36 minute read
edited by :L. Zhang, N. Ali, C. Zhang, A. Zhao, W. Zhang, B. Zhang, W. Ouyang...................................... pag


Flow field optimization in BOF based on bottom tuyeres arrangements
edited by:L. Zhang, N. Ali, C. Zhang, A. Zhao, W. Zhang, B. Zhang, W. Ouyang
The effects of different arrangements of bottom tuyeres with different gas flow rate were investigated to measure the mixing time of the 210t converter by physical model experiments, while the corresponding numerical simulation was performed by using volume of fluid (VOF) model to predict the gas-liquid flow characteristics inside the converter bath. The bottom tuyere was arranged symmetrically at the trunnion reference line in 1:9.43 scaled-down BOF converter and different water model experiments were performed. The optimized bottom tuyere arrangements were investigated according to the deviation of mixing time, which was reduced by 27%, 17.44% and 22% in case of B2, A1 and C2 schemes respectively than the prototype scheme X in the combined blowing converter. The percentage volume analysis of molten steel with different velocities has reasonable evaluation for the optimization of the flow field inside the converter bath. The numerical simulation results were consistent with the physical model results indicating that the optimized bottom blowing arrangements have a great impact on the flow of molten steel.
KEYWORDS:CONVERTER, MIXING TIME, WATER MODEL, NUMERICAL SIMULATION, OPTIMIZED BOTTOM TUYERE ARRANGEMENTS;
INTRODUCTION Top-bottom Combined blown technology is used for the efficient mixing in basic oxygen furnace (BOF). The application of combined blowing is of great importance which leads to homogenize the temperature and composition of the converter bath by the effective slag-metal interaction and the better yield. The top lance configuration, the gas flow rates and the bottom tuyeres configuration are investigated parameters of decisive importance for better mixing in the metal bath to improve steel quality and plant productivity[1]. Several researchers have carried out the optimization of bottom tuyeres for a given set of parameters to achieve better mixing in the converter bath[2-4] . Experimental[5,6] and numerical[7,8] studies were performed to investigate the gas-liquid two phase flow and the gas induced mixing behavior. Physical and mathematical models were used to simulate the combined blowing in the converter. In some cases, the results of the computational model and experimental observations had a good agreement with each other. Among the several bottom tuyeres arrangements, the one having eight tuyeres placed on the symmetric non-equiangular position was found the best with respect to mixing in the bath. Quiyoom studied the gas-liquid flow and mixing time for the optimization of bottom tuyere configuration with cold flow experiments in 6:1 scaled-down BOF converter. He performed 3D transient Euler-Lagrange (EL) simulation to investigate the static and dynamic differential flow schemes[9]. Singh et Liqiang Zhang, Naqash Ali, Chaojie Zhang, Aonan Zhao
School of Metallurgical Engineering, Anhui University of Technology, Ma’anshan 243002, China - naqash.sanaullah322@gmail.com
Wei Zhang, Benliang Zhang, Wei Ouyang
Jiangyin China Resources Steelmaking limited company; Ningbo Steel Limited Company - kuangbiao_juan@163.com
al. performed water model experiments and mathematical modelling (discrete phase analysis) to optimize the bottom tuyeres parameters in combined blowing and observed the minimum mixing time at a PCR of 0.56, with gas flow rate of 50 lpm[10]. Zhou proposed a scheme in which bottom tuyeres were asymmetrically arranged. He employed a mathematical model to study the characteristics of the flow field, compared the existing and new scheme with respect to mixing and turbulence, whose results showed that the new scheme had a better mixing in the bath[11]. A mathematical model, combination of the volume of fluid (VOF) and discrete phase model (DPM) was established to study the gas-liquid flow in BOF converter. Three bottom tuyeres placed at a diameter of 0.3-0.4 from the centre of the bottom have high mixing efficiency than the case of two or four tuyeres[12]. The jet penetration and Thyssen Blowing Metallurgy (TBM) tuyeres configuration on the behavior of the metal bath were defined by using visual inspection and calorimetry method in order to study the combined blowing through cold model[13]. The asymmetric bottom tuyere configuration in combined converter was used for the optimization of bottom blowing and the results of physical modelling experiments showed that the shorter mixing time was obtained in case of asymmetric configuration than the symmetric bottom tuyere configuration[14]. Wentao et al. studied the inclusion behavior and mixing efficiency with different layout of tuyeres. Shorter mixing time and higher inclusion removal were obtained by dual blowing as compared to centric and eccentric blowing by using one tuyeres[15]. Eulerian multiphase models were used to investigate the effects of flow rate and bottom tuyeres configuration on the molten steel flow in the bath for better stirring efficiency[13-14]. Thaker et al. investigated the effects of combined gas blowing and sloshing interface on the dynamics of gas–liquid flow and the liquid–phase mixing by performing the PIV and PLIF measurements in a 1:6 scaled down vessel. In the cases of combined blowing, the additional energy was provided by top blowing, resulting in the increased vertical molten velocity fluctuations and the relevant turbulent kinetic energy at the upper vessel region[17]. Quiyoom investigated the effect of pitch-to circle-diameter ratio (PCD) on the gas-liquid flow and mixing in the bath. The results showed that the mixing in the bath was minimum with 8 tuyeres located at PCD of 0.5[18]. Das et al. investigated the effect of dispersed gas bubbles on liquid phase mixing in a bottom blowing converter, and the results showed that the mixing time decreases with increasing the number of tuyeres[19] . In this paper, a series of water model experiments were performed by using a volume of fluid (VOF) model to investigate the optimization schemes. The mathematical model describes the flow characteristics of molten metal inside the converter bath with different bottom tuyere arrangements in case of optimized and prototype schemes. The optimized schemes had a shorter mixing time, which was reduced to 27 % than the prototype scheme X. Furthermore, the industrial trials were also performed, indicating the uniform mixing in the industrial BOF converter as the average [C]%×[O]% was significantly reduced than the prototype scheme X.
EXPERIMENTAL Water model experiment Experimental principle
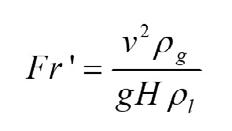
In this study, a 1:9.43 scaled-down BOF converter model was constructed to perform the cold flow experiments. Water was filled up to 210t level correlated with liquid in the actual vessel. The specific dimensions of the converter model and actual vessel are listed in Tab. 1. The dynamic similarity of the converter model and the prototype was ensured by determining the conversion formula between model and bottom blowing gas in the actual vessel. The Reynolds (Re) number of molten steel flow was found to be greater than 5000, which undergoes into self-preserving region, and the power of liquid flowing develops due to the buoyancy of bubble for the bottom gas stirring. Therefore, experiment ensures the similar geometries of the model and prototype. The actual Froude number in this experiment was converted to a modified Froude number because of gas two-phase flow, while the gravity acts as driving force. The modified Froude number is defined as:
In this formula V is the characteristic velocity (ms-1), H is the height (m) of the molten pool in the vessel, ρg and ρl are the density of gas and liquid (kg.m-3) and g is the gravitational acceleration (ms-2). Gas flow velocity can be expressed as a function of gas flow rate as follow:
Where, Q is gas flow volume and d are the nozzle diameter. Equation No.1 become as follow
By (Fr’)m= (Fr’)p

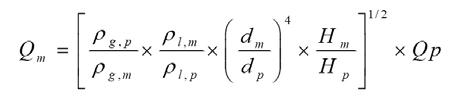
Where, m and p denote model and prototype.
, , lm atm lm m P P gH ρ= + Bring into the above equation.
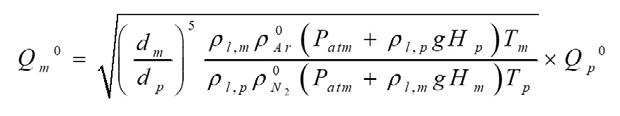
In the above equation the subscripts ρ
l, m and ρ
l, p
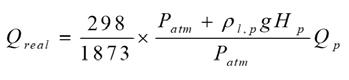
are the water and steel densities, kg. m-3 respectively, ρg, m and ρg, p are the standard densities of oxygen and argon respectively, kg. m-3 , H m and H p are the liquid pool heights (m) in converter model and prototype and P and 0 T0 are the standard pressure (101325 Pa) and temperature (20 oC). By substituting data into above equation
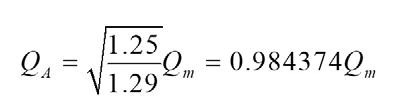
Subscripts Qm and QA are the actual gas flow rate and indicator value of flow meter (m3s-1) respectively. The formula of Qm is used to calculate the gas flow rate in model. The relationship between the gas flow rate at high temperature blown into the converter and flow rate under the standard condition of bottom blowing controlled at the required temperature is as follows:
Tab.1 - Dimensions of the converter model and prototype.
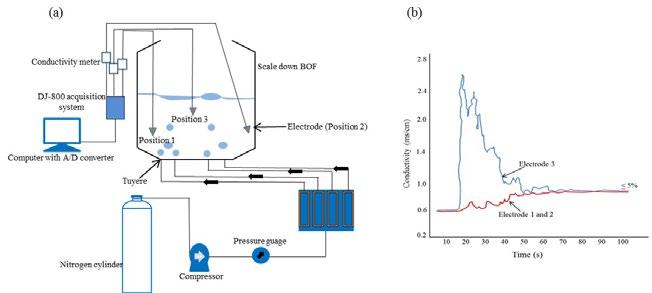
Experimental setup and mixing time The schematic of experimental setup is shown in Fig. 1(a). The conductivity method was used to investigate the mixing time in the converter bath under different bottom tuyere arrangements. During the experiment, nitrogen was injected into the bath through eight bottom tuyeres, arranged symmetrically on the trunnion reference line to simulate the argon blowing in the actual process. In the previous research reports only one conductivity electrode was used[20,21]. However, the conductivity values might be changed with the different electrode positions. Therefore, in this work three electrodes were placed at different positions to ensure the accurate mixing conditions of the solution, and collected the residence time distribution (RTD) curves during 180s as shown in Fig 1(b). The conductivity electrodes were calibrated before the start of experiment. One conductivity electrode was positioned into the active zone near the water level, while the other two was placed into the stagnant zone near the bottom region and bath walls. Mixing time experiments were performed by using stimulus-response method in which tracer as 50ml of saturated KCl solution was injected into the converter and the electrode was connected to a standard conductivity meter along DJ-800 acquisition system to measure the conductance of the solution. The output signal of conductivity meter was recorded through a computer connected A/D converter amplifier. The system was considered to be homogeneously mixed when the conductivity of water reaches at a certain permissible range of the total mixed concentration. Generally, ∣Ct-C∞∣ ≤ 0.05C∞ was taken as the standard with mixing time of t0.95. Each experiment was repeated twice for reproducibility of the measurements and mixing time was determined according to the fluctuation of conductivity, which was not exceeded above 5% of the stable state value. Before determining the mixing time, a certain amount of gas was stirred into the molten pool to ensure flow stability of the entire pool. The definition of mixing time is 95% of mixing degree. The mixing time is referred as the time when the detected conductance is almost stable.
Fig.1 - Schematic diagrams: (a) experimental setup, and (b) typical RTD curves at three different positions of electrodes.
Parameters
Ratio
Liquid depth (mm)
Top lance height (mm) No. of bottom tuyeres
Prototype
9.43
1800
1600 8
Model
1
190
170 8
Bottom tuyeres arrangements The design plan for the bottom tuyeres layout of four types of flow schemes with different gas flow rates is shown in Tab. 2. The flow scheme used by the steel industry is named as prototype X scheme in which four tuyeres (θ = 70°, 110°, 250° and 290°) are located at the pitch to circle diameter (PCD) of 0.5, while six tuyeres (θ = 50°, 90°, 130°, 230°, 270° and 310) located at PCD of 0.8, are compared with different experimental bottom blowing schemes in order to investigate the optimized bottom tuyere configuration.
Tab.2 - Investigated schemes with different bottom tuyere's arrangements.
Schemes Tuyere's position
PCD θ 1 2 3 4 5 6 7 8 9 10 11 12 13 14 15 16 .5 .6 .7 .8
A1
A2
A3
B1
B2
B3
C1 √ √ √ √ √ √ √ √ √
C2 √ √ C3 √ √
X 20/40°
20°
25/50°
√ 25°
MATHEMATICAL MODEL To investigate the effects of the converter bottom blowing arrangements on the flow of molten steel, the numerical simulation of the combined blowing for optimization of converter bath was carried out by implementing volume of fluid (VOF) model in ANSYS FLUENT 17.1. The volume of fluid (VOF) model is well known to be a powerful tool to simulate the gas stirring inside the converter bath[22]. The slag phase is not considered in the present work due to its little effect on stirring behavior of molten bath as consistent with the work of Ersson et al., [23]. The meshing of calculation domain in geometrical model for the combined blowing converter is shown in Fig. 2. The green and purple mesh colors denote the different faces of geometrical model and were meshed with size of 100 mm and 20 mm for the bottom blowing tuyeres and top blowing oxygen inlets respectively. Furthermore, the mesh size of the elements is selected based on the several mesh refinements.
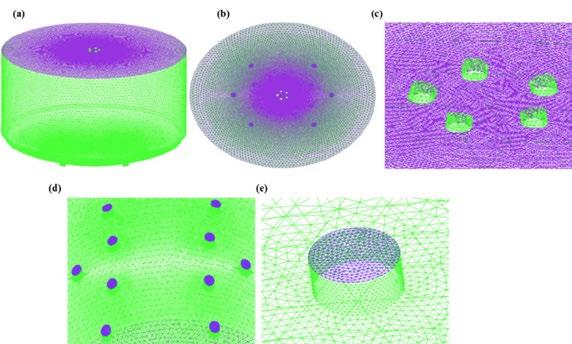
Fig.2 - Top-bottom combined blowing converter mesh: (a) overall meshing of converter model, (b, c) top blowing jet, and (d, e) bottom blowing tuyeres.
Basic assumptions The molten steel in the converter exhibits a complex turbulent flow. In order to establish the volume of fluid (VOF) model for the top and bottom of the converter, the basic assumptions are: 1) molten steel is a Newtonian fluid; 2) molten steel does not chemically react with the gas; 3) the top and bottom blowing gases are incompressible gases, and 4) assume the boundary as a non-slip boundary.
Basic assumptions The molten steel in the converter exhibits a complex turbulent flow. In order to establish the volume of fluid (VOF) model for the top and bottom of the converter, the basic assumptions are: 1) molten steel is a Newtonian fluid; 2) molten steel does not chemically react with the gas; 3) the top and bottom blowing gases are incompressible gases, and 4) assume the boundary as a non-slip boundary.
Control equation The multiphase flow inside the converter bath was simulated by VOF model and the control equations are stated as
follow[22,24,25] . (1) Equation of continuity
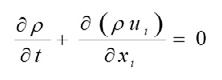
10)
Where, ρ is the density of liquid steel (kgm-3), ui is the velocity of the molten steel in the ith direction (ms-1) and t is the time (s). (2) Equation of the momentum conservation
11)
Where P is the pressure (Pa), μeff is the effective dynamic viscosity (Pa.s), FB is the buoyancy term. (3) Volume function equation Volume function equation is used to simulate the gas two-phase flow.
12)
In the formula, F is a volume function and F=1 represents a molten steel full state, when 0 < F < 1 represents a free surface and F = 0 represents the state without molten steel.
Boundary Conditions (1) Top blowing boundary conditions According to the top flow rate of 38000 m3/h and the geometrical size of oxygen lance (selected based on the several mesh refinement), the gas velocity at the outlet of the top lance was 780 ms-1. The pressure at the exit of the top jet was 1 × 10⁵ Pa. (2) Bottom blowing boundary conditions According to the bottom blowing flow rate of 500 m3/h and the geometrical size of bottom tuyeres, the gas flow rate at the outlet of the 10 bottom tuyeres was 0.563 ms-1 but for 8 tuyeres it was varied to 0.704 ms-1. The pressure at the exit of the bottom tuyeres was 1.1 × 10⁶ Pa.
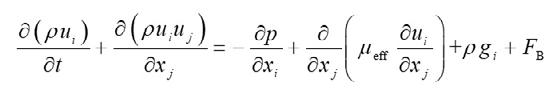
RESULTS AND DISCUSSION Water model results Effect of gas flow rates and tuyere's configurations on mixing time The bottom tuyere's configuration has a crucial role on the mixing time of converter bath, as the mixing time decreases with increasing the number of tuyeres and gas flow rate[26,27]. In the present work, four types of blowing schemes (A1, B2, B3, and C2) with gas flow rate of 600 m3/h are considered based on the total mixing time in the converter bath during bottom and combined blowing. The bottom tuyeres were separated with different angles at different PCD as show in Fig. 3. The six gas flow rates of 150, 600, 700, 800, 900 and 1000 m3/h with changing bottom tuyere's setup from PCD of 0.5 to 0.7 did a good job to investigate the optimized bottom tuyere's configuration as compared with prototype scheme X. The mixing time was increased with minimum and maximum gas flow rates of 150 m3/h and above 800 m3/h respectively as shown in Fig. 4. However, the lowest mixing time was obtained at flow rates of 600-800 m3/h with tuyere's setup at different PCD. Renato et al. found that the increase in gas flow rate does not diminish the degree of homogenization in the ladle for configurations involving one gas injection, which is contrary to the logic regarding the energy state of the system[28]. The mixing time was increased up to a critical value of gas flow rate and remained constant or slightly increased beyond the critical value, which is the function of angles between tuyeres[25], and nature of flow distribution pattern inside the converter bath[29]. Therefore, gas flow rate from 600-800 m3/h is considered as the critical value to further choose the optimization schemes based on the total mixing time in converter bath. In case of prototype X scheme, the mixing time was larger at the walls and center of the converter bath than all other investigated schemes. Furthermore, ten bottom tuyeres were placed at PCD of 0.5 and 0.8 in prototype scheme X, while the eight tuyeres were used in all other schemes. It can be inferred that the number of tuyeres has not major influence on mixing time; rather the configuration is much important. Wu et al. found that the different configurations of bottom tuyeres have a great influence on the mixing behavior of the molten steel than the number of tuyeres[8]. The different bottom blowing arrangements have decisive role on the mixing behavior at the converter walls, which is the function of close proximity of bottom tuyeres and the nature of induced flow pattern inside the converter bath. The high proportion of stirring is observed at the center of converter in all cases. The mixing behavior at the walls and center of converter bath is further verified by simulation results of velocity distribution in the following section. Fig. 5 shows the total mixing time with only bottom blowing and combined blowing processes, which reveals that in the case of top-bottom combined blowing the mixing time of the water model was longer than the only bottom argon blowing. The possible reason for the greater mixing time was that the top blowing oxygen and the bottom blowing argon were opposite to each other and a part of momentum remained offset. The stirring kinetic energy was significantly consumed by the top blowing jet, which results in the increase of mixing time. The top blowing gas leads to the cavity formation on the liquid surface. The top blown gas jet and the bottom blowing plume increases the gas velocity at the rim of the cavity, which causes the heavier spitting and lowers the energy distribution in the blowing converter[30]. Furthermore, a rough and positive correlation was investigated between the liquid/liquid and gas/liquid mass transfer rates by a wide range of top and bottom blowing gas flow rates[31]. From moving PCD of 0.5 to 0.7, the mixing time decreases for case B in than all other cases in combined and bottom blowing, due to close proximity of bottom tuyeres, which are separated by the angles of 20°. Therefore, mixing time was reduced by 27% in the case of B2 scheme as compare to prototype scheme X. In case of schemes A1, B1, C1 and X the bottom tuyeres are located at the PCD of 0.5 below the top oxygen jet. Therefore, an interacting flow pattern is developed which significantly reduced the mixing efficiency. Li et al. found that the mixing time decreases with increasing gas flow rate from bottom tuyeres beneath the top blowing jet due to the momentum loss by the collision of bottom blowing plumes and top blowing gas[16] . The prototype scheme X has the total mixing time of 77 sec, which was reduced by 35-44% in case of investigated schemes B2, B3, A1 and C2 during pure bottom blowing. The design scheme B with eight bottom tuyeres located at the pitch to circle diameter (PCD) of 0.6 and 0.7 (for B2 and B3 respectively) and have the better mixing time than A1,
A2, and C2 schemes. It can be observed that the from Fig. 5, that the design scheme B2 have the optimal solution of mixing time in case of combined and bottom, while A1 and C2 can be referred as optional optimization schemes.
Fig.3 - Schematic of different bottom tuyeres layout consider in the present study: (a-d) schemes B2, A1, B3 and C2 respectively.
Fig.4 - Relationship between mixing time and gas flow rates: (a-c) schemes A1, A2, and A3, (d-f) schemes B1, B2, and B3, (g-i) C1, C2, and C3 (j) prototype scheme X.
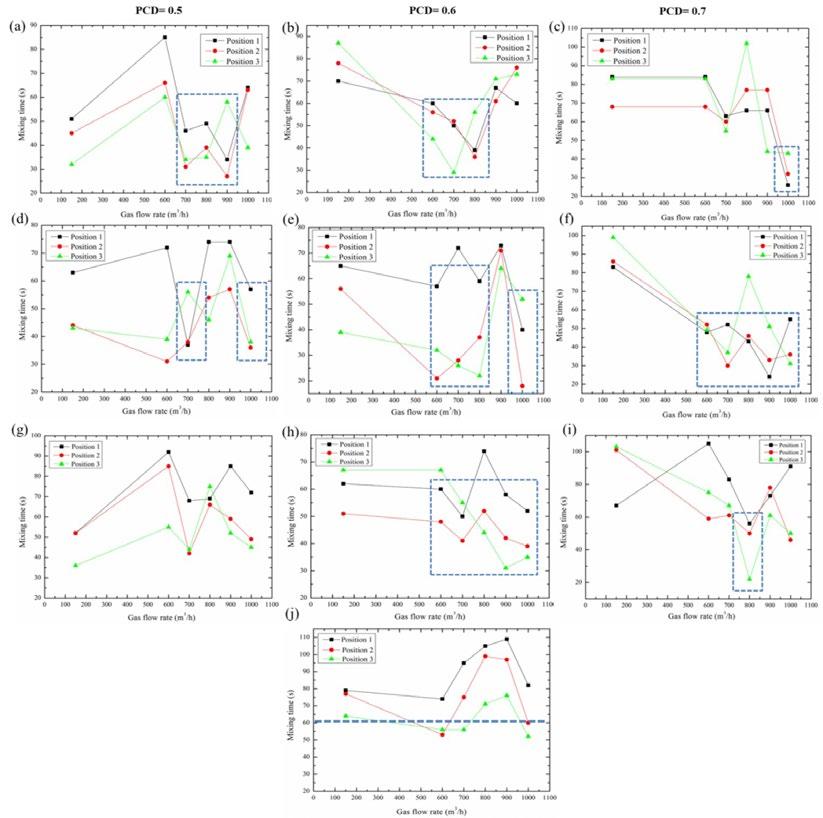
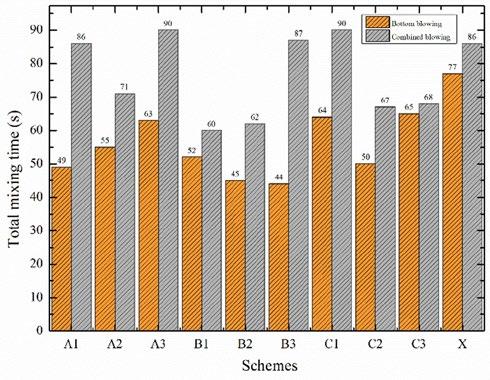
Fig.5 - Mixing time results inside the water model during combined and bottom blowing.
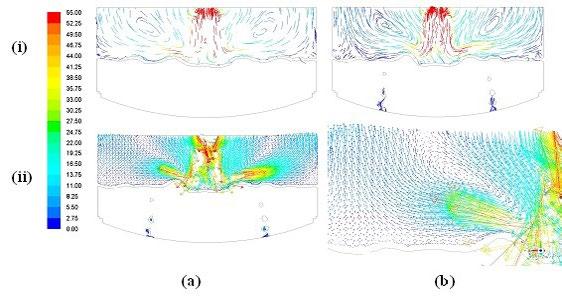
RESULTS OF MATHEMATICAL MODELING Characteristics of molten pool and velocity distribution by prototype scheme X In case of prototype scheme-X, the gas-liquid interface at the cross-section of X=0 and Z=0 in the converter bath is shown in Fig. 6 (i) and liquid interface fluctuation caused by the combined blowing was observed. The velocity distribution of molten steel at the cross section of X=0 and Z=0 was compared, which exhibited the different flow characteristics. Gas flows from the bottom tuyeres into the molten pool, which drives the molten steel to the upward direction during the ascending motion of gas. The velocity of molten steel is distributed within 0-1 ms-1, which is non-uniform in the entire molten pool and has multiple turbulent eddies. Overall, greater the flow of molten steel towards the upper part of the converter, greater will be the velocity at the gas-liquid interface. The four bottom tuyeres located beneath the top blowing jet at PCD of 0.5 are separated with greater angles in case of scheme X, and consumed a high fraction of stirring kinetic energy due to the collision of top blowing gas and bottom blowing bubbles, resulting in the low circulation area at the center of the molten pool as can be seen in Fig. 6 (ii). The six tuyeres located at PCD of 0.8 also induced low-velocity distribution at the walls of the converter due to wall friction. Therefore, the region between gas flow line and both sidewalls of the converter was covered by a large number of circulation paths and the entire molten pool was divided into independent flow regions which strongly affect the mixing uniformity. Therefore, the molten steel undergoes severe turbulence due to the combined blowing, which promotes uniformity of composition and temperature of the molten steel. However, there was still a certain region where the velocity and convection exchange with other regions was small. The velocity distribution at different cross sections in the converter is shown in Fig. 7. The gas flow rate is distributed within 10-60 ms-1, which is much larger than the flow rate of molten steel. The flow of gas is turbulent in the gas phase region which drives the molten steel to the gas-liquid interface. As can be seen in Fig. 7 (ii), there are specific regions with less velocity and dispersed gas flow, which affects the mixing efficiency of the entire molten pool due to multiple independent plume regions. Therefore, scheme X has the low gas flow rate by the bottom blowing tuyeres, which decline the stirring of converter bath, as a result mixing time of the converter bath was increased.
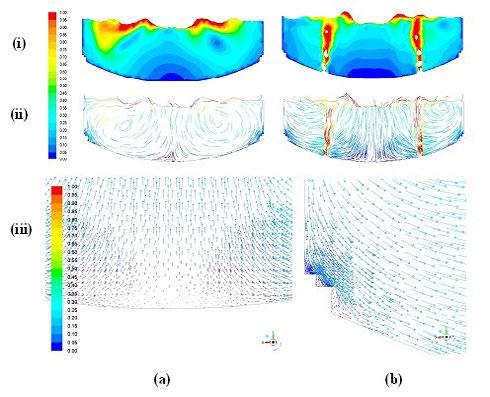
Fig.6 - Contours of molten steel velocity for Scheme X, (a) at section X=0, and (b) at section Z=0, (i) gas-liquid interface fluctuation, (ii) velocity line distribution, ms-1, and (iii) liquid steel flow vector distribution at section Z=0, ms-1, partial magnification.
Fig.7 -(i) Streamline distribution of gas phase, scheme X, (a) section X=0, and (b) section Z=0. (ii) gas-phase flow vector distribution, scheme X, section Z=0, (a) overall view, and (b) partial magnification.
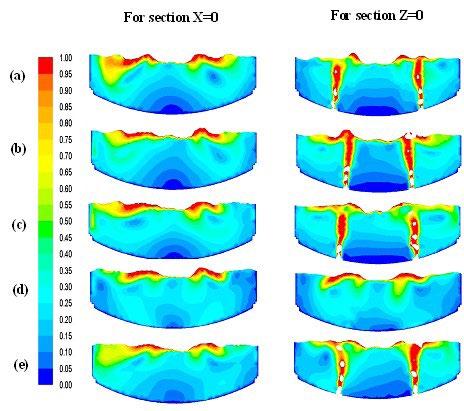
Comparison of velocity distribution in the longitudinal section of the molten pool The velocity distribution of molten steel in the longitudinal section of the molten pool for X=0 and Z=0 in different combined blowing schemes is shown in Fig. 8. The top blowing oxygen has a significant impact on the bath stirring; as a result cavity was formed with velocity of 1 ms-1 . The top and bottom blowing interaction with increasing distance of bottom tuyeres to the converter center leads to the greater cavity depth at gas-liquid interface as shown in Fig. 8a. The gas bubbles blowing upward drives the molten steel around it, which exhibits the strong turbulent circulation at the center due to the flow field of neighboring tuyeres. The shape of cavity confirms the direct contact area between top blowing oxygen and liquid steel, which simultaneously affects the molten metal flow[32] . The increasing number of tuyeres in prototype scheme X will have more splashing phenomenon and a non-homogeneous velocity distribution region will be formed in the molten pool in prototype scheme, while this effect was less in case of other investigated schemes with eight bottom tuyeres. The circulation of molten steel is mainly from bottom tuyeres towards the impinging cavity in case of B2, B3 and A2 schemes, which significantly improves the velocity distribution of liquid steel inside the converter bath. Furthermore, the flow field of inverted cone shape is much prominent in case of scheme B2 and B3, in which eight tuyeres are located at PCD of 0.6 and 0.7 respectively and the adjacent tuyeres are separated by an angle of 20°. But there is also a small region of low veloci-
ty between the bottom tuyeres and the wall of the converter as shown in Figure 8 (b, c). The smaller angle between the tuyeres leads the bubble plume to the centre of the combined blowing converter and the circulation between the bubble plumes and the wall of the converter becomes weak[12]. The flow field can also be hindered by the wall of the converter in scheme B3 due to less distance between converter wall and the tuyeres located at PCD of 0.7. The tracer was spread symmetrically in the converter bath owing to the symmetric flow behavior in both schemes. Both have also better velocity distribution at the centre of converter bath than X scheme due to the concentrative bottom tuyeres arrangement and also the stirring kinetic energy was not consumed by the top jet due to combined effect of closely packed bottom tuyeres. The concentrative bottom tuyeres arrangements can reduce the barrier to the mixing and decrease the bath mixing time[14]. The arrangement of eight bottom tuyeres (at PCD of 0.5) and the converter center are much close in case of A1. Therefore, high-velocity distribution occurred at the centre of a converter than all other schemes. The kinetic energy was consumed by the collision of top blowing gas and bottom blowing bubbles, resulting in less velocity distribution at the walls. The increasing flow rate weakens the impeding force of sidewall and improve the stirring effect of the molten bath in eccentric bottom tapping region, which would decrease the mixing time and also improve the stirring ability[33] .
Fig.8 - Contours of velocity distribution in the longitudinal section of molten pool at X=0 and Z=0 by different bottom blowing schemes, a) X (prototype), b) B2, c), B3, d) A1, and e) C2.
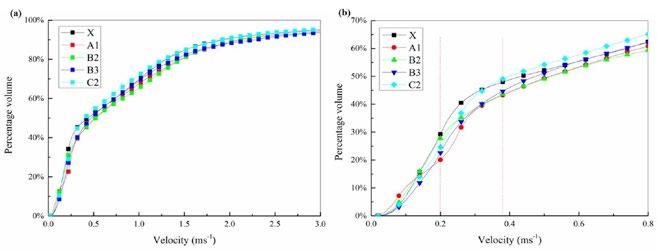
Effects of different bottom blowing schemes on the volume fraction of molten steel The volume fraction of molten steel at different velocity ranges can make a reasonable evaluation for the optimization of flow field inside the converter bath. Fig. 9 shows the percentage volume distribution of molten steel at low-velocity regions along horizontal axis under different bottom blowing arrangements. The ideal optimal scheme will be that in which the corresponding curves of molten steel volume have the highest fraction, for example, at different velocities, the ideal optimization scheme would be that in which the volume ratio of molten steel is greater, but in the actual situation the ideal scheme does not exist. At the low-velocity ranges of 0-0.8 ms-1, the volume ratios for different schemes have a great fluctuation, but at higher velocity the volume ratio increases and it remain constant for each bottom blowing scheme as can be seen in Fig. 10. The volume ratios are greater in case of scheme X and C2 in bottom blowing case, but it changes significantly in case of the combined blowing converter. The greater number of bottom tuyeres increases the oscillation of the converter pool than the other schemes with
eight tuyeres in the absence of top blowing. The same situation can be seen in scheme C2 in which the bottom tuyeres were separated by greater angles and each tuyere participated individually for the stirring of its corresponding region. In all studied cases, the concentrative bottom tuyeres have not special effect for velocity distribution due to their combined effect in pure bottom blowing converter. The interaction between top blowing oxygen and bottom blowing argon increases or decreases the stirring of the molten pool, which depends on the gas flow rate, bottom tuyere arrangements and top lance height. From above analysis, it can be inferred that the symmetrical and concentrated bottom tuyere arrangements will be more beneficial for the efficient velocity distribution in the converter bath, as its effect can be avoided by the momentum transfer from the top jet. The loss in stirring kinetic energy can be reduced in the combined blowing converter by adjusting the bottom tuyeres at a suitable pitch to circle diameter like in the A1, B2 and B3 schemes.
Fig.9 - Percentage volume of molten steel under different bottom blowing arrangements: (a) at high velocity ranges, and (b) at low velocity range.
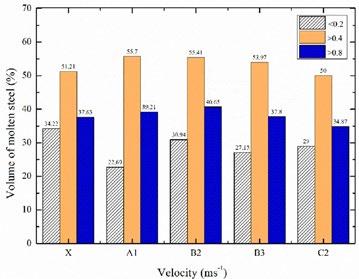
The velocity of molten steel for each scheme was calculated and a smaller volume percentage of molten steel was obtained with low velocity, and vice versa, which can be set as an efficient criterion, as it is beneficial for full mixing in the converter bath, promote the uniform stirring in the converter and increase the rate of the uniform chemical reaction. Furthermore, 0.2 ms-1, 0.4 ms-1 and 0.8 ms-1 were selected as the critical velocity values for determining the percentage volume of the molten steel. The volume of the molten steel with different velocities as <0.2 ms-1, >0.4 ms-1 and >0.8 ms-1 in different top-bottom combined blowing arrangements was also different. The quantitative relationship between the percentage volumes of molten steel at different velocities for combined blowing converter is shown in Fig. 10. The volume of the molten steel exceeds above 50 % at the velocity range of 0.4-0.8 ms-1 for all the schemes. The volume ratio was smaller in case of scheme X, when its velocity was less than 0.2 ms-1, as compared to the higher velocities >0.4 ms-1 and >0.8 ms-1. It indicates the efficient stirring of the molten steel at a low velocity less than 0.2 ms-1 in case of scheme X, than all other bottom blowing schemes. However, in case of prototype scheme X, the flow of molten steel was non-uniform in the entire molten pool with multiple turbulent eddies at high velocity as compared to the other investigated schemes. The same situation can be seen in the case of scheme C2 whose results of volume ratio were a little better than the scheme X. In scheme C2, eight bottom tuyeres separated by a greater angle of 25°/50° leads to non-homogeneous mixing in the converter as the velocity distribution at the wall of converter bath was inactive. The scheme X and C2 are near to equivalent each other, while the schemes A1, B2, and B3 were found the superior to prototype X scheme. The volume of molten steel in case of schemes A1, B2 and B3 is larger at velocity >0.4 ms-1 , which implies the stronger and homogeneous mixing in the bath than all other schemes with different velocities. In the case of velocity >0.8 ms-1, the mixing of molten steel was compressed in the converter bath with different bottom blowing arrangements. The maximum volume of molten steel was obtained by the schemes A1, B2 and B3 under different velocity ranges. Therefore, A1, B2, and B3 can be categorized as the optimization scheme in which the mixing time was reduced to 27 % than the prototype scheme X. Furthermore, the optimization schemes also encouraged an efficient velocity distribution in the entire
molten pool. The numerical simulation results agree with the water model results, which indicate that the optimization schemes are superior to the prototype scheme X. The experimental results showed that the mixing time of flow field in the converter was in the order of, top-bottom combined blowing > only bottom blowing. According to the analysis, the stirring kinetic energy generated by top blowing was limited, so the mixing time was larger. When the argon gas was blown from the bottom, the bubbles were dispersed which was beneficial to the circulating flow of molten steel in the converter, and the mixing time was the shorter. When the top and bottom gases were blown together, the kinetic energy generated by the top-blown oxygen jet to the molten steel was partially offset by the kinetic energy generated by the flow of bottom-blown argon; therefore, the mixing time was longer than the bottom blowing.
Fig.10 - Percentage volume of molten steel at different velocity ranges under top-bottom combined blowing arrangements.
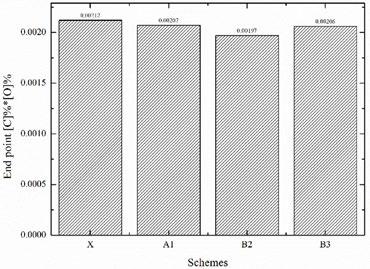
INDUSTRIAL RESULTS The industrial results verify the correctness of our water model and numerical simulation results. The average value of endpoint equilibrium of [C]×[O] composition (wt.%) provided by steel plant is 0.00212, 0.00207, 0.00197, 0.00206 for X, A1, B2 and C2 schemes respectively as shown in Fig. 11. The average [C]%×[O]% reduced by 0.0002, 0.0005 and 0.0006 for B2, A1 and C2 schemes as compared to the prototype X scheme, which indicates that how well the reaction in the converter bath was progressed and also represented uniform mixing in the industrial BOF converter. The industrial application results demonstrated that the bottom-blowing argon in BOF converter can facilitate the carbon–oxygen reaction reaching equilibrium, which lower the carbon content in molten steel at the end of melting process and improve the molten steel quality due to its superior stirring in the molten bath. Wei et al. found that the bottom-blowing can strengthen the mixing efficiency in the molten bath and improve the molten steel quality with lower final carbon–oxygen equilibrium and lower nitrogen content[34]. Therefore, the industrial results are also consistent with the physical model and numerical simulation results.
Fig.11 - The average endpoint [C]×[O] composition (wt.%) in industrial BOF converter by prototype and optimized schemes.
Conclusions The following main conclusions can be drawn as: 1. The mixing time in the converter bath is in the order of, top-bottom combined blowing > bottom blowing.
The larger mixing in combined blowing is due to opposite motion of top-blowing oxygen and the bottom-blowing argon, which consumes a large part of stirring kinetic energy and also momentum was remained offset in the combined blowing converter. 2. Symmetric and closely spaced bottom tuyere arrangements have the shorter mixing time in combined blowing converter, which was reduced to 27% than the prototype bottom arrangement. 3. 3D transient simulation was performed and a good agreement between water model and simulation results was obtained, where the VOF model is evident to be a powerful tool to simulate molten metal stirring process. 4. The increasing distance between the bottom tuyere with changing PCD of 0.5 to 0.8 results in the low-velocity distribution at the centre of the converter bath, which is also responsible for the low-velocity regions between the converter wall and the gas flow lines from tuyeres. 5. The obtained volume of molten steel at different velocities has a reasonable evaluation for the optimization of the flow field in the converter bath, which was greater than 50% at the velocity ranges of 0.4-0.8 ms-1 for all bottom blowing arrangements. 6. The average value of endpoint equilibrium of [C]×[O] composition (wt.%) was reduced to 0.0015, 0.0005 and 0.0006 with optimization schemes indicating uniform mixing in the BOF converter.
Acknowledgement The successful completion of this project is benefited from the financial support provided by the Open Foundation of the State Key Laboratory of Refractories and Metallurgy (G201711), and National Natural Science Foundation of China (51874001, U1760108).
REFERENCES
[1] H. Odenthal, U. Falkenreck, J. Kempken, J. Schlüter, N. Uebber, CFD Simulation of Melt Flow Mixing Phenomena in Combined Blowing Converters. Department of Information Technology, Netherlands (2006) 121-142. [2] S.K. Ajmani, A. Chatterjee, Cold model studies of mixing and mass transfer in steelmaking vessels, ISIJ int. 32, (2005) 515–528. [3] J.W. Ã, L. Zeng, Numerical Simulation of Fluid Flow in Bath during Combined Top and Bottom Blowing VOD Refining Process of Stainless Steel, 83 (2012) 1–18. [4] R. Li, S. Kuang, T. Zhang, Y. Liu, A. Yu, Numerical Investigation of Gas − Liquid Flow in a Newly Developed Carbonation Reactor, Industrial & Engineering Chemistry Research 57, (2017) 380-391. [5] M. Martín, M. Rendueles, M. Díaz, Global and local mixing determinations for steel converter analysis, Chem. Eng. Sci. 60 (2005) 5781–5791. [6] M. Díaz, M. Martín, Mixing in batch G-L-L reactors with top and bottom blowing, Chem. Eng. Sci. 54 (1999) 4839–4844. [7] H.J. Odenthal, U. Thiedemann, U. Falkenreck, J. Schlueteru, Simulation of fluid flow and oscillation of the Argon Oxygen Decarburization (AOD) process, Metall. Mater. Trans. B Process Metall. Mater. Process. Sci. 41 (2010) 396–413. [8] W. Wu, H. Yu, X. Wang, H. Li, K. Liu, Optimization on Bottom Blowing System of a 210 t Converter, J. Iron Steel Res. Int. 22 (2015) 80–86. [9] A. Quiyoom, R. Golani, V. Singh, V. V Buwa, Effect of Differential Flow Schemes on Gas-Liquid Flow and Liquid Phase Mixing in Basic Oxygen Furnace ( BOF ), Chem. Eng. Sci. 46, (2017) 1171-1176.
[10] V. Singh, J. Kumar, C. Bhanu, S.K. Ajmani, S.K. Dash, Optimisation of the Bottom Tuyeres Configuration for the BOF, ISIJ int. 47 (2007) 1605–1612. [11] X. Zhou, M. Ersson, L. Zhong, P. Jönsson, Optimization of Combined Blown Converter Process, ISIJ Int. 54, (2014) 2255–2262. [12] Y. Li, W.T. Lou, M.Y. Zhu, Y. Li, W.T. Lou, M.Y. Zhu, Numerical simulation of gas and liquid flow in steelmaking converter with top and bottom combined blowing, Ironmak. Steelmak. 40, (2016), 505-514. [13] B.T. Maia, D. Augusto, G. De Carvalho, T. Siderar, R. Tavares, TBM tuyeres arrangements and flow - Comparison between BOF Ternium Brasil and cold model Iron Steel Technol. Iron Steel Technol. 15, (2018) 1050–62. [14] Z. Lai, Z. Xie, L. Zhong, Influence of Bottom Tuyere Configuration on Bath Stirring in a Top and Bottom Combined Blown Converter, ISIJ Int. 48, (2008) 793–798. [15] W. Lou, M. Zhu, Numerical Simulations of Inclusion Behavior and Mixing Phenomena in Gas-stirred Ladles with Different Arrangement of Tuyeres, ISIJ Int. 54, (2014) 9–18. [16] M. Li, L.I.N. Li, Q. Li, Z. Zou, Modeling of Mixing Behavior in a Combined Blowing Steelmaking Converter with a Filter-Based Euler – Lagrange Model, JOM 70, (2018). [17] A.H. Thaker, S. V. Bhujbal, V. V. Buwa, Effects of sloshing gas–liquid interface on dynamics of meandering bubble plumes and mixing in a shallow vessel: PIV and PLIF measurements, Chem. Eng. J. 386 (2020) 122036. [18] A. Quiyoom, S.K. Ajmani, V. V Buwa, Optimization of bottom tuyere con fi guration for Basic Oxygen Furnace steelmaking through experiments and CFD simulations, Chem. Eng. J. 346 (2018) 127–142. [19] C.A. Das, A K, RAY H.S., Role of Dispersed GasBubble Agitation in Steelmaking, ISIJ Int. 29 (1989) 284–290. [20] M. Iguchi, R. Tsujino, K.I. Nakamura, M. Sano, Effects of surface flow control on fluid flow phenomena and mixing time in a bottom blown bath, Metall. Mater. Trans. B Process Metall. Mater. Process. Sci. 30 (1999) 631–637. [21] M.S.C. Terrazas, A.N. Conejo, Effect of Nozzle Diameter on Mixing Time During Bottom-Gas Injection in Metallurgical Ladles, Metall. Mater. Trans. B Process Metall. Mater. Process. Sci. 46 (2015) 711–718. [22] C.A. Llanos, S. Garcia-Hernandez, J.A. Ramos-Banderas, J.J. De Barreto, G. Solorio-Diaz, Multiphase modeling of the fluidynamics of bottom argon bubbling during ladle operations, ISIJ Int. 50 (2010) 396–402. [23] M. Ersson, A. Tilliander, Review on CFD Simulation and Modeling of Decarburization Processes, Steel Res. Int. 89 (2018) 1–13. [24] G. Chen, S. He, Y. Li, Investigation of the Air-Argon-Steel-Slag Flow in an Industrial RH Reactor with VOF–DPM Coupled Model, Metall. Mater. Trans. B Process Metall. Mater. Process. Sci. 48 (2017) 2176–2186. [25] T. Haiyan, G. Xiaochen, W. Guanghui, W. Yong, Effect of Gas Blown Modes on Mixing Phenomena in a Bottom Stirring Ladle with Dual Plugs, ISIJ Int. 56 (2016) 2161–2170. [26] F. Gonçalves, M. Ribeiro, R. Correa, R. Silva, B. Braga, B. Maia, R. Tavares, D. Carvalho, J. Schenk, Measurements methodologies for basic oxygen furnace cold modeling, J. Mater. Res. Technol. 13 (2021) 834–856. [27] S. Chanouian, B. Ahlin, A. Tilliander, M. Ersson, Inclination Effect on Mixing Time in a Gas–Stirred Side–Blown Converter, Steel Res. Int. 92 (2021). [28] R. González, G. Solorio, A. Ramos, E. Torres, C. Hernández, R. Zenit, Effect of the Fluid-Dynamic Structure on the Mixing Time of a Ladle Furnace, Steel Res. Int. 89 (2018) 1–9. [29] K.Y. Chu, H.H. Chen, P.H. Lai, H.C. Wu, Y.C. Liu, C.C. Lin, M.J. Lu, The Effects of Bottom Blowing Gas Flow Rate Distribution During the Steelmaking Converter Process on Mixing Efficiency, Metall. Mater. Trans. B Process Metall. Mater. Process. Sci. 47 (2016) 948–962. [30] S. Amano, S. Sato, Y. Takahashi, N. Kikuchi, Effect of top and bottom blowing conditions on spitting in converter, Eng. Reports. 3 (2021) 1–16. [31] Y. Kawabe, M. Uddin, Y. Kato, M. Seok, S. Lee, Correlation between liquid/liquid and gas/liquid mass transfers in a top/bottom blowing converter, ISIJ Int. 57 (2017) 296–303. [32] M. Lv, R. Zhu, Y.G. Guo, Y.W. Wang, Simulation of flow fluid in the BOF steelmaking process, Metall. Mater. Trans. B Process Metall. Mater. Process. Sci. 44 (2013) 1560–1571. [33] F. Liu, R. Zhu, K. Dong, X. Bao, S. Fan, Simulation and application of bottom-blowing in electrical arc furnace steelmaking process, ISIJ Int. 55 (2015) 2365–2373. [34] G. Wei, R. Zhu, Y. Wang, X. Wu, K. Dong, Technological innovations of electric arc furnace bottom-blowing in China, J. Iron Steel Res. Int. 7 (2018).
TORNA ALL'INDICE >


