22 minute read
B. Santillana, K. Hechu, A. SenGupta, M. Auinger.............................................................................. pag

Correlation between lab-scale wedge mould castings and slab samples, a method for new alloy development
B. Santillana, K. Hechu, A. SenGupta, M. Auinger
Industrial scale trials to develop new steel grades are energy intensive as well as expensive, therefore it is more efficient to do laboratory scale casting trials of different steel grades in order to evaluate the casting microstructure of a new steel grade. A conventional square ingot, has advantages and disadvantages. On one hand, it has a well-known geometry and the size of the mould can easily be adjusted. On the other hand, the cooling rate and thus heat extraction is not comparable to that during continuous casting of slabs. Therefore, features related to the solidification, such as grain size and segregation are not comparable to a continuously cast product. A wedge mould set-up was developed in-house to study the effect of cooling rate on the as-cast solidification structure and micro segregation at laboratory scale. Different cooling rates were achieved by making five steps of different thicknesses, leading to microstructures, comparable with the continuously cast product. To validate the results of the wedge mould ingots, slab samples with comparable chemistry as the ingots have been taken from a conventional slab caster and a thin slab caster. The as-cast microstructure of the ingots and slab samples were compared through the primary and secondary dendrites arm spacing measured along the thickness of all samples. Cooling rates for each step of the wedge mould samples were calculated based on the dendrite arm spacing and compared with the cooling rates based on the thermocouple measurements. The microstructure and cooling rates at two steps of the wedge mould correlate well with the thin and conventional slab samples, making these steps particularly useful for assessment of castability of new steel grades.
INTRODUCTION The demand for the development of the Advanced High Strength Steels (AHSS) is continuously increasing. AHSS combine superior strength along with good weldability, which is beneficial for the automotive and heavy structural sector. The properties of the final product are influenced not only by the chemical composition, but also by the developed microstructure and process parameters during continuous casting process. The main alloying elements of the AHSS are C, Mn, Cr, Si, and Al, but it may also contain micro-alloying elements, such as niobium and vanadium. These elements may segregate or precipitate in the as-cast steel and have a negative effect on the final product, unless the casting conditions are timely adjusted. Therefore, it is required to find the correlation between solidification microstructure and the process parameters during casting to achieve the desired product quality. Since industrial scale trials require a lot of energy and coB. Santillana
Tata Steel, R&D, PO Box 10000, 1970 CA, IJmuiden, The Netherlands
K. Hechu
Tata Steel, R&D, PO Box 10000, 1970 CA, IJmuiden, The Netherlands
A. Sengupta
R&D Division, Tata Steel Ltd., Jamshedpur, 831007, India
M. Auinger
WMG, University of Warwick, Coventry CV4 7AL, UK
sts, it is more efficient to do a laboratory scale casting trials to evaluate the as cast microstructure of a new steel grade. However, the conventional square ingot, which is regularly used for development of the new steels, has some advantages and disadvantages. On the one hand, it has a well-known geometry and the size of the mould can easily be adjusted. On the other hand, the cooling rate and thus heat extraction is not comparable to that during continuous casting. Therefore, features related to the solidification, such as the resulting microstructure, grain size and micro- and macro segregation are not comparable to a continuously cast product. An alternative solution must be found in order to obtain reliable results during lab trials which can be correlated with the as-cast samples.
Aims and objectives of current study In this study the possibility of using a wedge mould configuration to cast ingots in a Vacuum Induction Melting (VIM) furnace was assessed. The wedge mould consists of 5 steps and the heat extraction varies at each step, being the highest at the bottom and lowest at the top of the wedge mould. It leads to various cooling rates and therefore microstructures, which can be comparable with the continuously cast product. The objectives of this study are to analyse the effect of the heat extraction on the microstructure development during solidification in the wedge mould and find a microstructure correlation between the solidified wedge mould samples and the as-cast slab samples from a continuous cast product. DEVELOPMENT OF THE WEDGE MOULD TECHNIQUE Considering that the cooling rate has a direct influence on the microstructure of the steel and in order to achieve reproducibility of the results, it is important to use the same size, shape and material of the wedge mould during each trial. In addition, it is necessary to keep the following parameters and conditions constant: - amount of steel poured into the wedge mould, - superheat of the steel during casting, - wedge mould temperature during casting, - time needed for casting and filling up the wedge mould, - size of the air gap between the steel and the wedge mould during solidification, if any, - type and thickness of the coating material used inside the wedge would, (if a coating is applied before casting).
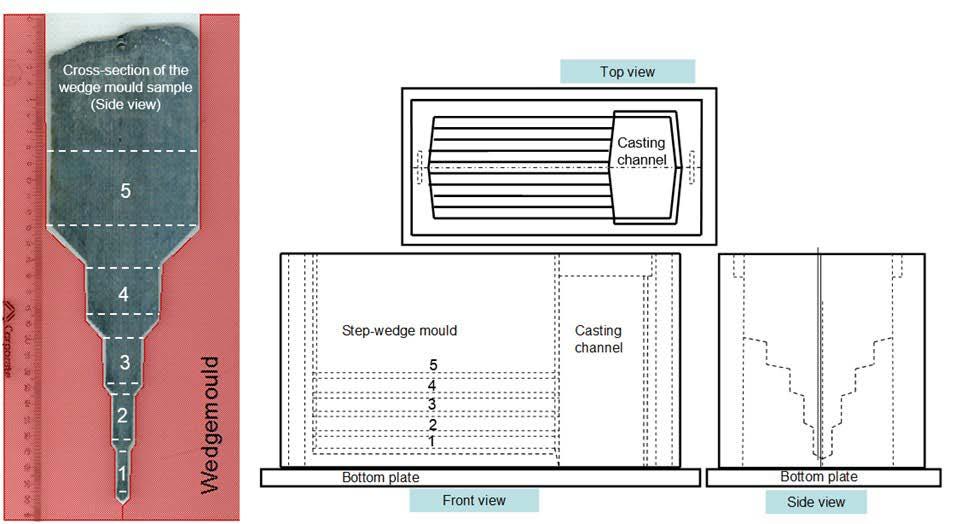
Mould design Fig 1 depicts the mould design, consisting of a casting channel and a stepwise wedge part to create some distinct areas. In the wedge part of the ingot, five steps are present and the cooling rates of the solidifying steel can be controlled by the thickness of the mould gap (volume of the steel to cool) and the thickness of the mould wall (volume of the heat adsorbing mould material). A smaller gap and/or thicker mould wall will lead to higher cooling rates. In this wedge mould design both the gap thickness and mould wall thickness can be varied, creating different cooling rates of the steel at different locations in the mould. A step wise wedge shape is applied, with more or less the same cooling rates. The rate is highest at the bottom because the wall thickness is the highest (Figure 1), and the rate is the lowest on of the top of the wedge mould.
Fig.1 - The design of the wedge mouldy.
2D heat transfer model To develop the wedge mould and to find the best configuration in terms of steps and mould wall thicknesses, and step length, a 2D finite element model was used. Several configurations of the model were developed using the MarcMSC code and one of was chosen to build the actual wedge mould, which is shown in Fig. 2.
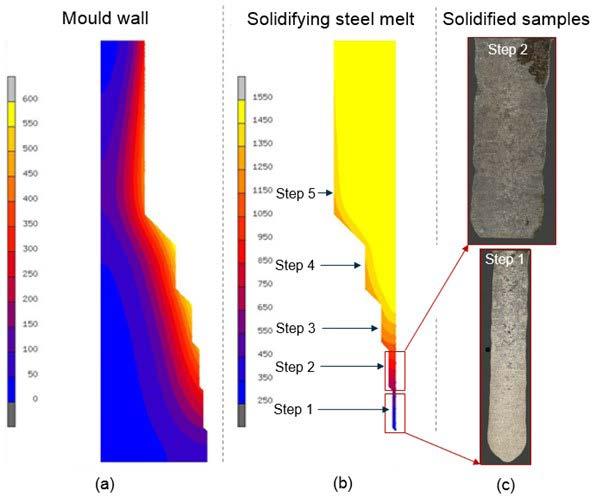
Fig.2 - Wedge mould simulations from the 2D heat exchange model and the macrostructure results, where (a) illustrated a wedge mould part, (b) – solidifying steel sample and (c) – Step 1 and Step 2 steel samples after etching,
The same model was used to correlate the measured thermocouple readings with calculated temperature. Moreover, the heat extraction based on this model was also compared with data from actual slabs. In the 2D finite element model it was assumed that above the liquidus temperature of steel the heat transfer is determined by conduction (htc of 1000 W/m2K) and below the solidus temperature by radiation. During the solidification range (between liquidus and solidus temperatures), a sliding transfer is applied between both types of heat exchange. The ambient heat transfer is described by the sum of convection (htc of 10 W/m2K) and radiation. Fig. 2 illustrates the example of the 2D heat exchange model, showing that for design purposes, step 1 has the highest cooling rate, Step 2 has a slightly lower cooling rate and so on, therefore on each step, there is more time for the alloying elements to be distributed within the sample.
EXPERIMENTAL PROCEDURES During the trial, 50 kg of liquid steel was made in the VIM under the vacuum atmosphere using pure iron (electrolytic grade), carbon, manganese and other alloying elements (if required). De-oxidation of the melt was done by adding pure aluminium before casting. To determine the different cooling rates of the solidifying steel, at each step, two thermocouples are embedded into the wedge mould at 5 and 10 mm from the hot face which makes 2 rows of thermocouples. The first row (which includes the thermocouples named 1-1 (Step 1), 2-1 (Step 2), 3-1 (Step 3), 4-1 (Step 4), 5-1(Step 5)), is located closer to the casting channel compared to the second row. Where the second row (1-2, 2-2, 3-2, 4-2, 5-2) is located closer to the molten metal. Before casting, it is important to make sure that there is no air gap inside the mould where the tip of the thermocouple is located, otherwise it can lead to faulty temperature readings. After the desired chemical composition and casting temperature of steel was reached, the melt was poured inside the vacuum chamber into the wedge mould and it was left to cool down to room temperature. During cooling, the thermal data was recorded by the K-type thermocouples, embedded into the wedge mould, (Figure 2). The measured
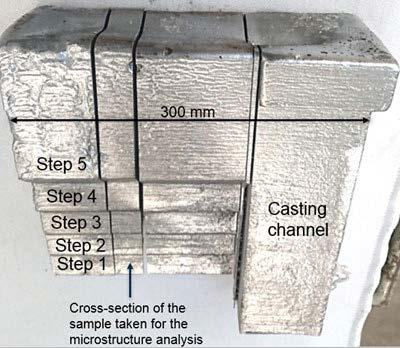
data was used to assess the heat extraction at each step during cooling and compared with 2D heat transfer model. A central part of the wedge mould sample (cross-section as shown in Figure 4) was cut up for the microscopy analysis. In addition, slab samples from conventional and thin slab casting, with comparable chemical composition to the wedge mould samples, were chosen for the analysis to validate the microstructure results.
Fig.3 - Example of the steel sample solidified in the wedge mould.
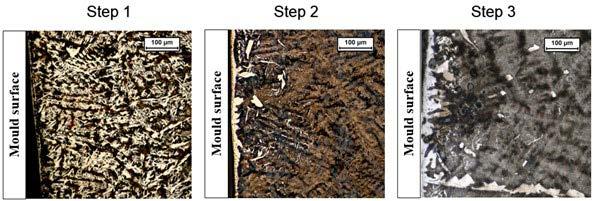
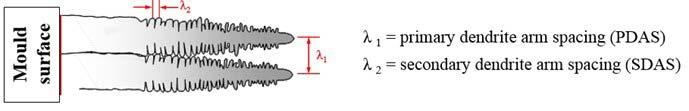
All samples were polished and etched using a Bechet-Beaujard (BB) etching solution to reveal the dendritic microstructure. The samples were then analysed under optical microscope to measure the primary and secondary dendrite arm spacing across the full sample width. The example of dendrites at the edge of the sample can be found in Figure 5. It also schematically shows how to find the primary and secondary dendrites arm spacing. Cooling rate for each step of the wedge mould samples was then calculated based on the dendrite arm spacing and compared with the cooling rates based on the thermocouple measurements and 2D heat exchange model.
Fig.4 - Example of primary and secondary dendrites found at the surface of solidified wedge mould sample at steps 1, 2 and 3.
RESULTS AND DISCUSSION Temperature measurement The thermal data during the test measured by the 10 thermocouples embedded into the wedge mould is illustrated in Fig. 5 below.
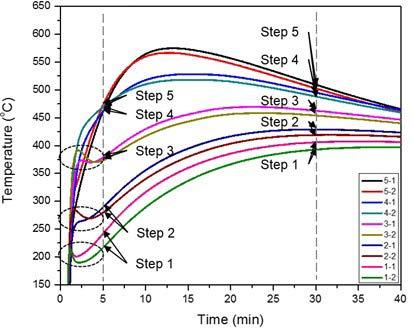
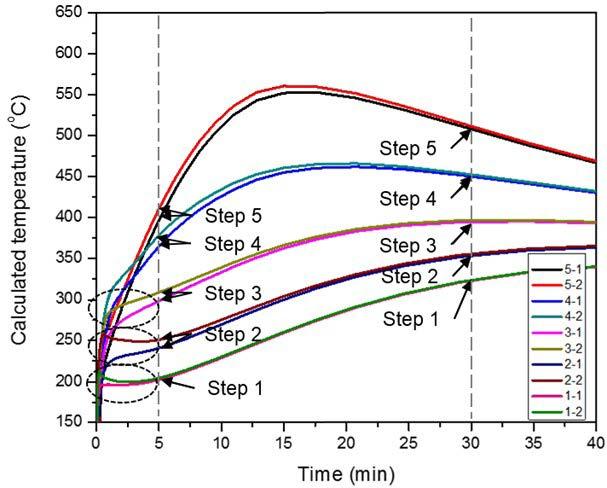
Fig.5 - Left: experimental results of the cooling curves obtained during solidification. Right: Calculated results of the cooling curves based on the 2D heat exchange model.
As a comparison and further verification, the thermal results of the cooling curves were also calculated using 2D heat exchange model. Fig.5, right, illustrates comparable behaviour of the thermocouples’ fluctuations during first couple of minutes during test, especially for steps 4 and 5. However, the calculated fluctuations at steps 1, 2 and 3 are less obvious compared to the measured data. On average, the measured temperature is approximately 50°C higher compared to the model calculations. In addition, by comparing the data at any time (for example at 5 and 30 minutes) the measured data of the thermocouples in row 1 always shows higher temperature compared to the thermocouples in row 2 which is the opposite from the calculated temperature. Because, the first thermocouple row is located closer to the casting channel than the second row, it means that during cooling, heat is extracted not only from the molten metal located in the wedge part of the mould but also from the molten metal located in the casting channel, which is a significant amount This resulting in an additional heat flux, making the process more three dimensional than required. This explains that the thermocouples in row 1 show higher temperature compared to the second row. Since the calculations are based on 2D heat exchange model, the heat, released from the casting channel is not considered, explaining why the calculated thermal data at each step on average is about 50° C lower compared to the measured one.
Analysis of the dendrites arm spacing and comparison with slab samples. A higher cooling rate leads to a smaller dendrite arm spacing in the cast material. Here we report the dendrite arm spacings (DAS) for two wedge mould steel samples and they are compared to the DAS of as-cast samples from a thin slab and conventional slab caster, see Table 1. The thin slab caster sample is 72 mm thick and the conventional slab caster sample is 225 mm thick. The wedge mould sample is taken in the middle of the wedge section of the ingot, as see in Figure 3.
Tab.1 - Name of the wedge mould samples and comparable as-cast samples used in this study.
Chemical composition (wt%) C Mn Si
Thin slab casting comparison wedge 1 0.22 2.1 1
slab 1 0.22 2.1 0.96
Conventional slab caster wedge 2 0.149 0.99
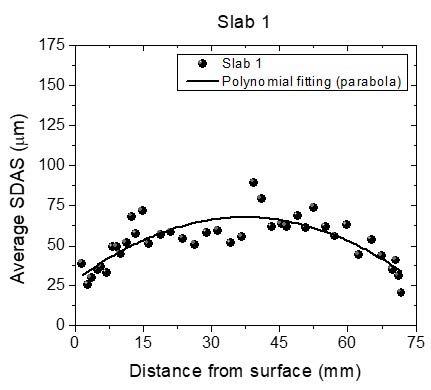
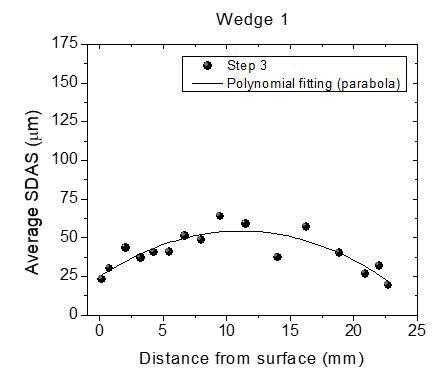
The average measured SDAS for the Slab 1 varies between 20 μm at the steel shell to 70 μm in the centre. It was found that step 3 of the Wedge 1 corresponds well with the measured SDAS of the Slab 1 sample. As illustrated in Figure 6, at the step 3, the SDAS varies between 20 μm at the shell to 60 μm in the centre.
(a) (b)
Fig.6 - Comparison of measured secondary dendrites arm spacing (SDAS) between Slab 1 sample from a (72 mm) thin slab caster (a) and step 3 of Wedge 1 sample (b).
These results show that step 3 of the wedge mould can be used as an indication for future research of the dendritic microstructure (and micro segregation) during solidification at a thin slab caster. However, depending on the aim of potential research projects, the thickness of the step 3 of Wedge 1 sample should be taken into account. It is 25 mm thick compared to 72 mm of the thin slab caster sample.
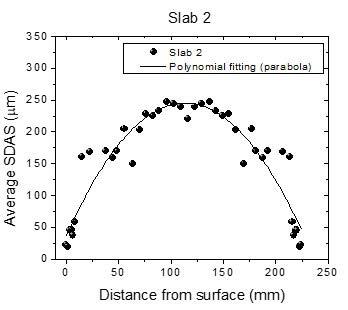
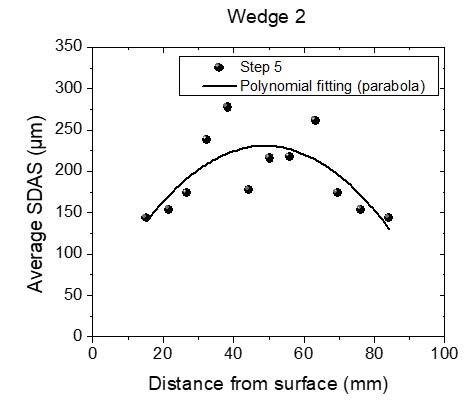
Figure 7 shows the SDAS for the conventional slab sample. Assuming that the microstructure of the slab sample is symmetrical across the slab thickness only half of the conventional slab sample was measured (116 mm out of 225 mm). The second half of SDAS was mirrored for the purpose of plotting the polynomial curve. The average measured SDAS for the Slab 2 sample varies between 25 μm at the steel shell to 240 μm in the centre. In this case, step 5 of the Wedge 2 sample corresponds well with the measured SDAS of the conventional slab sample.
(a)
(b) Fig.7 - Comparison of measured secondary dendrites arm spacing (SDAS) between conventional cast Slab 2 sample (a) and step 5 of the Wedge 2 sample (b).
These results indicate that step 5 of the wedge mould can be used to predict the dendritic microstructure (and micro segregation) during solidification at a conventional caster. However, depending of the aim of the potential future research, the thickness of the wedge sample should still be considered. The step 5 of the Wedge 2 sample is twice thinner (100 mm) compared to the Slab 2 sample (225 mm).
Cooling rate calculations For relating the dendrite arm spacing to the cooling rate, several models were assessed. The specifics of the results from the 2D heat exchange model and from the dendrite arm spacings are presented in the following paragraphs. Combined cooling rates results for the different wedge mould steps, based on the 2D heat exchange model and based on the dendrite arm spacing are illustrated in Figure 8.
A- Cooling rate based on 2D heat exchange model
The cooling rates for the wedge mould were calculated based on the 2D heat exchange model and are indicated in Figure 8 as the green stars. To estimate the cooling rate during solidification, the liquidus (TL) and solidus (TS) temperatures of the samples were calculated using Themo-Calc software [1, 2]. Based on these temperatures and the time required for the sample to transform from liquid to solid state (tL to tS), the cooling rate was estimated at each step of wedge mould, as can be seen in Table 2 for wedge 1.
Tab.1 - Estimated cooling rate at each step of Wedge 1 sample based on the 2D heat exchange model and time required for the sample to solidify.
The cooling rate at the steel shell decreases between from 690°C/s at step 1 to 352°C/s at step 3. It was found that at the shell of step 4 and 5 the cooling rate is comparable – 341 °C/s and 344 °C/s, respectively. In the centre of the wedge mould sample the cooling rate decreases from 249 °C/s at step 1 to 6 °C/s at step 5.
Liquidus temperature
Solidus temperature At the steel shell In the centre of wedge mould sample
Step TL (°C) TS (°C) tL (s) tS (s) Cooling rate, (°C/s) tL (s) tS (s) Cooling rate, (°C/s)
1 0.01 0.08 689.84 0.03 0.20 248.55
2 0.02 0.11 468.24 0.09 0.60 85.32
3
4
5 1506 1463 0.04 0.16 351.50 0.31 1.67 31.64
0.08 0.21 340.82 1.09 4.47 12.71
0.33 0.45 344.00 4.04 11.02 6.16
B- Cooling rate based on dendrites arm spacing
The cooling rates for the wedge mould were also calculated based on the dendrites arm spacing and are indicated in Fig. 8 as the red, blue and red dots and corresponding polynomial fitting curves. To estimate the cooling rate during solidification, the measured secondary dendrites arm spacing (SDAS) results were used at each step of the wedge 1 sample. For each measured SDAS data, a cooling rate was estimated using different equations found in the literature. One of the options to estimate a cooling rate is to use a model for calculating the dendrite arm spacing d2 (μm), of multicomponent steels, which was developed and validated by Louhenkilpi et al. [3], , as shown in Eq. (1):
2=123∙��−0.33∙��(−0.281����+0.175������−0.063������−0.136������−0.091������) (1)
where T (°C/s) is the average cooling rate in the mushy zone obtained with the heat transfer model and Ci (wt%) is the nominal composition of solute i. The validation of this model was made by Louhenkilpi et al. [3], using billet samples, cast in industrial casting machines at different cooling conditions. The second approach to evaluate SDAS profile as function
of cooling rate ( [4] and [5]) and solidification time [6] is based on available experimental and theoretical analysis ( [5] and [6]). Considering SDAS dependence on carbon content, the secondary dendrites arm spacing λ2 (μm) was calculated by El-Bealy and Thomas [7] as a function of cooling rate for steels containing less than 0.53 wt pct C as shown in Eq. (2):
2=��
1(��
��)−�� (2)
where ���� (°C/s) is cooling rate. The parameters ��1=148 and n=0.38 were calculated by fitting the experimental data in References [5] and [6] to the Eq. (2). The third option of exterminating the cooling rate was done by Won and Thomas [8] using the SDAS data. In this case, the SDAS results were derived from various sources, (including Suzuki et al. [5]) at different cooling rates and steel carbon contents By finding a best fit of the results, the empirical relationship was obtained by Won and Thomas [8] for the secondary dendrite arm spacing ����������:
��������(����)=143.9∙��
−0.3616∙����(0.5501−1.996����) for ��
��>0.15 (3)
=(169.1−720.9∙�� −0.4935 for 0<��
��≤0.15
where ��
�� is the cooling rate (°C/s) and ��
�� is the carbon con-
tent (wt pct C) All three equations described above were used to calculate a cooling rate. The results are illustrated in Fig. 8, where the black, blue and red dots (and corresponding colour of polynomial fit) are referred to the Eq. (1), Eq. (2) and Eq. (3) respectively. The highest cooling rate was obtained based on Eq. (1) - the model developed and validated using billet samples by Louhenkilpi et al. [3]. For step 3 (25 mm thick) it varies between 400 °C/s at the edge of the sample to 50 °C/s in the middle part. For step 5 (100 mm thick) it varies between 30 °C/s at the edge of the sample to 10 °C/s in the middle part. It confirms that the cooling rate of the samples decreases as the thickness of the wedge mould sample increases. Lower cooling rate was obtained based on Eq. (2) - calculations developed by El-Bealy and Thomas [7] using ingot casting data of different carbon contents (0.14 wt% - 0.88 wt%). For step 3 it varies between 125 °C/s to 45 °C/s and for step 5 it varies between 15 °C/s to 3 °C/s. Comparable results were achieved using Eq. (3) - calculations developed by Won and Thomas [8] based on theoretical and experimental data for different types of low alloy steels found in the literature. The cooling rate results are also compared with the estimated cooling rate at each step of wedge mould sample based on the 2D heat exchange model and the time required for the sample to solidify (Tab. 2). These estimated values are shown in green colour with “*” sign in each graph in Fig. 8. On average, for steps 1 to 4 at the steel shell, the cooling rate based on 2D heat exchange model is estimated to be comparable or lower than the calculated cooling rate using Eq. (1). However, it is estimated to be higher compared to the cooling rate, calculated based on the Eq. (2) and Eq. (3). For step 5 is it higher compared to the results obtained from all three equations. In the centre of the sample, however, the cooling rates between 2D heat exchange model and all three equations are comparable for all five steps. The deviation of the cooling rate at the steel shell may be explained by the lack of measured SDAS data since it is difficult to reveal and measure the dendrites right at the steel shell when the cooling rate is the highest and the dendrites are the smallest.
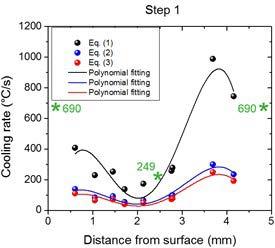
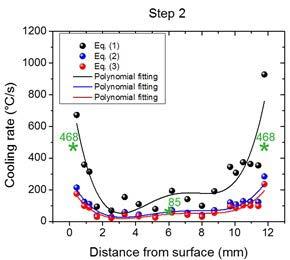
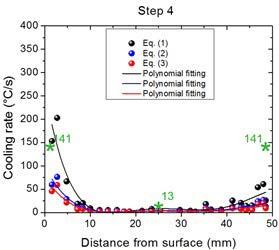
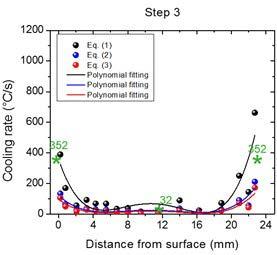
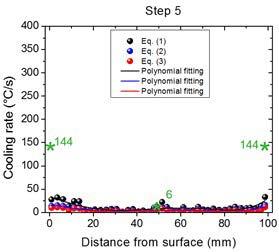
Fig.8 - Calculated cooling rate of Wedge 1 sample, based on the measured secondary dendrite arm spacing. Sign “ * ” indicates a cooling rate at each step of wedge mould sample based on the 2D heat exchange model (see Tab. 2 - Estimated cooling rate at each step of Wedge 1 sample based on the 2D heat exchange model and time required for the sample to solidify.)
CONCLUSIONS In the current research the wedge mould experiments are used to assess the possibility of using this technique for the comparison between a lab-cast technique and the industrial continuously cast slabs, aiming at improve alloys development. It was found that the microstructure developed during cooling at step 3 and 5 correlates well with the microstructure found at thin slab caster and conventional slab caster samples respectively. It means that the wedge mould technique can be used for new alloys development to obtain the microstructure compared to that during continuous casting process. It was attempted to use a 2D heat extraction model to describe the temperature development in the wedge mould experiments. The results show that the 2D heat extraction model is good for the overall understanding and design of the wedge mould, but a 3D model will be better. Due to the presence of the casting channel, 3D heat extraction plays a significant role. On average, for steps 1 to 4 at the steel shell, the cooling rate based on 2D heat exchange model is estimated to be comparable or lower than the calculated cooling rate using Eq. (1). However, it is estimated to be higher compared to the cooling rate, calculated based on the Eq. (2) and Eq. (3). For step 5 is it higher compared to the results obtained from all three equations. In the centre of the sample, however, the cooling rates between 2D heat exchange model and all three equations
are comparable for all five steps. The deviation of the cooling rate at the steel shell may be explained by the lack of measured SDAS data since it is difficult to reveal and measure the dendrites right at the steel shell when the cooling rate is the highest and the dendrites are the smallest. Acknowledgments Andre Burghardt and Henk Visser originally designed and modelled the wedge mould, without their contribution, this work would not have been possible. The experiments and thermocouples measurements have been carried out by Menno Effern, Nick Ontijt and Ben Voskamp, also their contribution to this study is greatly acknowledged.
REFERENCES
[1] J. Andersson, T. Helander, L. Höglund, P. Shi and B. Sundman, “Thermo-Calc and DICTRA, Computational tools for materials science,” Calphad, vol. 26, pp. 273-312, 2002. [2] K. Hechu, Assessmnt of solidification behaviour of peritectic steels (PhD thesis), Coventry: University of Warwick, WMG, 2018. [3] S. Louhenkilpi, J. Miettinen and H. L., “Simulation of Microstructure of As-cast Steels in Continuous Casting,” ISIJ International, vol. 46, no. 6, p. 914–920, 2006. [4] M. C. Flemings, Solidification Processing, Mc Graw Hill Book Co., 1974. [5] A. Suzuki, T. Suzuki, Y. Nagaoka and Y. Iwata, “On Seondary Dendrite Arm Spacing in Commercial Carbon Steels with Differenct Carbon Content,” Japan Inst. Met. Mater., vol. 32, p. 1301–1304, 1968. [6] H. Jacobi and K. Schwerdtfeger, “Dendrite morphology of steady state unidirectionally solidified steel,” Metallurgical transactions A , vol. 7A, pp. 811-820, 1976. [7] M. El-Bealy and B. Thomas, “Prediction of dendrite arm spacing for low alloy steel casting processes,” Metallurgical and Materials Transactions B, vol. 27B, 1996. [8]Y.-M. Won and B. G. Thomas, “Simple model of microsegregation during solidification of steels,” Metallurgical and Materials transactions A, vol. 32A, p. 13, 2001.
