
SPECIAL FOCUS: AIM
VentureEdge EUROPE © Copyright 2006 Dow Jones & Company, Inc. All Rights Reserved.
2006 | € 150 INASSOCIATIONWITH

Figure
Figure
Figure
Figure
Figure
Figure
Figure
Figure
Figure
Figure
VentureEdge Europe 2006
Editorial: Stephen Harmston-Green, Michelle Jeffers
Research: John Gabbert, Stephen Harmston-Green, Brendan Hughes, Jessica Canning, Victoria Camporeale, Arno Castanet, Gina Chan, Jonathan Cohen, Valerie Foo, Joshua Grove, Isaak Better, Regina Hoshimi, Shawn Jaswal, Hanne Lindoe, Michael Kwong, Gali Limor, Michael Little, Sabelle Mang, Ashish Narayan, Alexis Perry, Rafia Qureshi, Justin Renaudin, Toivo Rehemets, Ai Sato, Shimrit Shepherd, Martin Smith, Nicholas Smith, Alex Tan, Vidya Tiku, Dan Wang, Silvia Zerbio
Design: Tuncel Gokcepinar, Ray-Michael Peterson, Angie Espejo, Derrek Strickland
3
4 Introduction 5 European Market Overview: 2005
1: Number of Deals and Amount Invested in European Venture-Backed Companies
2: Largest Venture Capital Deals in Europe (2005) 6 Europe vis-à-vis the U.S.
Table of Contents
Figure
Figure
3: Investment in Venture-Backed Companies, Europe vs. United States
4: Number of Venture Capital Deals, Europe vs. United States
5: Percentage of European Deals with U.S. Investors 7 Individual European Country Perspectives
6: European Venture Capital Deal Flow by Country Figure 7: Equity Investment in Europe for Major Countries Figure 8: European Venture Capital Investment Geographic Analysis 8 Major Venture-Backed Industries Figure 9: 2005 European Investment by Industry 9 Health care Investment Figure 10: Venture Capital Investment in European Healthcare Companies Figure 11: European Healthcare Investment Allocation by Sector 9 IT Investment Figure 12: Venture Capital Investment in European Information Technology Companies Figure 13: European Information Technology Investment Allocation by Sector 10 Later Stage Activity
14: European Deal Flow Allocation by Round Class
15: Initial vs. Follow-on Financing Rounds
16: Follow-on Financing: Insider vs. New Investor Rounds 12 Capital Efficiency
17: Median Amount Invested in European Financing Rounds
18: Median Time Between Financing Rounds 12 Valuations
19: Median Pre-money Valuation of European Financing Rounds 13 Investor Spotlight
Figure
Figure
Figure
Figure
Figure
Figure
Figure
Figure
21: Top Investors in Europe 12 Fundraising
20: European Funds Raised for Venture Capital, Private Equity, and Buyout Investment
22: Largest Funds Raised 2005 14 Liquidity
23: European IPO activity
24: European M&A activity 16 Special Focus: AIM
Number of Listed Companies Companies
25:
Raised
26: Cross Proceeds
27: Trading Volume
Floor 5, 12 Norwich Street,
EC4A 1QN,
Tel: +44 207 842 9898 Ventur eEdge EUROPE © Copyright 2006 Dow Jones & Company, Inc. All Rights Reserved.
London,
UK
“The well-bred contradict other people. The wise contradict themselves”
—O SCAR W ILDE

For European venture capital, 2005 was the year of contradictions. On the one hand, there was much celebration about the market hitting some home run investments, most notably Skype and Q-Cells as European liquidity activity for venture-backed companies rebounded significantly, In addition, venture capital fundraising in Europe reached its highest level in three years, albeit concentrated in a small number of large funds. But on the other hand, venture capital deal flow took a steep decline and the capital invested shrank considerably.
Venture capital deal flow reached only 84% of 2004’s level and capital investment declined 5%. The slight uptick in investment in 2004 that brought cautious optimism about the state of the European venture capital market now seems premature. Instead it appears that European investors remain in a state of flux with widely varying levels of interest in the market.
The European venture capital market is not unique in its experiences. Deal flow for the year was also down in Israel, reaching only about 83% the rate it had the year before. In the U.S. however, deal flow flattened out, ending the year practically even with 2004. Furthermore, the dollars invested in the U.S. surpassed 2004 investments by almost $500 million, or 2%.
While 2004 seemed to be a year of rebuilding in the worldwide venture capital industry, coming off the low point the market had reached in 2003, 2005 was a year of contrasting fortunes. Early stage investing fell in favor of supporting existing portfolio companies. Later stage investing in the U.S. climbed in the second quarter, reaching its highest level in four years. In Europe, the percentage of the total investment going
into later stage deals rose to 49%, up from 44% in 2004.
The focus on later stage was the result of the liquidity climate in Europe, as investors finally saw significant exit opportunities for older portfolio companies. New exchanges in Europe aimed at smaller entrepreneurial companies have improved the ability of companies to seek public market exits.
Overall, 60 venture-backed companies completed initial public offerings in 2005, raising €2.03 billion—the most in a single year since 2000. In fact, it was even more than in the U.S. in 2005, which had only 41 companies complete IPOs.
The 2005 total reflects a 185% increase over 2004, when €712.5 million was raised in 35 venture-backed IPOs. But it remains far off the level of 2000, when 182 European companies raised €12.05 billion in IPOs.
Other than IPOs, however, the exit market slowed in the form of mergers and acquisitions. Only 163 were completed in 2005, down from 195 in 2004. But the median amount paid for these companies increased to €22.5 million, up from a median €17.8 million in 2004.
The median round size also rose, reaching €2 million. Last year’s median round size was €1.5 million. This is related to another trend: the lengthening of the median time between rounds. Investors appear to be requiring portfolio companies to reach significant milestones in their growth and are waiting approximately 19 months between financings, compared to about 10 months in 2000. European companies being financed are also posting higher valuations, a median €4.1million, compared to €3.8 million in 2004.
Introduction 4 VentureEdge Europe » 2006
S T E P H E N H A R M S T O N - G R E E N | | Director, International Research Dow Jones’ Ventur eOne
2005
The European venture capital market saw significant improvement in liquidity opportunities in 2005, with 60 venture-backed companies completing initial public offerings. These IPOs raised €2.03 billion for the companies—the most in a single year since 2000. In fact, European venture-backed companies were more successful than their U.S. counterparts in this regard, as only 41 venture-backed U.S. companies completed IPOs in 2005.
Along with the improved liquidity climate, venture capitalists raised €3.70 billion in 2005, the highest amount in three years. But it remains to be seen if this improved liquidity and fundraising activity will be enough to rebuild investor confidence. Of course, investors will only build firms large enough to advance to successful exits if they are confident enough to deploy reserves of capital, and only by taking advantage of exit
opportunities will they be able to position themselves securely for the next fundraising rounds from limited partners.
By year’s end, it was evident that European venture capital investment was on a slower pace than in 2004. Overall, €3.60 billion was invested in 1,020 financing transactions, annual decreases of 5% and 16% respectively. In fact, deal flow was at its lowest level since pre-1999, although the investment level was slightly higher than in 2003.
Despite the declining number of deals several significant trends were in evidence in 2005. Among them was an increase in later-stage rounds, which represented 40% of all deals occurring in Europe compared to 33% of the deals in 2004. The focus on later-stage activity is, of course, coming at the expense of early-stage and second-round deals. Early-stage deals grew steadily over the four quarters of 2004, ultimately
European Market Overview
5 VentureEdge Europe » 2006
Amount Invested Number of Deals
Figure 1: Number of deals and amount invested in European venture-backed companies
413 322 378 281 379 301 333 284 296 251 273 249247 €1.2B €0.8B 4Q02 1Q03 2Q03 3Q03 4Q03 1Q04 2Q04 3Q04 4Q04 1Q05 2Q05 3Q05 4Q05 €1.0B €1.0B €1.0B €1.0B €0.8B €0.8B €0.9B €0.9B €0.9B €0.9B €1.1B Company NameCountryClose DateRaised (€M) Company Description OxagenUnited Kingdom23/05/05 46.20Provider of advanced genetic analysis. CuracyteGermany17/02/05 31.50Developer of hematology, anti-thrombosis, and oncology medication. SpeedelSwitzerland22/02/05 30.83Provider of cardiovascular and metabolic disease therapeutics. WilexGermany30/04/05 30.00Developer of biopharmaceutical therapies for various tumors, including renal and breast cancer. Newron PharmaceuticalsItaly21/02/05 30.00Developer of small molecule drugs for the treatment of central nervous system (CNS) diseases. TrigenUnited Kingdom11/10/05 26.50Developer of drugs for the management of occlusive and inflammatory cardiovascular diseases. Zealand PharmaDenmark07/01/05 26.30Developer of therapeutic drugs which can improve the treatment of severe diseases. Cerenis TherapeuticsFrance12/07/05 25.00Developer of high-density lipoprotein (HDL)-related drugs. NemeriXSwitzerland08/09/05 25.00Provider of fabless semiconductors. ApertioUnited Kingdom31/12/05 24.96Provider of network development infrastructure. DiBcomFrance29/08/05 24.50Provider of low power system-on-chips (SoC).
Source: VentureOne/Ernst & Young | Underlying data available in VentureSource
Figure 2: Largest venture capital deals in Europe (2005)
making up a third of all deal flow in Europe that year. However, in 2005, early-stage deals represented just 31% of the completed rounds, and second rounds made up only 22%.
The median amount of capital invested in later rounds also increased, reaching €2.5 million, about €350,000 higher than it was a year ago. This indicates that investors in Europe are directing substantial sums to those companies they view as having the most promising exit potential. Larger round medians were also apparent for early-stage and second rounds - in 2005, the median amount invested in a first round of financing was €2 million, up from the €1.25 million median for 2004, whilst for second round financings the median amount invested in a round was €2 million, up from €1.5 million.
The growing size of venture capital deals indicates that while fewer companies are able to secure a financing round, those that do are receiving larger investments with the potential to sustain them as they seek potential partnerships and/or exit opportunities.
Europe vis-à-vis the U.S.
In contrast with Europe, U.S. venture capital investment increased slightly in 2005.
In the U.S., $122.13 billion was invested in 2,239 deals. Deal count was reduced by 10 deals from 2004, but the amount invested was up 2%. On a quarterly level, deal flow in the U.S. was slow in the first quarter of 2005, but picked up by the second quarter and continued to rise quarter-on-quarter throughout the rest of the year. Investment levels ranged from $4.93 billion to $5.98 billion over the course of 2005.
As in Europe, U.S. investors focused on existing portfolio companies, with later-round deals capturing 37% of deal activity. In addition, the $10.60 billion invested in later rounds in 2005 was 14% higher than the amount of capital
directed toward these rounds a year ago.
On the other hand, seed and first round deals grew to represent 35% of the deal flow in the U.S. in 2005, up slightly from 34% in 2004. In addition, $4.75 billion was invested in these rounds in 2005, compared to $4.61 billion in 2004, a 3% increase in capital investment.
Interestingly, healthcare and products and services company financings saw the largest percentage of early-stage deals, with 39% of the deals in both these industry categories occurring in seed and first round financings in 2005. While this is fairly consistent for healthcare financings, it represents a comeback for products and services deals, as last year only 30% of the deals in this industry category were early-stage deals.
As with last year, the percentage of second round deals in the U.S. continued to decline, representing just 20% of all completed rounds in 2005. This may be a result of fewer initial deals being completed during the last few years, leading to a dearth of companies in line for second round financings.
While liquidity options in the form of initial public offerings and mergers and acquisitions in the U.S. opened up slightly in 2004, they slowed somewhat in 2005.
They have yet to return to the levels of the last decade, causing investors to proceed cautiously as they consider their investments’ ultimate exit potential.
Within the U.S. venture capital market, information technology still represents the majority of financings, with $11.97 billion invested in 1,276 IT rounds in 2005, representing 57% of the deal flow. However, this is a smaller proportion than in 2004, when IT deals made up 61% of overall deal flow, and both IT deal flow and investment were off the pace of 2004 levels, when $12.45 billion was invested in 1,380 financing rounds. Within the IT category, only communications and information services deals held relatively steady with 2004.
6 VentureEdge Europe » 2006
Figure 4: Number of Venture Capital Deals, Europe vs. United States
VentureSource Europe U.S. 600 400 200 0 4Q02 1Q03 2Q03 3Q03 4Q03 1Q04 2Q04 3Q04 4Q04 1Q05 2Q05 3Q05 4Q05
Source : VentureOne/Ernst & Young | Underlying data available
in
Figur e3: Investment into venture-backed companies, Europe vs. U.S. ( B)
4Q02 1Q03 2Q03 3Q03 4Q03 1Q04 2Q04 3Q04 4Q04 1Q05 2Q05 3Q05 4Q05 €4 €6 €2 €0
Source : VentureOne/Ernst & Young | Underlying data available in VentureSource U.S. Europe
U.S. healthcare companies posted steady investment levels with 2004. By year’s end, 537 healthcare financings raised $6.70 billion in 2005, compared to 525 healthcare rounds in 2004, which raised $6.97 billion. Within the category, investment and deal flow in biopharmaceuticals—the largest segment—faltered in 2005, but investment and financing rounds were up for all other segments: medical devices, medical information systems, and healthcare services. Overall in 2005, healthcare financings made up about 24% of deal flow, compared to 23% in 2004. In terms of capital, healthcare companies received about 30% of the amount invested in 2005, compared to 32% a year ago.
A renewed focus for the U.S. venture capital market is products and services companies, which received $2.76 billion invested in 324 financing rounds in 2005. This represents an increase of 17% in deal flow from 2004, and 48% more capital invested. However, these figures should be treated with caution, as this category was also home to the largest U.S. deal in 2005, the $320 million investment in Integro (New York, NY), an insurance provider. This was the largest venture capital investment since 2001.
Over the past few years, the amount invested into European entrepreneurial companies is running at about 20% of the amount invested into similar U.S. firms. The long-run disparity in terms of amount invested continues to be a function of the immaturity of the European venture capital industry and reduced awareness among institutional investors.
With regard to the number of transactions, Europe hit an historical peak in 2001, when deal volume was about 82% of that in the U.S. By 2005, European companies completed only 46% as many rounds as their U.S. counterparts. This remains low compared to historical levels, indicating that there is more room for short-term growth in the European
market in terms of number of deals completed.
With 46% of the deals but only 21% of the money, European entrepreneurial companies continue to receive, on average, much smaller investments than their U.S. counterparts. This is a function of the relative size of venture capital funds in the two markets. The greater maturity of the U.S. market, and its larger returns to limited partners, has led to wider acceptance among investors such as pension funds and foundations. This has driven up the median venture capital fund size, which in turn has pushed up the average deal size. Other aspects being equal, this puts European entrepreneurs at a disadvantage.
Individual Country Perspectives
After holding steady in 2004, European venture capital investment faltered in 2005, although to a greater extent in deal flow than in actual capital investment. The slowdown in the number of deals completed compared to the amount invested is perhaps to be expected, and is a trend that may well continue. Many European venture firms have been discussing the need to invest more money in fewer companies in order
7 VentureEdge Europe » 2006
Figure 5: Percentage of European Deals with U.S. Investors
No U.S. Investors U.S. Investors 100% 75% 50% 25% 0 4Q02 1Q03 2Q03 3Q03 4Q03 1Q04 2Q04 3Q04 4Q04 1Q05 2Q05 3Q05 4Q05
Source
: VentureOne/Ernst & Young | Underlying data available in VentureSource
Figure 6: 2005 European Venture Capital Deal Flow by Country
UK 31% France
Sweden 9% Other
Switzerland
Ireland 3% Denmark
Germany
€
Source : VentureOne/Ernst & Young | Underlying data available in VentureSource
21%
17%
3%
6%
10%
500
Figure 7: Equity Investment in Europe for Major Countries(M)
UK France Germany Sweden Ireland €400 €300 €200 €100 €0 4Q02 1Q03 2Q03 3Q03 4Q03 1Q04 2Q04 3Q04 4Q04 1Q05 2Q05 3Q05 4Q05
Source
: VentureOne/Ernst & Young | Underlying data available in VentureSource
to compete with their counterparts in the U.S. Historically the average round size has been much lower in Europe, which has constrained the growth rate of European firms.
The U.K., which often bucks the trend of the rest of Europe, was in fact complicit in the declines this year. On one hand, the U.K. continued to command the greatest amount of venture capital activity in Europe – its 307 deals in 2005 represented 30% of all deals on the continent, and the €1.04 billion invested corresponds to 29% of the European total.
The number of U.K. deals, however, was down 9% from 2004, and the monies invested decreased by 11%. Early-stage investment capital declined from €313 million in 2004 to €183 million in 2005, although the amount invested in later-stage financings in the U.K. rose from ¤451 million in 2004 to €546 million in 2005.
Three of the top 10 deals in Europe in 2005 were in the U.K. including the year’s largest, the €46.2 million laterstage investment in Oxagen (Abingdon) a provider of advanced genetic analysis. MPM Capital led the round, which also included investment from 3i Group, Abingworth Management, Advent Venture Partners, Bessemer Venture Partners, IBT Ventures, Quester Capital Management, Red Abbey Venture Partners, Schroder Ventures Life Sciences, and Wellcome Trust. Among specific industries, software, biopharmaceuticals, and consumer and business services were the most popular investment areas in the U.K.
France was the second most active country for venture capital, with 213 completed financing rounds and €650.0 million invested. Although investment activity in France declined in 2005, it posted the smallest declines of the major investment areas, with deals down by 4% and investment capital down by only 2% from 2004.
In contrast, Germany saw much steeper declines from 2004, with deals down 26% to 106 and capital down 5% to €512.3 million. However, Germany was also home to two of the year’s largest deals - the €31.5 million investment in Curacyte (Leipzig) a developer of hematology, anti-thrombosis, and oncology medication; and the €30 million investment in Wilex (Munich) a developer of biopharmaceutical therapies for various tumors.
Curacyte was funded by AlpInvest Partners, GZ Paul Partners, IBG Beteiligungsges. Sachsen-Anhalt, IKB Private Equity, Mittelstandische Beteiligungsgesellschaf, Quintiles PharmaBio Development, Sachsen LB Corporate Finance Holding, S-Beteiligungen, Stroh Companies, and Techno Venture Management. Wilex was funded by Apax Partners & Co. Ventures, Earlybird Venture Capital, Individual Investors, Karolinska Investment Fund, Merlin Biosciences Limited, Quest For Growth, Quintiles Transnational, and TVM Techno Venture Management
A survey of other European countries reveals that in Switzerland capital investment rose 39% to €267.9 million, although there were five fewer deals in 2005. In Ireland, deal flow was down by 12 deals, but investment increased 4% to €114.4 million. In Norway, deal flow decreased by eight deals, but the amount invested increased 42% to €103.8 million.
The U.K. still accounts for the biggest share of the market both in terms of amount invested (29%) and number of deals (30%). However, France is gaining somewhat. Its proportion of the invested capital in Europe has remained steady at 18% for the past two years, but in 2005 it was also responsible for 21% of the deals, up from 18% in 2004. France’s activity is in contrast to Germany, which has seen deal flow shrink as a representative percentage. In 2004, 12% of the European deals occurred in Germany while in 2005, it was only 10%. In both years, German companies received 14% of all capital invested.
Major Venture-Backed Industries
While investments declined among all major industries in Europe, investment into healthcare companies, bolstered by
8 VentureEdge Europe » 2006
Countries EASTERN EUROPE Estonia2 0.90 Hungary3 4.09 Russia3 5.41 Eastern Europe Total8 10.40 NORTHERN EUROPE Denmark58 233.18 Finland 38 90.19 Norway 27 103.78 Sweden96 268.93 Northern Europe Total219 696.09 WESTERN EUROPE Austria19 70.42 Belgium 22 50.24 France 213 650.03 Germany 106 512.33 Ireland 30 114.35 Italy 8 67.94 Netherlands20 66.86 Portugal5 19.98 Spain 23 32.66 Switzerland 33 267.91 United Kingdom 307 1,037.31 Western Europe Total786 2,890.30
Figure 8: 2005 European Investment Geographic Analysis ( € M)
substantial capital directed toward biopharmaceutical and medical devices deals, held relatively steady for the year. In total there was €1.54 billion invested across 292 deals in 2005. The healthcare industry also took a greater percentage of the venture capital market, representing 43% of the overall capital invested in 2005 and 29% of the year’s deal flow. In comparison, healthcare accounted for only 11% of all venture capital investment in 2000. However, even though it now accounts for a greater piece of the total
invested, the amount is still significantly reduced from the 2000 and 2001 peak, when more than €2.45 billion was invested in healthcare companies.
Information technology continued to dominate venture capital investment in Europe. The €1.57 billion invested in 528 deals represented 44% of the amount invested in 2005 and 52% of the deals. The percentage breakdown for this industry has changed somewhat from 2000, when IT received 55% of the deals and 61% of the amount. In its place, healthcare investment has taken a greater share. In a year-on-year comparison, IT investments declined by 8% from 2004, and deal flow dropped by 18%.
The products and services category was the only industry category to see investment growth in 2005, with capital investment increasing 10% to € 350.0 million. However, deal flow declined in this category by 16 deals to give a total of 143 financings completed in 2005. As a percentage of total investment, this category represents only 13% of deal flow and 10% of capital investment.
Healthcare Investment
Since 2000, healthcare firms, unlike those in other sectors, have not witnessed as drastic a reduction in financial backing. While venture investment in IT and products and services sectors has declined by 88% and 94% respectively from 2000, healthcare investment has declined by 37%. One possible explanation is that venture capitalists recognize that these companies require a longer investment cycle and are therefore financially prepared to support them for several years. If healthcare investment requires more patience and arguably more money, investors know that the potential gains are significant. The intrinsic lure of the sector has also been augmented by the high-profile life sciences IPOs in the U.S. and Europe over the past two years.
In the short term, the decrease in the number of healthcare financings in 2005 was evenly distributed across the industry’s segments, which all posted fewer deals. However, larger medical device investments pushed the total amount invested in this segment up to €310.9 million in 2005, a 30% increase from a year earlier—making it the only healthcare segment to post a yearly increase in investment. Meanwhile, biopharmaceutical deals were down by 25 deals and investment in this segment was down by 7% to €1.16 billion.
9 VentureEdge Europe » 2006
Source : VentureOne/Ernst & Young | Underlying data available in VentureSource
Other
<1% Healthcare Services <1% Medical IS1% Adv Spec Mat & Chem1% Retailers2% Energy2% Information Services 3% Electronics5% Cons/Bus Services6% Communications 7% Semiconductors8% Medical Devices9% Software 21% Biopharmaceuticals 32% Total:3602.96 2005 European Investment by Industry (M) 767 311 170 89 48 36 113 73 42 14 34 229 236 285 2% Cons/Bus Products 1156 100 80 60 40 20 0 72 80 104 59 100 75 100 432 70 79 82 73
Figure 9:
Companies
Source : VentureOne/Ernst & Young | Underlying data available in VentureSource
70 233 454 504 364 495 405 326 4Q02 1Q03 2Q03 3Q03 4Q03 1Q04 2Q04 3Q04 4Q04 1Q05 2Q05 800 400 200 0 383 277 313 Amount Invested (M) Number of Deals 100 318 280 480 442 3Q05 4Q05 600
Figure 10: Venture Capital Investment in European Healthcare Companies
Figure 11: European Healthcare Investment Allocation by Sector
Medical IS Medical Devices Healthcare Services Biopharmaceuticals 100% 80% 60% 40% 20% 0% 4Q02 1Q03 2Q03 3Q03 4Q03 1Q04 2Q04 3Q04 4Q04 1Q05 2Q05 3Q05 4Q05
Source : VentureOne/Ernst & Young | Underlying data available in VentureSource
Healthcare was home to the largest deal of the year, the second quarter’s €46.2 million later-round investment in Oxagen (Abingdon, U.K.), a firm that analyses genetics for inflammatory and metabolic diseases.
Information Technology Investment
The IT sector saw a decrease in both investment and deal flow. Overall, there were 19% fewer deals and 8% less capital invested in this sector.
Software investment continued to account for the lion’s share of IT investment with €766.7 million and 294 deals, or 56% of all IT rounds in 2005. However, software overall was down 19% in deals and 8% in capital from the preceding year. Investment in communications companies also declined, with deal flow down 35% and investment down 49%. Investment in the electronics segment was up by 3% over 2004, to €169.7 million. More significantly, investment in the semiconductors segment increased 92% from 2004, standing at €284.7 million in 2005. However, there were only 47 semiconductor deals completed in the year, seven fewer than in 2004. There was a slight rebound in information services investments, with 6% more capital invested to give a total of €113.2 million, and deal flow increased by nine deals to 43. While the slight resurgence of interest in information services was noteworthy, the days appear long gone when information services accounted for almost one third of the total amount invested in the IT sector.
Perhaps unsurprisingly, the semiconductor segment also registered this year’s largest deal in IT: a €25 million later–stage investment in NemeriX (Manno, Switzerland), a provider of chipsets for ultra low power, radio frequency (RF), baseband and software designs for global positioning systems (GPS) solutions.
10 VentureEdge Europe » 2006
Initial Financings Follow-on Financings
Figure 15: Initial vs. Follow-on Financing Rounds
300 200 100 0 4Q02 1Q03 2Q03 3Q03 4Q03 1Q04 2Q04 3Q04 4Q04 1Q05 2Q05 3Q05 4Q05 New Investors Insider only Rounds
Source : VentureOne/Ernst & Young | Underlying
data available in VentureSource
So urce : VentureOne/Ernst & Young | Underlying data available in VentureSource 60% 50% 40% 30% 20% 10% 0 4Q02 1Q03 2Q03 3Q03 4Q03 1Q04 2Q04 3Q04 4Q04 1Q05 2Q05 3Q05 4Q05
Figure 16: Follow-on Financing: Insider vs. New Investor Rounds
Figure 14: European Deal Flow Allocation by Round Class
& Young
Underlying
available
SeedLater Second First 100% 80% 60% 40% 20% 0% 4Q02 1Q03 2Q03 3Q03 4Q03 1Q04 2Q04 3Q04 4Q04 1Q05 2Q05 3Q05 4Q05 800 600 200 0 154 157 191 159 201 226 173 469 126 130 146
: VentureOne/Ernst & Young
Underlying data available in VentureSource
Source : VentureOne/Ernst
|
data
in VentureSource
Source
|
158 383 466 477 460 393 471 409 382 418 436 371 418 181 126 200 150 100 50 0 Number of Deals Amount Invested (M) 400 4Q02 1Q03 2Q03 3Q03 4Q03 1Q04 2Q04 3Q04 4Q04 1Q05 2Q05 3Q05 4Q05 398
Figure 12: Venture Capital Investment in European IT Companies
Figure 13: European IT Investment Allocation by Sector
100% 80% 60% 40% 20% 0%
4Q02 1Q03 2Q03 3Q03 4Q03 1Q04 2Q04 3Q04 4Q04 1Q05 2Q05 3Q05 4Q05
Source : VentureOne/Ernst & Young | Underlying data available in VentureSource
Electronics Semiconductors Communications Information Services Software
Later-stage Activity
The concentration on later-stage investments seems to have returned in 2005. Later-stage deals made up 40% of all rounds completed in 2005—the largest percentage in the past five years and a considerable shift from 1999 and 2000, when later-stage deals represented only 10-12% of financing rounds in Europe. For the comparable period in 2004, later-stage deals represented 33% of the financing rounds.
In terms of investment, later-stage deals are also taking a larger percentage of the total, with 49% in 2005. Again, the greater focus on later-stage investment is historically significant, as it is the largest percentage of venture capital directed to this round class since pre-1999.
The overall switch from early-stage to later-stage investment is a natural part of the venture capital cycle. The success of venture capital in the U.S. in the 1980s was driven by the large flows of money invested in early stage projects in the late 1970s and 1980s. Similarly, the early 1990s saw a concentration on later-stage deals as investors picked up on the large flow of previous early-stage investments.
This phenomenon has both positive and negative drivers. In some respects, venture capitalists have little choice but to concentrate on later rounds. The significant spike in investment in the late 1990s and 2000 spawned a huge number of venture-backed companies. Combined with the contraction of the IPO and M&A markets, this means that venture capitalists face stark choices. Although exit markets are beginning to improve, many companies still require a large pool of money to see them through to an exit opportunity. However, as raising new funds is proving difficult, venture capitalists must make tough decisions about where their remaining funds are allocated. Each portfolio must have some successes—otherwise the firm will not generate the returns necessary to convince limited partners to re-invest. Venture capitalists must therefore conserve cash to support their most promising portfolio companies through to successful exits. Investors must also factor in returns. Investing at the early stage may yield potentially higher returns, but investing at the later-stage may result in a shorter turnaround for returns – both of which impact IRRs.
In 2004, there were signs that the pendulum was swinging in the direction of early-stage investing. But in 2005, for most investors, it appeared the risk/reward trade-off was more compelling at later-stages. Companies that have
11 VentureOne’s VentureEdge Europe » 2006
Figure 17: Median Amount Invested in European Financing Rounds (M)
2.5 2.0 1.5 1.0 0.5 0 1.2 1.0 1.4 1.7 1.1 1.3 1.6 1.5 1.5 2.2 1.9 1.5 2.0 4Q02 1Q03 2Q03 3Q03 4Q03 1Q04 2Q04 3Q04 4Q04 1Q05 2Q05 3Q05 4Q05
Source: VentureOne/Ernst & Young | Underlying data available in VentureSource
Figure 19: Median Pre-moneyValuation of European Financing Rounds (M)
6 5 4 3 2 1 0 3.5 3.6 4.3 3.6 4.0 3.3 5.5 3.5 3.1 4.4 3.3 3.9 4.8 4Q02 1Q03 2Q03 3Q03 4Q03 1Q04 2Q04 3Q04 4Q04 1Q05 2Q05 3Q05 4Q05
Source: VentureOne/Ernst & Young | Underlying data available in VentureSource
Figure 18: MedianTime (in months) Between Financing Rounds
18.3 19.8 25 20 15 10 5 0 20.2 20.3 19.5 18.5 19.9 17.6 22.0 18.5 18.4 20.7 17.1 4Q02 1Q03 2Q03 3Q03 4Q03 1Q04 2Q04 3Q04 4Q04 1Q05 2Q05 3Q05 4Q05
Source : VentureOne/Ernst & Young | Underlying data available in VentureSource
Venture Capital Buyout Other Private Equity
2000
Figure 20: European Funds Raised for Venture Capital, Private Equity, and Buyout Investment B ( )
Young | Underlying data available in VentureSource 2001200220032004 30 20 10 0 13.8 19.0 2.3 1.4 12.2 2.8 9.5 19.2 5.2 4.4 15.0 5.8 1.5 12.0 3.6 3.7 29.1 3.7 2005
Source: VentureOne/Ernst &
XAnge
already raised multiple funding rounds are likely to have well-developed technologies and may be at or approaching profitability (although this is more likely in IT than in health care). The risk involved in investing in these companies is much lower than for seed or startup companies. At the same time, valuations have been increasing for laterstage deals, reducing the long-term potential gains from later-stage investment. There is an argument within the industry for investing at earlier stages in a firm’s development, as there is currently less competition between investors. Some investors also argue that company formations allow them to start with a “clean sheet”, without the historical baggage of the restrictive terms often applied to prior rounds in a down market. There are small numbers of specialist early-stage investors, but most venture firms in Europe have traditionally moved with the market. This might change going forward, as many investors are on the fundraising trail and trying to differentiate themselves.
Capital Efficiency
There has been a strong negative correlation between the number of deals completed over time and the median time between financing rounds. Over the past three years, the median time between rounds has been creeping up quarter by quarter. In 2000, the average period between financing
rounds was about 10 months, whilst by 2005 the average had reached about 19 months.
The overall increase in the median time between rounds since 2000 can be viewed as a re-adjustment to new market realities. In 2000, the business model for many venturebacked entrepreneurs involved swift expansion in a capitalintensive manner through advertising, building communication infrastructure, and rapid product development. The short time between rounds in 2000 was a function of companies’ high burn rate, which in hindsight often seems to have been an inefficient use of venture money. In the current environment, the emphasis is on working venture money as hard as possible, with ambitious plans for aggressive growth often curtailed in favor of cutting costs and increasing sales. The increase in time between rounds has hovered between 18 and 22 months since 2003.
As the median time between rounds has increased, so has the efficiency of venture money. To attract funding, management teams have had to develop convincing business plans with measurable milestones, although this has led to increased time spent in securing funding at the cost of running their businesses.
Across Europe, the median amount raised by an entrepreneurial company increased upward in 2005.At year’s end, the annual median was €2 million, on par with 2000 levels.
12 VentureEdge Europe » 2006 Investing Firm Name Initial Company Investments Follow-on Investments Total Number of Deals 3i Group134356 YFM Group121022 SPEF Venture61521 SEB Foretagsinvest51621 Innovacom51318 Vaekstfonden51217
Partners8917
Gestion41317 Enterprise Ventures Limited10717
Venture7916
Sofinnova
I-Source
Atlas
Private Equity14115
Industrifonden31215
Innovation31215
CDC Entreprises
Apax Partners51015
Partners6814
Venture Capital5813
Fund Managers7512
Banexi Ventures
HealthCap
Wales
Siparex Group3912 Credit Agricole Private Equity6612
Figure 21: Top investors all deals 2005
Median deal sizes tend to be higher in the U.K. than the rest of Europe, and in both areas they tend to be much lower than that in the U.S. However, the highest rounds in 2005 were found in Germany, which posted a median round size of €3.5 million, followed by France, where it was €2 million. Germany’s higher median round size appeared to be bolstered by larger healthcare deals in particular this year. The U.K. had the smallest median round size for all the major countries, with €1.5 million.
Valuations
Valuations are the result of different and potentially conflicting forces: the fundraising environment and the consequent level of capital available for investment; the exit market whereby successful M&As and IPOs help entrepreneurs running similar companies to strike better deals with their investors; the number of companies with a convincing business model; and the type of deals (i.e. seed vs. later, typically with a higher valuation).
In 2005, the overall contraction in venture capital investment and reduced competition for deals led valuations to creep higher than 2004 levels. The overall median pre-money valuation was €4.1 million, up from €3.8 million in 2004.
By country, the median valuation in Germany increased to €11.6 million from €6.8 million in 2004. France’s median valuations also rose, to €4.4 million from ¤2.8 million in 2004. The median valuation for U.K. companies declined, however, to €3.7 million from €5.7 million.
Investor Spotlight
In 2005, 3i Group maintained its position as the most active investor in Europe, completing 56 deals, of which 43 were investments in existing portfolio companies. The second most active investor was YFM Group with 22 deals, more than half of which (12) were initial financings in new portfolio companies.
Unlike in the U.S., where nearly all the most active investors are pure-play venture firms, in Europe there is a broad mix of generalist private equity firms, investment
VentureEdge Europe » 2006 13 Investing Firm NameFirm TypeFund NameClosedAmount (€M) CVC Capital PartnersMezz/BuyoutCVC European Equity Partners IV29/07/05 6,000.00 BC Partners Mezz/BuyoutBC European Capital VIII30/04/05 5,500.00 Candover InvestmentsMezz/BuyoutCandover 2005 Fund10/11/05 3,500.00 PAI partnersMezz/BuyoutPAI Europe IV22/04/05 2,700.00 Bridgepoint Capital Mezz/BuyoutBridgepoint Europe III01/04/05 2,500.00 Montagu Private EquityOther Private EquityMontagu Private Equity III12/07/05 2,260.00 Barclays Private EquityMezz/BuyoutBarclays Private Equity European Fund II07/02/05 1,650.00 Doughty Hanson Mezz/BuyoutDoughty Hanson IV01/02/05 1,600.00 Electra Partners Europe Mezz/BuyoutElectra European Fund II LP01/07/05 1,250.00 Lion CapitalMezz/BuyoutLion Capital27/06/05 820.00 Inventages Venture CapitalCorporate Venture CapitalWhealth LP15/10/05 800.00 Clessidra Capital Partners Mezz/BuyoutClessidra Fund22/01/05 800.00 Investindustrial Private EquityMezz/BuyoutInvestindustrial III19/10/05 500.00 Sovereign Capital Mezz/BuyoutSovereign Capital II12/05/05 402.02
1000 800 600 400 200 0 M Number of IPOs 7 23 21 279 2 1 1 1 6 7 7 8 13 9 10 Source : VentureOne/Ernst & Young | Underlying data available in VentureSource
Figure 22: Largest Funds Raised 2005
20 15 5 361 310 1080 23 18 128 190 131 264 8 77 4Q02 1Q03 2Q03 3Q03 4Q03 1Q04 2Q04 3Q04 4Q04 1Q05 2Q05 3Q05 4Q05 10 0 0 20 40 60
Figure 23: European IPO Activity
Figure 24: European M&A Activity by Transaction
data available in VentureSource 34 31 42 39 37 47 49 48 51 41 51 44 27 4Q02 1Q03 2Q03 3Q03 4Q03 1Q04 2Q04 3Q04 4Q04 1Q05 2Q05 3Q05 4Q05
Source : VentureOne/Ernst & Young | Underlying
banks, and government investors, as well as corporate venturing and venture capital firms.
Like 3i, venture capitalists in general have, over recent quarters, been increasingly focused on existing portfolio companies and less on new investments. The proportion of follow-on financing rounds that included a new investor therefore declined in 2002 and 2003, reaching a low of about 40%. For the past year and a half, there has been a slight curtailment of this trend and in 2005 about 46% of follow-on financings included a new investor.
Fundraising
Fundraising in 2005 appeared to recover from the previously depressed market, at least in terms of venture capital fund. European VC firms raised the highest amount in three years, with fundraising totaling €3.70 billion in 2005. The total amount was 160% more than the amount raised in 2004, although two fewer funds closed in 2005.
While the pendulum swing that led to the rapid expansion of the European private equity market from the mid-1990s onward was reversed over the past two years, there is also renewed interest for buyout firms, which raised a total of €29.05 billion in 2005, an increase from the €12.21 billion raised in 2004. Other private equity funds rose to €3.67 billion, an increase from the €2.82 billion raised in 2004.
Liquidity
One of the most important factors contributing to the longterm health of the venture capital industry is the state of the exit market: initial public offerings and mergers and acquisitions. A stagnant market forces investors to continue funding existing portfolio companies, depleting their funds and preventing the funding of new companies. A robust market introduces liquidity and allows venture investors to distribute returns to their limited partners.
In 2005, European venture-backed companies enjoyed relative success in the liquidity market. Overall, 60 venturebacked companies completed initial public offerings in 2005, raising €2.03 billion.This is the most capital raised by IPO companies in Europe in a single year since 2000. In fact, it was even more than in the U.S. in 2005, which saw 41 companies complete IPOs. The 2005 European total
reflects a 185% increase over 2004, when €712.5 million was raised in 35 venture-backed IPOs. But it remains far off the level of 2000, when 182 European companies raised €12.05 billion in initial public offerings.
The ability of venture-capital supported companies in Europe to achieve IPO exits in larger numbers was clearly related to the new availability of exchanges such as AIM, which provides a marketplace for relatively young entrepreneurial companies.
By industry, 22 of the year’s IPOs were healthcare companies and 25 were information technology companies. By country, 22 of the IPOs were companies based in the United Kingdom, 14 were based in France and 10 were based in Germany. The median pre-money valuation of the European IPO companies was €42.0 million—up from €34.9 million in 2004. The median amount raised in equity prior to the IPO was €11.1 million—down from €13.3 million a year ago. Companies did require more time to go from initial equity financing to IPO: 5.9 years in 2005, compared to 4.3 years in 2004.
The largest IPO of 2005 was renewable energy company Q-Cells (XETRA: QCE) of Thalheim, Germany, which raised € 313.2 million in its October offering and was valued at € 1.09 billion.
In other liquidity transactions, there were 163 mergersand-acquisitions (M&A) deals for European venture-backed companies in 2005, a decline from the 195 that occurred in 2004. However, more was paid for the acquired companies: a median amount of €22.5 million, compared to €17.8 million in 2004. The median amount invested in these acquired companies was €6 million, about the same as in 2004. The companies being acquired took about 4.9 years from the time of initial equity financing to reach an acquisition, slightly longer than in 2004, when the median time from initial equity to acquisition was 4.2 years. By industry segment, more than half of the year’s M&A deals—86—were in the IT segment, while 47 were in the healthcare industry and 25 were products and services companies. By geography, 47 of the M&A companies were based in the U.K., 27 in France, and 26 in Germany. The largest venture-backed M&A of the year was the €2.08 billion acquisition of voice-over-IP software provider Skype Technologies of London by eBay (Nasdaq: EBAY).
14 VentureEdge Europe » 1H’05
VentureEdge Europe » 2006
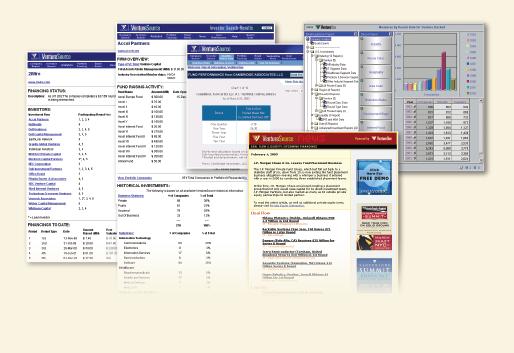
Company Profile Investor Profile Cambridge Associates LLC data The premier source for venture capital intelligence VentureSource News Company Analytics ■ Company Searches ■ Deal Searches ■ Investor Searches ■ Investment, Valuation, and Fundraising Analytics ■ Daily News Service ■ Customised Email Alerts ■ Full Concierge Service ■ 24-Hour-a-Day Support FOR A FREE DEMONSTRATION: +44 207 842 9858 / Sales@VentureSource.com / www.VentureSource.com © Copyright 2006 Dow Jones & Company, Inc. All Rights Reserved.
16 Special Focus VentureEdge Europe » 2006 INASSOCIATIONWITH
Figure 25
Figure 26
17 VentureEdge Europe » 2006
Figure 27
Methodology
The findings in this report are based on aggregate data from VentureOne’s proprietary European research. This data was collected by surveying over 1,200 active professional European investment firms, through in-depth interviews with over 7,000 company CEOs and CFOs, and from hundreds of secondary sources. The deals underlying this data can be viewed in VentureSource, the world’s leading venture capital research database. • These venture capital statistics are for equity investments into early-stage, innovative companies and do not include companies receiving funding solely from corporate, individual, and/or government investors. • No statement herein is to be construed as a recommendation to buy or sell securities or to provide investment advice.
About VentureOne
Dow Jones VentureOne (www.ventureone.com and www.venturecapital.dowjones.com), a unit of Dow Jones Financial Information Services, has been the leading provider of finance and investment data to the venture capital industry for almost 20 years. Dow Jones VentureSource, a sophisticated electronic database on the venture capital industry, is published by VentureOne.
About Dow Jones Financial Information Services
Through its Financial Information Services group, Dow Jones produces focused, sector-specific online databases, newsletters and industry events for the private equity, venture capital and diversified markets. Newsletters published include Private Equity Analyst, VentureWire Professional and Daily Bankruptcy Review. In addition, Dow Jones & Company (NYSE: DJ; www.dowjones.com) publishes the global Wall Street Journal with its international and online editions; Barron's; the Far Eastern Economic Review; Dow Jones Newswires and Indexes; MarketWatch; and Ottaway newspapers. Dow Jones co-owns Factiva with Reuters and SmartMoney with Hearst. Dow Jones also provides news content to CNBC and U.S. radio stations.

INASSOCIATIONWITH
About Wilmer Cutler Pickering Hale and Dorr LLP's Venture Capital Practice
Venture capital transactions are a cornerstone of WilmerHale's corporate practice and reflect our long-standing focus on technology, life sciences and entrepreneurial companies. We have a strong presence in the venture capital community throughout Europe and the United States. We also represent leading venture capitalists in fund formation and portfolio investments.
In the past five years, we have served as company counsel in more than 750 venture financings raising over $10 billion. We represent more European venture-backed companies than any other law firm and we are counsel to more venture-backed companies based in the eastern half of the US than any other law firm.
We have more than 1,000 lawyers, and offices worldwide in Baltimore, Beijing, Berlin, Boston, Brussels, London, Munich, New York, Northern Virginia, Oxford, Palo Alto, Waltham and Washington. For more information, please visit our website at wilmerhale.com.
18 VentureEdge Europe » 2006




don’t like these odds? ...get VentureSource.
1,000,000 1
to
© Copyright 2005 Dow Jones & Company, Inc. All Rights Reserved. +44 207 842 9858 | Sales@VentureSource.com | www.VentureSource.com
