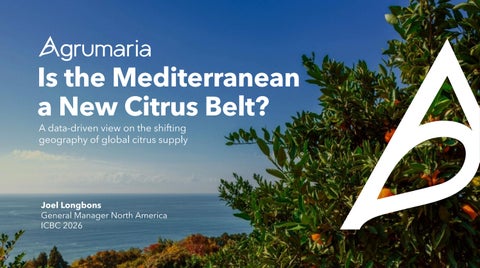
Is the Mediterranean a New Citrus Belt? A data-driven view on the shifting geography of global citrus supply
Joel Longbons General Manager North America ICBC 2026
About me
Joel Longbons General Manager, North America j.Longbons@agrumaria.com m +1 404 698 6550
2
Agenda 01
AGENDA | OVERVIEW
02
03
Fruit by Fruit
Risk & Outlook
1.1 What makes a "Citrus Belt"?
2.1 Orange
3.1 The HLB Advantage
1.2 Orange Production & Processing: 10 Years Ago, Today, and What's Next
2.2 Lemon
3.2 Why the Mediterranean is the New Citrus Belt: Conclusions
1.3 The Mediterranean Citrus Belt at a Glance
2.3 Niche Citrus
A New Geography for Global Citrus Supply
1.4 Processing Momentum: the last four seasons in the Mediterranean
3.3 Built for This Geography: Agrumaria's Dual-Origin Model
3
What makes a "Citrus Belt"? 02
01
PART I | A NEW GEOGRAPHY
03
Latitude & Climate
Scale & Diversity
Trade Orientation
20-40 degrees N/S, ideal diurnal range
Multiple species at commercial scale
Built for export or processing, not domestic
4
Orange Production & Processing: 10 Years Ago, Today, and What's Next GLOBAL ORANGE FRUIT AVAILABILITY
GLOBAL ORANGE PROCESSING
10 YEARS AGO (2013/14)
TODAY (2025/26)
1.24B boxes
1.12B boxes
(50.7M MT)
(45.9M MT)
10 YEARS AGO (2013/14)
TODAY (2025/26)
500M boxes
419.1M boxes
(20.4M MT)
(17.1M MT)
PART I | A NEW GEOGRAPHY
-9%
vs 2013/14
-16% vs 2013/14
1 box = 90 lb / 40.8 kg. Sources: USDA FAS; USDA NASS.
5
The Mediterranean Citrus Belt at a glance MEDITERRANEAN BASIN 2025/26
SPAIN & ITALY
~515M boxes
not published separately, EU total 31.7M boxes (1,293,000 MT) processed
(~21M MT)
ITALY
6 COUNTRIES TOTAL CITRUS FRUITS PROCESSING
10 YEARS AGO (~2013/14)
10 YEARS AGO (~2013/14)
500M boxes
64M boxes
TODAY (2025/26)
TODAY (2025/26)
515M boxes
64M boxes
(21M MT)
TURKEY
83.8M boxes (3.42M MT)
SPAIN
TOTAL CITRUS FRUITS AVAILABILITY
(20.4M MT)
PART I | A NEW GEOGRAPHY
116.2M boxes (4.74M MT) of which 4.0M boxes (162,000 MT) processed
133.3M boxes (5.44M MT)
(2.6M MT)
(2.6M MT)
1 box = 90 lb / 40.8 kg. Sources: USDA FAS/GAIN; TU2025-0067; MO2025-0021; E42025-0032; IS2024-0011.
MOROCCO
53.2M boxes (2.17M MT) of which 1.6M boxes (65,000 MT) processed
ISRAEL
EGYPT
121.3M boxes (4.95M MT) of which 22.1M boxes (900,000 MT) processed
11.5M boxes (470,000 MT) of which 3.8M boxes (156,000 MT) processed
6
Processing Momentum: the last four seasons in the Mediterranean
PART I | A NEW GEOGRAPHY
Since the 2022/23 trough the basin has grown in every season, compounding at 14.0% a year Citrus delivered to processing, basin total Of which Egypt:
+200%
42.7M boxes (1.74M MT)
2022/23
54.2M boxes (2.21M MT)
56.2M boxes (2.29M MT)
2023/24
2024/25
63.1M boxes (2.58M MT)
2025/26
1 box = 90 lb / 40.8 kg. Sources: EG2025-0031; TU2025-0067; MO2023-0021 and MO2025-0021; IS2021-0010 and IS2024-0011; E42023-0001 and E42025-0032.
7
Orange in the Mediterranean Belt 98.0M boxes (4.0M MT)
22.1M boxes (900,000 MT) processed 23.8M boxes (970,000 MT)
31.9M boxes (1.30M MT)
EGYPT
(4.0M MT)
22.1M boxes (900,000 MT) - 22.5% more to processing in 2025/26
SPAIN
2.7M boxes (110,000 MT) processed
98.0M boxes World's largest fresh orange exporter
1.6M boxes (65,000 MT) processed
ITALY
SPAIN & ITALY: 18.4M boxes (750,000 MT) processed
66.7M boxes (2.72M MT)
50.0M boxes (2.04M MT)
Blood orange +28% year on year
66.7M boxes (2.72M MT)
50.0M boxes (2.04M MT) EGYPT
PART II | FRUIT BY FRUIT
ITALY
SPAIN
TURKEY
MAROCCO
1 box = 90 lb / 40.8 kg. Sources: ISTAT 2026; USDA FAS MAPA aforo USDA GAIN TU2025-0067/MO2025-0021; EG2025-0031; MO2025-0021; E42025-0032.
8
Lemon 27.0M boxes (1.10M MT)
PART II | FRUIT BY FRUIT
21.3M boxes (870,000 MT)
1.2M boxes (50,000 MT) processed
Turkey
SPAIN & ITALY: EU total 6.8M boxes (278,000 MT) processed
Spain
12.5M boxes (510,705 MT)
Italy
ITALY LEMON, 2026 ISTAT
EGYPT LEMON & LIME, 2025/26
12.5M boxes
9.8M boxes
(510,705 MT)
(400,000 MT) 7.1M boxes (290,000 MT) equal to 72.5%, go to processing, up 17.5% year on year Egypt reports lemon and lime as one combined category
1 box = 90 lb / 40.8 kg. Sources: USDA FAS; TU2025-0067; E42025-0032.
9
Niche Citrus
PART II | FRUIT BY FRUIT
TURKEY ITALY
ITALY MAROCCO
BERGAMOT 662K boxes (27,000 MT) CEDRAT 27,696 boxes (1,130 MT) CLEMENTINE 16.9M boxes (690,207 MT)
TURKEY
MANDARIN & CLEMENTINE 53.7M boxes (2.19M MT)
ISRAEL
ISRAEL GRAPEFRUIT 3.8M boxes (155,000 MT)
1 box = 90 lb / 40.8 kg. Sources: ISTAT; TU2025-0067; IS2024-0011.
10
The HLB Advantage
PART III | RISK & OUTLOOK
MEDITERRANEAN FLORIDA
0% HLB
~95%
still fully clean
Production Decline (HLB-driven)
BRAZIL
~50%
of trees infected in 5 years
Buyers aren't just choosing origin, they’re looking for supply security.
11
Why the Mediterranean is the New Citrus Belt: Conclusions
CONCLUSIONS
Growing processing volumes, together with the Mediterranean’s unique 0% HLB status and its diversified, six-country base, position the region as a new Citrus Belt.
POTENTIAL
~515M boxes (~21M MT)
Combined Mediterranean citrus production across 6 countries
HEALTH
0% HLB The world's last major HLB-free citrus basin, structural, not cyclical
DIVERSITY AND SPECIALIZATION
6 countries A diversified portfolio, not a single-crop dependency
Different countries, different years, same direction: one integrated, HLB-free citrus belt. 12
Built for this geography: Agrumaria's Dual-Origin Model
AGRUMARIA | RISK & OUTLOOK
Two shores, one strategy: how Agrumaria's footprint mirrors the basin driving the next decade of citrus supply.
HARVEST COVERAGE
PRODUCT RANGE
EGYPT SCALE-UP
Dual Origin
Full Portfolio
Growing With the Market
Near year-round coverage from one supplier.
• • • •
Juice & Fruit Systems Essential Oil & Derivates Flavour & Extracts Integrated Fruit Solutions
Agrumaria processes approximately 4.4M boxes (180,000 MT) of oranges per year in Egypt, scaling alongside the market.
Two origins, one strategy: Agrumaria is structured the way the market is moving, diversified, resilient, and rooted in the region driving the next decade of citrus supply. 13
Scan the code to get insight and details on our 2027 Citrus Report!
Sources
SOURCES
• ISTAT • USDA FAS Citrus Annual Egypt • USDA GAIN Citrus Annual Spain, Turkey, Morocco, Israel IS2024-0011 • MAPA Spain • World Citrus Organisation
• USDA NASS • Agrumaria Market Intelligence
15
Thank you! j.longbons@agrumaria.com m +1 404 698 6550