5 minute read
PASSENGER TECHNOLOGY ADOPTION


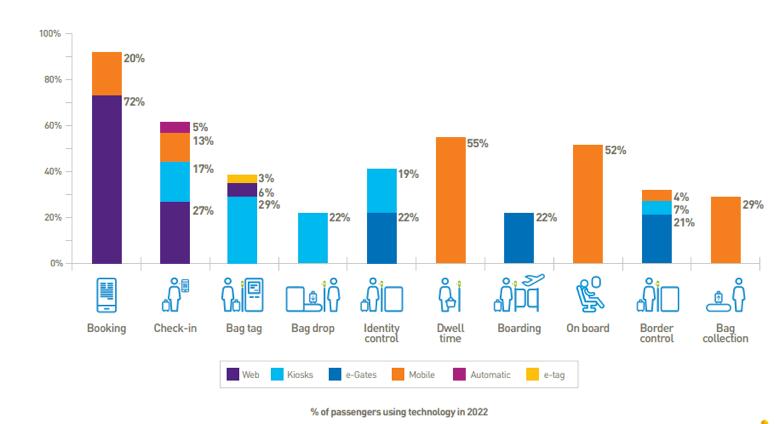
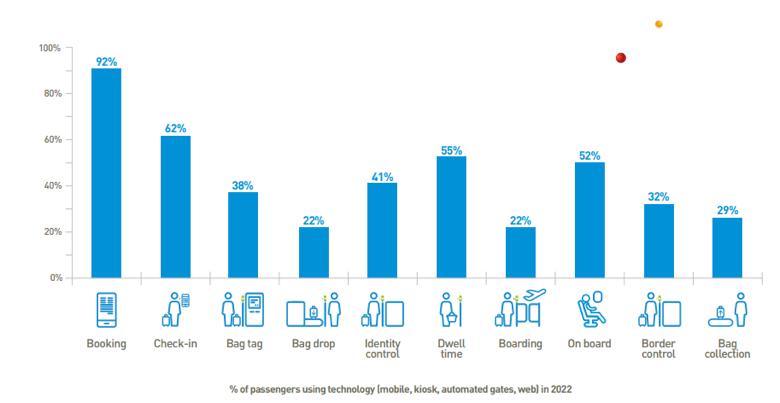
Technology adoption in 2022 reflects the pandemic’s effects on the passenger journey: Rates of technology adoption have remained relatively stable at each journey stage since the survey was last conducted in Q1 2020. However, there is a slight trend towards reduced technology usage in favour of manual interaction in the first half of the journey followed by increased technology adoption in the second half. Technology adoption at the check-in stage has decreased by 4% since Q1 2020, while the bag tag and bag drop stages have also seen decreases of 2 to 6%. Meanwhile, identity control, boarding, on board, border control, and bag collection have all seen increases in technology adoption of 3 to 5% from 2020. The overall lack of significant increase may be due to reduced travel during the COVID-19 pandemic, meaning passengers have not had the chance to familiarise themselves with new technologies. At the same time, due to the uncertainty around travel rules imposed by the pandemic, some flyers may have felt the need for more staff interaction at the beginning of the journey to ensure they were doing things correctly, but felt comfortable relying on technology in the second half.
Passenger technology usage preferences along the journey
Advertisement
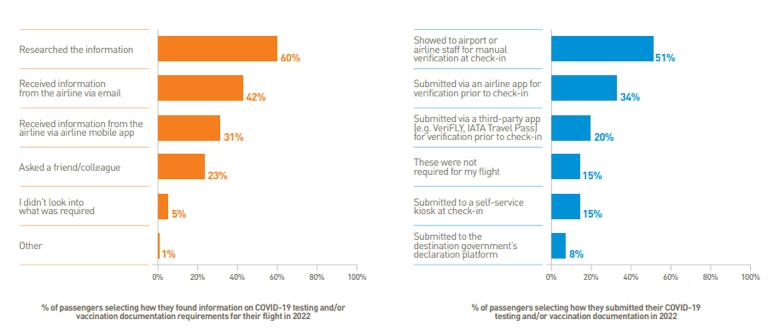
Health verification remains largely manual at the flight preparation stage, to understand COVID-19 verification requirements, most passengers (60%) actively researched the information, consulting sources such as government or airport websites, with nearly one quarter also asking others. At the same time, significant numbers of passengers received information on COVID-19 requirements directly from their airline, with 42% receiving this via email and 31% via the airline’s mobile app. At the stage of submitting COVID-19 documentation, just over half of passengers did so by manually showing it to staff. There was still some technology adoption at this stage, with just over one-third of passengers submitting documentation via an airline app and smaller numbers submitting via a third party app or self-service kiosk. The complexity of understanding ever-changing COVID-19 requirements is reflected in the high percentages of passengers who took multiple actions through various channels at each step. Over half of passengers who received COVID-19 information from the airline also did their own research online, and just over a third of those who submitted documentation via an app before check-in also underwent manual verification.
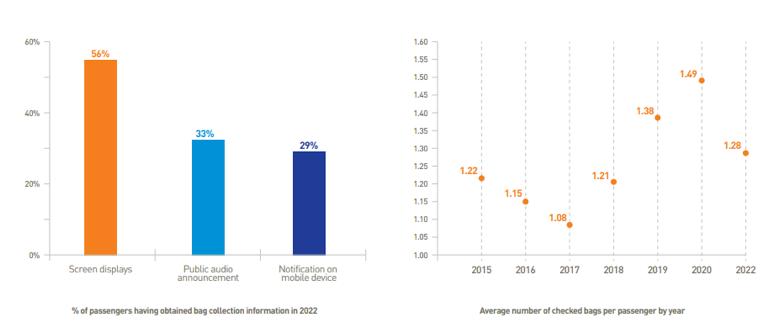
Mobile usage and real-time information growing at bag collection: The percentages of passengers who received information at bag collection via screen displays and public audio announcements have stayed the same since Q1 2020; however, a growing proportion of passengers are receiving notifications via their mobile devices (up 5% from 2020). Regarding the types of information passengers received, 57% were told belt numbers, and 50% were told time until delivery – the latter is up 8% from 2020, signaling a shift towards more real-time information being made available to passengers. Looking to the average number of checked bags per passenger, after steadily rising from 2017 to 2020 to reach 1.49, the figure dropped back down to 1.28 in 2022, a 14% decrease from 2020. This may be related to changes in airline pricing models for checked bags, as well as the shift towards greater proportions of domestic over international travel during the recent recovery period. IATA data shows that April 2022 traffic stood at -43.4% of April 2019 international traffic levels, but a significantly higher -25.85% for domestic.
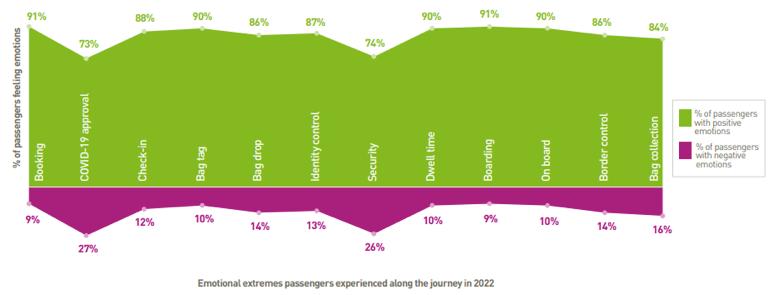
Greater technology adoption correlates with more positive emotions at key travel steps: Passengers appear happier overall throughout the journey in 2022 than in 2016 (the last time this metric was taken into account), with three particular pain points from 2016 seeing significant increases in positive emotions. The following all saw shifts in favour of more positive emotions: identity control (up 11% from 2016), security (up 6%), and bag collection (up 9%). Of these stages, the two where emotions have seen the greatest positive shifts since 2016 are also among the stages that have seen the highest increase in technology adoption over the same period. In fact, in 2016, there was no technology adoption for either identity control or bag collection, whereas in 2022, 41% of passengers are using kiosks and e-gates for identity control and 29% are receiving mobile notifications for bag collection.
Frequency of flying pre-pandemic vs. post-pandemic
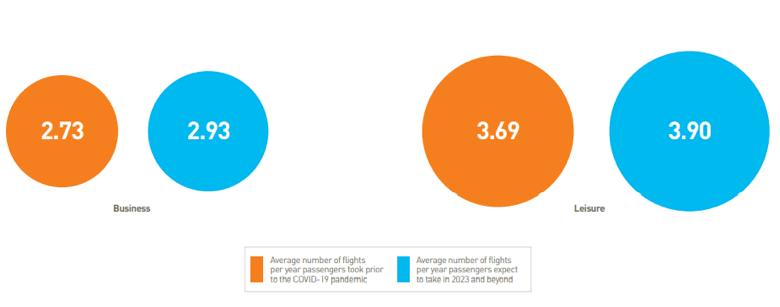
For recent travellers, demand has rebounded to – and even surpassed – pre-pandemic levels: Passengers report intentions to fly slightly more from 2023 onwards than they did prior to the COVID-19 pandemic. This holds true for both leisure and business travel, reflecting pent-up demand for travel following the period of disruption imposed by the pandemic. Passengers expect to take an average of 2.93 flights per year for business purposes from 2023 onwards, compared to the average of 2.73 flights per year taken before the pandemic. They in turn expect to take an average of 3.90 flights per year for leisure from 2023 onwards, up from 3.69 before the pandemic.
Note: the sample for this survey considers only individuals who traveled in Q1 2022, therefore representing the sentiments of those who were willing to travel before the wider lifting of travel restrictions.
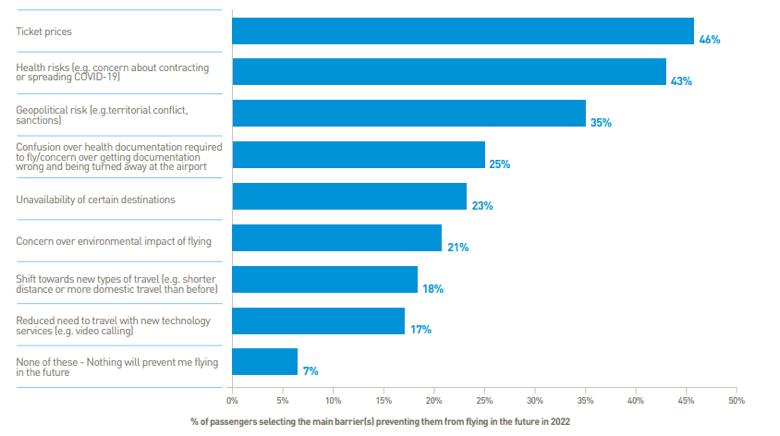
Current geopolitical and economic factors strongly influence anticipated barriers to flying:
The top three barriers to flying in the future that passengers anticipate in 2022 appear to closely relate to current global geopolitical and economic factors. Ticket prices come out as the number one anticipated barrier, with close to half of passengers citing this as a concern. While ticket prices are always likely to be a barrier, this may be exacerbated by the current inflation and rising costs facing many countries. Concern over health risks, ranked as the second biggest barrier, is clearly linked to COVID-19, suggesting that concerns are likely to continue, even among those who have been willing to fly during the pandemic. Geopolitical risk comes third, with about one-third of passengers listing it as a top concern; this is likely related to current crises such as the one in Ukraine, which may be creating further global uncertainties around the possibility and safety of travel on an ongoing basis. Indeed, the latter is ranked even higher (second, surpassing health risks) in Europe, the region most affected by the Ukraine conflict. On the other hand, health risks outweigh both ticket prices and geopolitical risks for first place in Asia, the Middle East, and Africa, where COVID-19 restrictions remain in fuller force.
Author: SITA Author: SITA
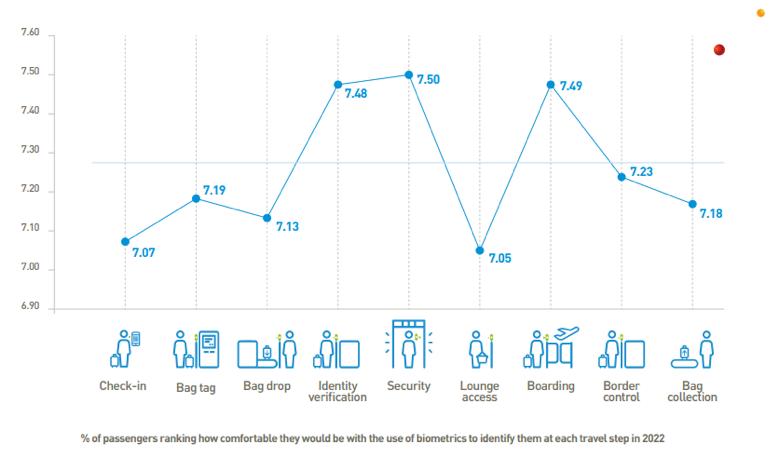
Comfort levels with biometric identification vary along the journey: When scoring out of 10 how comfortable they would be with biometric identity checks at each stage of the journey, passengers appear relatively comfortable with the use of biometrics. Passengers ranked identity control, security, and boarding the highest, possibly because they already expect various checks to occur in these areas. Conversely, check-in, bag drop, and lounge access came out as the lowest ranked, perhaps because passengers do not see the value of biometric identification at these stages.
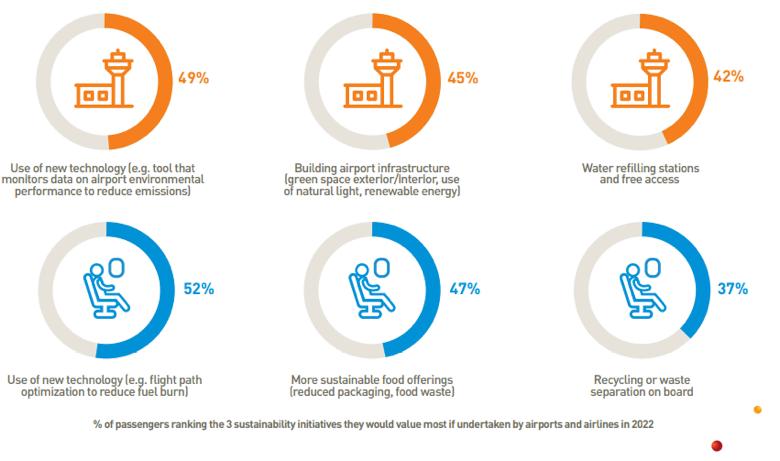
Top 3 Sustainability initiatives valued most by passengers
Growing interest in IT to support sustainability: Passengers have maintained from Q1 2020 the same top three sustainability initiatives they would value the most if undertaken by airports and airlines, with a strong interest in new IT solutions to support sustainability (valued by around half of passengers). On the airport front, this initiative has overtaken green airport infrastructure for first place (up 4% from 2020), suggesting all eyes are on the promises of technology to support concrete reductions to the environmental impacts of the industry. The continued sensitivity of passengers toward sustainable food options (47%), recycling, and water refilling stations are key areas of attention for the industry.