OAHU REAL ESTATE REPORT


2023 FEBRUARY STATISTICS { S O U R C E : H O N O L U L U B O A R D O F R E A L T O R S 2 0 2 1 }
ESTATE MARKET
REPORT
OAHU HOME SALES PICK UP MONTH-TO-MONTH, REMAIN DOWN YEAR-OVER-YEAR
Single-family homes are taking nearly four times longer to sell, and condos are taking two times longer to sell compared to
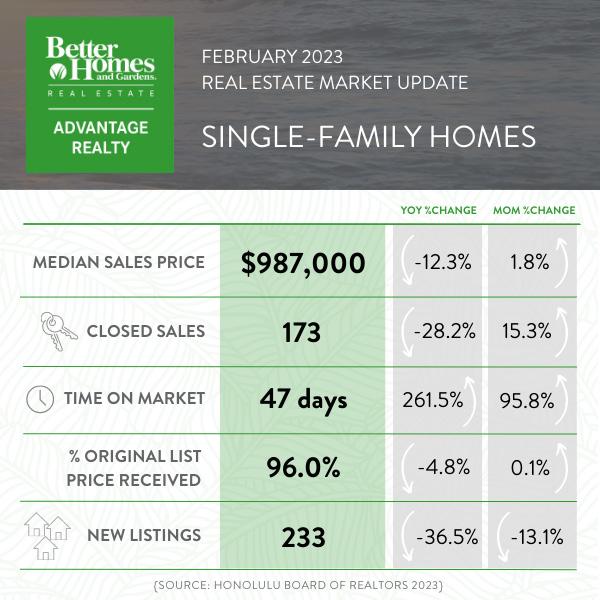
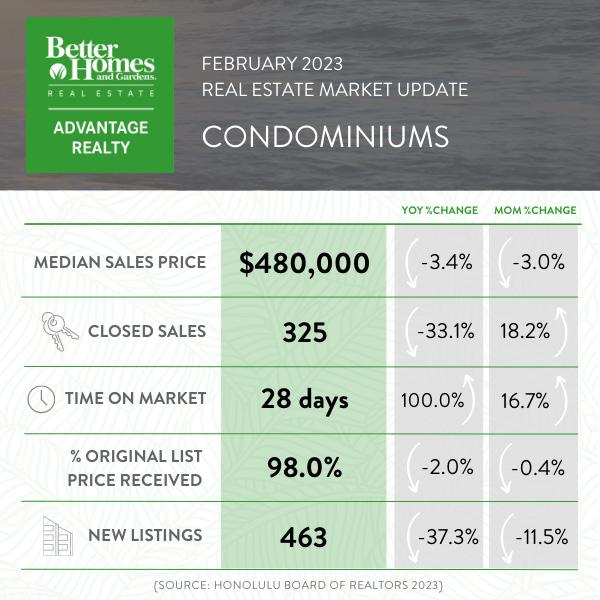
According to resales figures released by the Honolulu Board of REALTORS®, Oahu’s housing market remained sluggish in February, with closed sales of single-family homes and condos down 28.2% and 33.1%, respectively. However, single-family home sales rose 15.3%, and condo sales increased by 18.2% compared to January 2023.
Median sales prices in both markets declined, dipping 12.3% for single-family homes from $1,125,000 to $987,000 compared to 2022. The condo market experienced a modest 3.4% decline from $497,000 to $480,000. Roughly 189 O‘ahu properties sold for under $500,000 in February.
In February 2023, single-family homes nearly quadrupled the median days on market, skyrocketing to 47 days compared to 13 days in February 2022. The median days on market for condos doubled to 28 days compared to 14 days a year ago.
“Oahu’s housing market is in a very different place from a year ago, with activity calming across all facets,” says the President of the Honolulu Board of REALTORS®. “Notably, properties are spending significantly longer on the market before closing.”

The share of single-family homes sold above the original asking price fell dramatically from a year ago, accounting for just 19% of sales this
February, compared to 55% in February 2022. From another perspective, only 32% of single-family home sales received full asking price or more compared to 73% last February. In the condo market, the share of sales closing above the original list price shrank only 15% this February compared to 37% in February 2022. Of the sales this month, 36% received full asking price or more compared to 56% of sales last year.
“Average mortgage rates began to dip heading into February but started to tick higher throughout the month, weakening buyer purchasing power compared to one year ago,” the HBR President adds.

Though there were 233 new single-family home listings
and 463 new condo listings this past month, this was well below the number of listings brought to market in February 2022, down 36.5% for single-family homes and 37.3% for condos. Both markets added active inventory at various price points, though the most significant increase in the single-family home market was in the $999,999 and below price range, with twice as many properties up for sale compared to 2022. For condos, the most significant increase occurred in the $600,000 to $799,999 price range, with 50% more active condos than a year ago.
Most price points for single-family homes experienced fewer sales this February, with the largest drop in sales volume occurring in the $900,000 to $1,099,999 price range, down 47.4% year-over-year. The Ewa Plain region experienced the largest decline in sales volume, falling 40.4% year-over-year, followed by the Metro region, declining 55.2%.
Most price points for condos saw a decline in sales, with the most notable change occurring in the $800,000 to $1,999,999 price range, down 60% year-over-year, and in the $500,000 to $699,999 range, falling 42.7%. The Kailua region was the only area where condo sales were even with last year, with 10 condos sold. All other regions saw fewer sales compared to the same time last year, with the Ewa Plain falling 45.7% and the Metro region decreasing 30.1%.
{source: Honolulu Board of Realtors 2023}
OAHU
REAL BETTERHAWAII.COM | KAHALA MALL, UPPER LEVEL | 4211 WAIALAE AVENUE, BOX 9050 | HONOLULU, HI 96816 | (808) 738-3600 ©2022 Better Homes and Gardens Real Estate Advantage Realty. Better Homes and Gardens® is a registered trademark of Meredith Corporation licensed to Better Homes and Gardens Real Estate LLC. Equal Opportunity Company. Equal Housing Opportunity. An Independently Owned and Operated Franchise.
2022
2023
{ S O U R C E : H O N O L U L U B O A R D O F R E A L T O R S 2 0 2 1 }
BOARD
FEBRUARY
MONTHLY OAHU HOUSING STATISTICS
HONOLULU
OF REALTORS®

Page 1 of 34
Monthly Indicators
*seefootnotesonpages9-12regardingmethodologyupdatesYoY%chg=year-over-yearpercentchangecomparingcurrentmonthtothesamemonthlastyear. MoM%chg=month-over-monthpercentchangecomparingcurrentmonthtothepreviousmonth.
*seefootnotesonpages9-12regardingmethodologyupdates1-yr%chg=percentchangecomparingthecurrentYTDtimeperiodtothesameYTDtimeperiodoneyearago. 2-yr%chg=percentchangecomparingthecurrentYTDtimeperiodtothesameYTDtimeperiodtwoyearsago.
SOURCE: Honolulu Board of REALTORS®, residential resales compiled from MLS data. ©2023.HonoluluBoardofREALTORS®.AllRightsReserved.Informationhereindeemedreliablebutnotguaranteed.
February 2023 Feb-23 Feb-22YoY %chgJan-23MoM %chg Feb-23 Feb-22YoY %chgJan-23MoM %chg Closed Sales 173 241-28.2%15015.3% 325 486-33.1%27518.2% Median Sales Price $987,000 $1,125,000-12.3%$970,0001.8% $480,000 $497,000-3.4%$495,000-3.0% Average Sales Price $1,427,864 $1,486,088-3.9%$1,139,29425.3% $592,131 $583,3671.5%$633,441-6.5% Median Days on Market 47 13261.5%2495.8% 28 14100.0%2416.7% Percent of Orig. List Price Received 96.0% 100.8%-4.8%95.9%0.1% 98.0% 100.0%-2.0%98.4%-0.4% New Listings 233 367-36.5%268-13.1% 463 739-37.3%523-11.5% Pending Sales* 217 316-31.3%267-18.7% 399 643-37.9%3785.6% Active Inventory* 547 34857.2%551-0.7% 1,177 98919.0%1,196-1.6% Total Inventory in Escrow* 386 544-29.0%3762.7% 592 946-37.4%52313.2% Months Supply of Active Inventory* 2.0 0.9122.2%2.00.0% 2.4 1.650.0%2.40.0%
OAHU, HAWAII
Year-to-Date YTD-2023 YTD-20221-yr %chgYTD-20212-yr %chg YTD-2023 YTD-20221-yr %chgYTD-20212-yr %chg Closed Sales 323 567-43.0%551-41.4% 600 1,038-42.2%838-28.4% Median Sales Price $980,000 $1,084,250-9.6%$895,0009.5% $485,000 $500,000-3.0%$455,0006.6% Average Sales Price $1,293,853 $1,364,912-5.2%$1,106,81016.9% $609,016 $605,0090.7%$522,41216.6% Median Days on Market 35 12191.7%9288.9% 26 1485.7%1752.9% Percent of Orig. List Price Received 95.9% 101.2%-5.2%100.3%-4.4% 98.1% 100.0%-1.9%98.8%-0.7% New Listings 501 687-27.1%687-27.1% 986 1,405-29.8%1,282-23.1% Pending Sales* 484 631-23.3%694-30.3% 777 1,217-36.2%1,106-29.7%
Single-Family Homes Condos Single-Family Homes Condos
Page 2 of 34
Closed Sales
February 2023
OAHU, HAWAII
(Acountofpropertiesthathaveclosedinagivenmonth)
Mo-Yr Single-Family HomesCondosTotal
Feb-20247316563
Mar-20303410713
Apr-20248343591
May-20248254502
Jun-20302312614
Jul-20361426787
Aug-20370409779
Sep-20391456847
Oct-20345480825
Nov-20338407745
Dec-20420514934
Jan-21291392683
Feb-21260446706
Mar-21361626987
Apr-213756451,020
May-214055981,003
Dec-21378593971 Monthly Closed Sales Year-to-Date Closed Sales Jan-22326552878FebruarySFHYoY%chgCNDYoY%chgFebruaryYTDSFHYoY%chgYTDCNDYoY%chg Feb-2224148672720212605.3%44641.1%20215517.6%83820.6% Mar-223216729932022241-7.3%4869.0%20225672.9%1,03823.9% Apr-223656721,037 2023173-28.2%325-33.1% 2023323-43.0%600-42.2% May-223446881,032 Jun-22357626983 Jul-22312518830 Aug-22314508822 Sep-22278496774 Oct-22222435657 Nov-22192340532 Dec-22202360562 Jan-23150275425 Feb-23173 325 498
Jun-214517301,181 Jul-214046711,075 Aug-214256751,100 Sep-214246151,039 Oct-21381611992 Nov-21371601972
Sales 202120222023 Closed Sales SFH(YTD) 202120222023 Closed Sales CND(YTD) 202120222023 Closed Sales SFH(Feb) 202120222023 Closed Sales CND(Feb)
Page 3 of 34
SOURCE: Honolulu Board of REALTORS®, residential resales compiled from MLS data. ©2023.HonoluluBoardofREALTORS®.AllRightsReserved.Informationhereindeemedreliablebutnotguaranteed.
Median Sales Price
February 2023
OAHU, HAWAII
(Themediansalespriceofallclosedpropertiesinagivenmonth)
Mo/Yr Single-Family HomesCondos
Feb-20$765,000$430,000
Mar-20$810,000$435,000
Apr-20$809,000$450,000
May-20$797,000$399,000
Jun-20$770,000$421,500
Jul-20$815,000$440,000
Aug-20$839,000$430,000
Sep-20$880,000$445,000
Oct-20$865,000$439,500
Nov-20$872,500$420,000
Dec-20$870,000$455,000
Jan-21$883,000$452,000
Feb-21$917,500$457,500
Mar-21$950,000$451,000
Apr-21$928,000$450,000
May-21$978,000$457,750
Jun-21$979,000$460,000
Jul-21$992,500$475,000
Aug-21$1,050,000$500,000
Sep-21$1,050,000$478,000
Oct-21$1,000,000$500,000
Nov-21$1,050,000$500,000 Dec-21$1,050,000$485,000
SOURCE: Honolulu Board of REALTORS®, residential resales compiled from MLS data. ©2023.HonoluluBoardofREALTORS®.AllRightsReserved.Informationhereindeemedreliablebutnotguaranteed.
Monthly Median Sales Price Year-to-Date
Sales Price Jan-22$1,050,000$510,000FebruarySFHYoY%chgCNDYoY%chgFebruaryYTDSFHYoY%chgYTDCNDYoY%chg Feb-22$1,125,000$497,0002021$917,50019.9%$457,5006.4%2021$895,00016.6%$455,0005.9% Mar-22$1,150,000$515,5002022$1,125,00022.6%$497,0008.6%2022$1,084,25021.1%$500,0009.9% Apr-22$1,105,000$510,000 2023$987,000-12.3%$480,000-3.4% 2023$980,000-9.6%$485,000-3.0%
Median
May-22$1,153,500$516,500 Jun-22$1,100,000$534,000 Jul-22$1,107,944$500,000 Aug-22$1,125,500$498,500 Sep-22$1,100,000$502,500 Oct-22$1,050,000$520,000 Nov-22$1,149,500$480,000 Dec-22$1,049,500$502,500 Jan-23$970,000$495,000 Feb-23$987,000$480,000
Price ($) 202120222023 Price ($) SFH(YTD) 202120222023 Price ($) CND(YTD) 202120222023 Price ($) SFH(Feb) 202120222023 Price ($) CND(Feb)
Page 4 of 34
Average Sales Price
February 2023
OAHU, HAWAII
(Theaveragesalespriceofallclosedpropertiesinagivenmonth)
Mo/Yr Single-Family HomesCondos
Feb-20$974,283$527,836
Mar-20$972,367$528,606
Apr-20$941,708$521,484
May-20$1,003,419$453,220
Jun-20$899,271$481,220
Jul-20$1,016,491$475,346
Aug-20$1,022,449$527,573
Sep-20$1,073,692$545,367
Oct-20$1,065,594$479,736
Nov-20$1,084,834$472,726
Dec-20$1,113,076$504,222
Jan-21$1,050,263$496,296
Feb-21$1,172,804$545,629
Mar-21$1,226,827$530,257
Apr-21$1,194,150$520,192
May-21$1,246,611$555,798
Jun-21$1,225,011$557,302
Jul-21$1,265,382$544,064
Aug-21$1,316,681$618,612
Sep-21$1,289,510$558,002
Oct-21$1,335,171$582,509
Nov-21$1,296,551$559,007
Dec-21$1,303,481$604,749 Monthly Average Sales Price Year-to-Date Average Sales Price Jan-22$1,277,309$623,928FebruarySFHYoY%chgCNDYoY%chgFebruaryYTDSFHYoY%chgYTDCNDYoY%chg Feb-22$1,486,088$583,3672021$1,172,80420.4%$545,6293.4%2021$1,106,81018.4%$522,4121.0% Mar-22$1,570,668$623,6842022$1,486,08826.7%$583,3676.9%2022$1,364,91223.3%$605,00915.8% Apr-22$1,404,481$613,189 2023$1,427,864-3.9%$592,1311.5% 2023$1,293,853-5.2%$609,0160.7% May-22$1,450,008$625,327 Jun-22$1,382,559$631,822 Jul-22$1,329,023$590,934 Aug-22$1,341,958$547,319 Sep-22$1,307,249$607,502 Oct-22$1,243,960$676,988 Nov-22$1,387,685$594,444 Dec-22$1,325,156$576,689 Jan-23$1,139,294$633,441 Feb-23$1,427,864$592,131
Price ($) 202120222023 Price ($) SFH(YTD) 202120222023 Price ($) CND(YTD) 202120222023 Price ($) SFH(Feb) 202120222023 Price ($) CND(Feb)
Page 5 of 34
SOURCE: Honolulu Board of REALTORS®, residential resales compiled from MLS data. ©2023.HonoluluBoardofREALTORS®.AllRightsReserved.Informationhereindeemedreliablebutnotguaranteed.
Median Days on Market
February 2023
OAHU, HAWAII
(DaysonMarketrepresentsthenumberofdaysfromwhenapropertyisfirstlistedtowhenanofferisaccepted;theMedianDaysonMarketrepresentsthemedianofallsalesinagivenmonth)
Mo/Yr Single-Family HomesCondos
Feb-203534
Mar-201523
Apr-201927
May-201323
Jun-202040
Jul-201326
Aug-201523
SOURCE:
Jul-21911 Aug-21912 Sep-21911 Oct-211011 Nov-21119 Dec-211113 Monthly Median Days on Market Year-to-Date Median Days on Market Jan-221214FebruarySFHYoY%chgCNDYoY%chgFebruaryYTDSFHYoY%chgYTDCNDYoY%chg Feb-22131420219-74.3%18-47.1%20219-74.3%17-48.5% Mar-229920221344.4%14-22.2%20221233.3%14-17.6% Apr-221012 202347261.5%28100.0% 202335191.7%2685.7% May-221010 Jun-221011 Jul-221112 Aug-221313 Sep-221814 Oct-221919 Nov-221818 Dec-222521 Jan-232424 Feb-2347 28
Sep-20921 Oct-201018 Nov-201016 Dec-201019 Jan-21918 Feb-21918 Mar-21914 Apr-21913 May-21812 Jun-21811
Days on Market 202120222023 Days on Market SFH(YTD) 202120222023 Days on Market CND(YTD) 202120222023 Days on Market SFH(Feb) 202120222023 Days on Market CND(Feb)
Page 6 of 34
Honolulu Board of REALTORS®, residential resales compiled from MLS data. ©2023.HonoluluBoardofREALTORS®.AllRightsReserved.Informationhereindeemedreliablebutnotguaranteed.
Percent of Original List Price Received
February 2023
OAHU, HAWAII
(Thepercentagefoundwhendividingaproperty'ssalespricebytheoriginallistprice;reportedpercentageisthemedianofallsalesfortheperiodindicated)
Mo/Yr Single-Family HomesCondos
Feb-2098.3%97.3%
Mar-2098.7%98.1%
Apr-2098.9%98.1%
May-2099.0%97.8%
Jun-2098.7%97.7%
Jul-2098.8%97.9%
Aug-2098.7%98.3%
Sep-20100.0%98.6%
Oct-20100.0%98.3%
Nov-20100.0%99.0%
Dec-20100.0%98.5%
Jan-21100.7%98.8%
Feb-21100.0%98.8%
Mar-21100.4%99.1%
Apr-21101.9%99.6%
May-21101.4%100.0%
Jun-21104.2%100.0%
Jul-21103.9%100.0%
Aug-21103.0%100.0%
Monthly Percent of Original List Price Received Year-to-Date Percent of Original List Price Received
Dec-21102.1%100.0%
Jan-22101.6%100.0%FebruarySFHYoY%chgCNDYoY%chgFebruaryYTDSFHYoY%chgYTDCNDYoY%chg Feb-22100.8%100.0%2021100.0%1.7%98.8%1.5%2021100.3%2.5%98.8%1.3% Mar-22102.0%100.0%2022100.8%0.8%100.0%1.2%2022101.2%0.9%100.0%1.2% Apr-22102.6%100.0% 202396.0%-4.8%98.0%-2.0% 202395.9%-5.2%98.1%-1.9% May-22102.2%100.0% Jun-22102.0%100.0% Jul-22100.0%100.0% Aug-22100.0%100.0% Sep-2299.2%100.0% Oct-2299.8%99.0% Nov-2298.4%98.8% Dec-2296.7%98.5% Jan-2395.9%98.4% Feb-2396.0%98.0% Percent Received 202120222023 Percent Received SFH(YTD) 202120222023 Percent Received CND(YTD) 202120222023 Percent Received SFH(Feb) 202120222023 Percent Received CND(Feb)
Sep-21103.1%100.0% Oct-21102.2%100.0% Nov-21102.2%100.0%
Page 7 of 34
SOURCE: Honolulu Board of REALTORS®, residential resales compiled from MLS data. ©2023.HonoluluBoardofREALTORS®.AllRightsReserved.Informationhereindeemedreliablebutnotguaranteed.
New Listings
February 2023
OAHU, HAWAII
(Acountofpropertiesthathavebeennewlylistedonthemarketinagivenmonth)
Mo-Yr Single-Family HomesCondosTotal
Feb-203996391,038
Mar-203906101,000
Apr-20290440730
May-20345509854
Jun-20392598990
Jul-204226571,079
Aug-203876961,083
Sep-20368576944
Oct-203806641,044
Nov-20379561940
Dec-20264466730
Jan-213656591,024
Feb-21322623945
Mar-214397151,154
Apr-214597061,165
May-214306831,113
Jun-214827841,266
Jul-214696641,133
Aug-214607211,181
Sep-214127381,150
Oct-213767171,093
Nov-21358639997
Dec-21245527772
Monthly
Year-to-Date
Jan-22320666986FebruarySFHYoY%chgCNDYoY%chgFebruaryYTDSFHYoY%chgYTDCNDYoY%chg Feb-223677391,1062021322-19.3%623-2.5%2021687-16.9%1,282-4.0% Mar-224127141,126202236714.0%73918.6%20226870.0%1,4059.6% Apr-224247221,146 2023233-36.5%463-37.3% 2023501-27.1%986-29.8% May-224456871,132 Jun-223916861,077
New Listings
New Listings
Jul-223866161,002 Aug-22381608989
Jan-23268523791 Feb-23233 463 696
Sep-22304601905 Oct-22285532817 Nov-22289526815 Dec-22164371535
Listings 202120222023 Closed Sales SFH(YTD) 202120222023 Closed Sales CND(YTD) 202120222023 New Listings SFH(Feb) 202120222023 Closed Sales CND(Feb)
Page 8 of 34
SOURCE: Honolulu Board of REALTORS®, residential resales compiled from MLS data. ©2023.HonoluluBoardofREALTORS®.AllRightsReserved.Informationhereindeemedreliablebutnotguaranteed.
Pending Sales*
February 2023
OAHU, HAWAII
(Ameasureofcontractactivityrepresentedbyacountofpropertiesthathavehadoffersacceptedonthemduringagivenmonth)
Mo/Yr Single-Family HomesCondosTotal
Feb-20357449806
Mar-20316379695
Apr-20274234508
May-20337329666
Jun-20423454877
Jul-20422483905
Aug-20410493903
Sep-20389451840
Oct-20358484842
Nov-20394470864
Dec-20315438753
Jan-21329534863
Feb-21365572937
Mar-213706561,026
Apr-214507271,177
May-214316991,130
Jun-214226661,088
Jul-214336581,091
Aug-214156171,032
Sep-213986291,027
Oct-214006301,030
Nov-21367573940
Dec-21287511798
Jun-22305501806
Jul-22297484781
Aug-22312475787
Sep-22224436660
Oct-22198342540
Nov-22198359557
Dec-22168289457
Jan-23267378645
Feb-23217 399 616
*Methodologyupdatedasof2021toreflectacountofpropertiesthatenteredcontractwithinthegivenmonthandremaininescrowstatusattheendofthemonth(alsoappliedtohistoricaldatashownabove). PendingSales,inreportspriorto2021,reflectacountofalllistingsthatheldaPending(P)statusthroughoutthegivenmo nth.
SOURCE: Honolulu Board of REALTORS®, residential resales compiled from MLS data. ©2023.HonoluluBoardofREALTORS®.AllRightsReserved.Informationhereindeemedreliablebutnotguaranteed.
Monthly
Sales Year-to-Date
Feb-2231664395920213652.2%57227.4%20216941.3%1,10629.5% Mar-223846911,0752022316-13.4%64312.4%2022631-9.1%1,21710.0% Apr-223666631,029 2023217-31.3%399-37.9% 2023484-23.3%777-36.2%
Pending
Pending Sales Jan-22315574889FebruarySFHYoY%chgCNDYoY%chgFebruaryYTDSFHYoY%chgYTDCNDYoY%chg
May-22356601957
Listings 202120222023 Pending Sales SFH(YTD) 202120222023 Pending Sales CND(YTD) 202120222023 Pending Sales SFH(Feb) 202120222023 Pending Sales CND(Feb)
Page 9 of 34
Active Inventory*
February 2023
OAHU, HAWAII
(ThenumberofpropertiesinActive(A)statusattheendofthegivenmonth)
Mo/Yr Single-Family HomesCondosTotal
Feb-208141,7842,598
Mar-208251,8452,670
Apr-208041,8602,664
May-207971,8582,655
Jun-206831,8152,498
Jul-206421,8132,455
Aug-205651,7922,357
Sep-205291,7422,271
Oct-205211,7152,236
Nov-205031,6452,148
Dec-204191,4591,878
Jan-214171,3961,813
Feb-213501,3321,682
Mar-213791,2571,636
Apr-213811,1331,514
May-213379831,320
Jun-213771,0251,402
Jul-214159691,384
Aug-214169501,366
Jan-223119671,278
Feb-223489891,337
Mar-223609191,279
Apr-223959171,312
May-224719391,410
Jun-225279981,525
Jul-225761,0501,626
Aug-225961,0731,669
Sep-226291,1411,770
Oct-226561,1941,850
Nov-226821,2441,926
Dec-225971,1701,767
Jan-235511,1961,747
Feb-23547 1,1771,724
*Indicatormodifiedasof2021toreflectActivestatuslistingsonlyandappliedtohistoricalmonthlydatashownabove.Previousreportindicator,referredtoasActiveListings,reflectedallactivelymarketedlistingsinAandCstatus.
SOURCE: Honolulu Board of REALTORS®, residential resales compiled from MLS data. ©2023.HonoluluBoardofREALTORS®.AllRightsReserved.Informationhereindeemedreliablebutnotguaranteed.
Active Inventory
Sep-214371,0301,467FebruarySFHYoY%chgCNDYoY%chg Oct-214011,0391,4402021350-57.0%1,332-25.3% Nov-213661,0331,3992022348-0.6%989-25.8% Dec-213099461,255 202354757.2%1,17719.0%
Total Active Inventory: Single-Family Homes + Condos
Listings
Listings
Listings
Active202120222023
SFH(Feb) Active202120222023
CND(Feb)
Page 10 of 34
Total Inventory In Escrow*
February 2023
OAHU, HAWAII
(Thenumberofpropertiesundercontractattheendofthegivenmonth/combinedlistingsinCandPstatus)
Mo/Yr Single-Family HomesCondosTotal
Feb-206087101,318
Mar-205696001,169
Apr-20543455998
May-206255251,150
Jun-207036821,385
Jul-207427141,456
Aug-207487971,545
Sep-207027691,471
Oct-206937571,450
Nov-207118001,511
Dec-205757031,278
Jan-215968371,433
Feb-216979601,657
Mar-216919791,670
Apr-217391,0301,769
May-217931,1571,950
Jun-217541,0681,822
Jul-217351,0261,761
Aug-217279791,706
Total Inventory In Escrow
Total Inventory In Escrow: Single-Family Homes + Condos
Feb-225449461,490
Mar-226039801,583
Apr-225929561,548
May-225838561,439
Jun-225097281,237
Jul-224796761,155
Aug-224626541,116
Sep-22388590978
Oct-22345506851
Nov-22319512831
Dec-22278430708
Jan-23376523899
Feb-23386 592 978
*Newindicatoraddedtoreportsasof2021,includingapplicablehistoricaldata.
SOURCE:
Oct-216639351,598202169714.6%96035.2% Nov-216378991,5362022544-22.0%946-1.5% Dec-215287841,312 2023386-29.0%592-37.4% Jan-224987971,295
Sep-216609511,611FebruarySFHYoY%chgCNDYoY%chg
Listings 202120222023 Listings SFH(Feb) 202120222023 Listings CND(Feb)
Page 11 of 34
Honolulu Board of REALTORS®, residential resales compiled from MLS data. ©2023.HonoluluBoardofREALTORS®.AllRightsReserved.Informationhereindeemedreliablebutnotguaranteed.
Months Supply of Active Inventory*
February 2023
OAHU, HAWAII
(Comparesactiveinventorytoarolling12-monthaverageclosedsales)
Mo/Yr Single-Family HomesCondos
Feb-202.63.9
Mar-202.64.1
Apr-202.64.2
May-202.64.5
Jun-202.24.5
Jul-202.14.6
Aug-201.84.6
Sep-201.74.5 Oct-201.74.4
Nov-201.64.3
Dec-201.33.7
Jan-211.33.6
Aug-211.11.7 Months Supply of Active Inventory Active Inventory vs. Closed Sales Sep-211.21.8FebruarySFHYoY%chgCNDYoY%chg
Months202120222023 of Inventory
Jul-221.61.7
Aug-221.71.8
Sep-221.92.0
Oct-222.12.1
Nov-222.22.3
Dec-222.12.2
Jan-232.02.4
Feb-232.0 2.4
Months202120222023 of Inventory
*Methodologyupdatedasof2021(alsoappliedtohistoricaldatashownonthischart). MonthsofInventory,inreportspriorto2021,reflectacomparisonofactivelistingstoaveragependingsales.
SOURCE: Honolulu Board of REALTORS®, residential resales compiled from MLS data. ©2023.HonoluluBoardofREALTORS®.AllRightsReserved.Informationhereindeemedreliablebutnotguaranteed.
Feb-211.13.3 Mar-211.23.0 Apr-211.12.5 May-211.02.1 Jun-211.02.0 Jul-211.11.8
Oct-211.11.820211.1-57.7%3.3-15.4% Nov-211.01.720220.9-18.2%1.6-51.5% Dec-210.81.6 20232.0122.2%2.450.0% Jan-220.81.6 Feb-220.91.6 Mar-221.01.5 Apr-221.11.5
May-221.31.5 Jun-221.51.6
Months of Inventory
SFH(Feb)
CND(Feb)
Page 12 of 34
Housing Supply Overview
February 2023
OAHU, HAWAII
(Ayear-over-yearoverviewoftheavailabilityandsalesofpropertiesinagivenmonth,bypricerange)
SOURCE: Honolulu Board of REALTORS®, residential resales compiled from MLS data. ©2023.HonoluluBoardofREALTORS®.AllRightsReserved.Informationhereindeemedreliablebutnotguaranteed.
Single-Family HomesFeb-23Feb-22%chgFeb-23Feb-22%chgFeb-23Feb-22%chgFeb-23Feb-22%chgFeb-23Feb-22%chgFeb-23Feb-22%chgFeb-23Feb-22 %chgFeb-23Feb-22%chg $449,999 and below 30-34--102.6%--02-100.0%10-3250.0%67-14.3%1.50.5200.0% $450,000 - $599,999 67-14.3%7713492.3%91.9%100.0%-8.1%10911.1%17-85.7%219133.3%721-66.7%3.50.8337.5% $600,000 - $699,999 9812.5%5910490.0%97.1%100.0%-2.9%11837.5%12933.3%248200.0%221822.2%2.70.4575.0% $700,000 - $799,999 211540.0%759733.3%91.3%102.3%-10.8%1539-61.5%1828-35.7%383218.8%2946-37.0%1.80.8125.0% $800,000 - $899,999 28280.0%14137.7%98.9%103.7%-4.6%2541-39.0%2740-32.5%6619247.4%5266-21.2%1.90.3533.3% $900,000 - $999,999 2136-41.7%6014328.6%98.4%101.0%-2.6%3450-32.0%3353-37.7%493063.3%5983-28.9%1.30.6116.7% $1,000,000 - $1,499,999 4384-48.8%5212333.3%96.5%100.7%-4.2%64132-51.5%7598-23.5%1319735.1%122162-24.7%1.30.862.5% $1,500,000 - 1,999,999 1335-62.9%1113-15.4%97.5%100.0%-2.5%3442-19.0%2241-46.3%734273.8%4067-40.3%2.31.1109.1% $2,000,000 - $2,999,999 171241.7%5610460.0%91.1%105.2%-13.4%2530-16.7%1522-31.8%574235.7%2637-29.7%3.21.788.2% $3,000,000 and above 1216-25.0%353112.9%91.5%100.0%-8.5%15147.1%1318-27.8%856726.9%2337-37.8%6.54.544.4% All Single-Family Homes173241-28.2%4713261.5%96.0%100.8%-4.8%233367-36.5%217316-31.3%54734857.2%386544-29.0%2.00.9122.2% Condos Feb-23Feb-22%chgFeb-23Feb-22%chgFeb-23Feb-22%chgFeb-23Feb-22%chgFeb-23Feb-22%chgFeb-23Feb-22%chgFeb-23Feb-22%chgFeb-23Feb-22%chg $149,999 and below 1021-52.4%21210.0%95.2%97.1%-2.0%20195.3%1617-5.9%413517.1%2633-21.2%2.91.681.3% $150,000 - $299,999 4169-40.6%282040.0%97.5%98.9%-1.4%5198-48.0%4269-39.1%144169-14.8%61107-43.0%2.41.833.3% $300,000 - $399,999 6673-9.6%321968.4%98.0%100.0%-2.0%67110-39.1%65116-44.0%1231211.7%92164-43.9%1.61.233.3% $400,000 - $499,999 6782-18.3%271850.0%99.0%100.0%-1.0%87127-31.5%65116-44.0%15912230.3%95173-45.1%1.81.163.6% $500,000 - $599,999 3859-35.6%357400.0%97.4%100.0%-2.6%64102-37.3%60102-41.2%1079413.8%90140-35.7%1.41.040.0% $600,000 - $699,999 2958-50.0%3110210.0%98.4%101.5%-3.1%4382-47.6%4869-30.4%1228937.1%7194-24.5%2.31.376.9% $700,000 - $999,999 4879-39.2%231291.7%98.4%100.7%-2.3%81123-34.1%6397-35.1%21514746.3%97143-32.2%2.51.747.1% $1,000,000 - $1,499,999 1430-53.3%604825.0%95.9%97.2%-1.3%2539-35.9%1830-40.0%1078525.9%3351-35.3%4.52.955.2% $1,500,000 - $1,999,999 58-37.5%543650.0%91.8%98.9%-7.2%1321-38.1%1415-6.7%725238.5%1722-22.7%9.06.538.5% $2,000,000 and above 770.0%5261-14.8%100.0%93.6%6.8%1218-33.3%812-33.3%877516.0%1019-47.4%9.78.316.9% All Condos 325486-33.1%2814100.0%98.0%100.0%-2.0%463739-37.3%399643-37.9%1,17798919.0%592946-37.4%2.41.650.0% Active Inventory Active Inventory Closed SalesMedian Days on Market Percent of Original List Price ReceivedPending Sales Closed SalesMedian Days on Market Percent of Original List Price ReceivedPending Sales New Listings New Listings In Escrow Months Supply of Active Inventory Total Inventory In Escrow Months Supply of Active Inventory Total Inventory
Page 13 of 34
Closed Sales by Price Range: Single-Family Homes
February 2023
OAHU, HAWAII
(Acountofpropertiesthathaveclosedinagivenmonth) Single-Family


$449,999andbelow30-2851-45.1%
$450,000-$599,99967-14.3%69138-50.0%
$600,000-$699,9999812.5%104256-59.4%
$700,000-$799,999211540.0%247486-49.2%
$800,000-$899,99928280.0%412656-37.2%
$900,000-$999,9992136-41.7%448610-26.6% $1,000,000-$1,499,9994384-
$2,000,000-$2,999,999171241.7%215295-27.1%
$3,000,000andabove1216-25.0%150184-18.5%
All Single-Family Homes 173241-28.2%3,2304,542-28.9% This12-monthperiodreflectstheconsecutive12-monthperiodupthroughthecurrentmonth,whilelastperiod reflectsthesame12-monthperiodoneyearprior.
SOURCE: Honolulu Board of REALTORS®, residential resales compiled from MLS data. ©2023.HonoluluBoardofREALTORS®.AllRightsReserved.Informationhereindeemedreliablebutnotguaranteed.
HomesFeb-23Feb-22%chg 12-mth Total This Period 12-mth Total Last Period %chg
48.8%1,1701,381-15.3%
$1,500,000-1,999,9991335-62.9%387485-20.2%
Page 14 of 34
Closed Sales by Price Range: Condos
February 2023
OAHU, HAWAII
(Acountofpropertiesthathaveclosedinagivenmonth)
$149,999andbelow1021-52.4%168260-35.4%
$150,000-$299,9994169-40.6%7201,129-36.2%
$300,000-$399,9996673-9.6%9481,183-19.9%
$400,000-$499,9996782-18.3%1,0301,324-22.2%
$500,000-$599,9993859-35.6%8821,076-18.0%
$600,000-$699,9992958-50.0%640843-24.1%
$700,000-$999,9994879-39.2%1,0241,038-1.3%
$1,000,000-$1,499,9991430-53.3%292344-15.1%
$1,500,000-$1,999,99958-37.5%101938.6%
$2,000,000andabove770.0%110113-2.7%
All Condos 325486-33.1%5,9157,403-20.1% This12-monthperiodreflectstheconsecutive12-monthperiodupthroughthecurrentmonth,whilelastperiod reflectsthesame12-monthperiodoneyearprior.
SOURCE: Honolulu Board of REALTORS®, residential resales compiled from MLS data. ©2023.HonoluluBoardofREALTORS®.AllRightsReserved.Informationhereindeemedreliablebutnotguaranteed.
Condos Feb-23Feb-22%chg 12-mth Total This Period 12-mth Total Last Period %chg
Page 15 of 34
Median Days on Market by Price Range: Single-Family Homes
February 2023
OAHU, HAWAII
(Themediannumberofdaysfromwhenapropertyisfirstlistedtowhenanofferisaccepted)
$449,999andbelow34--1015-33.3%
$450,000-$599,9997713492.3%16977.8%
$600,000-$699,9995910490.0%181080.0%
$700,000-$799,999759733.3%189100.0%
$800,000-$899,99914137.7%12933.3%
$900,000-$999,9996014328.6%11922.2%
$1,000,000-$1,499,9995212333.3%111010.0%
$1,500,000-1,999,9991113-15.4%121020.0%
$2,000,000-$2,999,9995610460.0%13128.3%
$3,000,000andabove353112.9%2833-15.2%
All Single-Family Homes 4713261.5%121020.0%
This12-monthperiodreflectstheconsecutive12-monthperiodupthroughthecurrentmonth,whilelastperiod reflectsthesame12-monthperiodoneyearprior.
SOURCE: Honolulu Board of REALTORS®, residential resales compiled from MLS data. ©2023.HonoluluBoardofREALTORS®.AllRightsReserved.Informationhereindeemedreliablebutnotguaranteed.
12-mth Median This Period 12-mth Median Last Period %chg
Single-Family HomesFeb-23Feb-22%chg
Page 16 of 34
Median Days on Market by Price Range: Condos
February 2023
OAHU, HAWAII
(Themediannumberofdaysfromwhenapropertyisfirstlistedtowhenanofferisaccepted) Condos
$149,999andbelow21210.0%2735-22.9%
$150,000-$299,999282040.0%1824-25.0%
$300,000-$399,999321968.4%1314-7.1%
$400,000-$499,999271850.0%121020.0%
$500,000-$599,999357400.0%11922.2%
$600,000-$699,9993110210.0%12933.3%
$700,000-$999,999231291.7%111010.0%
$1,000,000-$1,499,999604825.0%21205.0%
$1,500,000-$1,999,999543650.0%3237-13.5%
$2,000,000andabove5261-14.8%3846-17.4%
All Condos 2814100.0%131118.2%
This12-monthperiodreflectstheconsecutive12-monthperiodupthroughthecurrentmonth,whilelastperiod reflectsthesame12-monthperiodoneyearprior.
SOURCE: Honolulu Board of REALTORS®, residential resales compiled from MLS data. ©2023.HonoluluBoardofREALTORS®.AllRightsReserved.Informationhereindeemedreliablebutnotguaranteed.

Feb-23Feb-22%chg 12-mth Median This Period 12-mth Median Last Period %chg
Page 17 of 34
Median
Percent of
February 2023
OAHU, HAWAII
Original List Price
Received by Price Range: Single-Family Homes
(Thepercentagefoundwhendividingaproperty'ssalespricebytheoriginallistprice;reportedpercentageisthemedianofallsalesfortheperiodandpricerangeindicated)
SOURCE: Honolulu Board of REALTORS®, residential resales compiled from MLS data. ©2023.HonoluluBoardofREALTORS®.AllRightsReserved.Informationhereindeemedreliablebutnotguaranteed.
Single-Family HomesFeb-23Feb-22%chg 12-mth Median This Period 12-mth Median Last Period %chg $449,999andbelow102.6%--100.0%100.0%0.0% $450,000-$599,99991.9%100.0%-8.1%97.4%100.9%-3.5% $600,000-$699,99997.1%100.0%-2.9%100.0%101.0%-1.0% $700,000-$799,99991.3%102.3%-10.8%100.0%103.0%-2.9% $800,000-$899,99998.9%103.7%-4.6%100.0%103.5%-3.4% $900,000-$999,99998.4%101.0%-2.6%100.2%102.9%-2.6% $1,000,000-$1,499,99996.5%100.7%-4.2%100.0%103.0%-2.9% $1,500,000-1,999,99997.5%100.0%-2.5%100.1%101.7%-1.6% $2,000,000-$2,999,99991.1%105.2%-13.4%100.0%100.0%0.0% $3,000,000andabove91.5%100.0%-8.5%97.3%97.0%0.3% All Single-Family Homes
96.0%100.8%-4.8%100.0%102.2%-2.2% This12-monthperiodreflectstheconsecutive12-monthperiodupthroughthecurrentmonth,whilelastperiod reflectsthesame12-monthperiodoneyearprior.
Page 18 of 34
Median Percent of Original List Price Received by Price Range: Condos
February 2023
OAHU, HAWAII
(Thepercentagefoundwhendividingaproperty'ssalespricebytheoriginallistprice;reportedpercentageisthemedianofallsalesfortheperiodandpricerangeindicated)

All Condos 98.0%100.0%-2.0%100.0%100.0%0.0% This12-monthperiodreflectstheconsecutive12-monthperiodupthroughthecurrentmonth,whilelastperiod reflectsthesame12-monthperiodoneyearprior.
SOURCE: Honolulu Board of REALTORS®, residential resales compiled from MLS data. ©2023.HonoluluBoardofREALTORS®.AllRightsReserved.Informationhereindeemedreliablebutnotguaranteed.
Condos Feb-23Feb-22%chg 12-mth Median This Period 12-mth Median Last Period %chg $149,999andbelow95.2%97.1%-2.0%96.1%95.7%0.4% $150,000-$299,99997.5%98.9%-1.4%98.7%98.0%0.7% $300,000-$399,99998.0%100.0%-2.0%100.0%99.2%0.8% $400,000-$499,99999.0%100.0%-1.0%100.0%100.0%0.0% $500,000-$599,99997.4%100.0%-2.6%100.0%100.0%0.0% $600,000-$699,99998.4%101.5%-3.1%100.0%101.2%-1.2% $700,000-$999,99998.4%100.7%-2.3%100.0%100.0%0.0%
$1,000,000-$1,499,99995.9%97.2%-1.3%97.6%98.2%-0.6% $1,500,000-$1,999,99991.8%98.9%-7.2%97.0%96.1%0.9% $2,000,000andabove100.0%93.6%6.8%95.7%96.0%-0.3%
Page 19 of 34
New Listings by Price Range: Single-Family Homes
February 2023
OAHU, HAWAII
(Acountofpropertiesthathavebeennewlylistedonthemarketinagivenmonth)
$449,999andbelow02-100.0%2750-46.0%
$450,000-$599,99910911.1%77161-52.2%
$600,000-$699,99911837.5%163305-46.6%
$700,000-$799,9991539-61.5%298557-46.5%
$800,000-$899,9992541-39.0%506691-26.8%
$900,000-$999,9993450-32.0%566667-15.1%
$1,000,000-$1,499,99964132-51.5%1,2501,306-4.3%
$1,500,000-1,999,9993442-19.0%5095001.8%
$2,000,000-$2,999,9992530-16.7%308310-0.6%
$3,000,000andabove15147.1%2782703.0%
All Single-Family Homes233367-36.5%3,9824,817-17.3%
This12-monthperiodreflectstheconsecutive12-monthperiodupthroughthecurrentmonth,whilelastperiod reflectsthesame12-monthperiodoneyearprior.
SOURCE: Honolulu Board of REALTORS®, residential resales compiled from MLS data. ©2023.HonoluluBoardofREALTORS®.AllRightsReserved.Informationhereindeemedreliablebutnotguaranteed.
12-mth Total This Period 12-mth Total Last Period %chg
Single-Family HomesFeb-23Feb-22%chg
Page 20 of 34
New Listings by Price Range: Condos February 2023
OAHU, HAWAII
(Acountofpropertiesthathavebeennewlylistedonthemarketinagivenmonth)
$149,999andbelow20195.3%186248-25.0%
$150,000-$299,9995198-48.0%8521,173-27.4%
$300,000-$399,99967110-39.1%1,0671,370-22.1%
$400,000-$499,99987127-31.5%1,1531,467-21.4%
$500,000-$599,99964102-37.3%9591,176-18.5%
$600,000-$699,9994382-47.6%776935-17.0%
$700,000-$999,99981123-34.1%1,2651,13611.4%
$1,000,000-$1,499,9992539-35.9%413421-1.9%
$1,500,000-$1,999,9991321-38.1%19016813.1%
$2,000,000andabove1218-33.3%188205-8.3%
All Condos 463739-37.3%7,0498,299-15.1% This12-monthperiodreflectstheconsecutive12-monthperiodupthroughthecurrentmonth,whilelastperiod reflectsthesame12-monthperiodoneyearprior.
SOURCE: Honolulu Board of REALTORS®, residential resales compiled from MLS data. ©2023.HonoluluBoardofREALTORS®.AllRightsReserved.Informationhereindeemedreliablebutnotguaranteed.
Condos Feb-23Feb-22%chg 12-mth Total This Period 12-mth Total Last Period %chg
Page 21 of 34
Pending Sales by Price Range: Single-Family Homes
February 2023
OAHU, HAWAII
(Ameasureofcontractactivity/acountofpropertiesthathavehadoffersacceptedontheminagivenmonth)

$449,999andbelow10-3356-41.1%
$450,000-$599,99917-85.7%72172-58.1%
$600,000-$699,99912933.3%156334-53.3%
$700,000-$799,9991828-35.7%287532-46.1%
$800,000-$899,9992740-32.5%456692-34.1%
$900,000-$999,9993353-37.7%484676-28.4%
$2,000,000-$2,999,9991522-31.8%208254-18.1%
$3,000,000andabove1318-27.8%134185-27.6%
All Single-Family Homes 217316-31.3%3,2924,604-28.5%
This12-monthperiodreflectstheconsecutive12-monthperiodupthroughthecurrentmonth,whilelastperiod reflectsthesame12-monthperiodoneyearprior.
SOURCE: Honolulu Board of REALTORS®, residential resales compiled from MLS data. ©2023.HonoluluBoardofREALTORS®.AllRightsReserved.Informationhereindeemedreliablebutnotguaranteed.
Single-Family HomesFeb-23Feb-22%chg 12-mth Total This Period 12-mth Total Last Period %chg
23.5%1,1151,241-10.2% $1,500,000-1,999,9992241-46.3%347462-24.9%
$1,000,000-$1,499,9997598-
Page 22 of 34
Pending Sales by Price Range: Condos
February 2023
OAHU, HAWAII
(Ameasureofcontractactivity/acountofpropertiesthathavehadoffersacceptedontheminagivenmonth)

$300,000-$399,99965116-44.0%9521,320-27.9%
$400,000-$499,99965116-44.0%9851,418-30.5%
$500,000-$599,99960102-41.2%7931,091-27.3%
$600,000-$699,9994869-30.4%649869-25.3%
$700,000-$999,9996397-35.1%912958-4.8%
$1,000,000-$1,499,9991830-40.0%259329-21.3%
$1,500,000-$1,999,9991415-6.7%99112-11.6%
$2,000,000andabove812-33.3%97126-23.0%
All Condos 399643-37.9%5,6187,583-25.9% This12-monthperiodreflectstheconsecutive12-monthperiodupthroughthecurrentmonth,whilelastperiod reflectsthesame12-monthperiodoneyearprior.
SOURCE: Honolulu Board of REALTORS®, residential resales compiled from MLS data. ©2023.HonoluluBoardofREALTORS®.AllRightsReserved.Informationhereindeemedreliablebutnotguaranteed.
Condos Feb-23Feb-22%chg 12-mth Total This Period 12-mth Total Last Period %chg
$149,999andbelow1617-5.9%171258-33.7%
$150,000-$299,9994269-39.1%7011,102-36.4%
Page 23 of 34
Active Inventory* by Price Range: Single-Family Homes
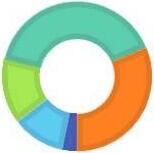
February 2023
OAHU, HAWAII
(Thenumberofpropertiesactiveonmarketattheendofagivenmonth)
Single-Family HomesFeb-23Feb-22YOY chg
$449,999andbelow3250.0%
$450,000-$599,999219133.3%
$600,000-$699,999248200.0%
$700,000-$799,999383218.8%
$800,000-$899,9996619247.4%
$900,000-$999,999493063.3%
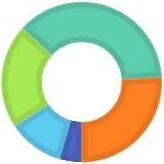
Active Inventory - Percent Share by Price Range (portionoftotalactivestatuslistingsrepresentedbyagivenpricerange)
$1,000,000-$1,499,9991319735.1%
$1,500,000-1,999,999734273.8%
$2,000,000-$2,999,999574235.7%
$3,000,000andabove856726.9%
All Single-Family Homes 54734857.2%
*Indicatormodifiedasof2021toreflectActivestatuslistingsonlyandappliedtohistoricalmonthlydatashownabove.Previousreportindicator,referredtoasActiveListings,reflectedallactivelymarketedlistingsinAandCstatus.
SOURCE: Honolulu Board of REALTORS®, residential resales compiled from MLS data. ©2023.HonoluluBoardofREALTORS®.AllRightsReserved.Informationhereindeemedreliablebutnotguaranteed.
Page 24 of 34
Active Inventory* by Price Range: Condos
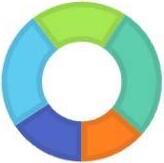
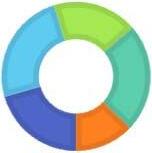
February 2023
OAHU, HAWAII
(Thenumberofpropertiesactiveonmarketattheendofagivenmonth)
Condos Feb-23Feb-22YOY chg
$149,999andbelow413517.1%
$150,000-$299,999144169-14.8%
$300,000-$399,9991231211.7%
$400,000-$499,99915912230.3%
$500,000-$599,9991079413.8%
$600,000-$699,9991228937.1%
Active Inventory - Percent Share by Price Range (portionoftotalactivestatuslistingsrepresentedbyagivenpricerange)
$700,000-$999,99921514746.3%
$1,000,000-$1,499,9991078525.9%
$1,500,000-$1,999,999725238.5%
$2,000,000andabove877516.0%
All Condos 1,17798919.0%
*Indicatormodifiedasof2021toreflectActivestatuslistingsonlyandappliedtohistoricalmonthlydatashownabove.Previousreportindicator,referredtoasActiveListings,reflectedallactivelymarketedlistingsinAandCstatus.
SOURCE: Honolulu Board of REALTORS®, residential resales compiled from MLS data. ©2023.HonoluluBoardofREALTORS®.AllRightsReserved.Informationhereindeemedreliablebutnotguaranteed.
Page 25 of 34
Listings Lisings


Condos
*Indicatormodifiedasof2021toreflectActivestatuslistingsonlyandappliedtohistoricalmonthlydatashownabove.Previousreportindicator,referredtoasActiveListings,reflectedallactivelymarketedlistingsinAandCstatus.
SOURCE: Honolulu Board of REALTORS®, residential resales compiled from MLS data. ©2023.HonoluluBoardofREALTORS®.AllRightsReserved.Informationhereindeemedreliablebutnotguaranteed.
Single-Family Homes 350379381337377415416437401366309311348360395471527576596629656682597551547
Active Inventory*: Single-Family Homes and Condos February 2023 OAHU, HAWAII
Page 26 of 34
Total Inventory In Escrow* by Price Range: Single-Family Homes February 2023
OAHU, HAWAII
(Thenumberofpropertiesinanescrowstatusattheendofagivenmonth)
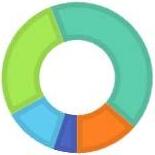
Single-Family HomesFeb-23Feb-22YOY chg
$449,999andbelow67-14.3%
$450,000-$599,999721-66.7%
$600,000-$699,999221822.2%
$700,000-$799,9992946-37.0%
$800,000-$899,9995266-21.2%
$900,000-$999,9995983-28.9%
Total Inventory In Escrow - Percent Share by Price Range
(portionoftotalinventoryinescrowrepresentedbyagivenprice range)
$1,000,000-$1,499,999122162-24.7%
$1,500,000-1,999,9994067-40.3%
$2,000,000-$2,999,9992637-29.7%
$3,000,000andabove2337-37.8%
All Single-Family Homes 386544-29.0%
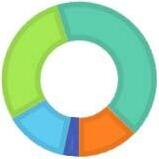
*Newindicatoraddedtoreportsasof2021,includingapplicablehistoricaldata.
SOURCE: Honolulu Board of REALTORS®, residential resales compiled from MLS data. ©2023.HonoluluBoardofREALTORS®.AllRightsReserved.Informationhereindeemedreliablebutnotguaranteed.
Page 27 of 34
Total Inventory In Escrow* by Price Range: Condos
February 2023
OAHU, HAWAII
(Thenumberofpropertiesinanescrowstatusattheendofagivenmonth)
Condos Feb-23Feb-22YOY chg
$149,999andbelow2633-21.2%
$150,000-$299,99961107-43.0%
$300,000-$399,99992164-43.9%
$400,000-$499,99995173-45.1%
$500,000-$599,99990140-35.7%
$600,000-$699,9997194-24.5%
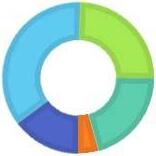
Total Inventory In Escrow - Percent Share by Price Range
(portionoftotalinventoryinescrowrepresentedbyagivenprice range)
$700,000-$999,99997143-32.2%
$1,000,000-$1,499,9993351-35.3%
$1,500,000-$1,999,9991722-22.7%
$2,000,000andabove1019-47.4%
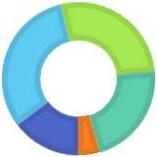
All Condos 592946-37.4%
*Newindicatoraddedtoreportsasof2021,includingapplicablehistoricaldata.
SOURCE: Honolulu Board of REALTORS®, residential resales compiled from MLS data. ©2023.HonoluluBoardofREALTORS®.AllRightsReserved.Informationhereindeemedreliablebutnotguaranteed.

Page 28 of 34
Months Supply of Active Inventory by Price Range: Single-Family Homes
February 2023
OAHU, HAWAII
(Comparesactiveinventorytoarolling12-monthaverageclosedsales)
Single-Family HomesFeb-23Feb-22YOY chg
$449,999andbelow1.50.5200.0%
$450,000-$599,9993.50.8337.5%
$600,000-$699,9992.70.4575.0%
$700,000-$799,9991.80.8125.0%
$800,000-$899,9991.90.3533.3%
$900,000-$999,9991.30.6116.7%
$1,000,000-$1,499,9991.30.862.5%
$1,500,000-1,999,9992.31.1109.1%
$2,000,000-$2,999,9993.21.788.2%
Months of Inventory
$3,000,000andabove6.54.544.4%
All Single-Family Homes 2.00.9122.2%
SOURCE: Honolulu Board of REALTORS®, residential resales compiled from MLS data. ©2023.HonoluluBoardofREALTORS®.AllRightsReserved.Informationhereindeemedreliablebutnotguaranteed.
Page 29 of 34
Months Supply of Active Inventory by Price Range: Condos
February 2023
OAHU, HAWAII
(Comparesactiveinventorytoarolling12-monthaverageclosedsales)
Condos Feb-23Feb-22YOY chg
$149,999andbelow2.91.681.3%
$150,000-$299,9992.41.833.3%
$300,000-$399,9991.61.233.3%
$400,000-$499,9991.81.163.6%
$500,000-$599,9991.41.040.0%
$600,000-$699,9992.31.376.9%
$700,000-$999,9992.51.747.1%
$1,000,000-$1,499,9994.52.955.2%
$1,500,000-$1,999,9999.06.538.5%
Months of Inventory
$2,000,000andabove9.78.316.9%
All Condos 2.41.650.0%
SOURCE: Honolulu Board of REALTORS®, residential resales compiled from MLS data. ©2023.HonoluluBoardofREALTORS®.AllRightsReserved.Informationhereindeemedreliablebutnotguaranteed.
Page 30 of 34
Page 31 of 34
Page 32 of 34

Page 33 of 34
Page 34 of 34
FEBRUARY 2023 OAHU
{ S O U R C E : H O N O L U L U B O A R D O F R E A L T O R S 2 0 2 1 } HONOLULU BOARD OF REALTORS®
LOCAL MARKET UPDATE
Oahu Local Market Update
February 2023
LOCAL MARKETS
to 1-2-9 (except 1-2-6)
CONTENTS:

Kailua - Waimanalo1-4-1 to selected 1-4-4
Wahiawa1-7-1 to 1-7-7
Makaha - Nanakuli1-8-1 to 1-8-9
- Salt Lake18
North Shore19
Pearl City - Aiea20
Ewa Plain1-9-1 Wahiawa21
Makakilo1-9-2 to 1-9-3
Waialae - Kahala22
Waipahu1-9-4 Waikiki23
MililaniSelected 1-9-4 to 1-9-5
Pearl City - Aiea1-9-6 to 1-9-9 Windward Coast25
SOURCE: Honolulu Board of REALTORS®, residential resales data compiled from HiCentral MLS, Ltd.®
©Copyright 2023. Honolulu Board of REALTORS®. All Rights Reserved. Information herein deemed reliable but not guaranteed.
Current Month Overview (Single-Family Homes) 2 Current Month Overview (Condos) 3 TMK AREAS Year-to-Date Overview 4 Moanalua - Salt Lake1-1-1 Aina Haina - Kuliouou 5 Kalihi - Palama1-1-2
Ala Moana - Kakaako6 Downtown - Nuuanu1-1-8 to 1-2-2 Downtown - Nuuanu7 Ala Moana - Kakaako1-2-3 Ewa Plain8 Makiki - Moiliili1-2-4
Hawaii Kai9 Waikiki1-2-6 Kailua - Waimanalo10
Kalihi
Kaneohe12
Makaha
to 1-1-7
Kapahulu - Diamond Head1-3-1 to 1-3-4
- Palama11 Waialae - Kahala1-3-5
Aina Haina - Kuliouou1-3-6 to 1-3-8 Kapahulu - Diamond Head13 Hawaii Kai1-3-9
- Nanakuli14
Makakilo15
Mililani17
Moanalua
Kaneohe1-4-4 to 1-4-7 Makiki - Moiliili16 Windward Coast1-4-8 to 1-5-5
North Shore1-5-6 to 1-6-9
Waipahu24
Oahu - Islandwide26 Neighborhoods Summary 27 Single-Family Homes 27-32 Condos 33-36
Local Market Update
Single Family Homes

SOURCE: Honolulu Board of REALTORS®, compiled from MLS data.
©Copyright 2023. Honolulu Board of REALTORS®. All Rights Reserved. Information herein deemed reliable but not guaranteed.
Feb-23Feb-22ChangeFeb-23Feb-22ChangeFeb-23Feb-22ChangeFeb-23Feb-22Change Aina Haina - Kuliouou 1-3-6 to 1-3-8 4 6 -33%$2,137,500$2,075,0003%98.8%100.3%-1% 31 21 48% Ala Moana - Kakaako 1-2-3 00---------Downtown - Nuuanu 1-1-8 to 1-2-2 2 9 -78%$905,000$1,230,000-26%100.2%102.5%-2% 50 8 525% Ewa Plain 1-9-1 33 56 -41%$910,000$907,5000%95.9%101.2%-5% 61 10 510% Hawaii Kai 1-3-9 11 11 0%$1,700,000$1,875,000-9%93.1%110.9%-16% 24 9 167% Kailua - Waimanalo 1-4-1 to Selected 1-4-4 20 22 -9%$1,420,000$1,470,000-3%98.0%100.0%-2% 35 16 119% Kalihi - Palama 1-1-2 to 1-1-7 9 11 -18%$750,000$1,055,000-29%95.9%100.0%-4% 73 35 109% Kaneohe Selected 1-4-4 to 1-4-7 6 8 -25%$1,140,000$1,167,500-2%92.8%102.1%-9% 42 28 50% Kapahulu - Diamond Head 1-3-1 to 1-3-4 9 14 -36%$1,305,000$1,747,500-25%94.0%106.0%-11% 27 11 145% Makaha - Nanakuli 1-8-1 to 1-8-9 20 17 18%$675,000$670,0001%95.2%100.0%-5% 73 11 564% Makakilo 1-9-2 to 1-9-3 9 11 -18%$850,000$1,020,000-17%97.1%101.6%-4% 40 8 400% Makiki - Moiliili 1-2-4 to 1-2-9 (except 1-2-6) 2 8 -75%$5,700,000$1,562,500265%93.7%102.2%-8% 28 26 8% Mililani Selected 1-9-4 to 1-9-5 4 9 -56%$1,146,000$980,00017%93.5%100.0%-6% 73 14 421% Moanalua - Salt Lake 1-1-1 0 1 -100% -$1,430,000- - 105.9% - - 5North Shore 1-5-6 to 1-6-9 8 5 60%$1,292,750$1,750,000-26%95.9%100.7%-5% 52 9 478% Pearl City - Aiea 1-9-6 to 1-9-9 17 19 -11%$905,000$1,030,000-12%98.4%101.1%-3% 10 13 -23% Wahiawa 1-7-1 to 1-7-7 4 5 -20%$750,000$876,000-14%95.2%104.3%-9% 39 12 225% Waialae - Kahala 1-3-5 9 9 0%$2,960,000$2,980,000-1%97.0%96.1%1% 80 30 167% Waikiki 1-2-6 00---------Waipahu 1-9-4 3 14 -79%$888,000$974,986-9%98.8%100.8%-2% 60 14 329% Windward Coast 1-4-8 to 1-5-5 3 6 -50%$1,080,000$1,477,500-27%87.3%97.7%-11% 11 75 -85% Feb-23Feb-22ChangeFeb-23Feb-22ChangeFeb-23Feb-22ChangeFeb-23Feb-22Change Aina Haina - Kuliouou 1-3-6 to 1-3-8 8 8 0% 5 8 -38% 25 17 47% 9 13 -31% Ala Moana - Kakaako 1-2-3 1 2 -50% 0 0 - 1 3 -67% 1 1 0% Downtown - Nuuanu 1-1-8 to 1-2-2 4 4 0% 3 6 -50% 21 12 75% 4 9 -56% Ewa Plain 1-9-1 44 80 -45% 33 66 -50% 94 42 124% 67 104 -36% Hawaii Kai 1-3-9 9 25 -64% 9 17 -47% 17 18 -6% 16 24 -33% Kailua - Waimanalo 1-4-1 to Selected 1-4-4 29 36 -19% 24 27 -11% 39 27 44% 39 41 -5% Kalihi - Palama 1-1-2 to 1-1-7 7 14 -50% 12 14 -14% 22 17 29% 21 27 -22% Kaneohe Selected 1-4-4 to 1-4-7 11 22 -50% 14 18 -22% 21 18 17% 23 40 -43% Kapahulu - Diamond Head 1-3-1 to 1-3-4 15 21 -29% 10 17 -41% 41 24 71% 20 34 -41% Makaha - Nanakuli 1-8-1 to 1-8-9 27 31 -13% 14 26 -46% 79 33 139% 30 52 -42% Makakilo 1-9-2 to 1-9-3 9 18 -50% 12 14 -14% 18 14 29% 13 22 -41% Makiki - Moiliili 1-2-4 to 1-2-9 (except 1-2-6) 12 14 -14% 11 9 22% 24 24 0% 20 18 11% Mililani Selected 1-9-4 to 1-9-5 5 18 -72% 12 19 -37% 20 9 122% 24 27 -11% Moanalua - Salt Lake 1-1-1 4 6 -33% 5 7 -29% 4 3 33% 9 8 13% North Shore 1-5-6 to 1-6-9 6 9 -33% 7 15 -53% 25 19 32% 10 25 -60% Pearl City - Aiea 1-9-6 to 1-9-9 19 16 19% 18 18 0% 24 12 100% 26 34 -24% Wahiawa 1-7-1 to 1-7-7 4 6 -33% 2 7 -71% 11 7 57% 7 11 -36% Waialae - Kahala 1-3-5 5 8 -38% 8 6 33% 21 17 24% 10 10 0% Waikiki 1-2-6 0 0 - 0 0 - 0 0 - 0 1 -100% Waipahu 1-9-4 12 22 -45% 15 16 -6% 28 17 65% 28 30 -7% Windward Coast 1-4-8 to 1-5-5 2 7 -71% 3 6 -50% 12 15 -20% 9 13 -31%
updated as of 2021, in accordance with Monthly Statistical Report. FEBRUARY 2023 New Listings Pending Sales* Active Inventory* Total Inventory In Escrow*
*Metrics
2023 FEBRUARY 2023 Closed Sales Median Sales Price Percent of Original List Price Received Median Days on Market
February
Local Market Update Condos
SOURCE: Honolulu Board of REALTORS®, compiled from MLS data.
©Copyright 2023. Honolulu Board of REALTORS®. All Rights Reserved. Information herein deemed reliable but not guaranteed.
Feb-23Feb-22ChangeFeb-23Feb-22ChangeFeb-23Feb-22ChangeFeb-23Feb-22Change Aina Haina - Kuliouou 1-3-6 to 1-3-8 00---------Ala Moana - Kakaako 1-2-3 30 58 -48%$502,500$750,000-33%96.0%96.3%0% 70 52 35% Downtown - Nuuanu 1-1-8 to 1-2-2 40 30 33%$490,000$500,750-2%95.9%100.0%-4% 31 17 82% Ewa Plain 1-9-1 25 46 -46%$517,000$705,000-27%99.0%102.2%-3% 22 8 175% Hawaii Kai 1-3-9 11 13 -15%$780,000$750,0004%98.7%98.7%0% 13 47 -72% Kailua - Waimanalo 1-4-1 to Selected 1-4-4 10 10 0%$759,500$850,000-11%100.0%103.0%-3% 12 8 50% Kalihi - Palama 1-1-2 to 1-1-7 6 14 -57%$532,500$402,50032%97.8%98.3%-1% 37 38 -3% Kaneohe Selected 1-4-4 to 1-4-7 10 12 -17%$590,000$675,000-13%97.9%102.4%-4% 37 9 311% Kapahulu - Diamond Head 1-3-1 to 1-3-4 7 12 -42%$790,000$580,00036%95.8%100.0%-4% 26 16 63% Makaha - Nanakuli 1-8-1 to 1-8-9 9 15 -40%$235,000$215,0009%98.8%100.0%-1% 47 10 370% Makakilo 1-9-2 to 1-9-3 7 11 -36%$645,000$610,0006%100.0%103.3%-3% 58 9 544% Makiki - Moiliili 1-2-4 to 1-2-9 (except 1-2-6) 20 56 -64%$375,000$402,500-7%95.7%99.7%-4% 50 10 400% Mililani Selected 1-9-4 to 1-9-5 21 32 -34%$450,000$510,000-12%100.0%103.9%-4% 21 9 133% Moanalua - Salt Lake 1-1-1 8 24 -67%$395,000$450,000-12%99.0%99.6%-1% 12 19 -37% North Shore 1-5-6 to 1-6-9 2 8 -75%$682,500$1,057,500-35%90.6%100.0%-9% 108 12 800% Pearl City - Aiea 1-9-6 to 1-9-9 16 25 -36%$384,000$435,000-12%99.3%100.2%-1% 33 19 74% Wahiawa 1-7-1 to 1-7-7 1 1 0%$101,266$130,000-22%96.9%100.0%-3% 34 44 -23% Waialae - Kahala 1-3-5 1 4 -75%$580,000$714,000-19%96.7%100.1%-3% 4 33 -88% Waikiki 1-2-6 93 100 -7%$390,000$382,5002%96.7%98.2%-2% 25 19 32% Waipahu 1-9-4 7 11 -36%$375,000$485,500-23%100.0%102.0%-2% 12 6 100% Windward Coast 1-4-8 to 1-5-5 1 4 -75%$475,000$220,000116%96.0%94.5%2% 28 46 -39% Feb-23Feb-22ChangeFeb-23Feb-22ChangeFeb-23Feb-22ChangeFeb-23Feb-22Change Aina Haina - Kuliouou 1-3-6 to 1-3-8 00-00-10-00Ala Moana - Kakaako 1-2-3 65 97 -33% 45 73 -38% 273 206 33% 68 114 -40% Downtown - Nuuanu 1-1-8 to 1-2-2 39 50 -22% 27 43 -37% 76 80 -5% 42 64 -34% Ewa Plain 1-9-1 29 70 -59% 37 60 -38% 58 30 93% 56 83 -33% Hawaii Kai 1-3-9 12 20 -40% 19 19 0% 35 17 106% 26 28 -7% Kailua - Waimanalo 1-4-1 to Selected 1-4-4 10 13 -23% 11 8 38% 7 8 -13% 14 11 27% Kalihi - Palama 1-1-2 to 1-1-7 17 16 6% 14 9 56% 24 19 26% 19 18 6% Kaneohe Selected 1-4-4 to 1-4-7 14 26 -46% 15 28 -46% 18 10 80% 17 35 -51% Kapahulu - Diamond Head 1-3-1 to 1-3-4 3 9 -67% 7 8 -13% 20 20 0% 9 14 -36% Makaha - Nanakuli 1-8-1 to 1-8-9 25 27 -7% 15 34 -56% 47 28 68% 23 53 -57% Makakilo 1-9-2 to 1-9-3 10 17 -41% 12 24 -50% 14 6 133% 19 27 -30% Makiki - Moiliili 1-2-4 to 1-2-9 (except 1-2-6) 51 81 -37% 29 75 -61% 112 98 14% 46 110 -58% Mililani Selected 1-9-4 to 1-9-5 26 27 -4% 23 25 -8% 30 13 131% 31 44 -30% Moanalua - Salt Lake 1-1-1 18 44 -59% 13 30 -57% 21 32 -34% 20 39 -49% North Shore 1-5-6 to 1-6-9 2 11 -82% 5 13 -62% 4 7 -43% 7 16 -56% Pearl City - Aiea 1-9-6 to 1-9-9 21 31 -32% 26 26 0% 29 24 21% 34 46 -26% Wahiawa 1-7-1 to 1-7-7 1 0 - 1 1 0% 2 3 -33% 4 4 0% Waialae - Kahala 1-3-5 5 9 -44% 4 7 -43% 6 6 0% 5 8 -38% Waikiki 1-2-6 100 170 -41% 84 140 -40% 381 367 4% 127 197 -36% Waipahu 1-9-4 12 18 -33% 11 19 -42% 15 11 36% 20 31 -35% Windward Coast 1-4-8 to 1-5-5 3 3 0% 1 1 0% 4 4 0% 5 4 25% *Metrics updated as of 2021, in accordance with Monthly Statistical Report. FEBRUARY 2023 New Listings Pending Sales* Active Inventory* Total Inventory In Escrow*
2023 FEBRUARY 2023 Closed Sales Median Sales Price Percent of Original List Price Received Median Days on Market
February
SOURCE: Honolulu Board of REALTORS®, compiled from MLS data.
Local Market Update Single Family Homes and Condos
Feb-23Feb-22ChangeFeb-23Feb-22ChangeFeb-23Feb-22ChangeFeb-23Feb-22ChangeFeb-23Feb-22ChangeFeb-23Feb-22Change Aina Haina - Kuliouou 1-3-6 to 1-3-8 1011-9%$2,137,500$1,700,00026%97.6%102.7%-5%3112158%17166%714-50% Ala Moana - Kakaako 1-2-3 01-100%-$1,205,000--96.5%- -36-13-67%01-100% Downtown - Nuuanu 1-1-8 to 1-2-2 819-58%$1,129,000$1,230,000-8%95.9%102.5%-6%219133%1415-7%615-60% Ewa Plain 1-9-1 55131-58%$840,000$920,000-9%95.8%101.7%-6%4810380%92143-36%84127-34% Hawaii Kai 1-3-9 1634-53%$1,437,500$1,500,000-4%95.2%103.8%-8%1213-8%2136-42%2331-26% Kailua - Waimanalo 1-4-1 to Selected 1-4-4 3655-35%$1,475,000$1,490,000-1%96.2%100.0%-4%2210120%5658-3%52512% Kalihi - Palama 1-1-2 to 1-1-7 1520-25%$815,000$967,500-16%95.9%100.4%-4%5926127%2131-32%2428-14% Kaneohe Selected 1-4-4 to 1-4-7 2123-9%$1,100,000$1,210,000-9%94.2%101.0%-7%3212167%2341-44%2440-40% Kapahulu - Diamond Head 1-3-1 to 1-3-4 1331-58%$1,200,000$1,585,000-24%94.0%100.0%-6%301867%2735-23%2736-25% Makaha - Nanakuli 1-8-1 to 1-8-9 3752-29%$660,000$710,000-7%95.7%100.0%-4%5613331%5763-10%4259-29% Makakilo 1-9-2 to 1-9-3 1327-52%$839,000$1,000,000-16%97.7%101.6%-4%4012233%1938-50%2235-37% Makiki - Moiliili 1-2-4 to 1-2-9 (except 1-2-6) 915-40%$1,600,000$1,640,000-2%91.4%100.8%-9%22220%252025%211450% Mililani Selected 1-9-4 to 1-9-5 625-76%$1,031,000$1,050,000-2%92.5%100.5%-8%7314421%2330-23%2530-17% Moanalua - Salt Lake 1-1-1 16-83%$953,888$1,117,500-15%95.9%107.9%-11%1015-33%69-33%79-22% North Shore 1-5-6 to 1-6-9 1114-21%$1,389,000$1,700,000-18%95.9%96.8%-1%564137%1025-60%1526-42% Pearl City - Aiea 1-9-6 to 1-9-9 3133-6%$885,000$1,070,000-17%98.4%101.6%-3%1112-8%38366%44432% Wahiawa 1-7-1 to 1-7-7 812-33%$765,000$900,500-15%93.2%103.9%-10%4612283%816-50%610-40% Waialae - Kahala 1-3-5 1011-9%$2,730,000$2,750,000-1%95.7%100.0%-4%7617347%1017-41%171421% Waikiki 1-2-6 00----------00-00Waipahu 1-9-4 1837-51%$915,000$905,0001%99.9%102.3%-2%151050%2437-35%2831-10% Windward Coast 1-4-8 to 1-5-5 510-50%$1,080,000$1,585,000-32%100.0%97.7%2%1175-85%918-50%1017-41% Feb-23Feb-22ChangeFeb-23Feb-22ChangeFeb-23Feb-22ChangeFeb-23Feb-22ChangeFeb-23Feb-22ChangeFeb-23Feb-22Change Aina Haina - Kuliouou 1-3-6 to 1-3-8 00----------00-00Ala Moana - Kakaako 1-2-3 69123-44%$593,750$790,000-25%96.6%97.2%-1%494120%151171-12%92143-36% Downtown - Nuuanu 1-1-8 to 1-2-2 5778-27%$560,000$503,75011%97.1%100.0%-3%3417100%7297-26%6582-21% Ewa Plain 1-9-1 5194-46%$522,000$702,500-26%99.2%102.6%-3%268225%80118-32%72105-31% Hawaii Kai 1-3-9 1632-50%$774,500$807,500-4%97.5%100.0%-3%281587%38373%3338-13% Kailua - Waimanalo 1-4-1 to Selected 1-4-4 17166%$745,000$740,0001%99.3%101.1%-2%189100%20195%17170% Kalihi - Palama 1-1-2 to 1-1-7 1025-60%$443,500$430,0003%98.3%98.8%-1%2129-28%302520%2226-15% Kaneohe Selected 1-4-4 to 1-4-7 1828-36%$691,500$712,500-3%98.2%103.3%-5%379311%2445-47%2844-36% Kapahulu - Diamond Head 1-3-1 to 1-3-4 1023-57%$682,500$580,00018%99.5%100.0%-1%1131-65%1823-22%1419-26% Makaha - Nanakuli 1-8-1 to 1-8-9 1931-39%$230,000$230,0000%99.5%100.0%-1%279200%3857-33%2457-58% Makakilo 1-9-2 to 1-9-3 1527-44%$635,000$550,00015%100.0%102.2%-2%13944%2036-44%2236-39% Makiki - Moiliili 1-2-4 to 1-2-9 (except 1-2-6) 45110-59%$382,000$398,750-4%96.9%99.1%-2%3912225%91166-45%59150-61% Mililani Selected 1-9-4 to 1-9-5 3976-49%$460,000$512,500-10%100.0%103.2%-3%199111%5360-12%4457-23% Moanalua - Salt Lake 1-1-1 1540-63%$440,000$446,500-1%99.1%100.0%-1%1217-29%2963-54%2543-42% North Shore 1-5-6 to 1-6-9 513-62%$875,000$850,0003%94.6%100.0%-5%4111273%622-73%820-60% Pearl City - Aiea 1-9-6 to 1-9-9 3466-48%$415,000$451,500-8%100.0%100.0%0%1016-38%4760-22%4462-29% Wahiawa 1-7-1 to 1-7-7 25-60%$176,633$130,00036%98.9%100.0%-1%221638%440%4333% Waialae - Kahala 1-3-5 310-70%$580,000$649,000-11%98.7%100.5%-2%11110%813-38%612-50% Waikiki 1-2-6 154201-23%$403,750$403,0000%96.6%97.9%-1%2627-4%229341-33%174261-33% Waipahu 1-9-4 2036-44%$497,000$487,7502%100.0%101.9%-2%13944%2541-39%2236-39% Windward Coast 1-4-8 to 1-5-5 14-75%$475,000$220,000116%96.0%94.5%2%2846-39%37-57%26-67% *Metric updated as of 2021, in accordance with Monthly Statistical Report. Single-Family Homes Condos Pending Sales* YEAR-TO-DATE Closed Sales Median Sales Price % Orig. List Price ReceivedMedian Days on Market New Listings
Year-to-Date February 2023 YEAR-TO-DATE Closed Sales Median Sales Price % Orig. List Price ReceivedMedian Days on Market New Listings Pending Sales*
©Copyright 2023. Honolulu Board of REALTORS®. All Rights Reserved. Information herein deemed reliable but not guaranteed.
SOURCE: Honolulu Board of REALTORS®, compiled from MLS data.
Local Market Update February 2023

Aina Haina
Kuliouou 1-3-6 to 1-3-8 20232022Change20232022Change 20232022Change20232022Change Closed Sales 4 6-33%1011-9% Closed Sales 0 0-0 0Median Sales Price $2,137,500$2,075,0003%$2,137,500$1,700,00026% Median Sales PricePercent of Original List Price Received 98.8%100.3%-1%97.6%102.7%-5% Percent of Original List Price ReceivedMedian Days on Market 312148%3112158% Median Days on MarketNew Listings 8 80%17166% New Listings 0 0-0 0Pending Sales 5 8-38%7 14-50% Pending Sales 0 0-0 0Active Inventory 251747%- Active Inventory 1 0-Total Inventory In Escrow 9 13-31%- Total Inventory In Escrow 0 0--
-
Single-Family Homes February Year to Date Condos February Year to Date 1,380,000 1,241,000 1,777,500 1,183,000 1,875,000 2,100,000 1,750,000 1,500,000 1,263,500 1,700,000 1,350,000 2,075,000 1,830,000 2,086,111 2,330,000 1,850,000 1,550,000 1,565,000 1,497,000 1,496,625 2,647,500 1,235,000 2,294,000 2,137,500 $0 $500,000 $1,000,000 $1,500,000 $2,000,000 $2,500,000 $3,000,000 Mar-21 Apr-21 May-21 Jun-21 Jul-21 Aug-21 Sep-21 Oct-21 Nov-21 Dec-21 Jan-22 Feb-22 Mar-22 Apr-22 May-22 Jun-22 Jul-22 Aug-22 Sep-22 Oct-22 Nov-22 Dec-22 Jan-23 Feb-23 Median Sales Price: Single-Family Homes 657,000 575,000 650,000 675,000 0 750,000 600,000 675,000 0 0 0 0 808,000 0 950,000 0 0 0 0 0 0 0 0 $0 $100,000 $200,000 $300,000 $400,000 $500,000 $600,000 $700,000 $800,000 $900,000 $1,000,000 Apr-21 May-21 Jun-21 Jul-21 Aug-21 Sep-21 Oct-21 Nov-21 Dec-21 Jan-22 Feb-22 Mar-22 Apr-22 May-22 Jun-22 Jul-22 Aug-22 Sep-22 Oct-22 Nov-22 Dec-22 Jan-23 Feb-23 Median Sales Price: Condos 9111212101415156155691077799310564 0 2 4 6 8 10 12 14 16 Mar-21 Apr-21 May-21 Jun-21 Jul-21 Aug-21 Sep-21 Oct-21 Nov-21 Dec-21 Jan-22 Feb-22 Mar-22 Apr-22 May-22 Jun-22 Jul-22 Aug-22 Sep-22 Oct-22 Nov-22 Dec-22 Jan-23 Feb-23 Closed Sales: Single-Family Homes 011120111000010200000000 0 1 2 3 Mar-21 Apr-21 May-21 Jun-21 Jul-21 Aug-21 Sep-21 Oct-21 Nov-21 Dec-21 Jan-22 Feb-22 Mar-22 Apr-22 May-22 Jun-22 Jul-22 Aug-22 Sep-22 Oct-22 Nov-22 Dec-22 Jan-23 Feb-23 Closed Sales: Condos
©Copyright
2023. Honolulu Board of REALTORS®. All Rights Reserved. Information herein deemed reliable but not guaranteed.
Ala Moana - Kakaako
Local Market Update February 2023
Median Sales Price: Single-Family Homes
1-2-3 20232022Change20232022Change 20232022Change20232022Change Closed Sales 0 0-0 1-100% Closed Sales 3058-48%69123-44% Median Sales Price - ---$1,205,000- Median Sales Price $502,500$750,000-33%$593,750$790,000-25% Percent of Original List Price Received - ---96.5%- Percent of Original List Price Received 96.0%96.3%0%96.6%97.2%-1% Median Days on Market - 36- Median Days on Market 705235%494120% New Listings 1 2-50%1 3-67% New Listings 6597-33%151171-12% Pending Sales 0 0-0 1-100% Pending Sales 4573-38%92143-36% Active Inventory 1 3-67%- Active Inventory 27320633%Total Inventory In Escrow 1 10%- Total Inventory In Escrow 68114-40%-
Single-Family Homes February Year to Date Condos February Year to Date 762,000 1,057,500 841,000 0 1,190,000 1,160,000 0 950,000 0 1,065,000 1,205,000 0 0 999,000 1,437,500 1,418,500 0 0 0 900,000 0 1,314,500 0 0 $0 $200,000 $400,000 $600,000 $800,000 $1,000,000 $1,200,000 $1,400,000 $1,600,000 Mar-21 Apr-21 May-21 Jun-21 Jul-21 Aug-21 Sep-21 Oct-21 Nov-21 Dec-21 Jan-22 Feb-22 Mar-22 Apr-22 May-22 Jun-22 Jul-22 Aug-22 Sep-22 Oct-22 Nov-22 Dec-22 Jan-23 Feb-23
580,000 450,000 802,500 566,000 750,000 785,000 405,000 500,000 630,000 837,500 790,000 750,000 760,500 732,000 800,000 709,000 732,500 615,000 695,000 880,000 612,500 620,000 737,500 502,500 $0 $100,000 $200,000 $300,000 $400,000 $500,000 $600,000 $700,000 $800,000 $900,000 $1,000,000 Mar-21 Apr-21 May-21 Jun-21 Jul-21 Aug-21 Sep-21 Oct-21 Nov-21 Dec-21 Jan-22 Feb-22 Mar-22 Apr-22 May-22 Jun-22 Jul-22 Aug-22 Sep-22 Oct-22 Nov-22 Dec-22 Jan-23 Feb-23 Median Sales Price: Condos 122011010210012200010200 0 0.5 1 1.5 2 2.5 Mar-21 Apr-21 May-21 Jun-21 Jul-21 Aug-21 Sep-21 Oct-21 Nov-21 Dec-21 Jan-22 Feb-22 Mar-22 Apr-22 May-22 Jun-22 Jul-22 Aug-22 Sep-22 Oct-22 Nov-22 Dec-22 Jan-23 Feb-23 Closed Sales: Single-Family Homes 625564836599546463726558769170675461585948393930 0 20 40 60 80 100 120 Mar-21 Apr-21 May-21 Jun-21 Jul-21 Aug-21 Sep-21 Oct-21 Nov-21 Dec-21 Jan-22 Feb-22 Mar-22 Apr-22 May-22 Jun-22 Jul-22 Aug-22 Sep-22 Oct-22 Nov-22 Dec-22 Jan-23 Feb-23 Closed Sales: Condos SOURCE: Honolulu Board of REALTORS®, compiled from MLS data. ©Copyright 2023. Honolulu Board of REALTORS®. All Rights Reserved. Information herein deemed reliable but not guaranteed.
Median Sales Price: Single-Family Homes
Local Market Update
February 2023
SOURCE: Honolulu Board of REALTORS®, compiled from MLS data.
Downtown-Nuuanu 1-1-8 to 1-2-2 20232022Change20232022Change 20232022Change20232022Change Closed Sales 2 9-78%8 19-58% Closed Sales 403033%5778-27% Median Sales Price $905,000$1,230,000-26%$1,129,000$1,230,000-8% Median Sales Price $490,000$500,750-2%$560,000$503,75011% Percent of Original List Price Received 100.2%102.5%-2%95.9%102.5%-6% Percent of Original List Price Received 95.9%100.0%-4%97.1%100.0%-3% Median Days on Market 50 8525%21 9133% Median Days on Market 311782%3417100% New Listings 4 40%1415-7% New Listings 3950-22%7297-26% Pending Sales 3 6-50%6 15-60% Pending Sales 2743-37%6582-21% Active Inventory 211275%- Active Inventory 7680-5%Total Inventory In Escrow 4 9-56%- Total Inventory In Escrow 4264-34%-
Single-Family Homes February Year to Date Condos February Year to Date 1,115,000 990,000 1,200,000 1,500,000 1,135,500 1,182,000 1,130,000 1,300,000 996,000 1,262,000 1,237,500 1,230,000 1,400,000 1,512,500 1,364,500 1,325,000 1,725,000 1,295,000 1,400,000 961,000 1,405,000 1,026,944 1,164,000 905,000 $0 $200,000 $400,000 $600,000 $800,000 $1,000,000 $1,200,000 $1,400,000 $1,600,000 $1,800,000 $2,000,000 Mar-21 Apr-21 May-21 Jun-21 Jul-21 Aug-21 Sep-21 Oct-21 Nov-21 Dec-21 Jan-22 Feb-22 Mar-22 Apr-22 May-22 Jun-22 Jul-22 Aug-22 Sep-22 Oct-22 Nov-22 Dec-22 Jan-23 Feb-23
615,000 575,000 425,000 560,000 559,000 650,000 602,500 697,500 605,000 510,500 505,000 500,750 605,000 640,000 629,950 545,000 423,000 525,000 470,000 630,000 425,000 630,000 670,000 490,000 $0 $100,000 $200,000 $300,000 $400,000 $500,000 $600,000 $700,000 $800,000 Mar-21 Apr-21 May-21 Jun-21 Jul-21 Aug-21 Sep-21 Oct-21 Nov-21 Dec-21 Jan-22 Feb-22 Mar-22 Apr-22 May-22 Jun-22 Jul-22 Aug-22 Sep-22 Oct-22 Nov-22 Dec-22 Jan-23 Feb-23 Median Sales Price: Condos 1415131014711119141095410993546462 0 2 4 6 8 10 12 14 16 Mar-21 Apr-21 May-21 Jun-21 Jul-21 Aug-21 Sep-21 Oct-21 Nov-21 Dec-21 Jan-22 Feb-22 Mar-22 Apr-22 May-22 Jun-22 Jul-22 Aug-22 Sep-22 Oct-22 Nov-22 Dec-22 Jan-23 Feb-23 Closed Sales: Single-Family Homes 396754637545455643554830425762554233453719271740 0 10 20 30 40 50 60 70 80 Mar-21 Apr-21 May-21 Jun-21 Jul-21 Aug-21 Sep-21 Oct-21 Nov-21 Dec-21 Jan-22 Feb-22 Mar-22 Apr-22 May-22 Jun-22 Jul-22 Aug-22 Sep-22 Oct-22 Nov-22 Dec-22 Jan-23 Feb-23 Closed Sales: Condos
©Copyright 2023.
Honolulu Board of REALTORS®. All Rights Reserved. Information herein deemed reliable but not guaranteed.
Ewa Plain
Local Market Update
February 2023
Median Sales Price: Single-Family Homes
SOURCE: Honolulu Board of REALTORS®, compiled from MLS data. ©Copyright 2023. Honolulu Board of REALTORS®. All Rights Reserved. Information herein deemed reliable but not guaranteed.
1-9-1 20232022Change20232022Change 20232022Change20232022Change Closed Sales 3356-41%55131-58% Closed Sales 2546-46%5194-46% Median Sales Price $910,000$907,5000%$840,000$920,000-9% Median Sales Price $517,000$705,000-27%$522,000$702,500-26% Percent of Original List Price Received 95.9%101.2%-5%95.8%101.7%-6% Percent of Original List Price Received 99.0%102.2%-3%99.2%102.6%-3% Median Days on Market 6110510%4810380% Median Days on Market 22 8175%26 8225% New Listings 4480-45%92143-36% New Listings 2970-59%80118-32% Pending Sales 3366-50%84127-34% Pending Sales 3760-38%72105-31% Active Inventory 9442124%- Active Inventory 583093%Total Inventory In Escrow 67104-36%- Total Inventory In Escrow 5683-33%-
Single-Family Homes February Year to Date Condos February Year to Date 800,000 801,000 860,000 871,000 872,500 856,000 869,500 873,500 886,500 874,900 920,000 907,500 935,000 950,000 940,250 932,000 950,000 949,000 870,000 890,000 880,000 845,000 810,000 910,000 $0 $100,000 $200,000 $300,000 $400,000 $500,000 $600,000 $700,000 $800,000 $900,000 $1,000,000 Mar-21 Apr-21 May-21 Jun-21 Jul-21 Aug-21 Sep-21 Oct-21 Nov-21 Dec-21 Jan-22 Feb-22 Mar-22 Apr-22 May-22 Jun-22 Jul-22 Aug-22 Sep-22 Oct-22 Nov-22 Dec-22 Jan-23 Feb-23
545,000 625,000 617,500 629,000 650,000 660,000 675,000 675,000 667,500 685,000 687,500 705,000 675,000 692,500 715,000 710,500 630,000 639,500 705,000 734,000 597,500 590,000 546,000 517,000 $0 $100,000 $200,000 $300,000 $400,000 $500,000 $600,000 $700,000 $800,000 Mar-21 Apr-21 May-21 Jun-21 Jul-21 Aug-21 Sep-21 Oct-21 Nov-21 Dec-21 Jan-22 Feb-22 Mar-22 Apr-22 May-22 Jun-22 Jul-22 Aug-22 Sep-22 Oct-22 Nov-22 Dec-22 Jan-23 Feb-23 Median Sales Price: Condos 657379958891708068717556577972696459513725412233 0 10 20 30 40 50 60 70 80 90 100 Mar-21 Apr-21 May-21 Jun-21 Jul-21 Aug-21 Sep-21 Oct-21 Nov-21 Dec-21 Jan-22 Feb-22 Mar-22 Apr-22 May-22 Jun-22 Jul-22 Aug-22 Sep-22 Oct-22 Nov-22 Dec-22 Jan-23 Feb-23 Closed Sales: Single-Family Homes 577074606065576468594846675659625154453224332625 0 10 20 30 40 50 60 70 80 Mar-21 Apr-21 May-21 Jun-21 Jul-21 Aug-21 Sep-21 Oct-21 Nov-21 Dec-21 Jan-22 Feb-22 Mar-22 Apr-22 May-22 Jun-22 Jul-22 Aug-22 Sep-22 Oct-22 Nov-22 Dec-22 Jan-23 Feb-23 Closed Sales: Condos
Single-Family
Local Market Update
February 2023
Median Sales Price: Single-Family Homes
SOURCE: Honolulu Board of REALTORS®, compiled from MLS data.
Hawaii Kai 1-3-9 20232022Change20232022Change 20232022Change20232022Change Closed Sales 11110%1634-53% Closed Sales 1113-15%1632-50% Median Sales Price $1,700,000$1,875,000-9%$1,437,500$1,500,000-4% Median Sales Price $780,000$750,0004%$774,500$807,500-4% Percent of Original List Price Received 93.1%110.9%-16%95.2%103.8%-8% Percent of Original List Price Received 98.7%98.7%0%97.5%100.0%-3% Median Days on Market 24 9167%1213-8% Median Days on Market 1347-72%281587% New Listings 9 25-64%2136-42% New Listings 1220-40%38373% Pending Sales 9 17-47%2331-26% Pending Sales 19190%3338-13% Active Inventory 1718-6%- Active Inventory 3517106%Total Inventory In Escrow 1624-33%- Total Inventory In Escrow 2628-7%-
Homes February Year to Date Condos February Year to Date 1,500,000 1,314,000 1,538,000 1,425,000 1,550,000 1,387,500 1,420,000 1,625,000 1,702,500 1,495,000 1,395,000 1,875,000 1,900,000 1,600,000 1,485,000 1,600,000 1,450,000 1,750,000 1,640,000 1,580,000 1,637,500 1,605,000 1,275,000 1,700,000 $0 $200,000 $400,000 $600,000 $800,000 $1,000,000 $1,200,000 $1,400,000 $1,600,000 $1,800,000 $2,000,000 Mar-21 Apr-21 May-21 Jun-21 Jul-21 Aug-21 Sep-21 Oct-21 Nov-21 Dec-21 Jan-22 Feb-22 Mar-22 Apr-22 May-22 Jun-22 Jul-22 Aug-22 Sep-22 Oct-22 Nov-22 Dec-22 Jan-23 Feb-23
695,000 672,500 680,000 767,750 762,500 764,500 860,000 746,000 670,000 670,000 821,000 750,000 915,000 899,000 810,000 816,000 955,000 757,000 745,000 835,000 870,000 900,000 670,000 780,000 $0 $200,000 $400,000 $600,000 $800,000 $1,000,000 $1,200,000 Mar-21 Apr-21 May-21 Jun-21 Jul-21 Aug-21 Sep-21 Oct-21 Nov-21 Dec-21 Jan-22 Feb-22 Mar-22 Apr-22 May-22 Jun-22 Jul-22 Aug-22 Sep-22 Oct-22 Nov-22 Dec-22 Jan-23 Feb-23 Median Sales Price: Condos 21162226141825251824231119231319720117814511 0 5 10 15 20 25 30 Mar-21 Apr-21 May-21 Jun-21 Jul-21 Aug-21 Sep-21 Oct-21 Nov-21 Dec-21 Jan-22 Feb-22 Mar-22 Apr-22 May-22 Jun-22 Jul-22 Aug-22 Sep-22 Oct-22 Nov-22 Dec-22 Jan-23 Feb-23 Closed Sales: Single-Family Homes 2427192020201416201819131917232515171217115511 0 5 10 15 20 25 30 Mar-21 Apr-21 May-21 Jun-21 Jul-21 Aug-21 Sep-21 Oct-21 Nov-21 Dec-21 Jan-22 Feb-22 Mar-22 Apr-22 May-22 Jun-22 Jul-22 Aug-22 Sep-22 Oct-22 Nov-22 Dec-22 Jan-23 Feb-23 Closed Sales: Condos
©Copyright 2023.
Honolulu Board of REALTORS®. All Rights Reserved. Information herein deemed reliable but not guaranteed.
Kailua - Waimanalo
Local
Single-Family Homes
Median Sales Price: Single-Family Homes
Market Update February 2023
SOURCE: Honolulu Board of REALTORS®, compiled from MLS data. ©Copyright 2023. Honolulu Board of REALTORS®. All Rights Reserved. Information herein deemed reliable but not guaranteed.
1-4-1 to Selected 1-4-4 20232022Change20232022Change 20232022Change20232022Change Closed Sales 2022-9%3655-35% Closed Sales 10100%17166% Median Sales Price $1,420,000$1,470,000-3%$1,475,000$1,490,000-1% Median Sales Price $759,500$850,000-11%$745,000$740,0001% Percent of Original List Price Received 98.0%100.0%-2%96.2%100.0%-4% Percent of Original List Price Received 100.0%103.0%-3%99.3%101.1%-2% Median Days on Market 3516119%2210120% Median Days on Market 12 850%18 9100% New Listings 2936-19%5658-3% New Listings 1013-23%20195% Pending Sales 2427-11%52512% Pending Sales 11 838%17170% Active Inventory 392744%- Active Inventory 7 8-13%Total Inventory In Escrow 3941-5%- Total Inventory In Escrow 141127%-
February Year to Date Condos February Year to Date 1,274,750 1,428,000 1,467,500 1,535,000 1,692,500 1,500,000 1,560,000 1,800,000 1,700,000 1,662,500 1,565,000 1,470,000 1,863,000 1,600,000 1,620,000 1,683,000 1,600,000 1,500,000 1,575,000 1,505,000 1,700,000 1,724,000 1,487,500 1,420,000 $0 $200,000 $400,000 $600,000 $800,000 $1,000,000 $1,200,000 $1,400,000 $1,600,000 $1,800,000 $2,000,000 Mar-21 Apr-21 May-21 Jun-21 Jul-21 Aug-21 Sep-21 Oct-21 Nov-21 Dec-21 Jan-22 Feb-22 Mar-22 Apr-22 May-22 Jun-22 Jul-22 Aug-22 Sep-22 Oct-22 Nov-22 Dec-22 Jan-23 Feb-23
895,000 645,000 636,000 723,000 943,550 849,000 750,000 950,000 715,000 650,000 735,000 850,000 775,000 700,000 840,000 910,000 721,500 760,000 757,000 745,000 708,750 718,425 712,000 759,500 $0 $100,000 $200,000 $300,000 $400,000 $500,000 $600,000 $700,000 $800,000 $900,000 $1,000,000 Mar-21 Apr-21 May-21 Jun-21 Jul-21 Aug-21 Sep-21 Oct-21 Nov-21 Dec-21 Jan-22 Feb-22 Mar-22 Apr-22 May-22 Jun-22 Jul-22 Aug-22 Sep-22 Oct-22 Nov-22 Dec-22 Jan-23 Feb-23 Median Sales Price: Condos 283242394243432327283322212840333329272317141620 0 5 10 15 20 25 30 35 40 45 50 Mar-21 Apr-21 May-21 Jun-21 Jul-21 Aug-21 Sep-21 Oct-21 Nov-21 Dec-21 Jan-22 Feb-22 Mar-22 Apr-22 May-22 Jun-22 Jul-22 Aug-22 Sep-22 Oct-22 Nov-22 Dec-22 Jan-23 Feb-23 Closed Sales: Single-Family Homes 15151313101419510136101110137899486710 0 2 4 6 8 10 12 14 16 18 20 Mar-21 Apr-21 May-21 Jun-21 Jul-21 Aug-21 Sep-21 Oct-21 Nov-21 Dec-21 Jan-22 Feb-22 Mar-22 Apr-22 May-22 Jun-22 Jul-22 Aug-22 Sep-22 Oct-22 Nov-22 Dec-22 Jan-23 Feb-23 Closed Sales: Condos
Kalihi - Palama
Local
Market Update February 2023
Median
SOURCE: Honolulu Board of REALTORS®, compiled from MLS data. ©Copyright 2023. Honolulu Board of REALTORS®. All Rights Reserved. Information herein deemed reliable but not guaranteed.
1-1-2 to 1-1-7 20232022Change20232022Change 20232022Change20232022Change Closed Sales 9 11-18%1520-25% Closed Sales 6 14-57%1025-60% Median Sales Price $750,000$1,055,000-29%$815,000$967,500-16% Median Sales Price $532,500$402,50032%$443,500$430,0003% Percent of Original List Price Received 95.9%100.0%-4%95.9%100.4%-4% Percent of Original List Price Received 97.8%98.3%-1%98.3%98.8%-1% Median Days on Market 7335109%5926127% Median Days on Market 3738-3%2129-28% New Listings 7 14-50%2131-32% New Listings 17166%302520% Pending Sales 1214-14%2428-14% Pending Sales 14 956%2226-15% Active Inventory 221729%- Active Inventory 241926%Total Inventory In Escrow 2127-22%- Total Inventory In Escrow 19186%-
Single-Family Homes February Year to Date Condos February Year to Date 830,000 915,000 880,000 855,000 885,750 850,000 900,000 952,500 950,000 958,438 870,000 1,055,000 985,000 1,050,000 1,050,000 905,000 925,000 925,000 875,000 950,000 1,150,000 922,500 927,500 750,000 $0 $200,000 $400,000 $600,000 $800,000 $1,000,000 $1,200,000 $1,400,000 Mar-21 Apr-21 May-21 Jun-21 Jul-21 Aug-21 Sep-21 Oct-21 Nov-21 Dec-21 Jan-22 Feb-22 Mar-22 Apr-22 May-22 Jun-22 Jul-22 Aug-22 Sep-22 Oct-22 Nov-22 Dec-22 Jan-23 Feb-23
455,000 415,000 540,000 375,000 416,000 281,000 457,500 386,500 347,500 370,000 470,000 402,500 415,000 395,000 457,500 399,000 420,000 377,500 420,000 452,000 370,000 388,000 345,000 532,500 $0 $100,000 $200,000 $300,000 $400,000 $500,000 $600,000 Mar-21 Apr-21 May-21 Jun-21 Jul-21 Aug-21 Sep-21 Oct-21 Nov-21 Dec-21 Jan-22 Feb-22 Mar-22 Apr-22 May-22 Jun-22 Jul-22 Aug-22 Sep-22 Oct-22 Nov-22 Dec-22 Jan-23 Feb-23 Median Sales Price: Condos 914121714171914151091113151115131113951069 0 2 4 6 8 10 12 14 16 18 20 Mar-21 Apr-21 May-21 Jun-21 Jul-21 Aug-21 Sep-21 Oct-21 Nov-21 Dec-21 Jan-22 Feb-22 Mar-22 Apr-22 May-22 Jun-22 Jul-22 Aug-22 Sep-22 Oct-22 Nov-22 Dec-22 Jan-23 Feb-23 Closed Sales: Single-Family Homes 201051917910101215111412131417116111010446 0 5 10 15 20 25 Mar-21 Apr-21 May-21 Jun-21 Jul-21 Aug-21 Sep-21 Oct-21 Nov-21 Dec-21 Jan-22 Feb-22 Mar-22 Apr-22 May-22 Jun-22 Jul-22 Aug-22 Sep-22 Oct-22 Nov-22 Dec-22 Jan-23 Feb-23 Closed Sales: Condos
Sales Price: Single-Family Homes
Kaneohe
Local Market Update
February 2023
Median Sales Price: Single-Family Homes
SOURCE: Honolulu Board of REALTORS®, compiled from MLS data. ©Copyright 2023. Honolulu Board of REALTORS®. All Rights Reserved. Information herein deemed reliable but not guaranteed.
Selected 1-4-4 to 1-4-7 20232022Change20232022Change 20232022Change20232022Change Closed Sales 6 8-25%2123-9% Closed Sales 1012-17%1828-36% Median Sales Price $1,140,000$1,167,500-2%$1,100,000$1,210,000-9% Median Sales Price $590,000$675,000-13%$691,500$712,500-3% Percent of Original List Price Received 92.8%102.1%-9%94.2%101.0%-7% Percent of Original List Price Received 97.9%102.4%-4%98.2%103.3%-5% Median Days on Market 422850%3212167% Median Days on Market 37 9311%37 9311% New Listings 1122-50%2341-44% New Listings 1426-46%2445-47% Pending Sales 1418-22%2440-40% Pending Sales 1528-46%2844-36% Active Inventory 211817%- Active Inventory 181080%Total Inventory In Escrow 2340-43%- Total Inventory In Escrow 1735-51%-
Single-Family Homes February Year to Date Condos February Year to Date 1,077,500 1,050,000 1,011,000 1,077,500 1,251,000 1,100,000 1,245,000 1,225,000 1,180,000 1,105,000 1,325,000 1,167,500 1,300,000 1,125,000 1,280,000 1,350,000 1,287,500 1,157,500 1,250,000 1,180,000 1,295,000 1,105,000 1,100,000 1,140,000 $0 $200,000 $400,000 $600,000 $800,000 $1,000,000 $1,200,000 $1,400,000 $1,600,000 Mar-21 Apr-21 May-21 Jun-21 Jul-21 Aug-21 Sep-21 Oct-21 Nov-21 Dec-21 Jan-22 Feb-22 Mar-22 Apr-22 May-22 Jun-22 Jul-22 Aug-22 Sep-22 Oct-22 Nov-22 Dec-22 Jan-23 Feb-23
470,000 530,000 580,000 625,000 700,000 700,500 724,500 715,500 708,500 755,000 712,500 675,000 697,000 697,500 730,000 724,500 610,000 600,000 817,000 749,000 660,000 695,000 752,500 590,000 $0 $100,000 $200,000 $300,000 $400,000 $500,000 $600,000 $700,000 $800,000 $900,000 Mar-21 Apr-21 May-21 Jun-21 Jul-21 Aug-21 Sep-21 Oct-21 Nov-21 Dec-21 Jan-22 Feb-22 Mar-22 Apr-22 May-22 Jun-22 Jul-22 Aug-22 Sep-22 Oct-22 Nov-22 Dec-22 Jan-23 Feb-23 Median Sales Price: Condos 2423233029343426272315827231723141817191115156 0 5 10 15 20 25 30 35 40 Mar-21 Apr-21 May-21 Jun-21 Jul-21 Aug-21 Sep-21 Oct-21 Nov-21 Dec-21 Jan-22 Feb-22 Mar-22 Apr-22 May-22 Jun-22 Jul-22 Aug-22 Sep-22 Oct-22 Nov-22 Dec-22 Jan-23 Feb-23 Closed Sales: Single-Family Homes 2717253323242224201116122624241617172481111810 0 5 10 15 20 25 30 35 Mar-21 Apr-21 May-21 Jun-21 Jul-21 Aug-21 Sep-21 Oct-21 Nov-21 Dec-21 Jan-22 Feb-22 Mar-22 Apr-22 May-22 Jun-22 Jul-22 Aug-22 Sep-22 Oct-22 Nov-22 Dec-22 Jan-23 Feb-23 Closed Sales: Condos
Kapahulu - Diamond Head
Local Market Update February 2023
Median Sales Price: Single-Family Homes
1-3-1 to 1-3-4 20232022Change20232022Change 20232022Change20232022Change Closed Sales 9 14-36%1331-58% Closed Sales 7 12-42%1023-57% Median Sales Price $1,305,000$1,747,500-25%$1,200,000$1,585,000-24% Median Sales Price $790,000$580,00036%$682,500$580,00018% Percent of Original List Price Received 94.0%106.0%-11%94.0%100.0%-6% Percent of Original List Price Received 95.8%100.0%-4%99.5%100.0%-1% Median Days on Market 2711145%301867% Median Days on Market 261663%1131-65% New Listings 1521-29%2735-23% New Listings 3 9-67%1823-22% Pending Sales 1017-41%2736-25% Pending Sales 7 8-13%1419-26% Active Inventory 412471%- Active Inventory 20200%Total Inventory In Escrow 2034-41%- Total Inventory In Escrow 9 14-36%-
Single-Family Homes February Year to Date Condos February Year to Date 1,144,500 1,162,500 1,200,000 1,053,000 1,200,000 1,526,500 1,300,000 1,252,500 1,225,000 1,218,000 1,550,000 1,747,500 1,500,000 1,367,500 1,200,000 1,365,000 1,300,000 1,339,000 1,220,000 1,250,000 1,300,000 1,345,000 1,100,000 1,305,000 $0 $200,000 $400,000 $600,000 $800,000 $1,000,000 $1,200,000 $1,400,000 $1,600,000 $1,800,000 $2,000,000 Mar-21 Apr-21 May-21 Jun-21 Jul-21 Aug-21 Sep-21 Oct-21 Nov-21 Dec-21 Jan-22 Feb-22 Mar-22 Apr-22 May-22 Jun-22 Jul-22 Aug-22 Sep-22 Oct-22 Nov-22 Dec-22 Jan-23 Feb-23
605,000 521,500 607,750 672,500 417,500 655,000 577,000 771,000 550,000 553,000 580,000 580,000 600,000 567,500 650,000 1,675,000 609,500 660,000 687,500 825,000 629,500 1,225,000 365,000 790,000 $0 $200,000 $400,000 $600,000 $800,000 $1,000,000 $1,200,000 $1,400,000 $1,600,000 $1,800,000 Mar-21 Apr-21 May-21 Jun-21 Jul-21 Aug-21 Sep-21 Oct-21 Nov-21 Dec-21 Jan-22 Feb-22 Mar-22 Apr-22 May-22 Jun-22 Jul-22 Aug-22 Sep-22 Oct-22 Nov-22 Dec-22 Jan-23 Feb-23 Median Sales Price: Condos 242423322418272422311714192115112523231419949 0 5 10 15 20 25 30 35 Mar-21 Apr-21 May-21 Jun-21 Jul-21 Aug-21 Sep-21 Oct-21 Nov-21 Dec-21 Jan-22 Feb-22 Mar-22 Apr-22 May-22 Jun-22 Jul-22 Aug-22 Sep-22 Oct-22 Nov-22 Dec-22 Jan-23 Feb-23 Closed Sales: Single-Family Homes 1612614101313125911121388847876637 0 2 4 6 8 10 12 14 16 18 Mar-21 Apr-21 May-21 Jun-21 Jul-21 Aug-21 Sep-21 Oct-21 Nov-21 Dec-21 Jan-22 Feb-22 Mar-22 Apr-22 May-22 Jun-22 Jul-22 Aug-22 Sep-22 Oct-22 Nov-22 Dec-22 Jan-23 Feb-23 Closed Sales: Condos SOURCE: Honolulu Board of REALTORS®, compiled from MLS data. ©Copyright 2023. Honolulu Board of REALTORS®. All Rights Reserved. Information herein deemed reliable but not guaranteed.
Makaha - Nanakuli
Local Market Update
February 2023
Median Sales Price: Single-Family Homes
SOURCE: Honolulu Board of REALTORS®, compiled from MLS data. ©Copyright 2023. Honolulu Board of REALTORS®. All Rights Reserved. Information herein deemed reliable but not guaranteed.
1-8-1 to 1-8-9 20232022Change20232022Change 20232022Change20232022Change Closed Sales 201718%3752-29% Closed Sales 9 15-40%1931-39% Median Sales Price $675,000$670,0001%$660,000$710,000-7% Median Sales Price $235,000$215,0009%$230,000$230,0000% Percent of Original List Price Received 95.2%100.0%-5%95.7%100.0%-4% Percent of Original List Price Received 98.8%100.0%-1%99.5%100.0%-1% Median Days on Market 7311564%5613331% Median Days on Market 4710370%27 9200% New Listings 2731-13%5763-10% New Listings 2527-7%3857-33% Pending Sales 1426-46%4259-29% Pending Sales 1534-56%2457-58% Active Inventory 7933139%- Active Inventory 472868%Total Inventory In Escrow 3052-42%- Total Inventory In Escrow 2353-57%-
Single-Family Homes February Year to Date Condos February Year to Date 586,000 630,000 647,000 675,000 630,000 630,000 660,000 650,000 700,000 690,000 720,000 670,000 739,000 745,000 740,000 721,000 680,000 650,000 656,000 684,500 736,000 702,500 640,000 675,000 $0 $100,000 $200,000 $300,000 $400,000 $500,000 $600,000 $700,000 $800,000 Mar-21 Apr-21 May-21 Jun-21 Jul-21 Aug-21 Sep-21 Oct-21 Nov-21 Dec-21 Jan-22 Feb-22 Mar-22 Apr-22 May-22 Jun-22 Jul-22 Aug-22 Sep-22 Oct-22 Nov-22 Dec-22 Jan-23 Feb-23
150,000 210,500 188,500 180,000 202,450 180,000 204,500 235,000 275,000 215,000 237,500 215,000 225,000 283,500 257,500 235,000 245,000 305,000 289,000 220,000 268,750 287,000 214,500 235,000 $0 $50,000 $100,000 $150,000 $200,000 $250,000 $300,000 $350,000 Mar-21 Apr-21 May-21 Jun-21 Jul-21 Aug-21 Sep-21 Oct-21 Nov-21 Dec-21 Jan-22 Feb-22 Mar-22 Apr-22 May-22 Jun-22 Jul-22 Aug-22 Sep-22 Oct-22 Nov-22 Dec-22 Jan-23 Feb-23
Sales
Condos 262930393729362928173517263227302125221412161720 0 5 10 15 20 25 30 35 40 45 Mar-21 Apr-21 May-21 Jun-21 Jul-21 Aug-21 Sep-21 Oct-21 Nov-21 Dec-21 Jan-22 Feb-22 Mar-22 Apr-22 May-22 Jun-22 Jul-22 Aug-22 Sep-22 Oct-22 Nov-22 Dec-22 Jan-23 Feb-23 Closed Sales: Single-Family Homes 17171628201628251725161537281823151415151619109 0 5 10 15 20 25 30 35 40 Mar-21 Apr-21 May-21 Jun-21 Jul-21 Aug-21 Sep-21 Oct-21 Nov-21 Dec-21 Jan-22 Feb-22 Mar-22 Apr-22 May-22 Jun-22 Jul-22 Aug-22 Sep-22 Oct-22 Nov-22 Dec-22 Jan-23 Feb-23 Closed Sales: Condos
Median
Price:
Median Sales Price: Single-Family Homes
Local Market Update
February 2023
SOURCE: Honolulu Board of REALTORS®, compiled from MLS data. ©Copyright 2023. Honolulu Board of REALTORS®. All Rights Reserved. Information herein deemed reliable but not guaranteed.
Makakilo 1-9-2 to 1-9-3 20232022Change20232022Change 20232022Change20232022Change Closed Sales 9 11-18%1327-52% Closed Sales 7 11-36%1527-44% Median Sales Price $850,000$1,020,000-17%$839,000$1,000,000-16% Median Sales Price $645,000$610,0006%$635,000$550,00015% Percent of Original List Price Received 97.1%101.6%-4%97.7%101.6%-4% Percent of Original List Price Received 100.0%103.3%-3%100.0% 102.2%-2% Median Days on Market 40 8400%4012233% Median Days on Market 58 9544%13 944% New Listings 9 18-50%1938-50% New Listings 1017-41%2036-44% Pending Sales 1214-14%2235-37% Pending Sales 1224-50%2236-39% Active Inventory 181429%- Active Inventory 14 6133%Total Inventory In Escrow 1322-41%- Total Inventory In Escrow 1927-30%-
Single-Family Homes February Year to Date Condos February Year to Date 880,000 840,000 835,000 927,000 974,500 1,100,000 997,500 955,000 963,821 1,000,000 994,000 1,020,000 990,000 1,240,000 922,500 1,113,000 930,000 1,150,000 1,050,000 944,000 850,000 1,010,000 804,500 850,000 $0 $200,000 $400,000 $600,000 $800,000 $1,000,000 $1,200,000 $1,400,000 Mar-21 Apr-21 May-21 Jun-21 Jul-21 Aug-21 Sep-21 Oct-21 Nov-21 Dec-21 Jan-22 Feb-22 Mar-22 Apr-22 May-22 Jun-22 Jul-22 Aug-22 Sep-22 Oct-22 Nov-22 Dec-22 Jan-23 Feb-23
475,200 446,500 465,000 513,500 535,000 512,750 491,000 496,050 515,000 526,500 537,500 610,000 551,000 553,001 622,500 555,000 512,000 570,000 528,000 560,000 610,000 551,000 523,000 645,000 $0 $100,000 $200,000 $300,000 $400,000 $500,000 $600,000 $700,000 Mar-21 Apr-21 May-21 Jun-21 Jul-21 Aug-21 Sep-21 Oct-21 Nov-21 Dec-21 Jan-22 Feb-22 Mar-22 Apr-22 May-22 Jun-22 Jul-22 Aug-22 Sep-22 Oct-22 Nov-22 Dec-22 Jan-23 Feb-23 Median Sales Price: Condos 171810198112214161916111317121813157105449 0 5 10 15 20 25 Mar-21 Apr-21 May-21 Jun-21 Jul-21 Aug-21 Sep-21 Oct-21 Nov-21 Dec-21 Jan-22 Feb-22 Mar-22 Apr-22 May-22 Jun-22 Jul-22 Aug-22 Sep-22 Oct-22 Nov-22 Dec-22 Jan-23 Feb-23 Closed Sales: Single-Family Homes 20141218101419102912161118161816111181191587 0 5 10 15 20 25 30 35 Mar-21 Apr-21 May-21 Jun-21 Jul-21 Aug-21 Sep-21 Oct-21 Nov-21 Dec-21 Jan-22 Feb-22 Mar-22 Apr-22 May-22 Jun-22 Jul-22 Aug-22 Sep-22 Oct-22 Nov-22 Dec-22 Jan-23 Feb-23 Closed Sales: Condos
Makiki - Moiliili
Local Market Update February 2023
Median Sales Price: Single-Family Homes
SOURCE: Honolulu Board of REALTORS®, compiled from MLS data.
1-2-4 to 1-2-9 (except 1-2-6) 20232022Change20232022Change 20232022Change20232022Change Closed Sales 2 8-75%9 15-40% Closed Sales 2056-64%45110-59% Median Sales Price $5,700,000$1,562,500265%$1,600,000$1,640,000-2% Median Sales Price $375,000$402,500-7%$382,000$398,750-4% Percent of Original List Price Received 93.7%102.2%-8%91.4%100.8%-9% Percent of Original List Price Received 95.7%99.7%-4%96.9%99.1%-2% Median Days on Market 28268%22220% Median Days on Market 5010400%3912225% New Listings 1214-14%252025% New Listings 5181-37%91166-45% Pending Sales 11 922%211450% Pending Sales 2975-61%59150-61% Active Inventory 24240%- Active Inventory 1129814%Total Inventory In Escrow 201811%- Total Inventory In Escrow 46110-58%-
Single-Family Homes February Year to Date Condos February Year to Date 1,602,500 1,295,000 1,350,000 1,411,000 1,375,000 1,500,000 1,450,000 1,550,000 1,642,500 1,398,000 1,650,000 1,562,500 1,575,000 1,800,000 1,940,000 1,525,000 1,425,000 1,460,750 1,310,000 1,734,500 1,350,000 1,800,000 1,435,000 5,700,000 $0 $1,000,000 $2,000,000 $3,000,000 $4,000,000 $5,000,000 $6,000,000 Mar-21 Apr-21 May-21 Jun-21 Jul-21 Aug-21 Sep-21 Oct-21 Nov-21 Dec-21 Jan-22 Feb-22 Mar-22 Apr-22 May-22 Jun-22 Jul-22 Aug-22 Sep-22 Oct-22 Nov-22 Dec-22 Jan-23 Feb-23
364,000 382,500 392,500 385,000 415,000 445,000 420,000 395,000 342,500 405,000 396,250 402,500 426,500 418,000 399,500 400,000 407,000 410,000 415,000 409,500 437,000 382,500 382,000 375,000 $0 $50,000 $100,000 $150,000 $200,000 $250,000 $300,000 $350,000 $400,000 $450,000 $500,000 Mar-21 Apr-21 May-21 Jun-21 Jul-21 Aug-21 Sep-21 Oct-21 Nov-21 Dec-21 Jan-22 Feb-22 Mar-22 Apr-22 May-22 Jun-22 Jul-22 Aug-22 Sep-22 Oct-22 Nov-22 Dec-22 Jan-23 Feb-23 Median Sales Price: Condos 12151919101517122215781213141211141165972 0 5 10 15 20 25 Mar-21 Apr-21 May-21 Jun-21 Jul-21 Aug-21 Sep-21 Oct-21 Nov-21 Dec-21 Jan-22 Feb-22 Mar-22 Apr-22 May-22 Jun-22 Jul-22 Aug-22 Sep-22 Oct-22 Nov-22 Dec-22 Jan-23 Feb-23 Closed Sales: Single-Family Homes 706352776359777264755456827490696155425434442520 0 10 20 30 40 50 60 70 80 90 100 Mar-21 Apr-21 May-21 Jun-21 Jul-21 Aug-21 Sep-21 Oct-21 Nov-21 Dec-21 Jan-22 Feb-22 Mar-22 Apr-22 May-22 Jun-22 Jul-22 Aug-22 Sep-22 Oct-22 Nov-22 Dec-22 Jan-23 Feb-23 Closed Sales: Condos
©Copyright
2023. Honolulu Board of REALTORS®. All Rights Reserved. Information herein deemed reliable but not guaranteed.
Median Sales Price: Single-Family Homes
Local Market Update
February 2023
Selected 1-9-4 to 1-9-5 20232022Change20232022Change 20232022Change20232022Change Closed Sales 4 9-56%6 25-76% Closed Sales 2132-34%3976-49% Median Sales Price $1,146,000$980,00017%$1,031,000$1,050,000-2% Median Sales Price $450,000$510,000-12%$460,000$512,500-10% Percent of Original List Price Received 93.5%100.0%-6%92.5%100.5%-8% Percent of Original List Price Received 100.0%103.9%-4%100.0% 103.2%-3% Median Days on Market 7314421%7314421% Median Days on Market 21 9133%19 9111% New Listings 5 18-72%2330-23% New Listings 2627-4%5360-12% Pending Sales 1219-37%2530-17% Pending Sales 2325-8%4457-23% Active Inventory 20 9122%- Active Inventory 3013131%Total Inventory In Escrow 2427-11%- Total Inventory In Escrow 3144-30%-
Mililani
Single-Family Homes February Year to Date Condos February Year to Date 1,026,500 919,000 925,000 960,000 1,092,500 915,000 1,216,000 965,000 1,070,000 950,000 1,050,000 980,000 1,096,491 1,045,000 1,110,000 1,080,000 1,065,000 1,200,000 1,110,000 1,051,000 1,075,000 1,275,000 947,500 1,146,000 $0 $200,000 $400,000 $600,000 $800,000 $1,000,000 $1,200,000 $1,400,000 Mar-21 Apr-21 May-21 Jun-21 Jul-21 Aug-21 Sep-21 Oct-21 Nov-21 Dec-21 Jan-22 Feb-22 Mar-22 Apr-22 May-22 Jun-22 Jul-22 Aug-22 Sep-22 Oct-22 Nov-22 Dec-22 Jan-23 Feb-23
410,000 435,000 435,000 468,500 477,000 485,000 505,000 511,000 525,000 469,000 512,500 510,000 515,000 501,000 536,250 520,000 552,500 566,250 560,000 565,000 523,000 533,000 467,500 450,000 $0 $100,000 $200,000 $300,000 $400,000 $500,000 $600,000 Mar-21 Apr-21 May-21 Jun-21 Jul-21 Aug-21 Sep-21 Oct-21 Nov-21 Dec-21 Jan-22 Feb-22 Mar-22 Apr-22 May-22 Jun-22 Jul-22 Aug-22 Sep-22 Oct-22 Nov-22 Dec-22 Jan-23 Feb-23 Median Sales Price: Condos 2416151724162118211516921152427131619167824 0 5 10 15 20 25 30 Mar-21 Apr-21 May-21 Jun-21 Jul-21 Aug-21 Sep-21 Oct-21 Nov-21 Dec-21 Jan-22 Feb-22 Mar-22 Apr-22 May-22 Jun-22 Jul-22 Aug-22 Sep-22 Oct-22 Nov-22 Dec-22 Jan-23 Feb-23 Closed Sales: Single-Family Homes 313535524143414039274432373138283632372327241821 0 10 20 30 40 50 60 Mar-21 Apr-21 May-21 Jun-21 Jul-21 Aug-21 Sep-21 Oct-21 Nov-21 Dec-21 Jan-22 Feb-22 Mar-22 Apr-22 May-22 Jun-22 Jul-22 Aug-22 Sep-22 Oct-22 Nov-22 Dec-22 Jan-23 Feb-23 Closed Sales: Condos
©Copyright 2023. Honolulu Board of REALTORS®.
Rights Reserved.
SOURCE: Honolulu Board of REALTORS®, compiled from MLS data.
All
Information herein deemed reliable but not guaranteed.
Moanalua - Salt Lake
Local Market Update
February 2023
Median Sales Price: Single-Family Homes
SOURCE: Honolulu Board of REALTORS®, compiled from MLS data. ©Copyright 2023. Honolulu Board of REALTORS®. All Rights Reserved. Information herein deemed reliable but not guaranteed.
1-1-1 20232022Change20232022Change 20232022Change20232022Change Closed Sales 0 1-100%1 6-83% Closed Sales 8 24-67%1540-63% Median Sales Price -$1,430,000-$953,888$1,117,500-15% Median Sales Price $395,000$450,000-12%$440,000$446,500-1% Percent of Original List Price Received -105.9%-95.9%107.9%-11% Percent of Original List Price Received 99.0%99.6%-1%99.1%100.0%-1% Median Days on Market - 5-1015-33% Median Days on Market 1219-37%1217-29% New Listings 4 6-33%6 9-33% New Listings 1844-59%2963-54% Pending Sales 5 7-29%7 9-22% Pending Sales 1330-57%2543-42% Active Inventory 4 333%- Active Inventory 2132-34%Total Inventory In Escrow 9 813%- Total Inventory In Escrow 2039-49%-
Single-Family Homes February Year to Date Condos February Year to Date 880,000 940,000 1,139,500 952,500 1,056,000 1,110,000 1,162,500 1,200,000 951,000 1,150,000 1,105,000 1,430,000 1,420,000 1,150,000 1,201,000 1,300,000 1,087,500 1,100,000 1,200,000 1,220,000 1,110,000 874,500 953,888 0 $0 $200,000 $400,000 $600,000 $800,000 $1,000,000 $1,200,000 $1,400,000 $1,600,000 Mar-21 Apr-21 May-21 Jun-21 Jul-21 Aug-21 Sep-21 Oct-21 Nov-21 Dec-21 Jan-22 Feb-22 Mar-22 Apr-22 May-22 Jun-22 Jul-22 Aug-22 Sep-22 Oct-22 Nov-22 Dec-22 Jan-23 Feb-23
419,000 355,000 400,000 426,000 415,000 442,500 380,000 407,000 432,000 435,000 441,000 450,000 470,000 435,250 442,500 440,000 470,000 430,000 428,000 508,500 410,000 425,000 445,000 395,000 $0 $100,000 $200,000 $300,000 $400,000 $500,000 $600,000 Mar-21 Apr-21 May-21 Jun-21 Jul-21 Aug-21 Sep-21 Oct-21 Nov-21 Dec-21 Jan-22 Feb-22 Mar-22 Apr-22 May-22 Jun-22 Jul-22 Aug-22 Sep-22 Oct-22 Nov-22 Dec-22 Jan-23 Feb-23 Median Sales Price: Condos 5664596541151537525957210 0 2 4 6 8 10 12 Mar-21 Apr-21 May-21 Jun-21 Jul-21 Aug-21 Sep-21 Oct-21 Nov-21 Dec-21 Jan-22 Feb-22 Mar-22 Apr-22 May-22 Jun-22 Jul-22 Aug-22 Sep-22 Oct-22 Nov-22 Dec-22 Jan-23 Feb-23 Closed Sales: Single-Family Homes 2923222331322026232616242824342913212769978 0 5 10 15 20 25 30 35 40 Mar-21 Apr-21 May-21 Jun-21 Jul-21 Aug-21 Sep-21 Oct-21 Nov-21 Dec-21 Jan-22 Feb-22 Mar-22 Apr-22 May-22 Jun-22 Jul-22 Aug-22 Sep-22 Oct-22 Nov-22 Dec-22 Jan-23 Feb-23 Closed Sales: Condos
North Shore
Local Market Update
February 2023
Median Sales Price: Single-Family Homes
SOURCE: Honolulu Board of REALTORS®, compiled from MLS data. ©Copyright 2023. Honolulu Board of REALTORS®. All Rights Reserved. Information herein deemed reliable but not guaranteed.
1-5-6 to 1-6-9 20232022Change20232022Change 20232022Change20232022Change Closed Sales 8 560%1114-21% Closed Sales 2 8-75%5 13-62% Median Sales Price $1,292,750$1,750,000-26%$1,389,000$1,700,000-18% Median Sales Price $682,500$1,057,500-35%$875,000$850,0003% Percent of Original List Price Received 95.9%100.7%-5%95.9%96.8%-1% Percent of Original List Price Received 90.6%100.0%-9%94.6%100.0%-5% Median Days on Market 52 9478%564137% Median Days on Market 10812800%4111273% New Listings 6 9-33%1025-60% New Listings 2 11-82%6 22-73% Pending Sales 7 15-53%1526-42% Pending Sales 5 13-62%8 20-60% Active Inventory 251932%- Active Inventory 4 7-43%Total Inventory In Escrow 1025-60%- Total Inventory In Escrow 7 16-56%-
February Year to Date Condos February Year to Date 1,620,000 2,100,000 1,340,000 1,350,000 1,505,000 1,397,500 1,722,500 962,000 1,300,000 1,475,000 1,650,000 1,750,000 1,822,500 2,135,900 2,075,000 1,400,000 2,001,250 1,212,500 1,050,000 1,580,000 2,367,500 1,785,000 1,389,000 1,292,750 $0 $500,000 $1,000,000 $1,500,000 $2,000,000 $2,500,000 Mar-21 Apr-21 May-21 Jun-21 Jul-21 Aug-21 Sep-21 Oct-21 Nov-21 Dec-21 Jan-22 Feb-22 Mar-22 Apr-22 May-22 Jun-22 Jul-22 Aug-22 Sep-22 Oct-22 Nov-22 Dec-22 Jan-23 Feb-23
Single-Family Homes
408,500 594,500 410,000 410,000 350,000 498,000 646,000 860,000 417,000 523,000 850,000 1,057,500 805,000 505,000 1,440,000 786,250 885,000 704,450 930,000 1,217,277 725,000 732,000 1,135,000 682,500 $0 $200,000 $400,000 $600,000 $800,000 $1,000,000 $1,200,000 $1,400,000 $1,600,000 Mar-21 Apr-21 May-21 Jun-21 Jul-21 Aug-21 Sep-21 Oct-21 Nov-21 Dec-21 Jan-22 Feb-22 Mar-22 Apr-22 May-22 Jun-22 Jul-22 Aug-22 Sep-22 Oct-22 Nov-22 Dec-22 Jan-23 Feb-23 Median Sales Price: Condos 18172176151245119510178131210755838 0 5 10 15 20 25 Mar-21 Apr-21 May-21 Jun-21 Jul-21 Aug-21 Sep-21 Oct-21 Nov-21 Dec-21 Jan-22 Feb-22 Mar-22 Apr-22 May-22 Jun-22 Jul-22 Aug-22 Sep-22 Oct-22 Nov-22 Dec-22 Jan-23 Feb-23 Closed Sales: Single-Family Homes 4419534538589746104471232 0 2 4 6 8 10 12 Mar-21 Apr-21 May-21 Jun-21 Jul-21 Aug-21 Sep-21 Oct-21 Nov-21 Dec-21 Jan-22 Feb-22 Mar-22 Apr-22 May-22 Jun-22 Jul-22 Aug-22 Sep-22 Oct-22 Nov-22 Dec-22 Jan-23 Feb-23 Closed Sales: Condos
Pearl City - Aiea
Local Market Update February 2023 Single-Family
Median Sales Price: Single-Family Homes
SOURCE: Honolulu Board of REALTORS®, compiled from MLS data. ©Copyright 2023. Honolulu Board of REALTORS®. All Rights Reserved. Information herein deemed reliable but not guaranteed.
1-9-6 to 1-9-9 20232022Change20232022Change 20232022Change20232022Change Closed Sales 1719-11%3133-6% Closed Sales 1625-36%3466-48% Median Sales Price $905,000$1,030,000-12%$885,000$1,070,000-17% Median Sales Price $384,000$435,000-12%$415,000$451,500-8% Percent of Original List Price Received 98.4%101.1%-3%98.4%101.6%-3% Percent of Original List Price Received 99.3%100.2%-1%100.0%100.0%0% Median Days on Market 1013-23%1112-8% Median Days on Market 331974%1016-38% New Listings 191619%38366% New Listings 2131-32%4760-22% Pending Sales 18180%44432%Pending Sales 26260%4462-29% Active Inventory 2412100%- Active Inventory 292421%Total Inventory In Escrow 2634-24%- Total Inventory In Escrow 3446-26%-
Homes February Year to Date Condos February Year to Date 910,000 885,000 942,000 920,000 985,000 905,000 1,013,000 1,000,000 1,020,000 1,035,000 1,123,500 1,030,000 1,023,000 1,030,000 1,162,500 1,071,000 1,128,500 1,100,000 1,012,500 1,060,000 987,250 986,000 850,000 905,000 $0 $200,000 $400,000 $600,000 $800,000 $1,000,000 $1,200,000 $1,400,000 Mar-21 Apr-21 May-21 Jun-21 Jul-21 Aug-21 Sep-21 Oct-21 Nov-21 Dec-21 Jan-22 Feb-22 Mar-22 Apr-22 May-22 Jun-22 Jul-22 Aug-22 Sep-22 Oct-22 Nov-22 Dec-22 Jan-23 Feb-23
411,000 447,000 429,250 457,000 432,000 410,000 460,000 530,000 460,000 405,000 459,000 435,000 480,000 455,000 515,000 499,000 475,000 495,000 432,500 472,500 470,000 540,000 497,000 384,000 $0 $100,000 $200,000 $300,000 $400,000 $500,000 $600,000 Mar-21 Apr-21 May-21 Jun-21 Jul-21 Aug-21 Sep-21 Oct-21 Nov-21 Dec-21 Jan-22 Feb-22 Mar-22 Apr-22 May-22 Jun-22 Jul-22 Aug-22 Sep-22 Oct-22 Nov-22 Dec-22 Jan-23 Feb-23 Median Sales Price: Condos 191723292522202926221419232116212214222114161417 0 5 10 15 20 25 30 35 Mar-21 Apr-21 May-21 Jun-21 Jul-21 Aug-21 Sep-21 Oct-21 Nov-21 Dec-21 Jan-22 Feb-22 Mar-22 Apr-22 May-22 Jun-22 Jul-22 Aug-22 Sep-22 Oct-22 Nov-22 Dec-22 Jan-23 Feb-23 Closed Sales: Single-Family Homes 393832433832513727314125314641333931282920211816 0 10 20 30 40 50 60 Mar-21 Apr-21 May-21 Jun-21 Jul-21 Aug-21 Sep-21 Oct-21 Nov-21 Dec-21 Jan-22 Feb-22 Mar-22 Apr-22 May-22 Jun-22 Jul-22 Aug-22 Sep-22 Oct-22 Nov-22 Dec-22 Jan-23 Feb-23 Closed Sales: Condos
SOURCE: Honolulu Board of REALTORS®, compiled from MLS data.
Local Market Update
February 2023
Wahiawa 1-7-1 to 1-7-7 20232022Change20232022Change 20232022Change20232022Change Closed Sales 4 5-20%8 12-33% Closed Sales 1 10%2 5-60% Median Sales Price $750,000$876,000-14%$765,000$900,500-15% Median Sales Price $101,266$130,000-22%$176,633$130,00036% Percent of Original List Price Received 95.2%104.3%-9%93.2%103.9%-10% Percent of Original List Price Received 96.9%100.0%-3%98.9%100.0%-1% Median Days on Market 3912225%4612283% Median Days on Market 3444-23%221638% New Listings 4 6-33%8 16-50% New Listings 1 0-4 40% Pending Sales 2 7-71%6 10-40% Pending Sales 1 10%4 333% Active Inventory 11 757%- Active Inventory 2 3-33%Total Inventory In Escrow 7 11-36%- Total Inventory In Escrow 4 40%-
Single-Family Homes February Year to Date Condos February Year to Date 692,500 780,000 798,500 765,000 722,500 732,050 840,000 800,000 845,000 840,000 925,000 876,000 950,000 888,000 942,500 922,500 777,500 930,000 732,500 880,500 808,000 820,000 837,000 750,000 $0 $100,000 $200,000 $300,000 $400,000 $500,000 $600,000 $700,000 $800,000 $900,000 $1,000,000 Mar-21 Apr-21 May-21 Jun-21 Jul-21 Aug-21 Sep-21 Oct-21 Nov-21 Dec-21 Jan-22 Feb-22 Mar-22 Apr-22 May-22 Jun-22 Jul-22 Aug-22 Sep-22 Oct-22 Nov-22 Dec-22 Jan-23 Feb-23
220,000 227,000 270,000 270,000 287,500 273,000 310,000 220,000 191,500 0 132,000 130,000 260,000 162,500 285,000 325,000 340,000 316,500 261,590 149,000 278,685 232,500 252,000 101,266 $0 $50,000 $100,000 $150,000 $200,000 $250,000 $300,000 $350,000 $400,000 Mar-21 Apr-21 May-21 Jun-21 Jul-21 Aug-21 Sep-21 Oct-21 Nov-21 Dec-21 Jan-22 Feb-22 Mar-22 Apr-22 May-22 Jun-22 Jul-22 Aug-22 Sep-22 Oct-22 Nov-22 Dec-22 Jan-23 Feb-23 Median Sales Price: Condos 1096988131110675651041213269744 0 2 4 6 8 10 12 14 Mar-21 Apr-21 May-21 Jun-21 Jul-21 Aug-21 Sep-21 Oct-21 Nov-21 Dec-21 Jan-22 Feb-22 Mar-22 Apr-22 May-22 Jun-22 Jul-22 Aug-22 Sep-22 Oct-22 Nov-22 Dec-22 Jan-23 Feb-23 Closed Sales: Single-Family Homes 341545352041223254333211 0 1 2 3 4 5 6 Mar-21 Apr-21 May-21 Jun-21 Jul-21 Aug-21 Sep-21 Oct-21 Nov-21 Dec-21 Jan-22 Feb-22 Mar-22 Apr-22 May-22 Jun-22 Jul-22 Aug-22 Sep-22 Oct-22 Nov-22 Dec-22 Jan-23 Feb-23 Closed Sales: Condos
Median Sales Price: Single-Family Homes
Honolulu
©Copyright 2023.
Board of REALTORS®. All Rights Reserved. Information herein deemed reliable but not guaranteed.
Waialae - Kahala
Local Market Update February 2023 Single-Family
Median Sales Price: Single-Family Homes
1-3-5 20232022Change20232022Change 20232022Change20232022Change Closed Sales 9 90%1011-9% Closed Sales 1 4-75%3 10-70% Median Sales Price $2,960,000$2,980,000-1%$2,730,000$2,750,000-1% Median Sales Price $580,000$714,000-19%$580,000$649,000-11% Percent of Original List Price Received 97.0%96.1%1%95.7%100.0%-4% Percent of Original List Price Received 96.7%100.1%-3%98.7%100.5%-2% Median Days on Market 8030167%7617347% Median Days on Market 4 33-88%11110% New Listings 5 8-38%1017-41% New Listings 5 9-44%8 13-38% Pending Sales 8 633%171421% Pending Sales 4 7-43%6 12-50% Active Inventory 211724%- Active Inventory 6 60%Total Inventory In Escrow 10100%- Total Inventory In Escrow 5 8-38%-
Homes February Year to Date Condos February Year to Date 3,462,500 2,050,000 2,336,155 2,320,000 2,180,000 2,280,000 2,110,500 2,825,000 2,825,000 2,740,000 2,115,000 2,980,000 1,875,000 2,375,000 3,220,000 2,050,000 3,125,000 2,600,000 2,425,000 2,450,000 1,627,500 2,384,549 1,085,000 2,960,000 $0 $500,000 $1,000,000 $1,500,000 $2,000,000 $2,500,000 $3,000,000 $3,500,000 $4,000,000 Mar-21 Apr-21 May-21 Jun-21 Jul-21 Aug-21 Sep-21 Oct-21 Nov-21 Dec-21 Jan-22 Feb-22 Mar-22 Apr-22 May-22 Jun-22 Jul-22 Aug-22 Sep-22 Oct-22 Nov-22 Dec-22 Jan-23 Feb-23
535,000 601,163 570,000 105,000 550,000 370,000 599,000 600,000 570,000 650,000 572,500 714,000 660,000 720,000 375,000 532,500 645,000 337,500 650,000 685,000 168,500 610,000 395,000 580,000 $0 $100,000 $200,000 $300,000 $400,000 $500,000 $600,000 $700,000 $800,000 Mar-21 Apr-21 May-21 Jun-21 Jul-21 Aug-21 Sep-21 Oct-21 Nov-21 Dec-21 Jan-22 Feb-22 Mar-22 Apr-22 May-22 Jun-22 Jul-22 Aug-22 Sep-22 Oct-22 Nov-22 Dec-22 Jan-23 Feb-23 Median Sales Price: Condos 1013102061761412122989107991036619 0 5 10 15 20 25 Mar-21 Apr-21 May-21 Jun-21 Jul-21 Aug-21 Sep-21 Oct-21 Nov-21 Dec-21 Jan-22 Feb-22 Mar-22 Apr-22 May-22 Jun-22 Jul-22 Aug-22 Sep-22 Oct-22 Nov-22 Dec-22 Jan-23 Feb-23 Closed Sales: Single-Family Homes 91161194434564576648313521 0 2 4 6 8 10 12 Mar-21 Apr-21 May-21 Jun-21 Jul-21 Aug-21 Sep-21 Oct-21 Nov-21 Dec-21 Jan-22 Feb-22 Mar-22 Apr-22 May-22 Jun-22 Jul-22 Aug-22 Sep-22 Oct-22 Nov-22 Dec-22 Jan-23 Feb-23 Closed Sales: Condos
Honolulu Board of REALTORS®, compiled from MLS data. ©Copyright 2023. Honolulu Board of REALTORS®. All Rights Reserved. Information herein deemed reliable but not guaranteed.
SOURCE:
Median Sales Price: Single-Family Homes
Local Market Update February 2023
SOURCE: Honolulu Board of REALTORS®, compiled from MLS data. ©Copyright 2023. Honolulu Board of REALTORS®. All Rights Reserved. Information herein deemed reliable but not guaranteed.
Waikiki 1-2-6 20232022Change20232022Change 20232022Change20232022Change Closed Sales 0 0-0 0- Closed Sales 93100-7%154201-23% Median Sales Price - Median Sales Price $390,000$382,5002%$403,750$403,0000% Percent of Original List Price Received - Percent of Original List Price Received 96.7%98.2%-2%96.6%97.9%-1% Median Days on Market - Median Days on Market 251932%2627-4% New Listings 0 0-0 0- New Listings 100170-41%229341-33% Pending Sales 0 0-0 0- Pending Sales 84140-40%174261-33% Active Inventory 0 0-- Active Inventory 3813674%Total Inventory In Escrow 0 1-100%- Total Inventory In Escrow 127197-36%-
Single-Family Homes February Year to Date Condos February Year to Date 1,100,000 0 1,075,000 0 0 1,880,000 0 0 0 0 0 0 1,500,000 0 0 0 0 0 0 1,975,000 0 0 0 0 $0 $500,000 $1,000,000 $1,500,000 $2,000,000 $2,500,000 Mar-21 Apr-21 May-21 Jun-21 Jul-21 Aug-21 Sep-21 Oct-21 Nov-21 Dec-21 Jan-22 Feb-22 Mar-22 Apr-22 May-22 Jun-22 Jul-22 Aug-22 Sep-22 Oct-22 Nov-22 Dec-22 Jan-23 Feb-23
416,000 400,000 350,500 409,000 390,000 452,400 418,350 425,000 424,044 446,500 424,000 382,500 442,500 460,000 420,000 515,000 442,000 340,000 437,000 381,500 387,000 440,000 412,000 390,000 $0 $100,000 $200,000 $300,000 $400,000 $500,000 $600,000 Mar-21 Apr-21 May-21 Jun-21 Jul-21 Aug-21 Sep-21 Oct-21 Nov-21 Dec-21 Jan-22 Feb-22 Mar-22 Apr-22 May-22 Jun-22 Jul-22 Aug-22 Sep-22 Oct-22 Nov-22 Dec-22 Jan-23 Feb-23 Median Sales Price: Condos 101001000000100000010000 0 0.2 0.4 0.6 0.8 1 1.2 Mar-21 Apr-21 May-21 Jun-21 Jul-21 Aug-21 Sep-21 Oct-21 Nov-21 Dec-21 Jan-22 Feb-22 Mar-22 Apr-22 May-22 Jun-22 Jul-22 Aug-22 Sep-22 Oct-22 Nov-22 Dec-22 Jan-23 Feb-23 Closed Sales: Single-Family Homes 120127136126138148107115122114101100132143136133104103929667776193 0 20 40 60 80 100 120 140 160 Mar-21 Apr-21 May-21 Jun-21 Jul-21 Aug-21 Sep-21 Oct-21 Nov-21 Dec-21 Jan-22 Feb-22 Mar-22 Apr-22 May-22 Jun-22 Jul-22 Aug-22 Sep-22 Oct-22 Nov-22 Dec-22 Jan-23 Feb-23 Closed Sales: Condos
Median Sales Price: Single-Family Homes
Local Market Update
February 2023
SOURCE: Honolulu Board of REALTORS®, compiled from MLS data. ©Copyright 2023. Honolulu Board of REALTORS®. All Rights Reserved. Information herein deemed reliable but not guaranteed.
Waipahu 1-9-4 20232022Change20232022Change 20232022Change20232022Change Closed Sales 3 14-79%1837-51% Closed Sales 7 11-36%2036-44% Median Sales Price $888,000$974,986-9%$915,000$905,0001% Median Sales Price $375,000$485,500-23%$497,000$487,7502% Percent of Original List Price Received 98.8%100.8%-2%99.9%102.3%-2% Percent of Original List Price Received 100.0%102.0%-2%100.0% 101.9%-2% Median Days on Market 6014329%151050% Median Days on Market 12 6100%13 944% New Listings 1222-45%2437-35% New Listings 1218-33%2541-39% Pending Sales 1516-6%2831-10% Pending Sales 1119-42%2236-39% Active Inventory 281765%- Active Inventory 151136%Total Inventory In Escrow 2830-7%- Total Inventory In Escrow 2031-35%-
Single-Family Homes February Year to Date Condos February Year to Date 830,000 800,000 864,500 837,500 860,000 890,000 880,000 880,500 910,000 950,000 840,000 974,986 950,000 960,000 1,050,000 980,000 1,015,000 976,250 879,500 880,000 915,000 922,500 935,000 888,000 $0 $200,000 $400,000 $600,000 $800,000 $1,000,000 $1,200,000 Mar-21 Apr-21 May-21 Jun-21 Jul-21 Aug-21 Sep-21 Oct-21 Nov-21 Dec-21 Jan-22 Feb-22 Mar-22 Apr-22 May-22 Jun-22 Jul-22 Aug-22 Sep-22 Oct-22 Nov-22 Dec-22 Jan-23 Feb-23
437,000 430,000 440,000 450,000 452,500 505,000 435,000 503,500 460,000 475,000 490,000 485,500 510,000 537,500 530,000 505,000 527,000 544,000 497,000 520,000 501,000 542,500 510,000 375,000 $0 $100,000 $200,000 $300,000 $400,000 $500,000 $600,000 Mar-21 Apr-21 May-21 Jun-21 Jul-21 Aug-21 Sep-21 Oct-21 Nov-21 Dec-21 Jan-22 Feb-22 Mar-22 Apr-22 May-22 Jun-22 Jul-22 Aug-22 Sep-22 Oct-22 Nov-22 Dec-22 Jan-23 Feb-23
Sales
Condos 13172220292523202627231417252327211810131710153 0 5 10 15 20 25 30 35 Mar-21 Apr-21 May-21 Jun-21 Jul-21 Aug-21 Sep-21 Oct-21 Nov-21 Dec-21 Jan-22 Feb-22 Mar-22 Apr-22 May-22 Jun-22 Jul-22 Aug-22 Sep-22 Oct-22 Nov-22 Dec-22 Jan-23 Feb-23 Closed Sales: Single-Family Homes 1930192322192216271725112216251817182313116137 0 5 10 15 20 25 30 35 Mar-21 Apr-21 May-21 Jun-21 Jul-21 Aug-21 Sep-21 Oct-21 Nov-21 Dec-21 Jan-22 Feb-22 Mar-22 Apr-22 May-22 Jun-22 Jul-22 Aug-22 Sep-22 Oct-22 Nov-22 Dec-22 Jan-23 Feb-23 Closed Sales: Condos
Median
Price:
Windward Coast
Local Market Update
February 2023
Median Sales Price: Single-Family Homes
SOURCE: Honolulu Board of REALTORS®, compiled from MLS data. ©Copyright 2023. Honolulu Board of REALTORS®. All Rights Reserved. Information herein deemed reliable but not guaranteed.
1-4-8 to 1-5-5 20232022Change20232022Change 20232022Change20232022Change Closed Sales 3 6-50%5 10-50% Closed Sales 1 4-75%1 4-75% Median Sales Price $1,080,000$1,477,500-27%$1,080,000$1,585,000-32% Median Sales Price $475,000$220,000116%$475,000$220,000116% Percent of Original List Price Received 87.3%97.7%-11%100.0%97.7%2% Percent of Original List Price Received 96.0%94.5%2%96.0%94.5% 2% Median Days on Market 1175-85%1175-85% Median Days on Market 2846-39%2846-39% New Listings 2 7-71%9 18-50% New Listings 3 30%3 7-57% Pending Sales 3 6-50%1017-41% Pending Sales 1 10%2 6-67% Active Inventory 1215-20%- Active Inventory 4 40%Total Inventory In Escrow 9 13-31%- Total Inventory In Escrow 5 425%-
Single-Family Homes February Year to Date Condos February Year to Date 988,000 912,500 910,750 655,000 1,255,000 1,009,500 846,500 1,337,500 1,200,000 810,000 2,085,000 1,477,500 1,155,000 1,175,000 1,435,000 1,050,000 1,437,500 1,890,000 900,000 1,260,000 1,047,500 1,042,000 1,095,000 1,080,000 $0 $500,000 $1,000,000 $1,500,000 $2,000,000 $2,500,000 Mar-21 Apr-21 May-21 Jun-21 Jul-21 Aug-21 Sep-21 Oct-21 Nov-21 Dec-21 Jan-22 Feb-22 Mar-22 Apr-22 May-22 Jun-22 Jul-22 Aug-22 Sep-22 Oct-22 Nov-22 Dec-22 Jan-23 Feb-23
150,860 375,000 97,500 360,000 256,000 137,000 321,000 290,025 268,250 80,000 0 220,000 465,000 420,000 408,450 471,056 495,000 435,000 308,750 460,000 420,000 98,000 0 475,000 $0 $100,000 $200,000 $300,000 $400,000 $500,000 $600,000 Mar-21 Apr-21 May-21 Jun-21 Jul-21 Aug-21 Sep-21 Oct-21 Nov-21 Dec-21 Jan-22 Feb-22 Mar-22 Apr-22 May-22 Jun-22 Jul-22 Aug-22 Sep-22 Oct-22 Nov-22 Dec-22 Jan-23 Feb-23 Median Sales Price: Condos 1181471014469546946543354223 0 2 4 6 8 10 12 14 16 Mar-21 Apr-21 May-21 Jun-21 Jul-21 Aug-21 Sep-21 Oct-21 Nov-21 Dec-21 Jan-22 Feb-22 Mar-22 Apr-22 May-22 Jun-22 Jul-22 Aug-22 Sep-22 Oct-22 Nov-22 Dec-22 Jan-23 Feb-23 Closed Sales: Single-Family Homes 5559811452104312413233501 0 2 4 6 8 10 12 Mar-21 Apr-21 May-21 Jun-21 Jul-21 Aug-21 Sep-21 Oct-21 Nov-21 Dec-21 Jan-22 Feb-22 Mar-22 Apr-22 May-22 Jun-22 Jul-22 Aug-22 Sep-22 Oct-22 Nov-22 Dec-22 Jan-23 Feb-23 Closed Sales: Condos
Oahu - Islandwide
Local Market Update
February 2023
Median Sales Price: Single-Family Homes
SOURCE: Honolulu Board of REALTORS®, compiled from MLS data. ©Copyright 2023. Honolulu Board of REALTORS®. All Rights Reserved. Information herein deemed reliable but not guaranteed.
20232022Change20232022Change 20232022Change20232022Change Closed Sales 173241-28%323567-43% Closed Sales 325486-33%6001,038-42% Median Sales Price $987,000$1,125,000-12%$980,000$1,084,250-10% Median Sales Price $480,000$497,000-3%$485,000$500,000-3% Percent of Original List Price Received 96.0%100.8%-5%95.9%101.2%-5% Percent of Original List Price Received 98.0%100.0%-2%98.1%100.0%-2% Median Days on Market 4713262%3512192% Median Days on Market 2814100%261486% New Listings 233367-37%501687-27% New Listings 463739-37%9861,405-30% Pending Sales 217316-31%484631-23% Pending Sales 399643-38%7771,217-36% Active Inventory 54734857%- Active Inventory 1,17798919%Total Inventory In Escrow 386544-29%- Total Inventory In Escrow 592946-37%-
Single-Family Homes February Year to Date Condos February Year to Date 950,000 928,000 978,000 979,000 992,500 1,050,000 1,050,000 1,000,000 1,050,000 1,050,000 1,050,000 1,125,000 1,150,000 1,105,000 1,153,500 1,100,000 1,107,944 1,125,500 1,100,000 1,050,000 1,149,500 1,049,500 970,000 987,000 $0 $200,000 $400,000 $600,000 $800,000 $1,000,000 $1,200,000 $1,400,000 Mar-21 Apr-21 May-21 Jun-21 Jul-21 Aug-21 Sep-21 Oct-21 Nov-21 Dec-21 Jan-22 Feb-22 Mar-22 Apr-22 May-22 Jun-22 Jul-22 Aug-22 Sep-22 Oct-22 Nov-22 Dec-22 Jan-23 Feb-23
451,000 450,000 457,750 460,000 475,000 500,000 478,000 500,000 500,000 485,000 510,000 497,000 515,500 510,000 516,500 534,000 500,000 498,500 502,500 520,000 480,000 502,500 495,000 480,000 $400,000 $420,000 $440,000 $460,000 $480,000 $500,000 $520,000 $540,000 $560,000 Mar-21 Apr-21 May-21 Jun-21 Jul-21 Aug-21 Sep-21 Oct-21 Nov-21 Dec-21 Jan-22 Feb-22 Mar-22 Apr-22 May-22 Jun-22 Jul-22 Aug-22 Sep-22 Oct-22 Nov-22 Dec-22 Jan-23 Feb-23 Median Sales Price: Condos 361375405451404425424381371378326241321365344357312314278222192202150173 0 50 100 150 200 250 300 350 400 450 500 Mar-21 Apr-21 May-21 Jun-21 Jul-21 Aug-21 Sep-21 Oct-21 Nov-21 Dec-21 Jan-22 Feb-22 Mar-22 Apr-22 May-22 Jun-22 Jul-22 Aug-22 Sep-22 Oct-22 Nov-22 Dec-22 Jan-23 Feb-23 Closed Sales: Single-Family Homes 626645598730671675615611601593552486672672688626518508496435340360275325 0 100 200 300 400 500 600 700 800 Mar-21 Apr-21 May-21 Jun-21 Jul-21 Aug-21 Sep-21 Oct-21 Nov-21 Dec-21 Jan-22 Feb-22 Mar-22 Apr-22 May-22 Jun-22 Jul-22 Aug-22 Sep-22 Oct-22 Nov-22 Dec-22 Jan-23 Feb-23 Closed Sales: Condos
Single Family Homes Sold - February 2023 vs 2022 (Residential resales data, based on region and neighborhood groupings as listed in MLS)
SOURCE: Honolulu Board of REALTORS®, compiled from MLS data. ©2023. Honolulu Board of REALTORS®. All Rights Reserved. Information herein deemed reliable but not guaranteed.

Note: YTD sold counts reflect combined monthly "snapshots" of the reported MLS data from Jan. 1 to the end of the currently reported month. February February February February YTD YTD YTD YTD 2023 Median 2022 Median +/- +/- 2023 Sold 2022 Sold +/- +/- 2023 Median 2022 Median +/- +/- 2023 Sold 2022 Sold +/- +/Central Region LAUNANI VALLEY 947,500 $ ---- 2---- 947,500 $ ---- 2---MILILANI AREA 1,146,000 $ 980,000 $ 16.9%166,000 $ 4 5-20.0%-1 1,031,000 $ 1,047,500 $ -1.6%(16,500) $ 6 16-62.5%-10 MILILANI MAUKA 1,466,250 $ ---- 2---- 1,267,000 $ ---- 5---WAHIAWA AREA 750,000 $ 668,000 $ 12.3%82,000 $ 3 1200.0%2 765,000 $ 862,000 $ -11.3%(97,000) $ 6 450.0%2 WAHIAWA HEIGHTS 1,377,500 $ ---- 2---- 950,000 $ 1,005,000 $ -5.5%(55,000) $ 1 5-80.0%-4 WAHIAWA PARK 850,000 $ ---- 1---- 852,500 $ ---- 2---WAIPIO ACRES/WAIKALANI WOODLANDS 983,000 $ ---- 2---WHITMORE VILLAGE 750,000 $ 876,000 $ -14.4%(126,000) $ 1 10.0%0 750,000 $ 876,000 $ -14.4%(126,000) $ 1 10.0%0 Central Region 880,000 $ 967,500 $ -9.0%(87,500) $ 8 14-42.9%-6 880,000 $ 1,000,000 $ -12.0%(120,000) $ 14 37-62.2%-23 Diamond Head Region AINA HAINA AREA 2,250,000 $ ---- 1---- 2,250,000 $ ---- 1---DIAMOND HEAD 5,000,000 $ 5,025,000 $ -0.5%(25,000) $ 1 3-66.7%-2 5,000,000 $ 4,862,500 $ 2.8%137,500 $ 1 6-83.3%-5 HAWAII LOA RIDGE 4,290,000 $ 3,675,000 $ 16.7%615,000 $ 2 20.0%0 2,929,000 $ 3,675,000 $ -20.3%(746,000) $ 4 2100.0%2 KAHALA AREA 3,290,000 $ 3,350,000 $ -1.8%(60,000) $ 4 333.3%1 3,290,000 $ 3,350,000 $ -1.8%(60,000) $ 4 333.3%1 KAHALA-PUUPANINI 2,202,500 $ 3,025,000 $ -27.2%(822,500) $ 2 1100.0%1 1,840,000 $ 2,512,500 $ -26.8%(672,500) $ 3 250.0%1 KAI NANI 8,250,000 $ ---- 1---- 8,250,000 $ ---- 1---KAIMUKI 1,112,500 $ 1,150,000 $ -3.3%(37,500) $ 2 1100.0%1 1,112,500 $ 1,170,000 $ -4.9%(57,500) $ 2 6-66.7%-4 KALANI IKI 1,480,000 $ 1---KAPAHULU 1,600,000 $ 2---- 1,200,000 $ 1,600,000 $ -25.0%(400,000) $ 1 2-50.0%-1 KULIOUOU 1,875,000 $ 1,300,000 $ 44.2%575,000 $ 1 10.0%0 1,875,000 $ 1,325,000 $ 41.5%550,000 $ 1 5-80.0%-4 MAUNALANI HEIGHTS 1,198,000 $ 2,955,000 $ -59.5%(1,757,000) $ 1 3-66.7%-2 1,198,000 $ 2,955,000 $ -59.5%(1,757,000) $ 1 3-66.7%-2 NIU BEACH 3,400,000 $ 1 NIU VALLEY 1,105,000 $ 1,505,000 $ -26.6%(400,000) $ 1 10.0%0 1,285,000 $ 1,427,500 $ -10.0%(142,500) $ 3 250.0%1 PALOLO 918,000 $ 1,555,000 $ -41.0%(637,000) $ 1 2-50.0%-1 918,000 $ 1,555,000 $ -41.0%(637,000) $ 3 4-25.0%-1 ST. LOUIS 1,200,000 $ 1---- 1,219,000 $ 4---WAIALAE IKI 2,380,000 $ 2,440,000 $ -2.5%(60,000) $ 2 4-50.0%-2 1,830,000 $ 2,750,000 $ -33.5%(920,000) $ 3 5-40.0%-2 WAIALAE NUI RDGE 2,322,500 $ 1,712,500 $ 35.6%610,001 $ 2 20.0%0 2,322,500 $ 1,712,500 $ 35.6%610,001 $ 2 20.0%0 WAIALAE NUI-LWR 1,085,000 $ 1 WAILUPE BCH 4,800,000 $ 1 4,800,000 $ 1 WILHELMINA 1,765,000 $ 1,430,000 $ 23.4%335,000 $ 2 1100.0%1 1,765,000 $ 1,525,000 $ 15.7%240,000 $ 2 4-50.0%-2 Diamond Head Region 2,275,000 $ 2,250,000 $ 1.1%25,000 $ 22 29-24.1%-7 1,840,000 $ 1,795,000 $ 2.5%45,000 $ 33 53-37.7%-20 Ewa Plain Region EWA BEACH 840,000 $ 967,500 $ -13.2%(127,500) $ 3 6-50.0%-3 772,500 $ 967,500 $ -20.2%(195,000) $ 6 8-25.0%-2 EWA GEN ALII COURT 790,000 $ ---- 1---EWA GEN ALII COVE 775,000 $ ---- 1---- 775,000 $ ---- 1---EWA GEN BREAKERS 1,185,000 $ ---- 1---- 1,185,000 $ ---- 1---EWA GEN CORAL RIDGE 1,200,000 $ ---- 1---EWA GEN CORTEBELLA 725,000 $ ---- 2---EWA GEN HALEAKEA 1,350,000 $ 2 1,350,000 $ 1,367,500 $ -1.3%(17,500) $ 2 20.0%0 EWA GEN KEALII 1,550,000 $ ---- 1---- 1,550,000 $ ---- 1---EWA GEN KULA LEI 865,000 $ 970,000 $ -10.8%(105,000) $ 1 2-50.0%-1 865,000 $ 957,500 $ -9.7%(92,500) $ 1 3-66.7%-2 EWA GEN LAS BRISAS 685,000 $ 760,000 $ -9.9%(75,000) $ 1 3-66.7%-2 685,000 $ 760,000 $ -9.9%(75,000) $ 1 5-80.0%-4
Single Family Homes Sold - February 2023 vs 2022 (Residential resales data, based on region and neighborhood groupings as listed in MLS)
SOURCE: Honolulu Board of REALTORS®, compiled from MLS data. ©2023. Honolulu Board of REALTORS®. All Rights Reserved. Information herein deemed reliable but not guaranteed.
Note: YTD sold counts reflect combined monthly "snapshots" of the reported MLS data from Jan. 1 to the end of the currently reported month.
February February February February YTD YTD YTD YTD 2023 Median 2022 Median +/- +/- 2023 Sold 2022 Sold +/- +/- 2023 Median 2022 Median +/- +/- 2023 Sold 2022 Sold +/- +/EWA GEN LATITUDES 1,089,000 $ 979,000 $ 11.2%110,000 $ 1 2-50.0%-1 1,089,000 $ 975,000 $ 11.7%114,000 $ 1 3-66.7%-2 EWA GEN LAULANI 789,000 $ ---- 1---- 810,000 $ 839,500 $ -3.5%(29,500) $ 1 2-50.0%-1 EWA GEN LAULANI-TIDES 800,000 $ 848,000 $ -5.7%(48,000) $ 1 2-50.0%-1 795,000 $ 845,000 $ -5.9%(50,000) $ 2 3-33.3%-1 EWA GEN LOMBARD WAY 675,000 $ 1 670,000 $ 2 EWA GEN MERIDIAN 860,000 $ ---- 1---- 860,000 $ ---- 1---EWA GEN MONTECITO/TUSCANY 818,000 $ ---- 1---- 800,000 $ ---- 3---EWA GEN NORTHPARK 840,000 $ 1 840,000 $ 1 EWA GEN PARKSIDE 875,000 $ 1 875,000 $ 910,000 $ -3.8%(35,000) $ 1 10.0%0 EWA GEN PRESCOTT 910,000 $ 1,000,500 $ -9.0%(90,500) $ 1 2-50.0%-1 910,000 $ 1,000,500 $ -9.0%(90,500) $ 1 4-75.0%-3 EWA GEN SANDALWOOD 1,068,000 $ 1 1,068,000 $ 1 EWA GEN SODA CREEK 770,000 $ ---- 1---- 712,500 $ 770,000 $ -7.5%(57,500) $ 2 1100.0%1 EWA GEN SONOMA 1,135,500 $ ---- 1---- 1,135,500 $ ---- 1---EWA GEN SUMMERHILL 900,000 $ ---- 1---EWA GEN SUN TERRA 700,000 $ ---- 1---EWA GEN SUN TERRA ON THE PARK 925,000 $ ---- 1---EWA GEN SUN TERRA SOUTH 810,000 $ 833,500 $ -2.8%(23,500) $ 1 3-66.7%-2 810,000 $ 833,500 $ -2.8%(23,500) $ 1 5-80.0%-4 EWA GEN TERRAZZA 781,000 $ 850,000 $ -8.1%(69,000) $ 1 10.0%0 781,000 $ 810,000 $ -3.6%(29,000) $ 1 3-66.7%-2 EWA GEN TIBURON 795,000 $ 2---EWA GEN TUSCANY II 840,000 $ 1 EWA GEN WOODBRIDGE 1,367,500 $ 2---- 1,335,000 $ 3---EWA GEN-SEABRIDGE 845,000 $ 2---- 825,000 $ 845,000 $ -2.4%(20,000) $ 2 20.0%0 EWA VILLAGES 842,500 $ 765,000 $ 10.1%77,500 $ 2 3-33.3%-1 775,000 $ 766,000 $ 1.2%9,000 $ 5 7-28.6%-2 EWA VILLAGES-HOONANI 867,000 $ 1---- 867,000 $ 1---HAWAIIAN HOMES LAND 680,000 $ 1---- 680,000 $ 1---HOAKALEI-KA MAKANA 1,160,200 $ 1,312,000 $ -11.6%(151,800) $ 2 4-50.0%-2 1,160,200 $ 1,150,000 $ 0.9%10,200 $ 2 11 -81.8%-9 HOAKALEI-KIPUKA 1,125,000 $ 1 1,267,500 $ 1,407,500 $ -9.9%(140,000) $ 2 20.0%0 HOAKALEI-KUAPAPA 1,267,500 $ 2 1,145,000 $ 1,262,500 $ -9.3%(117,500) $ 4 40.0%0 HOOPILI-AULU 1,202,000 $ 1---HOOPILI-ILIAHI 876,500 $ 2---HOOPILI-MAMAKA 799,000 $ 1 799,000 $ 1 KAPOLEI 950,000 $ 892,500 $ 6.4%57,500 $ 1 2-50.0%-1 865,000 $ 885,000 $ -2.3%(20,000) $ 4 333.3%1 KAPOLEI KNOLLS 1,150,000 $ 1,035,000 $ 11.1%115,000 $ 1 2-50.0%-1 1,150,000 $ 1,050,000 $ 9.5%100,000 $ 1 5-80.0%-4 KAPOLEI-AELOA 999,000 $ 1 999,000 $ 851,000 $ 17.4%148,000 $ 1 10.0%0 KAPOLEI-IWALANI 810,000 $ 1,031,000 $ -21.4%(221,000) $ 1 3-66.7%-2 810,000 $ 1,031,000 $ -21.4%(221,000) $ 1 3-66.7%-2 KAPOLEI-KAI 860,000 $ 1---KAPOLEI-KAWENA AT MEHANA 920,000 $ 1---KAPOLEI-KEKUILANI 720,000 $ 2---KAPOLEI-MALANAI 890,000 $ 1 890,000 $ 1 KAPOLEI-MEHANA-KUKUNA 900,000 $ 880,000 $ 2.3%20,000 $ 1 10.0%0 900,000 $ 880,000 $ 2.3%20,000 $ 1 10.0%0 KAPOLEI-MEHANA-LA HIKI 950,000 $ 1---KAPOLEI-MEHANA-OLINO 1,049,000 $ 1 1,049,000 $ 1 LEEWARD ESTATES 1,100,000 $ 1---- 1,010,000 $ 2---NANAKAI GARDENS 750,000 $ 880,000 $ -14.8%(130,000) $ 1 10.0%0 750,000 $ 880,000 $ -14.8%(130,000) $ 1 10.0%0 OCEAN POINTE 960,000 $ 994,000 $ -3.4%(34,000) $ 1 4-75.0%-3 900,000 $ 937,500 $ -4.0%(37,500) $ 2 16-87.5%-14 WESTLOCH ESTATES 850,000 $ 1 850,000 $ 960,000 $ -11.5%(110,000) $ 1 2-50.0%-1 WESTLOCH FAIRWAY 890,000 $ 1---- 885,000 $ 890,000 $ -0.6%(5,000) $ 1 2-50.0%-1 Ewa Plain Region 905,000 $ 900,000 $ 0.6%5,000 $ 34 57-40.4%-23 840,000 $ 917,500 $ -8.4%(77,500) $ 56 132-57.6%-76
Single Family Homes Sold - February 2023 vs 2022 (Residential resales data, based on region and neighborhood groupings as listed in MLS)
SOURCE: Honolulu Board of REALTORS®, compiled from MLS data. ©2023. Honolulu Board of REALTORS®. All Rights Reserved. Information herein deemed reliable but not guaranteed.
Note: YTD sold counts reflect combined monthly "snapshots" of the reported MLS data from Jan. 1 to the end of the currently reported month. February February February February YTD YTD YTD YTD 2023 Median 2022 Median +/- +/- 2023 Sold 2022 Sold +/- +/- 2023 Median 2022 Median +/- +/- 2023 Sold 2022 Sold +/- +/Hawaii Kai Region ANCHORAGE 1,875,000 $ ------1---- 1,875,000 $ ---- 1---HAHAIONE-LOWER 1,150,000 $ 1 1,150,000 $ 1,160,000 $ -0.9%(10,000) $ 1 10.0%0 KALAMA VALLEY 1,660,000 $ 1 1,360,000 $ 1,515,000 $ -10.2%(155,000) $ 3 4-25.0%-1 KAMILOIKI 1,375,000 $ 1 1,216,000 $ 2 KOKO HEAD TERRACE 1,061,650 $ ---- 2---- 1,272,500 $ 1,290,000 $ -1.4%(17,500) $ 2 8-75.0%-6 KOKO KAI 3,946,250 $ ---- 2---- 3,946,250 $ ---- 2---KOKO VILLAS 2,044,000 $ 2,550,000 $ -19.8%(506,000) $ 2 1100.0%1 2,044,000 $ 2,550,000 $ -19.8%(506,000) $ 2 1100.0%1 MARINERS COVE 1,724,500 $ 1,510,000 $ 14.2%214,500 $ 2 1100.0%1 1,724,500 $ 1,510,000 $ 14.2%214,500 $ 2 5-60.0%-3 MARINERS RIDGE 1,425,000 $ 1------ 1,425,000 $ 1,900,000 $ -25.0%(475,000) $ 1 10.0%0 MARINERS VALLEY 1,330,000 $ 4---NAPALI HAWEO 1,995,000 $ 1---- 1,995,000 $ 1---PORTLOCK 8,250,000 $ 2,600,000 $ 217.3%5,650,000 $ 1 10.0%0 8,250,000 $ 3,080,000 $ 167.9%5,170,000 $ 1 3-66.7%-2 SPINNAKER ISLE 2,025,000 $ 1,850,000 $ 9.5%175,000 $ 1 10.0%0 2,025,000 $ 1,850,000 $ 9.5%175,000 $ 1 10.0%0 TRIANGLE 1,810,000 $ 1 1,810,000 $ 1 WEST MARINA 1,500,000 $ 1---- 1,355,000 $ 2---Hawaii Kai Region 1,700,000 $ 1,875,000 $ -9.3%(175,000) $ 11 110.0%0 1,437,500 $ 1,500,000 $ -4.2%(62,500) $ 16 34-52.9%-18 Kailua Region AIKAHI PARK 2,100,000 $ 1 1,850,000 $ 2 BEACHSIDE 4,800,000 $ ---- 1---- 10,300,000 $ 3,500,000 $ 194.3%6,800,000 $ 1 3-66.7%-2 COCONUT GROVE 1,359,250 $ 1,150,000 $ 18.2%209,250 $ 2 5-60.0%-3 1,336,750 $ 1,250,000 $ 6.9%86,750 $ 6 11-45.5%-5 ENCHANTED LAKE 2,112,500 $ 1,615,000 $ 30.8%497,500 $ 2 20.0%0 1,611,000 $ 1,680,000 $ -4.1%(69,000) $ 5 7-28.6%-2 HILLCREST 2,250,000 $ 1 2,250,000 $ 1 KAILUA BLUFFS 1,350,000 $ 1,410,000 $ -4.3%(60,000) $ 1 2-50.0%-1 1,612,500 $ 1,410,000 $ 14.4%202,500 $ 2 20.0%0 KAILUA ESTATES 2,200,000 $ ---- 1---- 2,200,000 $ ---- 1---KALAHEO HILLSIDE 1,700,000 $ ---- 1---KALAMA TRACT 2,000,000 $ 1,850,000 $ 8.1%150,000 $ 1 10.0%0 2,000,000 $ 1,850,000 $ 8.1%150,000 $ 1 3-66.7%-2 KALAMA/CNUT GROV 1,375,000 $ 1---KAOPA 1,475,000 $ 1,277,500 $ 15.5%197,500 $ 1 2-50.0%-1 KEOLU HILLS 1,475,000 $ 1,242,500 $ 18.7%232,500 $ 3 250.0%1 1,312,500 $ 1,300,000 $ 1.0%12,500 $ 4 8-50.0%-4 KOOLAUPOKO 1,605,000 $ 2---- 2,300,000 $ 1,910,000 $ 20.4%390,000 $ 1 3-66.7%-2 KUULEI TRACT 1,450,000 $ 2 1,450,000 $ 1,757,500 $ -17.5%(307,500) $ 2 1100.0%1 LANIKAI 6,697,500 $ 6,387,500 $ 4.9%310,000 $ 2 20.0%0 6,697,500 $ 6,500,000 $ 3.0%197,500 $ 2 5-60.0%-3 MAUNAWILI 1,845,000 $ 1---- 1,725,000 $ 2OLOMANA 1,225,000 $ 1,450,000 $ -15.5%(225,000) $ 1 10.0%0 1,512,500 $ 1,450,000 $ 4.3%62,500 $ 2 3-33.3%-1 POHAKUPU 1,350,000 $ 1 1,350,000 $ 1 WAIMANALO 815,000 $ 770,000 $ 5.8%45,000 $ 3 250.0%1 625,000 $ 770,000 $ -18.8%(145,000) $ 5 2150.0%3 Kailua Region 1,420,000 $ 1,470,000 $ -3.4%(50,000) $ 20 22-9.1%-2 1,475,000 $ 1,490,000 $ -1.0%(15,000) $ 36 55-34.5%-19 Kaneohe Region AHAOLELO 1,600,000 $ 1 AHUIMANU AREA 975,000 $ ---- 1---- 1,062,500 $ 1,150,000 $ -7.6%(87,500) $ 2 20.0%0 ALII BLUFFS 2,000,000 $ ---- 1----
Single Family Homes Sold - February 2023 vs 2022 (Residential resales data, based on region and neighborhood groupings as listed in MLS)
SOURCE: Honolulu Board of REALTORS®, compiled from MLS data. ©2023. Honolulu Board of REALTORS®. All Rights Reserved. Information herein deemed reliable but not guaranteed.
Note: YTD sold counts reflect combined monthly "snapshots" of the reported MLS data from Jan. 1 to the end of the currently reported month. February February February February YTD YTD YTD YTD 2023 Median 2022 Median +/- +/- 2023 Sold 2022 Sold +/- +/- 2023 Median 2022 Median +/- +/- 2023 Sold 2022 Sold +/- +/BAY VIEW ESTATES 1,051,008 $ 1 CROWN TERRACE 1,042,500 $ ---- 2---HAIKU VILLAGE 1,350,000 $ 2 1,350,000 $ 2 HAKIPUU 1,050,000 $ ---- 1---- 1,050,000 $ ---- 1---HAUULA 1,585,000 $ 1,371,250 $ 15.6%213,750 $ 2 20.0%0 1,080,000 $ 1,371,250 $ -21.2%(291,250) $ 3 250.0%1 HEEIA VIEW 1,375,000 $ ---- 1---- 1,375,000 $ ---- 1---KAAAWA 1,520,000 $ ---- 1---KAMOOALII 900,000 $ ---- 1---KANEOHE TOWN 1,168,250 $ 4 KAPUNA HALA 910,000 $ 1 955,000 $ 2 LILIPUNA 1,120,000 $ 1,425,000 $ -21.4%(305,000) $ 2 1100.0%1 LULANI OCEAN 1,560,000 $ 3---MAHALANI 980,000 $ 1---- 1,100,000 $ 980,000 $ 12.2%120,000 $ 1 10.0%0 MAHINUI 1,950,000 $ 1,657,500 $ 17.6%292,500 $ 1 2-50.0%-1 1,950,000 $ 1,500,000 $ 30.0%450,000 $ 1 3-66.7%-2 MIKIOLA 1,050,000 $ 1 1,050,000 $ 1 NOHANANI TRACT 1,700,000 $ 1---PIKOILOA 1,322,500 $ 2 PUNALUU 1,650,000 $ 3---- 1,650,000 $ 3---PUOHALA VILLAGE 1,210,000 $ 1---- 1,210,000 $ 1---PUUALII 490,000 $ 1---VALLEY ESTATES 725,000 $ 1 725,000 $ 830,000 $ -12.7%(105,000) $ 1 10.0%0 WAIHEE 1,125,000 $ 1---- 1,125,000 $ 1---WAIKALUA 1,070,000 $ 1---- 835,000 $ 1,065,000 $ -21.6%(230,000) $ 1 3-66.7%-2 Kaneohe Region 1,155,000 $ 1,255,000 $ -8.0%(100,000) $ 8 14-42.9%-6 1,090,000 $ 1,302,500 $ -16.3%(212,500) $ 24 30-20.0%-6 Leeward Region LUALUALEI 675,000 $ 720,000 $ -6.3%(45,000) $ 5 2150.0%3 697,500 $ 710,000 $ -1.8%(12,500) $ 8 80.0%0 MAILI 636,500 $ 568,000 $ 12.1%68,500 $ 8 4100.0%4 640,000 $ 596,000 $ 7.4%44,000 $ 17 1330.8%4 MAILI SEA-KAIMALINO 575,000 $ 1 575,000 $ 1 MAILI SEA-MAKALAE 1 670,000 $ ---- 3---- 710,000 $ ---- 6---MAILI SEA-MAKALAE 2 742,500 $ ---- 2---- 740,000 $ ---- 3---MAILI SEA-NOHOKAI 760,000 $ 3 760,000 $ 894,000 $ -15.0%(134,000) $ 3 30.0%0 MAILI SEA-PALEKAI 670,000 $ 760,000 $ -11.8%(90,000) $ 1 10.0%0 670,000 $ 760,000 $ -11.8%(90,000) $ 1 10.0%0 MAILI SEA-POOKELA 812,000 $ ---- 1---MAKAHA 1,212,500 $ 576,500 $ 110.3%636,000 $ 2 4-50.0%-2 410,000 $ 710,000 $ -42.3%(300,000) $ 5 9-44.4%-4 NANAKULI 450,000 $ 1---WAIANAE 495,000 $ 1---- 465,000 $ 705,000 $ -34.0%(240,000) $ 2 7-71.4%-5 Leeward Region 675,000 $ 670,000 $ 0.7%5,000 $ 20 1717.6%3 660,000 $ 710,000 $ -7.0%(50,000) $ 37 52-28.8%-15 Makakilo Region MAKAKILO-ANUHEA 980,000 $ 965,000 $ 1.6%15,000 $ 1 10.0%0 980,000 $ 965,000 $ 1.6%15,000 $ 1 3-66.7%-2 MAKAKILO-HIGHLANDS 990,000 $ ---- 2---MAKAKILO-HIGHPOINTE 1,250,000 $ ---- 1---MAKAKILO-KAHIWELO 987,000 $ 1,300,000 $ -24.1%(313,000) $ 1 2-50.0%-1 1,088,500 $ 1,305,000 $ -16.6%(216,500) $ 2 4-50.0%-2
Single Family Homes Sold - February 2023 vs 2022 (Residential resales data, based on region and neighborhood groupings as listed in MLS) Note:
SOURCE: Honolulu Board of REALTORS®, compiled from MLS data. ©2023. Honolulu Board of REALTORS®. All Rights Reserved. Information herein deemed reliable but not guaranteed.
YTD sold counts reflect combined monthly "snapshots" of the reported MLS data from Jan. 1 to the end of the currently reported month. February February February February YTD YTD YTD YTD 2023 Median 2022 Median +/- +/- 2023 Sold 2022 Sold +/- +/- 2023 Median 2022 Median +/- +/- 2023 Sold 2022 Sold +/- +/MAKAKILO-KUMULANI 1,596,500 $ ---- 2---- 1,596,500 $ ---- 2---MAKAKILO-LOWER 1,002,500 $ 4 844,500 $ 709,000 $ 19.1%135,500 $ 6 2200.0%4 MAKAKILO-PALEHUA HGTS 1,040,000 $ ---- 2---MAKAKILO-ROYAL RIDGE 992,500 $ ---- 2---- 992,500 $ ---- 2---MAKAKILO-STARSEDGE 1,150,000 $ ---- 1---- 1,188,688 $ ---- 2---MAKAKILO-UPPER 830,000 $ 869,000 $ -4.5%(39,000) $ 2 20.0%0 825,000 $ 925,000 $ -10.8%(100,000) $ 3 6-50.0%-3 Makakilo Region 915,000 $ 1,085,000 $ -15.7%(170,000) $ 8 10-20.0%-2 844,500 $ 1,010,000 $ -16.4%(165,500) $ 12 26-53.8%-14 Metro Region ALEWA HEIGHTS 850,000 $ ---- 1---- 1,246,000 $ ---- 4---ALIAMANU 1,430,000 $ ---- 1---- 1,055,849 $ ---- 4---DOWSETT 1,124,000 $ 1,900,000 $ -40.8%(776,000) $ 2 20.0%0 KALIHI UKA 760,000 $ ---- 1---KALIHI VALLEY 820,000 $ 1,900,000 $ -56.8%(1,080,000) $ 3 1200.0%2 820,000 $ 1,775,000 $ -53.8%(955,000) $ 3 250.0%1 KALIHI-LOWER 480,000 $ 862,500 $ -44.3%(382,500) $ 1 2-50.0%-1 1,005,000 $ 875,000 $ 14.9%130,000 $ 3 30.0%0 KALIHI-UPPER 925,000 $ 799,000 $ 15.8%126,000 $ 2 1100.0%1 850,000 $ 799,000 $ 6.4%51,000 $ 3 4-25.0%-1 KAMEHAMEHA HEIGHTS 700,000 $ 1,299,000 $ -46.1%(599,000) $ 2 5-60.0%-3 700,000 $ 1,299,000 $ -46.1%(599,000) $ 2 5 -60.0%-3 KAPALAMA 710,000 $ 1,055,000 $ -32.7%(345,000) $ 1 10.0%0 724,000 $ 1,146,500 $ -36.9%(422,500) $ 4 2100.0%2 KAPIOLANI 1,050,000 $ 1 LILIHA 850,000 $ 1---MAKIKI HEIGHTS 8,300,000 $ 1,600,000 $ 418.8%6,700,000 $ 1 10.0%0 8,300,000 $ 1,600,000 $ 418.8%6,700,000 $ 1 10.0%0 MANOA AREA 3,100,000 $ 1,784,000 $ 73.8%1,316,000 $ 1 10.0%0 1,435,000 $ 1,650,000 $ -13.0%(215,000) $ 3 30.0%0 MANOA-LOWER 1,130,000 $ 1,570,000 $ -28.0%(440,000) $ 1 2-50.0%-1 MANOA-UPPER 1,437,500 $ 2---- 1,525,000 $ 3---MANOA-WOODLAWN 1,832,500 $ 2---- 1,650,000 $ 1,865,000 $ -11.5%(215,000) $ 3 30.0%0 MOANALUA GARDENS 1,315,000 $ 2---MOANALUA VALLEY 953,888 $ 1 MOILIILI 1,260,000 $ 1---- 1,260,000 $ 1---NUUANU AREA 1,266,000 $ 1---- 1,180,000 $ 1,258,000 $ -6.2%(78,000) $ 1 2-50.0%-1 NUUANU-LOWER 1,315,000 $ 2---- 1,300,000 $ 3---OLD PALI 2,108,634 $ 1---- 2,108,634 $ 1---PACIFIC HEIGHTS 905,000 $ 2 905,000 $ 2 PAUOA VALLEY 1,212,500 $ 2---- 1,240,000 $ 1,195,000 $ 3.8%45,000 $ 1 5-80.0%-4 PAWAA 1,205,000 $ 1PUNAHOU 1,110,000 $ 1---- 1,110,000 $ 1---PUNCHBOWL AREA 888,000 $ 1---- 750,000 $ 888,000 $ -15.5%(138,000) $ 1 10.0%0 PUUNUI 1,310,000 $ 2---- 1,288,000 $ 1,200,000 $ 7.3%88,000 $ 1 3-66.7%-2 TANTALUS 2,400,000 $ 1---Metro Region 815,000 $ 1,299,000 $ -37.3%(484,000) $ 13 29-55.2%-16 1,050,000 $ 1,250,000 $ -16.0%(200,000) $ 33 61-45.9%-28 North Shore Region HALEIWA 2,050,000 $ 1 2,050,000 $ 1,200,000 $ 70.8%850,000 $ 1 10.0%0 KAHUKU 754,000 $ ---- 1---KAWAILOA-NORTH SHORE 5,000,000 $ 2,300,000 $ 117.4%2,700,000 $ 1 10.0%0
Single Family Homes Sold - February 2023 vs 2022 (Residential resales data, based on region and neighborhood groupings as listed in MLS)
SOURCE: Honolulu Board of REALTORS®, compiled from MLS data. ©2023. Honolulu Board of REALTORS®. All Rights Reserved. Information herein deemed reliable but not guaranteed.
Note: YTD sold counts reflect combined monthly "snapshots" of the reported MLS data from Jan. 1 to the end of the currently reported month. February February February February YTD YTD YTD YTD 2023 Median 2022 Median +/- +/- 2023 Sold 2022 Sold +/- +/- 2023 Median 2022 Median +/- +/- 2023 Sold 2022 Sold +/- +/KAWELA BAY 5,300,000 $ ---- 1---LAIE 950,000 $ 1 1,087,500 $ 2,650,000 $ -59.0%(1,562,500) $ 2 3-33.3%-1 MOKULEIA 2,900,000 $ 3,561,000 $ -18.6%(661,000) $ 1 10.0%0 2,144,500 $ 2,580,500 $ -16.9%(436,000) $ 2 20.0%0 PAALAAKAI 959,000 $ 2 959,000 $ 2 PUPUKEA 1,790,000 $ ---- 1---- 1,790,000 $ ---- 1---SUNSET AREA 2,475,000 $ ---- 2---SUNSET/VELZY 1,640,500 $ 1,750,000 $ -6.3%(109,500) $ 2 1100.0%1 1,640,500 $ 1,750,000 $ -6.3%(109,500) $ 2 1100.0%1 WAIALUA 870,000 $ 1,267,500 $ -31.4%(397,500) $ 2 20.0%0 825,000 $ 1,470,000 $ -43.9%(645,000) $ 3 4-25.0%-1 North Shore Region 1,030,500 $ 1,750,000 $ -41.1%(719,500) $ 9 580.0%4 1,225,000 $ 1,750,000 $ -30.0%(525,000) $ 13 17-23.5%-4 Pearl City Region AIEA AREA 865,000 $ 2 865,000 $ 2 AIEA HEIGHTS 1,300,000 $ 1,275,000 $ 2.0%25,000 $ 1 3-66.7%-2 1,300,000 $ 1,231,944 $ 5.5%68,056 $ 1 4-75.0%-3 FOSTER VILLAGE 988,888 $ ---- 1---- 988,888 $ ---- 1---HALAWA 900,000 $ 950,000 $ -5.3%(50,000) $ 1 10.0%0 985,000 $ 1,207,500 $ -18.4%(222,500) $ 3 250.0%1 HALAWA HEIGHTS 1,500,000 $ ---- 1---- 1,500,000 $ ---- 1---MOMILANI 991,500 $ ---- 2---- 910,000 $ 990,000 $ -8.1%(80,000) $ 1 3-66.7%-2 NEWTOWN 994,500 $ 1,288,000 $ -22.8%(293,500) $ 2 1100.0%1 950,000 $ 1,224,000 $ -22.4%(274,000) $ 3 250.0%1 PACIFIC PALISADES 1,042,500 $ 1,029,000 $ 1.3%13,500 $ 2 3-33.3%-1 834,000 $ 1,029,500 $ -19.0%(195,500) $ 6 60.0%0 PEARL CITY-UPPER 905,000 $ 960,000 $ -5.7%(55,000) $ 7 3133.3%4 850,000 $ 990,000 $ -14.1%(140,000) $ 11 4175.0%7 PEARLRIDGE 1,410,000 $ 1 ROYAL SUMMIT 1,800,000 $ 1---WAIAU 885,000 $ 910,000 $ -2.7%(25,000) $ 1 10.0%0 885,000 $ 995,000 $ -11.1%(110,000) $ 1 2-50.0%-1 WAILUNA 1,265,000 $ 1---- 1,265,000 $ 1---WAIMALU 800,000 $ 1,167,500 $ -31.5%(367,500) $ 1 2-50.0%-1 825,000 $ 1,040,000 $ -20.7%(215,000) $ 2 6-66.7%-4 Pearl City Region 905,000 $ 1,030,000 $ -12.1%(125,000) $ 17 19-10.5%-2 885,000 $ 1,070,000 $ -17.3%(185,000) $ 31 33-6.1%-2 Waipahu Region BUSINESS 750,000 $ ---- 1---CRESTVIEW 850,000 $ 780,000 $ 9.0%70,000 $ 1 10.0%0 HALE LUMI 949,000 $ 1 HARBOR VIEW 944,000 $ ---- 2---- 1,100,000 $ 944,000 $ 16.5%156,000 $ 1 2-50.0%-1 ROBINSON HEIGHTS 830,000 $ ---- 1---- 680,000 $ 920,000 $ -26.1%(240,000) $ 1 3-66.7%-2 ROYAL KUNIA 1,086,000 $ ---- 2---- 1,175,000 $ 976,000 $ 20.4%199,000 $ 3 4-25.0%-1 SEAVIEW 885,000 $ 1 885,000 $ 1 VILLAGE PARK 945,000 $ ---- 2---- 805,000 $ 870,000 $ -7.5%(65,000) $ 3 8-62.5%-5 WAIKELE 980,000 $ ---- 1---- 1,078,250 $ 876,500 $ 23.0%201,750 $ 2 3-33.3%-1 WAIPAHU ESTATES 910,000 $ 1,100,000 $ -17.3%(190,000) $ 1 10.0%0 910,000 $ 1,100,000 $ -17.3%(190,000) $ 1 3-66.7%-2 WAIPAHU GARDENS 888,000 $ 1 888,000 $ 1 WAIPAHU TRIANGLE 875,000 $ 1---WAIPAHU-LOWER 1,175,000 $ 2---- 761,500 $ 860,000 $ -11.5%(98,500) $ 2 7-71.4%-5 WAIPIO GENTRY 1,000,000 $ 3---- 935,000 $ 990,000 $ -5.6%(55,000) $ 1 4-75.0%-3 Waipahu Region 888,000 $ 974,986 $ -8.9%(86,986) $ 3 14-78.6%-11 915,000 $ 905,000 $ 1.1%10,000 $ 18 37-51.4%-19
Condos Sold - February 2023 vs 2022 (Residential resales data, based on region and neighborhood groupings as listed in MLS)
SOURCE: Honolulu Board of REALTORS®, compiled from MLS data. ©2023. Honolulu Board of REALTORS®. All Rights Reserved. Information herein deemed reliable but not guaranteed.
Note: YTD sold counts reflect combined monthly "snapshots" of the reported MLS data from Jan. 1 to the end of the currently reported month. February February February February YTD YTD YTD YTD 2023 Median 2022 Median +/- +/- 2023 Sold 2022 Sold +/- +/- 2023 Median 2022 Median +/- +/- 2023 Sold 2022 Sold +/- +/Central Region LAUNANI VALLEY 532,500 $ ---- 8---- 622,000 $ 515,000 $ 20.8%107,000$ 2 17-88.2%-15 MILILANI AREA 539,000 $ 610,000 $ -11.6%(71,000) $ 7 10-30.0%-3 539,500 $ 635,000 $ -15.0%(95,500) $ 14 29-51.7%-15 MILILANI MAUKA 422,500 $ 562,500 $ -24.9%(140,000) $ 4 40.0%0 457,500 $ 585,000 $ -21.8%(127,500) $ 6 11-45.5%-5 WAHIAWA HEIGHTS 101,266 $ 130,000 $ -22.1%(28,734) $ 1 10.0%0 101,266 $ 130,000 $ -22.1%(28,734) $ 1 5-80.0%-4 WAIPIO ACRES/WAIKALANI WOODLANDS 432,500 $ 400,000 $ 8.1%32,500 $ 10 100.0%0 430,000 $ 380,000 $ 13.2%50,000 $ 17 19-10.5%-2 WILIKINA 252,000 $ 1 Central Region 442,500 $ 505,000 $ -12.4%(62,500) $ 22 33-33.3%-11 450,000 $ 500,000 $ -10.0%(50,000) $ 41 81-49.4%-40 Diamond Head Region DIAMOND HEAD 1,342,500 $ 590,000 $ 127.5%752,500 $ 6 11-45.5%-5 1,342,500 $ 590,000 $ 127.5%752,500 $ 8 21-61.9%-13 KAIMUKI 425,000 $ 1 425,000 $ 385,000 $ 10.4%40,000 $ 1 10.0%0 KALANI IKI 1,390,000 $ ---- 1---- 1,397,500 $ ---- 2---KAPAHULU 355,000 $ ---- 1---- 355,000 $ ---- 1---PALOLO 301,000 $ 1 WAIALAE G/C 580,000 $ 1 350,000 $ 327,500 $ 6.9%22,500 $ 2 20.0%0 WAIALAE NUI VLY 700,000 $ ---- 3---- 670,000 $ 649,000 $ 3.2%21,000 $ 1 6-83.3%-5 Diamond Head Region 685,000 $ 659,000 $ 3.9%26,000 $ 8 16-50.0%-8 580,000 $ 595,000 $ -2.5%(15,000) $ 13 33-60.6%-20 Ewa Plain Region AG/INDL/NAVY 320,000 $ ---- 1---- 334,500 $ ---- 2---EWA 432,500 $ 510,500 $ -15.3%(78,000) $ 4 40.0%0 440,000 $ 482,500 $ -8.8%(42,500) $ 8 14-42.9%-6 EWA BEACH 315,000 $ ---- 3---- 315,000 $ ---- 3---EWA GEN 617,500 $ ---- 2---- 570,000 $ 615,000 $ -7.3%(45,000) $ 1 3-66.7%-2 EWA GEN PARKSIDE 865,000 $ 1 865,000 $ 1 EWA GEN SODA CREEK 495,000 $ 525,000 $ -5.7%(30,000) $ 3 30.0%0 465,000 $ 512,500 $ -9.3%(47,500) $ 10 666.7%4 EWA GEN SUN TERRA ON THE PARK 517,000 $ 1 517,000 $ 1 EWA GEN-SEABRIDGE 851,500 $ ---- 1---- 851,500 $ ---- 1---HOAKALEI-KA MAKANA 769,500 $ 2- 785,000 $ 770,000 $ 1.9%15,000 $ 1 3-66.7%-2 HOAKALEI-LEI PAUKU 955,000 $ 1---- 800,000 $ 955,000 $ -16.2%(155,000) $ 1 10.0%0 HOOPILI-AKOKO 770,000 $ 3---HOOPILI-ILIAHI 407,411 $ 2 407,411 $ 2 HOOPILI-KOHINA 675,000 $ 520,000 $ 29.8%155,000 $ 1 10.0%0 698,000 $ 520,000 $ 34.2%178,000 $ 4 1300.0%3 KAPOLEI 430,000 $ 545,000 $ -21.1%(115,000) $ 3 30.0%0 462,500 $ 545,000 $ -15.1%(82,500) $ 6 11-45.5%-5 KAPOLEI-KAHIKU AT MEHANA 710,000 $ 785,000 $ -9.6%(75,000) $ 1 2-50.0%-1 705,000 $ 820,000 $ -14.0%(115,000) $ 3 4-25.0%-1 KAPOLEI-MALANAI 476,000 $ 1 476,000 $ 1 KAPOLEI-MEHANA-MANAWA 819,000 $ 1---- 819,000 $ 1---KAPOLEI-MEHANA-NANALA 661,000 $ 1---- 745,500 $ 2---KAPOLEI-MEHANA-OLINO 760,000 $ 798,000 $ -4.8%(38,000) $ 1 10.0%0 760,000 $ 783,500 $ -3.0%(23,500) $ 1 2-50.0%-1 KAPOLEI-MEHANA-PULEWA 614,000 $ 710,000 $ -13.5%(96,000) $ 1 2-50.0%-1 614,000 $ 710,000 $ -13.5%(96,000) $ 1 2-50.0%-1 KAPOLEI-POHAKALA AT MEHANA 775,000 $ 659,000 $ 17.6%116,000 $ 1 10.0%0 775,000 $ 659,000 $ 17.6%116,000 $ 1 10.0%0 KO OLINA 1,462,500 $ 986,500 $ 48.3%476,000 $ 2 12-83.3%-10 1,162,500 $ 998,000 $ 16.5%164,500 $ 4 19-78.9%-15 OCEAN POINTE 715,000 $ 707,500 $ 1.1%7,500 $ 3 4-25.0%-1 710,000 $ 715,000 $ -0.7%(5,000) $ 5 14-64.3%-9 WESTLOCH FAIRWAY 400,000 $ 1---- 400,000 $ 1---Ewa Plain Region 517,000 $ 705,000 $ -26.7%(188,000) $ 25 46-45.7%-21 522,000 $ 702,500 $ -25.7%(180,500) $ 51 94-45.7%-43
Condos Sold - February 2023 vs 2022 (Residential resales data, based on region and neighborhood groupings as listed in MLS)
SOURCE: Honolulu Board of REALTORS®, compiled from MLS data.
herein deemed reliable but not guaranteed.
Note: YTD sold counts reflect combined monthly "snapshots" of the reported MLS data from Jan. 1 to the end of the currently reported month. February February February February YTD YTD YTD YTD 2023 Median 2022 Median +/- +/- 2023 Sold 2022 Sold +/- +/- 2023 Median 2022 Median +/- +/- 2023 Sold 2022 Sold +/- +/Hawaii Kai Region HAHAIONE-LOWER 685,000 $ 700,000 $ -2.1%(15,000) $ 4 5-20.0%-1 650,000 $ 650,000 $ 0.0%$ 7 11-36.4%-4 MARINERS VALLEY 475,000 $ ---- 2---- 800,000 $ ---- 5---WEST MARINA 945,000 $ 920,000 $ 2.7%25,000 $ 7 616.7%1 945,000 $ 915,000 $ 3.3%30,000 $ 9 16-43.8%-7 Hawaii Kai Region 780,000 $ 750,000 $ 4.0%30,000 $ 11 13-15.4%-2 774,500 $ 807,500 $ -4.1%(33,000) $ 16 32-50.0%-16 Kailua Region AIKAHI PARK 745,000 $ 730,000 $ 2.1%15,000 $ 1 10.0%0 712,000 $ 730,000 $ -2.5%(18,000) $ 3 1200.0%2 BLUESTONE 1,475,000 $ ---- 3---- 1,310,000 $ 1,462,500 $ -10.4%(152,500) $ 1 4-75.0%-3 KAILUA BLUFFS 1,145,000 $ ---- 1---- 1,145,000 $ ---- 1---KAILUA TOWN 769,000 $ 655,000 $ 17.4%114,000 $ 9 580.0%4 737,500 $ 667,500 $ 10.5%70,000 $ 12 1020.0%2 KUKILAKILA 990,000 $ 1 Kailua Region 759,500 $ 850,000 $ -10.6%(90,500) $ 10 100.0%0 745,000 $ 740,000 $ 0.7%5,000 $ 17 166.3%1 Kaneohe Region COUNTRY CLUB 750,000 $ 950,000 $ -21.1%(200,000) $ 1 10.0%0 860,000 $ 860,000 $ 0.0%$ 3 4-25.0%-1 HAIKU PLANTATION 730,000 $ ---- 1---- 600,000 $ 783,500 $ -23.4%(183,500) $ 1 2-50.0%-1 HAIKU VILLAGE 630,000 $ 1 630,000 $ 1 HALE KOU 387,000 $ ---- 1---- 387,000 $ ---- 1---LILIPUNA 825,000 $ 752,500 $ 9.6%72,500 $ 1 2-50.0%-1 830,000 $ 755,000 $ 9.9%75,000 $ 2 3-33.3%-1 MAHALANI 840,000 $ ---- 1---- 867,500 $ ---- 2---PUNALUU 475,000 $ 220,000 $ 115.9%255,000 $ 1 4-75.0%-3 475,000 $ 220,000 $ 115.9%255,000 $ 1 4-75.0%-3 PUUALII 506,500 $ ---- 2---- 628,500 $ ---- 4---TEMPLE VALLEY 550,000 $ 820,000 $ -32.9%(270,000) $ 1 10.0%0 655,000 $ 560,000 $ 17.0%95,000 $ 2 5-60.0%-3 WINDWARD ESTATES 512,000 $ 450,000 $ 13.8%62,000 $ 6 3100.0%3 539,000 $ 450,000 $ 19.8%89,000 $ 9 728.6%2 Kaneohe Region 550,000 $ 507,500 $ 8.4%42,500 $ 11 16-31.3%-5 648,000 $ 592,500 $ 9.4%55,500 $ 19 32-40.6%-13 Leeward Region MAILI 479,725 $ 230,000 $ 108.6%249,725 $ 2 5-60.0%-3 190,000 $ 230,000 $ -17.4%(40,000) $ 7 70.0%0 MAKAHA 235,000 $ 184,900 $ 27.1%50,100 $ 5 9-44.4%-4 235,000 $ 218,000 $ 7.8%17,000 $ 9 21-57.1%-12 MAKAHA OCEANVIEW ESTATES 330,000 $ ---- 1---- 302,500 $ ---- 2---WAIANAE 225,000 $ 2 230,000 $ 205,000 $ 12.2%25,000 $ 3 1200.0%2 Leeward Region 235,000 $ 215,000 $ 9.3%20,000 $ 9 15-40.0%-6 230,000 $ 230,000 $ 0.0%$ 19 31-38.7%-12 Makakilo Region MAKAKILO-UPPER 645,000 $ 610,000 $ 5.7%35,000 $ 7 11-36.4%-4 635,000 $ 550,000 $ 15.5%85,000 $ 15 27-44.4%-12 Makakilo Region 645,000 $ 610,000 $ 5.7%35,000 $ 7 11-36.4%-4 635,000 $ 550,000 $ 15.5%85,000 $ 15 27-44.4%-12 Metro Region ALA MOANA 429,000 $ 432,000 $ -0.7% (3,000) $ 12 14-14.3%-2 446,500 $ 680,000 $ -34.3%(233,500) $ 30 35-14.3%-5
©2023. Honolulu Board of REALTORS®.
Rights
All
Reserved. Information
Condos Sold - February 2023 vs 2022 (Residential resales data, based on region and neighborhood groupings as listed in MLS)
SOURCE: Honolulu Board of REALTORS®, compiled from MLS data. ©2023. Honolulu Board of REALTORS®. All Rights Reserved. Information herein deemed reliable but not guaranteed.
Note: YTD sold counts reflect combined monthly "snapshots" of the reported MLS data from Jan. 1 to the end of the currently reported month. February February February February YTD YTD YTD YTD 2023 Median 2022 Median +/- +/- 2023 Sold 2022 Sold +/- +/- 2023 Median 2022 Median +/- +/- 2023 Sold 2022 Sold +/- +/CHINATOWN 575,000 $ 620,000 $ -7.3%(45,000) $ 3 5-40.0%-2 575,000 $ 565,000 $ 1.8%10,000 $ 3 11-72.7%-8 DILLINGHAM 465,000 $ ---- 1---- 465,000 $ ---- 1---DOWNTOWN 350,000 $ 504,750 $ -30.7%(154,750) $ 11 837.5%3 370,000 $ 406,500 $ -9.0%(36,500) $ 15 22-31.8%-7 HOLIDAY MART 522,500 $ 345,500 $ 51.2%177,000 $ 2 8-75.0%-6 402,500 $ 351,000 $ 14.7%51,500 $ 6 21-71.4%-15 KAKAAKO 703,500 $ 885,000 $ -20.5%(181,500) $ 32 39-17.9%-7 792,500 $ 892,500 $ -11.2%(100,000) $ 58 82-29.3%-24 KALIHI AREA 375,000 $ 361,250 $ 3.8%13,750 $ 1 2-50.0%-1 370,000 $ 375,000 $ -1.3%(5,000) $ 2 3-33.3%-1 KALIHI-LOWER 269,000 $ ---- 4---- 325,000 $ 293,000 $ 10.9%32,000 $ 1 5-80.0%-4 KAPAHULU 472,000 $ 395,500 $ 19.3%76,500 $ 1 2-50.0%-1 472,000 $ 400,000 $ 18.0%72,000 $ 3 7-57.1%-4 KAPALAMA 310,000 $ 1 KAPIO/KINAU/WARD 310,000 $ 394,750 $ -21.5%(84,750) $ 1 4-75.0%-3 310,000 $ 348,750 $ -11.1%(38,750) $ 1 6-83.3%-5 KAPIOLANI 507,500 $ 587,500 $ -13.6%(80,000) $ 2 8-75.0%-6 512,500 $ 581,000 $ -11.8%(68,500) $ 6 16-62.5%-10 KUAKINI 490,000 $ 1 490,000 $ 1 MAKIKI 327,500 $ 4---- 400,000 $ 327,500 $ 22.1%72,500 $ 1 6-83.3%-5 MAKIKI AREA 350,000 $ 405,000 $ -13.6%(55,000) $ 11 17-35.3%-6 360,000 $ 395,000 $ -8.9%(35,000) $ 23 31-25.8%-8 MCCULLY 505,000 $ 390,000 $ 29.5%115,000 $ 1 3-66.7%-2 505,000 $ 372,500 $ 35.6%132,500 $ 1 4-75.0%-3 MOILIILI 295,000 $ 402,000 $ -26.6%(107,000) $ 5 10-50.0%-5 370,000 $ 379,000 $ -2.4%(9,000) $ 10 18-44.4%-8 NUUANU-LOWER 585,000 $ 459,500 $ 27.3%125,500 $ 4 6-33.3%-2 470,000 $ 445,000 $ 5.6%25,000 $ 5 10-50.0%-5 PALAMA 276,900 $ 1---- 280,950 $ 2---PAWAA 268,750 $ 442,500 $ -39.3%(173,750) $ 2 20.0%0 311,250 $ 403,000 $ -22.8%(91,750) $ 4 7-42.9%-3 PUNAHOU 550,000 $ 418,500 $ 31.4%131,500 $ 1 6-83.3%-5 550,000 $ 475,000 $ 15.8%75,000 $ 1 16-93.8%-15 PUNCHBOWL AREA 290,000 $ 368,234 $ -21.2%(78,234) $ 3 10-70.0%-7 272,500 $ 365,000 $ -25.3%(92,500) $ 4 19-78.9%-15 PUNCHBOWL-LOWER 350,000 $ 388,500 $ -9.9%(38,500) $ 3 4-25.0%-1 365,000 $ 363,500 $ 0.4%1,500 $ 5 14-64.3%-9 SALT LAKE 395,000 $ 450,000 $ -12.2%(55,000) $ 8 24-66.7%-16 440,000 $ 446,500 $ -1.5%(6,500) $ 15 40-62.5%-25 WAIKIKI 390,000 $ 382,500 $ 2.0%7,500 $ 93 100-7.0%-7 403,750 $ 403,000 $ 0.2%750 $ 154 201-23.4%-47 Metro Region 440,000 $ 440,000 $ 0.0%$ 197 282-30.1%-85 440,000 $ 450,000 $ -2.2%(10,000) $ 350 577-39.3%-227 North Shore Region KUILIMA 1,275,000 $ -- 6---- 1,135,000 $ 1,150,000 $ -1.3%(15,000) $ 3 9-66.7%-6 MOKULEIA 682,500 $ 769,000 $ -11.2%(86,500) $ 2 1100.0%1 682,500 $ 769,000 $ -11.2%(86,500) $ 2 1100.0%1 WAIALUA 310,000 $ ---- 1---- 377,500 $ ---- 3---North Shore Region 682,500 $ 1,057,500 $ -35.5%(375,000) $ 2 8-75.0%-6 875,000 $ 850,000 $ 2.9%25,000 $ 5 13-61.5%-8 Pearl City Region AG/PRESERVE 305,000 $ ---- 1---- 305,000 $ ---- 1---AIEA HEIGHTS 730,000 $ ---- 1---HALAWA 621,000 $ 420,000 $ 47.9%201,000 $ 1 10.0%0 579,000 $ 420,000 $ 37.9%159,000 $ 3 5-40.0%-2 MANANA 290,000 $ 260,000 $ 11.5%30,000 $ 1 3-66.7%-2 276,250 $ 257,500 $ 7.3%18,750 $ 2 4-50.0%-2 NAVY/FEDERAL 385,000 $ 435,000 $ -11.5%(50,000) $ 1 10.0%0 385,000 $ 432,500 $ -11.0%(47,500) $ 1 2-50.0%-1 NEWTOWN 675,000 $ ---- 1---- 643,500 $ ---- 3---PACIFIC PALISADES 975,000 $ ---- 1---PEARL CITY-LOWER 420,000 $ ---- 1---PEARL CITY-UPPER 380,000 $ 1 270,000 $ 2 PEARLRIDGE 383,000 $ 397,500 $ -3.6%(14,500) $ 9 12-25.0%-3 417,500 $ 436,000 $ -4.2%(18,500) $ 20 32-37.5%-12 WAIAU 378,000 $ 567,500 $ -33.4%(189,500) $ 1 6-83.3%-5 504,000 $ 510,000 $ -1.2%(6,000) $ 2 13-84.6%-11 WAILUNA 708,000 $ 1 708,000 $ 755,000 $ -6.2%(47,000) $ 3 1200.0%2
Condos Sold - February 2023 vs 2022
(Residential resales data, based on region and neighborhood groupings as listed in MLS) Note:
SOURCE: Honolulu Board of REALTORS®, compiled from MLS data. ©2023. Honolulu Board of REALTORS®. All Rights Reserved. Information herein deemed reliable but not guaranteed.
YTD sold counts reflect combined monthly "snapshots" of the reported MLS data from Jan. 1 to the end of the currently reported month. February February February February YTD YTD YTD YTD 2023 Median 2022 Median +/- +/- 2023 Sold 2022 Sold +/- +/- 2023 Median 2022 Median +/- +/- 2023 Sold 2022 Sold +/- +/WAIMALU 415,000 $ 1 415,000 $ 352,500 $ 17.7%62,500 $ 1 2-50.0%-1 Pearl City Region 384,000 $ 435,000 $ -11.7%(51,000) $ 16 25-36.0%-9 415,000 $ 451,500 $ -8.1%(36,500) $ 34 66-48.5%-32 Waipahu Region ROYAL KUNIA 512,500 $ 550,000 $ -6.8%(37,500) $ 2 3-33.3%-1 VILLAGE PARK 480,000 $ ---- 1---WAIKELE 745,000 $ 620,000 $ 20.2%125,000 $ 1 5-80.0%-4 552,500 $ 545,000 $ 1.4%7,500 $ 6 15-60.0%-9 WAIPAHU-LOWER 315,500 $ 242,500 $ 30.1%73,000 $ 4 2100.0%2 331,000 $ 287,500 $ 15.1%43,500 $ 5 6-16.7%-1 WAIPIO GENTRY 492,500 $ 457,500 $ 7.7%35,000 $ 2 4-50.0%-2 495,000 $ 460,000 $ 7.6%35,000 $ 7 11-36.4%-4 Waipahu Region 375,000 $ 485,500 $ -22.8%(110,500) $ 7 11-36.4%-4 497,000 $ 487,750 $ 1.9%9,250 $ 20 36-44.4%-16
BETTERHAWAII.COM 808.738.3600 VISIT OUR OFFICES IN KAHALA MALL, HALEIWA STORE LOTS, KAILUA TOWN CENTER AND KA MAKANA ALII. SOURCE: HONOLULU BOARD OF REALTORS ©2021 BETTER HOMES AND GARDENS REAL ESTATE ADVANTAGE REALTY BETTER HOMES AND GARDENS® IS A REGISTERED TRADEMARK OF MEREDITH CORPORATION LICENSED TO BETTER HOMES AND GARDENS REAL ESTATE LLC EQUAL OPPORTUNITY COMPANY EQUAL HOUSING OPPORTUNITY AN INDEPENDENTLY OWNED AND OPERATED FRANCHISE
