
32 minute read
PART 2: GEOGRAPHIC ACCESS TO BEHAVIORAL HEALTH SERVICES (BHS


5. Geographic Availability of BHS
Advertisement
5.1 Introduction
This section of the report assesses geographic access to Behavioral Health Services (BHS) in Orange County. The geographic location of BHS facilities was obtained from the Orange County Health Care Agency Behavioral Health Services Directory and the online facility locator database maintained by the Substance Abuse and Mental Health Services Administration. A demographic summary of the Orange County population was obtained from the U.S. Census American Community Survey, 5-year estimates (2012-2016). Please note that this section is reporting on access to physical facility locations; Orange County provides many field-base services which are designed to serve areas where there are no facilities.
A quantile classification method was applied to the maps displaying the density of BHS facilities and demographic data. Under the quantile method, the data being mapped was grouped into three categories with approximately the same number of zip codes assigned to each category. When moving from one class to the next class, the data linearly increased (or decreased) and hence the classes were defined as low, medium, or high.
Detailed information on geographic mapping methods can be found in Appendix 2A, a list of all facilities with their characteristics can be found in Appendix 2B, and references for this section can be found in Appendix 2C.
County
There were 201 facilities providing Behavioral Health Services (BHS) through the Orange County Health Care Agency (OC HCA; Figure 14). More than half of Orange County zip codes (52%) had at least one BHS facility and these facilities were located in the more populated regions of the county. As shown in Table 7, nearly two-thirds of the Orange County population resided in a zip code with at least one facility. Zip codes with at least one facility had a significantly higher proportion of Latino residents (39.7% vs. 23.3%) and a significantly lower proportion of white residents (37.2% vs. 50.3%) compared to zip codes without a BHS facility (Table 7). Additionally, zip codes with at least one facility were more likely to have a greater proportion of uninsured (14.1% vs. 8.4%) or publicly insured residents (31.0% vs. 26.5%), as well as a younger resident population (median age 30.9 years vs. 45.5 years).
Figure 14: Distribution of Behavioral Health Service (BHS) Facilities by Zip Codes in Orange County

Table 7. Demographic Characteristics in Orange County and Stratified by Presence of Behavioral Health Service Facility
Demographic Characteristics Overall No Facility At least one BHS Facility p-value
Race/Ethnicity
Latino
White
African American
API other 34.2% 42.0% 1.5% 19.3% 3.0% 23.3% 50.3% 2.1% 20.6% 3.7% 39.7% 37.2% 1.6% 18.9% 2.6% < 0.001 0.0016 0.6975 0.9877 0.001
Insurance Status
Private Insurance
Public Insurance
Uninsured 65.7% 29.5% 12.3% 74.3% 26.5% 8.4% 61.7% 31.0% 14.1%
0.001 0.0119 < 0.001 Living Below Federal Poverty Level 12.5% 9.8% 12.9% 0.5586 Median Age (in years) 37.3 45.5 30.9 0.0010 Total Population Size 3,371,361 1,165,031 2,206,330 <0.001
Cities
Most BHS facilities in Orange County are concentrated in and around the zip codes covering the cities of Anaheim, Costa Mesa, Orange, and Santa Ana (Figure 15). These four cities contained 65% of all the BHS facilities and account for 31% of the population (Table 8).
Figure 15: Distribution of Behavioral Health Service Facilities in Zip Codes within the Cities of Anaheim, Costa Mesa Orange, and Santa Ana
Table 8. Behavioral Health Service Facilities and Population Size in Select Orange County Cities
Cities Number of BHS Facilities Population size Density of services per 10,000 residents
Anaheim Costa Mesa Orange Santa Ana 30 (14.9%) 367,602 (11.6%) 17 (4.5%) 114,250 (3.6%) 23 (11.4%) 145,240 (4.6%) 61 (30.4%) 357,192 (11.3%) 0.84 1.48 1.46 1.82
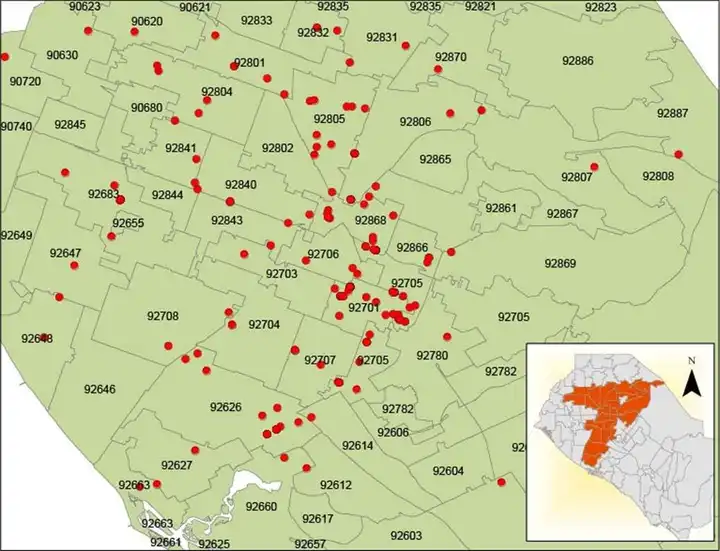
Figure 16 displays the geographic coverage of BHS facilities stratified by the population being served. Zip code 92701, in Santa Ana, had the largest number of behavioral health programs for adults (n=7), older adults (n=4), TAY (n=10) and children (n=8). Additional zip codes with a large number of services specific to these populations included 92805, in Anaheim, for adults; 92707, in Santa Ana and 92626, in Costa Mesa, for older adults; and 92705 and 92868, in Santa Ana for children and TAY. There was some overlap in the geographic availability of facilities with services that were specific to children and TAY since several of these facilities were programs targeting both age groups.
Figure 16: Number of Behavioral Health Services (BHS) Facilities Providing Services Specific to Adults, Older Adults, Transitional Age Youth (TAY), and Children by Zip Code in Orange County

Insurance Coverage
Approximately 30% of the Orange County population is publicly insured (Table 7). The majority of the publicly insured population reside in the northern region of the county, in the cities of Seal Beach, Garden Grove, Santa Ana, Anaheim, Villa Park, Fullerton, Buena Park and La Habra (Figure 17). Parts of the southern region of Orange County also have a large number of publicly insured individuals. This includes the southwest section of Newport Beach, Laguna Woods, and San Juan Capistrano (Figure 17).
Similarly, the northern region of Orange County has the highest density of BHS facilities, measured as the number of BHS facilities per 10,000 residents (Figure 17). Areas with a high density of BHS facilities spatially overlap with areas in which there is a high density of the publicly insured population. However, there may be gaps in BHS coverage in San Juan Capistrano where there is a high density of publicly insured residents but no BHS facility.
Figure 17: Distribution of Public Insurance Coverage and Behavioral Health Services (BHS) Facilities in Orange County by Zip Code Tabulation Areas (ZCTA)

Note: Zip Code Tabulation Areas (ZCTA) are generalized areal representations of mailing address zip codes used by the United States Postal System. The U.S. Census Bureau publishes statistical census data by ZCTA.
Approximately 1 out of 10 residents are uninsured in Orange County (Table 7). The majority
of the uninsured population reside in the northern region of the county, in the cities of Garden Grove, Stanton, Santa Ana, Anaheim, Fullerton, Buena Park and La Habra (Figure 18). Parts of southern Orange County also have a high presence of uninsured individuals including San Juan Capistrano/Capistrano Beach (Figure 18).
Areas with a high density of BHS facilities spatially overlap with areas in which there is a high density of the uninsured population. However, there may be gaps in BHS coverage in Trabuco Canyon and San Juan Capistrano/Capistrano Beach, where there is a high density of uninsured residents but no BHS facility.
Figure 18: Distribution of Uninsured Coverage and Behavioral Health Services (BHS) Facilities in Orange County by Zip Code Tabulation Areas (ZCTA)

Note: Zip Code Tabulation Areas (ZCTA) are generalized areal representations of mailing address zip codes used by the United States Postal System. The U.S. Census Bureau publishes statistical census data by ZCTA.
English Speakers
Approximately 19% (586,471) of Orange County residents are not fluent in English. As shown in Figure 19, the most common non-English languages, spoken among those not fluent in English, are Spanish (11.3%), Vietnamese (3.2%), Korean (1.6%), and Chinese (1.2%).
Figure 19: Percent of non-English Speakers in Orange County
Spanish
Vietnamese
Korean
Chinese
Tagalog
Arabic
Farsi
Khmer 1.6%
1.2%
0.5%
0.3%
0.4%
0.1% 3.2% 11.3%
0.0% 2.0% 4.0% 6.0% 8.0% 10.0% 12.0% Non-English Speakers
Of the 201 BHS facilities in Orange County, over half (61%; n=123) provide services in Spanish (Table 9). The other most common linguistic services offered at BHS facilities include Vietnamese (38%; n=76), Farsi (23%; n=47), and Korean (17%; n=35).
Table 9. Linguistic Services Offered at BHS Facilities and Population of non-English Speakers
Language
BHS Facilities Population of non-English Speakers Number Percent a Number Percent
Spanish Vietnamese Korean Chinese (Mandarin) Tagalog Arabic 123 61% 357,014 11.3% 76 38% 101,780 3.2% 35 17% 50,763 1.6% 8 10 4% 38,822 1.2% 5% 15,098 <1%
6 3% 7,943 <1%
Farsi 47 23% 11,813 <1%
Khmer 3 1% 3,238 <1%
a Percentages are calculated with a denominator of 201 which is the total number of BHS facilities in Orange County
Figures 20-27 display maps of the locations of BHS facilities offering specific linguistic services by the resident population speaking those respective languages. The maps are color coded to capture a low, medium and high density of non-English speakers where density is measured as the number of non-English speakers per 10,000 residents.
Spanish-Speaking Population: The highest density of Spanish speaking residents, measured as the number of Spanish speakers per 10,000 residents, is in the cities of Huntington Beach, Costa Mesa, Anaheim, Orange, Santa Ana, and San Juan Capistrano. As shown in Figure 20, there are a total of 123 BHS facilities with Spanish-speaking staff, accounting for 61% of all BHS facilities in the County. The Spanish-speaking facilities are located throughout Orange County and the majority (69%; n=85) are situated in cities with a high density of Spanish speaking residents (La Habra, Fullerton, Anaheim, Orange, Santa Ana, and Garden Grove; Table 10).
Figure 20: Distribution of Spanish speakers per 10,000 residents and BHS Facilities with Spanish Language Services by Zip Code Tabulation Areas (ZCTA) in Orange County

Note: Zip Code Tabulation Areas (ZCTA) are generalized areal representations of mailing address zip codes used by the United States Postal System. The U.S. Census Bureau publishes statistical census data by ZCTA.
Table 10. Number of BHS facilities with Spanish-Speaking Staff in Zip Code Tabulation Areas (ZCTA*) with the Highest Density of Spanish-Speaking Residents
ZCTA* City No. of Spanish speakers per 10,000 residents
No. of BHS facilities with Spanish-speaking Staff
90620 Buena Park 90621 Buena Park 90631 La Habra
90680
Stanton 92530 Trabuco Canyon 92627 Costa Mesa 92647 Huntington Beach 92655 Midway City 92675 San Juan Capistrano 92701 Santa Ana 1,091.6 2,374.7 1,692.3 2,018.8 1,640.5 1,605.1 966.6 1,056.3 1,761.4 4,864.0 1 1 1 0 0 1 1 0 0 18
92703 Santa Ana 92704 Santa Ana 92705 Santa Ana 92706 Santa Ana 92707 Santa Ana 4,148.3 3,000.3 1,402.3 3,504.5 3,682.0 0 1 13 2 4
92780 92801 92802 92804 92805 92806 92832
Tustin Anaheim Anaheim Anaheim Anaheim Anaheim Fullerton 1,611.3 2,017.5 2,521.4 1,585.5 3,270.3 1,874.8 1,935.3 0 4 0 1 7 5 3
92833
Fullerton 92840 Garden Grove 92841 Garden Grove 92843 Garden Grove 92866 92867 92868 92869 92870 Orange Orange Orange Orange Placentia 1,167.5 1,370.6 1,098.4 1,645.3 2,125.5 1,155.8 1,582.1 1,354.7 1,034.3 0 4 1 1 2 1 12 0 1
TOTAL 85
*Note: Zip Code Tabulation Areas (ZCTA) are generalized areal representations of the mailing address zip codes used by the United States Postal System. The U.S. Census Bureau publishes statistical census data by ZCTA. ZCTA 92530 is not part of the US postal zip code system but 92530 geographically overlaps with the postal zip code 92679 in Trabuco Canyon.
Vietnamese-Speaking Population: The majority of Vietnamese-speaking residents are located in the northwest region of Orange County covering the cities of Huntington Beach, Westminster, Garden Grove, Santa Ana and Anaheim (Figure 21). There are a total of 76 BHS facilities with Vietnamese-speaking staff, accounting for 38% of all BHS facilities. Several of the Vietnamesespeaking BHS facilities are located in the northwest region of the county where there is a high density of Vietnamese speaking residents. Of the 76 Vietnamese-speaking BHS facilities, 54% (n=41) are located in areas with a high density of Vietnamese speaking residents (Table 11). However, there is a lack of Vietnamese language services in Yorba Linda, Tustin, and Irvine where a high density of Vietnamese-speaking individuals reside.
Figure 21: Distribution of Vietnamese speakers per 10,000 residents and BHS Facilities with Vietnamese Language Services by Zip Code Tabulation Areas (ZCTA) in Orange County

Note: Zip Code Tabulation Areas (ZCTA) are generalized areal representations of mailing address zip codes used by the United States Postal System. The U.S. Census Bureau publishes statistical census data by ZCTA.
Table 11. Number of BHS facilities with Vietnamese-Speaking Staff in Zip Code Tabulation Areas (ZCTA*) with the Highest Density of Vietnamese-Speaking Residents
ZCTA* City No. of Vietnamese speakers per 10,000 residents No. of BHS facilities with Vietnamesespeaking Staff
90620 Buena Park 132.3 1
90680 92606 Stanton Irvine 1,010.3 134.4 0 0
92620
Irvine 92626 Costa Mesa 92646 Huntington Beach 92647 Huntington Beach 92649 Huntington Beach 92655 Midway City 92683 Westminster 92703 Santa Ana 92704 Santa Ana 134.8 114.5 110.5 252.1 147.2 2,576.3 2,501.6 853.5 777.9 0 7 0 0 0 0 6 0 1
92706 Santa Ana 92707 Santa Ana 92708 Fountain Valley 92780 Tustin
92782 92801
Tustin Anaheim
92802 92804 92805 92806
Anaheim Anaheim Anaheim Anaheim 92840 Garden Grove 92841 Garden Grove 92843 Garden Grove 92844 Garden Grove 92845 Garden Grove 92868 92869 92870 Orange Orange Placentia 92887 Yorba Linda 247.7 164.6 988.8 165.0 228.9 228.8 366.3 623.6 102.5 187.4 1,428.1 1,839.2 2,400.4 2,784.4 334.4 232.8 124.9 113.5 175.0 1 3 2 0 0 2 0 0 4 3 4 1 0 0 0 5 0 1 0
TOTAL 41
*Note: Zip Code Tabulation Areas (ZCTA) are generalized areal representations of the Zip Code areas used by the United State Postal System for mailing address. The U.S. Census Bureau publishes statistical census data by ZCTA.
Korean-Speaking Population: A high density of Korean-speaking residents are located in the northern region of the county, in cities bordering Los Angeles County (Seal Beach, Cypress, Garden Grove Buena Park, Fullerton, La Habra), as well as in the city of Irvine (Figure 22). There are a total of 35 BHS facilities with Korean-speaking staff, which accounts for 17% of all BHS facilities in the county (Table 12). Only seven facilities are situated in areas with a high presence of Korean-speaking residents There are few of facilities with Korean-speaking staff in the cities bordering Los Angeles County and the city of Irvine.
Figure 22: Distribution of Korean speakers per 10,000 residents and BHS Facilities with Korean Language Services by Zip Code Tabulation Areas (ZCTA) in Orange County

Note: Zip Code Tabulation Areas (ZCTA) are generalized areal representations of mailing address zip codes used by the United States Postal System. The U.S. Census Bureau publishes statistical census data by ZCTA.
Table 12. Number of BHS facilities with Korean-Speaking Staff in Zip Code Tabulation Areas (ZCTA*) with the Highest Density of Korean-Speaking Residents
ZCTA* City No. of Korean speakers per 10,000 residents
No. of BHS facilities with Korean-speaking Staff
90620 Buena Park 537.9 1
90621 Buena Park 90623 La Palma 1,196.8 742.0 1 0
90630 90631 Cypress La Habra 876.5 205.1 0 0
90638 La Mirada 487.8 0
90703 Santa Ana 90720 Los Alamitos 90740 Seal Beach 90742 Huntington Beach 92602 Irvine
92603 Irvine 744.9 155.2 207.3 174.2 382.0 167.9 0 0 0 0 0 0
92606
Irvine 92610 Foothill Ranch 92612 92614 Irvine Irvine
92617 Irvine
92618 Irvine
92620
Irvine 92637 Laguna Woods 92655 Midway City 92782 Tustin
92801 Anaheim
92821 Brea 161.8 179.8 228.9 162.0 197.4 225.6 592.2 402.6 198.7 280.7 193.2 250.4 0 0 0 1 0 0 0 0 0 0 0 0
92823 92831 92832 92833 92835
Brea Fullerton Fullerton Fullerton Fullerton 92841 Garden Grove 92844 Garden Grove 92868 Orange 322.4 170.1 206.5 1,132.5 556.5 327.4 327.8 182.1 0 0 1 0 0 0 0 3
TOTAL 7
*Note: Zip Code Tabulation Areas (ZCTA) are generalized areal representations of the Zip Code areas used by the United State Postal System. The U.S. Census Bureau publishes statistical census data by ZCTA. ZCTA 90742 is not part of the US postal zip code system but 90742 geographically overlaps with the postal zip code 92649 in Huntington Beach.
Chinese-Speaking Population: The majority of Chinese-speaking residents are located in the northeast (Fullerton, Brea, and Yorba Linda) and southern regions (Irvine and Laguna Niguel) with additional Chinese-speaking residents in the cities of Cypress, Garden Grove and Westminster (Figure 23). There are a total of 8 BHS facilities with Chinese-speaking staff, which accounts for 4% of all BHS facilities (Table 13). Nearly all of the Chinese-speaking facilities are located in areas that do not have a high presence of Chinese-speaking residents. Rather there is only 1 Chinese-speaking BHS facility in an area with a high density of Chinese-speaking residents and this is in the city of Westminster.
Figure 23: Distribution of Chinese speakers per 10,000 residents and BHS Facilities with Chinese Language Services by Zip Code Tabulation Areas (ZCTA) in Orange County

Note: Zip Code Tabulation Areas (ZCTA) are generalized areal representations of mailing address zip codes used by the United States Postal System. The U.S. Census Bureau publishes statistical census data by ZCTA.
Table 13. Number of BHS facilities with Chinese-Speaking Staff in Zip Code Tabulation Areas (ZCTA*) with the Highest Density of Chinese-Speaking Residents
ZCTA* City No. of Chinese speakers per 10,000 residents
No. of BHS facilities with Chinese-speaking Staff
90621 Buena Park 109.7 0
90623 La Palma 343.4 0
90630
Cypress 90703 Santa Ana 291.7 638.1 0 0
92602 Irvine 200.4 0
92603 Irvine 471.0 0
92604 Irvine
92606
Irvine 92610 Foothill Ranch 92612 Irvine
92614 92617 Irvine Irvine 399.9 644.0 173.4 451.2 511.3 464.0 0 0 0 0 0 0
92618 Irvine
92620
Irvine 92637 Laguna Woods 92656 Aliso Viejo 92657 Newport Coast 92677 Laguna Niguel 92683 Westminster 92708 Fountain Valley 92782 Tustin
92804 Anaheim
92821 Brea
92823 Brea
92831 92833 92835
Fullerton Fullerton Fullerton 92841 Garden Grove 92843 Garden Grove 92861 Villa Park 92886 Yorba Linda 92887 Yorba Linda 499.3 598.4 240.5 115.7 133.2 110.6 122.9 208.9 328.0 110.0 131.1 344.5 285.2 191.7 287.4 173.1 119.3 166.6 165.5 198.6 0 0 0 0 0 0 1 0 0 0 0 0 0 0 0 0 0 0 0 0
TOTAL 1
*Note: Zip Code Tabulation Areas (ZCTA) are generalized areal representations of the mailing zip codes used by the United State Postal System. The U.S. Census Bureau publishes statistical census data by ZCTA.
Tagalog-Speaking Population: Tagalog-speaking residents are located throughout Orange County. As indicated in Figure 24, the highest density of Tagalog-speaking residents are in the northern (Buena Park, Garden Grove, Santa Ana, Fullerton, Anaheim, and Brea) and southern (Tustin, Irvine, Lake Forest, Mission Viejo) regions. There are a total of 10 BHS facilities with Tagalog-speaking staff, accounting for 5% of all BHS facilities (Table 14). All of these facilities are located in the northern region of the county with 5 of the Tagalog-speaking BHS facilities situated in areas with a high density of Tagalog-speaking residents. There is an absence of Tagalog-speaking staff in the southern region of the county where there is a high presence of Tagalog-speaking residents.
Figure 24: Distribution of Tagalog speakers per 10,000 residents and BHS Facilities with Tagalog Language Services by Zip Code Tabulation Areas (ZCTA) in Orange County

Note: Zip Code Tabulation Areas (ZCTA) are generalized areal representations of mailing address zip codes used by the United States Postal System. The U.S. Census Bureau publishes statistical census data by ZCTA.
Table 14. Number of BHS facilities with Tagalog-Speaking Staff in Zip Code Tabulation Areas (ZCTA*) with the Highest Density of Tagalog-Speaking Residents
ZCTA* City No. of Tagalog speakers per 10,000 residents
No. of BHS facilities with Tagalog-speaking Staff
90620 Buena Park 344.5 0
90621 Buena Park 90623 La Palma 226.8 107.1 0 0
90630 90631
Cypress La Habra 90638 La Mirada 90703 La Palma 90720 Los Alamitos 92604 Irvine
92606 Irvine 102.3 47.3 137.9 265.1 77.6 57.4 57.5 0 0 0 0 0 0 0
92614
Irvine 92626 Costa Mesa 92630 Lake Forest 92655 Midway City 92656 Aliso Viejo 92688 Rancho Santa Margarita 92694 Ladera Ranch 43.7 56.0 104.6 41.3 43.6 48.4 55.0 0 0 0 0 0 0 0
92707 Santa Ana 43.2 1
92780 92801 92802 92804 92806 92808
Tustin Anaheim Anaheim Anaheim Anaheim Anaheim
92821 92835
Brea Fullerton 92840 Garden Grove 92841 Garden Grove 92845 Garden Grove 92865 92868 92870 Orange Orange Placentia 67.1 102.9 42.1 156.4 74.3 55.4 50.3 67.3 50.3 64.4 47.6 102.1 47.9 73.7 0 1 0 1 0 0 0 0 1 0 0 0 1 0
TOTAL 5
*Note: Zip Code Tabulation Areas (ZCTA) are generalized areal representations of the mailing zip codes used by the United State Postal System. The U.S. Census Bureau publishes statistical census data by ZCTA. ZCTA 90703 is not part of the US postal zip code system but 90703 geographically overlaps with the postal zip code 90623 in La Palma.
Arabic-Speaking Population: The highest density of the Arabic-speaking population is located in the cities of Seal Beach, Westminster, Buena Park, Fullerton, and Anaheim (northern region) and the cities of Tustin, Irvine, Lake Forest, and Mission Viejo (southern region). A total of 6 BHS facilities have Arabic-speaking staff, which accounts for 3% of all BHS facilities. Most of these Arabic-speaking facilities are in the city of Santa Ana (Figure 25); an area with the lowest density of Arabic-speaking residents. The remaining Arabic-speaking BHS facilities are located in areas with a high density of Arabic-speaking residents (Table 15).
Figure 25: Distribution of Arabic speakers per 10,000 residents and BHS Facilities with Arabic Language Services by Zip Code Tabulation Areas (ZCTA) in Orange County

Note: Zip Code Tabulation Areas (ZCTA) are generalized areal representations of mailing address zip codes used by the United States Postal System. The U.S. Census Bureau publishes statistical census data by ZCTA.
Table 15. Number of BHS facilities with Arabic-Speaking Staff in Zip Code Tabulation Areas (ZCTA*) with the Highest Density of Arabic-Speaking Residents
ZCTA* City No. of Arabic speakers per 10,000 residents
No. of BHS facilities with Arabic-speaking Staff
90620 Buena Park 35.5 0
90623 La Palma 49.2 0
90630 90680 90703
Cypress Stanton La Palma 90740 Seal Beach 92602 92604 Irvine Irvine 32.0 30.9 55.6 25.6 178.5 55.6 0 0 0 0 0 0
92606 92612 Irvine Irvine 137.1 65.0 0 0
92614 92618 Irvine Irvine 100.0 161.8 1 0
92620
Irvine 92630 Lake Forest 92647 Huntington Beach 92656 Aliso Viejo 92683 Westminster 92688 Rancho Santa Margarita 92691 Mission Viejo 92708 Fountain Valley 92782 Tustin
92801 Anaheim
92802 92804 Anaheim Anaheim
92806 Anaheim
92821 92831
Brea Fullerton 92841 Garden Grove 92865 92868 92870 Orange Orange Placentia 26.7 37.8 91.6 26.3 33.3 42.4 29.6 45.7 28.7 54.3 61.1 100.9 31.1 30.0 44.5 59.1 24.9 22.6 23.1 0 0 0 0 0 0 0 0 0 1 0 0 0 0 0 0 0 1 0
TOTAL 3
*Note: Zip Code Tabulation Areas (ZCTA) are generalized areal representations of the mailing zip codes used by the United State Postal System. The U.S. Census Bureau publishes statistical census data by ZCTA. ZCTA 90703 is not part of the US postal zip code system but 90703 geographically overlaps with the postal zip code 90623 in La Palma.
Farsi-Speaking Population: A high density of Farsi-speaking residents are located in northeastern region of the county in the cities of Anaheim, Orange and Yorba Linda and in the southern region covering the cities of Newport Beach, Irvine, Tustin, Lake Forest, Mission Viejo, Laguna Niguel, Trabuco Canyon, and San Juan Capistrano. A total of 47 BHS facilities have Farsispeaking staff, accounting for 23% of all BHS facilities. The majority of Farsi-speaking facilities are in the cities of Santa Ana, Orange, and Anaheim (Figure 26). Only 19% (n=9) of the Farsispeaking facilities are located in regions of the county with a high density of Farsi-speaking residents (Table 16).
Figure 26: Distribution of Farsi speakers per 10,000 residents and BHS Facilities with Farsi Language Services by Zip Code Tabulation Areas (ZCTA) in Orange County

Note: Zip Code Tabulation Areas (ZCTA) are generalized areal representations of mailing address zip codes used by the United States Postal System. The U.S. Census Bureau publishes statistical census data by ZCTA.
Table 16. Number of BHS facilities with Farsi-Speaking Staff in Zip Code Tabulation Areas (ZCTA*) with the Highest Density of Farsi-Speaking Residents
ZCTA* City No. of Farsi speakers per 10,000 residents No. of BHS facilities with Farsi-speaking Staff
90630 90680 Cypress Stanton 42.0 24.6 0 0
92530 Trabuco Canyon 92602 Irvine 24.0 166.5 0 0
92603 92604 92606 92612 Irvine Irvine Irvine Irvine 133.1 125.7 217.5 265.3 0 0 0 0
92614 Irvine 238.7 1
92618 Irvine 126.8 0
92620
Irvine 92625 Corona del Mar 92630 Lake Forest 92637 Laguna Woods 92653 Laguna Hills 92656 Aliso Viejo 92657 Newport Coast 92663 Newport Beach 92675 San Juan Capistrano 92677 Laguna Niguel 92688 Rancho Santa Margarita 92691 Mission Viejo 92692 Mission Viejo 92694 Ladera Ranch 92782 92807 92808 92831 Tustin Anaheim Anaheim Fullerton 196.8 34.9 55.7 125.4 107.1 115.7 93.6 45.0 42.4 142.8 55.3 121.4 175.8 64.2 57.0 81.3 134.4 60.2 0 0 3 0 0 1 0 0 0 0 0 3 0 0 0 0 0 0
92867
Orange 92886 Yorba Linda 92887 Yorba Linda 30.2 34.0 65.5 1 0 0
TOTAL 9
*Note: Zip Code Tabulation Areas (ZCTA) are generalized areal representations of the mailing zip codes used by the United State Postal System. The U.S. Census Bureau publishes statistical census data by ZCTA. ZCTA 92530 is not part of the US postal zip code system but 92530 geographically overlaps with the postal zip code 92679 in Trabuco Canyon.
Khmer-Speaking Population: The majority of the Khmer-speaking population of Orange County is located in the northern region, primarily in the cities of Westminster, Santa Ana, Buena Park, Fullerton, Anaheim, Brea and Yorba Linda (Figure 27). There are 3 BHS facilities with Khmerspeaking staff, and all of these are located in the northwestern region covering the cities of Garden Grove and Anaheim. However, of the 3 BHS facilities, only one facility, located in Garden Grove, is within close proximity to areas that have a high presence of Khmer-speaking residents (Table 17).
Figure 27: Distribution of Khmer speakers per 10,000 residents and BHS Facilities with Khmer Language Services by Zip Code Tabulation Areas (ZCTA) in Orange County

Note: Zip Code Tabulation Areas (ZCTA) are generalized areal representations of mailing address zip codes used by the United States Postal System. The U.S. Census Bureau publishes statistical census data by ZCTA.
Table 17. Number of BHS facilities with Khmer-Speaking Staff in Zip Code Tabulation Areas (ZCTA*) with the Highest Density of Khmer-Speaking Residents
ZCTA* City No. of Khmer speakers per 10,000 residents No. of BHS facilities with Khmer-speaking Staff
90623 La Palma 20.0 0
90630 90703
Cypress La Palma 90720 Los Alamitos 90815 Los Alamitos 13.0 35.5 21.1 13.4 0 0 0 0
92604 Irvine 17.9 0
92614
Irvine 92655 Midway City 92683 Westminster 92701 Santa Ana 92703 Santa Ana 92707 Santa Ana 92708 Fountain Valley 92804 Anaheim
92806 92807 Anaheim Anaheim
92823 92832
Brea Fullerton 92840 Garden Grove 92843 Garden Grove 92844 Garden Grove 92845 Garden Grove 92868 Orange
92869
Orange 92887 Yorba Linda 27.8 21.7 26.0 64.6 28.6 21.3 15.8 16.2 43.4 13.1 369.8 19.5 31.7 21.4 45.4 12.8 25.0 15.1 29.3 0 0 0 0 0 0 0 0 0 0 0 0 1 0 0 0 0 0 0
TOTAL 1
*Note: Zip Code Tabulation Areas (ZCTA) are generalized areal representations of the mailing zip codes used by the United State Postal System. The U.S. Census Bureau publishes statistical census data by ZCTA. ZCTA 90703 is not part of the US postal zip code system but it geographically overlaps with the postal zip code 90623 in La Palma. ZCTA 900815 is not part of the US postal zip code system but it geographically overlaps with the postal zip code 90720 in Los Alamitos.
Serious Psychological Distress
As previously described, the highest density of behavioral health services per 10,000 residents is in the northern region of the county. Additionally, there are a few zip codes in the southern region with a high density of BHS facilities (Figure 28). The overall prevalence of serious psychological distress among adults age 18 and older is 6.7%. Areas with a high density of BHS facilities spatially overlap with areas in which there is a high prevalence of serious psychological distress. However, there may be gaps in BHS coverage in San Juan Capistrano where there is a high density of prevalence of serious psychological distress but no BHS facility.
Figure 28: Distribution of Behavioral Health Services (BHS) per 10,000 Residents and Prevalence of Serious Psychological Distress across Orange County Zip Codes

Figure 29 displays zip codes with geographic discordance between the location of BHS facilities and the prevalence of serious psychological distress including:
1. Zip codes with a high density of BHS facilities (measured as the number of BHS facilities per 10,000 residents) and a low prevalence of serious psychological distress (high BHS –low SPD, shown in red in Figure 29), and;
2. Zip codes with a low density of BHS facilities and a high prevalence of serious psychological distress (low BHS – high SPD, shown in blue in Figure 29).
3. Non-discordant areas, shaded in grey in Figure 29, indicate zip codes in which there was less discrepancy between the availability of behavioral health services and the need for such services.
Figure 29: Geographic Discordance between the Density of Behavioral Health Services (BHS) Facilities and Prevalence of Serious Psychological Distress (SPD)

Note: Classification of high-low defined as follows: 0.49 ≤ High BHS density ≤ 6.17; low BHS density = 0; 7.3% ≤ high SPD ≤ 8.6%; low SPD ≤ 6.6%
Table 18 identifies the specific zip codes from Figure 30 in which the density of BHS facilities at the zip code-level was low relative to the prevalence of serious psychological distress (i.e., lowhigh) or conversely, where the density of BHS facilities was high relative to the prevalence of serious psychological distress (i.e., high-low).
Demographically, residents of the zip codes listed in Table 18 are more likely to be privately insured (71% vs. 65%) and less likely to be uninsured (9.3% vs. 12.6%) compared to residents of the remaining zip codes in Orange County. We therefore sought to determine whether the zip codes listed in Table 18, truly had low geographic coverage or no geographic coverage of mental health services.
Table 18. Disparities in Geographic Coverage of HCA Behavioral Health Services
City Zip Code Density of BHS facilities per 10,000 residents Prevalence of Serious Psychological Distress (SPD)
BHS Services relative to SPD
Density of office-based Psychiatrists per 10,000 residents a
Density of office-based Therapists per 10,000 residents a
Orange 92865 0 7.3% Low-High 0 (0) 0.98 (2) San Juan Capistrano 92675 0 7.3% Low-High 0.27 (1) 1.07 (4) Anaheim 92808 0 7.6% Low-High 0.94 (2) 0 (0) Brea 92821 0 7.4% Low-High 0.55 (2) 1.36 (5) Irvine 92612 0 8.0% Low-High 1.35 (9) 3.03 (9) Rancho Santa Margarita 92688 0 7.6% Low-High 0.22 (1) 0.45 (2) Foothill Ranch 92610 0 7.6% Low-High 0 (0) 0 (0) Capistrano Beach 92624 0 7.4% Low-High 0 (0) 1.42 (1) La Palma 90623 0.61 6.2% High-Low 0.61 (1) 0 (0) Newport Beach 92660 0.58 6.0% High-Low 7.28 (25) 11.36 (39) Laguna Beach 92651 1.63 4.7% High-Low 1.23 (3) 1.63 (4) Laguna Hills 92653 0.68 6.5% High-Low 3.06 (9) 7.49 (22) Santa Ana 92705 5.0 6.6% High-Low 1.09 (5) 2.39 (11) Westminster 92683 0.98 5.9% High-Low 0.22 (2) 0.11 (1) Midway City 92683 1.16 5.7% High-Low 0 (0) 0 (0)
a Note: the value enclosed in parenthesis is the number of office-based establishments
Using data from the U.S. Census County Business Patterns Survey, we examined the geographic availability of mental health specialists (e.g., psychiatrists) or practitioners (e.g., therapists) at the zip code level. In Orange County, there were a total of 165 office-based establishments with a psychiatrist(s) of which the majority of these establishments (80% or n=132 establishments) had between 1-4 employees. Further, there were a total of 303 office-based establishments with a mental health therapist in Orange County of which 83% of these
establishments (n=253) had between 1-4 employees. Based on this database, we calculated the density of office-based establishments per 10,000 residents.
As shown in Table 18, the density of office-based establishments varied across zip codes. Importantly, zip codes with no geographic coverage of BHS facilities did in fact have at least one establishment with a mental health psychiatrist(s) and/or therapist(s) (with the exception of Foothill Ranch). Irvine (zip code 92612), which had the highest prevalence of serious psychological distress, had a total of 18 office-based establishments with either a psychiatrist(s) or therapist(s). Note, we defined ‘no geographic coverage of BHS facilities’ as zip codes that were absent of any behavioral health services as reflected in the databases obtained through OC HCA or the Substance Abuse and Mental Health Services Administration (SAMHSA).
8. Estimating Needs Related to Hospital and Emergency
Department Utilization for Psychiatric Care
To supplement these geographic analyses, we examined psychiatric care-related inpatient and emergency department services use to determine whether there are gaps in the availability of psychiatric inpatient beds in Orange County. There was an expressed concern that limited availability of psychiatric beds was leading to overnight stays in the emergency room. Data on inpatient admissions and emergency department encounters were obtained from the Office of Statewide Planning and Development (OSHPD). Data on the number of psychiatric beds in a hospital were obtained from OSHPD’s Hospital Annual Utilization Report.
Inpatient admissions data were used to calculate the number of individuals who were staying overnight at each the hospital for psychiatric care in Orange County in 2015. Psychiatric-related inpatient admissions were identified using the Medicare Severity Diagnosis Related Group (MSDRG). The MS-DRG classification system uses diagnosis and procedure codes to identify the primary reason for the inpatient stay. We included all admissions with MS-DRGs related to psychiatric care. We then used the admission and discharge dates to identify the number of individuals who were staying overnight at each hospital for psychiatric care for each day in 2015. The mean number of individuals with inpatient psychiatric care was 23.6 (SD=16.5) individuals per hospital per day (Table 19). The majority of admissions (82%) were related to psychosis. The average length of inpatient stay was 11.8 days (SD=22.3). A large percentage of inpatient admissions were among repeat users: 38% of admissions were among individuals who had an admission previously during the year.
Emergency department encounter data were used to calculate the number of individuals who had a visit for psychiatric care in Orange County in 2015. Psychiatric-related emergency department visits were identified using the principal diagnosis code for the encounter. We included all emergency department visits with diagnoses related to psychiatric care. We then used the encounter dates to identify the number of individuals who were receiving psychiatric care at each hospital emergency department for psychiatric care for each day in 2015. The mean number of individuals with emergency department psychiatric care was 2.4 (SD=2.3) individuals per hospital per day (Table 19). The most common diagnoses were related to anxiety (47%), mood disorders (26%) and schizophrenia or psychosis (19%). A large percentage of emergency department visits were among repeat users: 37% of visits were among individuals who had an admission previously during the year.
Table 19: Select Characteristics of Psychiatric-Related Inpatient and Emergency Department Admissions in Orange County, 2015
Mean number of individuals receiving care per hospital per day Proportion of admissions related to psychosis Proportion of patients who were repeat users Psychiatric-Related Inpatient Admissions
23.6 (SD=16.5)
82% 38%
Emergency Department Psychiatric Visits
2.4 (SD=2.3)
19% 37%
We combined inpatient and emergency department data at the hospital level. This provided data on the number of individuals with overnight stays and with emergency department visits for psychiatric care for each hospital and each day during 2015. Using data from Hospital Annual Utilization Report, we created an indicator variable for when the hospital met or exceeded their capacity for overnight stays for psychiatric care.
We identified 12 hospitals with psychiatric beds in Orange County in 2015. We excluded two hospitals that did not have an associated emergency department: College Hospital Costa Mesa and Newport Bay Hospital. The remaining 10 hospitals are shown in Table 20 including their number of licensed psychiatric beds and the number of days in 2015 when the number of individuals with overnight stays for psychiatric care exceeded the number of licensed psychiatric beds. In total there were 56 hospital day combinations during 2015 when hospitals exceeded their capacity for inpatient psychiatric care.
Table 20: Hospitals with Licensed Psychiatric Beds in Orange County and the Number of Days Meeting or Exceeding their Capacity for Inpatient Psychiatric Care in 2015
Hospital Name
Chapman Global Medical Center Anaheim Global Medical Center Number of Psychiatric Beds
12 90
Days Meeting or Exceeding Capacity in 2015
5 0
Huntington Beach Hospital La Palma Intercommunity Hospital Los Alamitos Medical Center
25 17 25 0 3 15
South Coast Global Medical Center University of California Irvine Medical Center Mission Hospital Laguna Beach St. Joseph Hospital - Orange West Anaheim Medical Center
23 48
36 37 30 0 3
0 0 30
We used regression analysis to determine whether emergency department admissions were related to a hospital meeting or exceeding its capacity for inpatient psychiatric care. We used a random-effects regression with each hospital serving as a panel. The number of emergency department visits on a given day was the dependent or outcome variable, and the indicator variable for hospital capacity was the independent or predictor variable. We found no relationship between emergency department visits and meeting or exceeding capacity for inpatient psychiatric care (P=.474). We also found no relationship when limiting the analysis to children or adults.
In summary, this section assessed the geographic availability of behavioral health services in Orange County to identify potential geographic disparities in access to care. In general, BHS facilities were significantly more likely to be located in the more populated regions of the county. Additionally, areas with a high density of BHS facilities spatially overlap with areas in which there is a high density of the publicly insured population as well as areas with a high prevalence of high psychological distress.
