RODMAN STREET proposal

Tim VanWingerden
Associate Cincinnati Office
D. 513.878.7750
tim.vanwingerden@marcusmillichap.com
Jordan Dickman
First Vice President Investments
Cincinnati Office
D. 513.878.7735
jordan.dickman@marcusmillichap.com
Nick Andrews
First Vice President Investments
Cincinnati Office
D. 513.878.7741

nicholas.andrews@marcusmillichap.com
Austin Sum
Senior Associate

Cincinnati Office
D. 513.878.7747
austin.sum@marcusmillichap.com
“OUR COMMITMENT IS TO HELP OUR CLIENTS CREATE


AND PRESERVE WEALTH BY PROVIDING THEM WITH
THE BEST REAL ESTATE INVESTMENT SALES, FINANCING, RESEARCH AND ADVISORY SERVICES AVAILABLE.”
06 28 38 46 50 62

THIS IS A BROKER PRICE OPINION OR COMPARATIVE MARKET ANALYSIS OF VALUE AND SHOULD NOT BE CONSIDERED AN APPRAISAL. This information has been secured from sources we believe to be reliable, but we make no representations or warranties, express or implied, as to the accuracy of the information. References to square footage or age are approximate. Buyer must verify the information and bears all risk for any inaccuracies.
Marcus & Millichap is not affiliated with, sponsored by, or endorsed by any commercial tenant or lessee identified in this marketing package. The presence of any corporation’s logo or name is not intended to indicate or imply affiliation with, or sponsorship or endorsement by, said corporation of Marcus & Millichap, its affiliates or subsidiaries, or any agent, product, service, or commercial listing of Marcus & Millichap, and is solely included for the purpose of providing tenant lessee information about this listing to prospective customers.
Thank you for allowing Marcus & Millichap the opportunity to provide a current Broker Pricing Opinion (Proposal) for RODMAN STREET, located in Louisville, Kentucky.
We are excited for the possibility to work with you on the marketing and sale of this asset. As you read this package, you will find that our team has had great success in executing multifamily transactions in the Midwest markets. We have an excellent track record of selling the “story” behind each asset we market. We will ensure maximum market value by identifying a diverse buyer pool, and leveraging Marcus & Millichap’s national platform to create the most competitive environment for sale.
Nicholas Andrews Tim VanWingerden Austin Sum

Austin Sum
Senior Associate
JD Schmerge

Associate
Tim VanWingerden
Associate
Brian Johnston
Associate
Austin Hall Associate
Alden Simms
Associate RESEARCH & EVALUATION
Sam Petrosino
Financial Analyst
CLIENT RELATIONS
Skyler Wilson
Client Relations Manager
MARKETING
Alex Papa
Marketing Coordinator
OPERATIONS
Brittany Campbell-Koch
Director of Operations


JORDAN DICKMAN
FIRST VICE PRESIDENTS DIRECTOR, NMHG
NICK ANDREWS
FIRST VICE PRESIDENTS DIRECTOR, NMHG
AUSTIN SUM
SENIOR INVESTMENT ASSOCIATE
JD SCHMERGE INVESTMENT ASSOCIATE
BRIAN JOHNSTON INVESTMENT ASSOCIATE
TIM VANWINGERDEN INVESTMENT ASSOCIATE
AUSTIN Hall INVESTMENT ASSOCIATE
ALDEN SIMMIS INVESTMENT ASSOCIATE
SAM PETROSNIO
VALUATION & RESEARCH
LIZ POPP
MIDWEST OPERATIONS MANAGER
JOSH CARUANA
VICE PRESIDENT
REGIONAL MANAGER
INDIANAPOLIS | CINCINNATI | LOUISVILLE | ST LOUIS | KANSAS CITY
JOHN SEBREE
SENIOR VICE PRESIDENT
NATIONAL DIRECTOR
NATIONAL MULTI HOUSING GROUP
MICHAEL GLASS
SENIOR VICE PRESIDENT
MIDWEST DIVISION MANAGER
NATIONAL DIRECTOR, MANUFACTURED HOME COMMUNITIES GROUP
SKLYER WILSON
CLIENT RELATIONS MANAGER
BRITTANY CAMPBELL-KOCH
DIRECTOR OF OPERATIONS
ALEX PAPA
MARKETING COORDINATOR
Value of recently closed
$84.4 billion
transactions in most recent year

Marcus & Millichap is the premier commercial real estate investment services firm in the United States. Founded in 1971 on a unique model that matches each property with the largest pool of pre-qualified investors, we leverage nearly five decades’ worth of experience and relationships to handle all of your commercial real estate needs. Our team of more than 2,000 professionals in the U.S. and Canada focuses exclusively on real estate investment sales, financing, research, and advisory services.
FOUNDED IN 1971 ON A UNIQUE METHODOLOGY
LARGEST POOL OF PRE-QUALIFIED INVESTORS IN THE INDUSTRY
MOVES CAPITAL ACROSS OUR NETWORK OF INVESTMENT PROFESSIONALS
MORE THAN 2,000 INVESTMENT PROFESSIONALS IN THE U.S. & CANADA
ACCESS TO THE INDUSTRY’S

MATCHING BUYERS & SELLERS
RESULTING IN THE MOST EFFICIENT PROCESS OF LOCALLY, REGIONALLY & NATIONALLY.
WITH AN EXCLUSIVE FOCUS ON REAL ESTATE INVESTMENT SALES, FINANCING, RESEARCH, AND ADVISORY SERVICES
LARGEST POOL OF PRIVATE & INSTITUTIONAL INVESTORS
Marcus & Millichap is the premier commercial real estate investment services firm in the United States. Founded in 1971 with a unique model that matches each property with the largest pool of pre-qualified investors, we leverage nearly five decades of experience and relationships to handle all your commercial real estate needs. Our team of more than 2,000 professionals in the United States and Canada focuses exclusively on real estate investment sales, financing, research and advisory services.
13,255 Transactions


In most recent year
6.74 Transactions closed Every Business Hour MOVING CAPITAL. MAXIMIZING VALUE.
We execute more tax-deferred exchanges than any other firm in the United States (32% of total transactions), and our market share is a direct benefit to clients. Over the years, we have developed the skills and expertise to maximize value and meet sensitive timelines required in a 1031 Exchange. With billions of dollars of commercial real estate exclusively listed with us at any time, motivated exchange buyers seek out Marcus & Millichap for quality investment opportunities. Through our industry-leading inventory, we deliver the best of both worlds – we maximize the value of your asset through our unparalleled marketing. We then help identify appropriate upleg options to execute a successful tax deferral acquisition.


The success of Marcus & Millichap is based on our collaborative culture of information sharing across our network of more than 2,000 investment professionals, which maximizes value for each of our clients.
Working with a unique platform that is antithetical to the concept of “pocket listings,” our investment professionals share all listings with the entire Marcus & Millichap team. Each professional specializes in a property type and has a database of local properties and owners, which is leveraged in every client assignment. Because each local agent specializes in a single product type in a specific geographic region, our clients have exposure across the U.S. and Canada with every investment..
Our foundation of information sharing maximizes pricing for our clients and gives us the largest inventory of any firm in the industry.
THE SIZE AND ACCESSIBILITY OF OUR INVENTORY ENABLES YOU TO SELL YOUR PROPERTY AND QUICKLY MOVE INTO ANOTHER PROFITABLE INVESTMENT.
2,000+ $84.4B
VALUE OF RECENTLY CLOSED TRANSACTIONS IN MOST RECENT YEAR



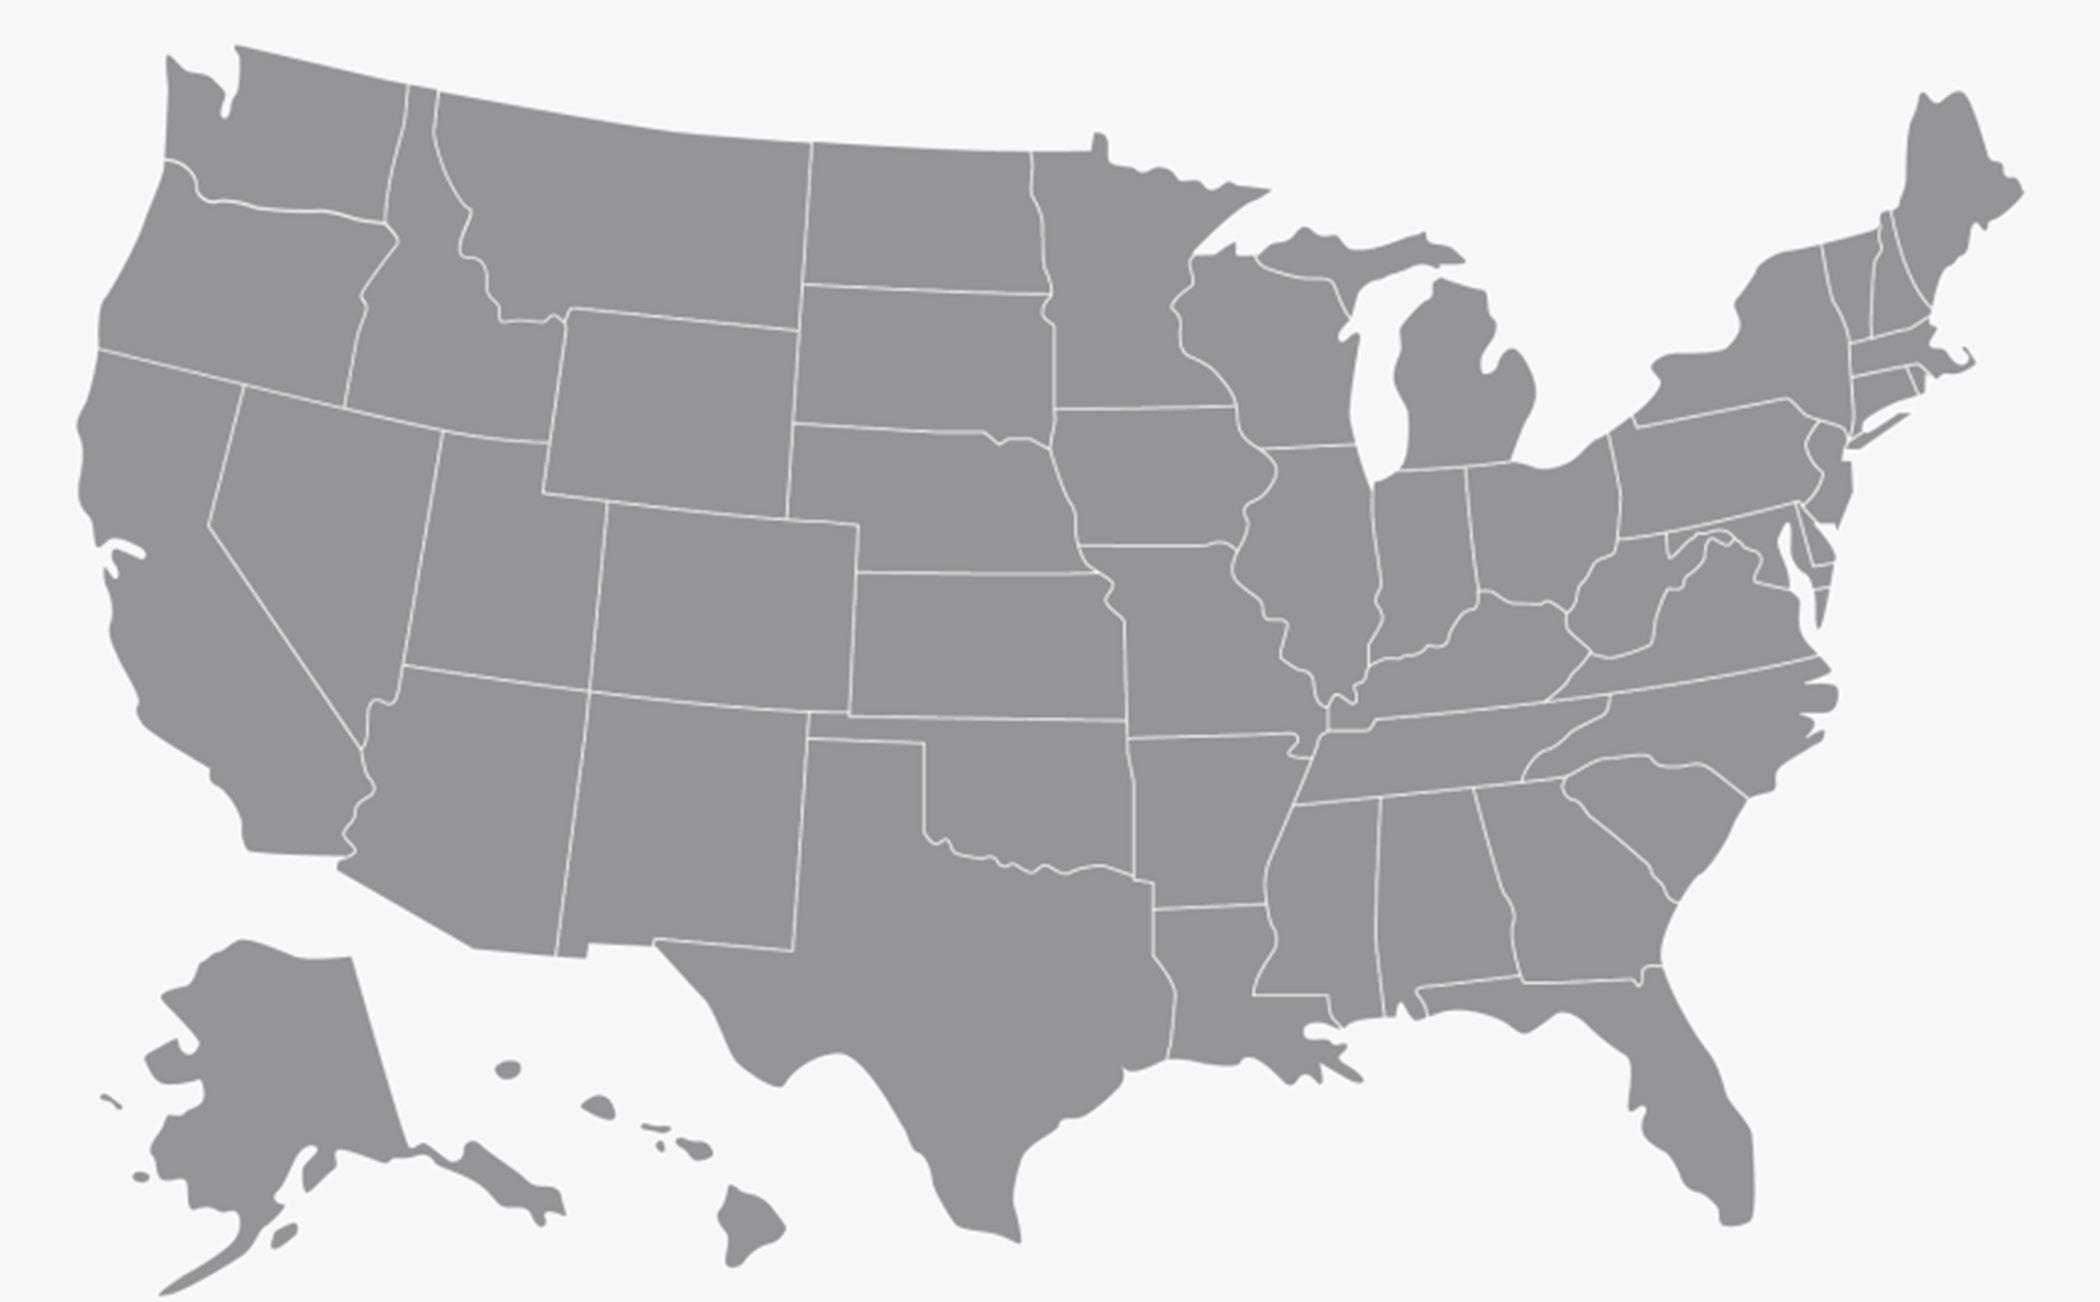
INBOUND / OUTBOUND
$2.1B - MW. OUTBOUND
$3.8B - MW. INBOUND
$9.2BB - W. OUTBOUND
$1.6B - W. INBOUND
$3.1B - S. OUTBOUND
$7.8B - S. INBOUND
$1.8B - TX/OK OUTBOUND

$6.4B - TX/OK INBOUND
$6.4B - NE. OUTBOUND
$1.4B - NE. INBOUND
$3.3B - MOUNTAIN OUTBOUND
$5.0B - MOUNTAIN INBOUND

The Marcus & Millichap GLOBE Capital Group provides the opportunity to expose your property to more foreign buyers with the guided expertise of our senior investment specialists. Our firm is comprised of 80+ offices throughout the US and Canada, and we provide investors with exclusive investment opportunities, financing capabilities, research, and advisory services.
With more inventory than any other firm, buyers seek Marcus & Millichap to fulfill their investment acquisition needs.
Our structured marketing process, coupled with the industry’s largest sales force, creates a competitive bidding environment for your listing
We maintain active relationships with the industry’s largest pool of 1031 exchange buyers, the most coveted buyers in the market.
This is why clients choose Marcus & Millichap over local, regional, or other national firms



Marcus & Millichap’s National Multi Housing Group (NMHG) provides the industry’s most dynamic and effective marketplace for the acquisition and disposition of apartment properties. With multifamily specialists in offices throughout the U.S. and Canada, NMHG is the industry leader in apartment transactions, having successfully executed on our clients’ behalf more than $106 billion of sales volume in the past five years.

Whether you’re looking to buy, sell, refinance, or hold, Marcus & Millichap leverages real-time market research to assess local and national trends, with specialized focus on individual property types. Backed by the collaborative culture of industry experts, your local investment professional will walk you through each phase of your investment strategy.
• Is holding my asset the most profitable choice in this market?
• How can I best take advantage of the capital markets to maximize my returns?
• Based on my investment risk tolerance and objectives, what opportunities should I consider?
• Is now the right time to sell?
• How can I leverage the capital markets to maximize my results?
• How do I optimize my position via a disposition?

• What alternatives and associated

• When is the right time to buy?
• What investment opportunities are available for my consideration?
• What are the risks in the current market?
• What are my financing options?
• How will an acquisition impact my portfolio’s returns?
• Strategic “hold” analysis

• Refinance and capitalization options
• Quarterly investment return analysis
• Ongoing market and submarket research
• Ongoing product-specific research

• Value and market positioning analysis
• Disposition buyer financing
• New acquisition financing
• 1031 exchange investment alternatives analysis

• Pre-acquisition analysis
• Financial investment analysis
• Market and submarket research
• Product-specific research

MMCC—our fully integrated, dedicated financing arm—is committed to providing superior capital market expertise, precisely managed execution, and unparalleled access to capital sources, providing the most competitive rates and terms.
We leverage our prominent capital market relationships with commercial banks, life insurance companies, CMBS, private and public debt/equity funds, Fannie Mae, Freddie Mac, and HUD to provide our clients with the greatest range of financing options.

Our dedicated, knowledgeable experts understand the challenges of financing and work tirelessly to resolve all potential issues for the benefit of our clients.
Optimum financing solutions to enhance value
Enhanced control through MMCC’s ability to qualify investor finance contingencies
Enhanced control through quickly identifying potential debt/equity sources, processing, and closing buyer’s finance alternatives
Enhanced control through MMCC’s ability to monitor investor/due diligence and underwriting to ensure timely, predictable closings
CLOSED 1,943 DEBT AND EQUITY FINANCINGS IN MOST RECENT YEAR
NATIONAL PLATFORM OPERATING WITHIN THE FIRM’S BROKERAGE OFFICES
$7.67 BILLION TOTAL NATIONAL VOLUME IN MOST RECENT YEAR

ACCESS TO MORE CAPITAL SOURCES THAN ANY OTHER FIRM IN THE INDUSTRY
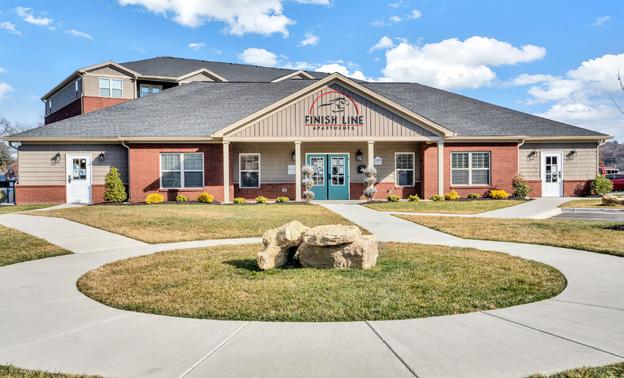
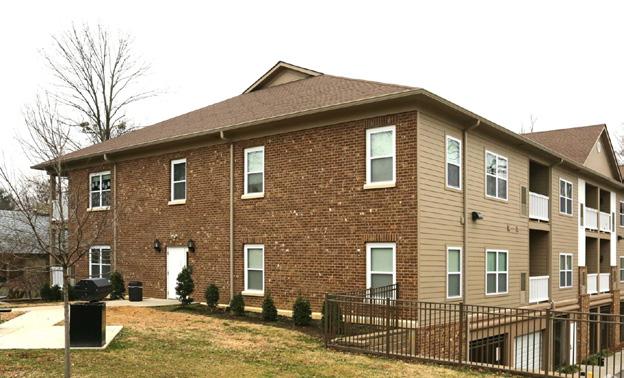
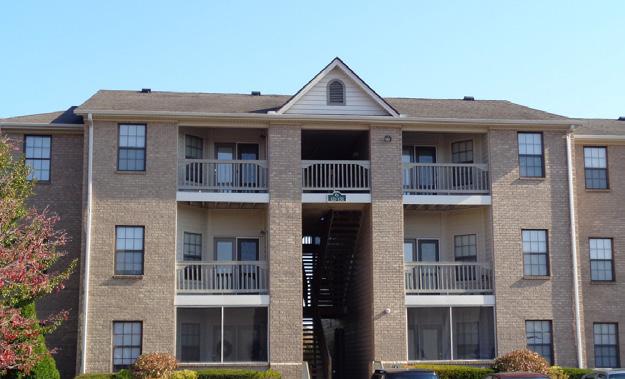
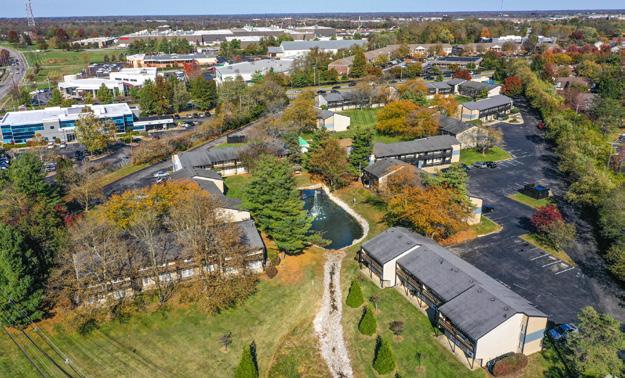
Our cutting-edge market research helps us advise our clients of existing asset performance and future opportunities.



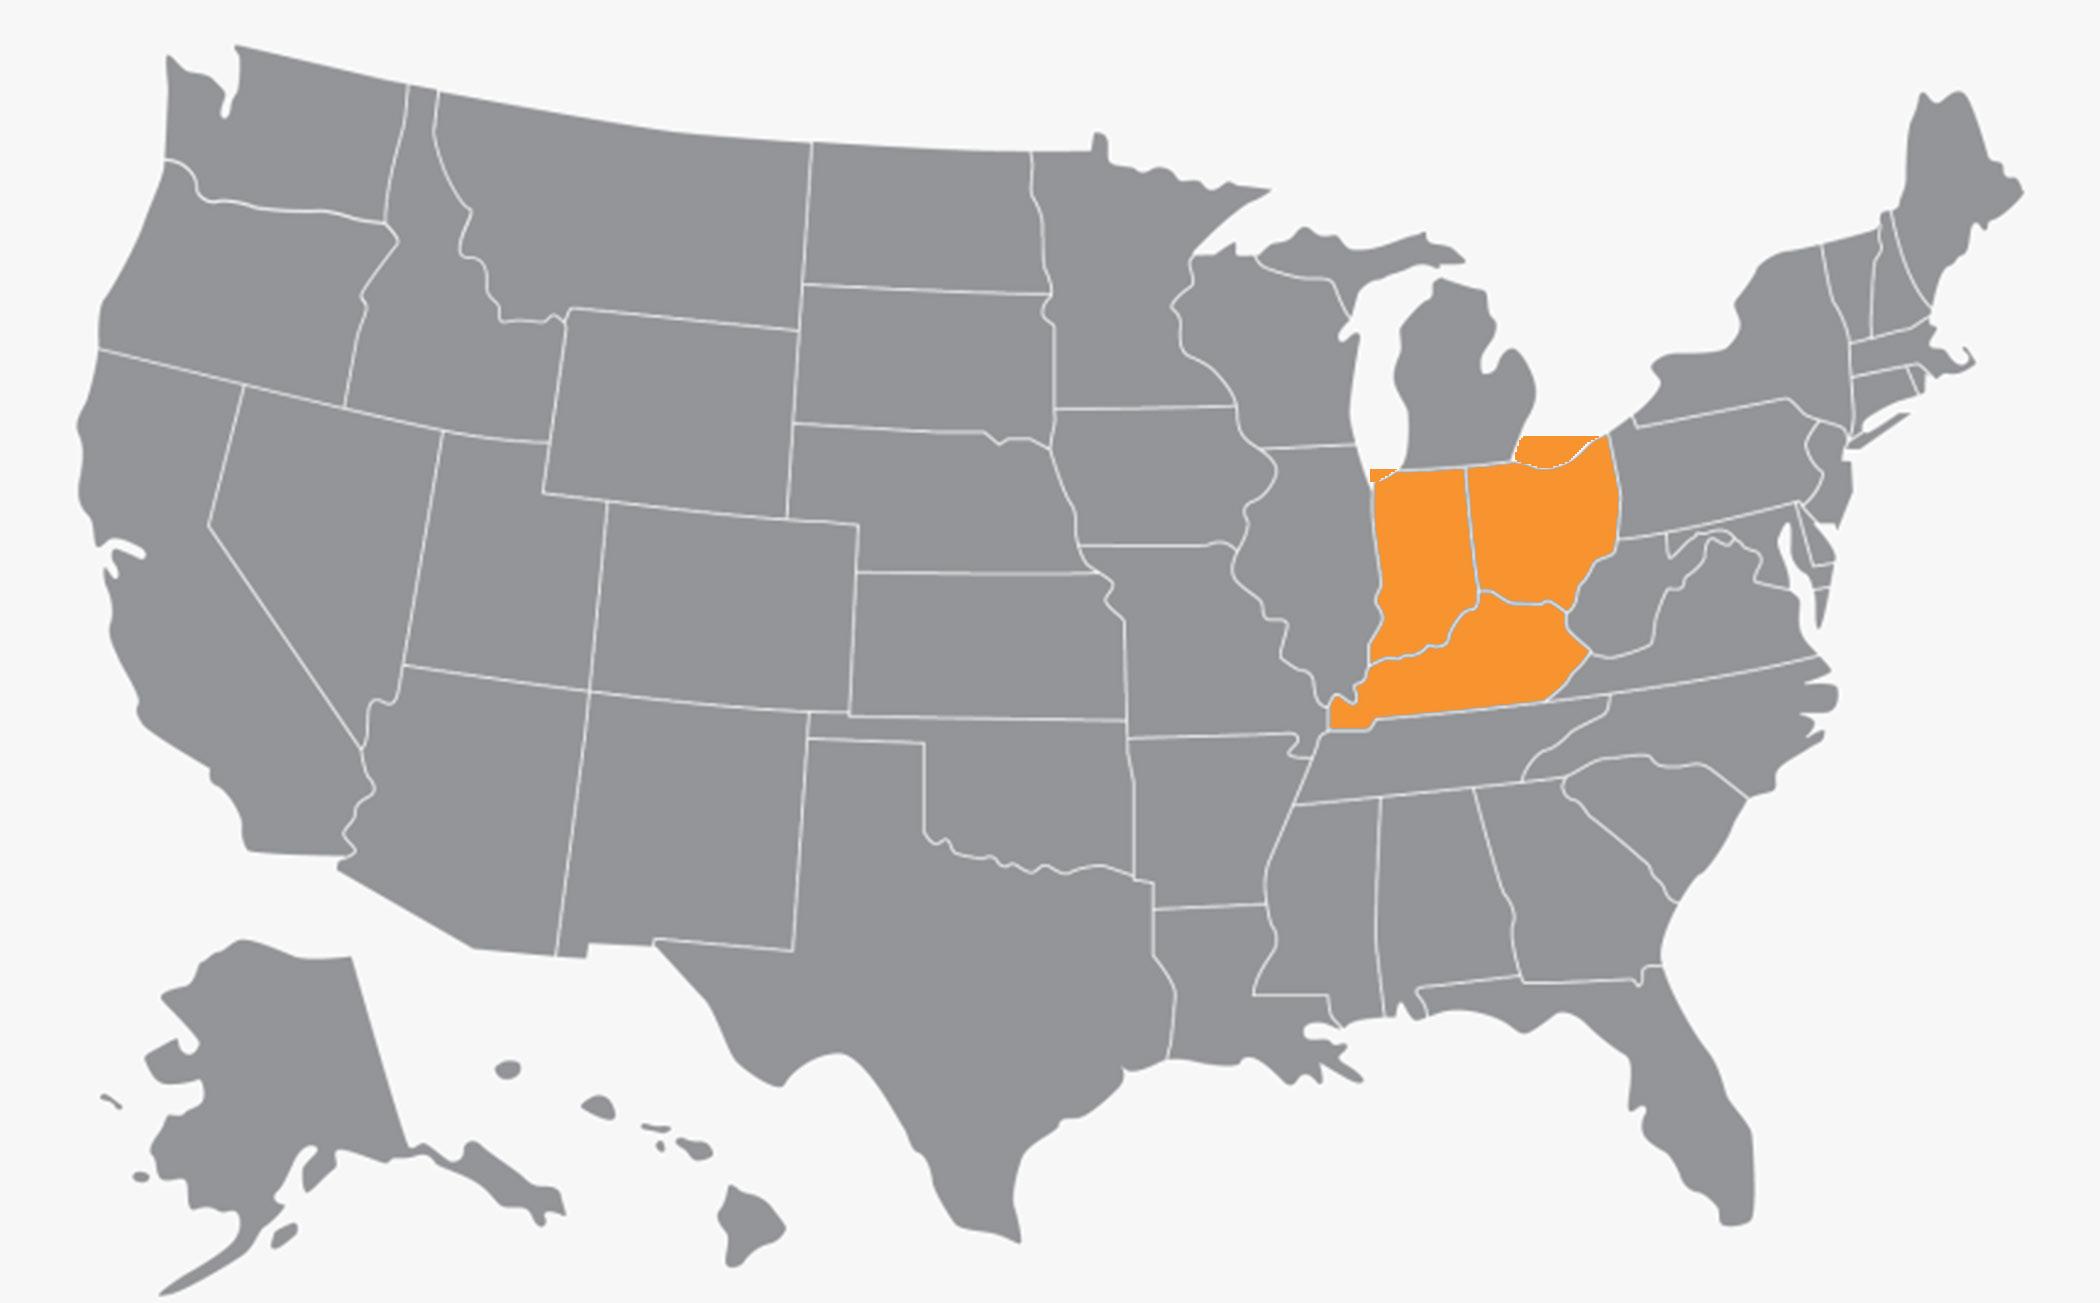

To successfully execute a marketing campaign, it is critical to understand the likely buyer profiles that will be attracted to the asset, in addition to their respective approval process, corporate structure and underwriting methodology.


Whether it be a private investor, pension fund advisor, sponsored capital group, family office, or a discretionary fund manager, every investment group has an approval process/corporate structure that dictates their ability to process with a transaction. We pride ourselves on maintaining vast and deep relationships with each of the buyer profiles that are active in the market place today coupled with a thorough under standing of their required investor returns and standards of underwriting.

Pension funds, advisors, banks, REITs, and life insurance companies
Syndicates, developers, merchant builders, general partnerships, and professional investors

Foreign investors seeking domestic opportunities and technology enablers that direct foreign demand
1031




Investors seeking acquisition opportunities for capital gains tax deferral

Opportunistic investors seeking diversification in other real estate property types
Private, individual investors who account for the majority of transactions in the marketplace
days
ProActive In-Person Meetings
Direct Phone Calls & Emails
Strategic Property
E-Campaigns
Distribution of offering Materials
On-site Property Tours

Weekly Seller Updates
Offering Procurement
Field Initial Offers
Best & Final Offering Round
Conduct Buyer Interviews
Select Buyer
Negotiate Contract
Days

COMMERCIAL REAL ESTATE
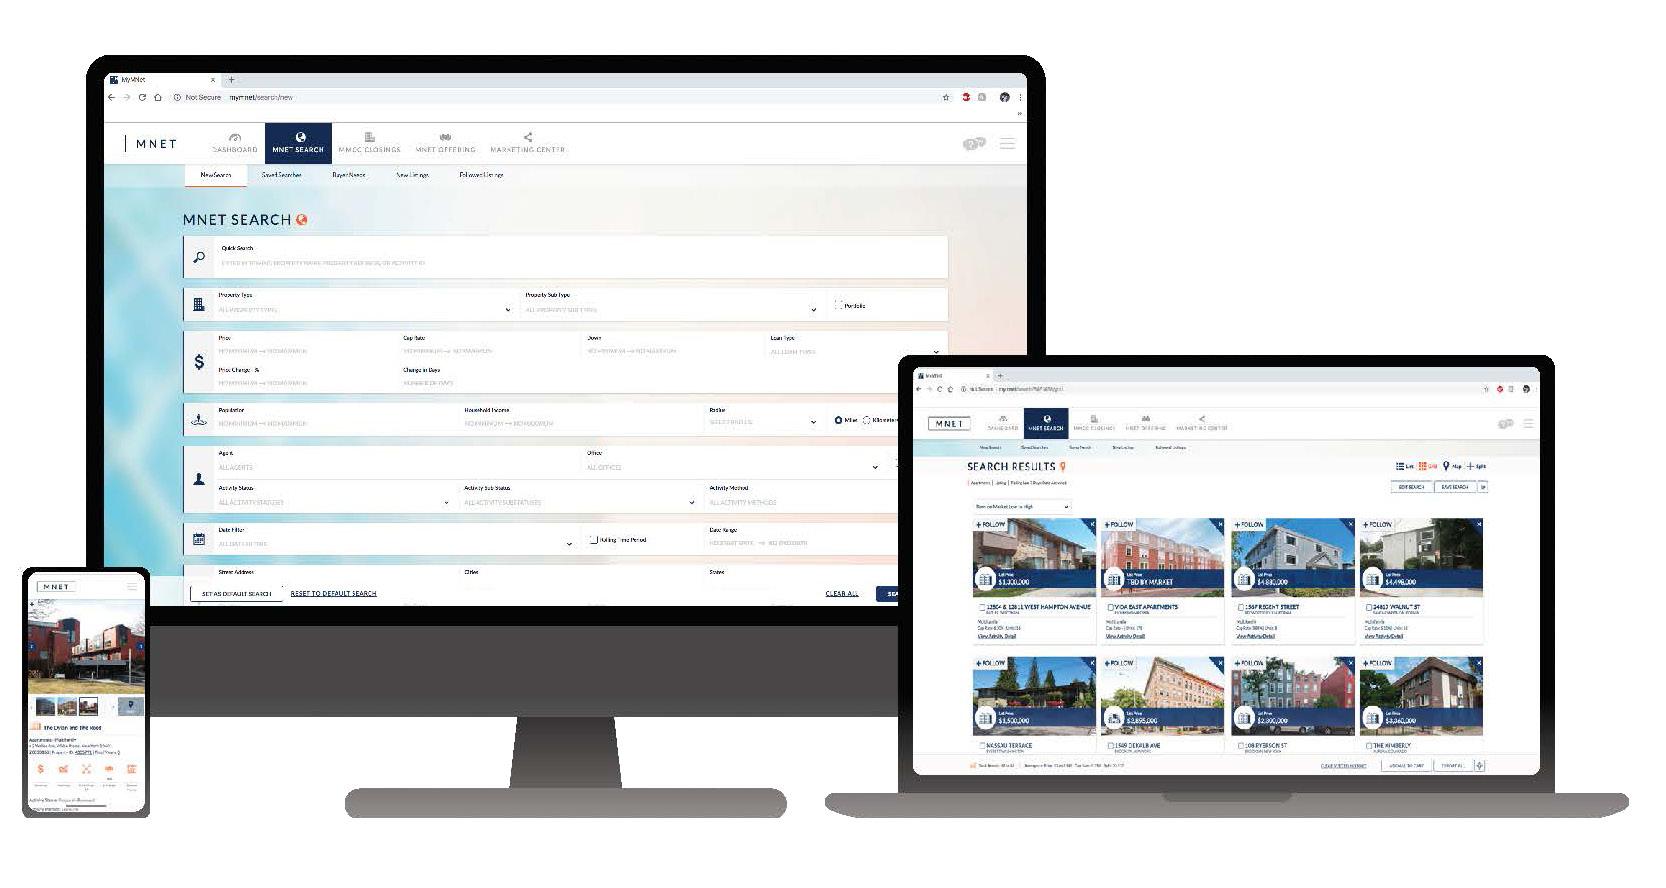
OUR PROPRIETARY TECHNOLOGY PLATFORM, MNET, IS A GAME-CHANGER. NO OTHER FIRM OFFERS ANYTHING LIKE IT OR THE POWERFUL PROPERTY SEARCH TOOLS AND AUTOMATED PROPERTY MATCHING CAPABILITIES IT FEATURES.
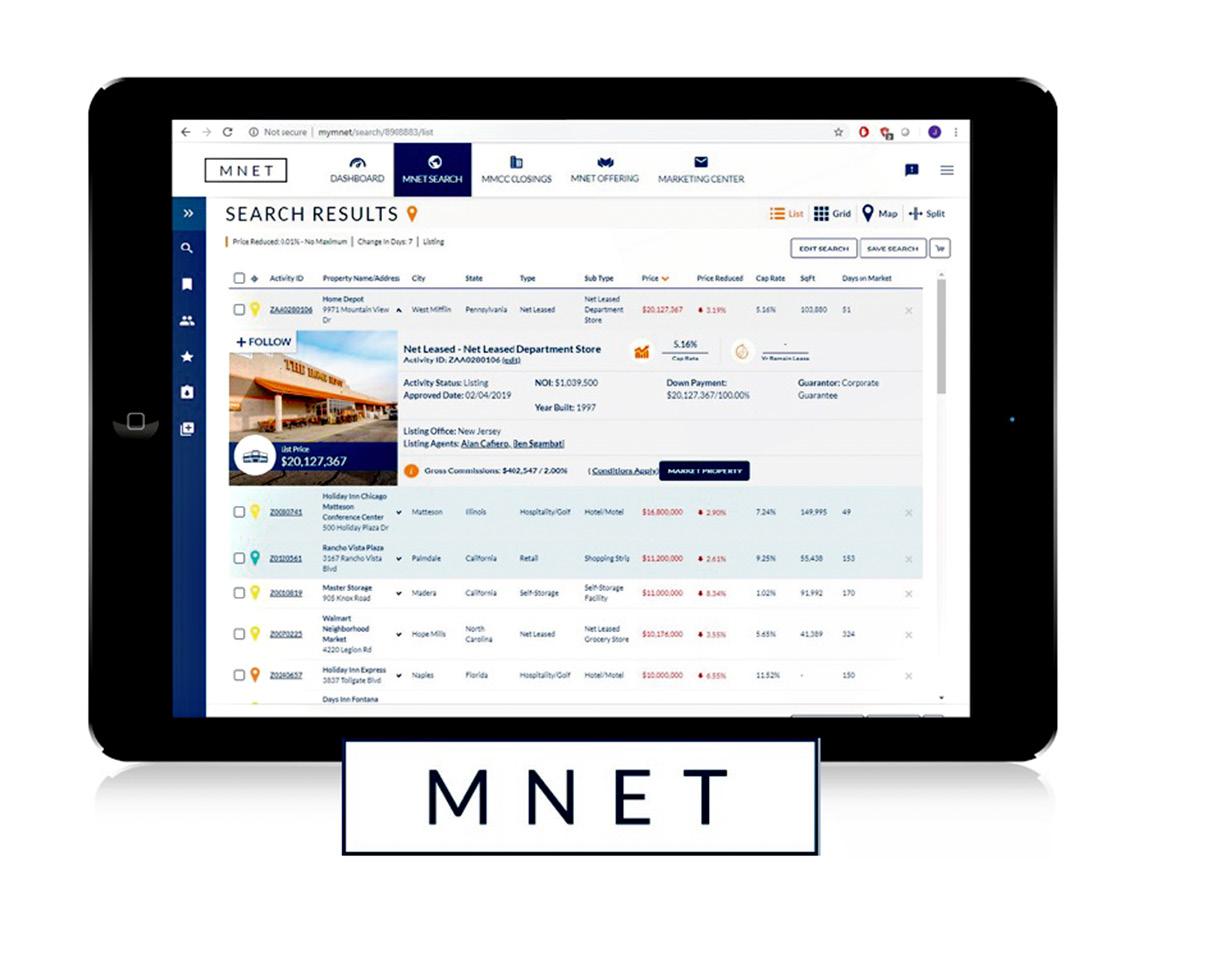
ADVANCE SEARCH CAPABILITIES
$18B +
OF CURRENT INVENTORY
1.2M
SEARCHES ANNUALLY
3,500 +
EXCLUSIVE LISTINGS

Commercial Real Estate Exchange, Inc. (CREXI) is the commercial real estate industry’s fastest-growing marketplace, advanced technology and data platform dedicated to sup porting the CRE industry and its stakeholders. Crexi enables commercial real estate pro fessionals to quickly streamline, manage, grow their businesses, and ultimately close deals faster. Since launching in 2015, Crexi has quickly become the most active market place in the industry. With millions of users, the platform has helped buyers, tenants and brokers transact and lease on over 500,000 commercial listings totaling more than $1 trillion in property value.

Real Capital Markets (RCM) is the GLOBE marketplace for buying and selling CRE. RCM increases the speed, exposure, and security of CRE sales through its streamlined online platform. Solu tions include integrated property marketing, trans action management, and business intelligence tools to unify broker-level and firm-level data and work flows.





The main advantage of digital marketing is that a targeted audience can be reached in a cost-effective and measurable way. Over the course of the past several years, our team has managed to collect over twenty thousand emails of potential investors, in a variety of states across the US. This database allows us to tailor future investment opportunity to each investor, and their desired goal. Not only does this database allow us to personalize emails, but it also allows us to measure the results of our out reach.
EMAILS SENT THIS CURRENT MONTH
EMAIL OPENS OVER 60K IN OUR MAILING LIST OVER 20K
INDUSTRY AVERAGE
OPEN RATE: 29.97%
CLICK RATE: .75%
ADG OPEN RATE
34%
ADG CLICK RATE
1.5% OVER 1.2K CLICK THROUGH
“Email has an ability many channels don’t: creating valuable personal touches - at scale.”
Social media helps us engage with our potential clients and find out what is being said about our business. We also use social media for advertising, attracting clients, get client feedback, build better customer loyalty, increase our market reach, develop our brand etc. Social media is a great tool to use in our industry, especially for building new relationships and keeping up with the market.

ADG IS ON
6




OVER 1K NEW RELATIONSHIPS MADE
MONTHLY IMPRESSIONS ON ISSUU
OVER 1.2K
OVER 3K IMPRESSIONS ON LINKEDIN
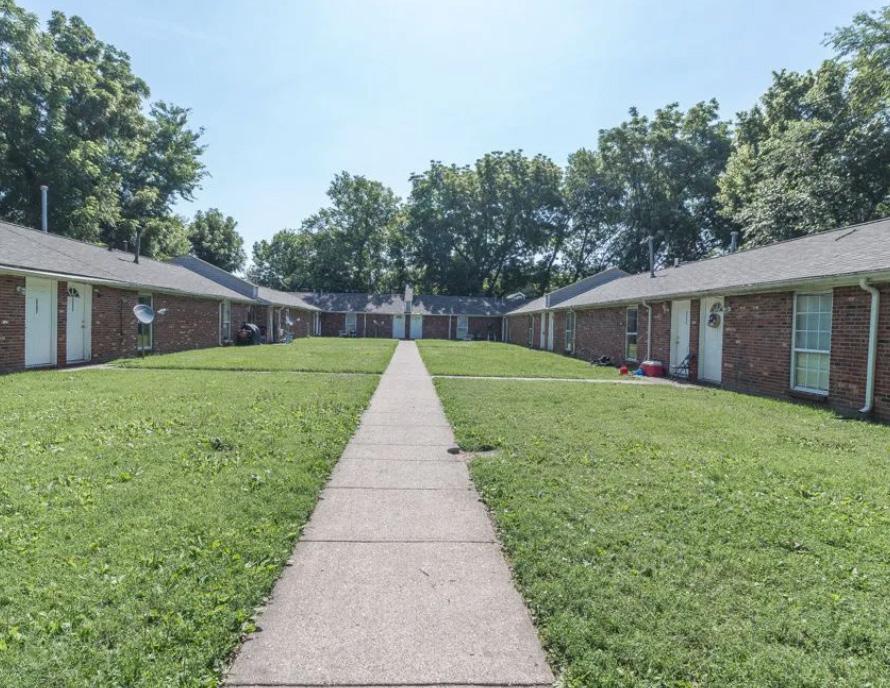
Property Address: 2325 Rodman St.
City, State, Zip: Louisville, KY 40208
Submarket: Churchill Downs
County: Jefferson
Year Built: 1958
Number Of Units: 16
Avg Unit Size: 780
Rentable Sqft: 15,800
Number of Parcels: 1
Lot Size (Acres): 0.41
# of Buildings: 1
# of Stories: 1
Plumbing: Copper & Plastic
HVAC: Central
Water Heater: Heat Pump
Wiring: Copper
CONSTRUCTION:
Foundation: Concrete
Framing: Wood
Roofs Asphalt Shingle
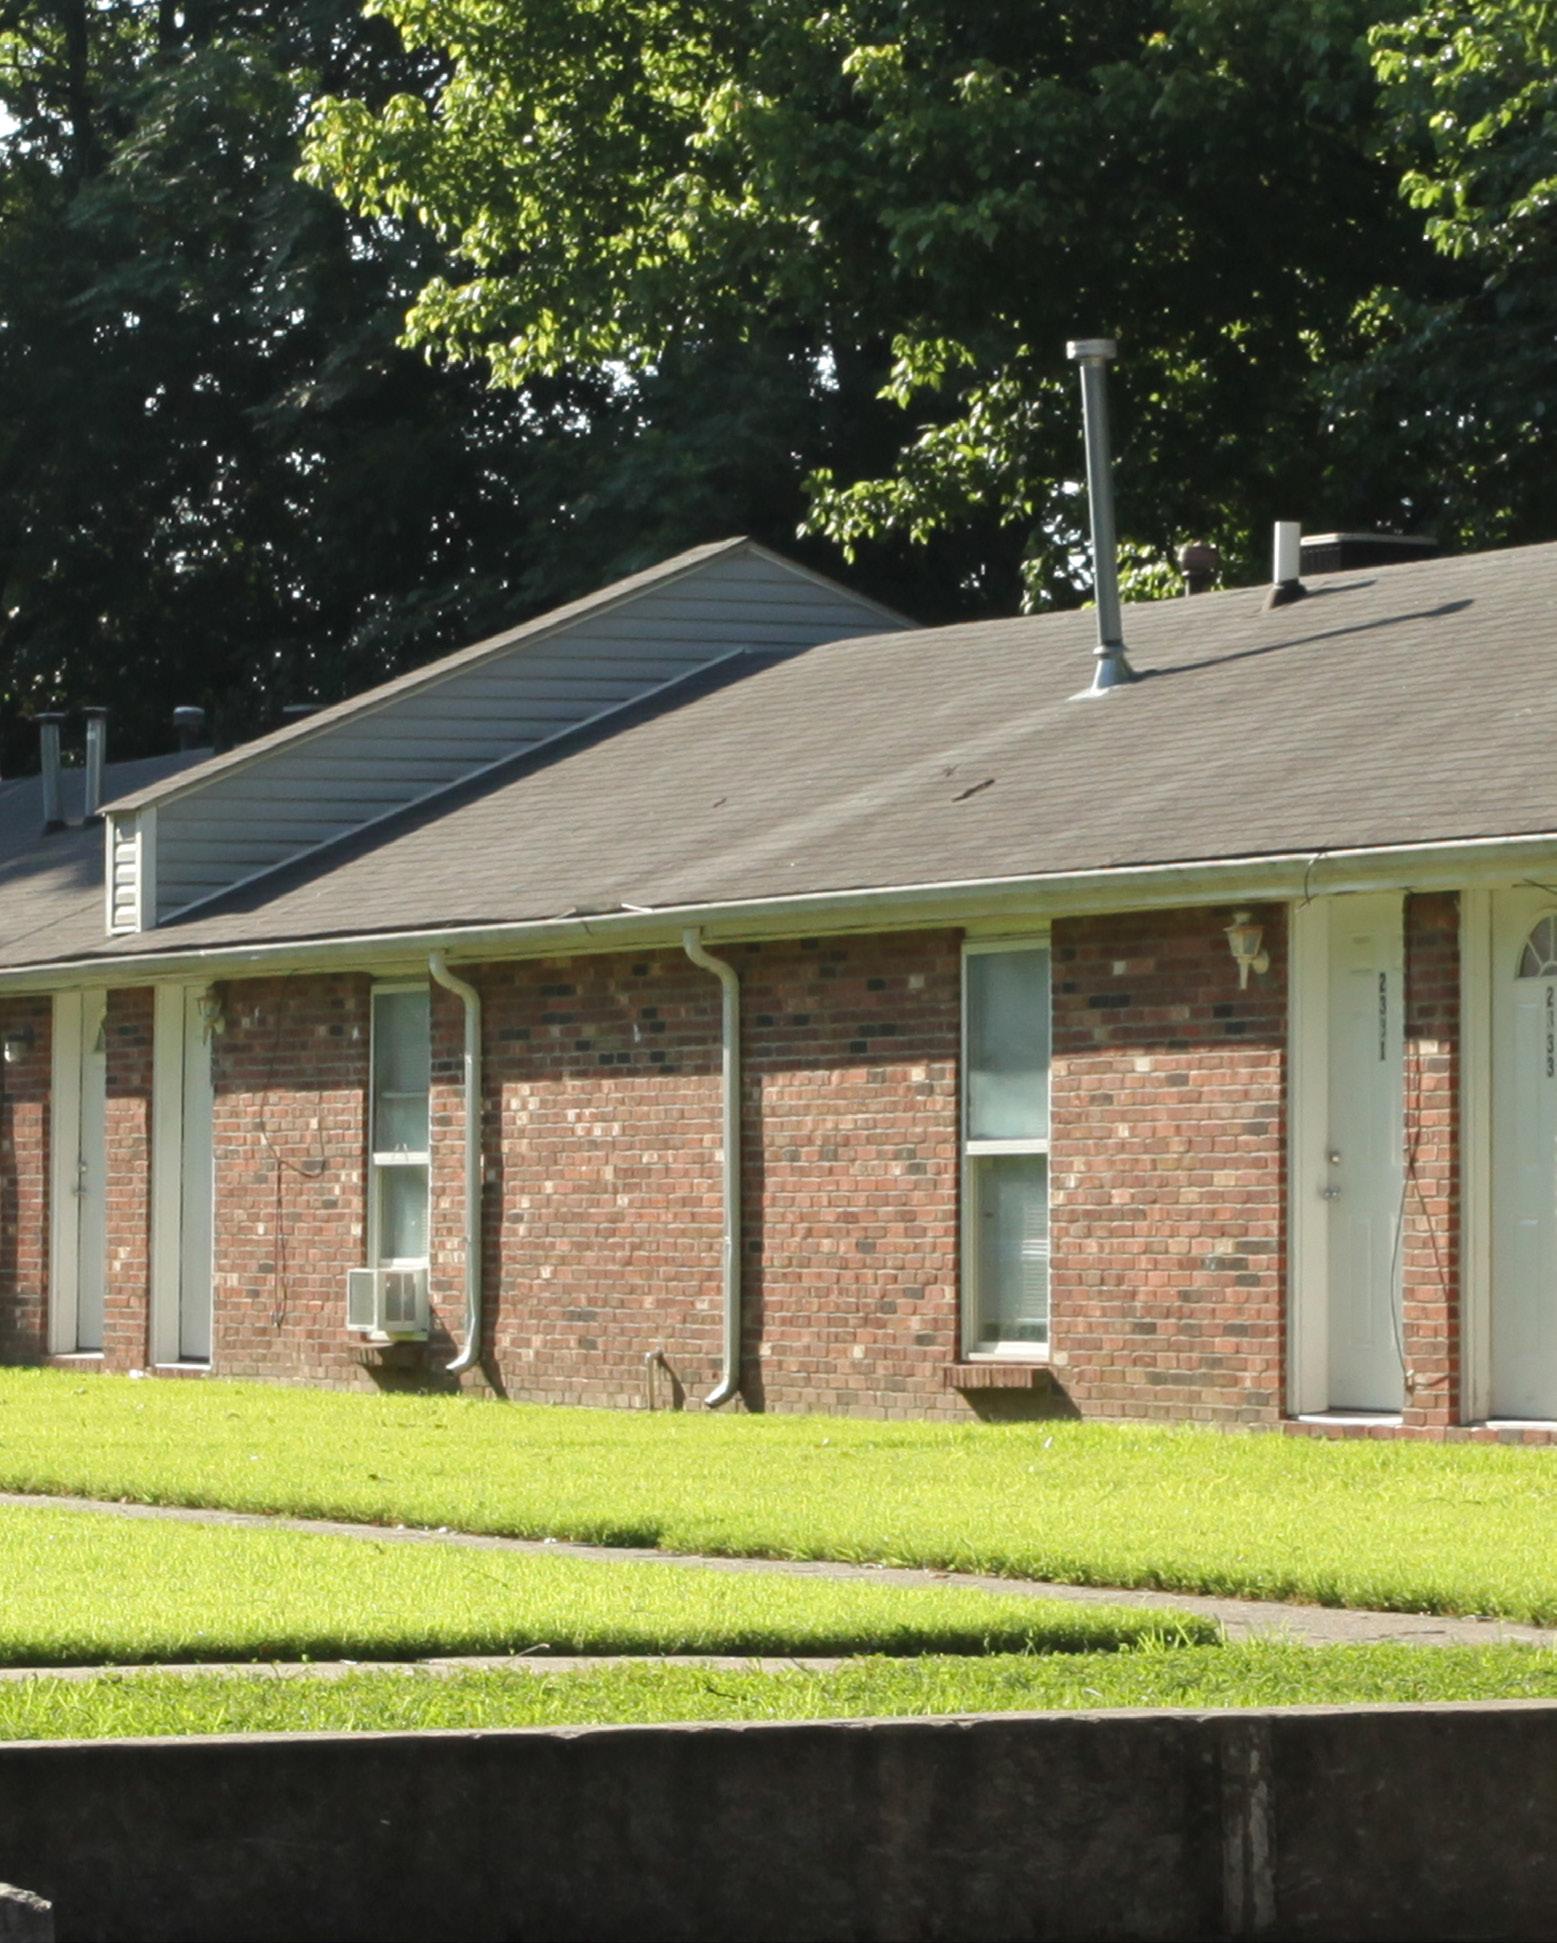
Exterior of Building: Brick
Windows: Vinyl Double Hung
utilities
Electric: Tenant Paid
Gas: NA
Water Tenant Paid
Sewer Tenant Paid
Trash: Owner Paid
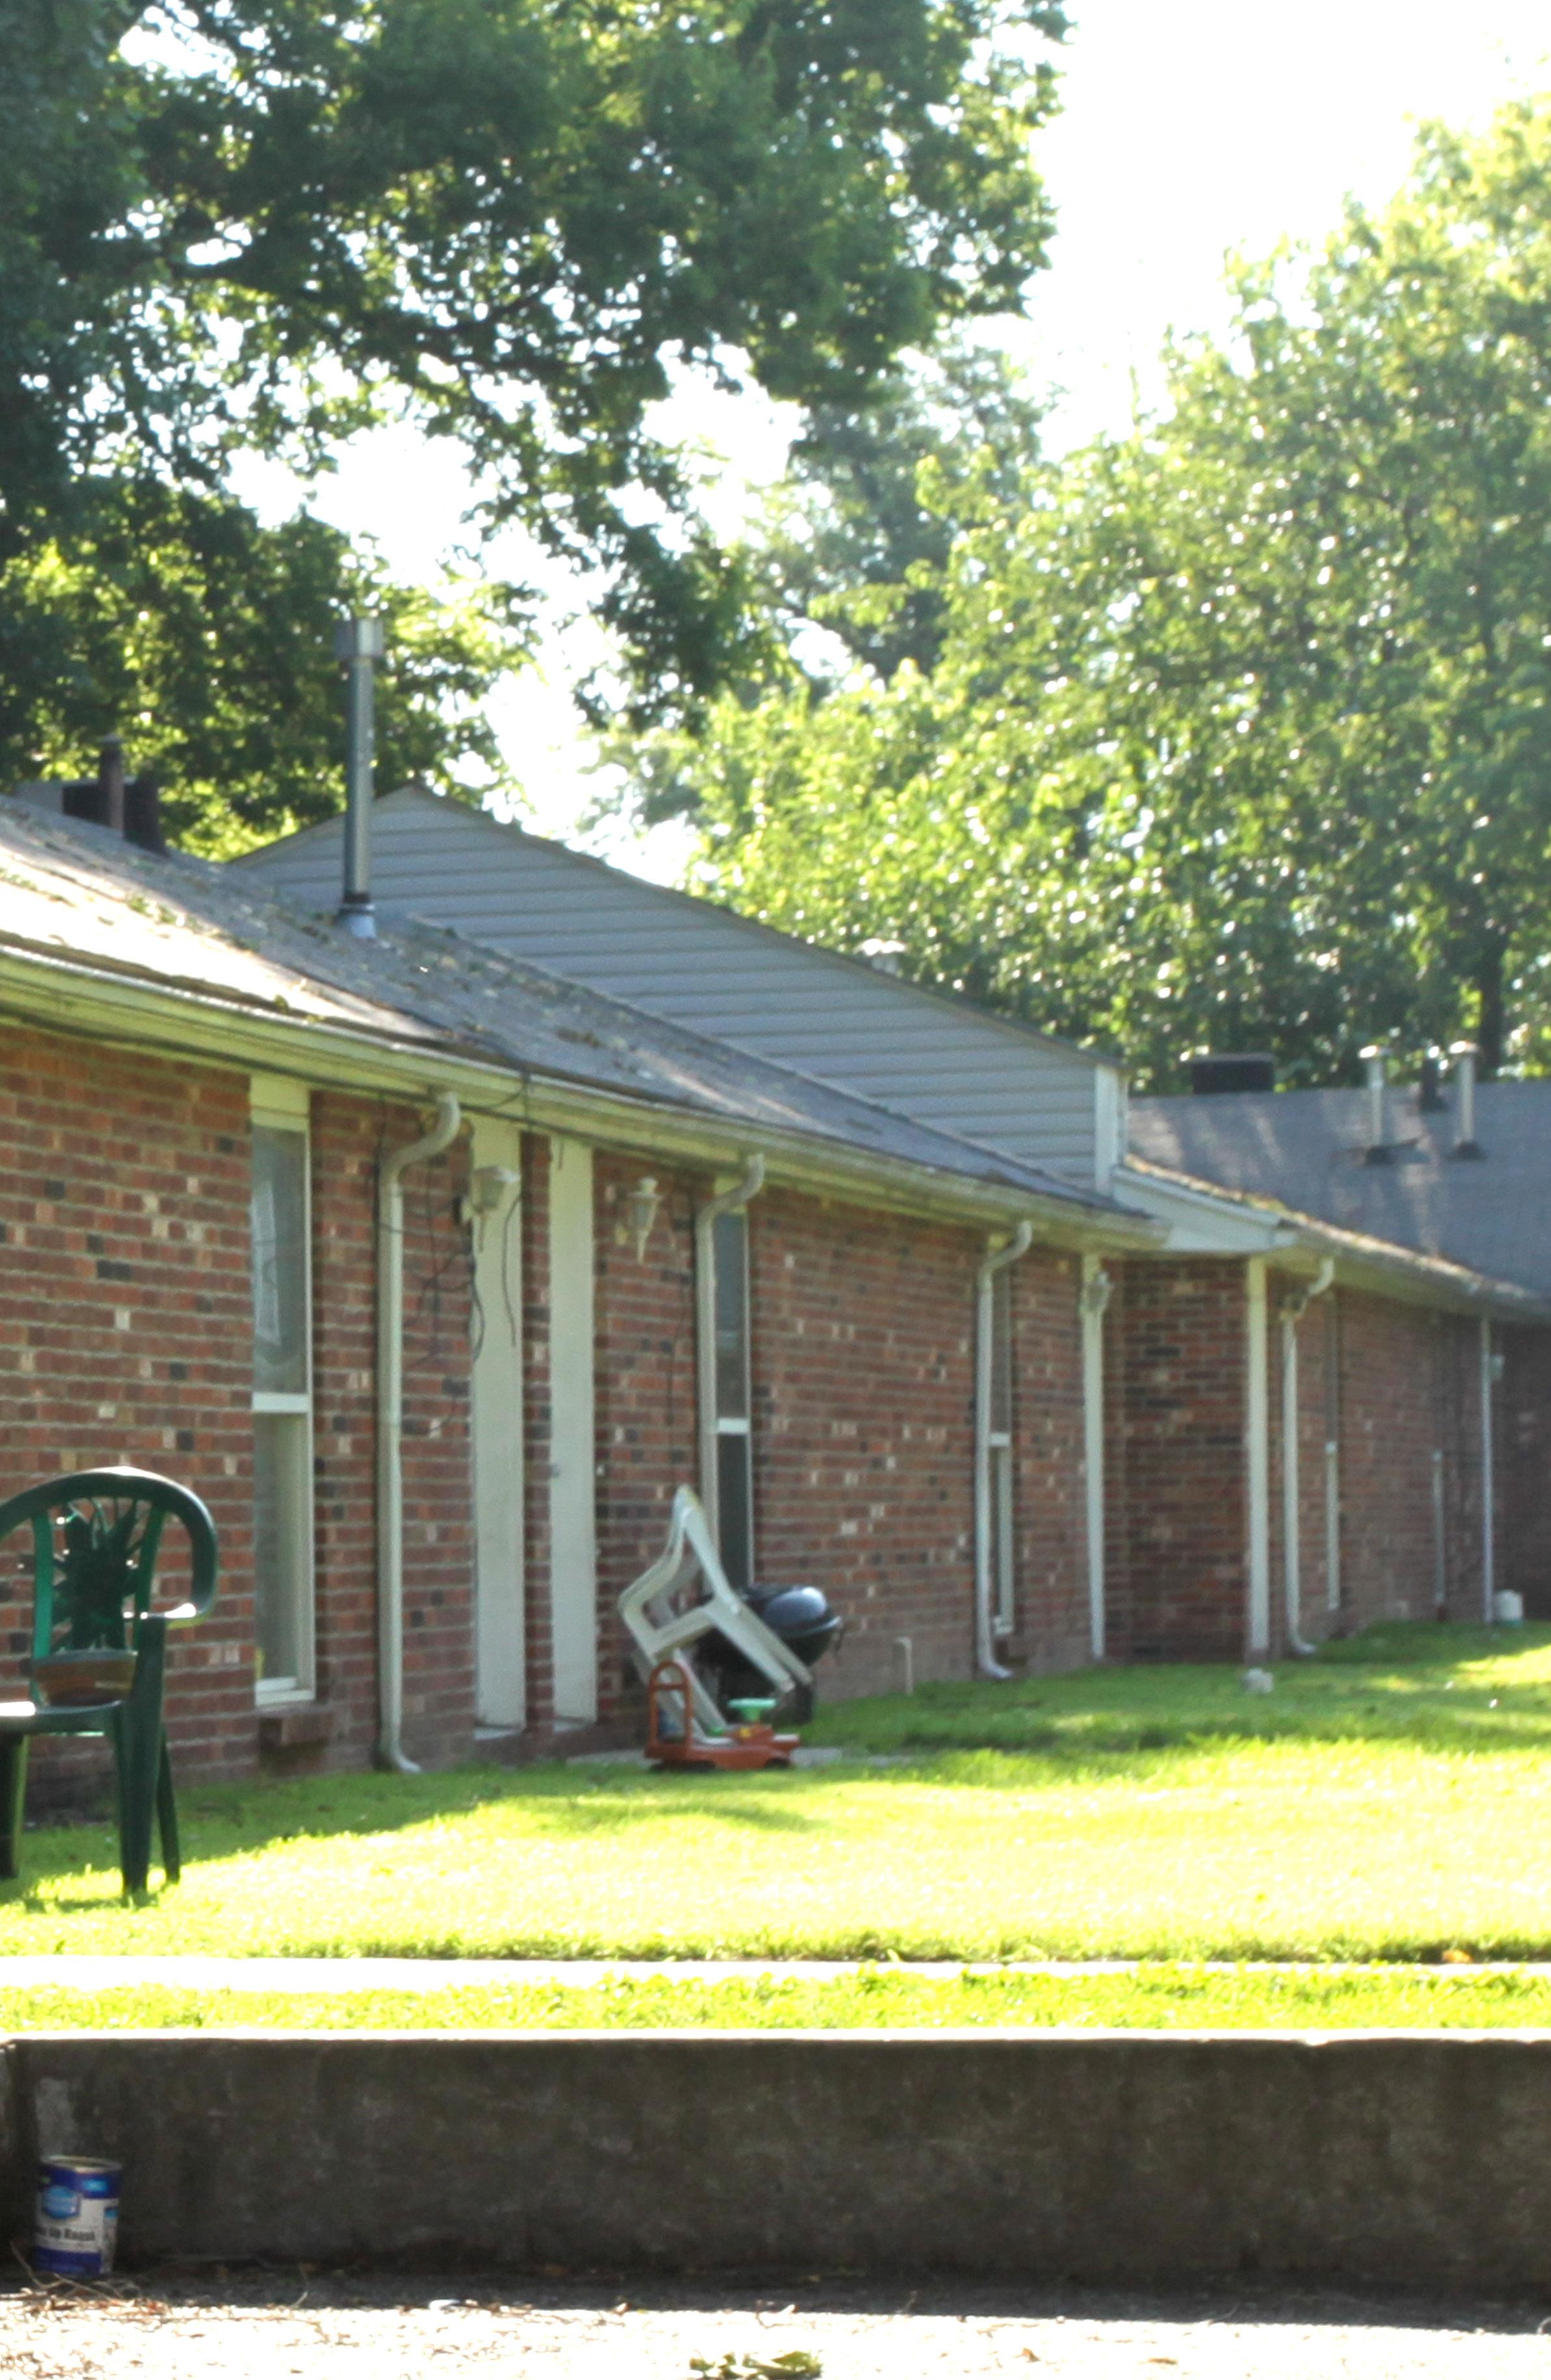
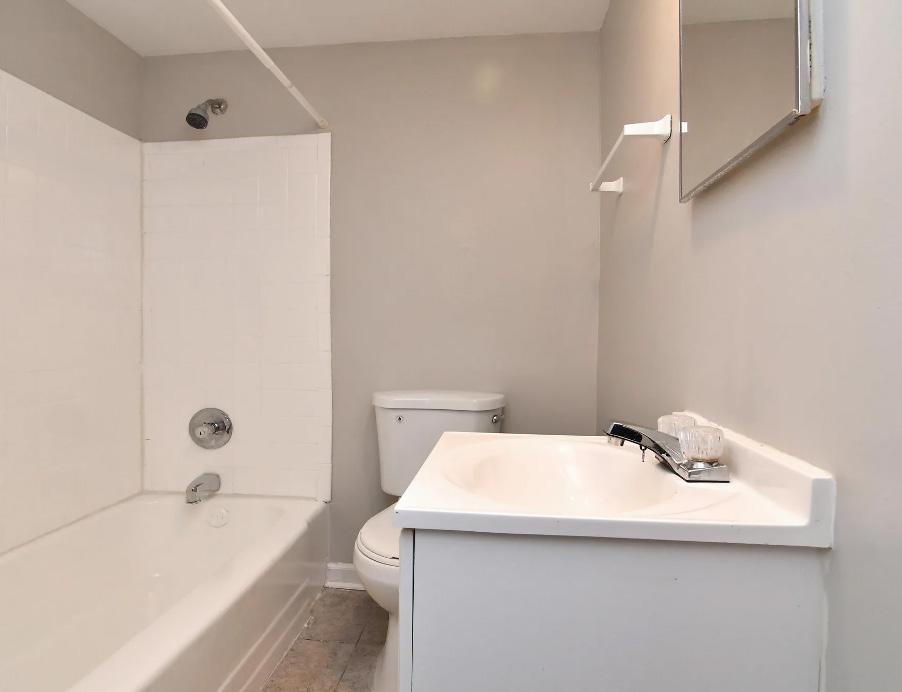
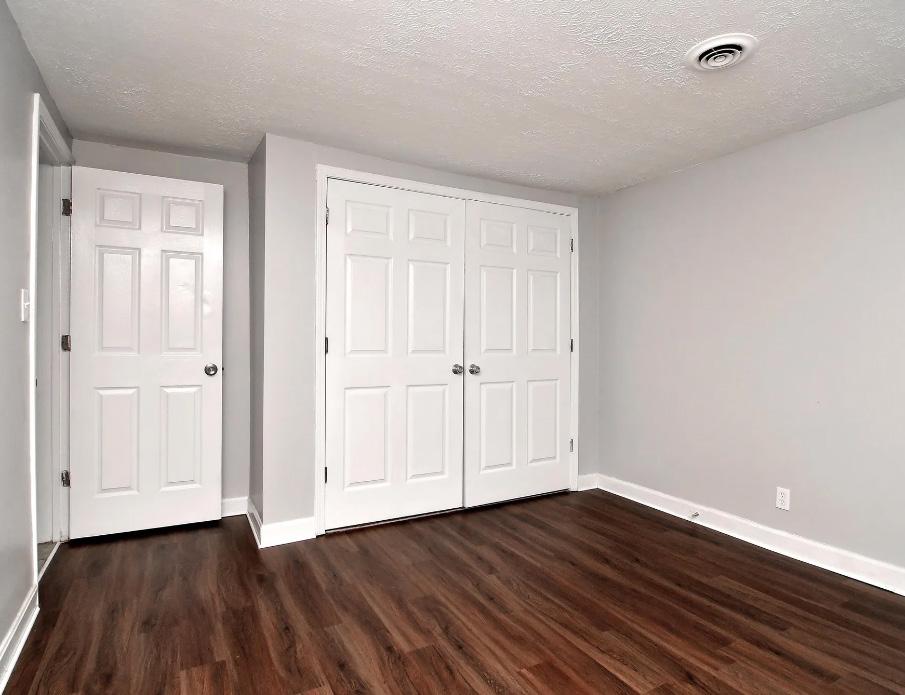
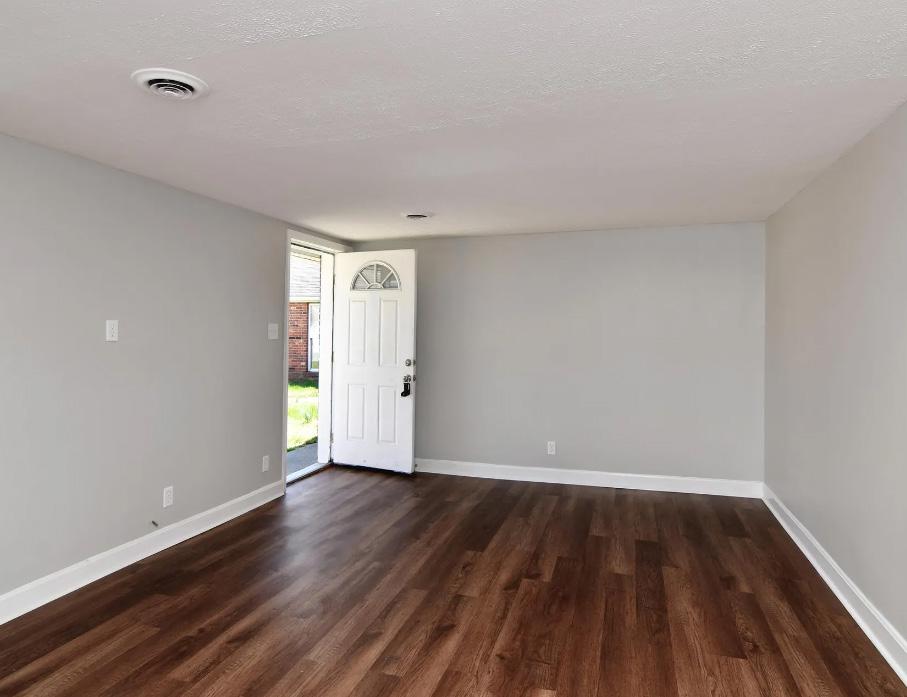
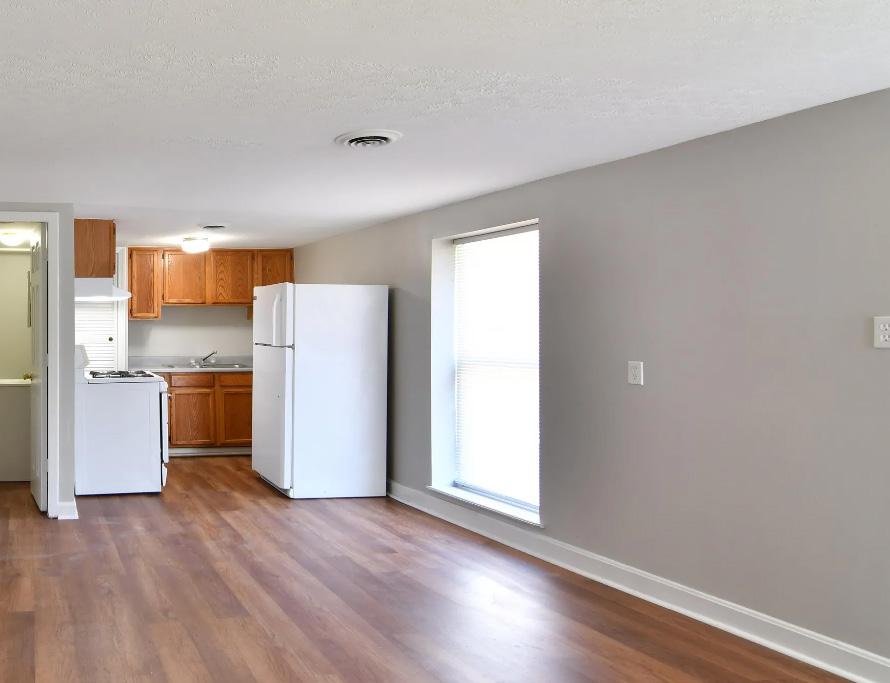
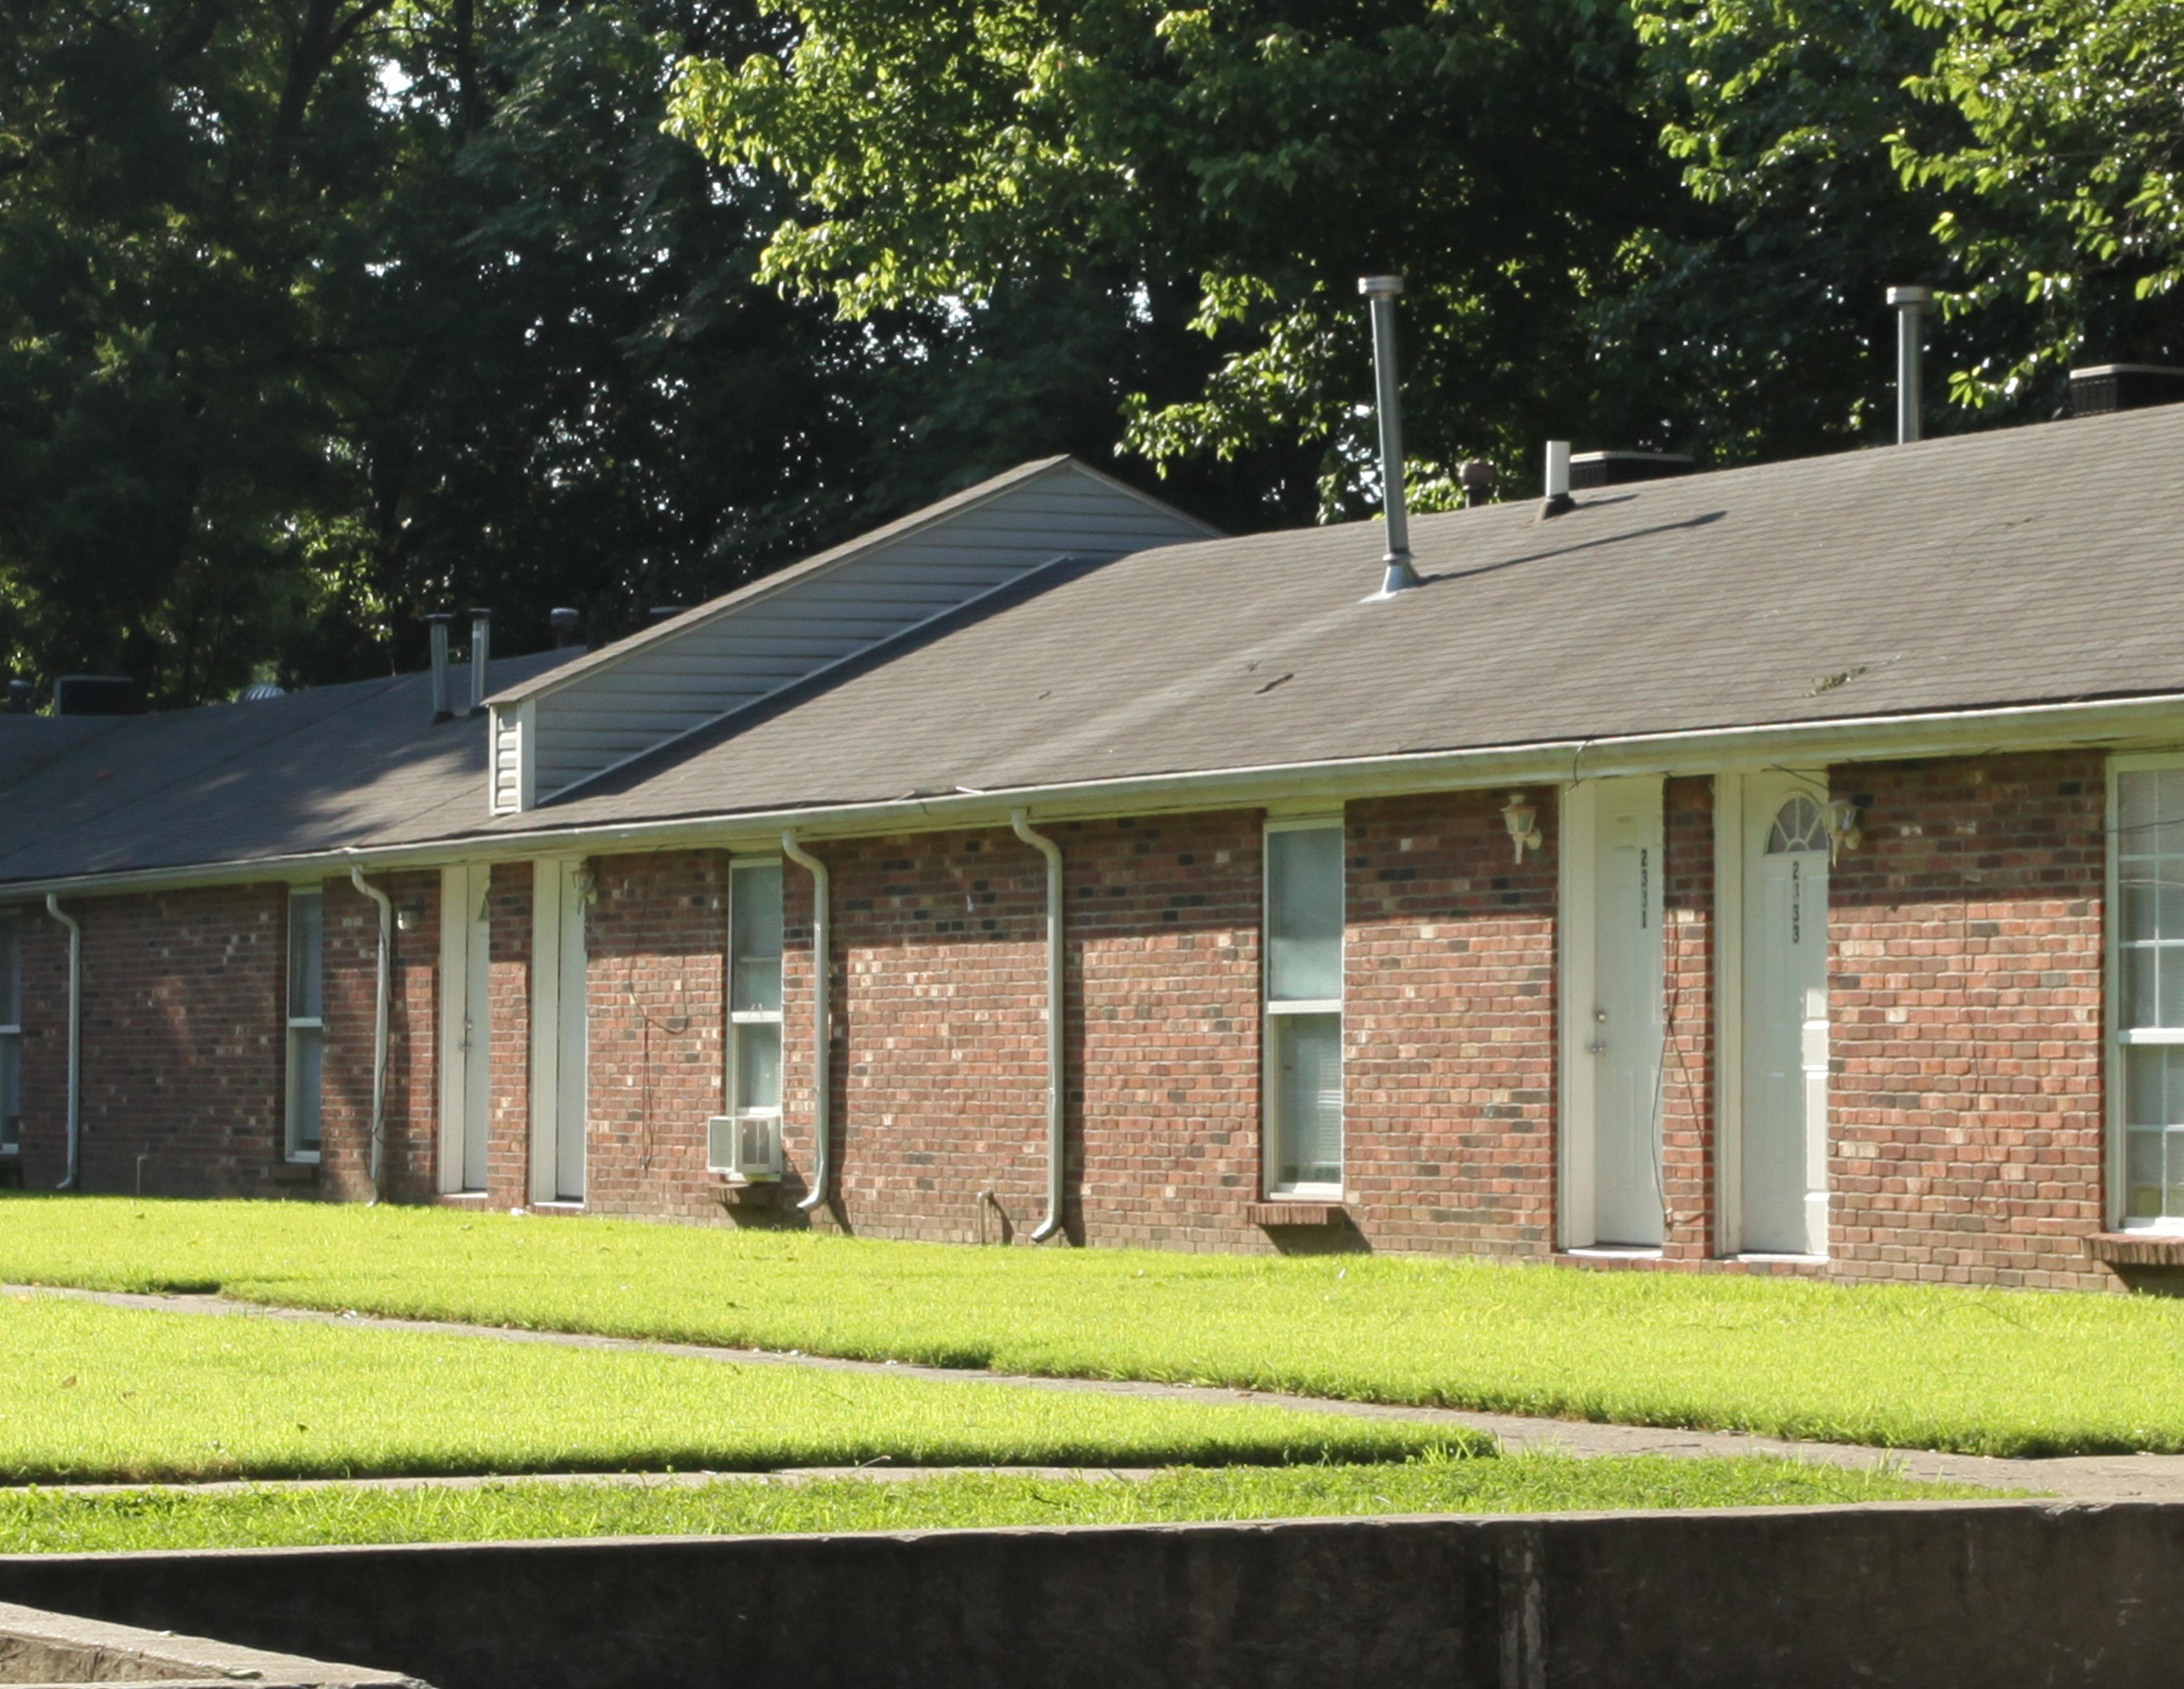
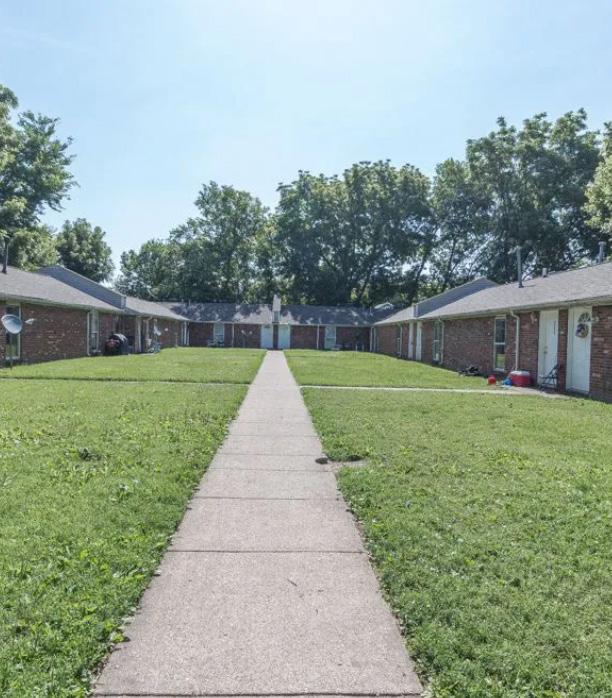
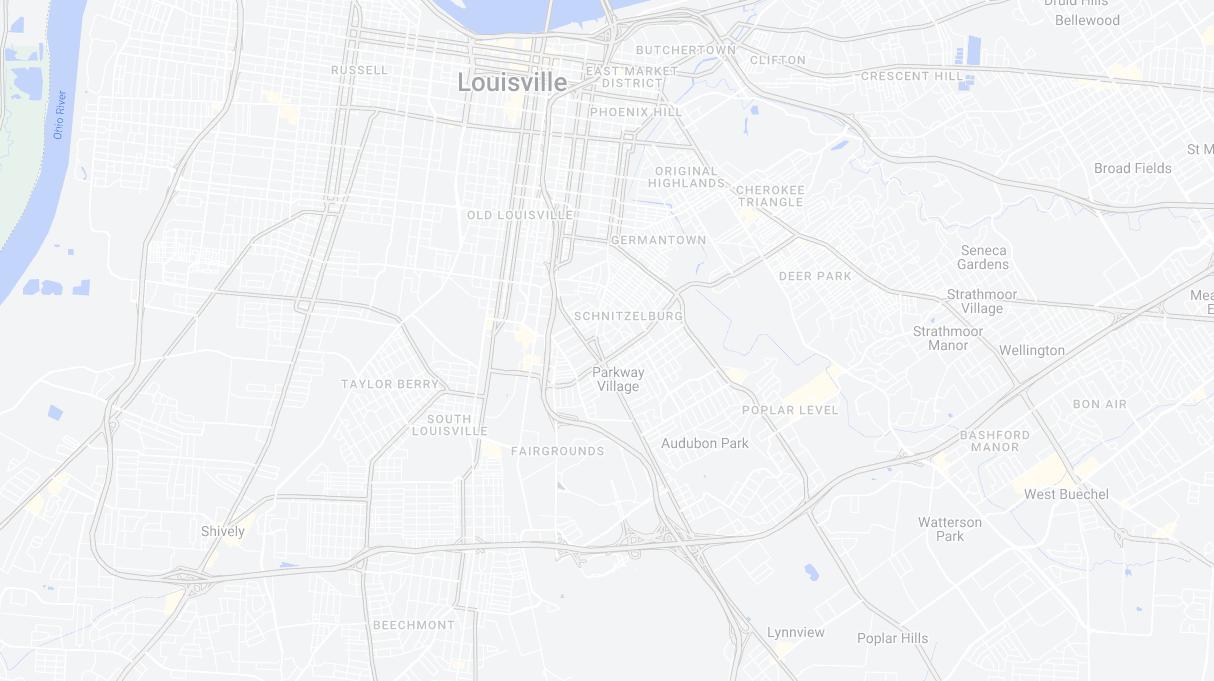
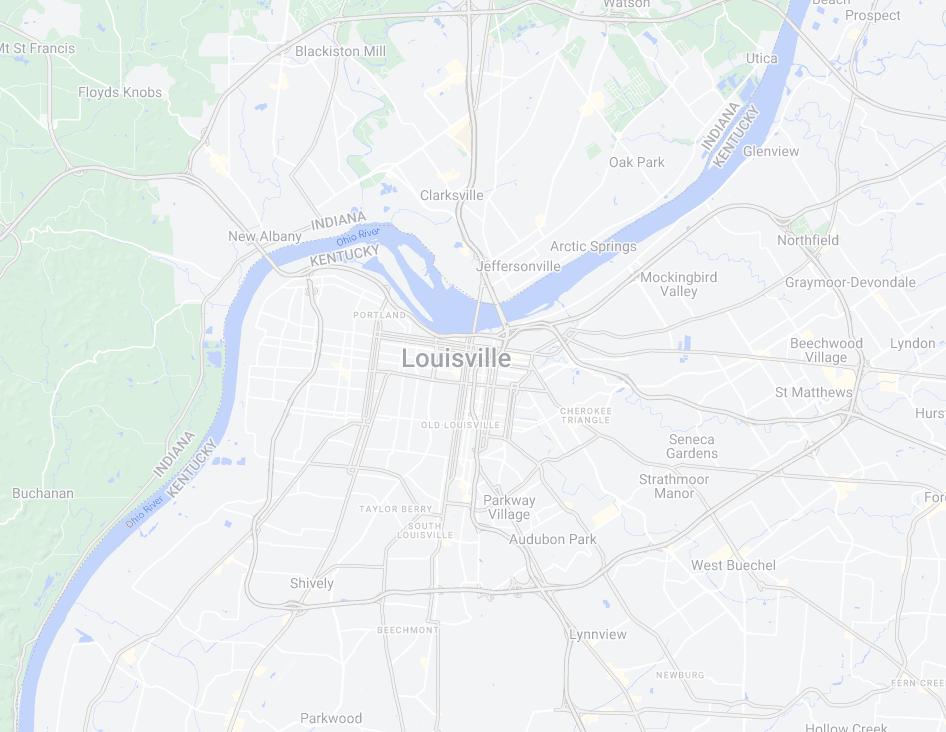
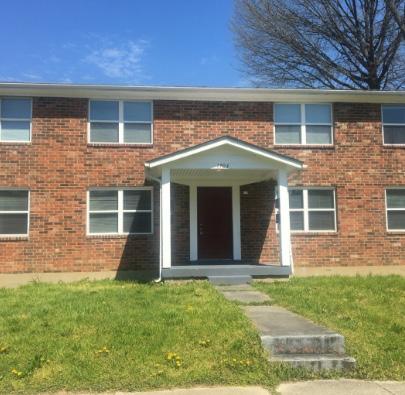
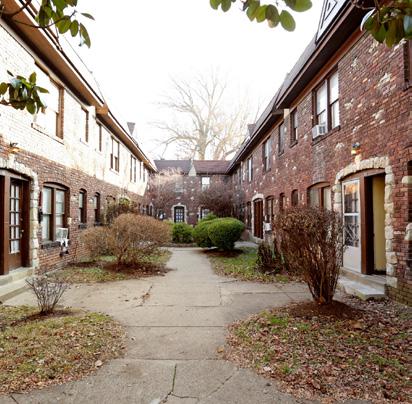
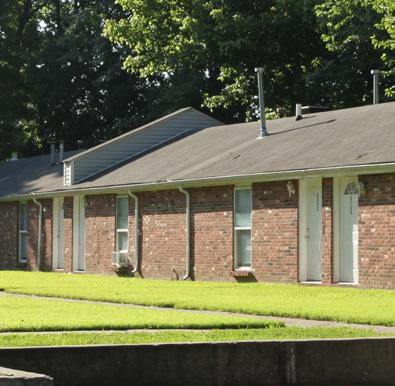
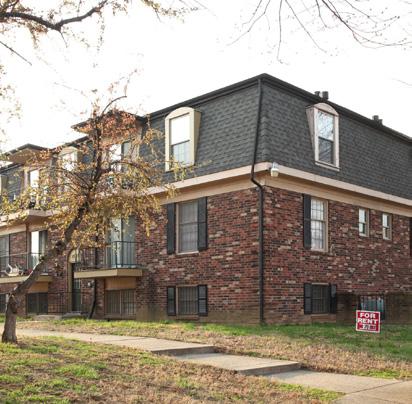
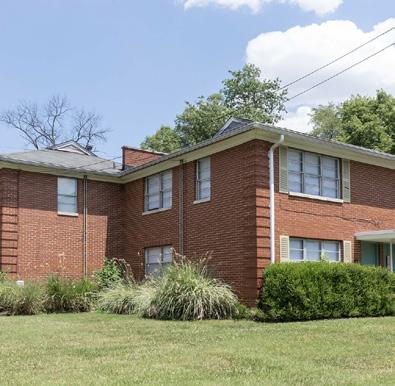
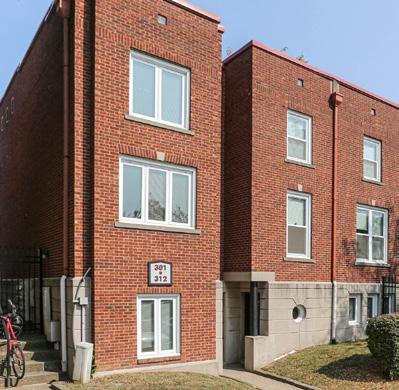
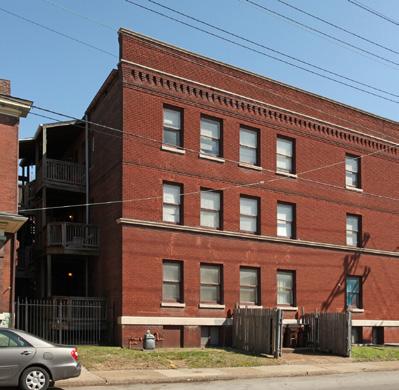
Marcus & Millichap is pleased to present Rodman apartments, 16 units located off 3rd Street, few minutes from the University of Louisville and Churchill Downs.
Rents in the competitive set are $921/mo on avereage, providing an excellent opportunity for an investor to draft rents from the submarket and push rents by $50 per month.
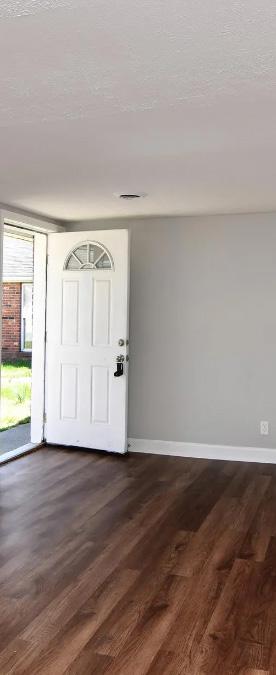
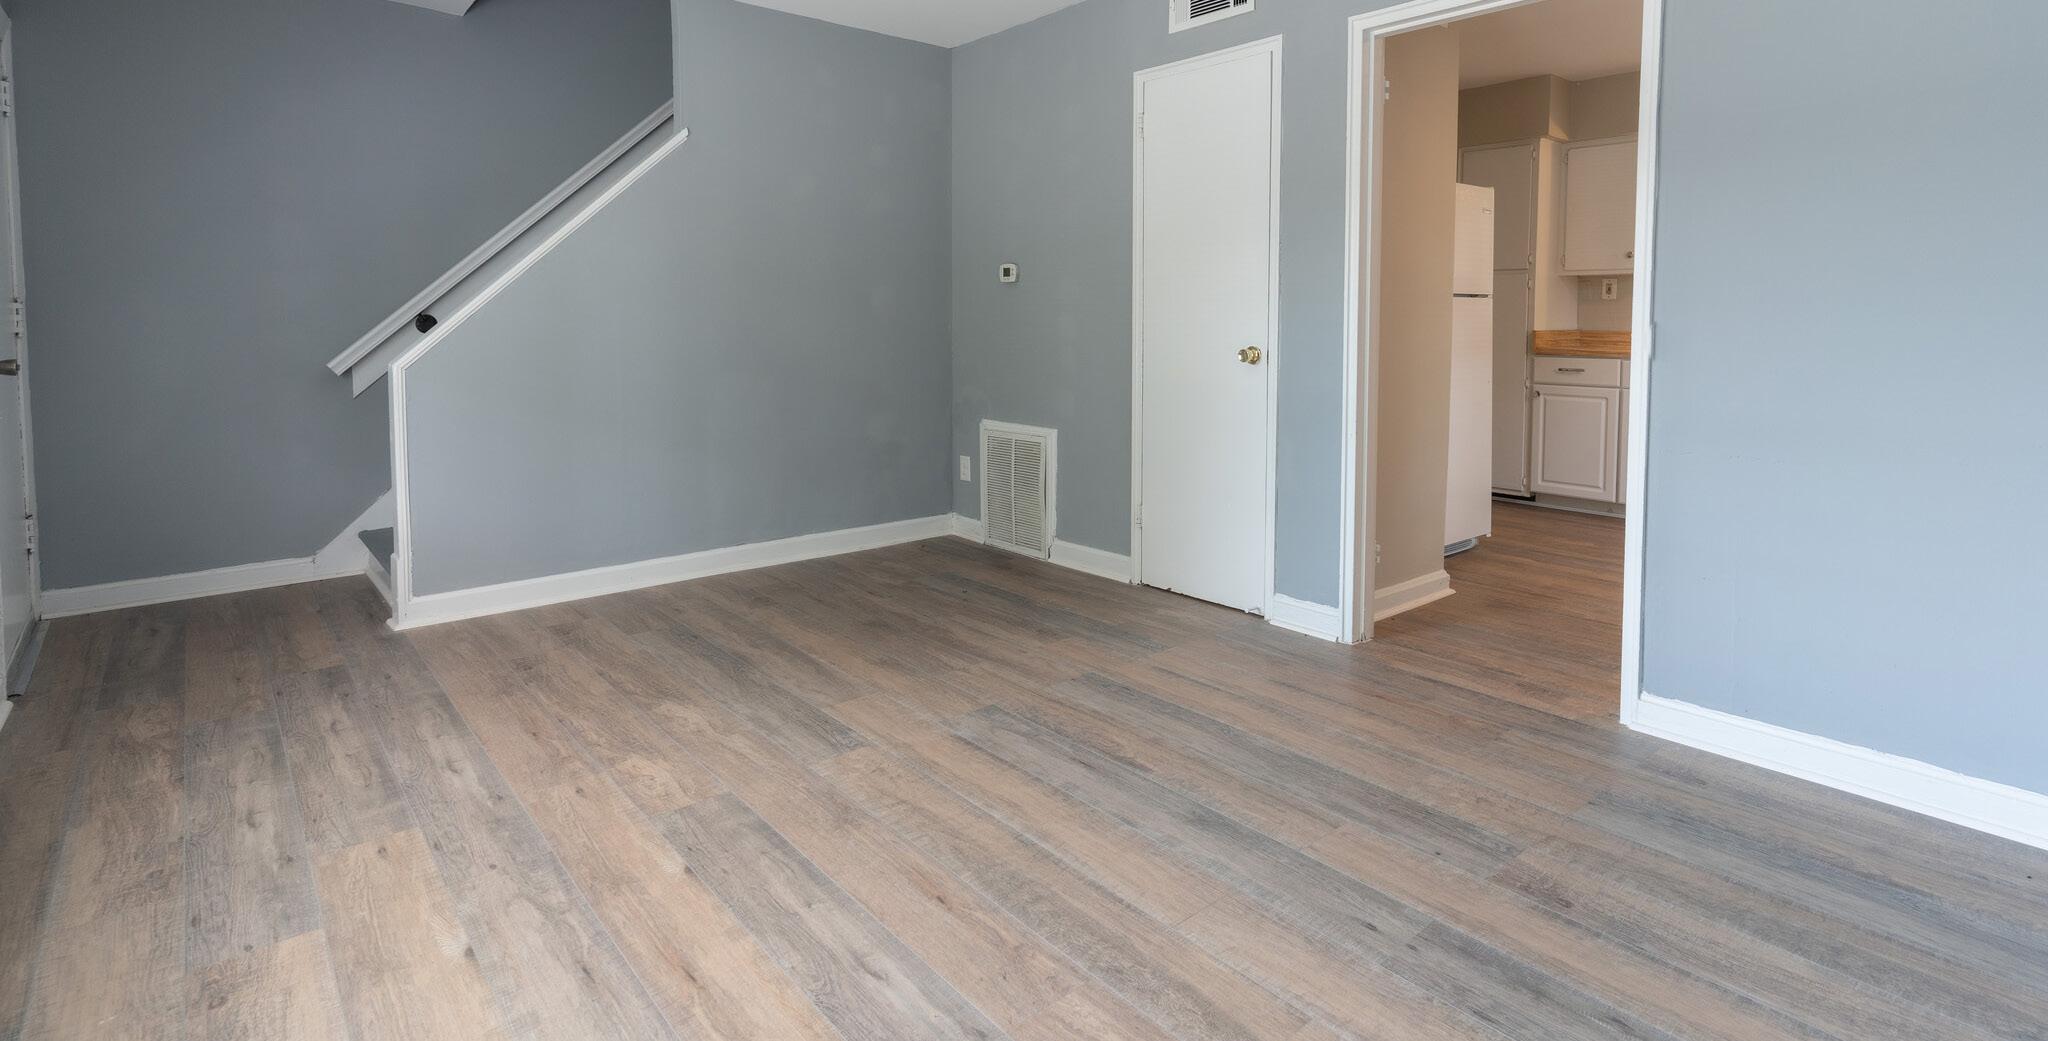
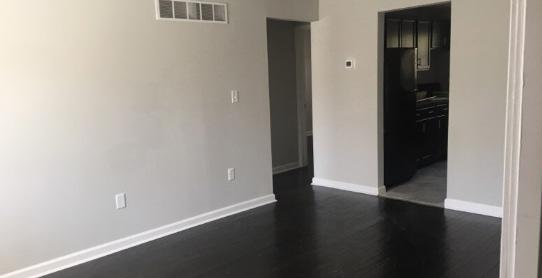
Turn-key Opportunity: Little to no deferred maintenance.
Resident Retention: Single story units provide a stable tenant base.
Laundry Income: Other income potential collecting load charges.
Louisville has experienced strong rental growth in the past 12 month’s largely driven by strong economic fundamentals and pent-up demand from Covid. The metro recorded a net gain of 22,400 jobs as the market recovers from Covid, expanding the employment base by 3.5%.
The top industries in Louisville’s employment sector are Trade & Transportation (23.3%), Education & Health (14.6%), Manufacturing (12.4%), and Professional Services (12.1%). Some of the largest employers in the area include Yum! Brands, Kindred Healthcare, Humana, and Ford. It is also home to UPS Worldport, the world’s largest package handling facility.
• Amazon building new $5.5MM last-mile delivery station at prime Louisville property adding close to 2,000 new jobs (March 2021).
• GE Appliances completes $60MM expansion adding 245 new jobs (July 2021)
• Ge Appliances set to invest $450MM at its Appliance park in the next
2 years adding over 2,000 new jobs (Oct 2021)
• QSR Automations opens new global headquarters in Louisville, KY (Nov 2021)
• KCC Manufacturing breaks ground on 700-job operation in Shelby County (Nob 2021)
• Republic National Distributing Co. breaks ground on a relocation and expansion project that will create 30 full-time jobs with a $50 million investment (Sep 2021).
• Baptist Health to build $42M rehabilitation hospital in Jeffersontown (Nov 2021)
12,470 16 $615

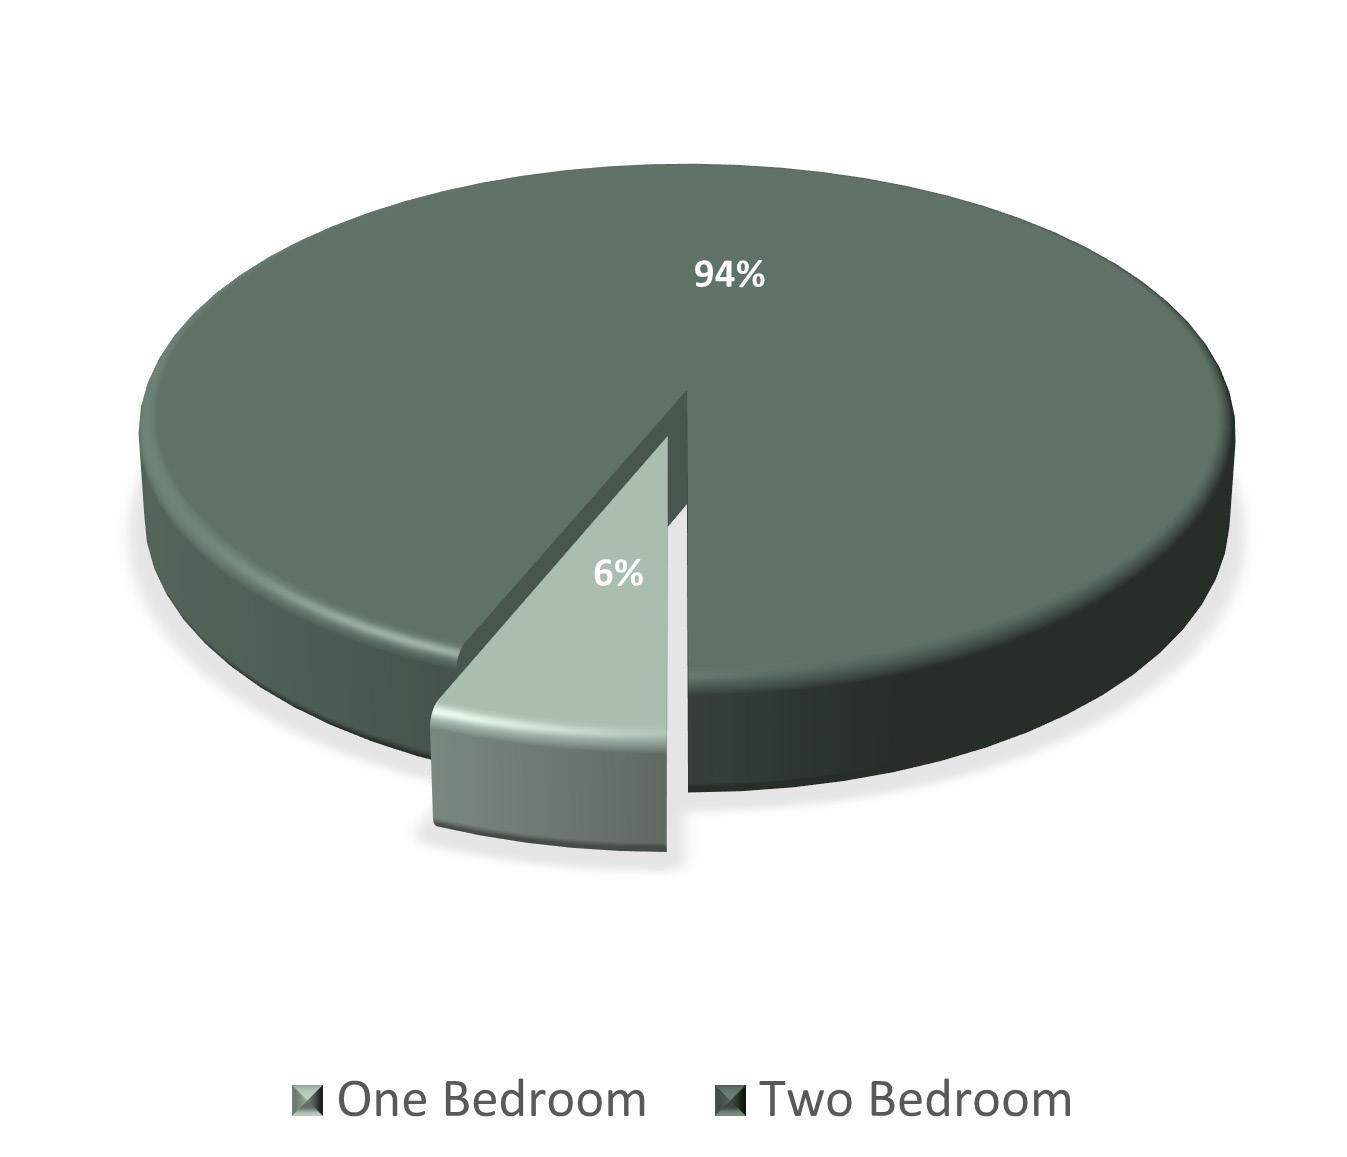
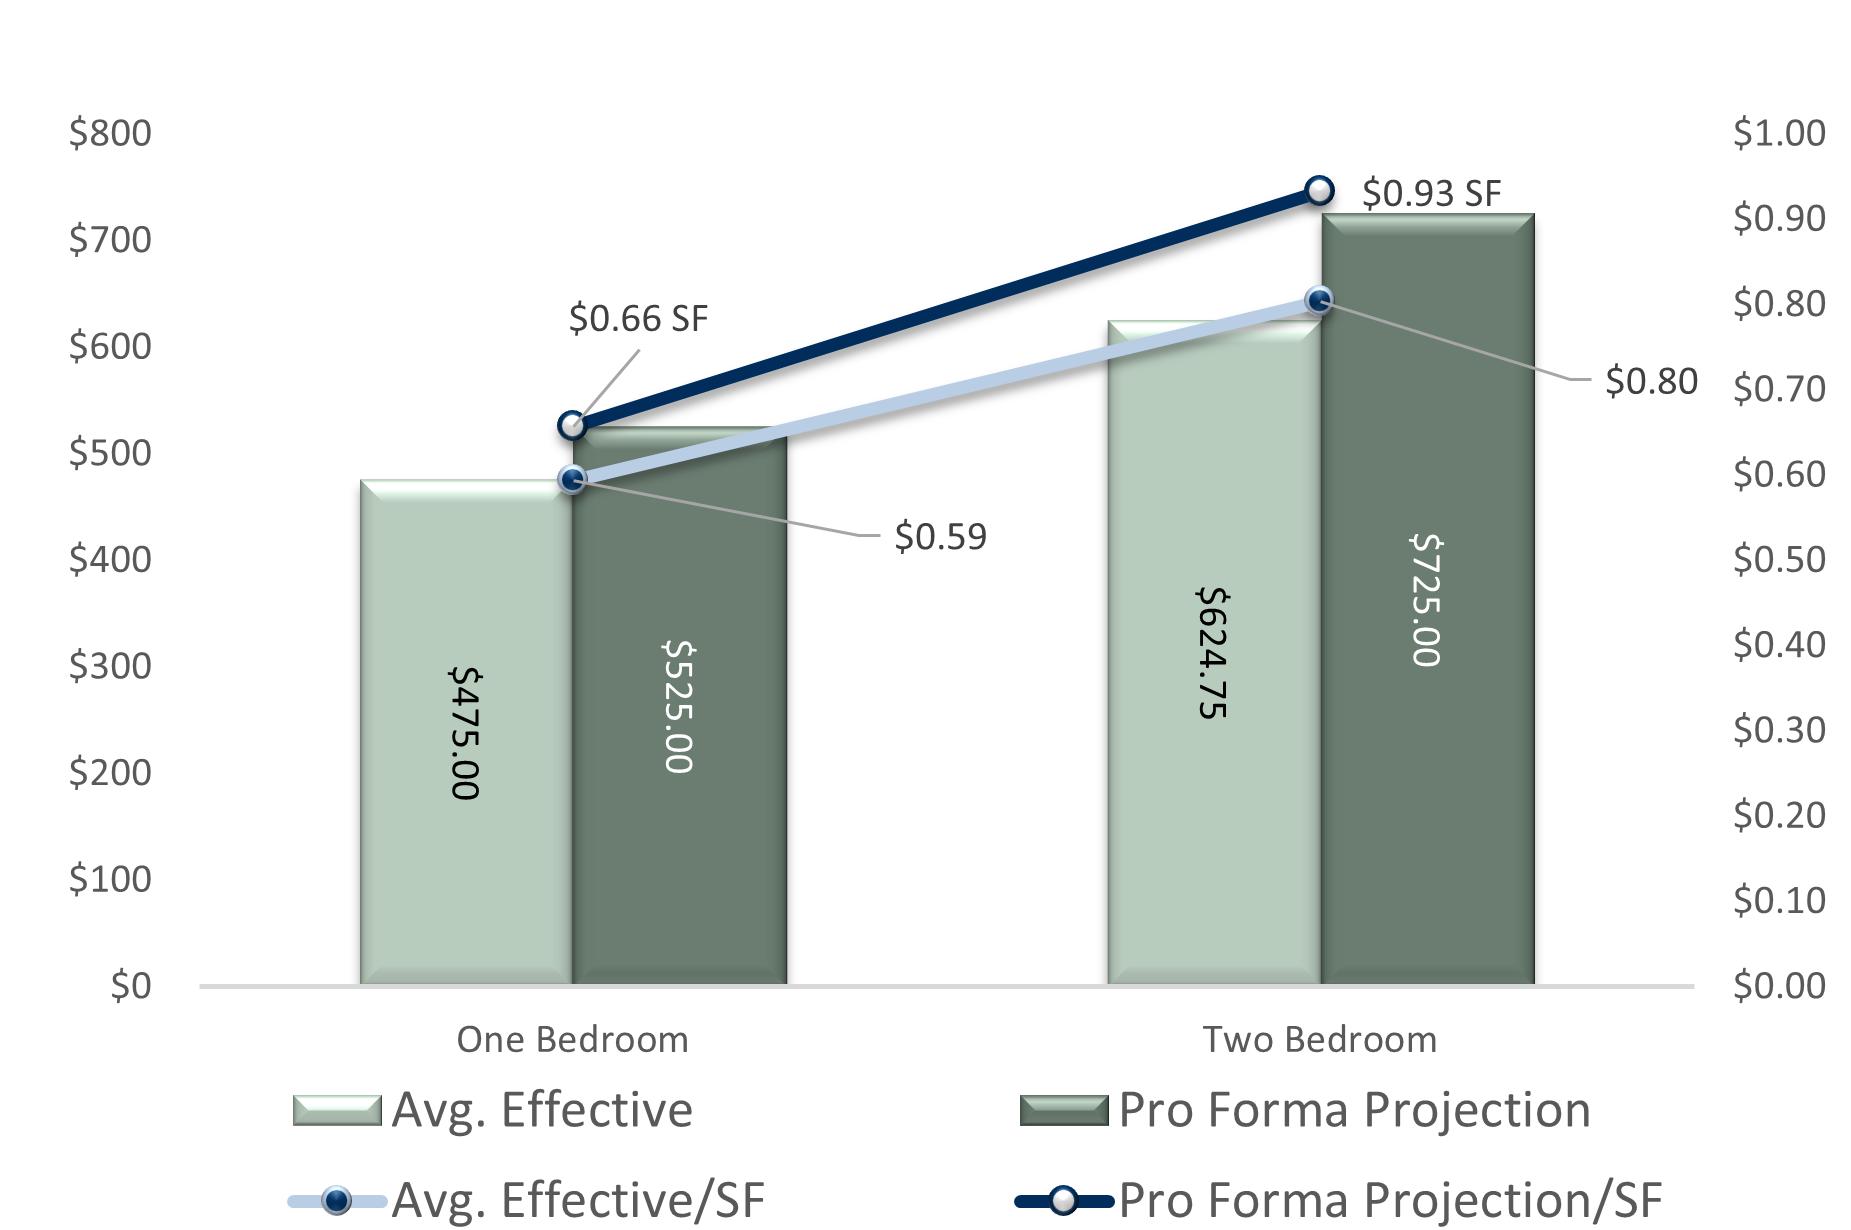

# NOTE
1 Replacement & Reserves: added based on market norm of $255 per unit per year
2 Laundry Income: Owner, not included in financial statements
3 Added based on market norms
4 Water/Sewer: Normalized Nov and Dec charges due to water leak in those months
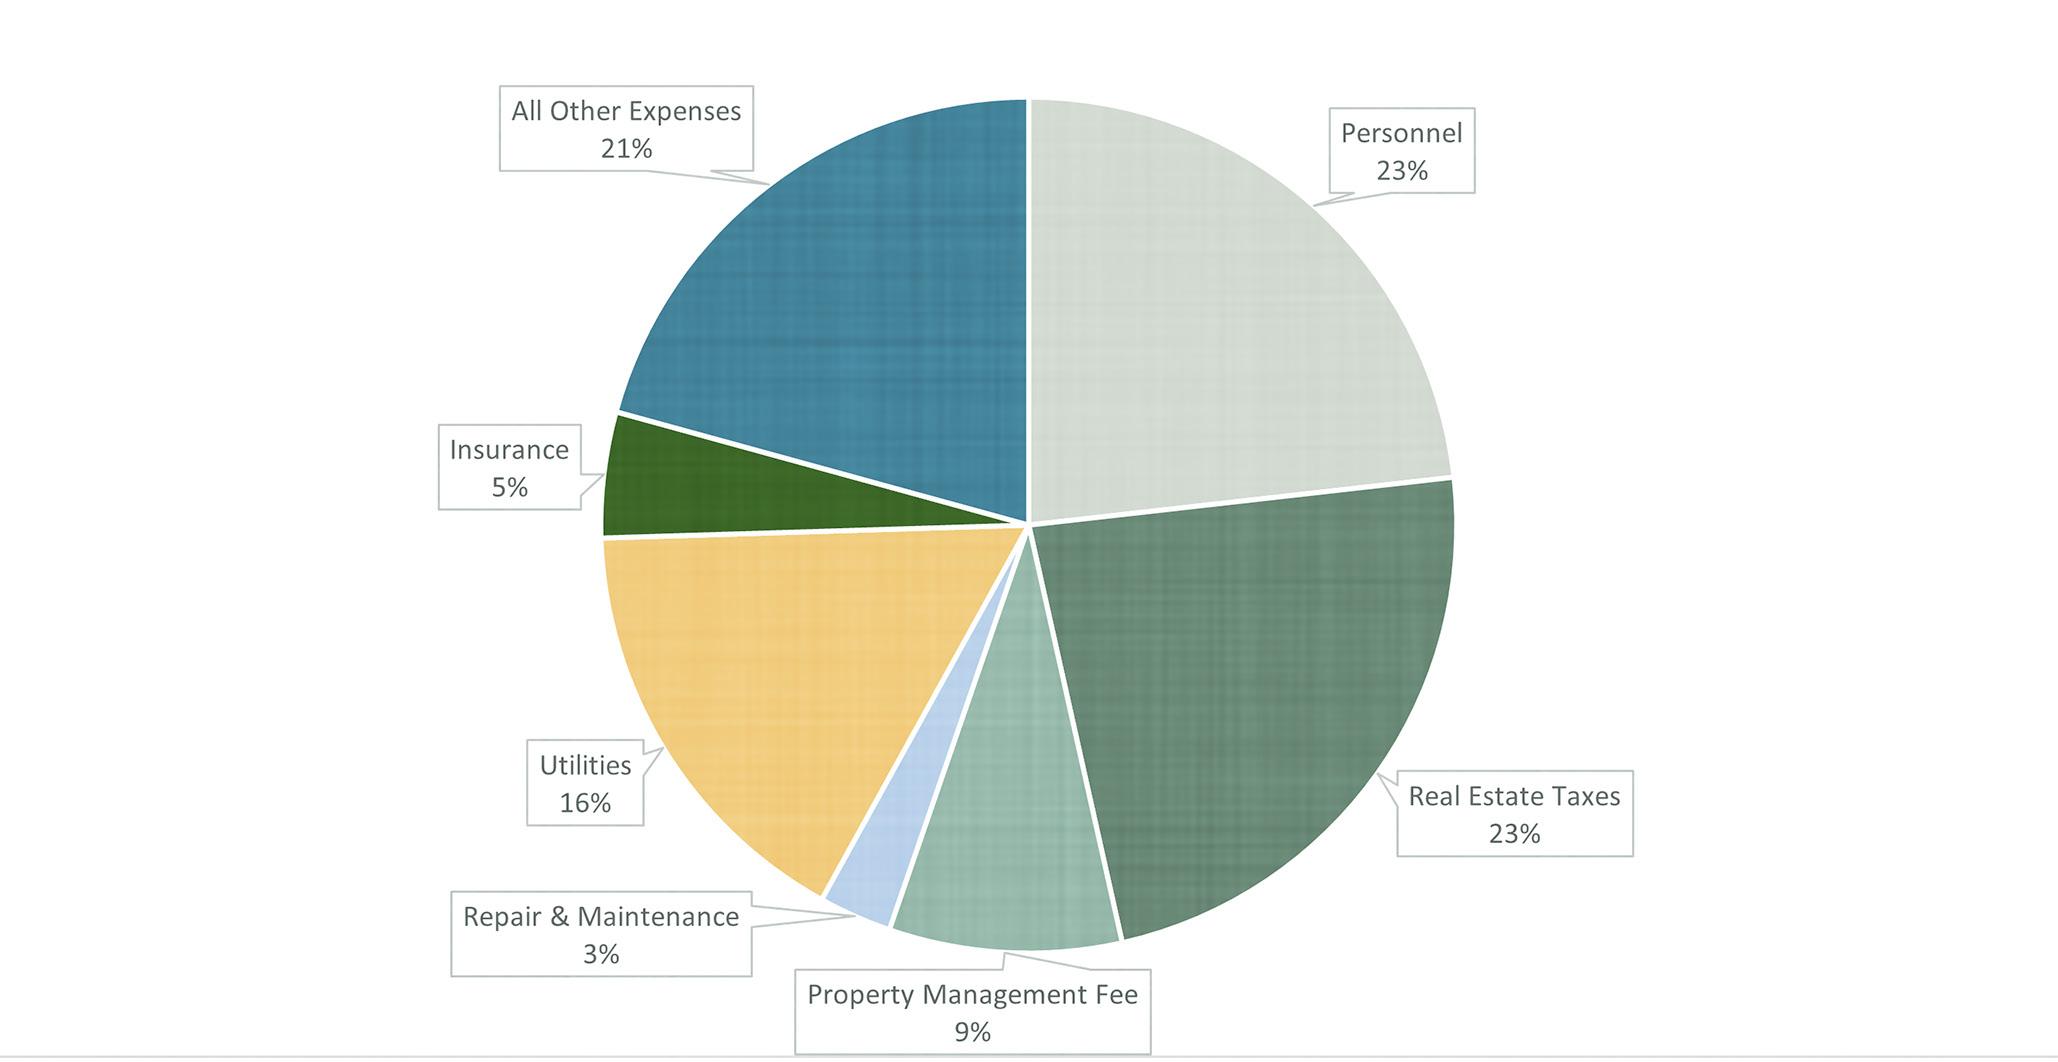
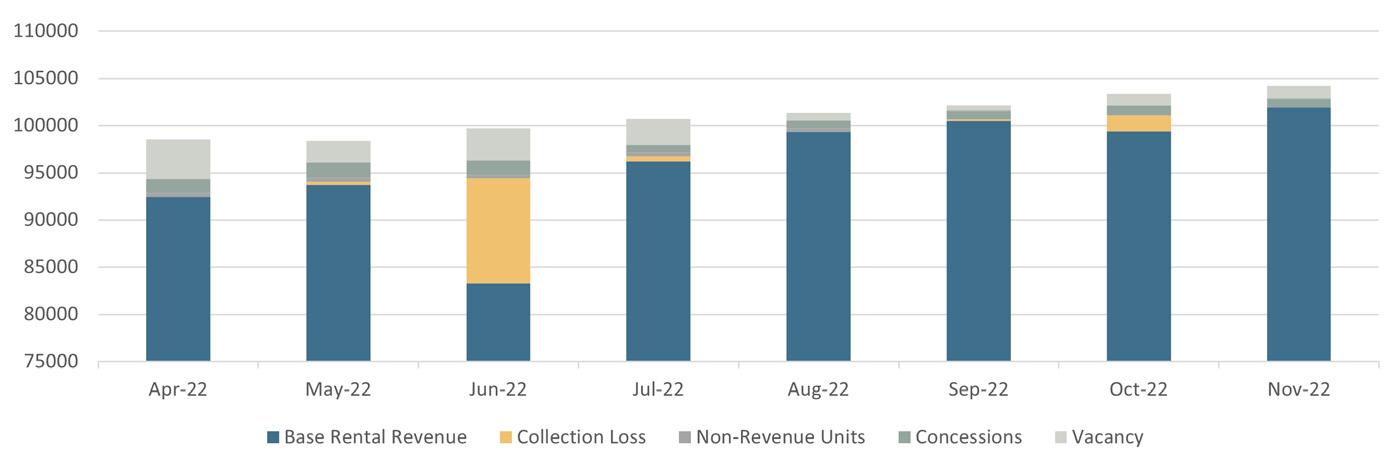

Marketing the asset without a specific price allows us to customize our sales approach to each investor’s specific rehab costs, cost of debt and minimum return requirements. Thus facilitating a competitive bidding environment and ultimately maximizing the value of the Property.
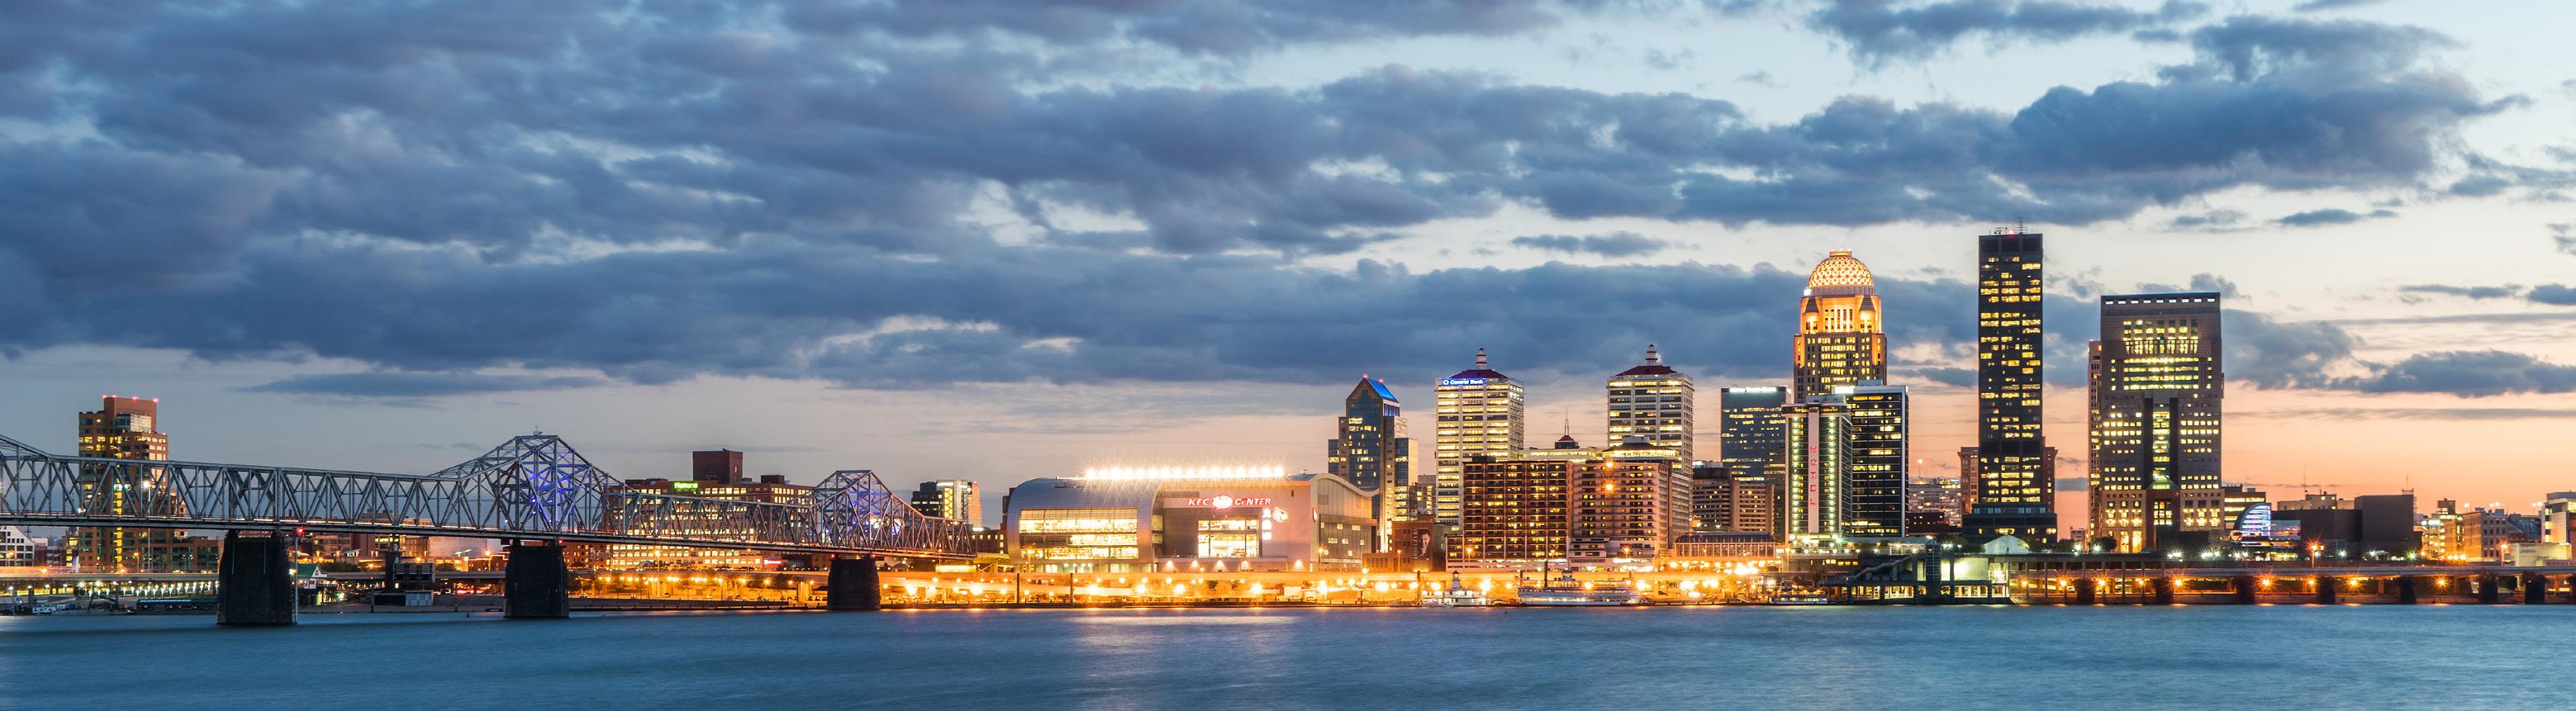
Situated on the banks of the Ohio River, Louisville is a progressive community of 1.3 million people. Louisville is one of the most uniquely authentic destinations in the world. It is Kentucky’s largest city and offers hundreds of one-of-a-kind attractions. Whether you are north, south, east, or west – Louisville offers a slew of attractions and historic architecture in every direction. Three of the state’s six Fortune 500 companies call Louisville home – Humana, Kindred Health, and Yum! Brands.
The area provides an attractive business environment for companies due to its location and low cost of doing business, while allowing employees to enjoy a relatively affordable place to live. The economy has transitioned from traditional manufacturing and shipping to health-
care, tourism, and technology. Tourism in the state of Kentucky has a $3.5 billion economic impact from Louisville alone. While the economic impact is very significant, the results are even more so, as they positively affect the quality of life in Louisville. Through maintaining its commitment to the tourism industry, Louisville can enrich and nurture its infrastructure, allowing it to consistently rank as one of the top cities in the nation for quality of life. Foodies and food trucks, brew masters and bourbon, sports, tradition, and transformation - it’s all happening in Louisville. With such a vibrant quality of life, Louisville is a great place to call home.
• Amazon building new $5.5MM last-mile delivery station at prime Louisville property adding close to 2,000 new jobs (March 2021).

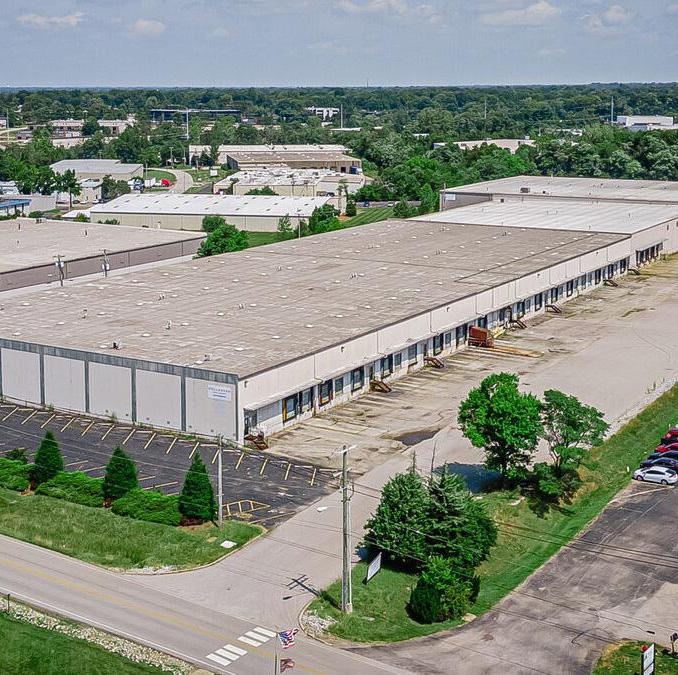
• GE Appliances completes $60MM expansion adding 245 new jobs (July 2021)

• Ge Appliances set to invest $450MM at its Appliance park in the next 2 years adding over 2,000 new jobs (Oct 2021)
• QSR Automations opens new global headquarters in Louisville, KY (Nov 2021)

• KCC Manufacturing breaks ground on 700-job operation in Shelby County (Nob 2021)
• Republic National Distributing Co. breaks ground on a relocation and expansion project that will create 30 full-time jobs with a $50 million investment (Sep 2021).
• Baptist Health to build $42M rehabilitation hospital in Jeffersontown (Nov 2021)

• Cincinnati characteristically managed to escape the more extreme swings in apartment market performance seen over the last two years in the wake of the pandemic. Although apartment absorption cooled considerably in 3rd quarter 2022, Cincinnati apartment demand did not plumet to the degree seen in many other markets nationwide.
• As deliveries mount to a record rate over the next year, operators will be unlikely to sustain Cincinnati’s recent record high rent growth. There were 6,411 units under construction at the end of 3rd quarter, with 3,722
Population: 2.2M
Average occupancy: 96.9%
of those units slated to come online within the next 12 months. Although those deliveries will be spread more evenly throughout the Cincinnati market, new supply will test the depth of the Class A renter pool in a market that has still yet to recover all its pandemic-era job losses.
• During the year-ending 3rd Quarter 2022, median home prices in Cincinnati increased an average of 10.6%, landing at a median price of roughly $270,000.
• The local homeownership rate averaged 70.6% in the year-ending 2nd
Median age: 37.9
Rent growth: 11.8%
MSA median home value: $270,000
MSA median hhi: $66,900
1 - Year growth: 10.6%
1 - Year growth: 2.35%
• In 3rd quarter 2022, effective asking rents for new leases were up 11.8% yearover-year. That annual rent performance was above the market’s five-year average of 4.7%. Cincinnati’s recent annual rent change performance ranked #2 in the Midwest region.
• Product classes in Cincinnati, annual effective rent change registered at 14.8% in Class A units, 11.6% in Class B units and 8.1% in Class C units.
• Among submarkets, the strongest annual rent change performances over the past year were in Butler County and North Central Cincinnati.
• The weakest performances were in West Cincinnati and North Cincinnati. As of 3rd quarter 2022, effective asking rental rates in Cincinnati averaged S1,286 per month, or $1.372 per square foot.
• New apartment completions in Cincinnati were modest recently, as 2,130 units delivered in the year-ending 3rd quarter 2022. With 176 units removed from existing stock over the past year, the local inventory base grew 1.2%.
• In the past year, supply was greatest in Central Cincinnati and Campbell/Kenton Counties. New supply was concentrated in Central Cincinnati, Campbell/Kenton Counties and Northeast Cincinnati/Warren County, which received 65% of the market’s total completions.
• At the end of 3rd quarter 2022, there were 6,411 units under construction with 3,722 of those units scheduled to complete in the next four quarters.
• Scheduled deliveries in the coming year are expected to be concentrated in North Central Cincinnati and Central Cincinnati.
• Over the past five years, annual absorption in Cincinnati has ranged from 675 units to 4,536 units, averaging 2,286 units annually during that time.
• In the year-ending 3rd quarter 2022, the market recorded demand for 1,013 units, trailing concurrent supply volumes. Among submarkets, the strongest absorption over the past five years was seen in Central Cincinnati, Campbell/Kenton Counties and Northeast Cincinnati/Warren County.
• Those areas accounted for 56% of the market’s total demand over the past five years. In the past year, demand was greatest in Central Cincinnati and Campbell/Kenton Counties.
• Transaction dollar volumes in Cincinnati totaled roughly $332.9 million in the year-ending 3rd quarter 2022, down about 40% year-over-year.
• Transactions in the year-ending 3rd quarter 2022 yielded an average cap rate of 5.50%, down 21 basis points year-over-year. By comparison, cap rates averaged 5.05% in the Midwest region and 4.56% nationally.
• The average price per unit in Cincinnati came in at roughly $151,800, up 57.4% annually. Cincinnati’s average price per unit landed below the norms for both the Midwest region ($173,900) and U.S. overall ($238,700).
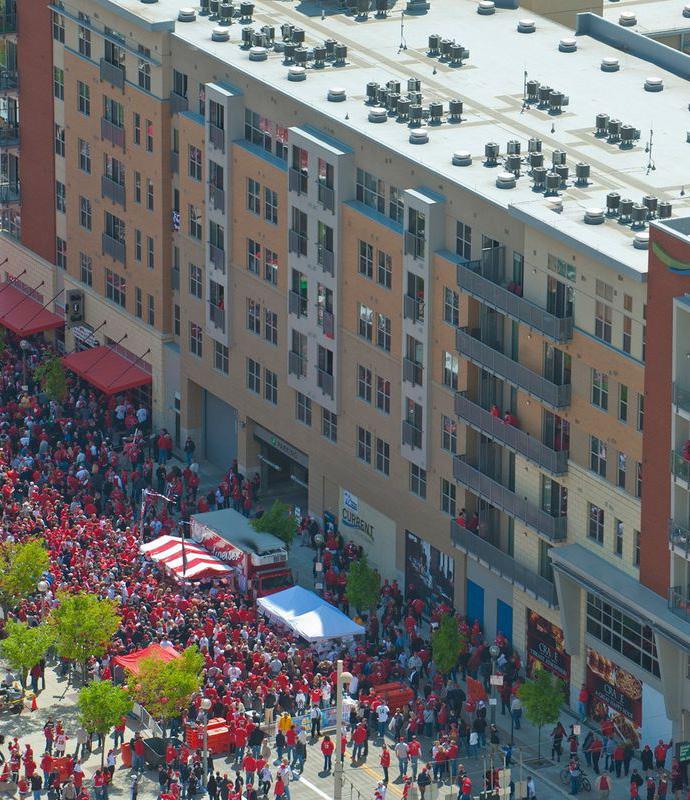
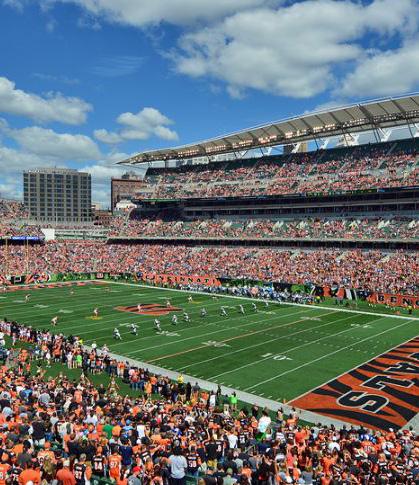
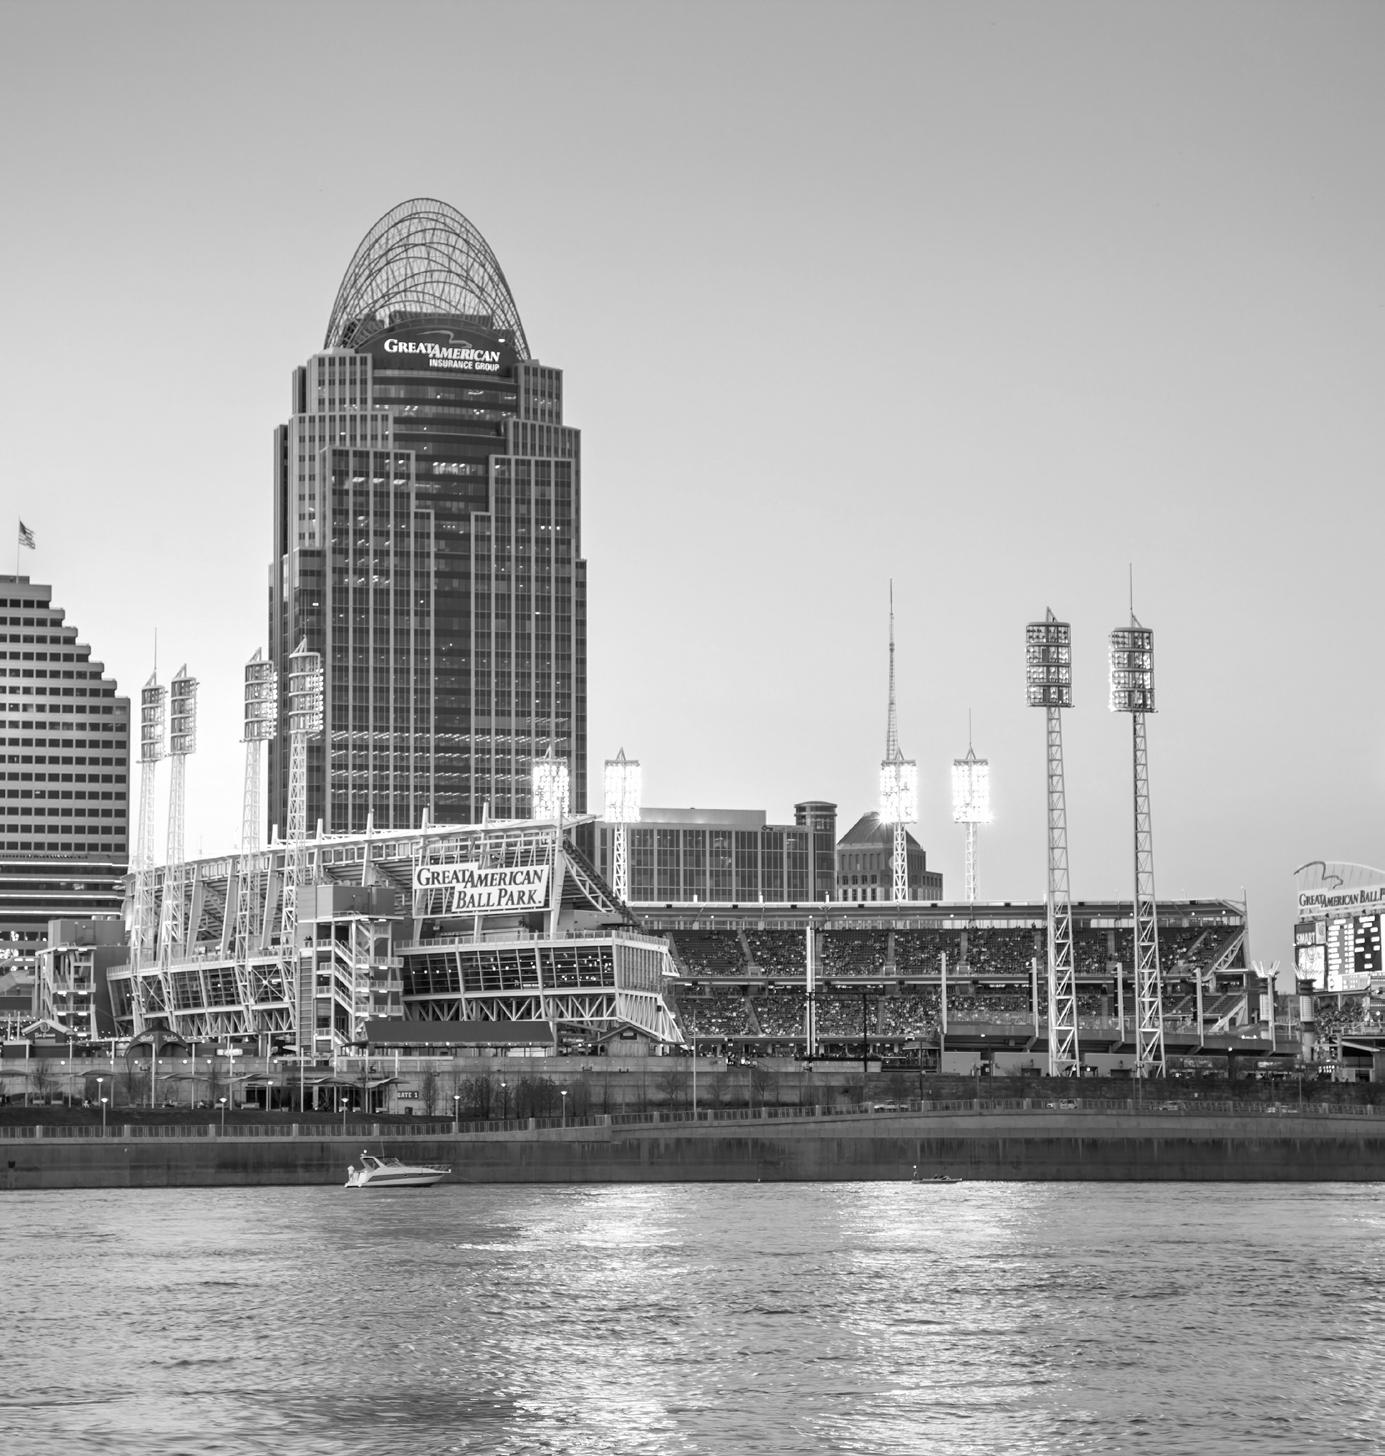
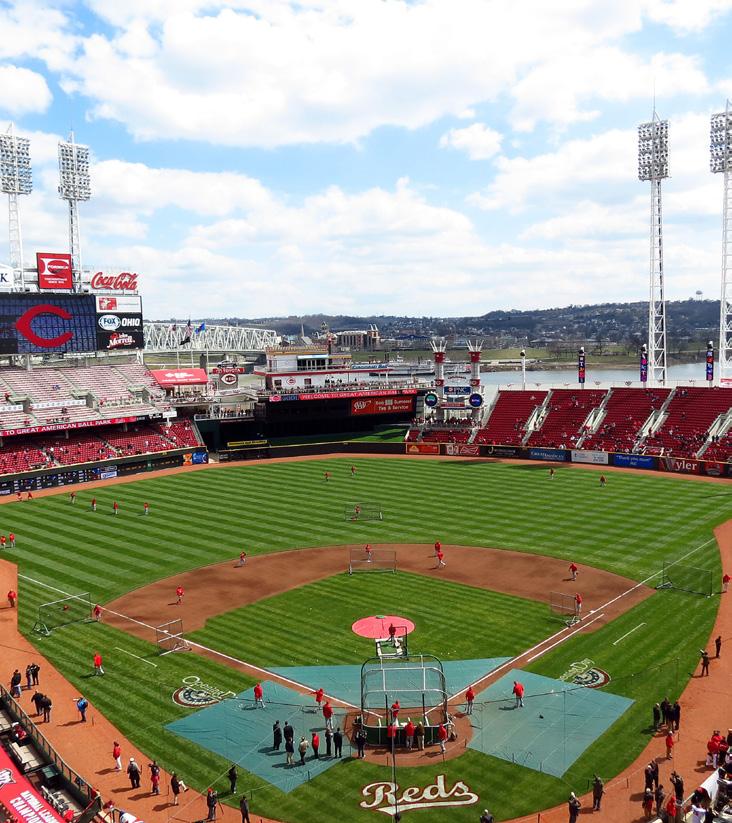
Right on the water and brimming with activity- The Banks is where you will find everything from sports events to a lively nightlife scene. Located along the Ohio River, The Banks provides spectacular riverfront views and lines the water with a family friendly park. Along with great biking, walking, and other recreational amenities during the daytime, The Banks comes alive at night. With live music and entertainment, a thriving bar scene nestled between two sports stadiums, The Banks is the place to be.

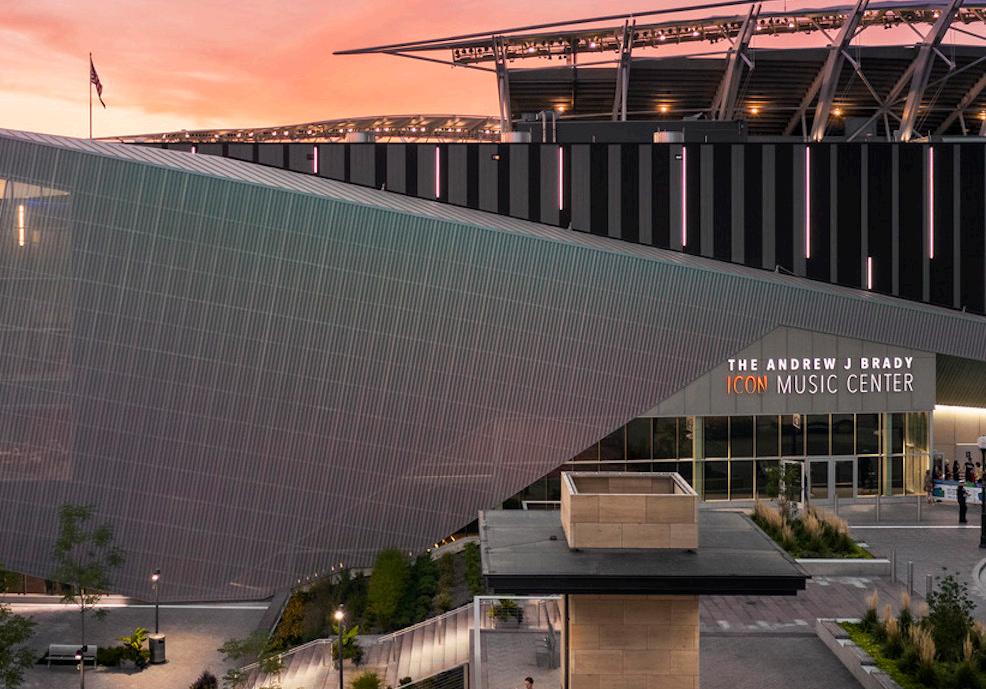
A major attraction at The Banks, the Andrew J Brady ICON Music Center was built for the audience experience, offering an intimate yet spacious setting. Offering both indoor and outdoor venues, the state-of-the-art facility hosts a wide variety of musical acts, spanning all genres. Visitors can enjoy a live concert while taking in the scenic riverfront view.
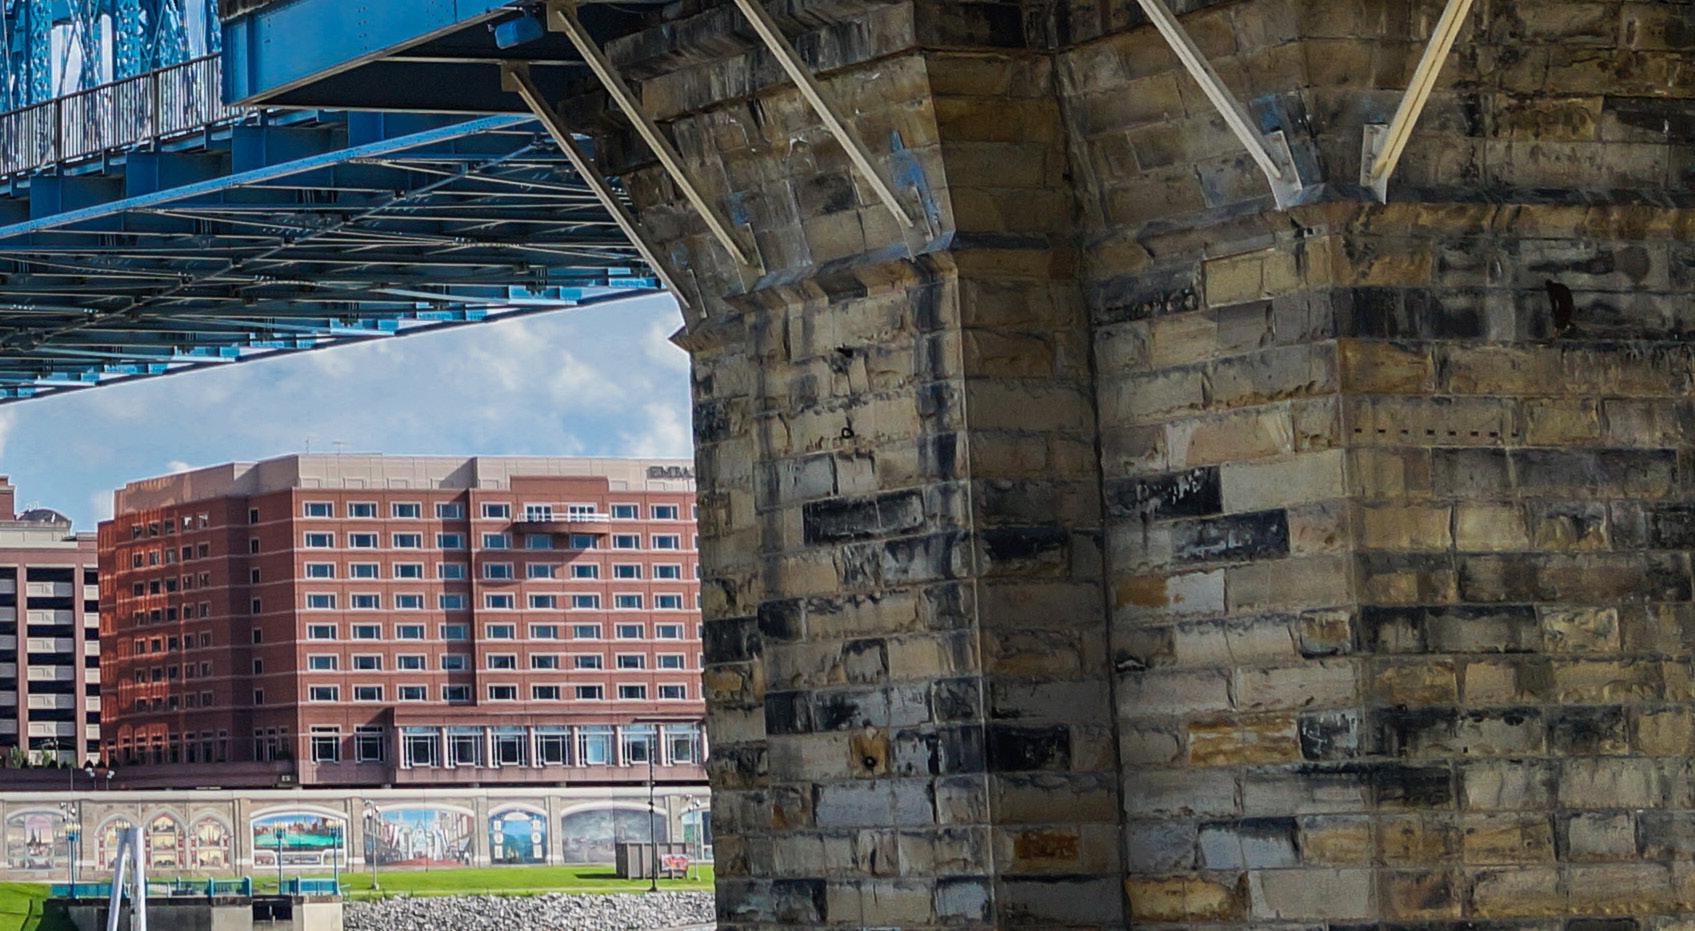
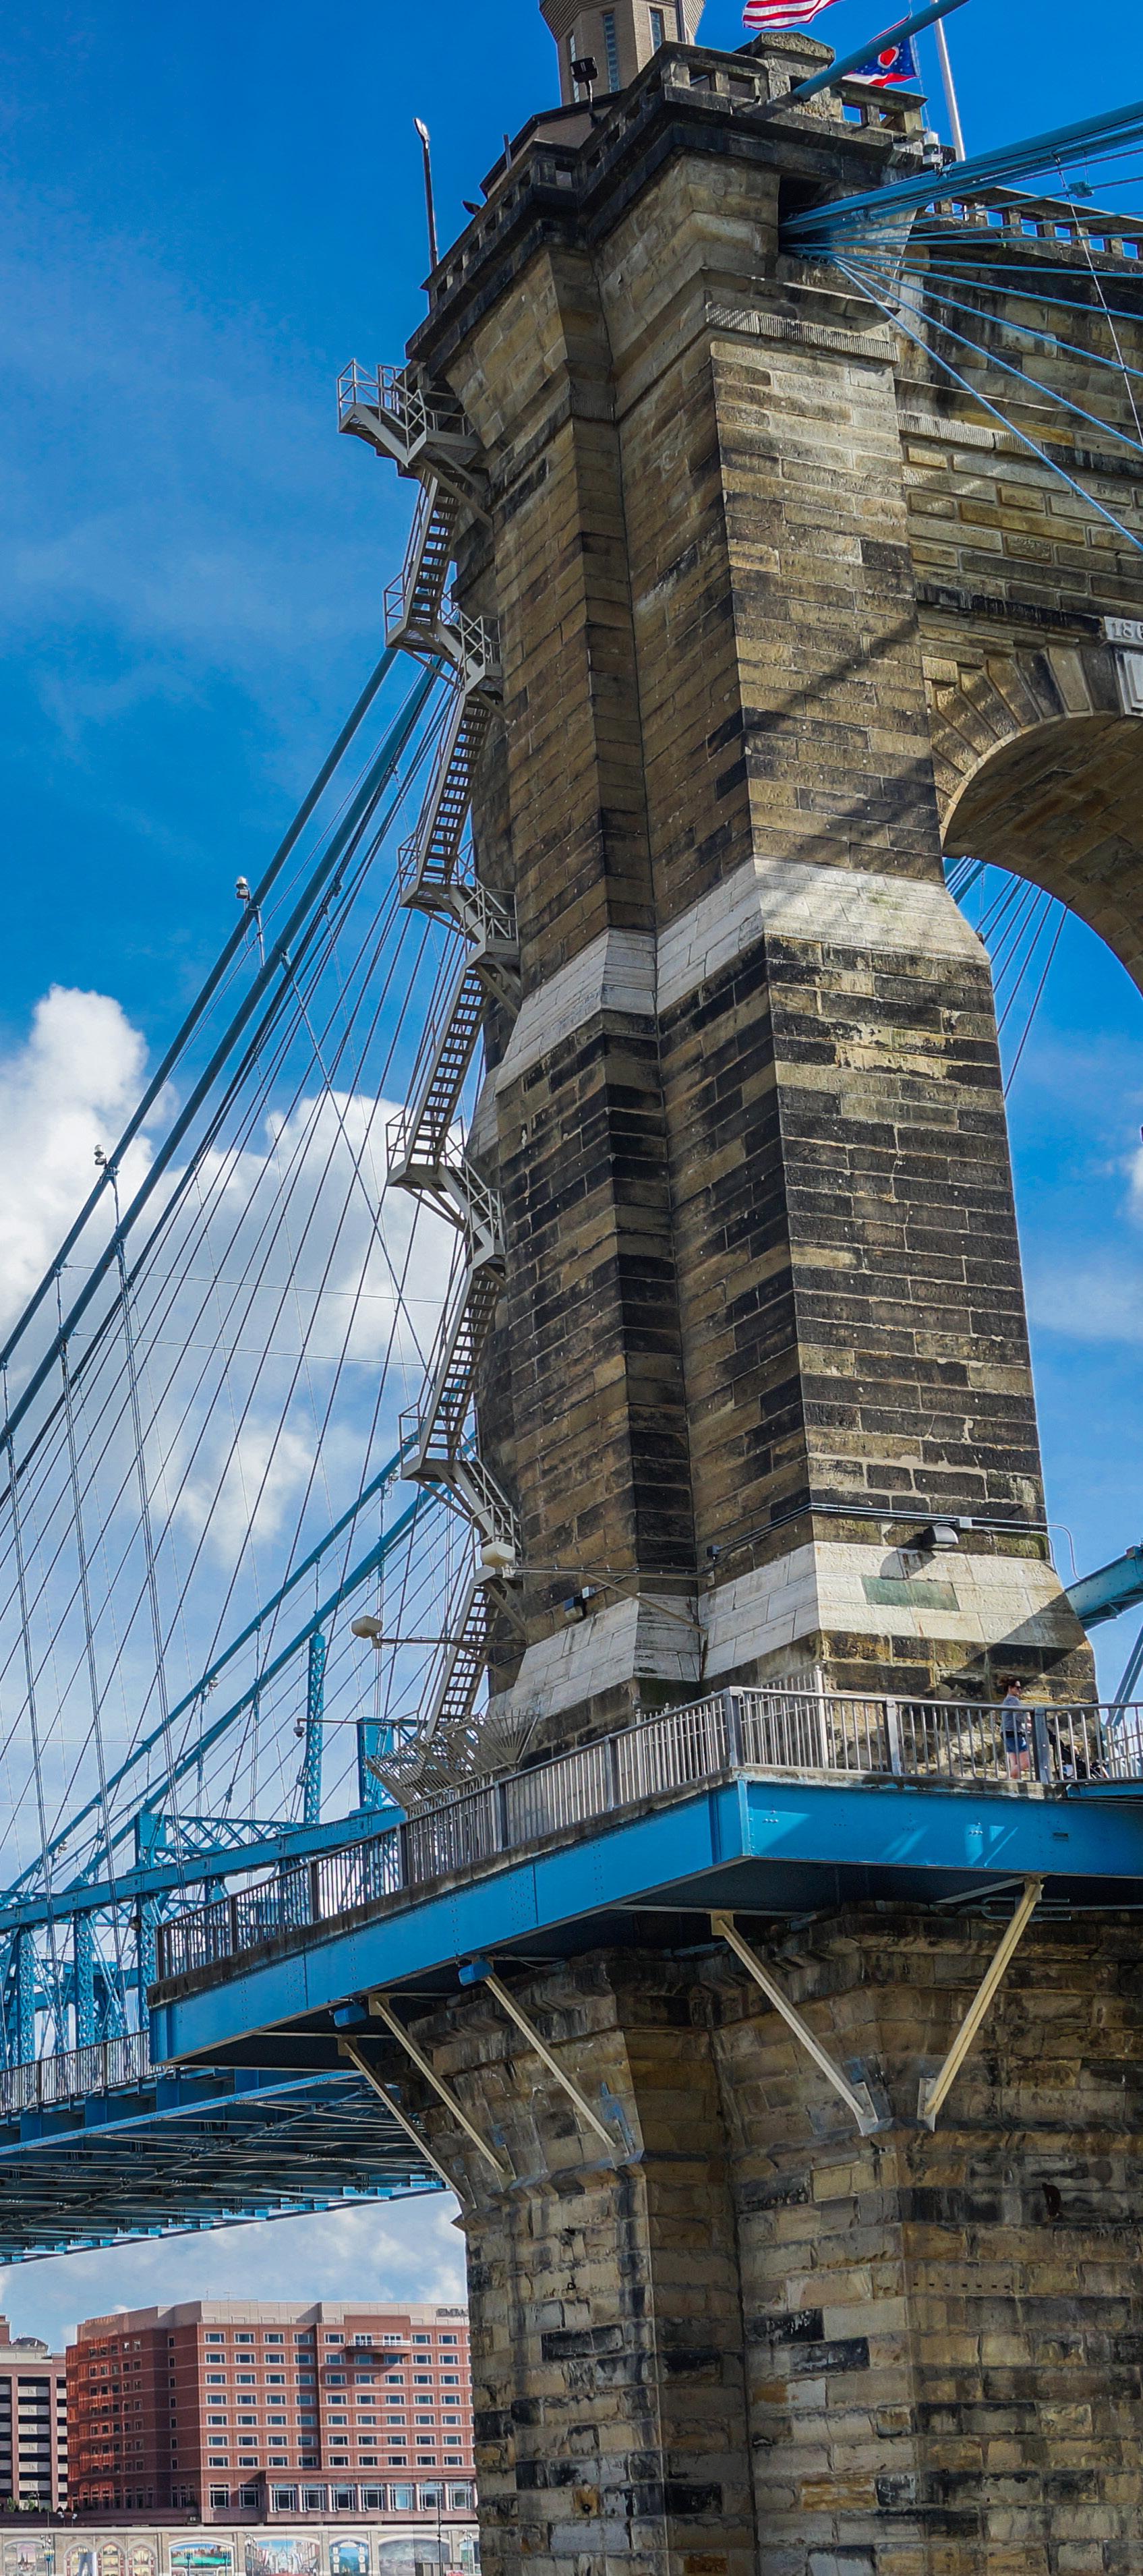
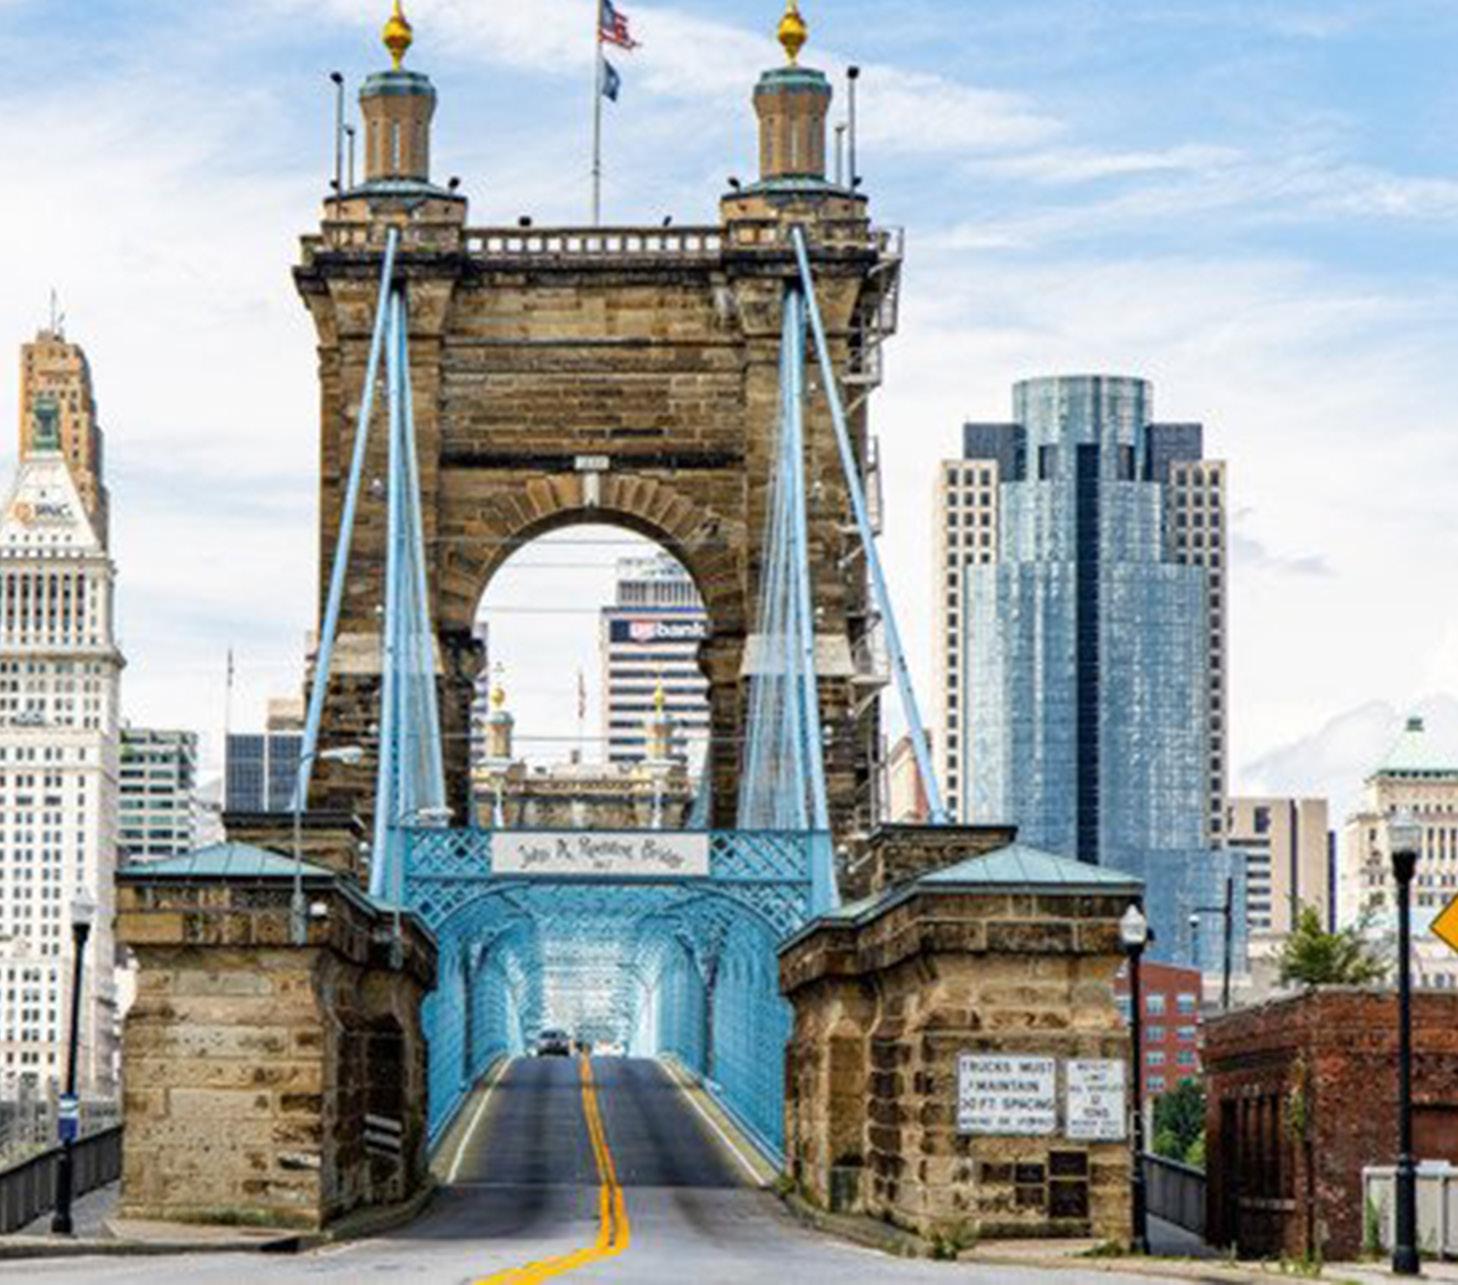
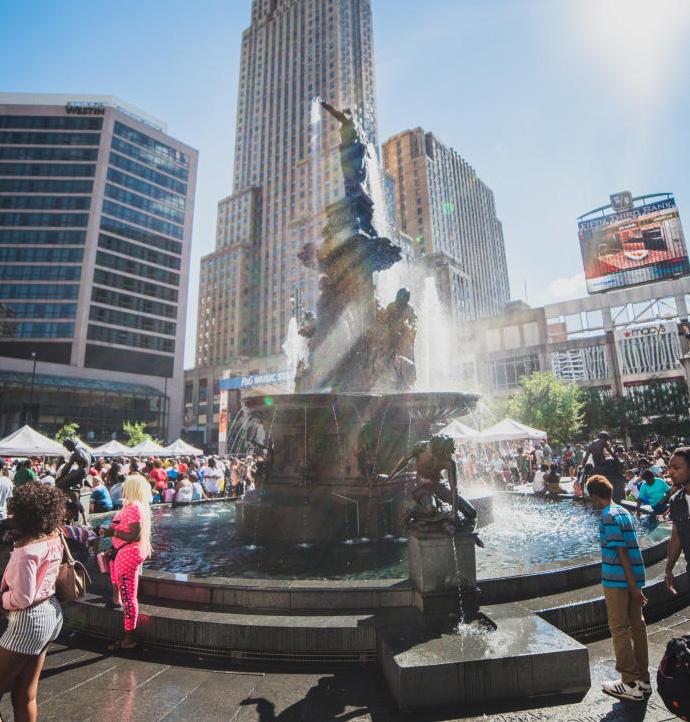
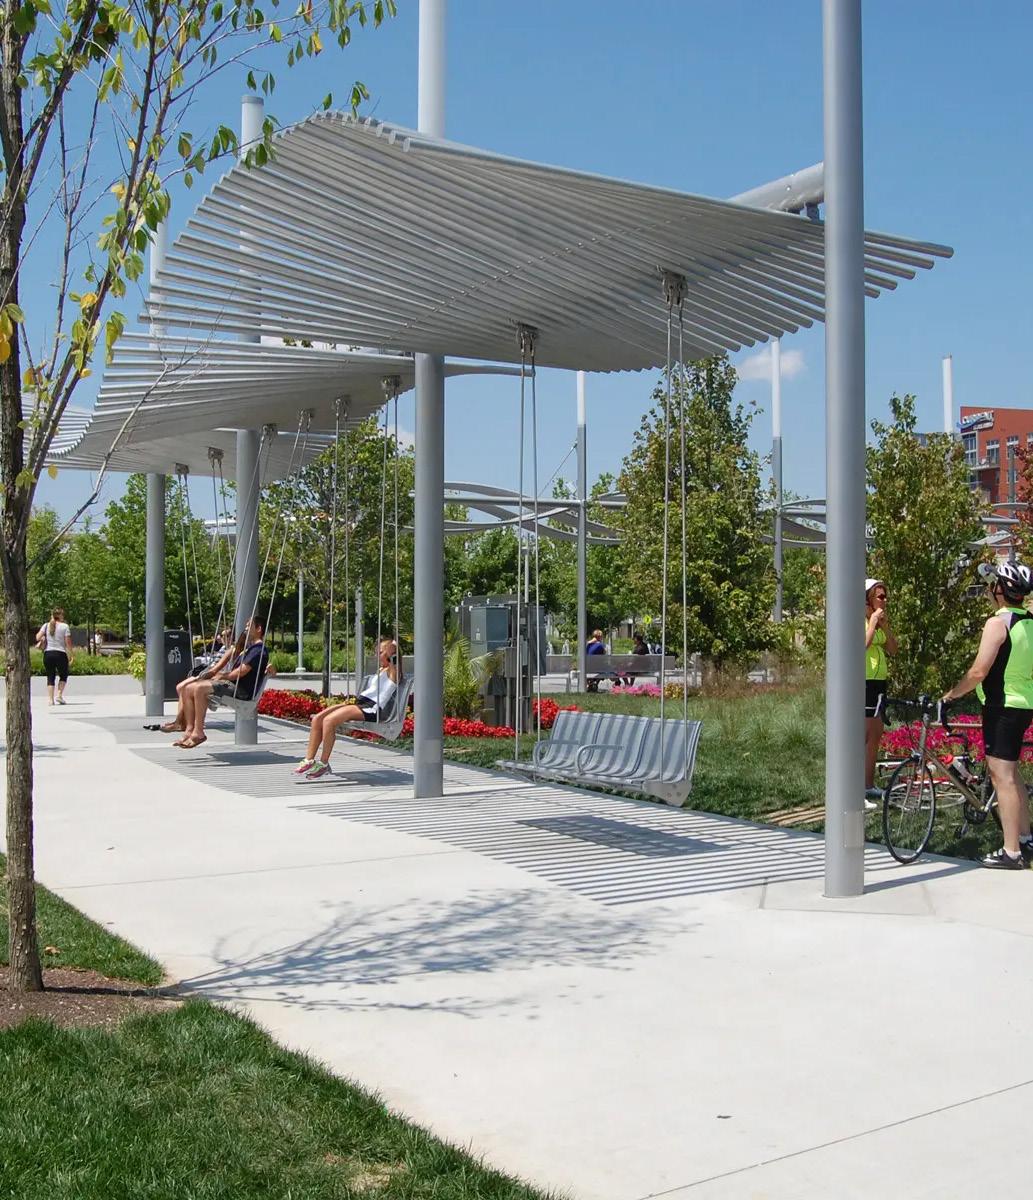
Ranked by USA Today readers as a Top 5 Riverwalk in the nation, Smale Riverfront Park offers walking trails, water features, swings, and other amenities to enjoy, while taking in the beautiful views of the Ohio River and the historic John A. Roebling Suspension Bridge. If you have kids in tow, make sure to visit Carol Ann’s Carousel, featuring 44 characters and illustrations incorporating Cincinnati landmarks. Enclosed in a glass building, the carousel is open year-round.
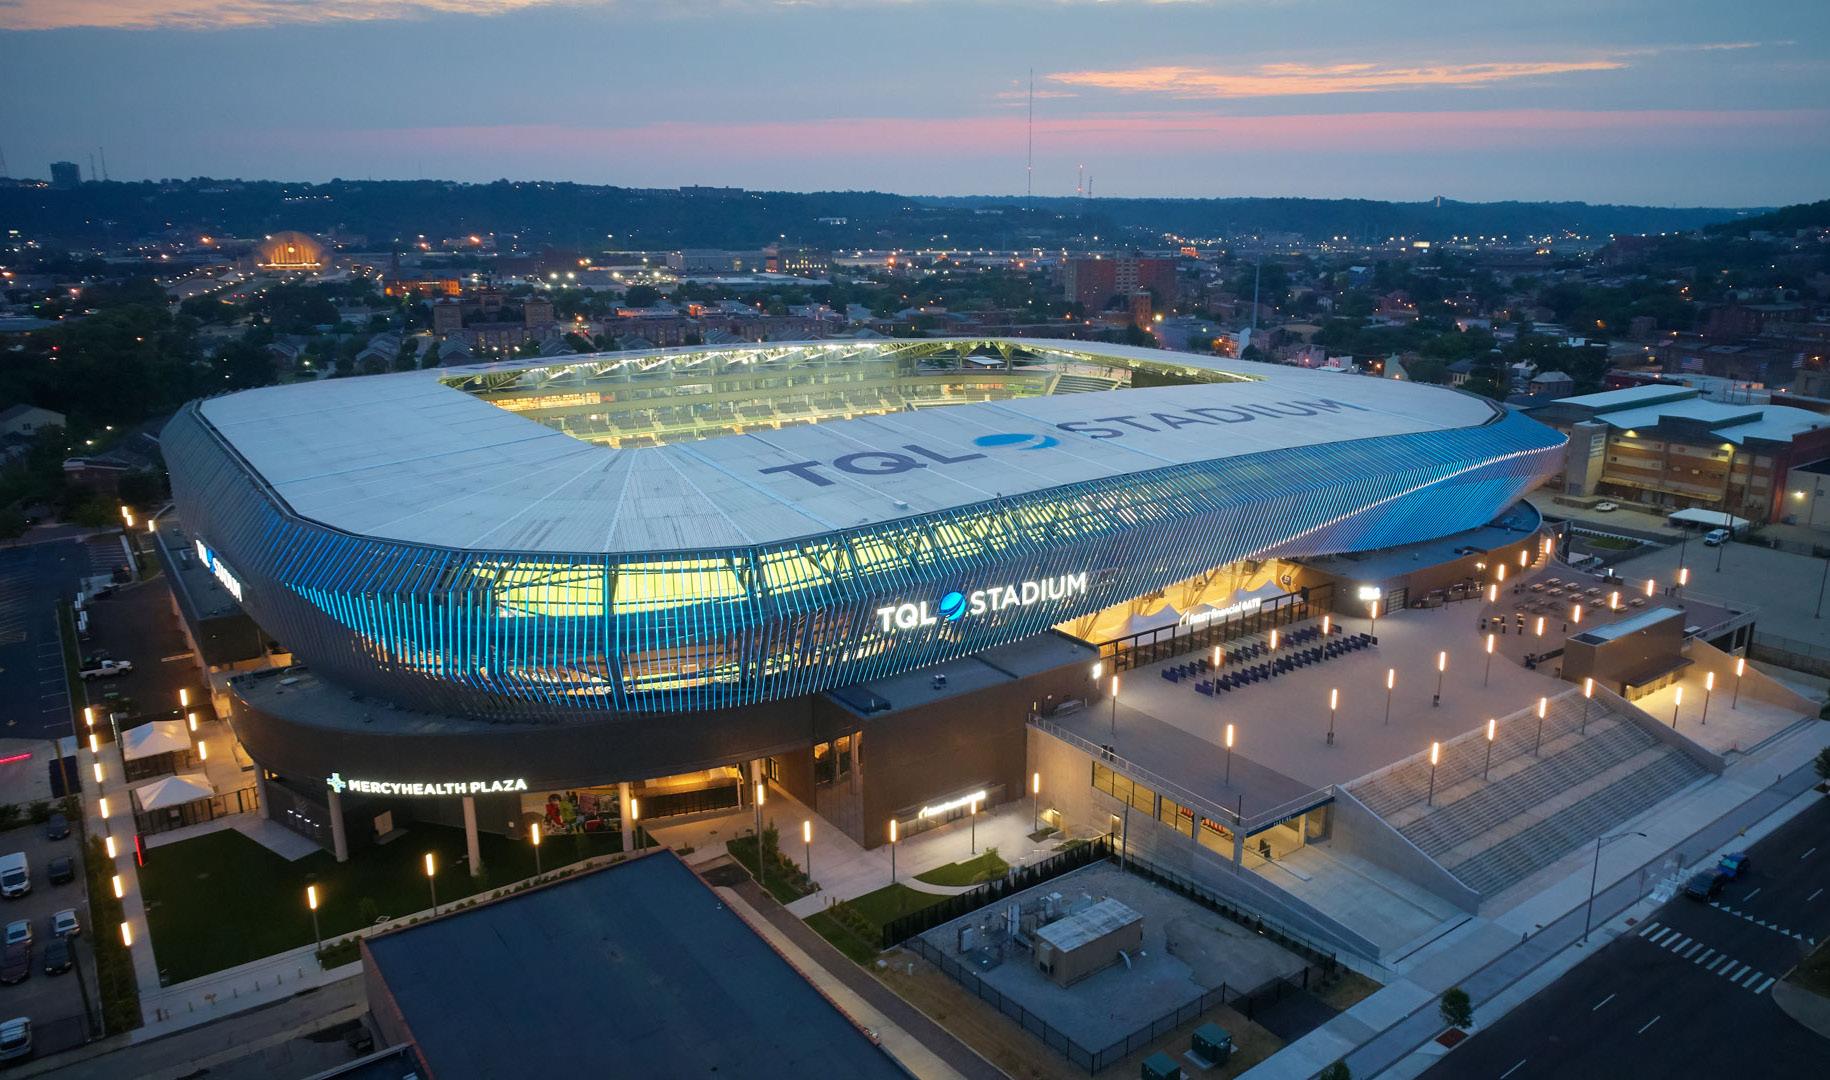
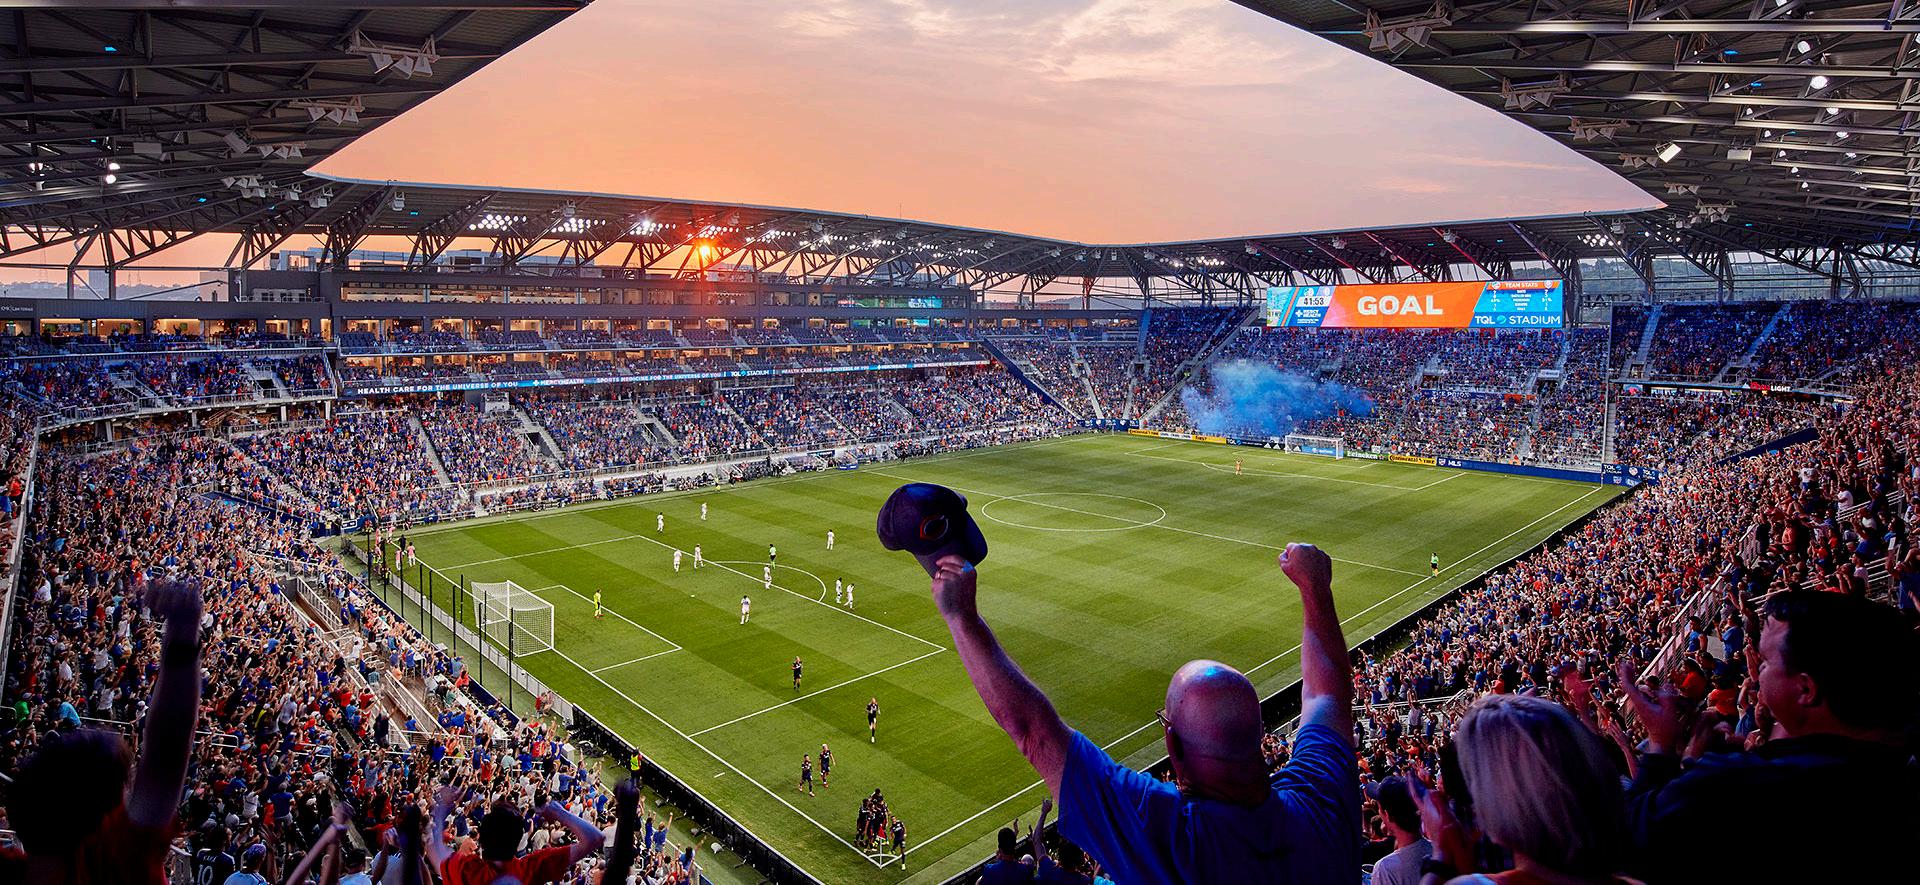
The FCC-TQL partnership brings together two Cincinnati-grown, leading businesses that share a “no limits” philosophy as well as a deep connection and commitment to our local community. There are a lot of synergies that make this alliance between TQL and FCC a perfect match and are reflected throughout the stadium from — the fin lighting to the TQL Beer District. The stadium features first-in-the-world lighting technology powered by 2.7 miles of LED lights.
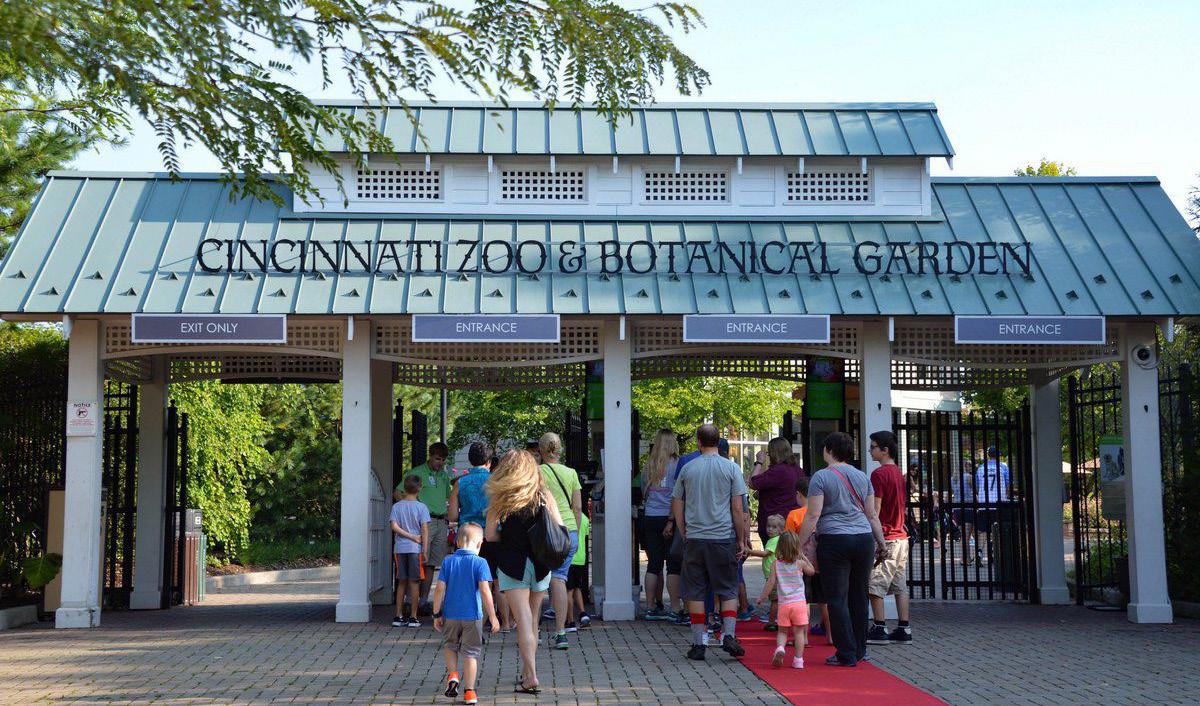
The Cincinnati Zoo & Botanical Garden is the second oldest zoo in the United States, founded in 1873 and officially opening in 1875, after the Roger Williams Park Zoo. It is located in the Avondale neighborhood of Cincinnati, Ohio. It originally began with 64.5 acres in the middle of the city, but has spread into the neighboring blocks and several reserves in Cincinnati’s outer suburbs. It was appointed as a National Historic Landmark in 1987.
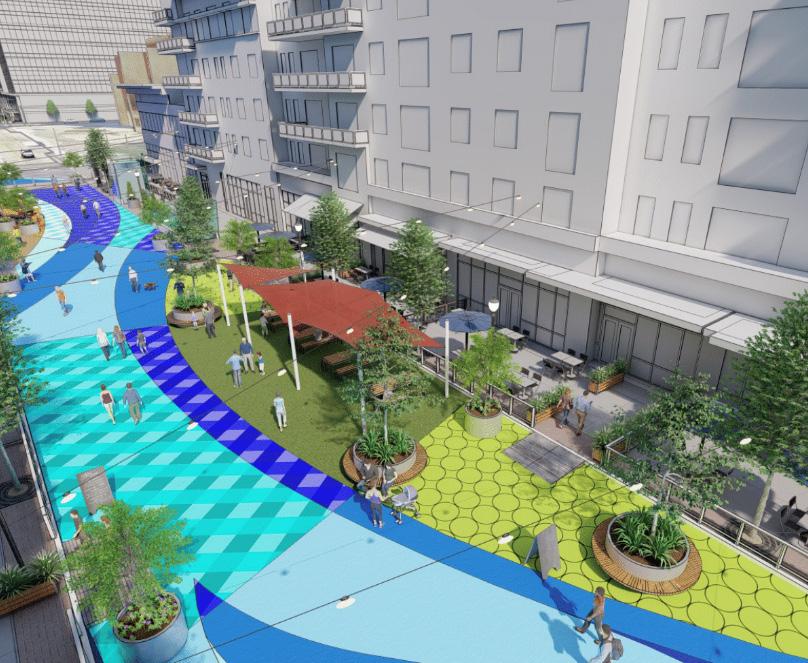
From 11am – 1am daily, the 85-acre DORA district at The Banks allows guests to take their beverage purchased from one of the 18 Banks establishments and explore our public plazas and green spaces. It simply needs to be in the Official DORA Cup.
At risk of missing the first pitch? Late for the opening act? Take your beverage purchased in a DORA cup from a Banks establishment and go! Waiting for a table, or wish to picnic outside in The Banks plazas or greenspaces? Grab a DORA beverage from a Banks establishment and explore!
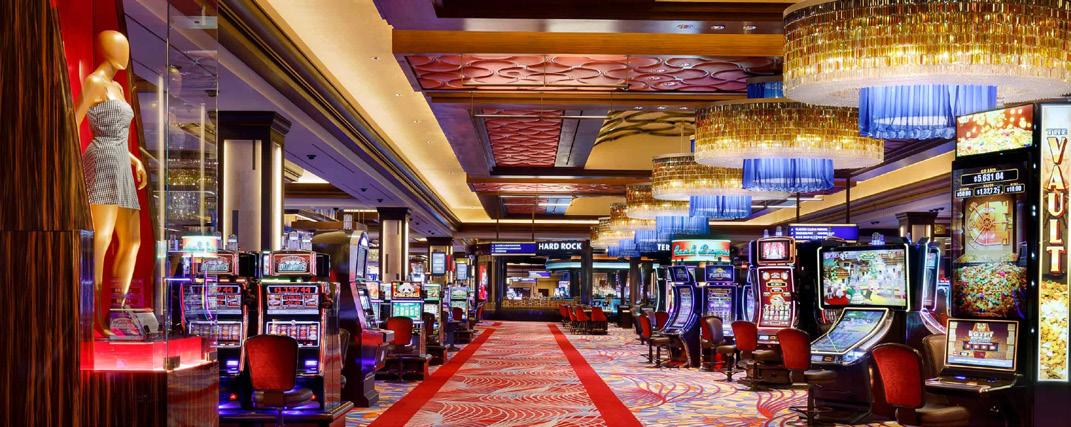
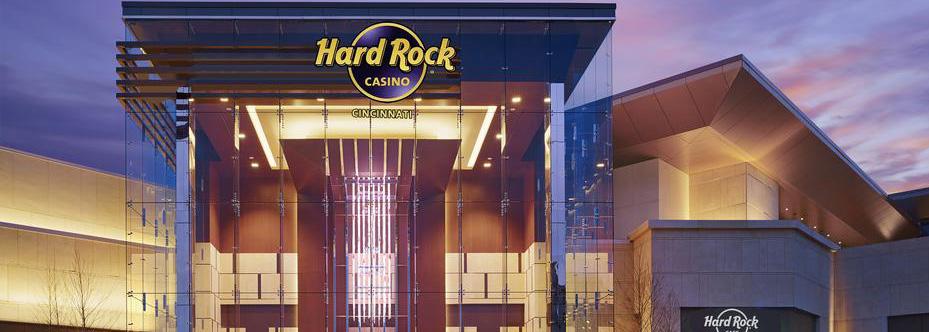
The game is always on at Hard Rock Casinos, where stars are made every night. Come try your hand at the tables, with classic games including blackjack, baccarat and poker, or tap into thousands of the hottest slots on the planet. With the world’s greatest rock memorabilia collection to enhance the thrill, plus the accompaniment of live, world-class entertainment, the atmosphere is like no other.
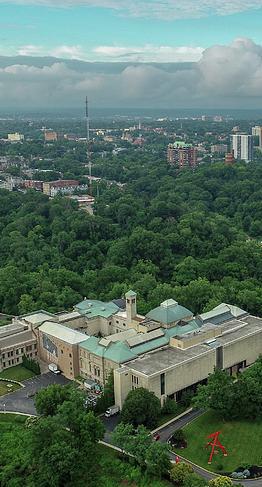
Located in scenic Eden Park, the Cincinnati Art Museum features a diverse, encyclopedic art collection of more than 67,000 works spanning 6,000 years. In addition to displaying its own broad collection, the museum also hosts several national and international traveling exhibitions each year. Visitors can enjoy the exhibitions or participate in the museum’s wide range of art-related programs, activities and special events. General admission is always free
for all. Museum members receive additional benefits. The museum is supported by the generosity of individuals and businesses that give annually to ArtsWave. The Ohio Arts Council helped fund the museum with state tax dollars to encourage economic growth, educational excellence and cultural enrichment for all Ohioans. The museum gratefully acknowledges operating support from the City of Cincinnati, as well as our museum members.
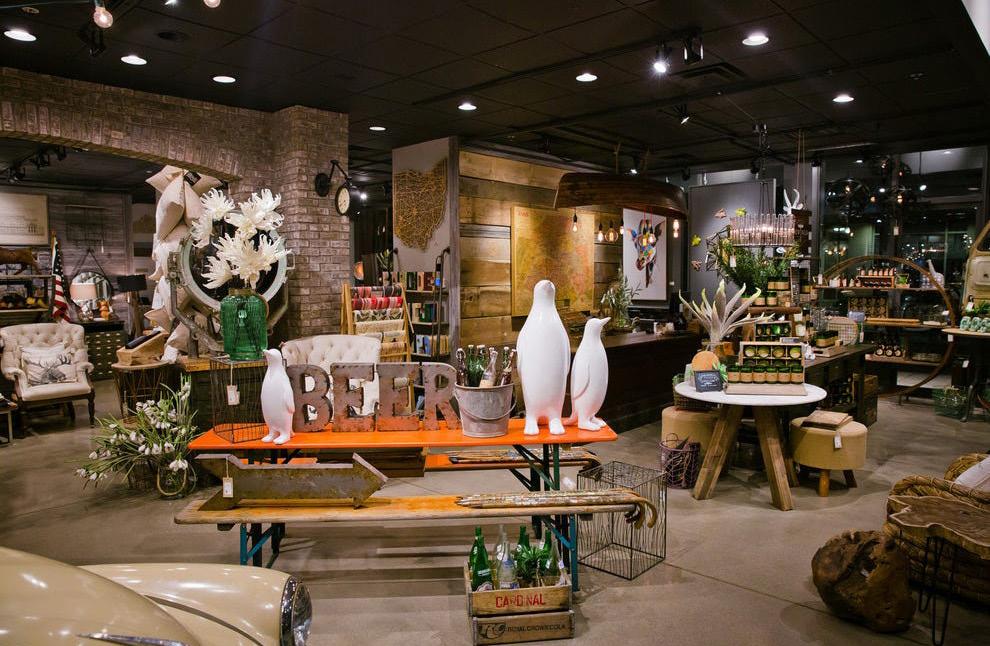
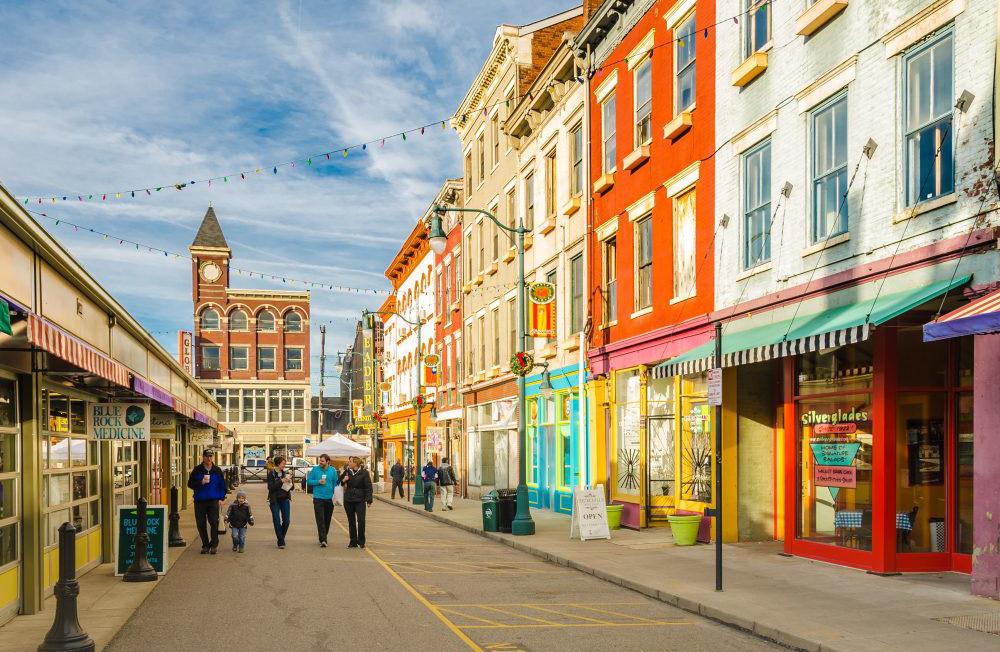

In addition to the restaurant and nightlight scene, the area has no shortage of retail options. Downtown offers both boutiques and department stores. Over-the-Rhine (OTR) is a historic, walkable district of downtown Cincinnati with many independent shops. Cincinnati’s Over-the-Rhine neighborhood was once a place where residents would not recommend to visitors, but that has changed. The restaurant and nightlife scene is now thriving, and the shopping scene is beginning to catch up. Most of the shops are in the southwest quarter of Over-the-Rhine, on either Vine or Main St. You won’t find chain stores in this walkable shopping district. MiCA 12/v and Urban Eden are a popular gift shops that sell local arts and crafts. Elm & Iron sells vintage and up-cycled items for the home. The Little Mahatma sells exotic jewelry and folk art from around the world. You’ll find several clothing boutiques, including Mannequin, a non-profit upscale and vintage boutique that benefits local charities. Park + Vine is a popular general store for environmentally-conscious shoppers; they sell a variety of merchandise including green cleaning and personal products, vegan foods, garden products and more.
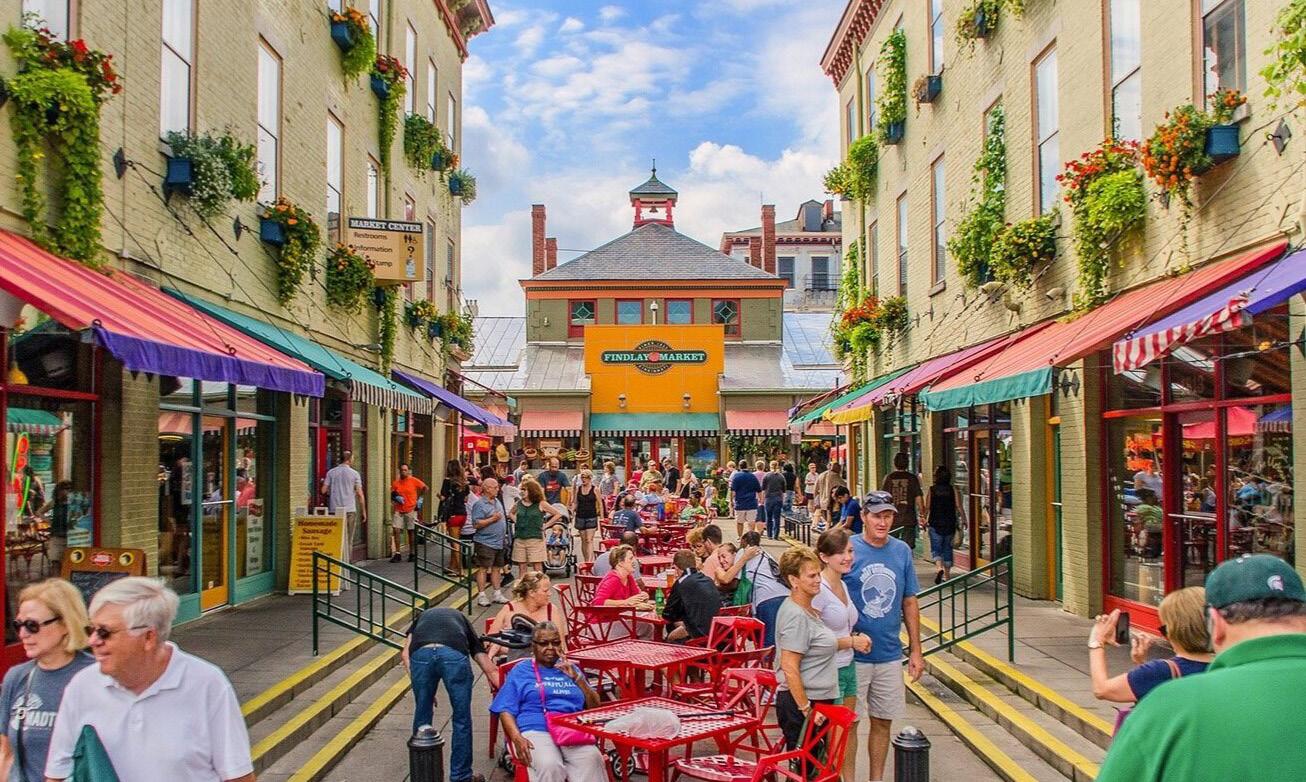
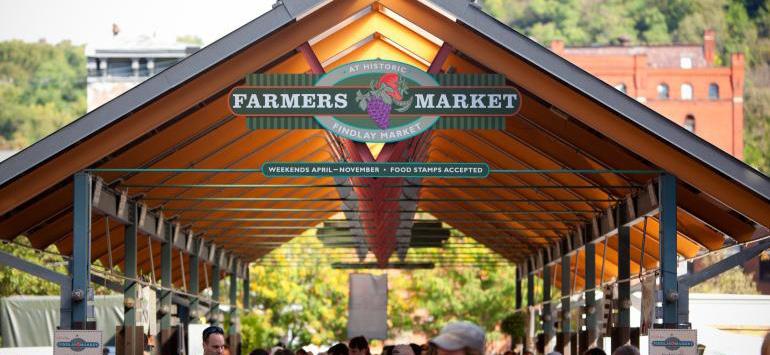
Findlay Market is Ohio’s oldest continuously operated public market and is located in the historic Over-the-Rhine neighborhood. The market is a wonderful place for locals to buy their groceries as well as a must-see historic spot for visitors to Cincinnati. Findlay Market is open year-round, Tuesday through Sunday, with a seasonal farmers market. Nearly 40 full-time businesses operate year-round, plus over 100 more vendors operate on weekends or part-time. Many vendors sell raw food while others specialize in prepared foods. Some of the merchants are new startups, while others have been in business for generations. You’ll find everything from fresh meat and produce to imported fine teas to Belgian waffles. There are restaurants as well as a beer garden, so plan to stay for lunch. Findlay Market has a fascinating history. Why not take a tour to learn more? There are several different tour options, including a culinary tour with tasty samples.