9 minute read
Stage 2: Competitor Analysis and Projected Future Industry Leader Selection Introduction

Stage 1 of the assignment identified three companies with the highest electric vehicle industry share. Tesla is a multinational clean energy automotive company that manufactures electric vehicles in large volumes. The company is among the biggest automotive car manufacturers, valued at USD 75.9 billion. One of the most famous brands of Tesla is the Tesla Model 3, one of the world's best-selling cars. The other EV company identified in stage 1 is SAIC. SAIC was formerly called Shanghai Automotive Industry Corporation. The state of China Republic owns the company, which commands a significant portion of the global electric car market. In 2021, SAIC made sales amounting to USD 115.6 billion; in 2022, the company sold 5.32 cars. The company is in the 60th position in the rankings of Fortune 100. The other company identified in stage 1 as a worthy competitor in the global electric car market is BYD, an acronym for Build Your Dream. BYD is a Chinese multinational which is owned by the state. BYD had a revenue of USD 30.68 in 2021.
Buy this excellently written paper or order a fresh one from ace-myhomework.com
Advertisement
In this stage of the assignment, the financial ratios of the companies will be used to compare their financial performance. Also, the stage will make growth projections of each company to determine if they will be good for investment. The financial ratios and growth projections will show one company among the three competitors that will be the industry leader in future. The stage will also analyze the capital structure of the three companies and project the company's future stock.
Ratio Analysis
Profit Margin
Profitability is an important measure of a business's financial performance. Profit margin is one of the measures that show the extent to which the revenues of a business exceed the costs incurred in earning the revenues. The profit margin for Tesla increased from -4.5% in 2018 to 15.44% in 2022 (Yahoo Finance, 2023). The increase is attributable to the increase in sales that the company made, particularly the sale of electric cars. SAIC had a profit margin of 4.0% in 2018, which remained unpredictable, with the company experiencing a profit margin of 2.9%. In 2020, the profit margin of SAIC increased slightly to 3.5%, and in 2021 it reduced to 2.9% (Yahoo Finance, 2023). In 2022, the profit margin of the company increased to 3.7%. Incidentally, the profit margin of BYD remained consistently high, with one sharp slump in 2021. In 2022, however, the company's profit margin increased to 18.96%, which is the highest profit margin for the period under review.
As the comparative bar chart below shows, the trend of the profit margin of Tesla has increased consistently from the -4.5478% to the highest value of 15.44% in 2022. Thus, if the company maintains the trend, it will continue to be the leader in the electric vehicle industry. The trend of SAIC shows that the company has an unstable profit margin which necessitates that it creates mechanisms for stabilizing its net profit. BYD has the highest profit margin, indicating that the company is stable in terms of revenues and hence net profits. The following table summarises the companies' profit margins, and the following graph shows the comparative bar graphs of the companies net profits.
Return on Equity
The return on equity measures the extent to which the companies use the equity to generate profits. The return on equity for Tesla increased consistently from -18.46% in 2018 to 27.67% in 2022 (Yahoo Finance, 2023). The increase in the return on equity indicates that the company’s efficiency in utilizing shareholders’ equity to generate income for shareholders increased. On the other hand, the return on equity for SAIC remained unpredictable throughout the period under review. For instance, the company's ROE was 54.74% in 2018, decreasing tremendously to 9.13% in 2019. In 2020, the ROE of the company increased slightly to 16.04%, and it decreased to 13.59% in 2021. In 2022, the ROE of SAIC increased again slightly to 17.12%. The ROE of BYD remained generally low, with the company recording a return on equity of 5% in 2018, which decreased to 2.88% in 2019 (Yahoo Finance, 2023). In 2020, the company’s ROE increased to 7.43%, and it reduced to 3.73% in 2021. In 2022, BYD had a return on equity of 15. The information is summarized in figure 3 and figure 4, shown below.
As shown in the comparative line graph, Tesla's return on equity will likely increase going into the future. On the other hand, the trend of the ROE of BYD indicates that the company still needs to stabilize its return on equity. Incidentally, the trend of SAIC shows that the company has maintained a low ROE but which is steady. Therefore, on ROE, Tesla is better than its two electric car industry competitors.
Revenues
Revenues play important for a company. Stable and competitive companies have high revenues, implying that they make high sales of their products. On the other hand, companies with unstable revenues indicate that they need to command more market share to make enough sales to sustain their operations. From figure 5, shown below, BYD had the highest revenues throughout the period under review. The company’s revenues increased from USD 95.6 billion in 2018 to USD 408.219 billion in 2022. Tesla was the second after BYD. Tesla’s revenues increased steadily from USD 21.461 in 2018 to USD 81.62 in 2022 (Yahoo Finance, 2023). Both BYD and Tesla commanded the market for the electric vehicle throughout the period under review. SAIC had the lowest market share, with USD 4.454 billion in 2018, which increased slightly throughout the period under review to USD 7.394 billion in 2022.
The electric vehicle industry witnessed tremendous increases in revenues from 2018 through 2022. In 2018, the electric vehicle industry generated revenues of USD 890 billion. In 2019, the revenues increased to USD 950 billion (Irle, 2022). The revenues generated by the industry increased consistently and hit USD 3000 billion in 2022. From the revenue data in figure 5 below, BYD enjoys the highest market share in the electric vehicle industry, followed by
Tesla. SAIC has the lowest market share in terms of sales revenue. The figures below summarize the revenue data.
Debt-To-Equity Ratio
The debt–to–equity ratio shows the extent to which companies are geared. Companies funded by equity capital are at a lower burden than companies that rely on debt for funding. A low debt-to-equity ratio indicates a company is less geared, which is a good signal for companies. On the other hand, a high debt-to-equity ratio shows that a company is highly geared, which points to a dangerous financing situation. As figure 7 shows, all serious competitors in the electric motor industry have a decreasing trend in the debt-to-equity ratio. The foregoing implies that the companies’ financing has shifted from debt to equity financing throughout the period under consideration. The industry debt-to-equity ratio also shows a decreasing trend. BYD's debt-to-equity ratio is below the industry trend. The company's financing criteria were majorly inclined towards equity financing.
On the other hand, SAIC's debt-to-equity ratio shows that the company is financed more by debt than by equity. Tesla was highly geared in 2018, but the company's debt-to-equity ratio reduced sharply to BYD from 2020 onwards. The following table and comparative lie graph summarize the debt-to-equity information of the companies and the industry.
The current ratio is a liquidity measure that assesses how much a company can repay its debts. From figure 9, shown below, Tesla had the highest current ratio, implying that the company could easily pay its debts. Tesla's current ratio was above the industry average. BYD and SAIC had the lowest current, as shown in figure 10 below. The companies' current ratios were below the industry trend. The figures below show the company's current ratios.
Growth Projections
The electric vehicle industry is composed of many electric motor companies. The top three competitors selected are Tesla, BYD, and SEIC. Judging by the revenues each company received between 2018 and 2022, BYD has the highest average growth compared to the rest of the companies in the industry. Averagely, the revenue of BYD grew at a rate of 45.77% between 2018 and 2022. The high average growth is attributable to the company's dealing in EVs and
PHEVs. In 2020, BYD sold three times as many EV and PHEV cars compared to the sales the company made in 2021 (Irle, 2022). The China-based company has a heavy presence worldwide regarding electric vehicle market command.
On the other hand, Tesla was the second in terms of revenue after BYD. Tesla’s average revenue growth between 2018 and 2022 was 41.21. The company’s revenue growth is lower than the revenue growth of BYD because Tesla does not manufacture PHEV cars. In general, Tesla has a market share of 17%. Tesla’s sales growth over the five years under review is attributable to its strong brands, including VW ID 4, the Skoda, and Audi Q4 (Irle, 2022) Tesla has also gained a reputation for consistently manufacturing high-quality EV cars.
SAIC is at a distant end, with a revenue growth of 14.23%. SAIC manufactures EVs on a large scale and PHEVs on a small scale. The company had a positive market deviation of 8% in 2022, implying it is a worthy contender in the electric vehicle industry. Going forward, SAIC will capitalize on the available market for electric cars and increase its production capacity to compete favourably with the two giants, namely BYD and Tesla. Figure 11 below summarises the revenue growth of the three companies.
Figure 11: Average revenue growth rate
In terms of asset growth, BYD has very high prospects for asset growth in the future. BYD had an average asset growth rate of 50.80. the company's asset base increased consistently from less than USD 200 billion in 2018 to USD 600 billion in 2022. The tremendous increase in assets indicates that the company is on the verge of growth,d it will hit high levels in the future. On the other hand, SAIC witnessed an average asset growth rate of 36.31%, the second in the industry. Tesla came third with an average asset growth rate of 29.75%. The table below summarizes the asset growth rate of the three major competitors in the industry.
Projected Industry Leader
Following the projections and estimations above, all the findings indicate that BYD will be the industry leader in the future. The company's average revenue growth rate was the highest- 45.77%, and its asset growth rate was the highest- 50.80. BYD's market strategy is also strong because it manufactures EV and PHEV vehicles. The two types of vehicles will widen the market for BYD, making the commander in the electric vehicle industry. Additionally, the company is run by the state. As indicated above, the company has a low debt-to-equity ratio implying that the company has sufficient capital to undertake needle-shaped innovation. BYD has over 30 industrial parks worldwide, with the biggest in China, the USA, Europe, and India (BYD Group, n.d).
Financial Measures of BYD Value of Common Stock
According to Yahoo Finance (2023), the stock of BYD was trading at CNY 53.53. The general trend of the common stock's value indicates that the company's stock has increased consistently over the last five years. The consistent increase in value shows that investors have confidence in investing in the company's stocks. Additionally, the increase, as shown in figure 13 below, indicates that the value of BYD's stock has an increasing trend.
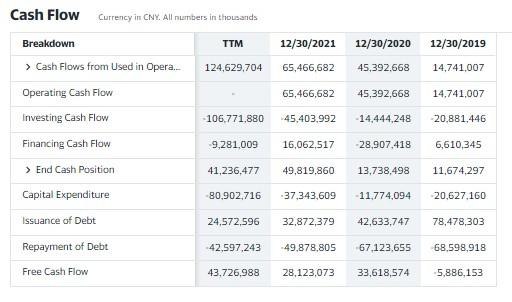
Cash Flows
BYD Electronics has very strong finance cash flows. In 2019, the company had a total operating cash flow of CNY 14.741 billion. The operating cash flow increased exponentially to USD 65.466 billion in 2021. The investing cash flow also increased from CNY 20.881 billion in 2019 to CNY 45.403 billion in 2021. Incidentally, the company’s financing cash flow increased from CNY 6.610 billion in 2019 to CNY 16.062 billion in 2021. After deducting expenses such as capital expenditures and repayment of debts, the company's free cash flow increased from CNY 5.886 billion in 2019 to CNY 28.12 billion in 2021. The strongly positive free cash flows indicate that BYD’s operations are highly profitable. Figure 14 shows the cash flow statement of BYD.
Future Stock Price of BYD
Both debt and equity finance BYD. According to Yahoo Finance (2023), the market capitalization of BYD is CNY 6305.723 million. Also, the market-free rate of the company is equivalent to the 10-year treasury constant, equivalent to 3.372. At the market premium of 6%, the company's equity cost is 3.672%. Following the trend of revenues computed above, which was increasing and the low debt-to-equity capital, the company's share price is expected to increase. The 3.672% investors require from the company as the cost of investing in the company is affordable, and the company may float more shares to make more money for its operations, hence leading to more profits, which may lead to higher dividends, and finally leading to high demand for the company’s shares.
Reflection
The assignment has taught me fundamental concepts in stock valuation. I have learnt how to conduct a comprehensive ratio analysis of competing companies in a given industry. Also, I learnt how to conduct horizontal analysis to judge whether a company is above or below the industry trend. Incidentally, I learnt to project future growth rates, which are crucial in deciding whether a company is good or bad for investment. Incidentally, the assignment taught me to compute CAPM and how to predict whether the stock price will increase or decrease in future.