8 minute read
PLS-SEM Approach to Establishing Causal Relationships

The data to be used in this study was collected metrically, and respondents were required to respond to questions by assigning them a figure on a scale of 1-5. The study utilized The Partial Least Square Structural Equation Modelling to analyze the data. PLS-SEM is a statistical method used to derive complex cause-effect relationships that lead to informed decisions by managers. The PLS-SEM has latent variables and construct variables. For this study, the construct variables were the perceived presence of the video ad (PP), the perceived novelty of the video ad (PN), attitude towards the video ad (ATV), attitude towards the brand (ATB), and sharing the intention of the video ad (SI).
On the other hand, the latent variables under the perceived presence of the video ad were the perception of respondents about the naturality of the video, the attribute of immersiveness, and the sense of being present in the video. Under the construct of perceived novelty, the latent variables were perceptions of the creativity of the video, the originality of the video, and the aspect of memorability. Under the construct of attitude towards the video, the latent variables are the extent to which respondents liked the video, the extent to which the video was interesting, and the extent to which the respondents were positive about the video ad.
Advertisement
Buy this excellently written paper or order a fresh one from ace-myhomework.com
Under the construct of attitude towards the brand, the latent variables were the extent to which the respondents liked the brand, the extent to which respondents felt the brand was cool, and the extent to which respondents were positive about the brand. Incidentally, under the construct of sharing intentions about the brand, the latent variables were the extent to which the respondents thought they would like the video ad, the extent to which they thought they would comment on the video, and the extent to which they thought they would share the video ad with other people.
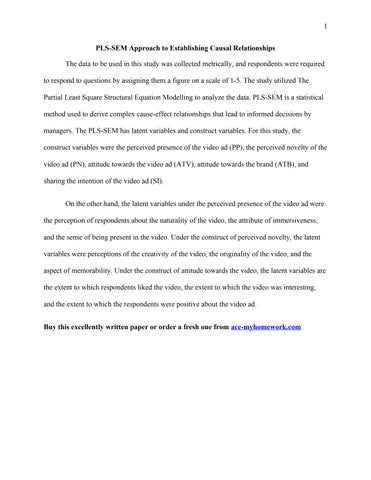
Path models visualize the relationship between construct variables and latent variables. The relationships between the construct variables and the latent variables are important because they indicate the extent to which the latent variables explain the construct variables. In other words, the relationship shows whether the latent variables reasonably cause the construct variables. The graphical representation of the relationships between the construct variables and the latent variables is shown below.
The PLS above displays two crucial elements: the structural and the measurement models. The structural model links the PP, ATV, ATB, PN, and SI. The structural model, also called the inner model, links the constructs to each other. On the other hand, the measurement model, also called the outer model, shows the relationship between the constructs and the indicator variables, as shown in figure 1 above.
Conceptually, respondents were expected to like the video, then the brand and finally share the brand with others. Thus, the conceptual framework begins with respondents perceiving their presence in the brand through its natural aspect, immersive aspect, and sense of being present in the video. Their attitude towards the video will be positive, leading to a positive attitude towards the brand. After liking the brand, the respondents will share the video ad with their friends who they feel would wish to be associated with it too.
Reliability and Validity of the Model
Reliability measures whether the results can be produced under similar conditions. Validity is the accuracy of the measure that is used in the model. The first step is to assess the indicator reliability, which is the level to which each indicator in the model is explained by its construct. At the beginning of the analysis, all indicators that correlated less than 0.7 were removed to ensure the model was reliable and valid. As shown in figure 2 below, the video ad's perceived presence correlates 0.949 with the immersive perception and 0.731 with the perspective of being present. The perception of the natural video ad correlated less than 0.7, and it was eliminated from the model to enhance reliability.
On the other hand, the correlation between the perceived novelty and the video being perceived to be creative is 1, which is perfect. The perceptions of originality and the video being memorable were eliminated to enhance the reliability of the model. The attitude towards the video had an indicator loading of 0.852 with the perception of liking the video, 0.763 with the perception of the video being interesting, and 0.847 with the perception of being positive about the video.
The indicator loading of the attitude towards the brand with liking the brand was 0.857, the indicator loading of attitude towards the brand with the brand being cool was 0.880, and that of attitude towards the brand with being positive about the brand was 0.914. Incidentally, the indicator loading between sharing the video ad with liking the video was 1, which is perfect loading. The indicator loading between sharing the video and commenting on the video and sharing intention was less than 0.7, leading to their elimination from the model.
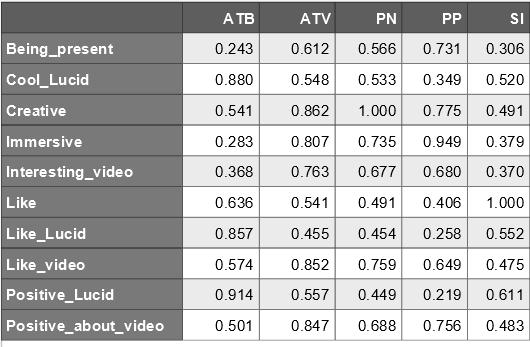
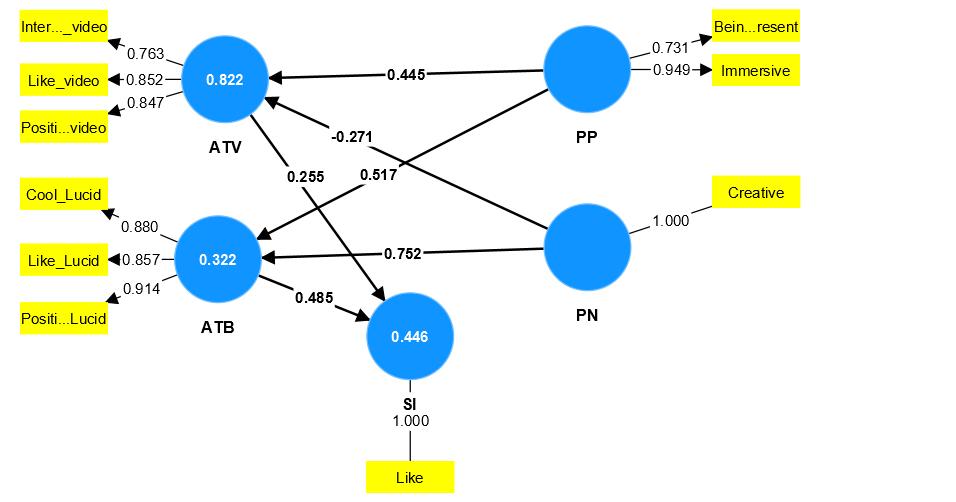
Figure 2: Discriminant Validity
The composite reliability measure and Cronbach’s Alpha assessed the internal consistency reliability. The Cronbach’s Alpha for all the constructs in the model is greater than 0.7, implying that the model is reliable. On the other hand, the composite reliability for all the constructs is also greater than 0.7, implying that the model is reliable. The table generated from the SmartPLS software is shown in figure 3 below.
Figure 3: Construct Reliability
The average variance extracted is the mean value of squared loadings of the indicators. It is used to show the extent to which the constructs converge to explain the variance of the indicators they explain. The minimum value for convergent validity acceptable for a model to be valid and reliable is 0.5. In the mode, the average variance extracted is 0.781 for ATB, 0.675 for ATV, and 0.717 for PP. Therefore, the model is reliable.
Incidentally, for the model to be reliable, it must adhere to the Discriminant validity requirement. Discriminant validity assesses the extent to which a construct is empirically distinct from other constructs in the structural model. The Discriminant validity is measured using the heterotrait-monotrait ratio. Figure 4 below shows the heterotrait-monotrait ratio results of the model.
Latif et al. (2020) recommend that the heterotrait-monotrait ratio be used to assess the Discriminant validity of a model. Further, the researchers posit that an HTMT value greater than 0.9 suggests that Discriminant validity is absent in a model. However, an HTMT value of 0.85 is acceptable when the constructs are distinct. From figure 4 above, HTMT of PN and ATV satisfies the condition. Also, the HTMT ratio between PP and ATV satisfies the condition. The HTMT ratios, therefore, certify that the model is reliable and valid.
Structural Model
The structural model assesses hypothesized relationships to show the kind of relationships that exist between the constructs. In the model, the hypotheses are 1. PP ATV
2. PP ATB 3. PN ATB 4. PN ATV 5. ATV SI 6. ATB SI. All the hypotheses can be tested using the correlation coefficients and the p-values in figure 5 and figure 6. For hypothesis 1, the correlation coefficient between PP and ATV is 0.845, as shown in figure 5, and the p-value for the hypothesis is 0.016, as shown in figure 6. Therefore, hypothesis 1 is accepted, and the study concludes that perceived presence has a causal effect on the attitude towards the brand's video ad. For hypothesis 2, perceived presence has a correlation of 0.311 with the attitude towards the brand. The p-value for the hypothesis is 0.068, greater than 0.05, which is the decision criteria for the study. Therefore, the study rejects hypothesis 2 and concludes that perceived presence has no causal effect on the attitude towards presence. For hypothesis 3, the correlation between perceived novelty and attitude towards the brand is 0.541, and the p-value of the hypothesis is 0.024. Therefore, since the correlation is greater than 0.5 and the p-value is less than 0.05, the study accepts the hypothesis and concludes that there is a causal relationship between the perceived novelty of the brand and the attitude towards the brand.
For hypothesis 4, the correlation between the perceived novelty and attitude towards the video is 0.862 and the p-value is 0.018. Since the correlation is greater than 0.5 and the p-value is less than 0.05, the study accepts the hypothesis. It concludes that perceived novelty has a causal effect on the attitude towards the video. For hypothesis 5, the correlation between the attitude towards video and sharing intention correlates 0.541, and the p-value of the hypothesis is 0.03. Thus, the study concludes a causal relationship between attitude towards video and the sharing intention of the respondents. Incidentally, for hypothesis 6, the correlation between attitude towards the brand and the sharing intention of the respondents is 0.636, and the p-value of the hypothesis is 0.049. Since the correlation is greater than 0.5 and the p-value is less than 0.05, the study accepts the hypothesis. It concludes that there is a causal relationship between the attitude towards the brand and the sharing intention of the respondents involved in the study.
Measurement Model
The measurement model was used to quantify the relationship between the constructs and the indicators. The results are shown in figure 2 above. The indicator loadings in the figure are over 0.7, implying a strong relationship between the constructs and the indicators the constructs are explaining. The indicators that had indicator loading of less than 0.7 were eliminated from the mode, hence making the model reliable and valid.
Discussion of the Results
The study explored the relationship between the perceptions customers have about the advertisement of a brand and their likelihood to share the advertisement with other people on YouTube. The constructs in the study were perceived presence, attitude towards the video ad, attitude towards the brand, perceived novelty, and sharing intention. The results from the study indicate that there is a strong relationship between perceived presence and sharing intention. The findings agree with the findings of Dinana & El-tazy (2016), who found a strong association between the perceived presence and novelty of advertisement videos, the attitude towards the videos and the intention of sharing with others. Therefore, if companies recognize the importance of video ads on YouTube on the customers' intention to share the videos, making the brand popular, they would ensure that their videos are produced in a manner that they are natural, immersive, and involves the viewers. In that case, customers can like the videos, implying their likelihood to subscribe to the brands.
The study also found a causal relationship between attitude towards the video and the sharing intention of respondents. The correlation coefficient was 0.581. The finding proves the positive relationship between the perceived presence and the attitude towards the video advert.
When viewers feel the video is natural and engages them, they will develop a positive attitude towards it. As a result, they will develop the urge to share the video with other people within their circle. Hermann (2020) conducted a study on the impact of attitudes towards YouTube adverts and the intention of customers to like the brand. He realized a positive correlation exists between video novelty and the attitude customers develop towards the brand. Therefore, this study is consistent with the study of Hermann (2020). From the findings, companies wishing to make their brands known and liked by customers worldwide can ensure their YouTube ads are involving and of high creativity to attract many people.
However, the study indicated no relationship between the perceived novelty of YouTube adverts and the customers' intention to share the videos with people in their circle. The finding is striking in that most marketing executives think that when the ad is memorable and original, customers will be positive about it. The lack of a causal relationship between video ad novelty and sharing intention indicates that marketers will now shift from novelty to making the video involving and interesting for viewers.
Conclusion
The study used PLS-SEM to determine the relationship between perception of presence, attitude towards video ads, attitude towards a brand, perception of novelty, and sharing intention. The study found a relationship between all the constructs apart from the perception of presence and attitude towards the brand and perception of novelty and intention of sharing. The study recommends that companies seeking to extend their client base and increase brand popularity should ensure their YouTube advertisement ads are involving and interesting to viewers because