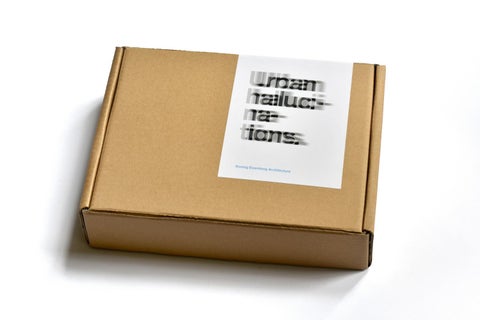
Urban Hallucinations / Part One
Homes for all.
Koning Eizenberg Architecture
1
Los Angeles metropolitan region.
Housing affordability.
The Greater Los Angeles Area is the second largest urban region in the US. Its population is spread across five counties and 4,850 square miles.
One measure of affordability is an area’s Median Multiple: median house price divided by median household income (gross). The Greater Los Angeles Area has the 9th highest median multiple in the world.
8x
4x
Median multiple
6x
City of Los Angeles
2,811,801
3,971,883
Los Angeles County
7,032,075
10,170,292
SCAG Region
10,062,637
18,859,954
Source: US Census Bureau, 2015.
Denver
93,220
Seattle
2015
88,289
Boston
1970
City of Santa Monica
New York
Population
Los Angeles
2x
0
Source: Demographia International Housing Affordability Survey, Q3 2015.
Homelessness.
Income inequality.
2016 marked a 5.7% increase in homelessness in Los Angeles County. 74% of individuals experiencing homelessness are unsheltered, and 72% have been living in LA County for more than 20 years.
In 2015, the Los Angeles City Council voted to raise the City’s minimum wage from $9 an hour to $10.50, with an annual increase until reaching $15 in 2020. Using 2014 average home prices, not a single place in the City of Los Angeles is affordable on the projected minimum wage for a person paying one third of their income toward housing costs.
34,527 individuals unsheltered
46,874 total homeless individuals
Cheaper to own Cheaper to rent Difficult to afford No data
Source: Los Angeles Homeless Services Authority, 2016.
Source: Los Angeles Times: Rent or Buy Los Angeles interactive graphic, 2014.
3
From A to B. FEASIBILITY CONCEPT
CONCEPT DESIGN
Land purchase
A “Float Up” is a preliminary review and comment session to obtain a general “We like this project enough” to permit it to move forward in the approval process and initiate the preparation of an environmental impact report.
Architectural Review Board (A.R.B.) “Float Up”
LIKE
Development Agreement (D.A.) application
LIKE
City Council “Float Up”
Planning Commission “Float Up”
DON’T LIKE
DON’T LIKE
LIKE
DON’T LIKE
Revise design till LIKE
DON’T LIKE
Community meeting
Revise design till LIKE
REVISE DESIGN TILL LIKE?
Revise design till LIKE
ALONG THE WAY, meet with community folks, city planners, members of boards, commissions, and City Council to gather in
4
DON’T LIKE
PLANNING COMMISSION HEARING: Certify E.I.R, Recommend CC Approve
Draft circulated for public comment
Responses to comments
City Council hearing for D.A. approval
LIKE /APPROVE
LIKE/ APPROVE
Environmental impact Aesthetics Sunlight and shadow Air quality Construction effects Cultural resources Grenhouse gas emissions Geology Hazardous materials Land use Neighborhood effects Noise Population and housing Public services Transportation and circulation Utilities
Revise design till LIKE
Revise design till LIKE
Final
Expected timeline 3.5 years 1.5 years 1.5–2 years
Final A.R.B.
DON’T LIKE
LIKE
Environmental Impact Report prepared
process for a 60’+ high, 100+ unit, mixed-use housing development in Santa Monica. In brief, an entitlement and construction process will stretch over five years and at least seven public hearings. Other cities, like Los Angeles, are less demanding, but public participation (beneficial) and extended approval timelines (less so) are the norm.
DON’T LIKE
It’s not easy to build in Los Angeles. Issues of displacement and gentrification must be weighed against sustainable benefits, like transit linked density and alleviating the housing shortage. Though imperfect, the mechanics of developing housing are more rigorous and participatory than many claim. Below is a flowchart of the 2016 anticipated approval
Revise design till LIKE
LIKE / APPROVE
BUILDING PERMIT: Shoring, Grading, Building, Electrical, Mechanical, Plumbing, Public Works, Elevator, Etc.
BUILD IT
er information and keep all informed about the project as it develops and moves through the approval process.
5
SOBIESKI HOUSE South Pasadena, California, 2012
Informality and spontaneity is an ongoing interest of ours, and was the catalyzing idea behind this home for the Sobieski family, who see daily life as opportunity for improvisation and invention. The design takes advantage of Pasadena’s mild, dry weather and the site’s 16’ high hedge to open inside to outside in ways that do not rely on the local standby of expansive glass, rooted in mid-century modern design. The 3,300 sf plan groups six large, white, studio-like rooms that support open-ended uses. Each is served by low-ceilinged, wood-clad bars enclosing bathrooms and storage. As expected, use adapts for the weekend, or morphs to accommodate growing children and evolving interests. Primary circulation is outside, extending to an existing studio and the pool house. Thanks to climate and passive earth tube cooling, doors are left open, blurring the functional distinction between inside and out. The experiential differentiation is quite the opposite, intensifying the distinctive character of each.
20
White rooms shaped by origami-like folds are backdrops for interchangeable activities, from sleeping to working to entertaining.
This 25,000 sf flag lot’s gate is the formal entry of the hedge-enclosed site. Beyond, circulation is non-deterministic, weaving in and out.
Activities are not confined by indoor and outdoor, and change over time. The Sobieskis relayed that table tennis was a great icebreaker, lasting as a feature in the “living room� for many months.
21
Urban Hallucinations / Part Two
Signs of life.
Koning Eizenberg Architecture
2
Seismic resilience.
Housing production.
After passing a new mandatory retrofitting law, the City of Los Angeles compiled a list of earthquake-vulnerable, wood-frame apartment buildings. Most of these at risk structures were built in the 1950s-‘70s and have a “soft story” of ground level parking with units above.
Los Angeles Mayor Eric Garcetti has called for 100,000 new homes by 2021, but a 2006 study claiming a 300,000 home shortfall in post1990 LA indicates this may not be nearly enough. Permit numbers below look impressive on first review, but 22.5% of permitted units remain unbuilt every year.
27,500 25,000 22,500
Multifamily Units Permitted
20,000 17,500 15,000 12,500 10,000
buildings at risk 7,500 5,000 2,500
Sources: Los Angeles Department of Building and Safety, LA County Assessor, 2016
Source: U.S. Census Bureau, Building Permits Survey
2015
2014
2013
2012
2011
2010
2009
2008
2007
2006
2005
2004
0
Likely unbuilt
Transit propels gentrification.
Diversity.
Key findings from UCLA indicate that gentrification in Los Angeles County is largely happening around transit, especially in Downtown areas “where transit oriented development interacts with other interventions aiming to revitalize the urban form” – infill upscaling.
People from over 180 different countries speaking 140 languages live in the City of Los Angeles. LA has no ethnic majority, though the Hispanic/Latino population is approaching majority status. Nonetheless, non-white residents are often poorly represented and have less access to services.
Chinatown
Hollywood
Downtown
Black or African American 9.1%
American Indian and Alaska Native 1.5% Asian 15%
White, not Hispanic or Latino 26.6%
103rd Street
Gentrified both decades Gentrified 1990 –2000 only Gentrified 2000 –2013 only Eligible, did not gentrify Source: Ong, P & Pech, C., Urban Displacement Project; UCLA Center for Neighborhood Knowledge, 2015.
Native Hawaiian and Other Pacific Islander 0.4%
Hispanic or Latino 48.4%
Source: US Census Bureau, American Communities Survey, 2015.
3
9
SEE-THROUGH HOUSE Santa Monica, California, 2014
Of the things you don’t see, city zoning codes are perhaps the most form-driving and frustrating for architects. We’ve learned that “Yes, and...” is a more pragmatic starting place than “No, but –” to negotiate the code. This house, designed for a Planning Commissioner and her family, emerged from opportunistically embracing the regulations. The owner and principal Hank Koning had served together on the Planning Commission and got to know each other guiding the development of Santa Monica’s Land Use and Circulation Element. When Hank first traced the outline of the minimum setbacks and maximum height restrictions for the house, we were all surprised to see the profile of a barn. It turned out to be a remarkable fit for the family’s rural roots and interests in the informal, modest, and communal. The barn now sits comfortably among its Tudor, Cape Cod, Spanish, and Modern neighbors.
30
Suburban subdivisions face forward, but don’t acknowledge the street. See-Through House takes on the street with social space back and front, using sliding screen doors to create modifiable privacy. Left: Street face. Right: Backyard.
The North of Montana Neighborhood consists of mostly 50’ x 150’ single family lots divided by alleys. Houses are close together, and the biggest views are front and back.
The kitchen, the focus of activities in the house, anchors the first floor.
31
Urban Hallucinations / Part Three
Faith in community.
Koning Eizenberg Architecture
3
Fifteen years ago I woke up in a big house in a strange city against the recommendations of nearly all of my friends, family members, colleagues, co-workers, and casual acquaintances, one of whom told me something to the effect of, if you move there, you’ll have to spend all your time in your car, but don’t worry, there’s nothing to see. But I never found the “Hell A” that everyone warned me about. To me, it was magical that I might buy my groceries at a farmers market in the middle of January, drink at the bars I’d watched in Swingers (often next to the people who starred in Swingers), and climb an actual mountain in my neighborhood where I could take in the entire city at once. In those first few months, I went up there a lot, trying to piece together the vast metropolis by tracing the streets I’d seen on my Thomas Guide, standing behind the most famous sign on Earth which captioned the view of my new home with a very appropriate: “OH.” I think I might have actually been right there, pondering the endless grid, when I realized I could probably walk to the farmers market instead of circling in a parking garage. Then I noticed those bars were really only a short stroll away, too, and — this was the best part — I could easily stumble into new ones I discovered along the way. I learned that the world’s most comprehensive transportation system was being reknit below my feet, and, when I wasn’t speeding past them in a vehicle, I saw that those were bike lanes painted on the fringes of nearby roads. I found secret staircases carved into those mountains, and met other people on them who were just like me – discovering their own new Los Angeleses. The biggest change that LA has seen in the last 1.5 decades has not been sparked by a giant development, but because Angelenos are using their city in a different way. There are parklets that shift parking spaces into shady seating. CicLAvia, which turns wide streets into playgrounds
2
for pedestrians. The other day I was riding the City’s new bike share through downtown and found myself disoriented – the street had become nearly unrecognizable. Nothing had changed, except for a few swipes of paint. It was because there were suddenly so many more people enjoying it. This city still manages to surprise and delight me every single day, just like it did in my first wide-eyed moments. And after watching it transform around me, there’s one thing I can say with confidence: The Los Angeles we live in is not static, and simply by choosing the way we move through it, we can be a part of that change. And in a way, I should thank that guy who warned me about moving here, because he was right – it was really only by getting out of that car that I found the things worth seeing. ALISSA WALKER Urbanism writer and pedestrian advocate
Traffic is still an issue.
Green space shortage.
US drivers spent more than eight billion hours stuck in traffic in 2015. Angelinos led the pack with an average of 81 hours.
The City of Los Angeles has one of the lowest percentages of green space of any major US city. Non-white and low income communities are disproportionately impacted, contributing to negative mental and physical health outcomes.
Acres of park space in Los Angeles for every 1,000 people.
81 75
75
74
73 66
64 59
Hours Per Year Spent in Traffic
60
49 Predominantly white neighborhoods: 31.8
Honolulu
Atlanta
Chicago
Boston
Seattle
New York
Houston
San Francisco
Washington
Los Angeles
Predominantly African American neighborhoods: 1.7
Predominantly Latino neighborhoods: 0.6
Source: Wolch, J., Wilson, J.P., & Fehrenbach, J. Urban Geography, Park and parks funding in Los Angeles: An equality mapping analysis, 2005.
Source: Inrix Traffic Scorecard, 2015.
More access, more ridership.
An increasingly serious drought and growing environmental awareness have propelled sustainable standards across Southern California. In 2015, the City of Los Angeles released the Sustainable City pLAn, which set aggressive goals for reducing water consumption; increasing available storage for clean, solar energy; and reducing greenhouse gas emissions.
Weekday commuter ridership on the Expo Line, running from Downtown LA to the beach, surged when the final leg to Santa Monica was completed in May 2016. 45,876
Resources: water and power.
39,237
Water use (gallons per capita)
30,163
30,315
30,830
30,371
30,510
30,785
30,386
29,047
9/15
10/15
11/15
12/15
1/16
2/16
3/16
4/16
goal (22.5% reduction)
30,221
2025
8/15
2016 progress (20% reduction)
30,685
2014 baseline
7/15
102
30,507
104.8
6/15
131
Greenhouse gas emissions (in MMtCO2e)
43.3
1990
2016
2025
baseline
progress: 20% reduction
goal: 45% reduction
Source: Los Angeles Mayor’s Office, “Sustainable City pLAn: First Annual Report,” 2015-2016.
6/16
29.8 5/16
54.1
Source: Los Angeles County Metropolitan Transportation Authority Interactive Estimated Ridership Stats, 2016.
3
TEMPLE ISRAEL OF HOLLYWOOD Los Angeles, California, 2016
Designing religious buildings calls for a more conscious investigation of how architecture communicates. In Jewish practice there is no prescription for building style, but cherished imagery is commonly found – including the Star of David, the Tallit (prayer shawl), and the Western Wall in Jerusalem. In the renovation and addition for this Reform Jewish congregation, traditional motifs appear in unconventional ways, encouraging multiple readings. An idea may start as a reference to a prayer shawl, but, as we heard from congregants, can also be read as the flood waters lifting Noah’s ark. Open-ended engagement suits the culture of enquiry, encouraging participation and differing points of view. Narrative shapes informal and light-filled spaces that emerge from reinstating the Temple’s heritage and strengthening connections. Fifty years of layered improvements are peeled away to give the historic sanctuary and ancillary wing breathing room, allowing for a more generous courtyard. The reconfigured ancillary wing offers views all around, integrating and connecting the elementary school, sanctuary, courtyard, social hall, and new chapel. The formal sanctuary continues to anchor High Holy Day worship, while the new chapel is the focus of everyday activities and worship.
30
The historic sanctuary was built in 1949. Martin Luther King, Jr. spoke here, Elizabeth Taylor converted here, and Sammy Davis, Jr. married here. Over the last ten years, we have assisted the congregation to achieve its vision for the next generation.
New Chapel & Sunshade
Lobby/Library/Office/Gallery Historic Sanctuary
Expanded Courtyard
Renovated Social Hall
The work in this phase addressed evolving contemporary practice to offer missing flexible, interactive social and worship space. New 15,000 sf chapel and social/ educational spaces are infused with Jewish spirit and traditions.
The Tallit, worn by both men and women in this congregation, generated the design of chapel ceiling and sunshade. Below, a sedimentary wall contains small rocks from sacred and everyday places in Israel collected by congregants. It recalls the tradition of the Western Wall (left), where small messages are inserted between stones. The ark (containing the Torah scrolls) sits within. The design of its doors draws on Moorish-influenced Sephardic tradition (right).
31