Unknown author, ‘The Bellman’s Chart’, from The Hunting of the Snark: An Agony in Eight Fits, by Lewis Carroll, 1891 edition. Ink on paper, 190 × 130 mm
Lewis Carroll’s 1876 nonsense poem, The Hunting of the Snark (An Agony of Eight Fits), tells the story of the Bellman and his crew as they search the high seas for their elusive quarry. To navigate the waters, the shipmates rely on the Bellman’s Chart. No ordinary nautical map marked with depths and currents, submerged hazards and places for safe harbour, this seems to be nothing more than an empty black frame drawn on the page; the blank space it delineates is the ocean. The crew are surprisingly elated to be guided by such an object, a navigational chart ‘they could all understand’: ‘Other maps are such shapes, with their islands and capes! But we’ve got our brave Captain to thank’ (So the crew would protest) ‘that he’s bought us the best – A perfect and absolute blank!’ Take another look at the Bellman’s Chart. Is it in fact blank? Or awash with information? Printed around the frame of the ocean is an array of cartographic terms – an incomplete set of cardinal directions, coordinates, horizon lines, poles, a scale bar that refers to nothing. These annotations, which seem to have been arbitrarily placed either by the book’s illustrator, Henry Holiday, or by Carroll himself via a typesetter, still tell us many things: what we are looking at (an ‘Ocean-Chart’), how to read it, and the fact that the territory in question is not empty at all, but full of possibility. 01 There is a risk in beginning an essay about the architectural survey with a nonsensical ocean chart of a non-existent place. Does something so spartan, with its pair of black frames barely signalling it as a drawing, even register on the spectrum of surveys included here? Graphically, the Bellman’s Chart could scarcely be more distinct from the mapping in Eugène-Emmanuel Viollet-le-Duc’s Le massif du Mont Blanc, published the same year as Carroll’s poem. Comparing the two, we have one drawing that seems to show us nothing, and another that tries to reveal everything through highly detailed topographical views and analytical studies. Yet both find common ground – in their clear definitions of the site, in the annotations and symbols on the page and, not least, in their absurdity, one charting the seas by void, the other attempting quixotically to make visible every peak and col within the great massif. 02 What both the Bellman’s Chart and Viollet-le-Duc’s geographical study suggest is that while there are many ways to make a survey, the point of this type of drawing is to help us better understand not only what is evident, but also how we see it. Whether outlined on a sheet 10
11
of paper, roughly cast in a sketchbook or drawn in precise detail, surveys have long been used by architects to observe and comprehend the site, its conditions and its boundaries. Some are intended to inspect or to explore, to speculate or to scrutinise. Others are made for different motivations: out of novelty or boredom, for money or even as poetry. A survey might be contingent or idealised, abstract or symbolic, absolute or ephemeral. It might map no other site than the architect’s psyche: their references, their interests, or their desire to transform the existing conditions of their world. By its very nature, the survey tends to be incomplete, naïve, subjective, its name even a source of confusion among American colleagues, who mostly prefer ‘measured drawing’. And as much as it documents what already exists, the survey is also a site for the imagination. It is not a passive object or record, but an agent and instrument of power. It moves, circulating as a medium of exchange, and it argues, questioning our notion of the architectural site as a place of activity, a place for appropriation, and a place for the formation of identity. It is always, consequently, two things at once: a tool for recording the present and a mode for projecting into a past or future; a way of documenting what is right there in front of our eyes, and a provocation to conjure something new into being. Starting In this sense the Bellman’s Chart is not so different from the drawings made by the first-year architecture students at the Swiss Federal Institute of Technology (ETH) in Zurich, where I teach. As in many schools of architecture, students draw something – a room, a piece of furniture, the outline of their body – as a way of beginning to learn the subject. In the case of the ETH, each cohort over five years is tasked with preparing a portion of a 1:100 section that cuts across the city of Zurich, from its northeast to its southwest boundaries. 1 The on-site survey lasts barely a day, but months are spent preparing material and organising access to the interiors of buildings along the section’s path. Before undertaking this intensive project, students must also learn how to make a survey. For anyone new to the task, it helps to begin with something familiar; in the case of the first years, this means the HIL, home of the Department of Architecture. Set on a hill on the outskirts of the city, the HIL is a four-storey building from the mid-1970s, a groundscraper wrapped around a garden courtyard, with a forgettable bronze curtain wall. 12
13
Eugène-Emmanuel Viollet-le-Duc, Massif du Mont Blanc, map drawn at 1:40,000, 1876. Chromolithography by Georges Erhard, 1175 × 995 mm. Courtesy Département des cartes et plans, Bibliothèque Nationale, Paris
John Soane: The Construction Site Architectural education in Europe has for centuries privileged the tacit knowledge embodied in making a survey. From 1769, students at the newly founded Royal Academy (RA) Schools in London would make measured drawings of buildings as an integral part of their training, which was intended to complement their pupillage in an architect’s office. Each year would begin with a competition for the best measured drawing, which was awarded the RA’s Silver Medal. Accuracy was key: all drawings were checked by one or more of the Academicians – the prominent artists of the day. The subject of the competition was invariably a building located within ten miles of the institution’s base. In 1771 students were assigned the ‘Front next the Thames of the Royal Academy’ (their equivalent of the HIL). As a new student, just turned 18, John Soane (1753–1837) probably laboured with another student to measure the facade, first with rods and a tape before using string and lead strips to gauge the profile of the cornices and mouldings. They moved across the site, making outline drawings on folded sheets that were mounted onto a portable board. While these rough but meticulously annotated working drawings are by Soane, the final drawing is in the hand of Robert Baldwin, a draughtsman who had previously worked for George Dance the Younger, Soane’s mentor and a founding member of the Royal Academy. The submission deadline was 1 November 1771, one week after Soane’s enrolment. He missed it by a day. But he got his Silver Medal the following year, for a drawing of the Banqueting House at Whitehall. Here, too, Soane seems to have taken all the measurements before commissioning Baldwin to produce a presentation drawing. 28 Similar to the pyramidal scheme of the ateliers at the Beaux-Arts school in Paris, where final drawings were not the work of a single author but of a cohort of hands, this process suggests that the experience gained in making a survey was considered more important than the finished product. New knowledge can arise from leaving the places you know. After winning the Royal Academy’s Gold Medal in November 1776 with a project for a ‘Triumphal Bridge’, Soane was awarded a royal scholarship that provided for a three-year sojourn in Rome. 29 He would leave for Italy in March 1778 and return in June 1780. From Soane’s time abroad we have just over 100 surveys of buildings, mainly in Italy, as well as four sheets of drawings of eighteenth-century 34
35
previous spread Soane Office, site progress view, Dulwich Picture Gallery, made to accompany Royal Academy Lecture, 1812. Pencil and coloured washes, watercolour technique, shaded on laid paper, 235 × 165 mm © Sir John Soane’s Museum, London below, opposite, and overleaf John Soane with Thomas Hardwick, Temple of Minerva Medica, including a section of the Nymphaeum, partial plans and plan, c 1778. Pen, sepia washes, pencil, 617 × 455 mm; 562 × 438 mm; 725 × 534 mm © Sir John Soane’s Museum, London
bridges in Switzerland. Some are copies of other architects’ work rather than measured surveys made by Soane himself; the tell-tale signs include marks showing where he has pricked through the sheets to make transfers, and the use of non-English, region-specific drawing scales. Surviving sketchbooks contain on-site studies of buildings and archaeological remains at Tivoli, Pompeii and of course Rome, where Soane immediately set to ‘examining the numerous and estimable remains of Antiquity’ when he arrived at the beginning of May 1778. 30 Soon after, he joined forces with a fellow student at the Royal Academy, Thomas Hardwick, who was wealthy enough to fund his own Grand Tour. Through the month of June, the pair moved from one monument to the next, dividing the tasks of measuring and recording equally. An obsession with detail drives their surveys, but the focus is less on the exact intricacies of the orders or ornamental decoration, and more on the overall composition of a building, studied and expressed in plan to clearly record its spatial organisation. Sometimes their desire for exactitude led them down the path of danger. In surveying the so-called Temple of Minerva Medica (actually a ruined nymphaeum), they climbed up the crumbling brick dome to examine its clerestory windows, and leant out
36
pl. 23 Stephanie Macdonald, Concrete Beach, Tonnara di Scopello, 2013. Chinagraph pen on paper, 297 × 420 mm. Courtesy the architect
This drawing was made with a chinagraph pen over the course of a holiday afternoon. It started out roughly, as a quick sketch, but time stretched out as more people filled the page. I like using chinagraph as it can be sensitive to great softness and also very dark lines. I like its texture – it is a very direct medium and you cannot alter its mark once it is on the page, and so it forces you to look carefully and commit to the line you are making. The view is from a first-floor terrace that bridges over the old wooden entrance gates to the palazzina of the Tonnara di Scopello in Sicily, a medieval walled estate once supported by tuna fishing. The Tonnara sits on a picturesque lagoon, and today its pitted concrete causeway has become a public beach. At night it is home to visitors staying in the palazzina and in the old fishermen’s houses that line the slopes around the bay. When I made this drawing, 80-year-old Giovanni – bright eyed, leathery skinned, wiry and fit – was still living in one of them. He was always to be found sitting beneath the fig tree that can be seen in the middle distance of the drawing, having worked all his life in this place. I love the way that this former working space has become a multi-generational public realm. It is as busy as a town square where people, quite unguarded in their demeanour, chat and relax in groups and pairs; different characters emerge. A parapet ledge of old mismatched patterned cement tiles in the foreground is a typical Sicilian detail. Stephanie Macdonald
pl. 29 Pascal Coste, Palace of Darius, Persepolis, c 1840. Pen, ink watercolour and gold ink on laid Whatman paper, 315 × 508 mm
pl. 29 Pascal Coste, Palace of Darius, Persepolis, c 1840. Pen, ink watercolour and gold ink on laid Whatman paper, 315 × 508 mm
pl. 42 Pierre Adrien Paris, sketchbook of architectural detail, ornament and furnishings, 1770. Pen and ink, 370 × 250 mm
pl. 42 Pierre Adrien Paris, sketchbook of architectural detail, ornament and furnishings, 1770. Pen and ink, 370 × 250 mm
pl. 46 Jean-Augustin Renard, study of a Corinthian capital in white marble, 1777. Lithograph, 440 × 335 mm
pl. 46 Jean-Augustin Renard, study of a Corinthian capital in white marble, 1777. Lithograph, 440 × 335 mm
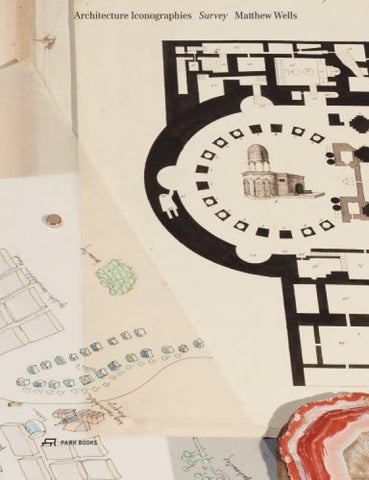
Architecture Iconographies – Survey by Matthew Wells is published by Drawing Matter and Park Books With thanks to Niall Hobhouse, Sarah Handelman, Pamela Johnston, Matthew Page, Craig Stevens, Susie Dowding, Lewis Ronald and Mathias Clottu; Neil Bingham, Tobias Erb, Adrian Forty, Emma Letizia Jones, Frank Salmon, Laurent Stalder, Victoria West, India Whiteley, Alessia Zambon. Thanks also to the architects who contributed texts and drawings to the plates section, especially Biba Dow, Tom Emerson, Stephanie Macdonald, Willem Jan Neutelings, Sheila O’Donnell, Thomas Padmanabhan, Eric Parry, Denise Scott Brown, David Valinsky, Lucas Wilson, and Peter Wilson.
Edited by Sarah Handelman Design and production by Studio Mathias Clottu Cover and section photography by Lewis Ronald Copyediting by Pamela Johnston Printed by DZA Druckerei zu Altenburg GmbH, Thuringia © 2021 Matthew Wells, Drawing Matter and Park Books AG, Zurich © for the texts: the authors © for the images: Drawing Matter (photography Craig Stevens), except where noted in captions (eg, ‘courtesy the architect’). Every effort has been made to trace the copyright holders and obtain permission to reproduce this material.
Drawing Matter Shatwell Lane Yarlington Wincanton BA9 8DL United Kingdom drawingmatter.org
Park Books Niederdorfstrasse 54 8001 Zurich Switzerland park-books.com
Park Books is supported by the Federal Office of Culture with a general subsidy for the years 2021–2024 All rights reserved; no part of this publication may be reproduced, stored in a retrieval system or transmitted in any form or by any means, electronic, mechanical, photocopying, recording, or otherwise, without the prior written consent of the publisher. ISBN 978-3-03860-250-7