2 minute read
Life-cycle Analysis of Biofuels


Alternative fuels will play a dominant role in the decarbonization of the marine and offshore sectors and are expected to yield the most benefits for reducing greenhouse gas (GHG) emissions. The current regulatory framework is focused on vessel emissions (tank-to-wake) rather than the overall life-cycle emissions of a given fuel (well-to-wake). However, it is recognized throughout the industry that the life-cycle carbon footprint of fuels provides the most complete description of their environmental impact.
This section presents comparative analyses of some of the alternative marine fuels and their life-cycle emissions, with the objective of offering a holistic view of the challenges associated with adopting low- and zero-carbon fuels.
BIOFUELS
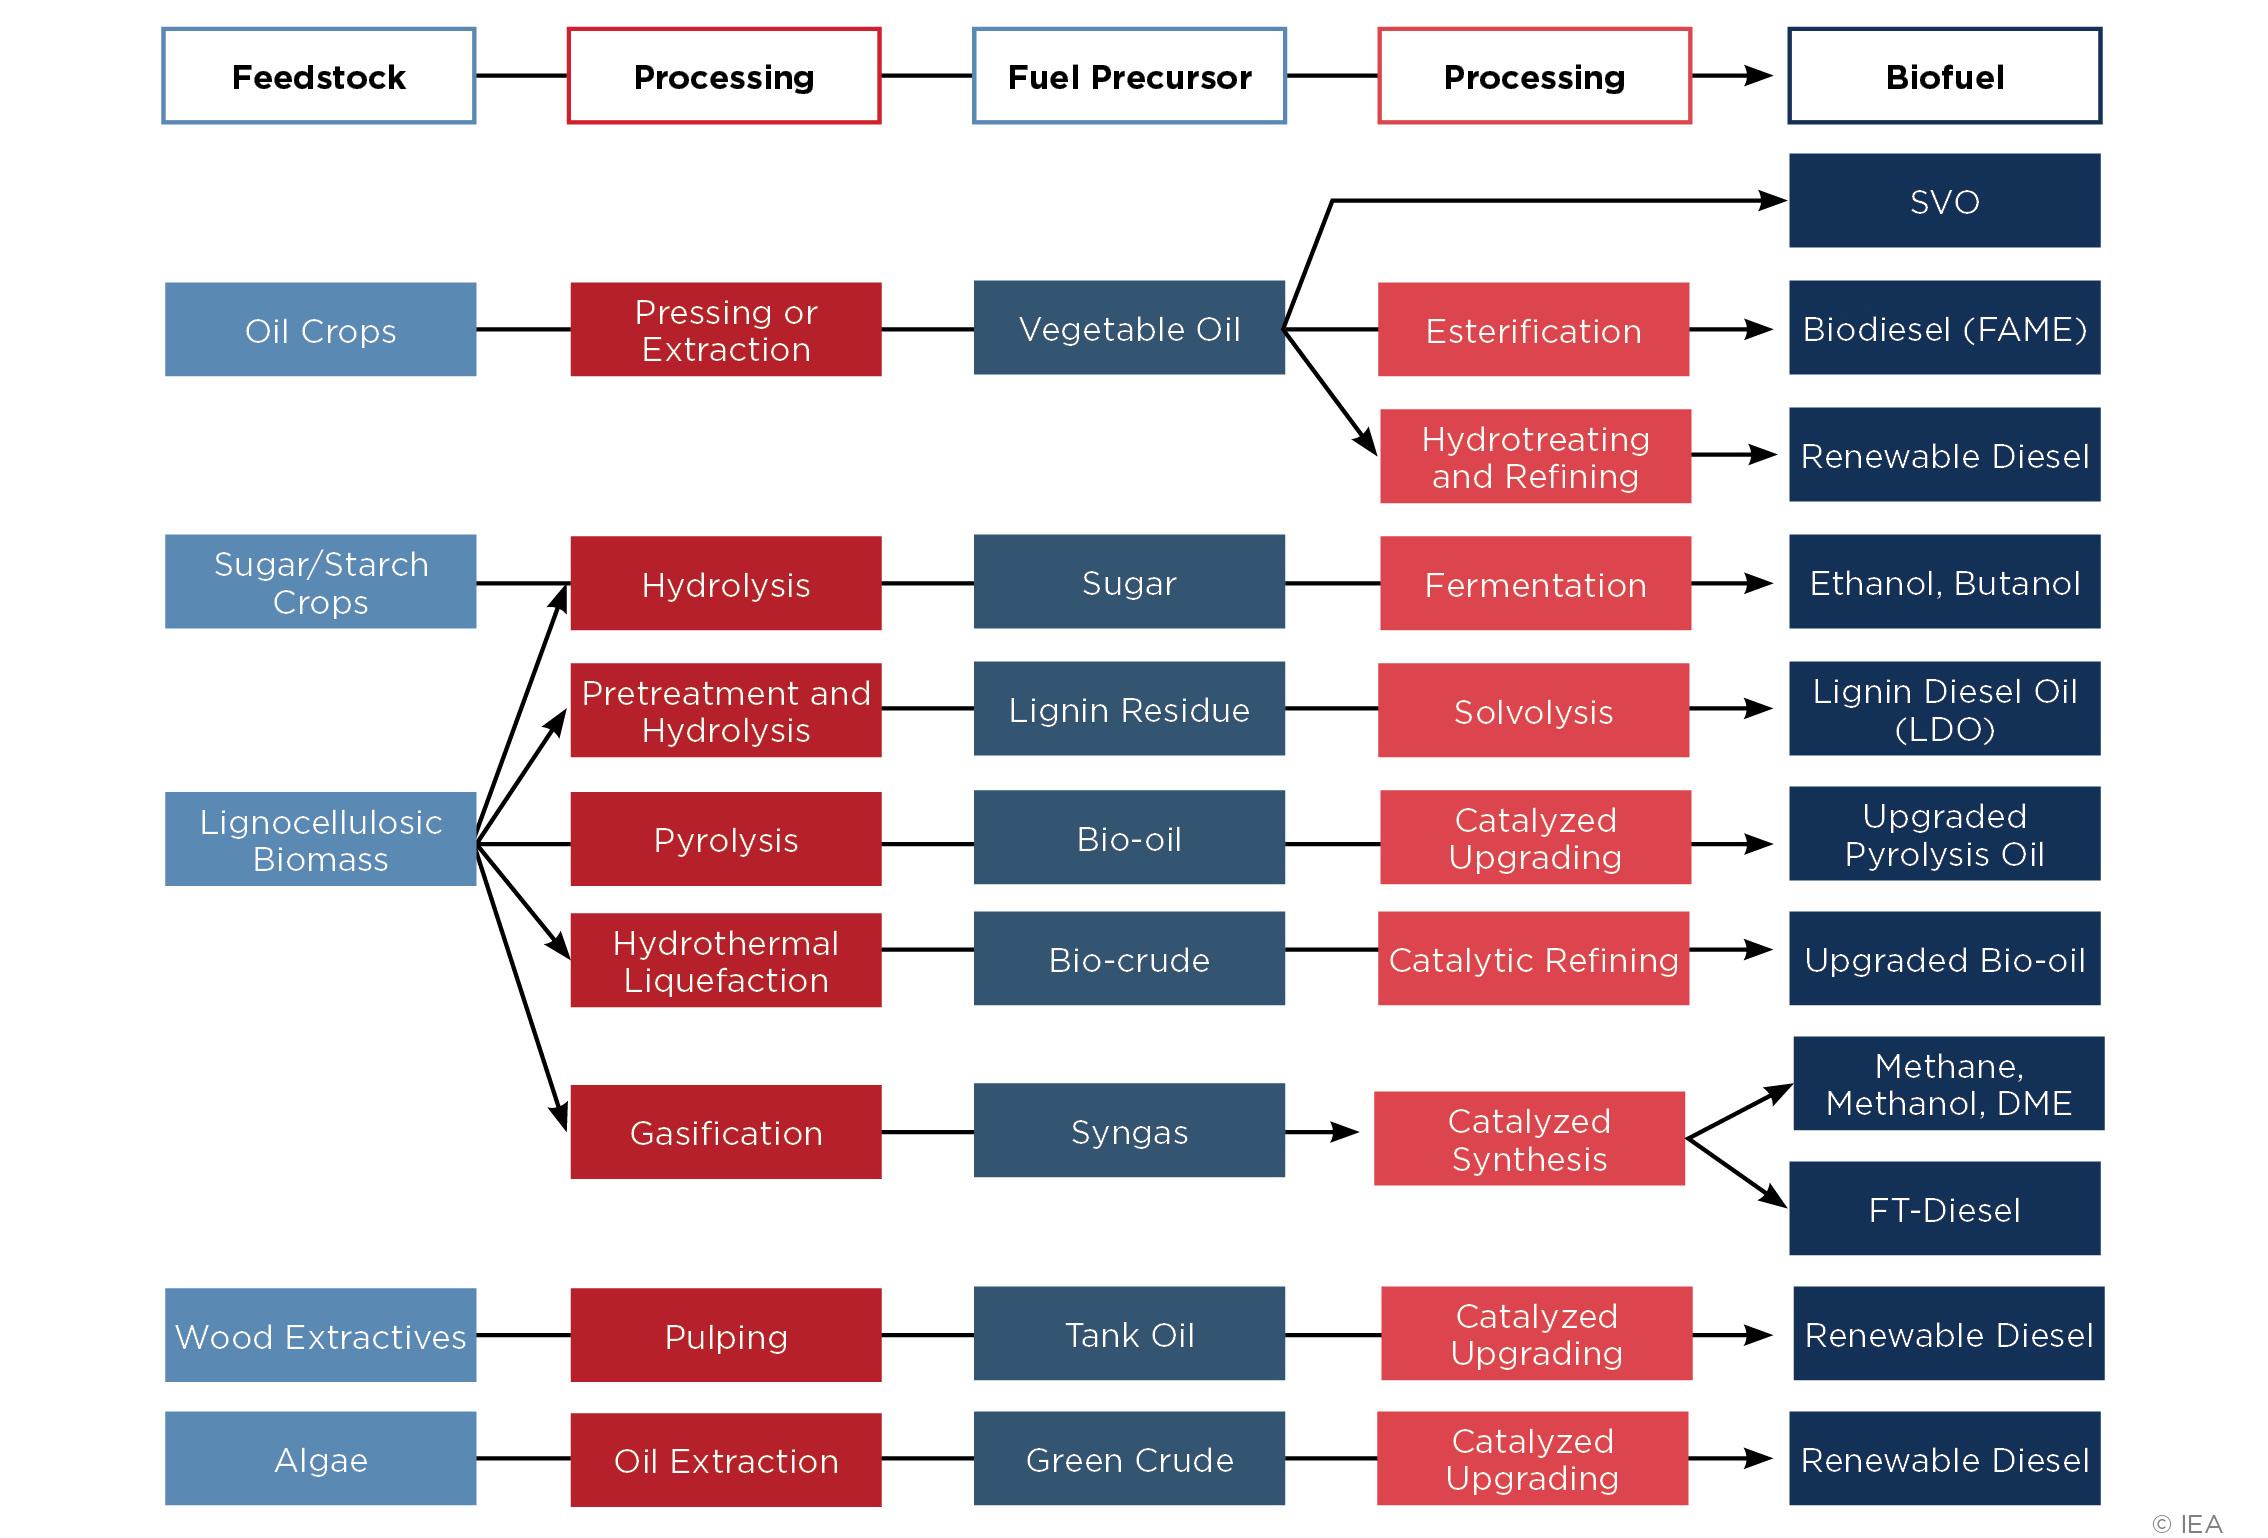
The biofuels currently available can be produced from a wide range of feedstocks, such as animal fats or waste, forestry or agricultural waste, food crops and vegetable oils (Figure 10). Naturally, the source and processing of each different feedstock will result in different carbon footprint on a life-cycle basis.

Figure 10: Potential feedstocks and production pathways for biofuels.
Figure 11 shows the well-to-tank carbon emissions of biodiesel produced from different feedstocks. The tank-to-wake emissions of biodiesel or renewable diesel are estimated to be equal to those of VLSFO since the carbon content of these fuels is similar. The amount of well-to-tank emissions generated by biofuel production can vary based on whether the production starts from crops or residues, the location of the biomass, potential deforestation for land use, as well as the efficiency of the production processes which varies from plant to plant. These factors are captured within a range between a low-emissions case (low estimate) and high-emissions case (high estimate).
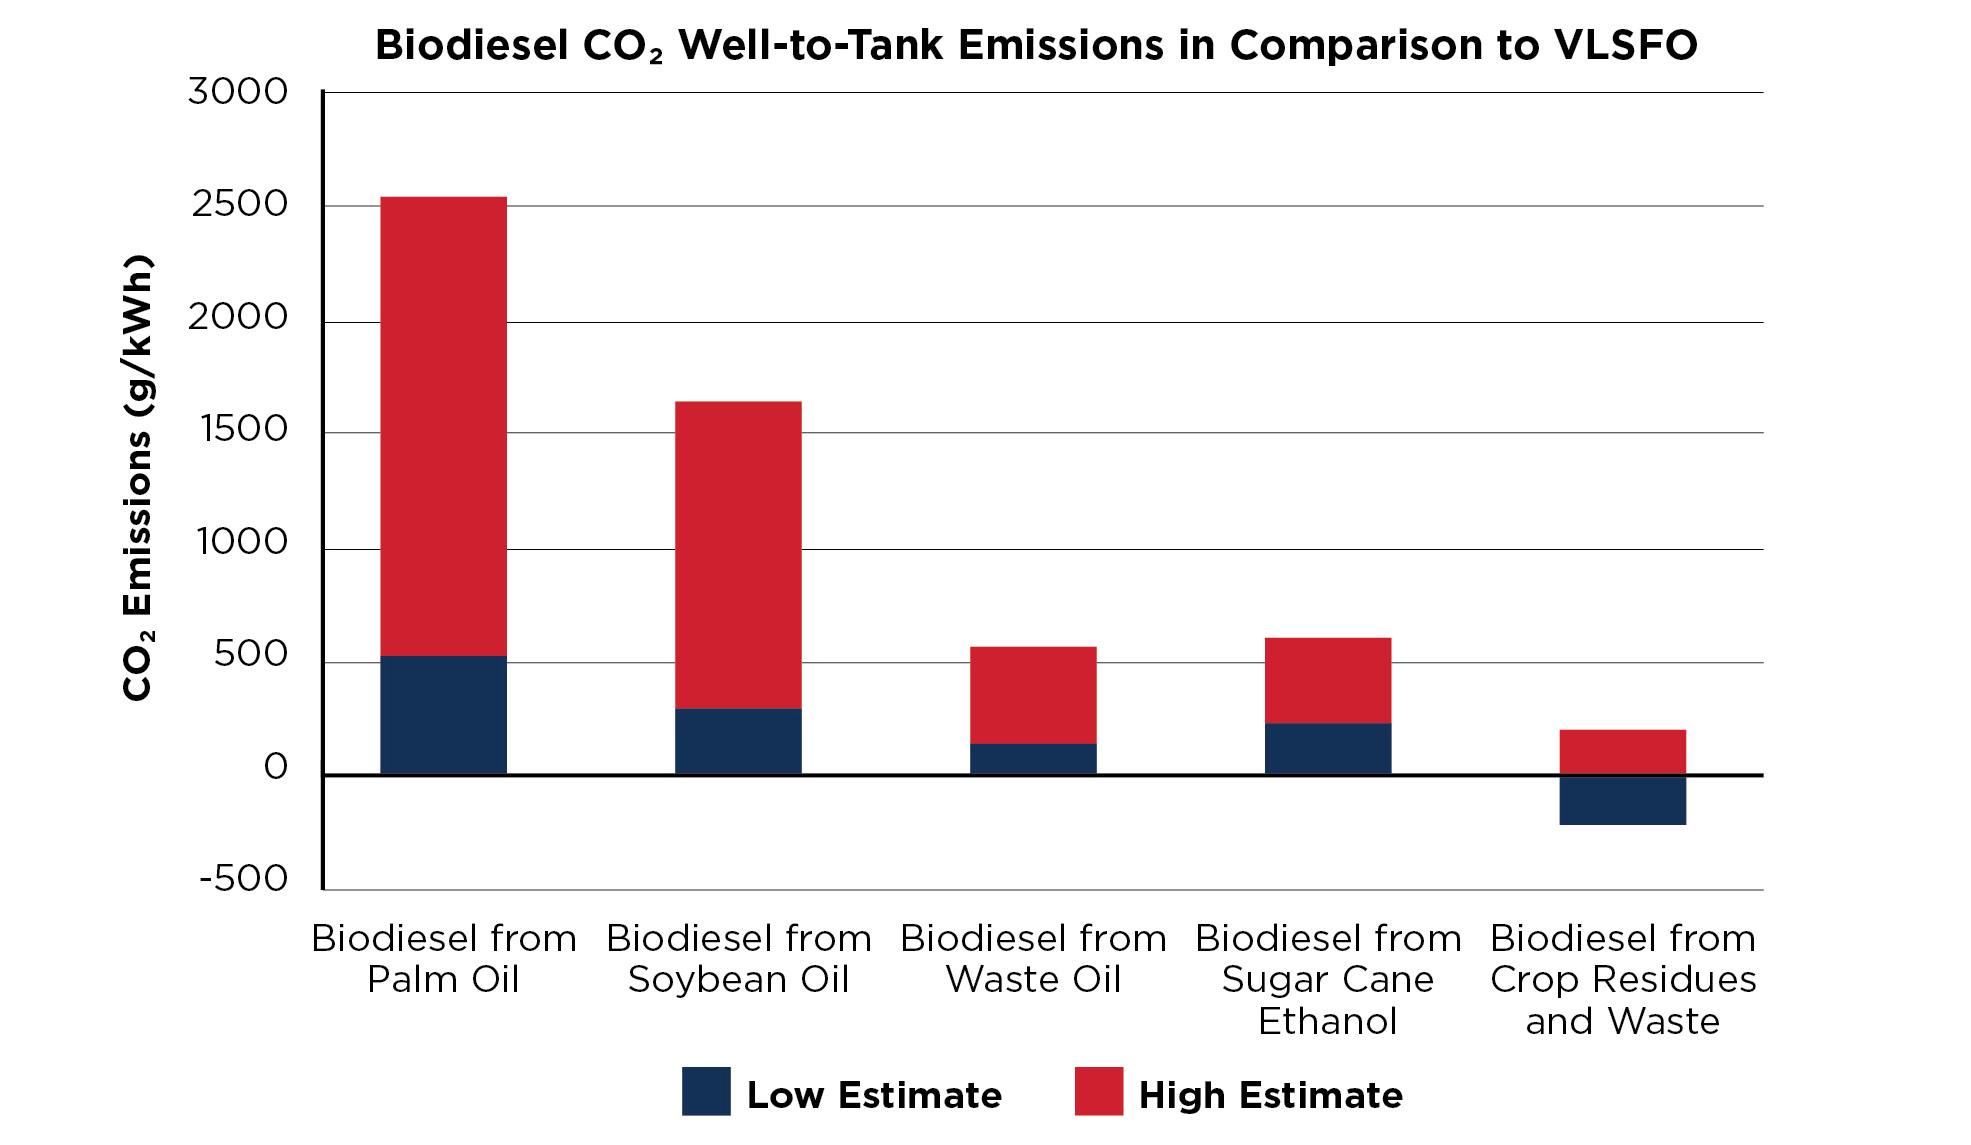
Figure 11: Well-to-tank CO2 emissions of biodiesel sources from different feedstocks .
The calculation of well-to-tank emissions for different biofuels can vary depending on the production processes included in the calculations and the implicit assumptions. Table 2 shows a summary of well-to-wake CO₂ emissions (in gCO₂eq/MJ) of different biofuels based on different models, as presented by the IEA's recent BioEnergy report.
Also, a recent study by the International Council on Clean Transportation (ICCT) examined the life-cycle carbon footprints of alternative marine fuels. Figure 11 shows life-cycle GHG emissions for alternative marine liquid fuels based on different feedstocks. This comparison showed that second-generation biofuels made from waste and lignocellulosic biomass offer the most well-to-wake GHG reductions, ranging from 70 to 100 percent lower than marine gas oil (MGO). That is due to their small impact on land use, large biogenic carbon uptake, and modest use of fossil fuel energy for feedstock conversion. In contrast, first-generation biofuels produced from soy oil and palm oil generate enough life-cycle carbon emissions to be comparable to MGO.
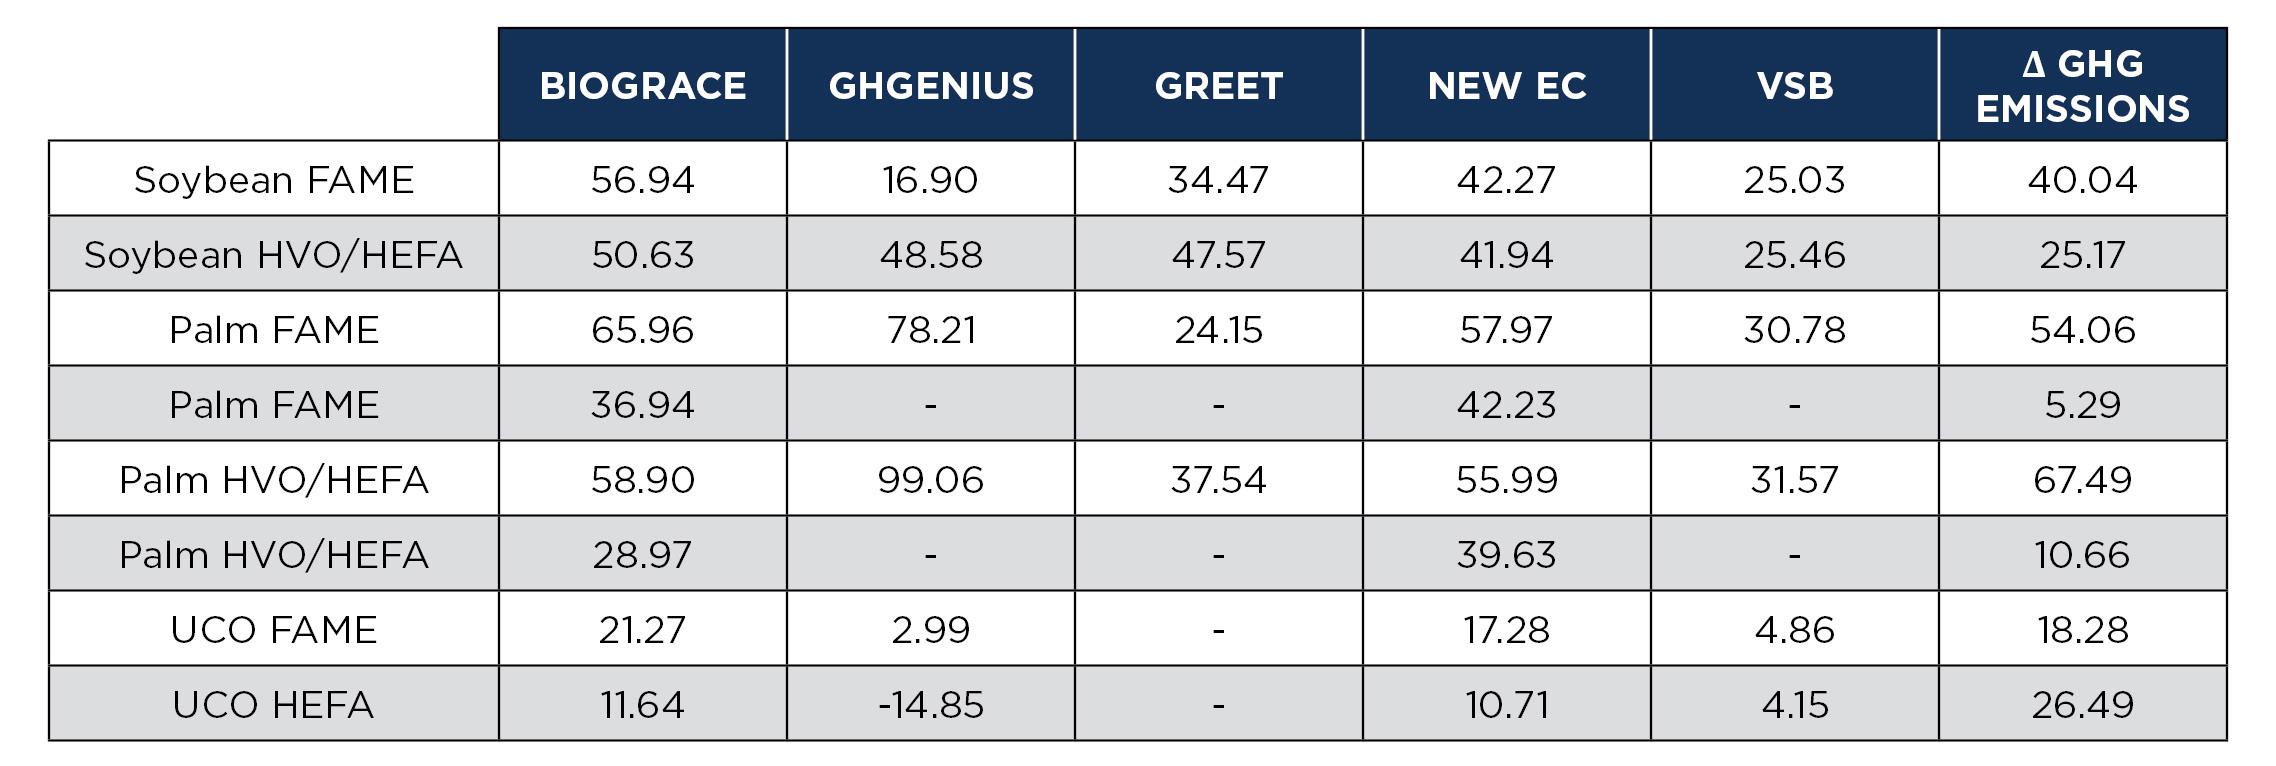
Table 2: Summary of well-to-wake CO₂ emissions (in gCO₂eq/MJ) of different biofuels based on different modeling schemes (IEA Bioenergy, Task 39: December 2018). Acronyms defined on page 76.
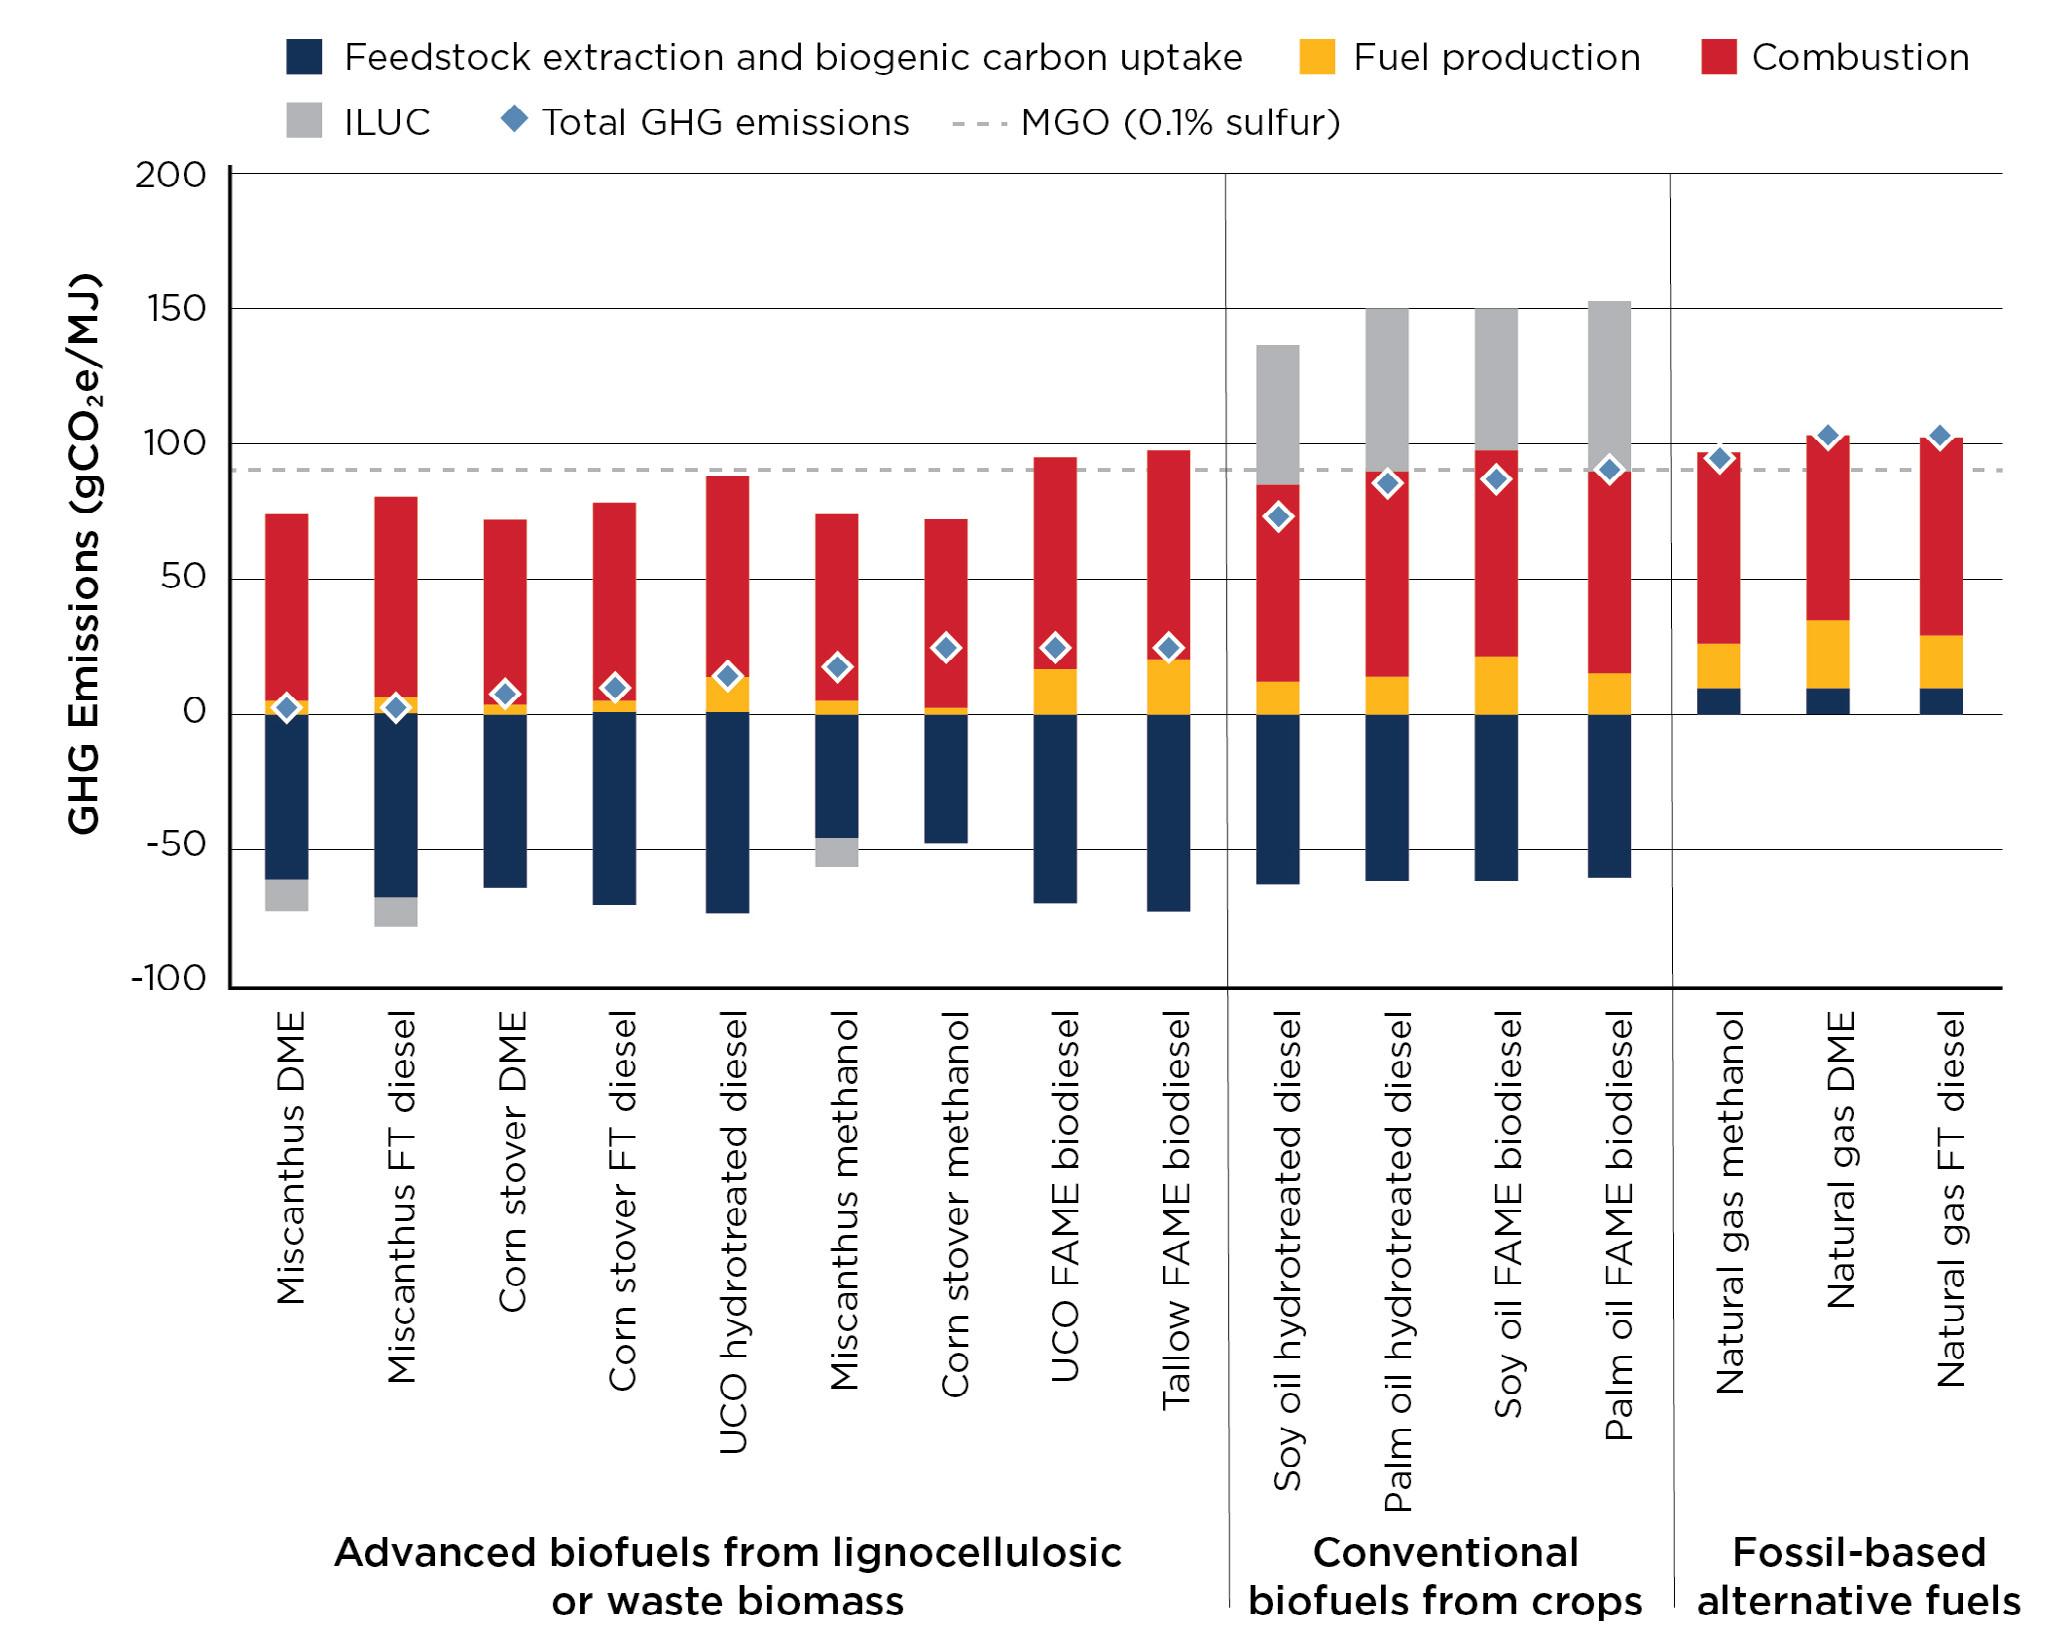
Figure 12: Life-cycle GHG emissions (100-year GWP) of alternative liquid marine fuels and feedstocks analyzed, by life cycle stage (ICCT, 2020).


