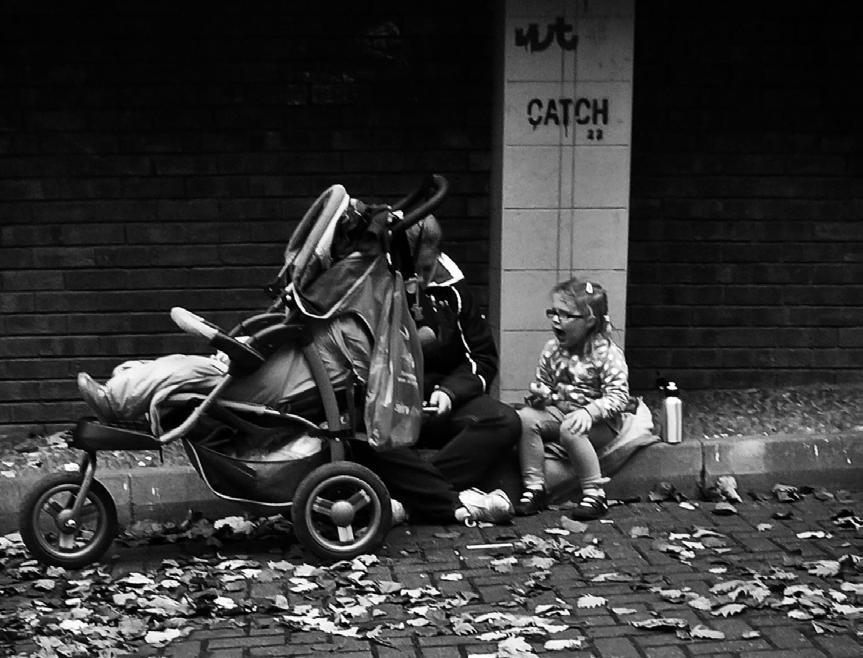
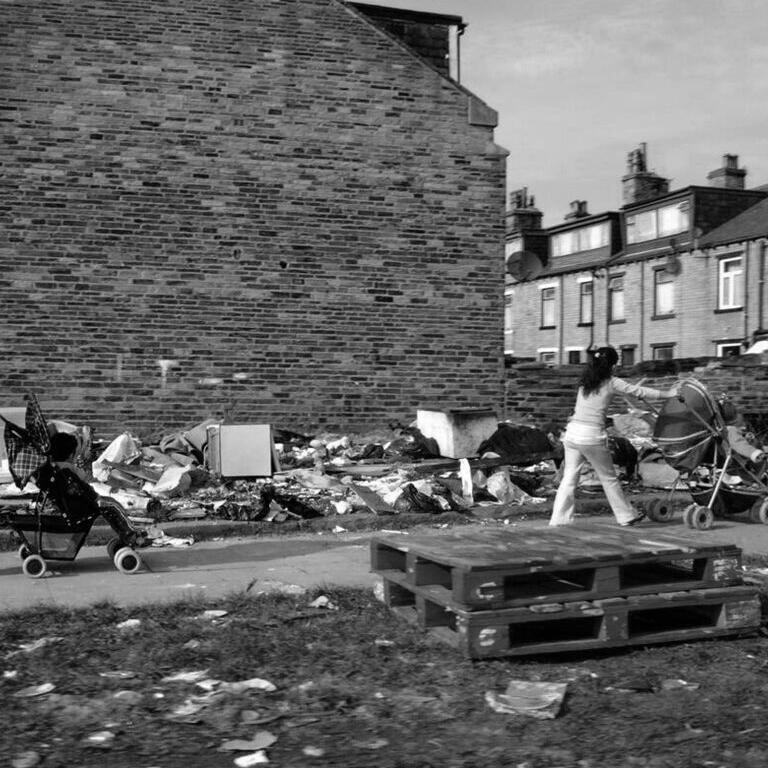
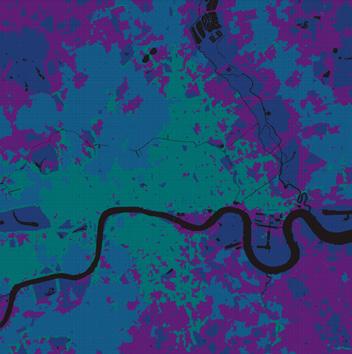
The city’s design, while functional for adults, often overlooks the needs of its youngest residents. Traditional educational settings, such as schools and playgrounds, while important, may not fully support the holistic development of children, especially when considering the alarming 25% increase of child school absences over the past year. Holistic development encompasses not just academic learning, but also physical, emotional, social, and cognitive growth. In light of this, there is a growing need to reimagine urban spaces to create integrated environments that serve as alternative learning spaces for children. In this dynamic approach, we aim to gamify the experience of the solutions to create engaging, educational, and accessible pathways that encourage empowered education, community involvement, tailored child development and help offset factors inhibiting child educational development. By applying interactive elements that combat factors inhibiting the development of children, we aim to innovatively address these issues faced by affected children in London.
URBAN STRATEGY
We aim to do this by overhauling the traditional idea of a neighborhood, which consists of functioning as a means for people to navigate from their homes to their destination. Instead, our whole neighborhood intervention shall function as an educational, stimulating and interactive medium that kills the idea of the neighborhood space as a banal transportational means. This interactive approach will be achieved by creating a holistic interconnected neighborhood space that provides the necessary factors and facilities that shall help tackle the unpleasant life quality of children in poverty.
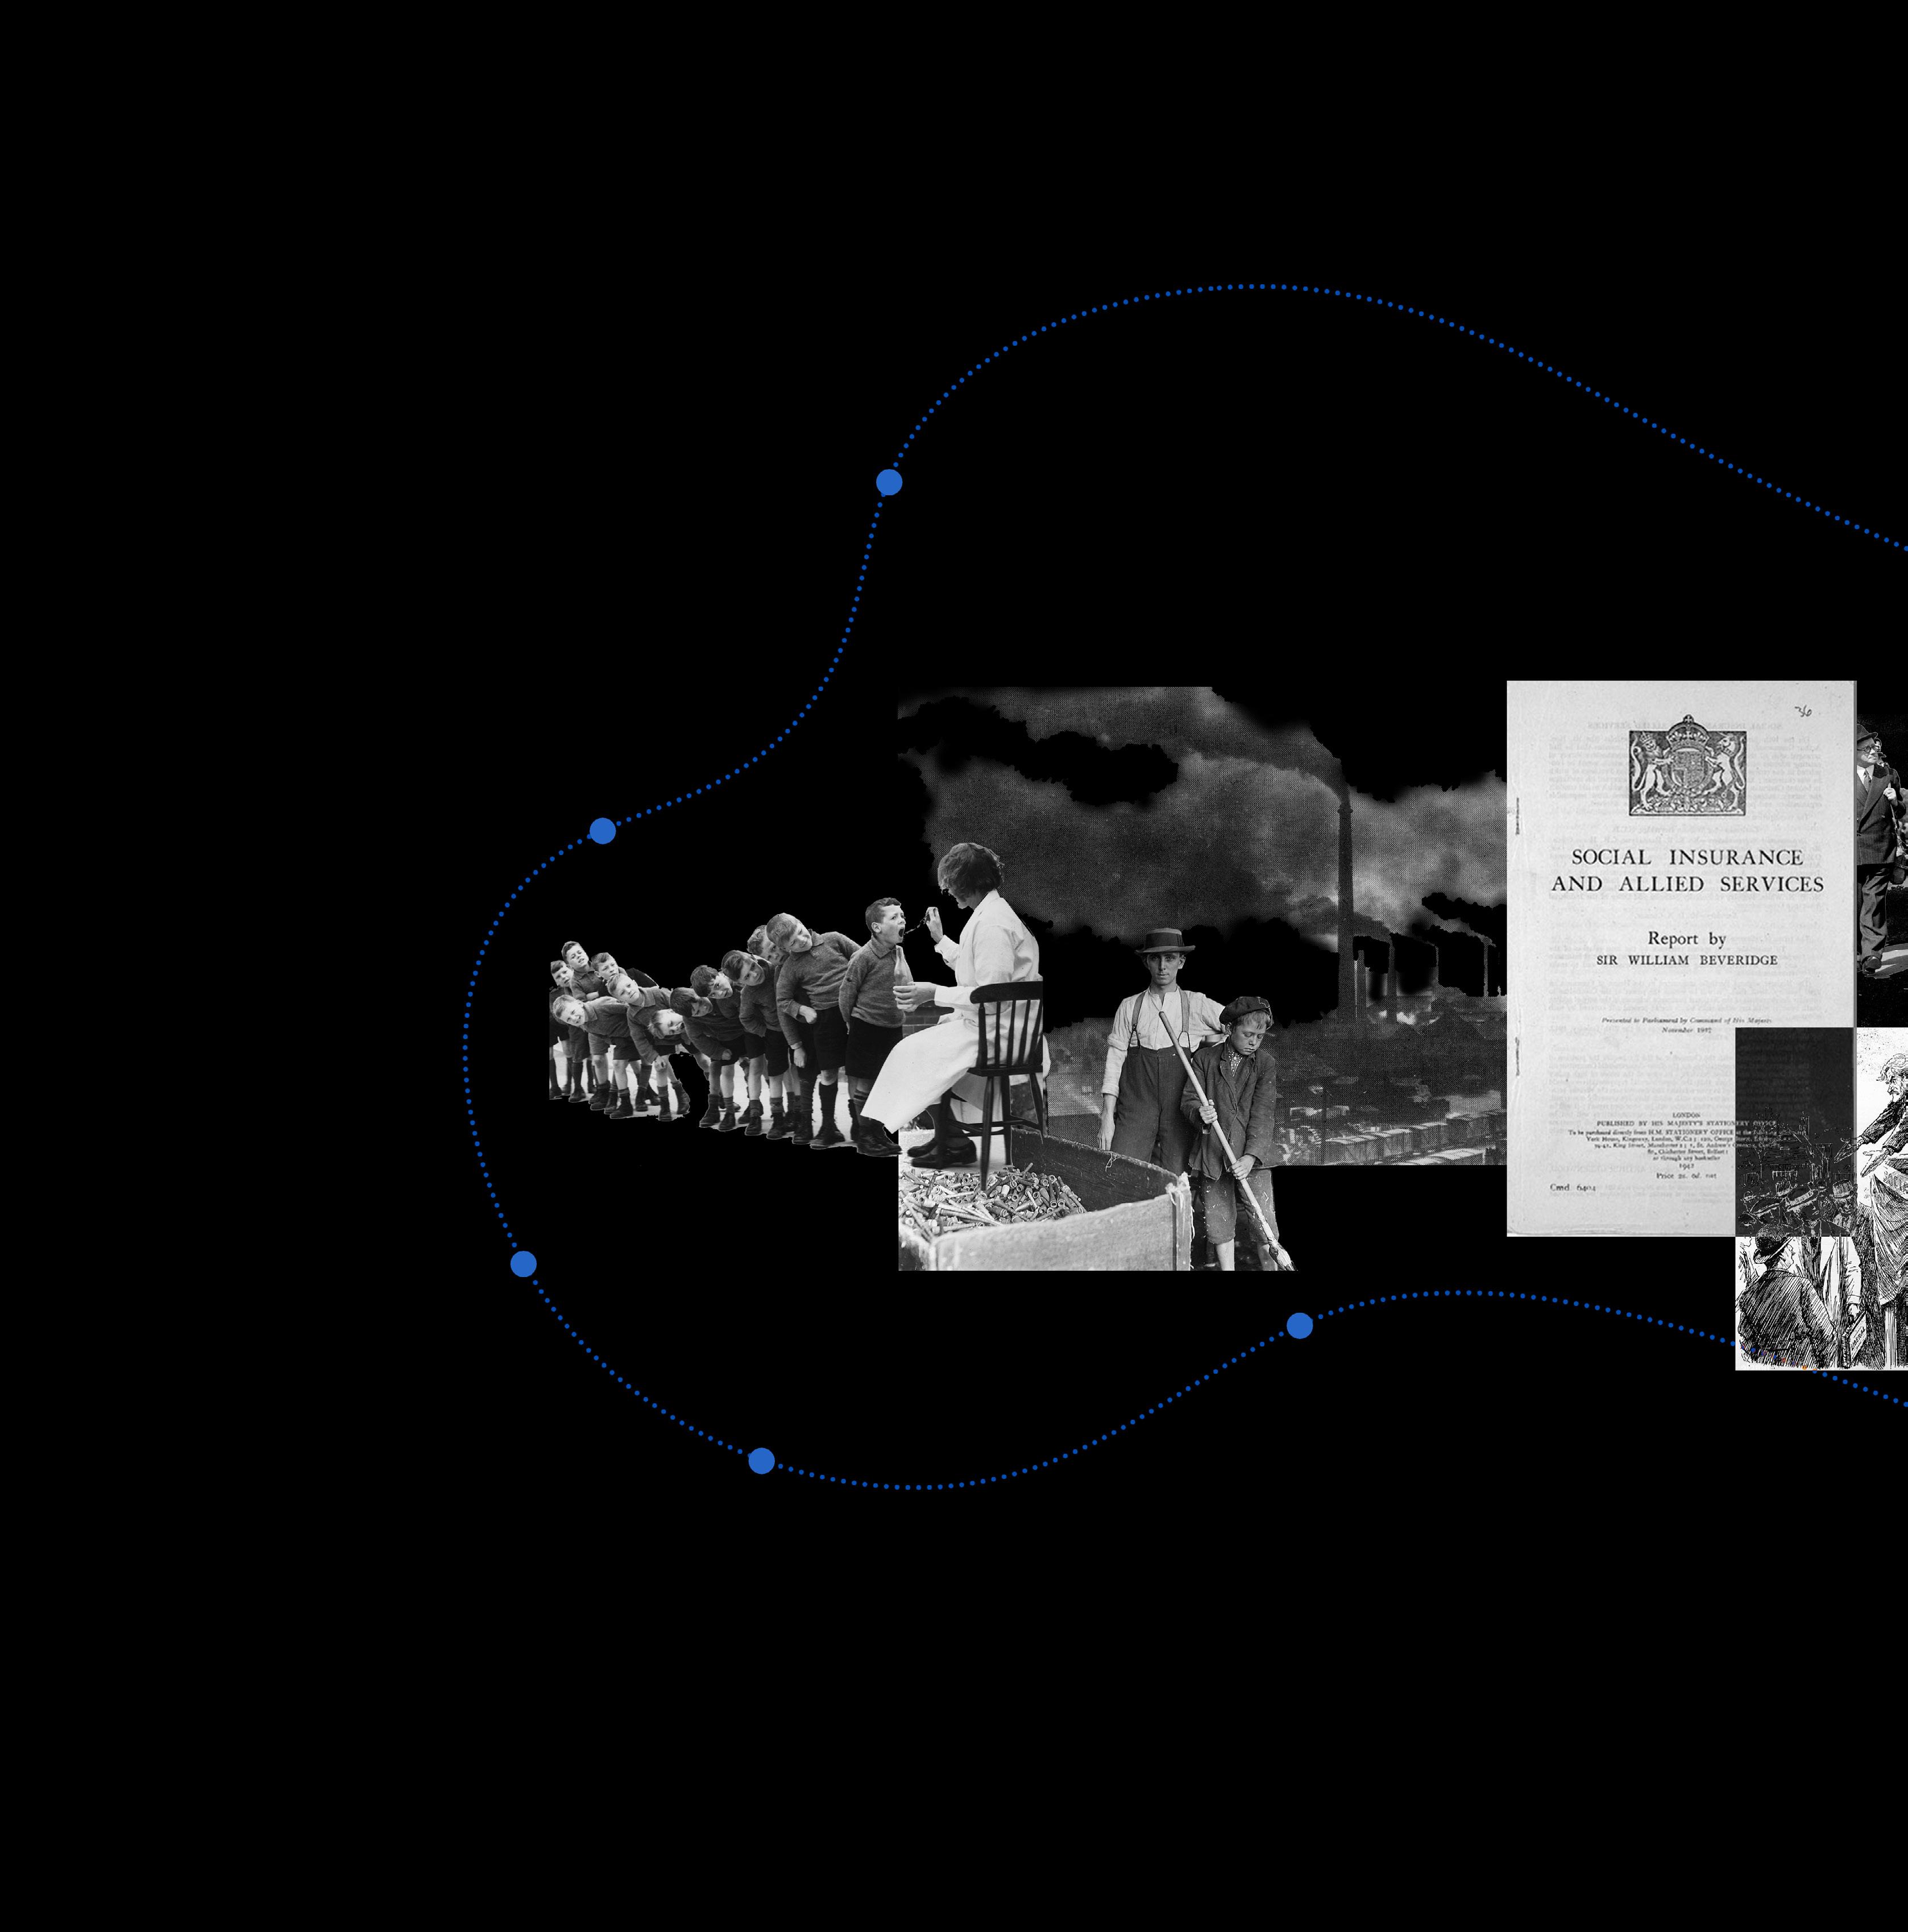
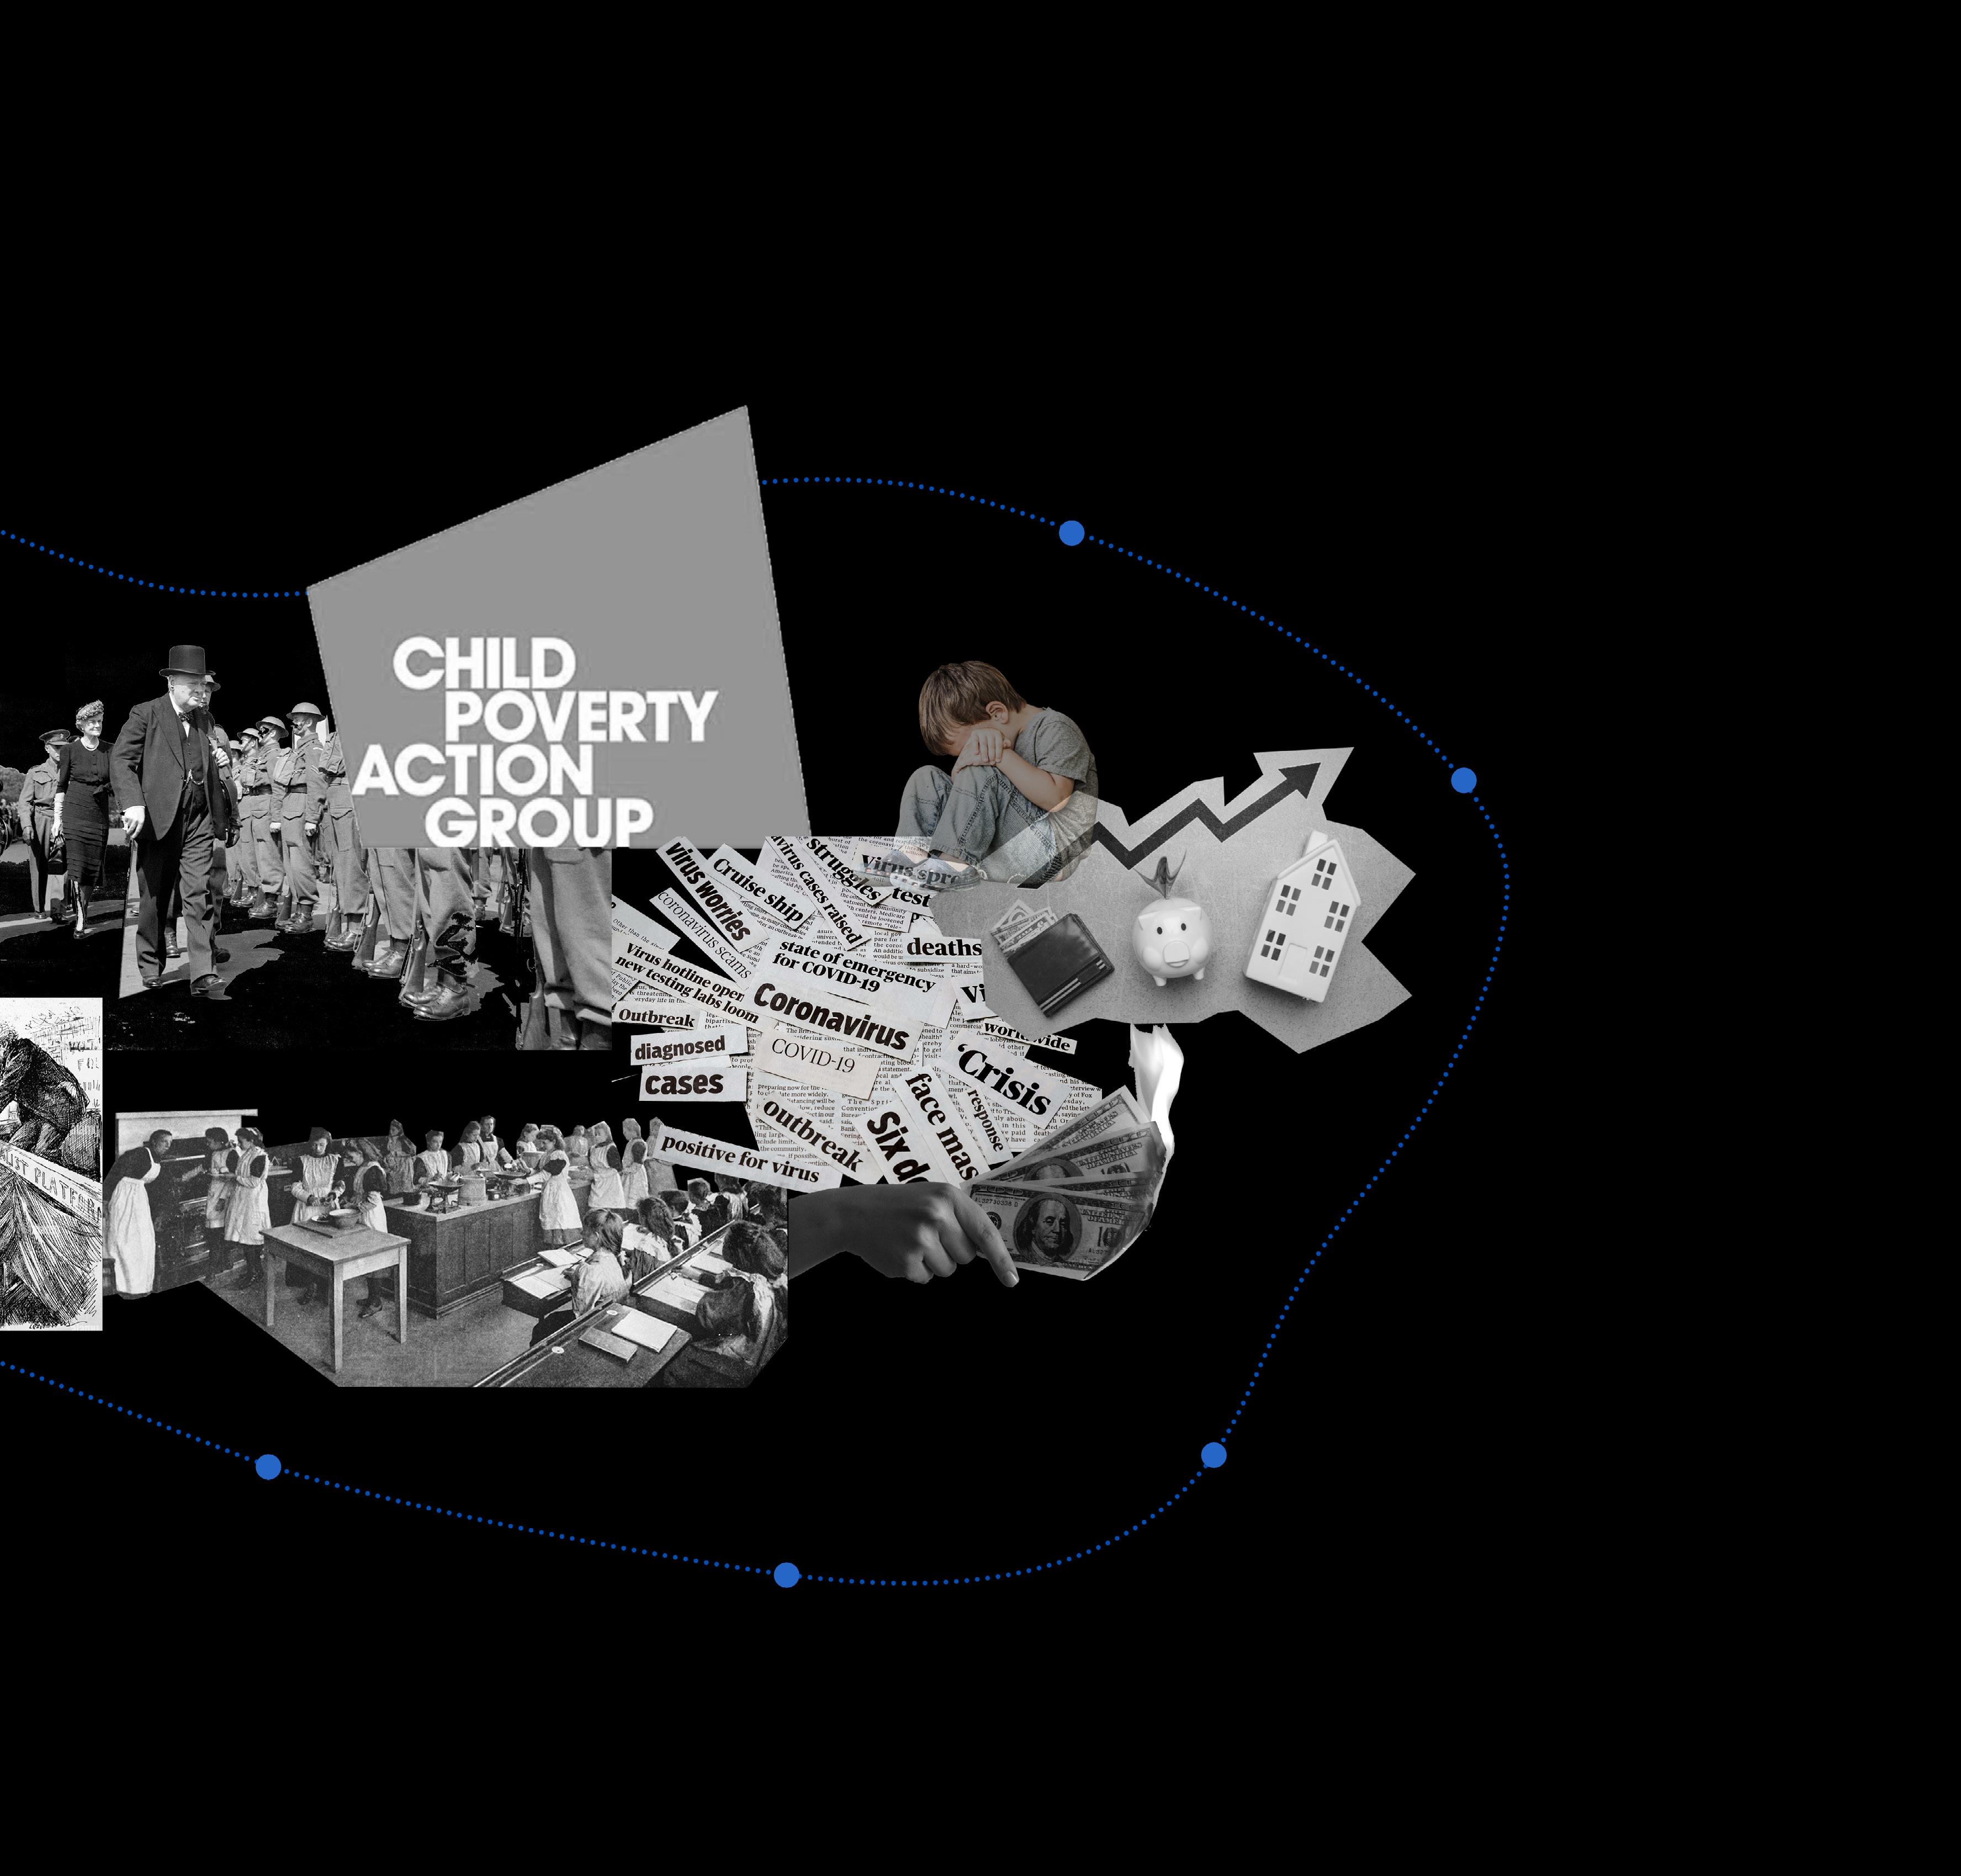
TIMELINE OF FACTORS RELATING TO CHILD DEVELOPMENT IN THE UK
“Poor Law” implemented by UK Gov which involved Parish householders and rich households to pay a tax for the poor. 1600’s
Early 1800’s
The rise of the Industrial Revolution in the early 19th century increased child poverty in the UK, as children were employed in harsh conditions due to the absence of protective labor laws.
The “Poor Law” was reformed to ensure that children in poverty were clothed, fed and placed in workhouses. Not all the victorian elite shared this view. 1834
Early 1900’s
In the early 20th century, social reformers Seebohm Rowntree and Charles Booth conducted surveys on British poverty, shedding light to the public and policy makers on the extensive issue of child poverty.
1942
The Beveridge Report built upon the ideas and findings of Booth and Rowntree, was a document that outlined and spearheaded social welfare reforms, which ultimately targets child poverty.
1944
Post-World War II, social welfare reforms aiming to address child poverty and mitigate its impact were introduced, such as free school meals, old age pensions, and National and Unemployment Insurance.
2021-Present day
The cost of living crisis began in the UK during 2021. Food and energy prices soared significantly, particularly gas prices, with the annual rate of inflation reaching a 41-year high at 11.1% in October 2022. This prevents children from having a fair chance of development and empowered education
2020
The impact of the pandemic disrupting economic activity lead to income instability for many families which saw the child poverty rate rise from 25 % (pre-pandemic) to 30 % (post pandemic). Persistent child school absences rose drastically from 12.9 % before the pandemic to 28.9 % by July 2023.
1960
The creation of the “Child Poverty Action Group” created the term child poverty to shed light on the everlasting issue. They function to influence policy makers.
2006
Since 2006, child obesity rates in primary students has increased by 30 %, showcasing the lack of an adequate and nutritious food system for children, essentially affecting their education and development.
CHILD DEVELOPMENT IN THE UK
During the Industrial revolution in the early 19th century, over 50 % of workers were comprised of children below the age of 14. Terrible pay, dangerous conditions and excessive working hours prevented these children from receiving an education and plagued those children with health conditions. Post-World War II, the Beveridge Report introduced a comprehensive system of social insurance to address poverty, including child poverty, and to mitigate its impact on children’s education. The subsequent educational policies in the 1960’s aimed at reducing poverty and improving the well-being of children demonstrated a growing awareness of the adverse impact of child poverty on education. The historical struggle to address factors inhibiting child development in the UK has also highlighted issues of accessibility. Factors such as poor quality accommodation and fuel poverty (no transport means) have affected children’s well-being and development and access to basic needs and healthcare. Despite progress, accessibility issues remain persistent, portraying the need for sustained, multifaceted intervention to reduce its impact on the lives of children. This underscores our commitment to creating a more equal society through an integrated urban landscape that addresses the root causes of the factors inhibiting child devlopment and empowered education, such as food insecurity, health, accessibility and education.
How can an integrated urban environment be designed to serve as an alternative learning space for children, fostering holistic development through equity with adults, self-directed exploration, and experiential learning, while addressing their unique developmental needs?
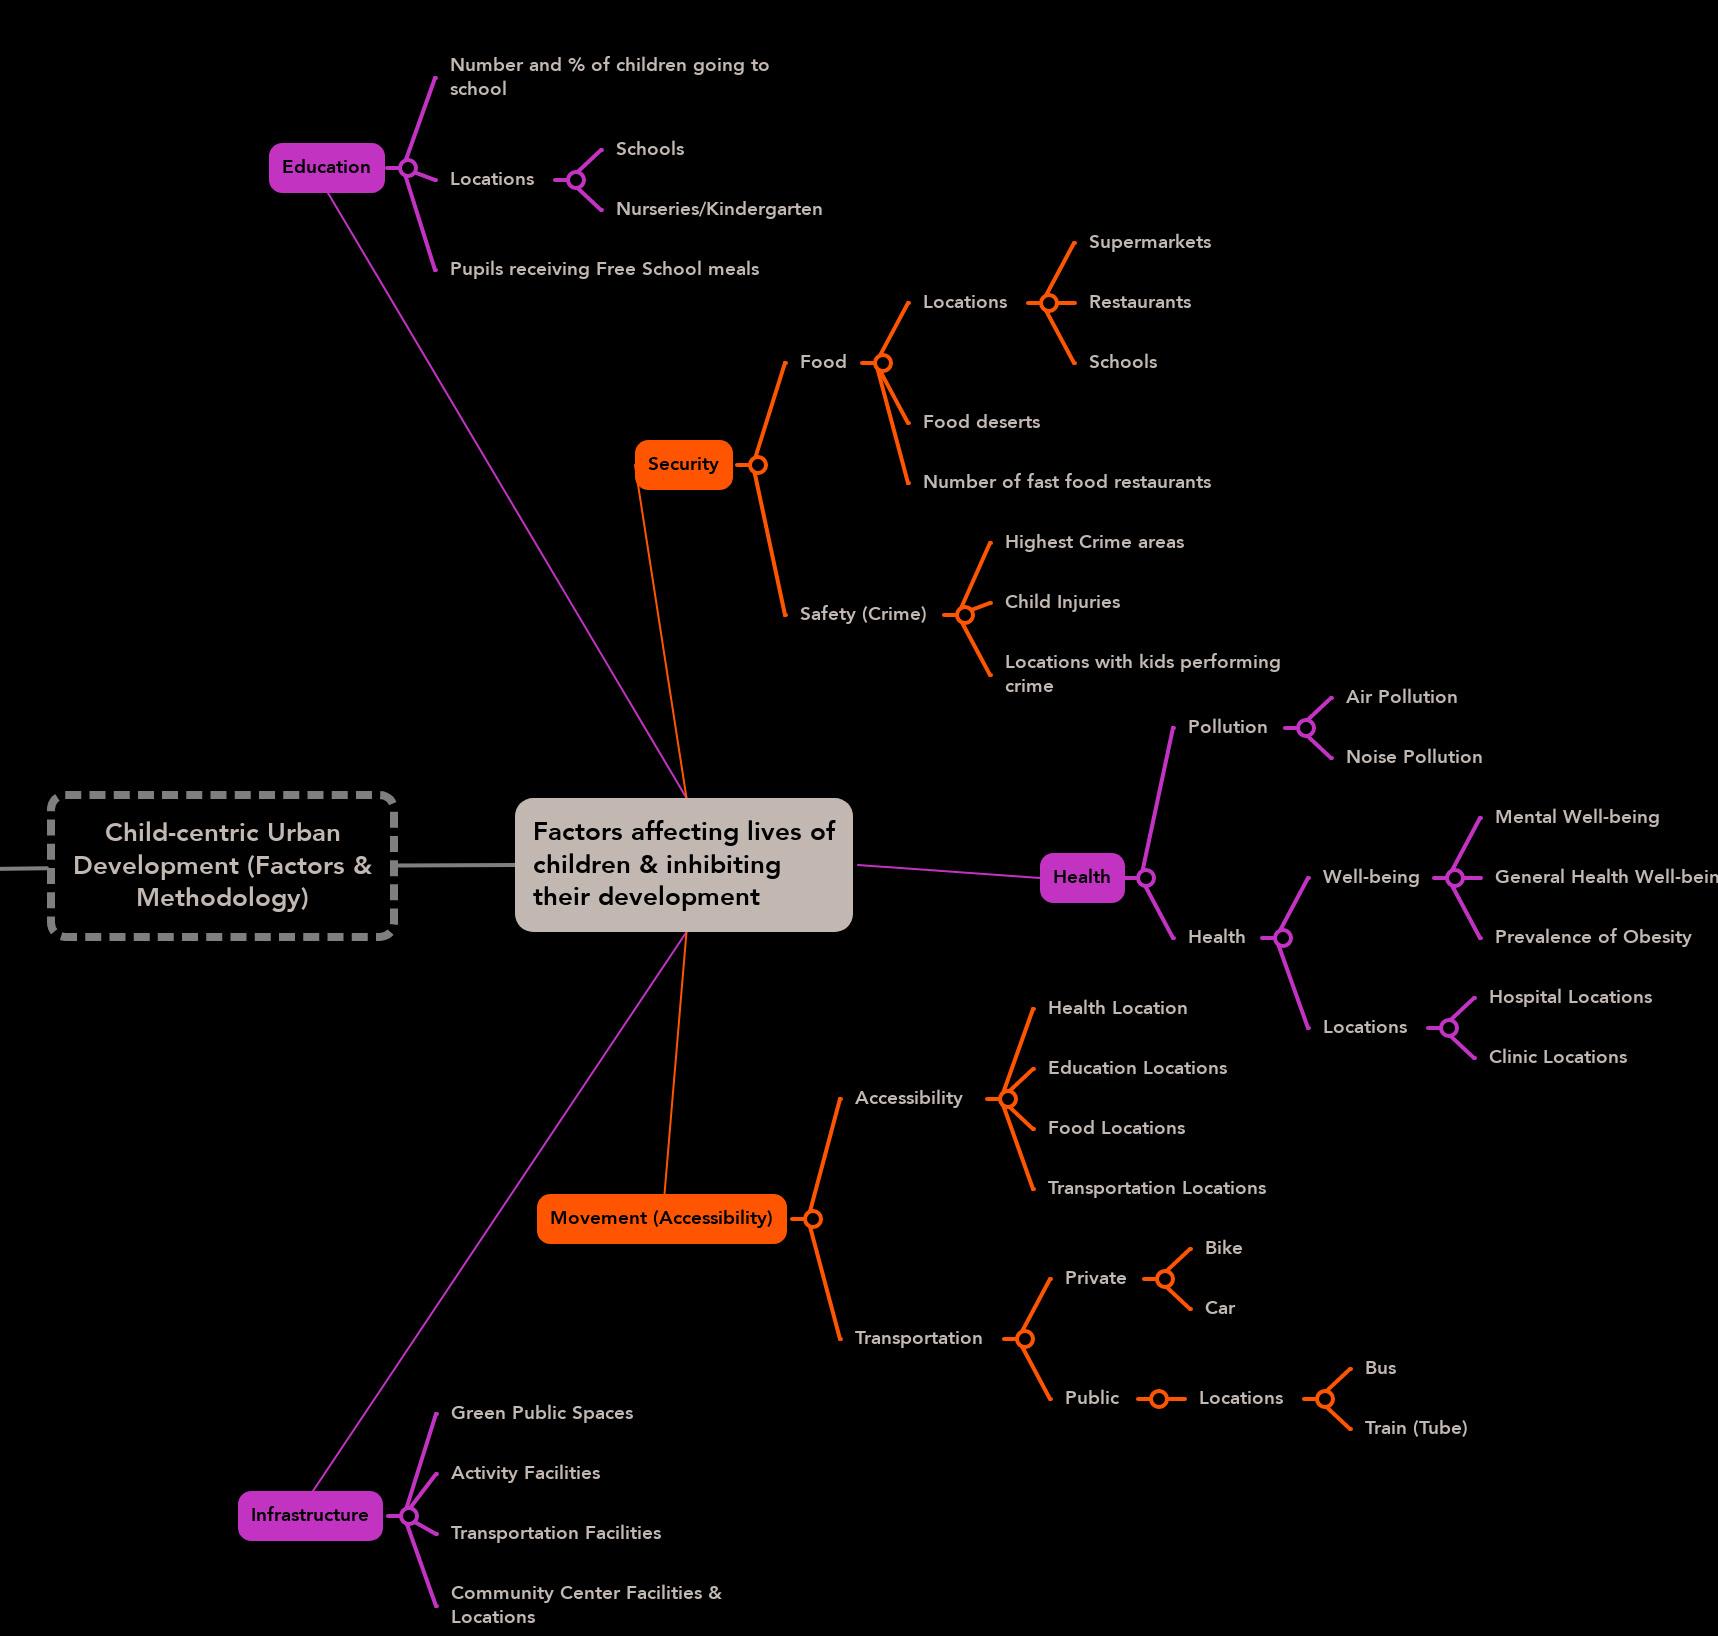
FACTORS INHIBITING CHILD DEVELOPMENT & EMPOWERED EDUCATION
CHILD DEVELOPMENT CRISIS
The factors focused on in this project to reduce social inequality and provide the children with the chance of a higher of life
EDUCATION
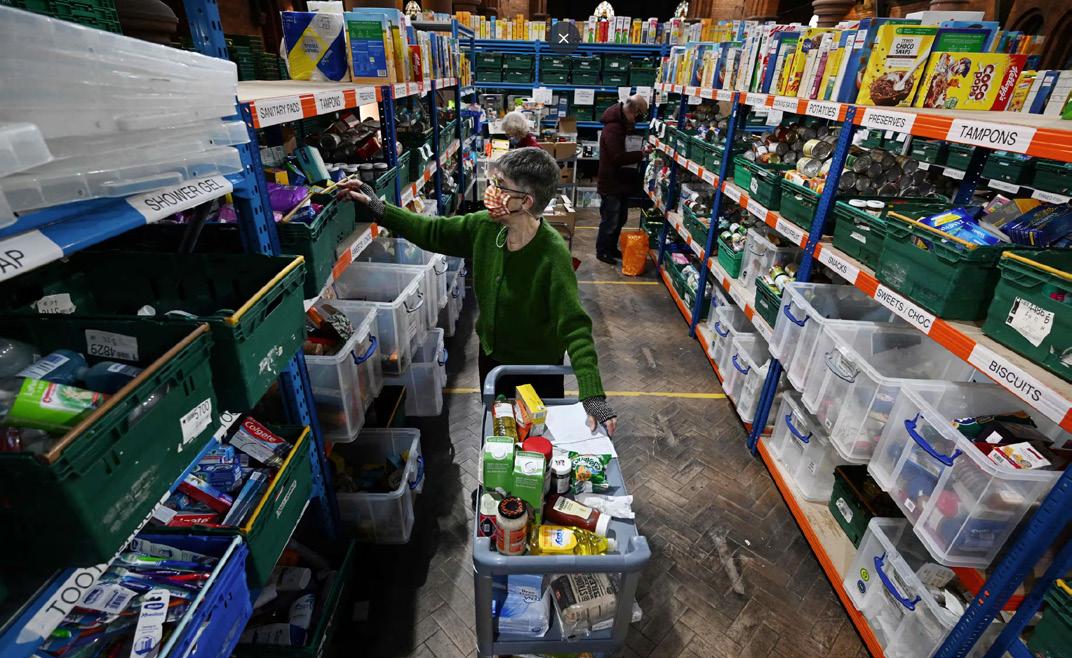
FOOD INSECURITY
HEALTH 6 7 8 4 5 1 2 3 ACCESSIBILITY
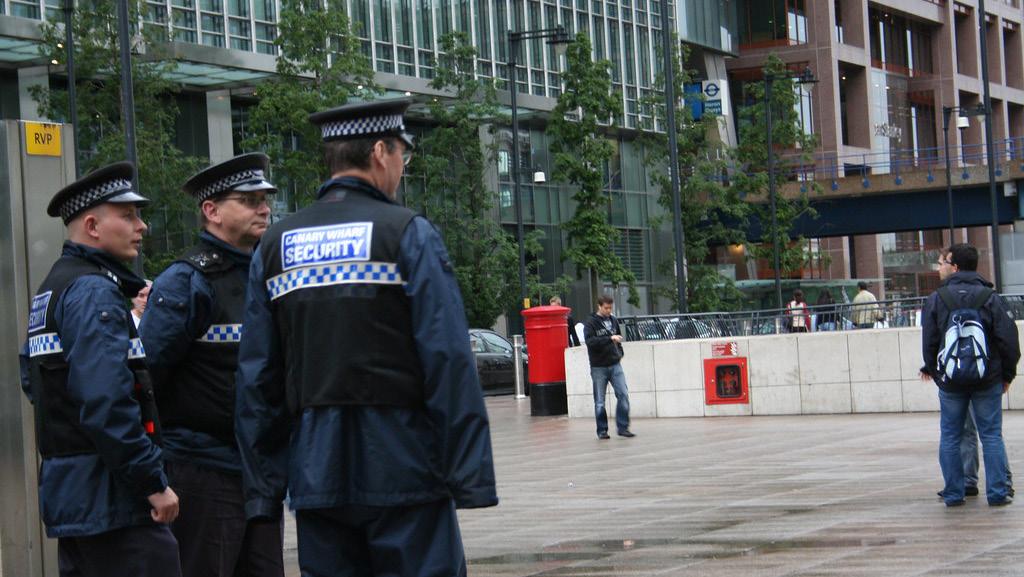
SECURITY
GEOGRAPHIC LOCATION
PARENTAL EMPLOYMENT
SOCIAL ASSISTANCE
CHILD DEVELOPMENT IN THE UK TODAY
Over the past year, the population of children in poverty in the UK increased by over 320,000 children, due to the rise of the living cost crisis occuring today. Over 12.2 million people in the UK were in deep poverty in 2023, which is around 18 % of the entire population. Additionally, 3 in 10 children (32 %) are unfortunately part of households in poverty.
From an educactional point of view, only 33% of children that are elgibile for free school meals achieve 5 passing marks (A*-C) in their GCSEs as opposed to 61% of those that are not in poverty. Teachers have stated that disadvantaged children were not likely to gain the same educational experience as other students as the classroom functioned as a space to provide them with basic needs, sleep, food and clothing rather than education. Additionally, they are much more likely to get bullied than other students.
Studies have highlighted a strong correlation between food insecurity or poor dietary intake and declining academic performance in children. For instance, children from food-insecure households often experience difficulties in grasping concepts, performing well on tests, and maintaining focus during classroom activities. This gap perpetuates a cycle of disadvantage that undermines children’s developmental prospects and educational attainment.
Child poverty is linked to a wide range of health inequalities, including: Low birth weight (200g lower than other children), Poor physical health such as obesity and malnourishment, Mental health problems, and low sense of wellbeing & confidence.
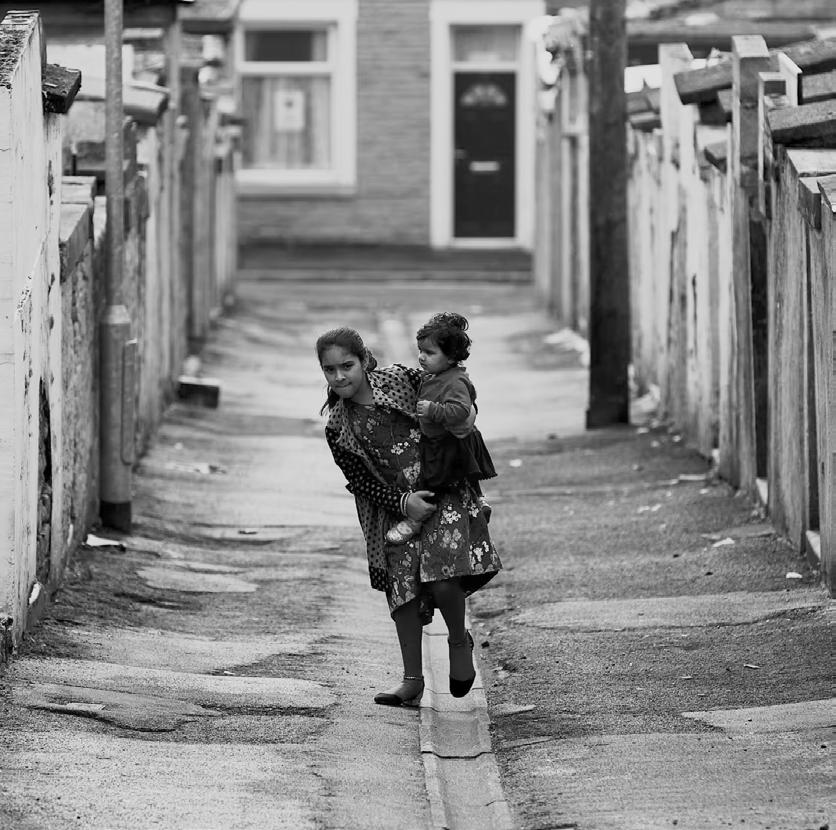
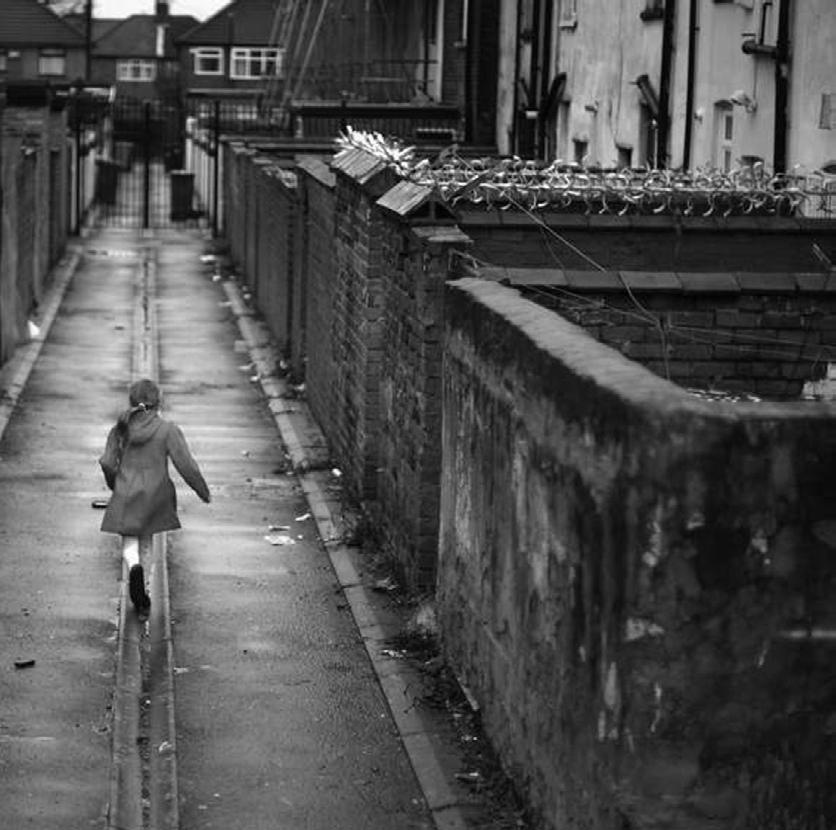
A major contributor to inadequate child development and what is preventing them from receiving basic needs and a fulfilled life, is accessiblity. 38 % of the people in poverty were reported to have no car, limiting their access to medical centers, schools, and food sources such as supermakrets and food banks. 3 in 5 people in poverty worry about public transport costs and not being able to afford it.
Although we accept that we may not be able to directly influence the economic policies and living cost situation, we believe through planning and design that the children affected by these factors could be aided by addressing them to help meet and exceed one’s basic needs to live, prosper, and develop.
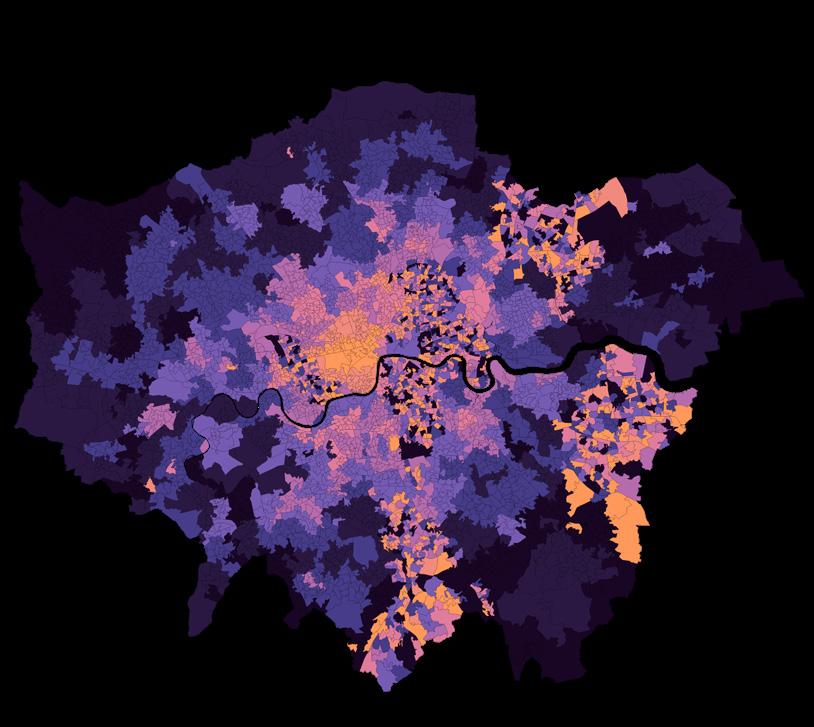
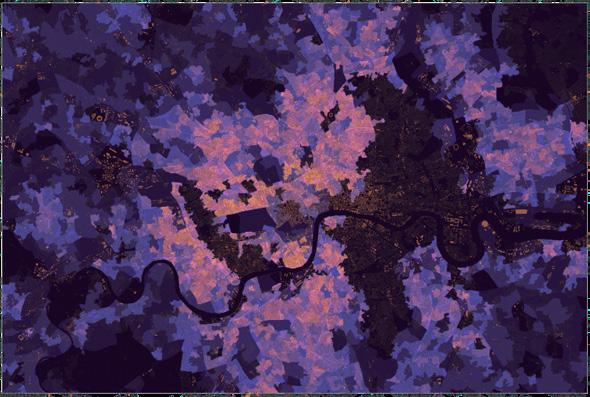
LEGEND
RAIL NETWORK
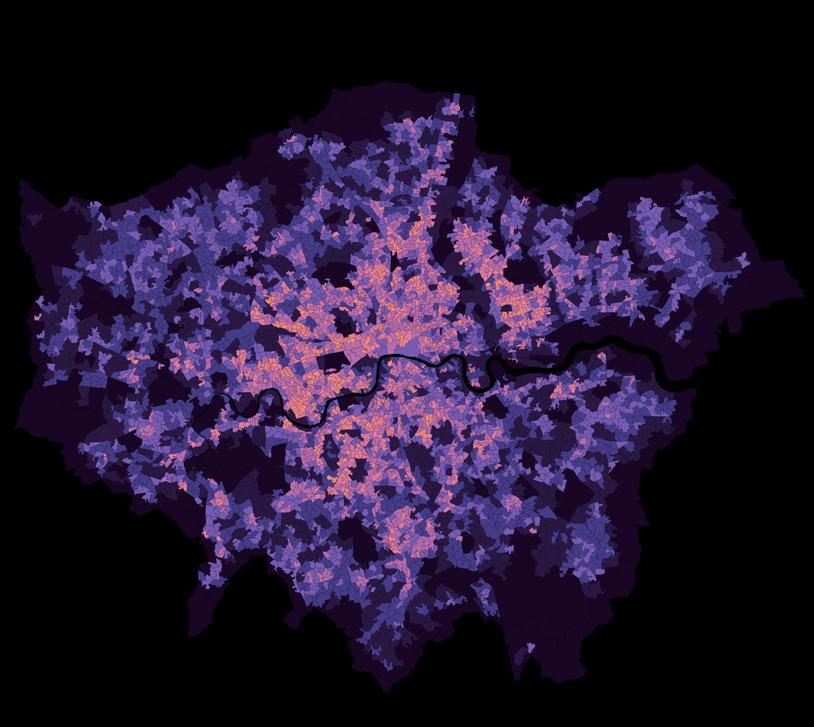
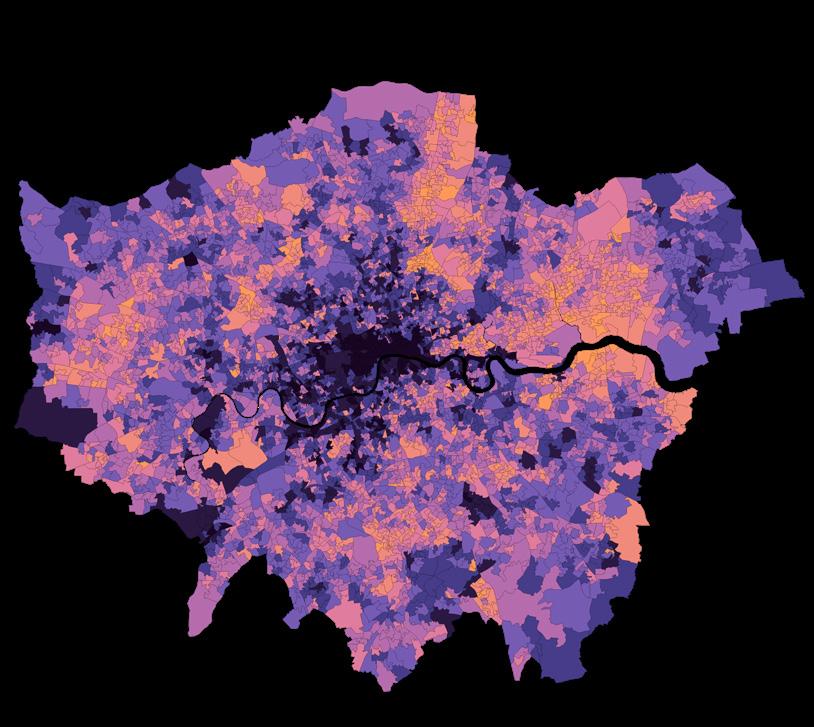
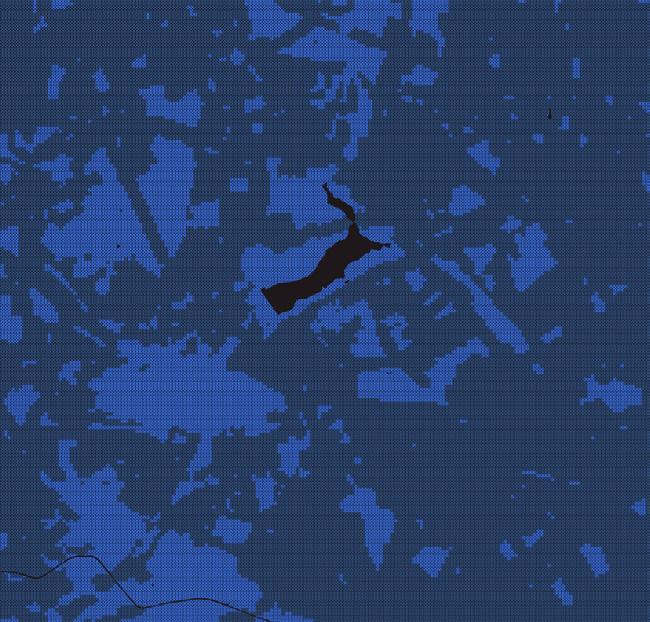
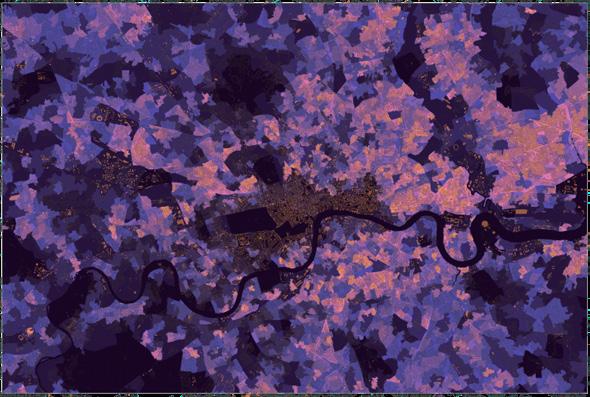
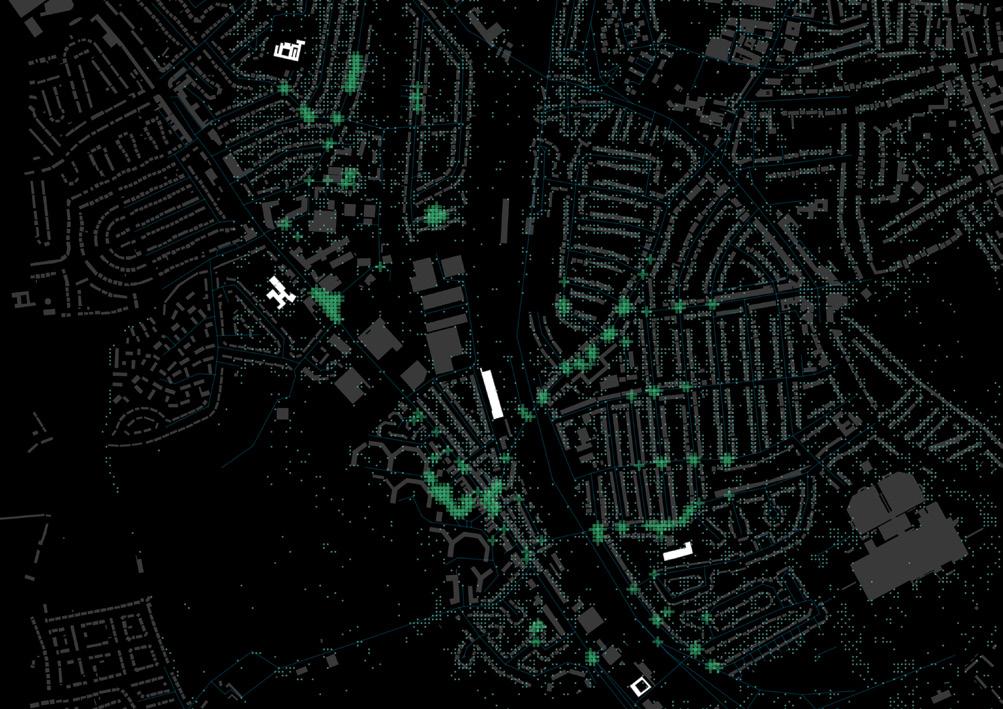
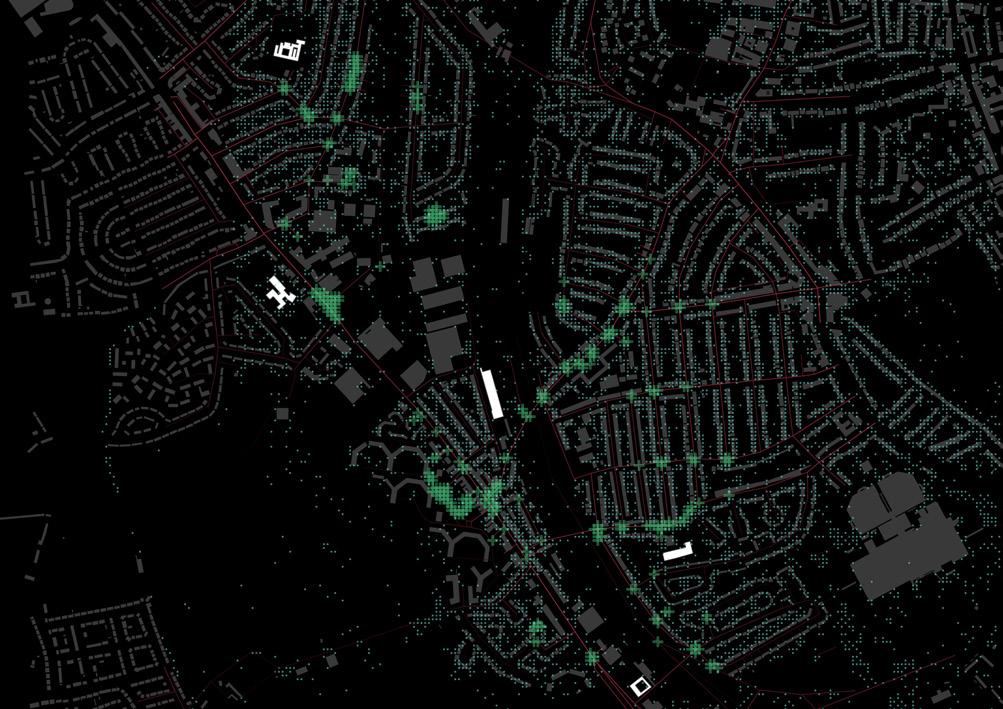
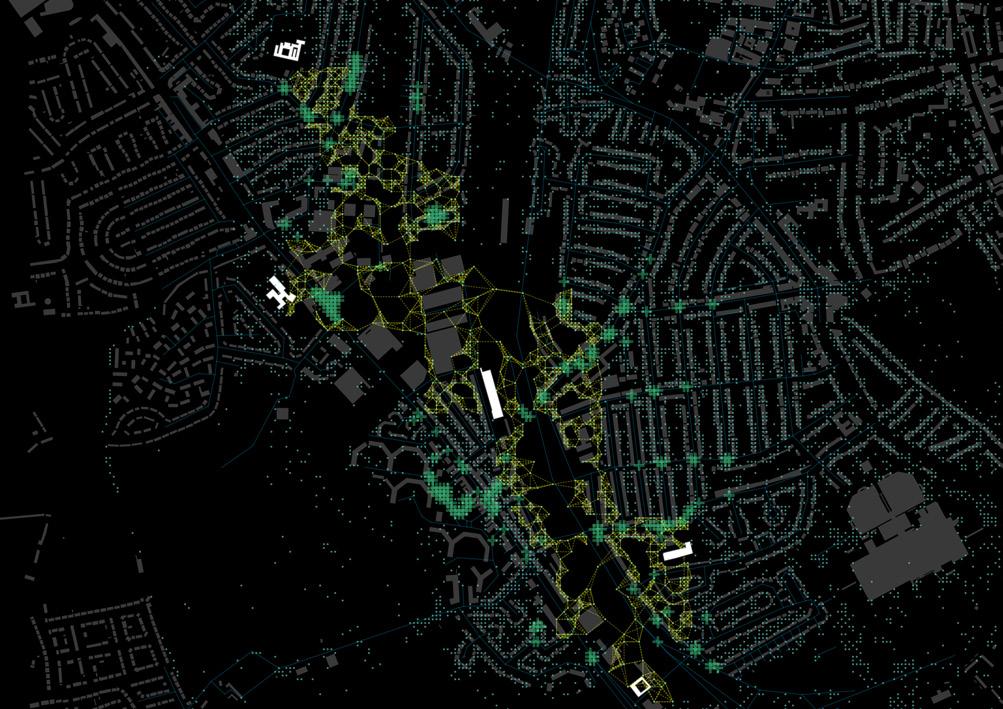
BAD HEALTH RATE
LONDON DEPRIVATION SCORE
0-15 AGE LACK OF CHILDREN COUNT
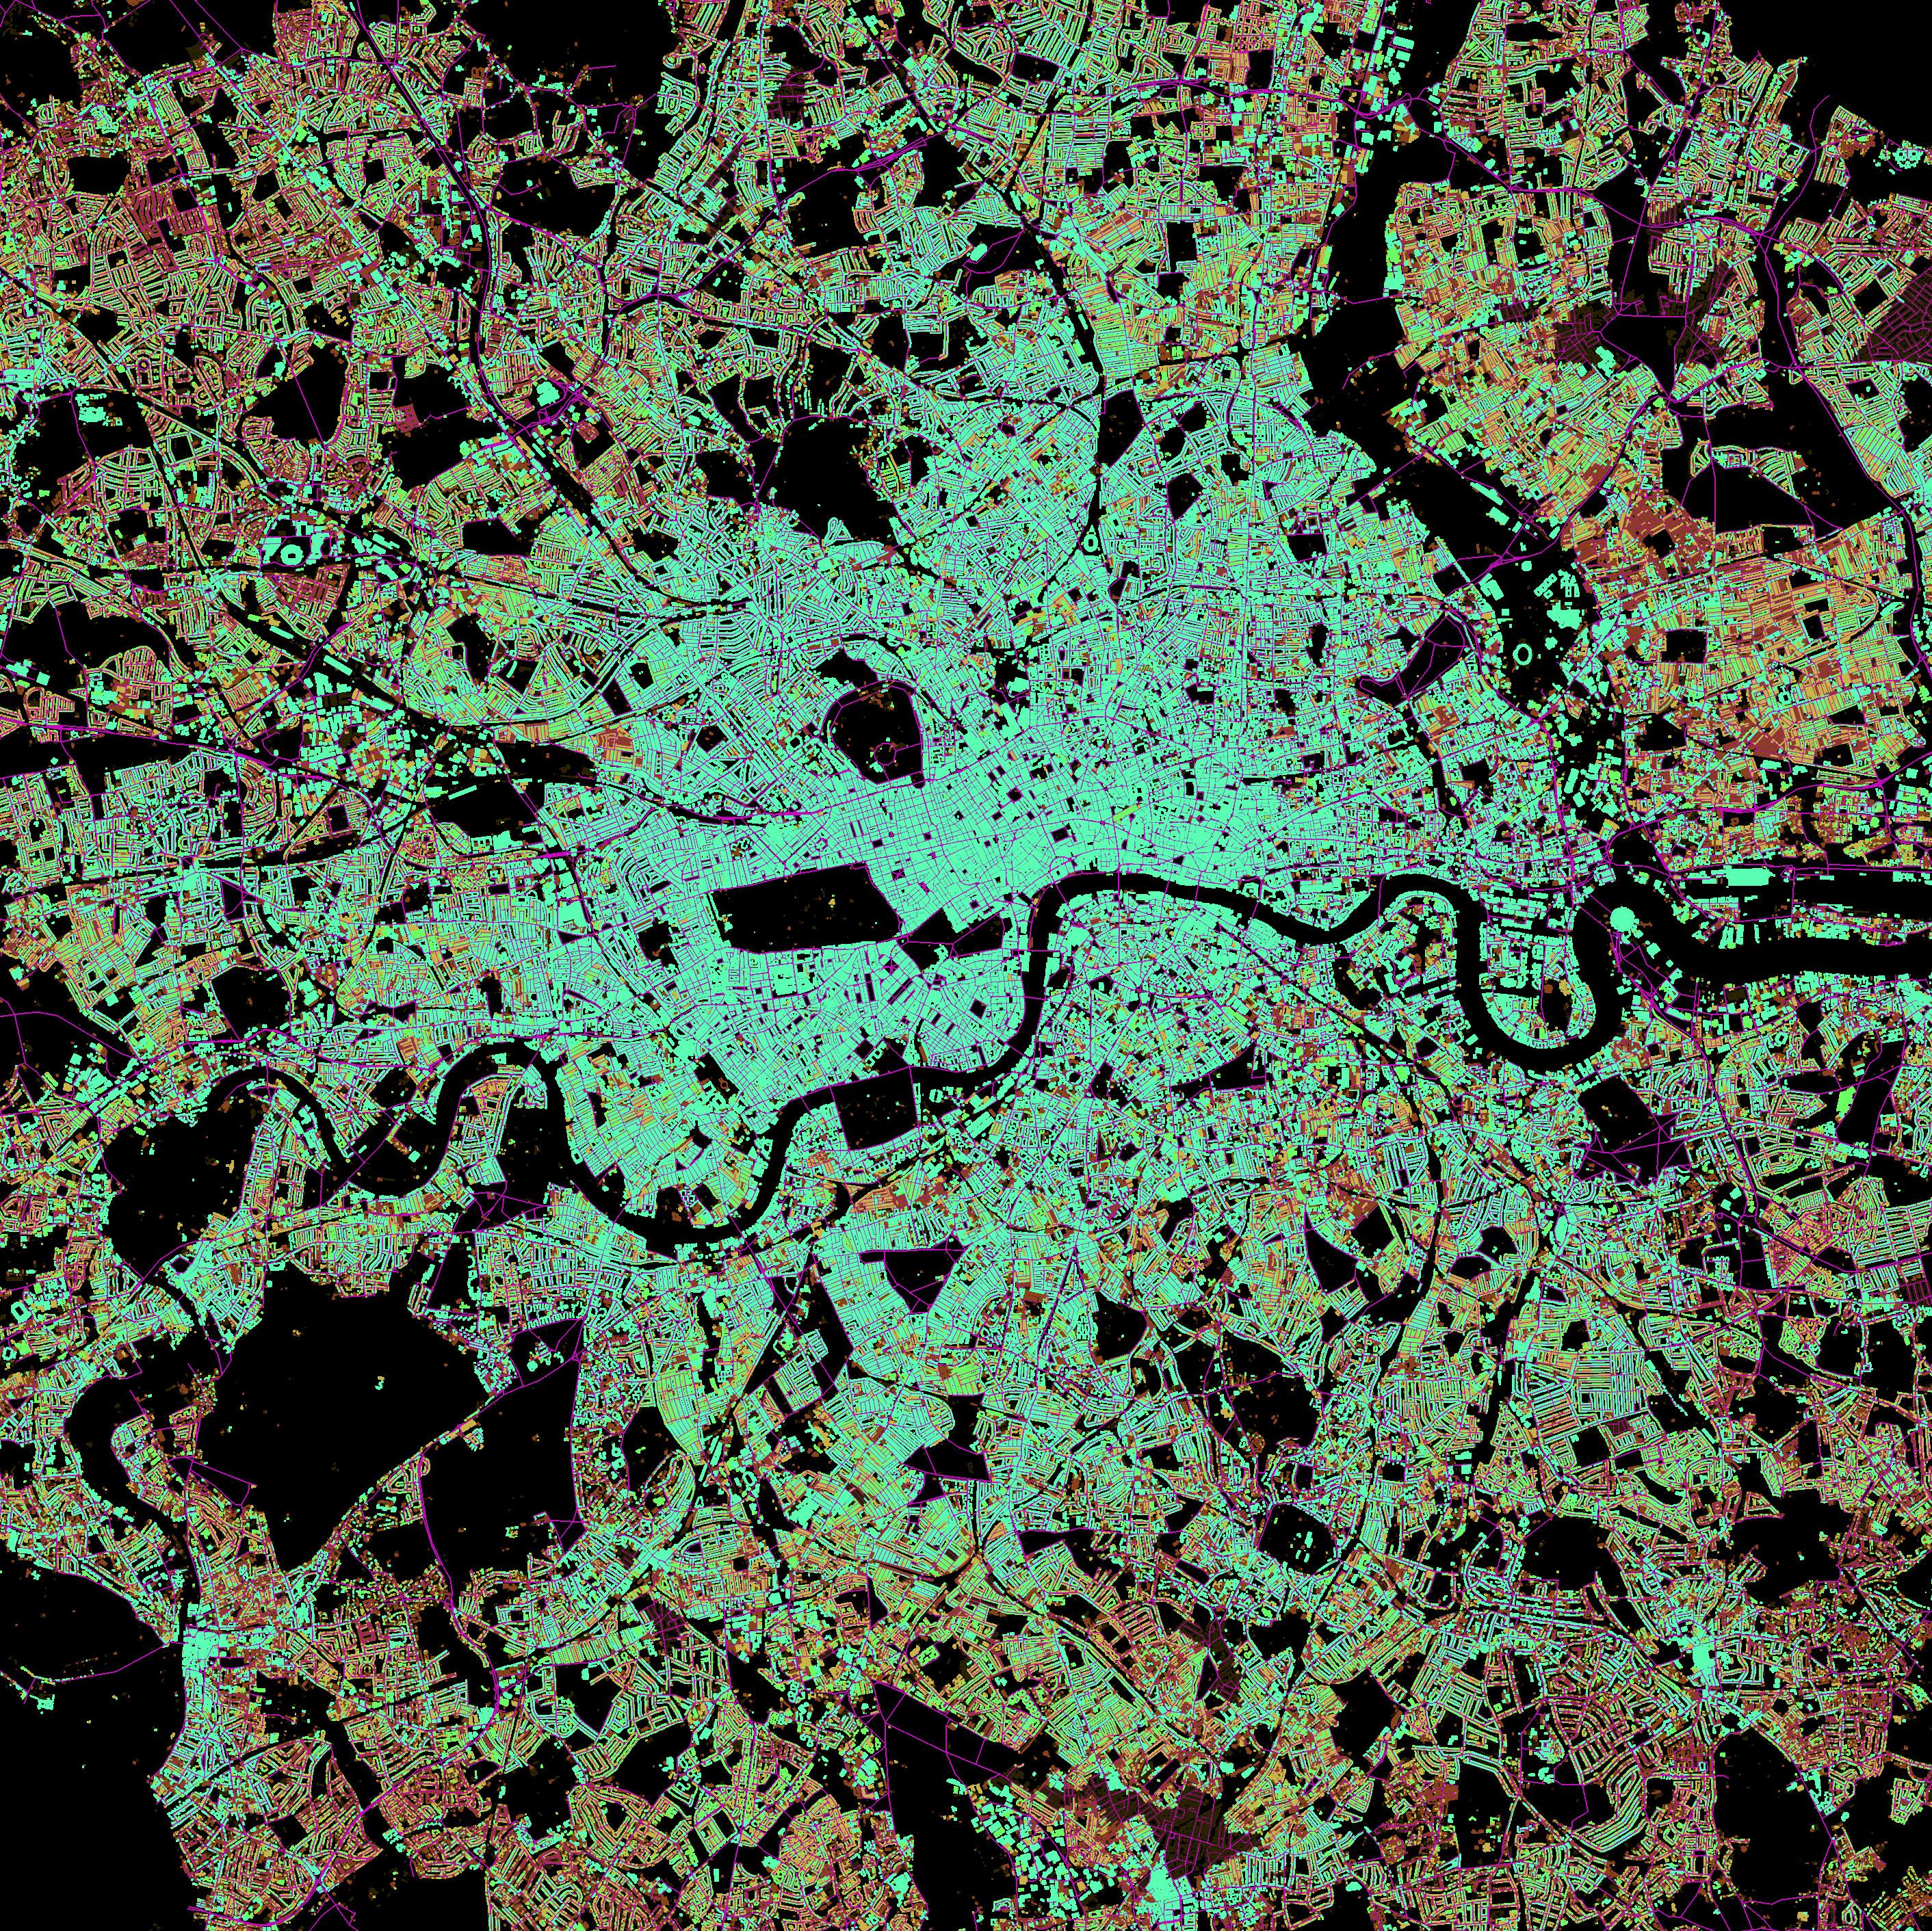
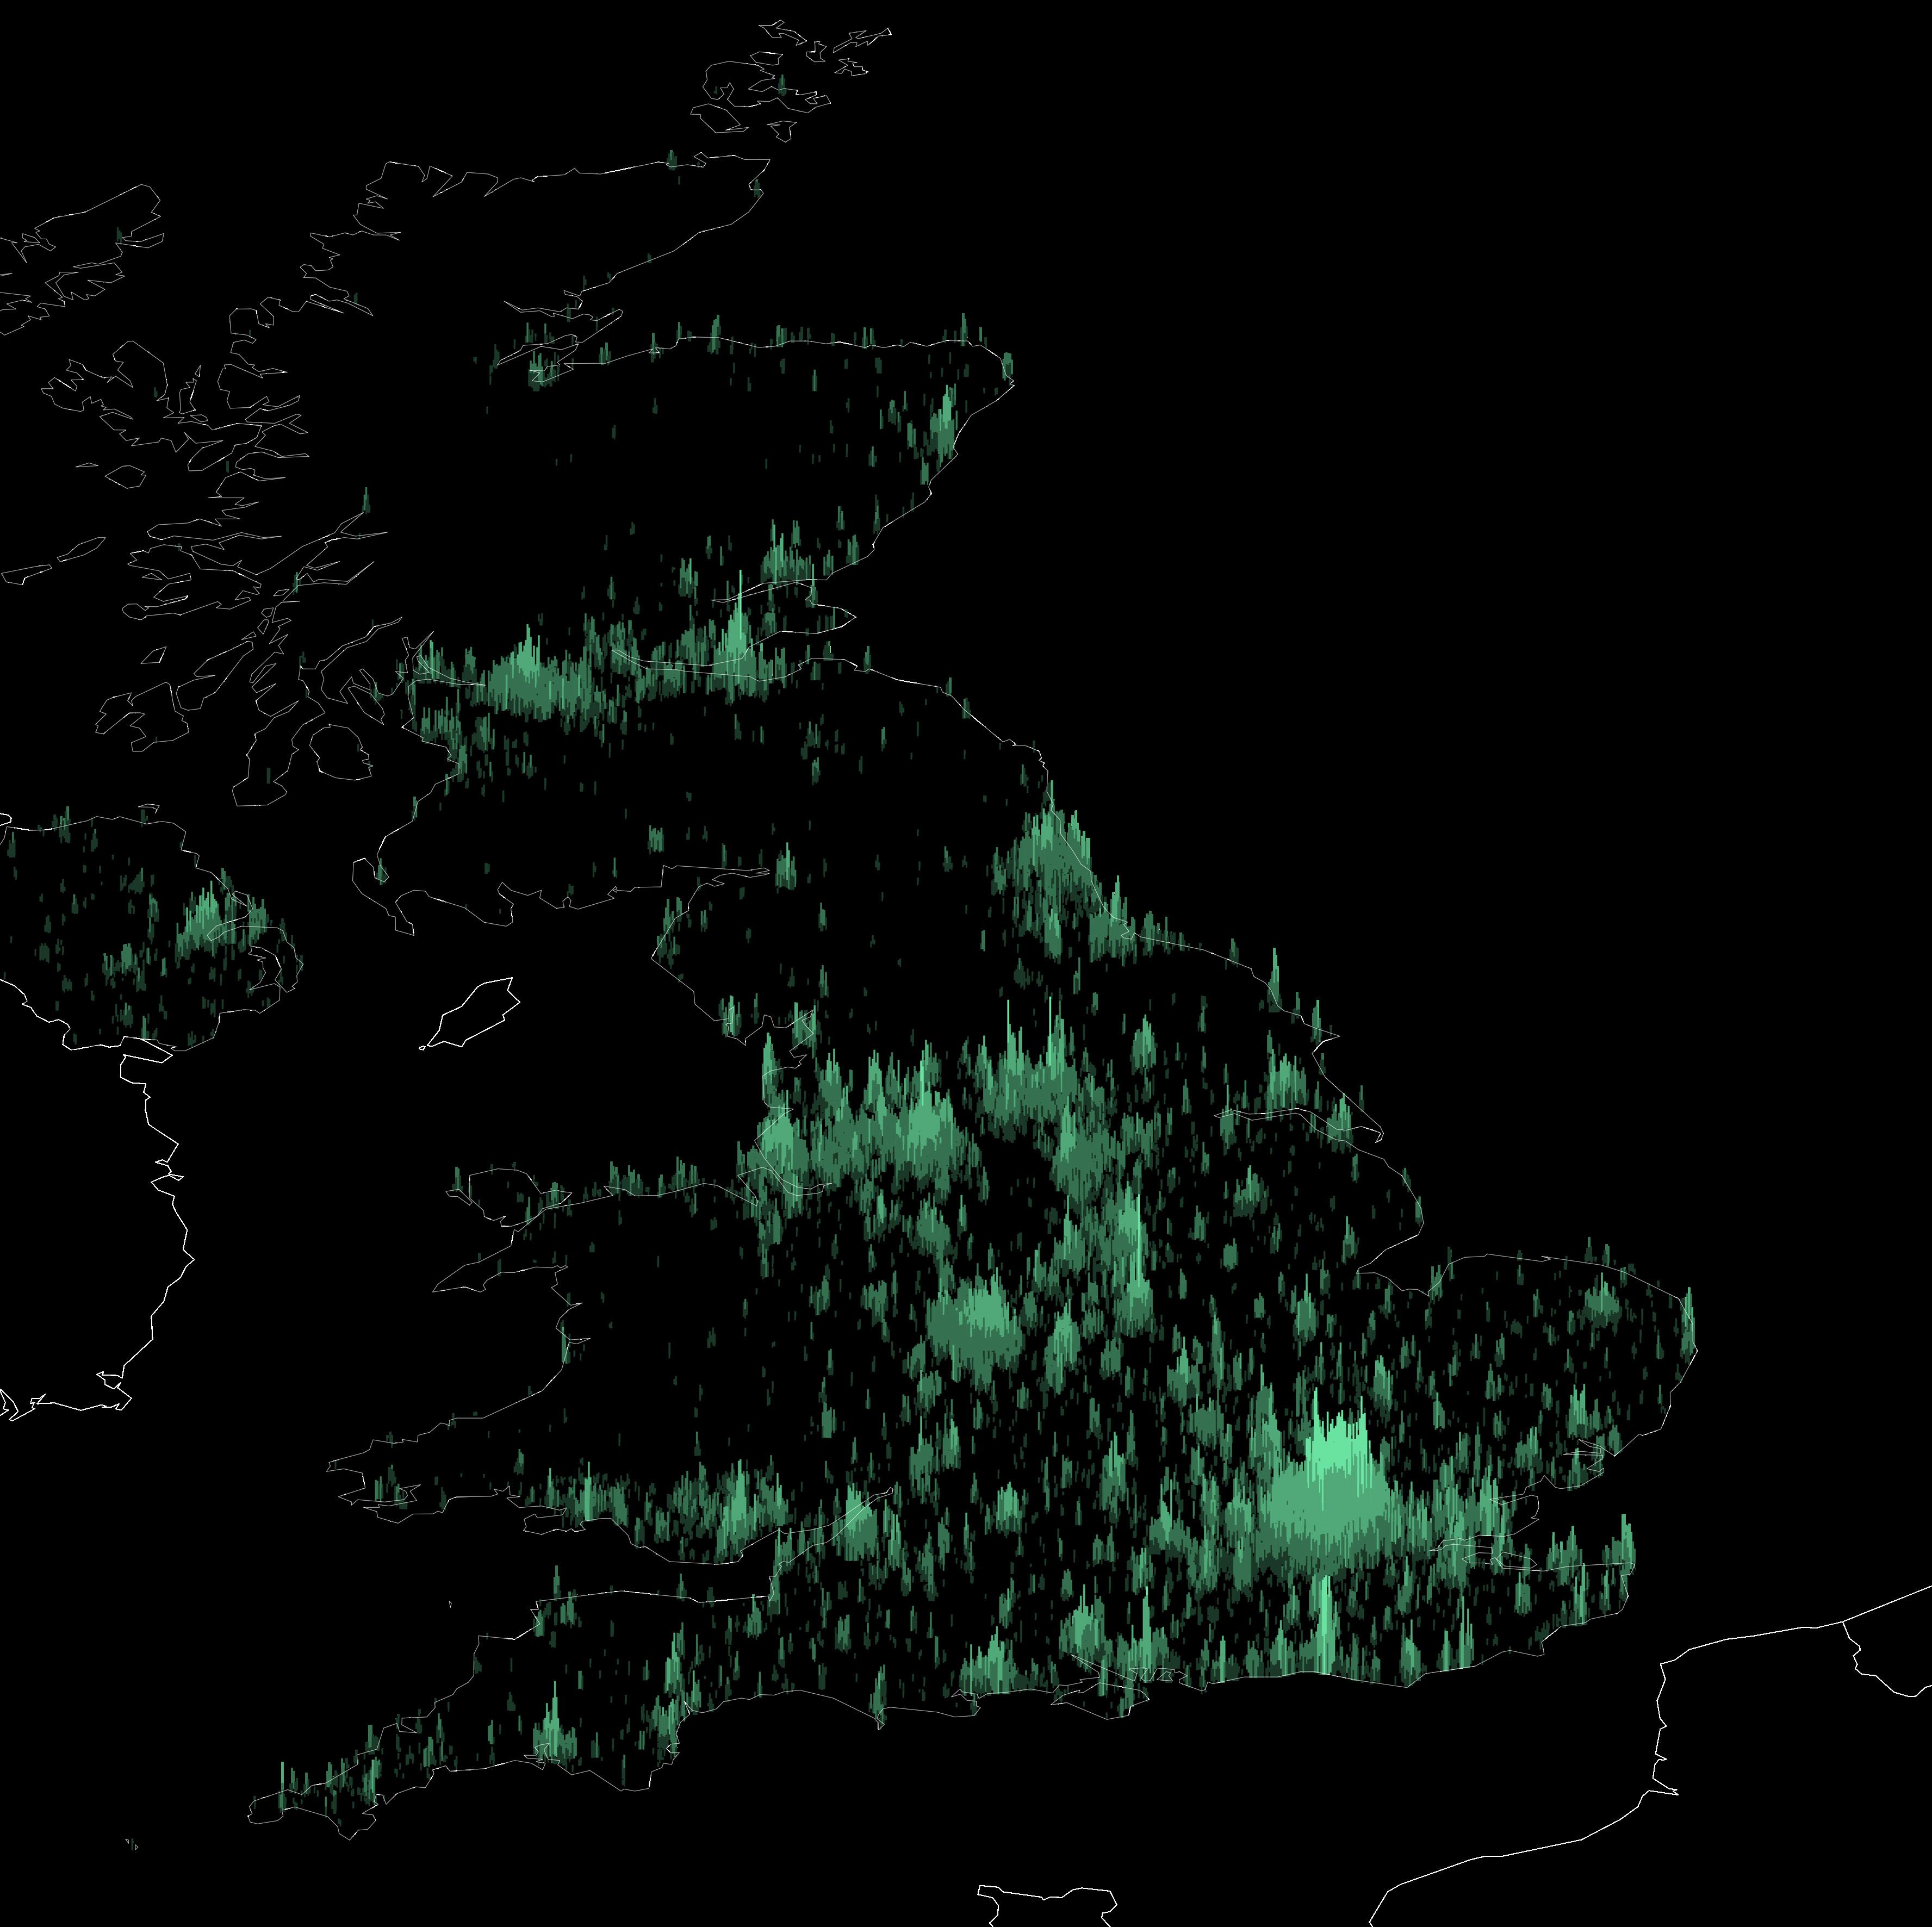
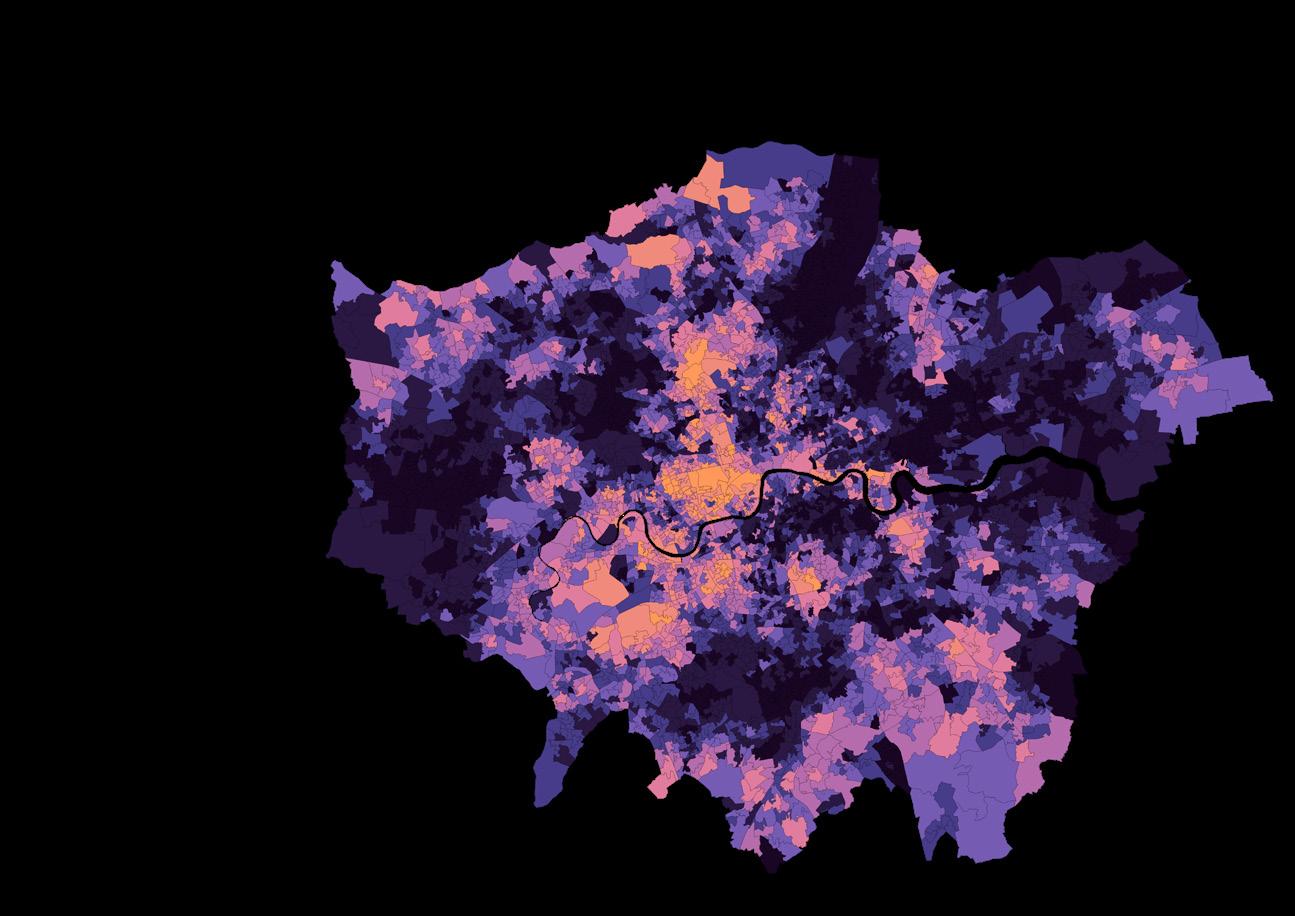
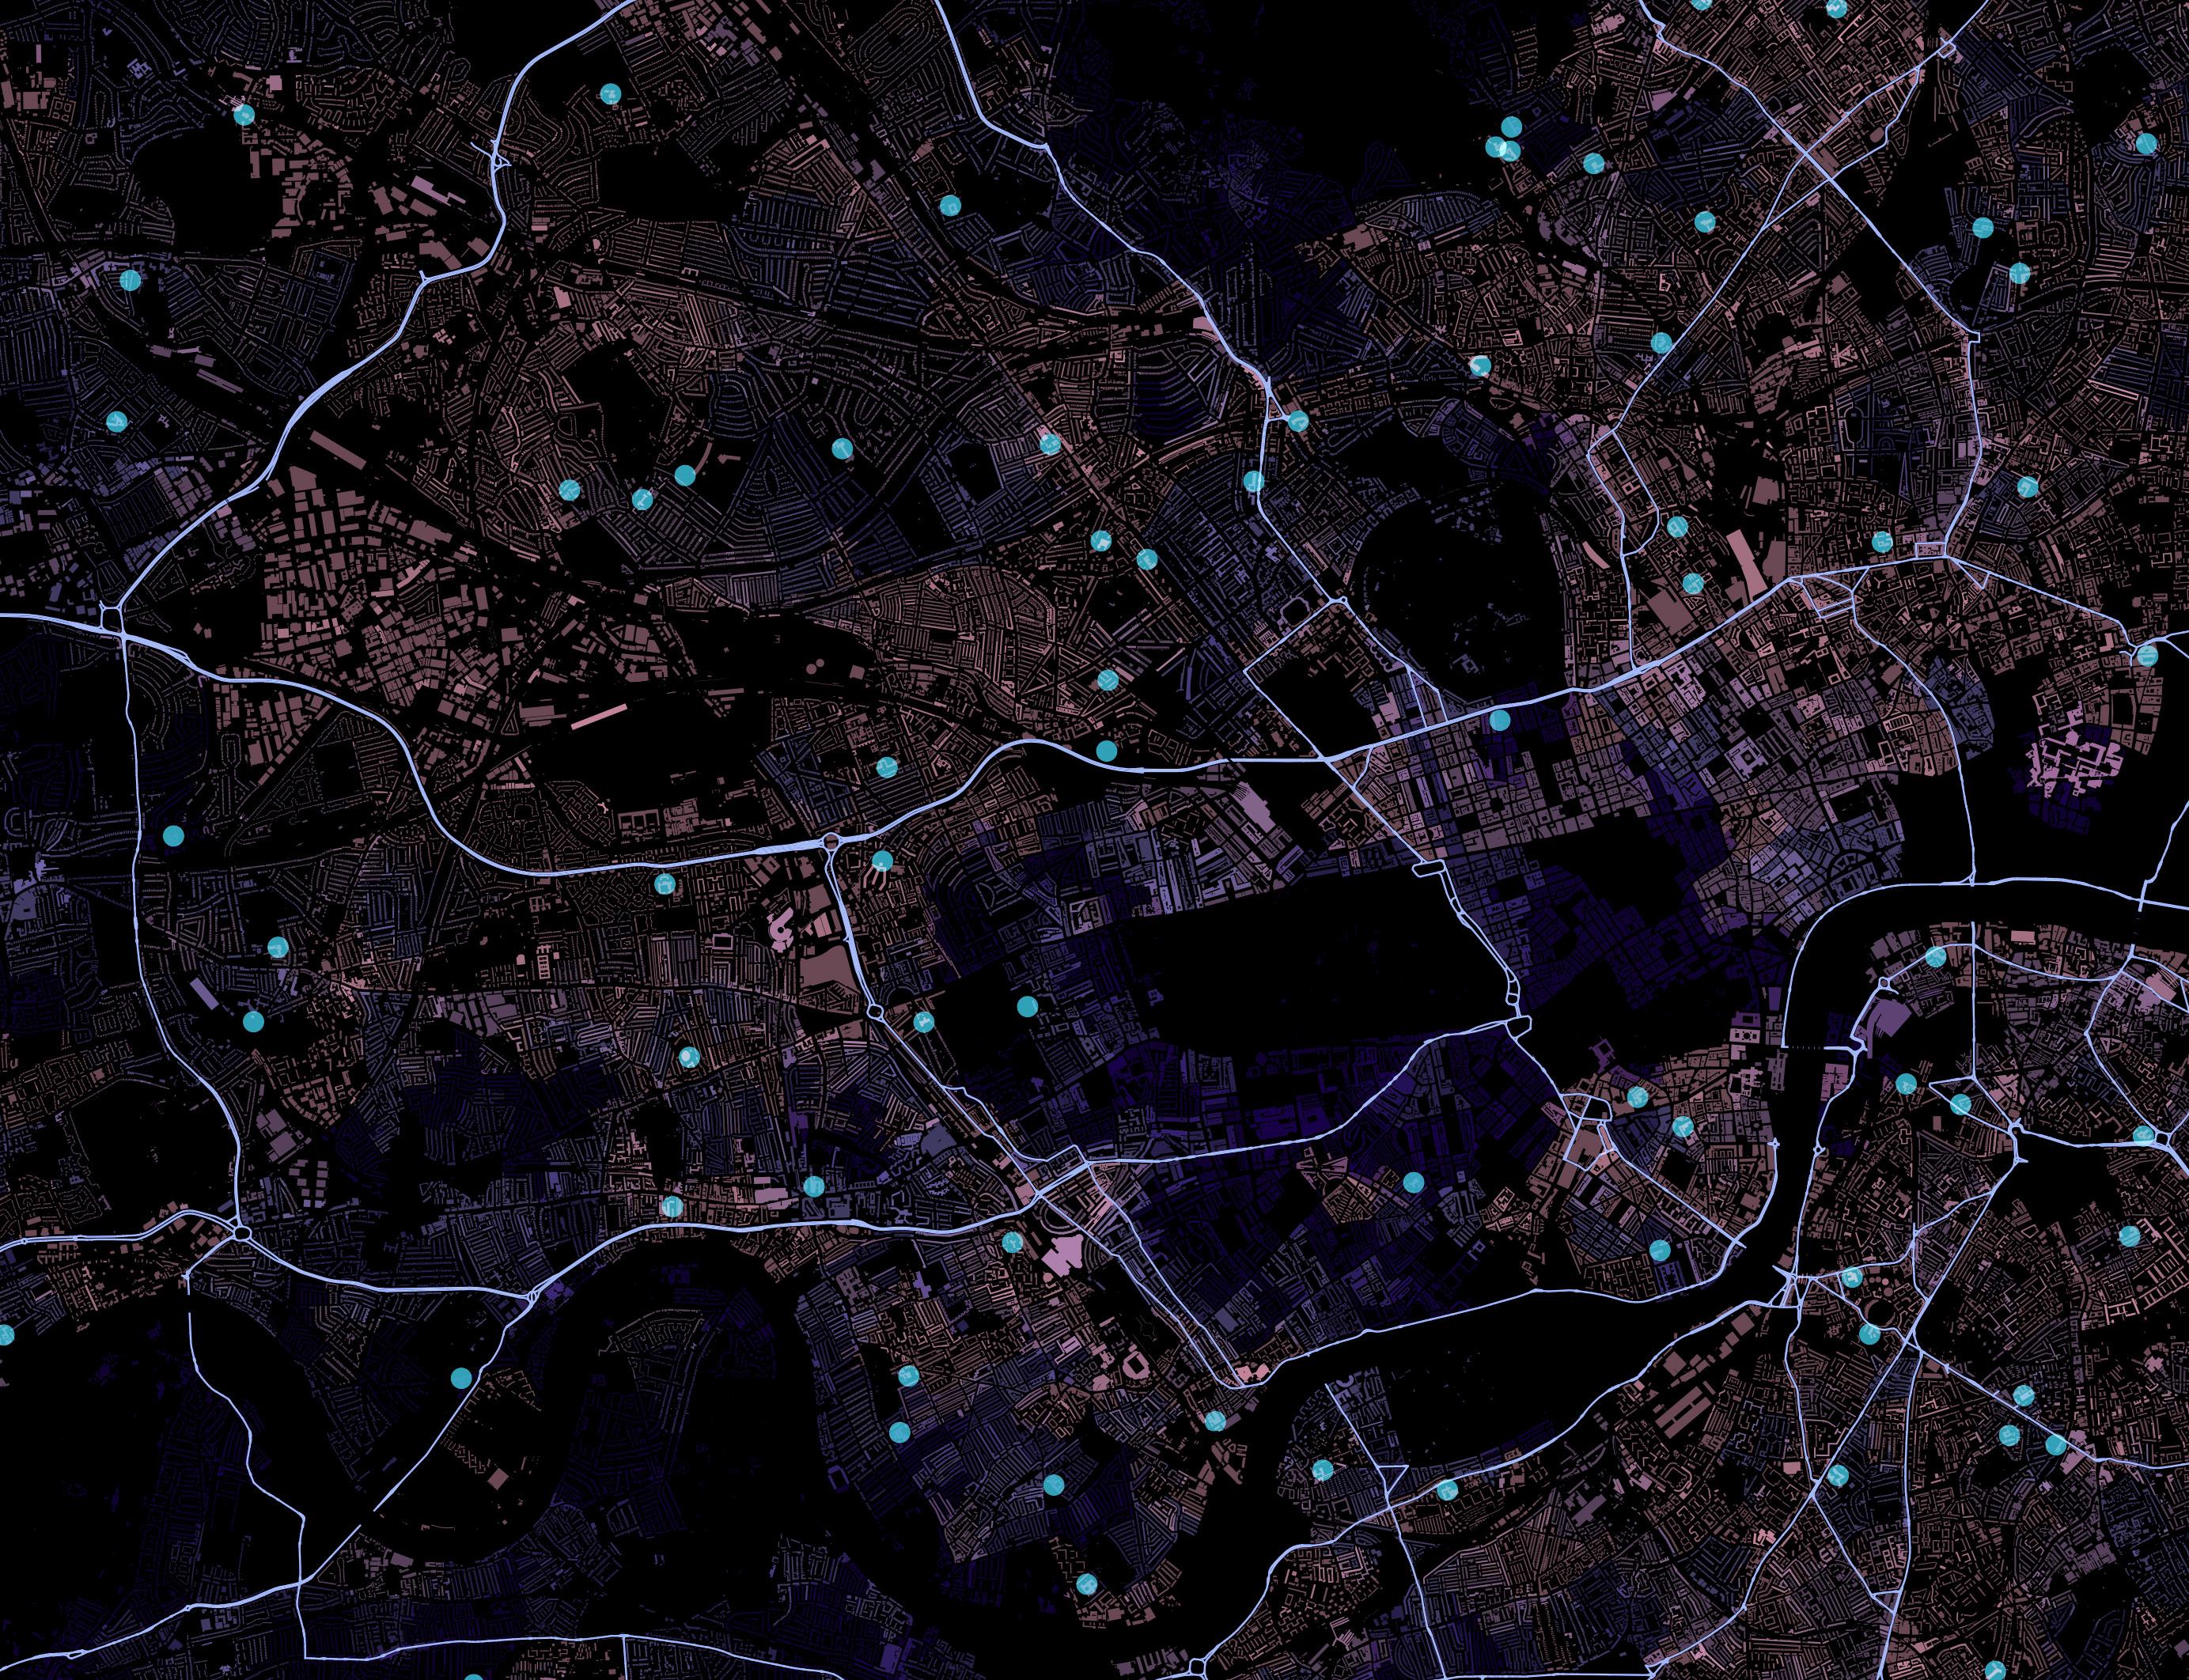
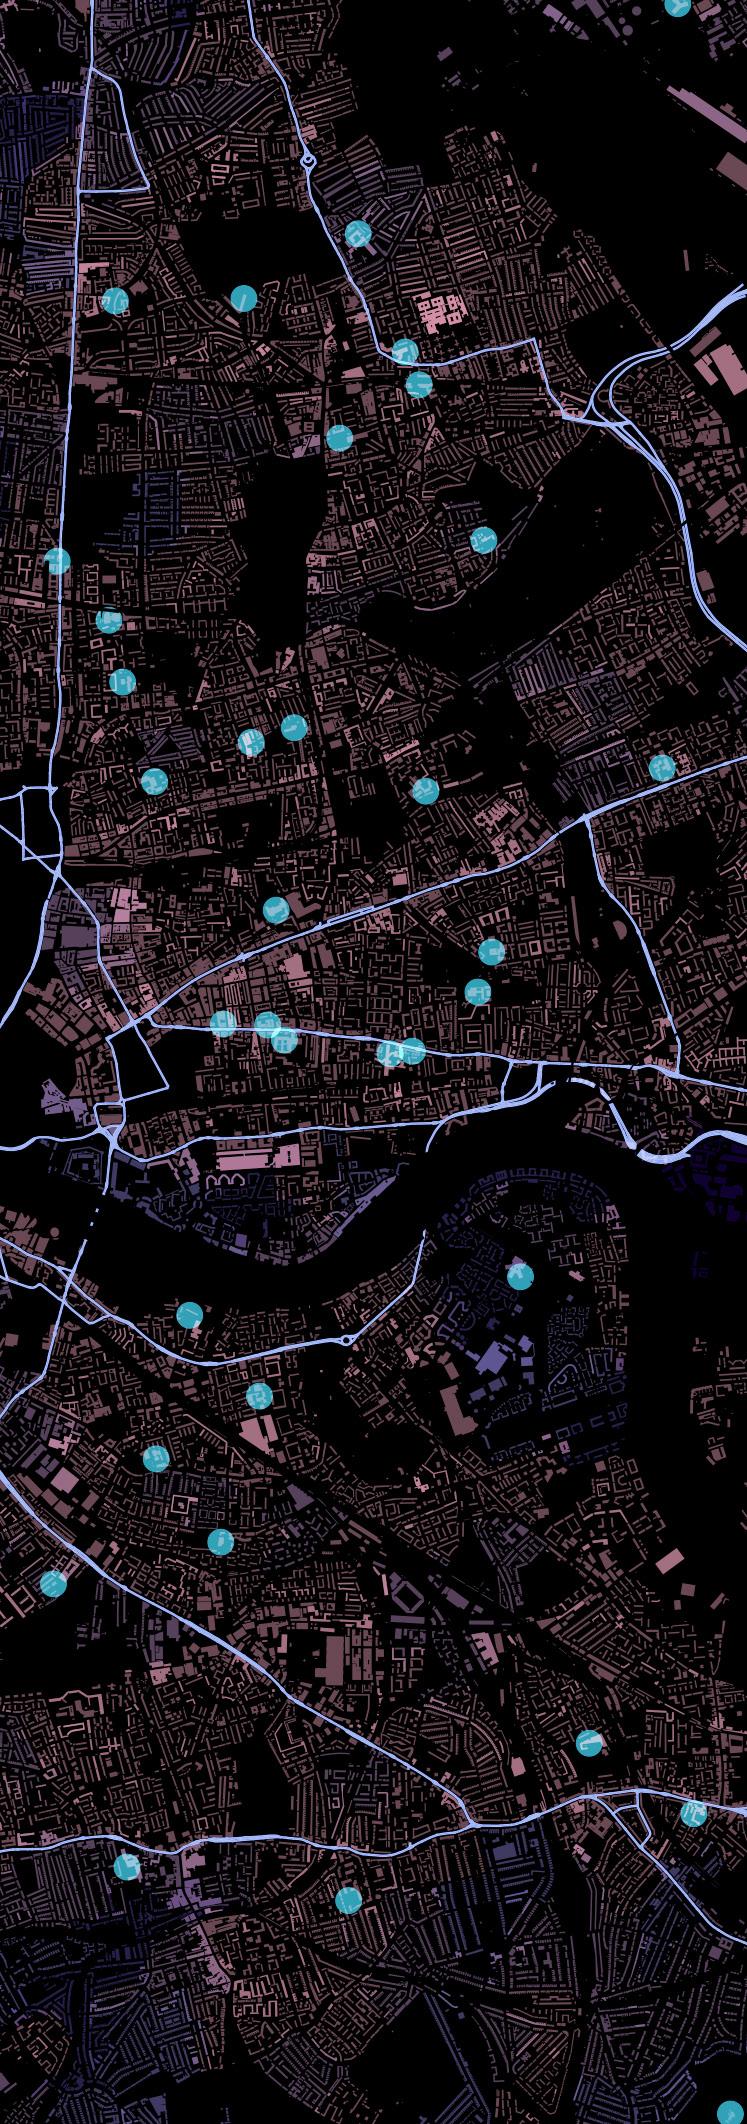
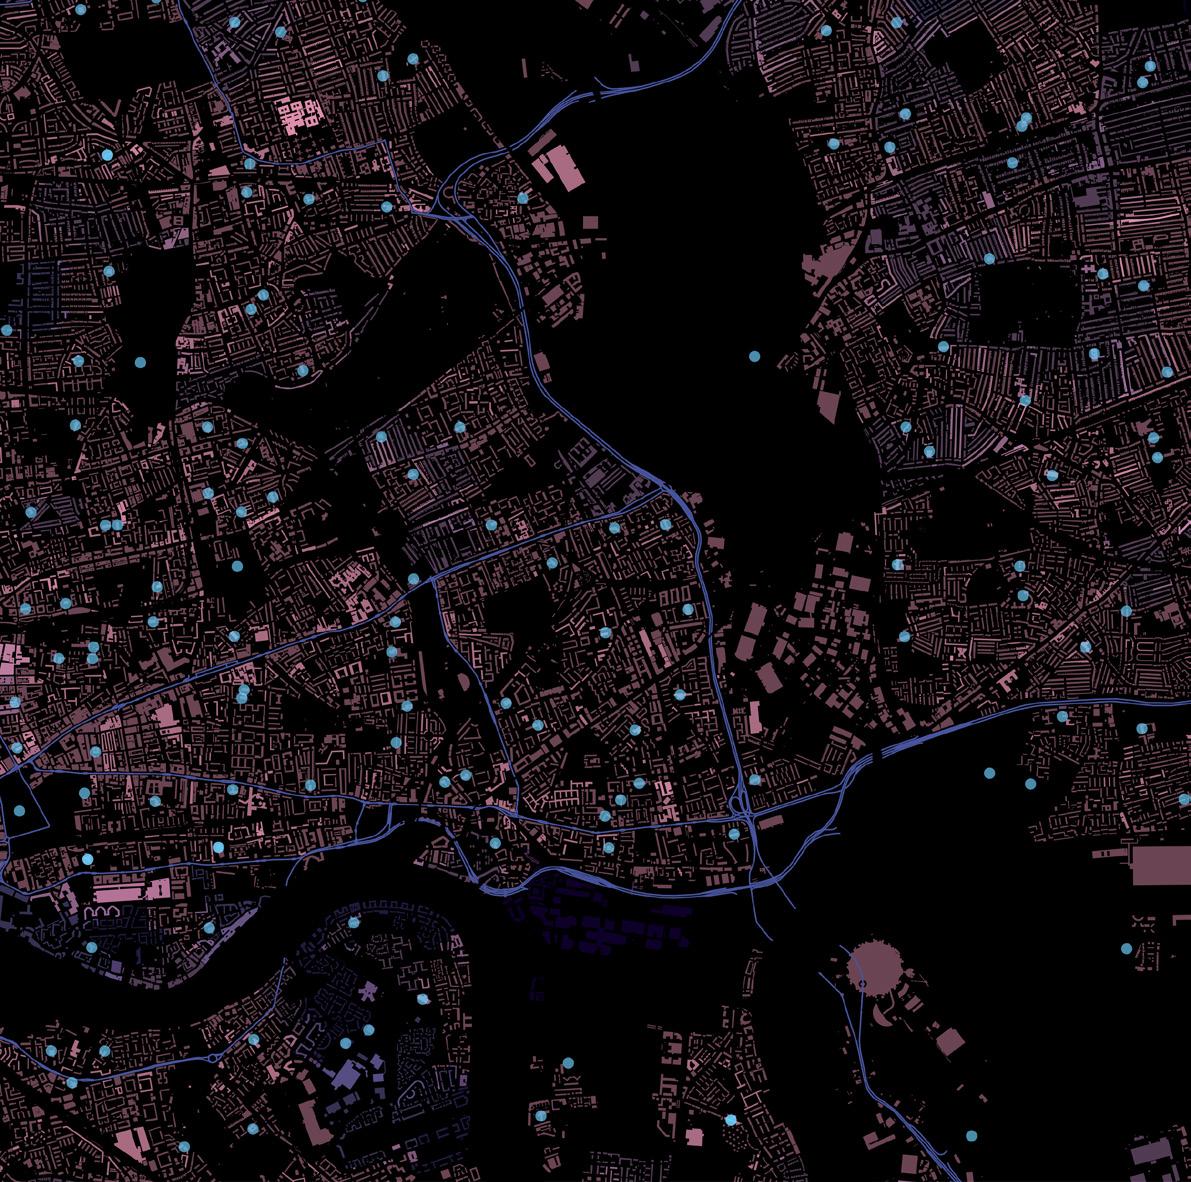
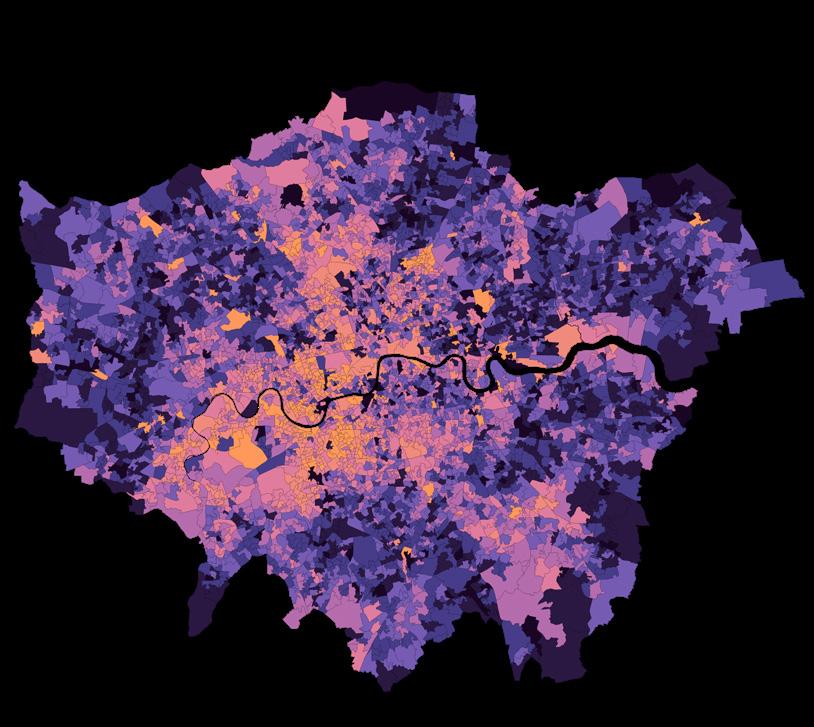
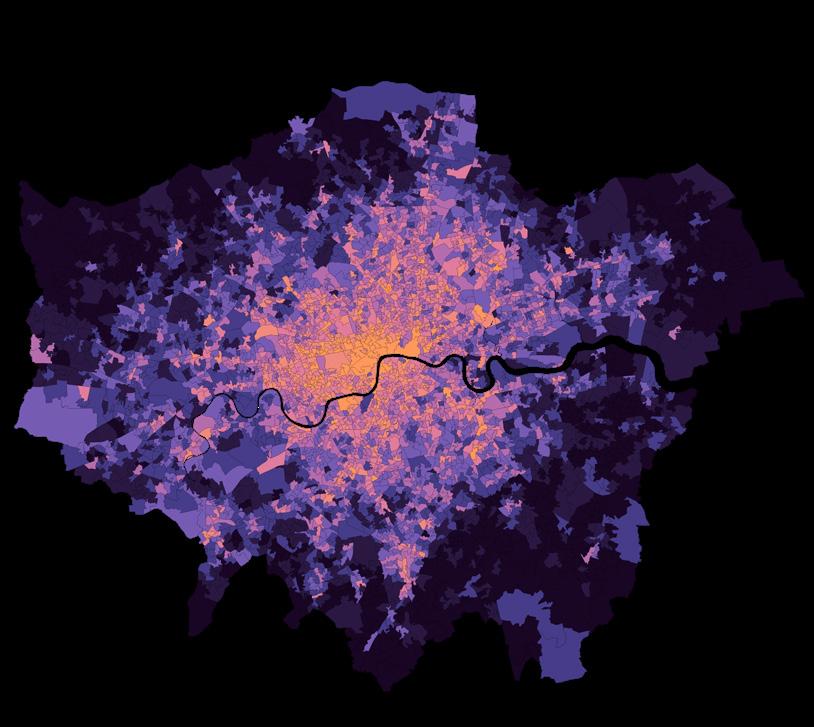
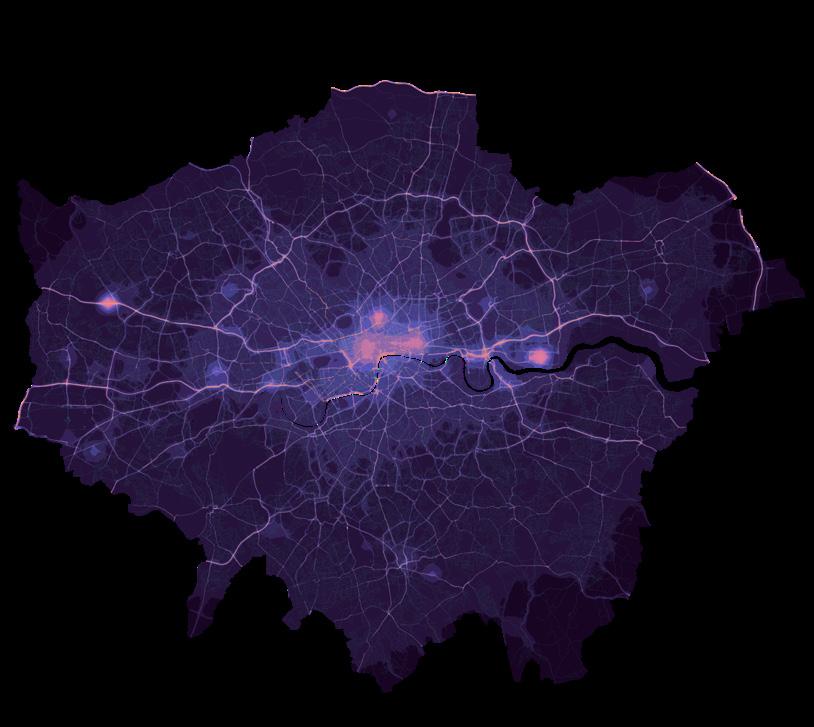
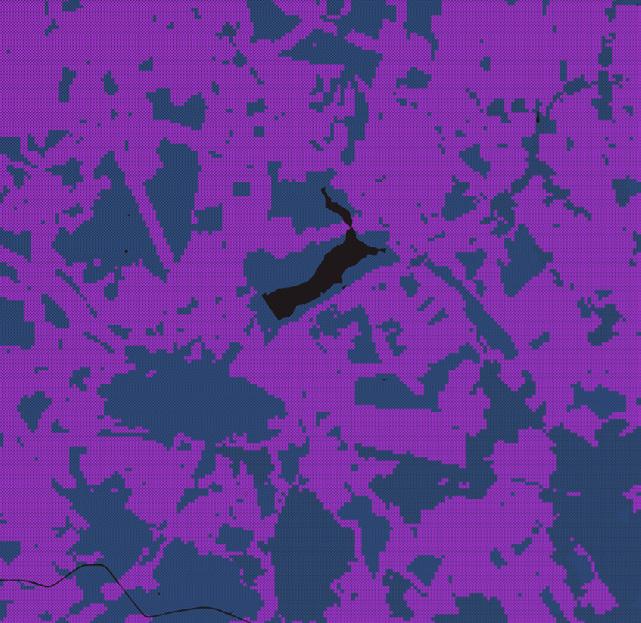
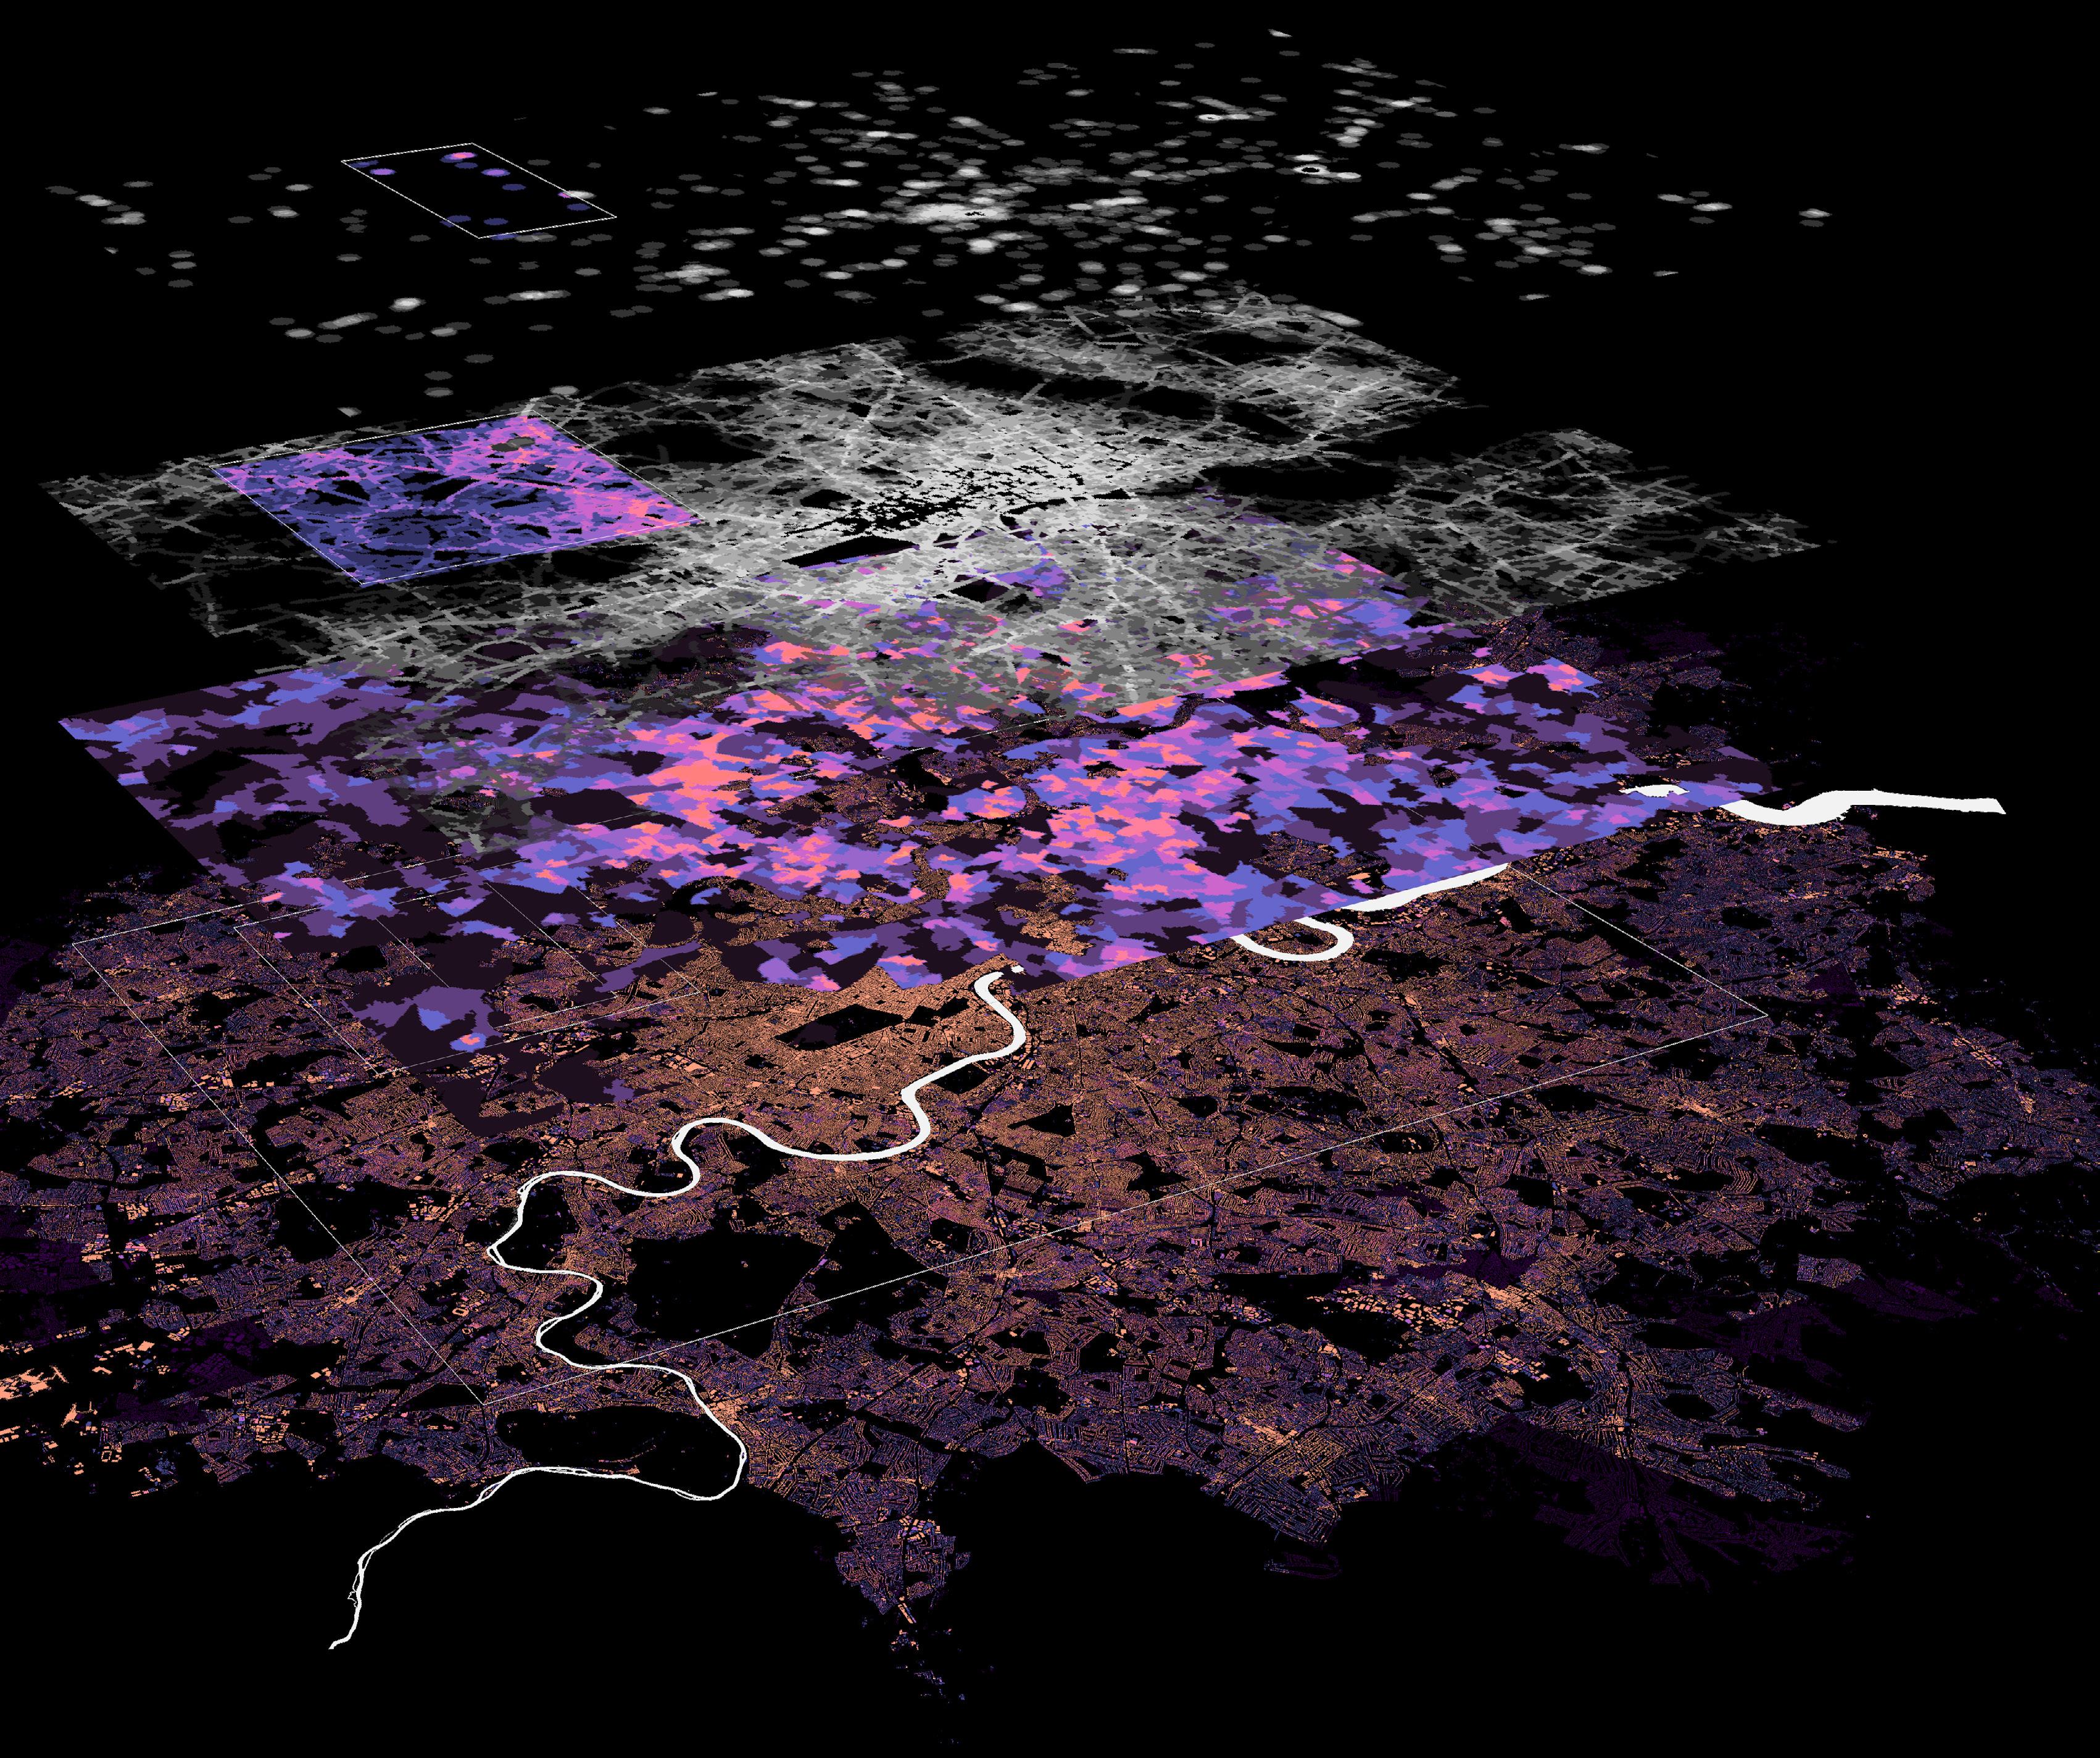
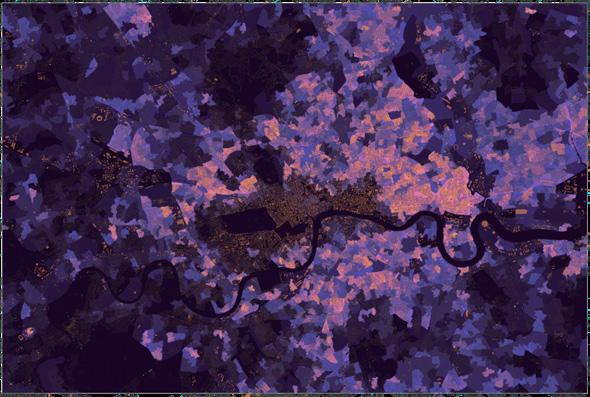
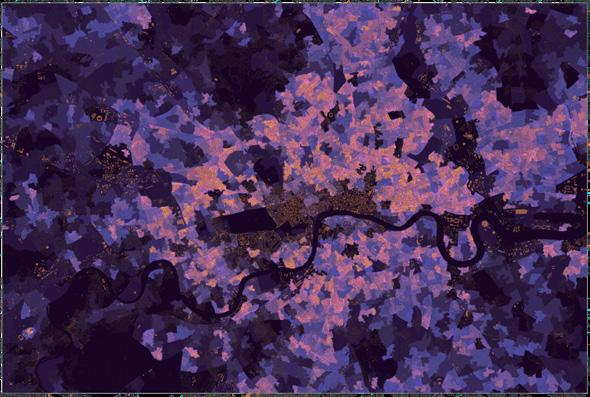
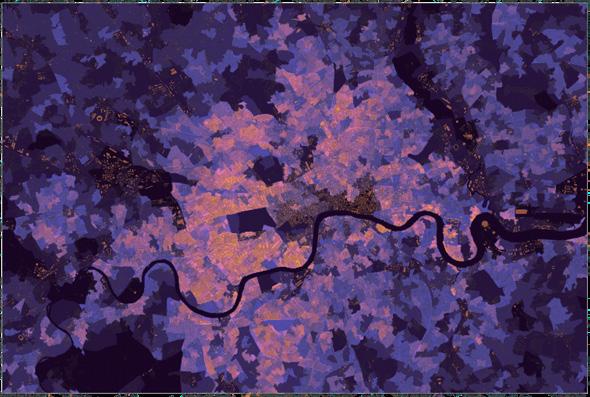
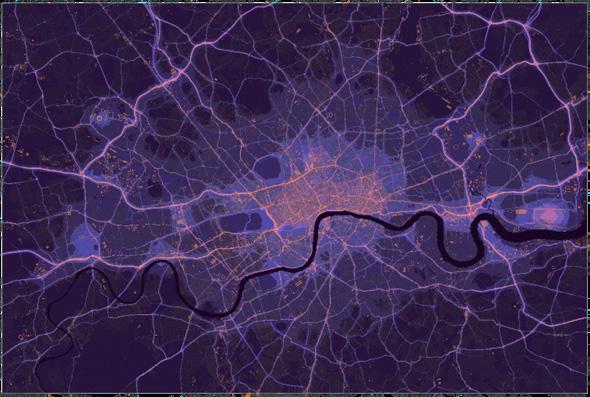
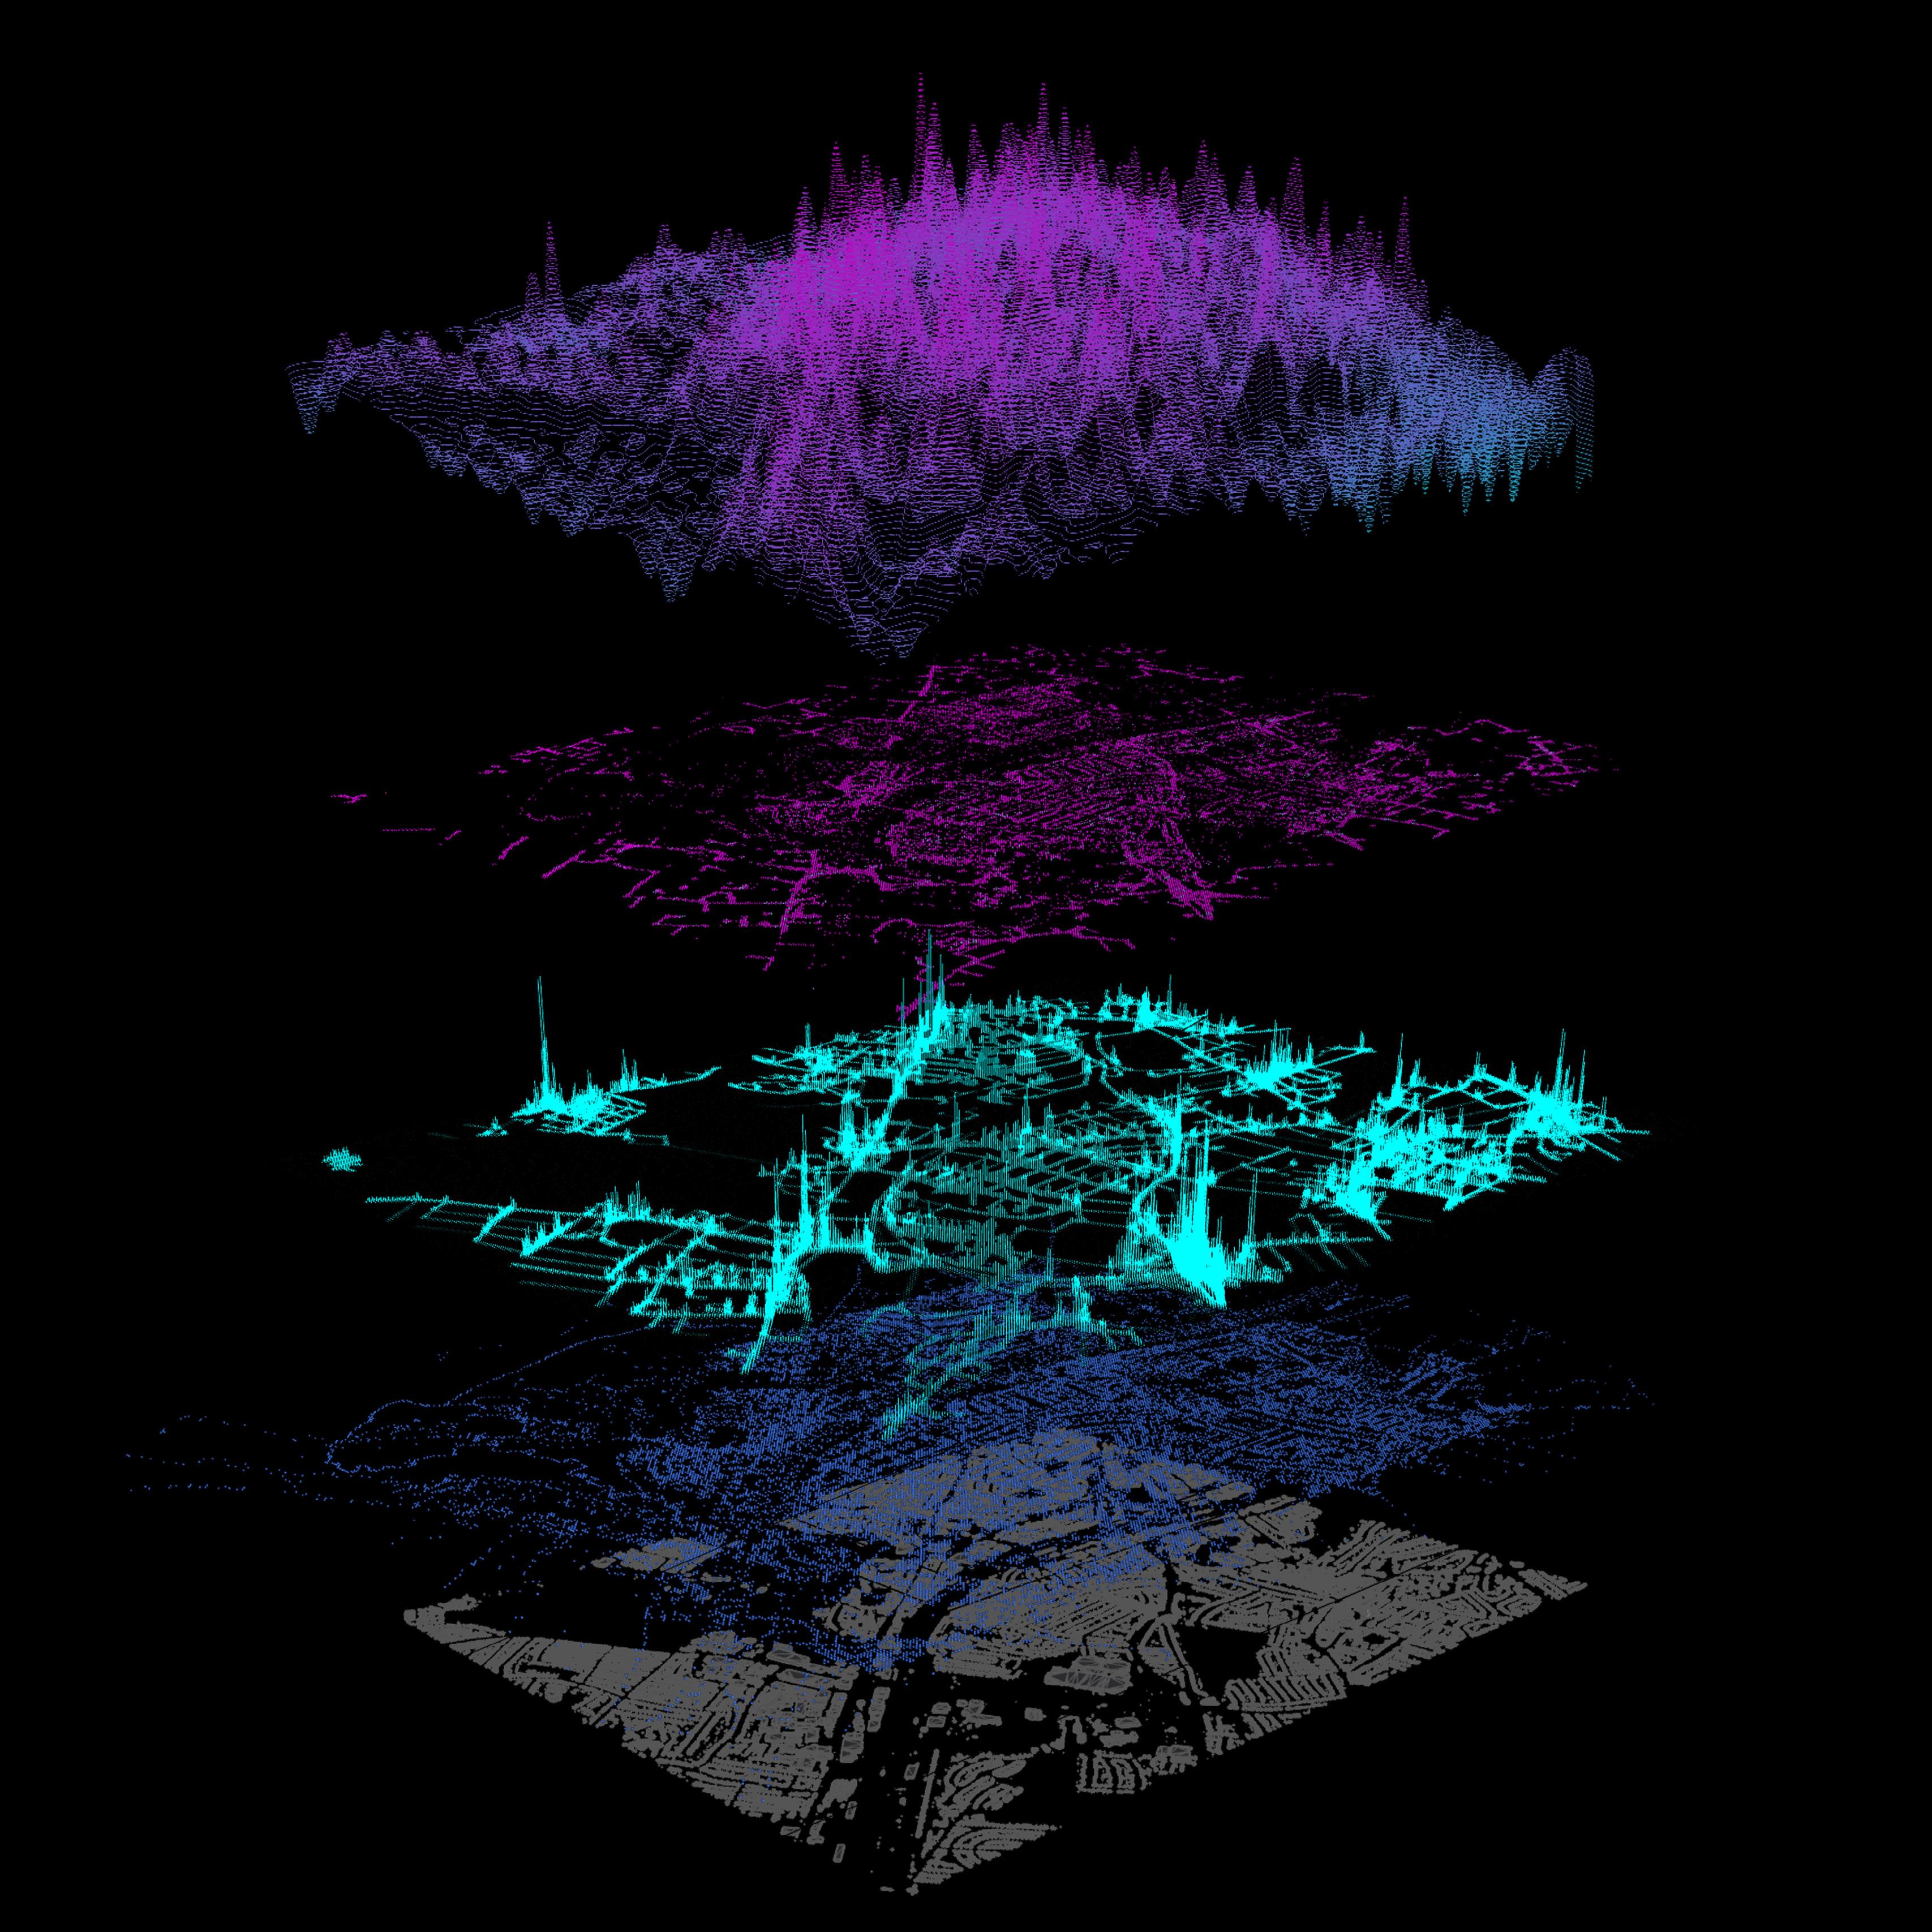
Great Britain-Scale Analysis: CHILD POPULATION
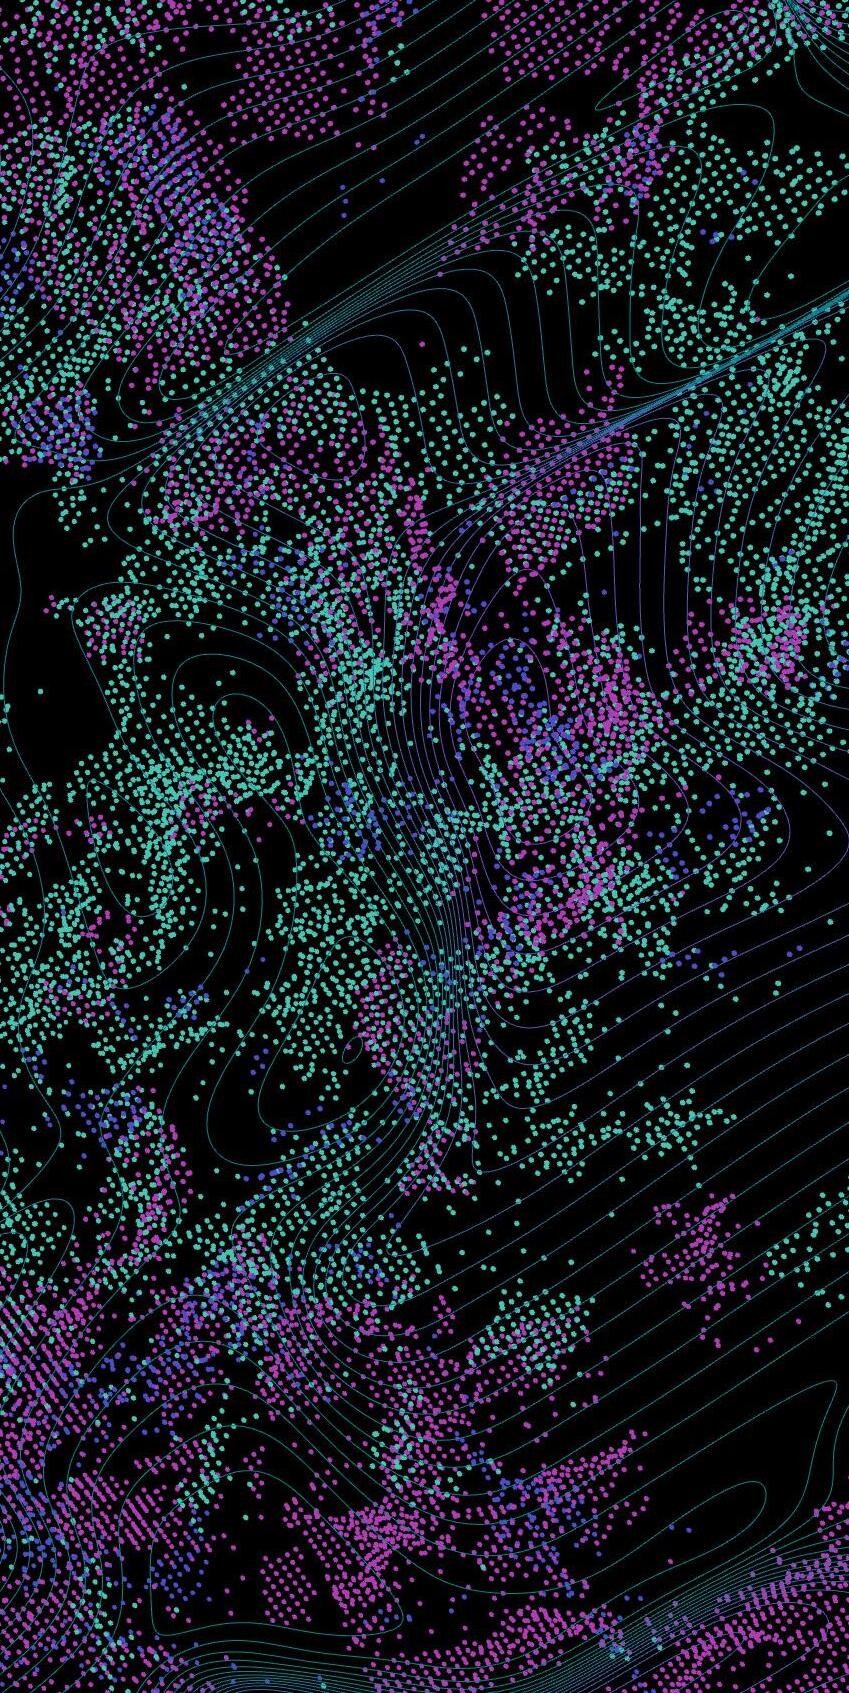
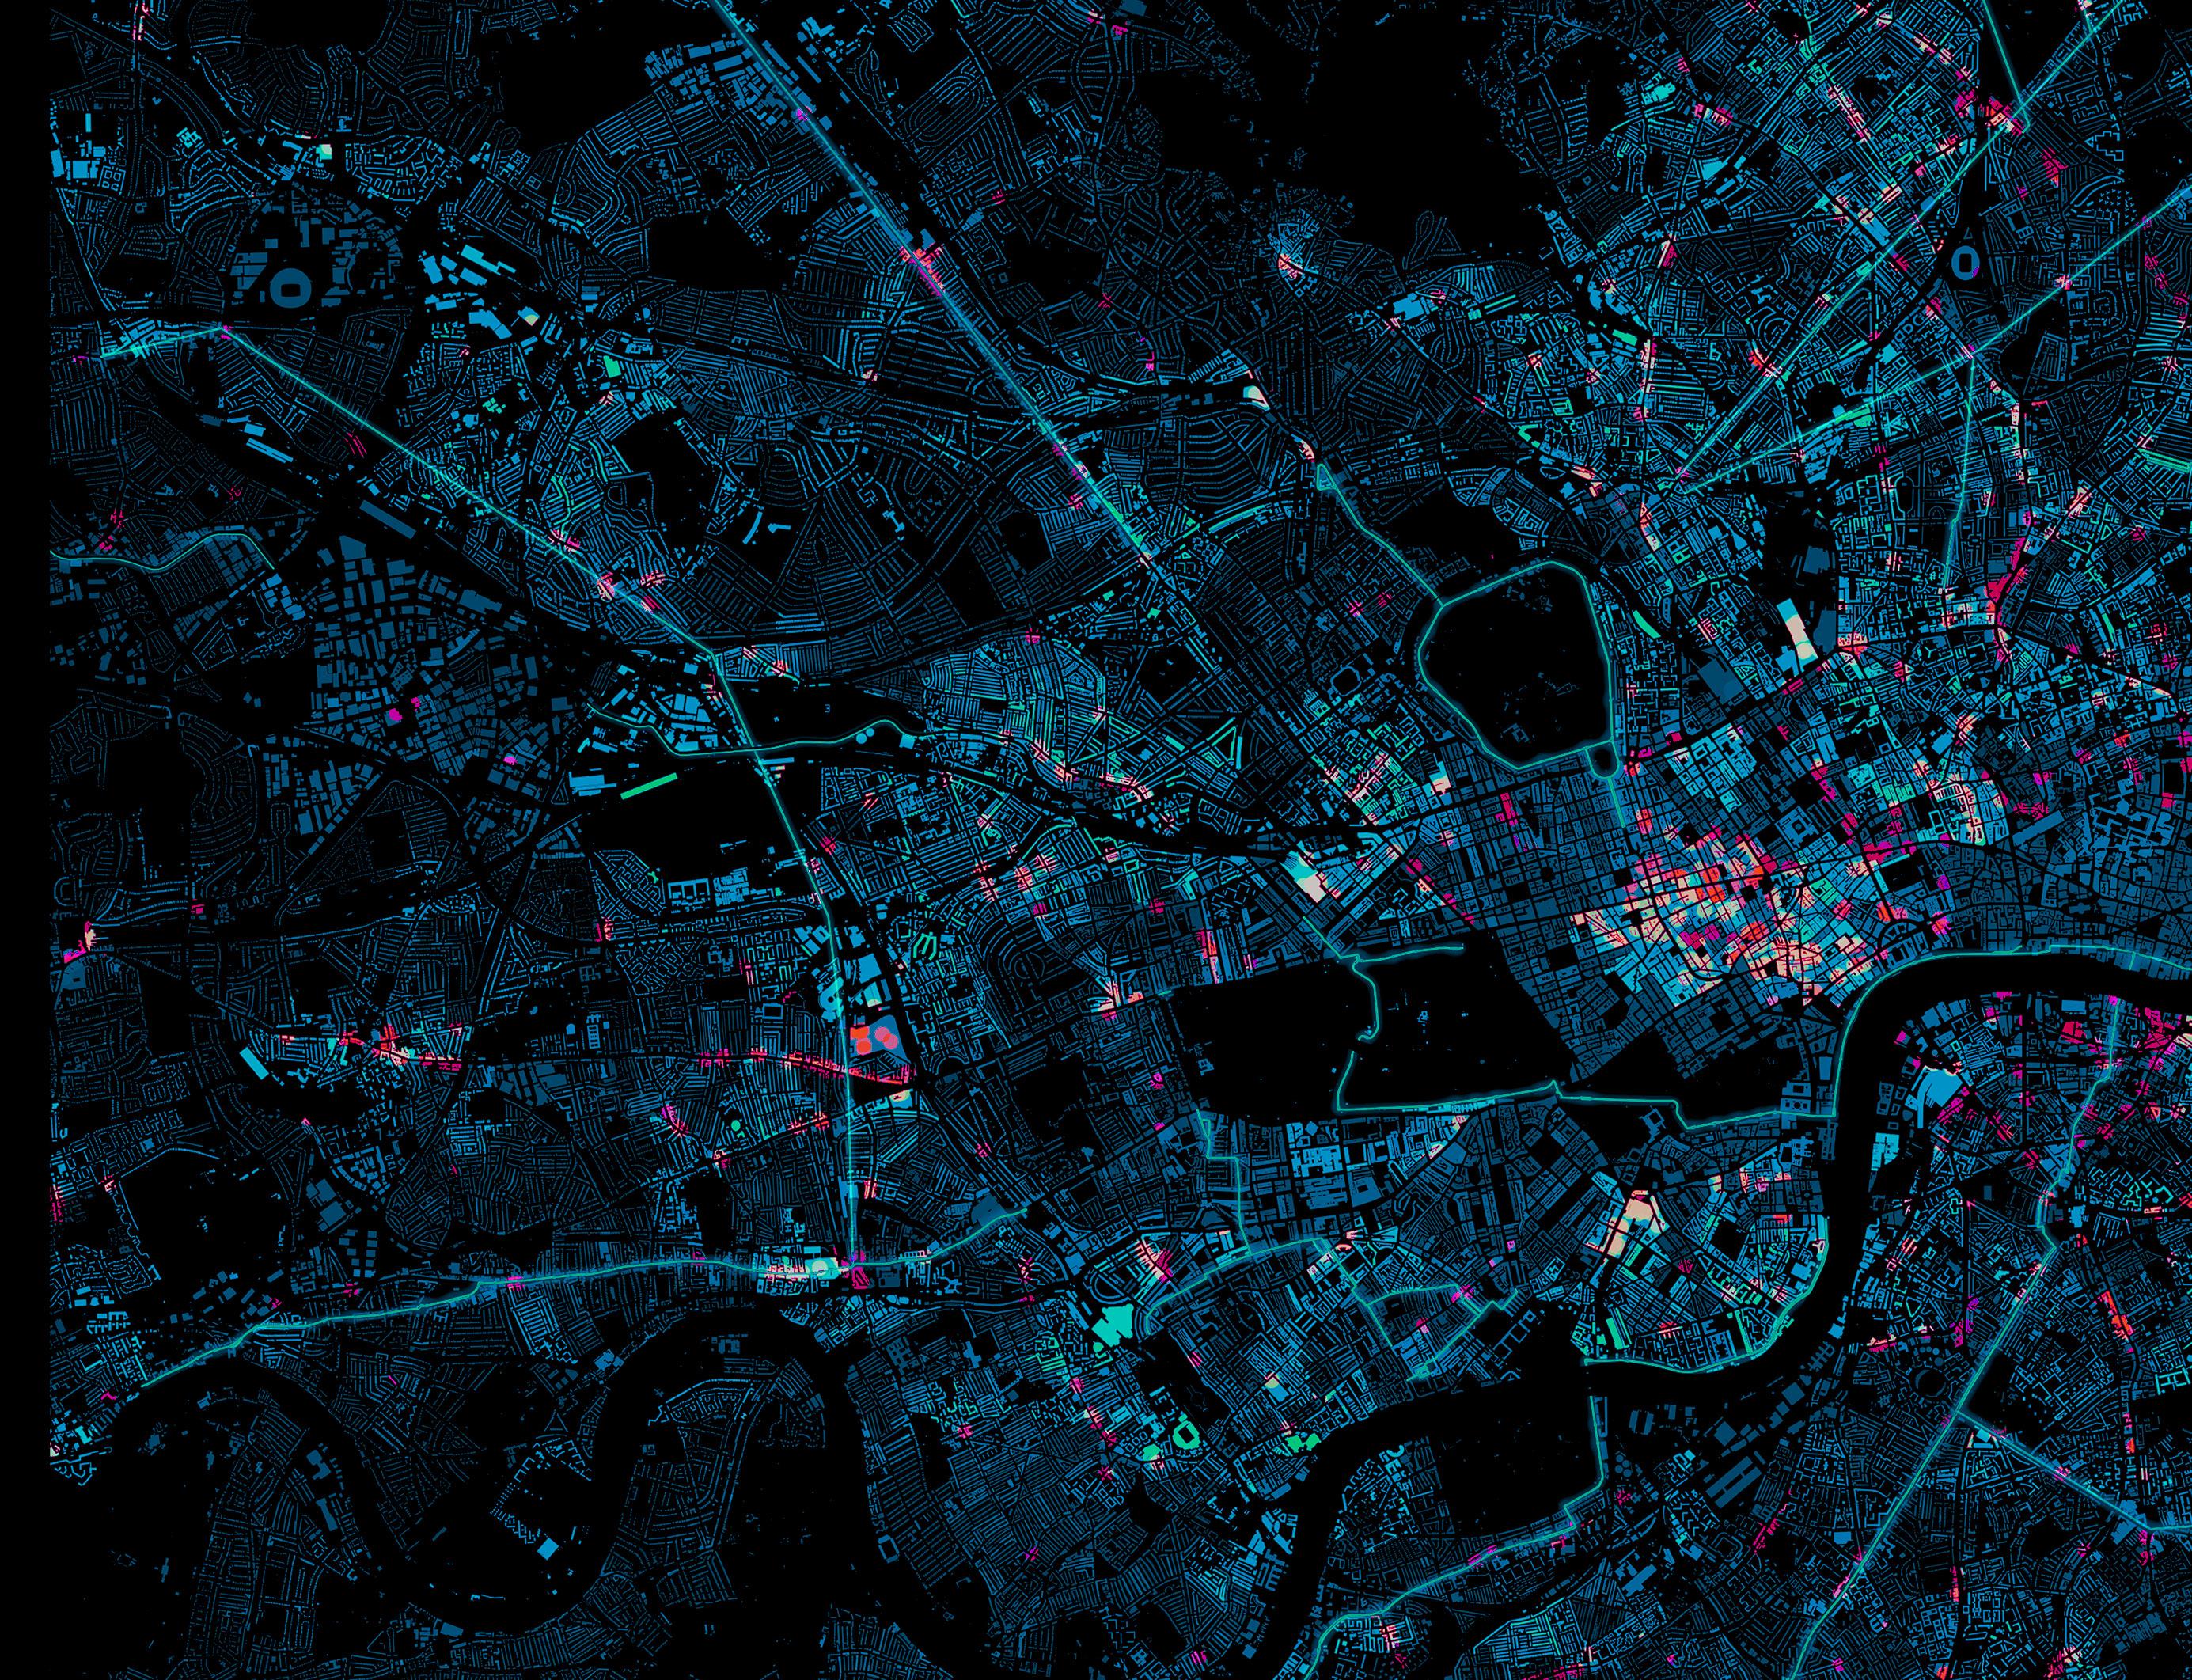
In order to grasp the severity and signififcance of the effects these factors have on children, it is important to understand the magnitude of the children affected here. Looking at the population of children in the UK aged between 0-15 years, it is safe to say that London has the highest concentration, and therefore the most kids affected in terms of their development and education. The graphic below highlights the distribution and population count of children in London.
London Child Population 0-15
GLASGOW - 140,000
MANCHESTER - 120,000
BIRMINGHAM - 347,000
LONDON - 1.7MIL
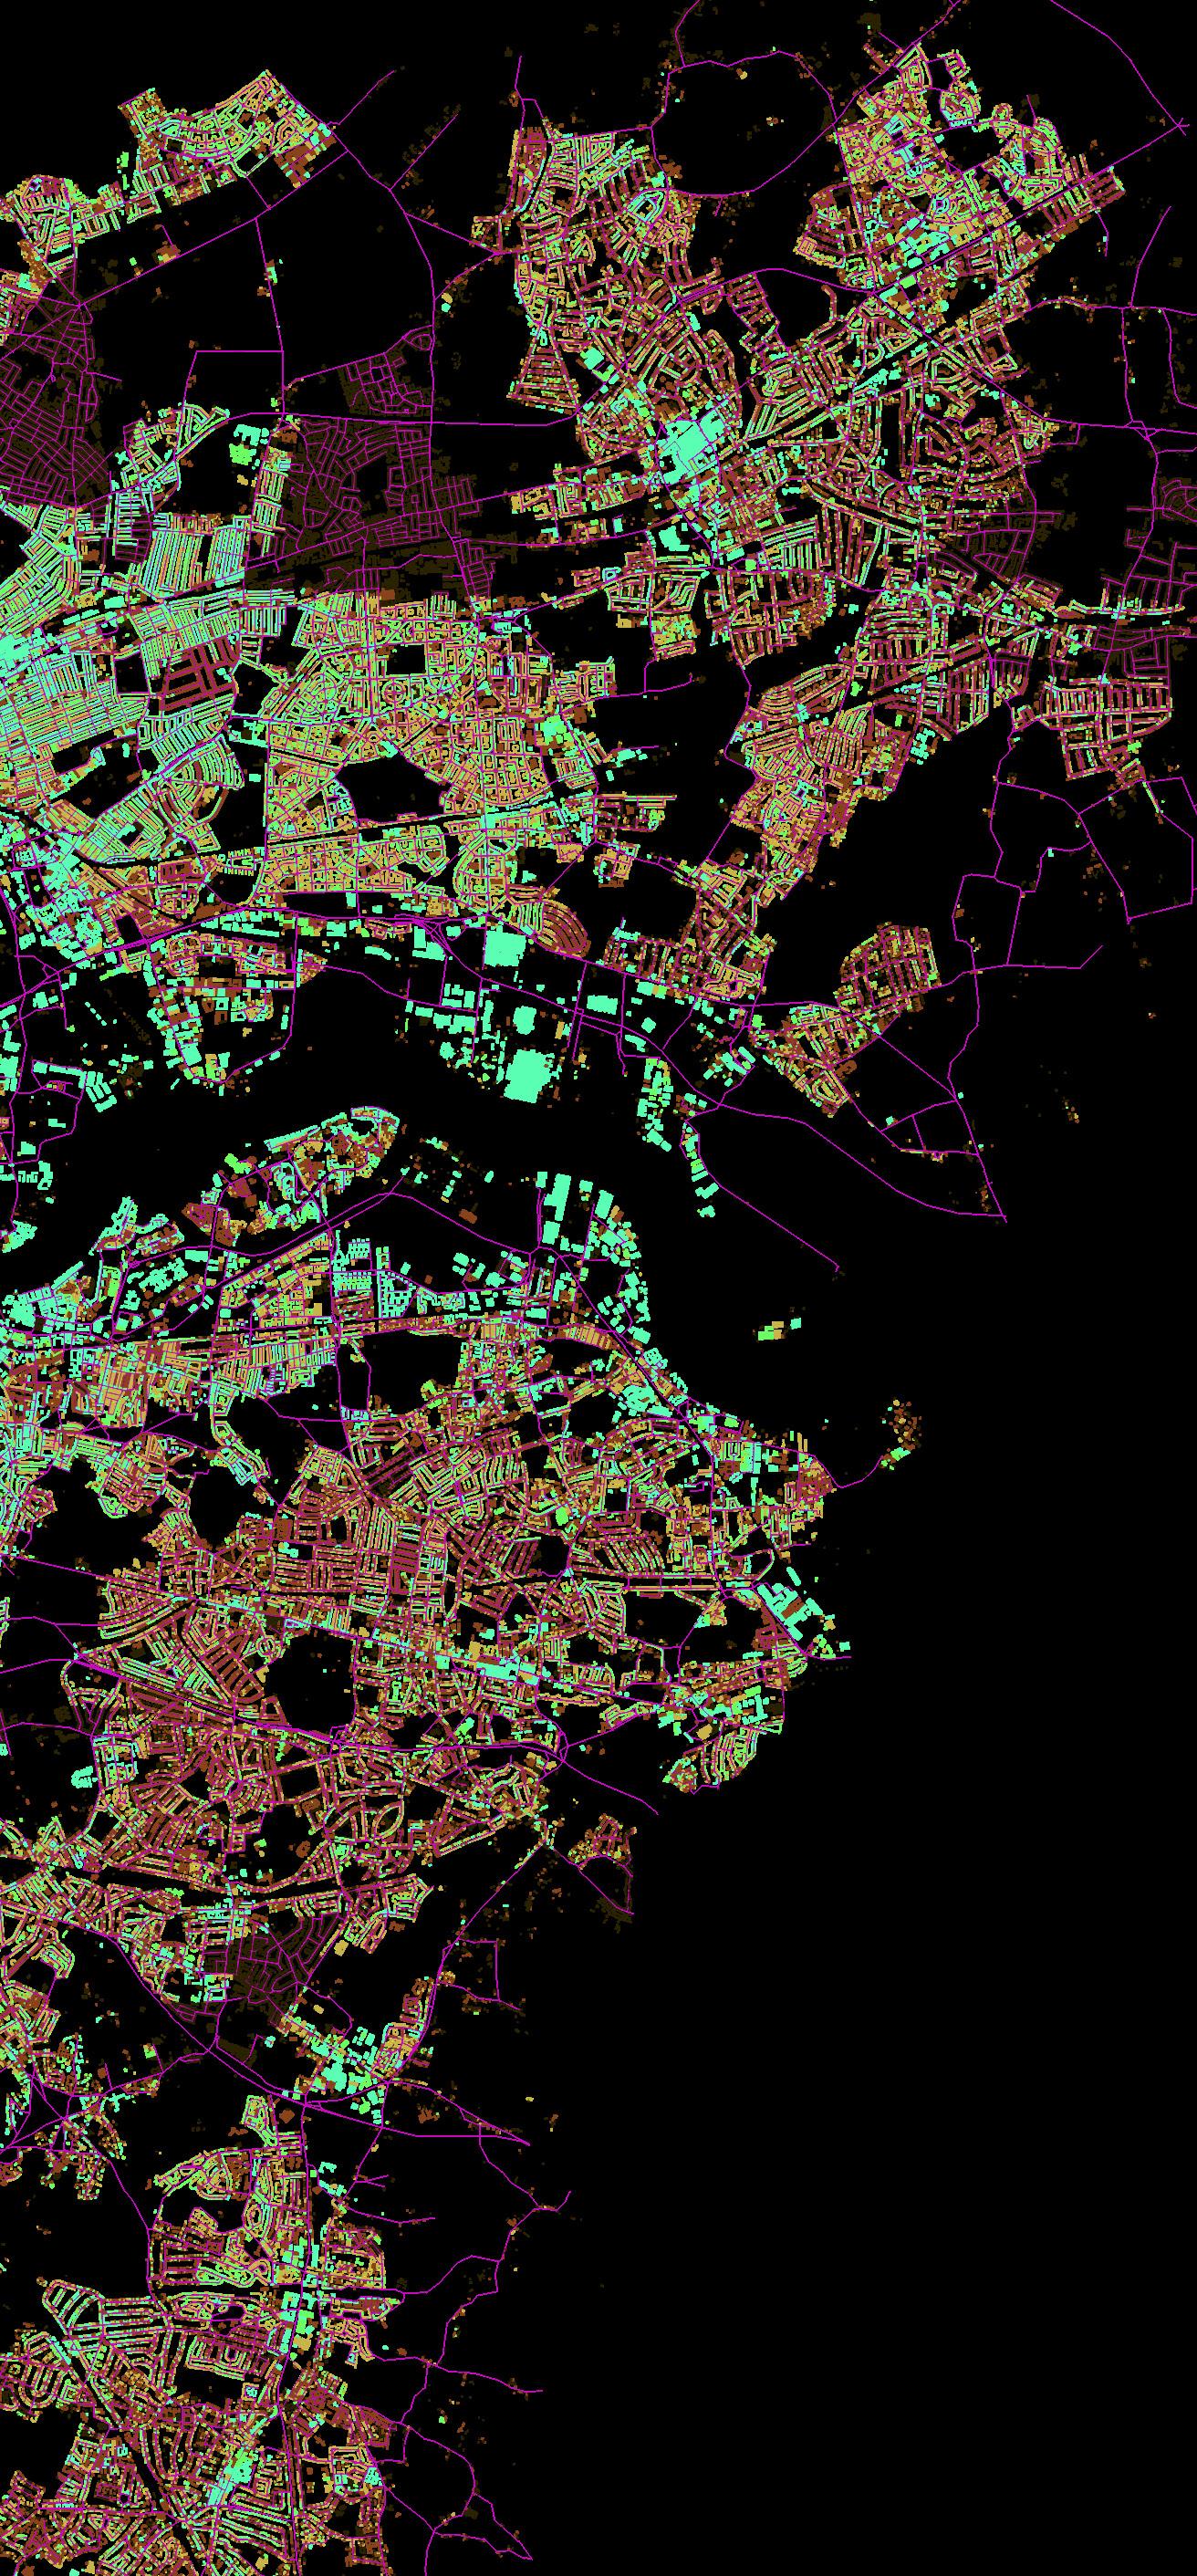
02 MACRO SCALE SITE ANALYSIS & RESEARCH
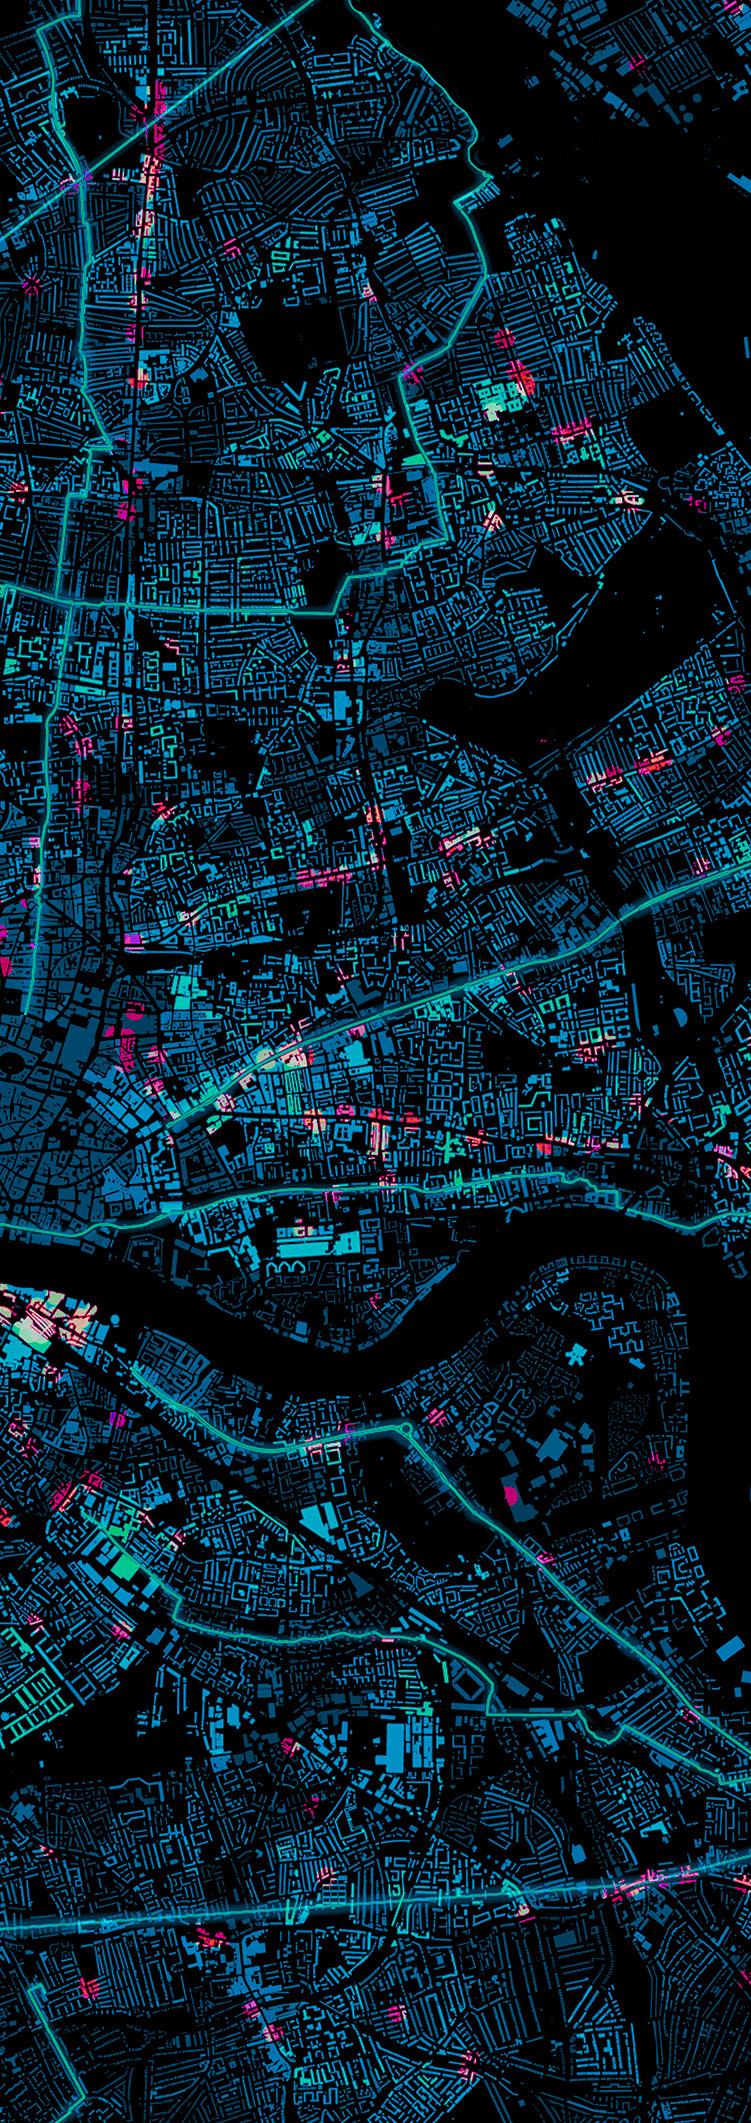
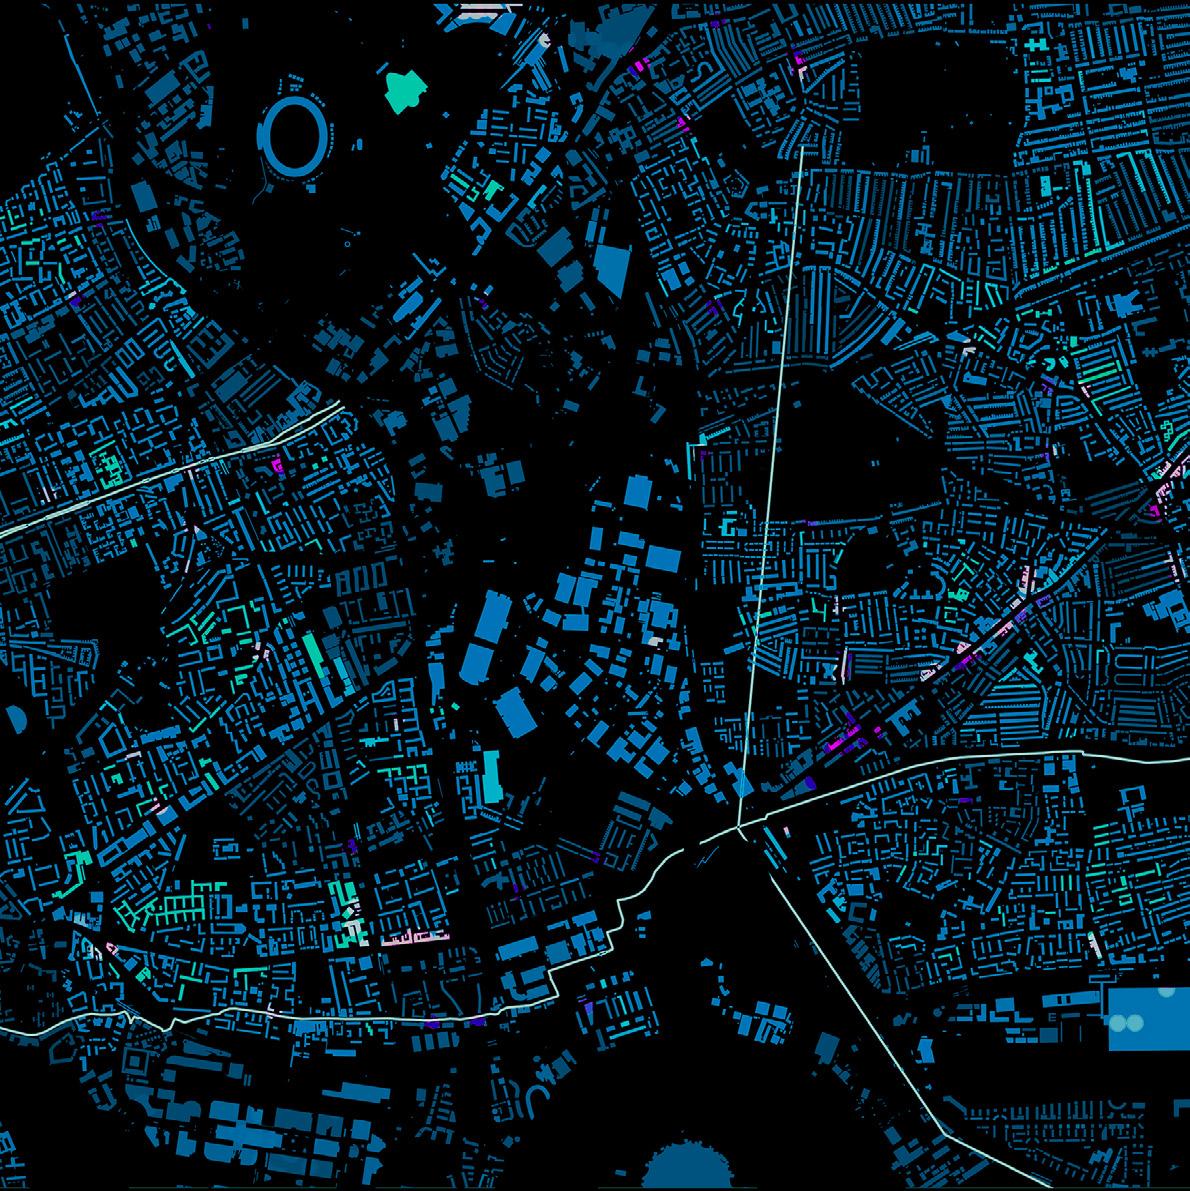
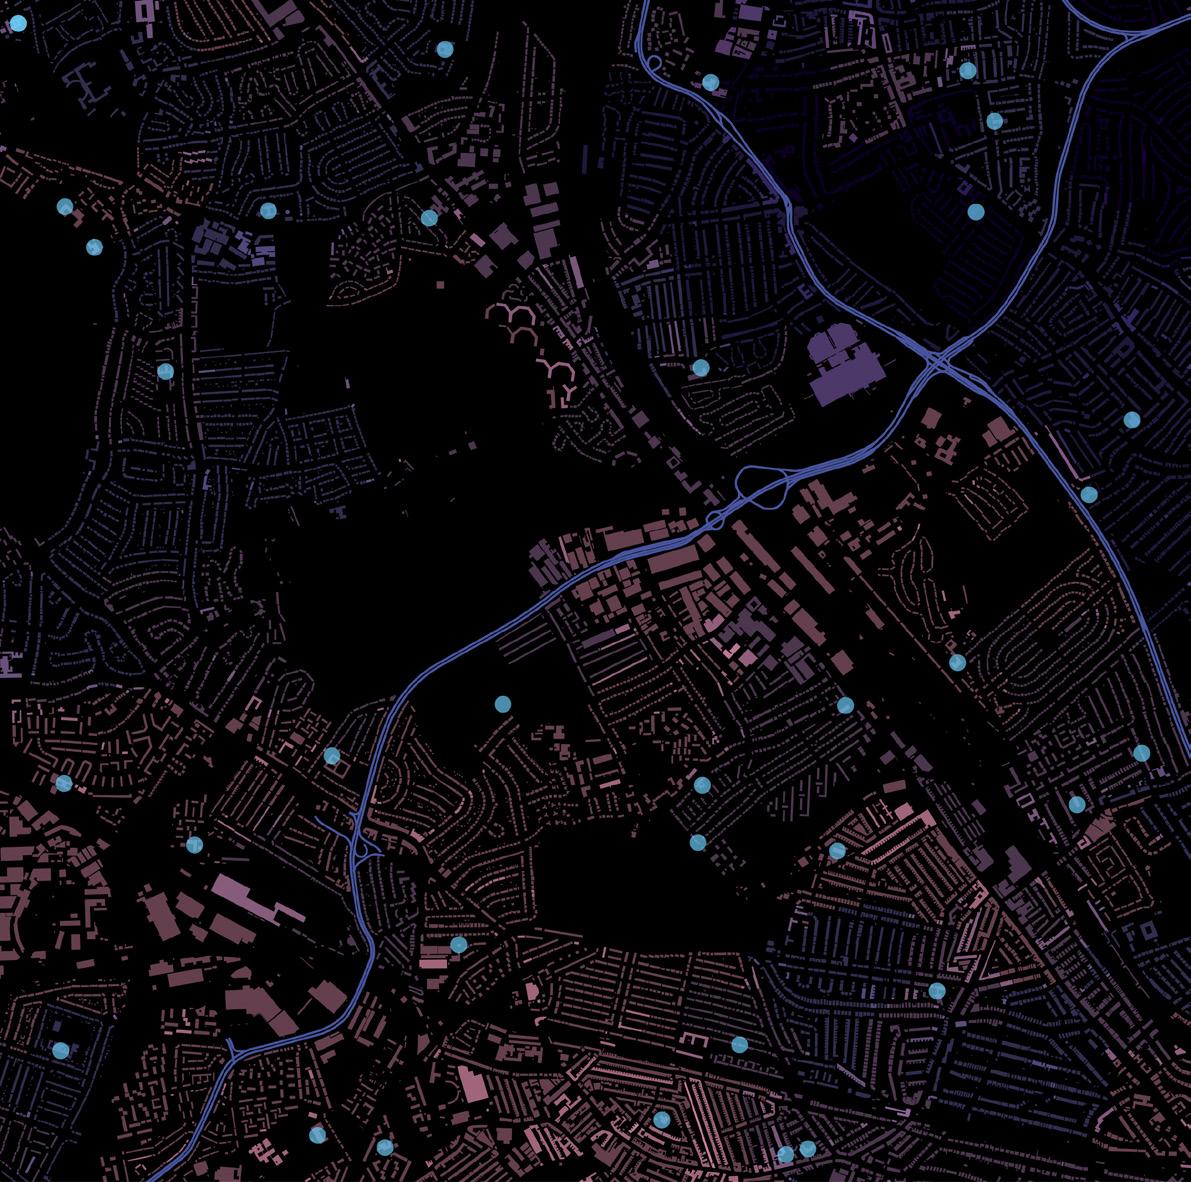
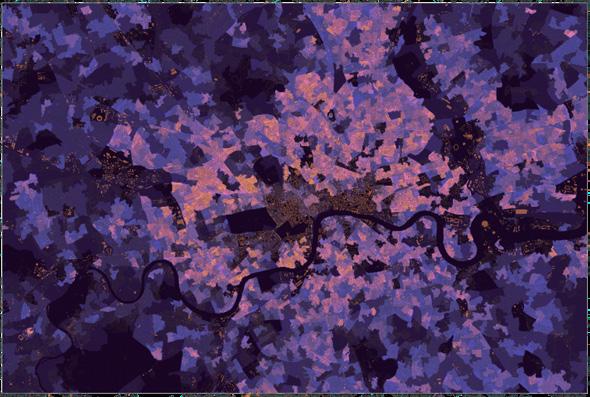
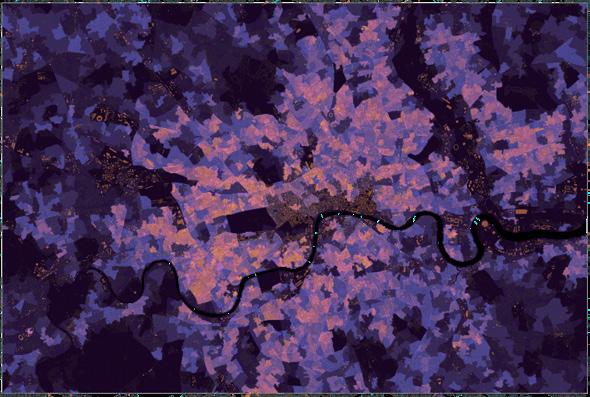
SITE RESEARCH [Macro-Scale Analysis]
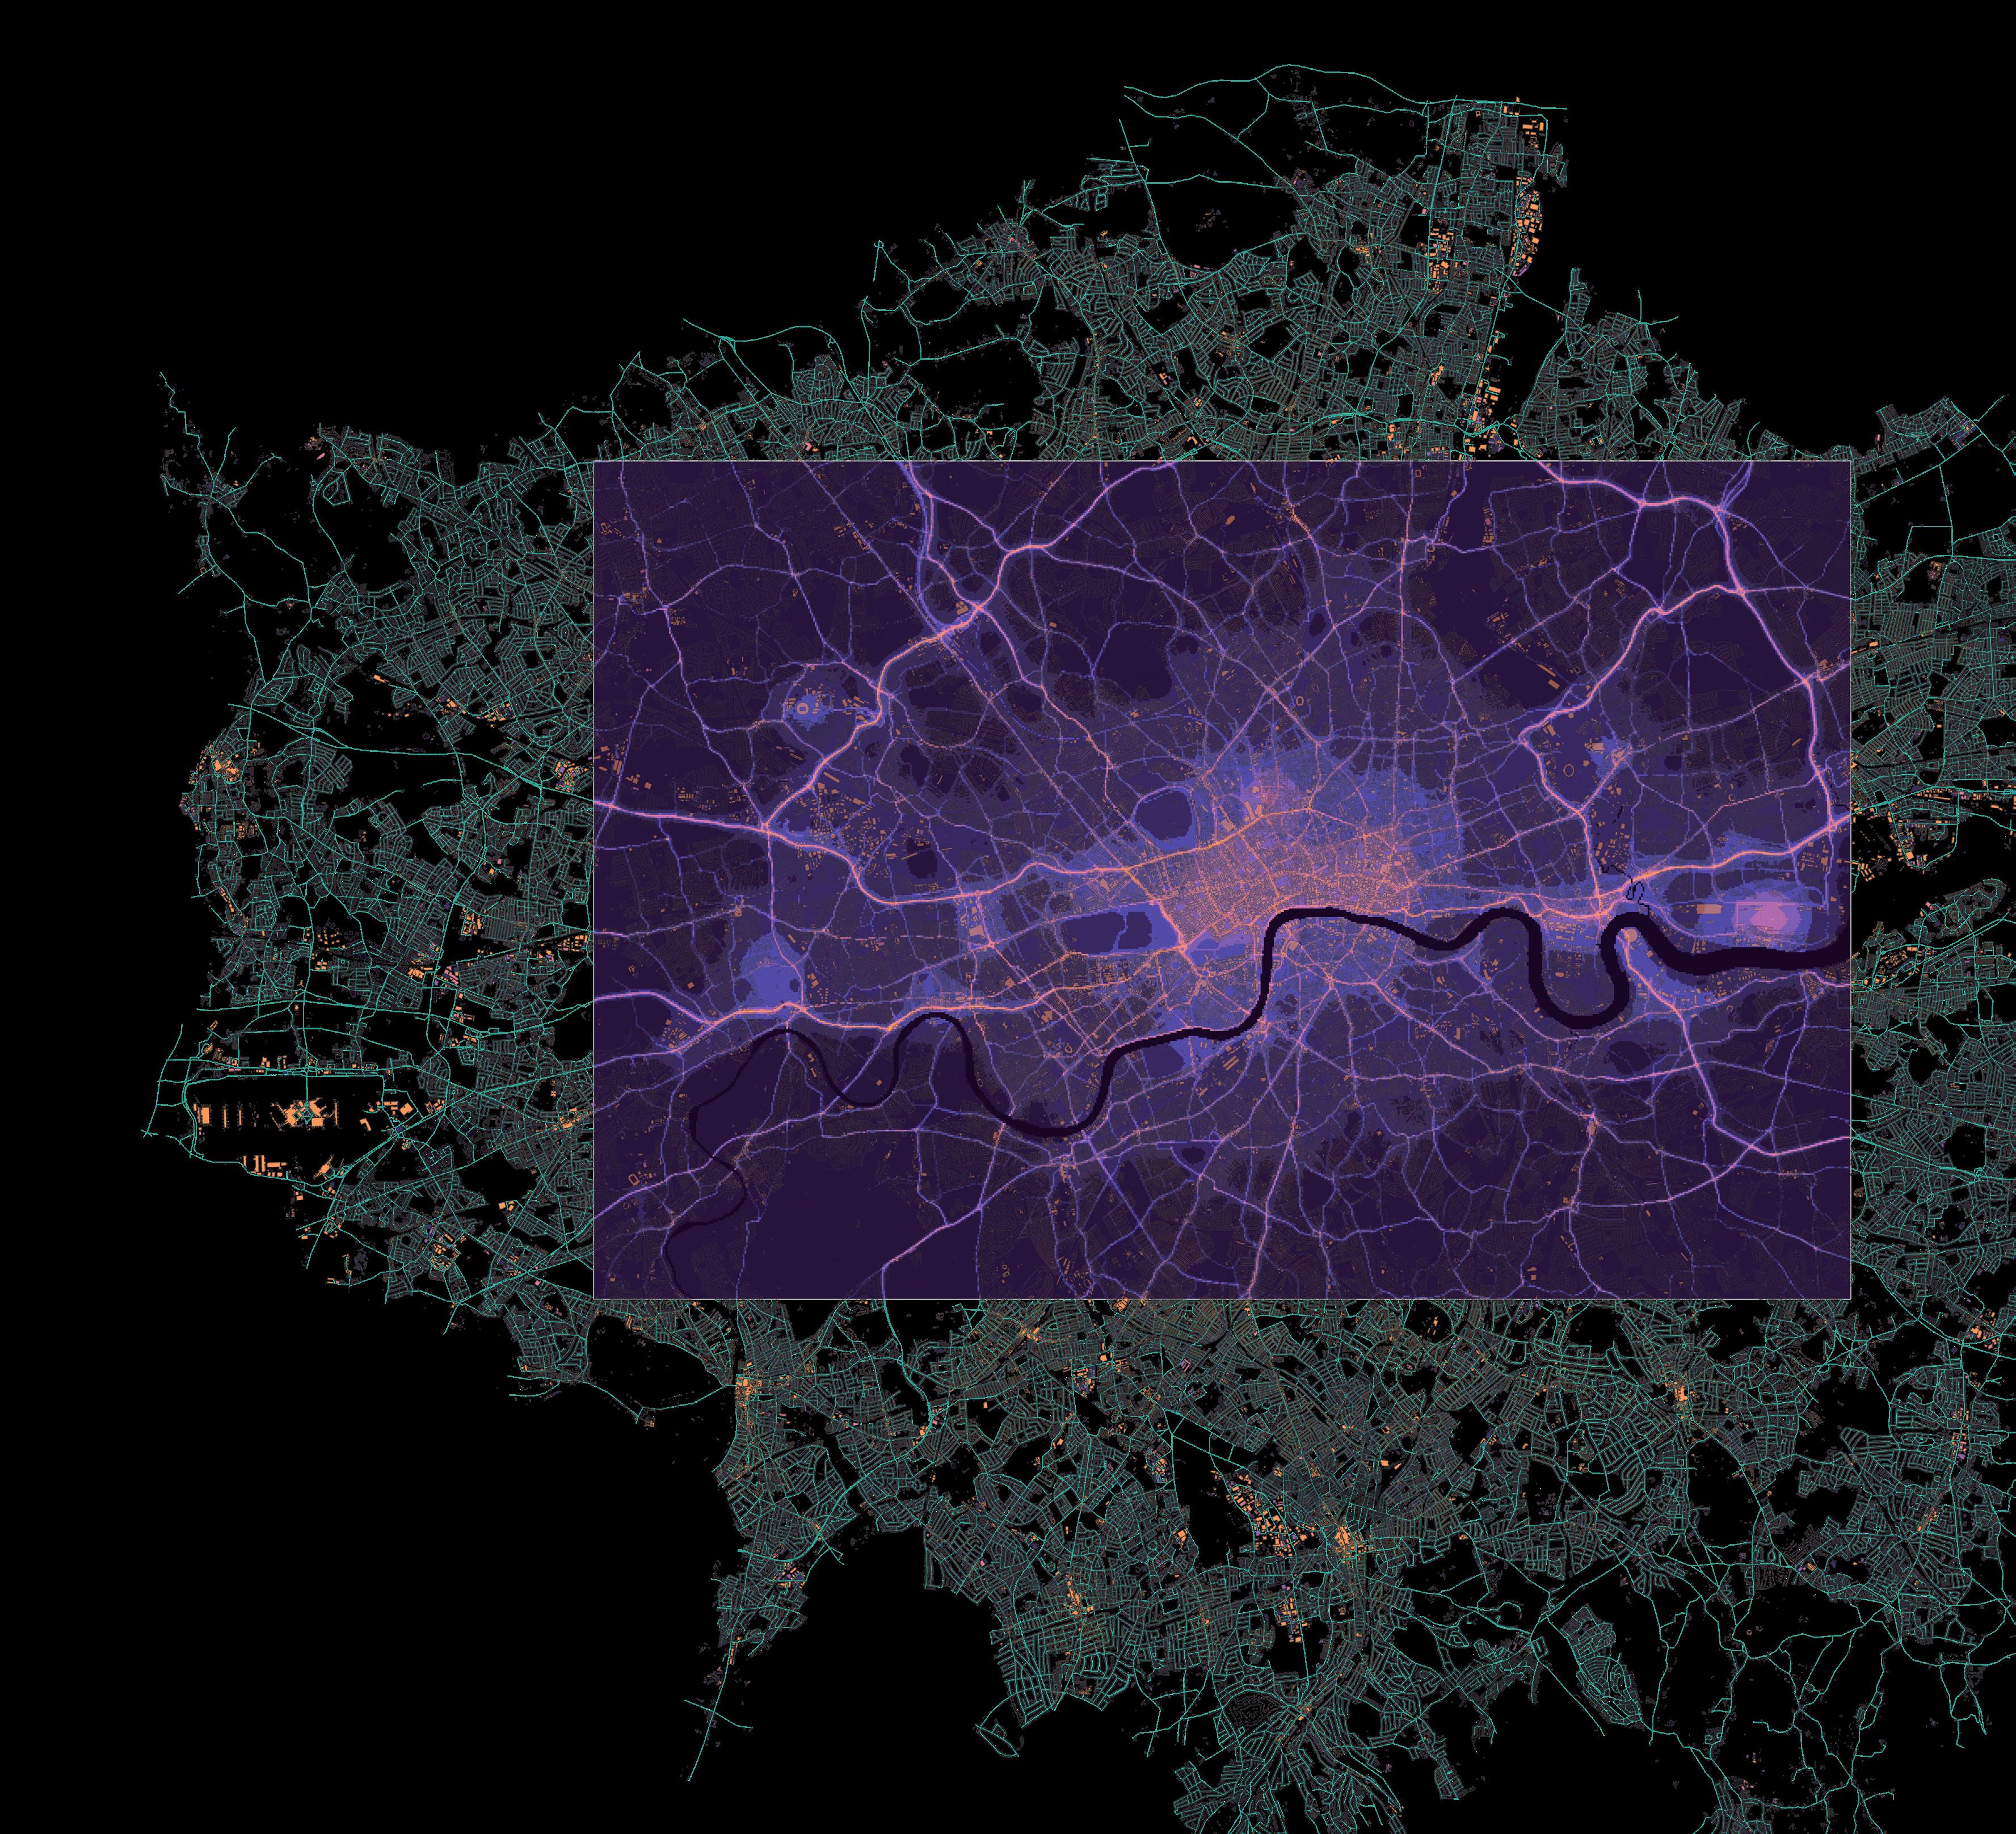
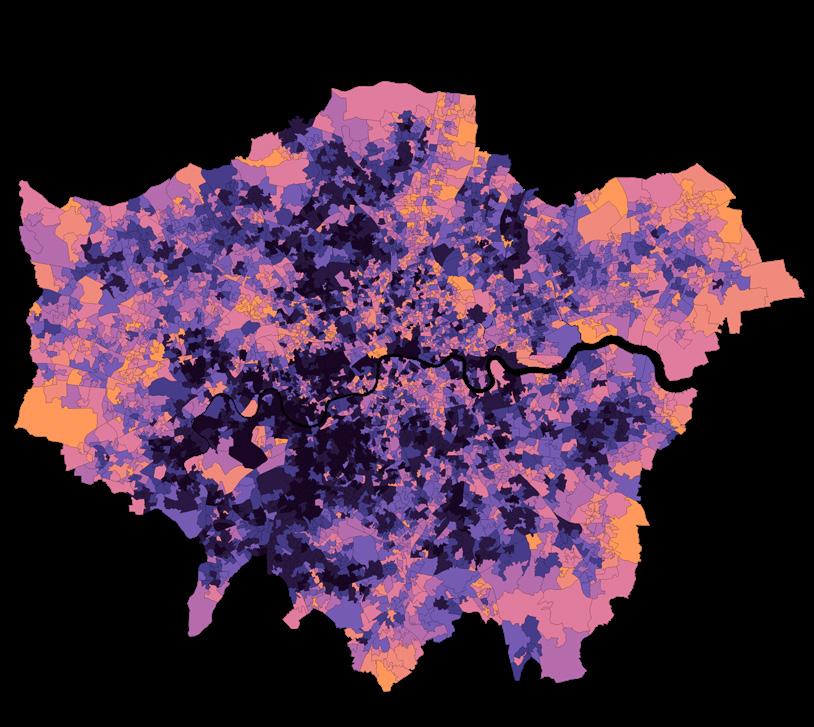
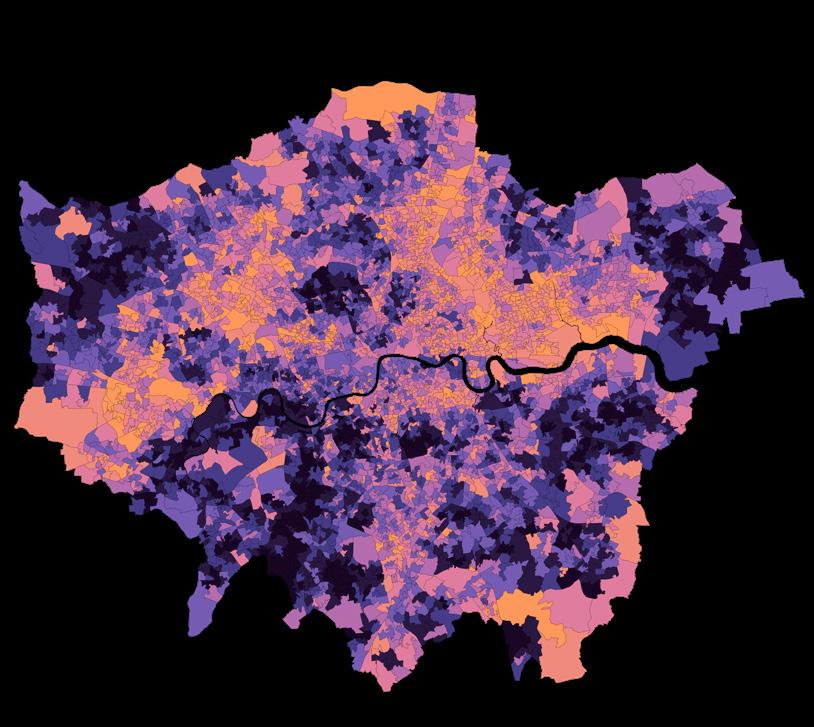
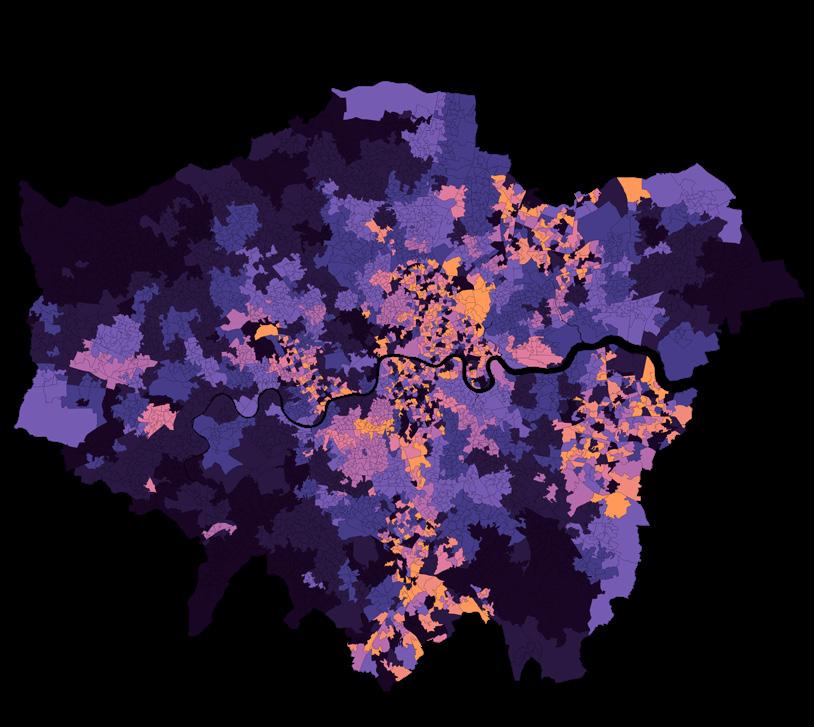
CHILD HEALTH
LEGEND
HIGH SCORE OF BAD HEALTH RATE
LOW SCORE OF BAD HEALTH RATE
FAST FOOD LOCATIONS
CYCLE ROUTES
CHILD HEALTH RATE
Brent Hackney
Hammersmith Newham
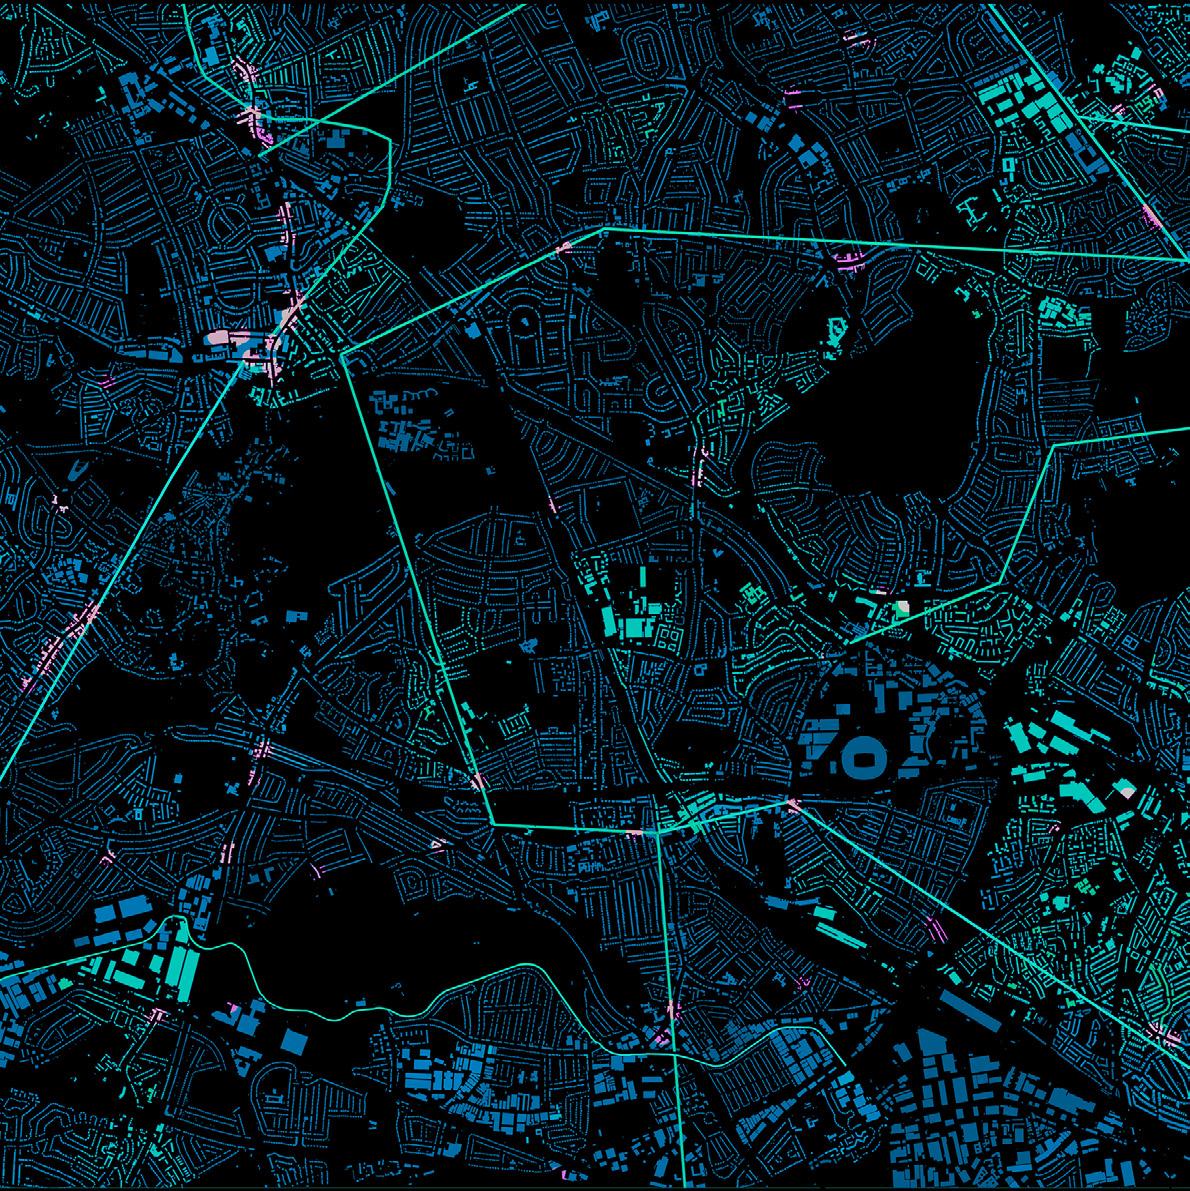
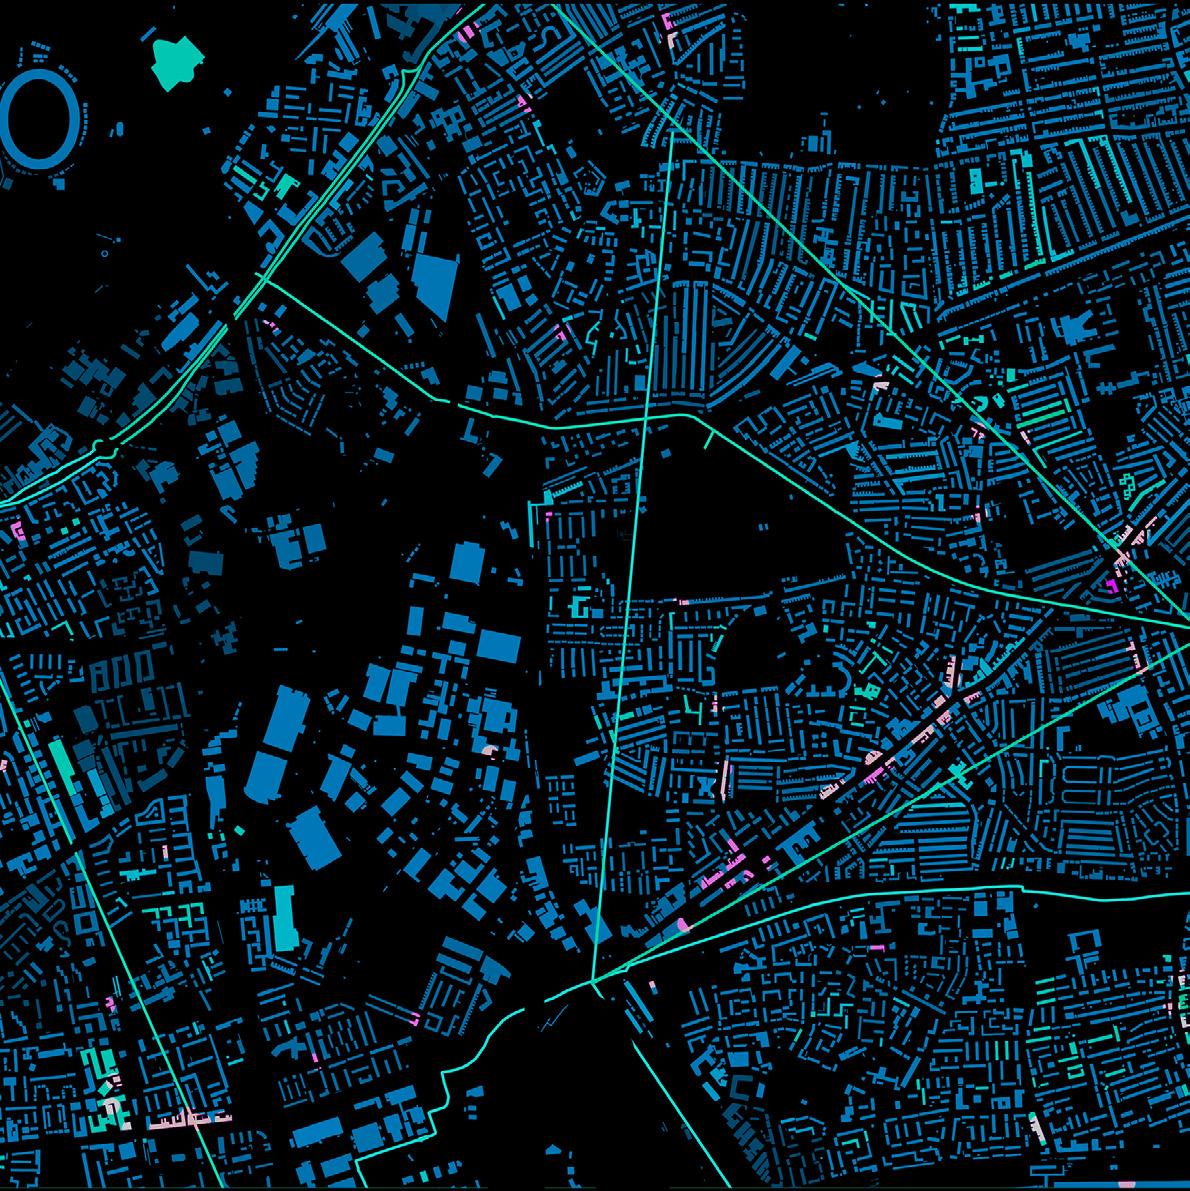
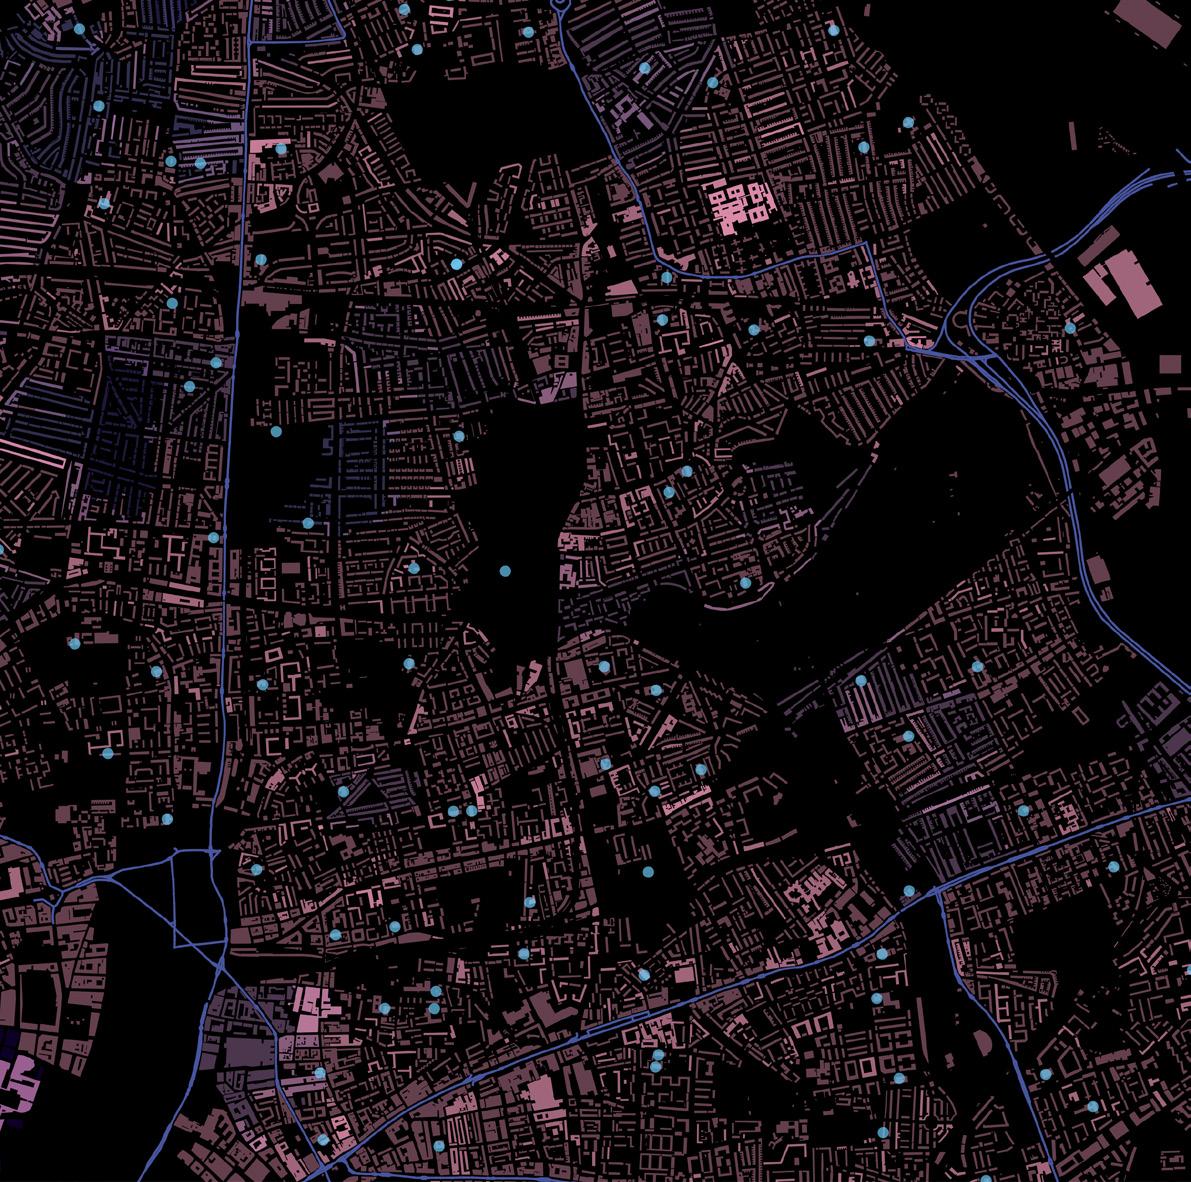
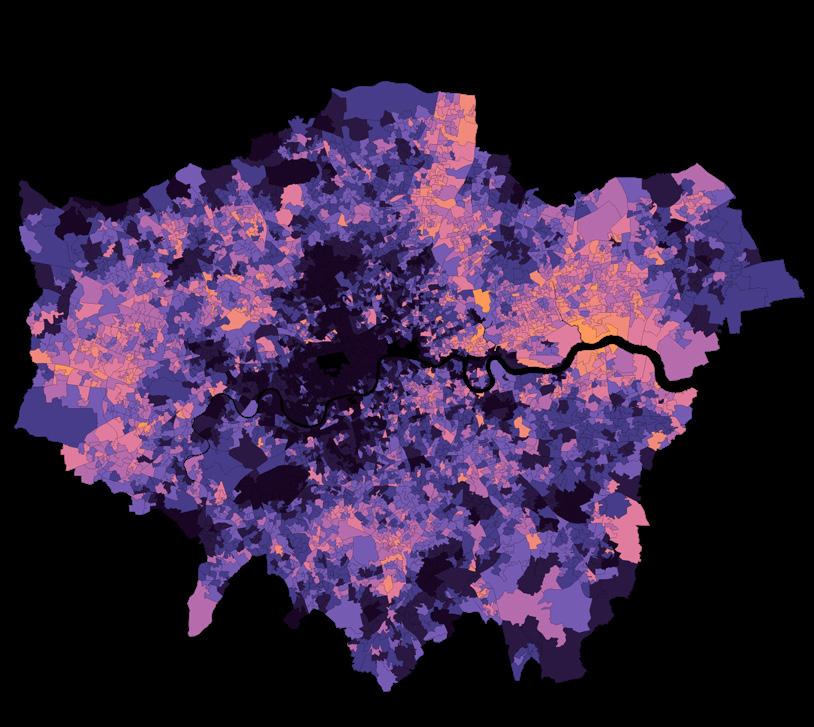
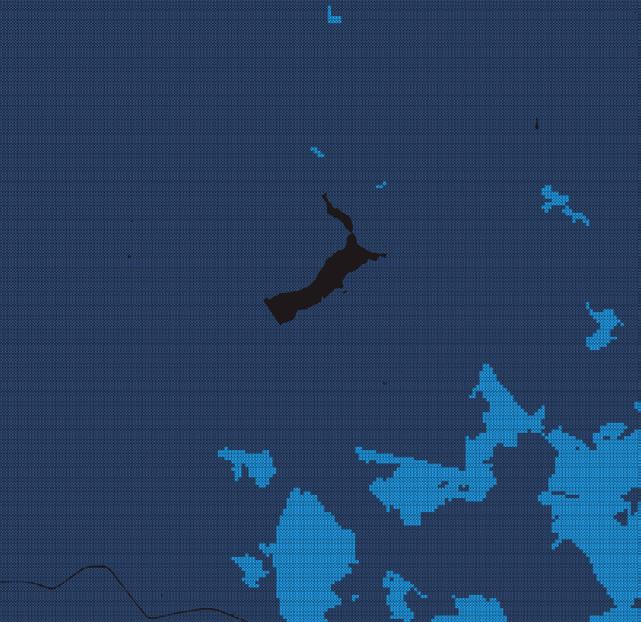
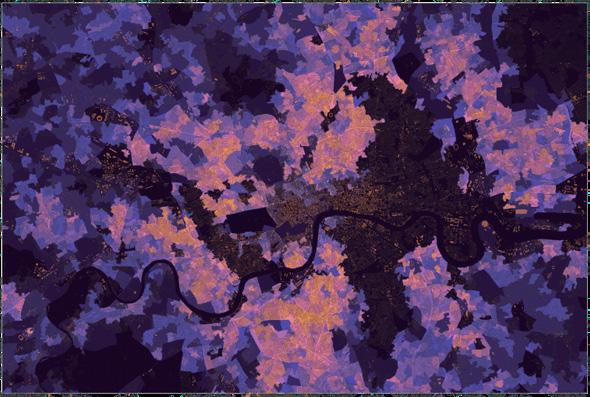
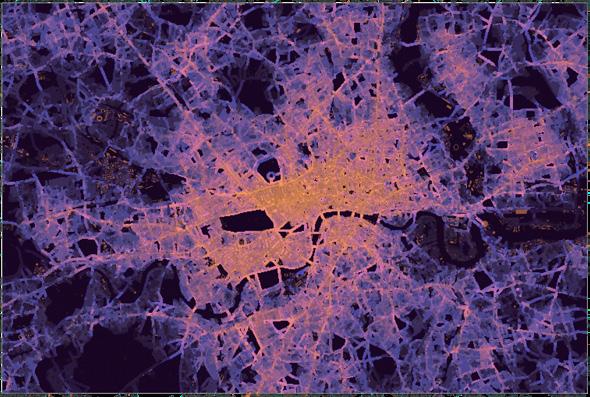
SITE RESEARCH [Macro-Scale Analysis]
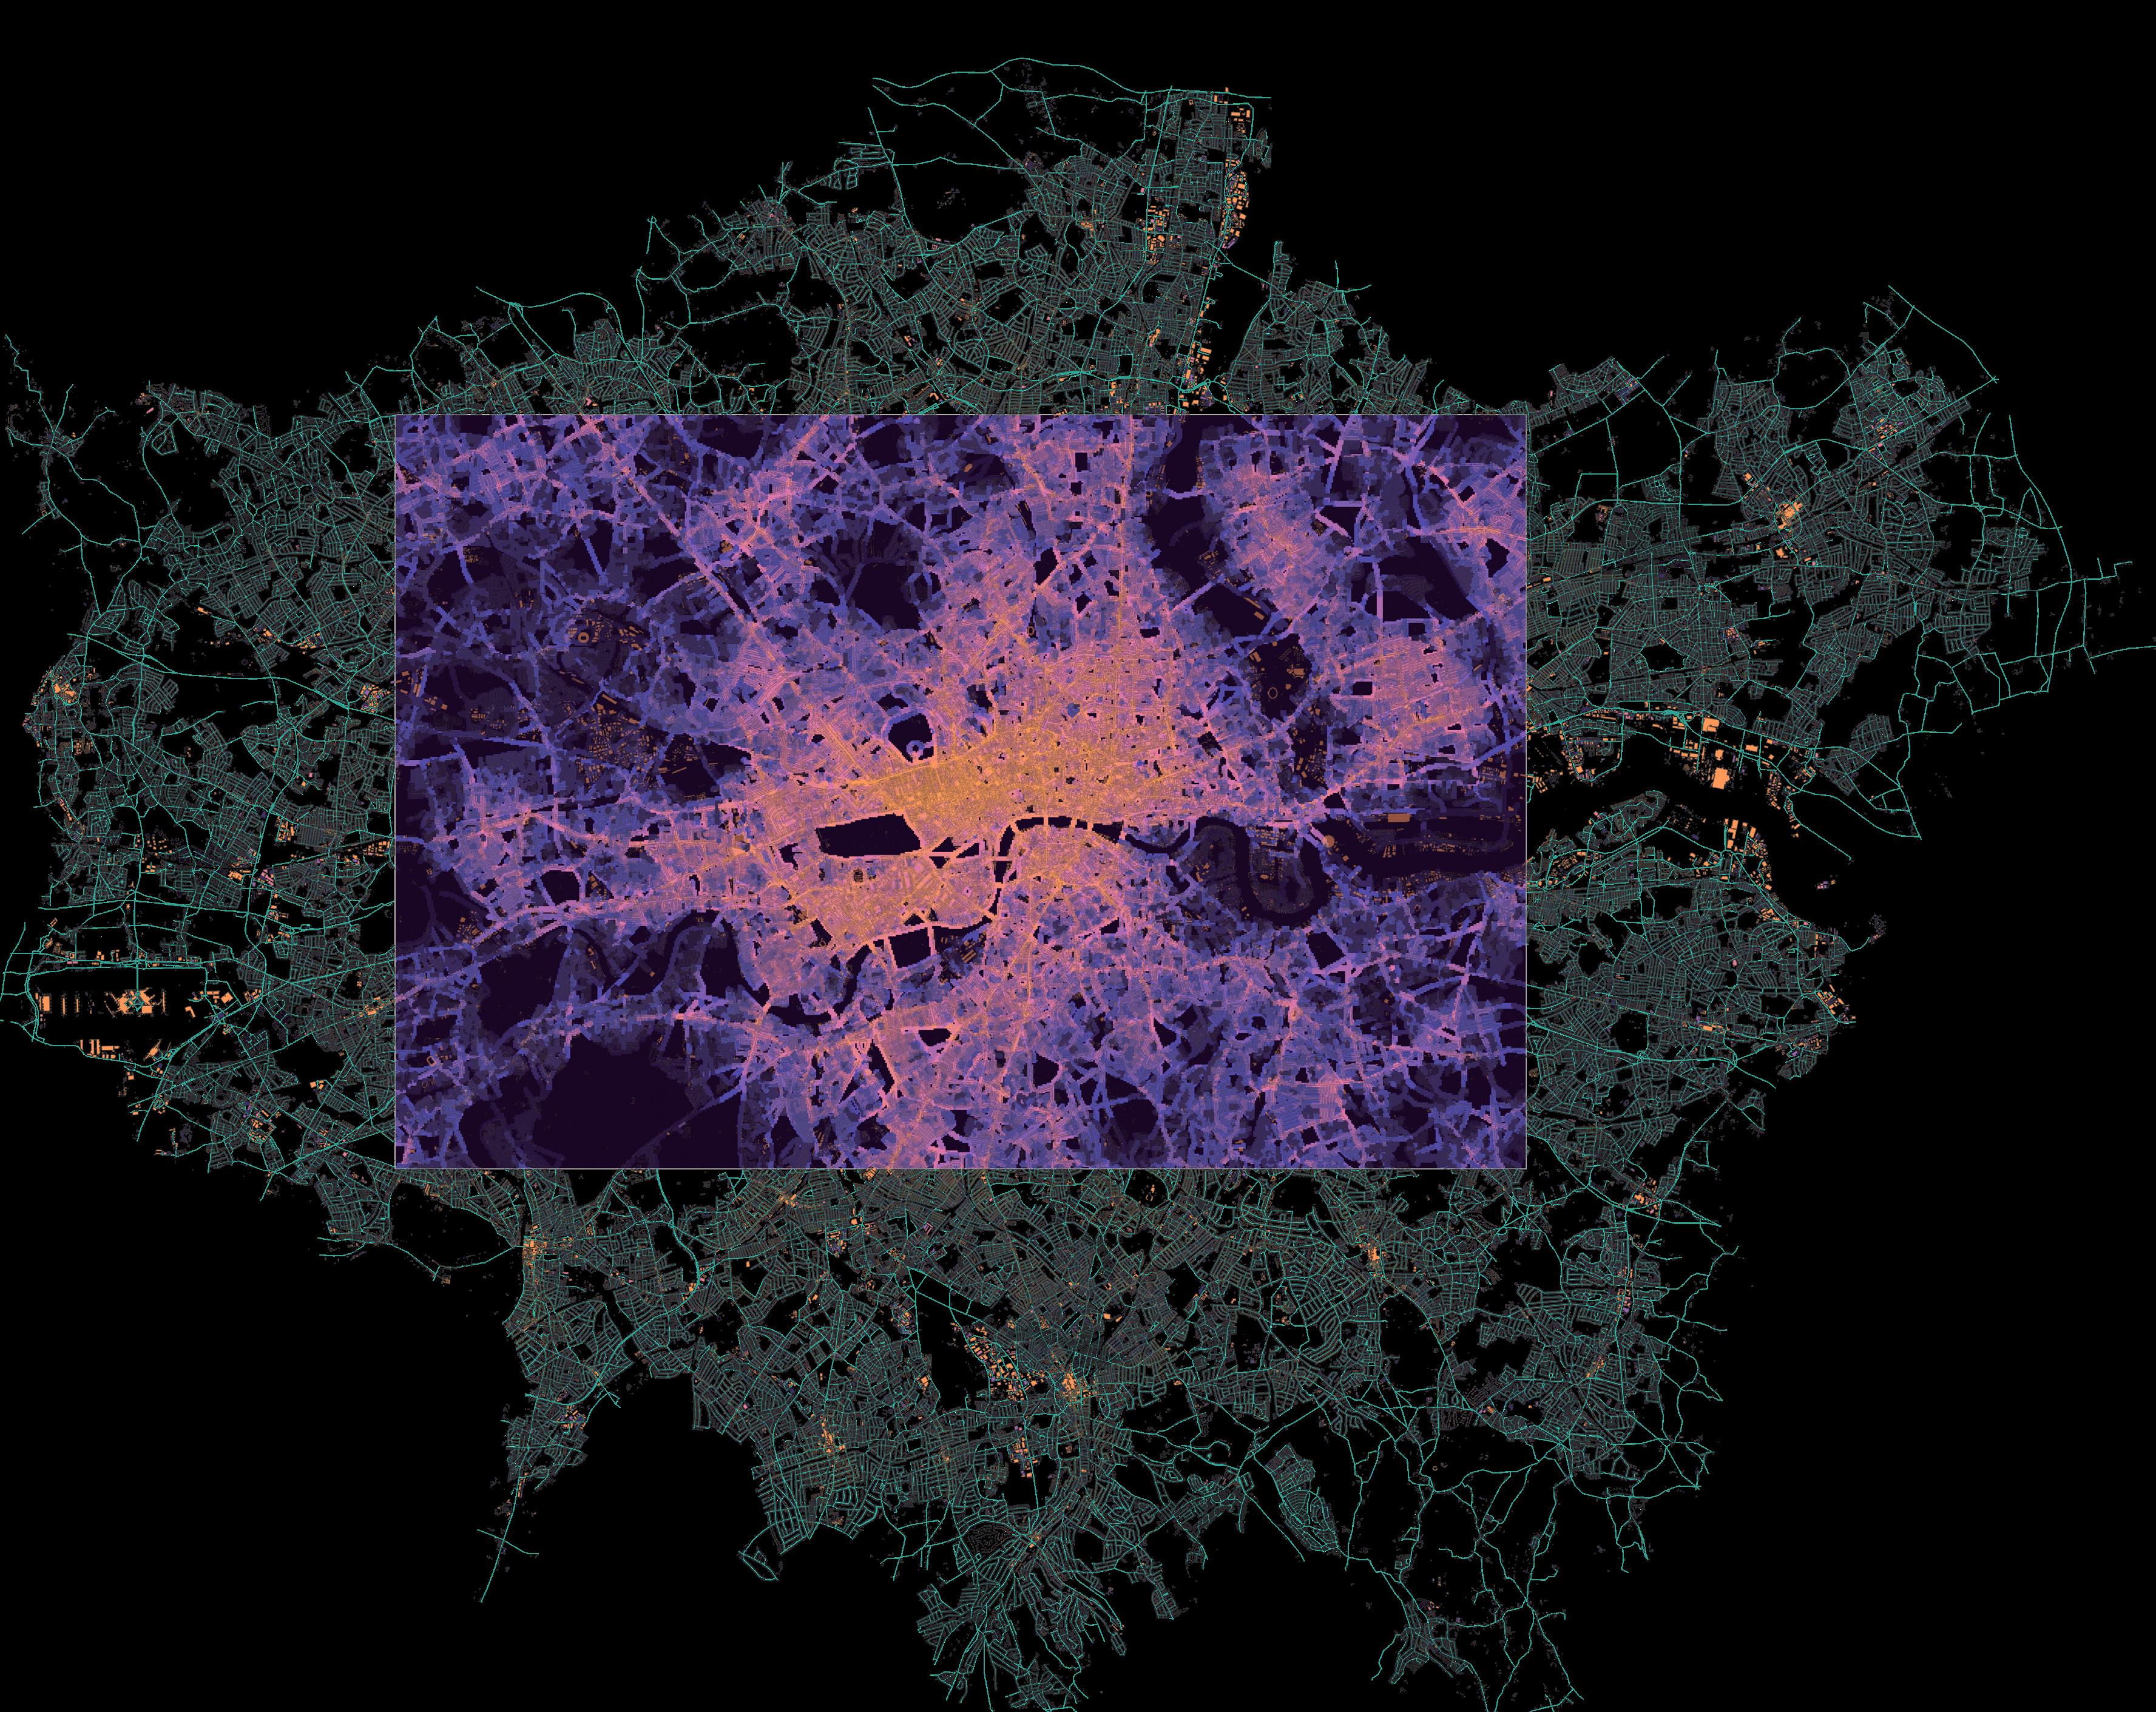
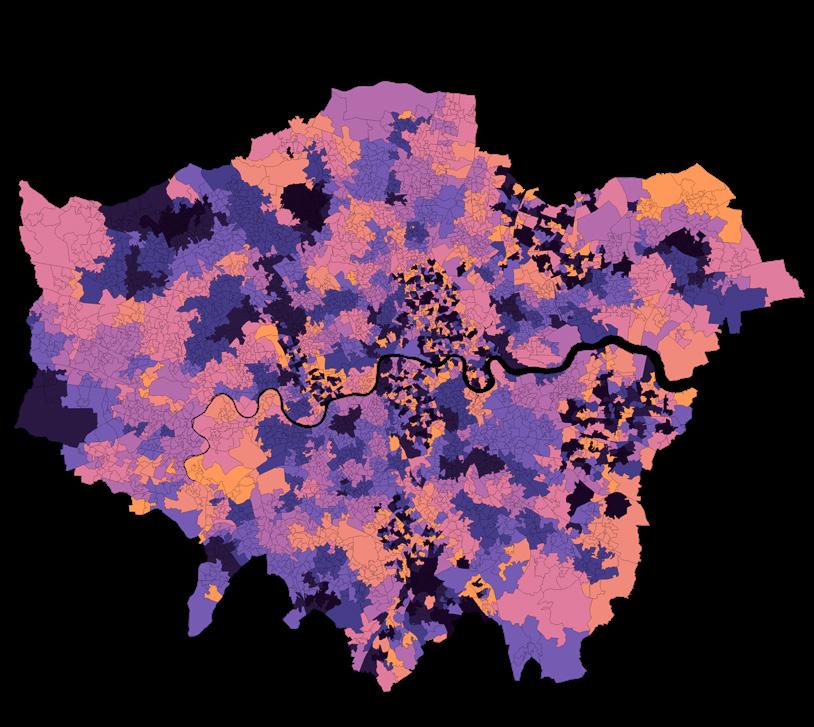
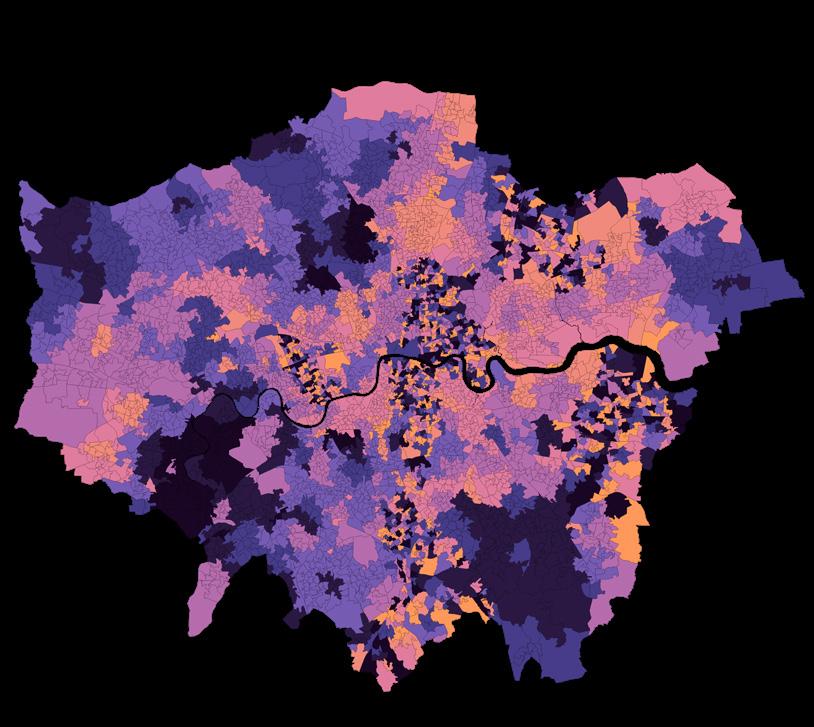
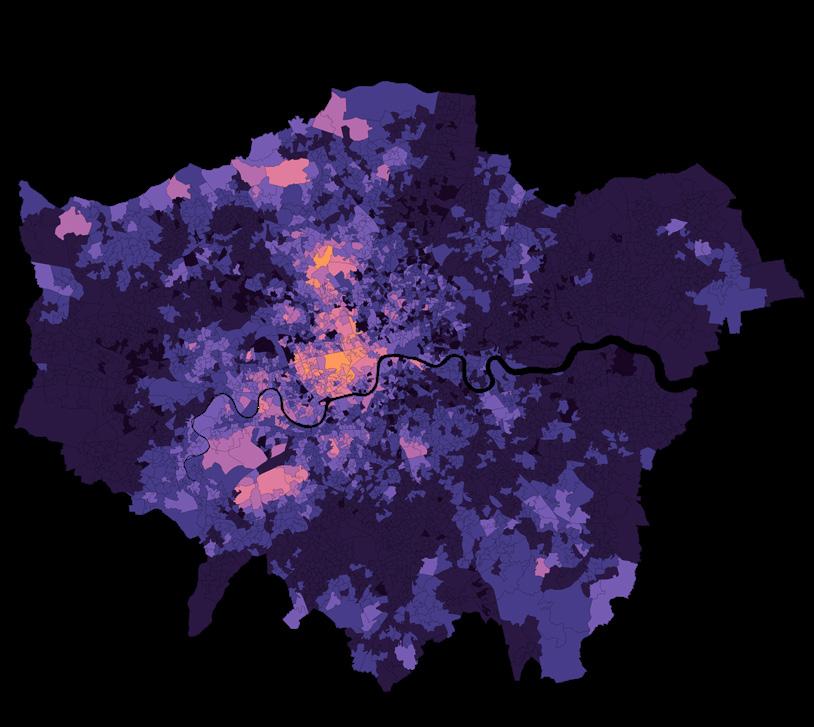
CHILD SECURITY
LEGEND
HIGH CRIME RATE
LOW CRIME RATE
DANGER HOTSPOTS
LONDON TUBELINE
CHILD CRIME RATE
Hackney
Hammersmith
Newham
Brent
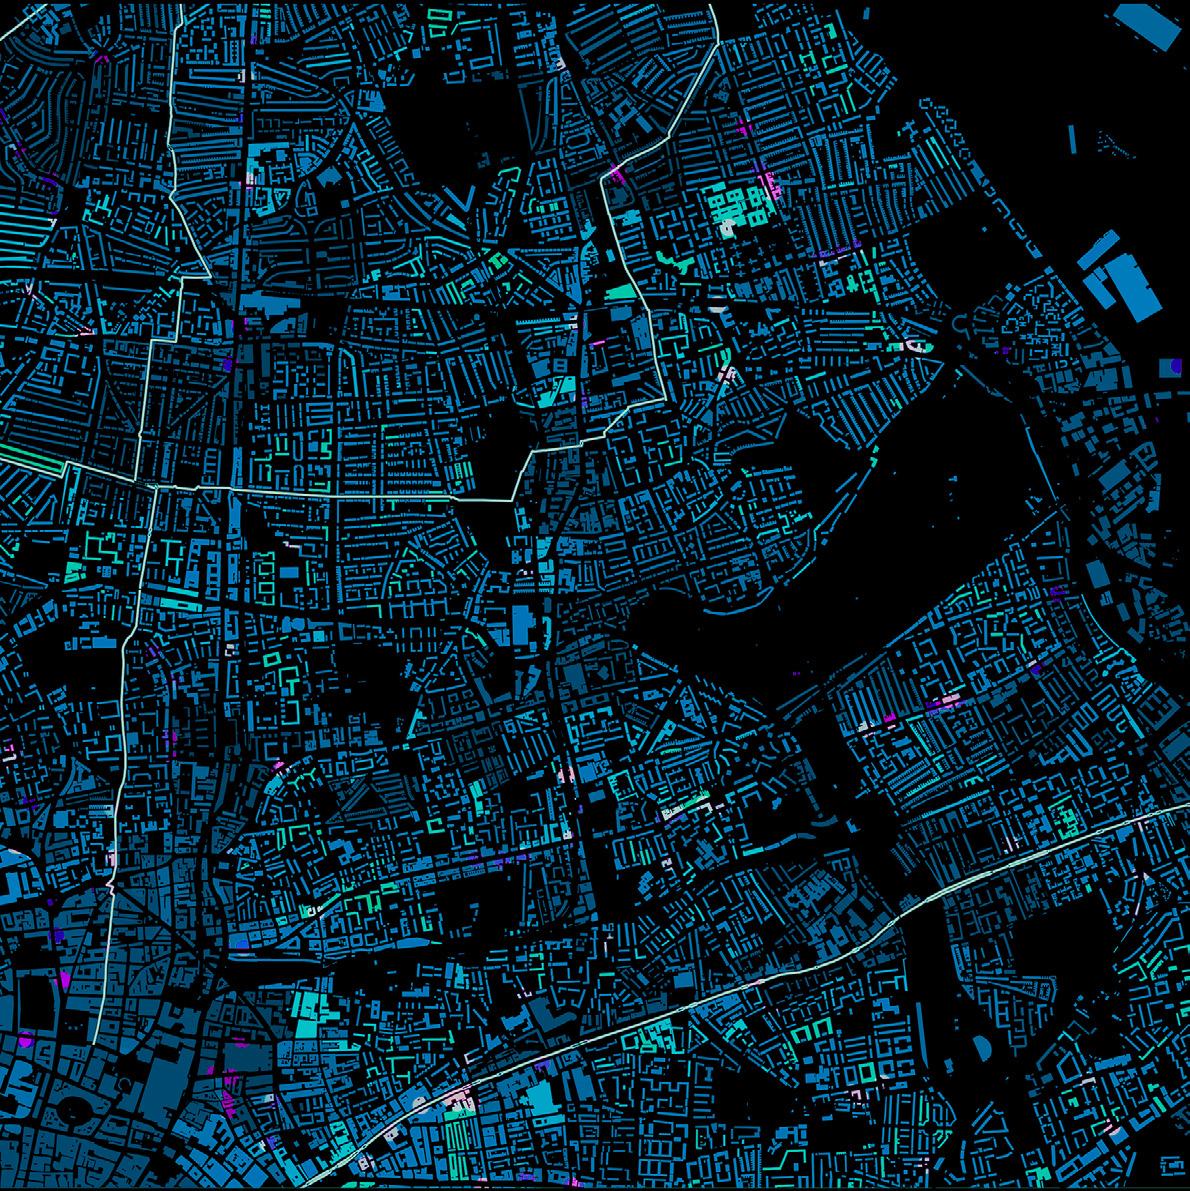
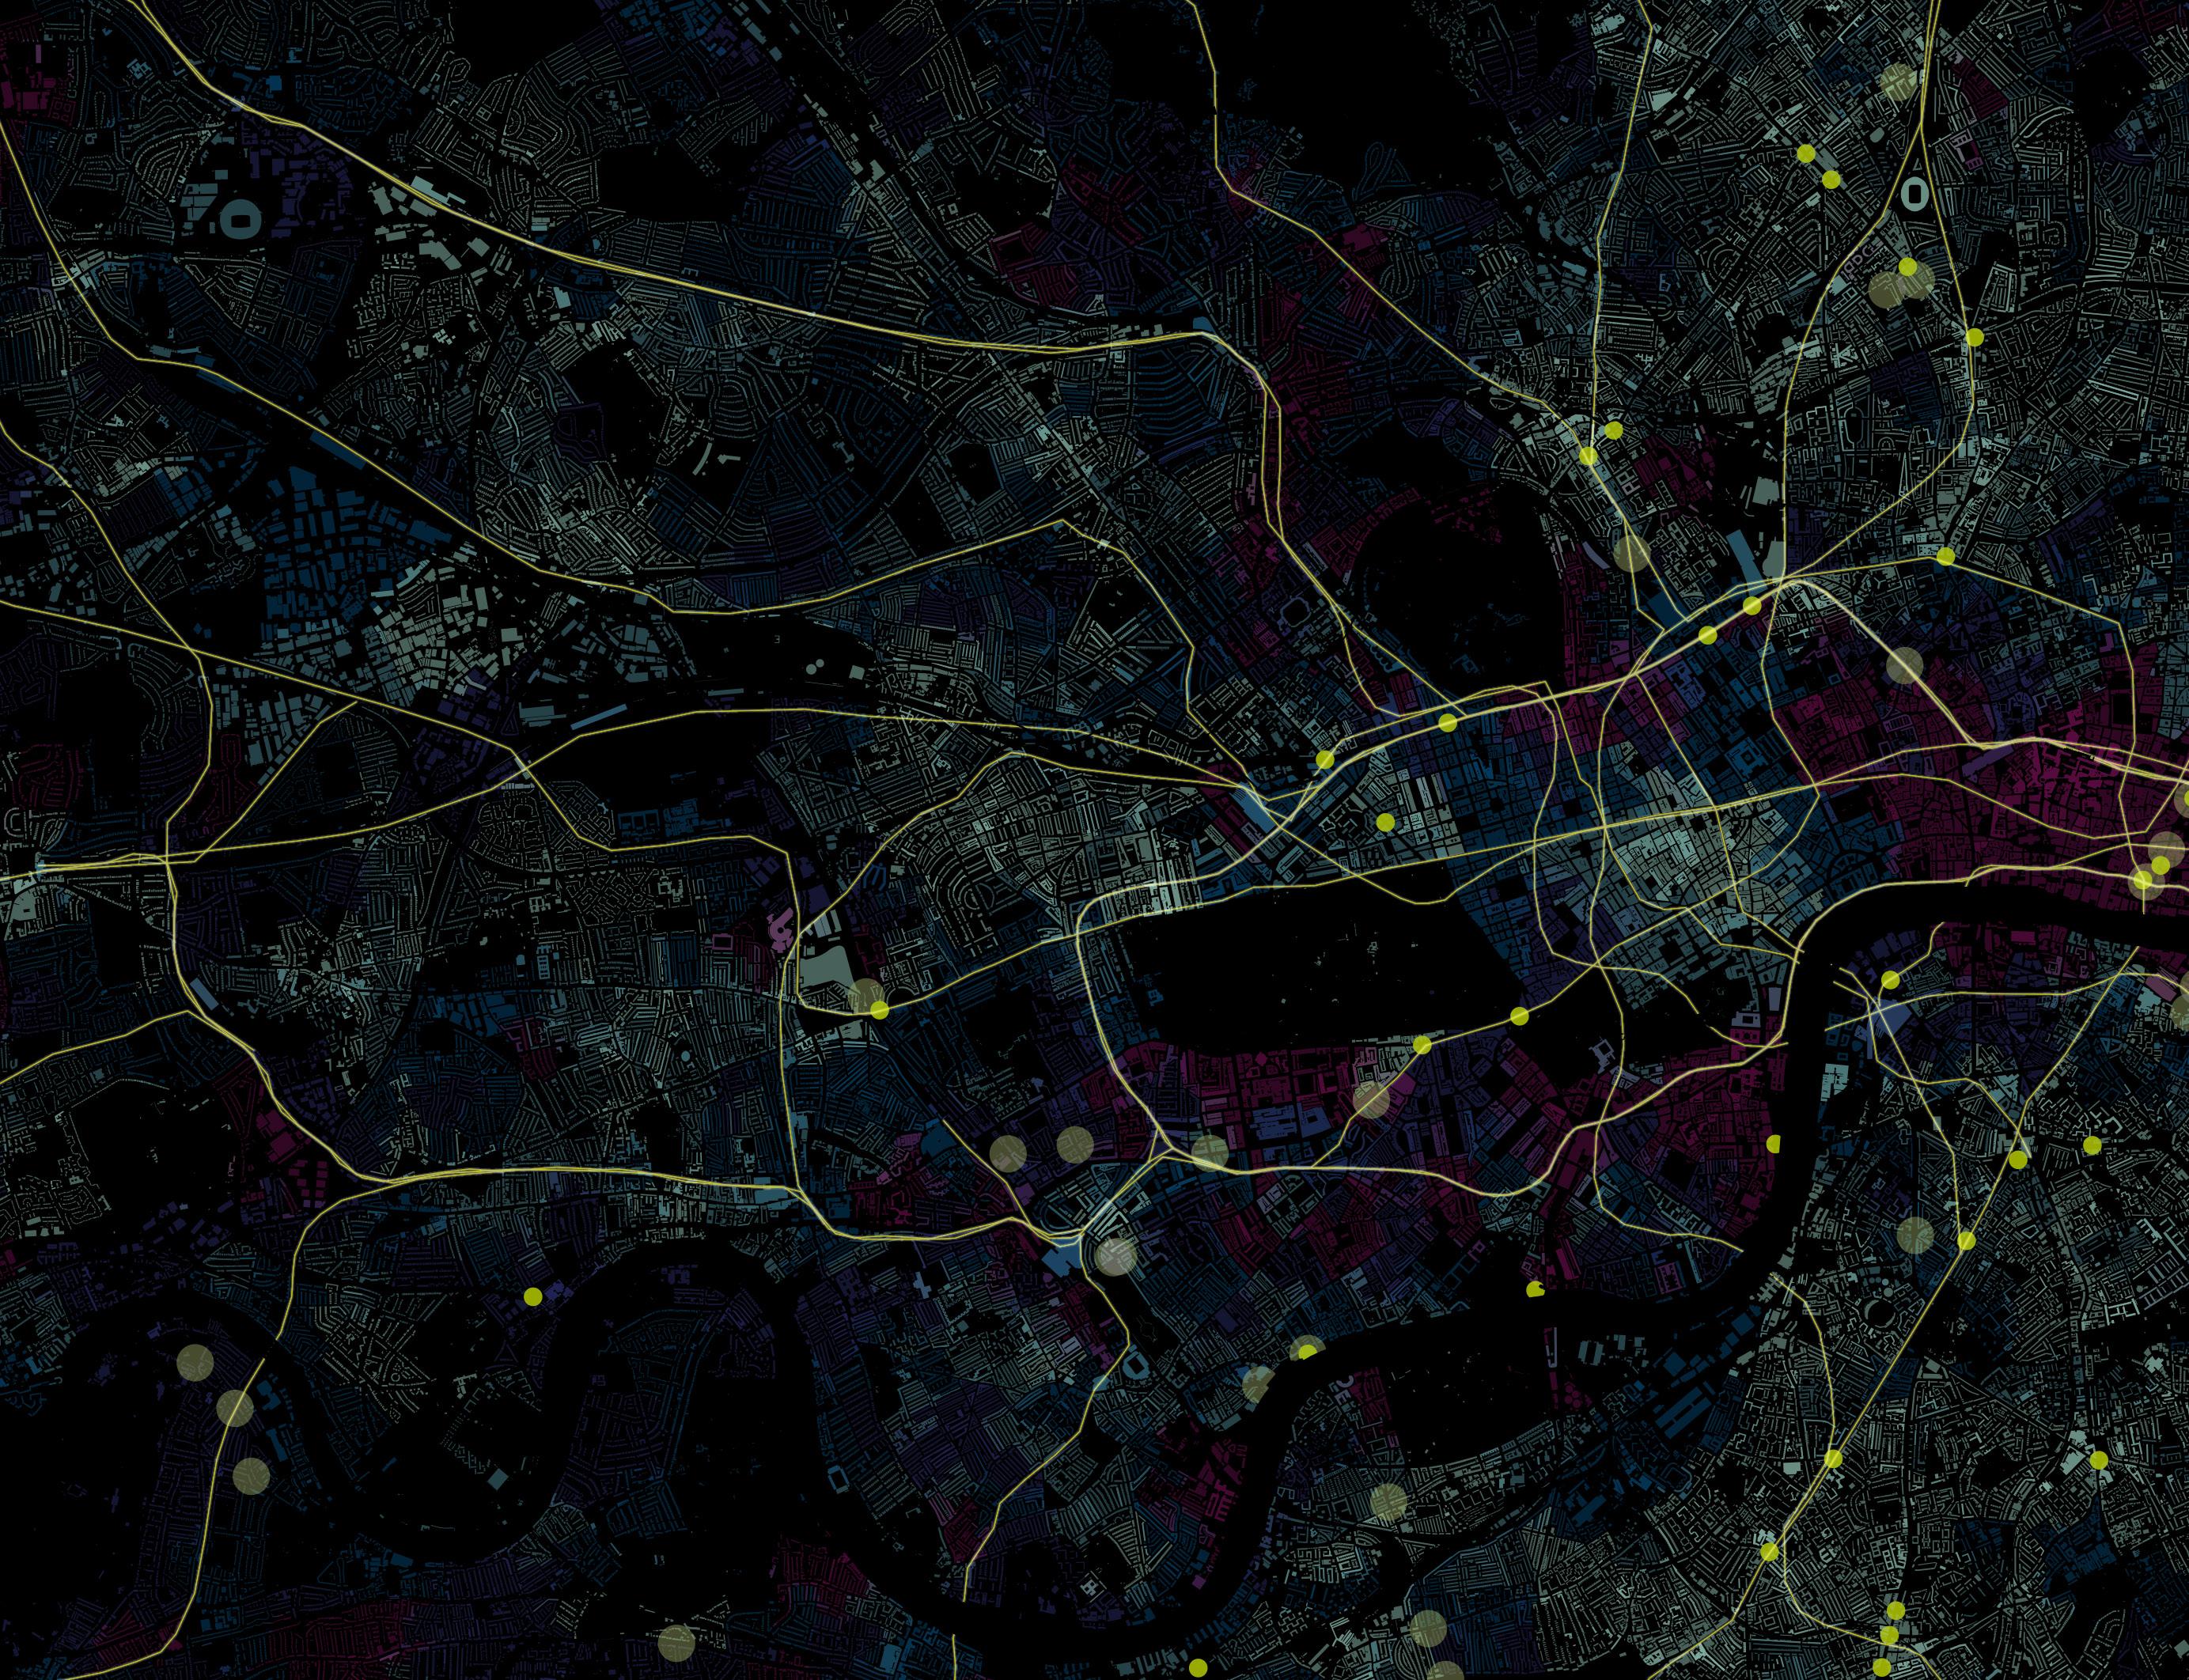
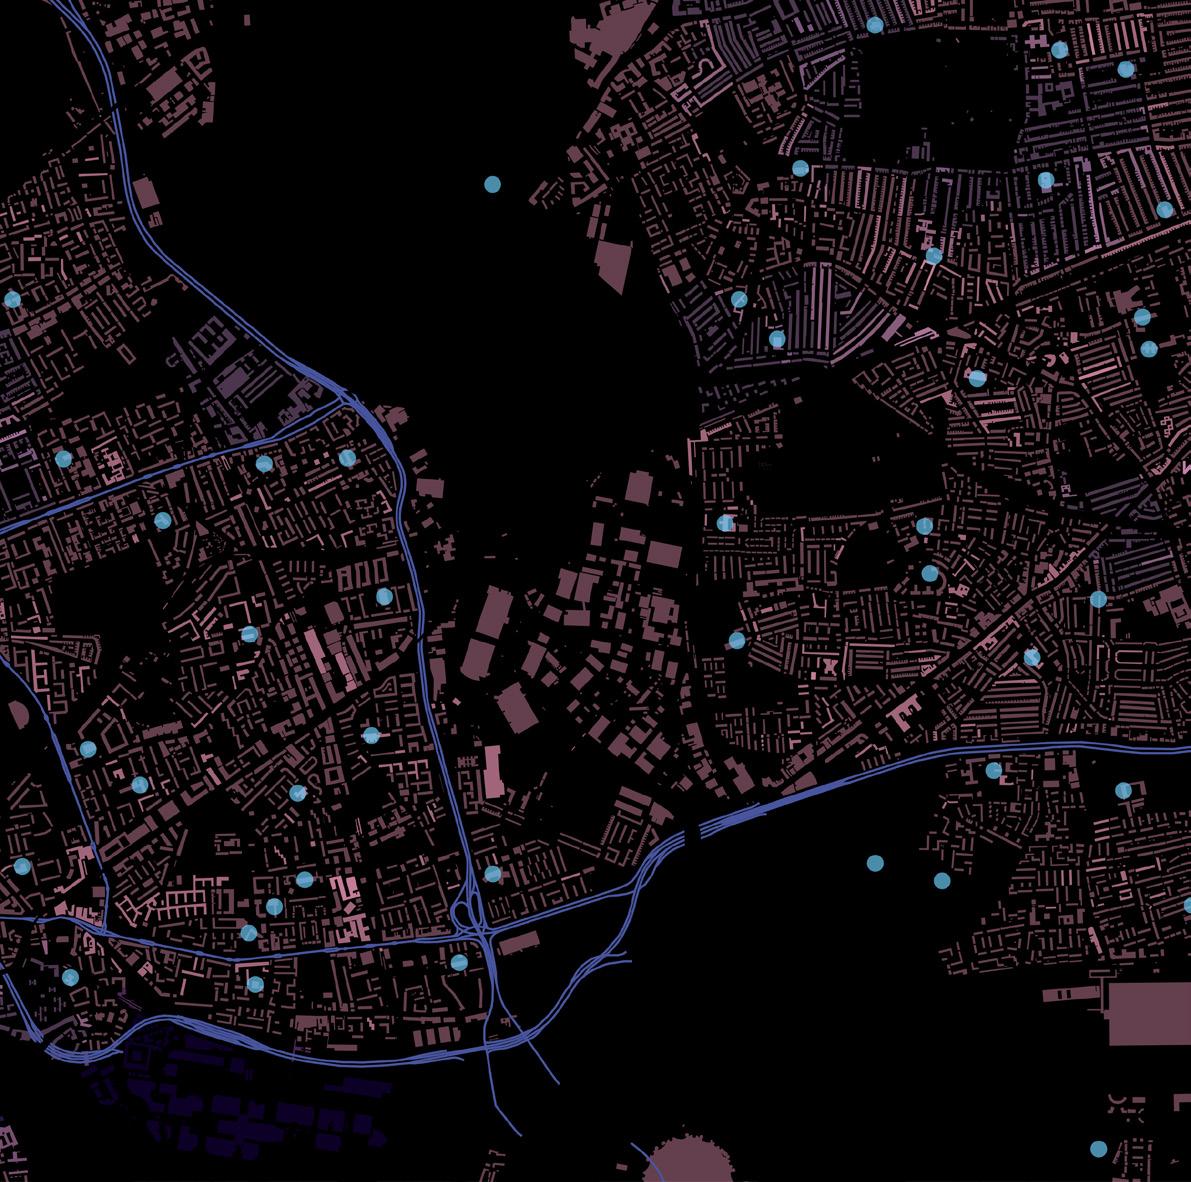
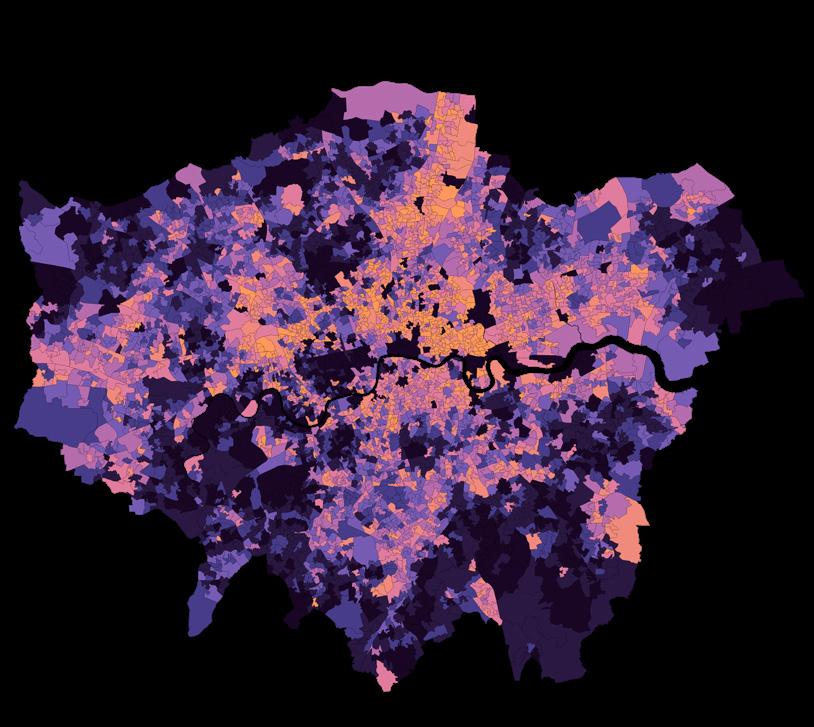
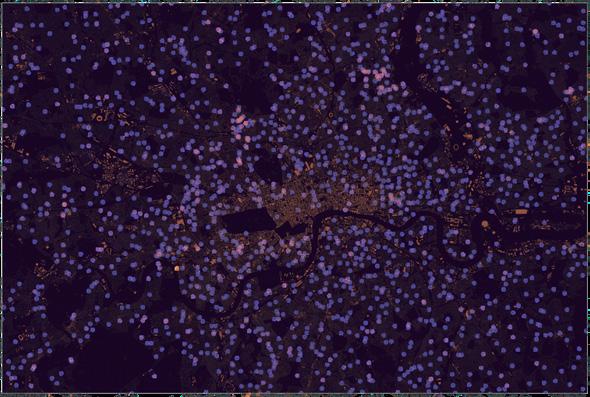
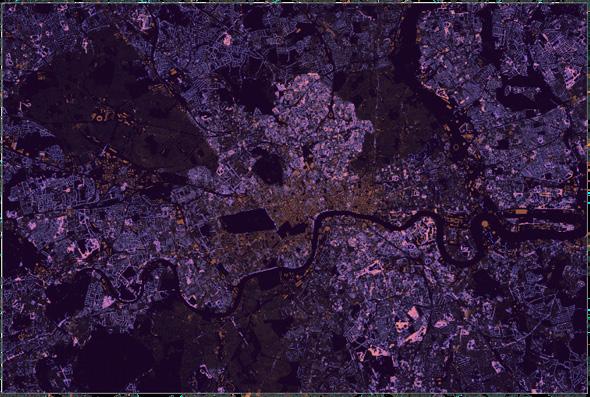
SITE RESEARCH [Macro-Scale Analysis]
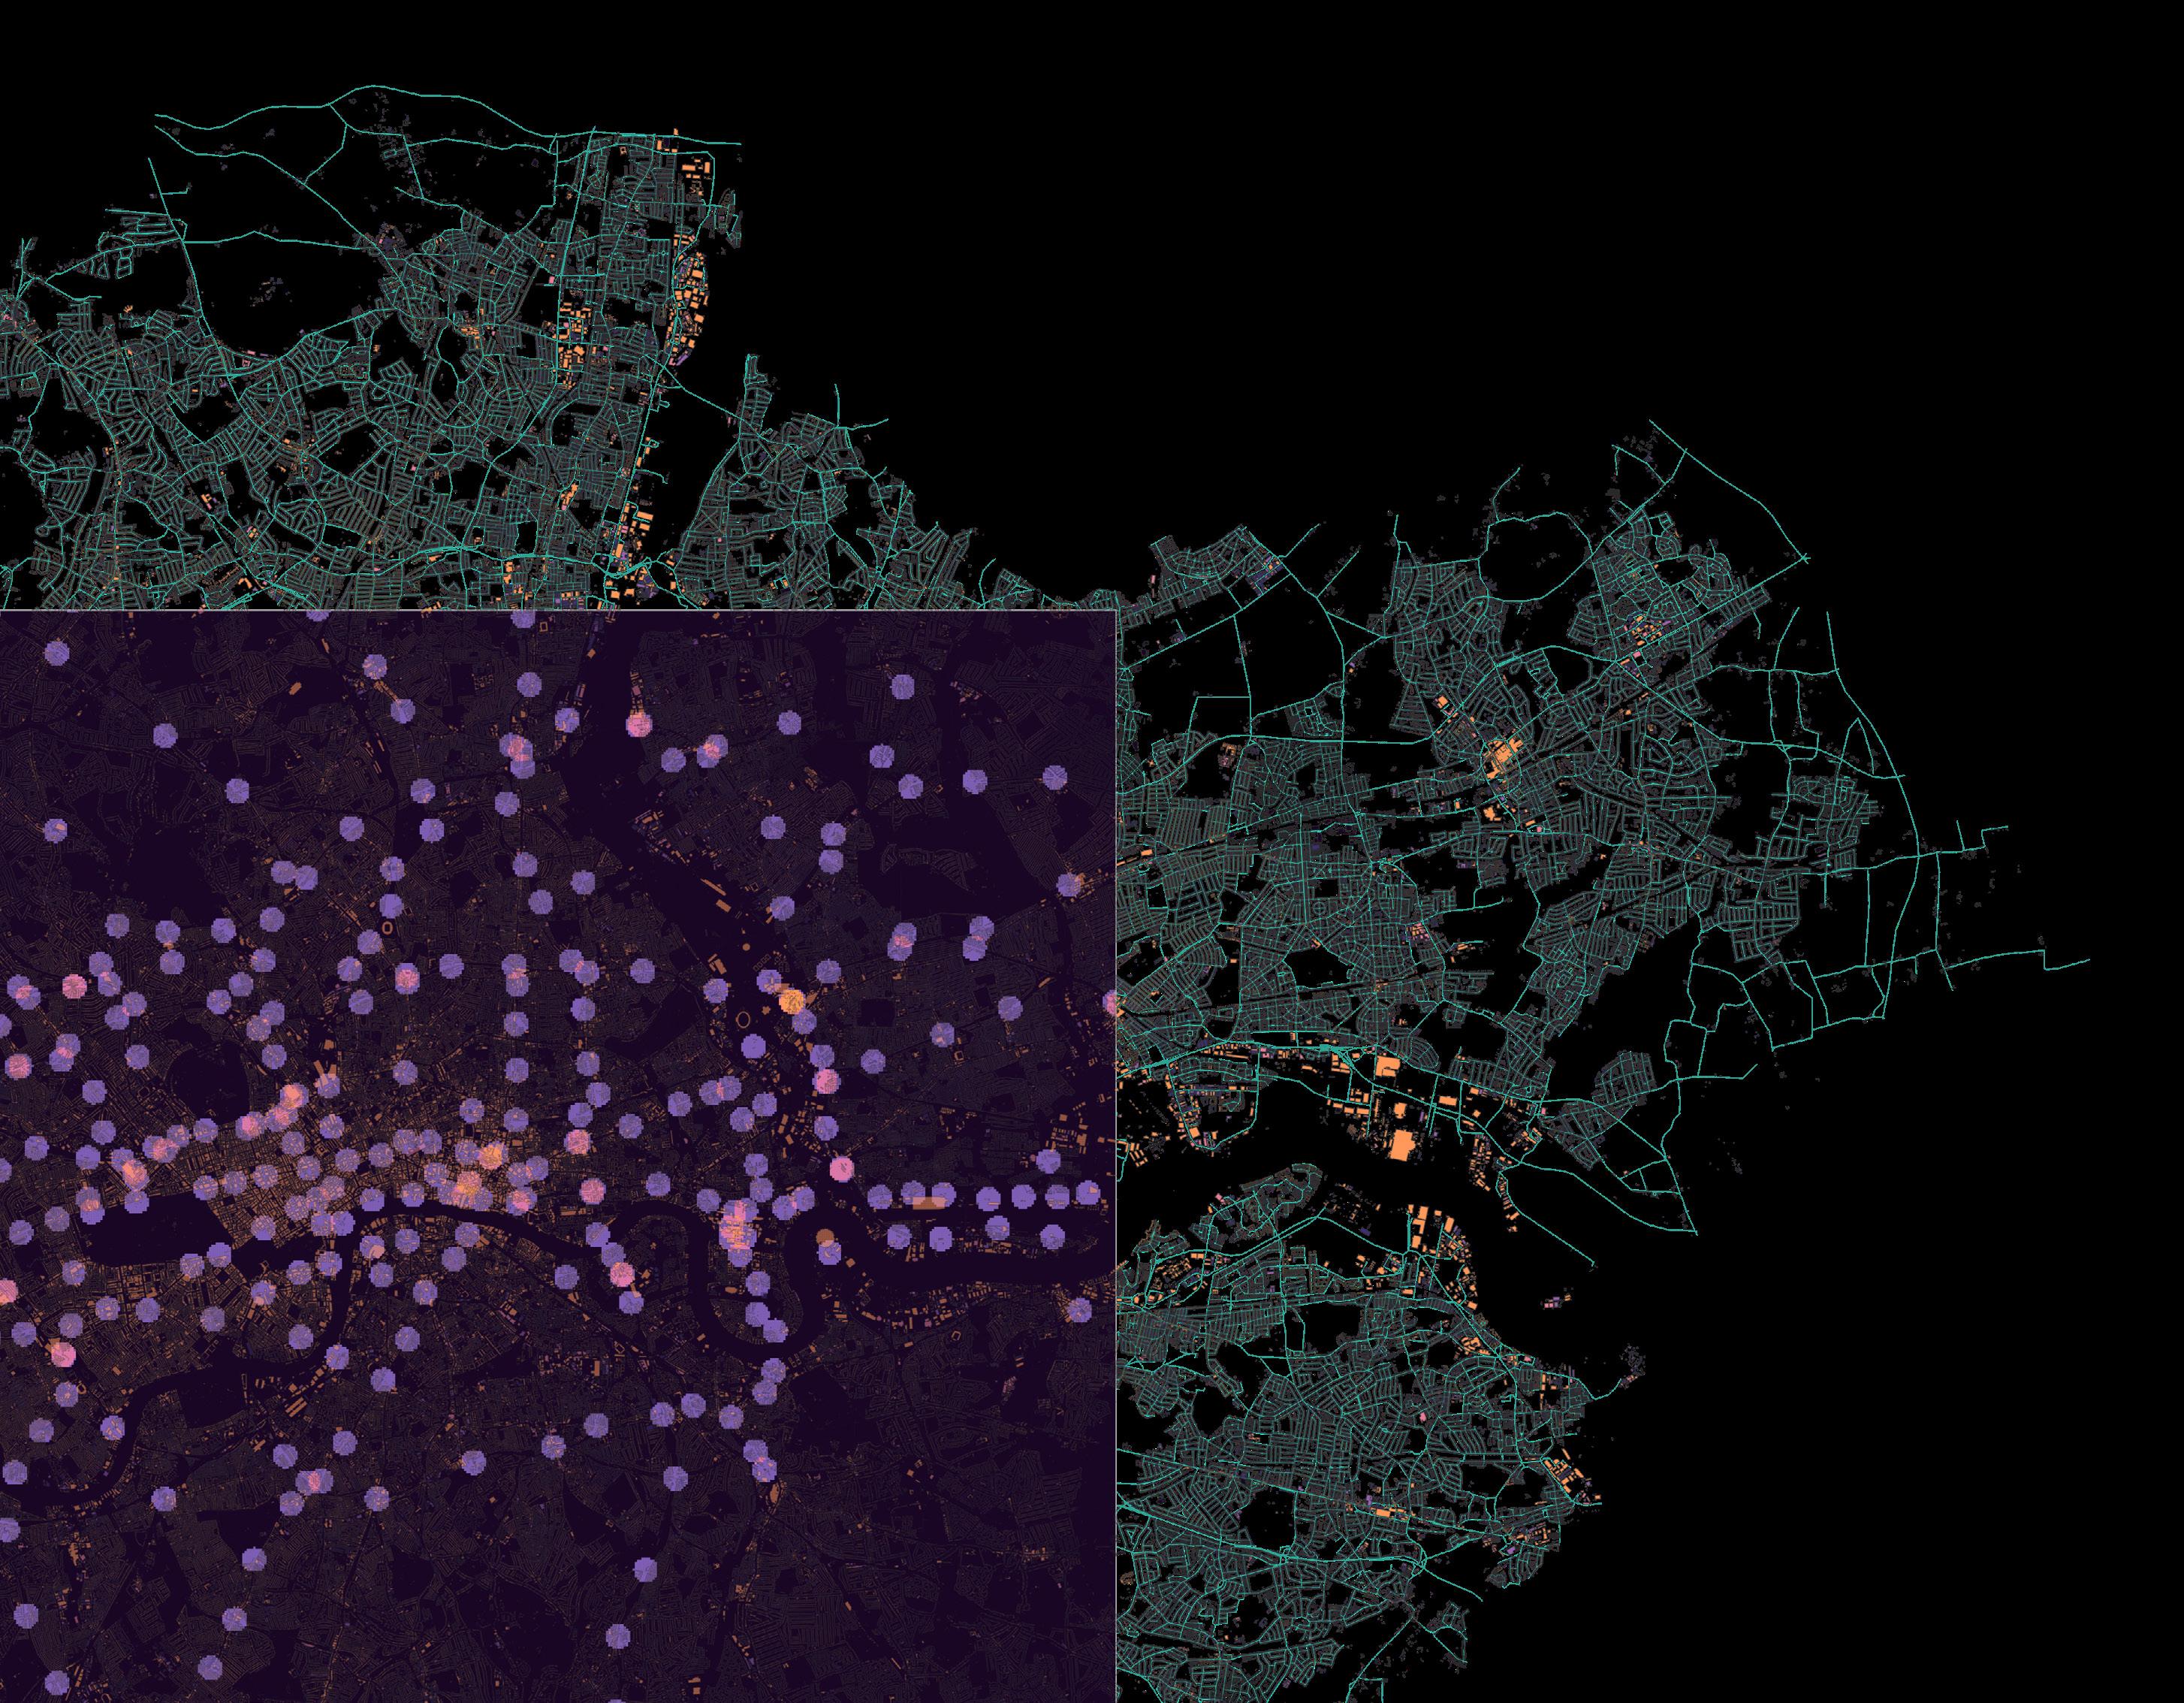
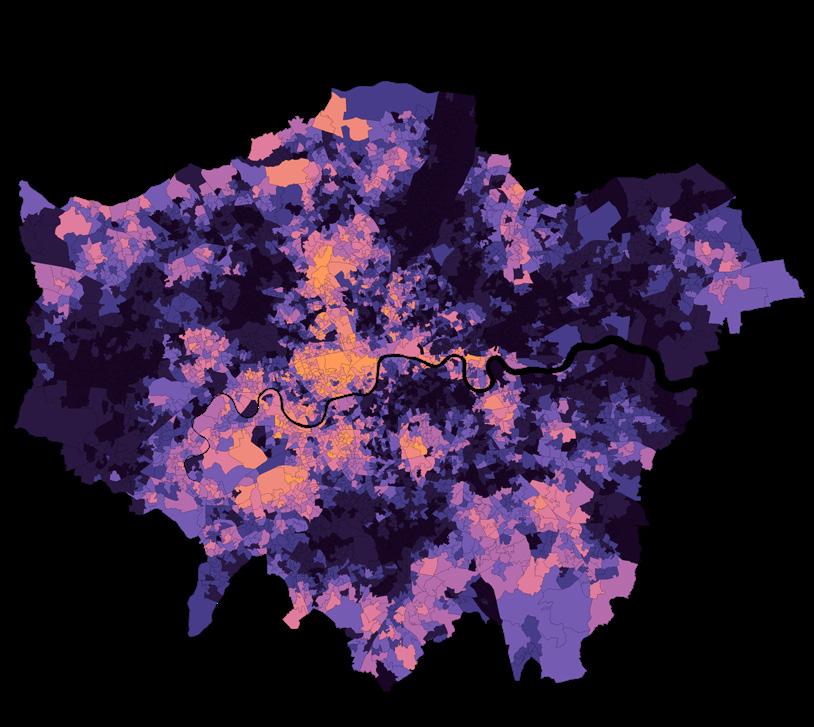
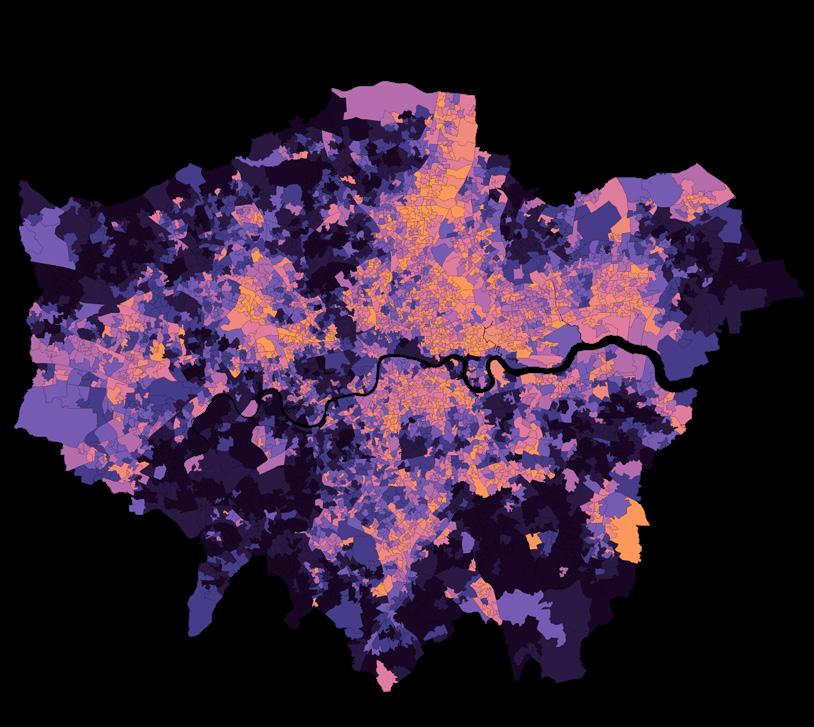
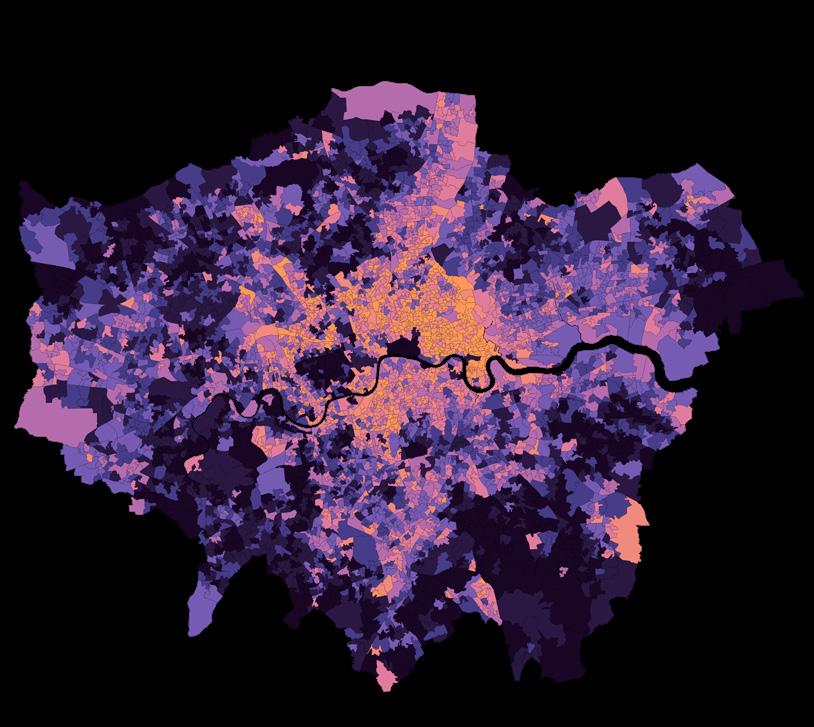
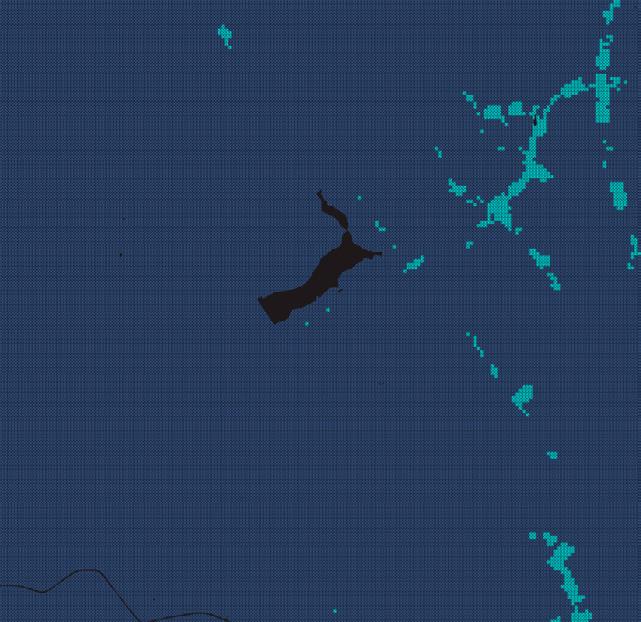
CHILD EDUCATION
LEGEND
HIGH # OF PUPILS GO TO SCHOOL COUNT
LOW # OF PUPILS GO TO SCHOOL COUNT
SCHOOL LOCATIONS
LONDON MAIN ROADS
AMOUNT OF PUPILS GOING TO SCHOOL COUNT
Brent Hackney
Hammersmith
Newham
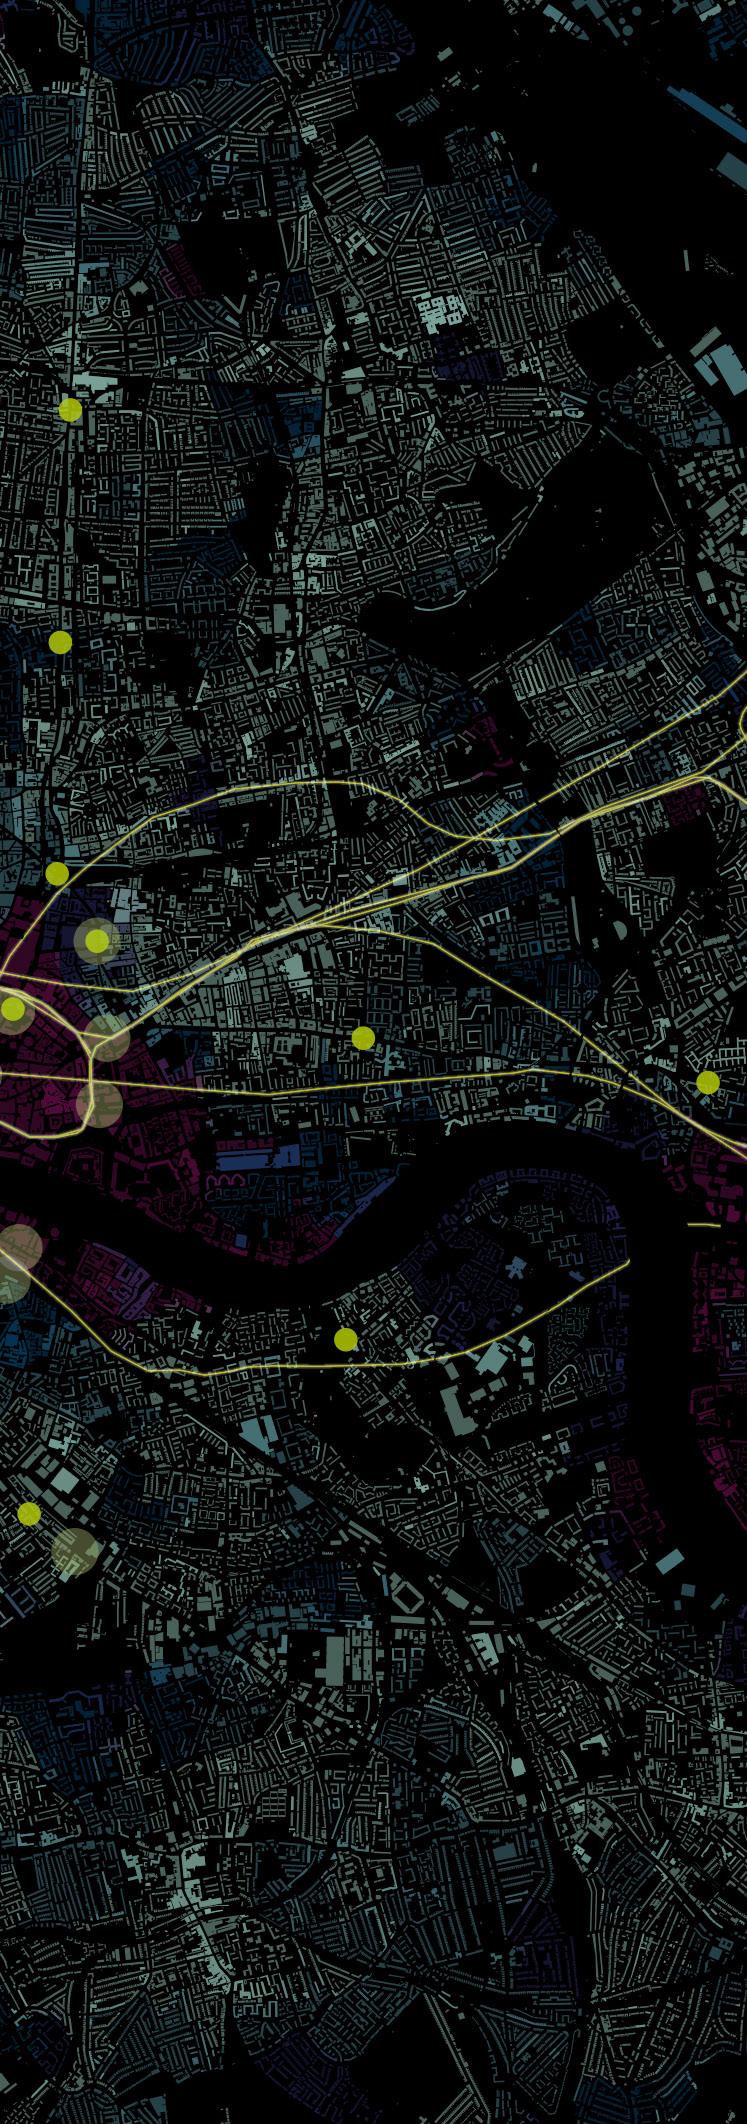
03 DATA DRIVEN ANALYSIS
# of Pupils Going to school
Children in Low Income families
Barriers to housing Services
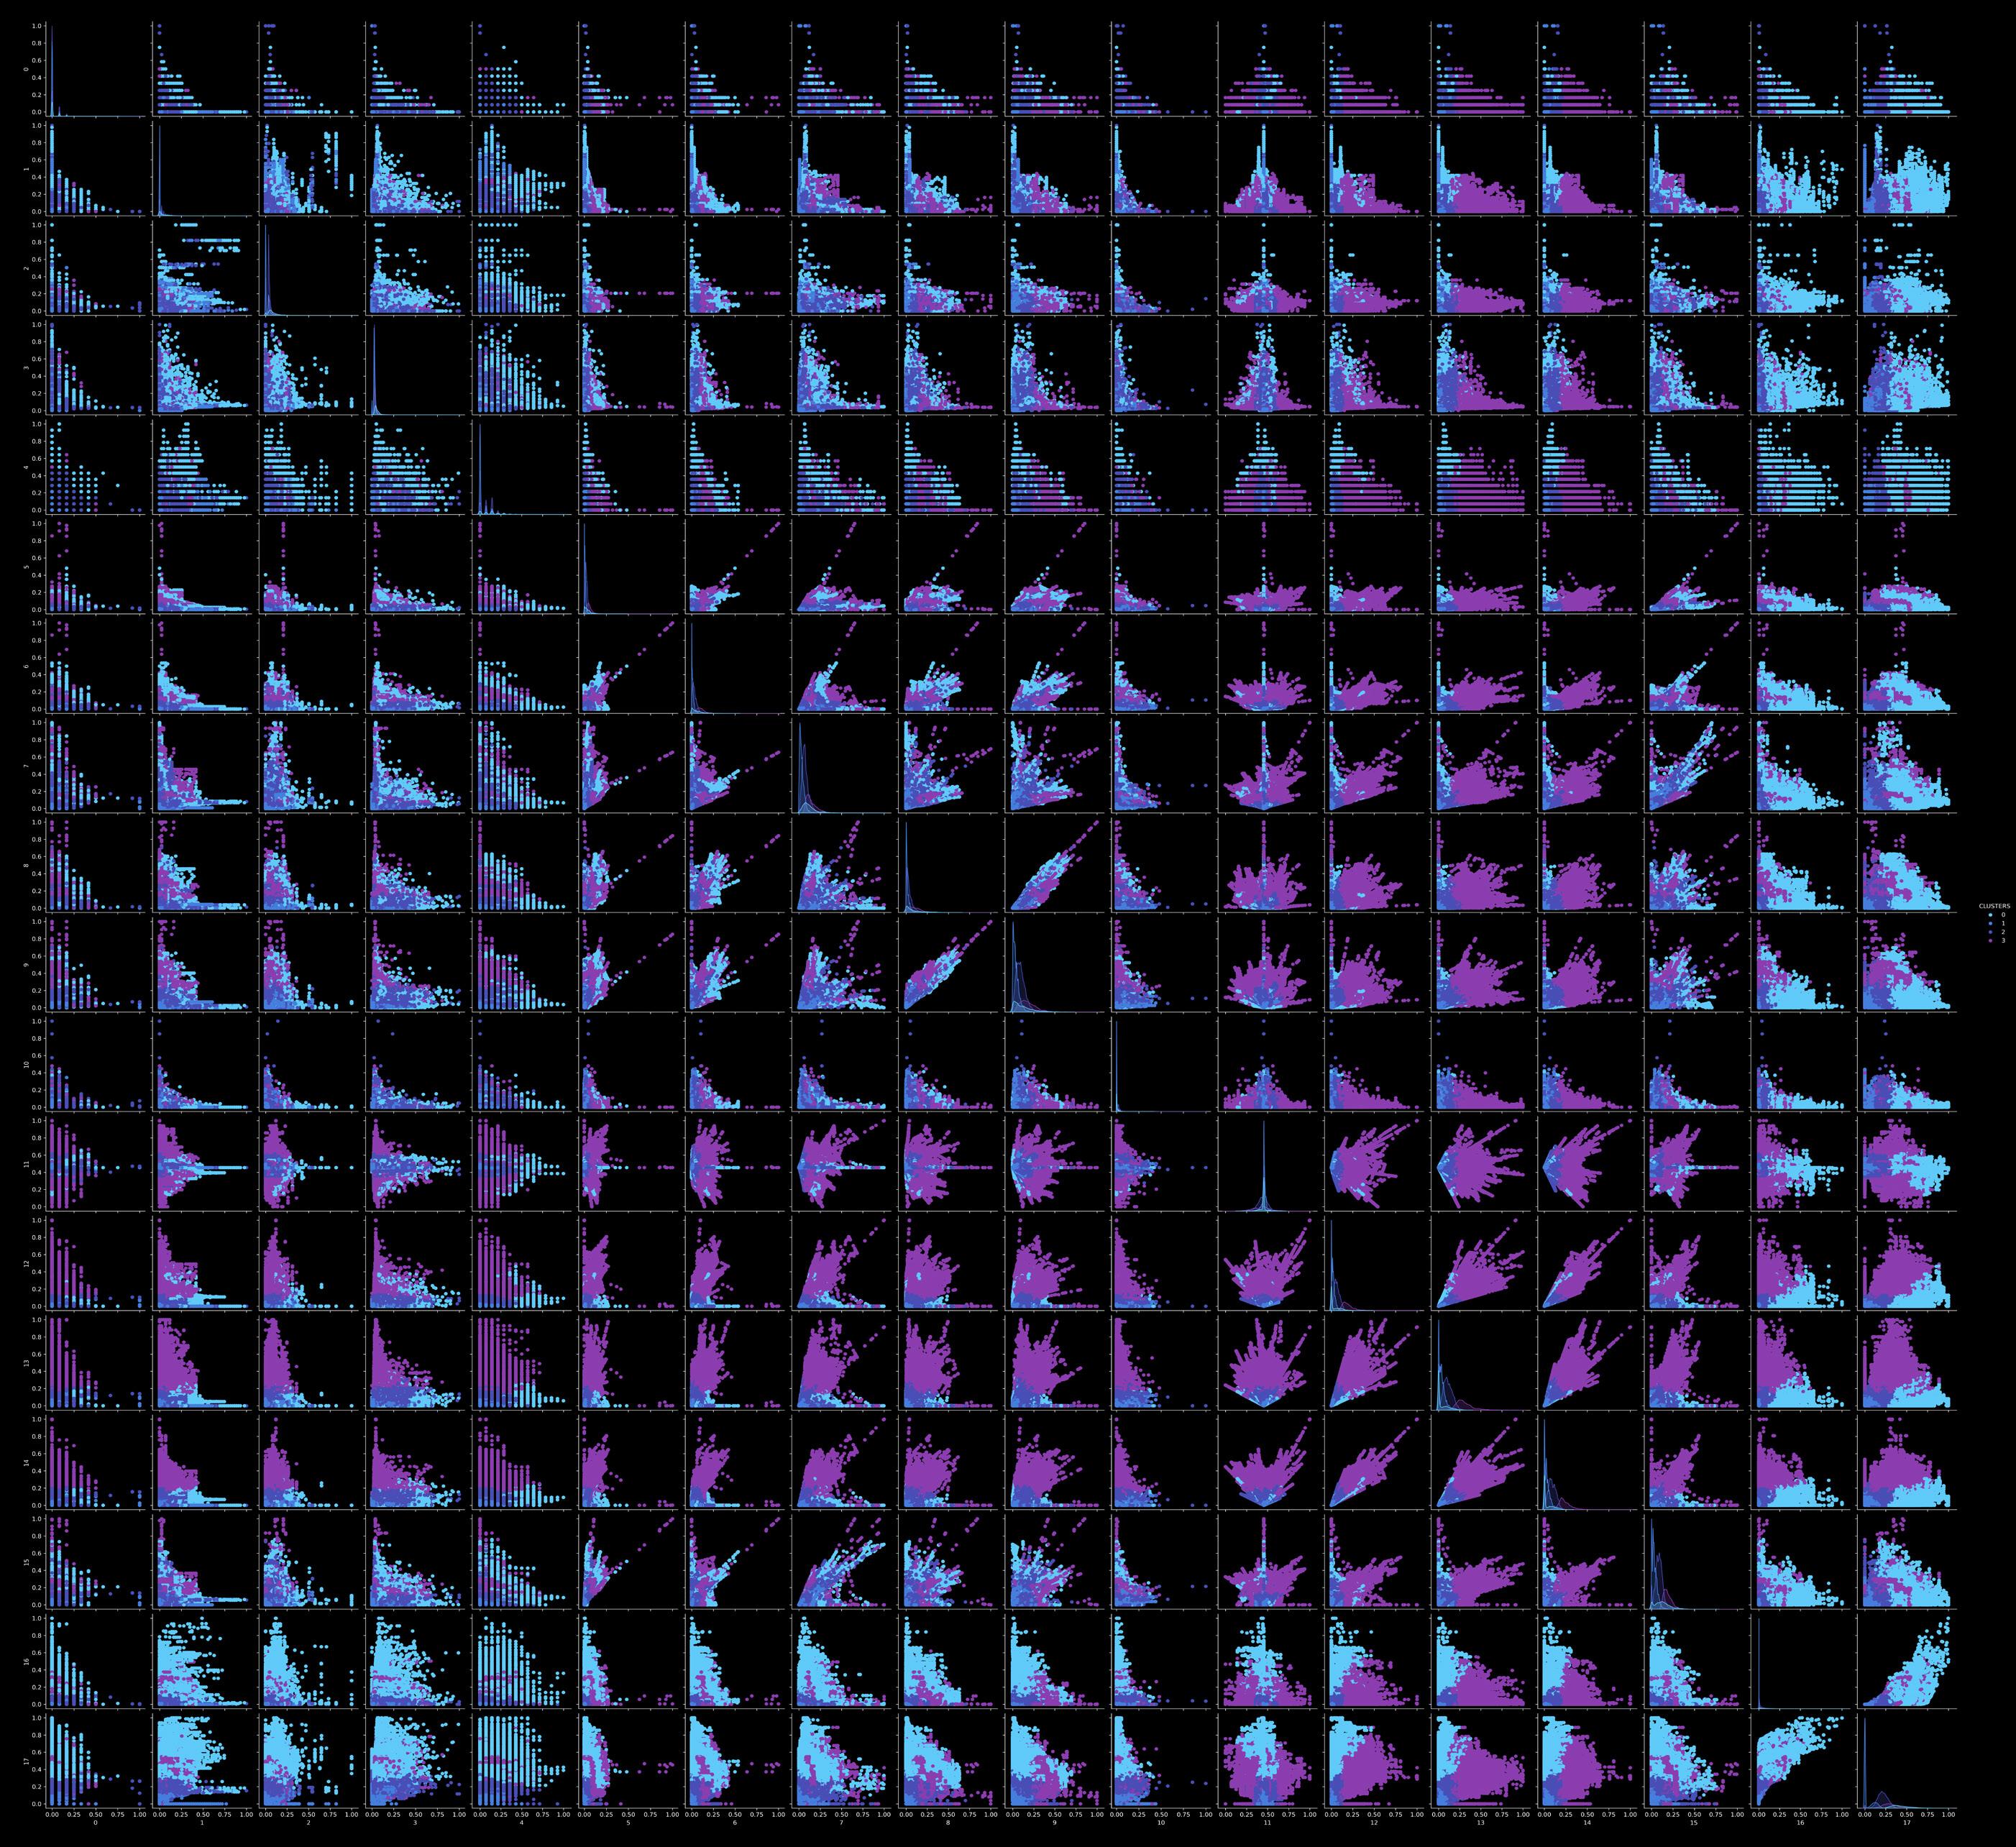
CORRELATION HEATMAP & PAIRPLOT
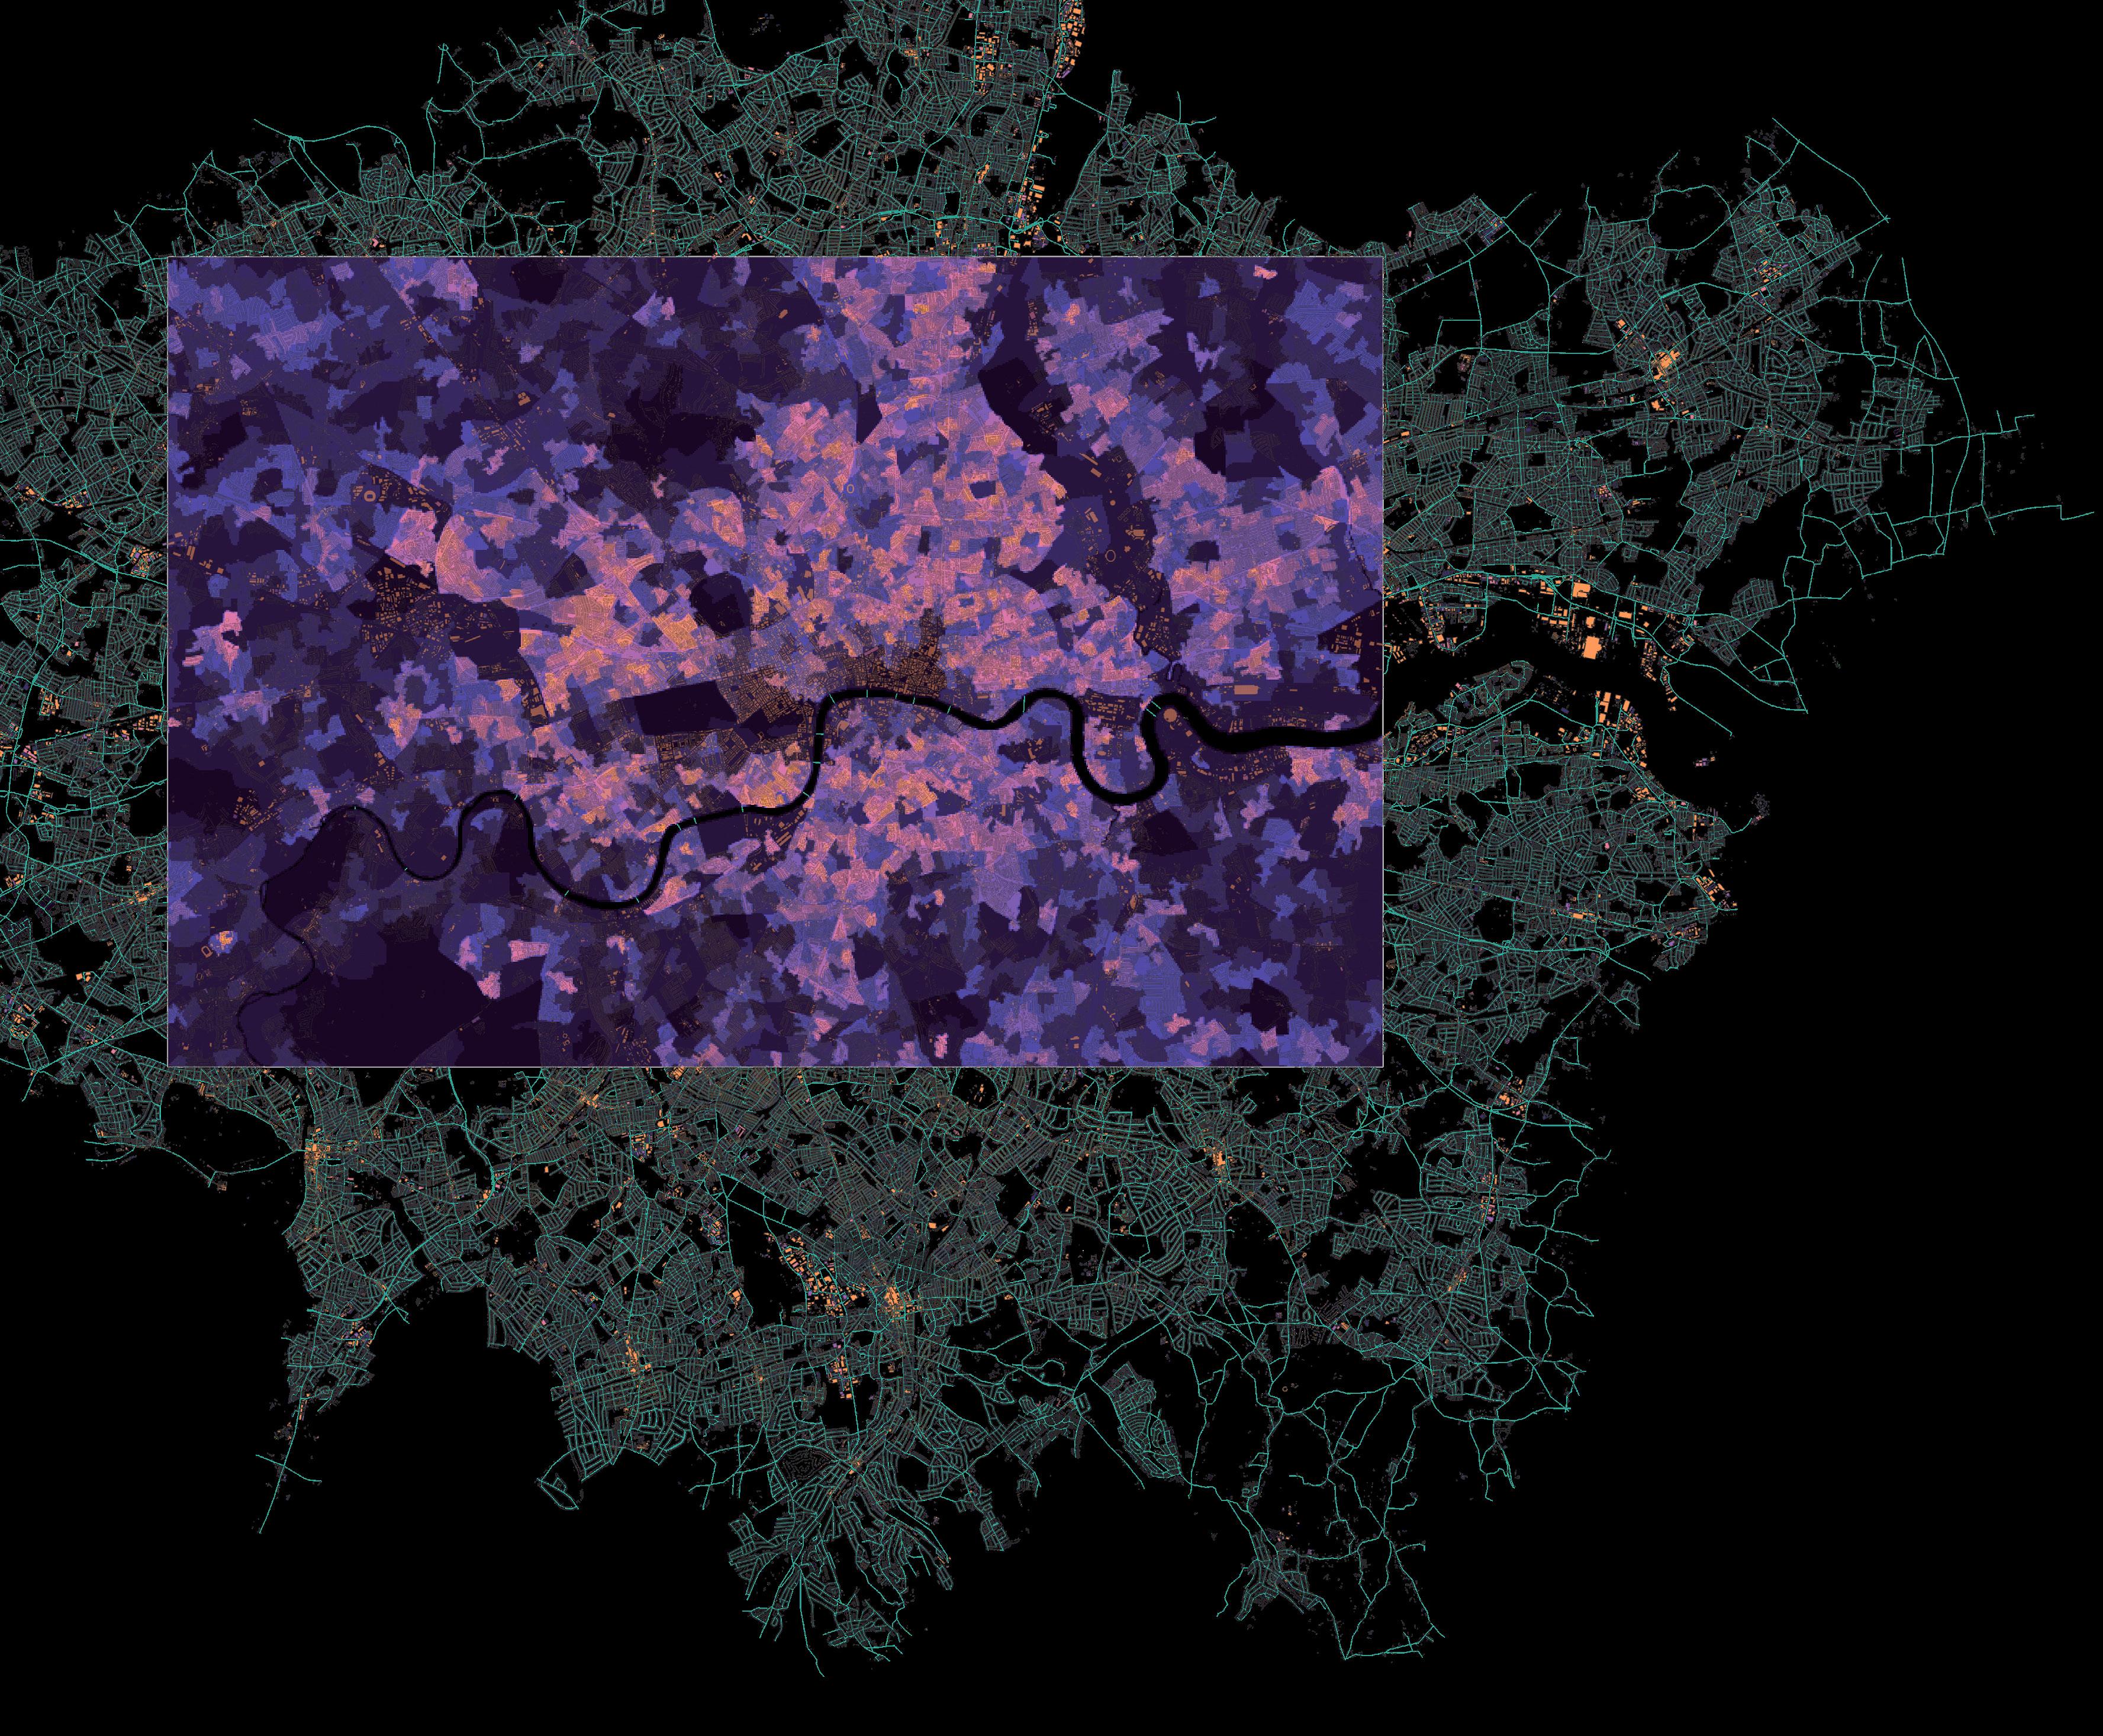
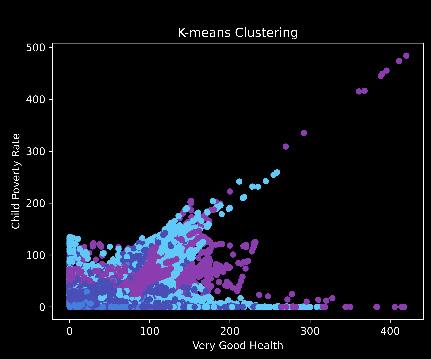
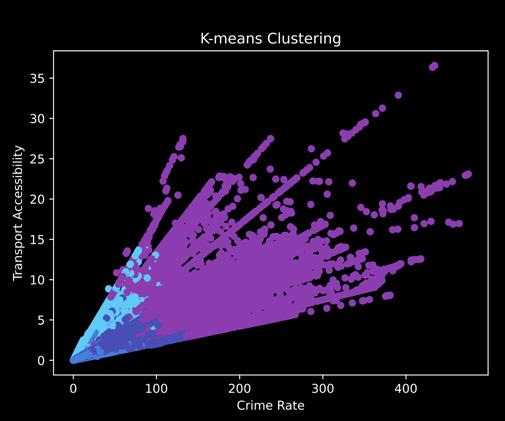
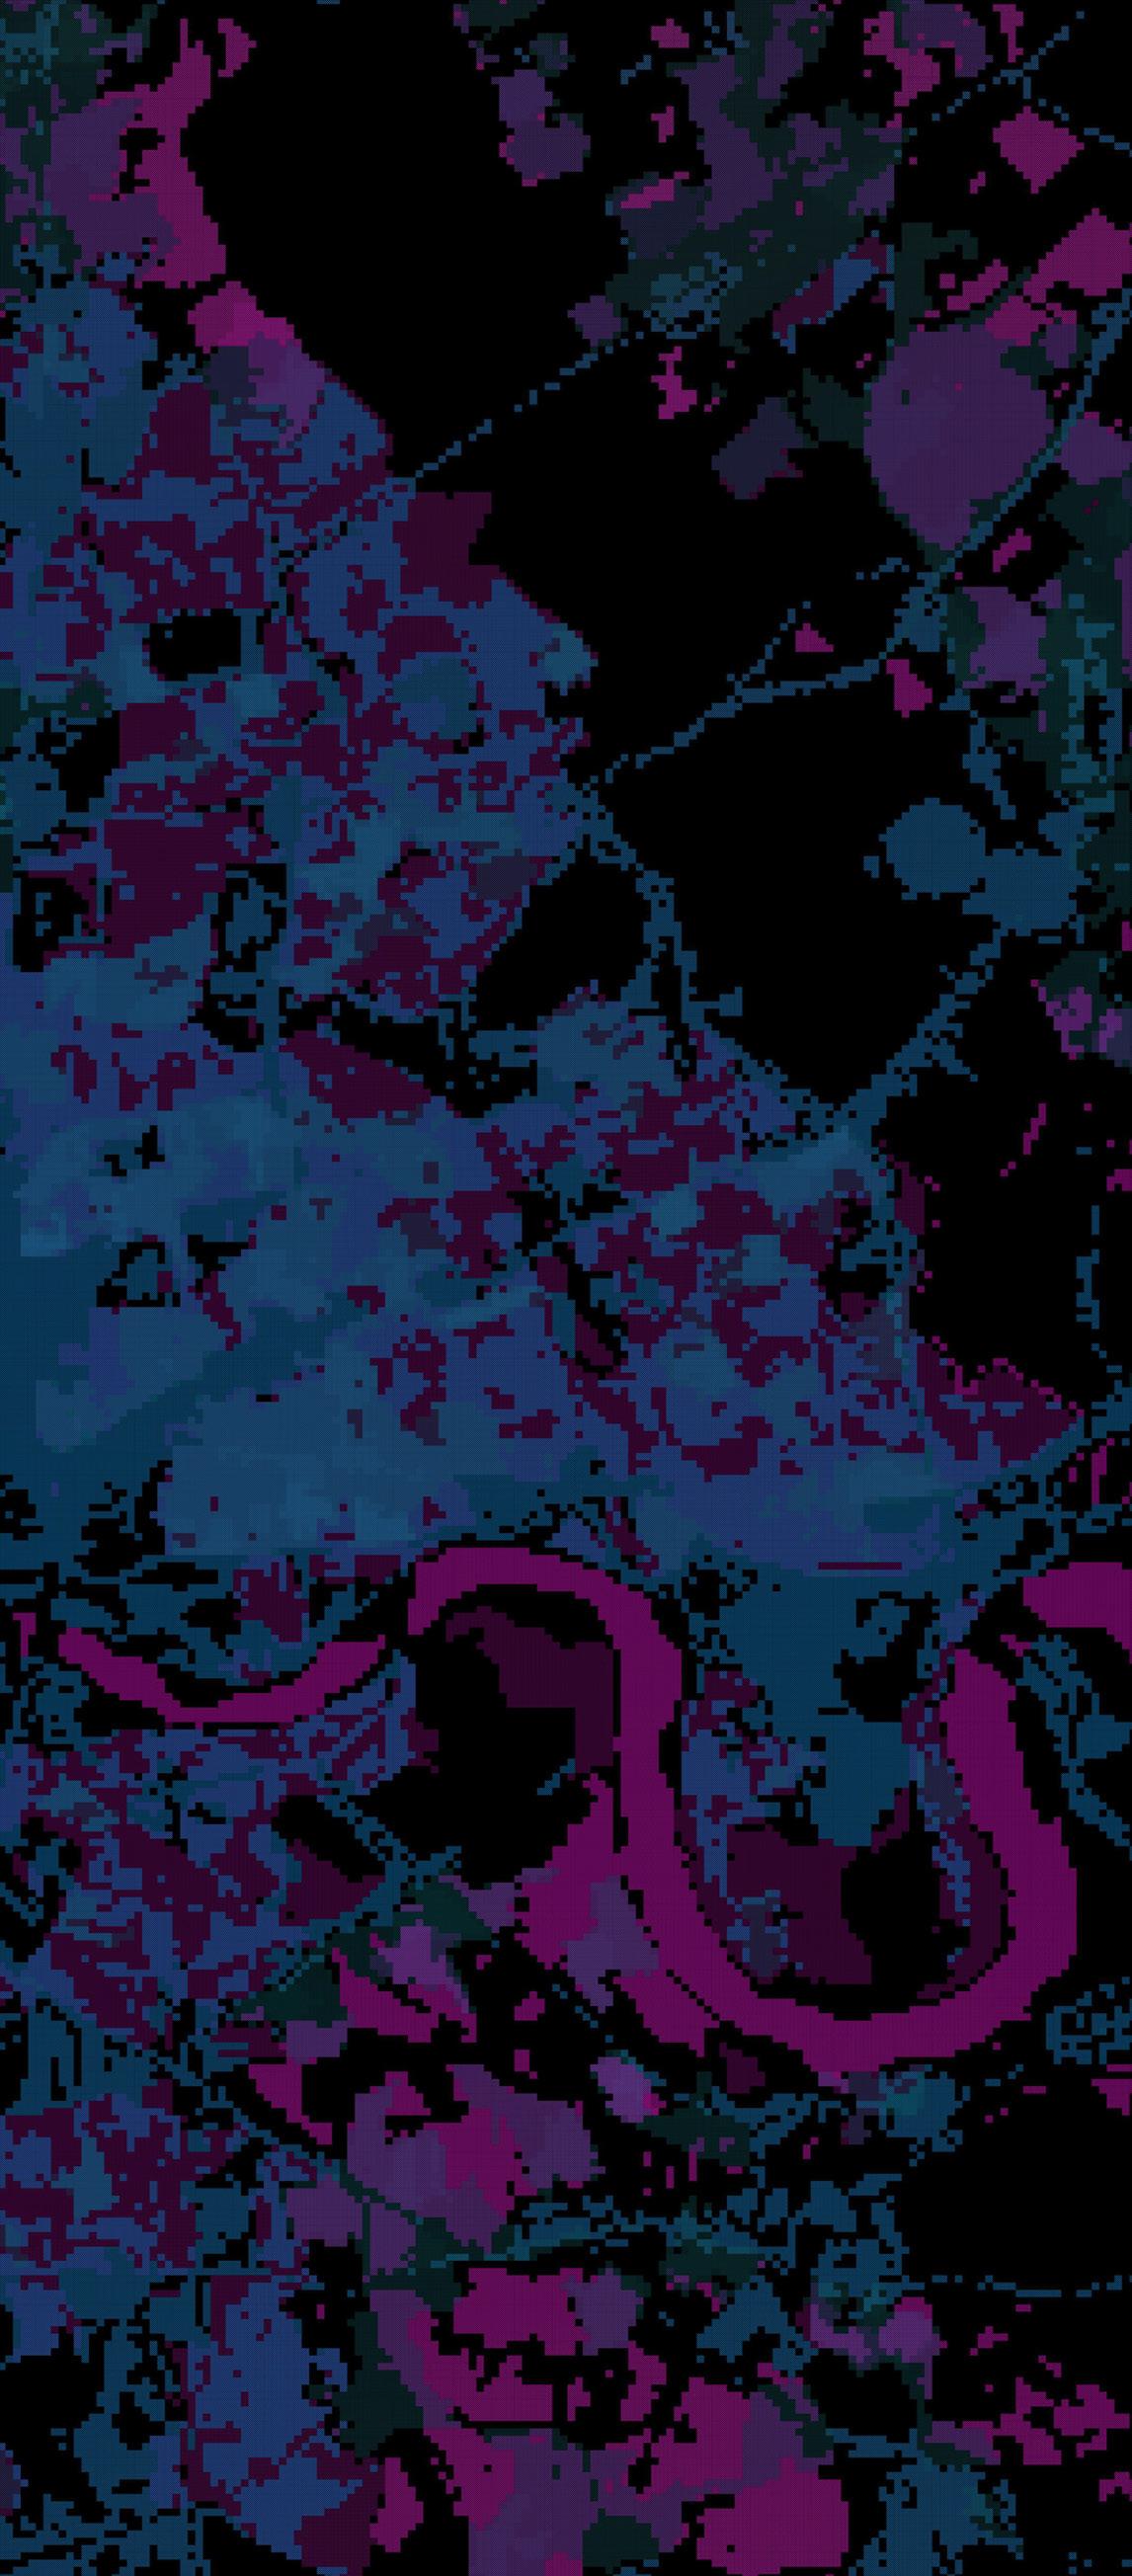
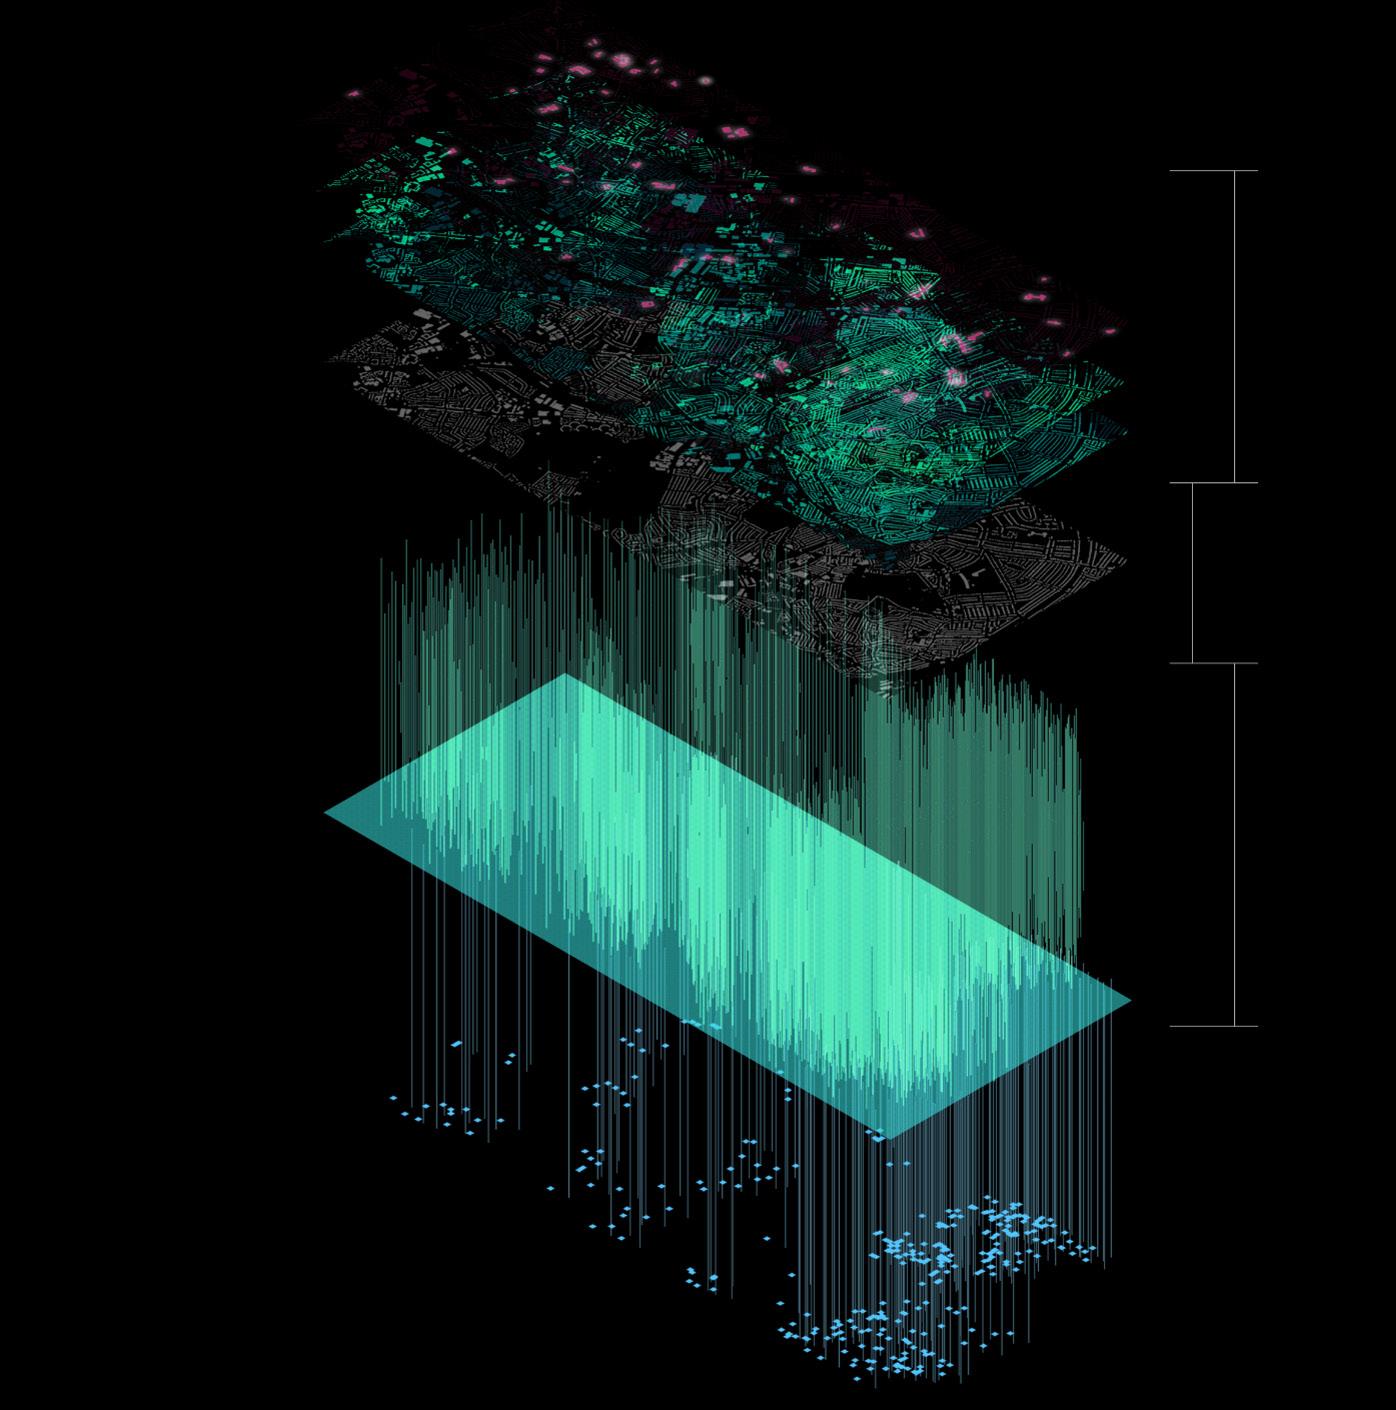
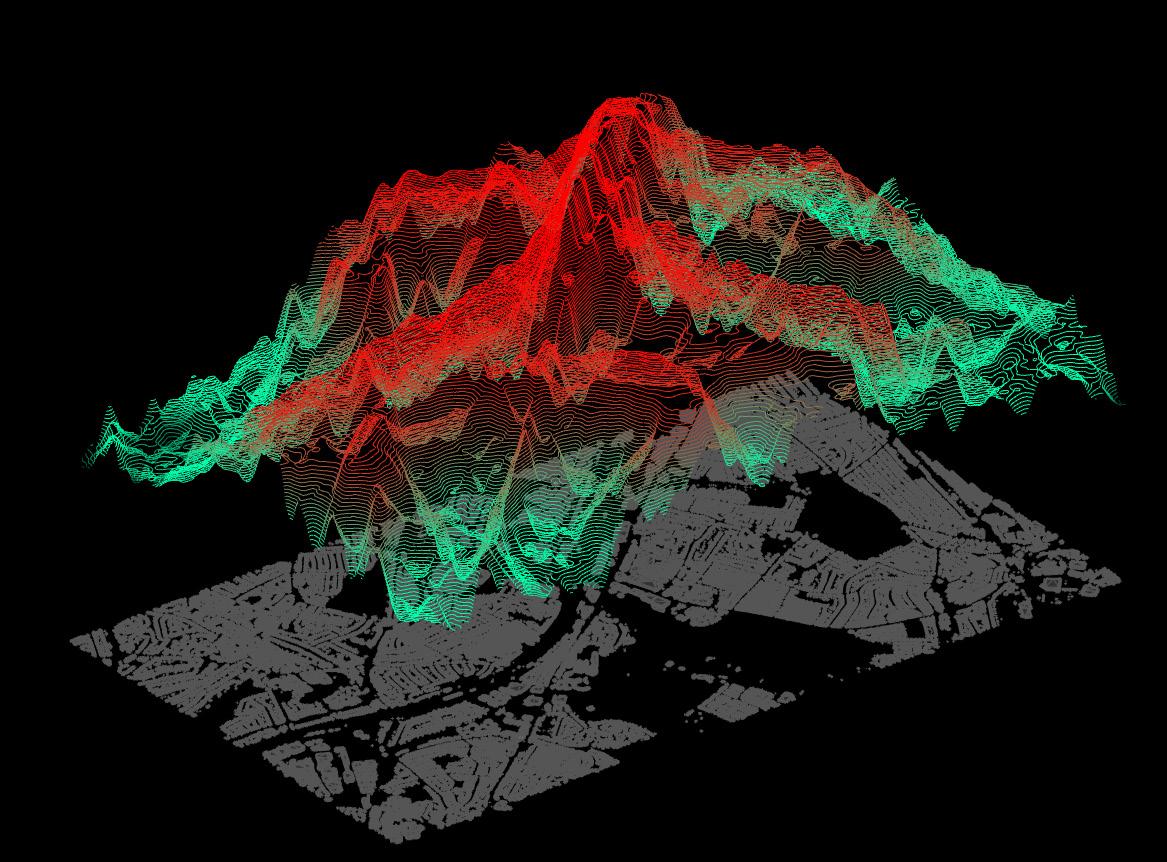
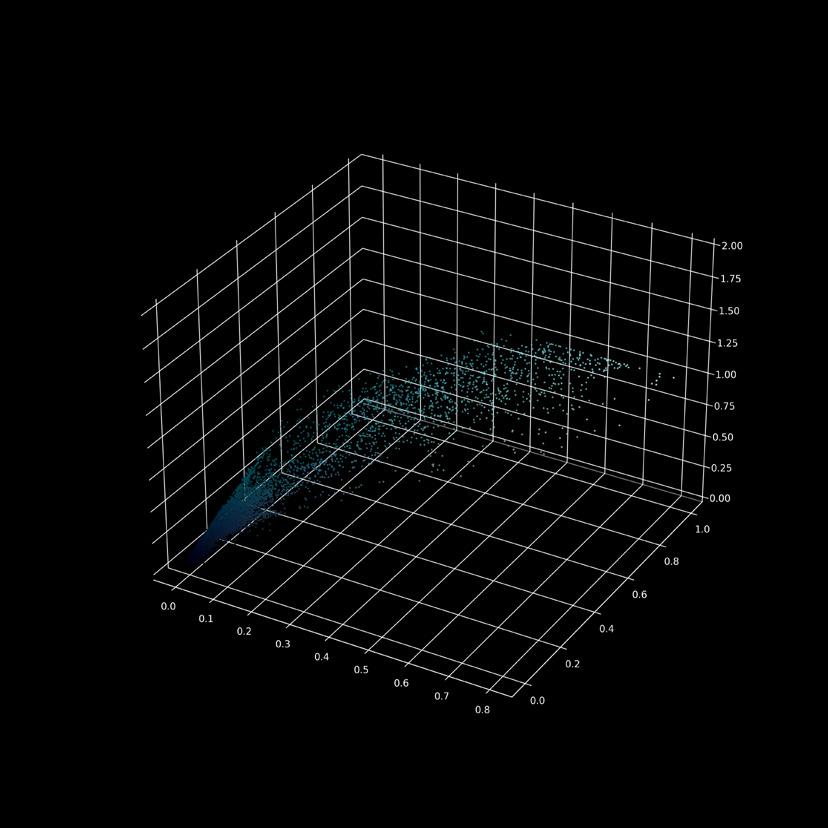
In our investigation, we analyzed the interrelations among 15 distinct datasets, encompassing variables such as building heights, air pollution, availability of free school meals, tree density, rates of child poverty, residential proximity to open spaces, transport accessibility, distribution of fast food outlets, crime statistics, obesity prevalence, health assessments, spatial configuration (space syntax), average household income, and school distributions. Our analysis found that almost most of them have a positive correlation. For example, the data sets such as the school locations and air pollution are not at all related. Meanwhile some datasets such as obesity percentage and transport accessibility are positively correlated.
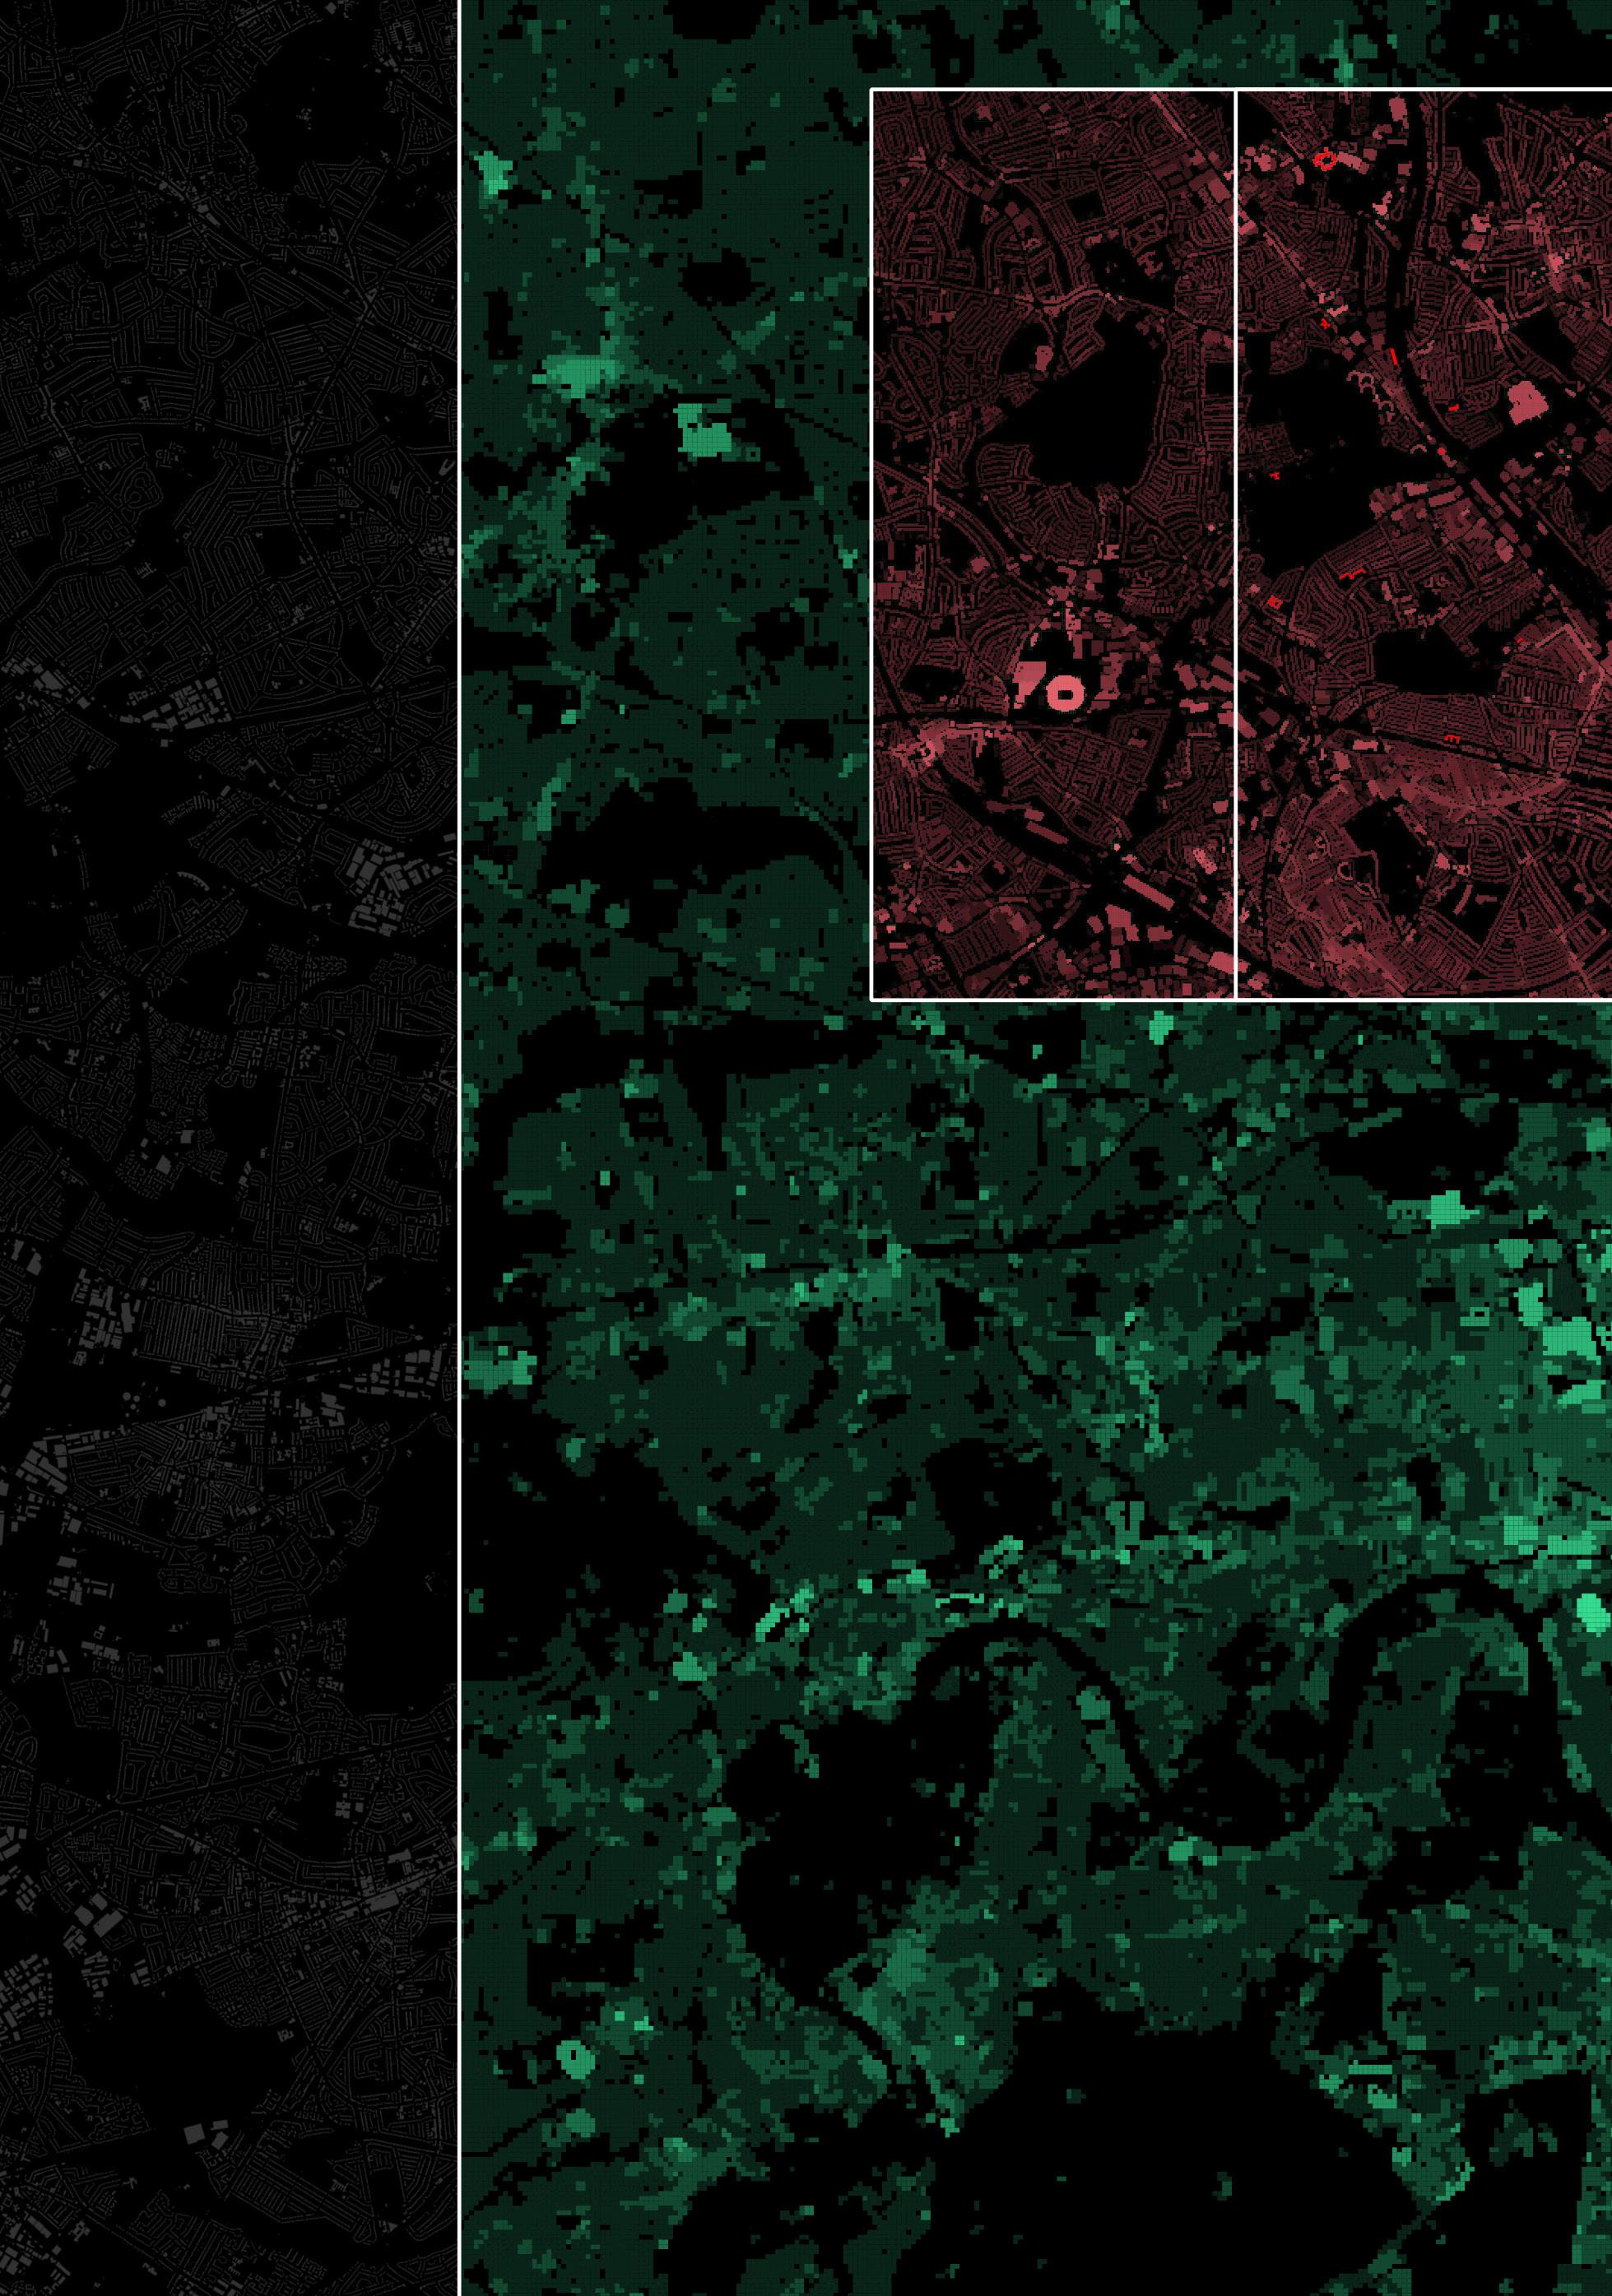
PRINCIPAL COMPONENT ANALYSIS
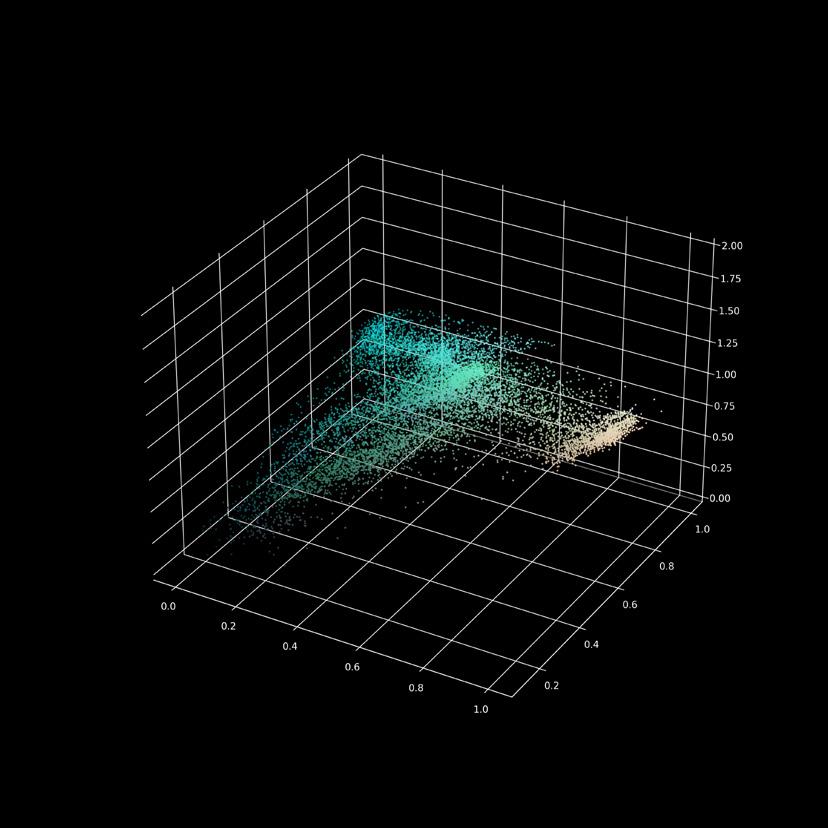
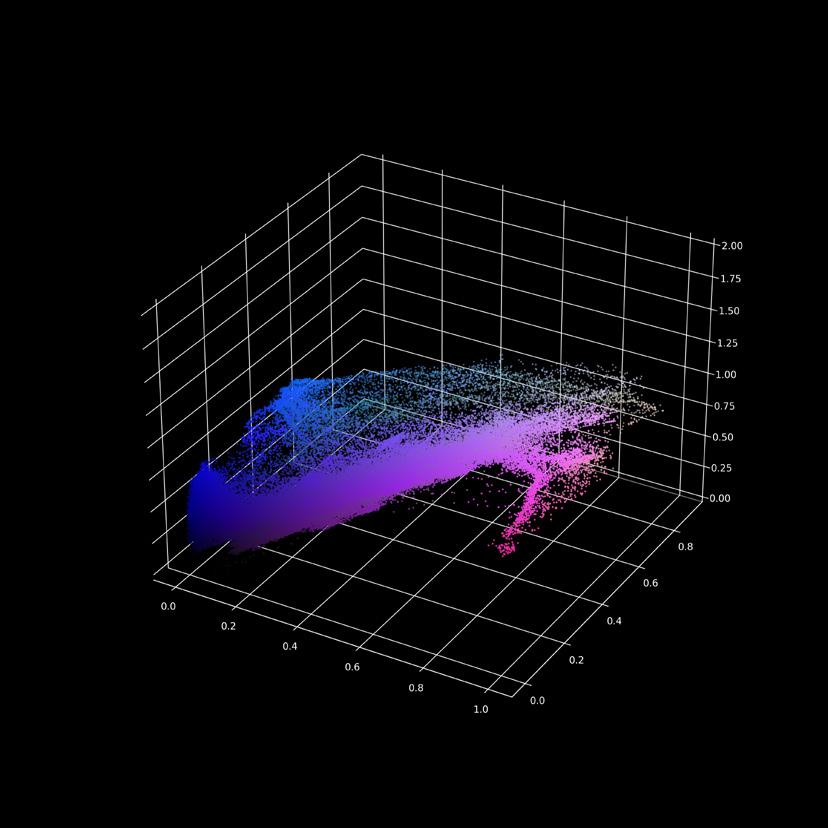
In our analysis, we applied Principal Component Analysis (PCA) to our multifaceted dataset, which revealed three distinct components. PCA 0 showcased datasets with strong positive correlations, PCA 1 included datasets with negative correlations and a wider spread across the conceptual space, and PCA 2 combined elements from both previous components.
LEGEND
High points of PCA 0
High points of PCA 1
High Points of PCA 2
LEGEND
High points of PCA 0
High points of PCA 1
High Points of PCA 2
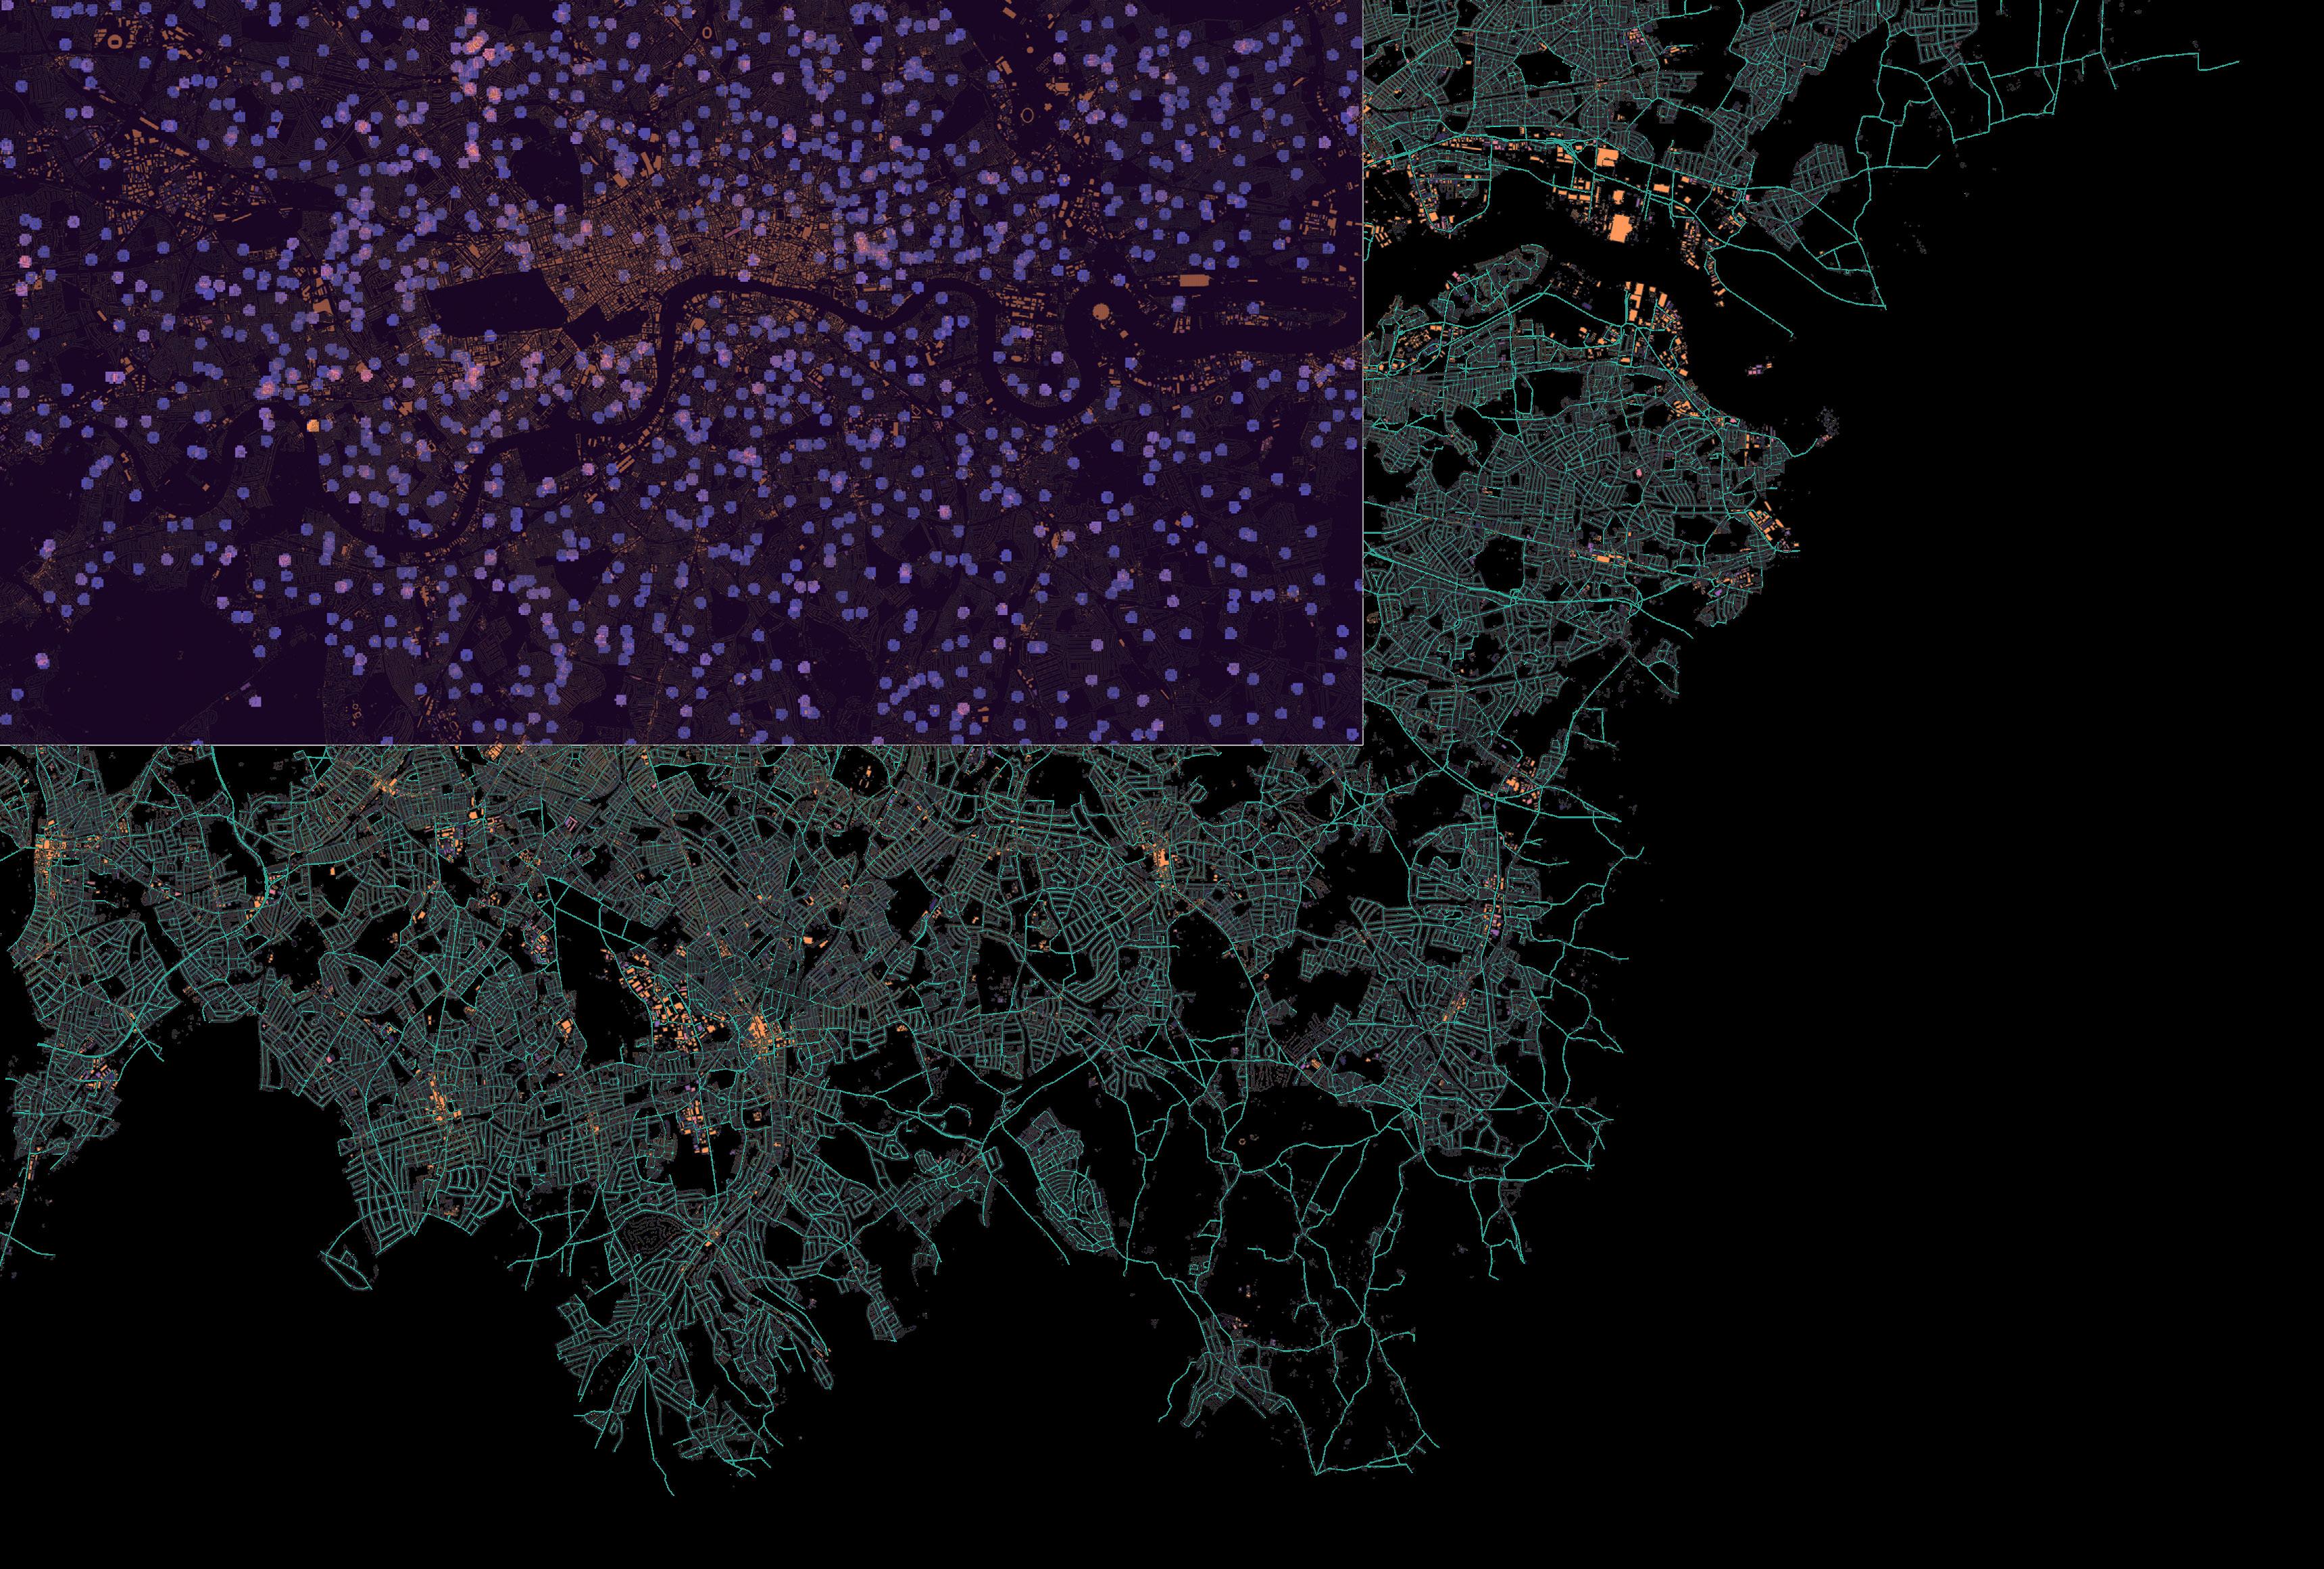
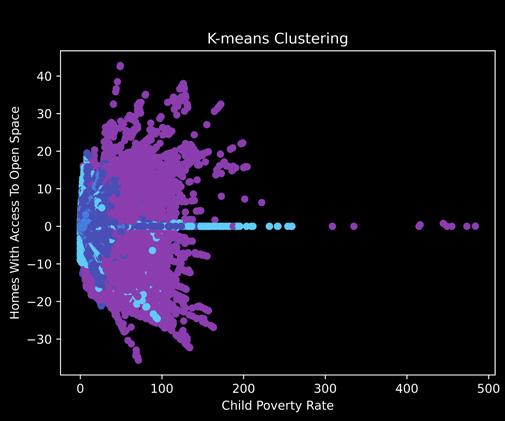
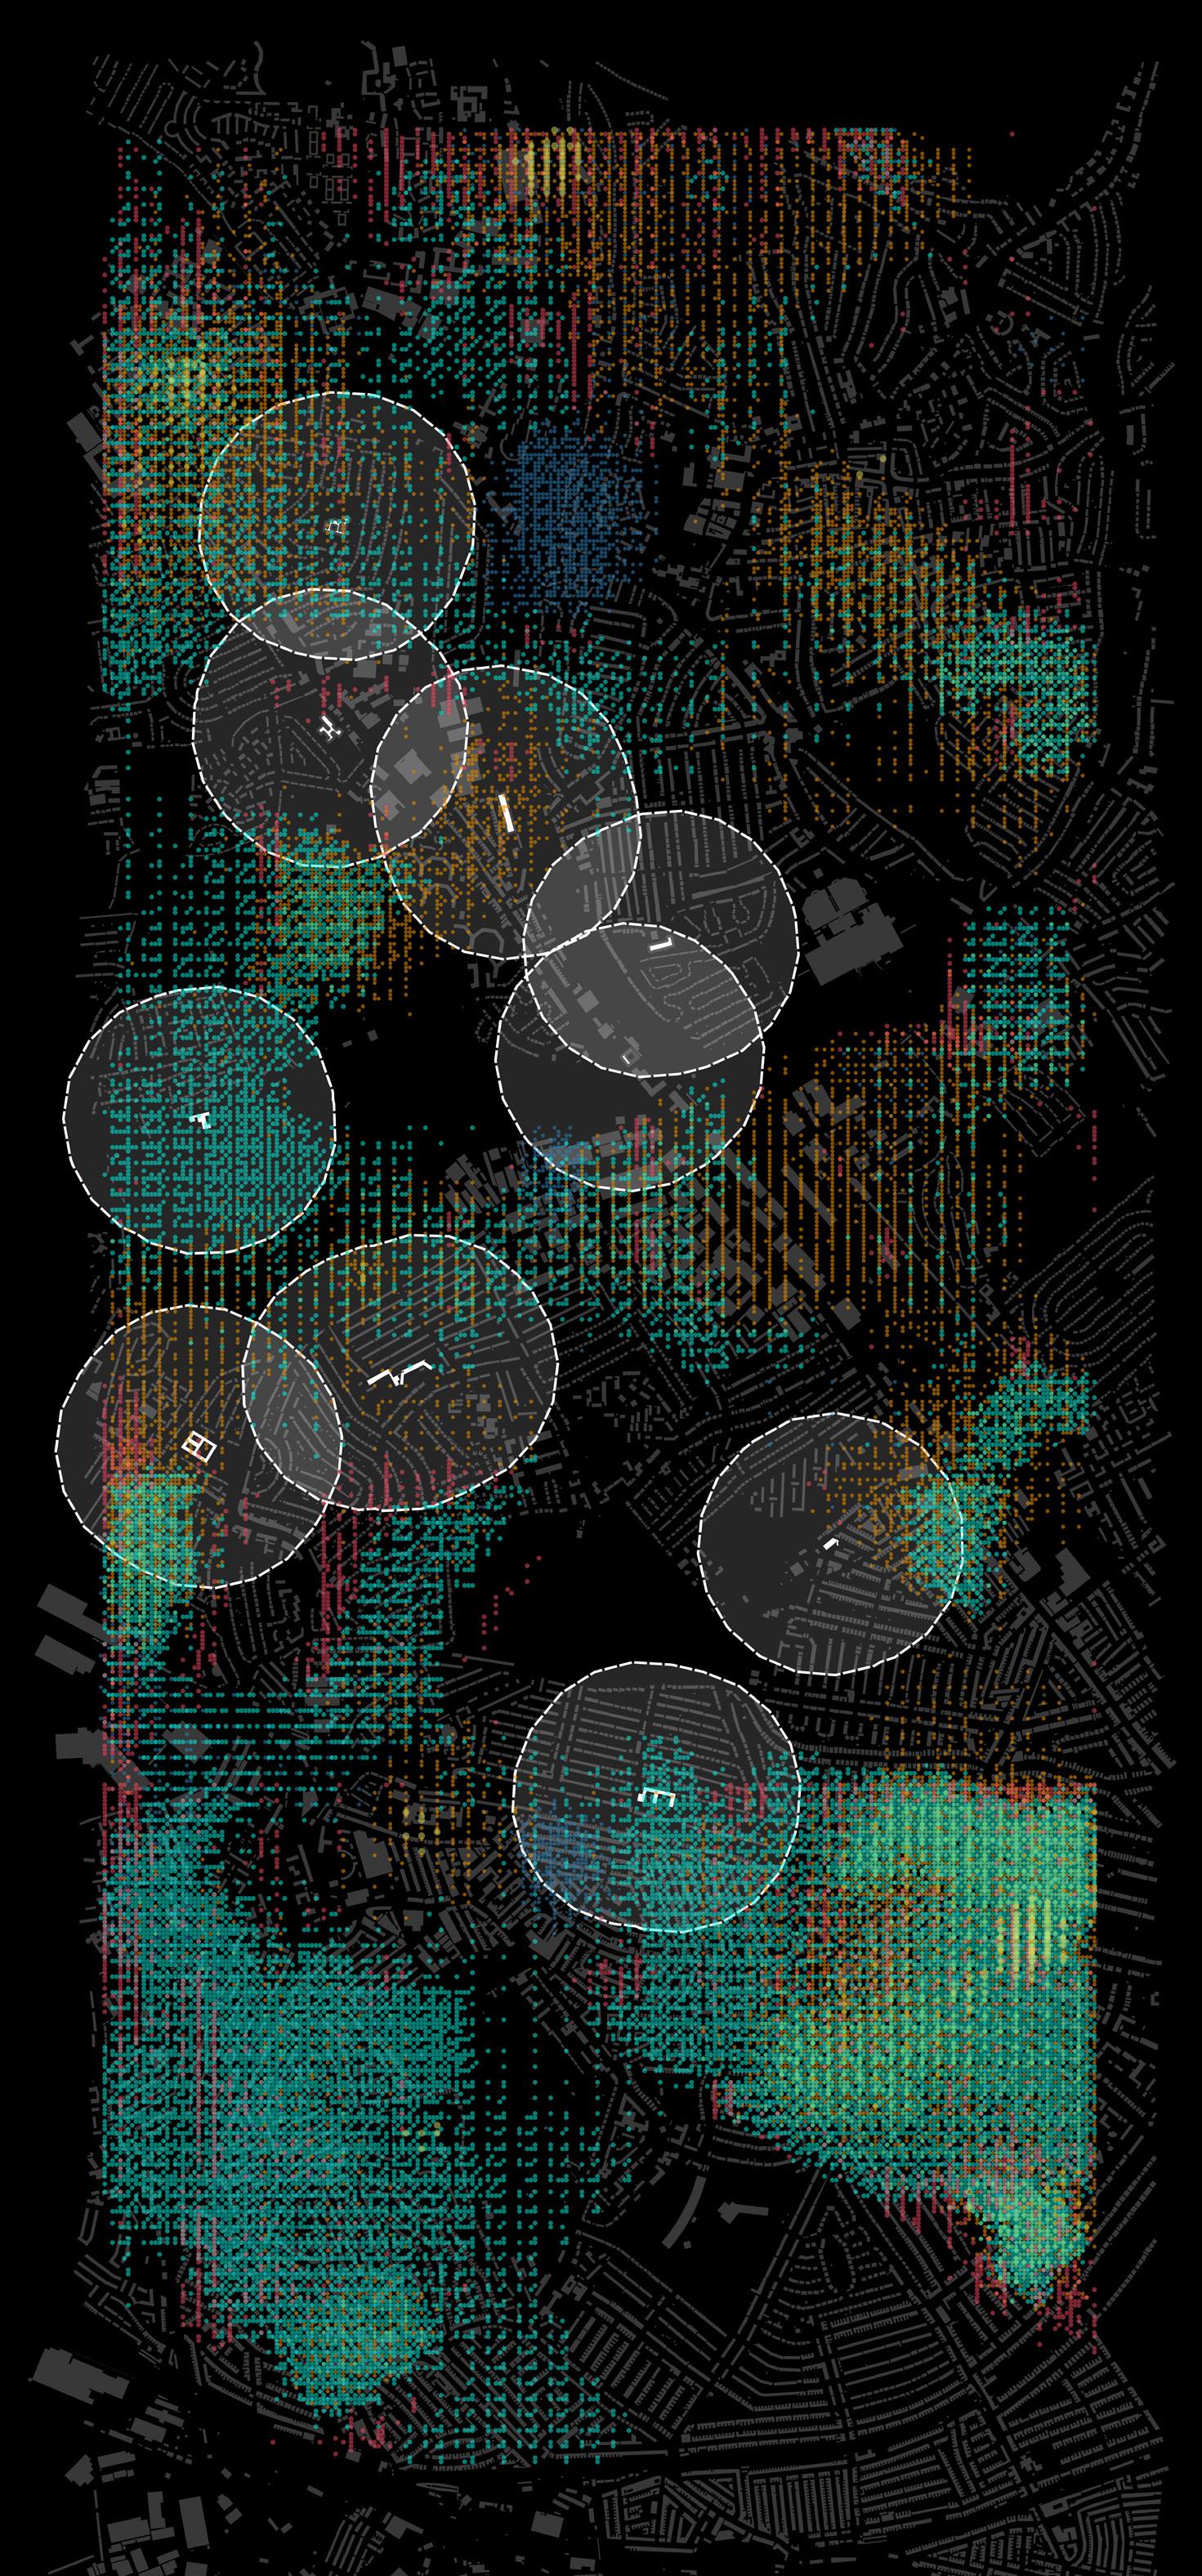
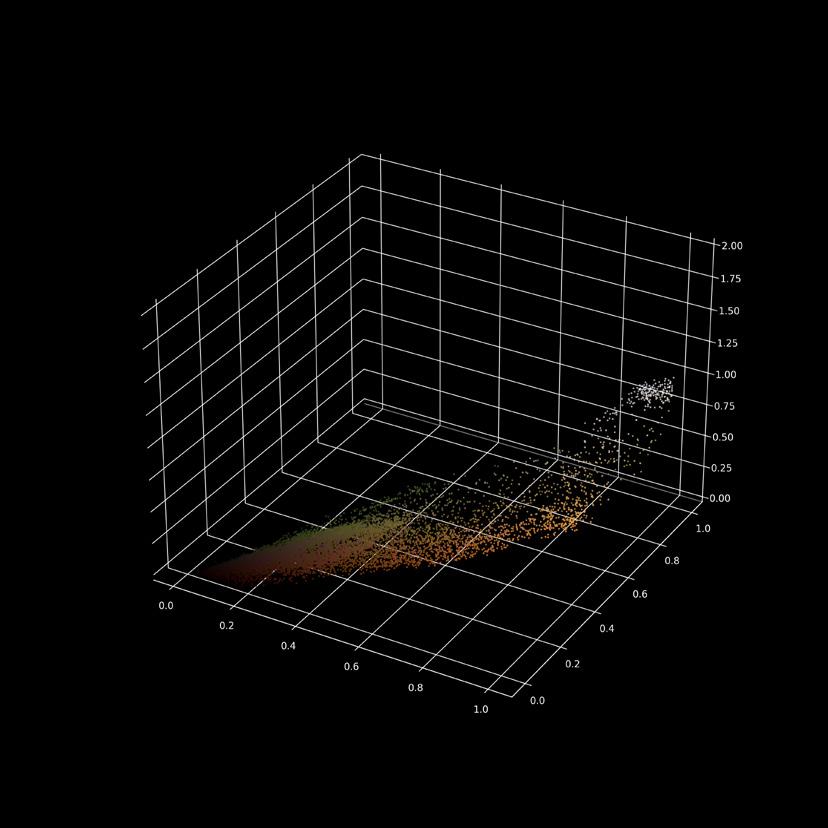
Given the balanced representation in PCA 0, we chose Brent as our target location for its comprehensive coverage of the dynamics of the themes that affect children’s education and development, ensuring a nuanced approach to understanding the interplay of societal and environmental factors at a macro level. Minimizing within-cluster variances, was pivotal for our analysis. K-Means facilitated the identification of patterns within the area, enabling insights into spatial distributions and characteristics unique to each cluster.
PCA Component 0
PCA Component 1
PCA Component 2
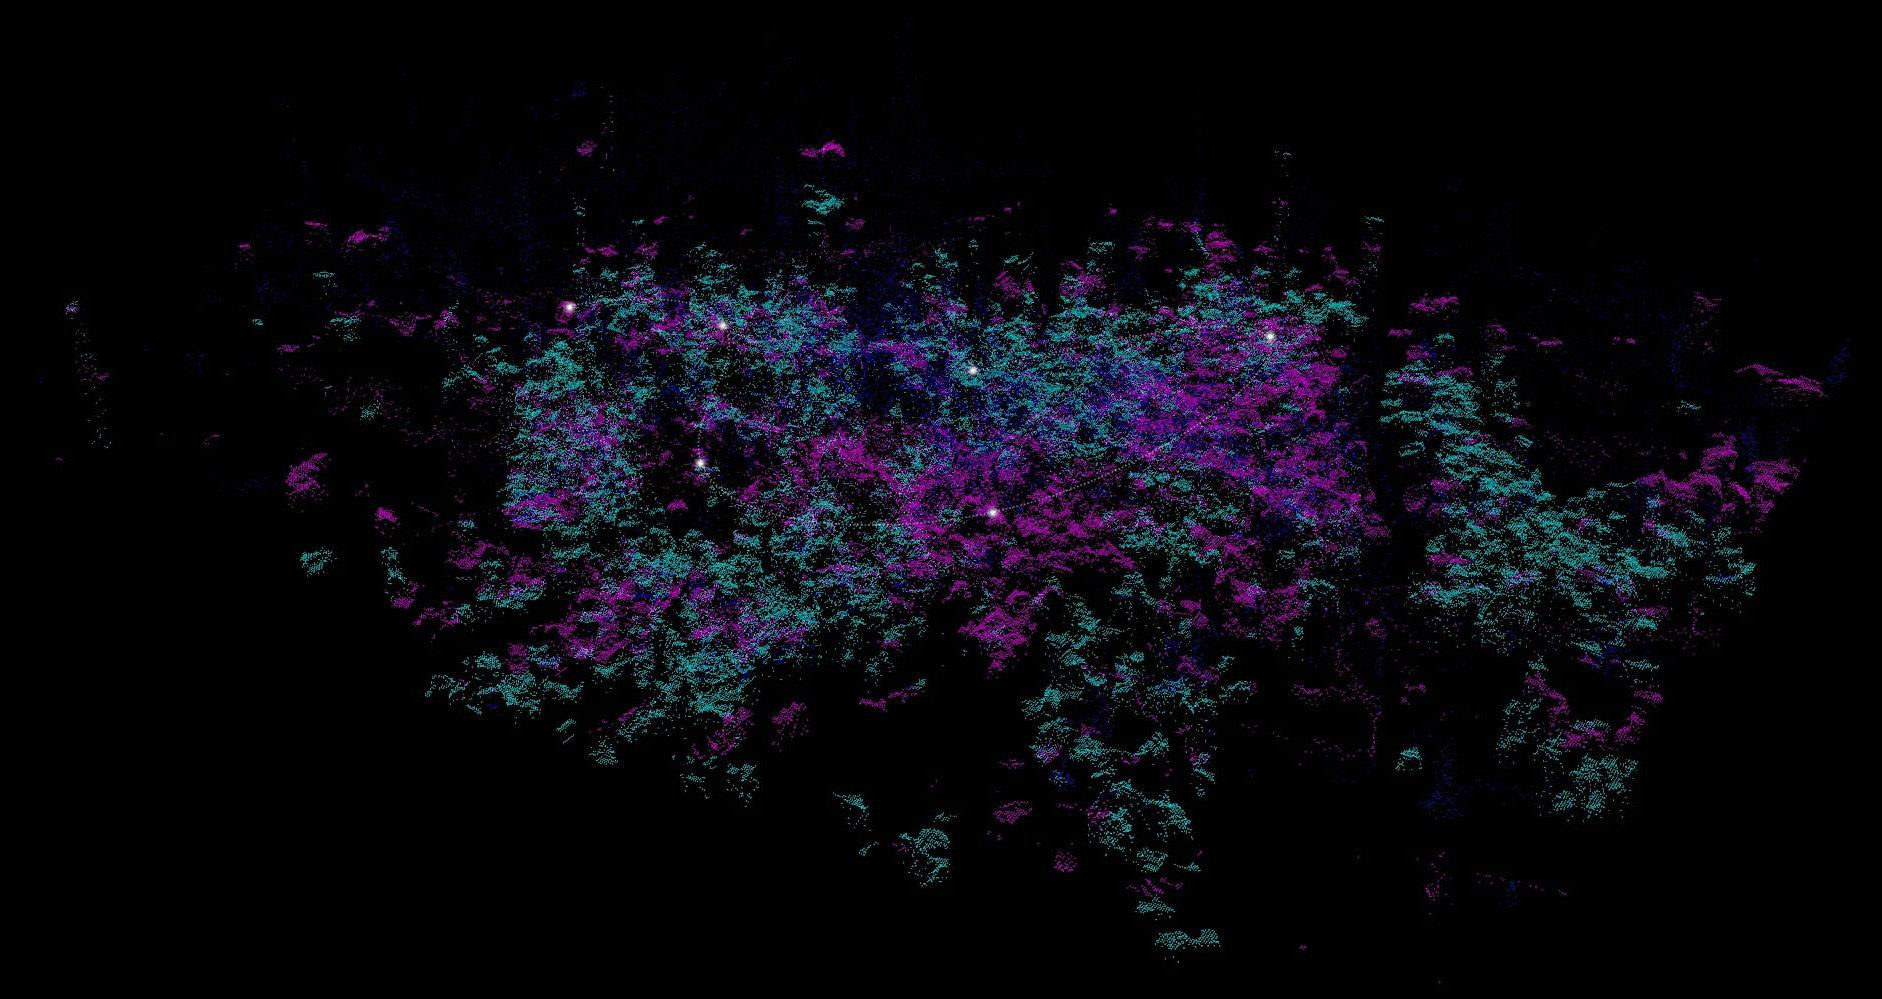
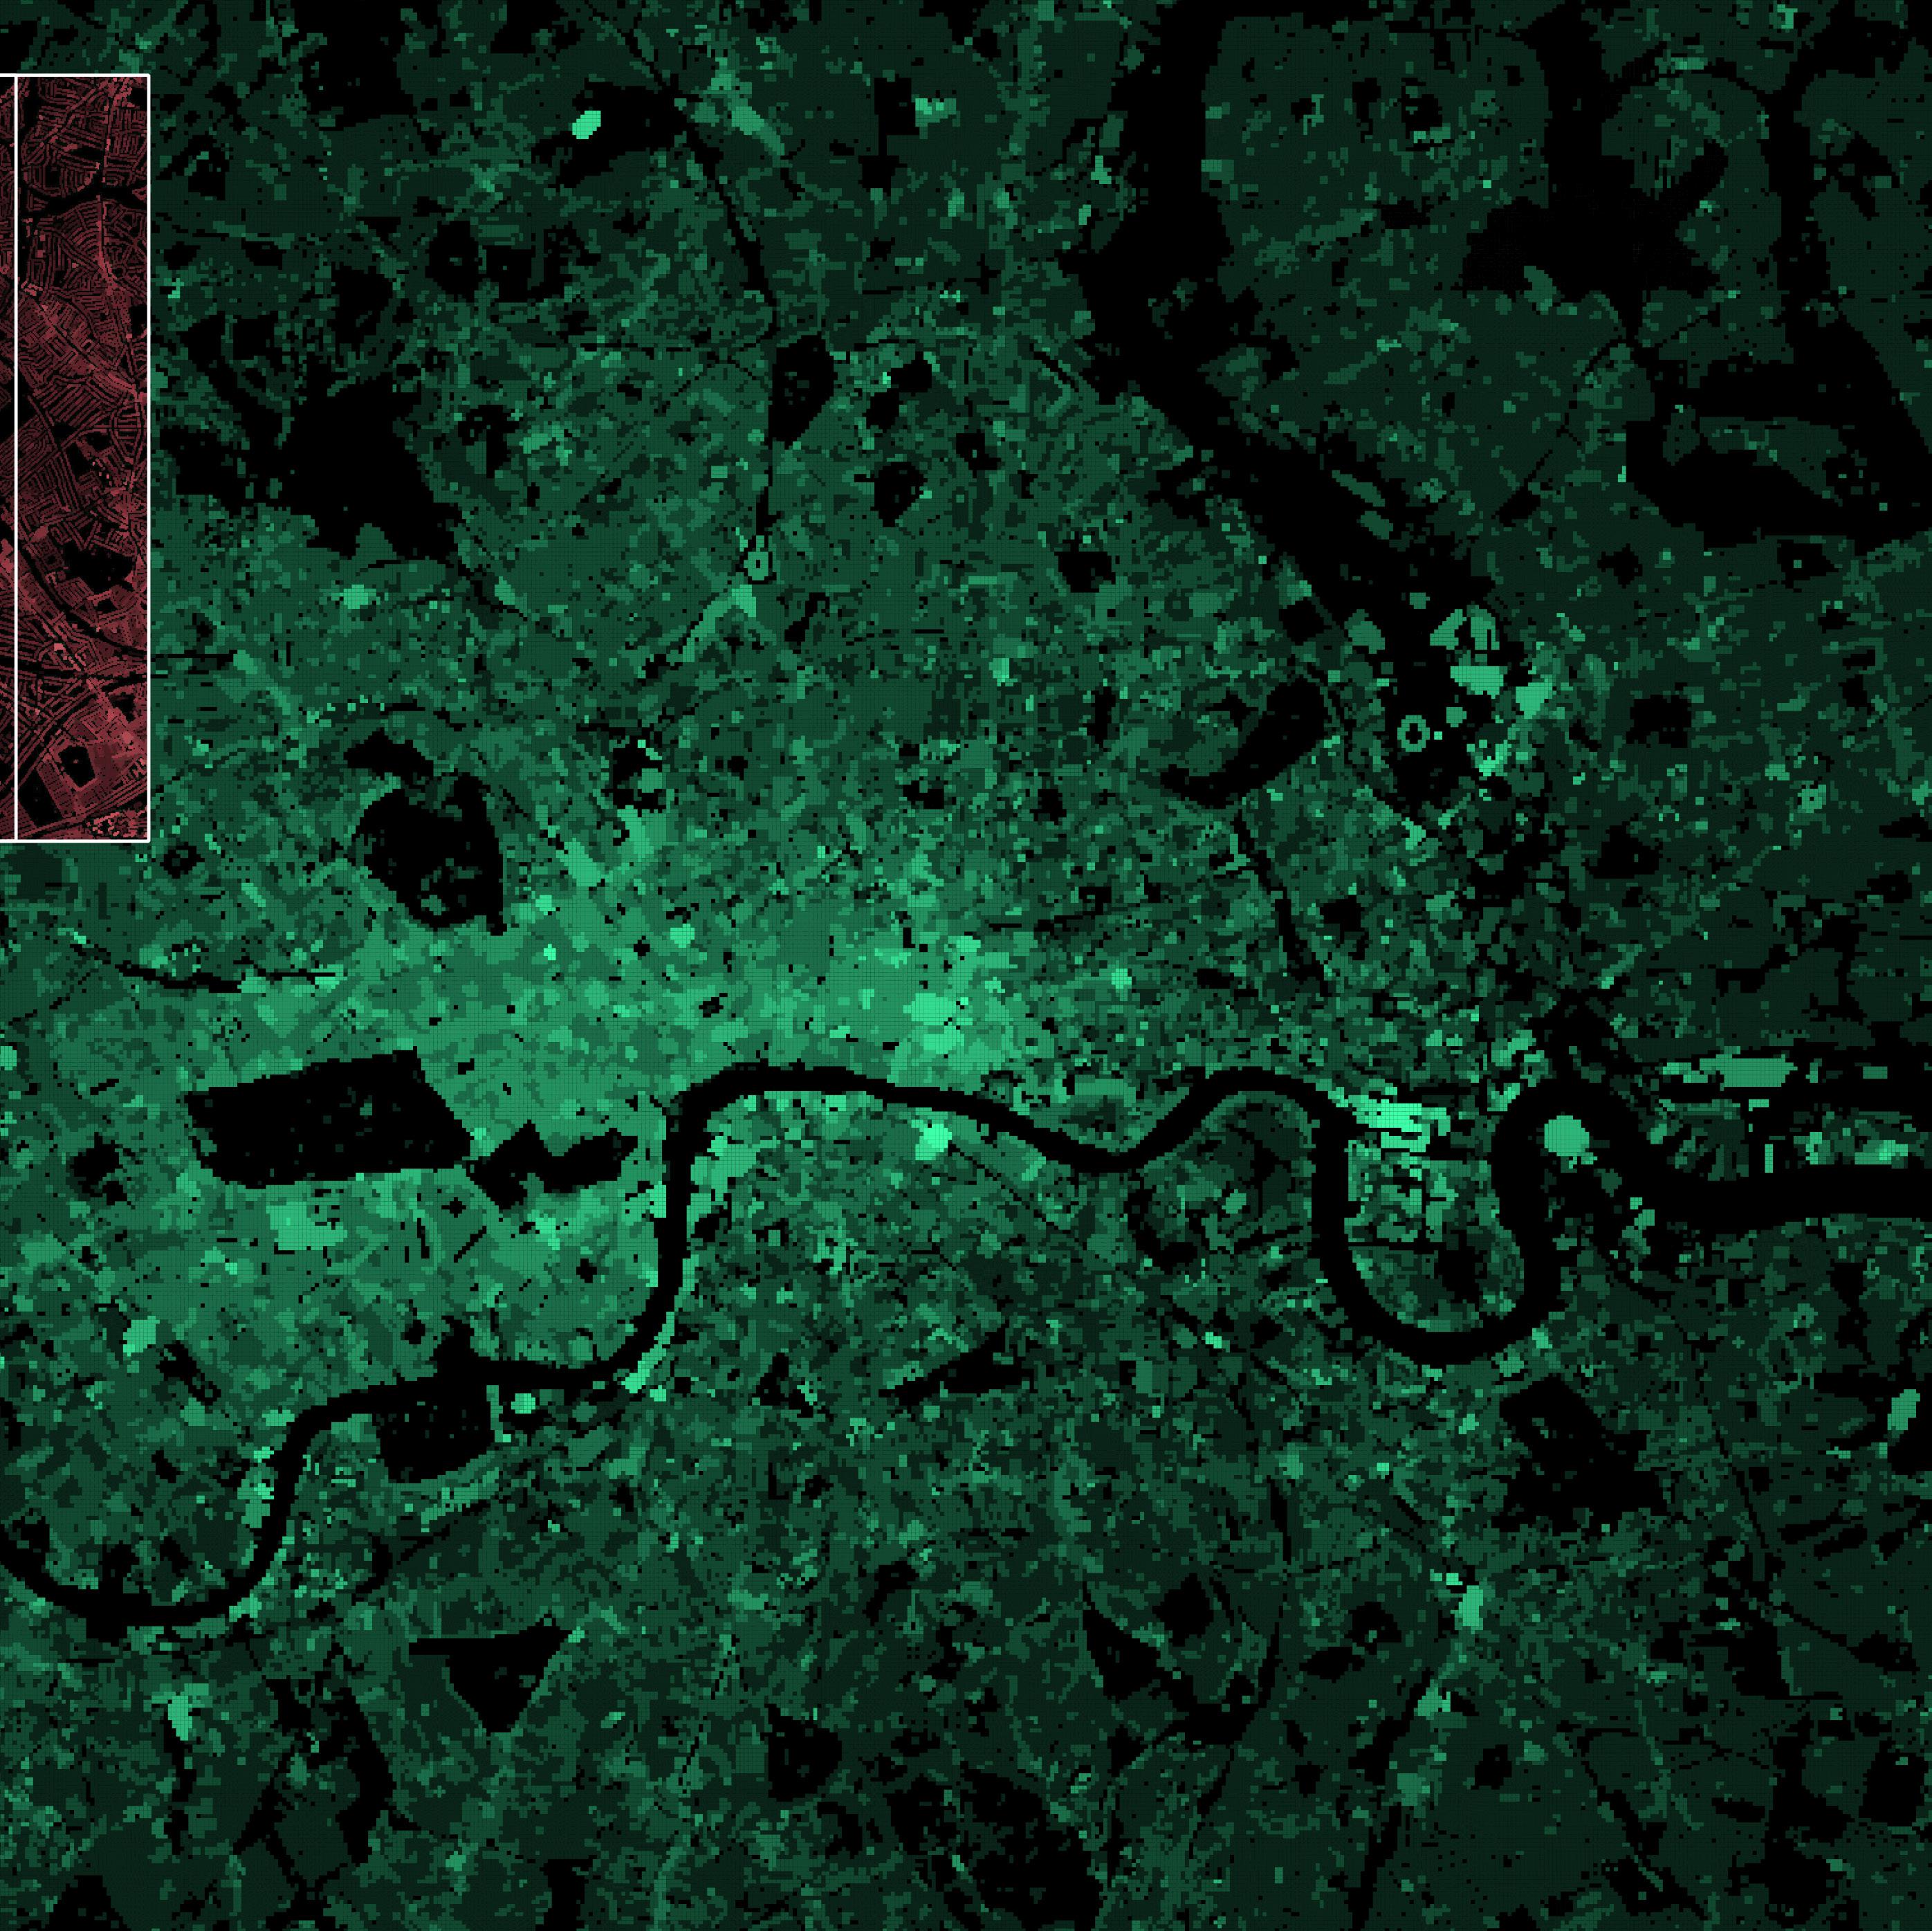
K Means Clustering
DATA DISTRIBUTION of K-MEANS CLUSTERING [Macro-Scale Analysis]
LEGEND
RESAMPLED SITES & CATEGORIES OF ANALYSIS
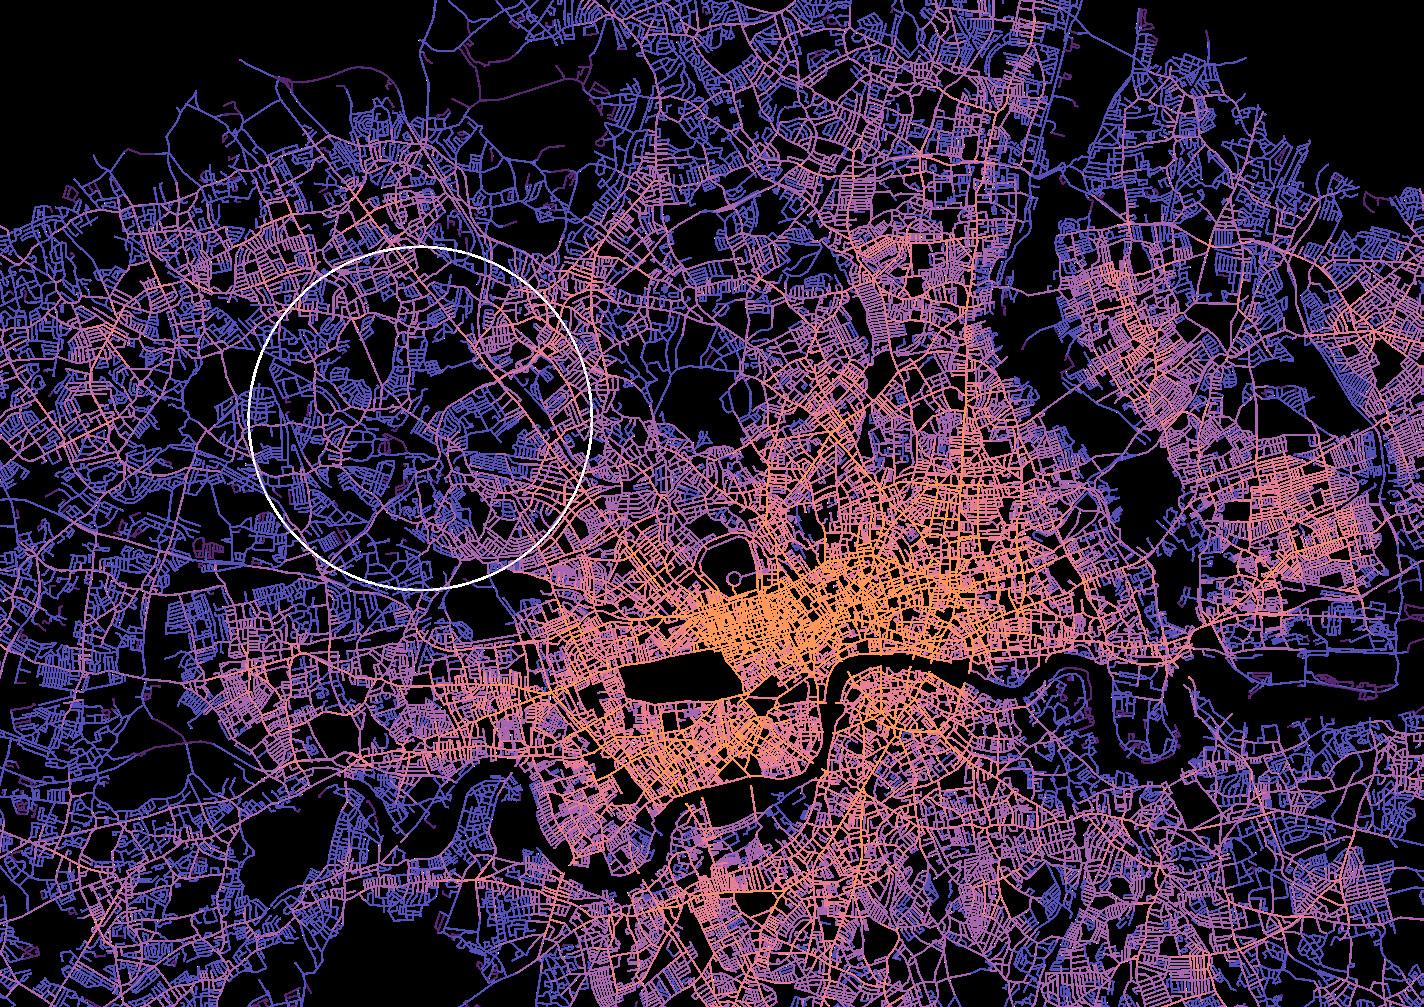
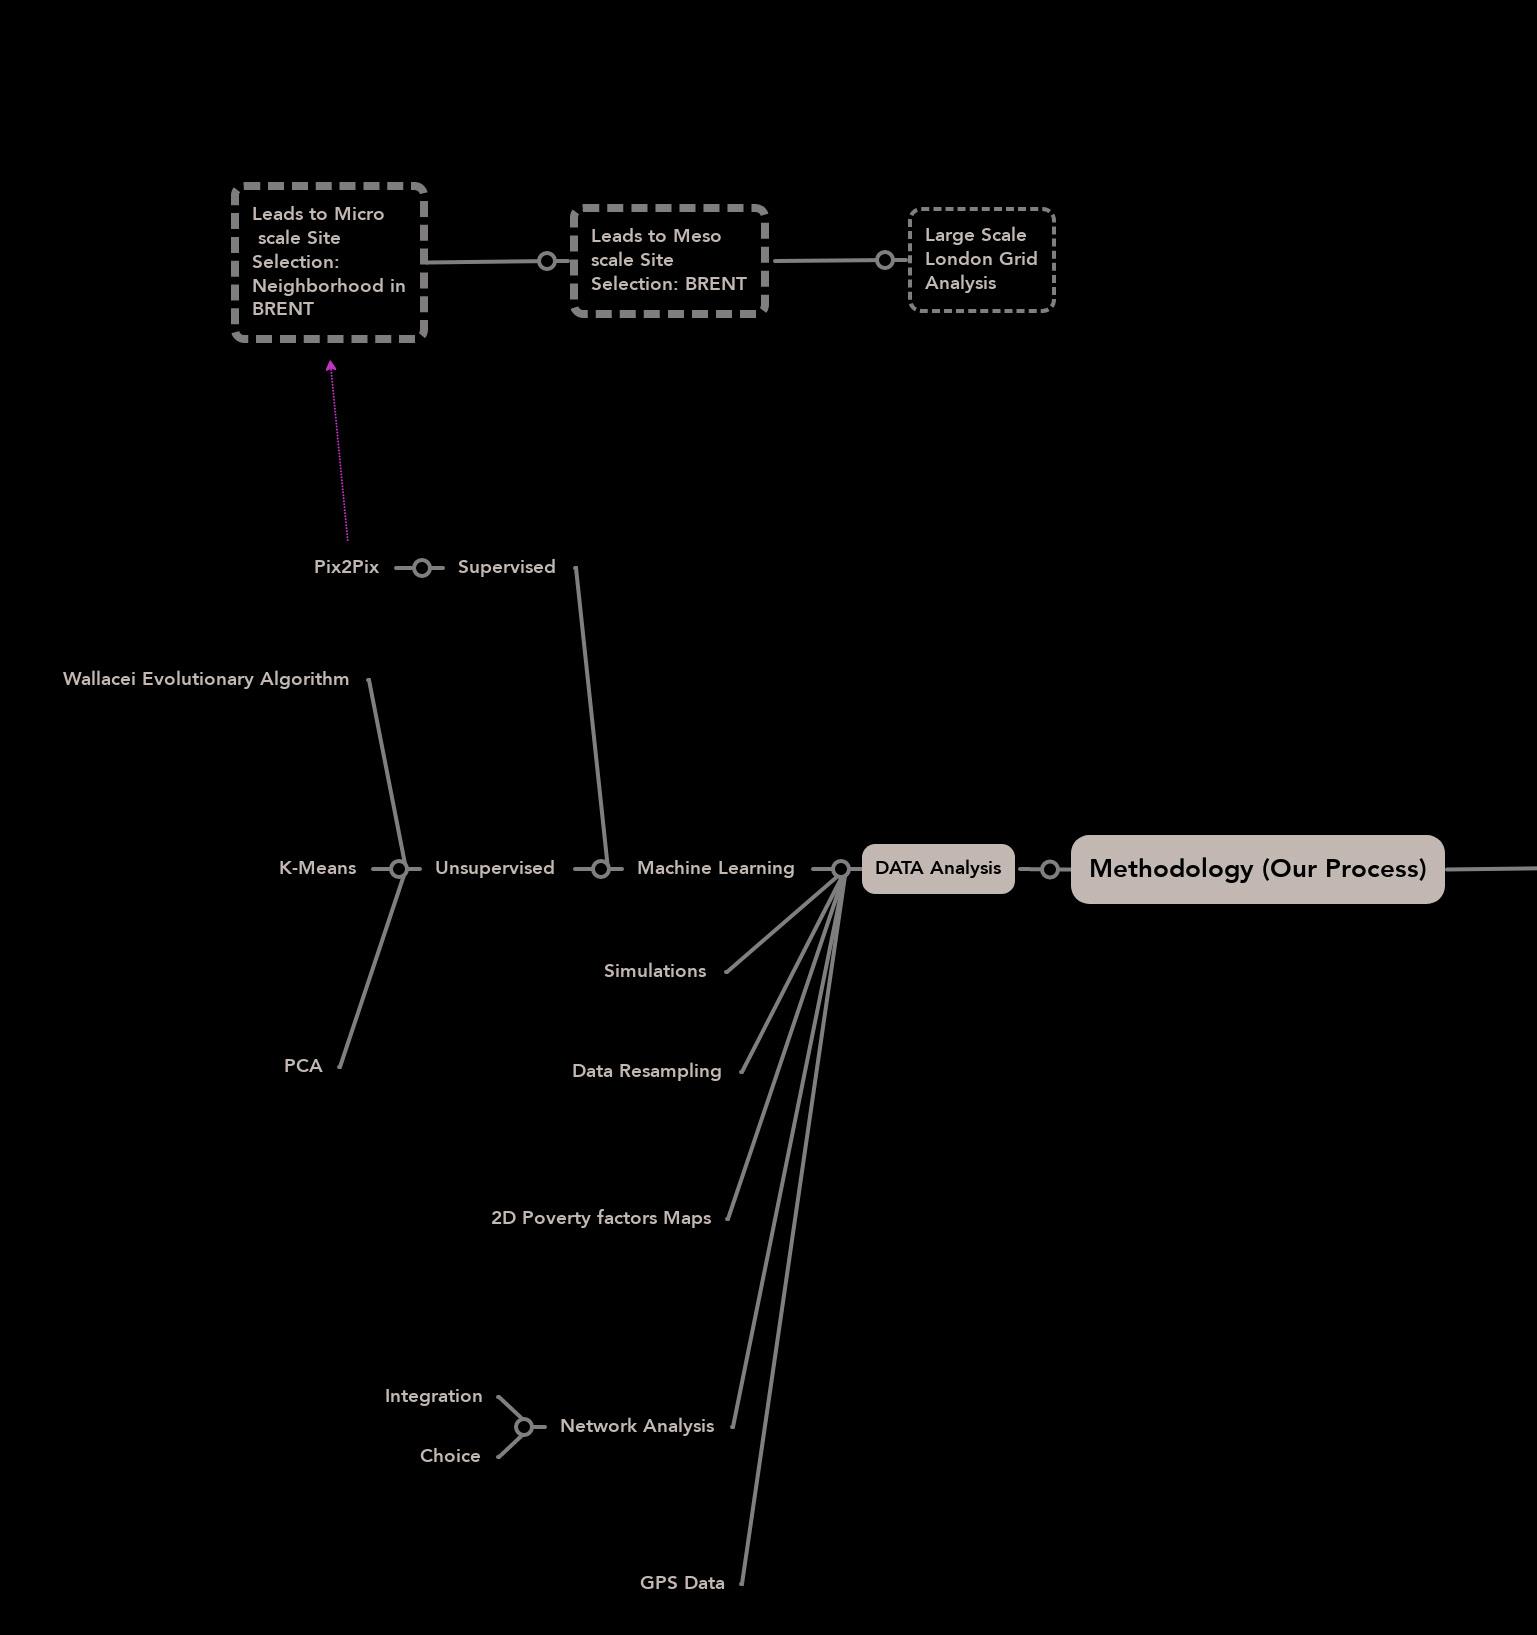
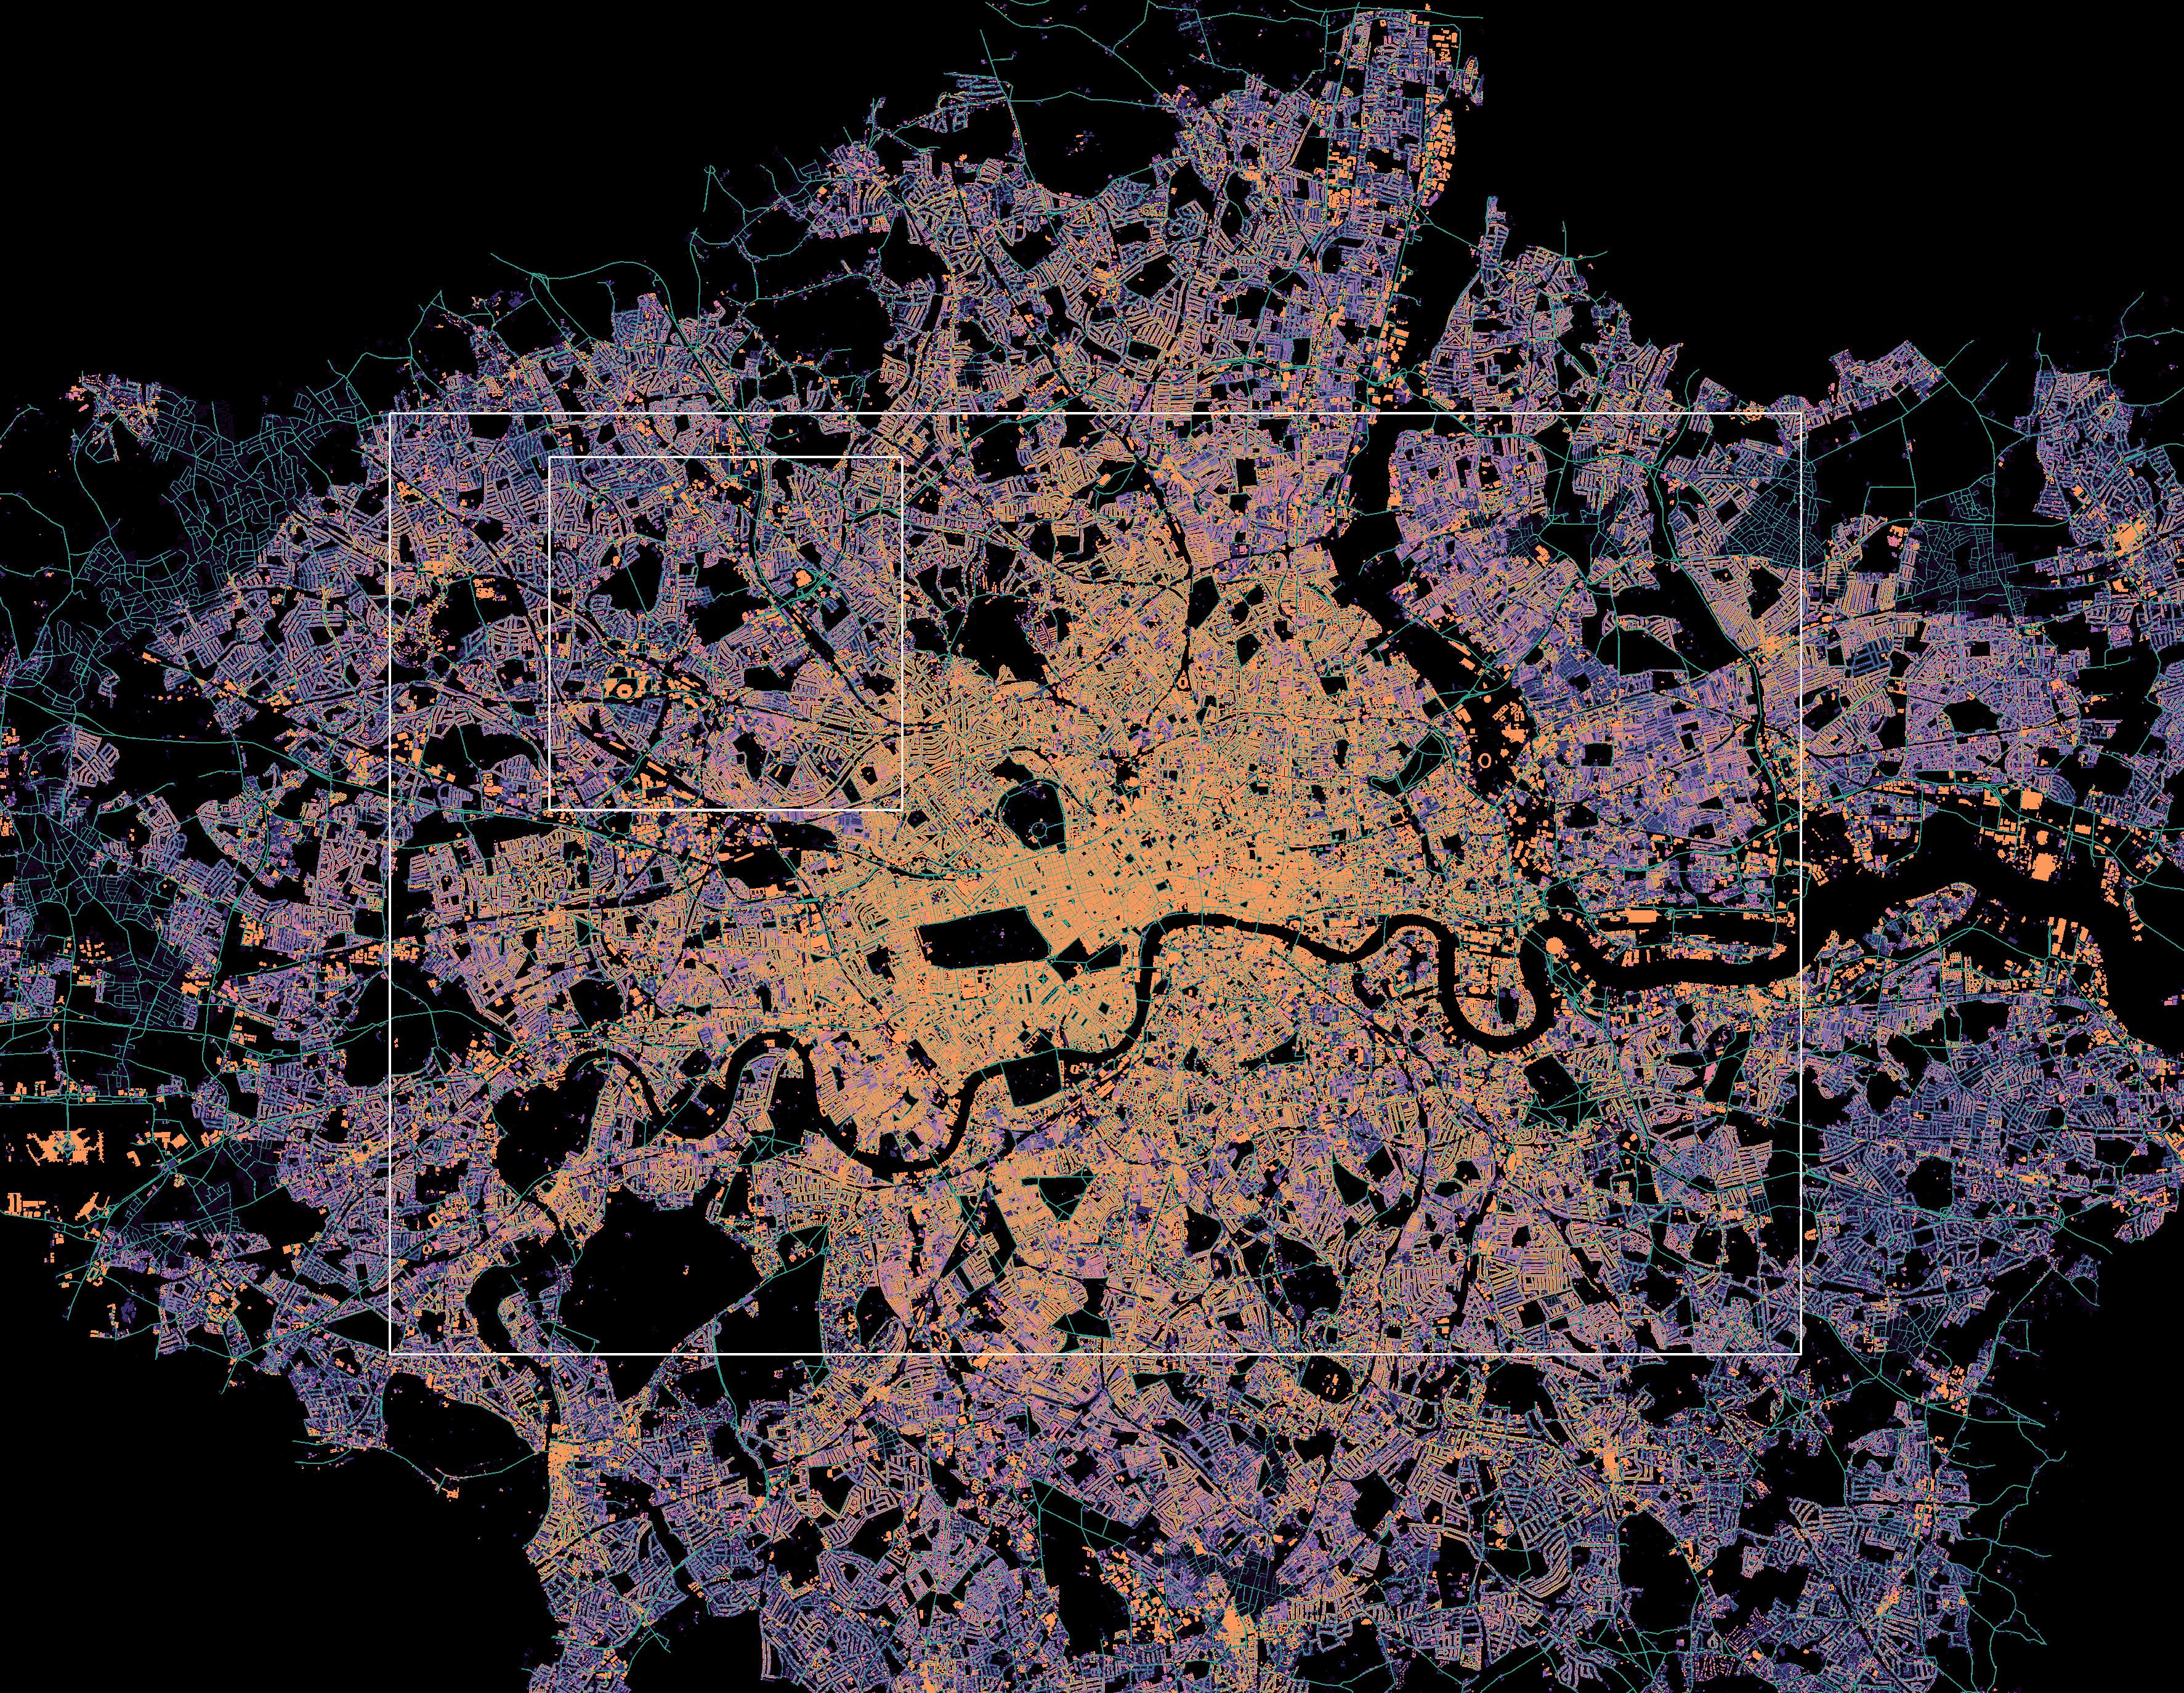
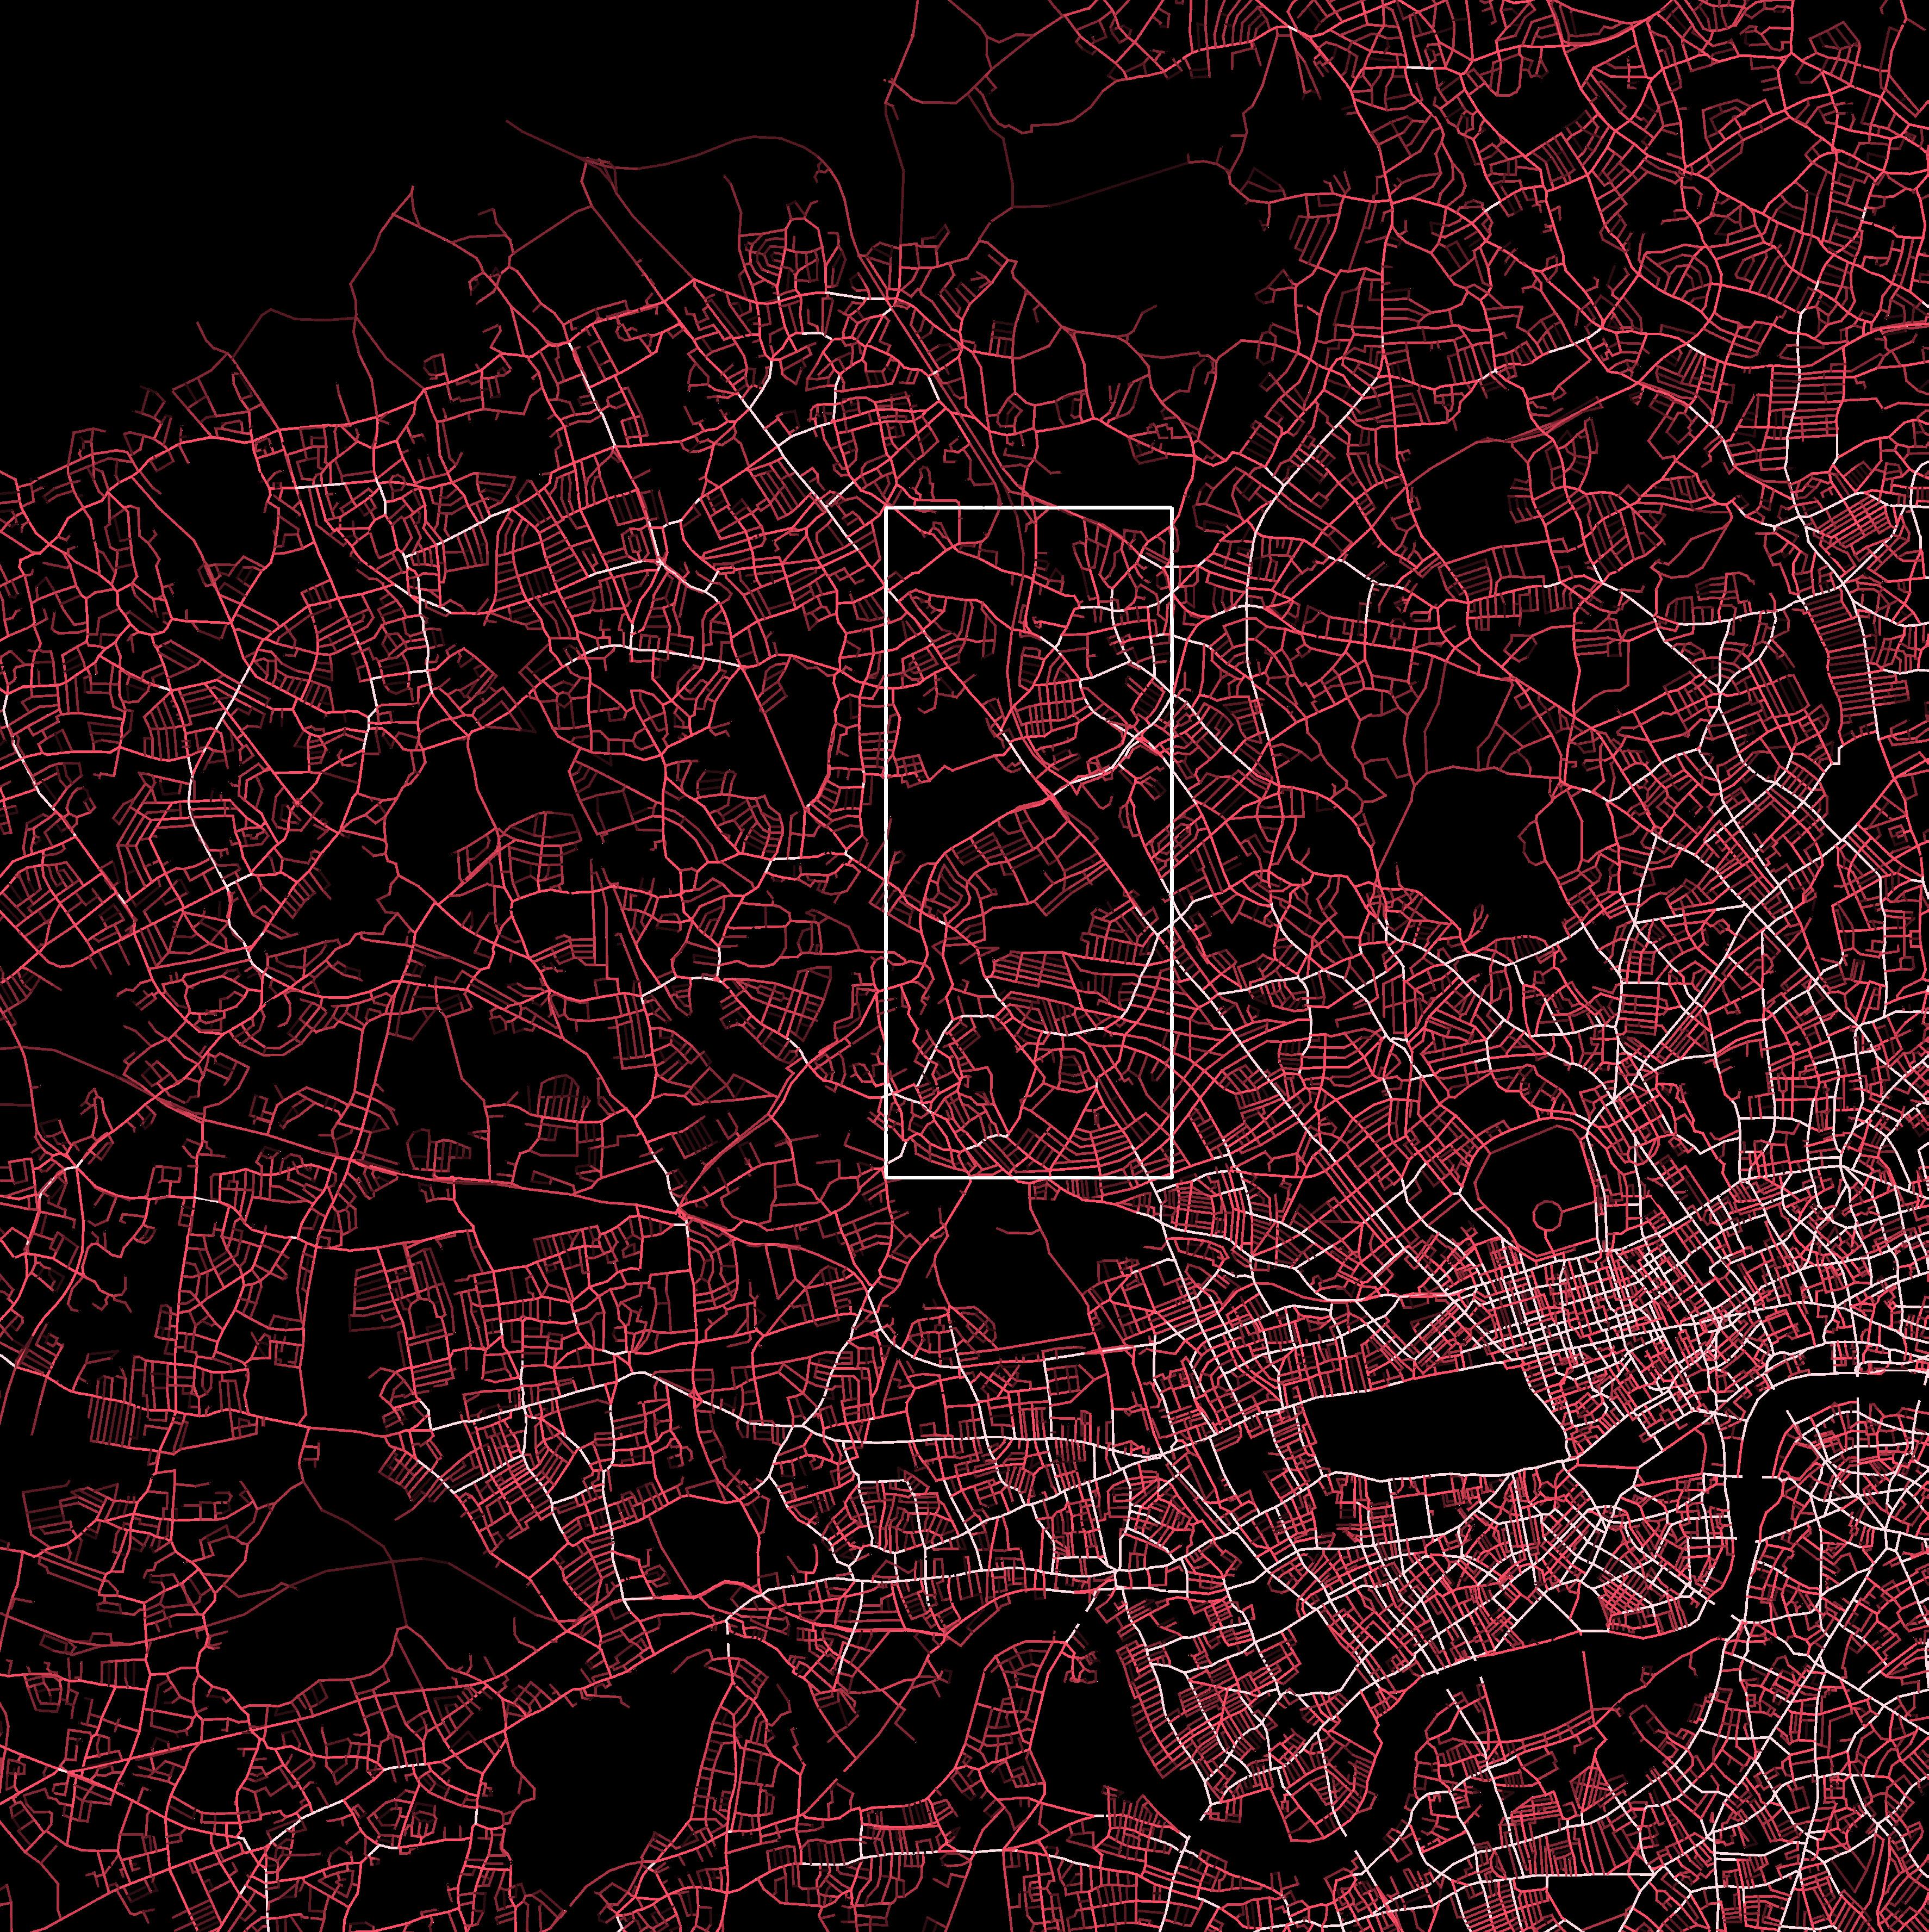
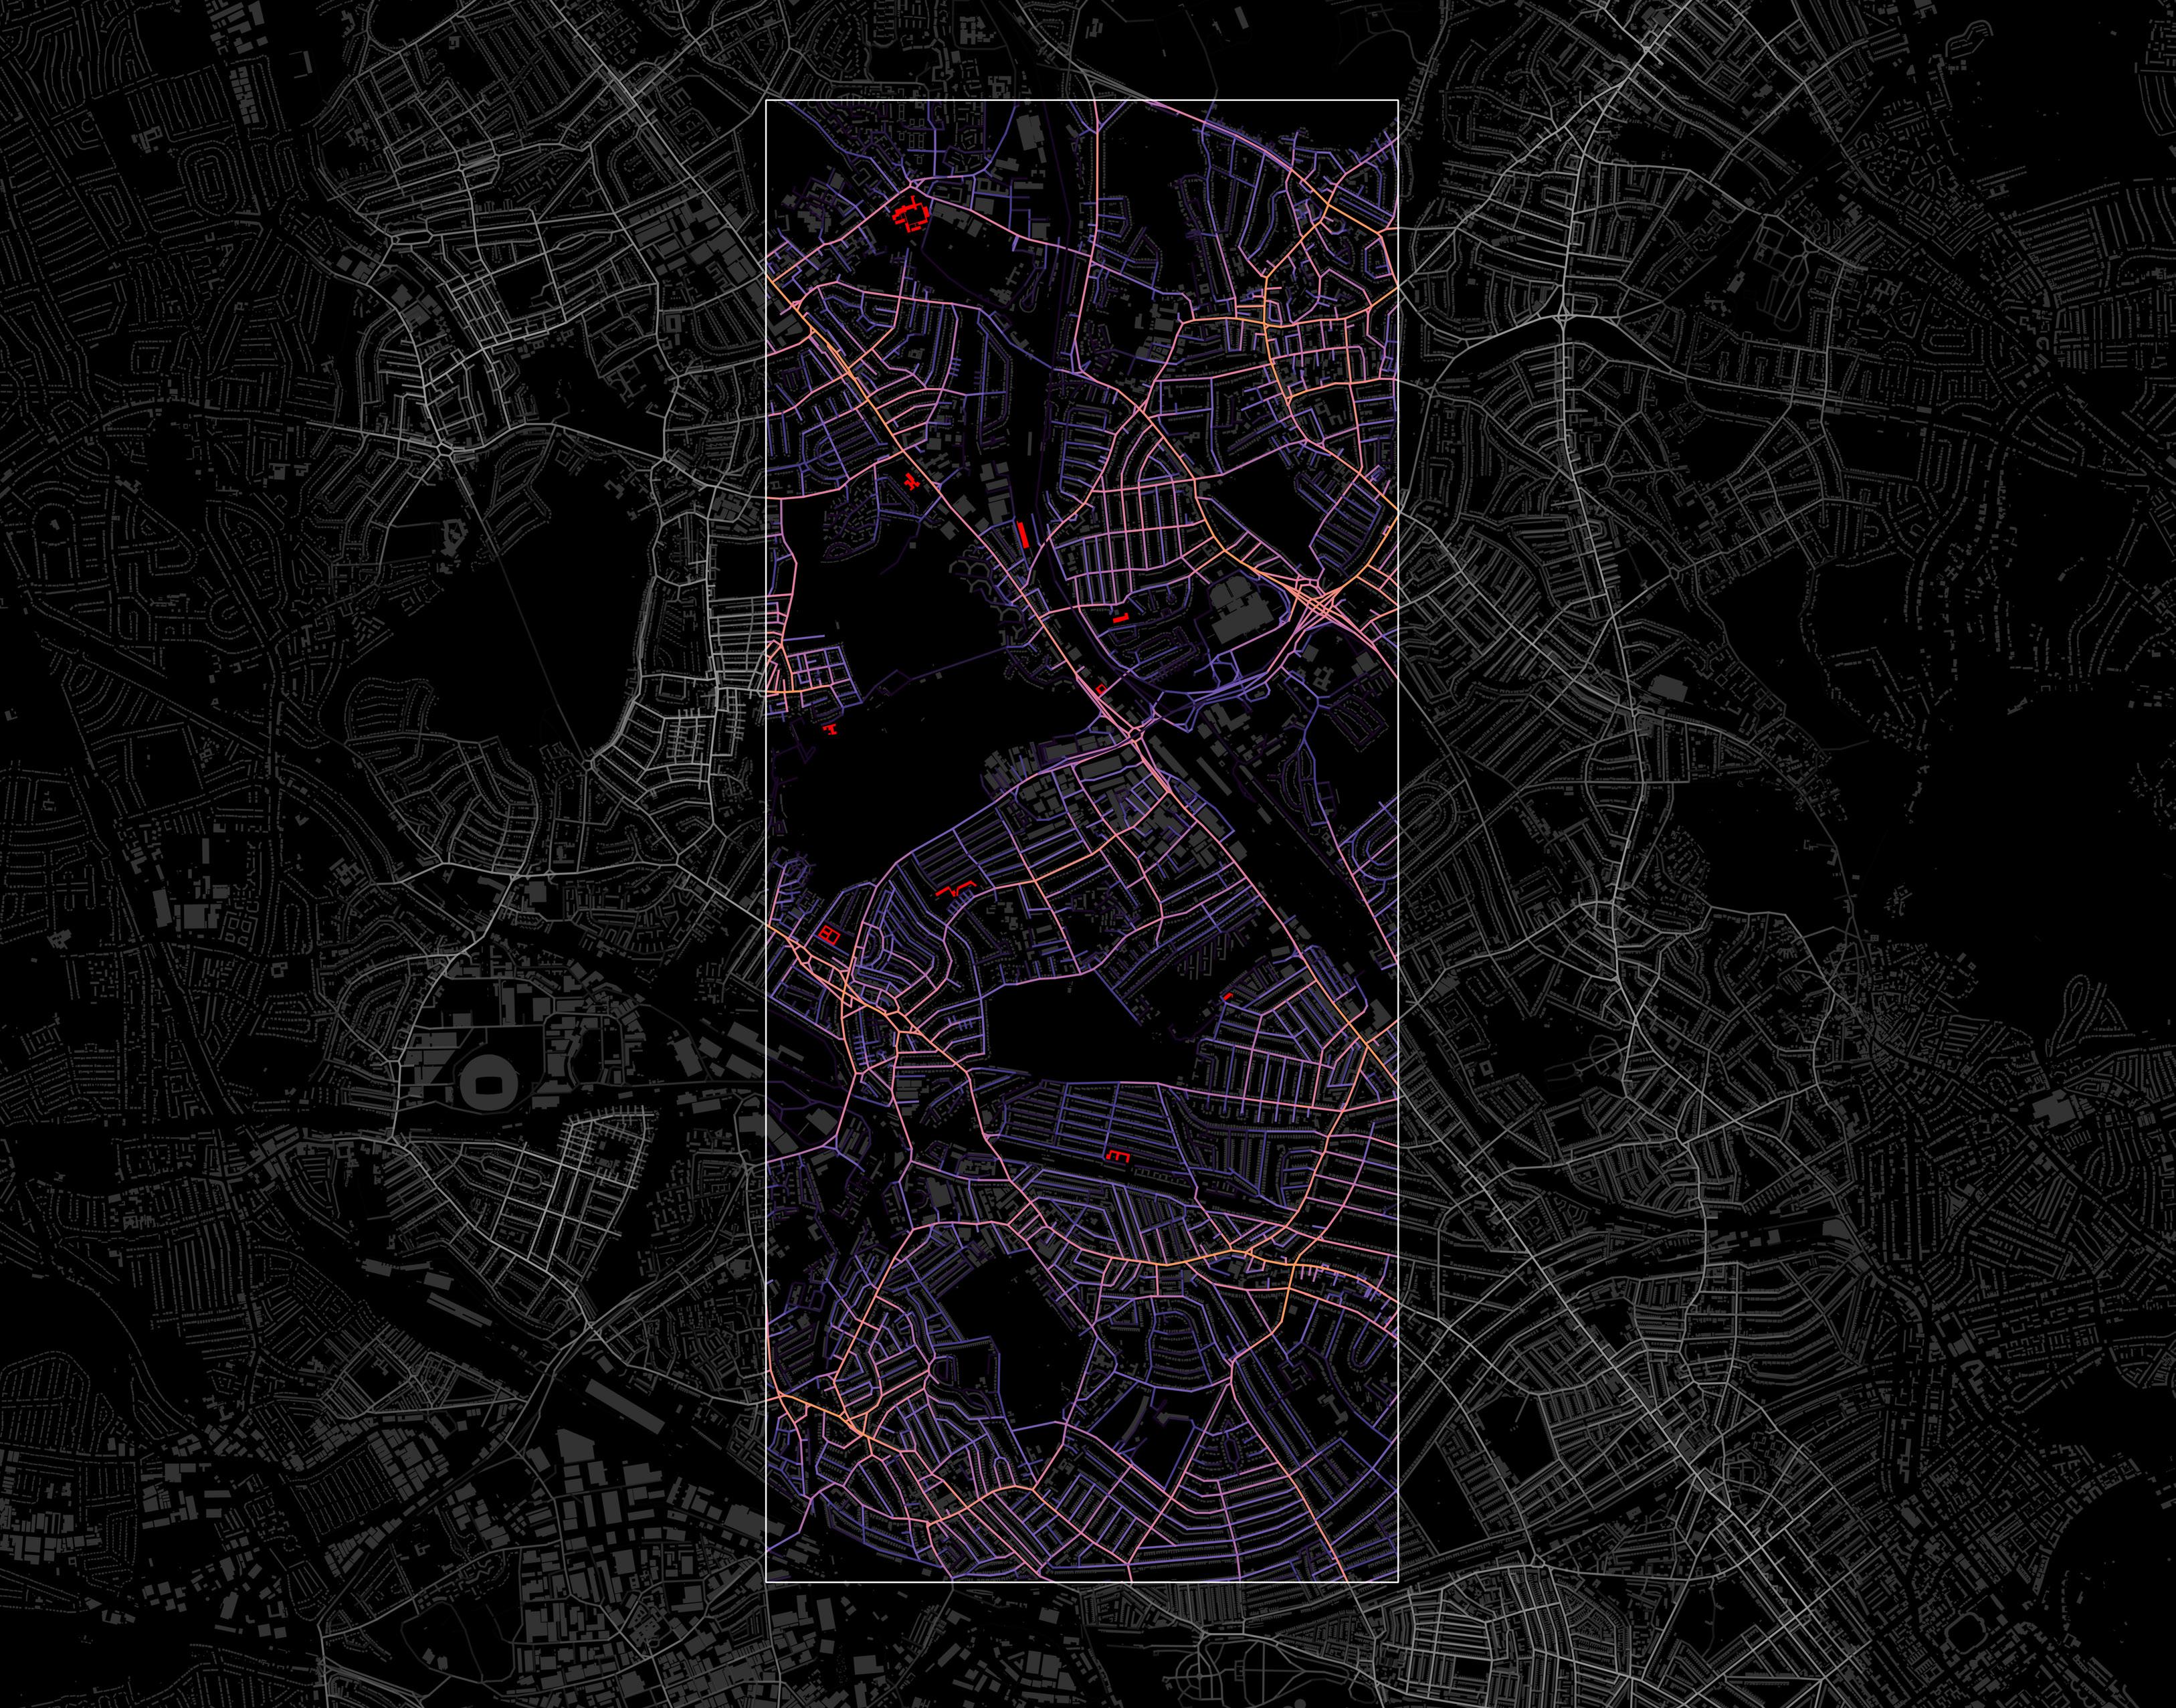
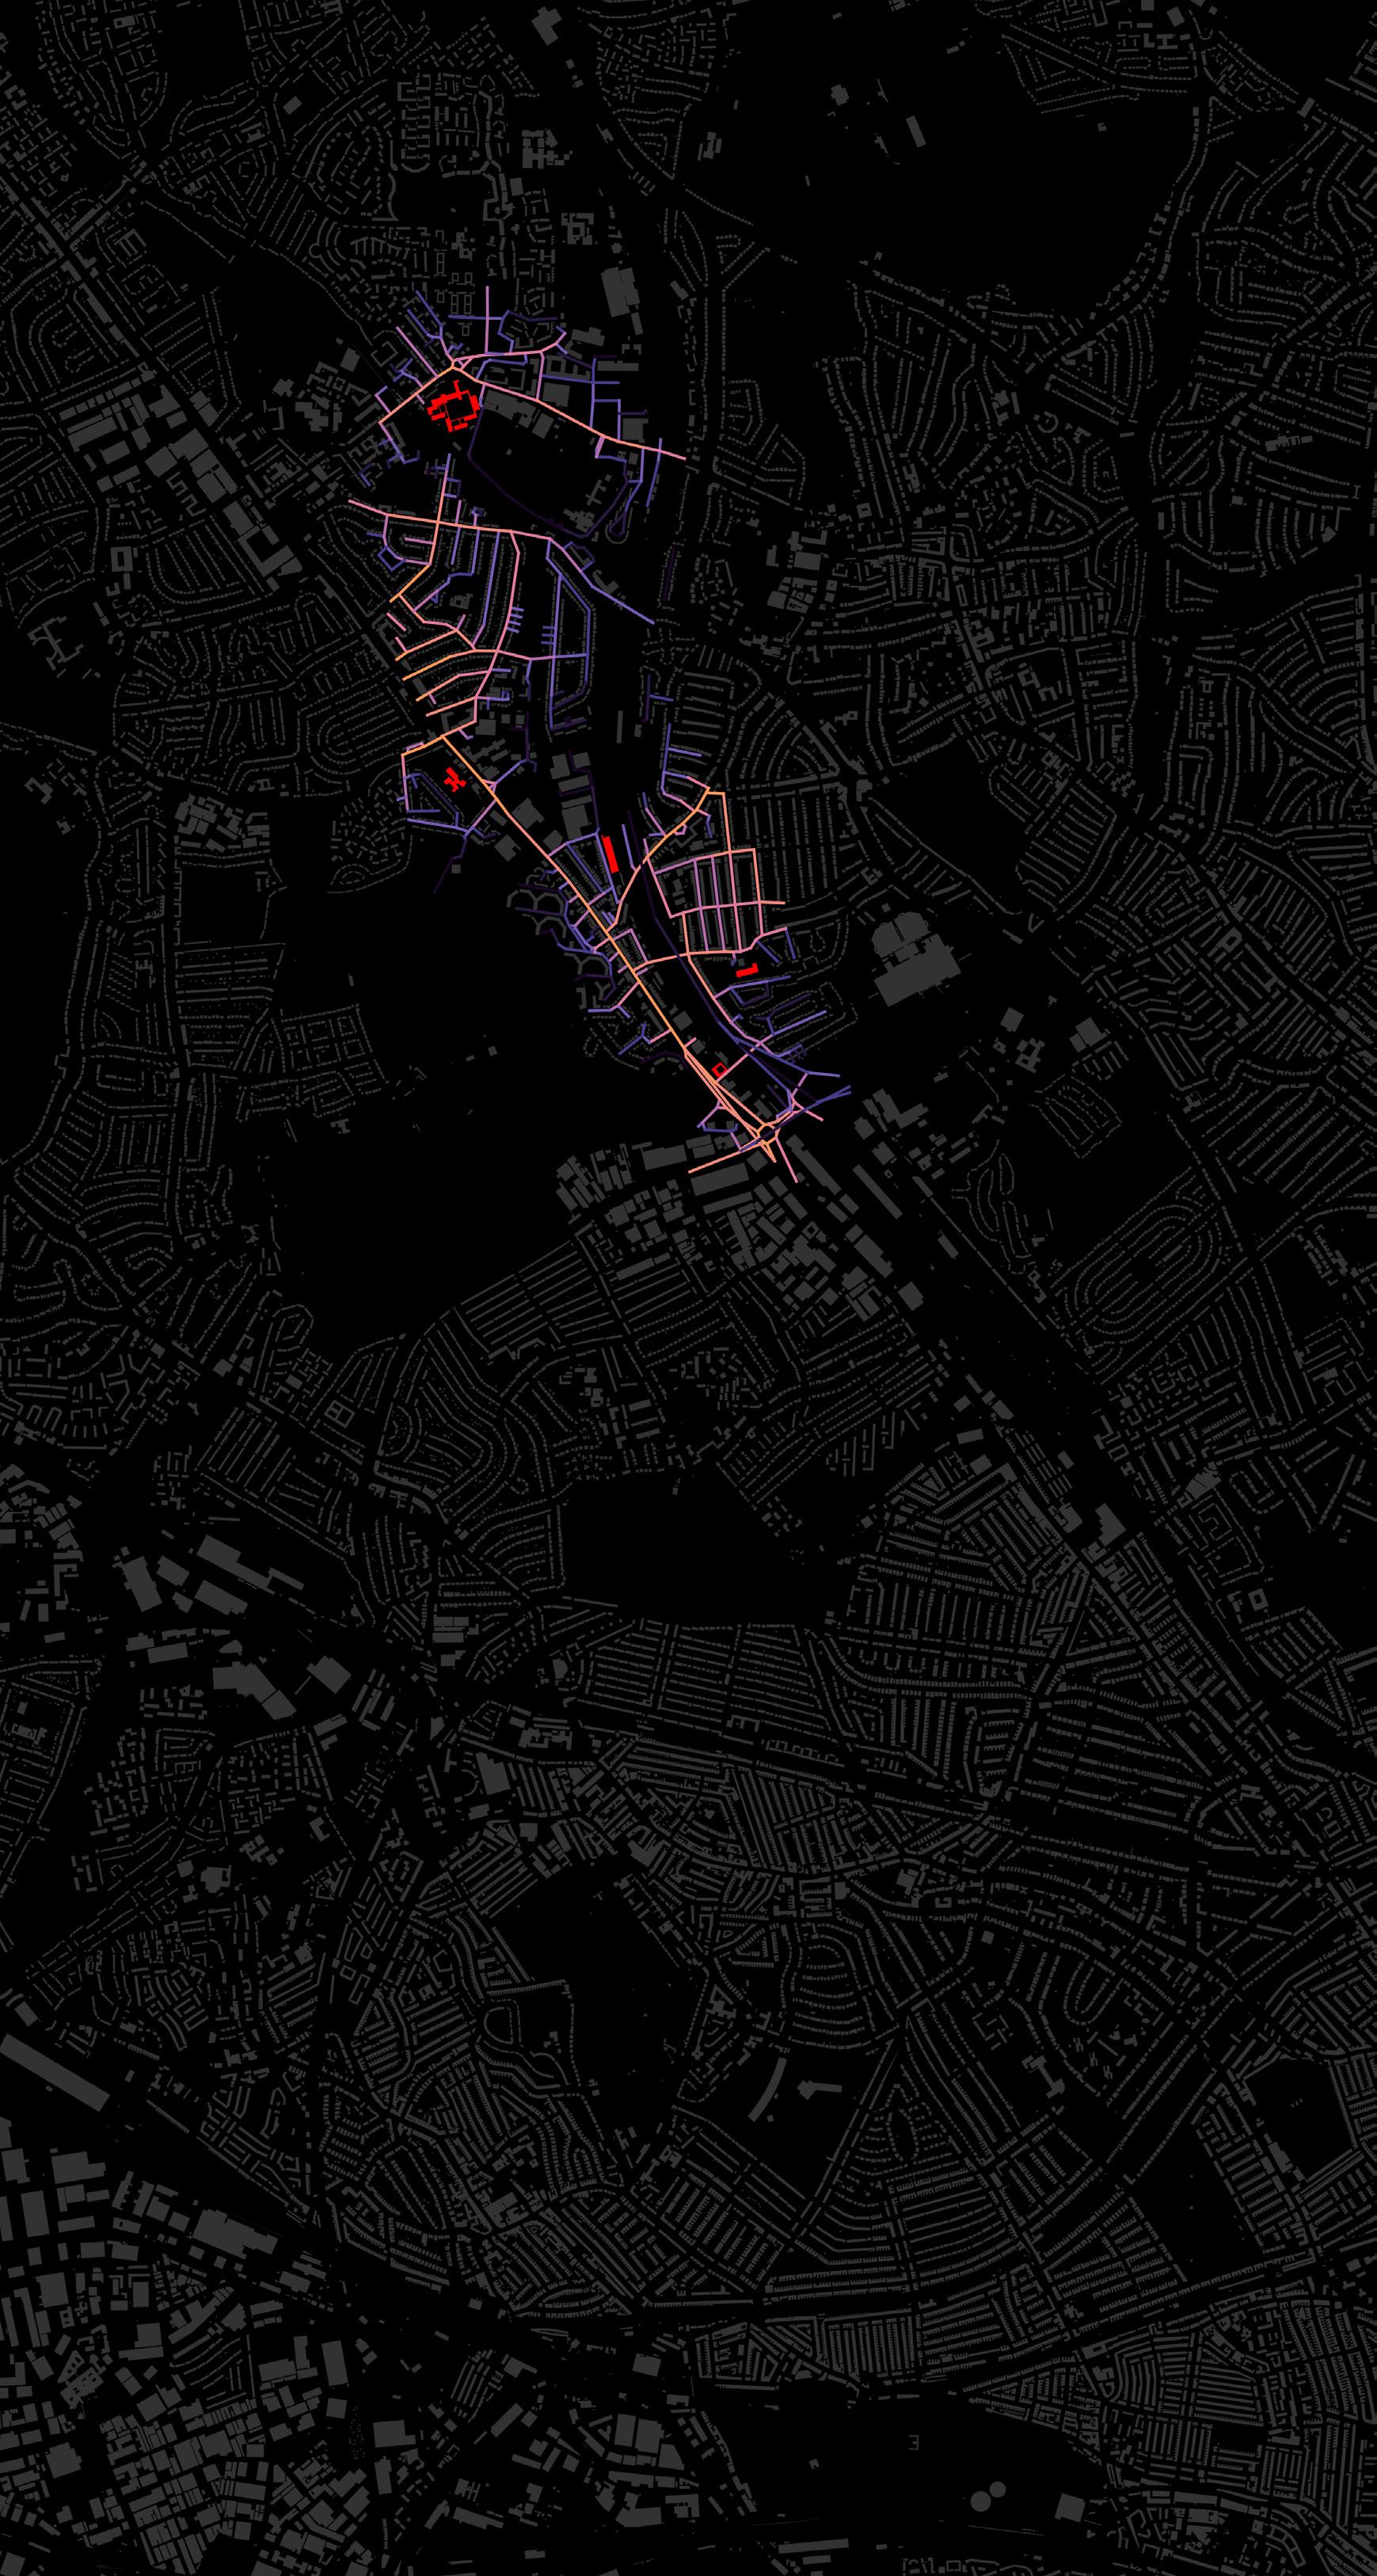
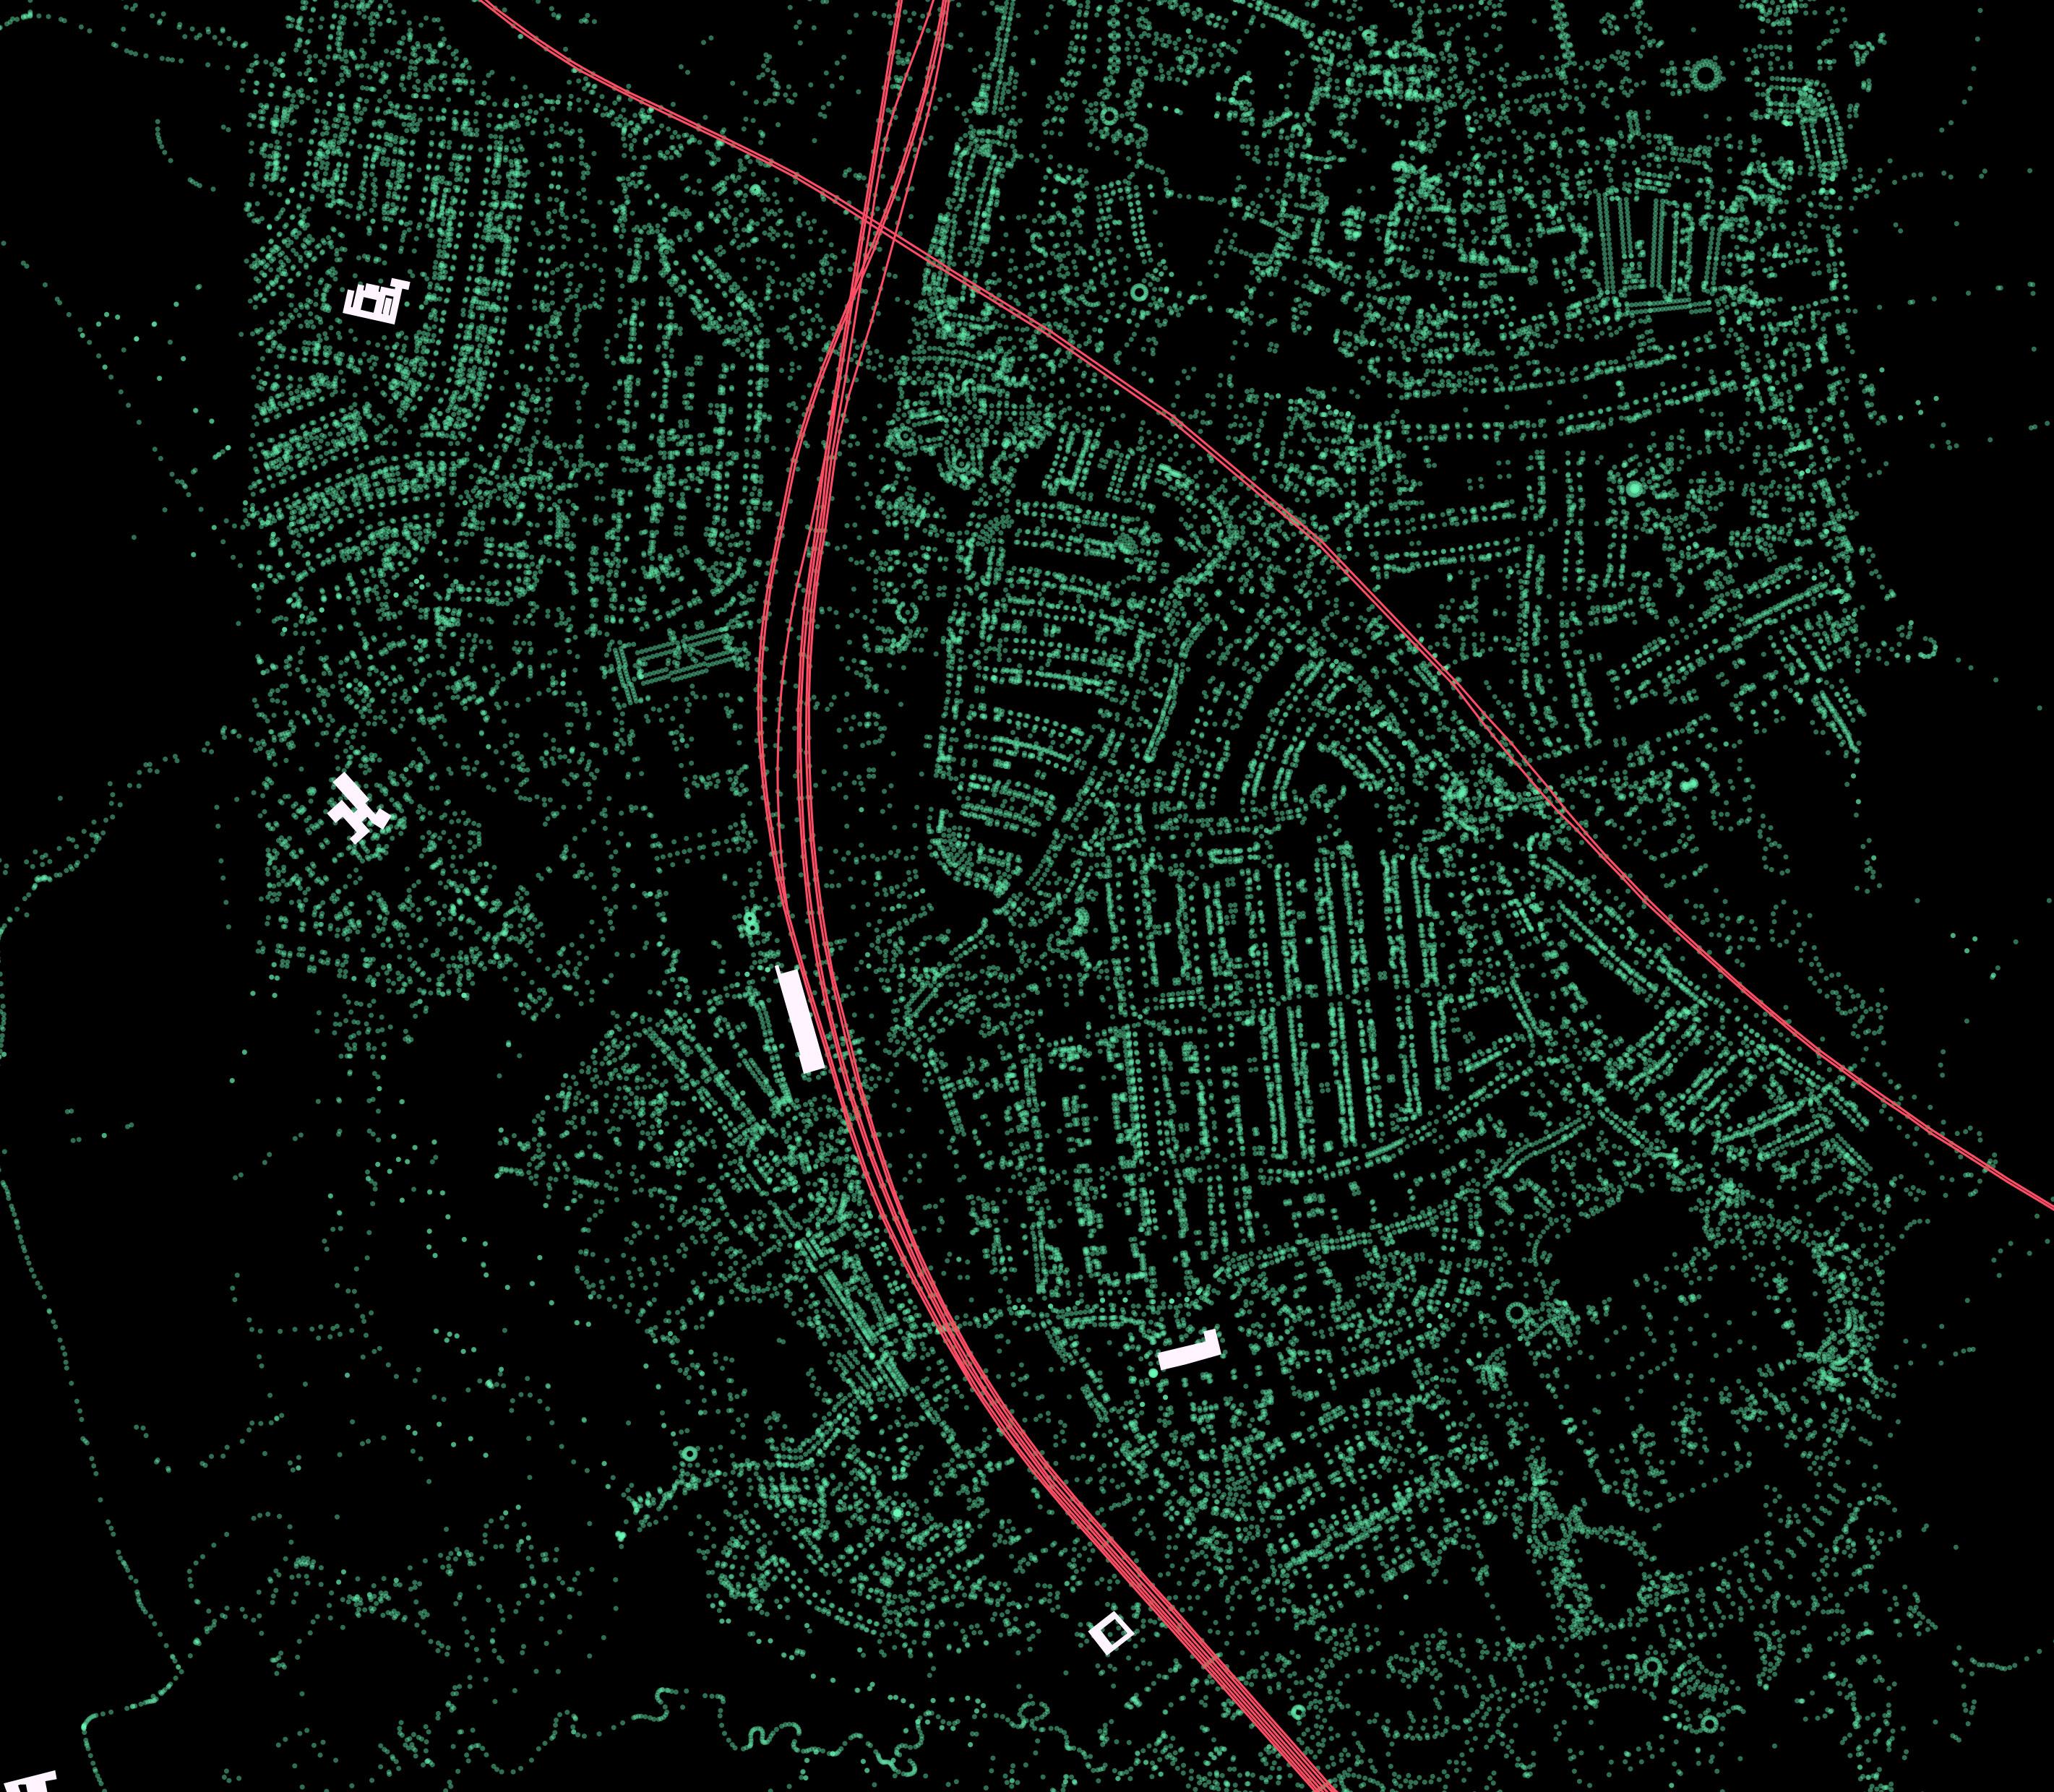
Based On our PCA, K-means and 2D dataset mapping Results, we found that the Brent Borough would be a very suitable site to focus on as we found low rates of children that go to school and high rates of the negative datasets that affect children’s education and development in that area. We then Resampled datasets for both the large London grid as our training set and the small Brent grid as our Test set. We focused on multiple categories of analysis which helped narrow down our site and they are Network Analysis, Location Analysis, Demographic analysis and simulation analysis.
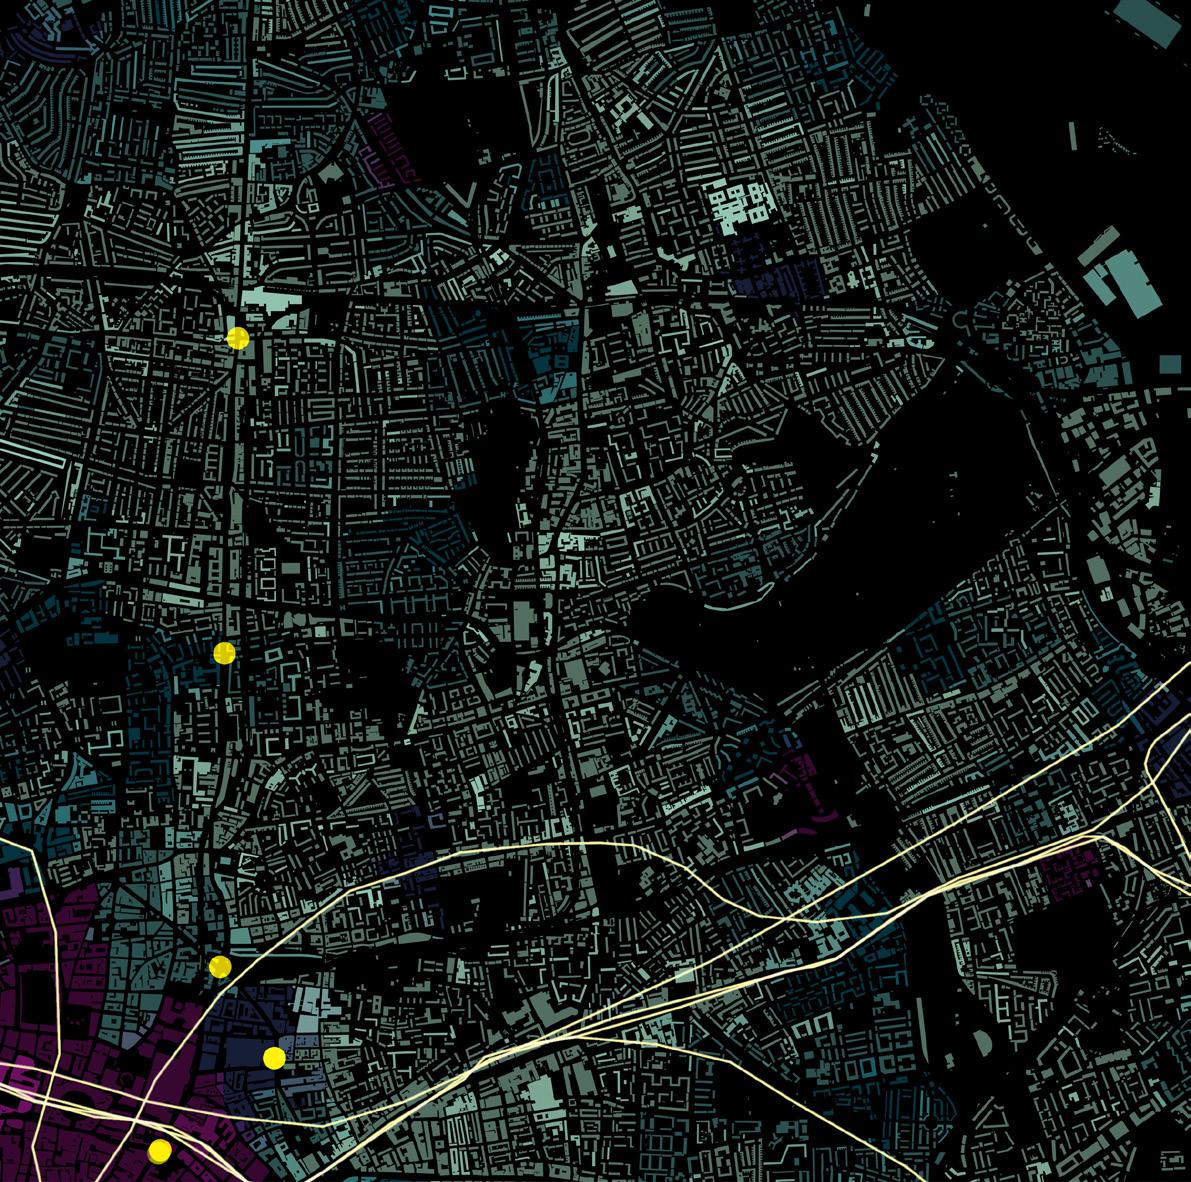
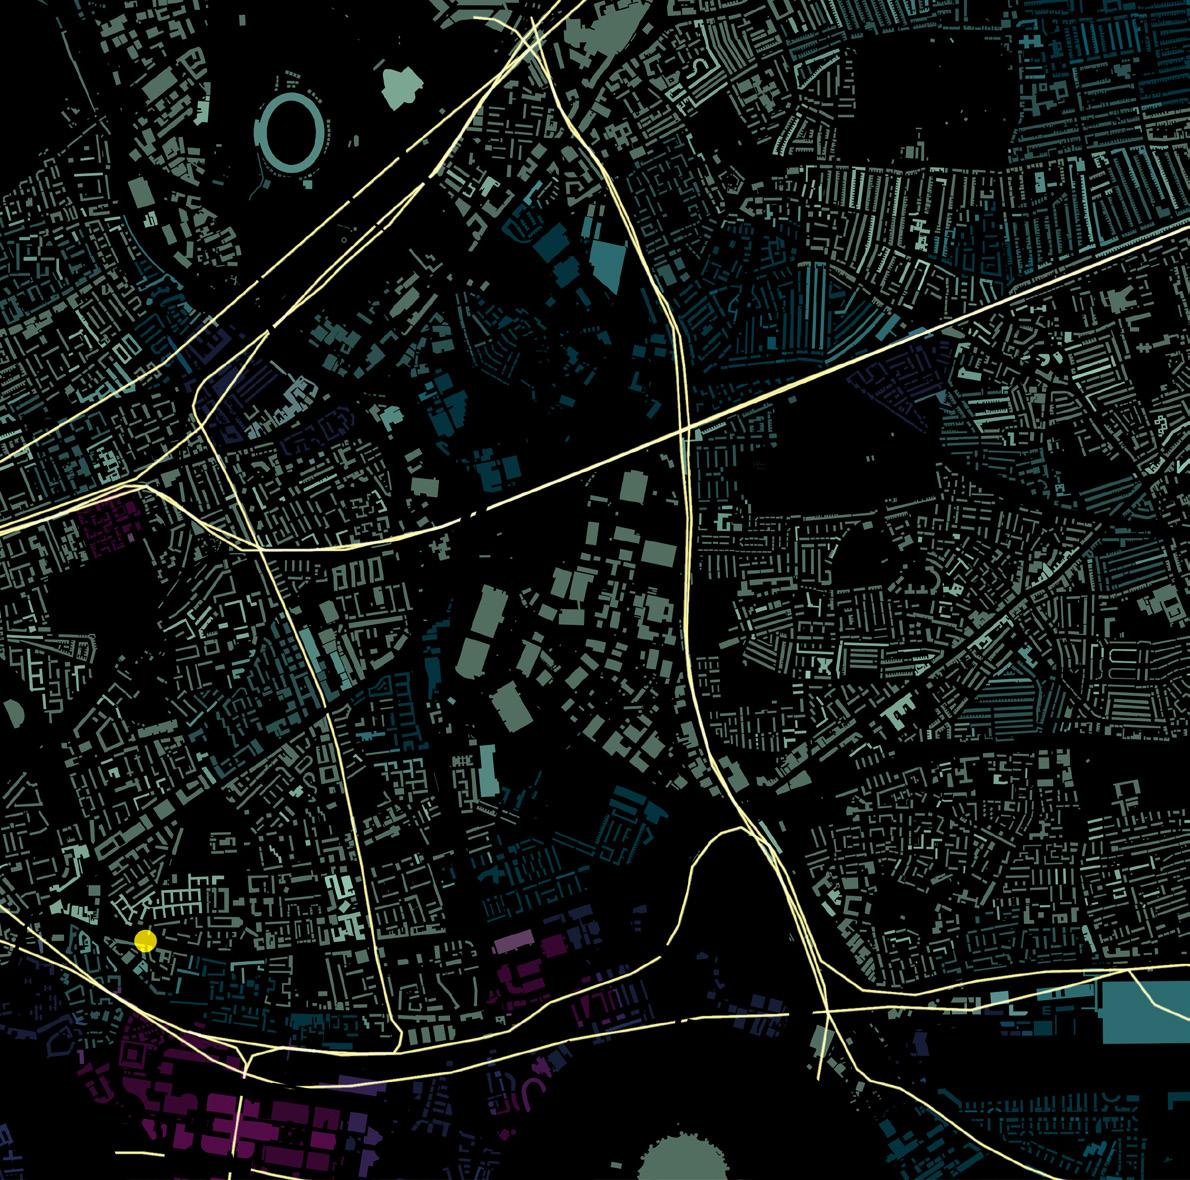
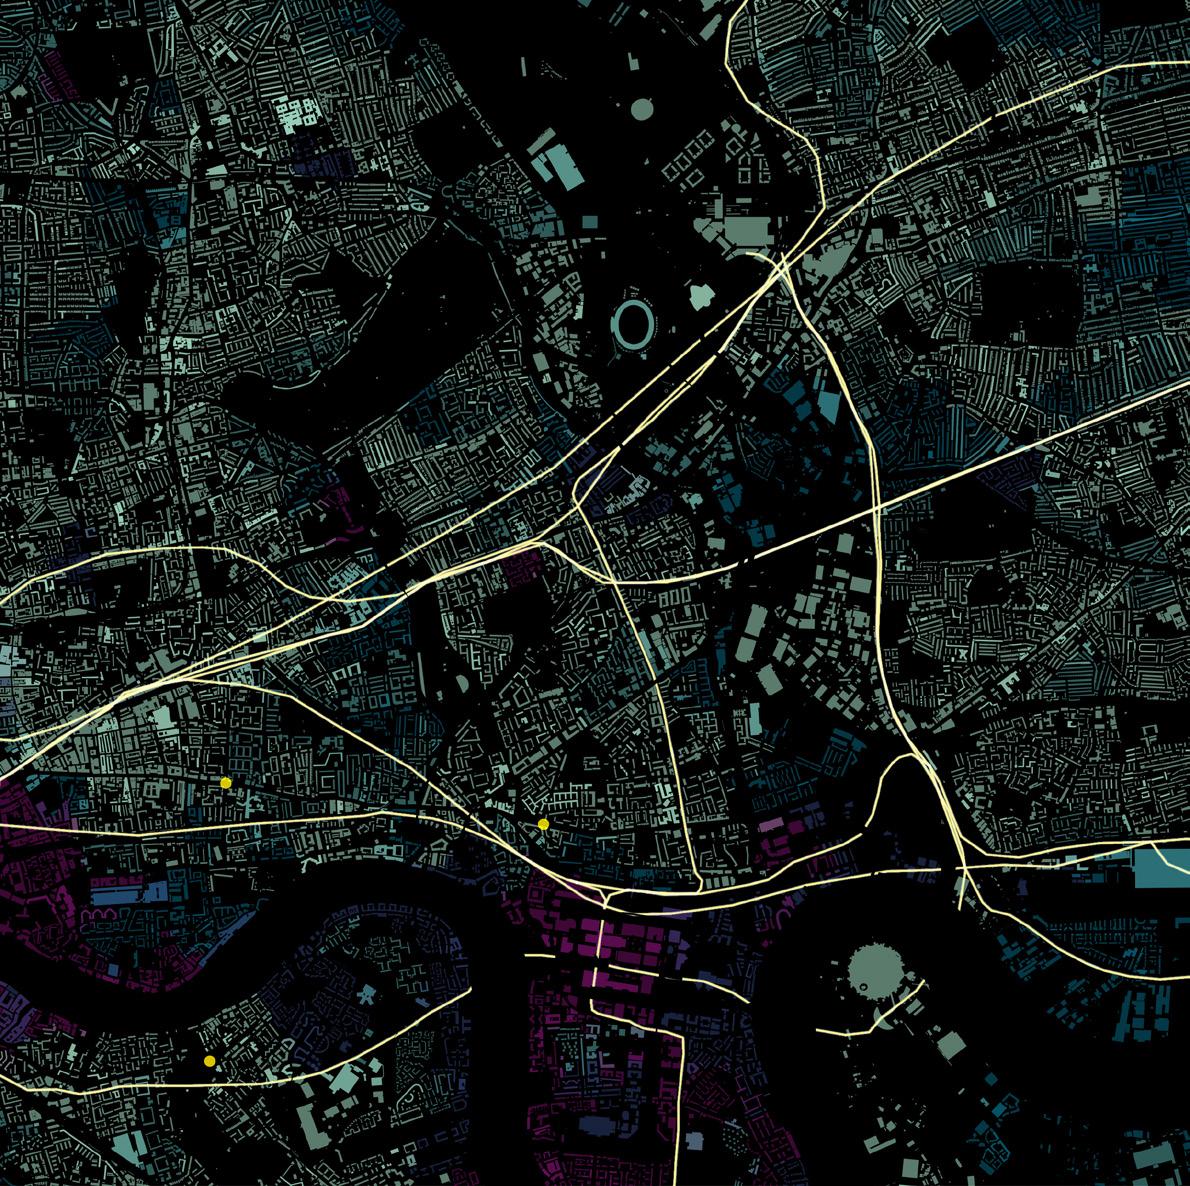
Location Analysis: School Locations
MICRO SITE: BRENT NEIGHBORHOOD
MESO SITE: BRENT
Angular Segment Analysis: Integration 2KM
MACRO SITE: LONDON
Demographic Analysis: # of Pupils going to school
RESAMPLED DATASETS
Beside is a list of the datasets that were resampled and relevant to some of the factors that may be inhibiting the children from achieving their full potential, developmental needs and education.
BRENT SITE: TEST SET
CENTRAL LONDON SITE: TRAIN SET
Bus Stop Locations
School Locations Fast Food restaurant locations
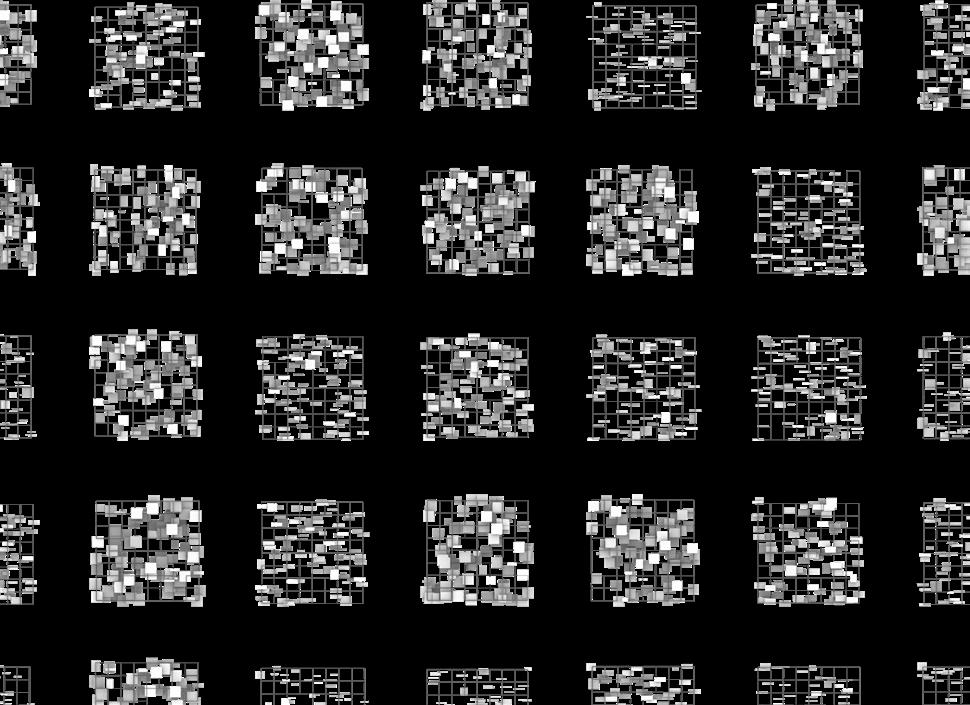
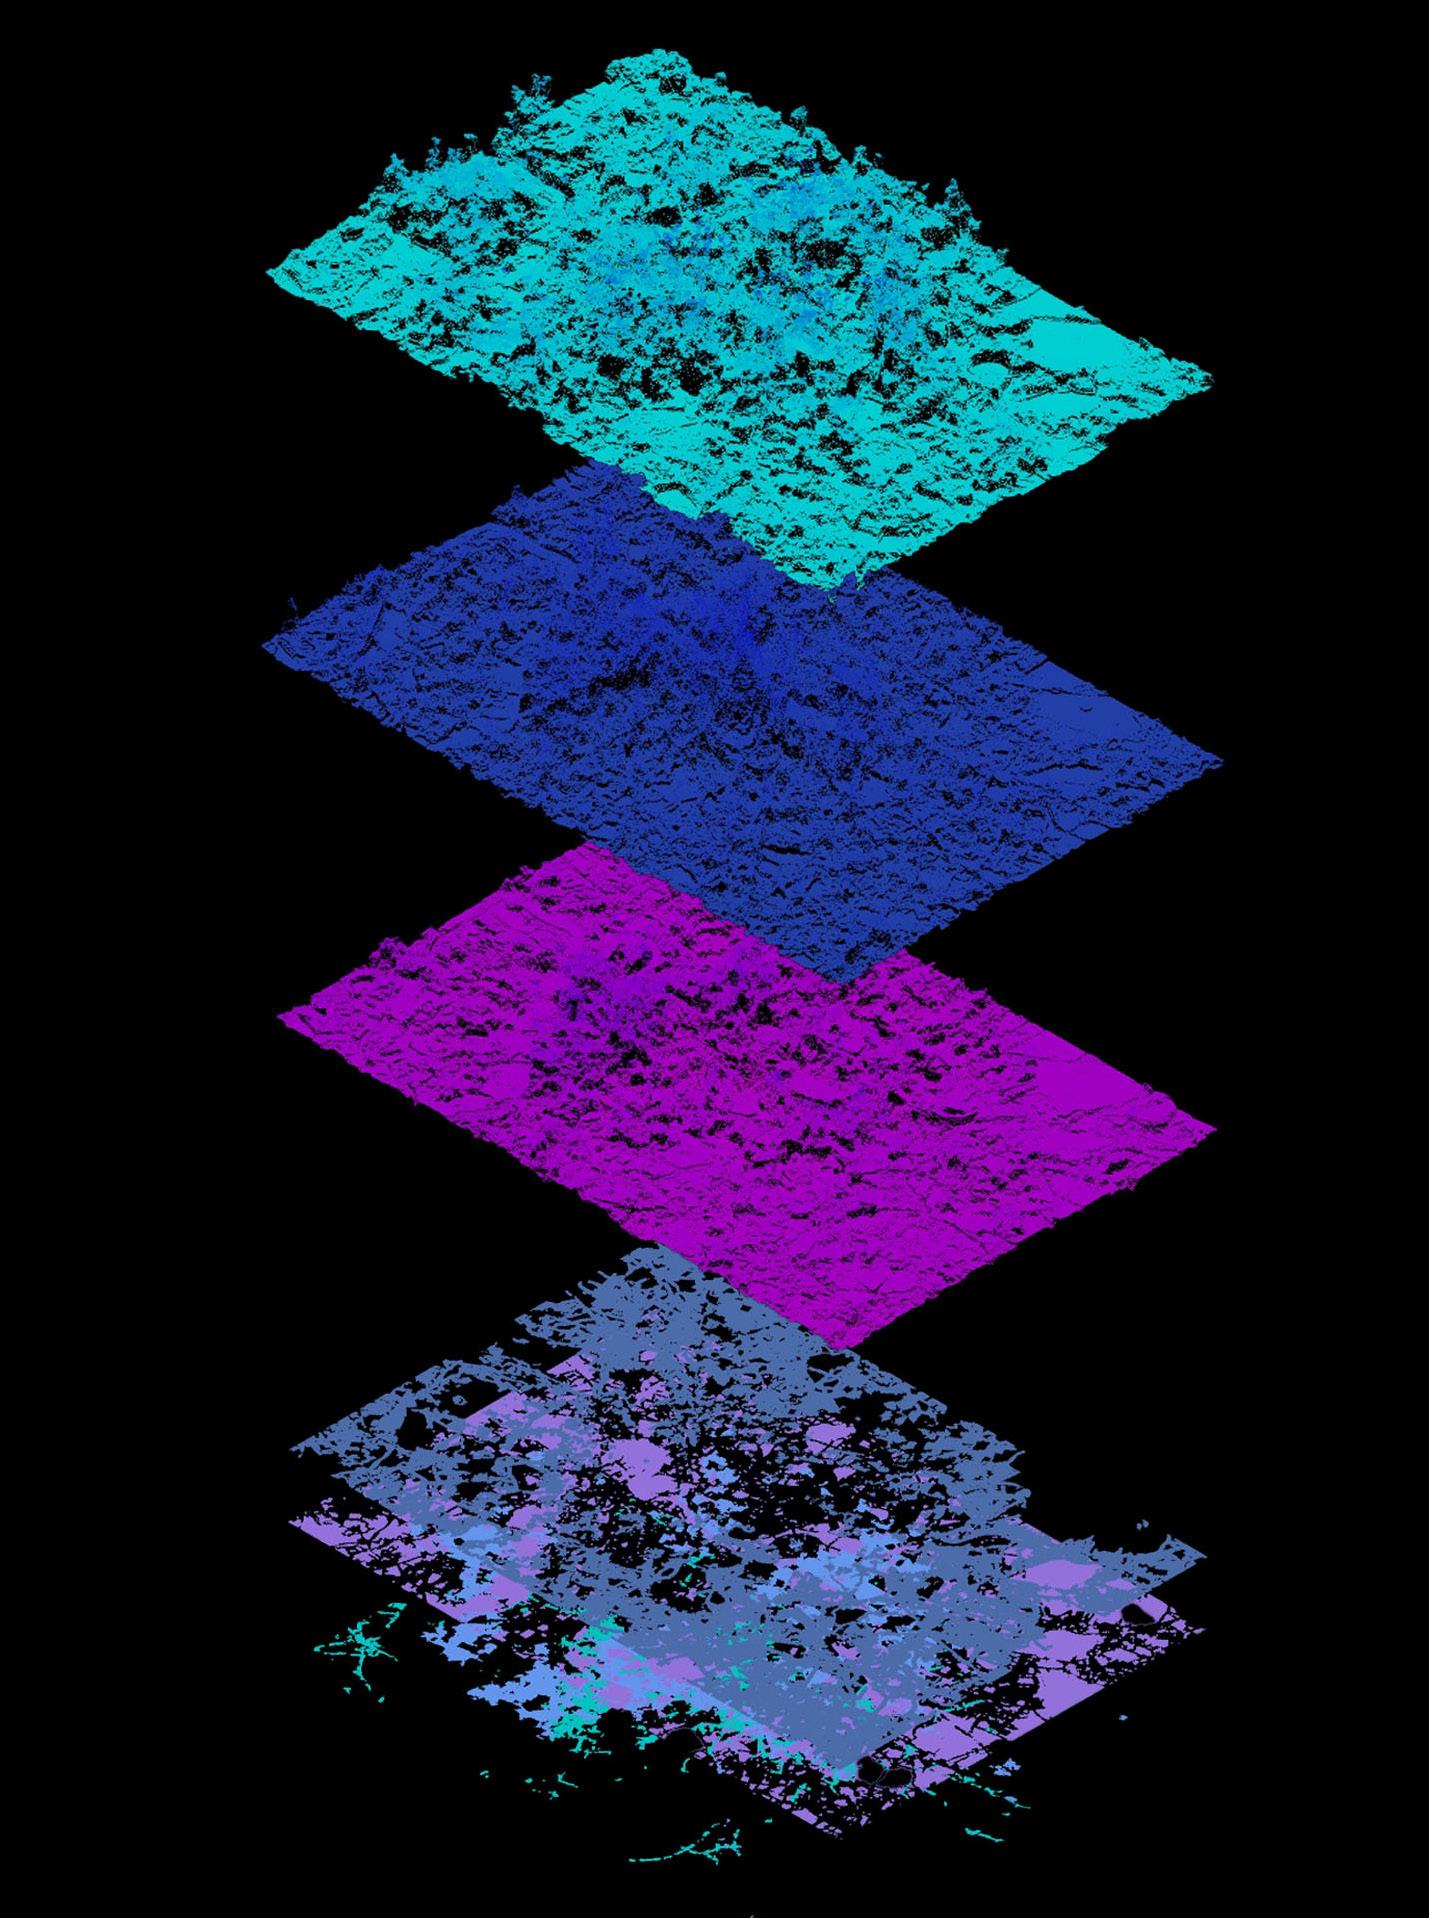
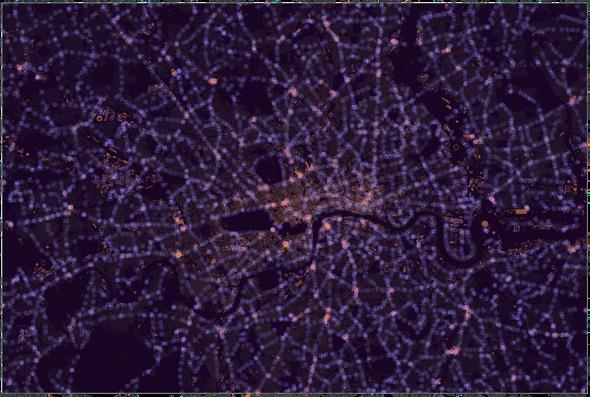
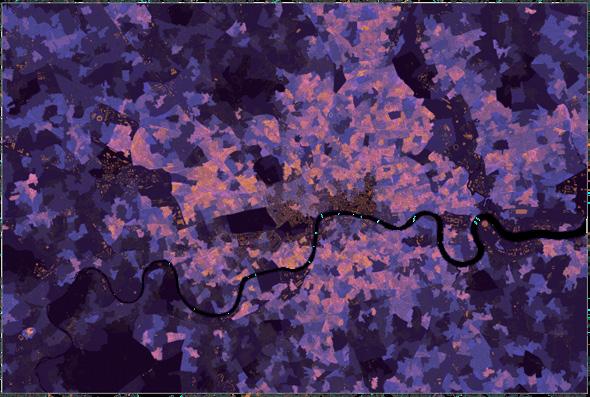
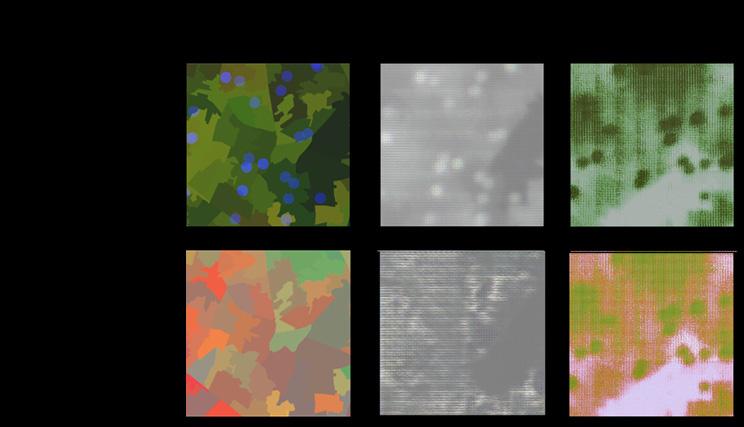
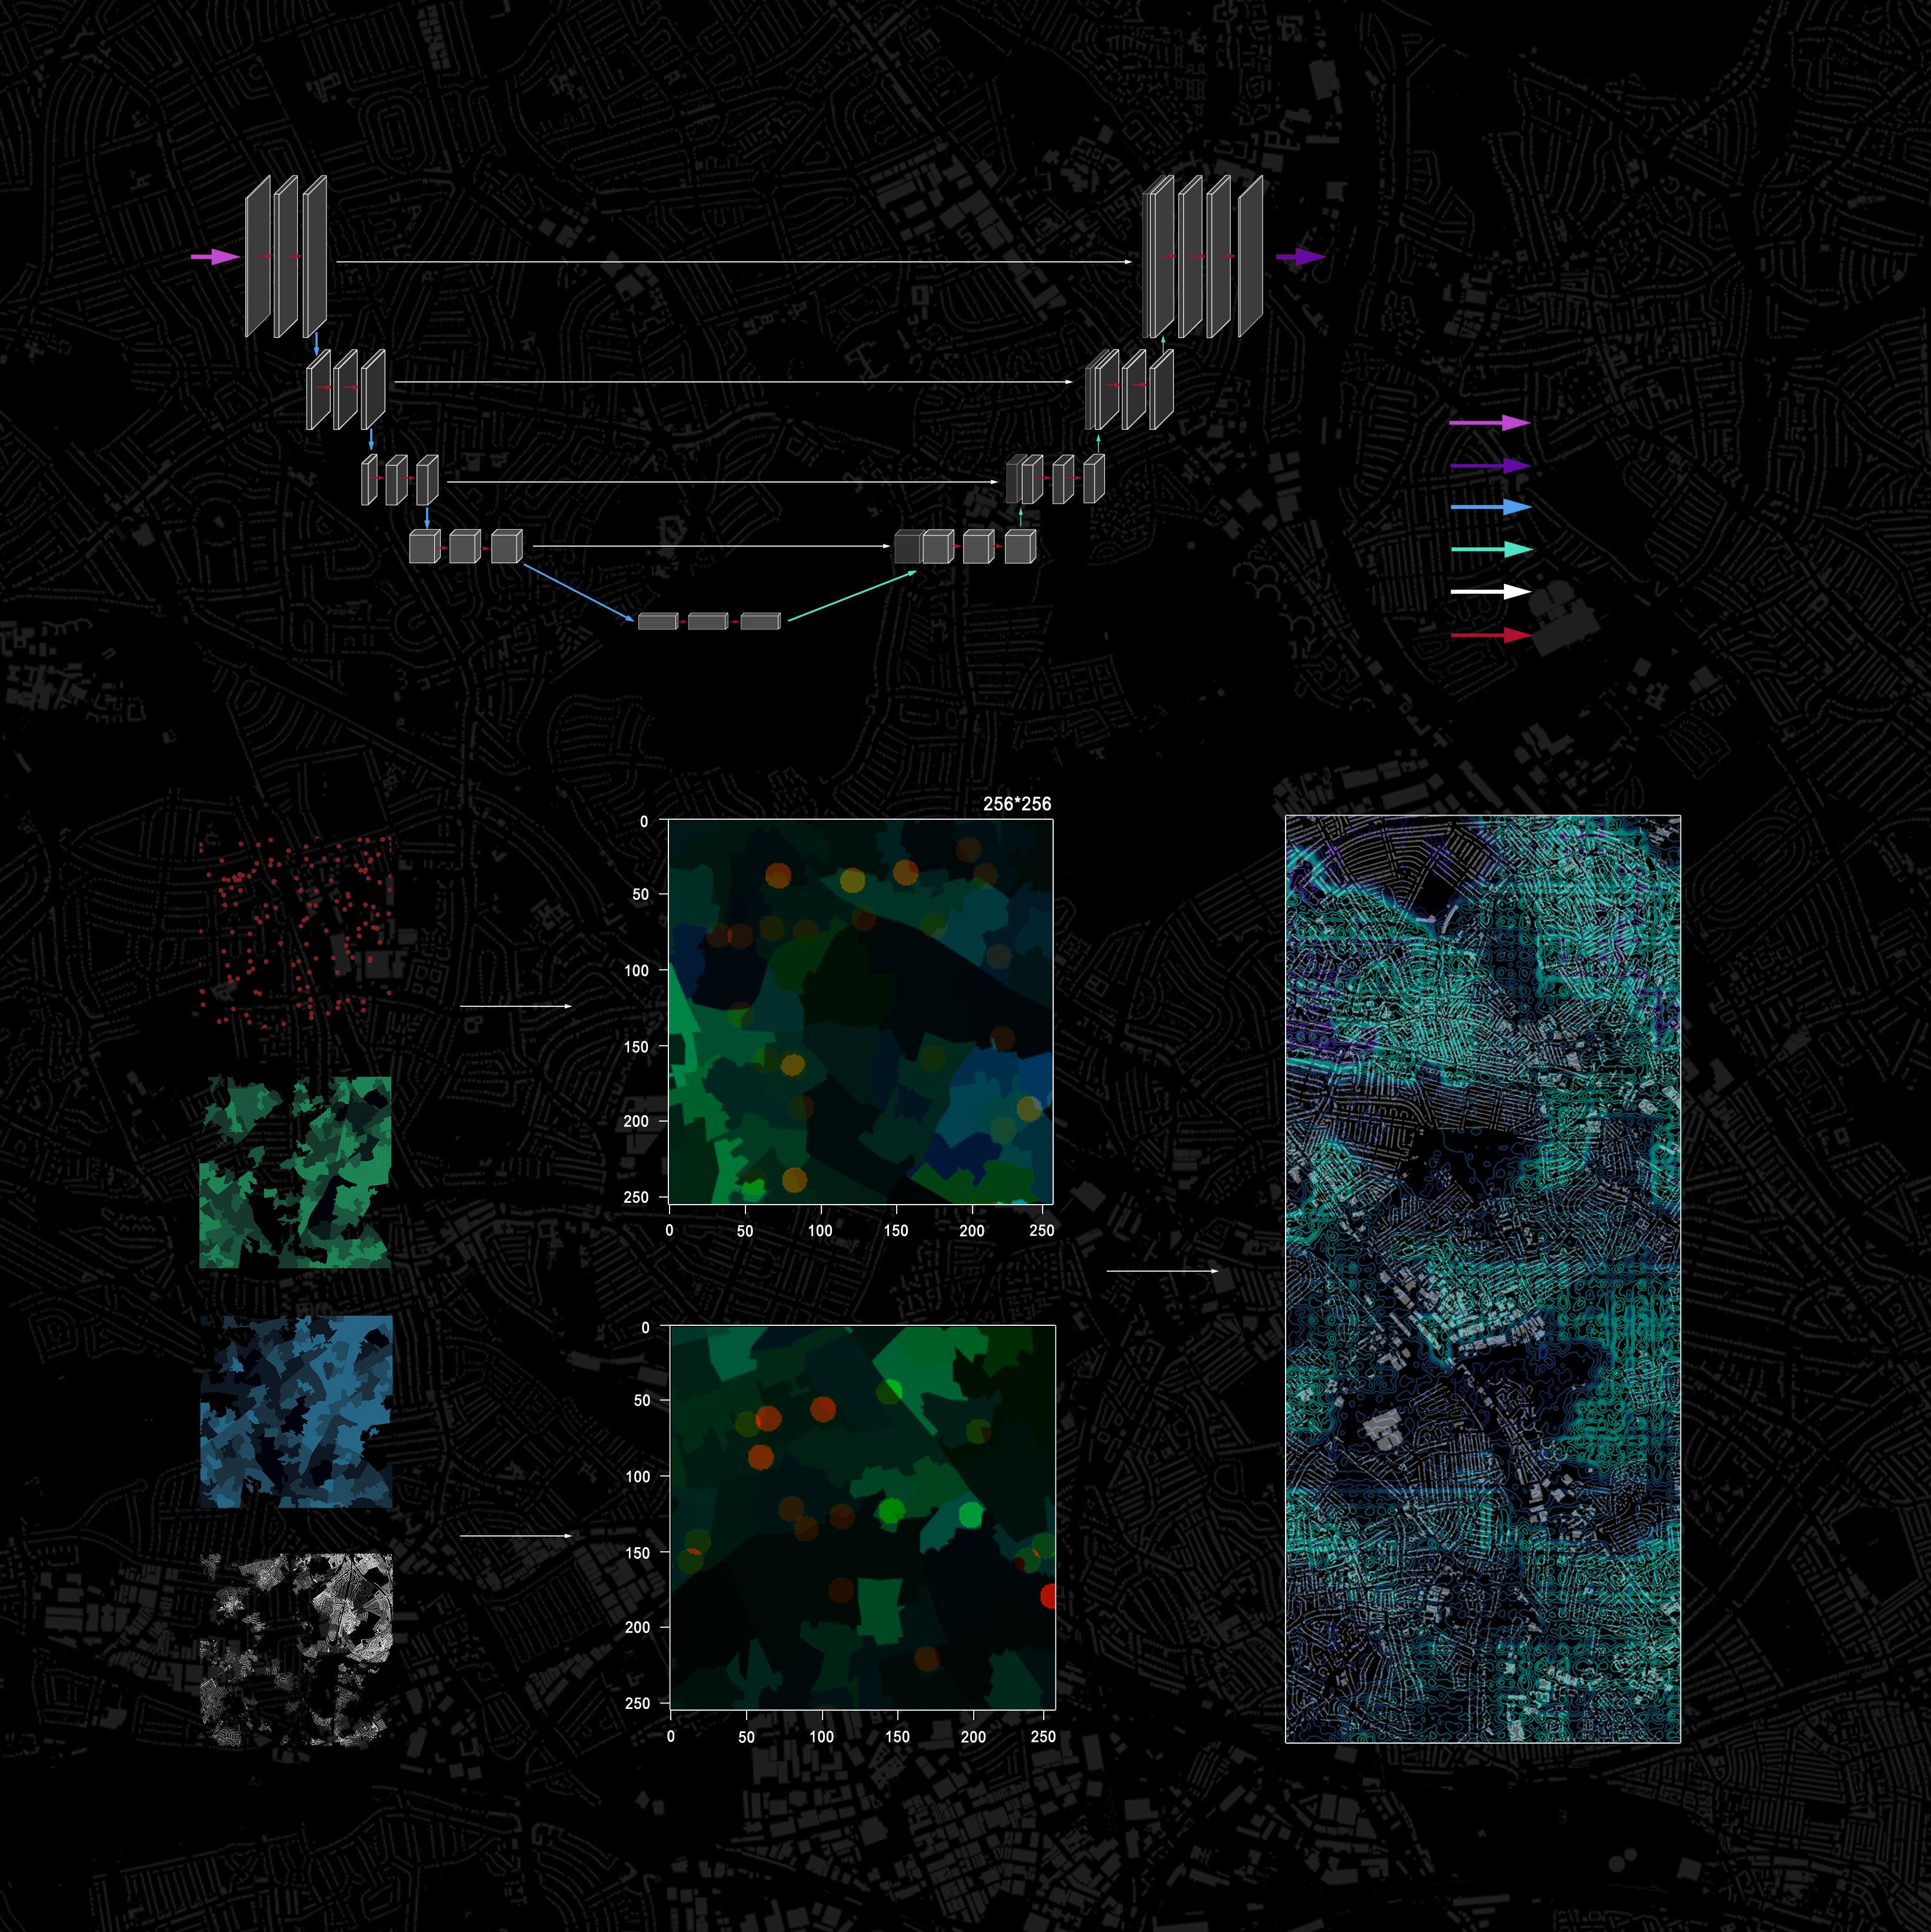
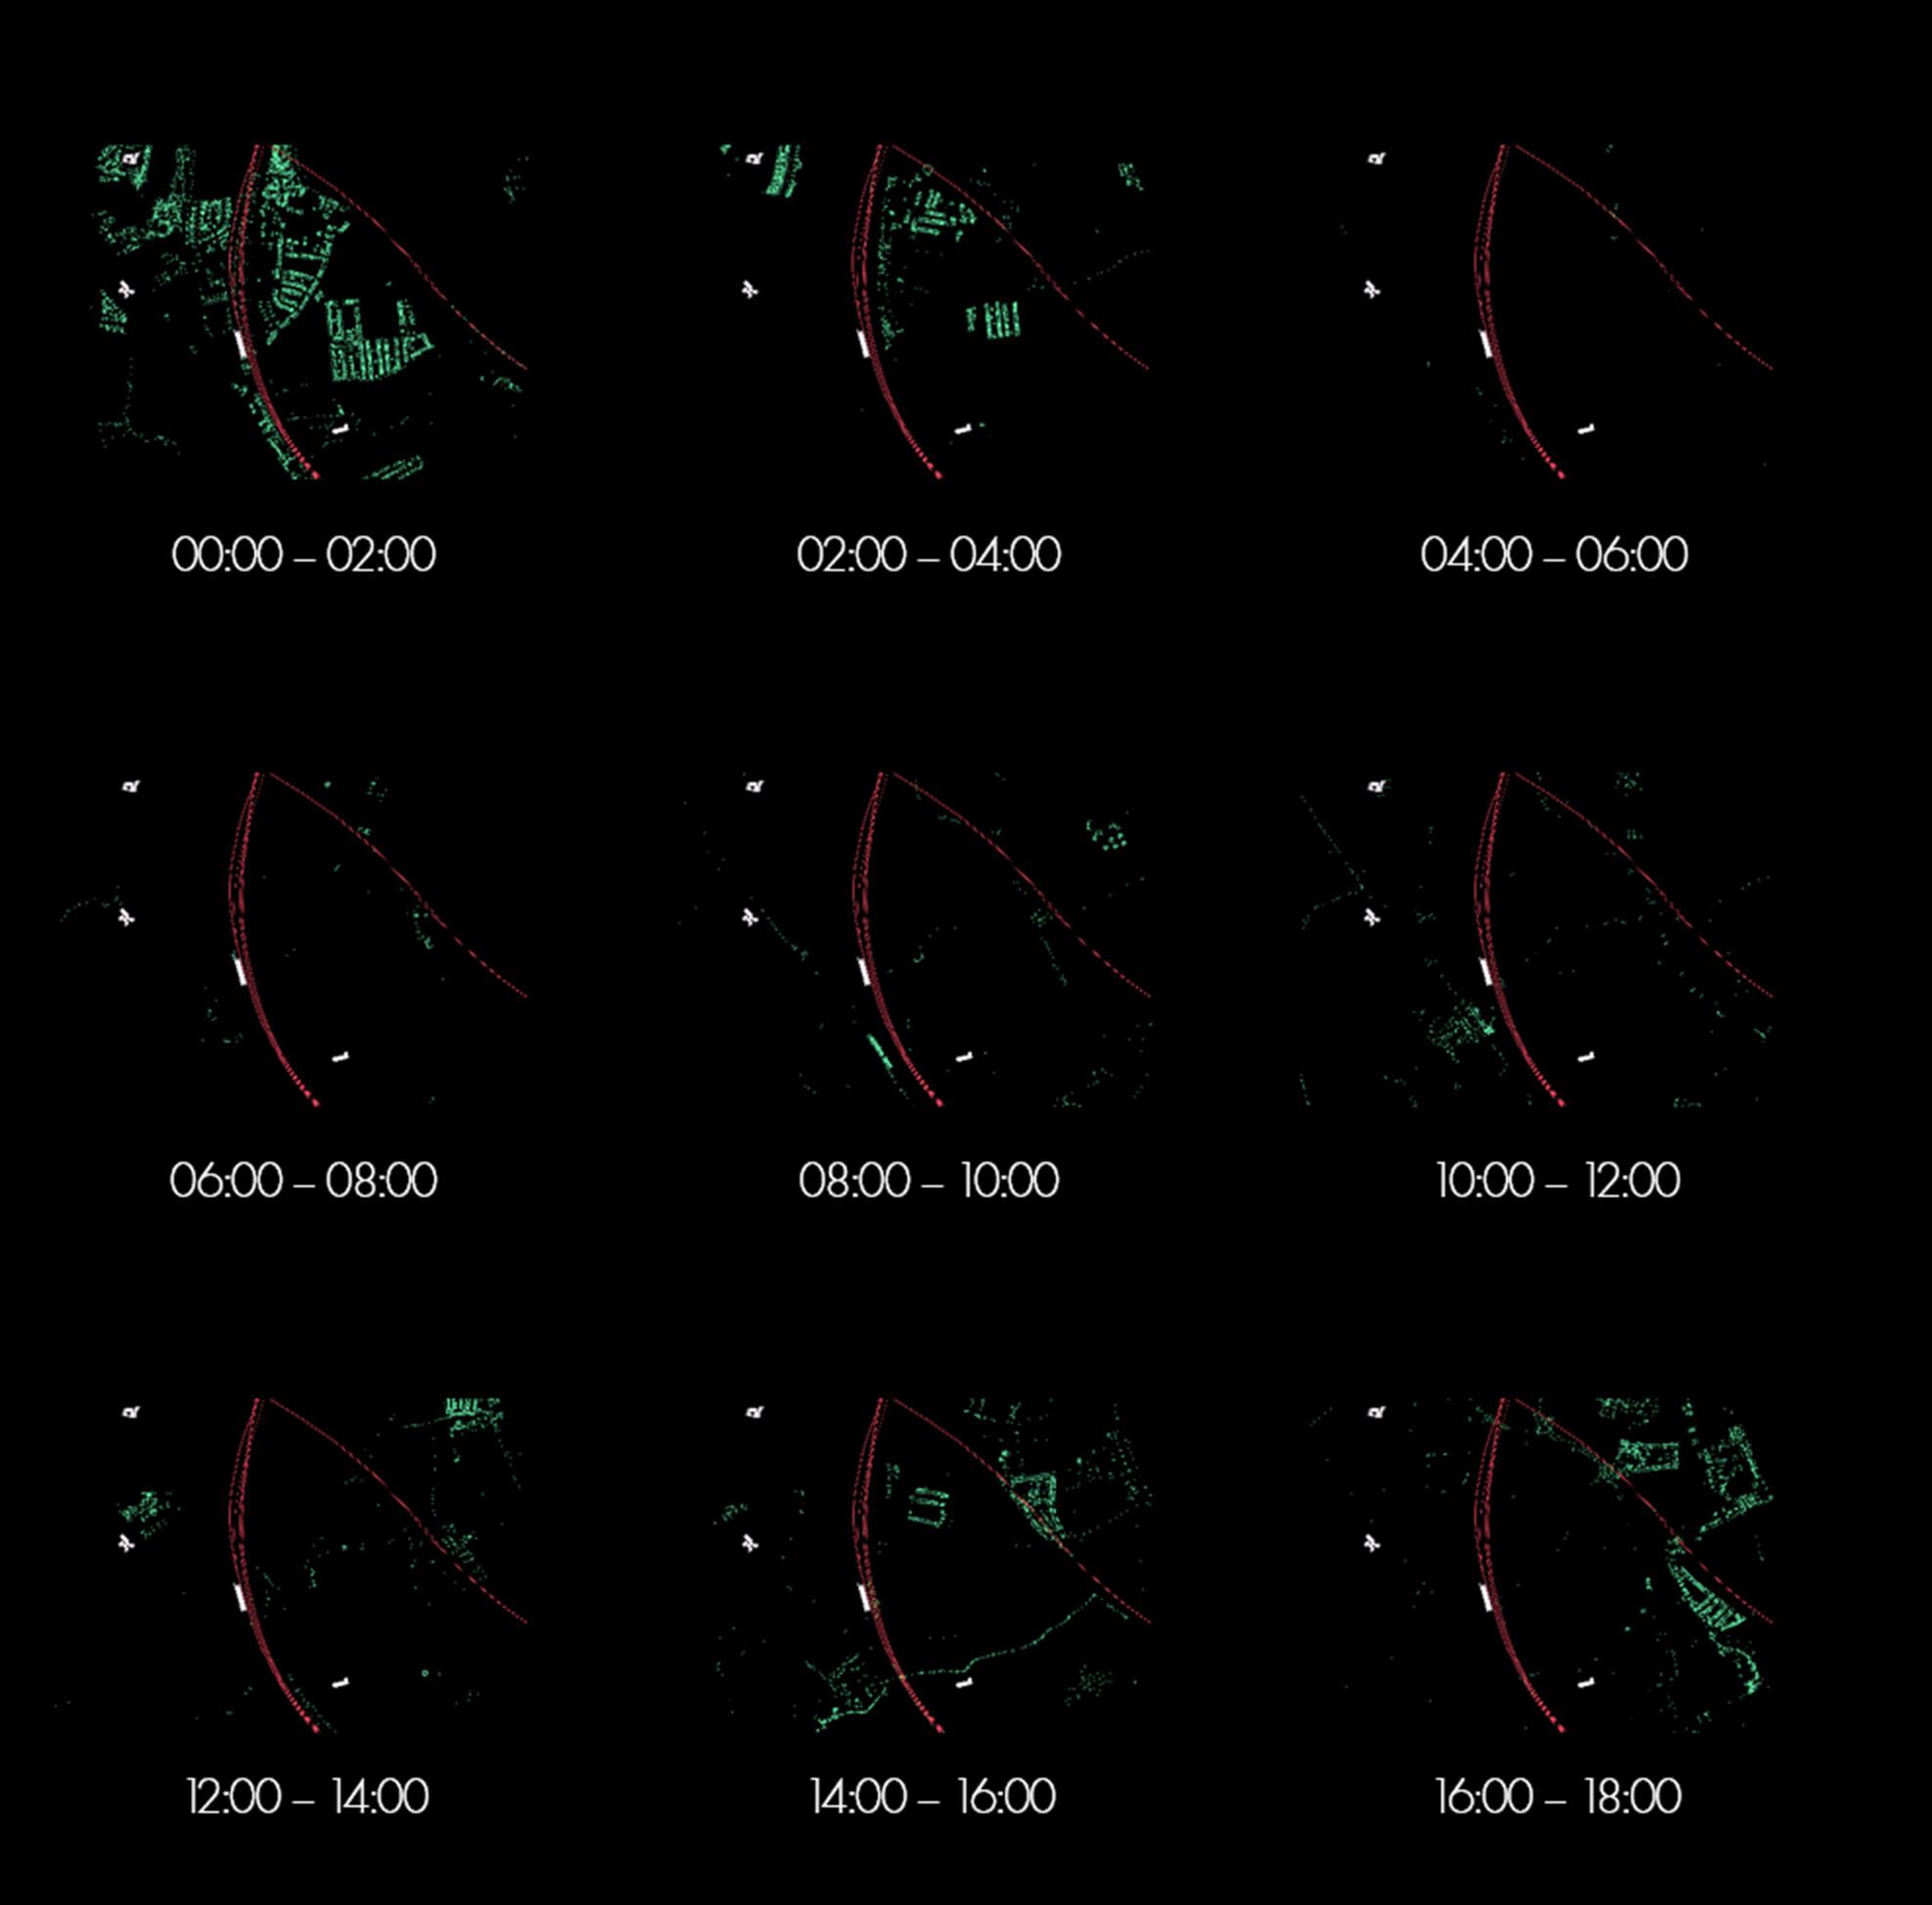
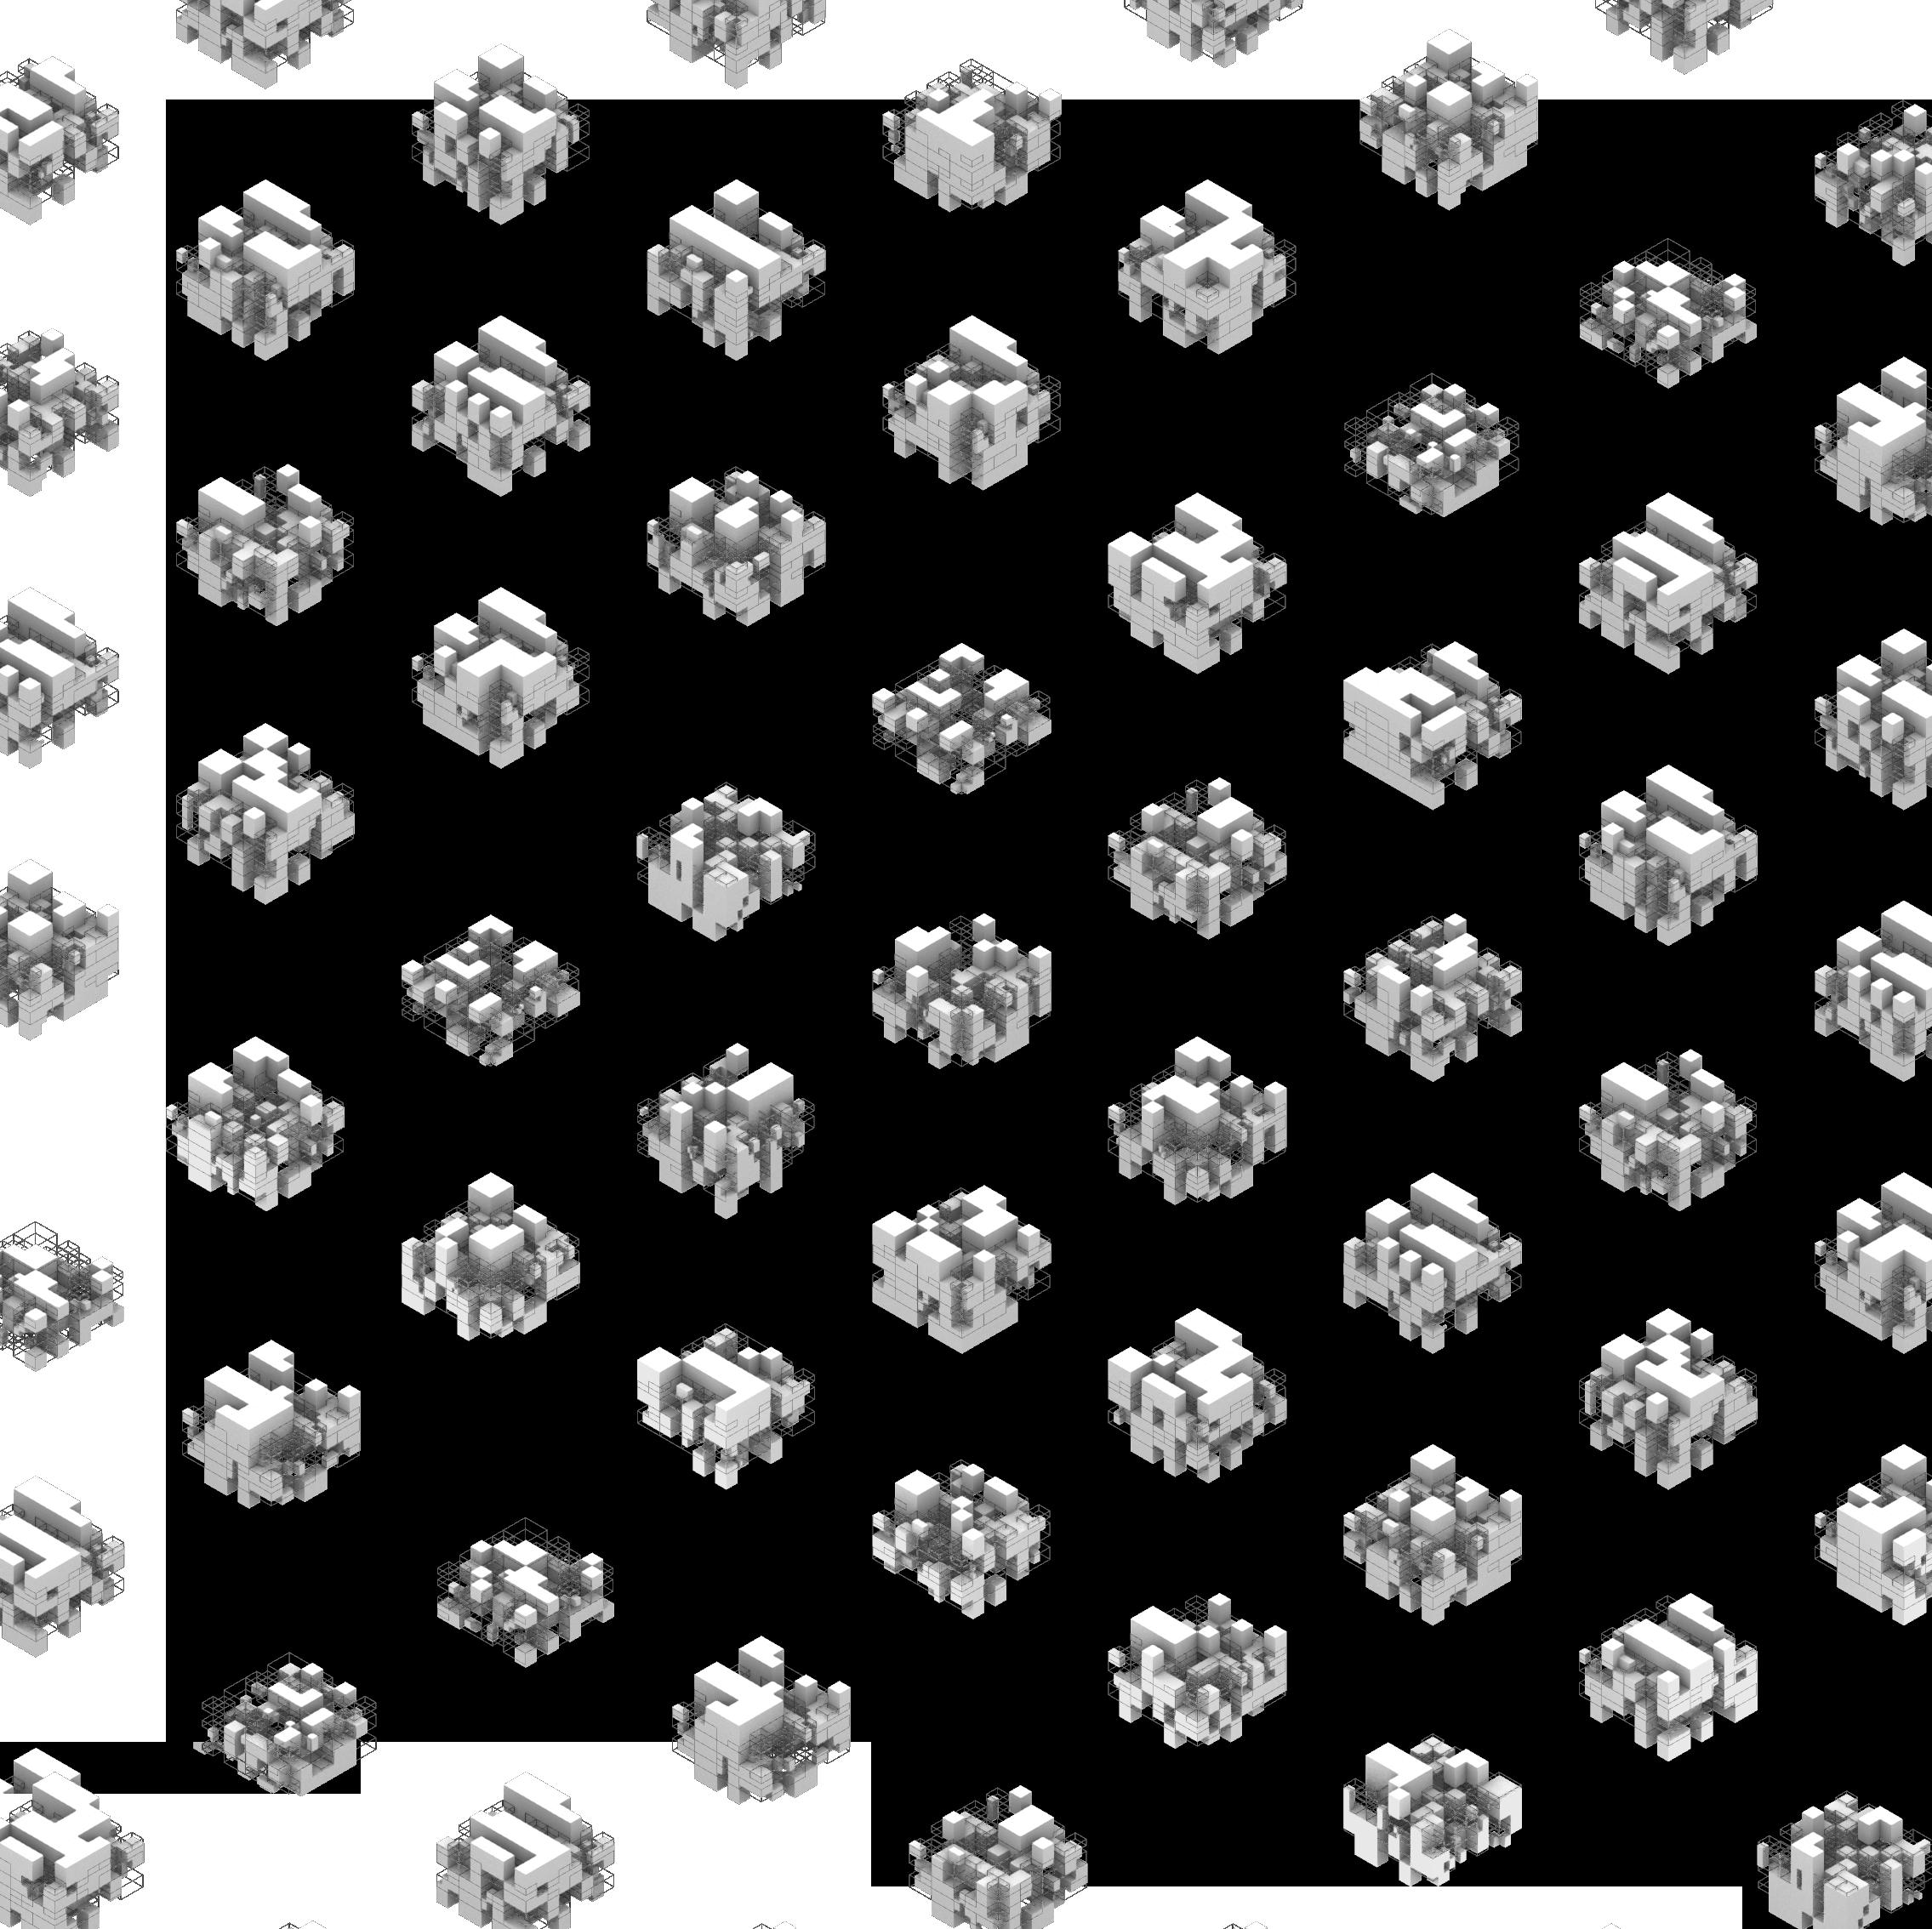
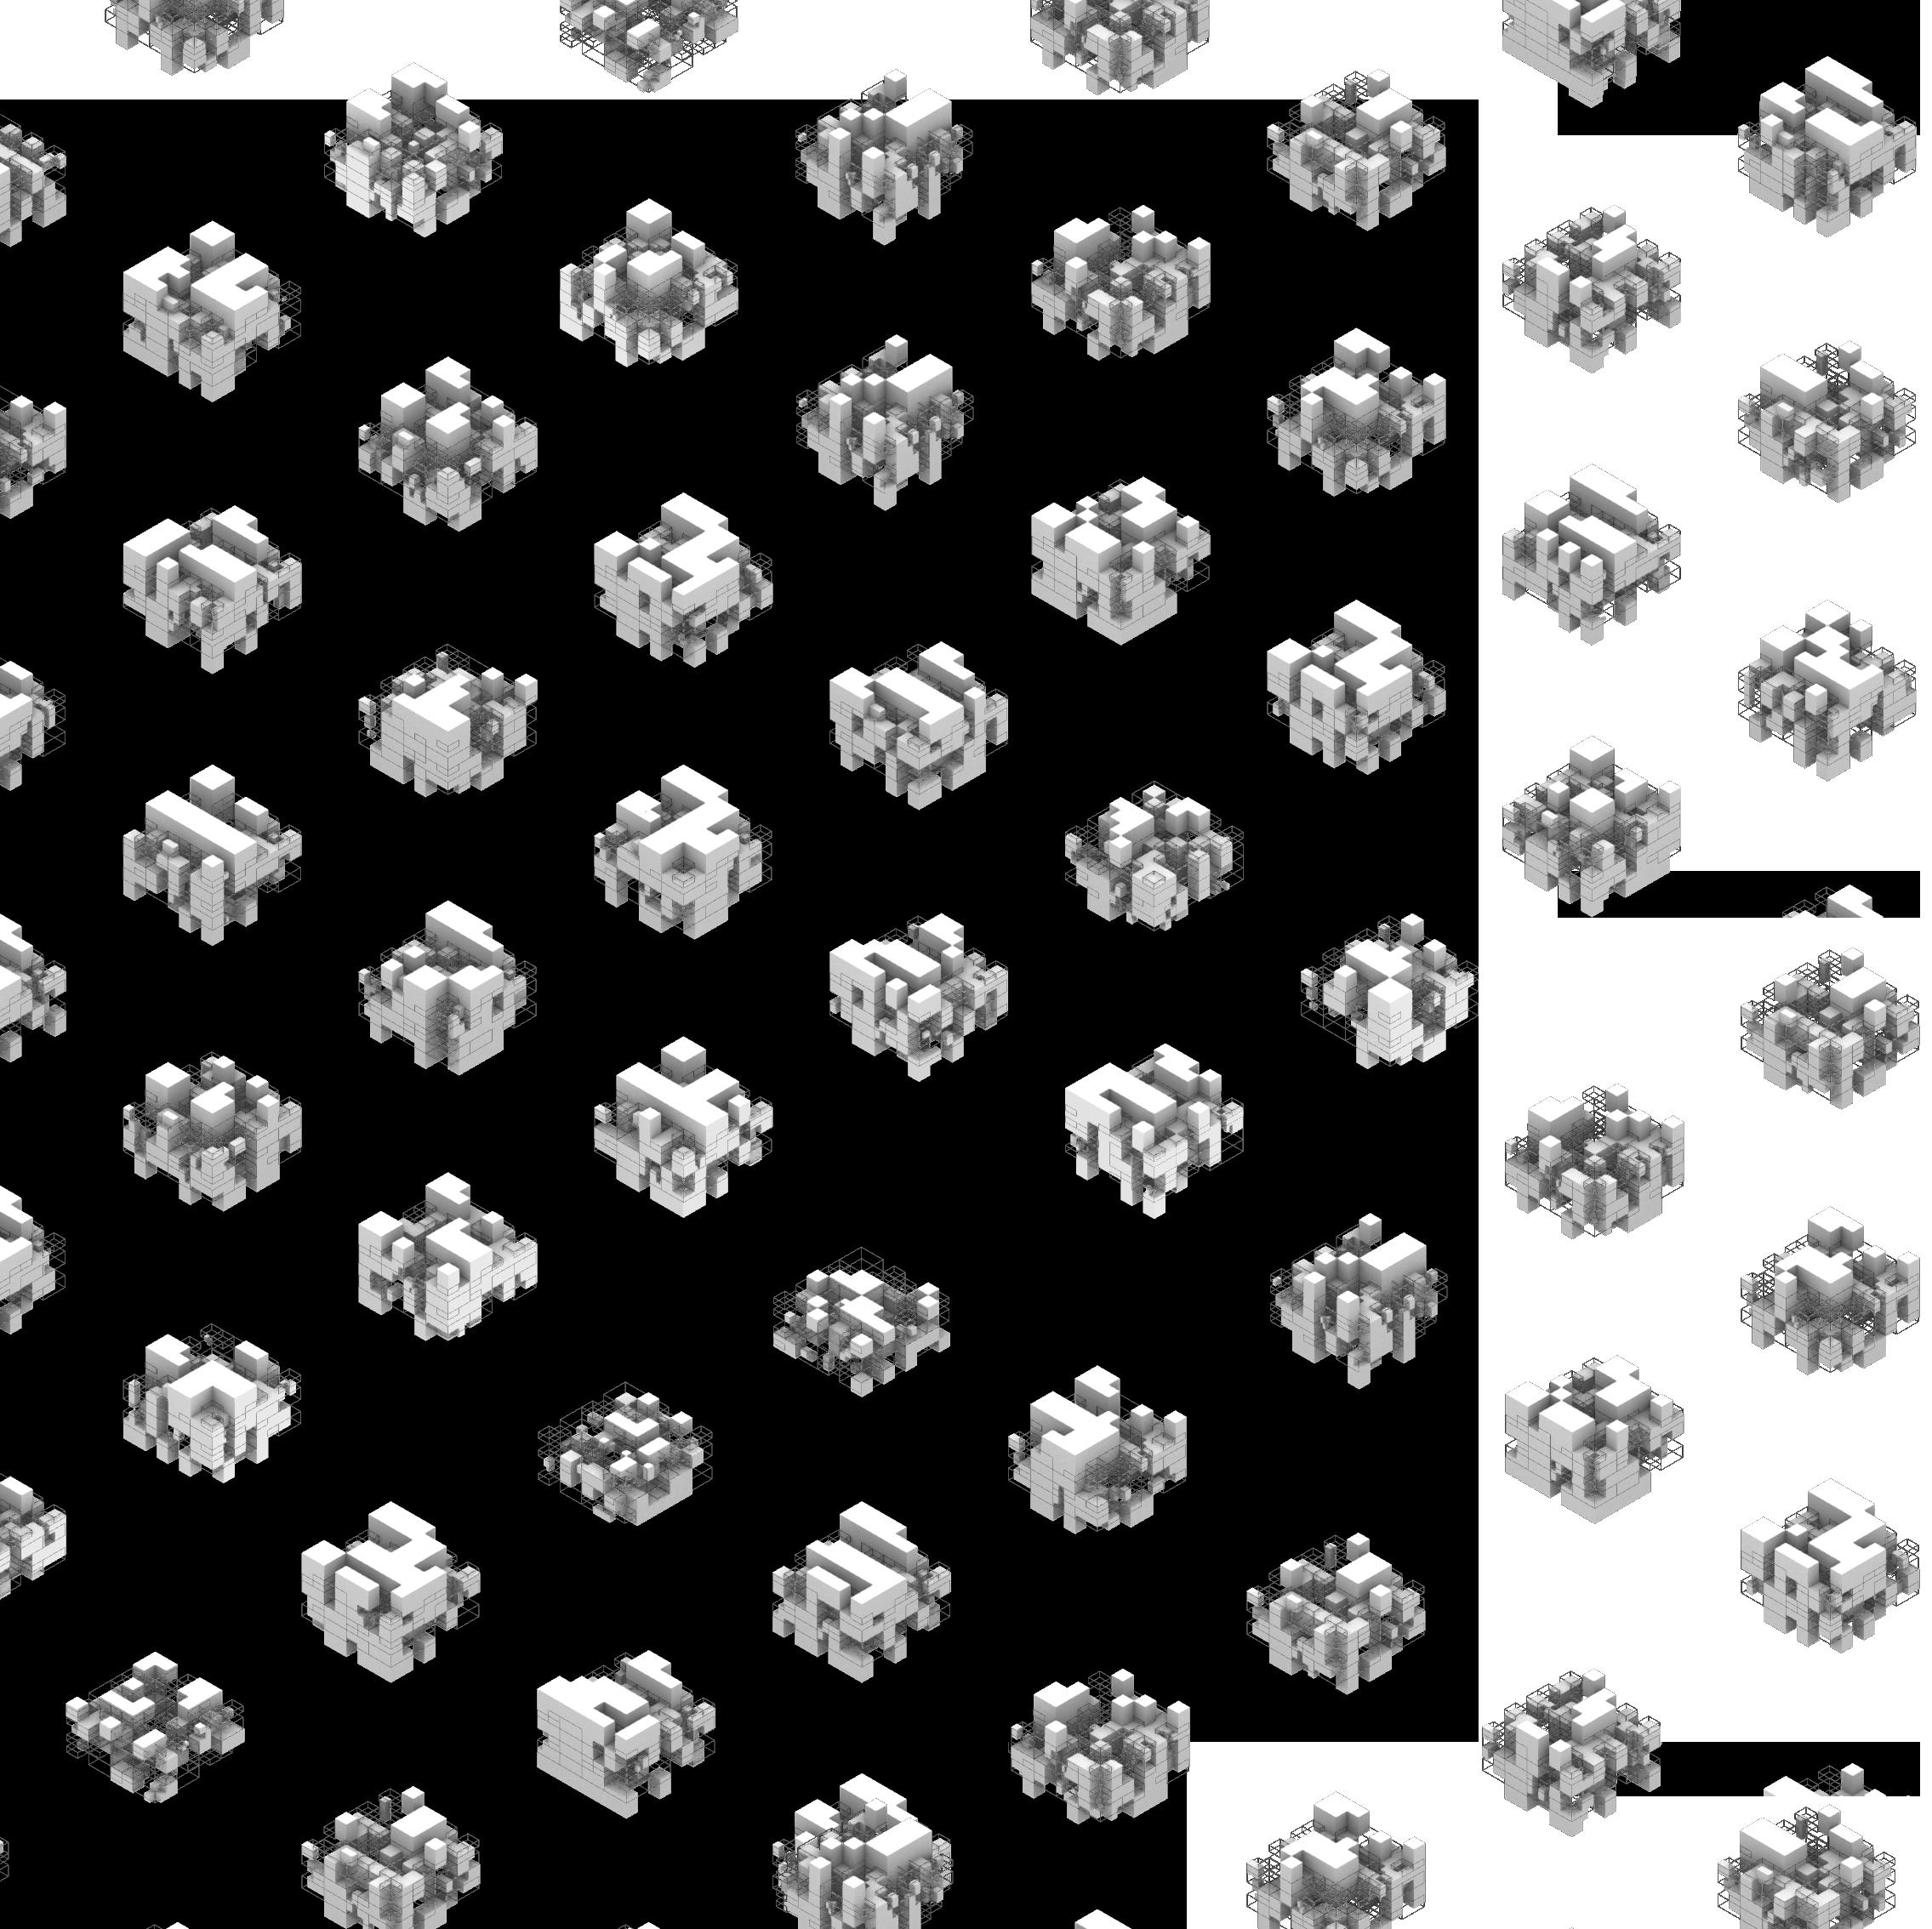
Using our resampled datasets, we ran a pix2pix analysis on 6 stacks that we have curated. The 6 stacks relate to the themes relevant to the factors affecting the children and they are Health, Food security, safety and Movement/Accessibility.
BRENT GRID: TEST SET
CHOSEN SITE: MICRO SITE
CENTRAL LONDON GRID: TRAINING SET
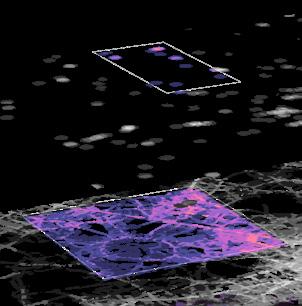
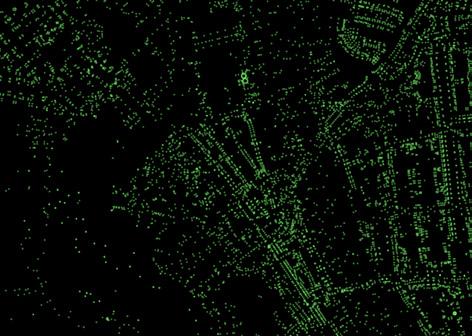
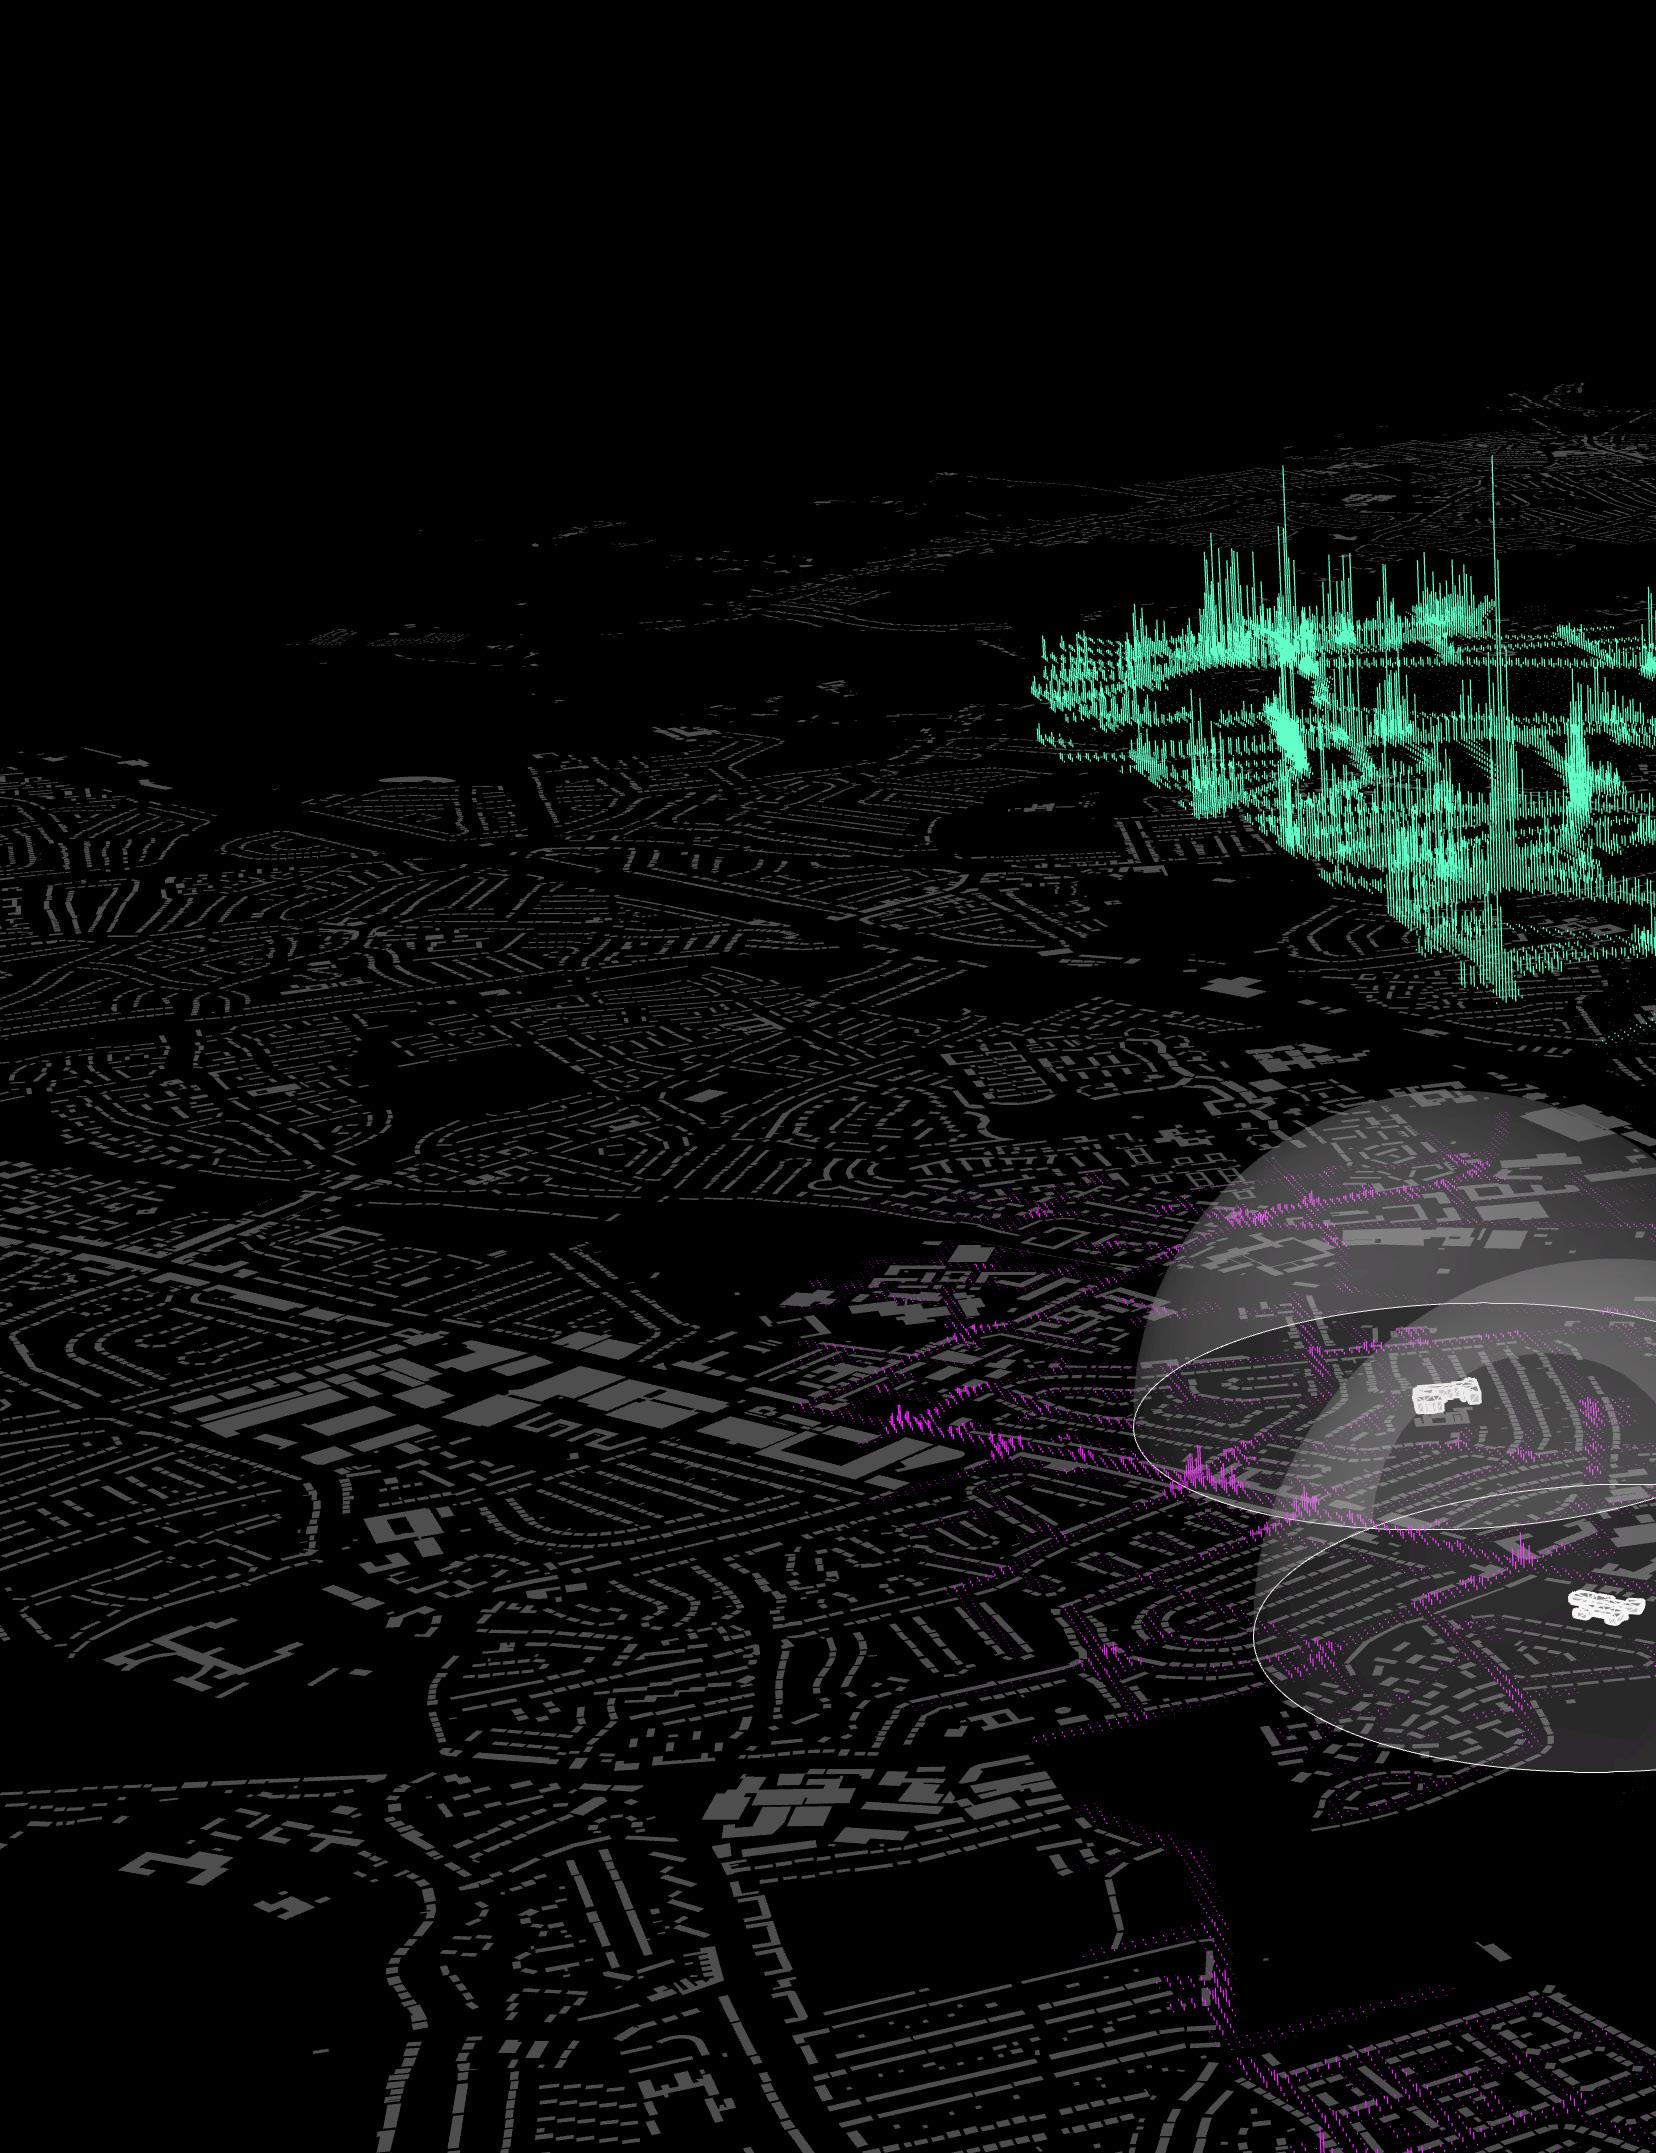
The use of Pix2pix and its generative adversarial networks (GANs) allows us to transform our complex datasets into interpretable visual maps.
In order for Pix2pix to run, we resampled then supersampled many relevant datasets from a Macro scale large area of London as our training set which omitted data from the Brent site. We then used resampled data from the Brent site as our test set. Essentially, we trained the GAN on the data of all of london minus Brent, and asked the model to vizualize Brent based on the datasets fed into the RGB channels.
Beside is a list of 6 dataset stacks that relate to the themes relevant to the factors affecting children. Each stack is made up of data that is specific to what could improve a child’s holistic development.
STACK 1 SAFETY –Crime Rate, Building Density, School Count
Y LABEL - Integration 2km
STACK 2 HEALTH –
Pupil going to school, Household Income, Transport accessibility
Y LABEL - Noise Pollution Average
Supersampling/Input Output
Visualised in the 2D
STACK 3 FOOD SECURITY –
E-Food Desert Index, Free School Meals, Fast Food Count
Y LABEL - Building Density
STACK 4 MOVEMENT –
Homes Access Open Space, Transport Accessibility, Bad Health
Y LABEL - Integration 2km
STACK 5 MOVEMENT –
Tree Count, Population Density, Pupils Going to School
Y LABEL - Transport Accessibility
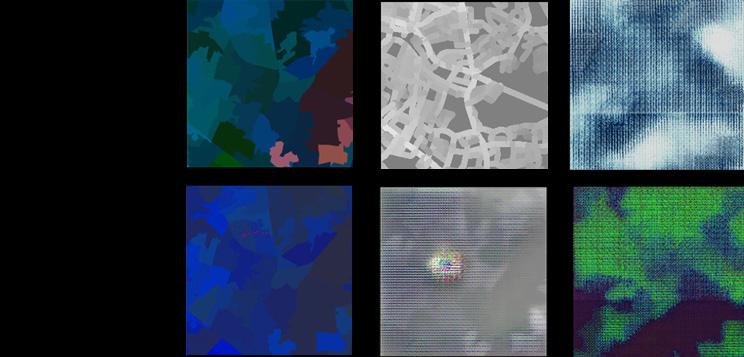
STACK 6 HEALTH –
Child Obesity, Mean Income, Bad health
Y LABEL - Building Density
Resampling Dataset School Locations
2*2 Up-conv 2*2
Copy and crop Con 1*1
Supersampling Dataset High point outputs
PIX2PIX ANALYSIS 3/3
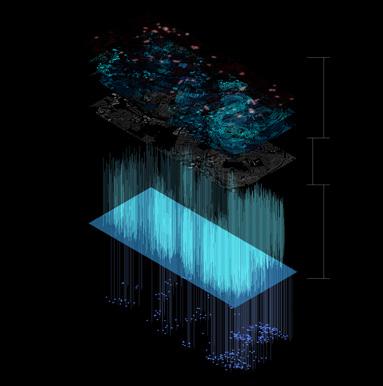
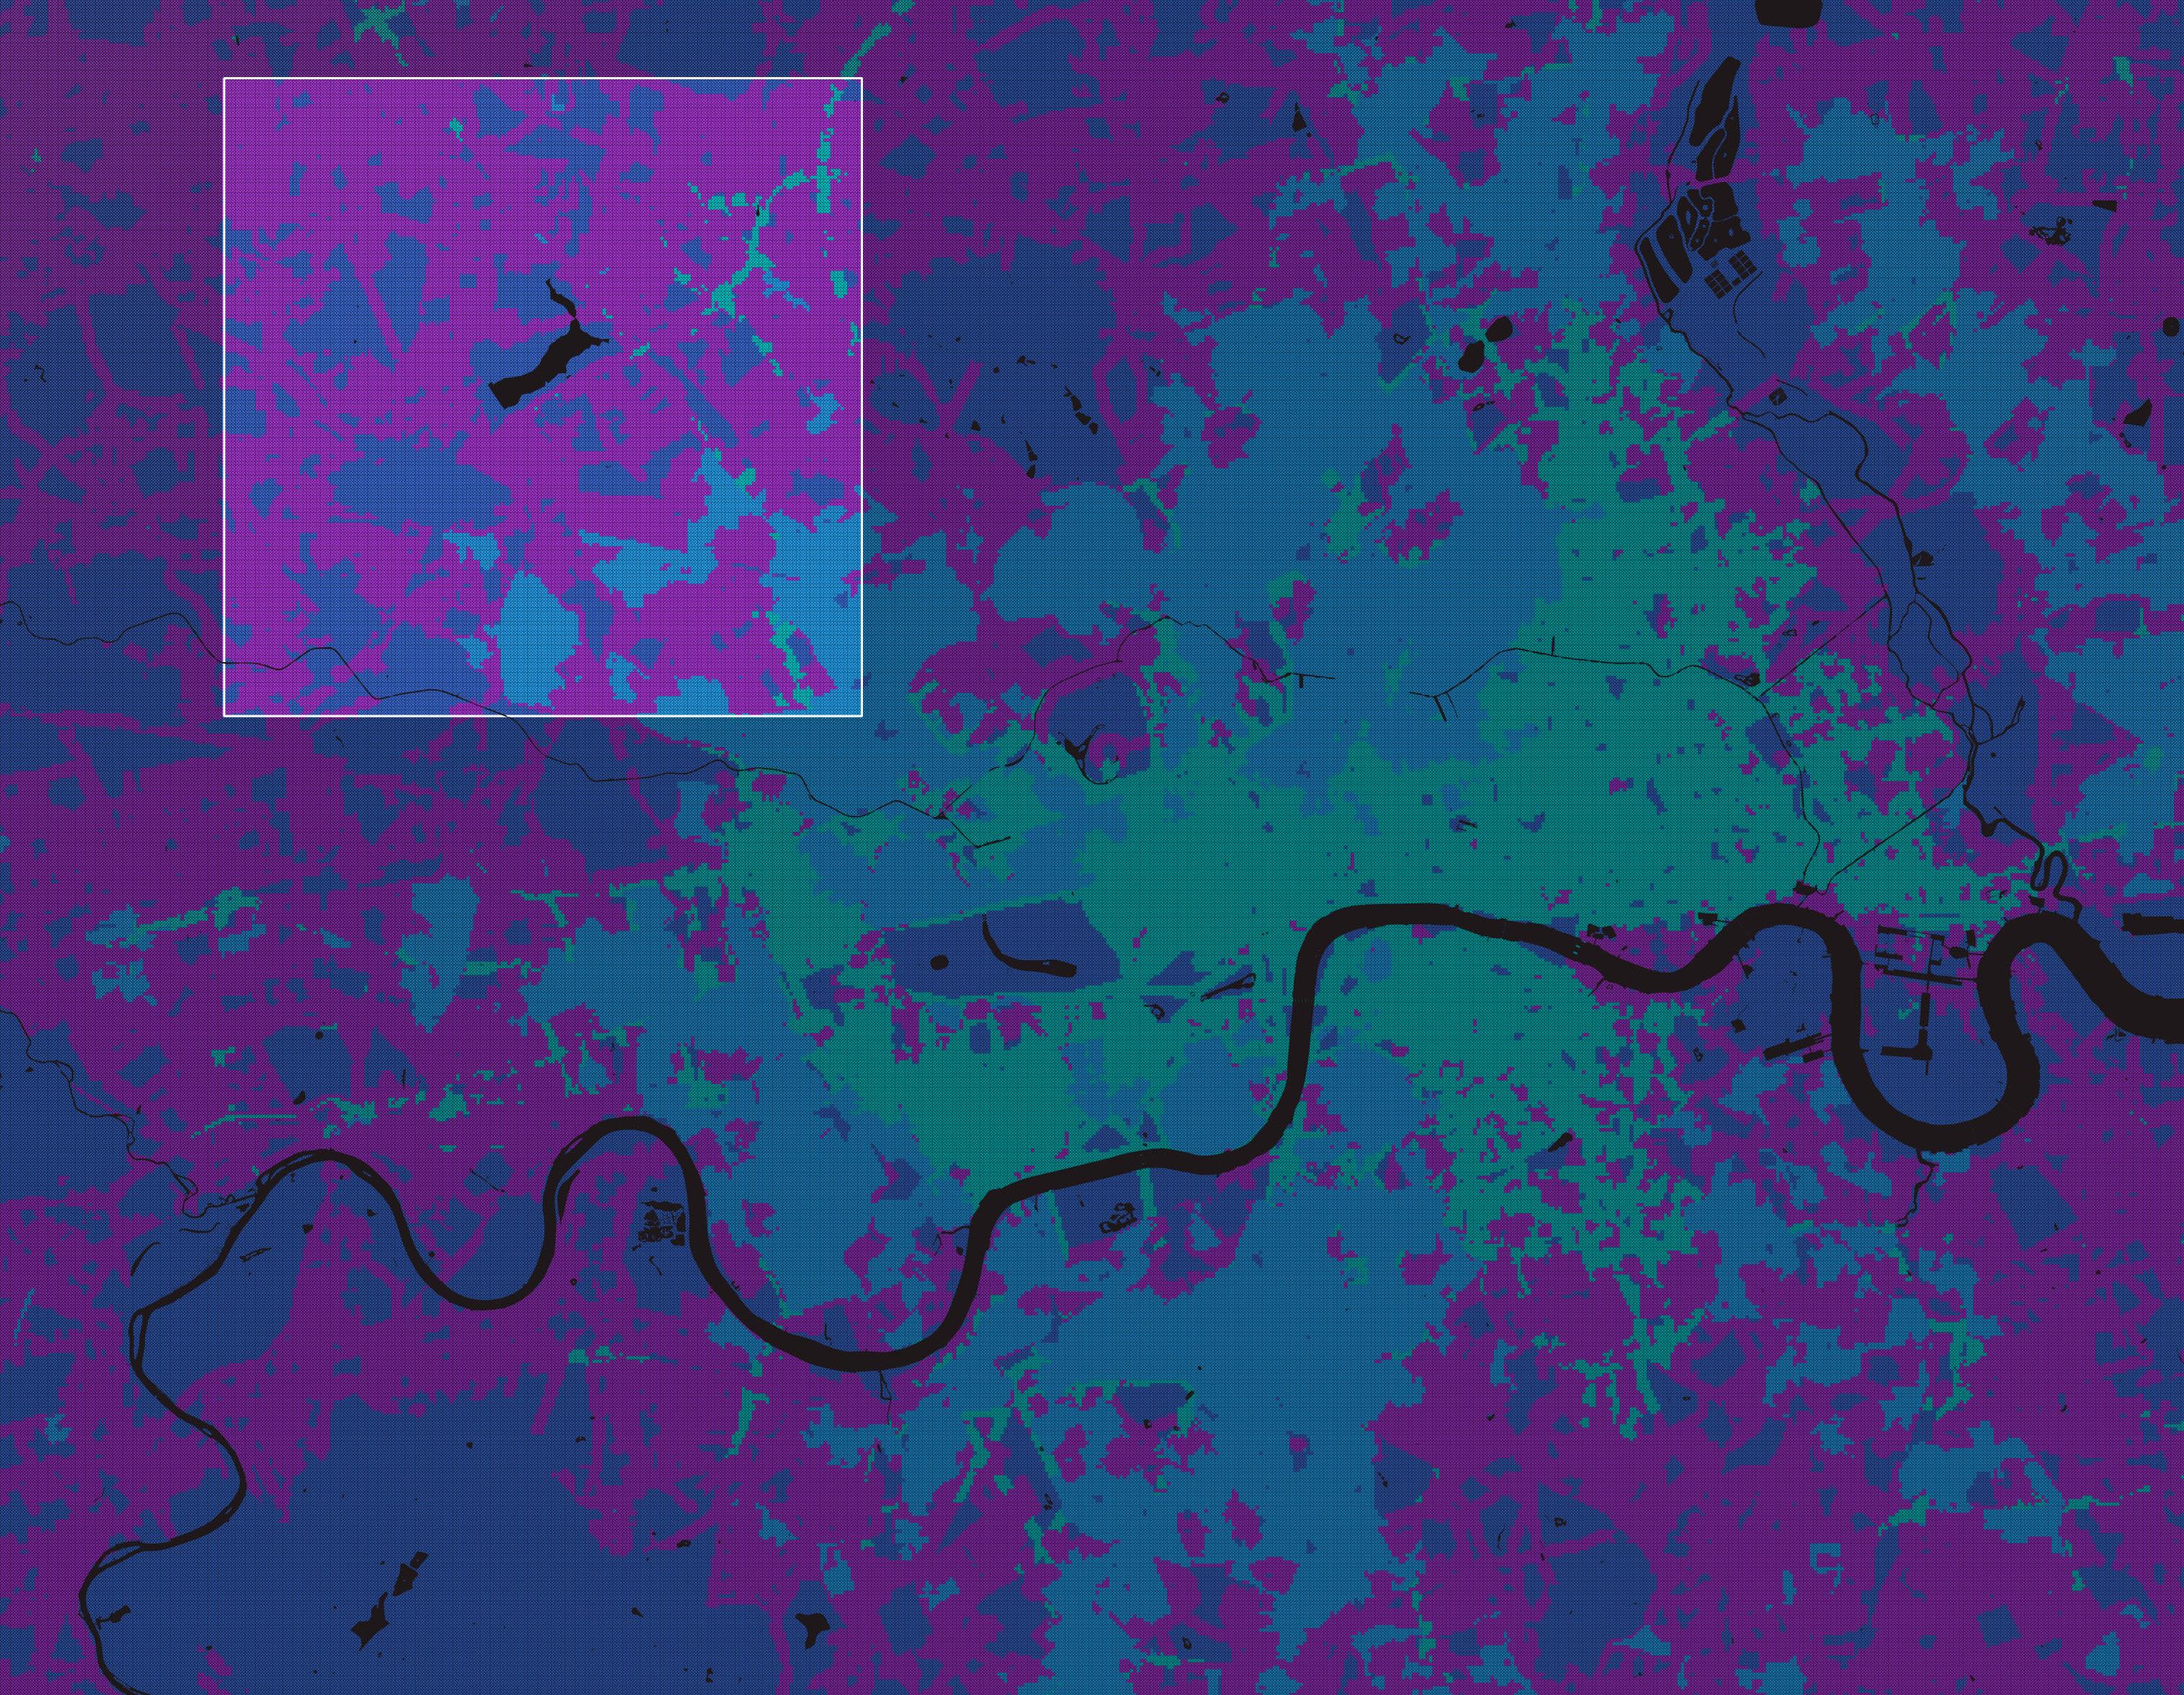
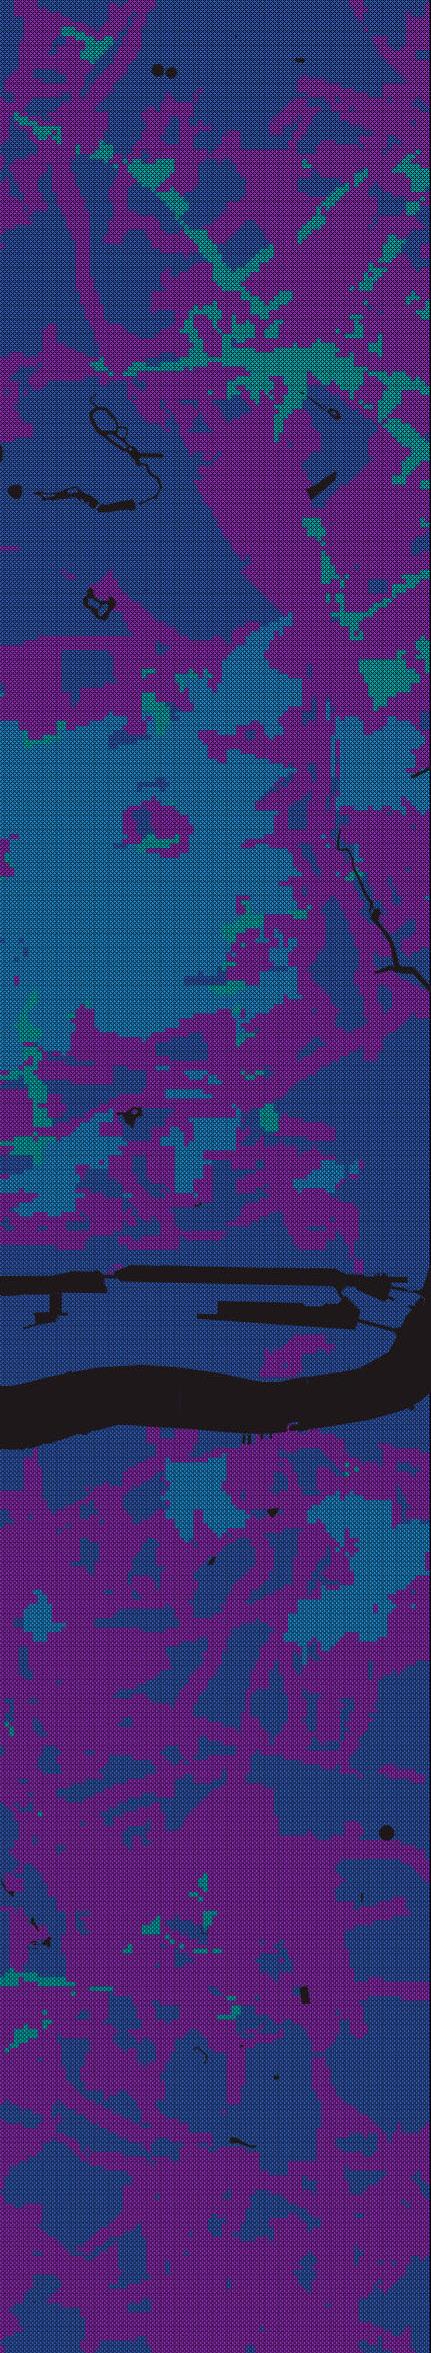
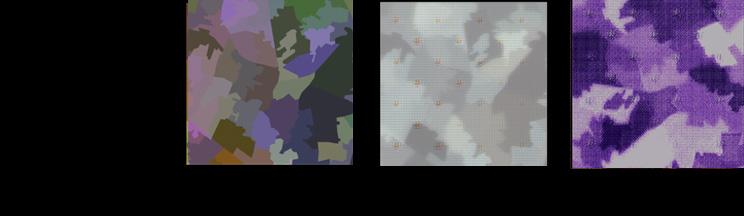
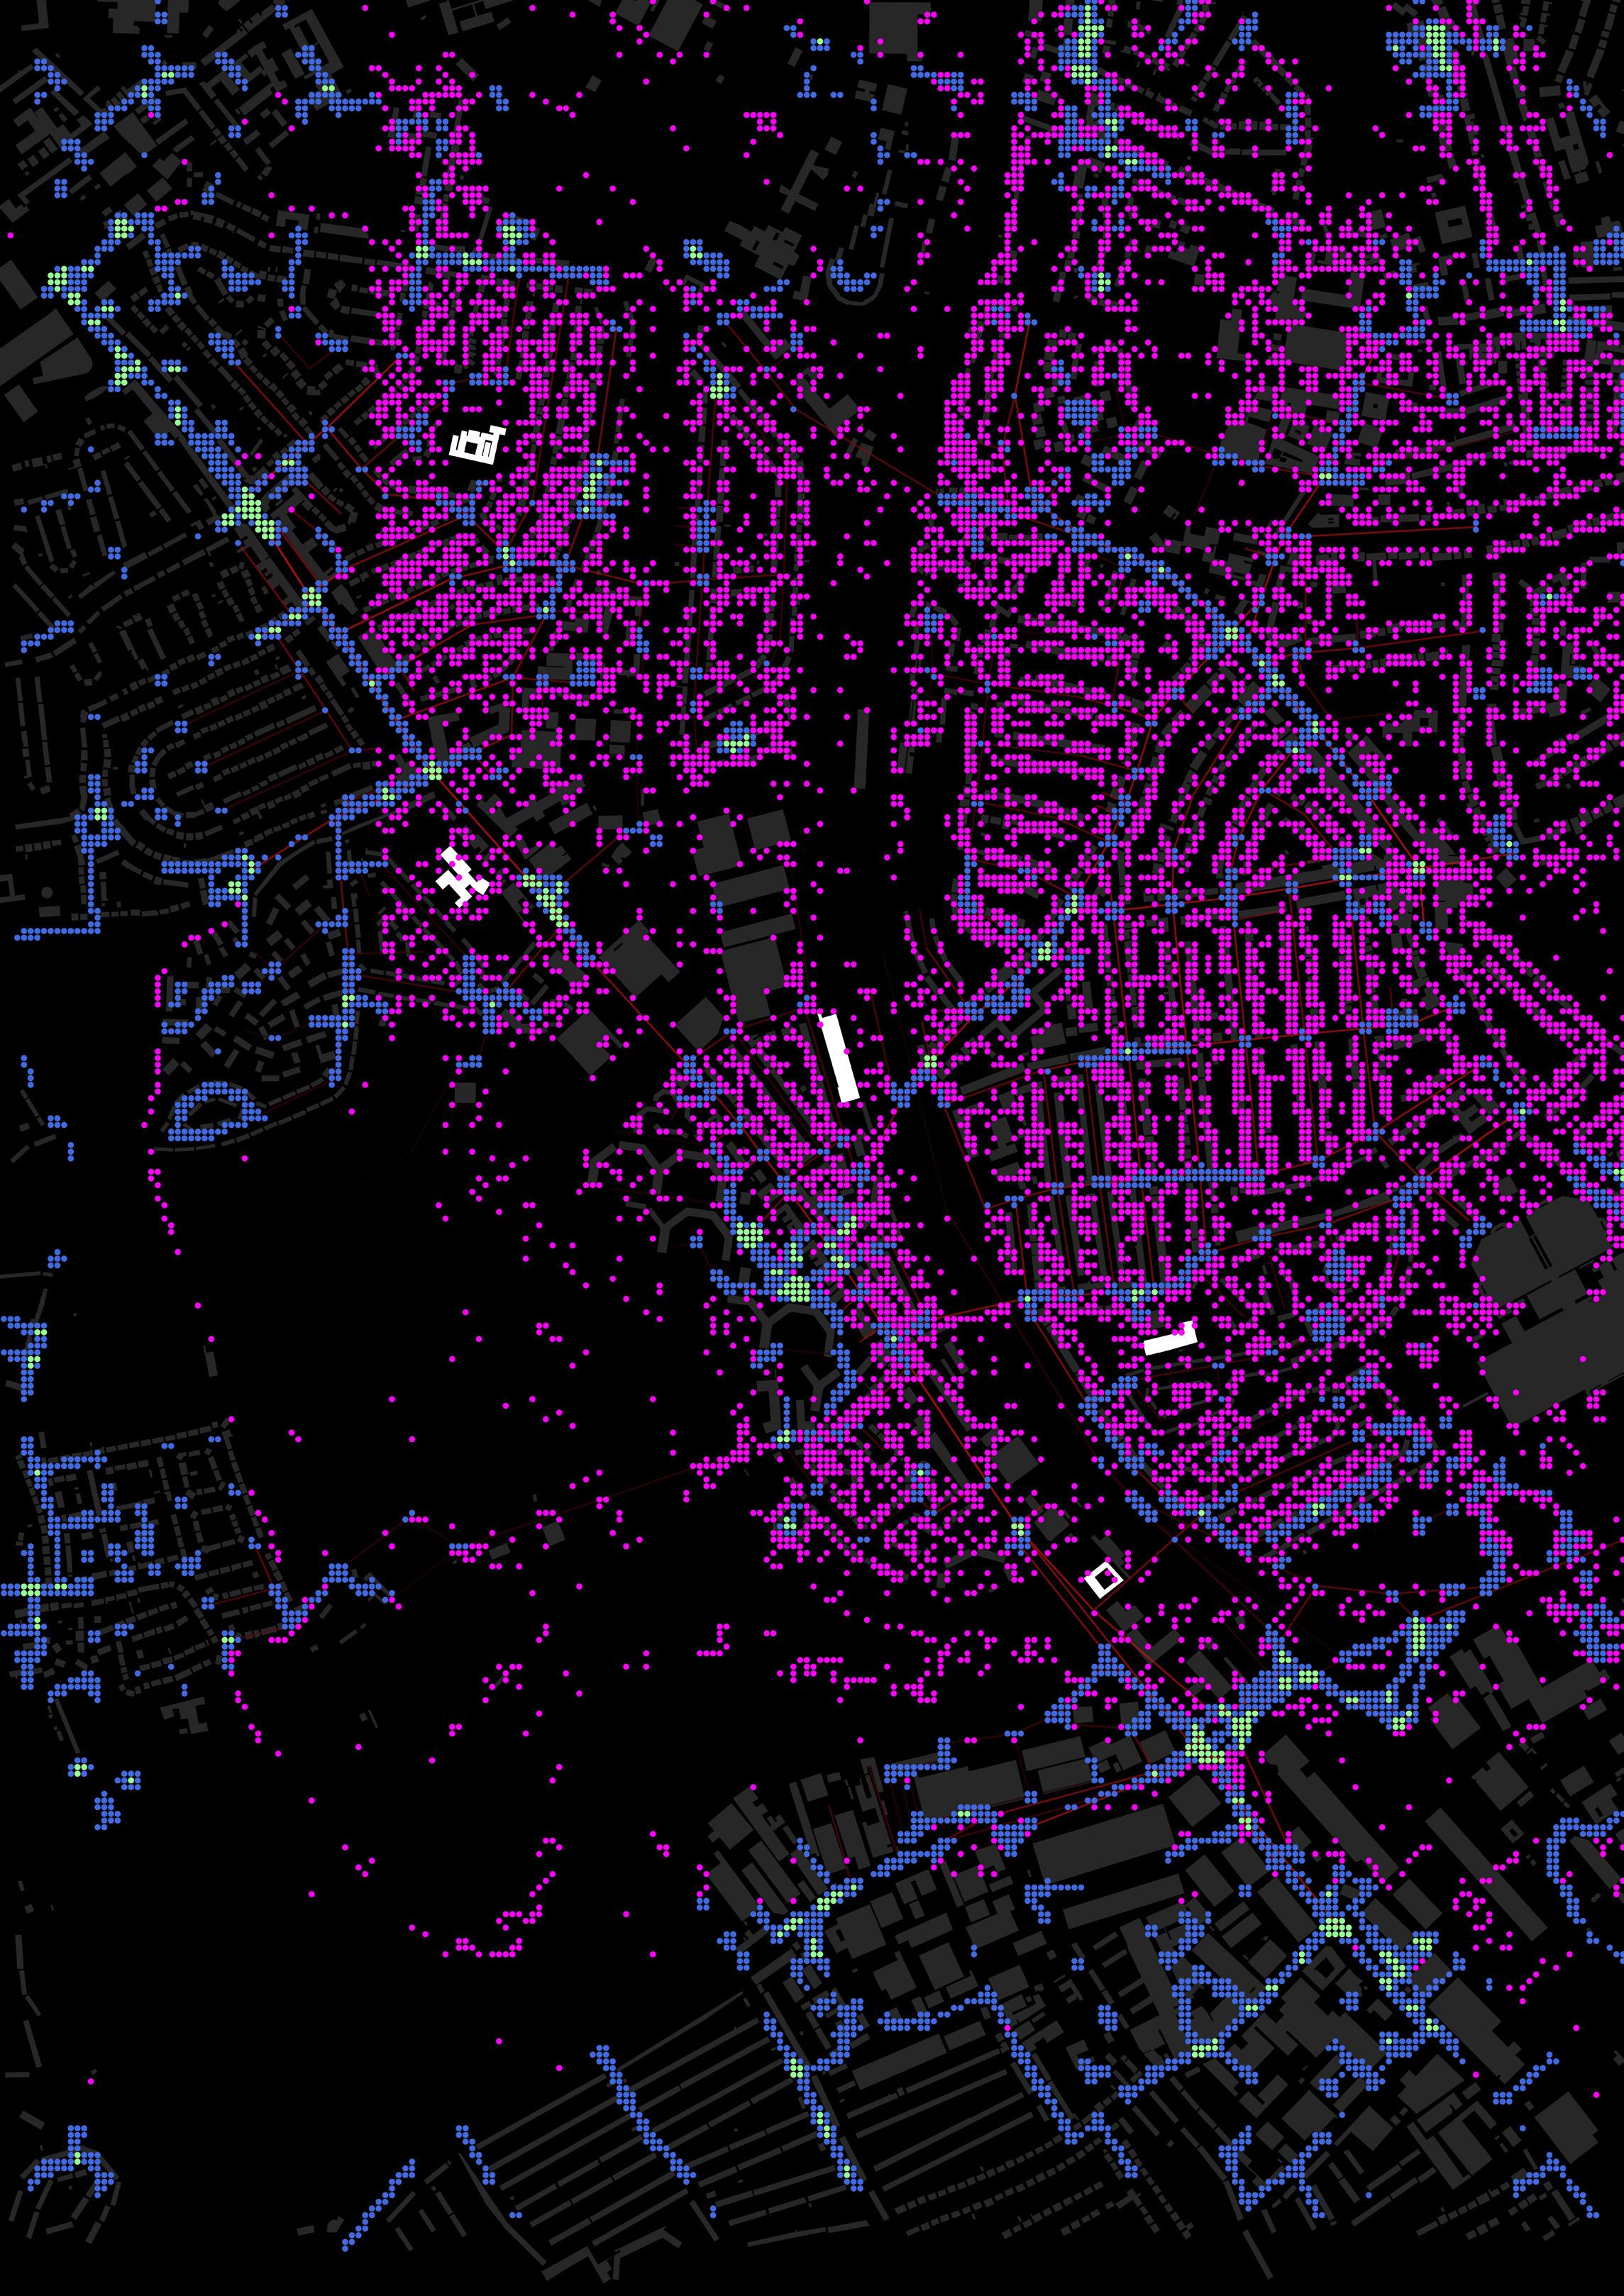
The reason we undertook this decision to pair the dataset stacks to themes and then run them in pix2pix, was to analyze the results and see where high points of the data are most evident and then determine the locations of where our micro–Brent Site shall be.
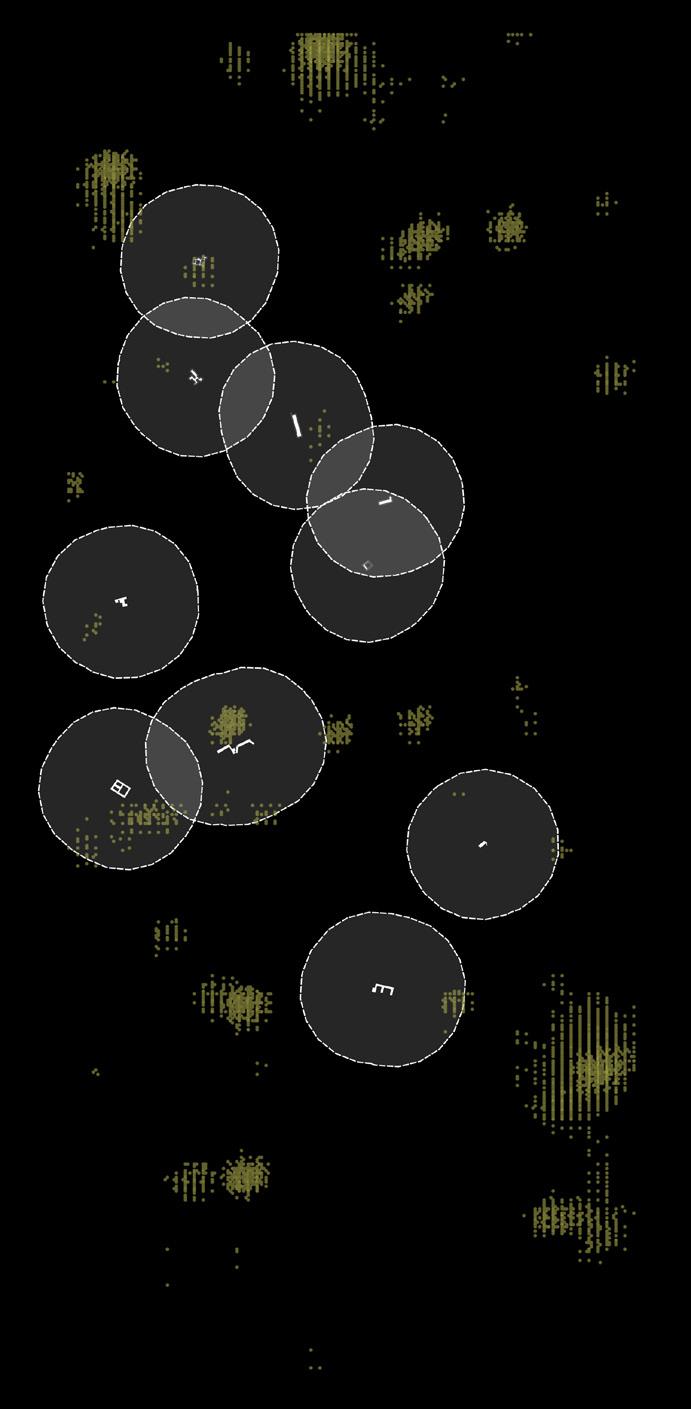
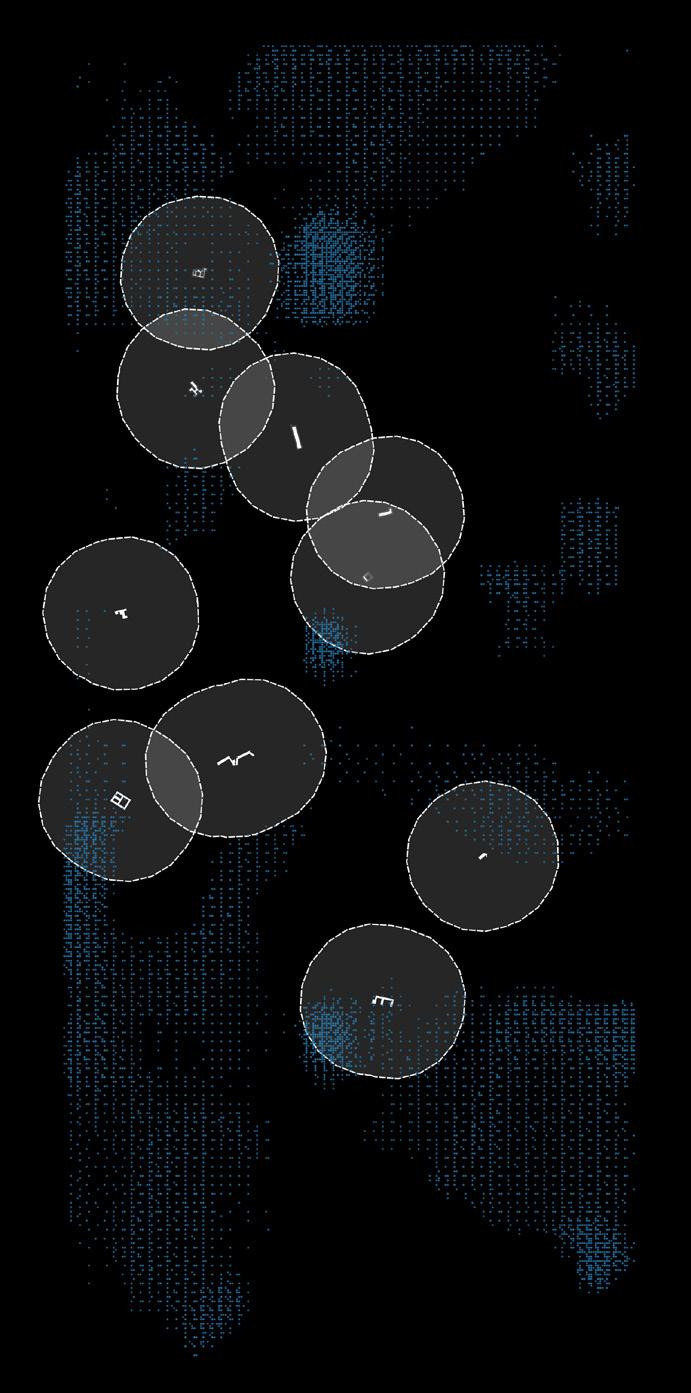
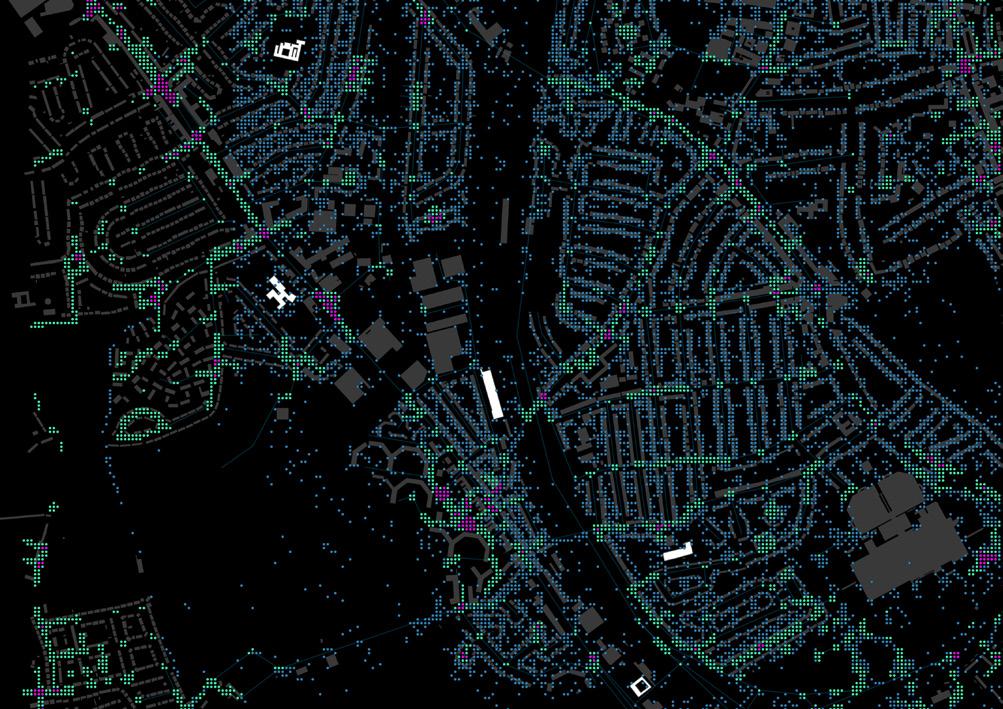
This is the combined 6 stacks of the pix2pix results. It consists of the top 10 % high points of each stack result. We used a combination of 10 selected primary schools’ catchment areas, the p2p results and the integration results to narrow down and triangulate onto potential sites.
Stronger the color = Higher the value/count
LEGEND
HEALTH
FOOD SECURITY
MOVEMENT
HEALTH
MOVEMENT
SAFETY
SCHOOL LOCATIONS
MICRO SCALE SITE ANALYSIS & SIMULATION
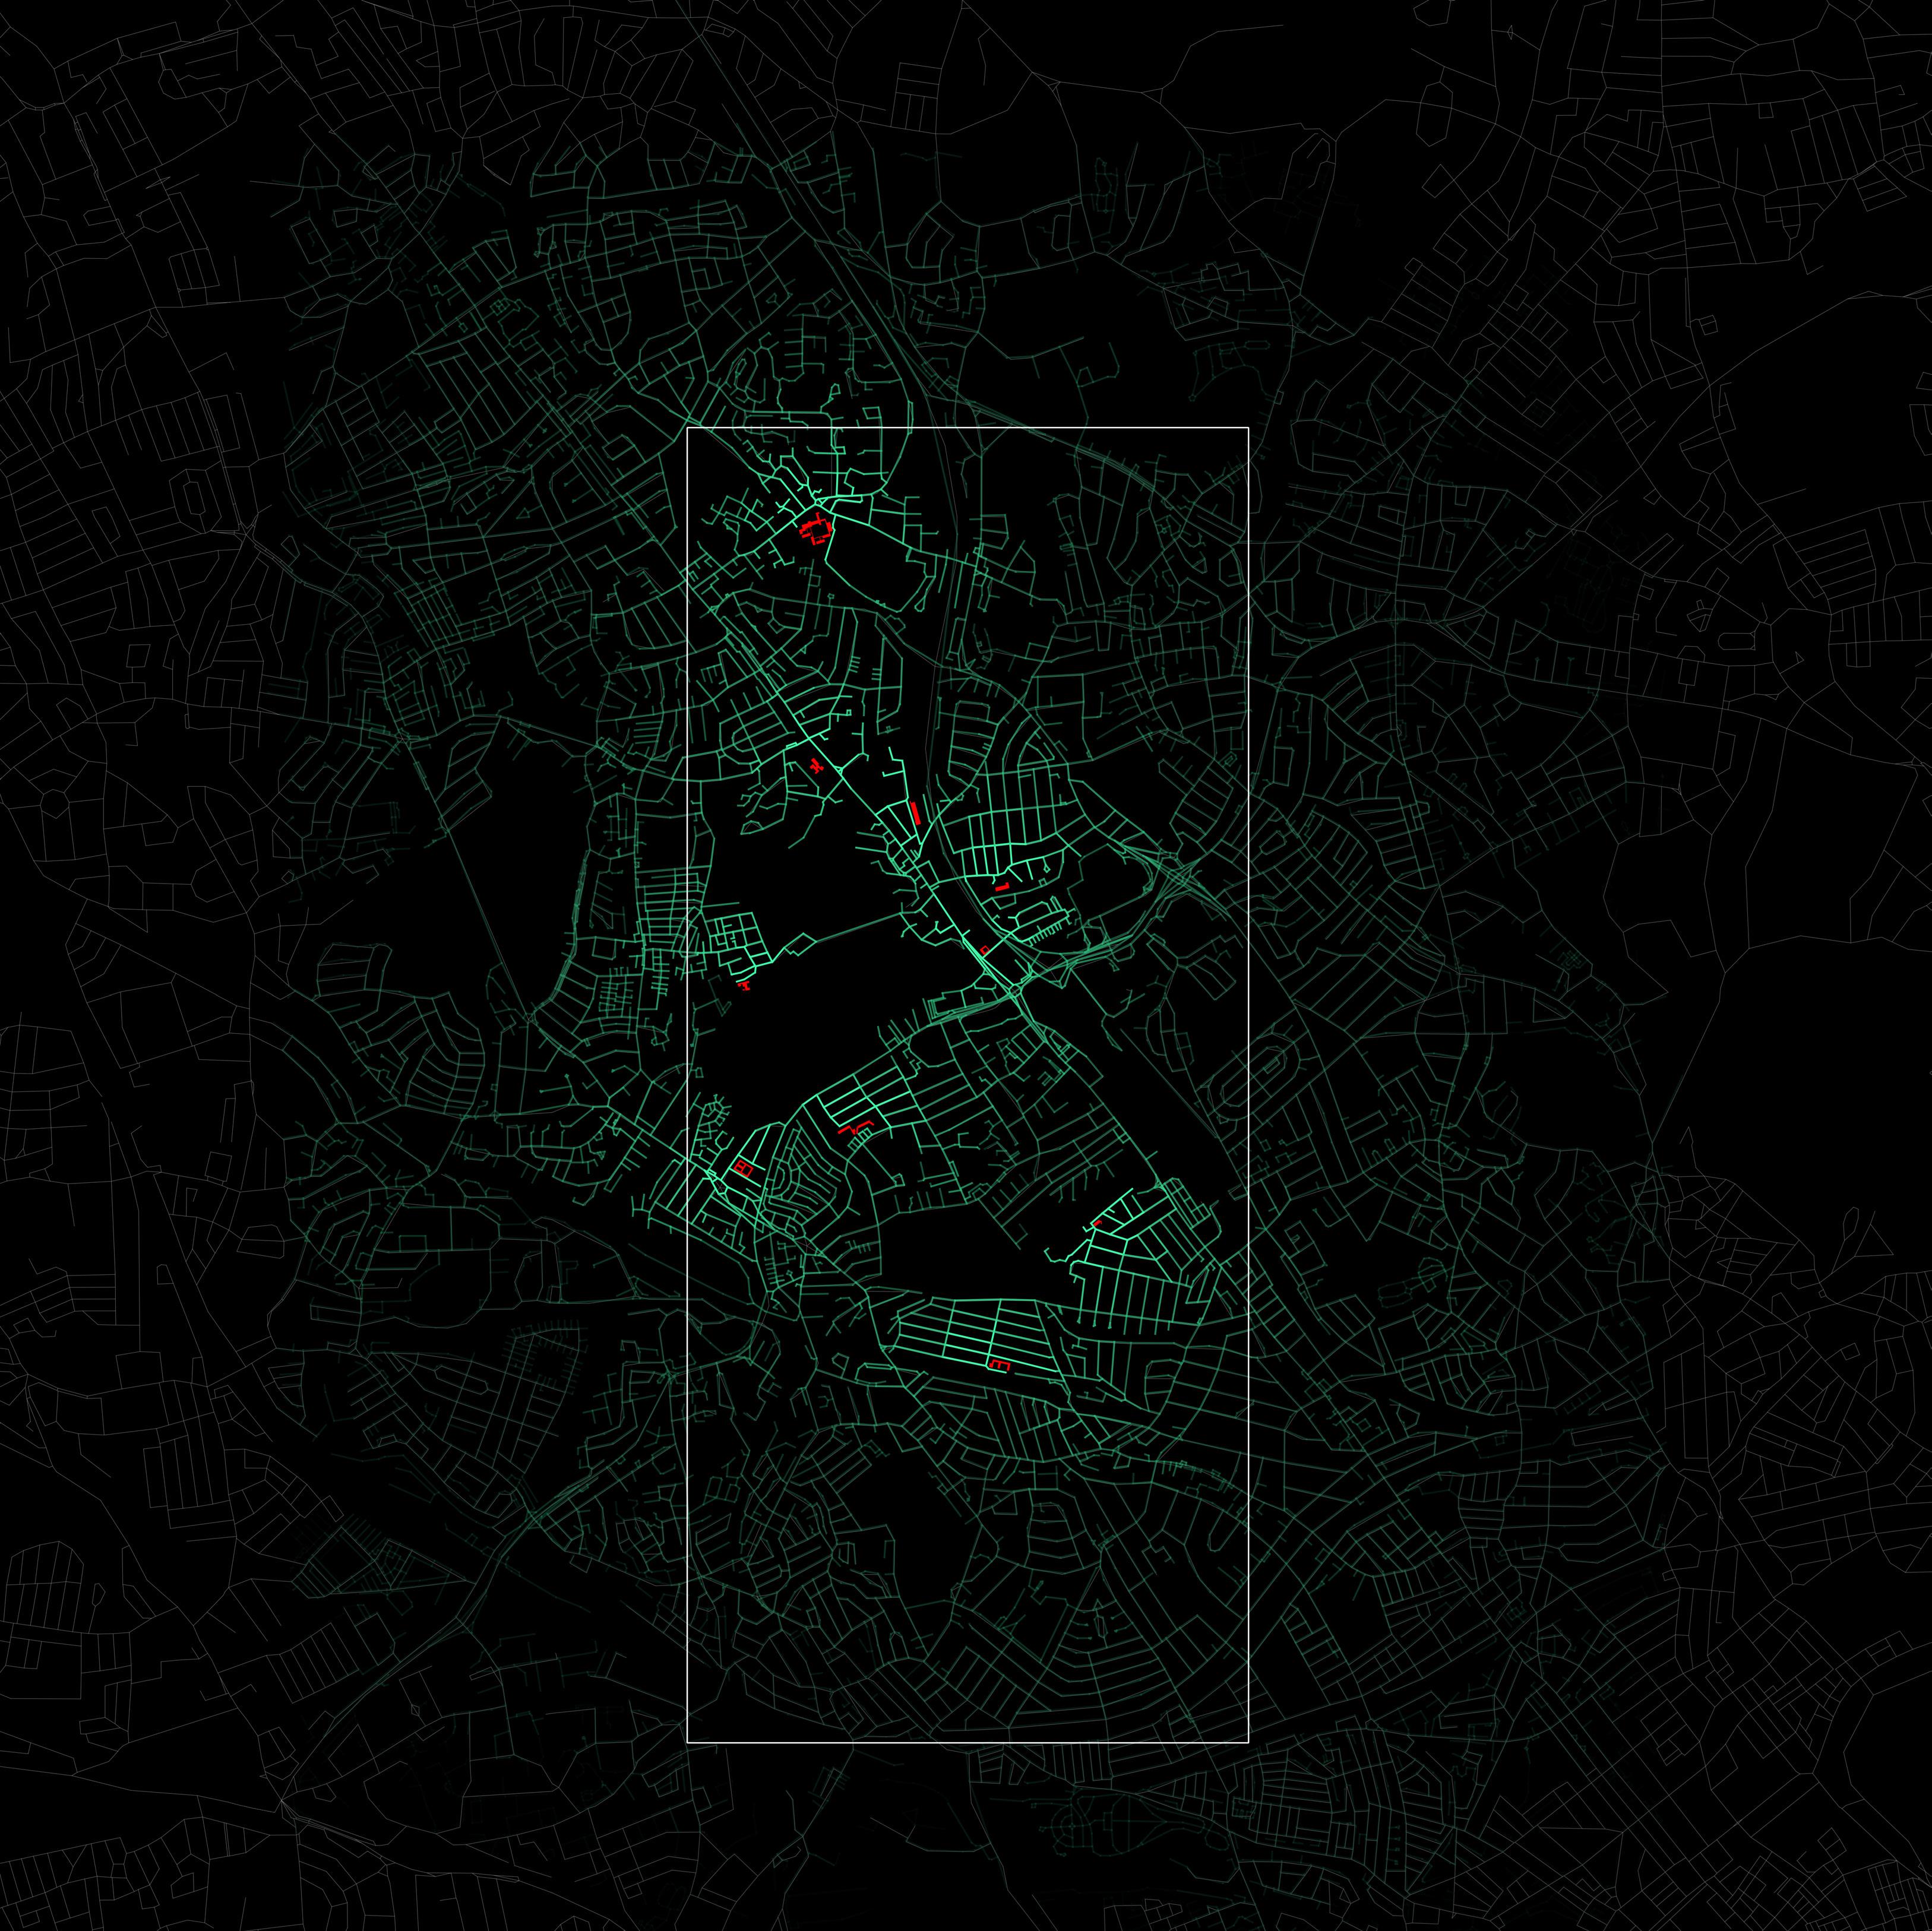
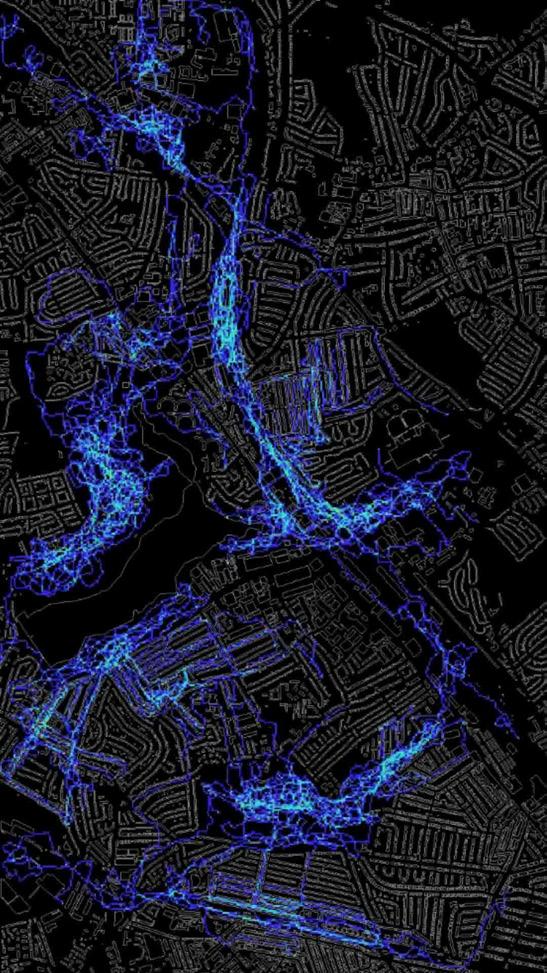
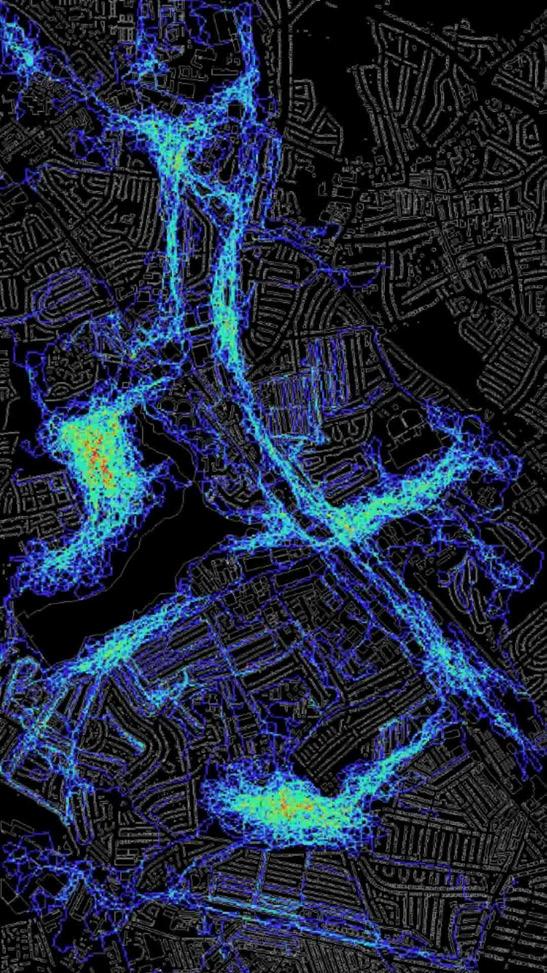
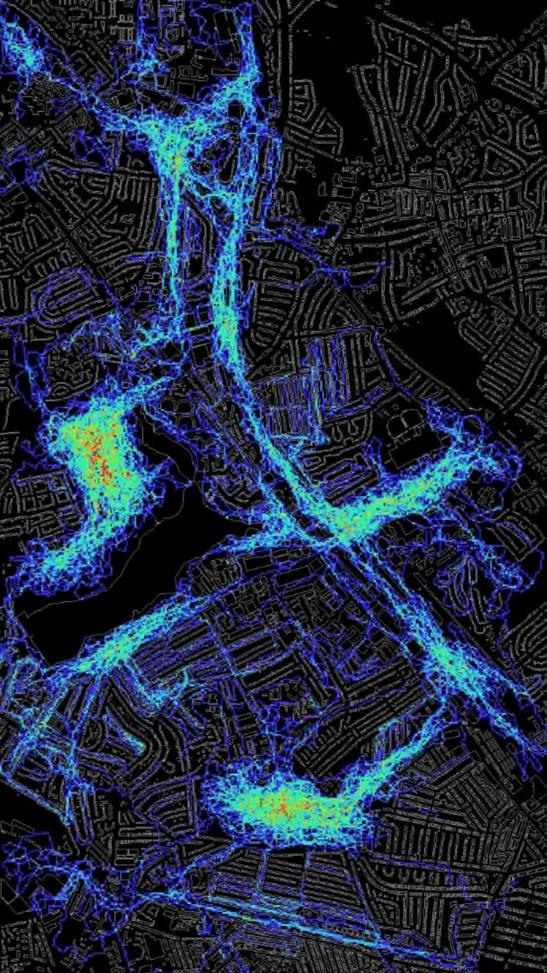
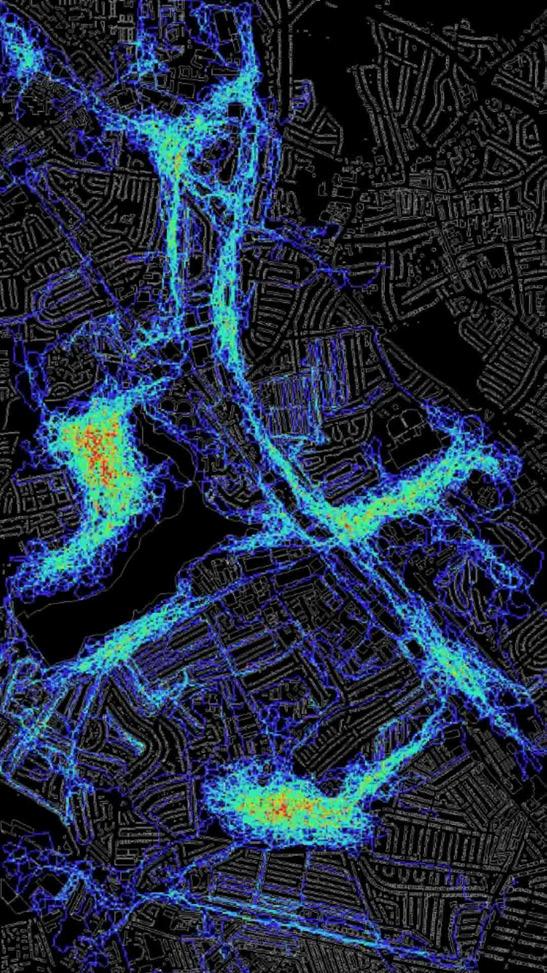
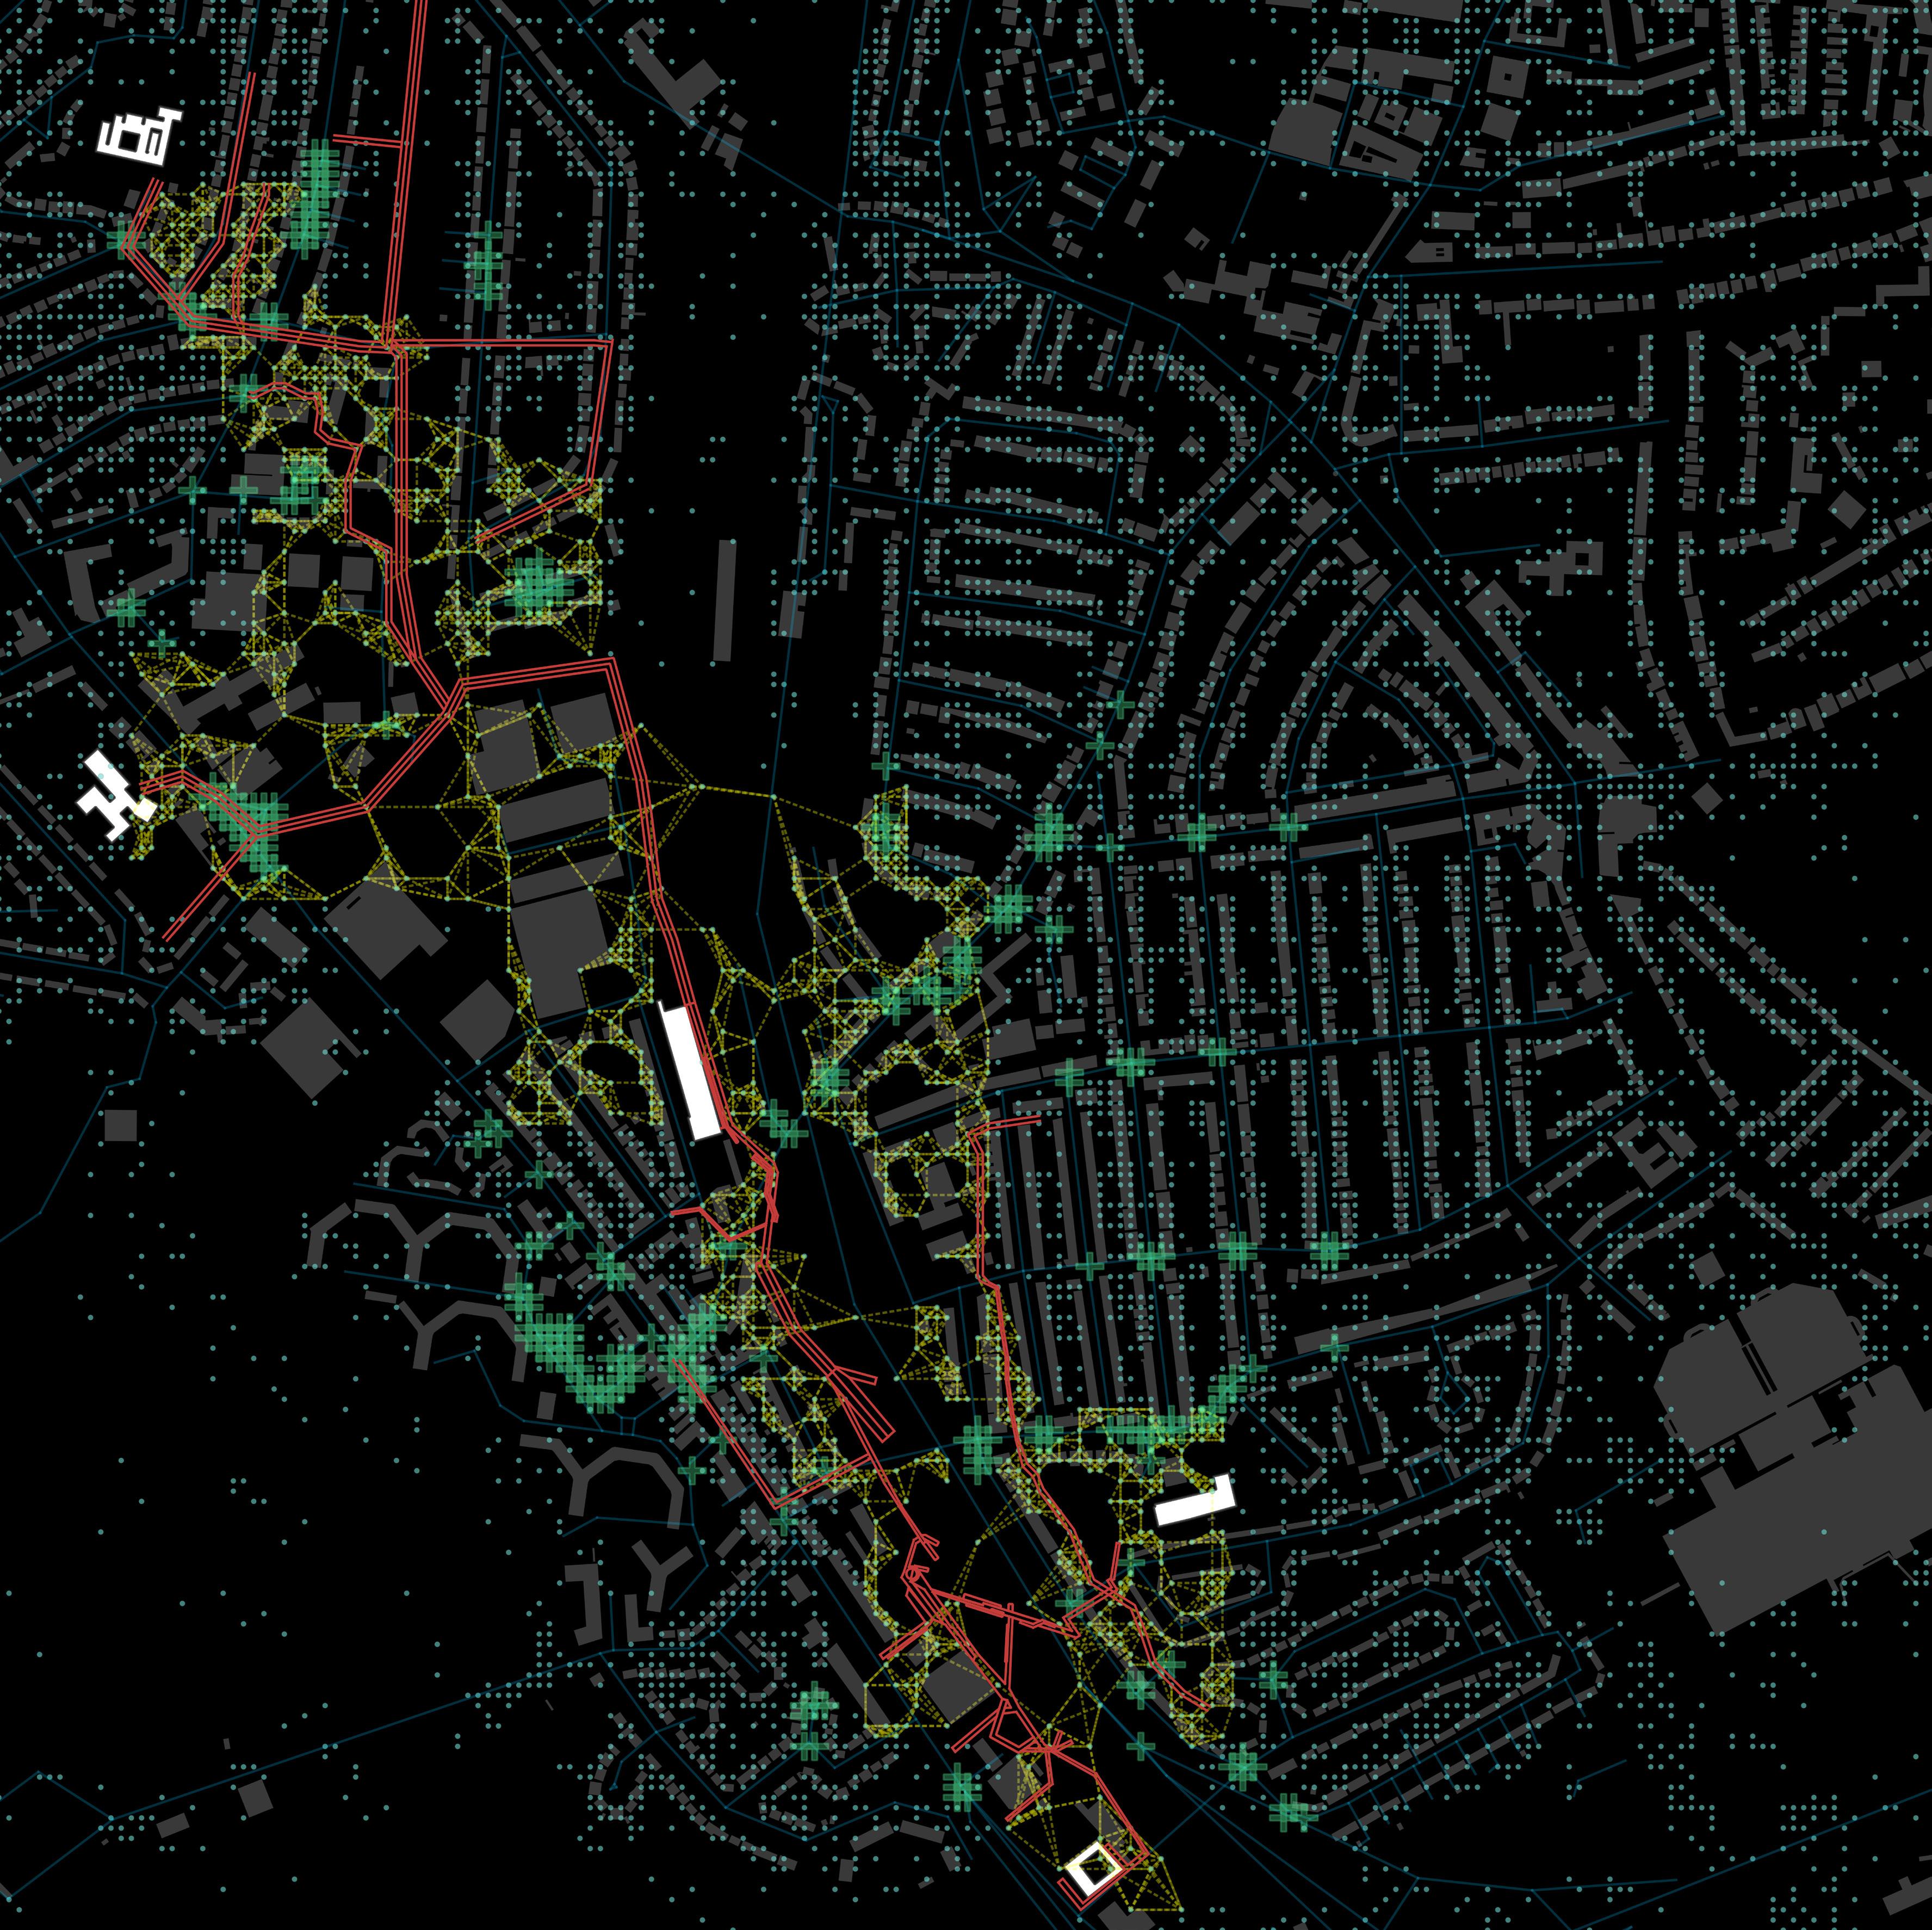
ANGULAR SEGMENT ANALYSIS: CHOICE
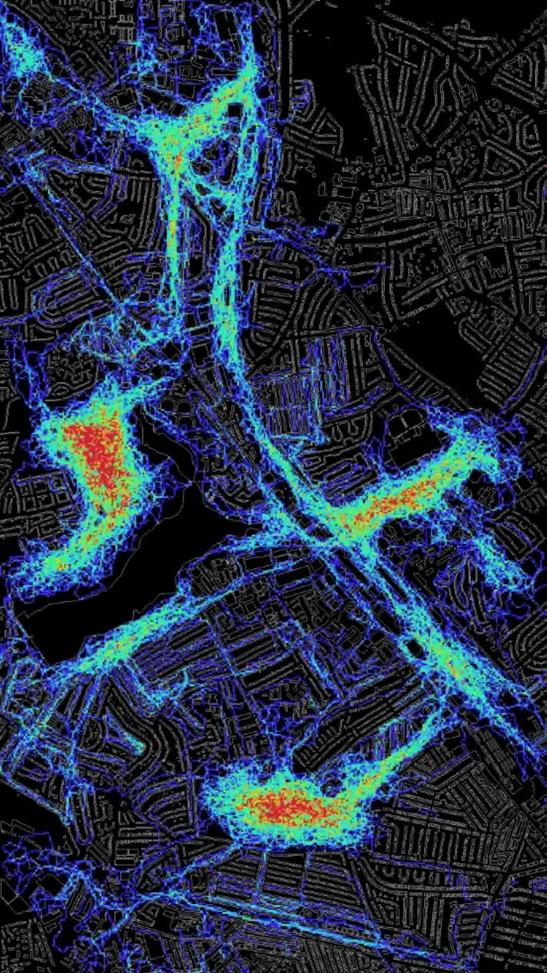
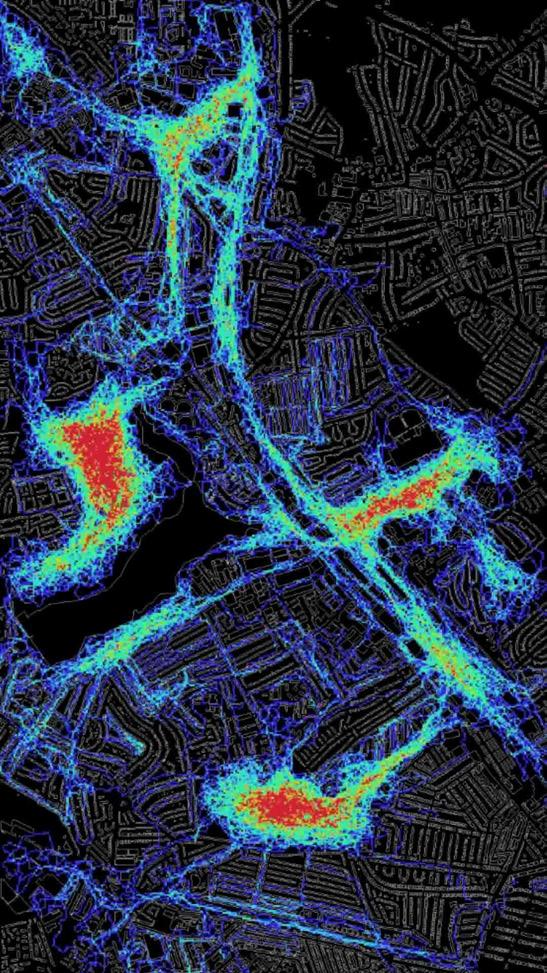
Based on the choice network analysis of our chosen Brent site, there are many bright red values scattered around the site which indicates high levels of vehicle and pedestrian movement as well as uncovering underlying route structures in the site.
Choice R500
Quantile (Natural Break)
Choice R800
Quantile (Natural Break)
Choice R2000
Quantile (Natural Break)
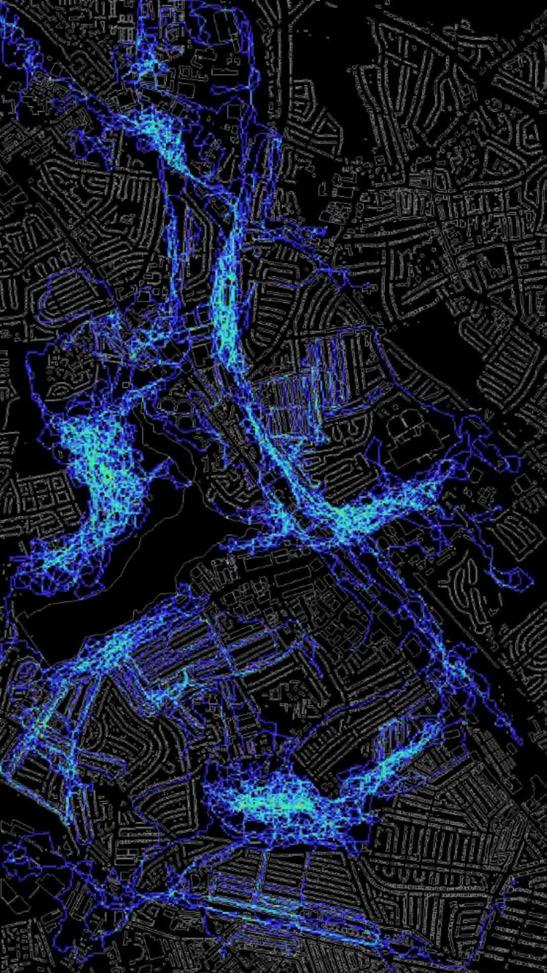
ANGULAR SEGMENT ANALYSIS: STEP DEPTH
Calculating the shortest angular paths that uses the fewest number of turns provides insights into the layout and connectivity of urban spaces, thereby indicating areas of strong and weak movement potential. The stronger the tone of green in the below map, the lower the step depth meaning the higher the level of connectivity and accessibility
Step Depth R800
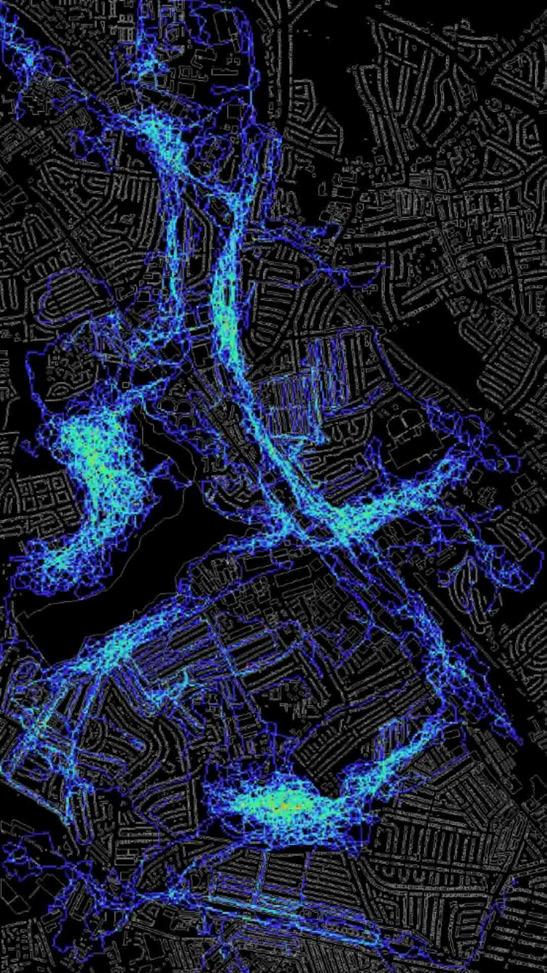
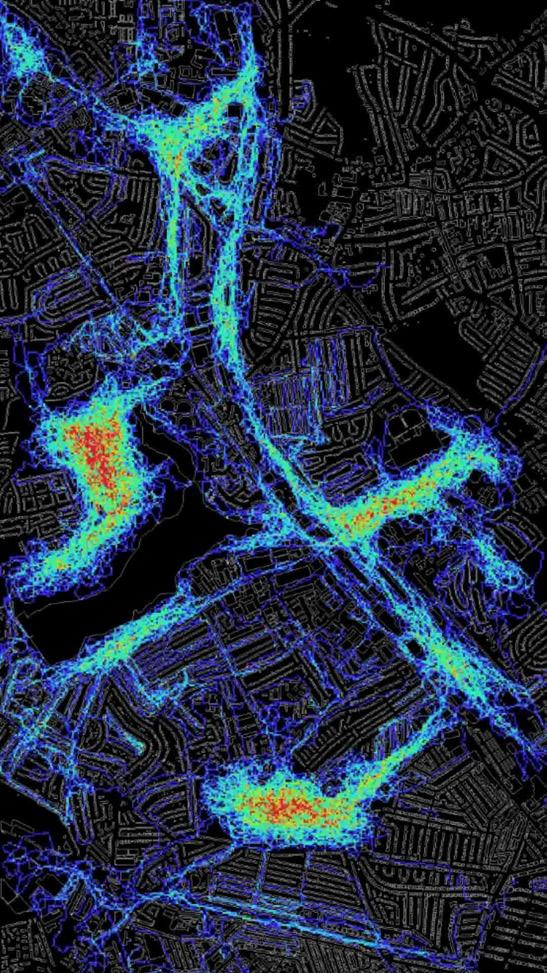
ANGULAR SEGMENT ANALYSIS: INTEGRATION
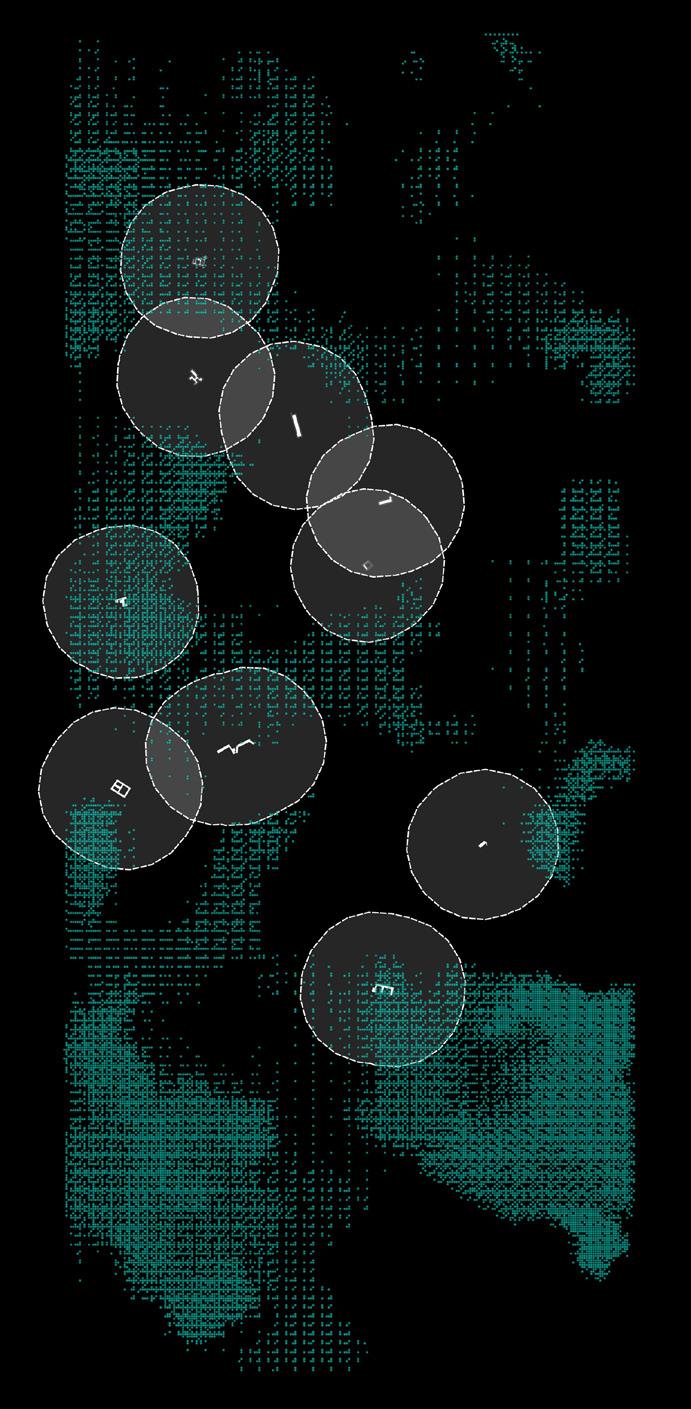
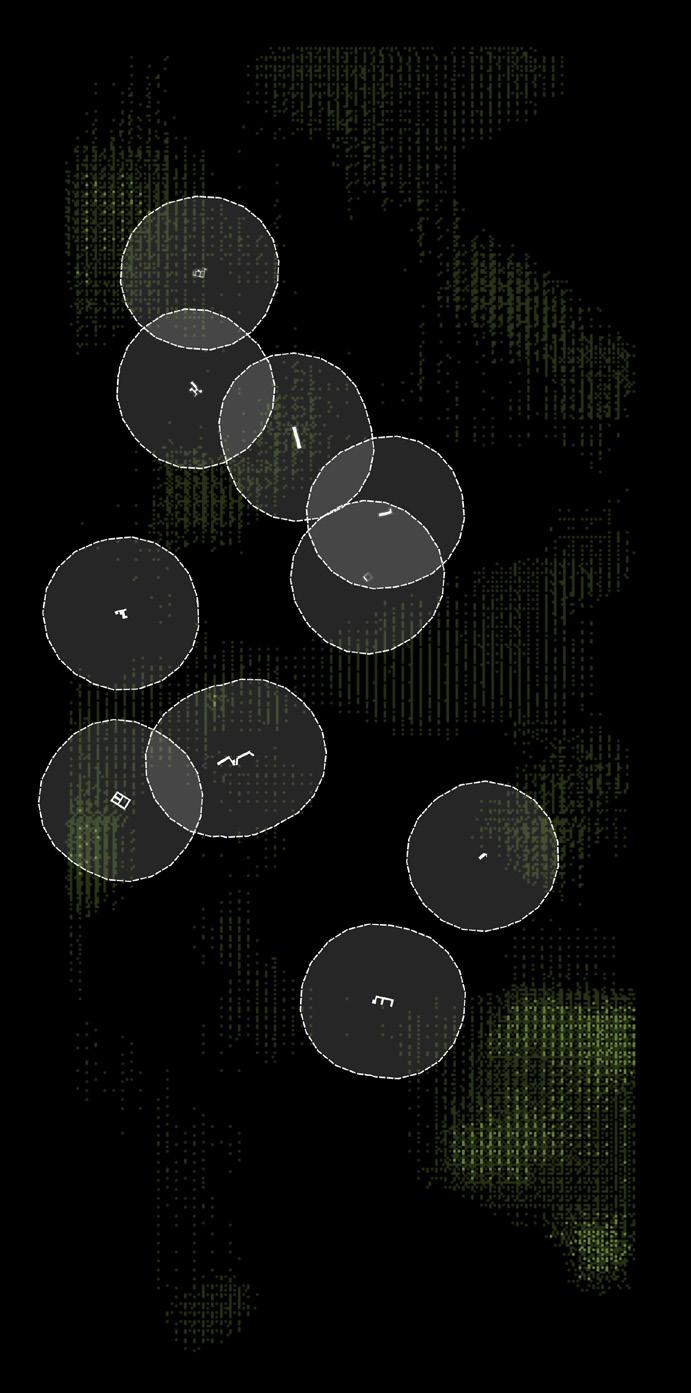
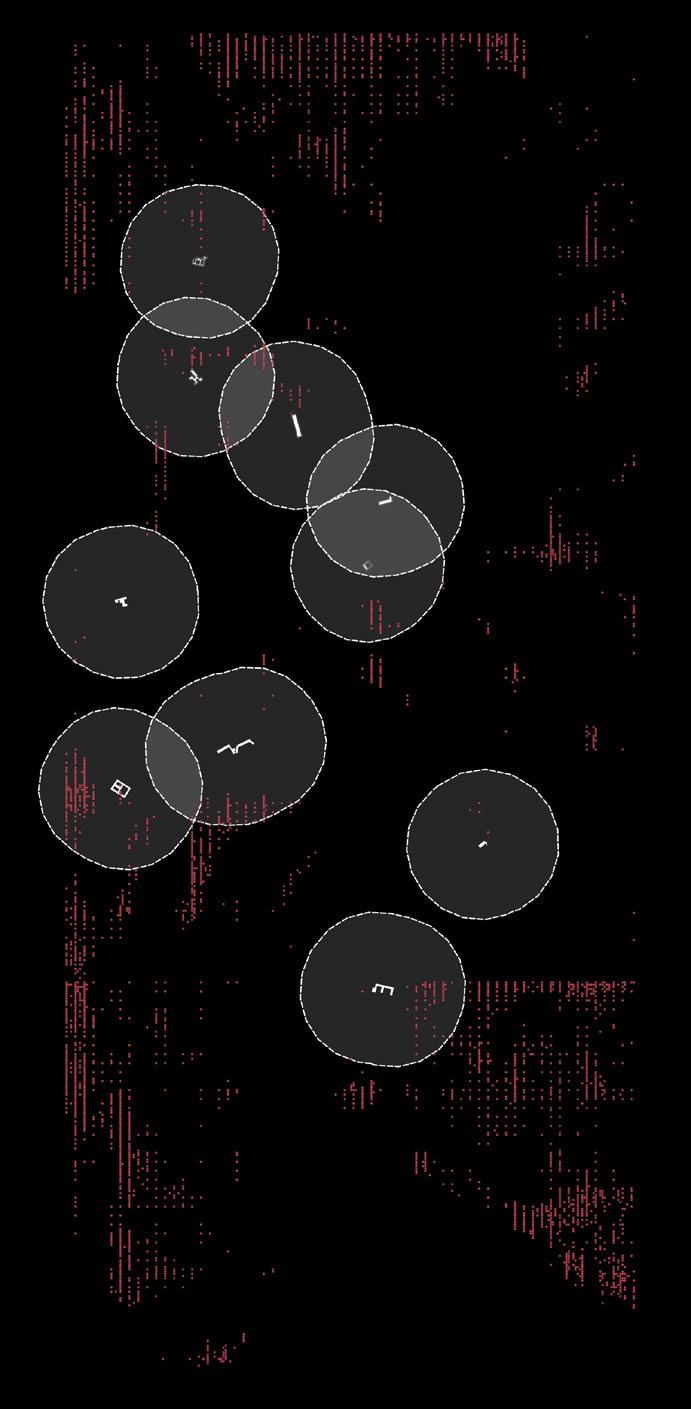
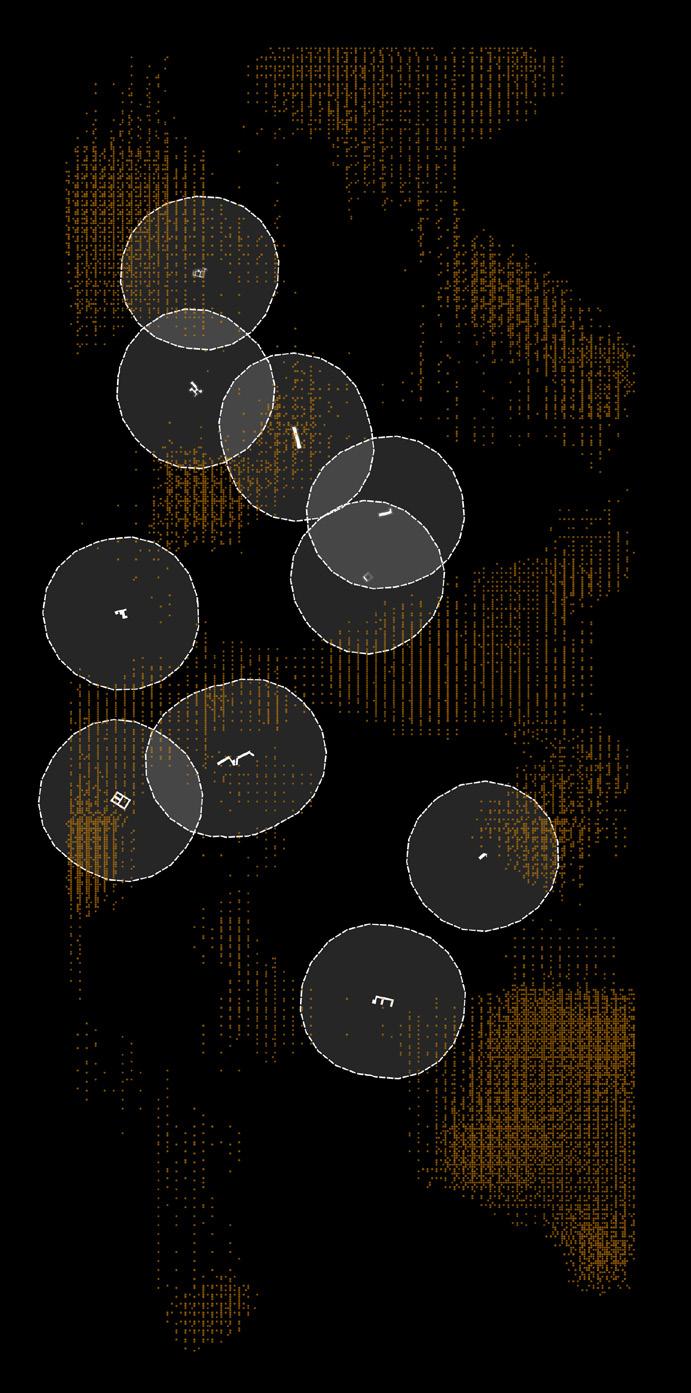
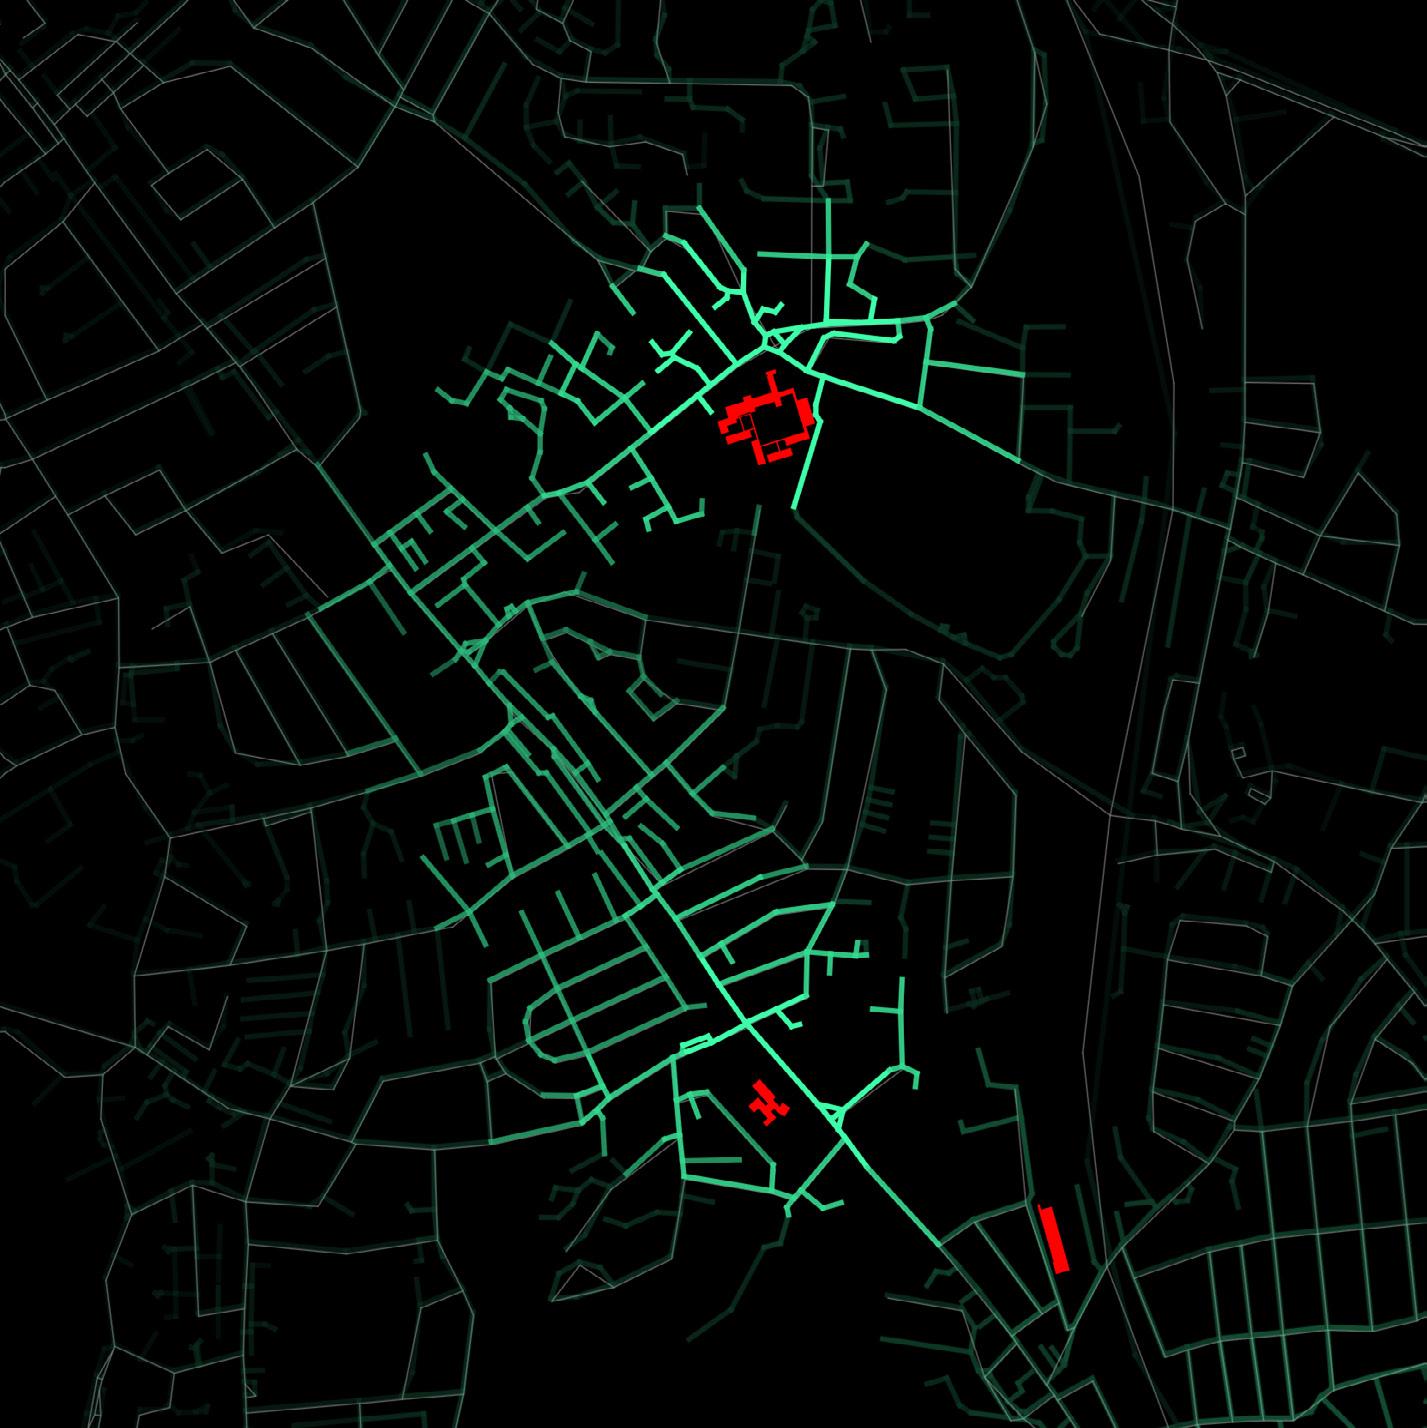
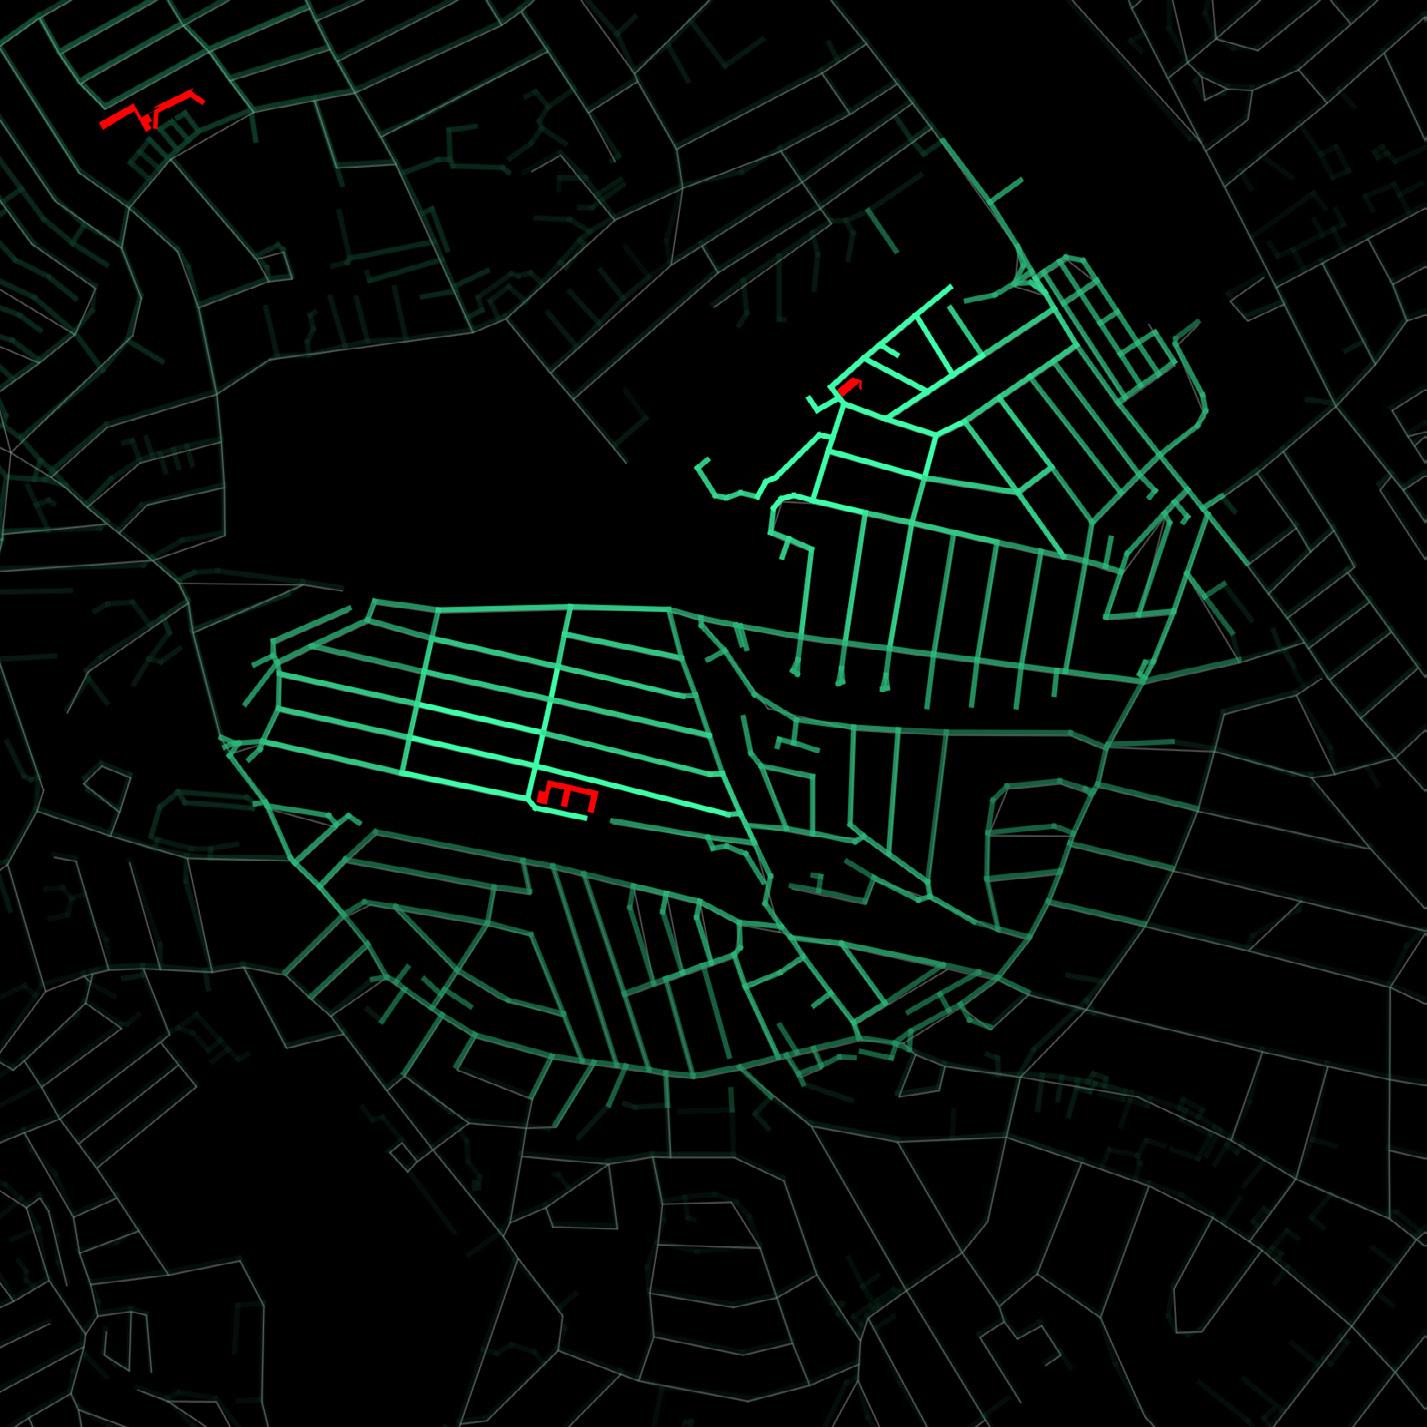
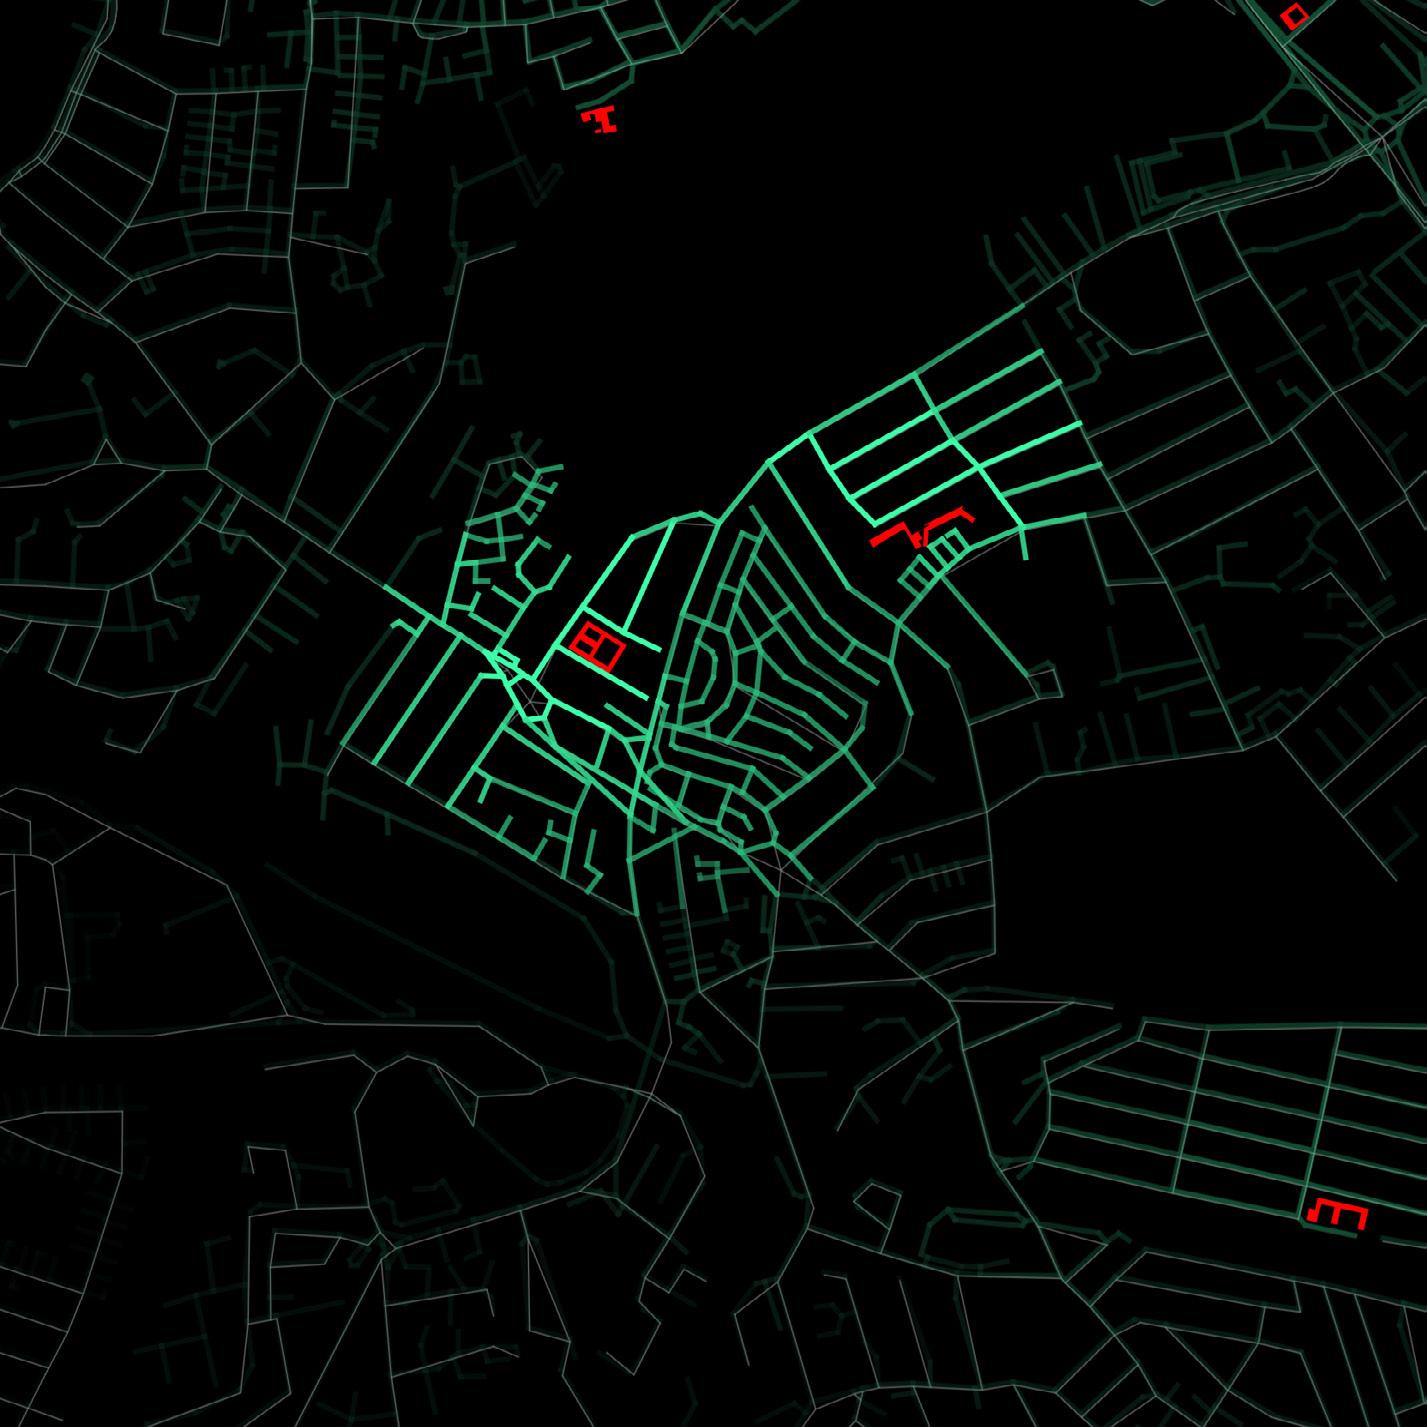
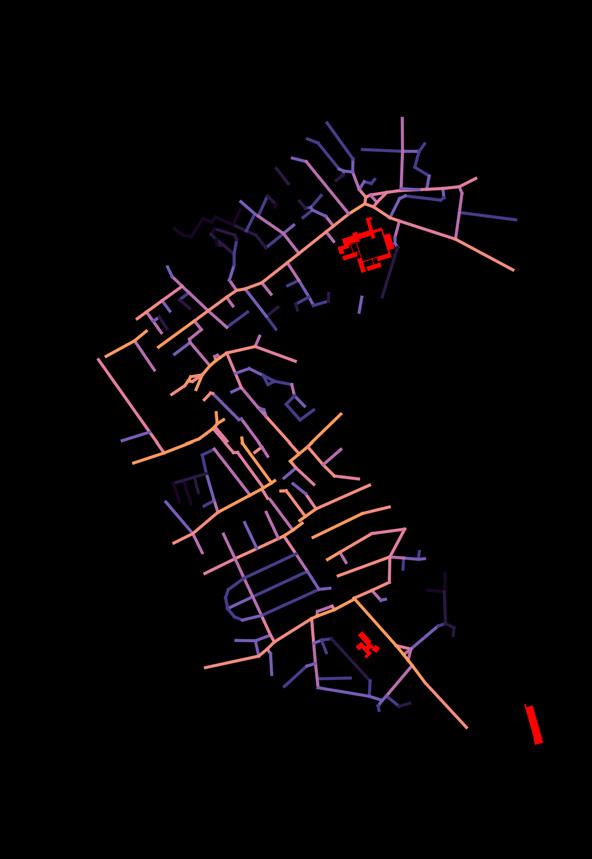
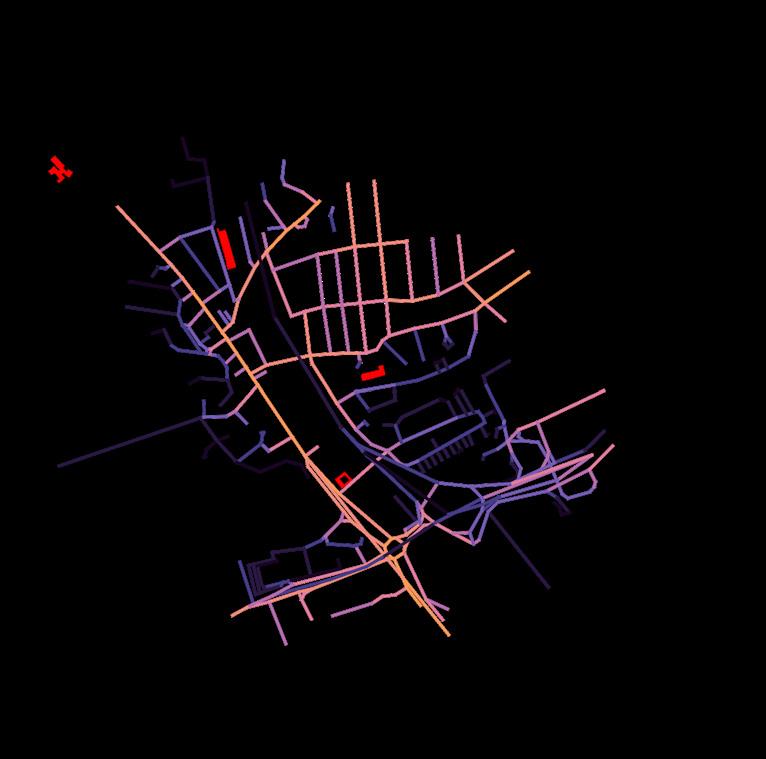
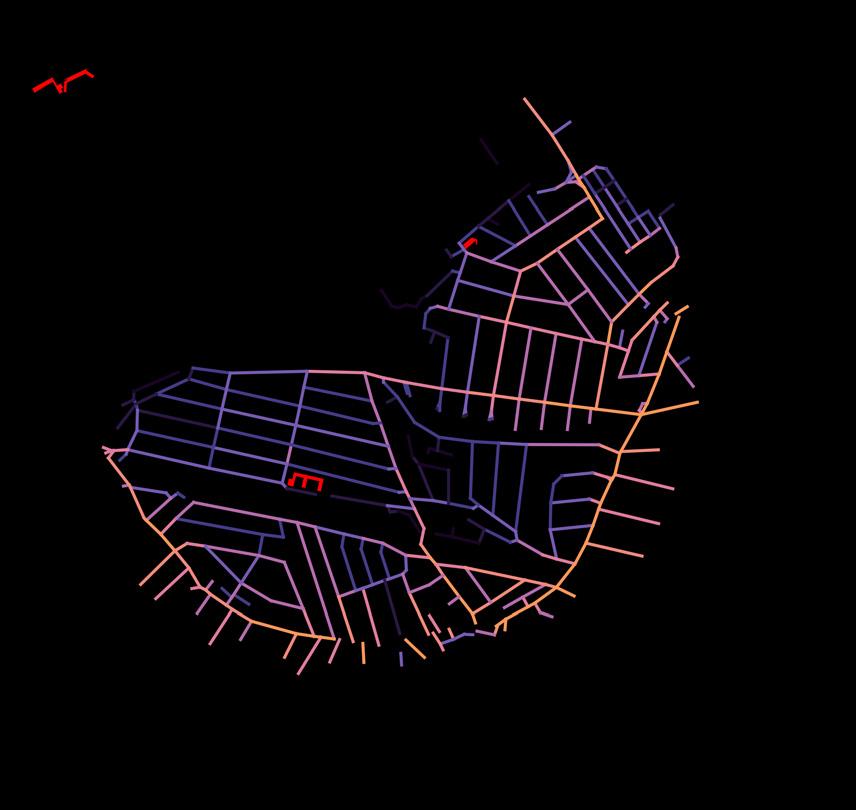
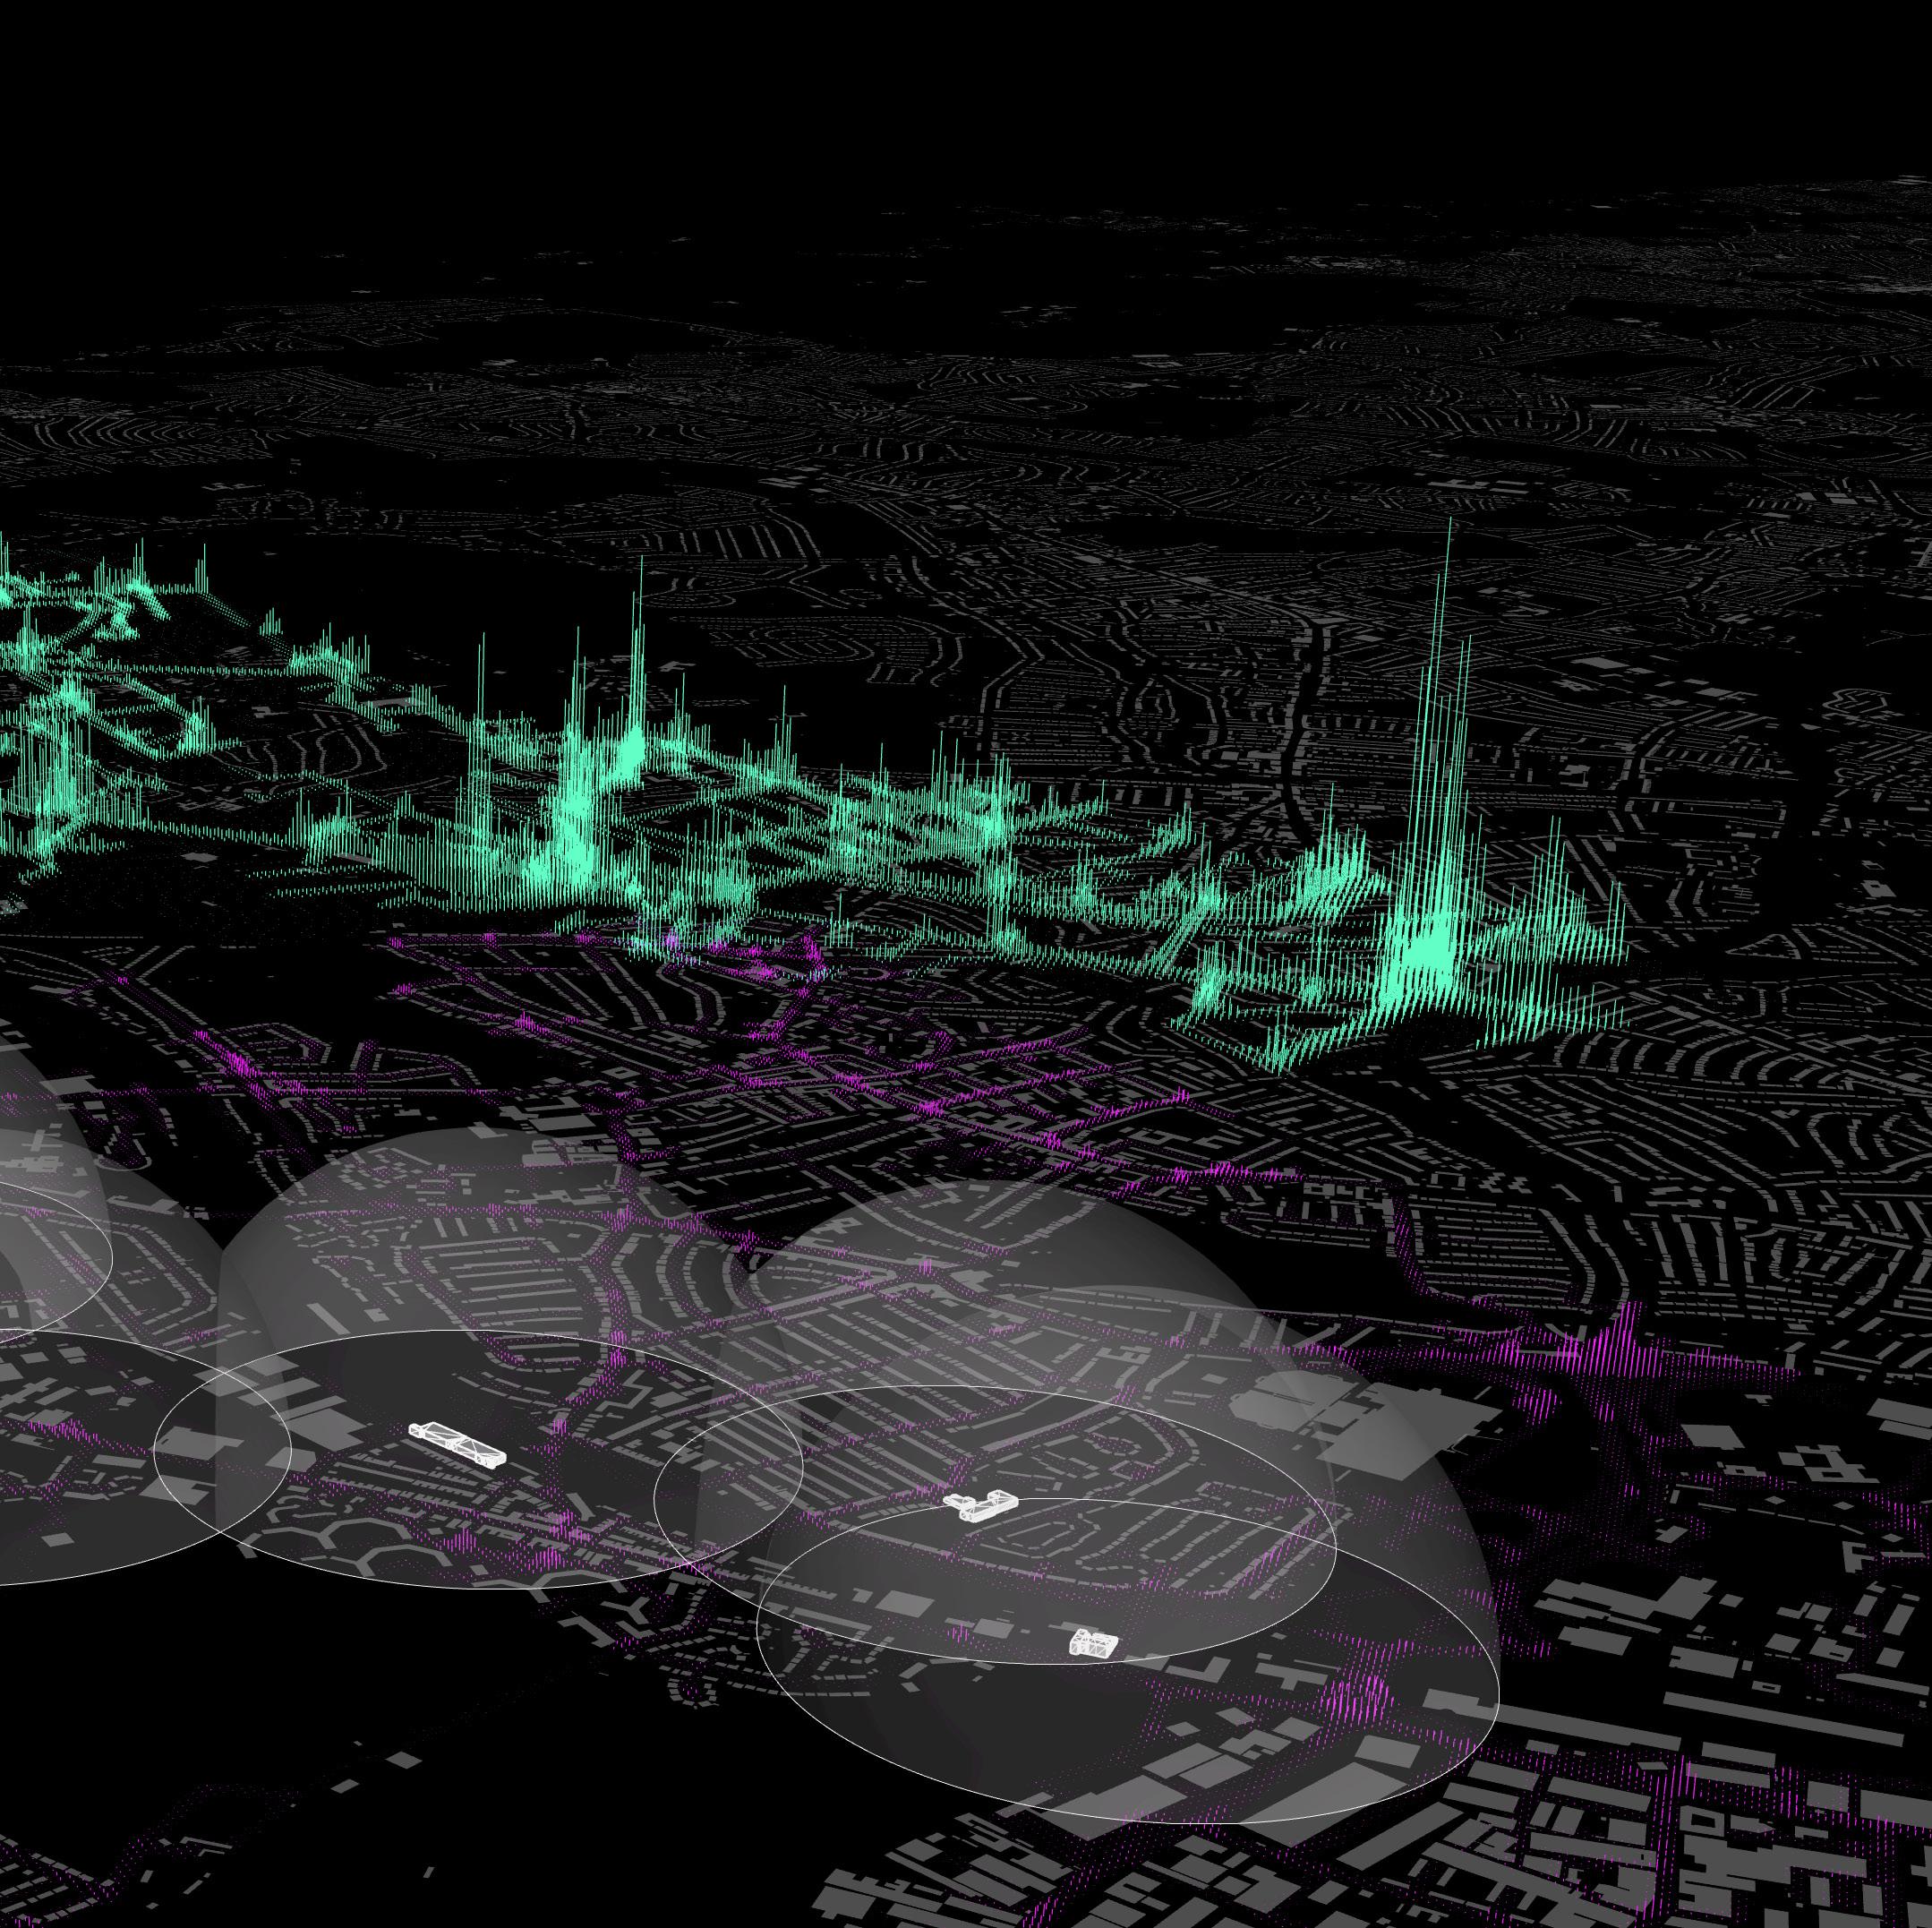
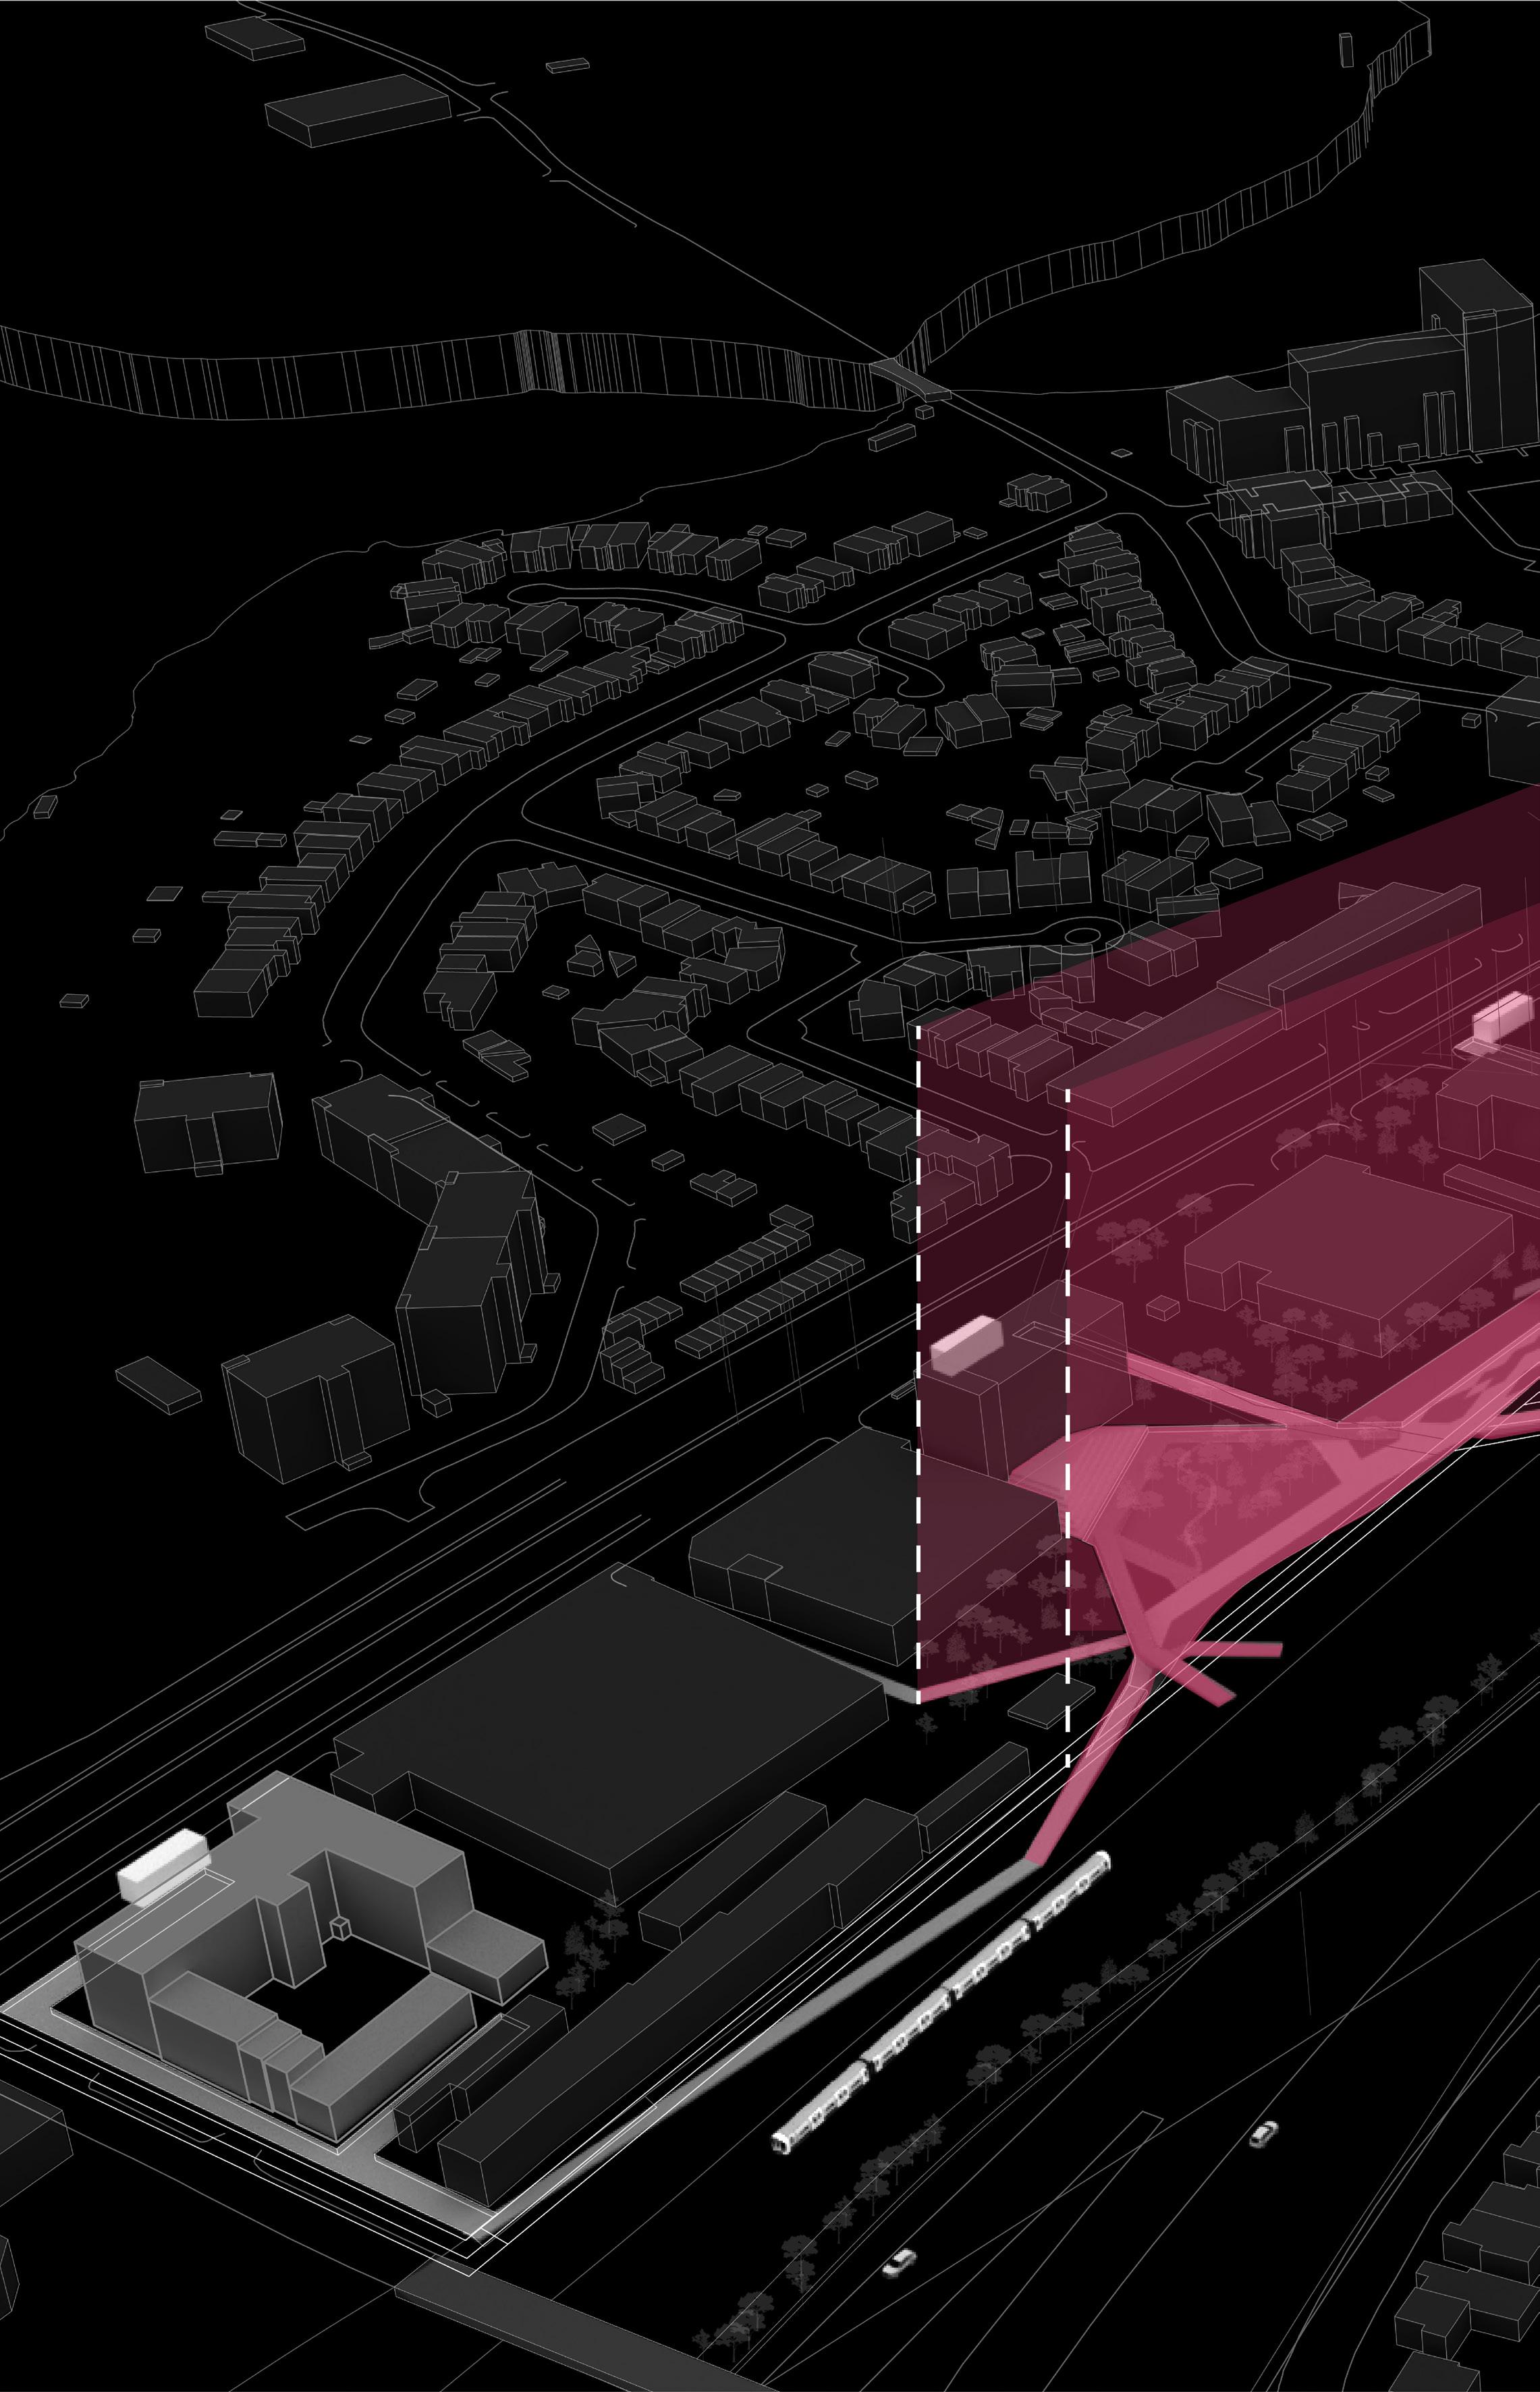
Both integration and choice in angular segment analysis provide crucial insights into spatial dynamics, movement potential, and decision-making processes related to urban design. Integration is the calculation of how close or how accessible each spatial element is to all others around it. Based on our results, it seems as though most areas of our Brent site is well connected and accessible. We shortlisted 4 sites that included 2 or more schools and high amounts of integration as our criteria.
Integration R800
Based on a couple of requirements and criteria curated by us, the data led us to a suitable site situated in Brent, which is a combination of sites 1 and 2.
Site 1
Site 2
Site 3
Site 4
Chosen Site
CHOSEN SITE JUSTIFICATIONS
The criteria and requirments we placed to determine our chosen site is made up of the following:
1. We looked at the 800-meter catchment radius of each school in relation to one another. The reason we chose 800 meters is due to the distance of walking a child would be subjected to, which is approximately 10 mins every 800 meters. As we don’t want the children walking massive distances, we chose a site that has the most overlap of the catchment areas.
2. This site was picked due to its combination of including the most schools, which are 5, nearest to each other so we could fill a gap in the surrounding neighborhood where educational elements are lacking by providing our alternate learning spaces.
3. The pix2pix points showed many high points situated in this area.
4. It included a combination of high integration spaces and medium integration spaces which makes it easily accessible to children while also minimizing their contact with vehicular movement.
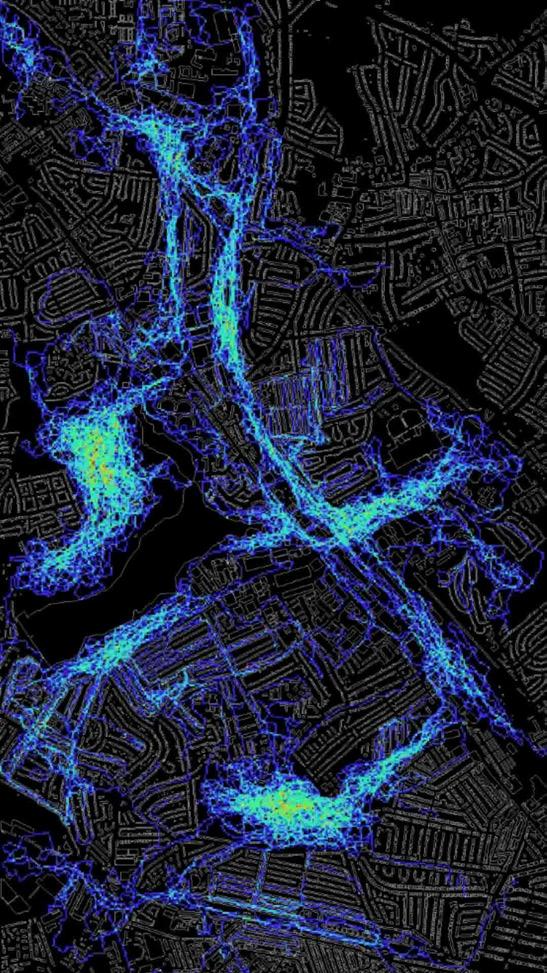
CHOSEN SITE INTEGRATION
800M CATCHMENT AREA
BRENT SITE INTEGRATION
SCHOOLS
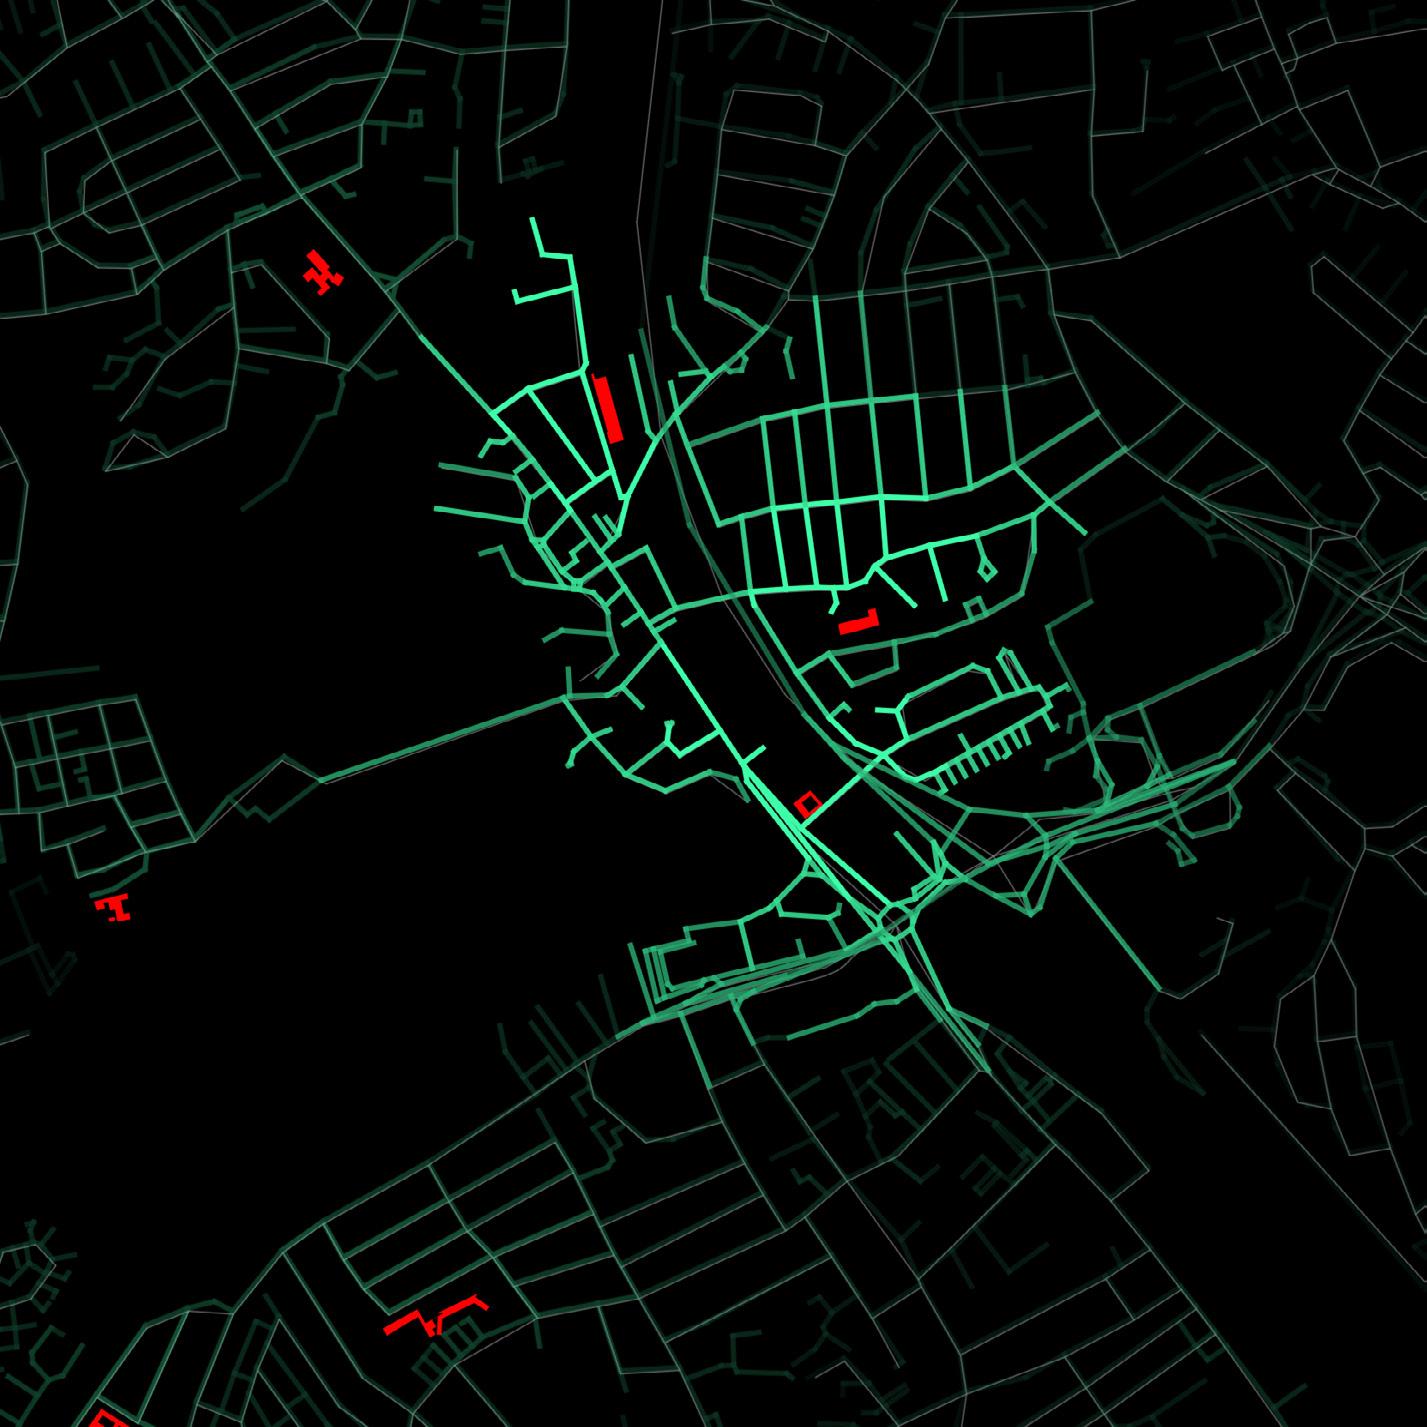
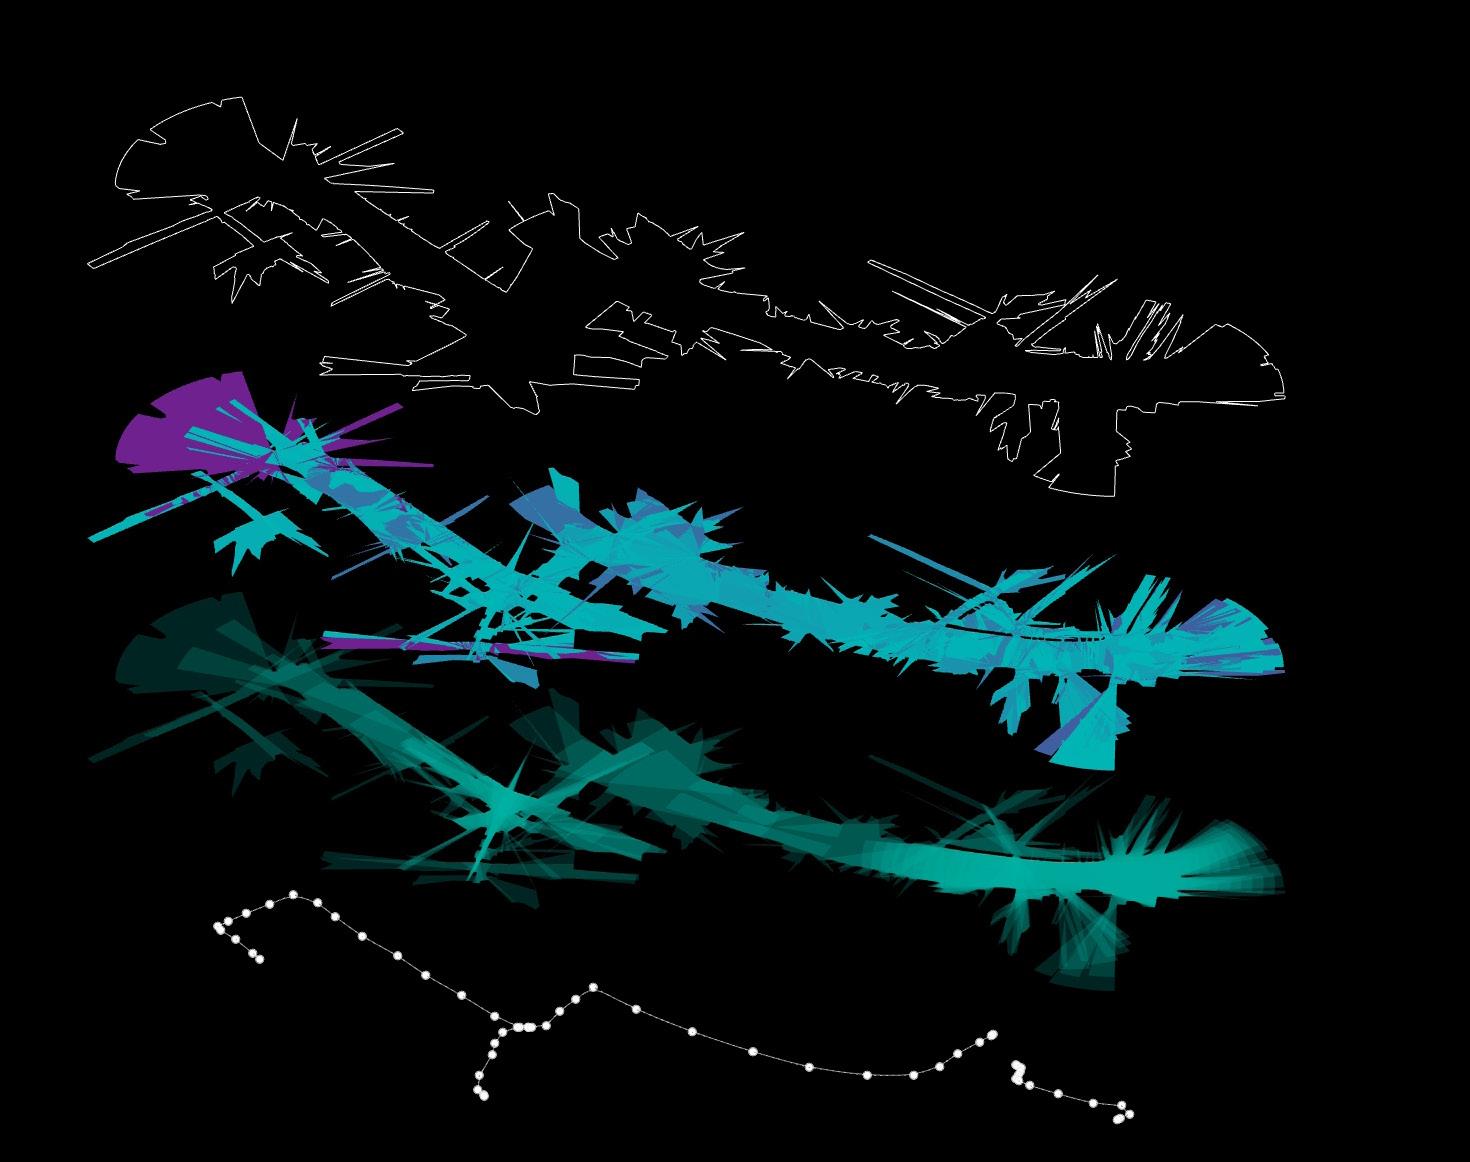
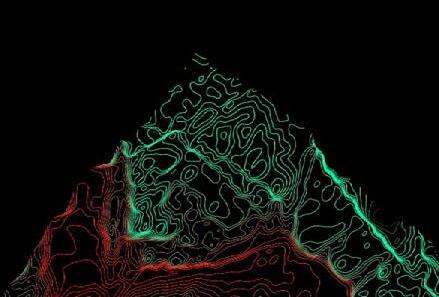
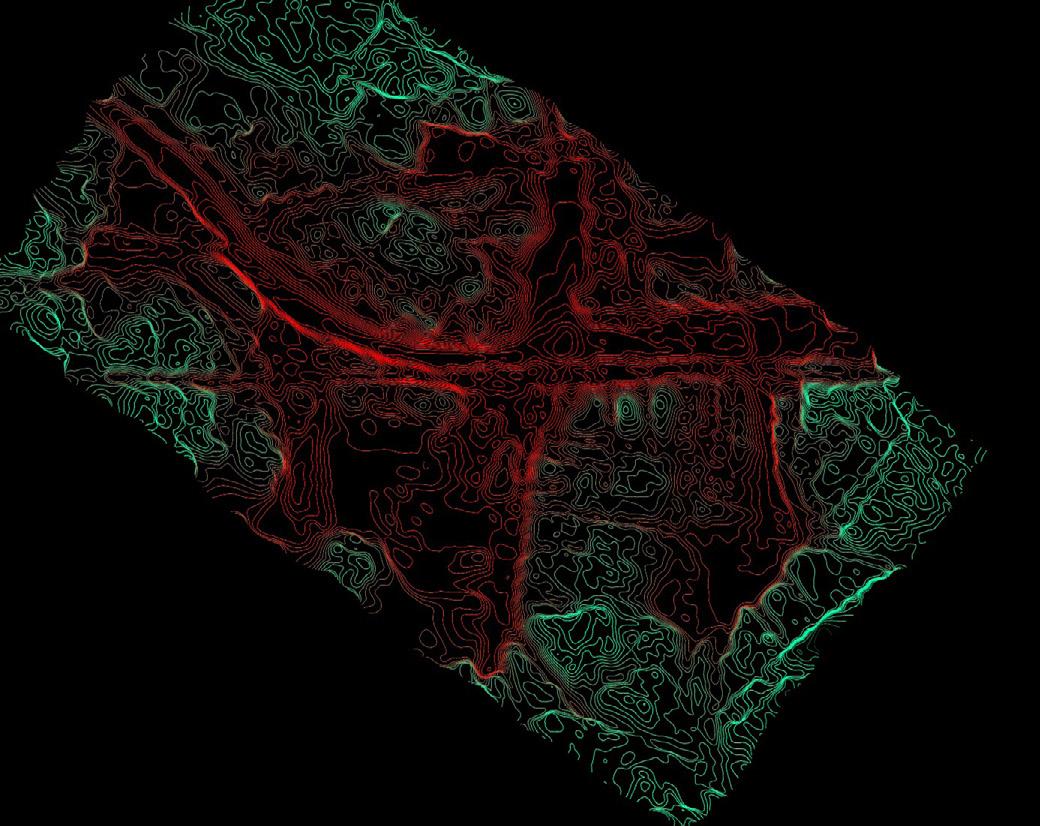
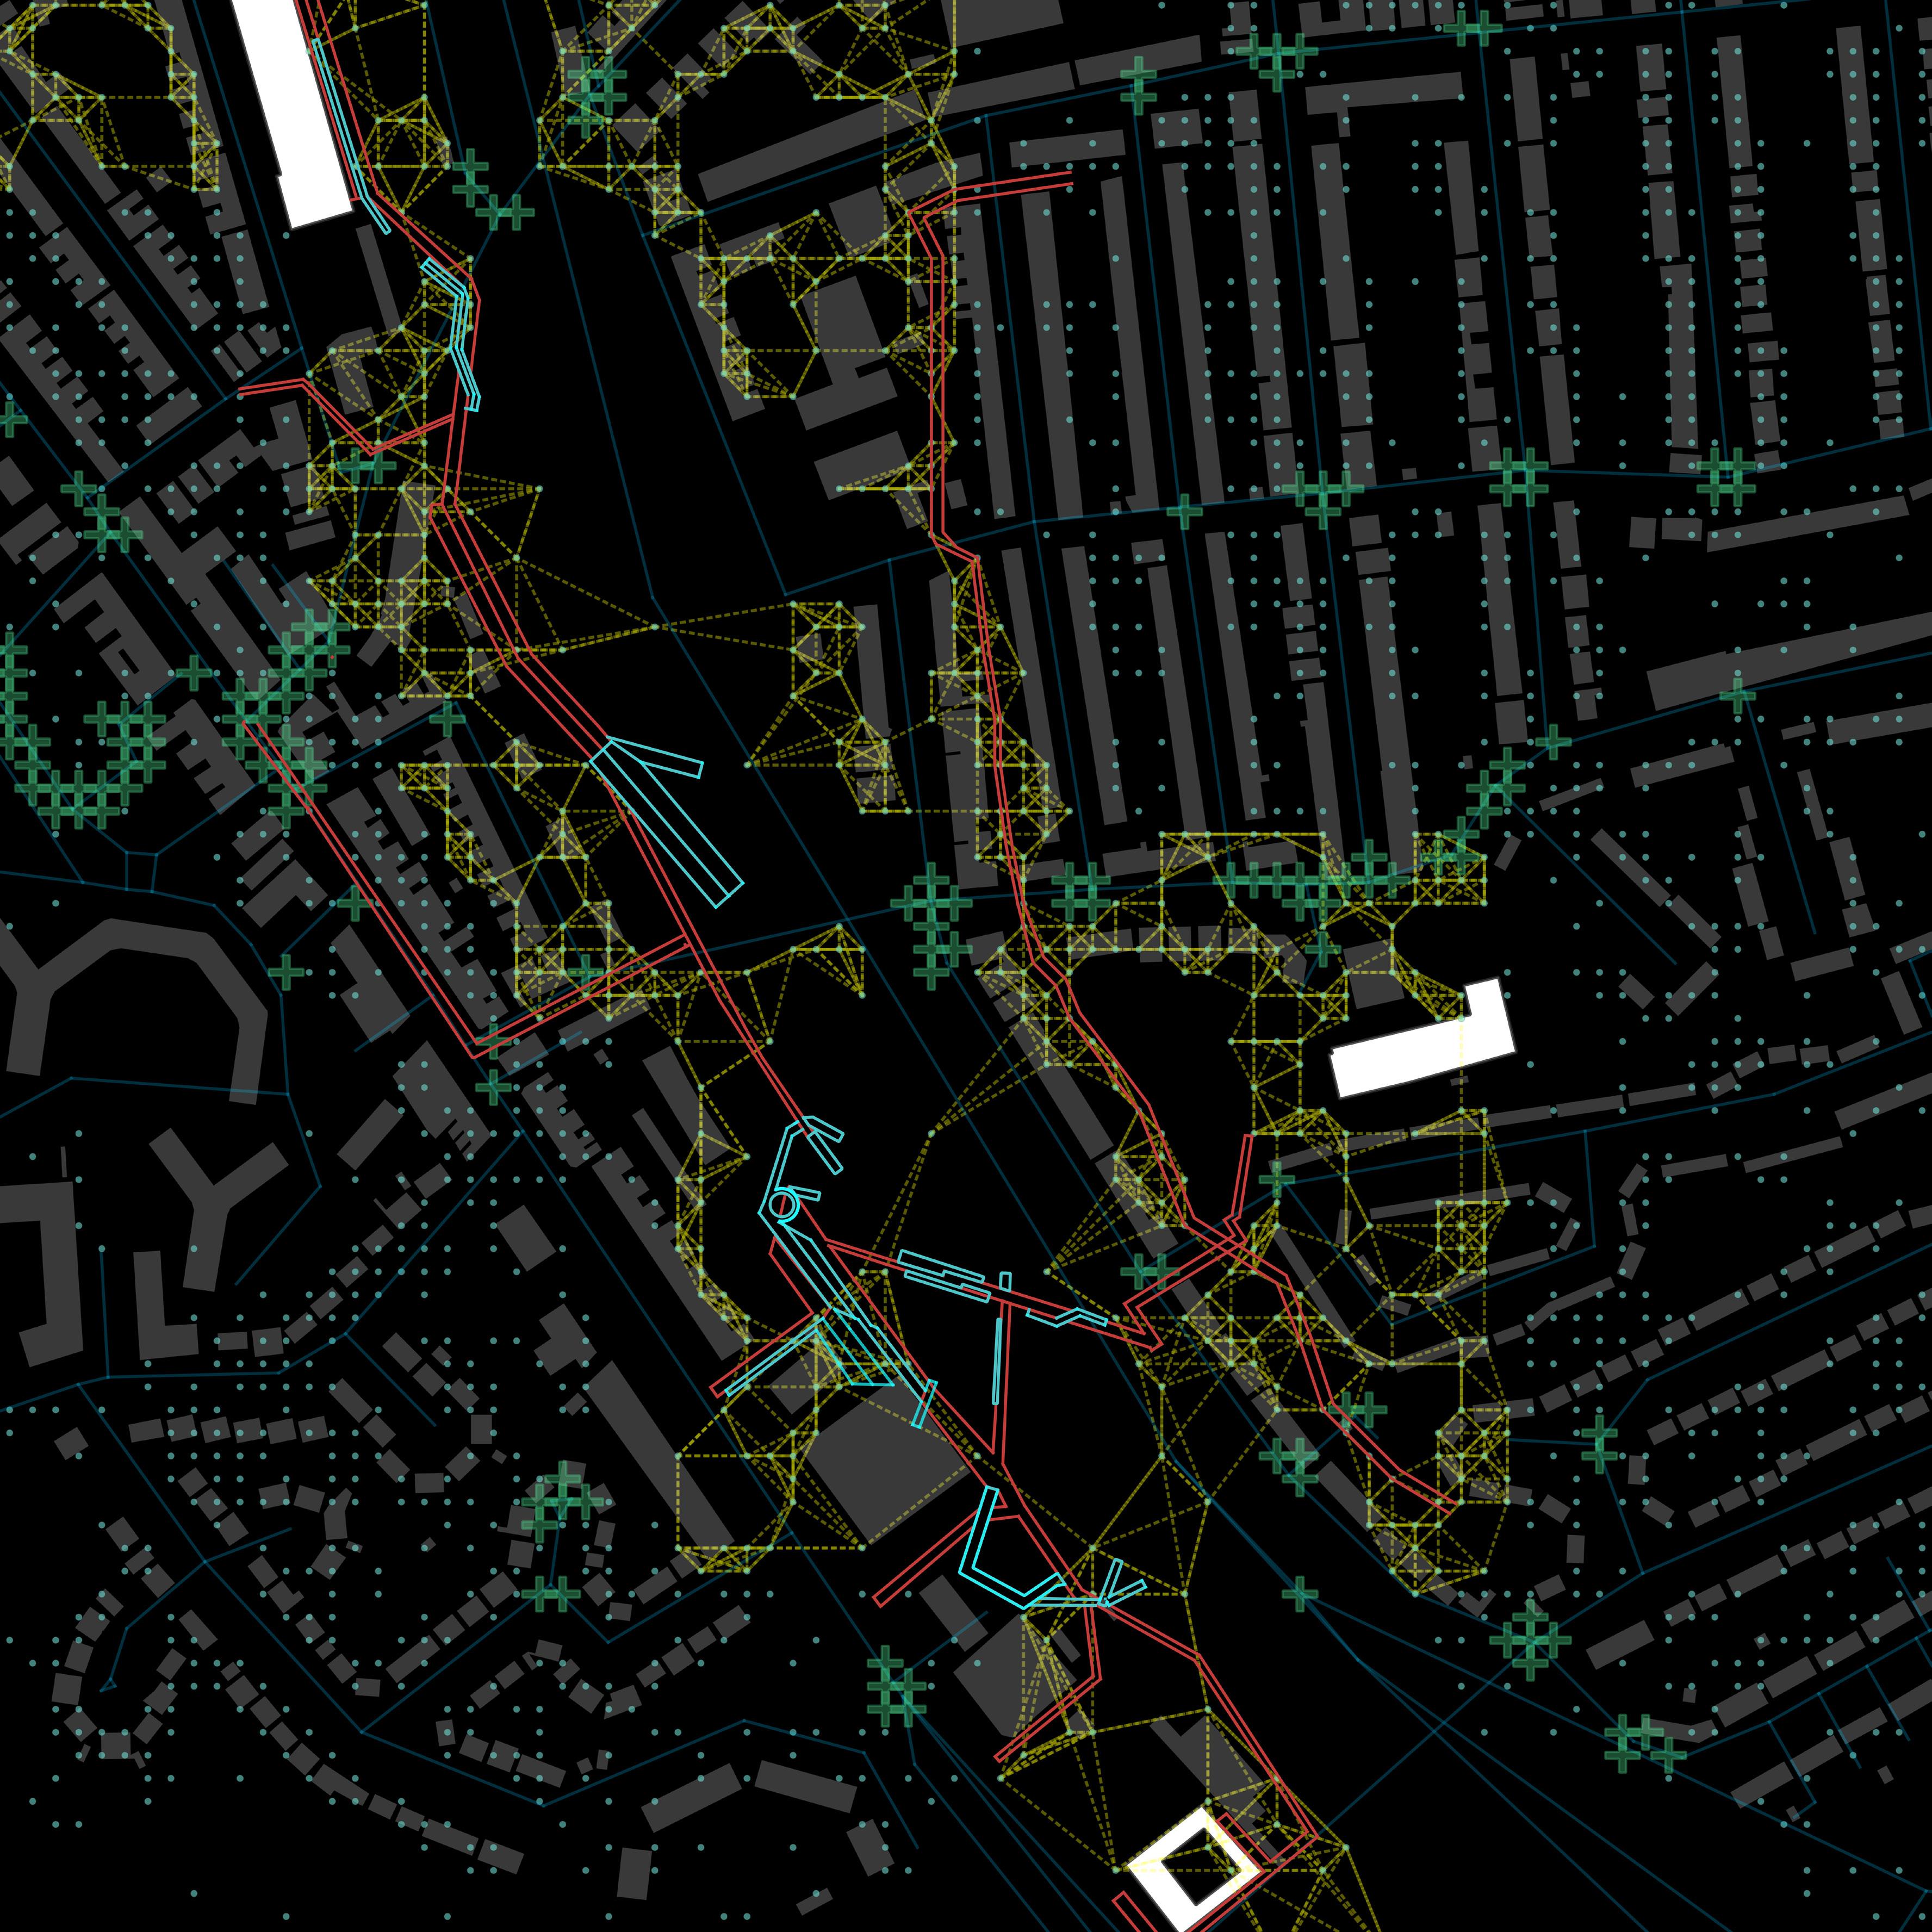
ISOVIST SIMULATION
Isovist Analysis was done at our chosen site between the 5 school locations to gain an understanding of the variability of visibility throughout our site. The Isovist analysis of Brent here shows that in the linear highway and railway area naturally more is visible and spatially connected. However, in smaller and narrower neighborhood streets the visibility is very linear. It would be important to leverage the idea of enhancing visibility and creating clear sightlines for our neighborhood scale interventions by strategically placing them in a way that enhances our alternate educational aspect to positively enhance a child’s holistic development.
Isovist Perimeter
Isovist Value Area
Isovist Area
Isovist Path
ISOVIST AREA
SCHOOL
LOCATIONS
Isovist Plan View – Throughout Chosen Site
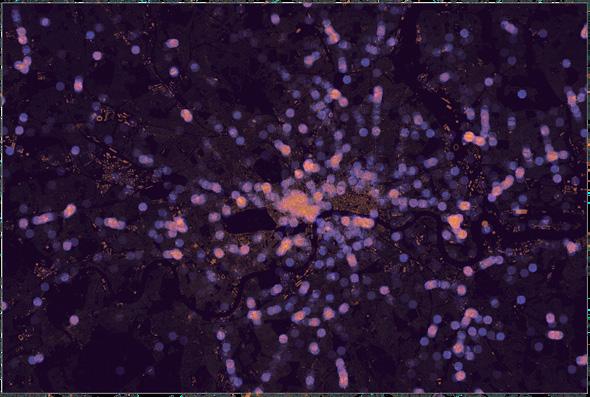
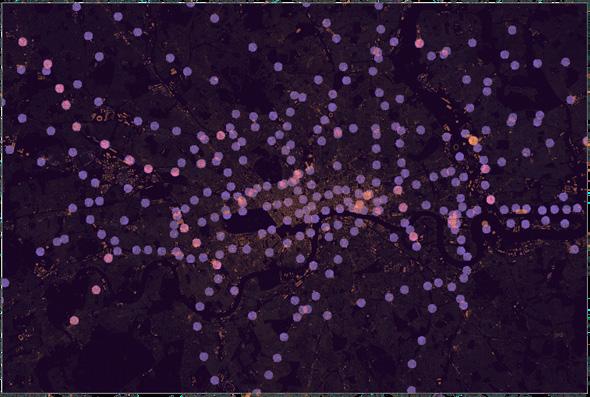
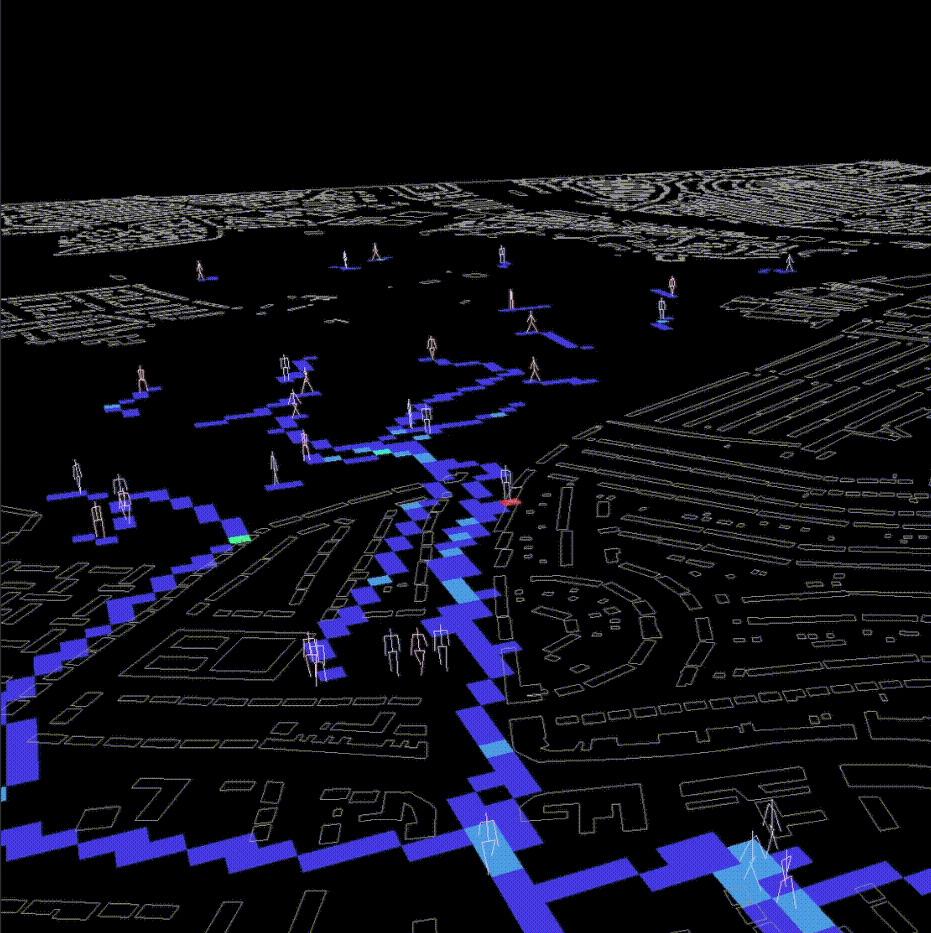
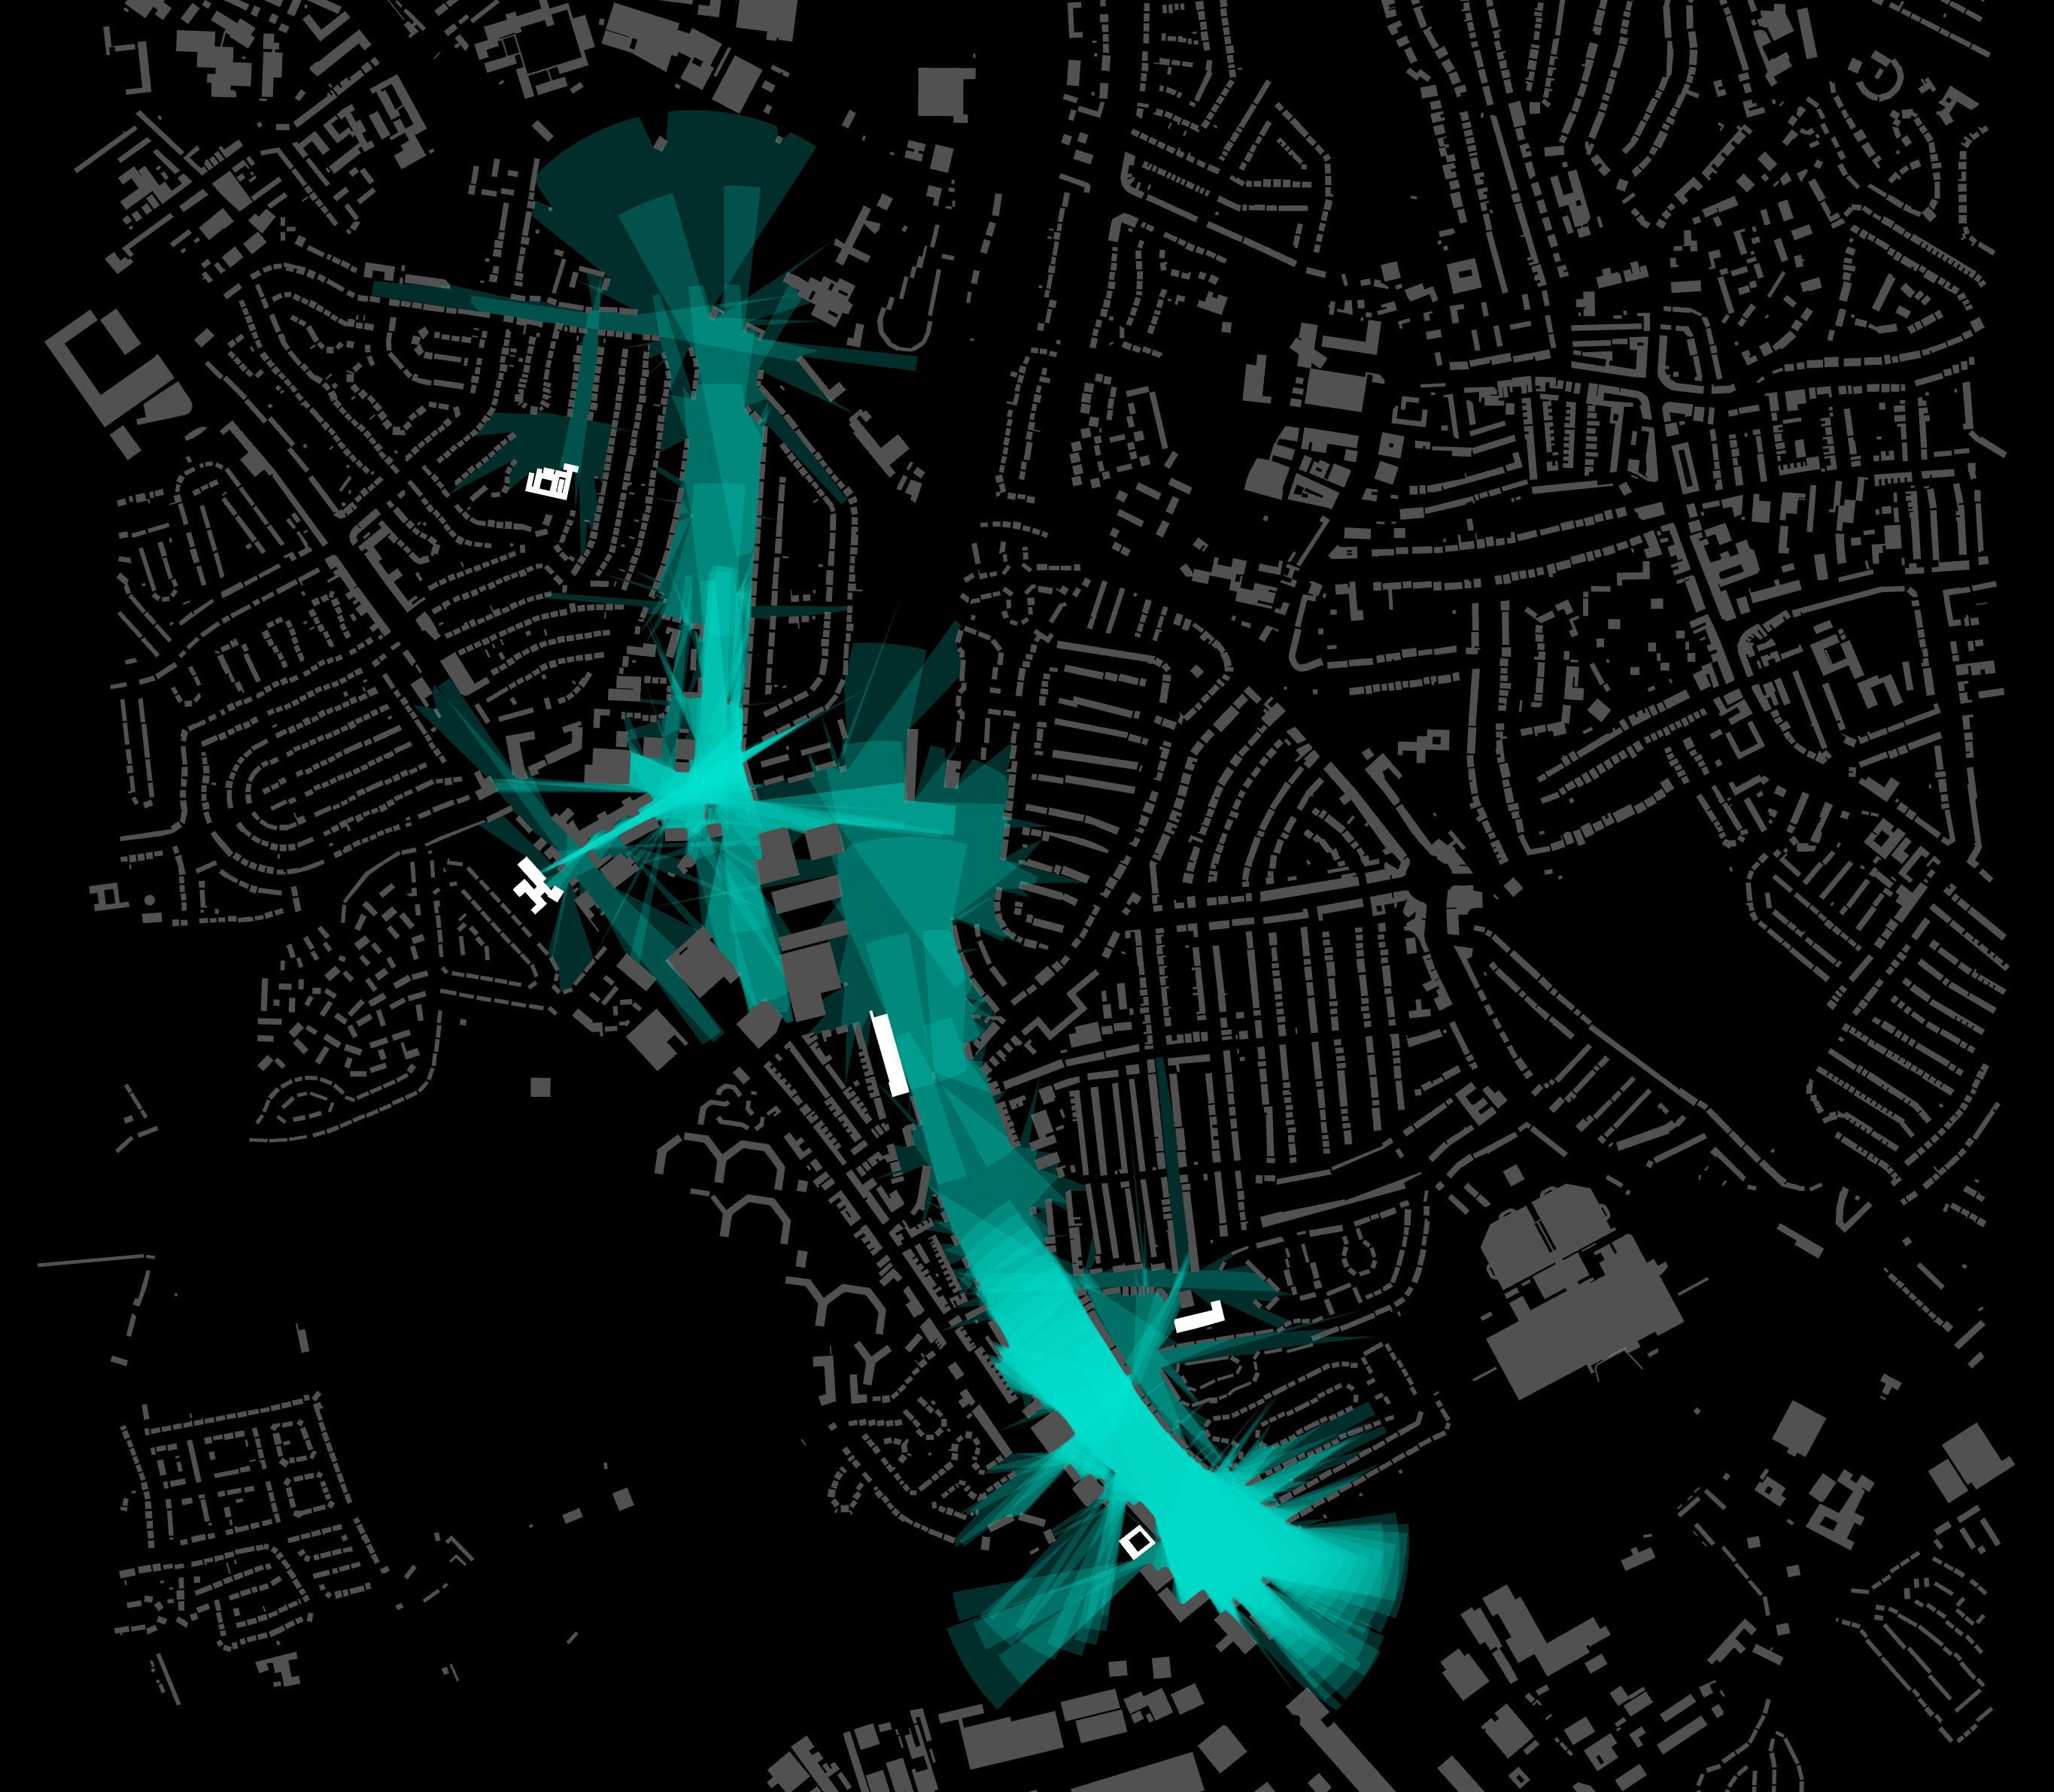
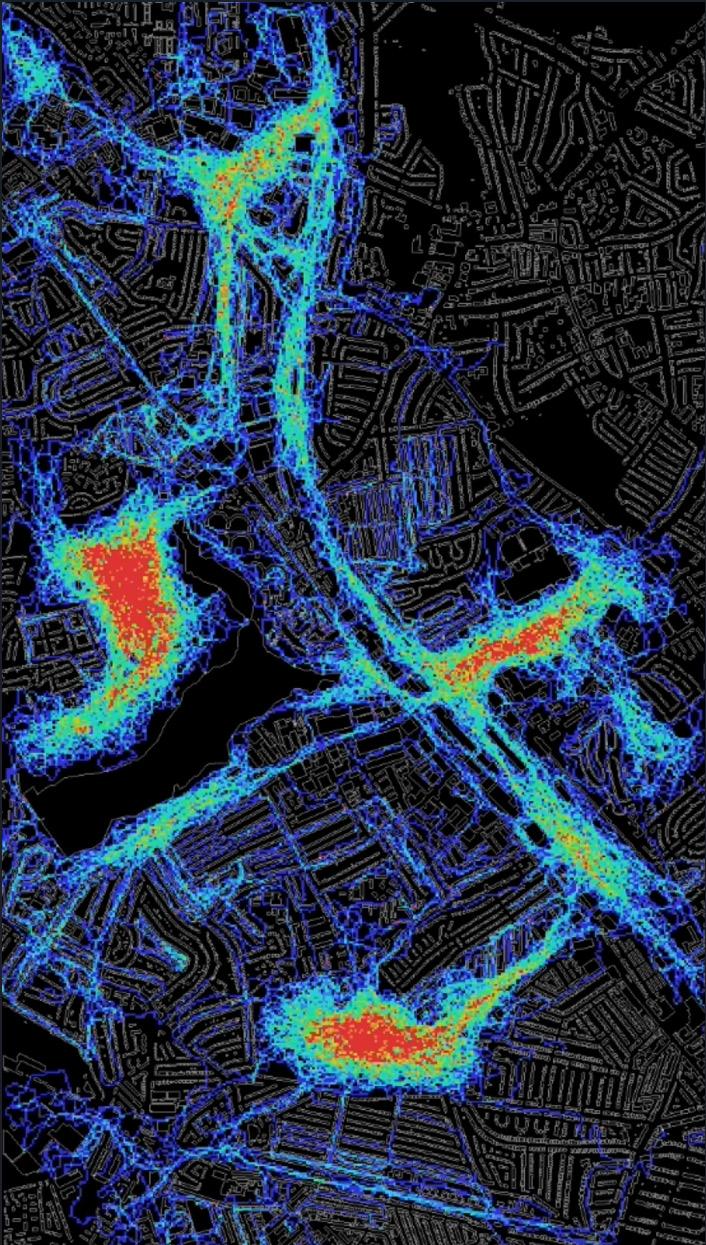
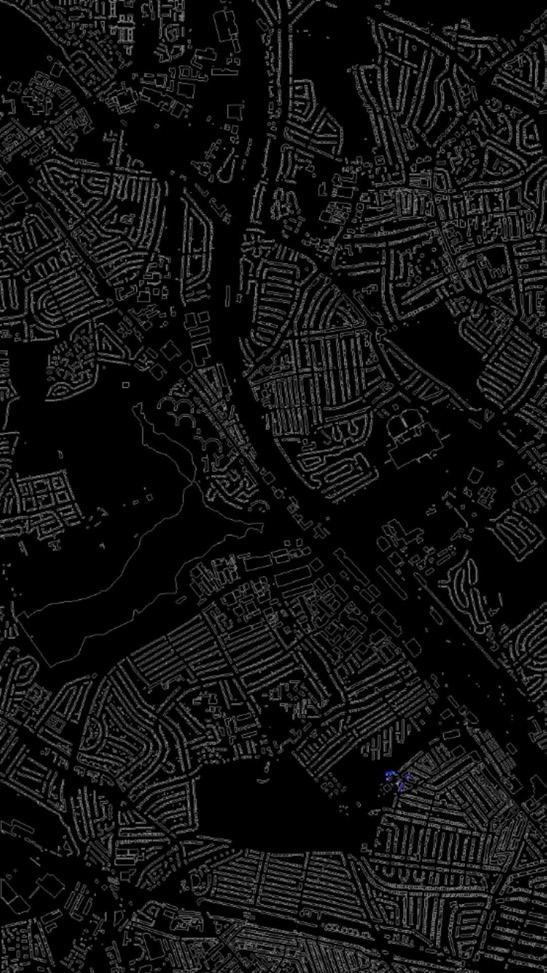
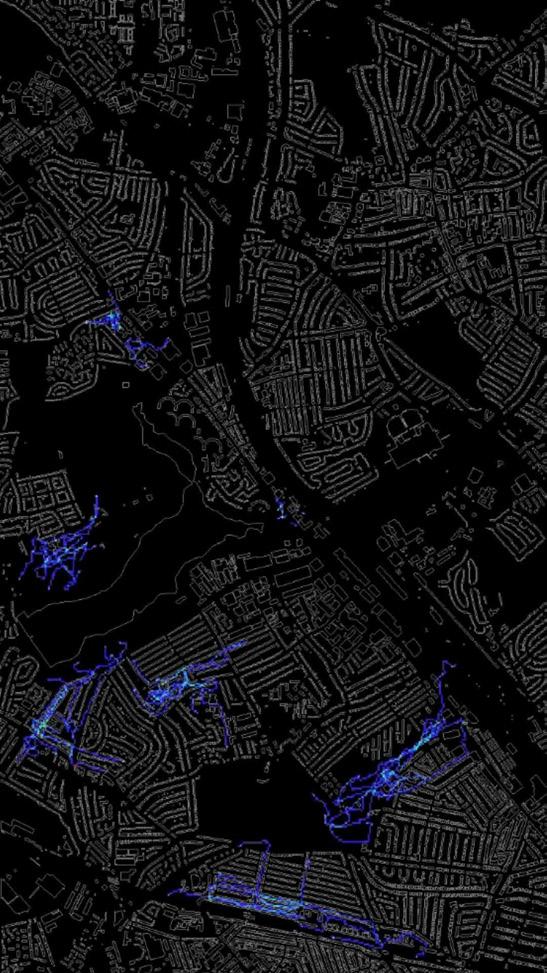
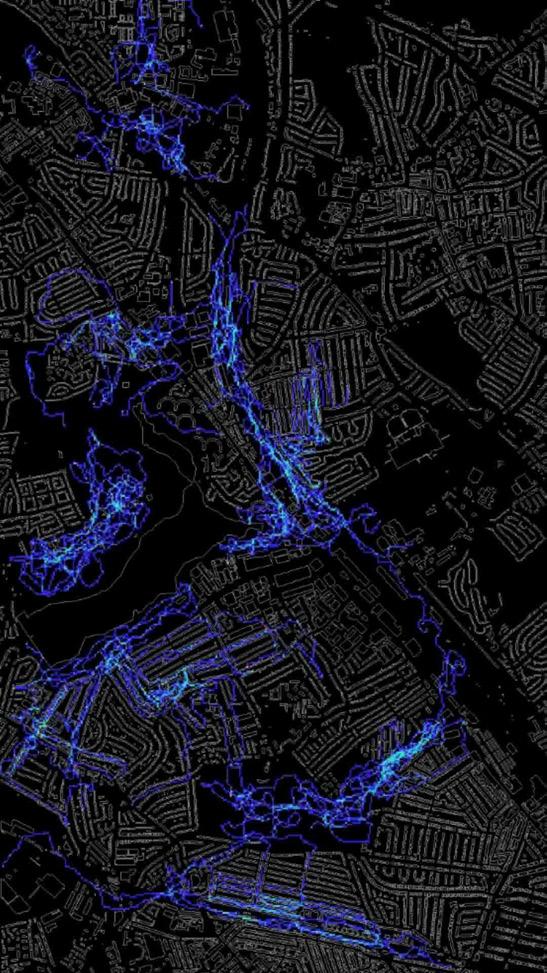
CHILD AGENT SIMULATION
An agent simulation was ran to simulate the movements of children with the aim of aiding design methodology of the pathways and pedestrian zones. The movements of 80 children were simulated. 10 children per school, which are highlighted by the red geometries, were placed in the simulation and observed to walk 10 minutes. A parameter was specifically placed which would cause the child agent to change direction every 3 steps due to the curious and unpredictable nature of a child’s way of walking. This analysis among the pix2pix and integration analysis mentioned, have together led us to our central narrowed down site.
School Locations (Simulation Starting Points)
PATH
PATH
Most travelled pathway by child agents
VGA SIMULATION
The VGA analysis shows that there is a strong visibility among the 5 different schools we have selected, and the two open areas have a linear connection. The strong visibility and clear sightlines evident in the site (highlighted in red) must be preserved in our design interventions and leveraged to have a positive educational effect on the children.
K-MEANS & PCA ANALYSIS
The K-means analysis helped determine our designed pathway shape and placements in connecting the 5 schools together. The Data of the K-means conists of GPS Points, Step Depth, Noise Pollution, Integration, and E-food desert index. This resulted in decisions that would allow our pathway to be highly connected, easily accessible, and close to the schools
DATA USED:
GPS points
Integration
E-food desert
Step depth
Noise pollution
LEGEND
Cluster 0
Cluster 1
Cluster 2
K-MEANS
INTEGRATION
MASTERPLAN PROCESS: DATA-DRIVEN DESIGN DECISIONS
The masterplan starts off with the K-means points
The points were filtered down by analyzing their proximity towards the schools
Integration values of the site (underlaid in red ) were to give a sense of the interconnectivity of the site within the context of the other data
A proximity analysis was ran on a second more refined cluster of points from the K-Means analysis (in yellow) 4 1 2 3
HIGH INTEGRATION & VEHICULAR MOVEMENT AT SCHOOL JUNCTION
SCHOOLS SHARE 800 METER CATCHMENT AREA
COMBINATION OF HIGH INTEGRATION & MEDIUM INTEGRATION EVIDENT
NODE INTEGRATING NEIGHBORHOOD WITH RAILWAY BASIN
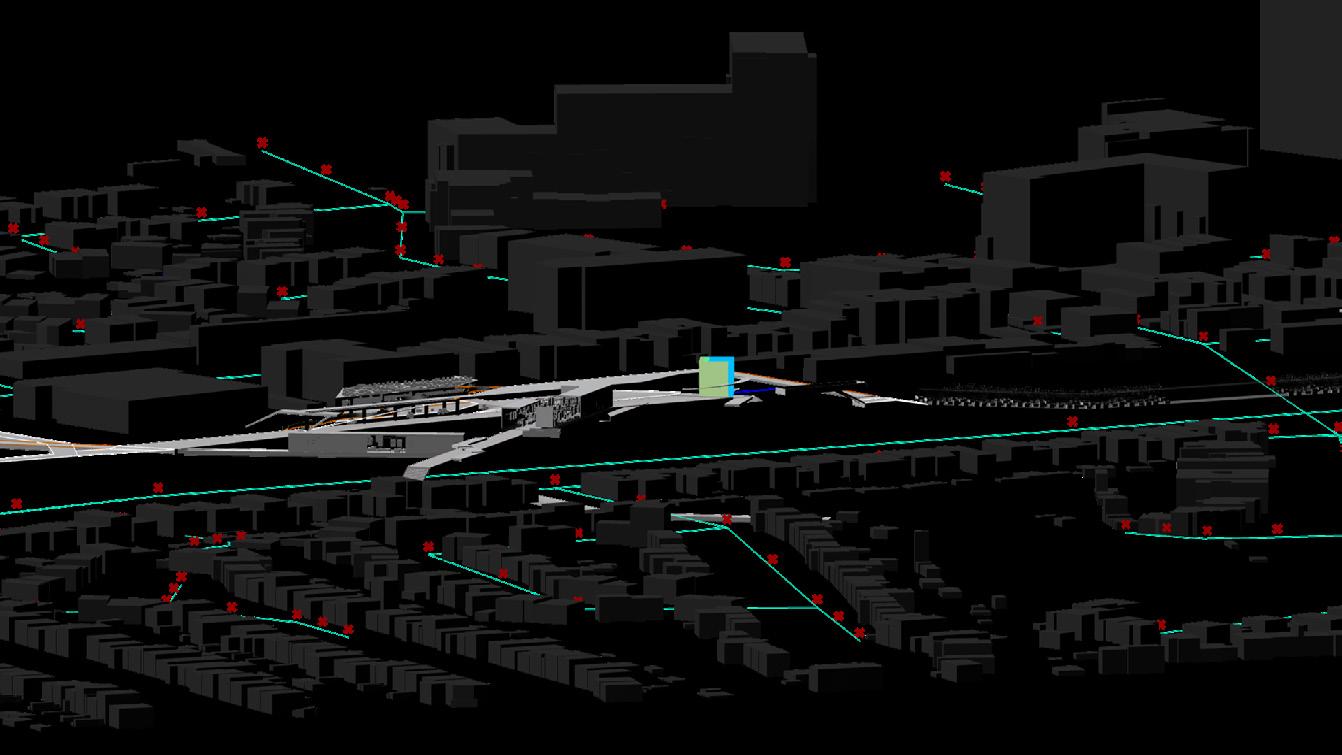
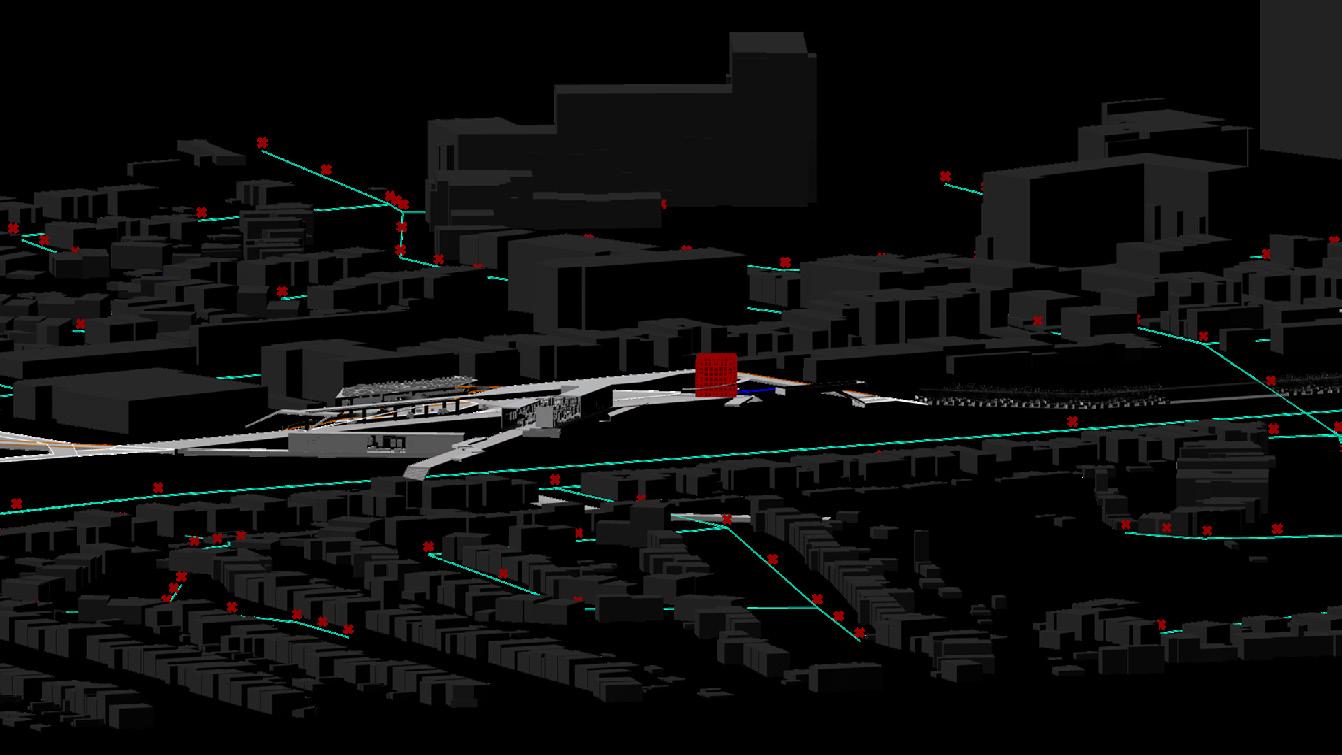
FOCUSED DESIGNED AREA
DATA ANALYSIS HELPED FORM THE BASIS OF THE PATH SHOWN (THICK RED LINES)
MASTERPLAN: FOCUSED DESIGN AREA
LEGEND
K-Means points
Roads
Filtered K-Means points
Proximity Data
Main Pathways
Secondary Pathways
SECONDARY PATHWAYS
MAIN PATHWAYS
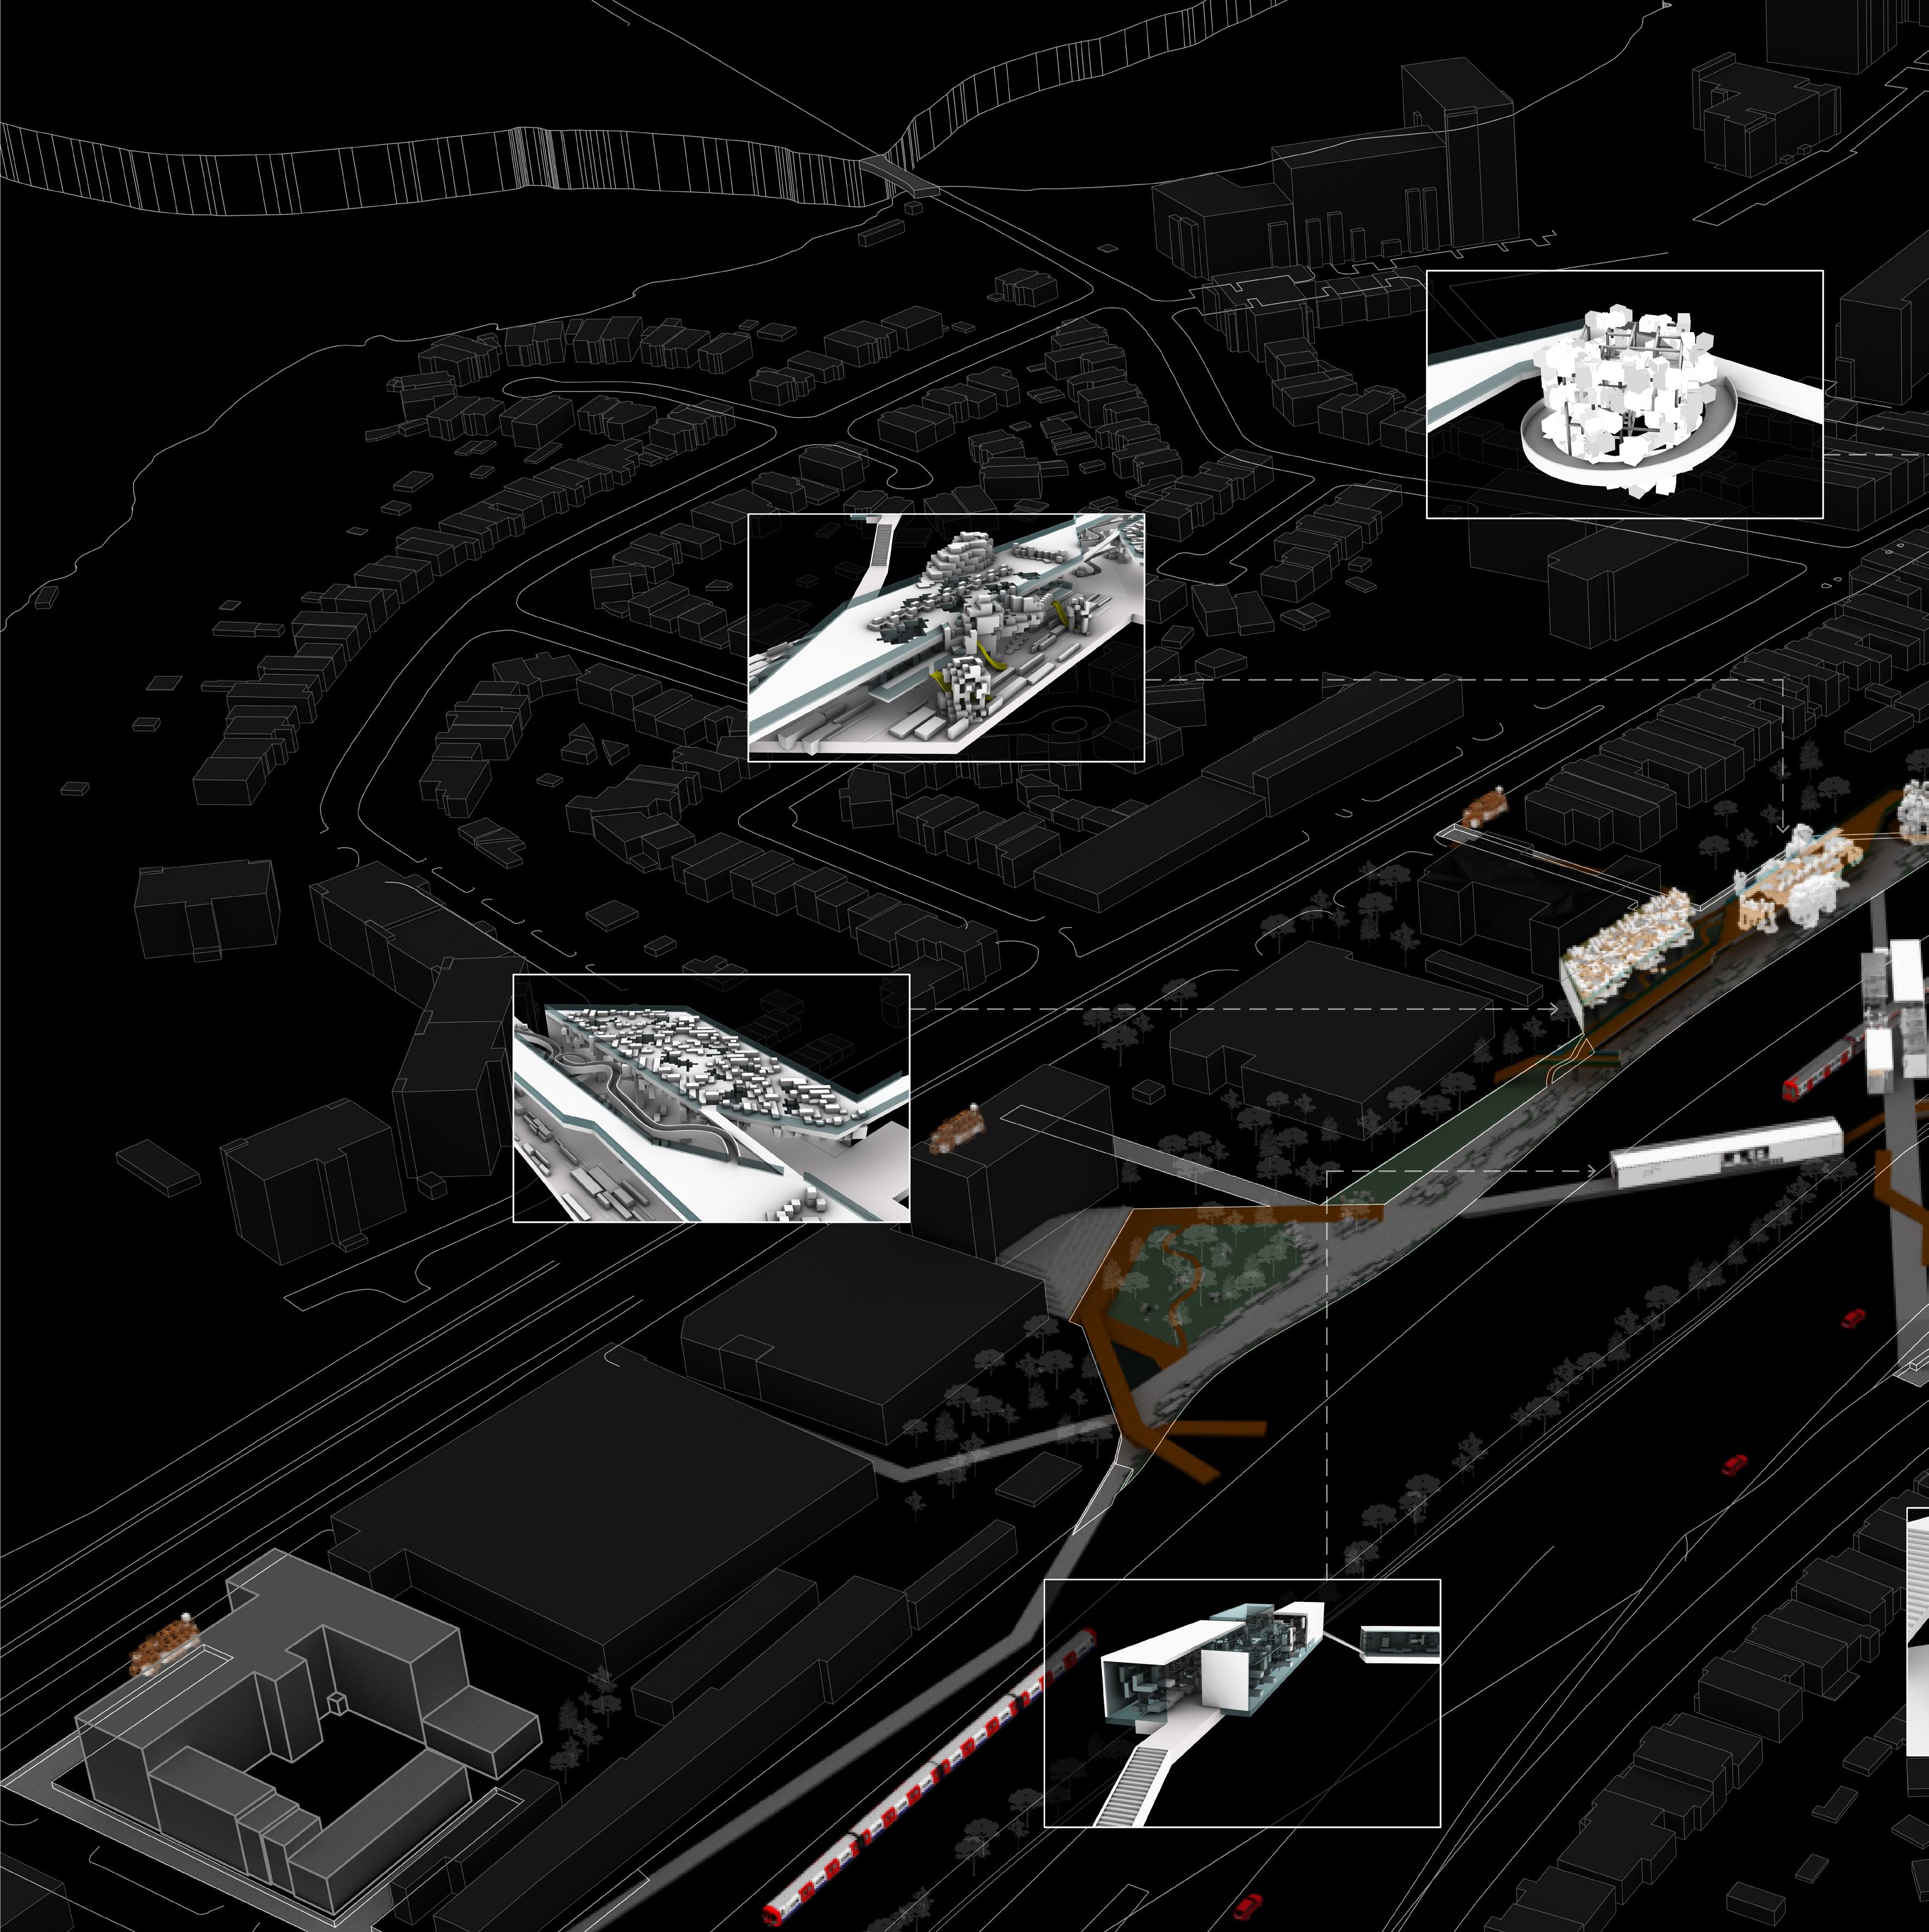
DESIGN CONCEPT & PEDAGOGY
For our design concept, We researched the most important educational aspects that are both crucial to a child’s development yet also lacking in schools and they are Creativity, social, financial, agriculture, emotional, nature, and reading. Then we derived from those aspects 8 design interventions. These interventions have the aim to provide holistic development cognitively, emotionally, physically, and socially and are the basis for the idea of the alternate school space we are creating. Not only are we pairing the design interventions to these researched educational aspects lacking in schools, but also, we are ensuring that the interventions satisfy the issues from the 5 factors that we previously mentioned which are potential inhibitors to a child’s education and development.
EXTRACTED EDUCATIONAL ASPECTS CRUCIAL TO CHILD DEVELOPMENT
Creative Aspect
Social Aspect
Financial Aspect
Reading Aspect
Emotional Aspect
Agriculture & Food
security Aspect
Nature Aspect
We chose to adopt the forest school pedagogy and extracted crucial principles from this learning method. The main principles extracted were:
• Nature based learning
• Hands-on interactive learning
• Holistic development
PROPOSED INTERVENTIONS
5 FACTORS AFFECTING CHILD HOLISTIC DEVELOPMENT
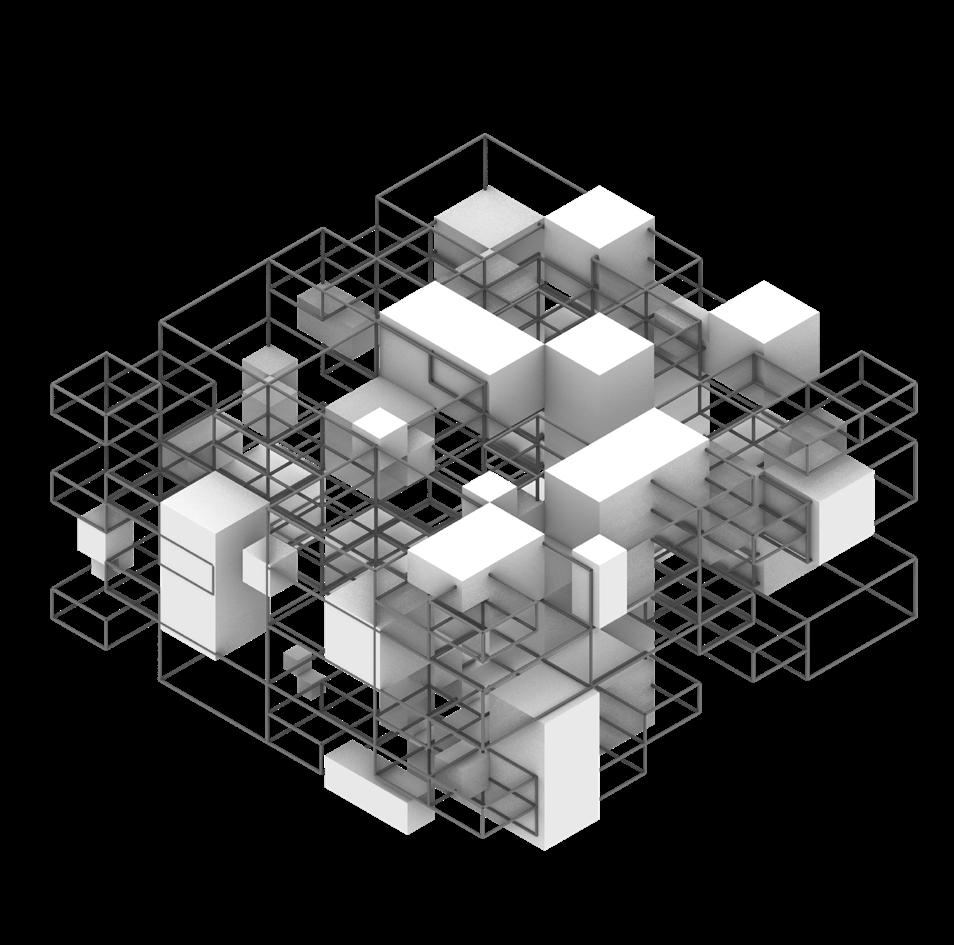
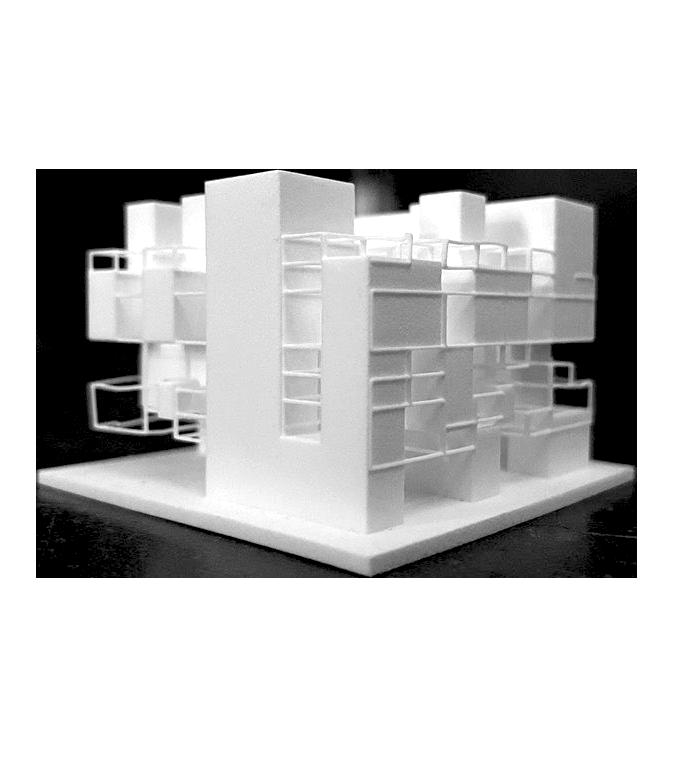
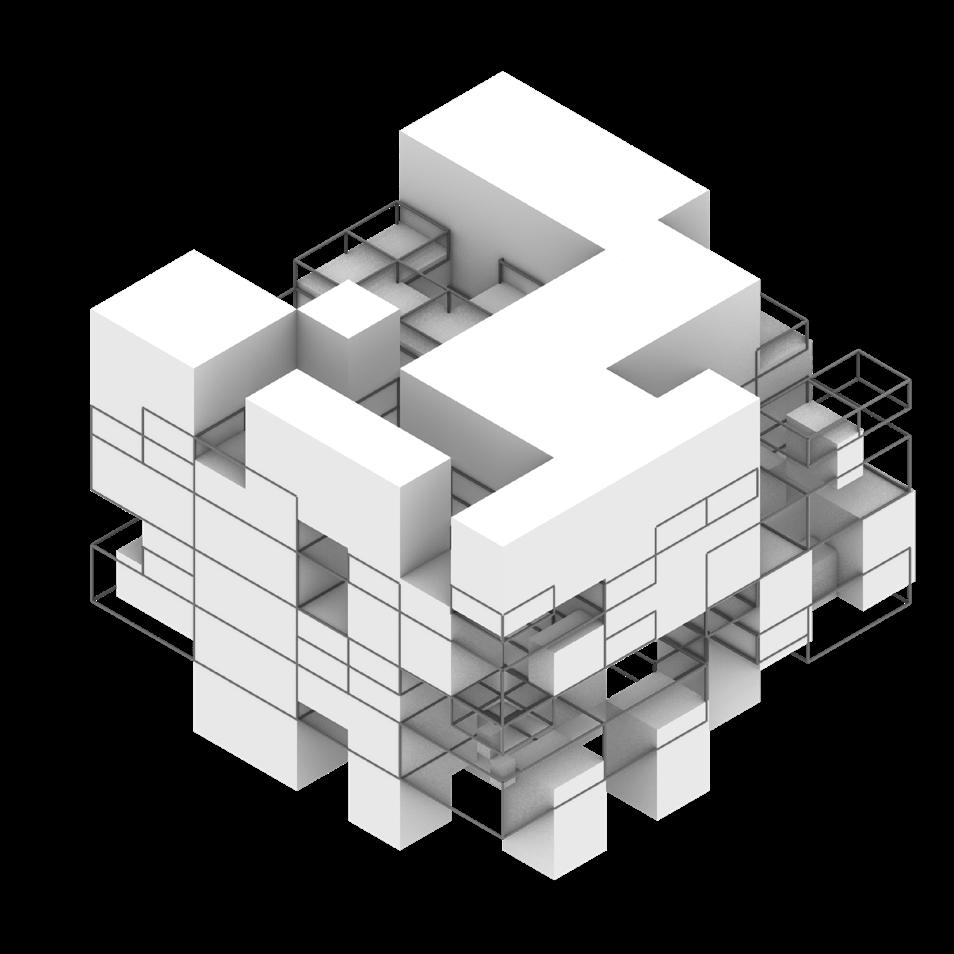
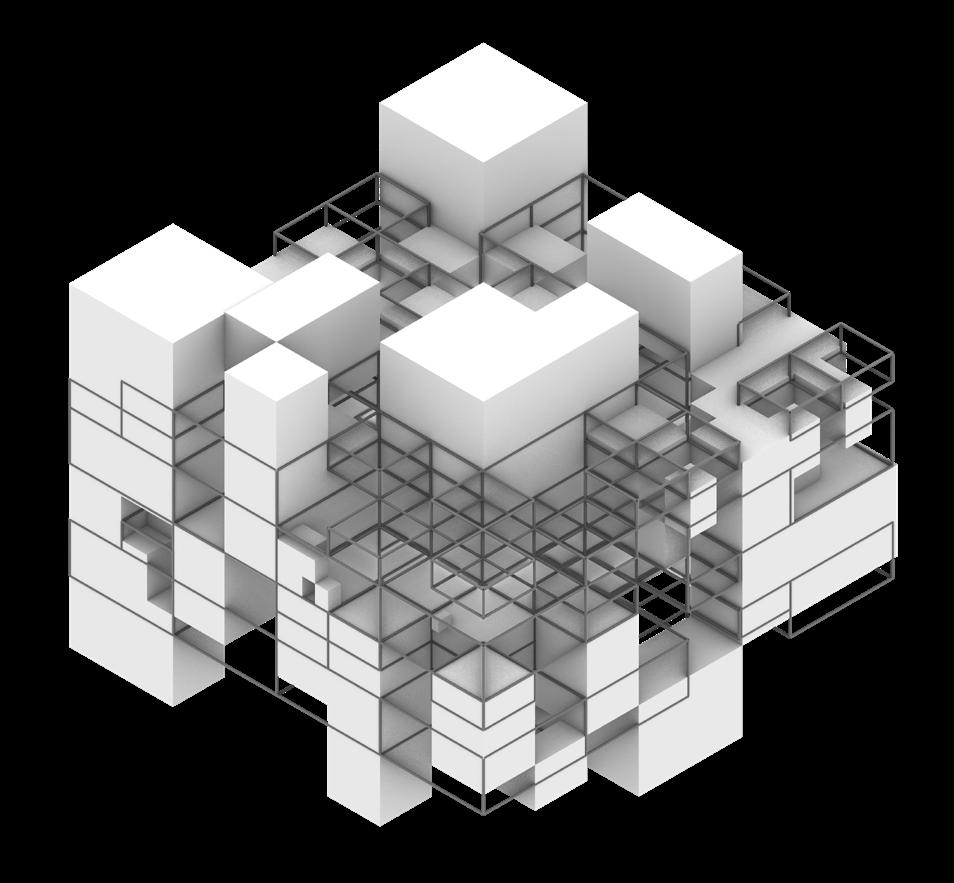
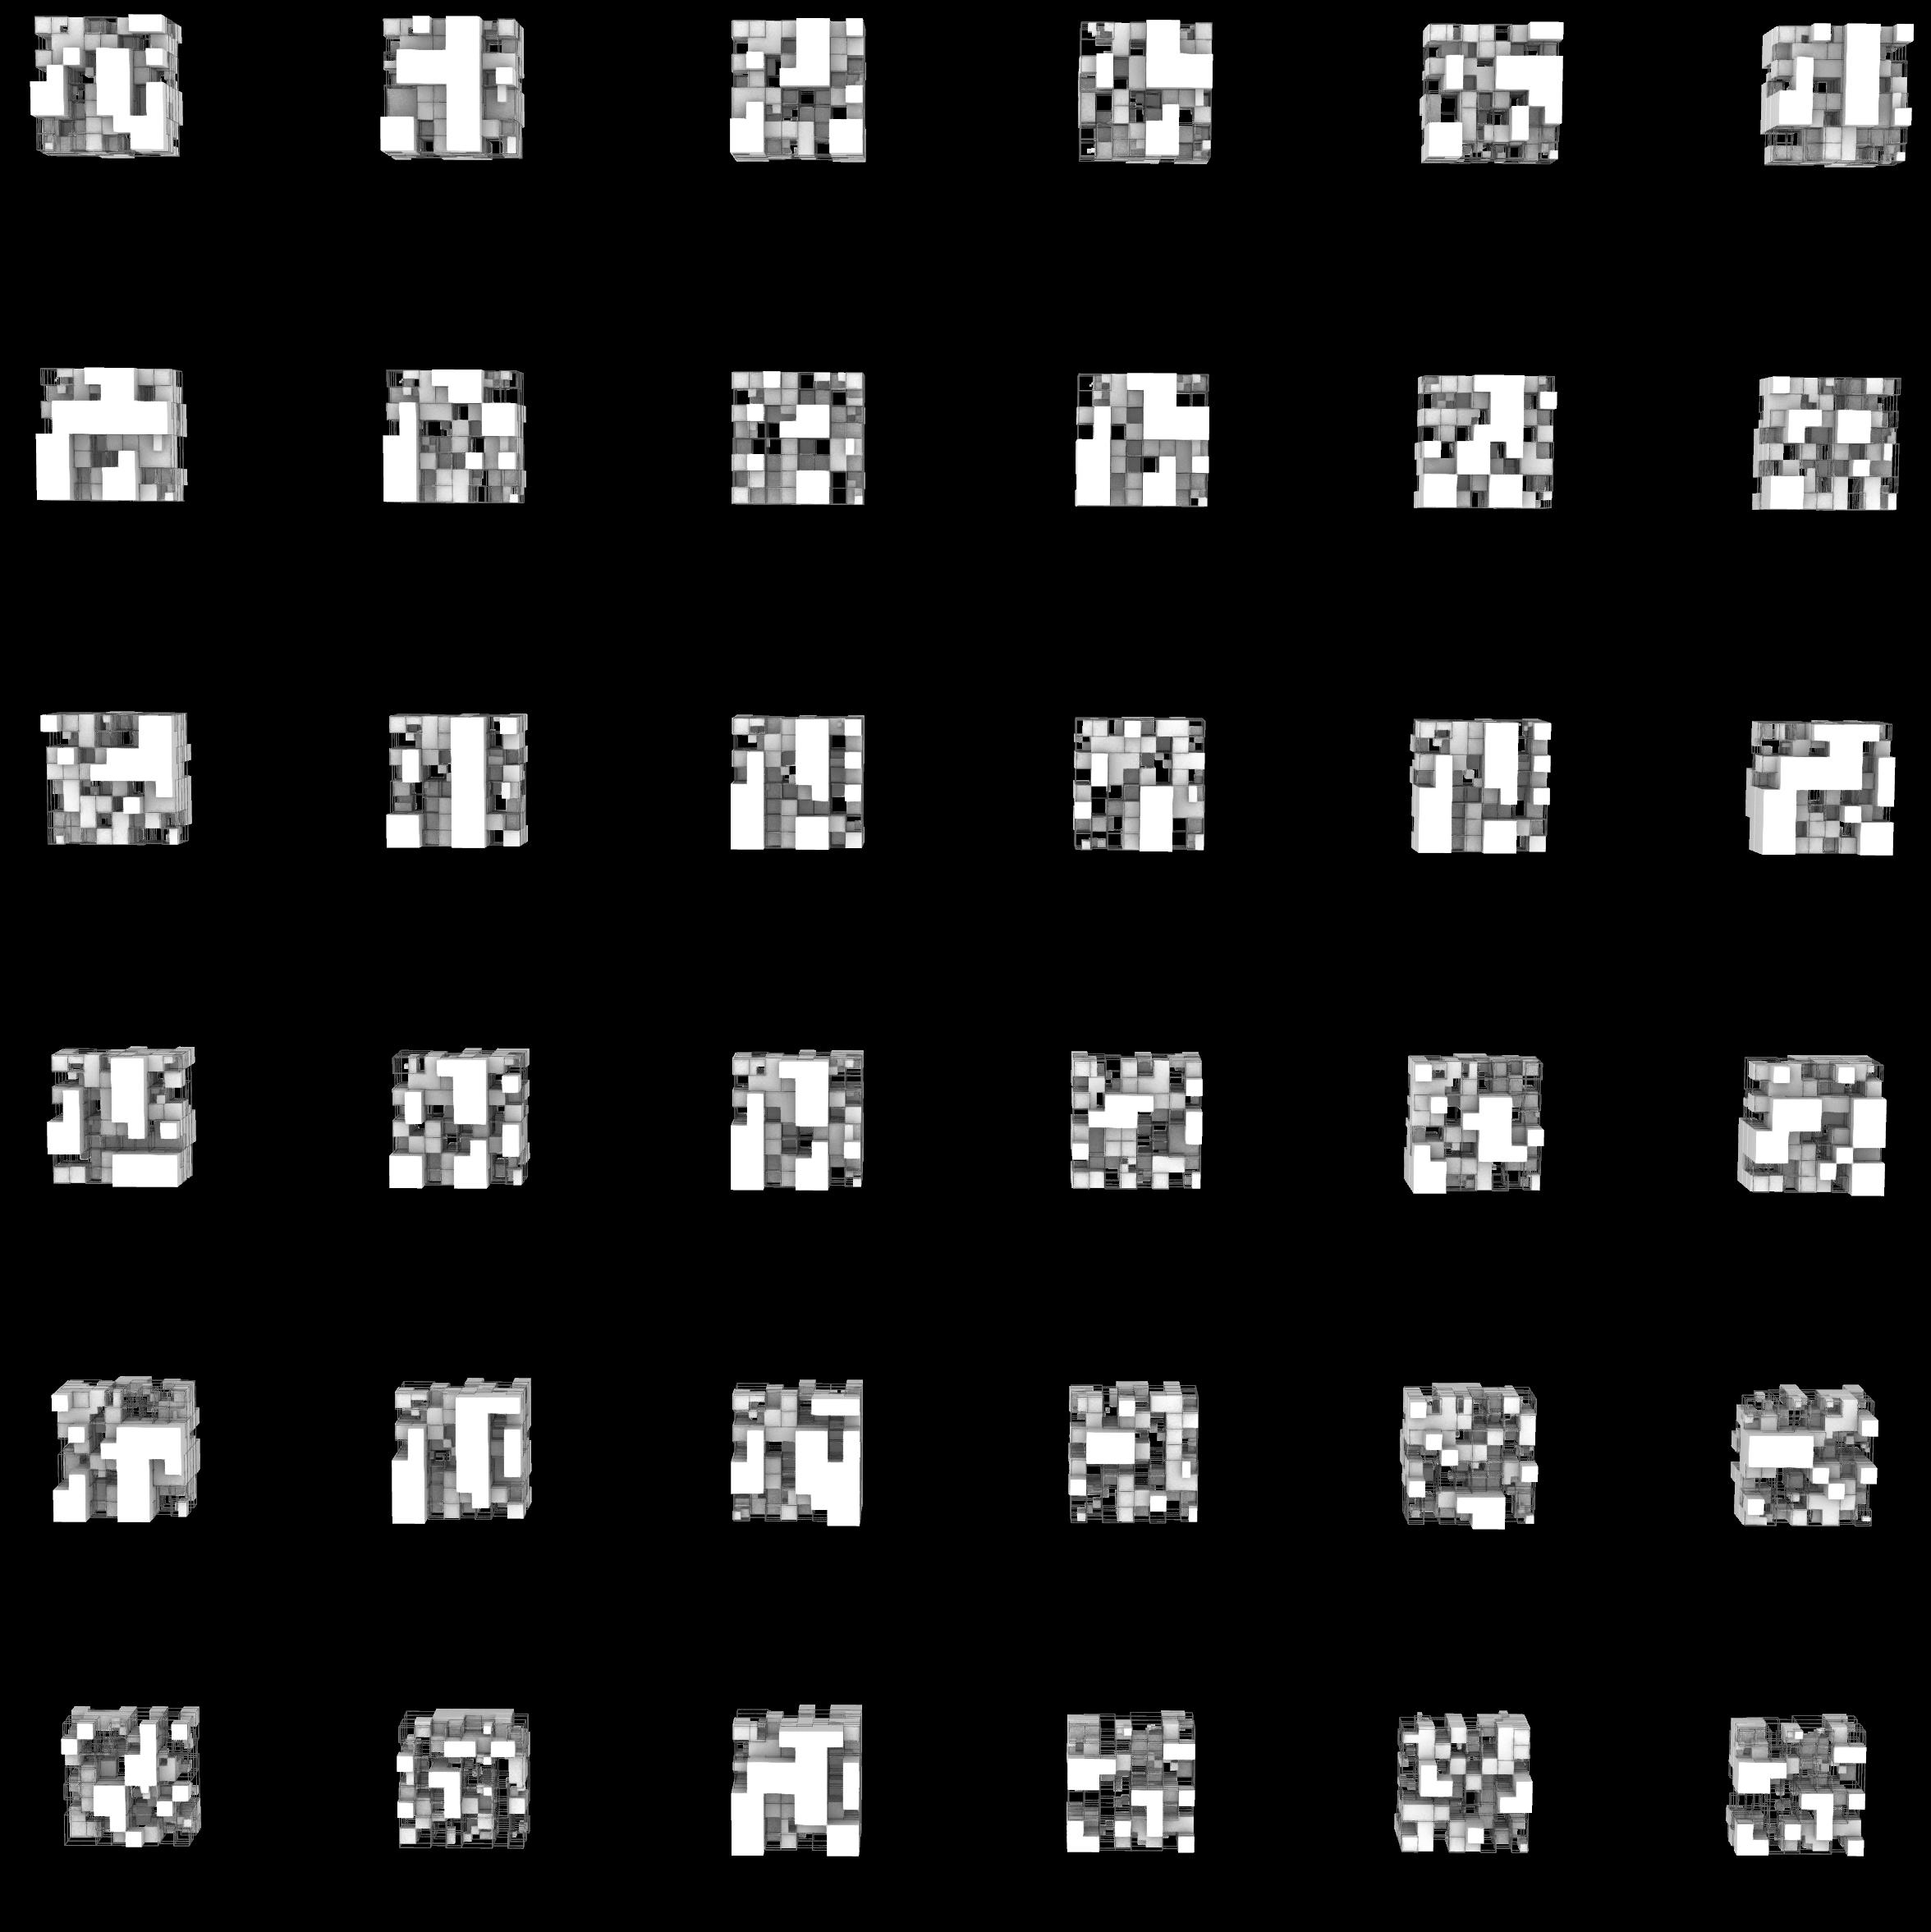
EVOLUTIONARY ALGORITHM DESIGN ITERATIONS
We created design iterations using an evolutionary algorithm that used the two design elements of solids and voids as the base form. The iterations were fed 3 fitness parameters which were essential to creating spaces suitable for our design interventions and they are Max volume of void, minimum volume of solids, and max area of solids.
FITNESS VALUES -
Maximum Volume of Void – To increase open spaces left by void boxes
Minimum Volume of Solids – To reduce solid spaces throughout the structure to make it easier to access and walkthrough
Max area of Solids – To get different sizing of the solids to create variation in the space
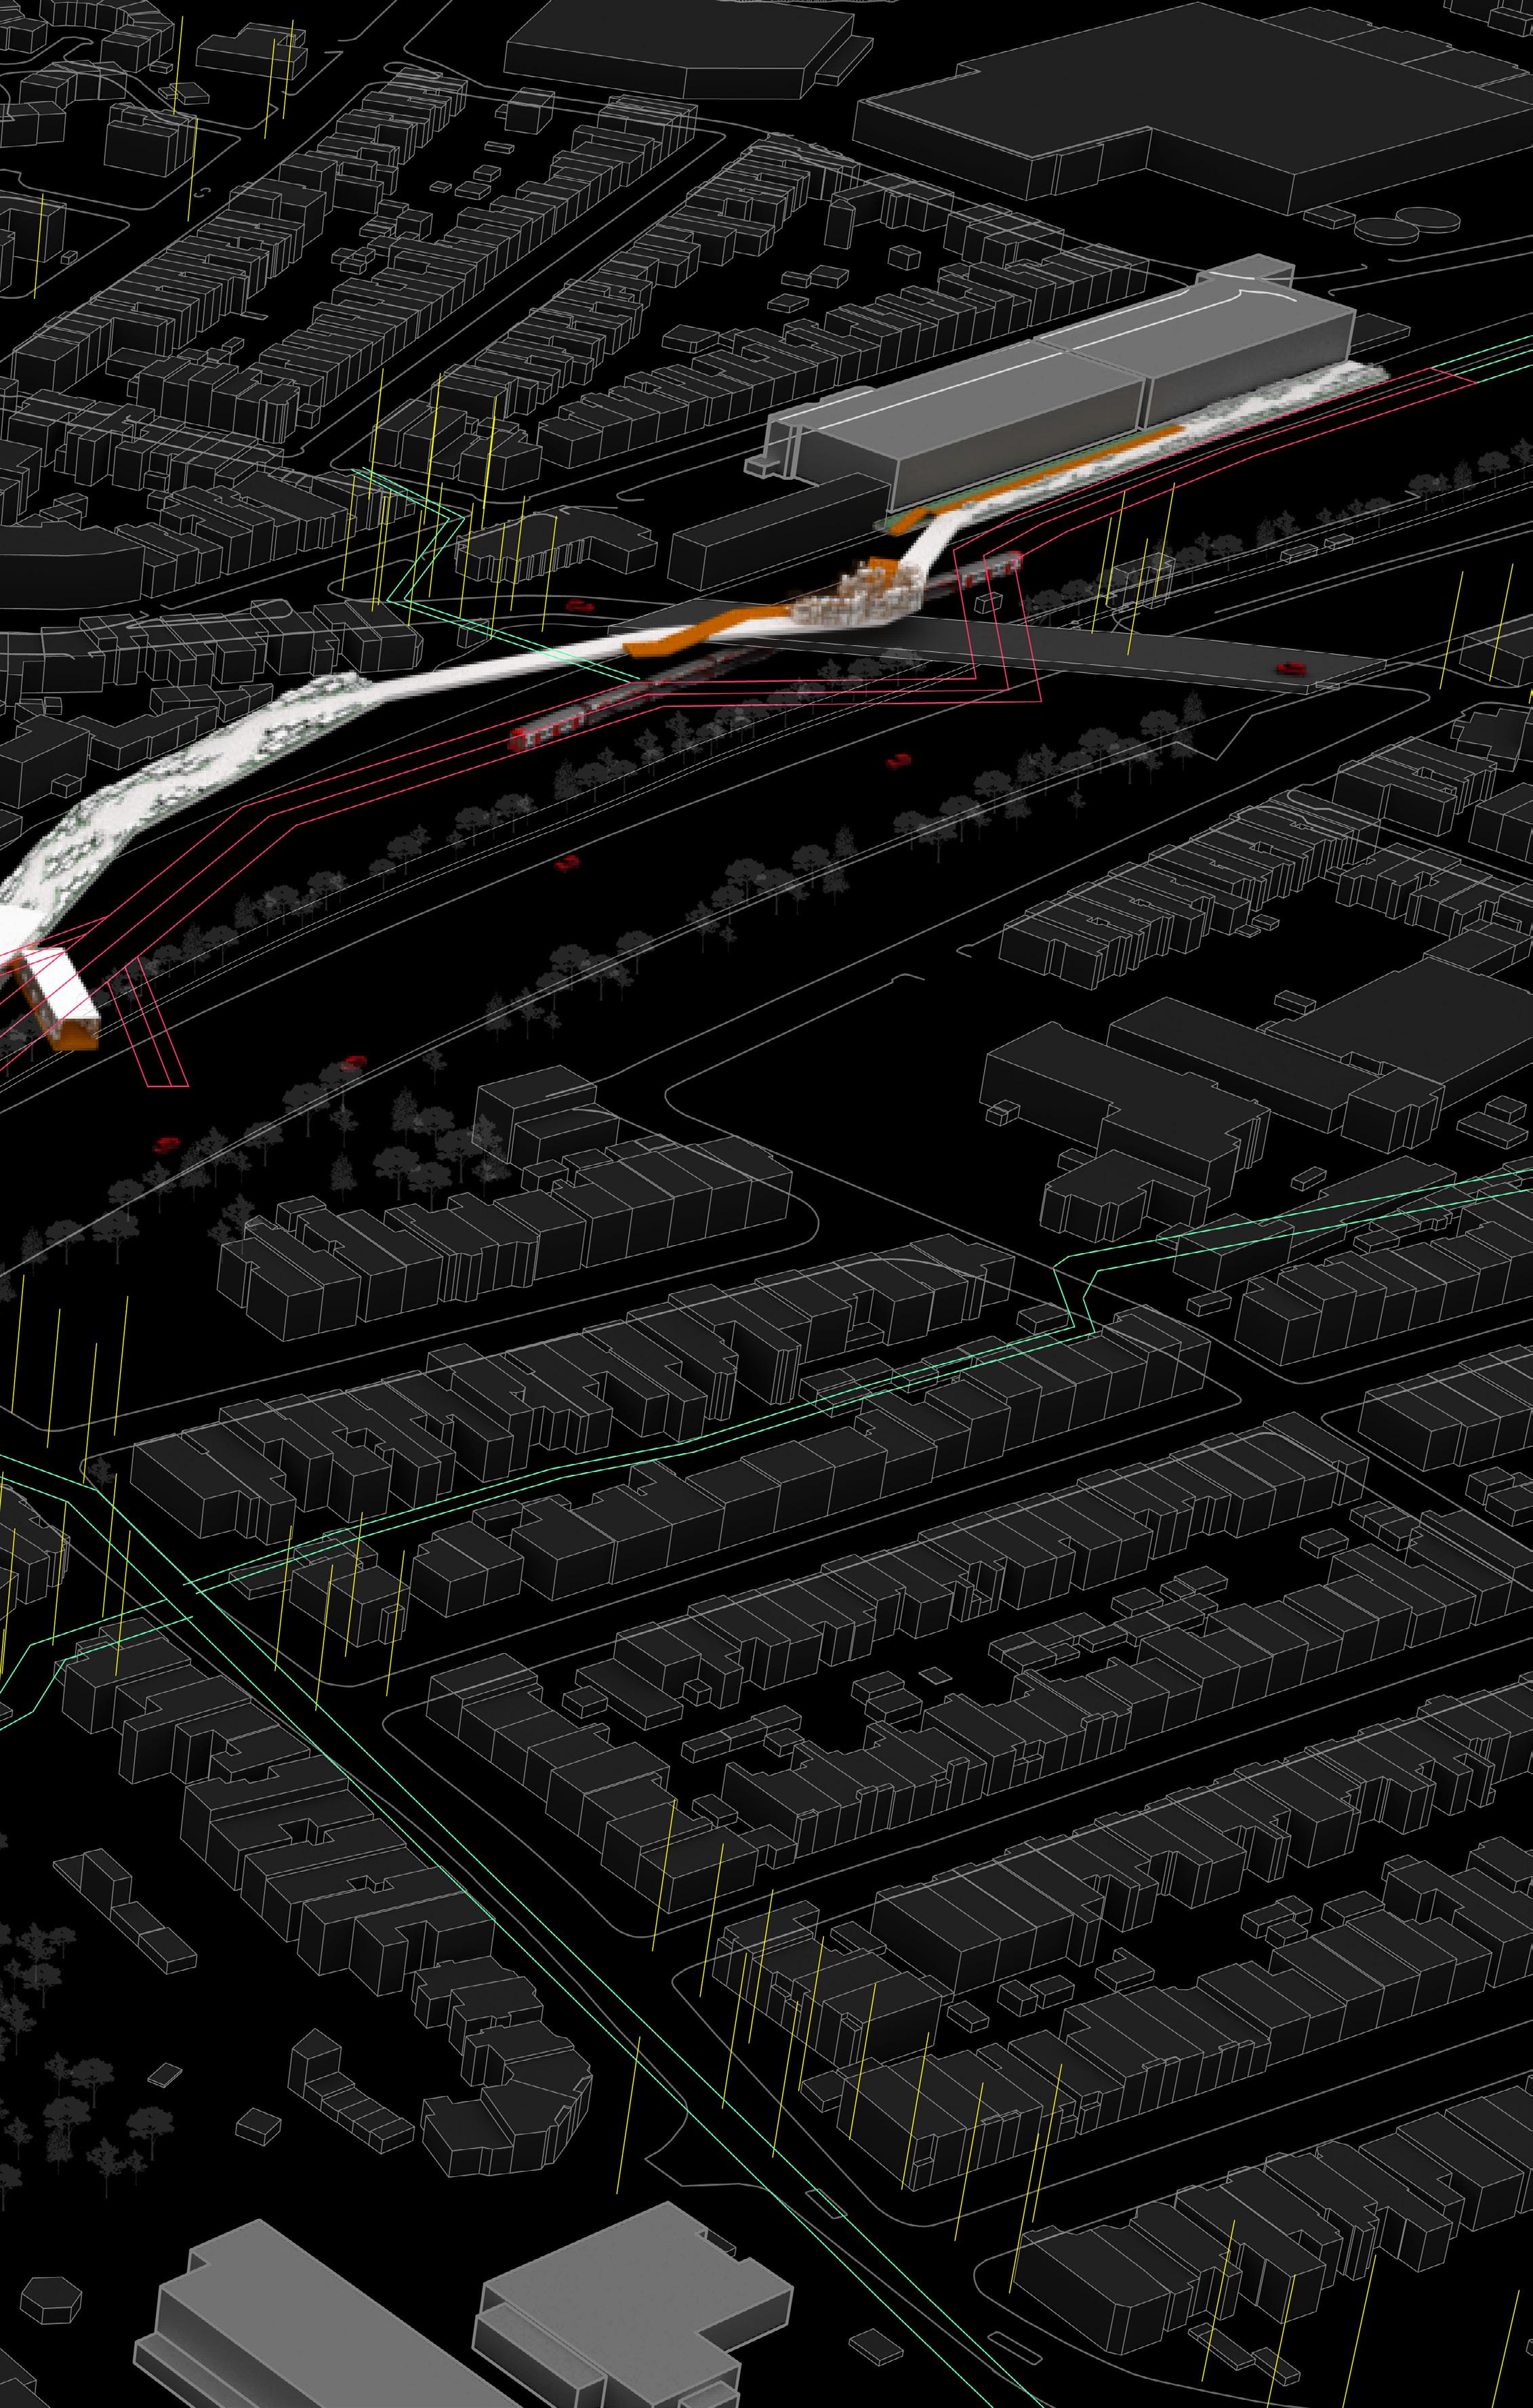
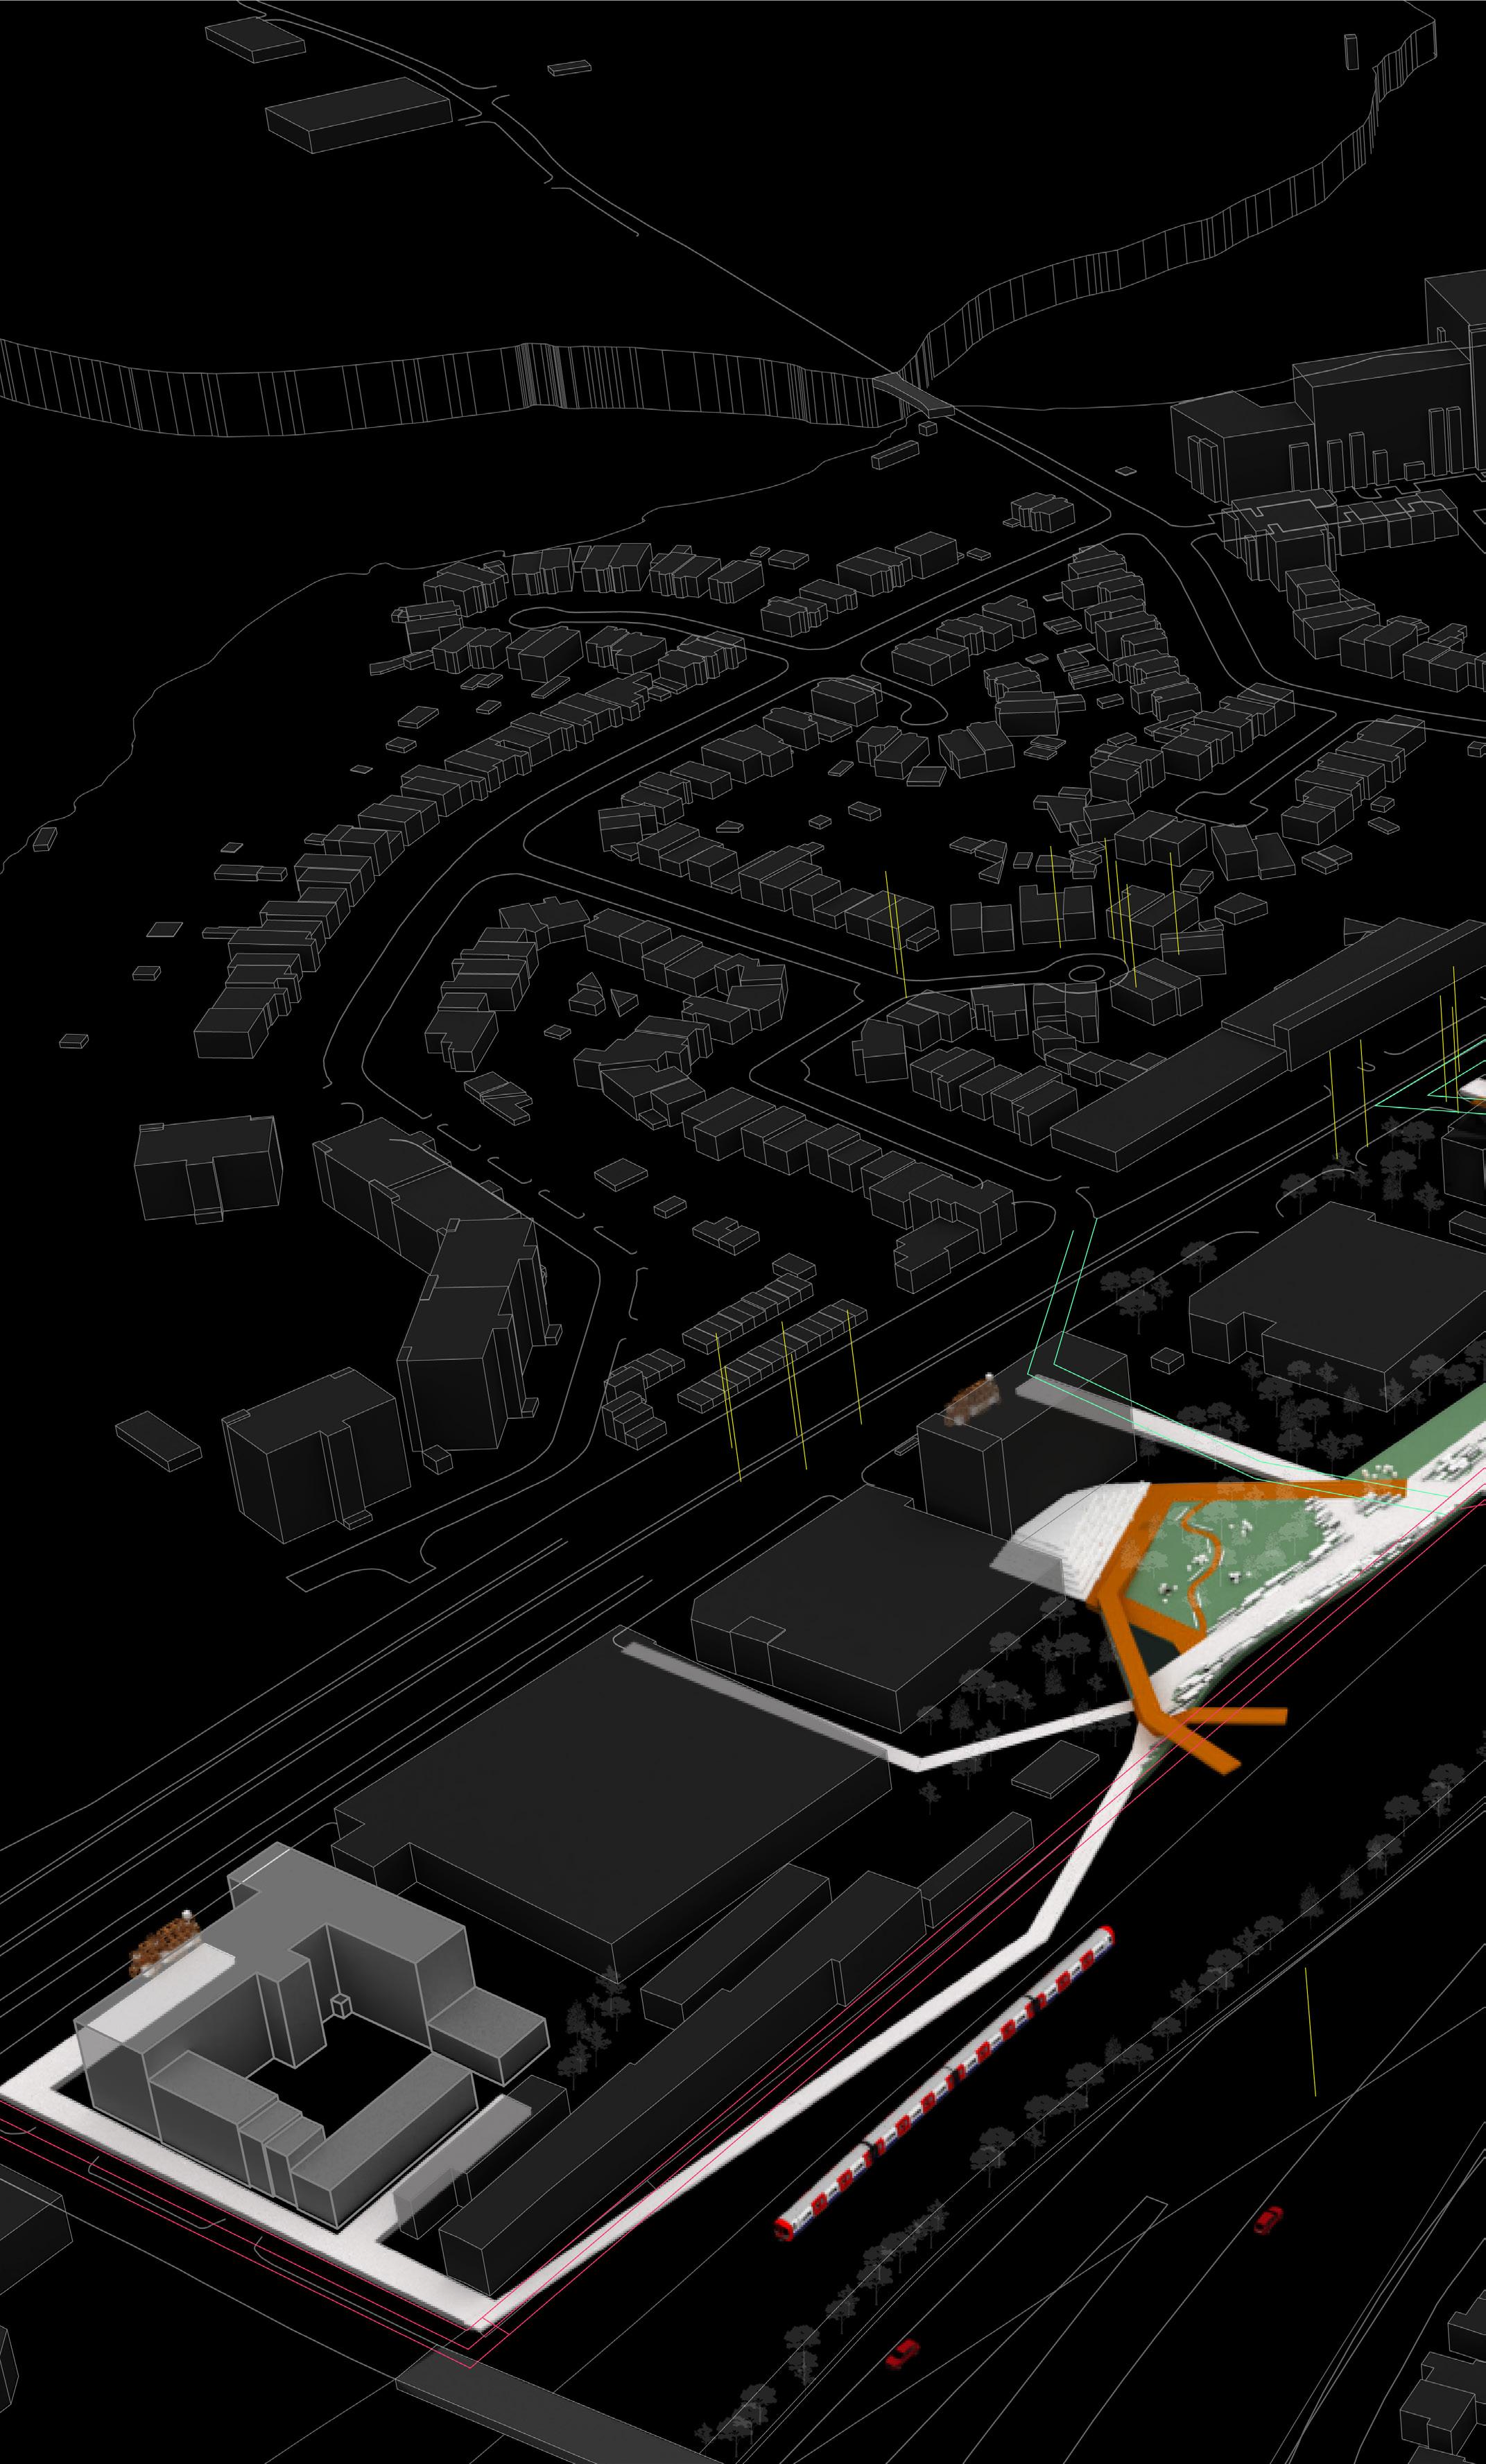
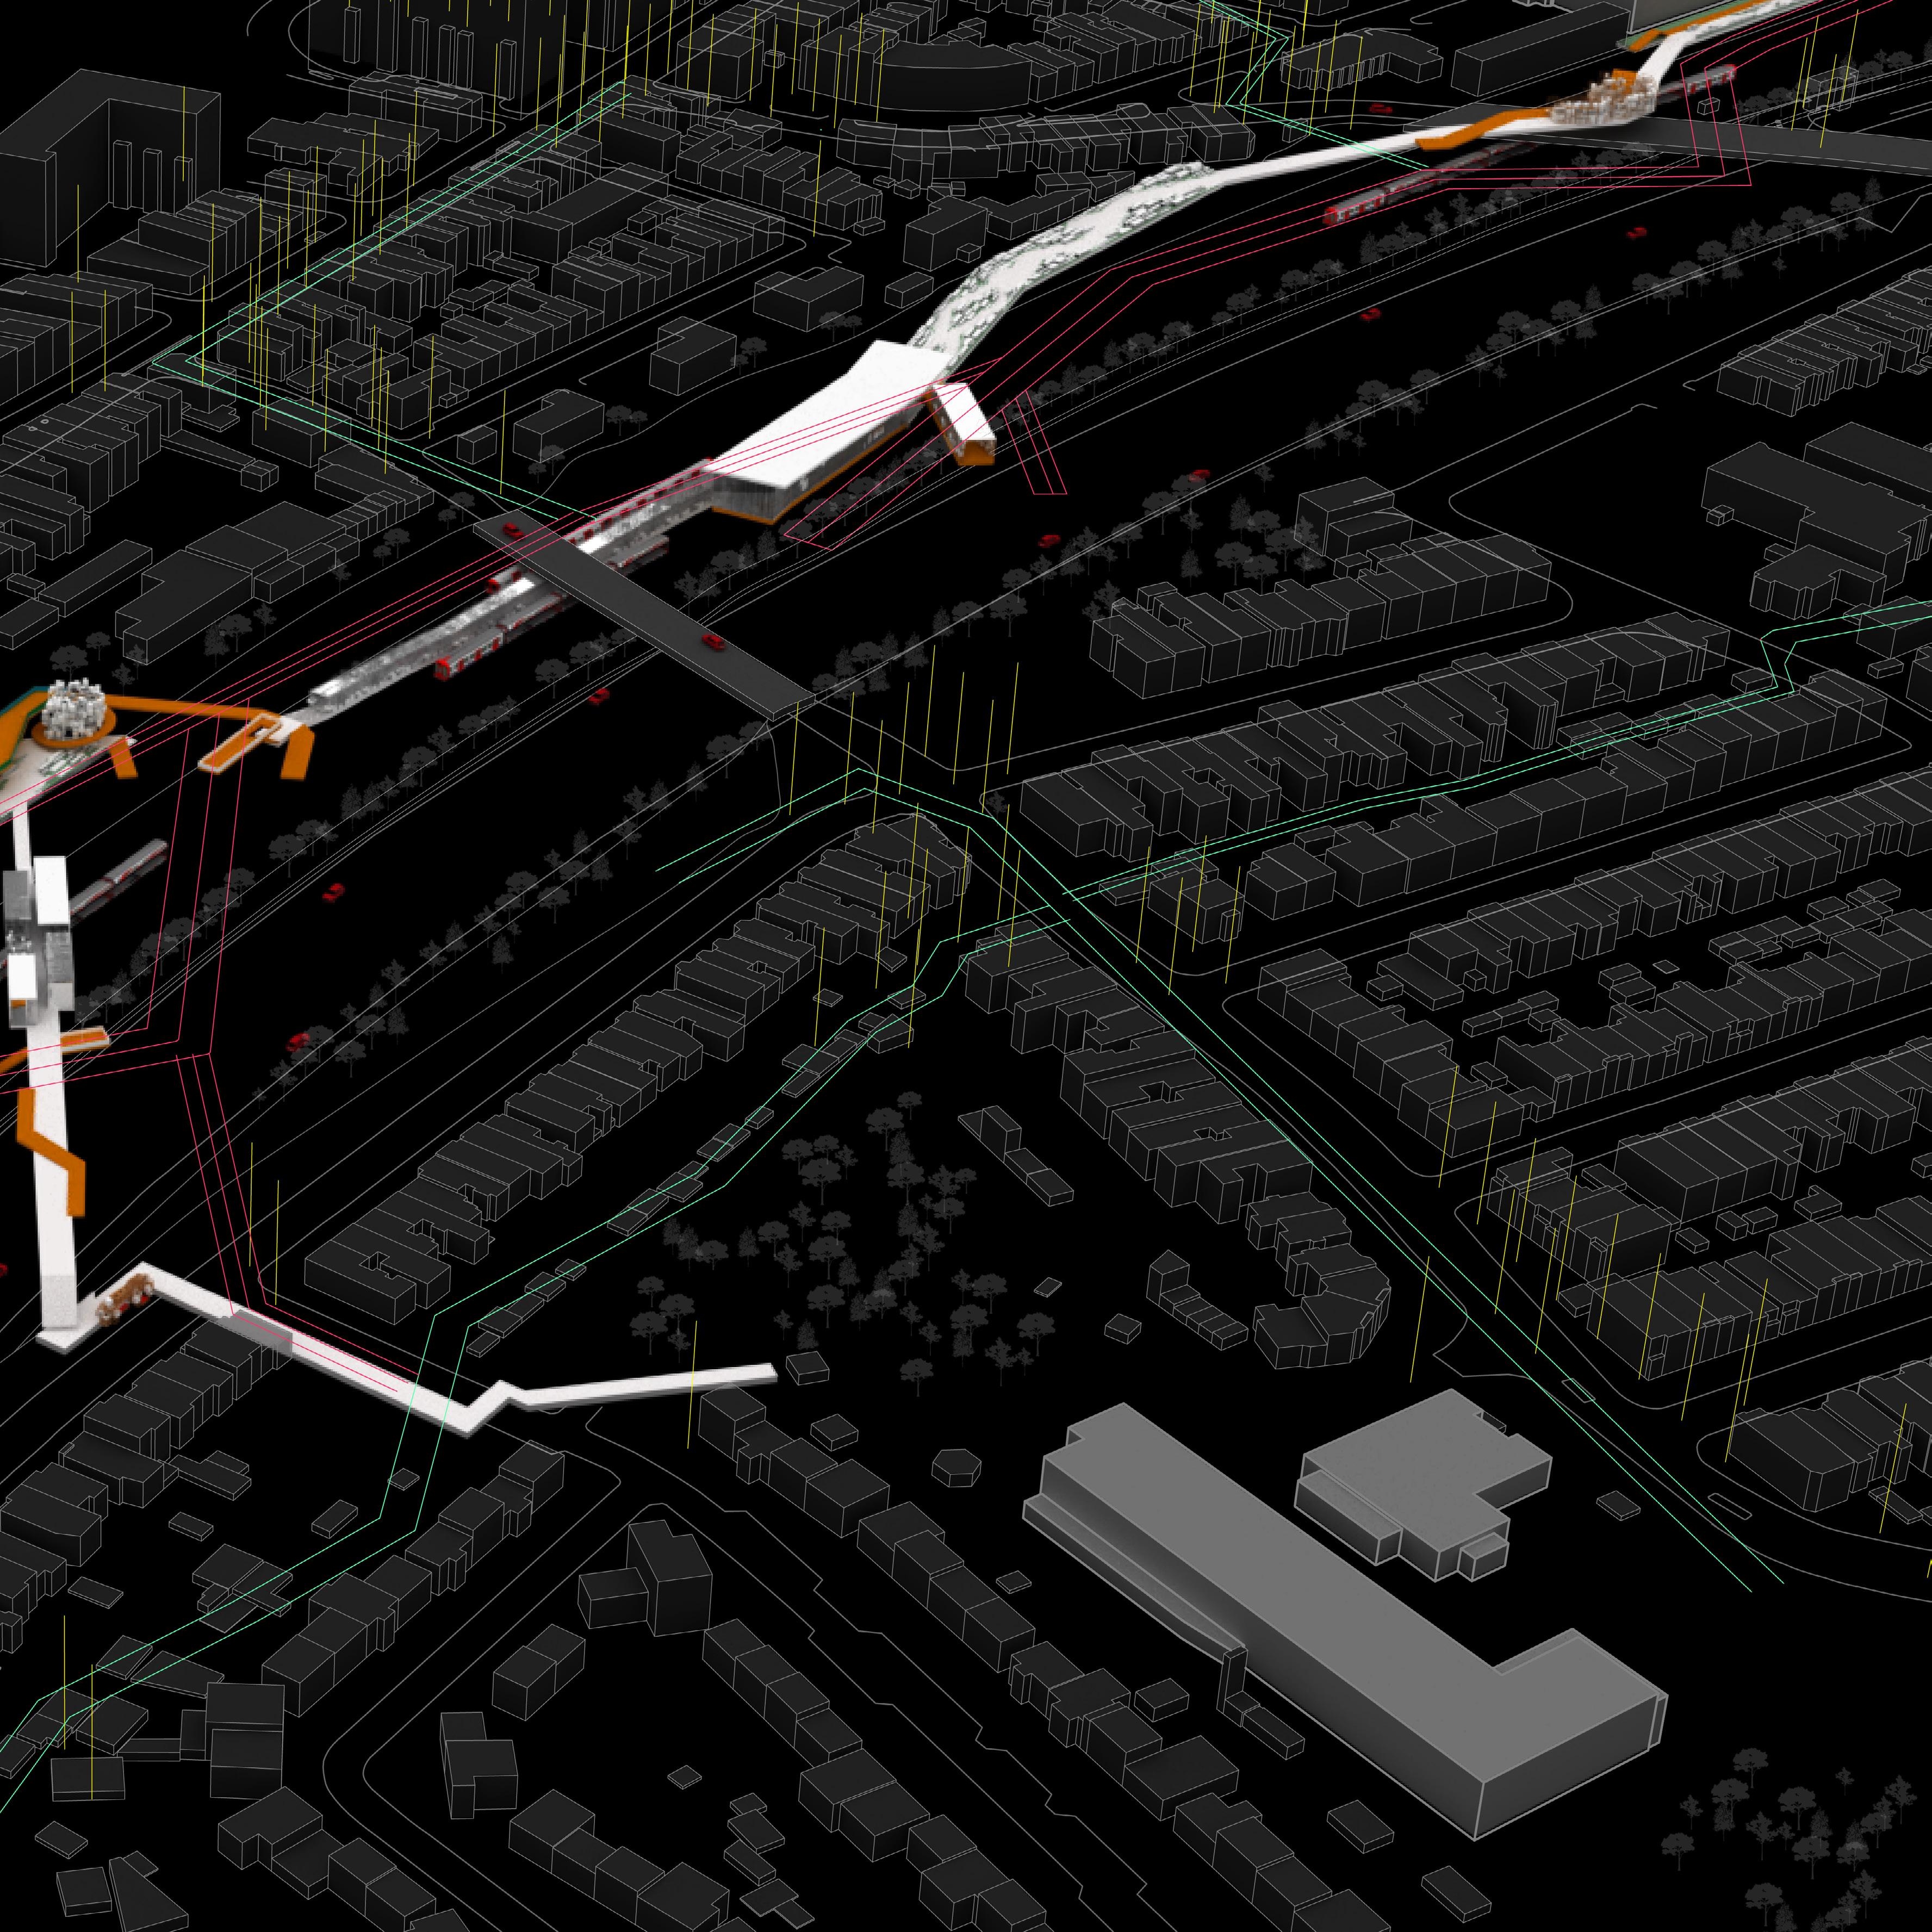
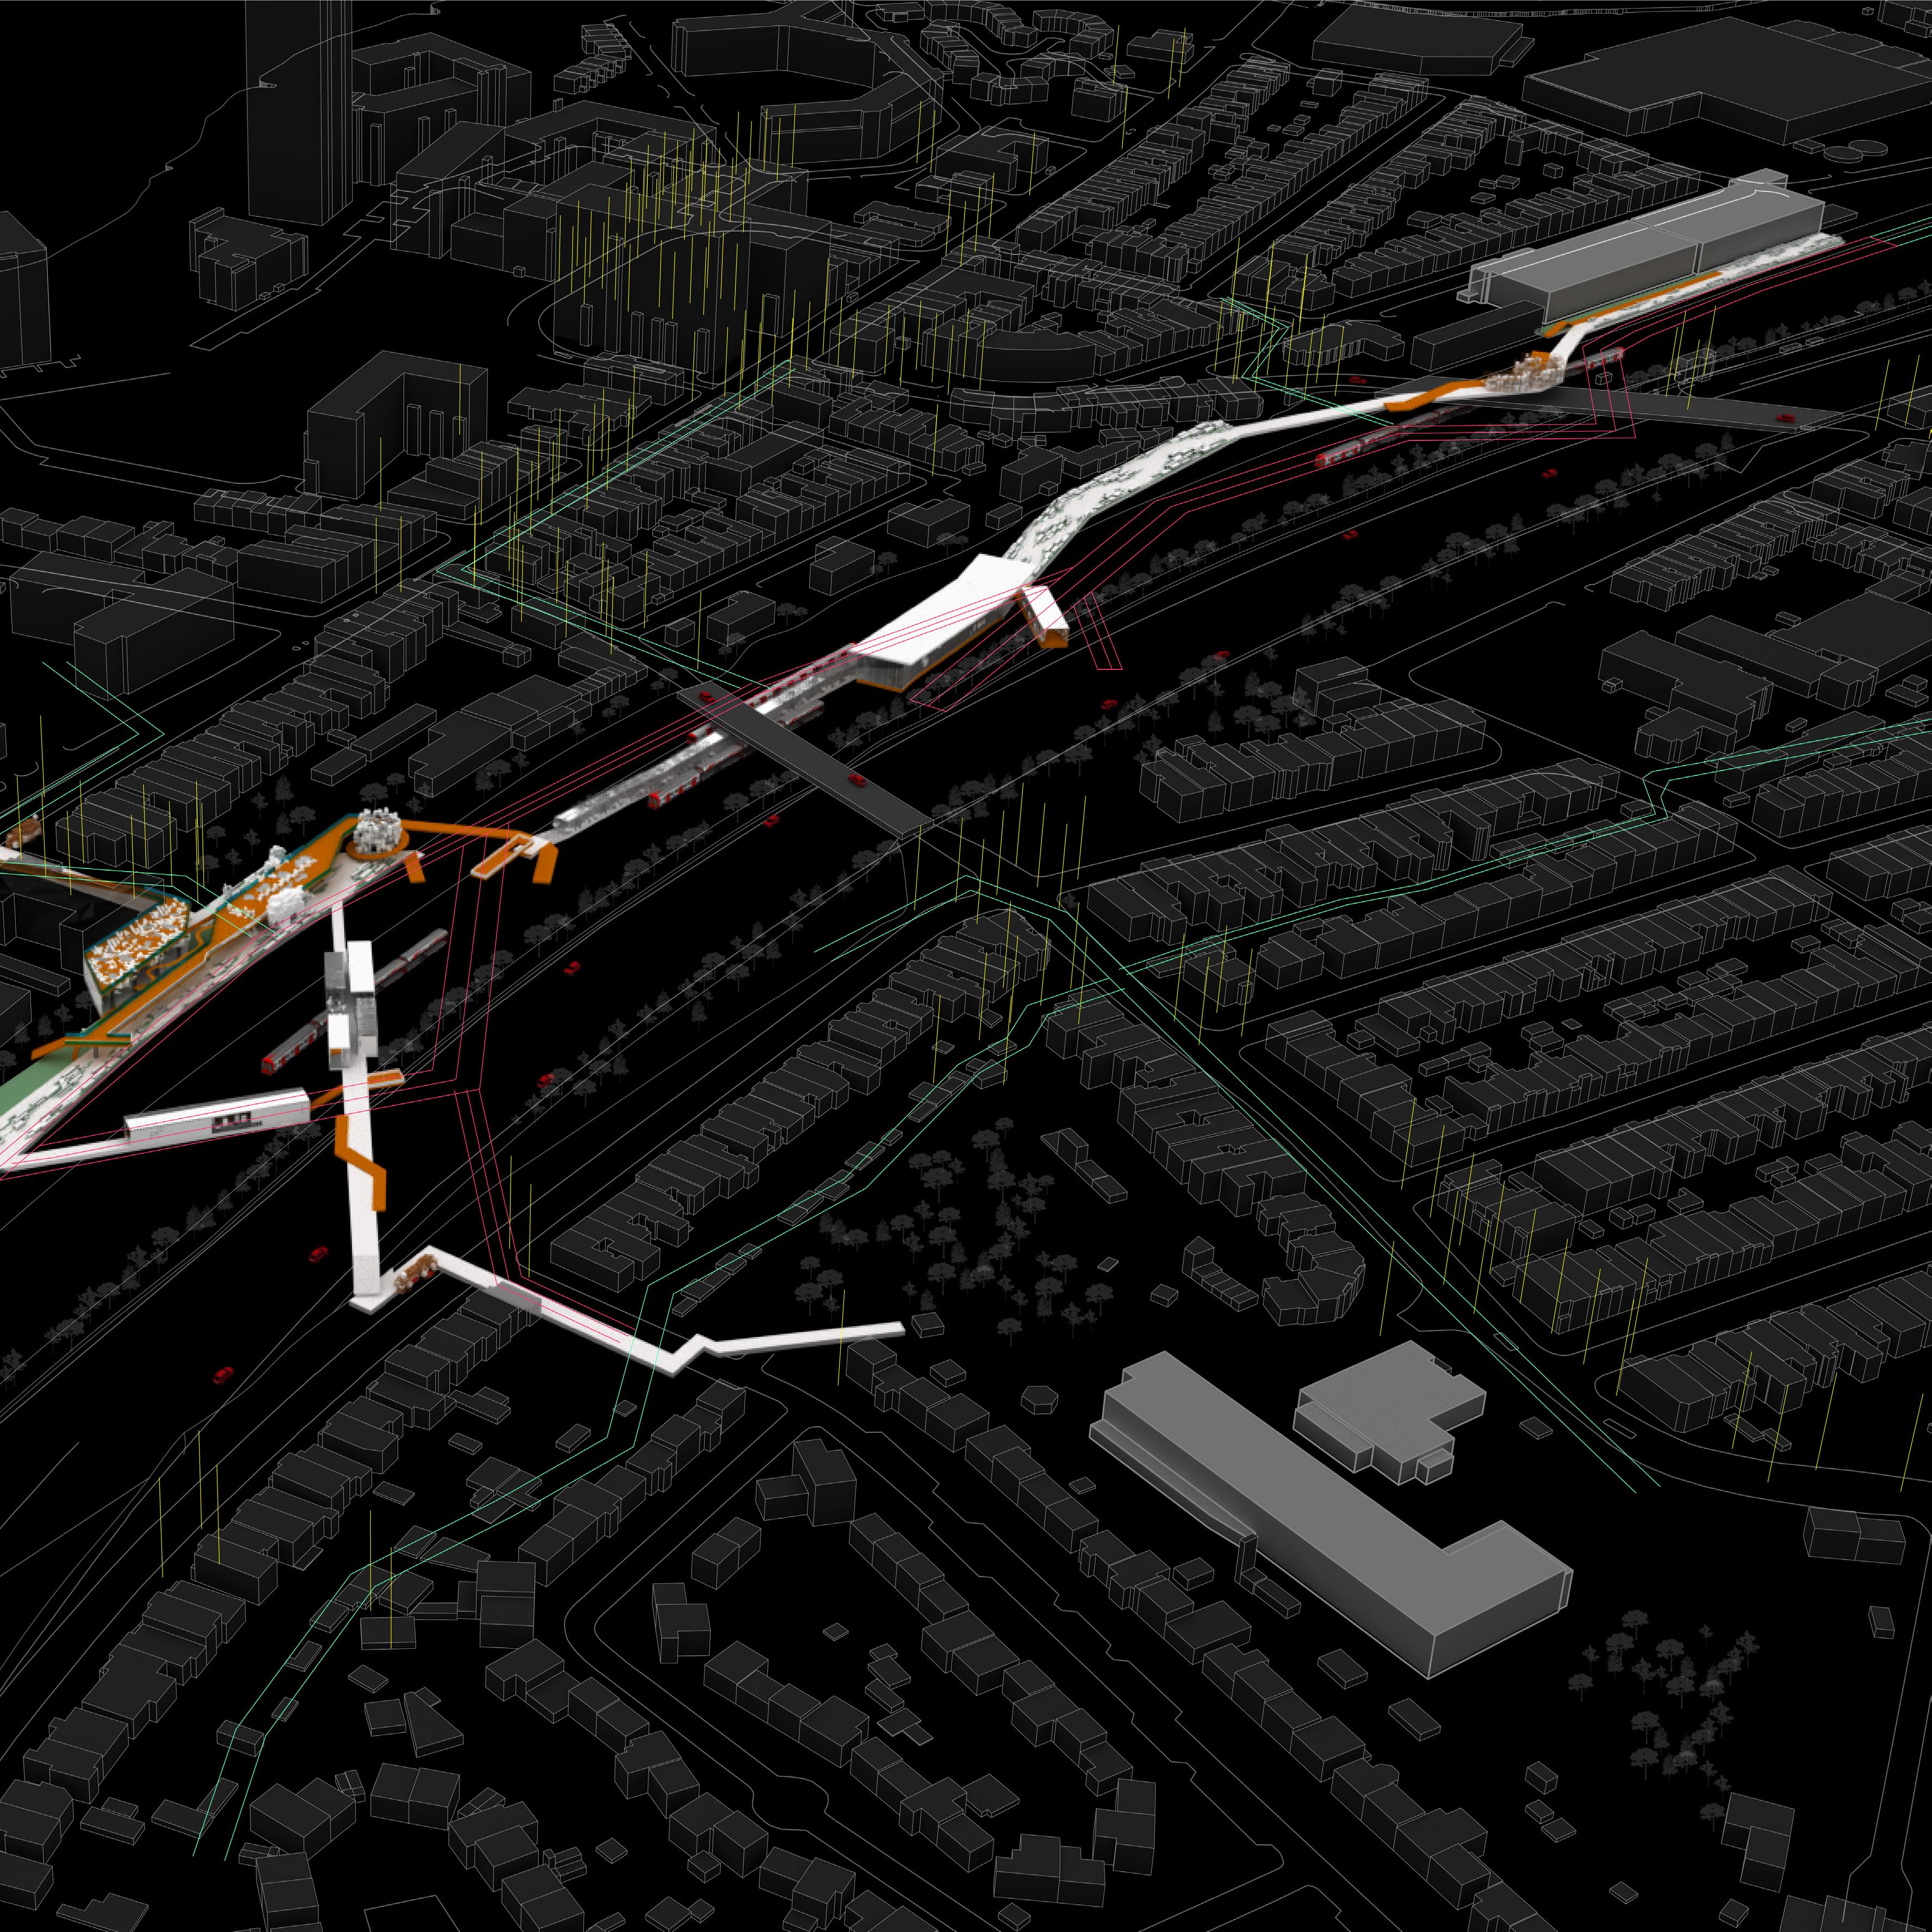
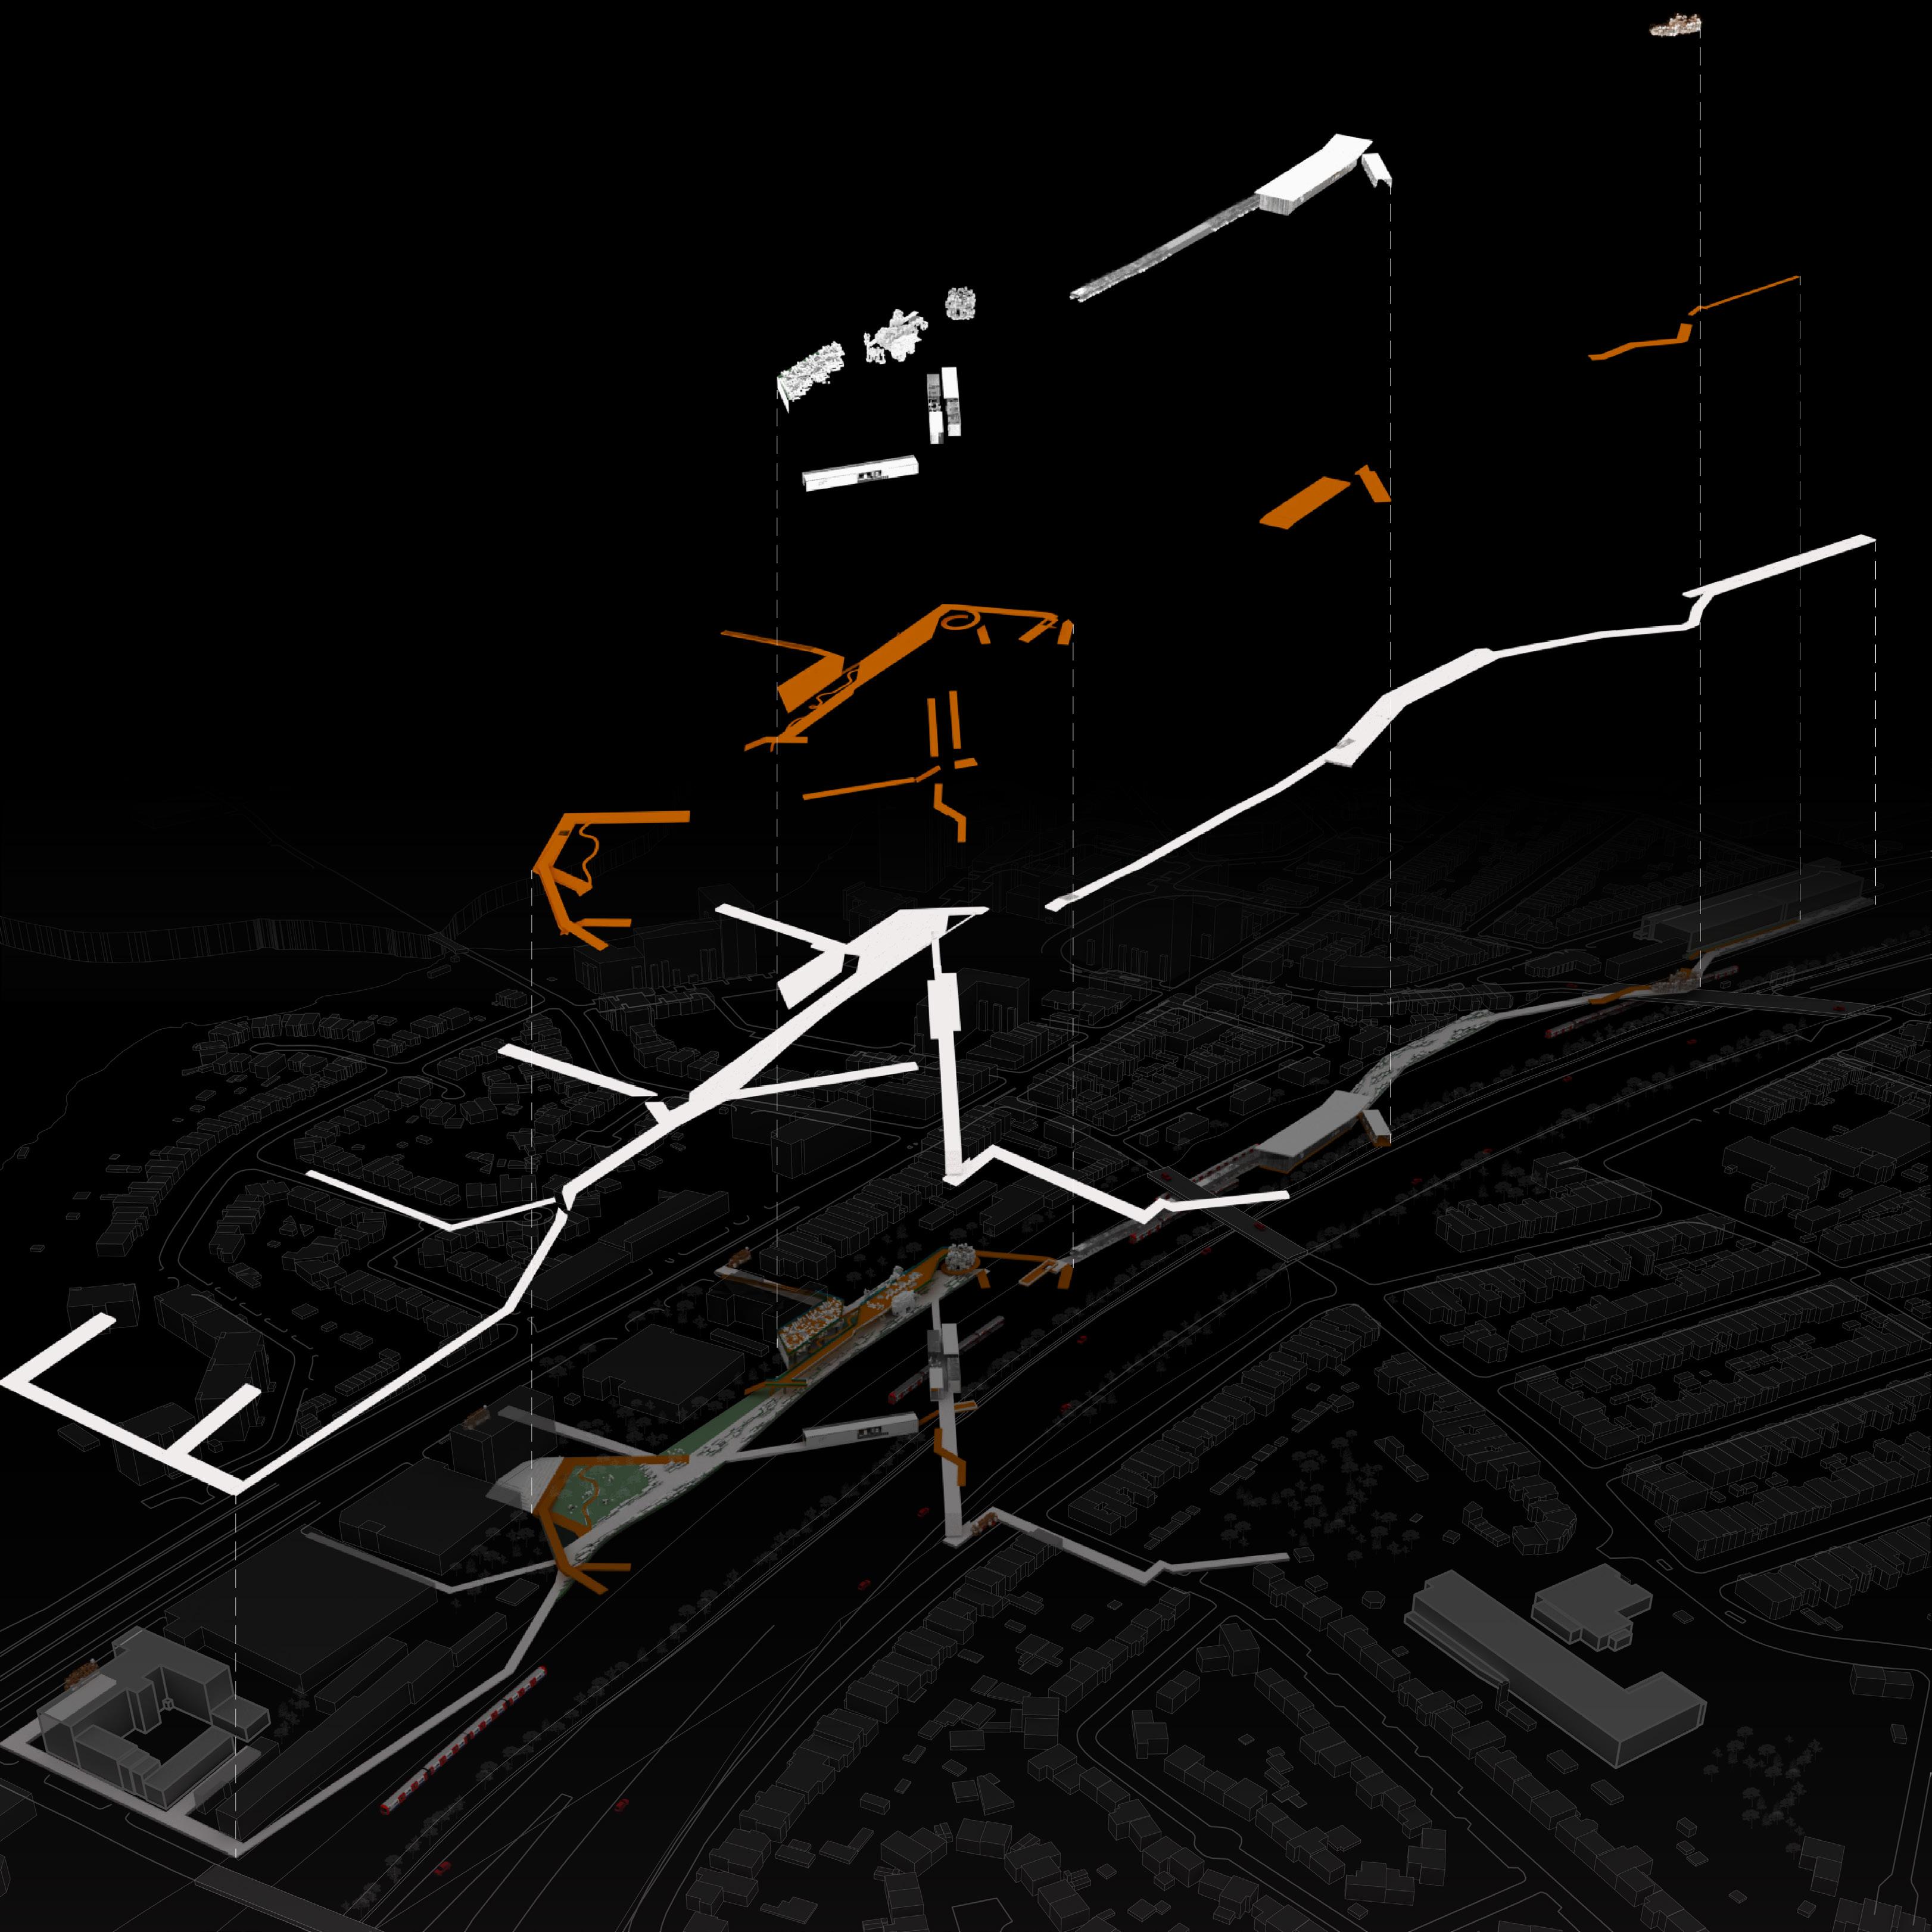
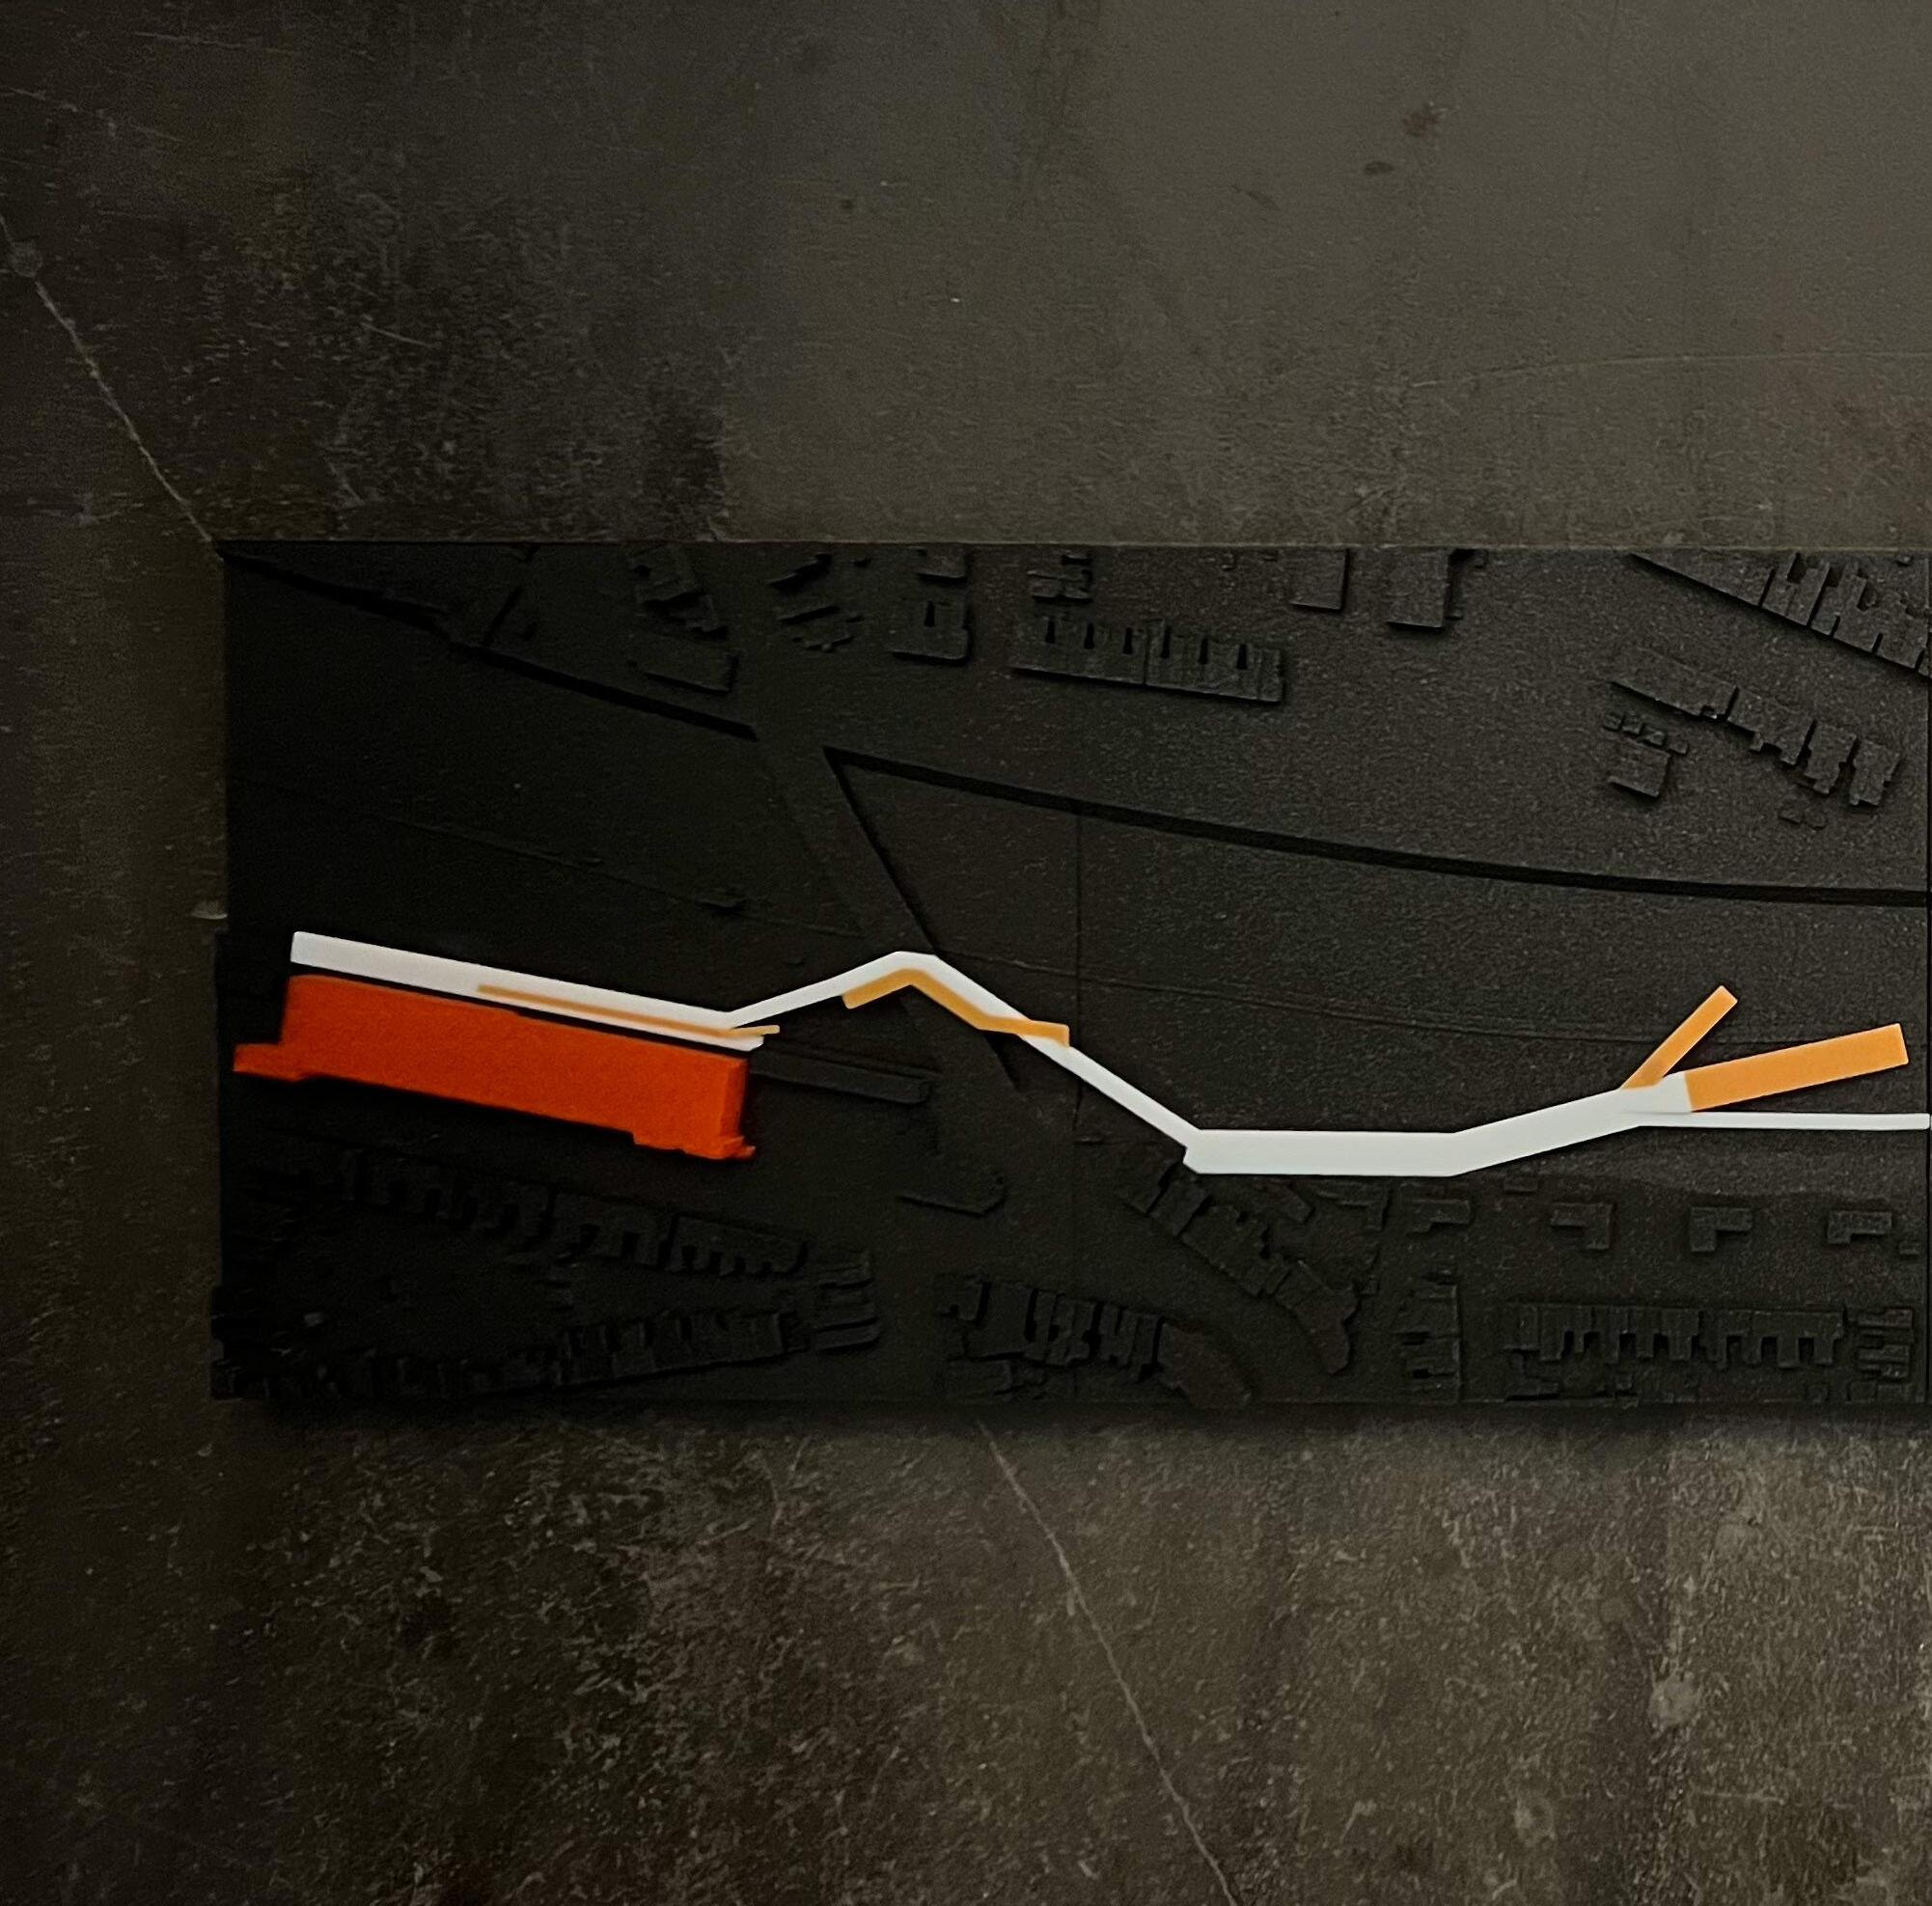
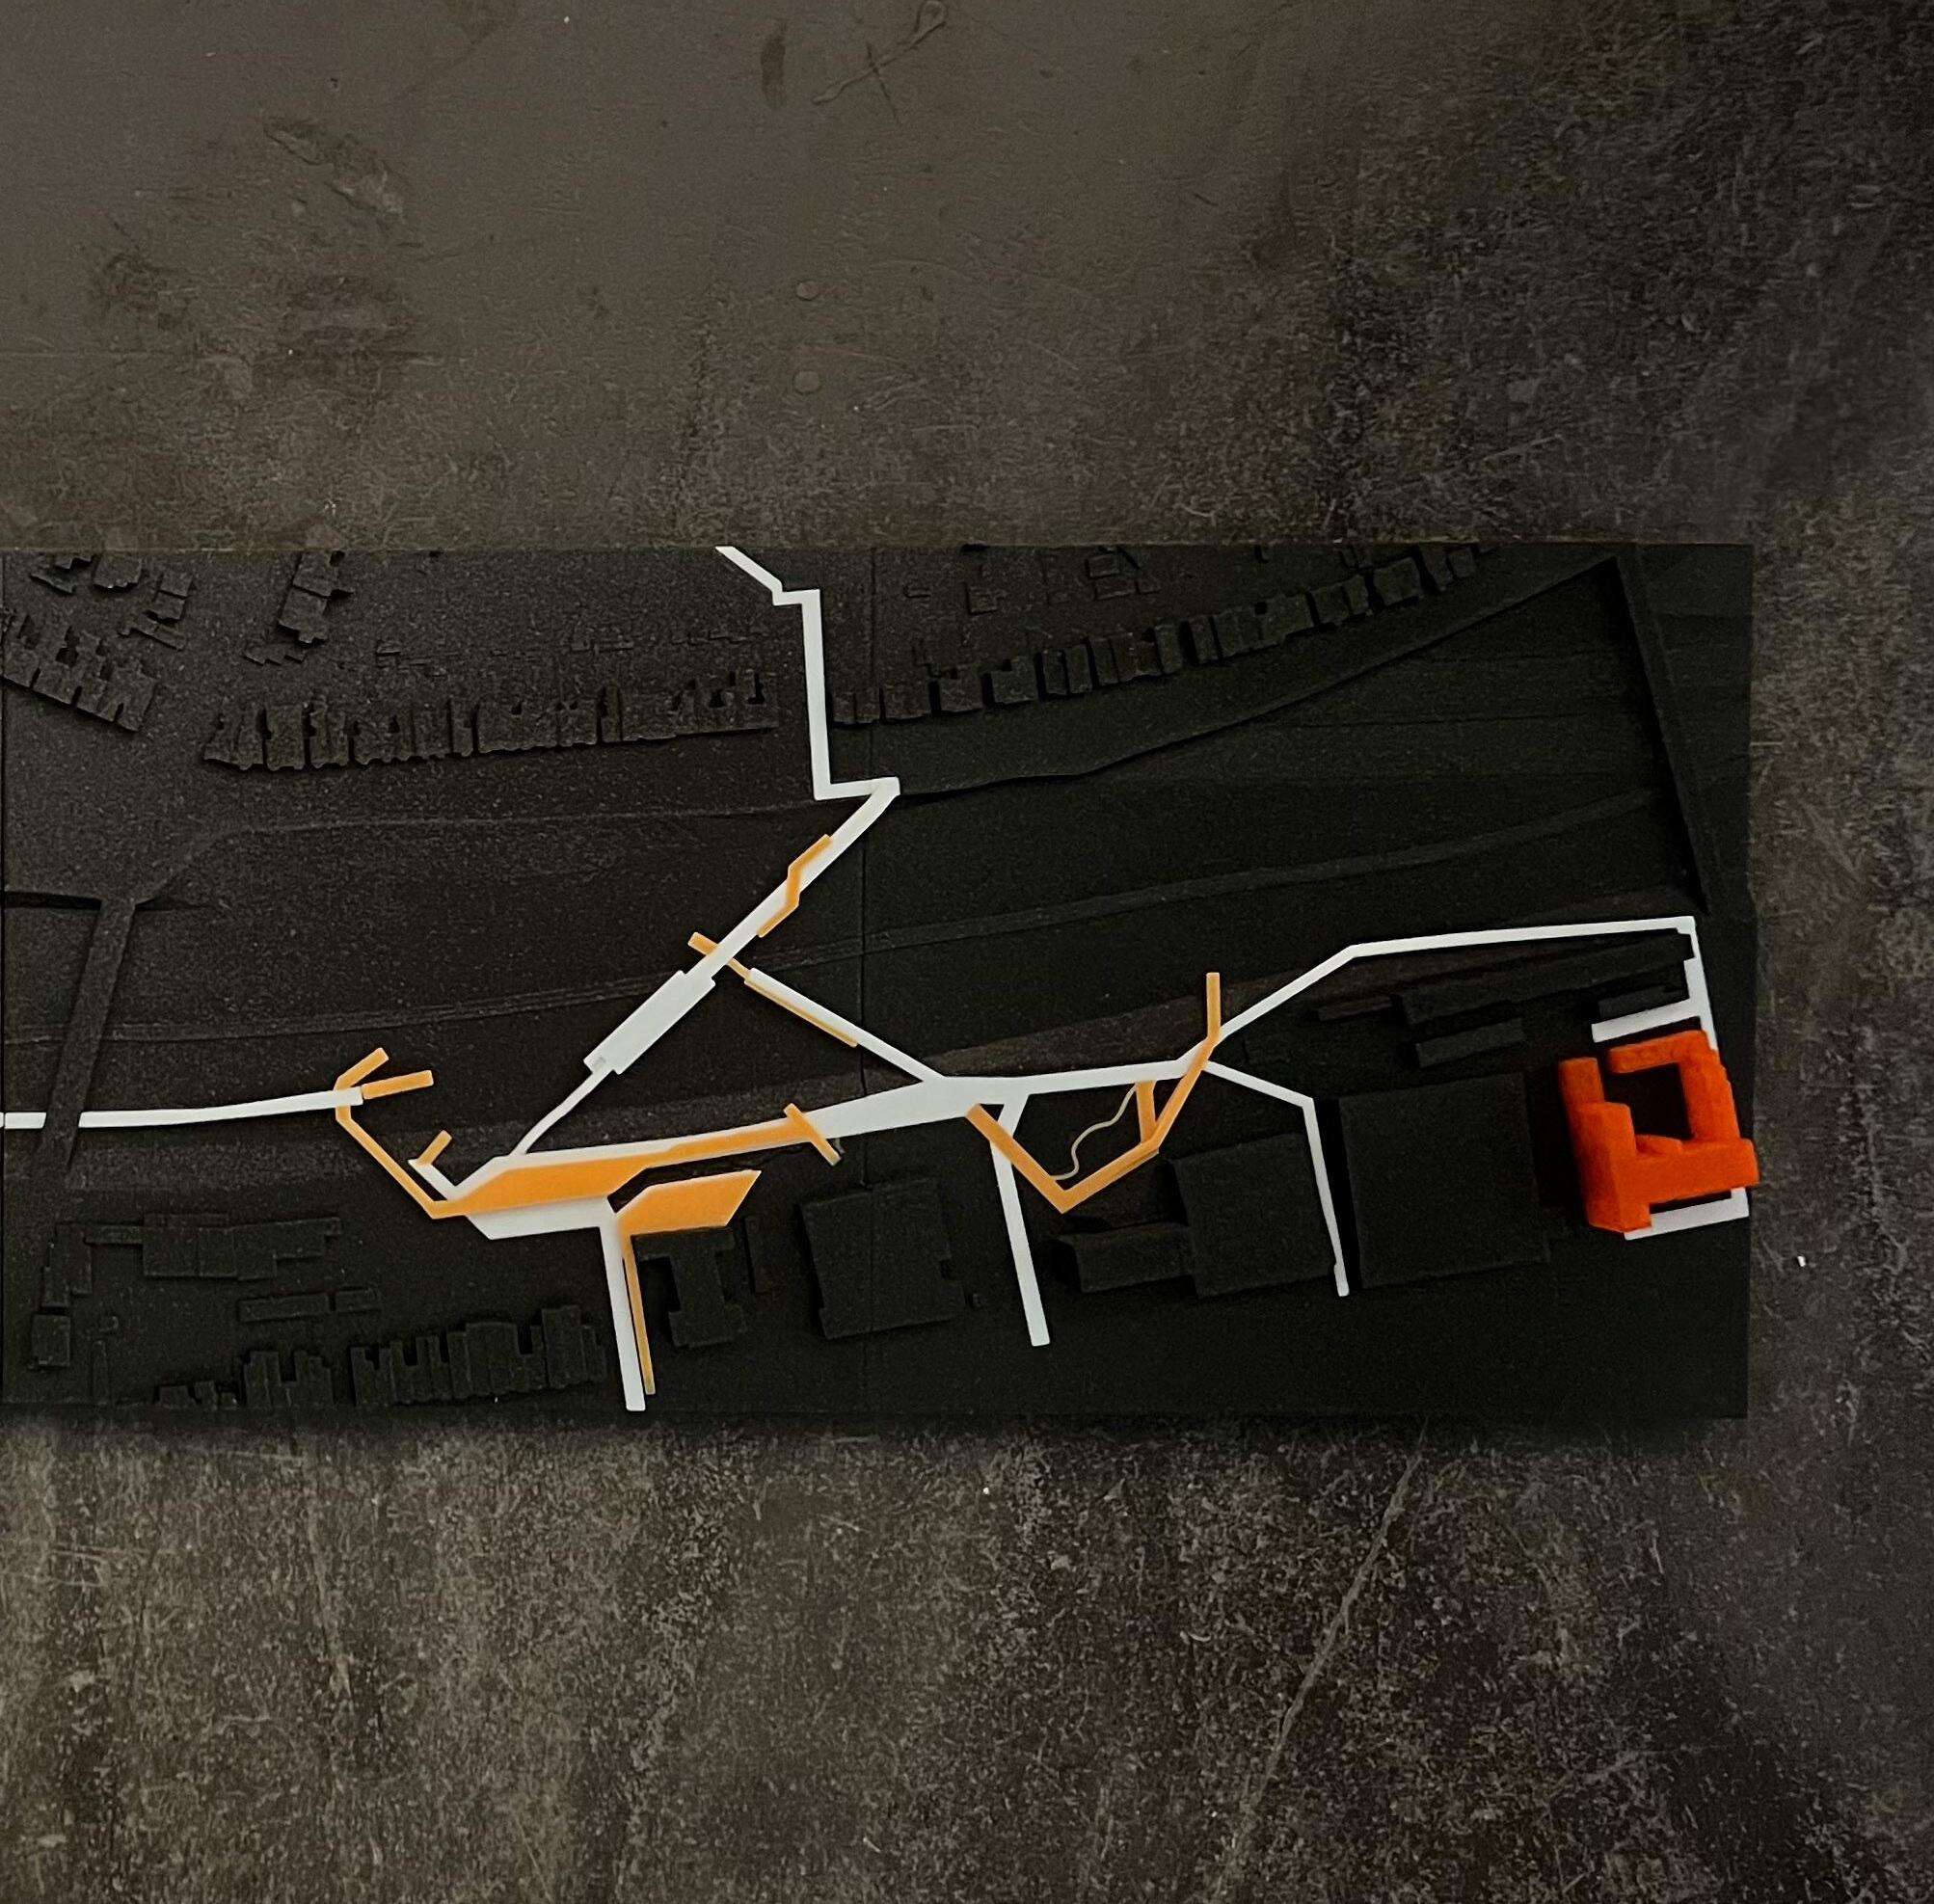
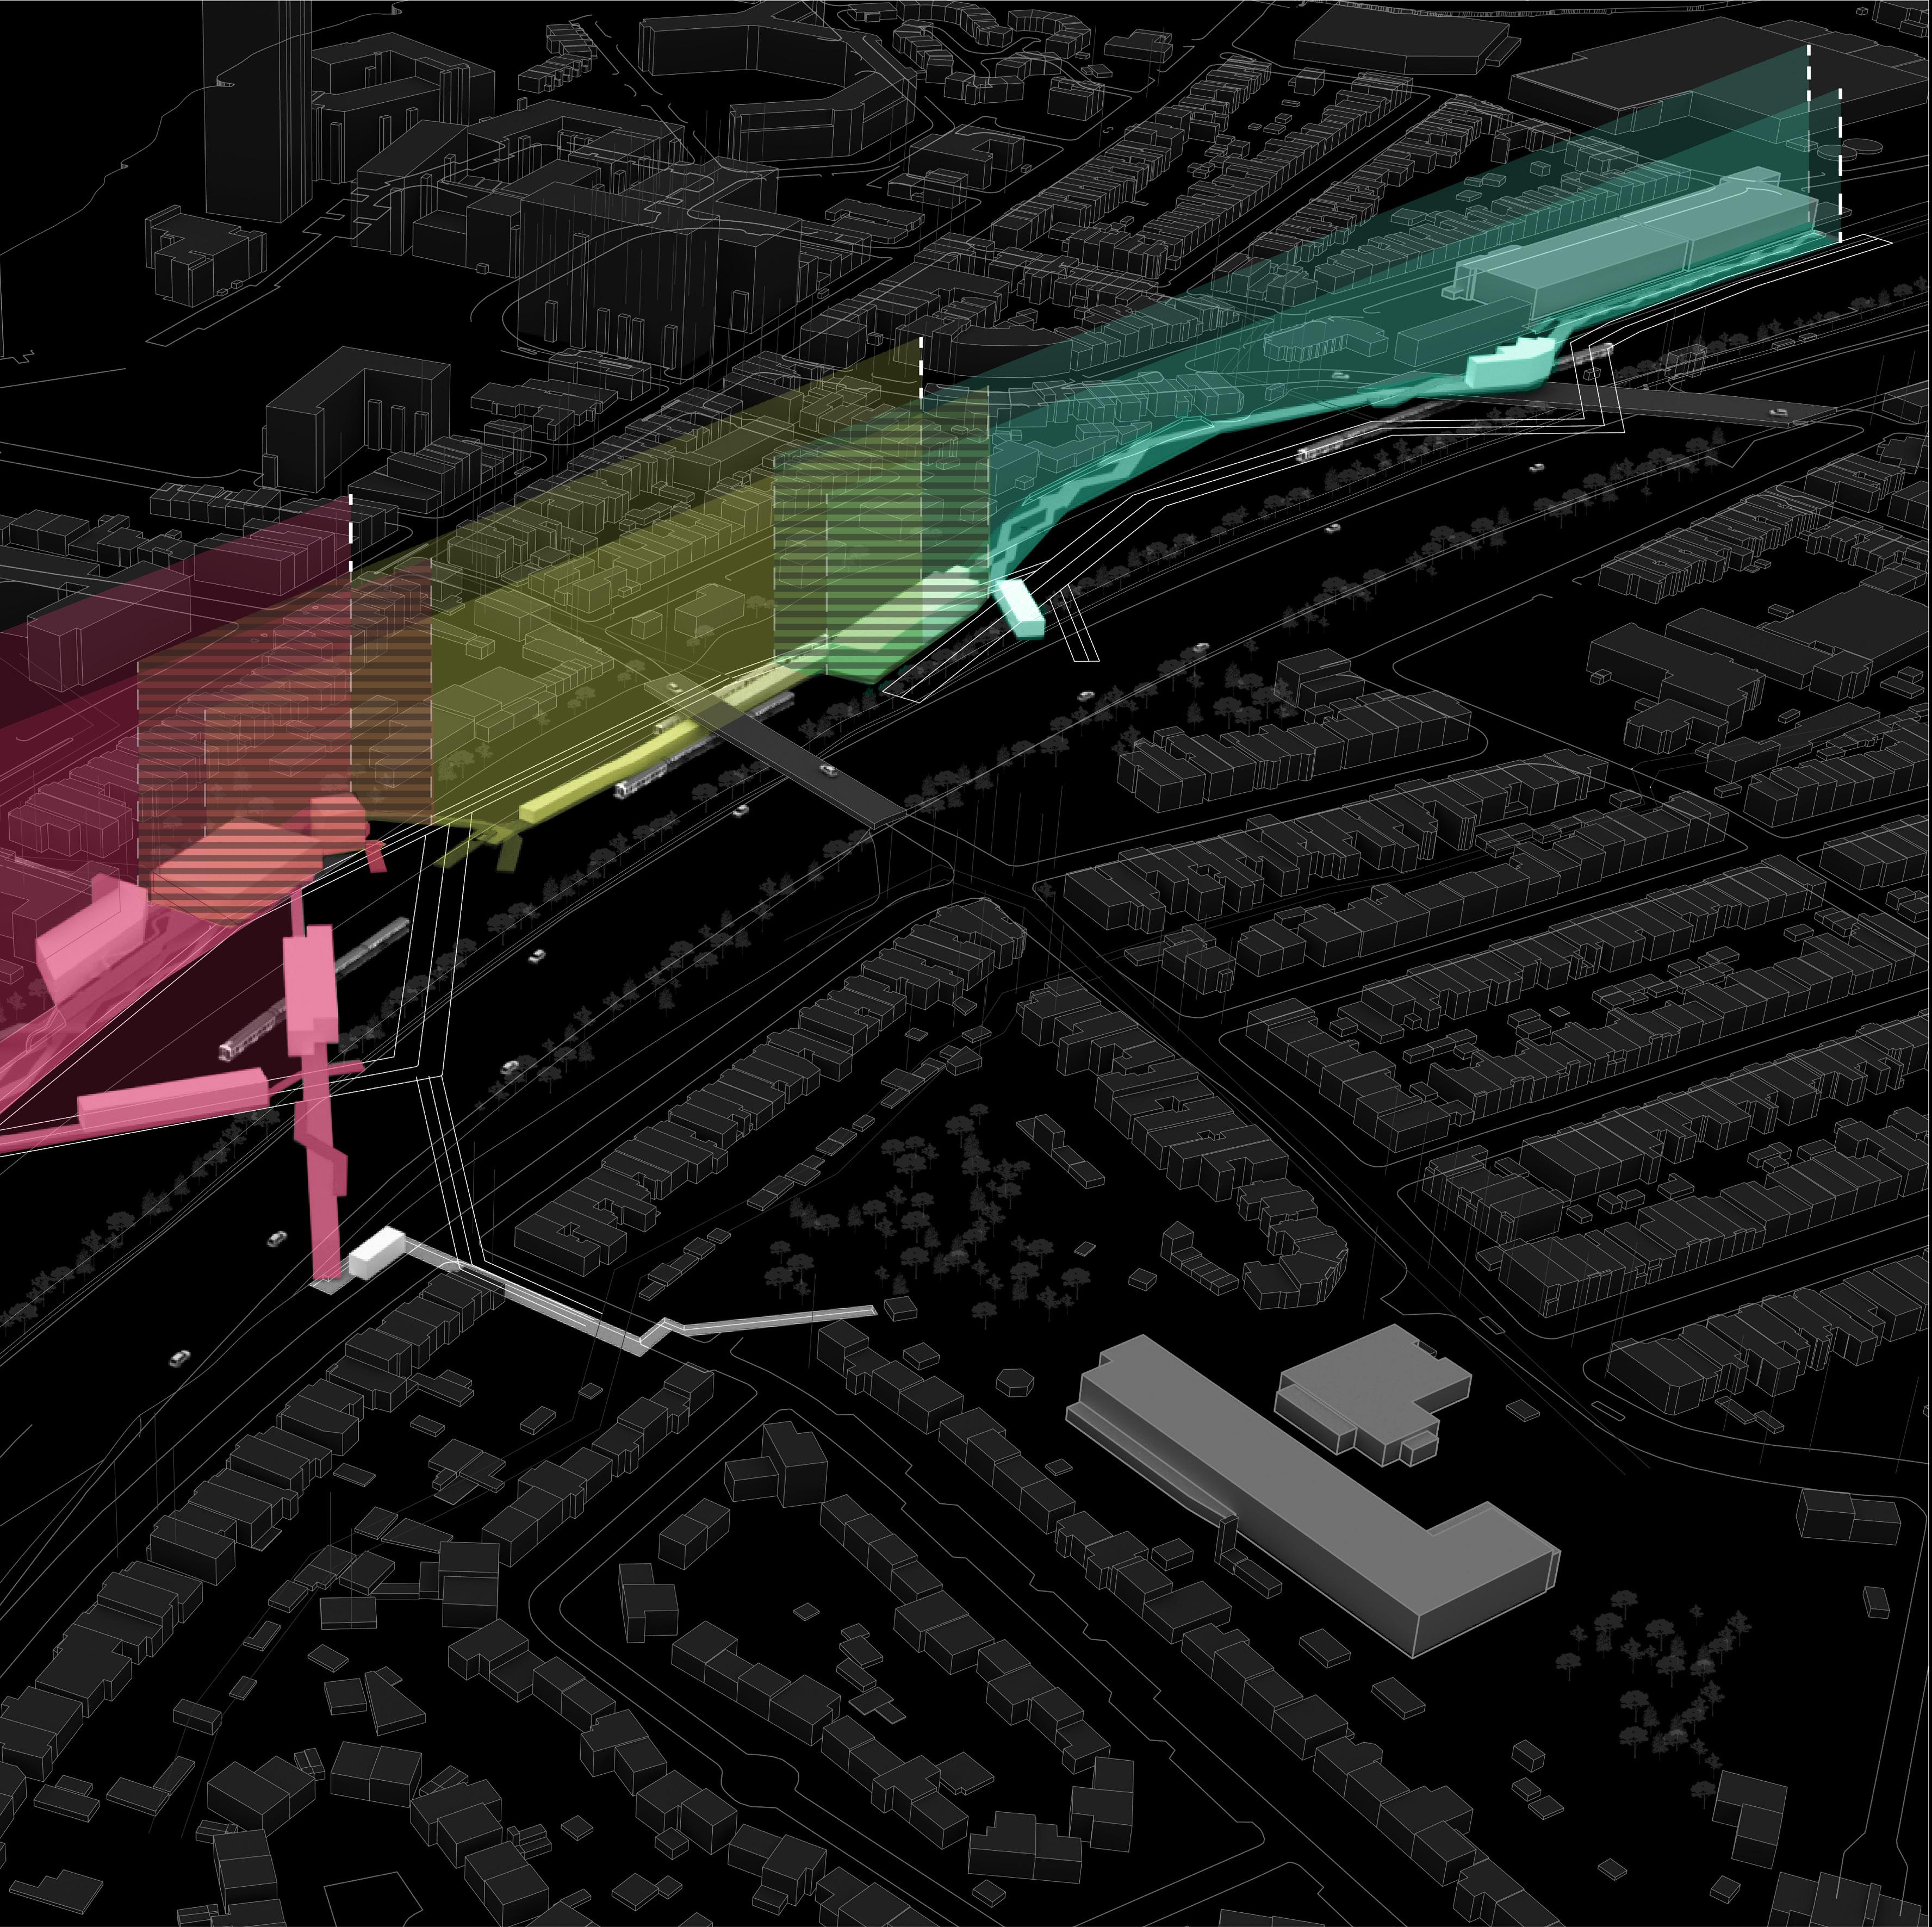
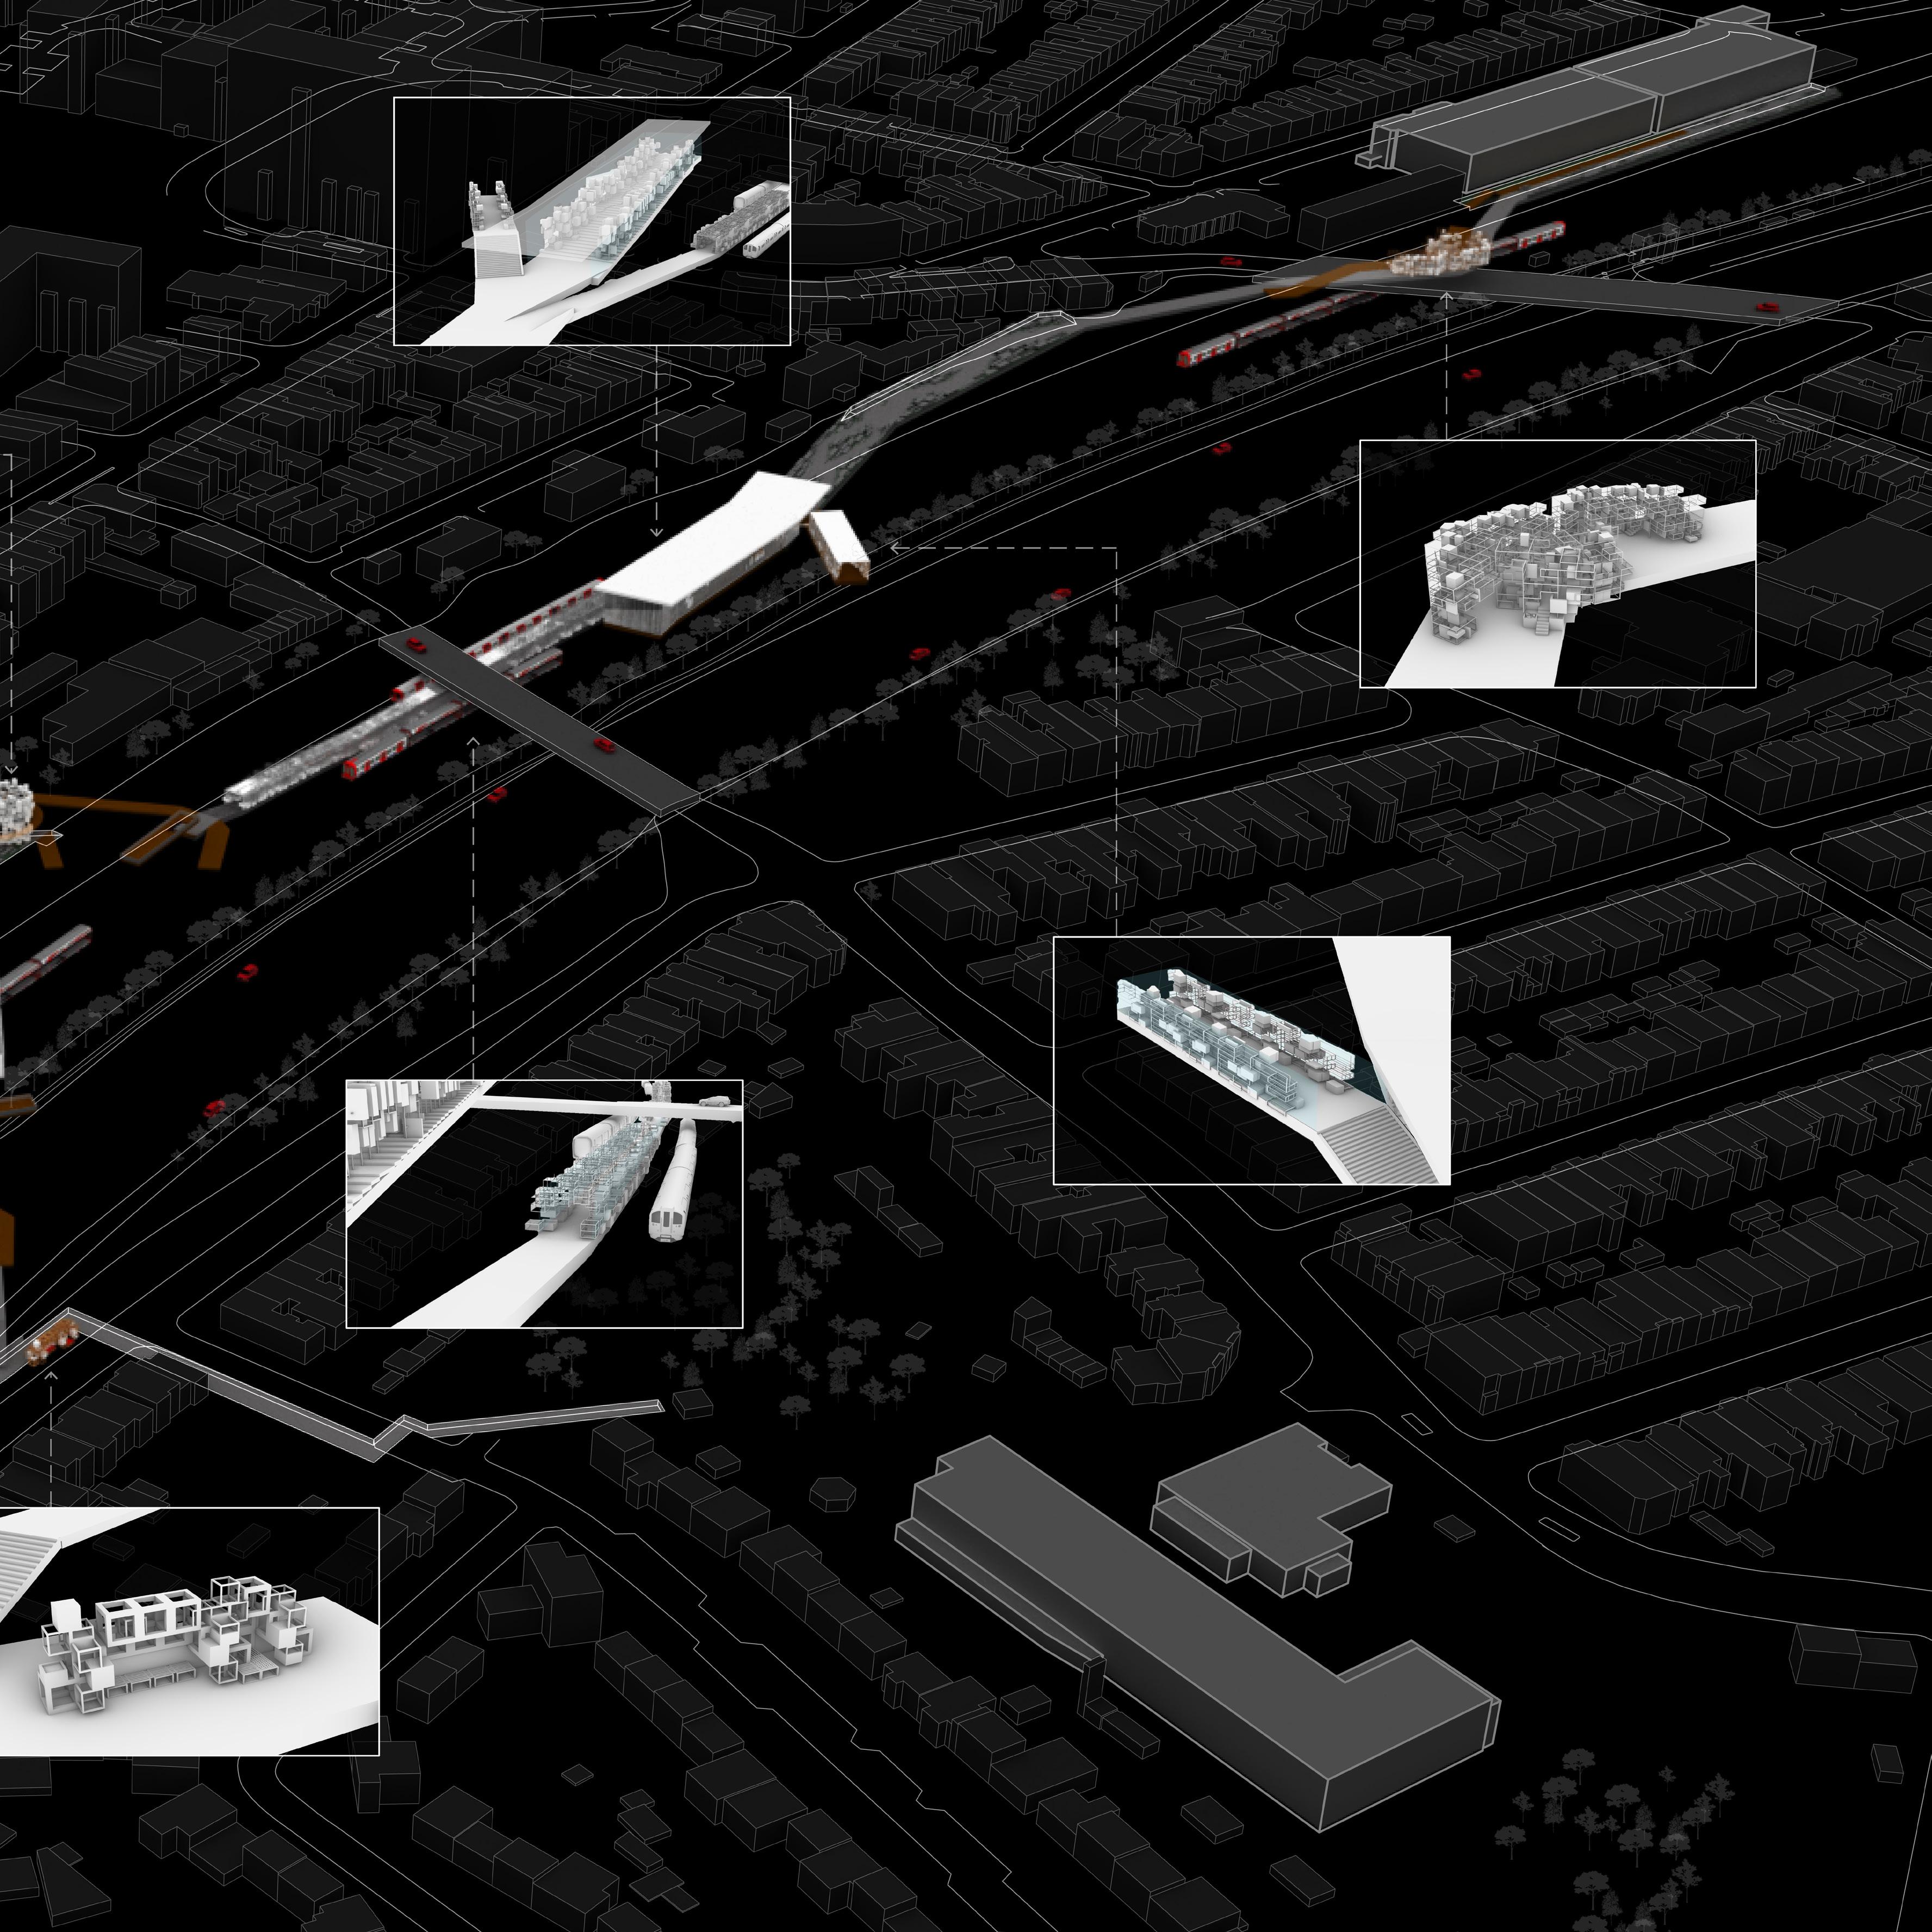
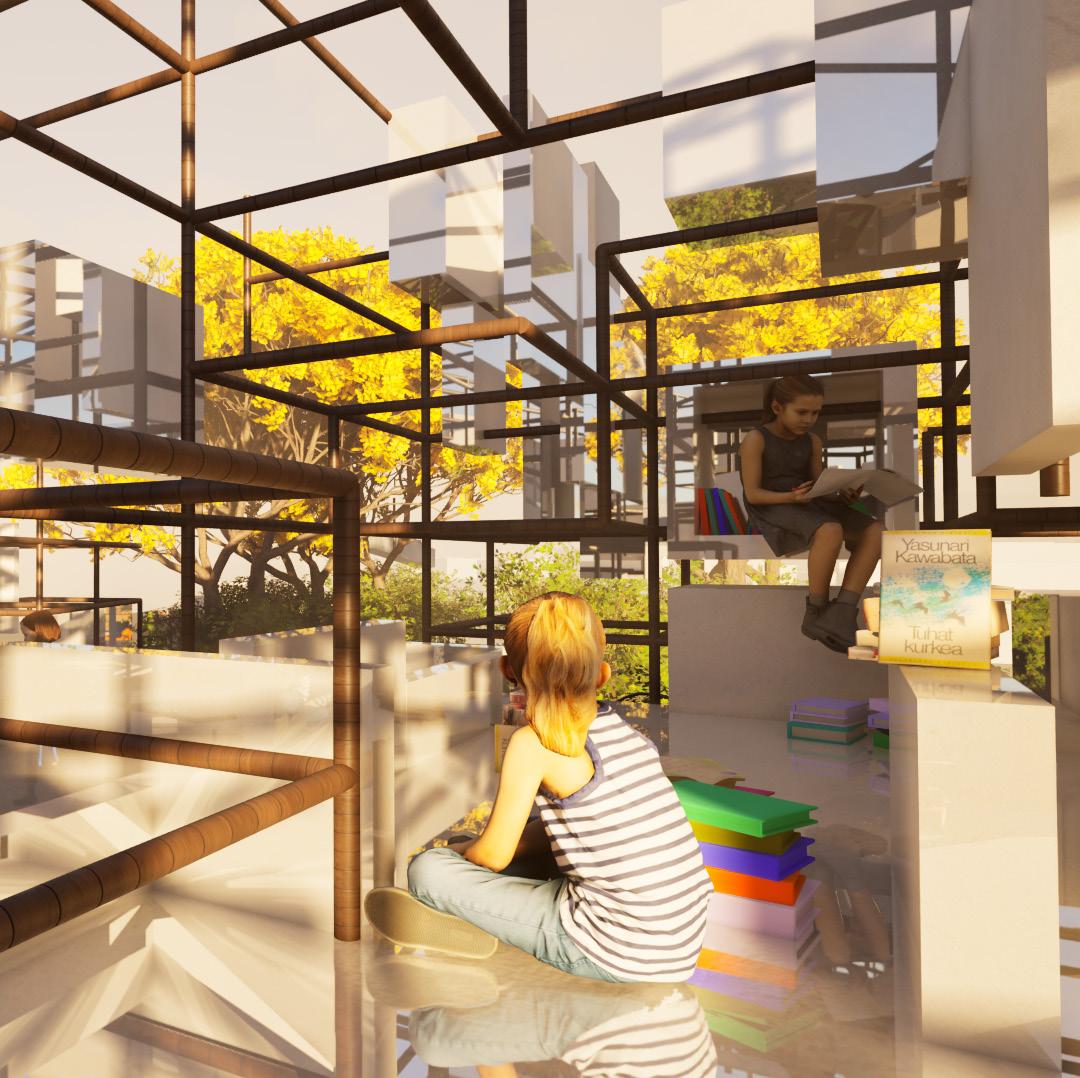
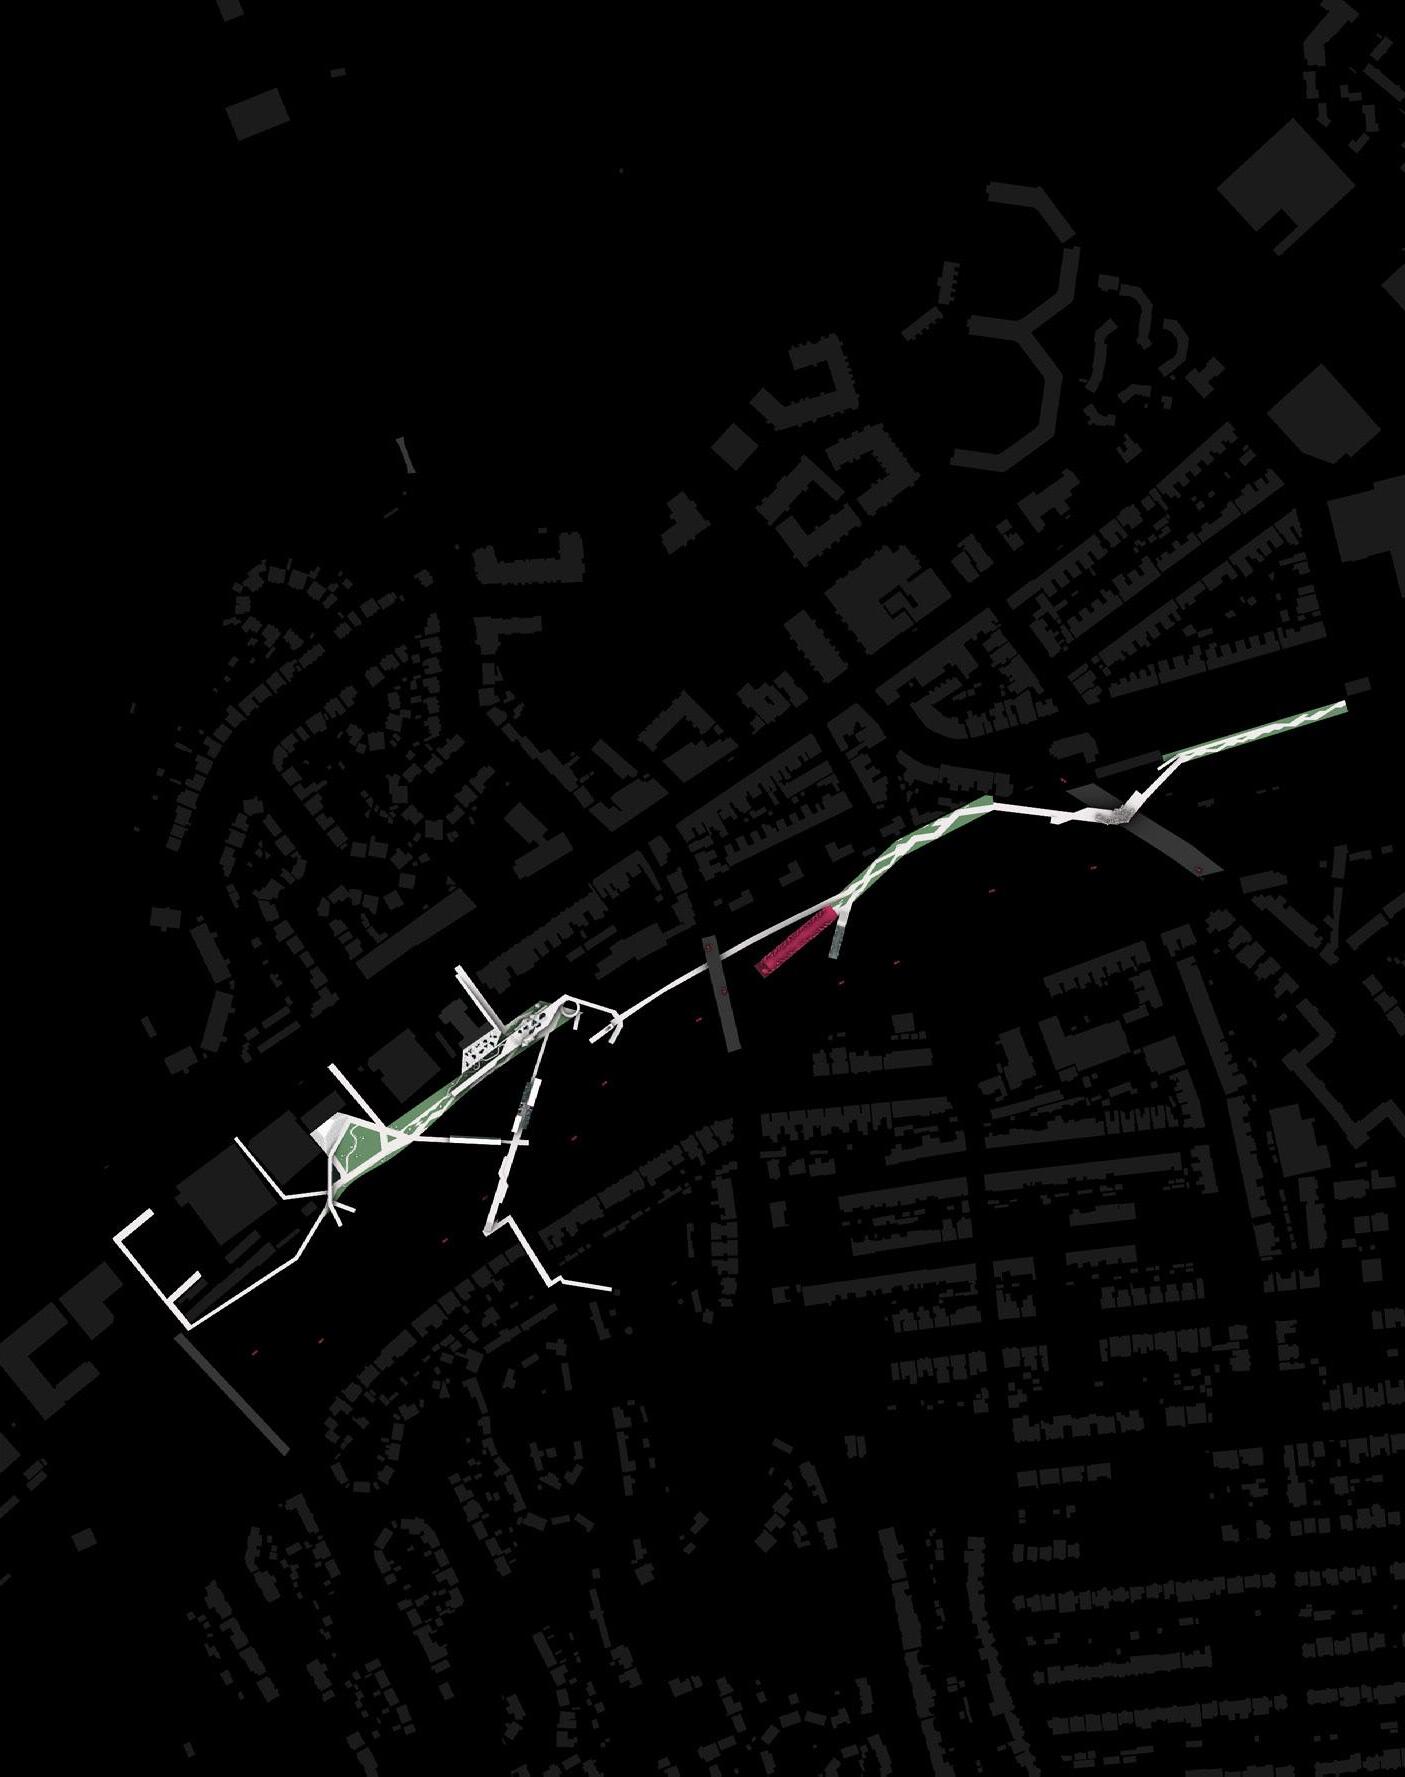
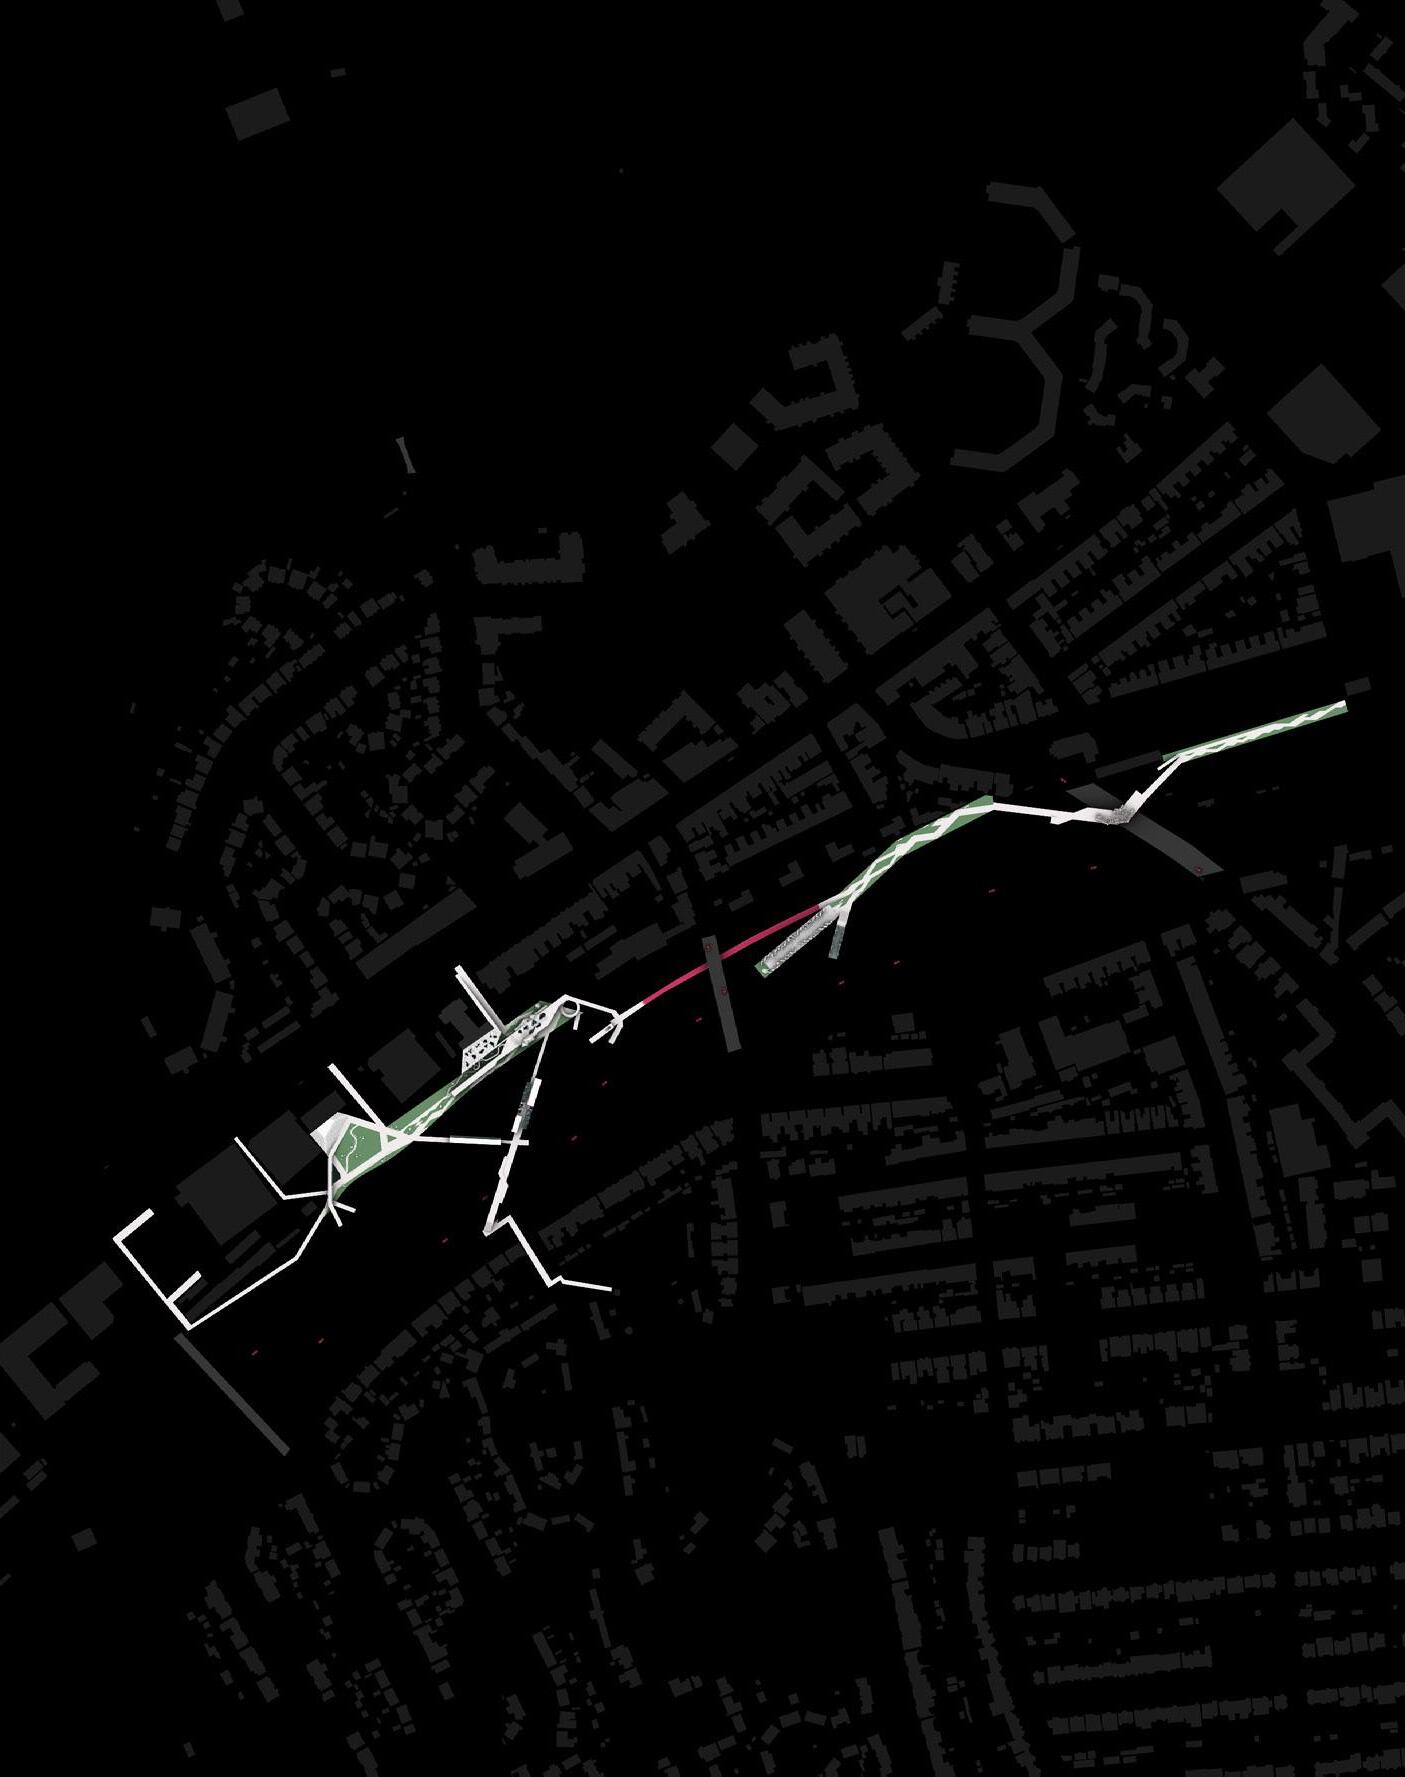
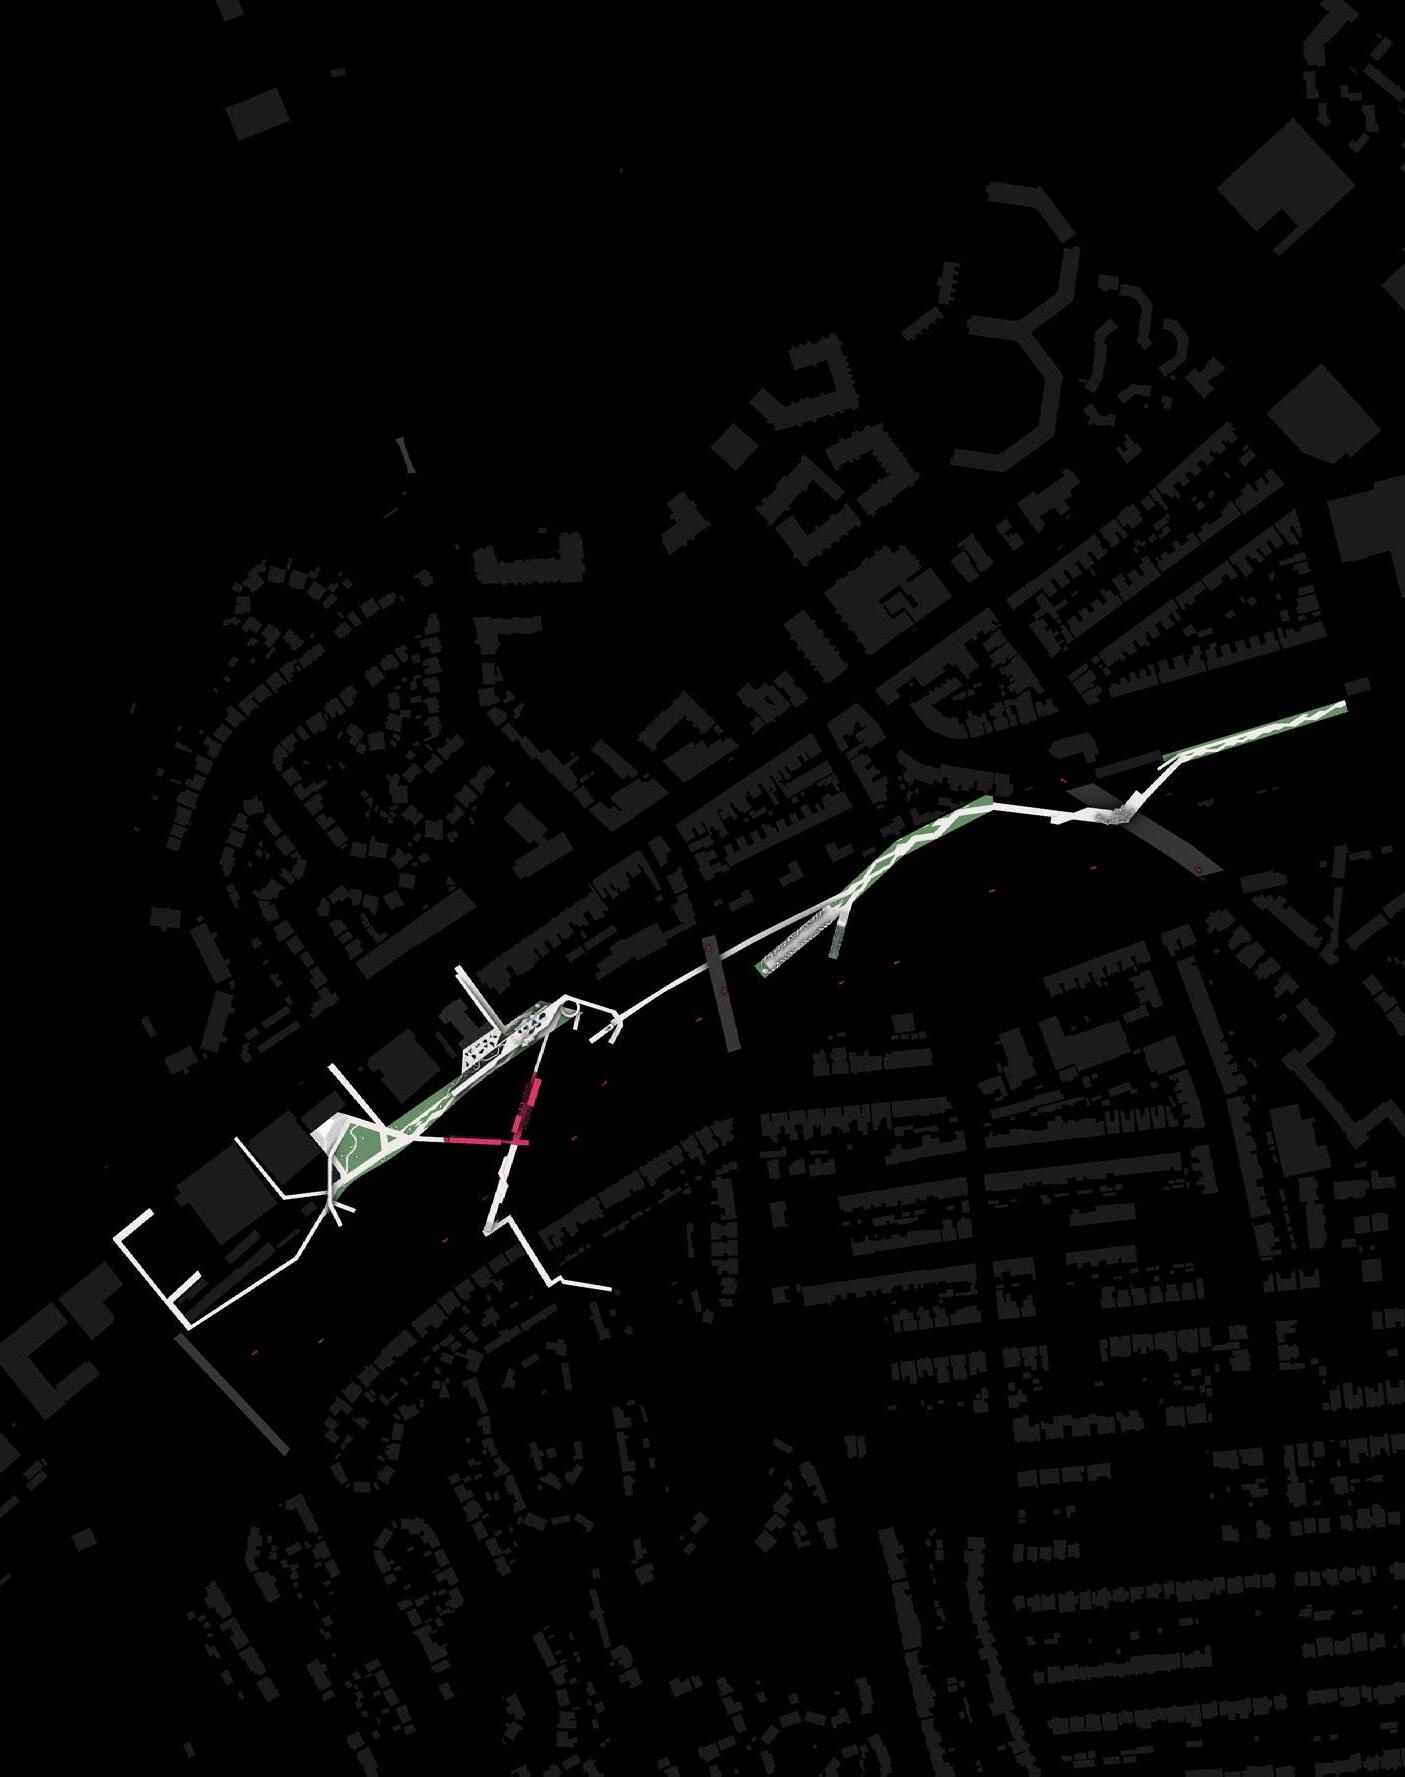
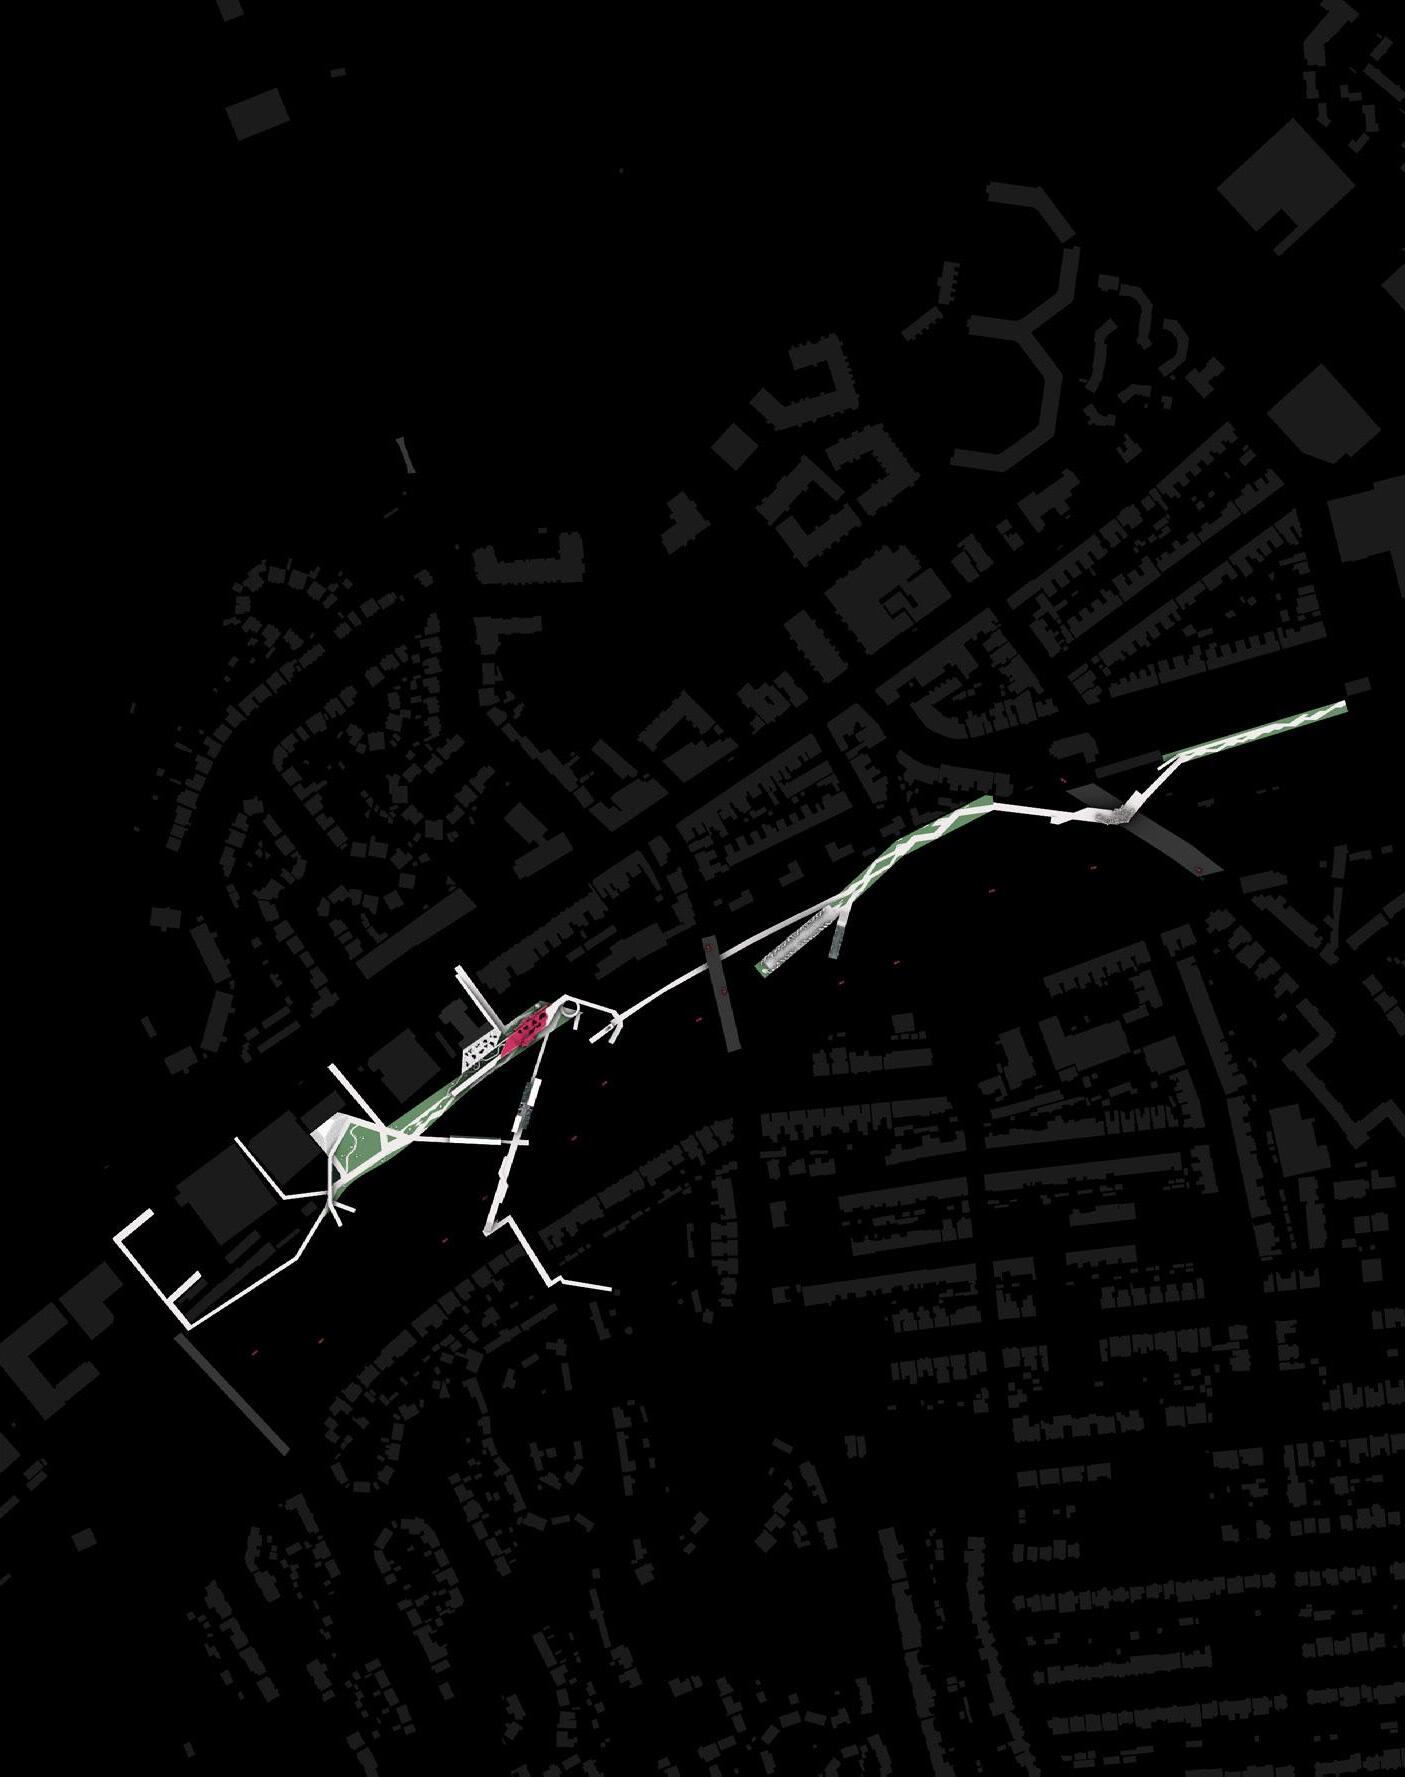
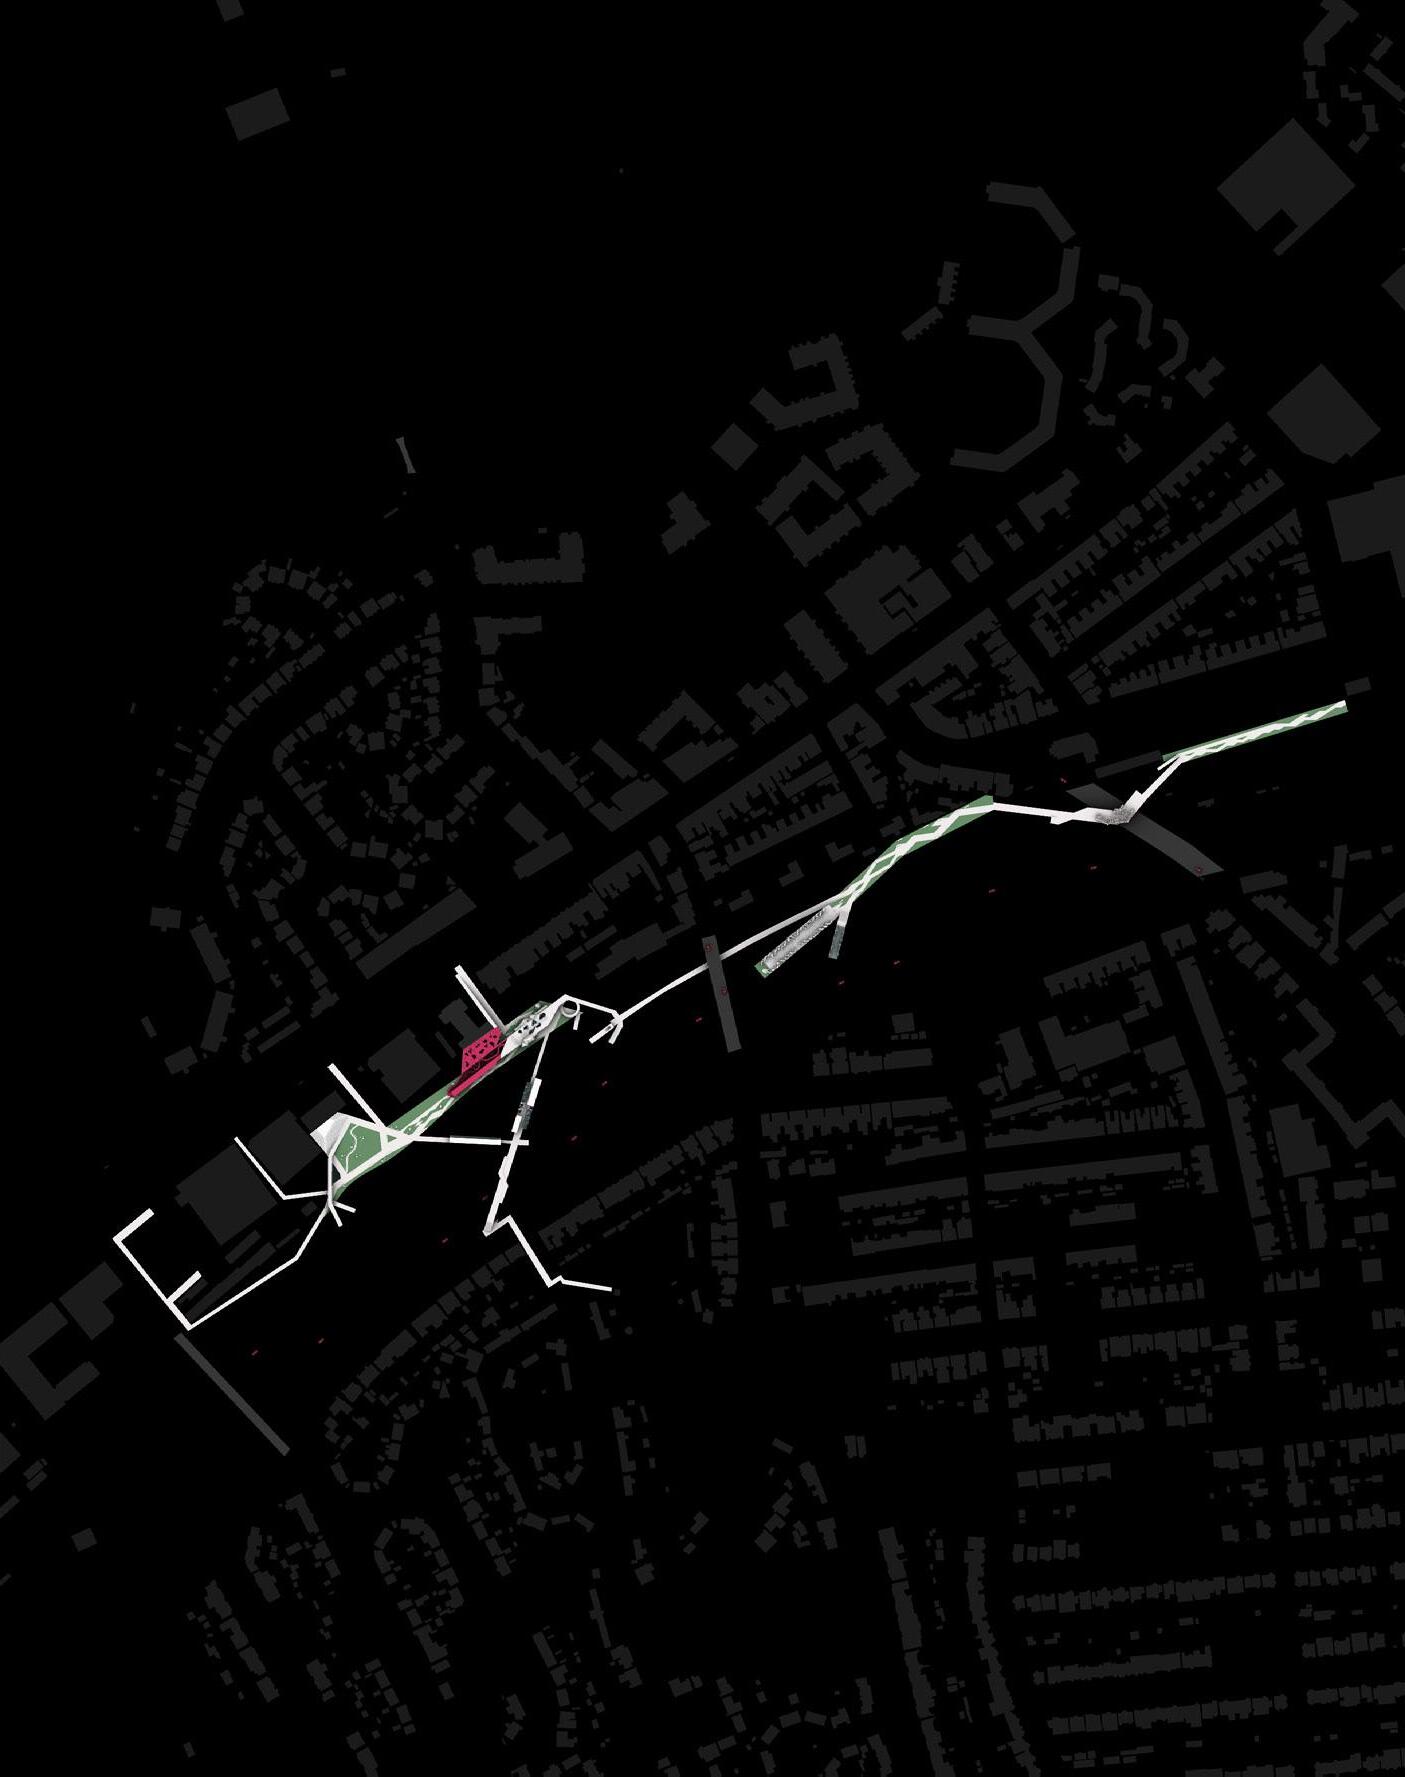
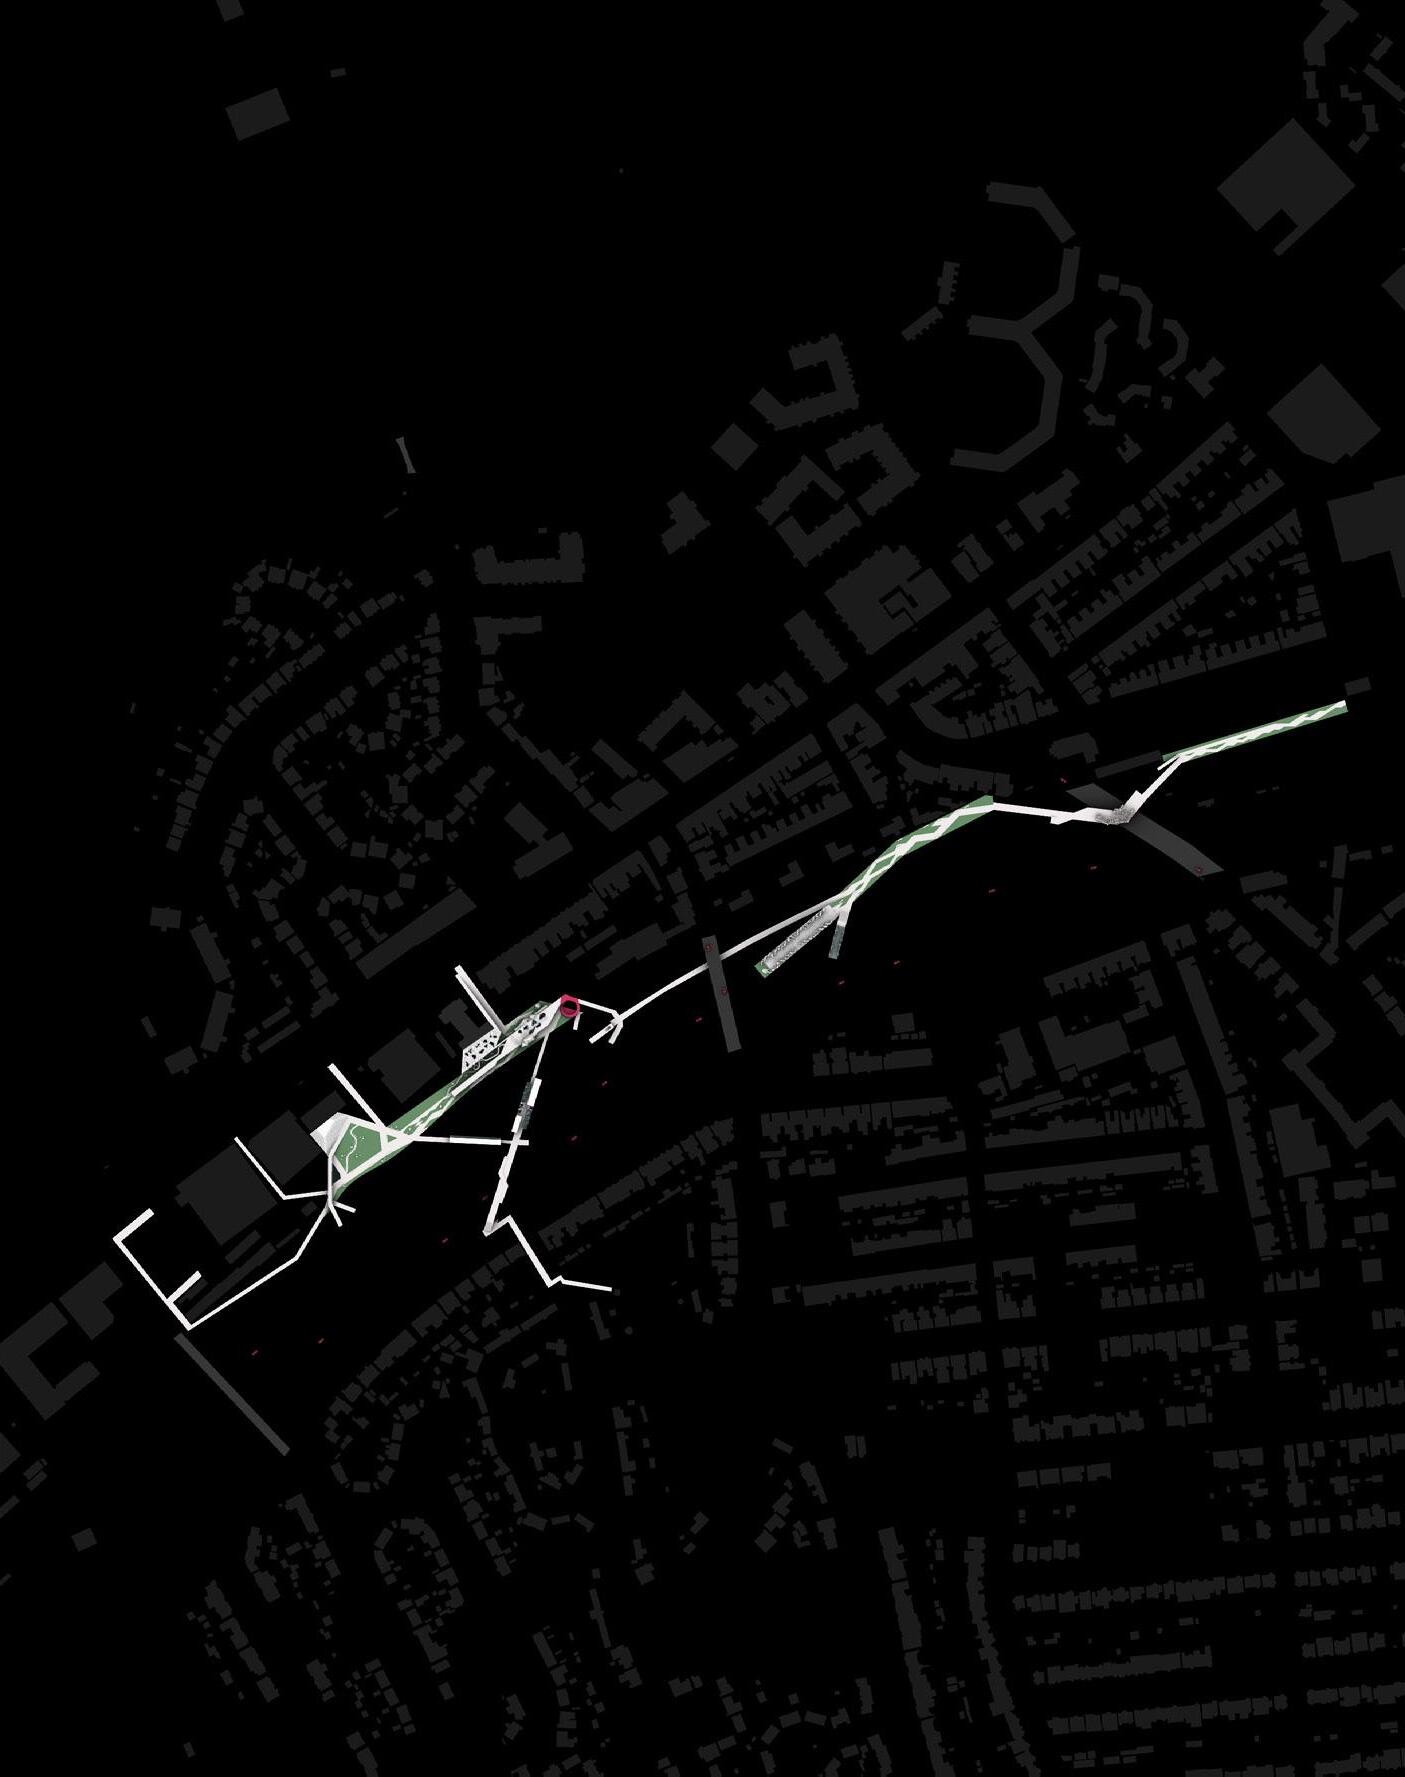
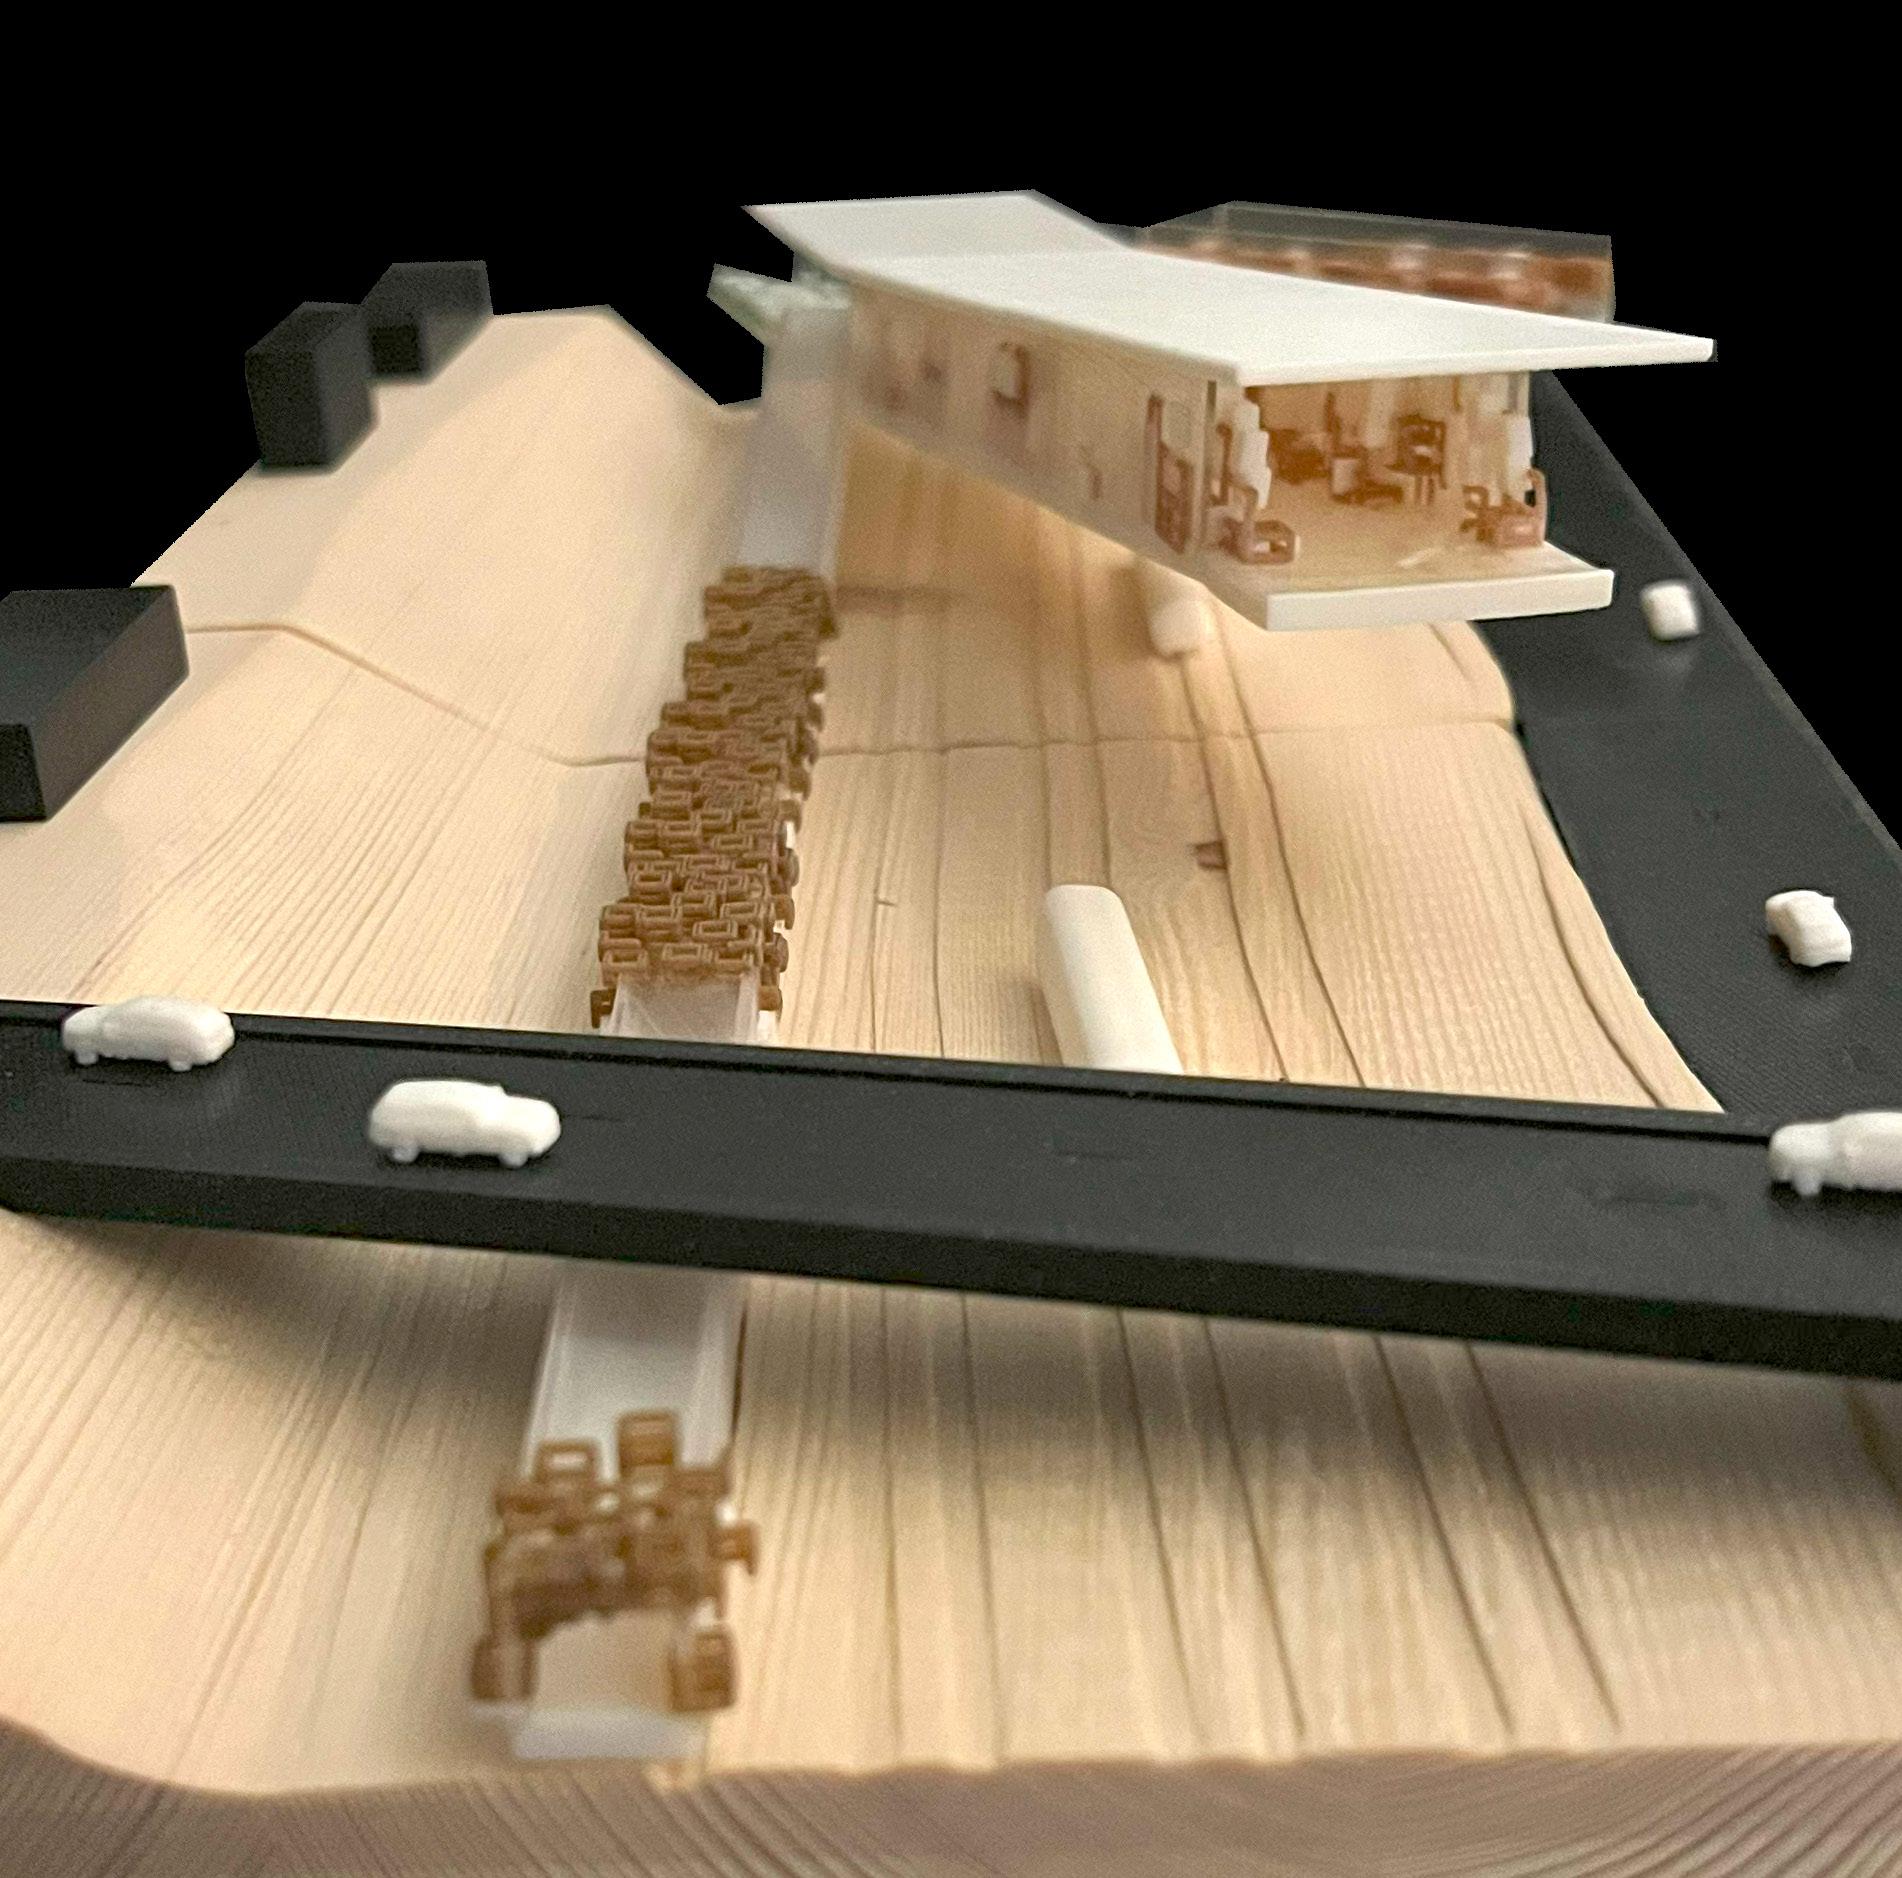
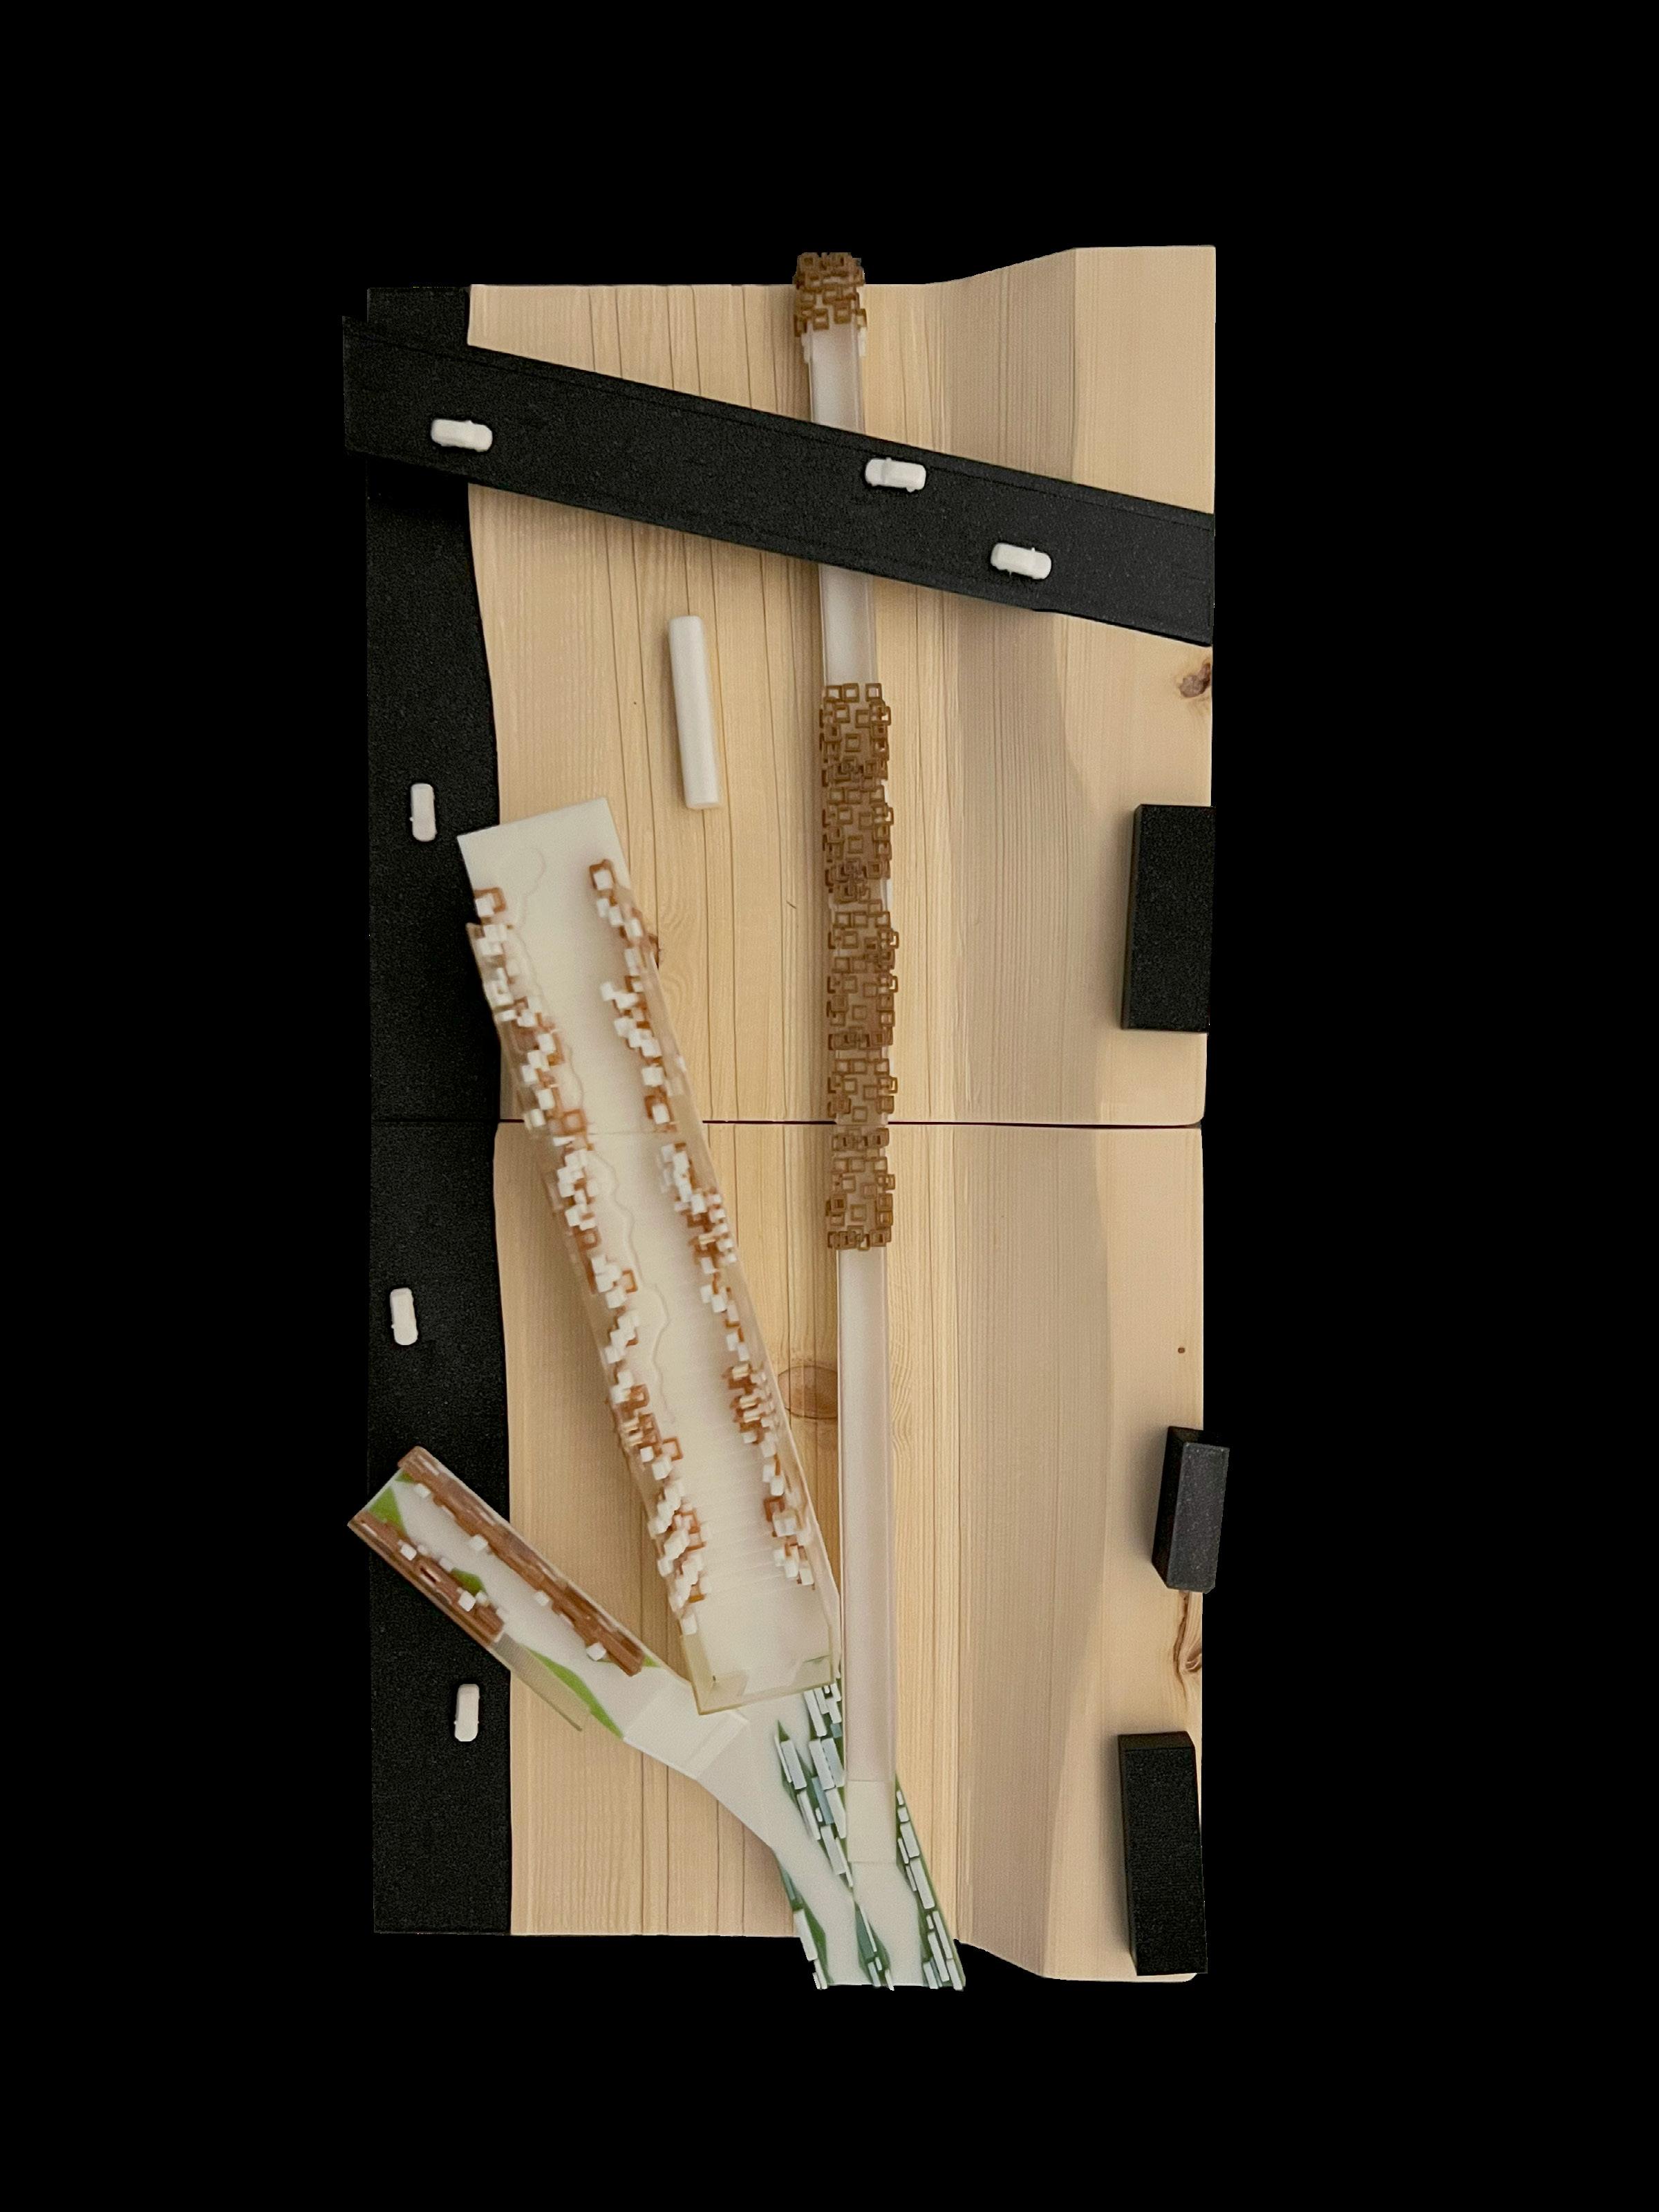
SITE PLAN
Our site plan starts off with our designed path in white within the context of the surrounding Brent area and the schools highlighted in grey. The K-Means points, highlighted in the yellow vertical lines, have helped provide initial proposed pathways (highlighted in the red and cyan horizontal lines). We then further refined the path based on this data, our knowledge of the site, and analysis of the surrounding context.
Secondary Pathway
Main Pathway
Data Proposed Cantilevered Pathways
Provides different functions and programs
Data Proposed Neighborhood Pathways
Provides Main Circulation throughout site
PRIMARY SCHOOL
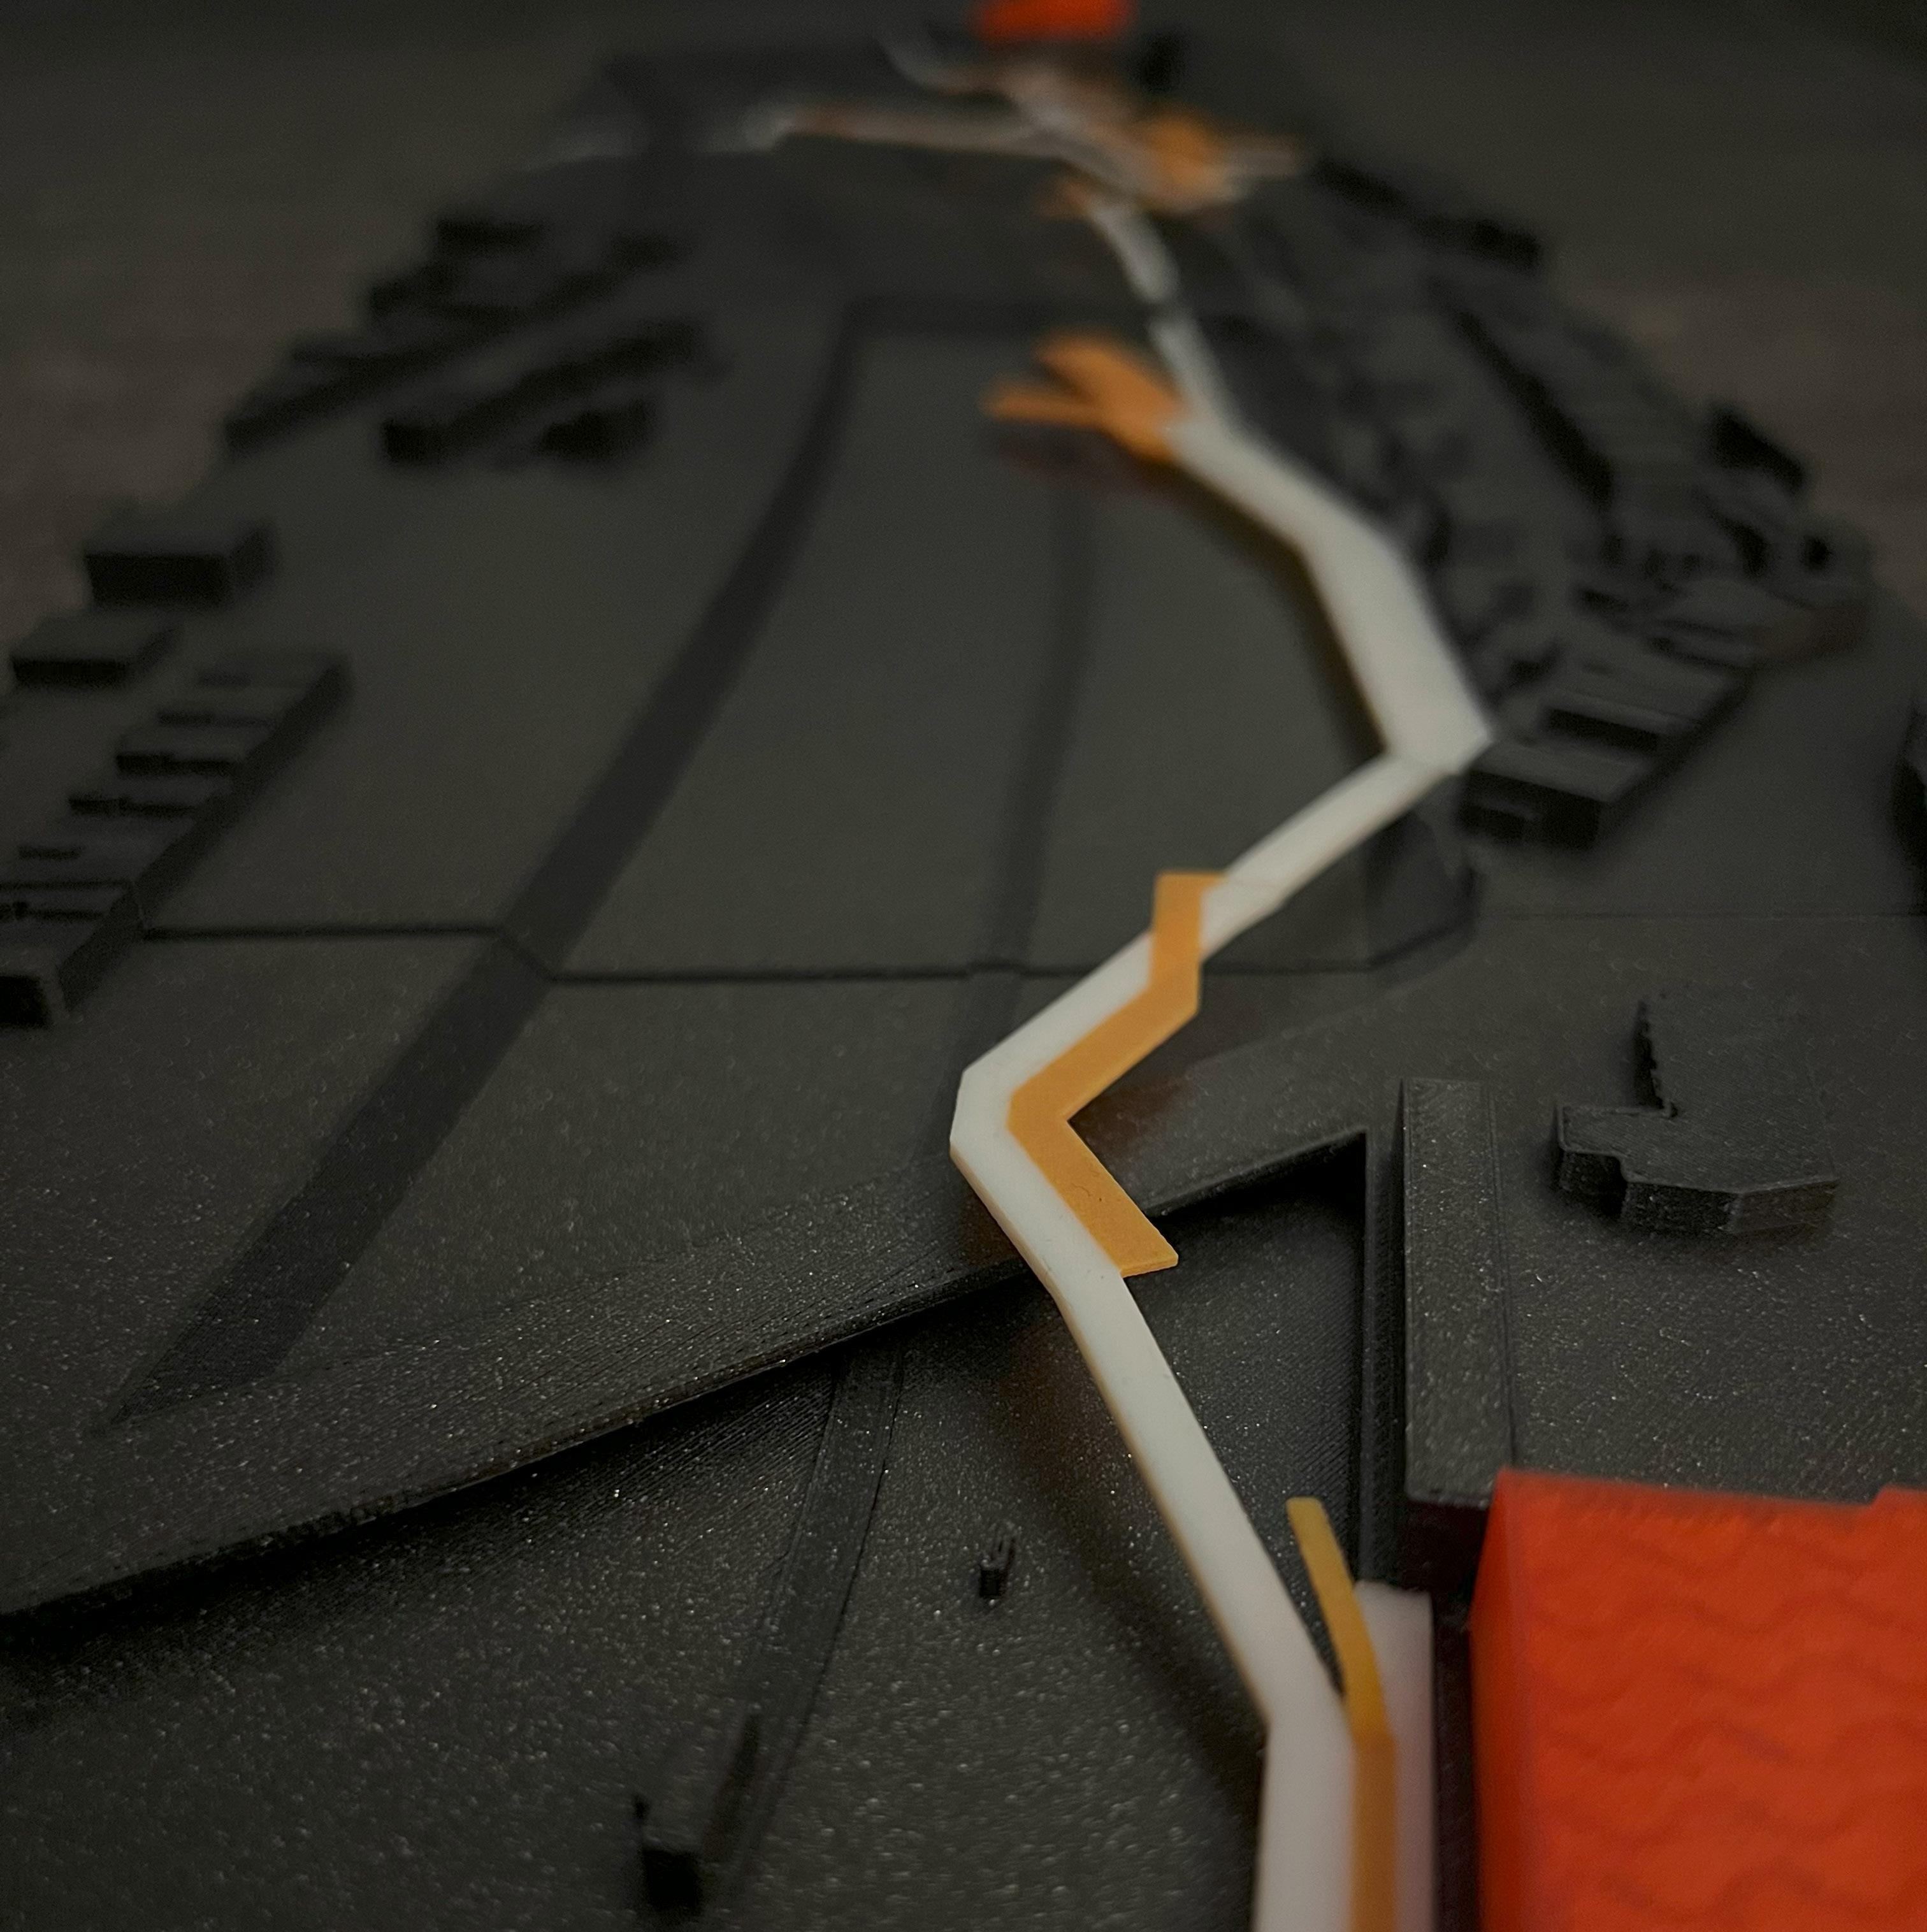
DESIGNED PATHWAYS
BEIS SCHNEIRER PRIMARY SCHOOL
K-MEANS POINTS
DATA PROPOSED CANTILEVERED PATHWAYS
DATA PROPOSED NEIGHBORHOOD PATHWAYS
PARKFIELD PRIMARY SCHOOL
SITE PLAN: PATH PROGRAM
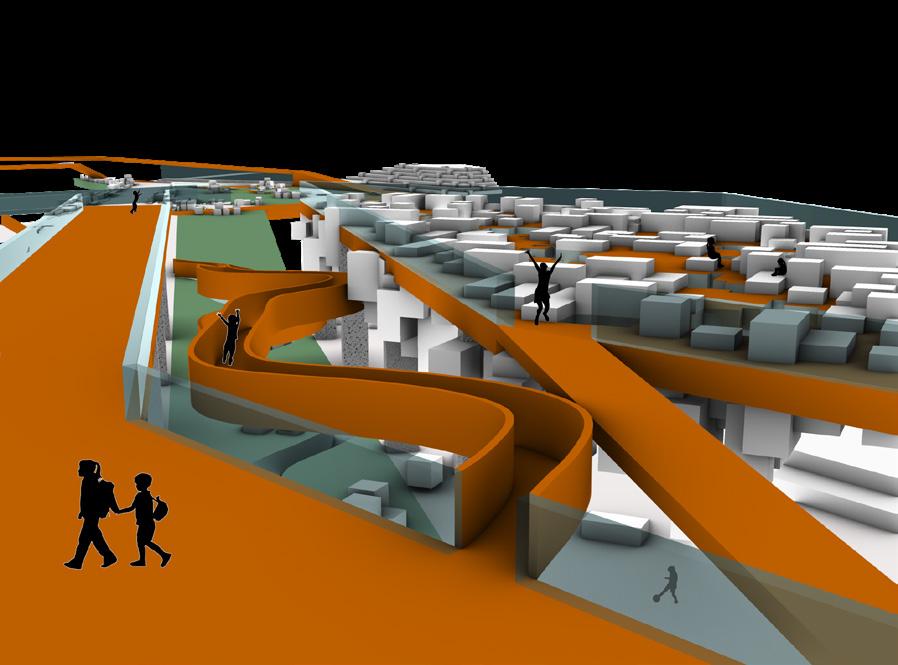
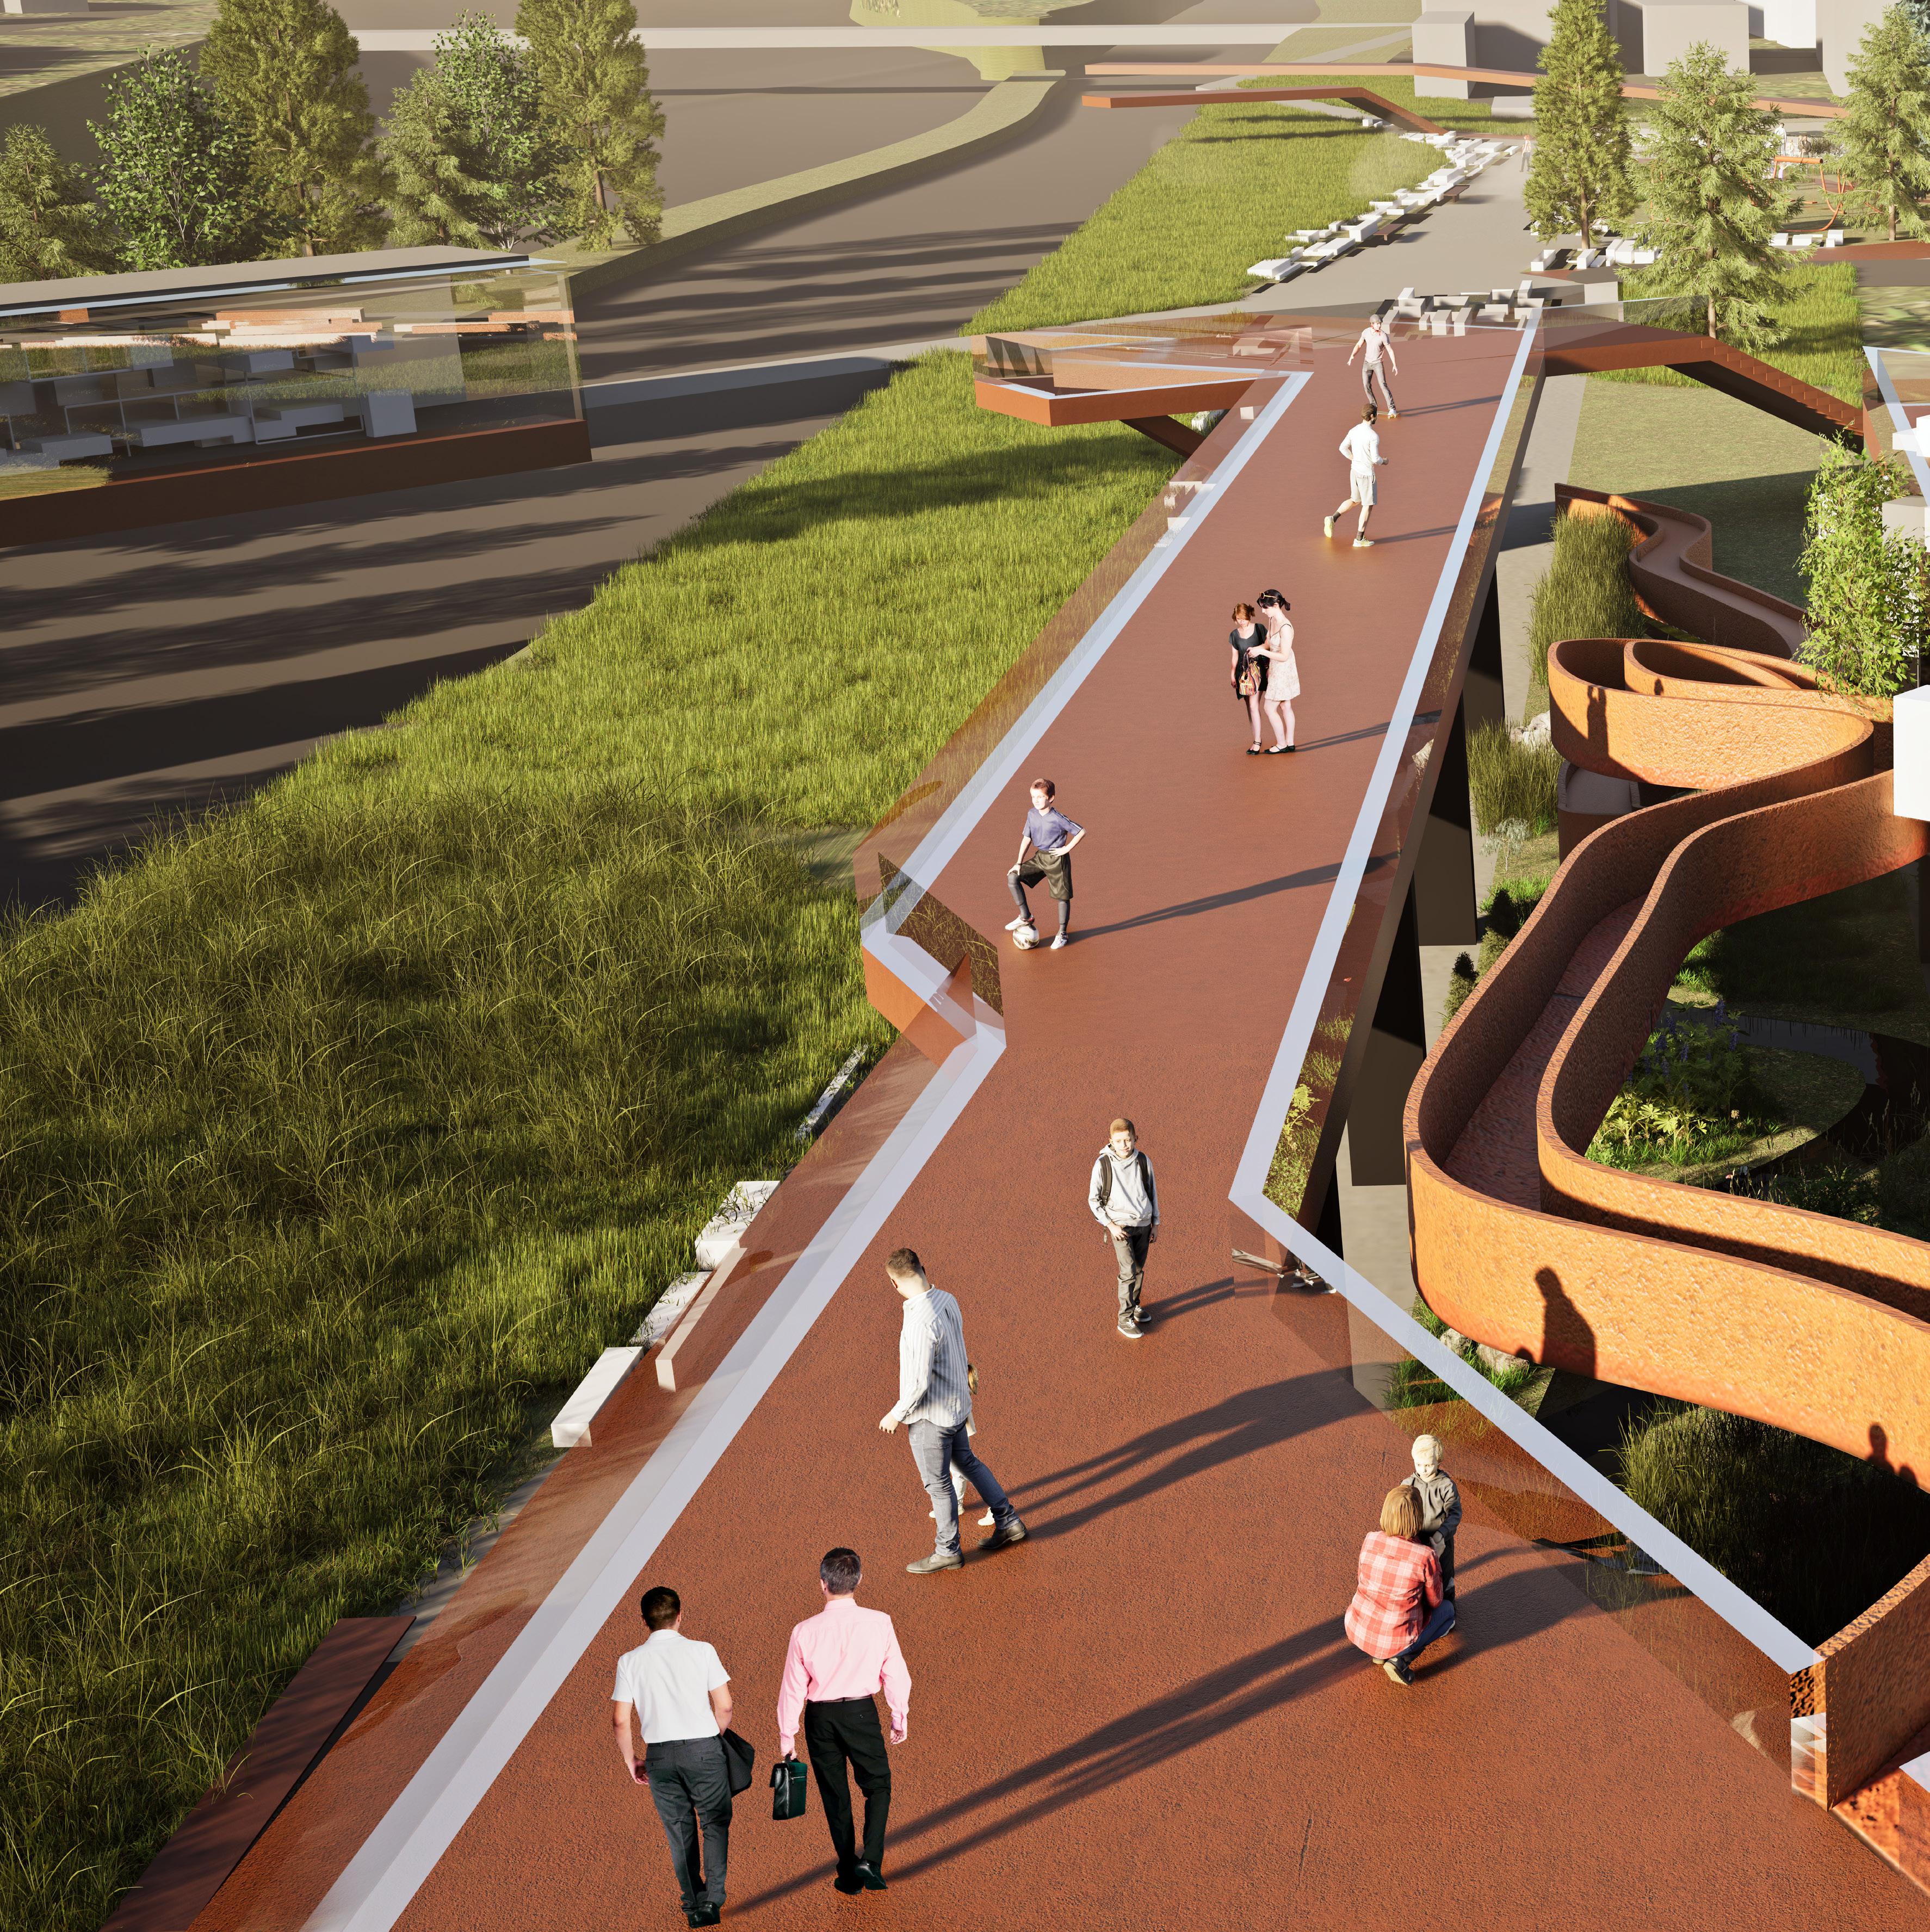
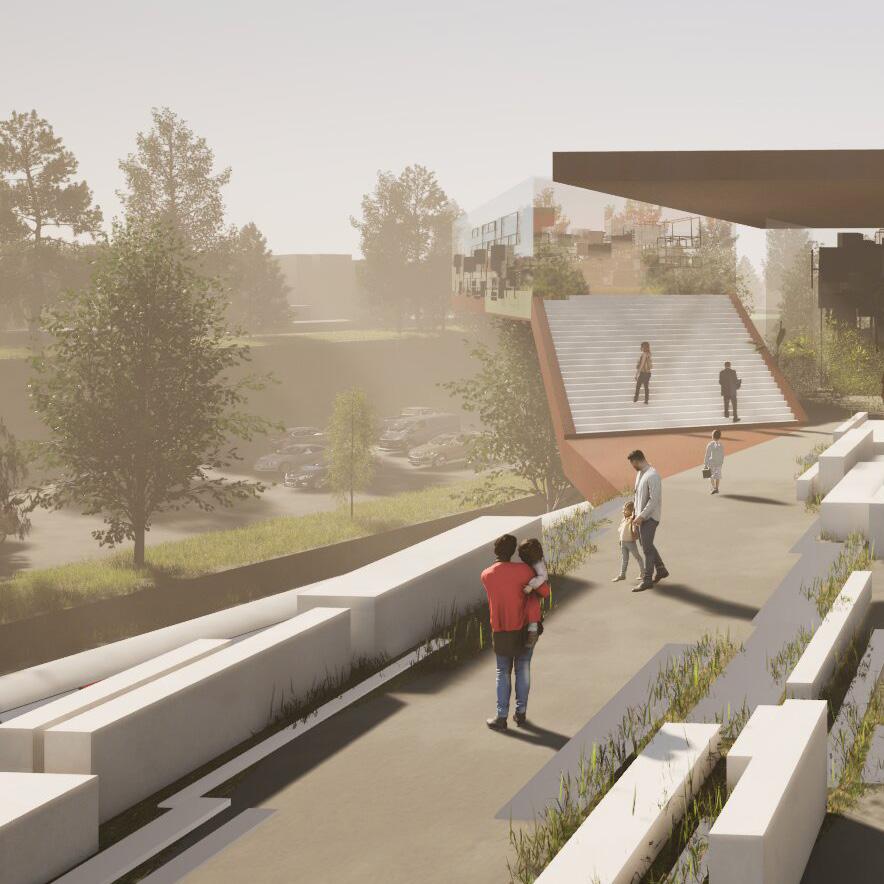
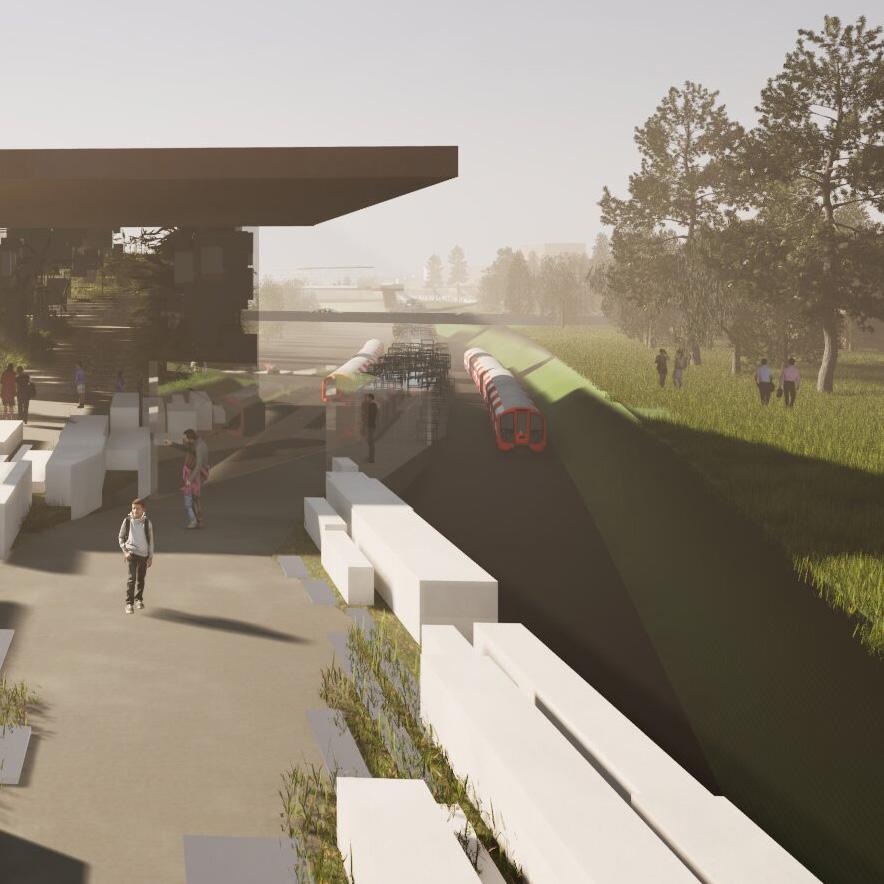
Our site can be further segmented into the two pathways and the intevrentions integrated throughout them. The main pathway is designed to provide safe and accessible circulation, connecting key educational areas while ensuring ease of movement. In contrast, the secondary pathway offers alternative routes and specialized functions that encourage exploration, play, and interaction with the natural environment.
Secondary Pathway
Main Pathway
Provides Main Circulation throughout site
The secondary pathway operates as a complementary route, supporting diverse functions and programs:
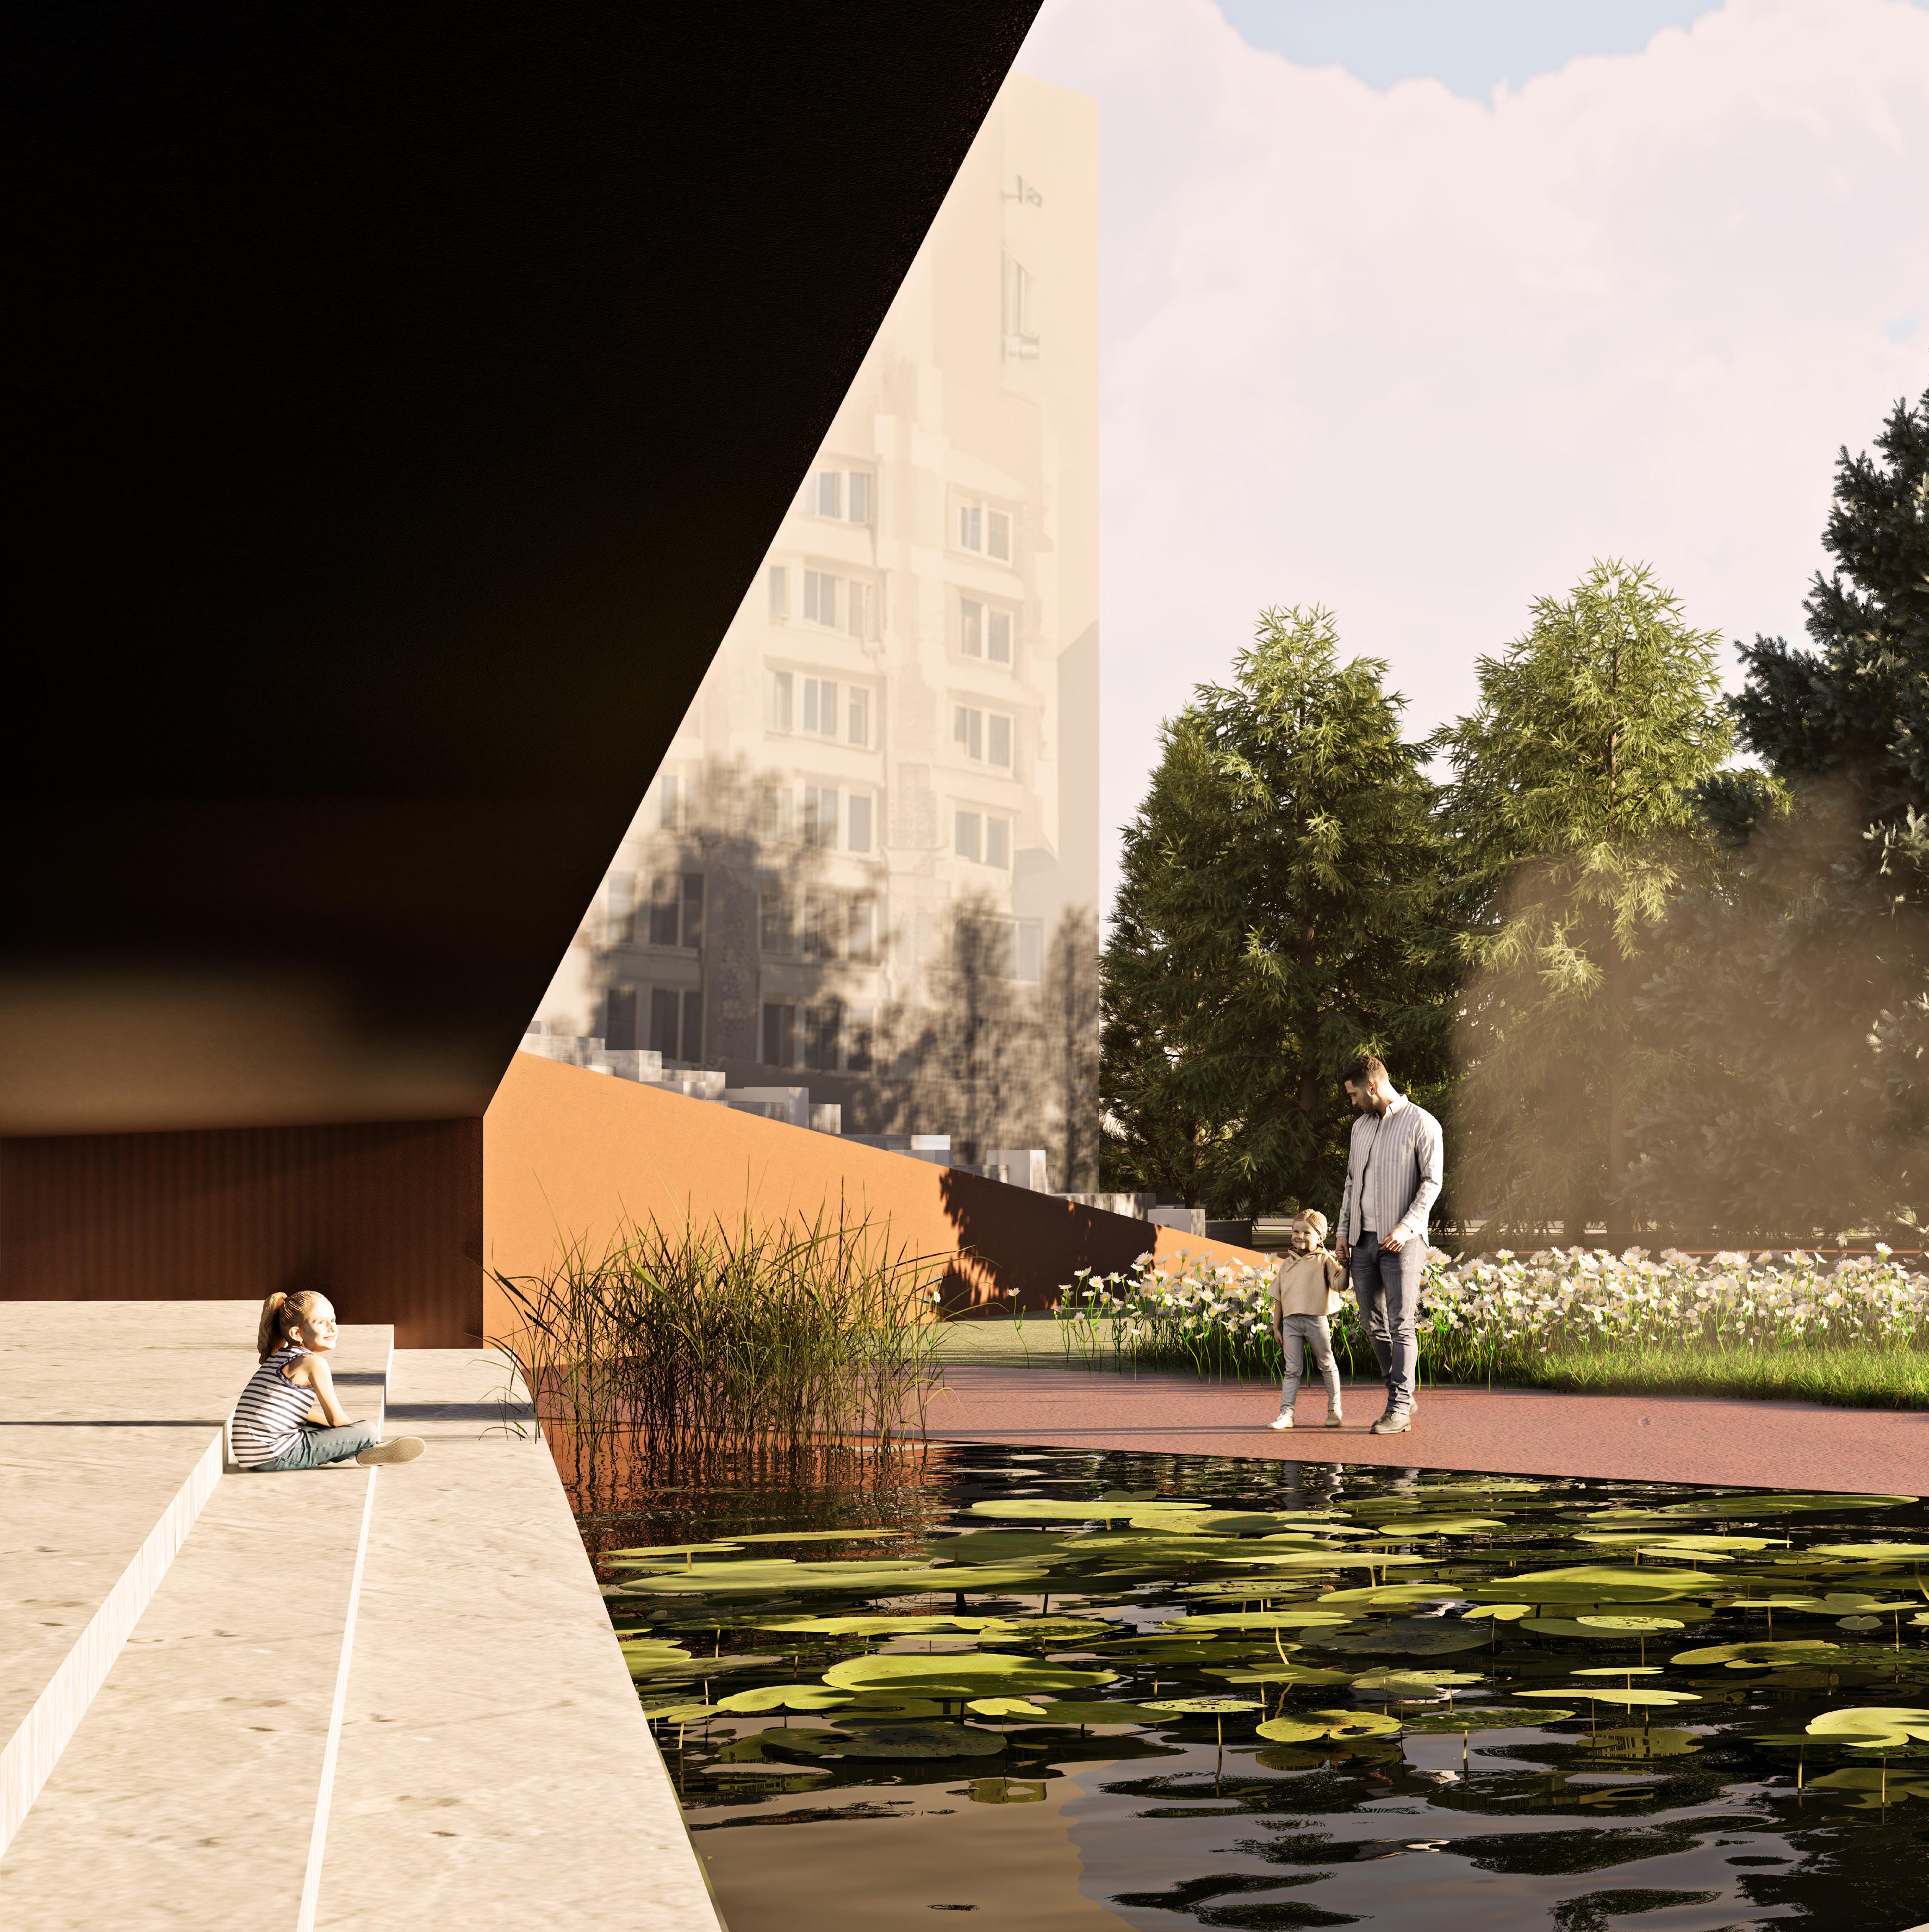
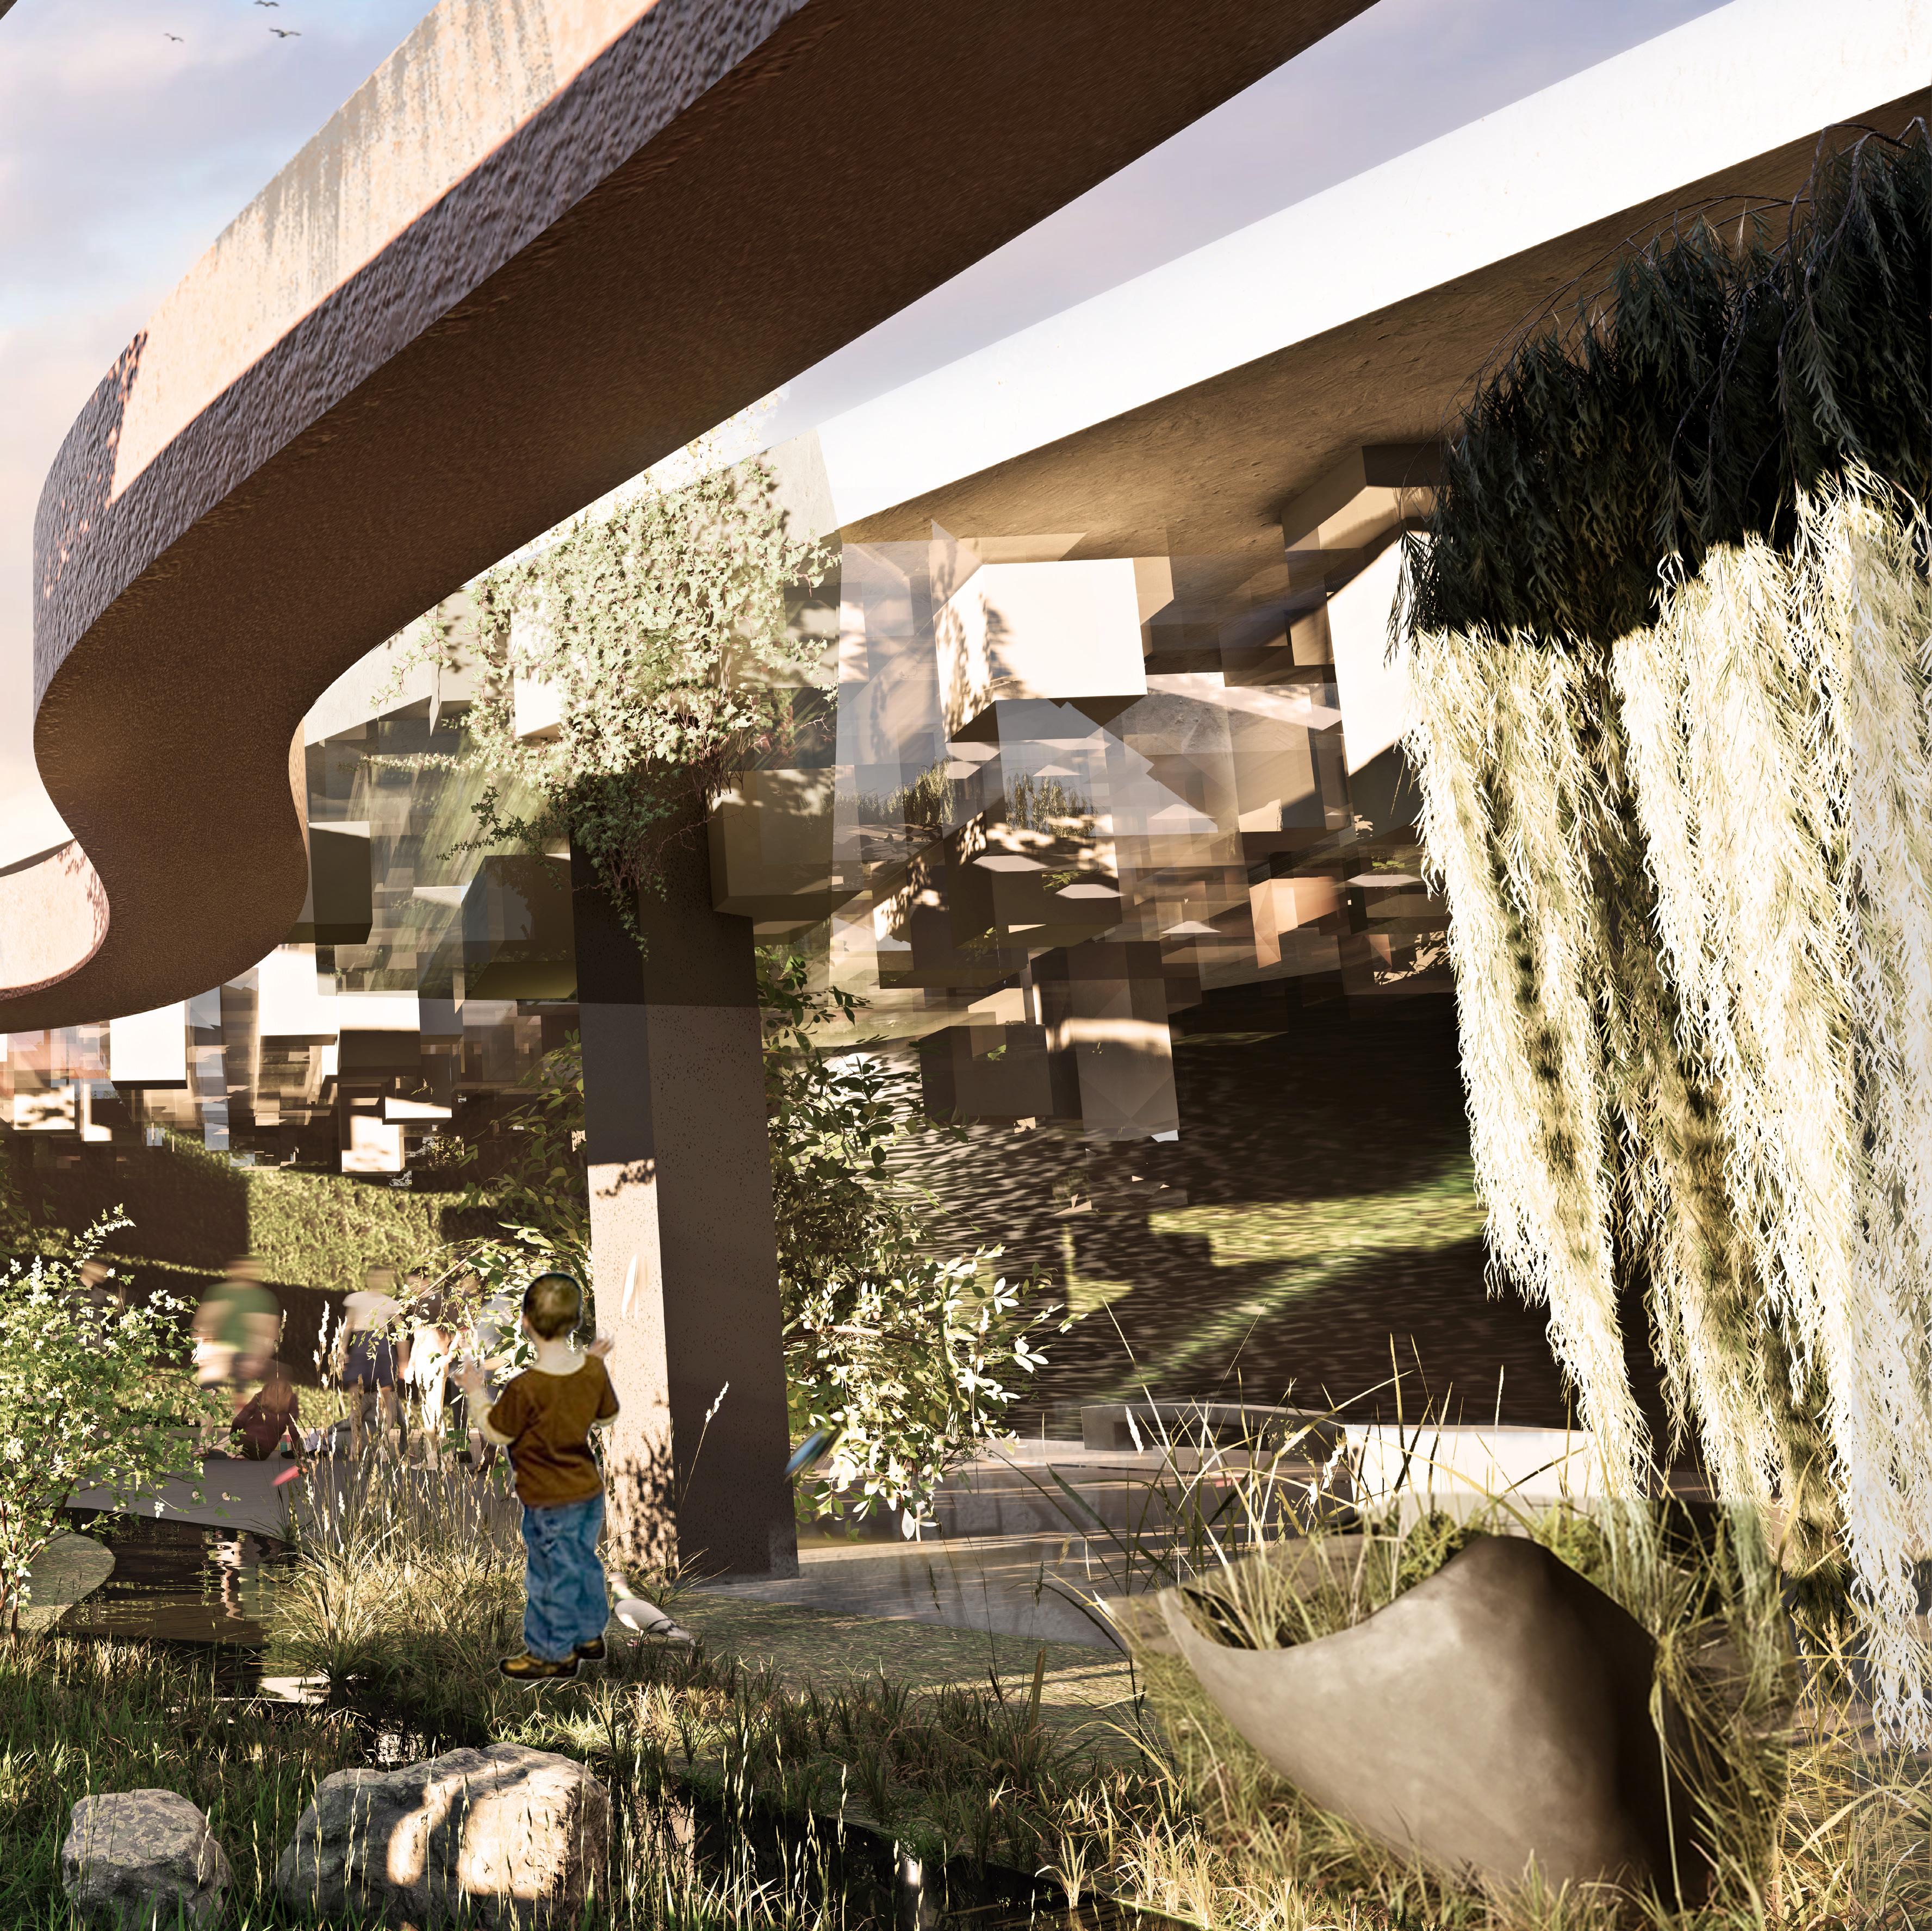
Provides nature trails and community gathering spaces, enhancing the educational aspect of the design and provide opportunities for experiential and social learning.
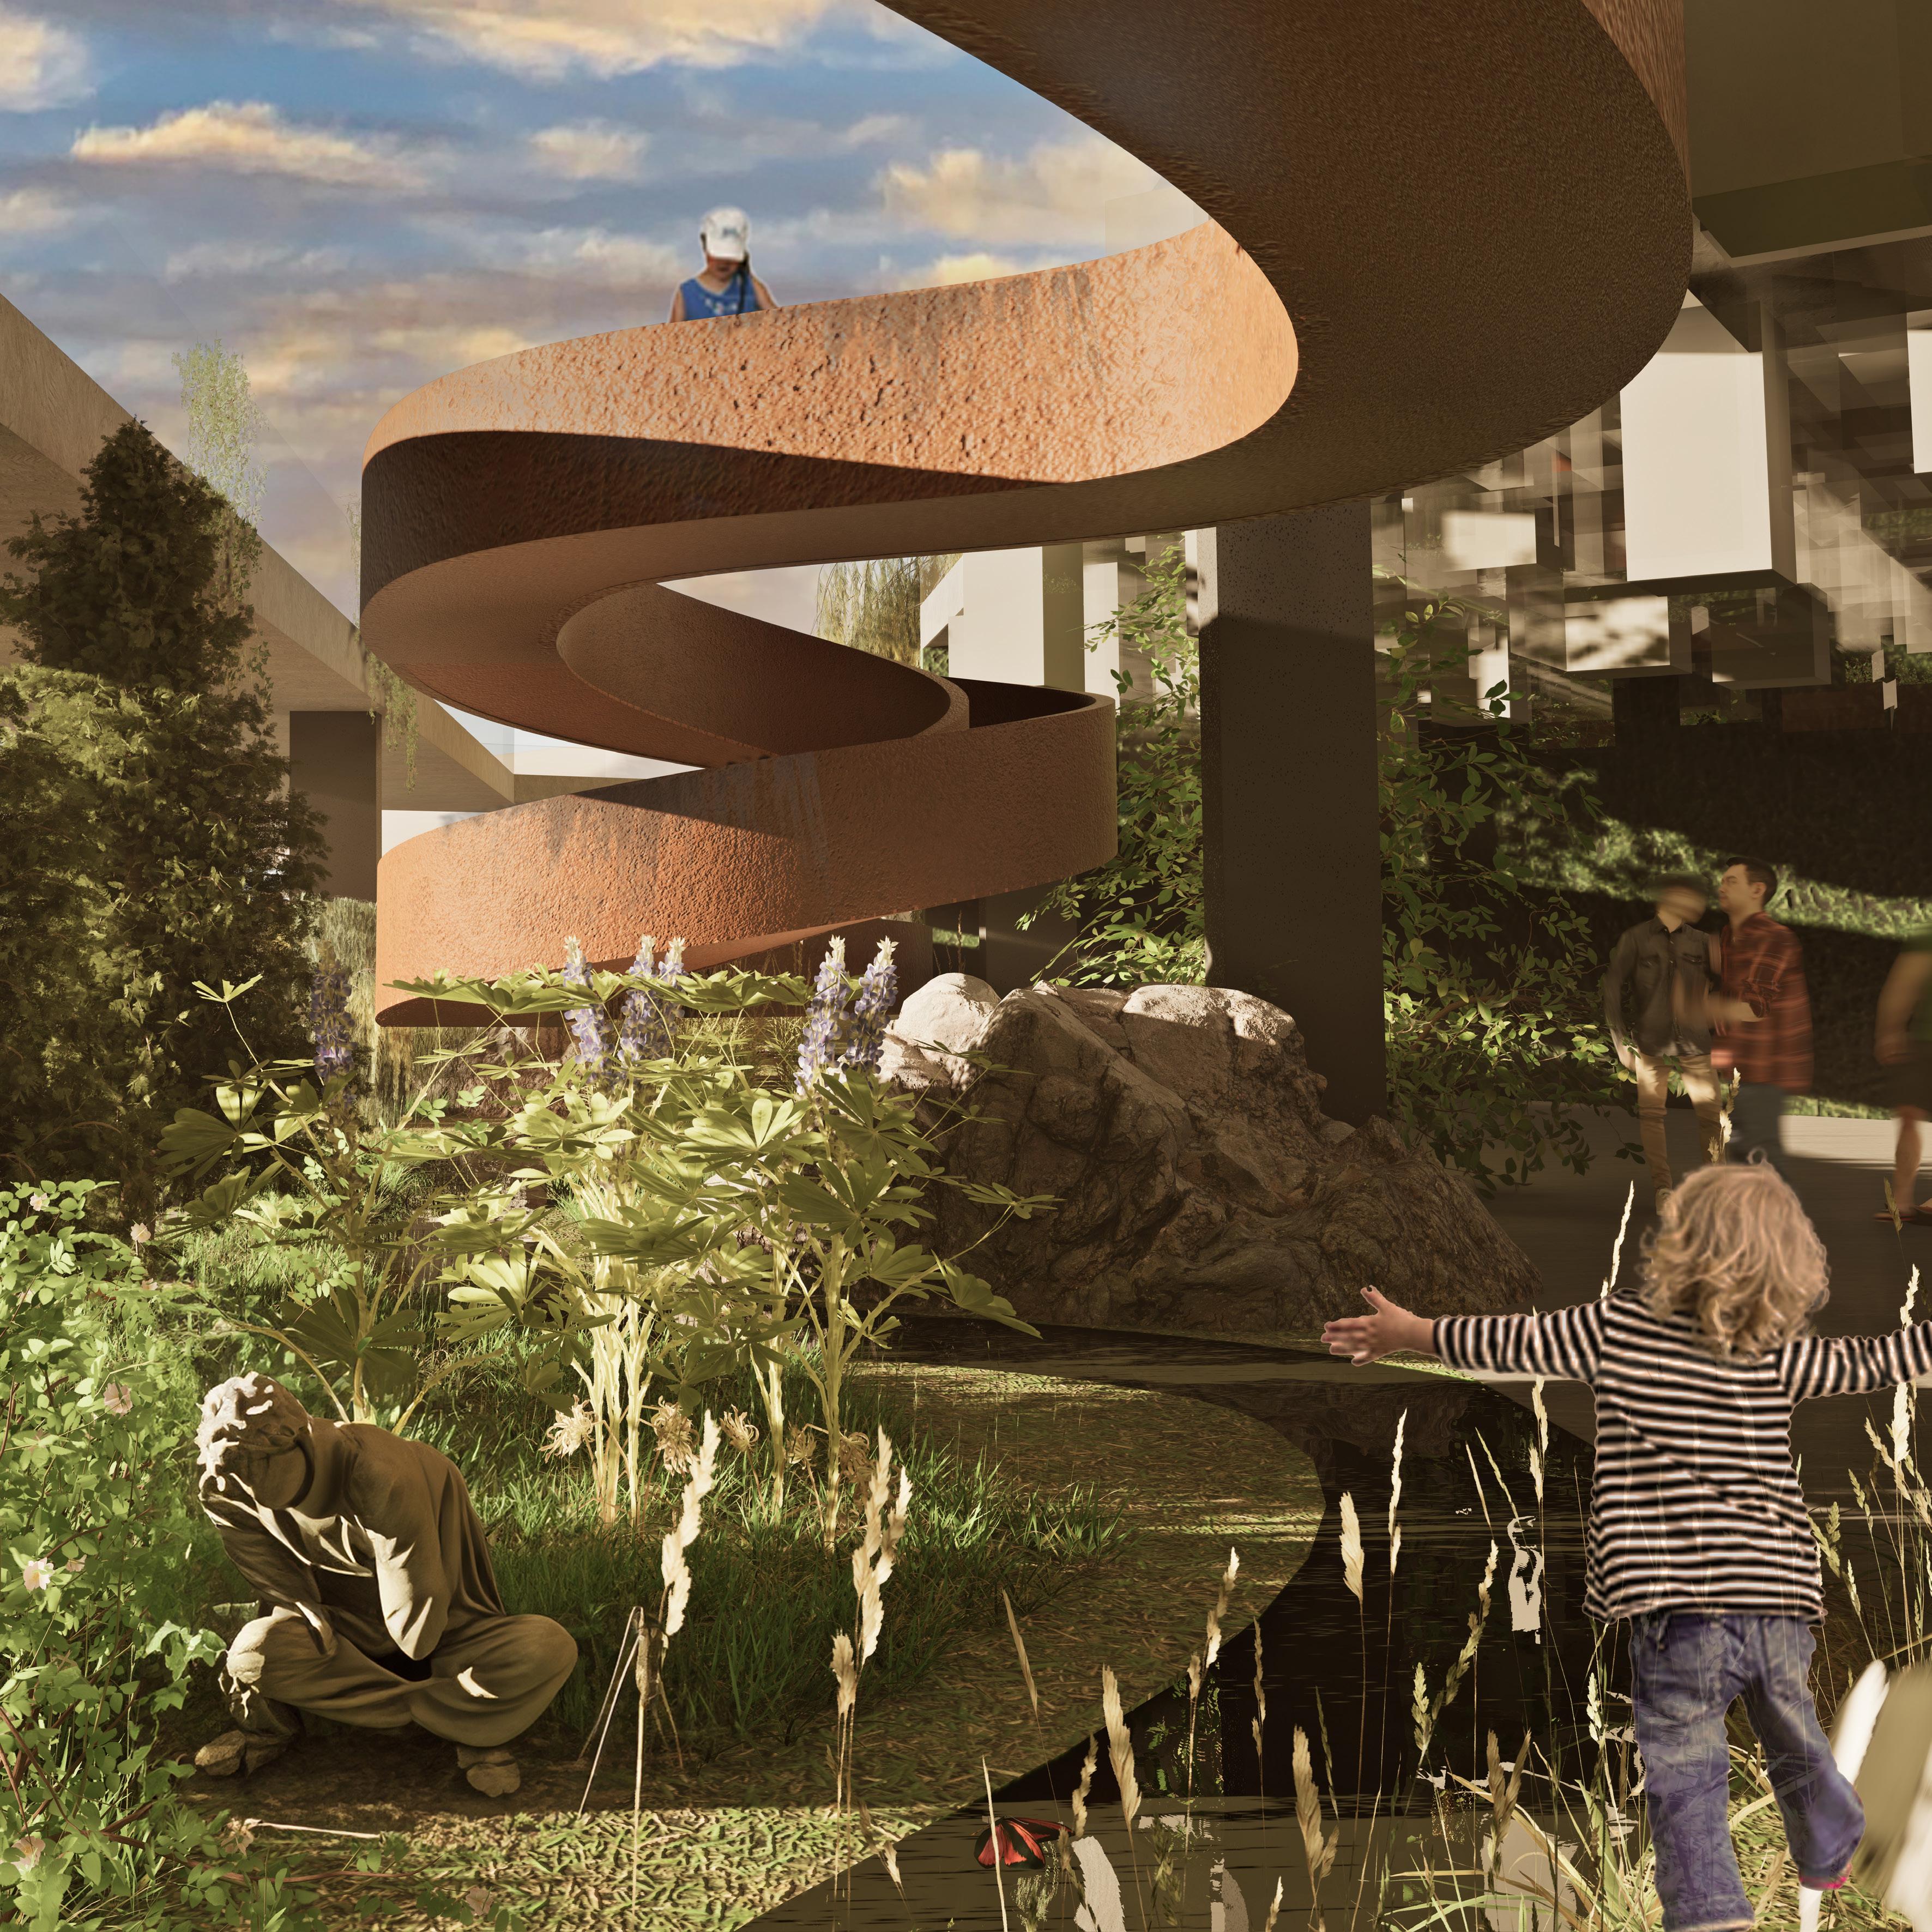
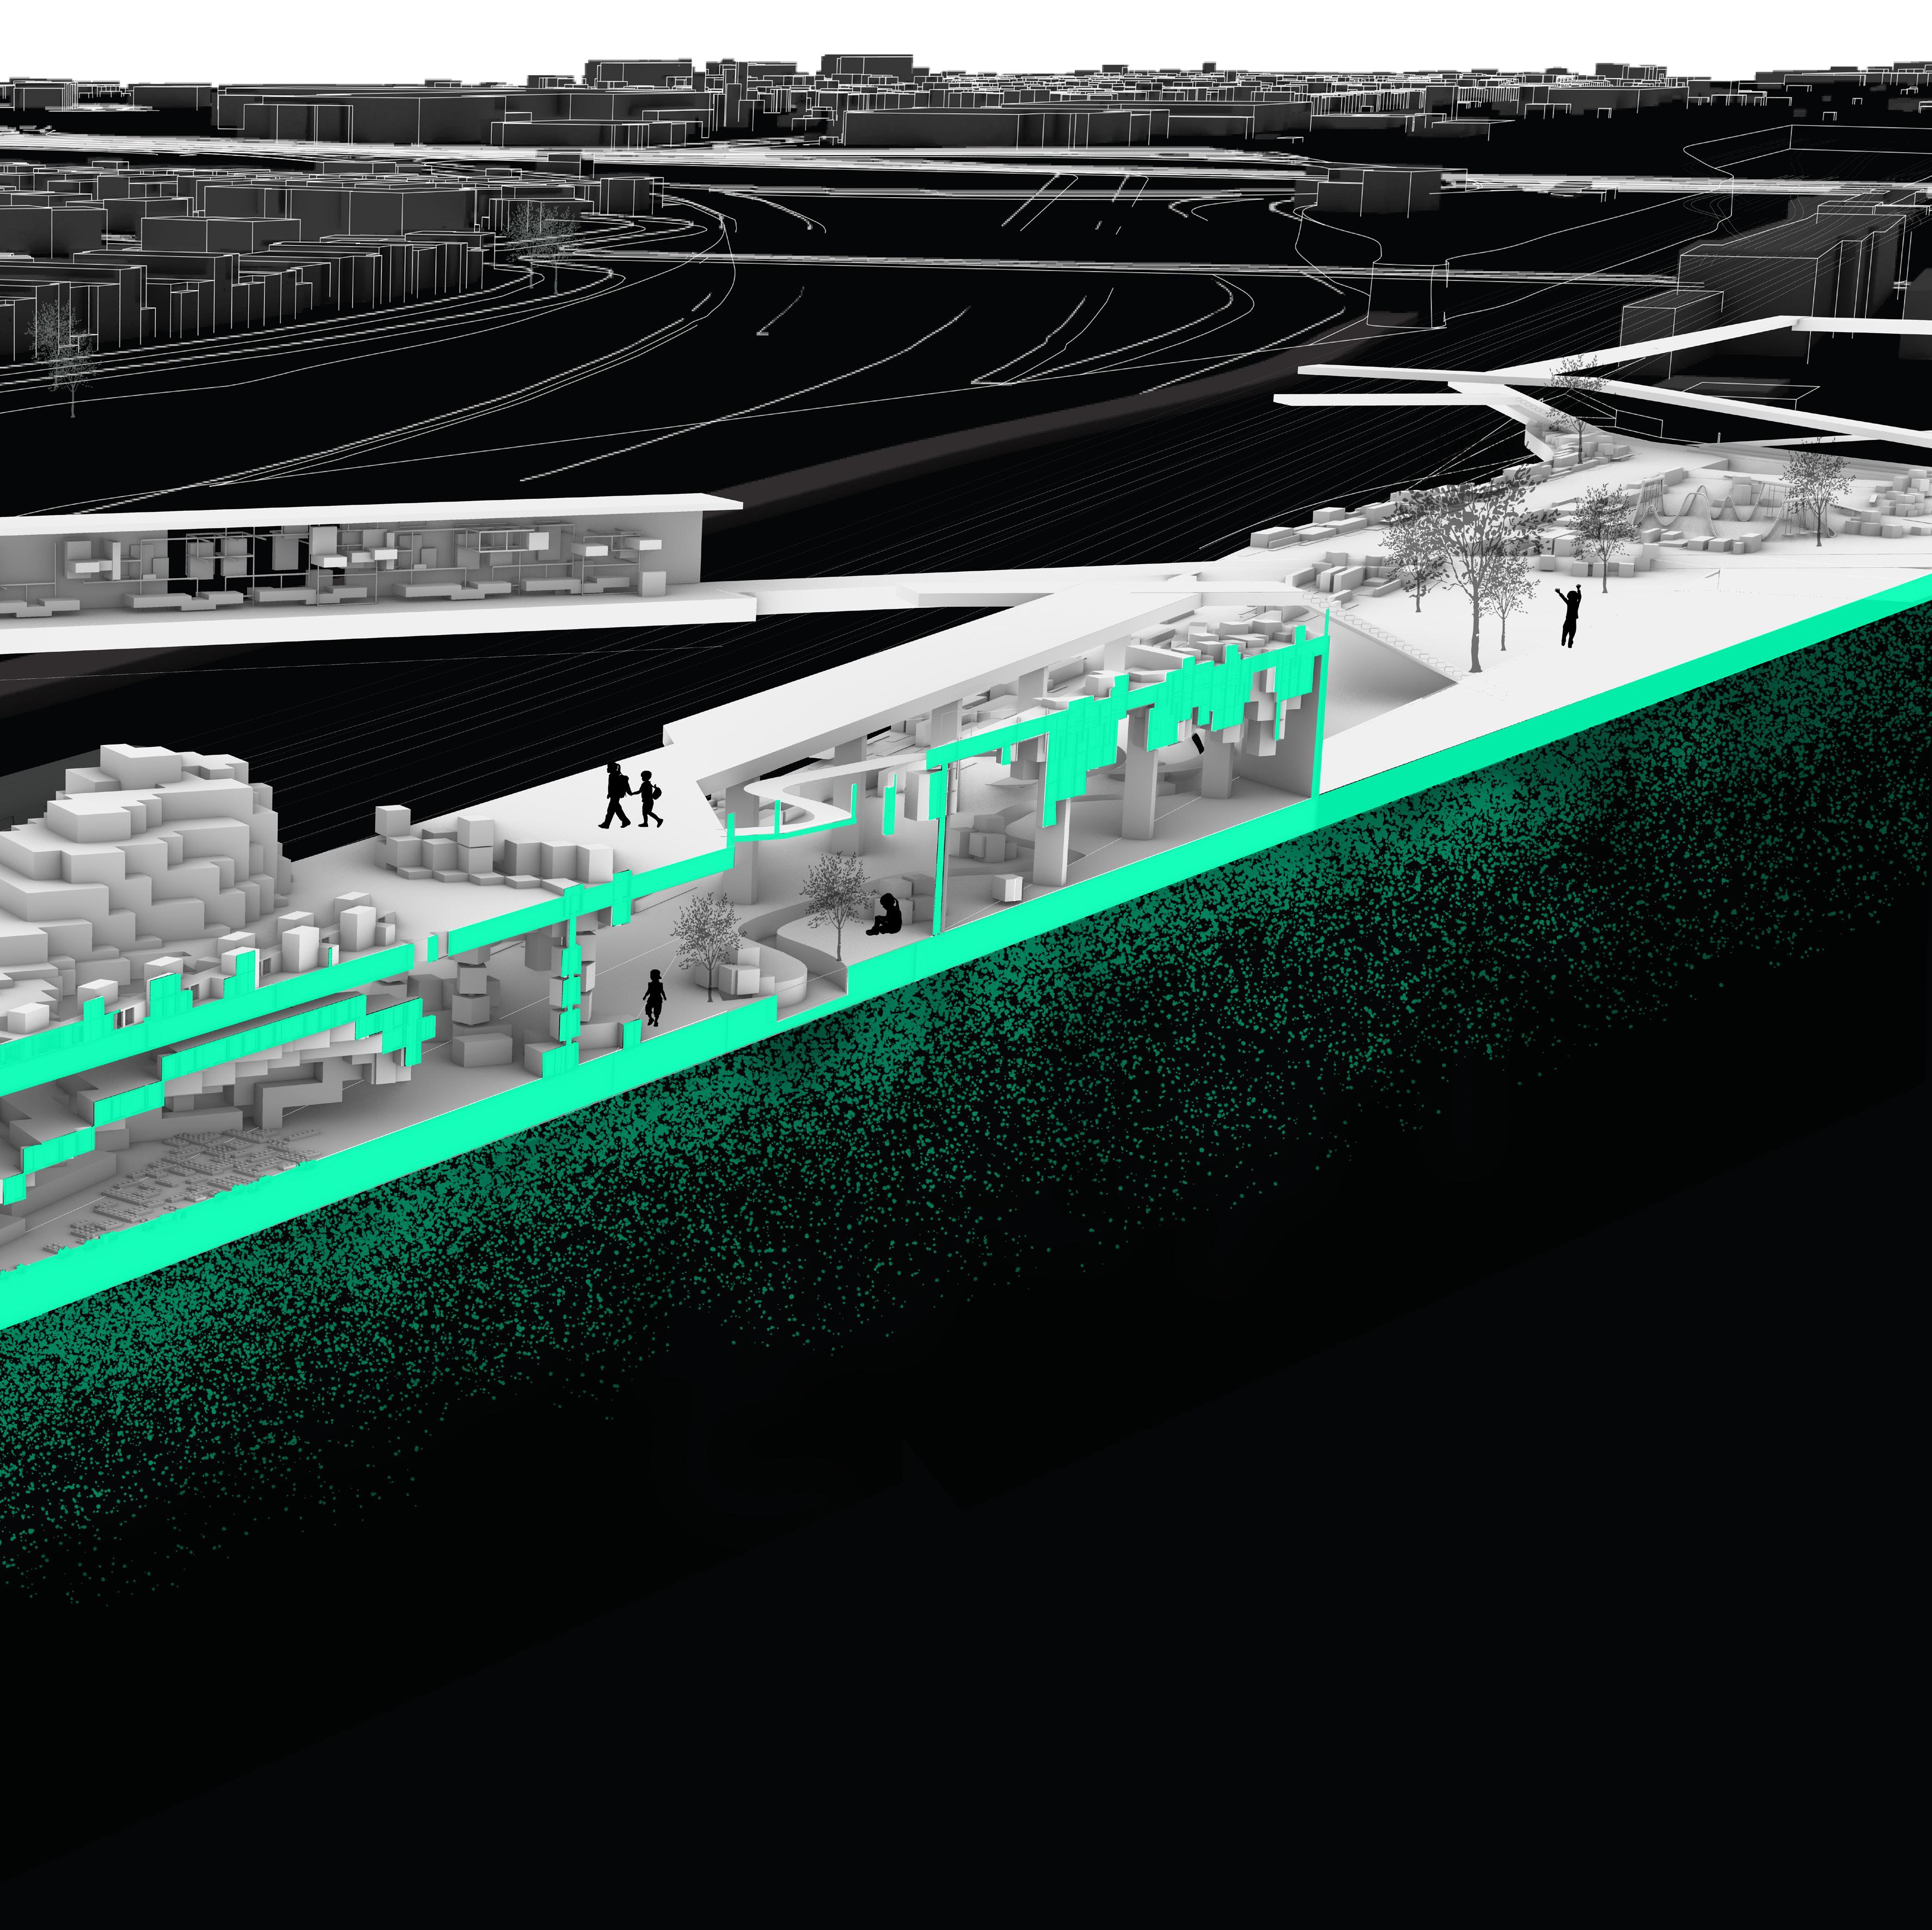
Provides alternative circulation options and exploratory passages.
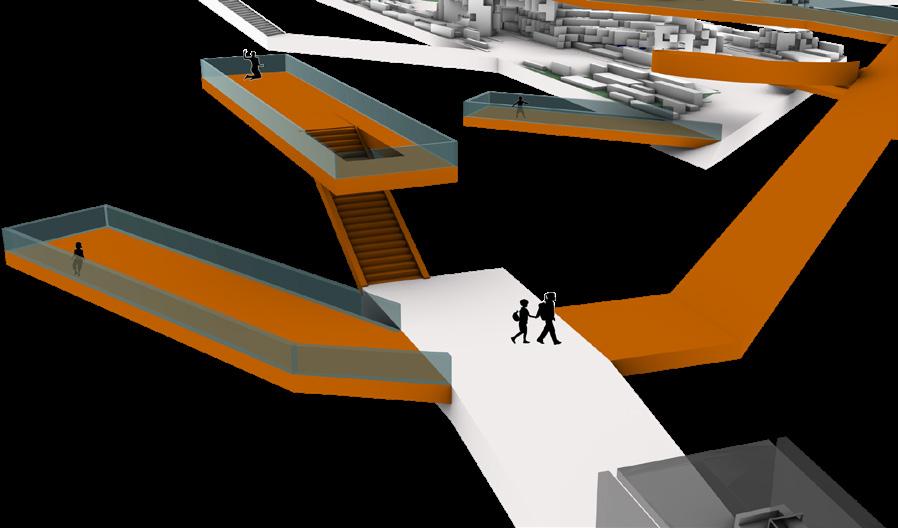
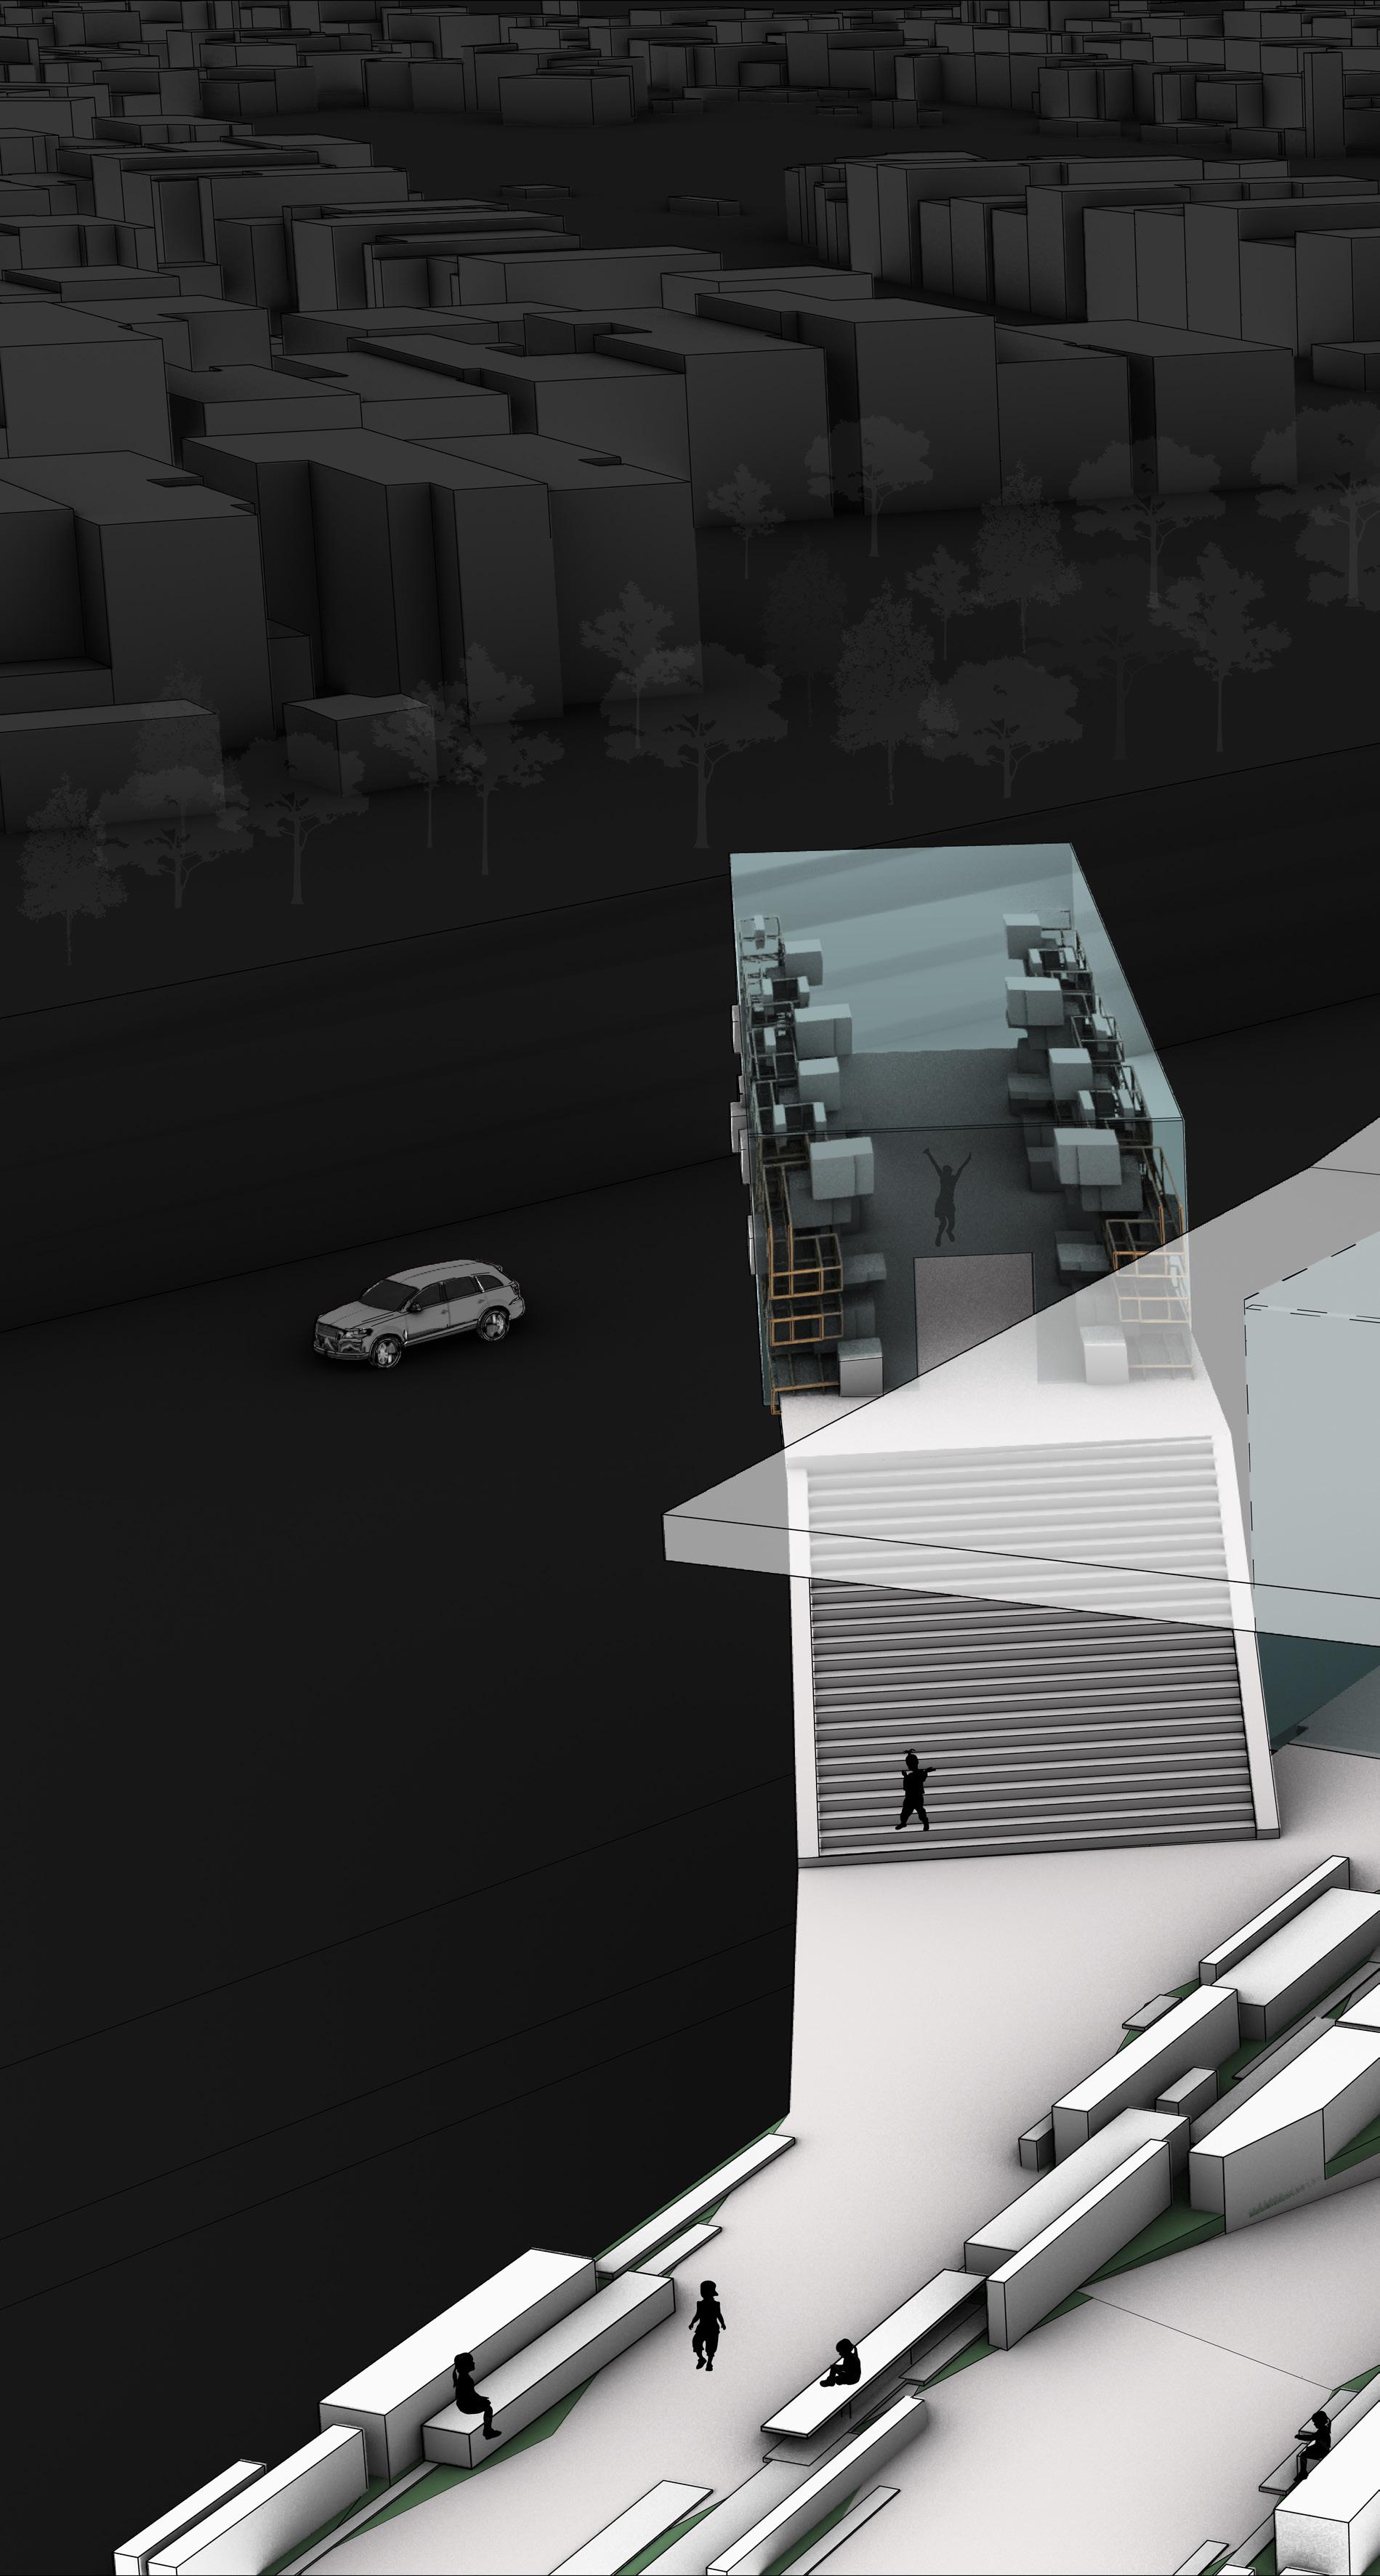
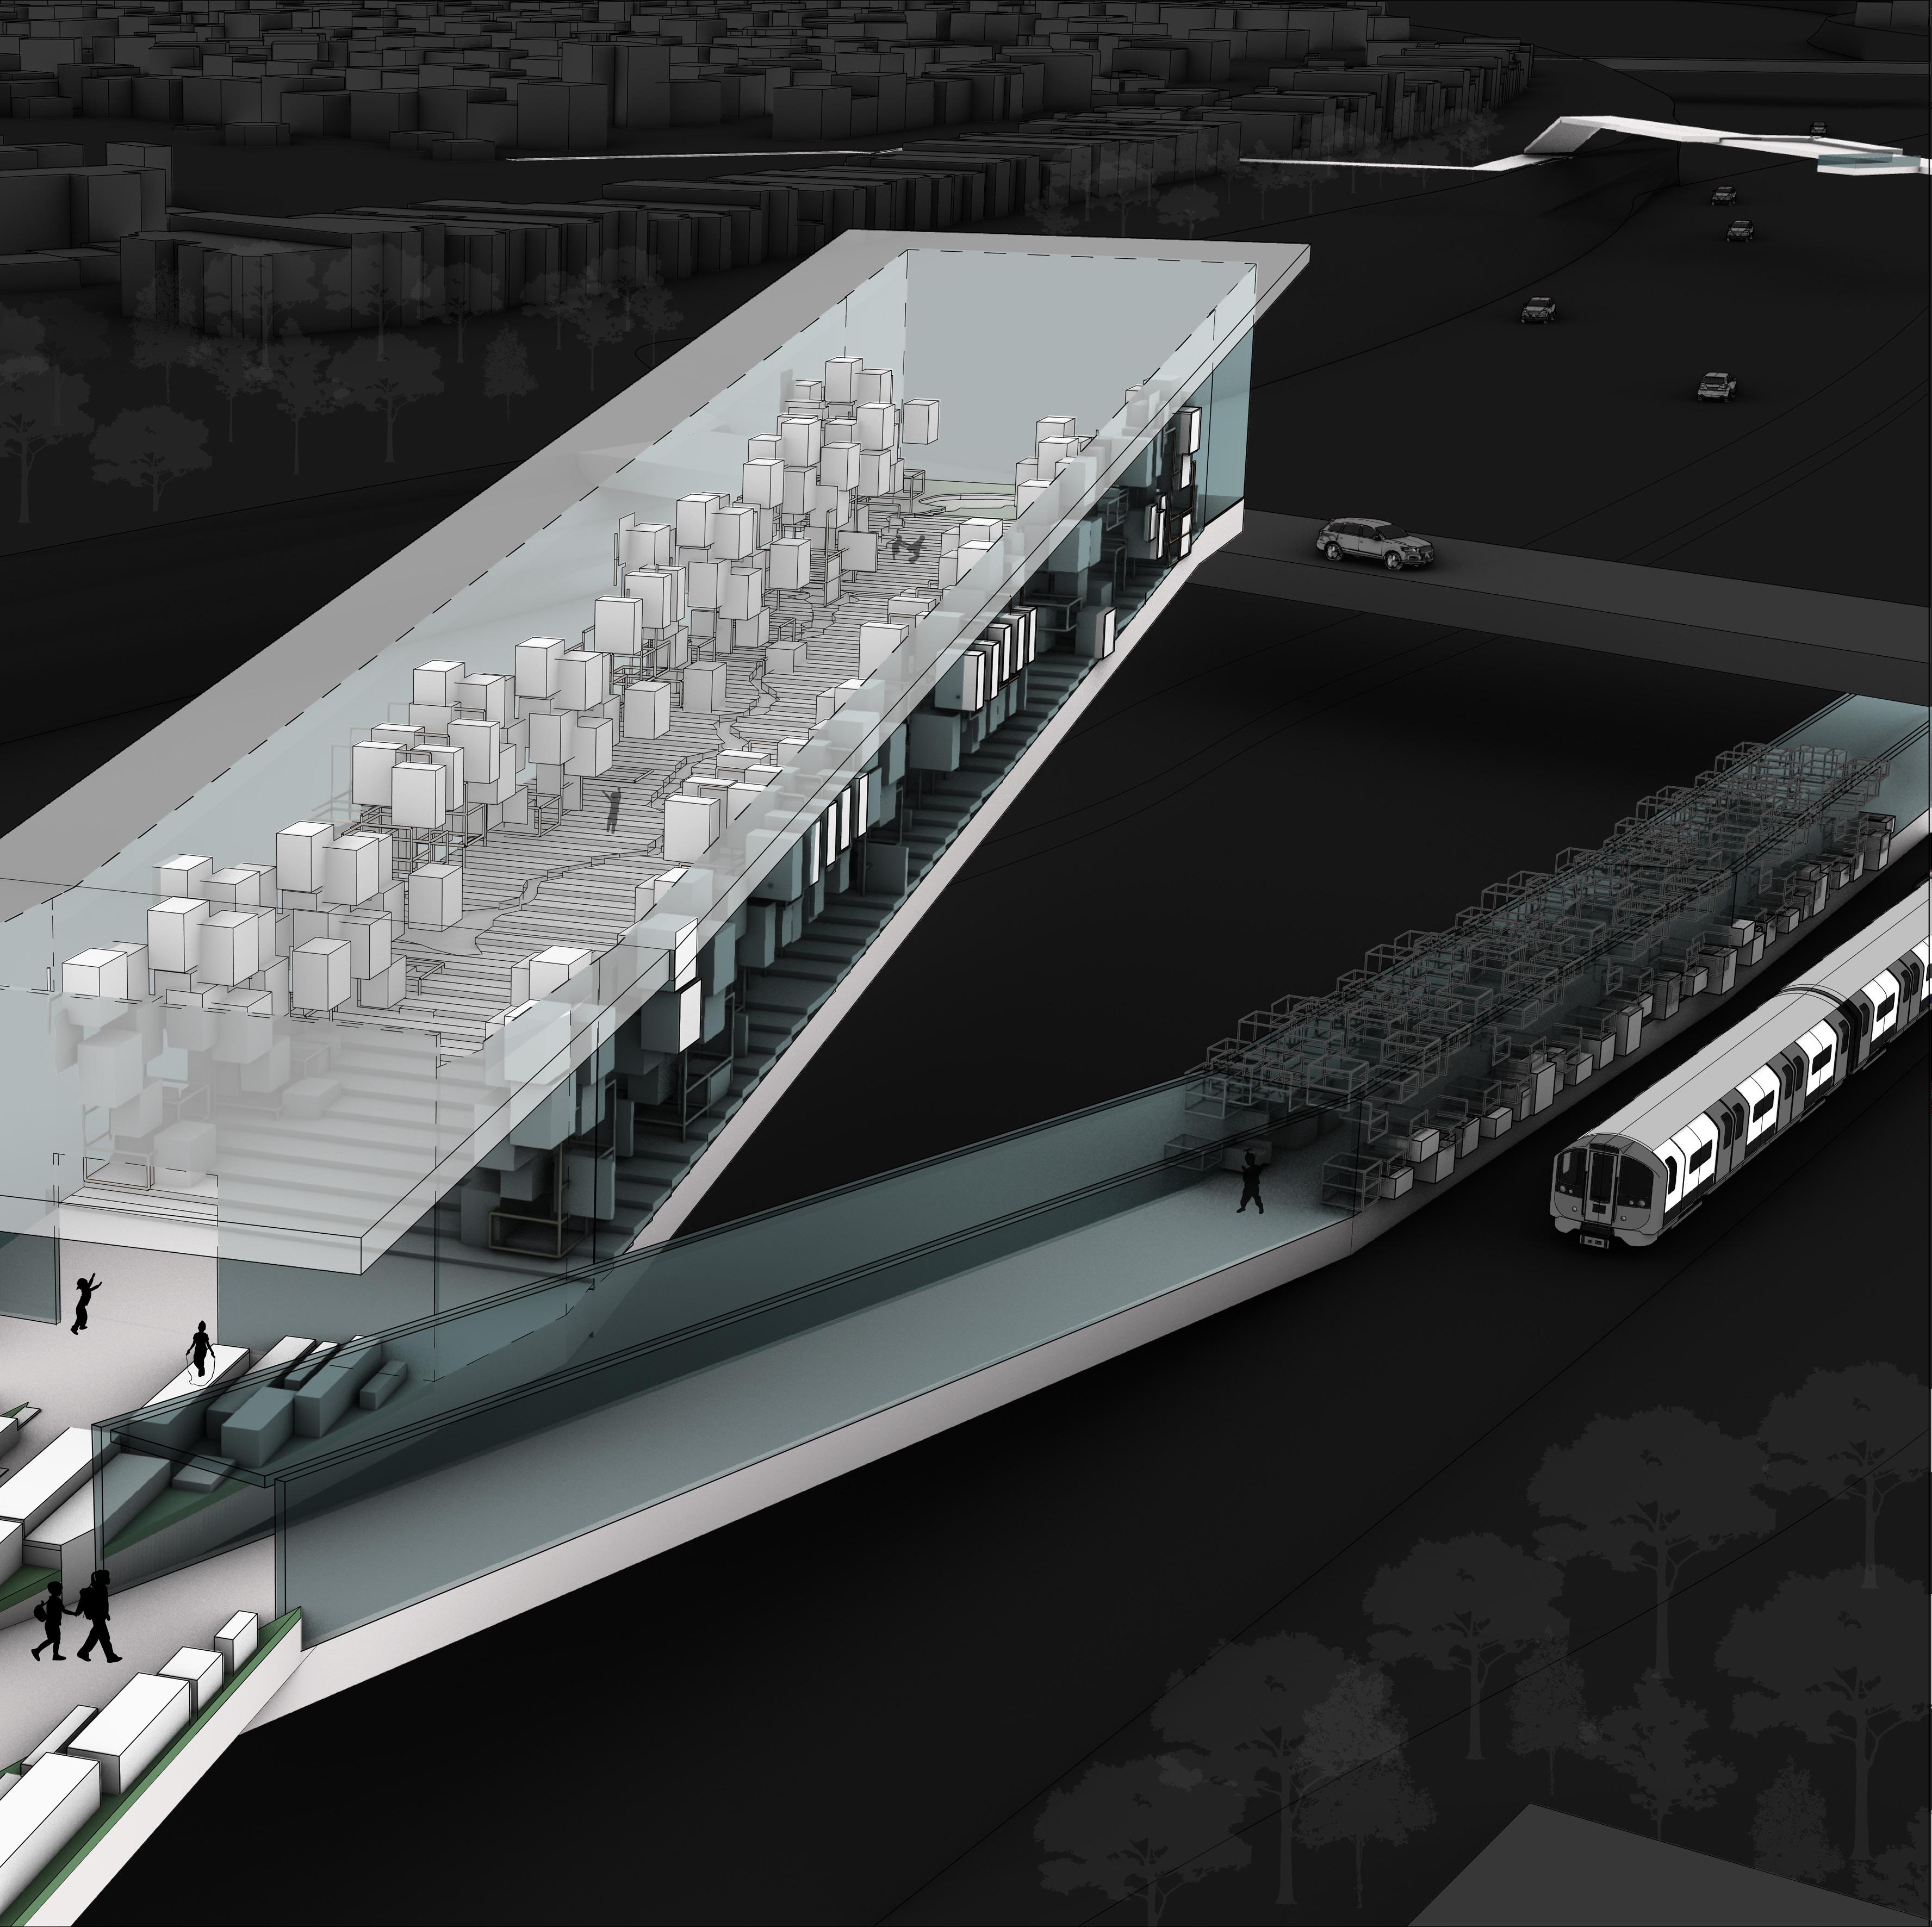
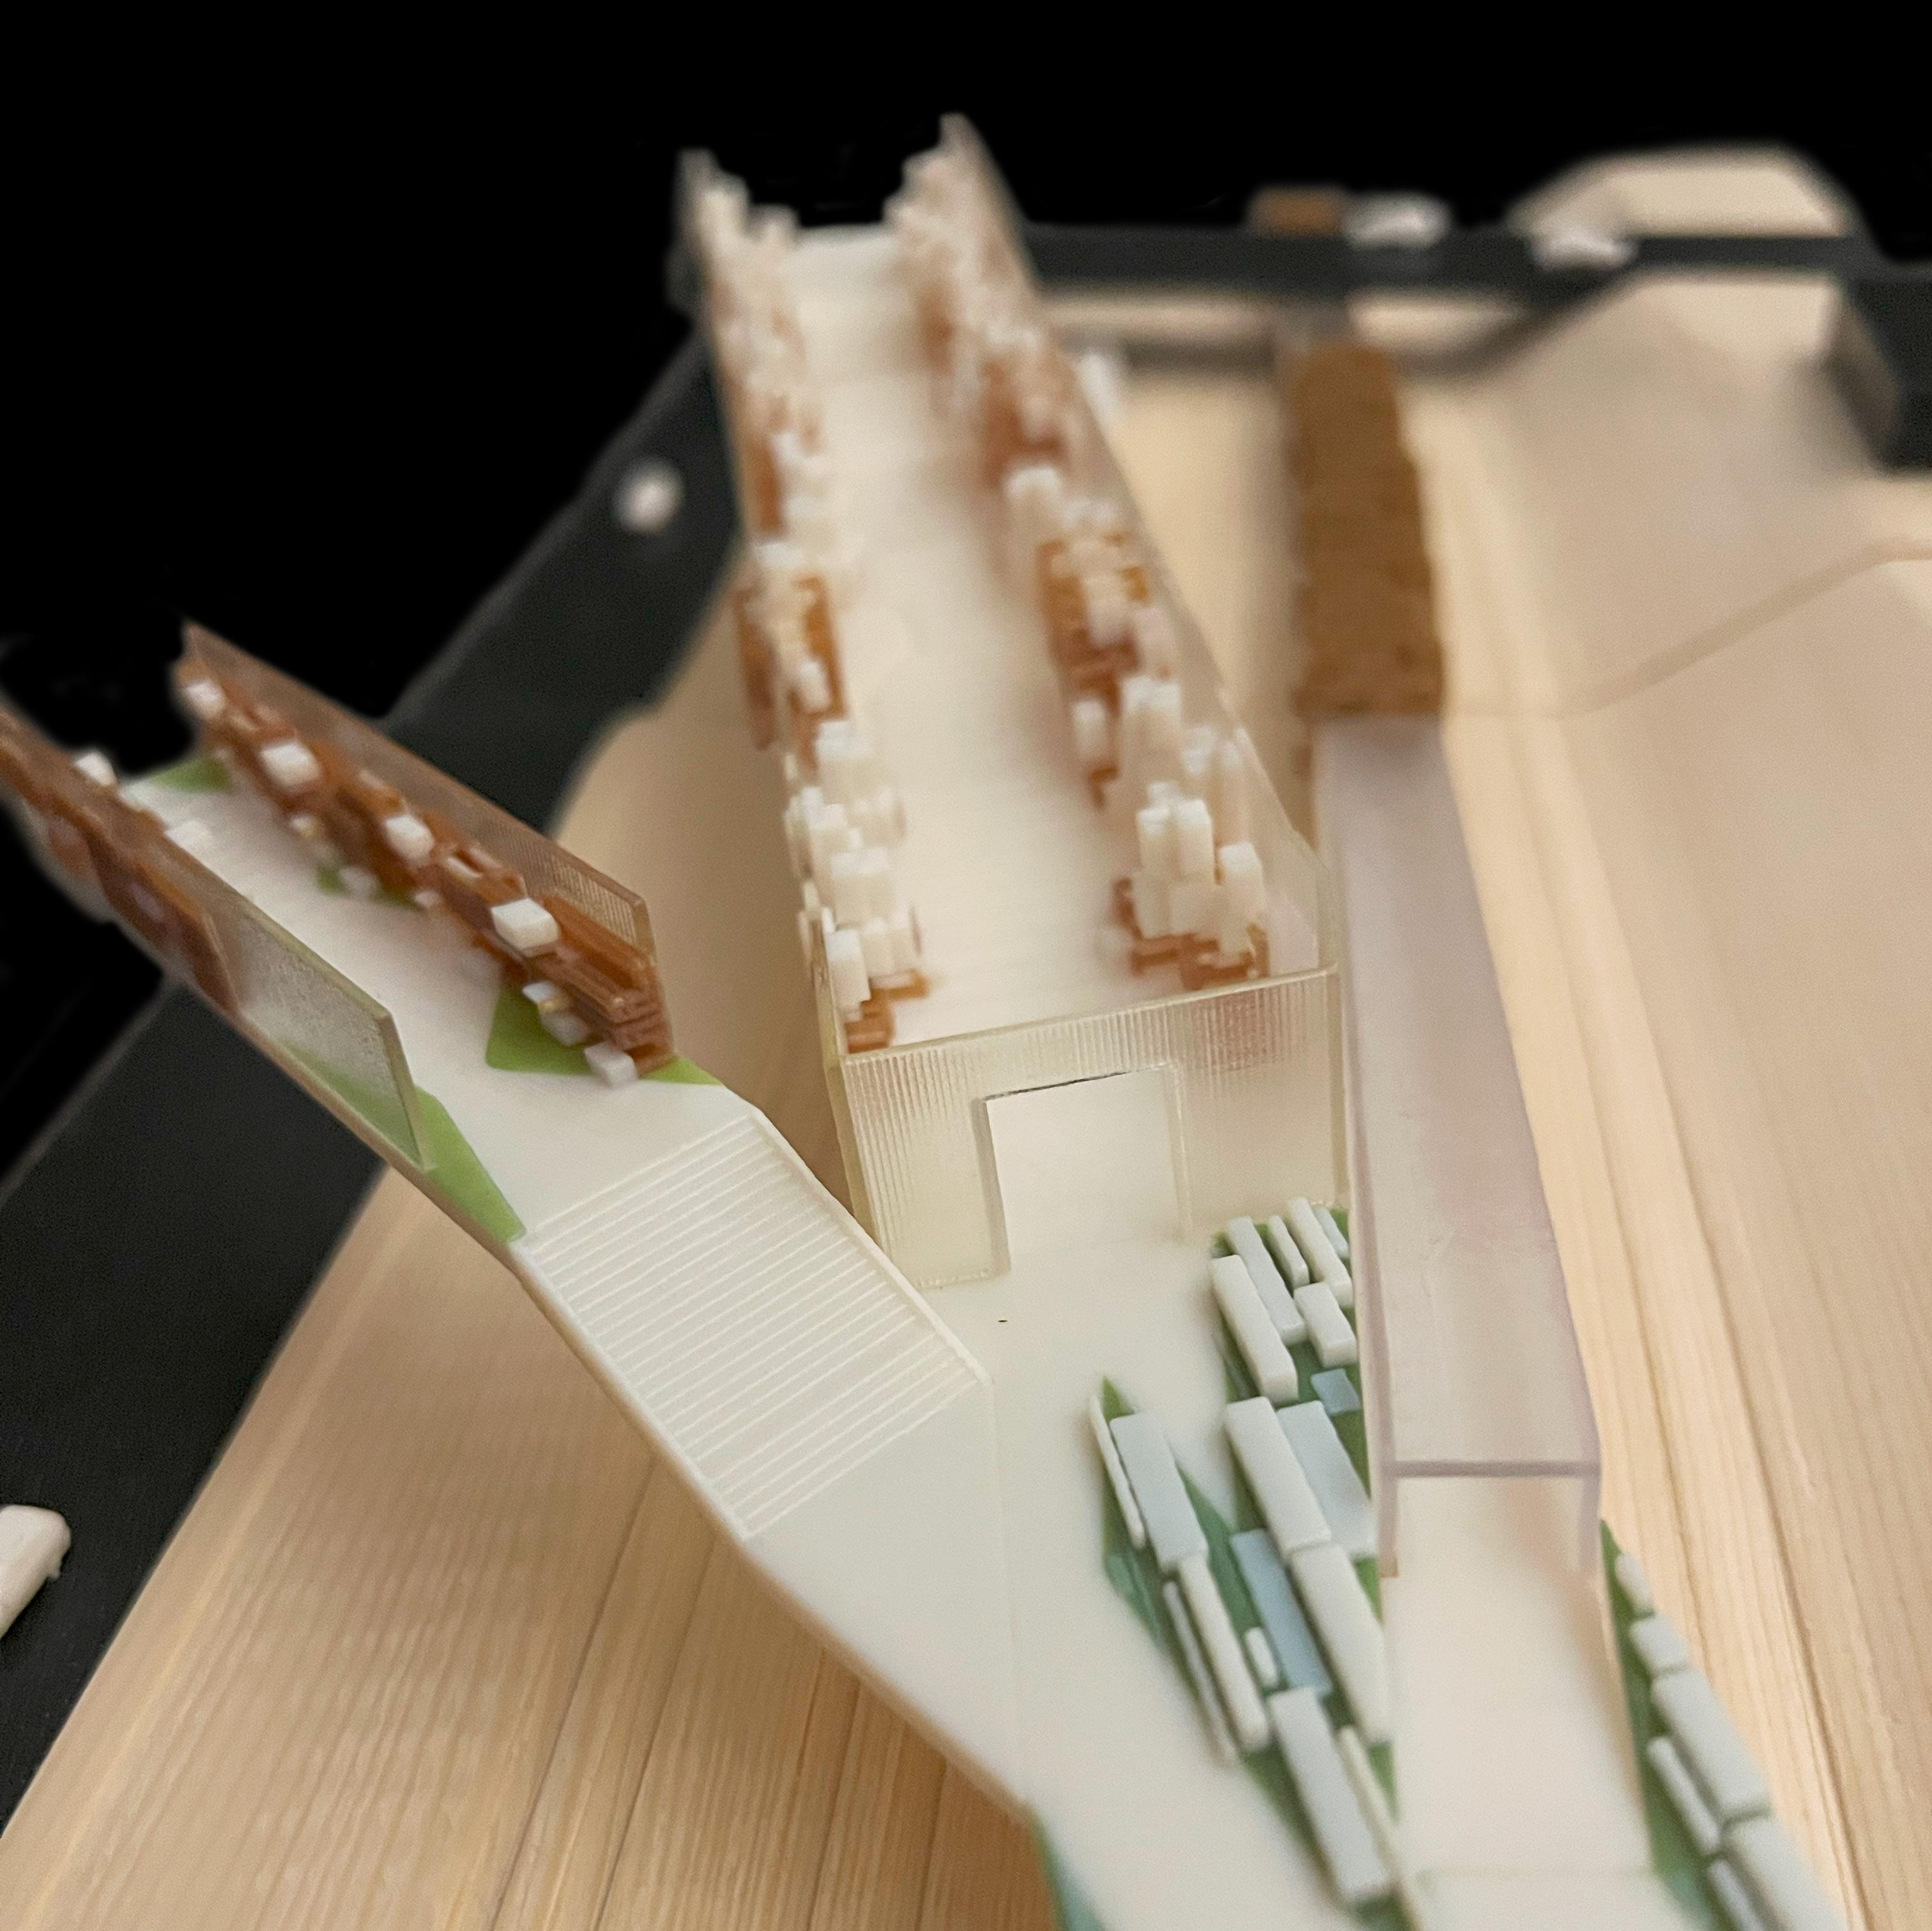
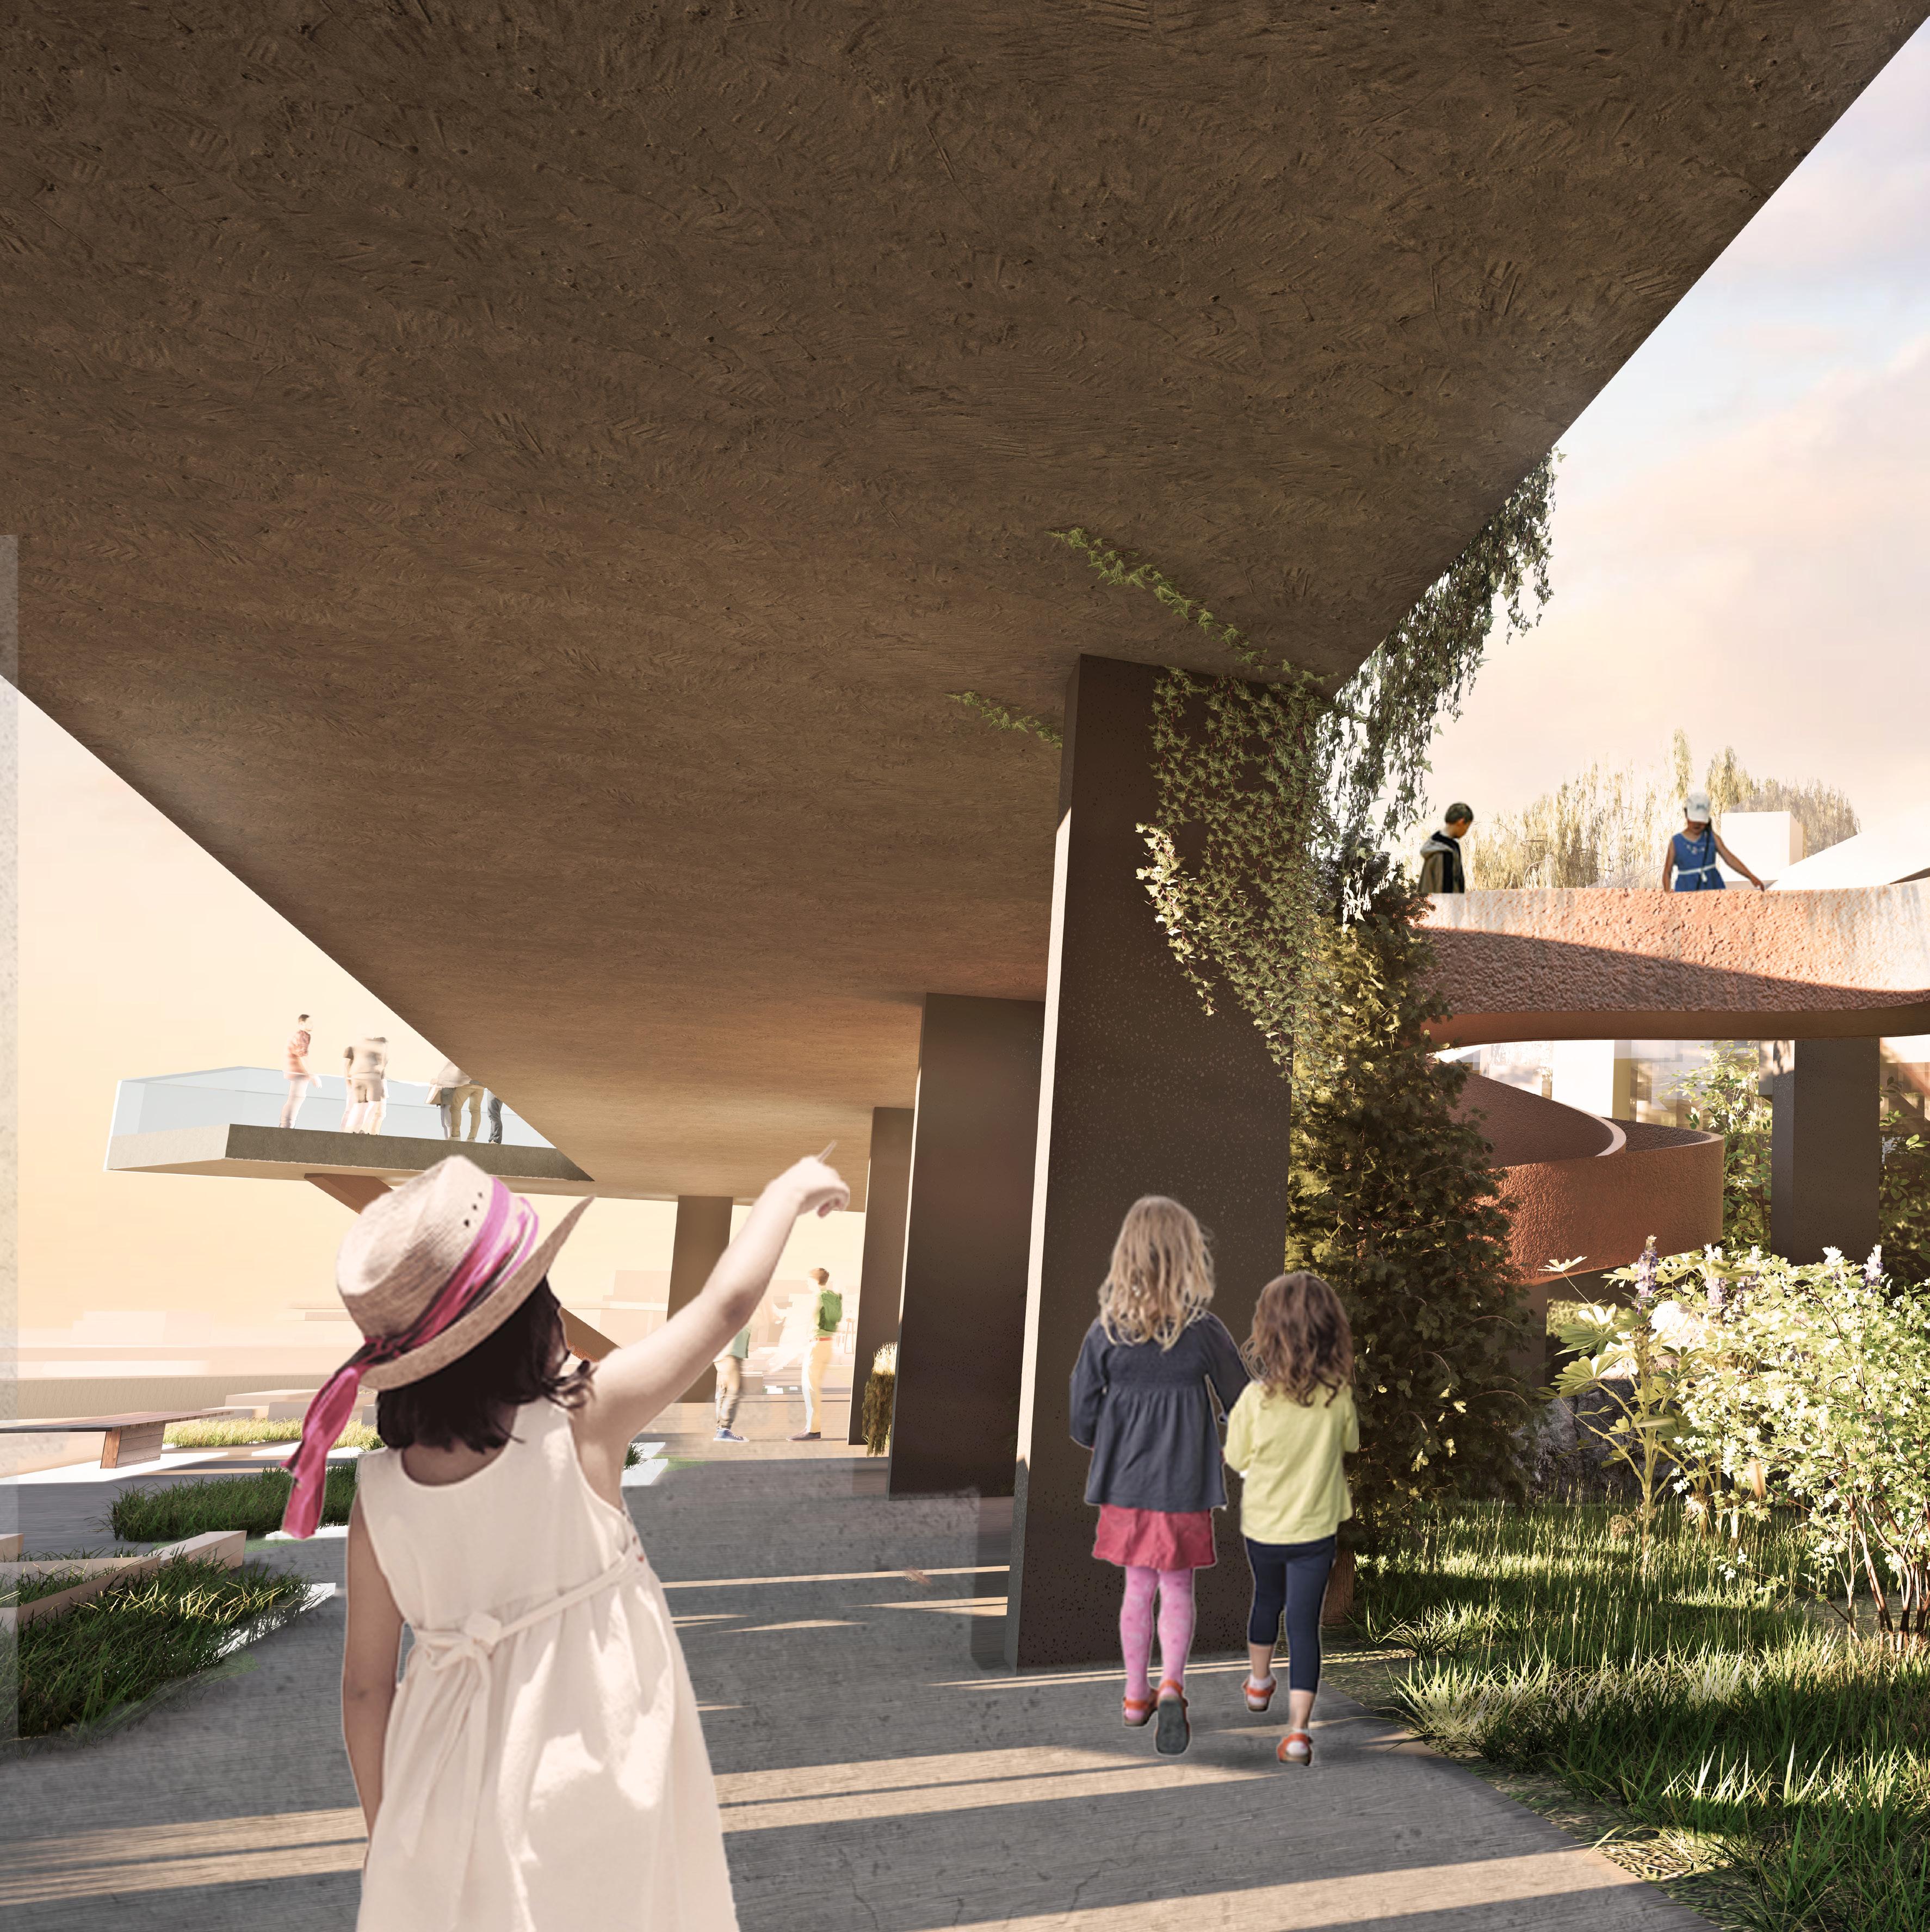
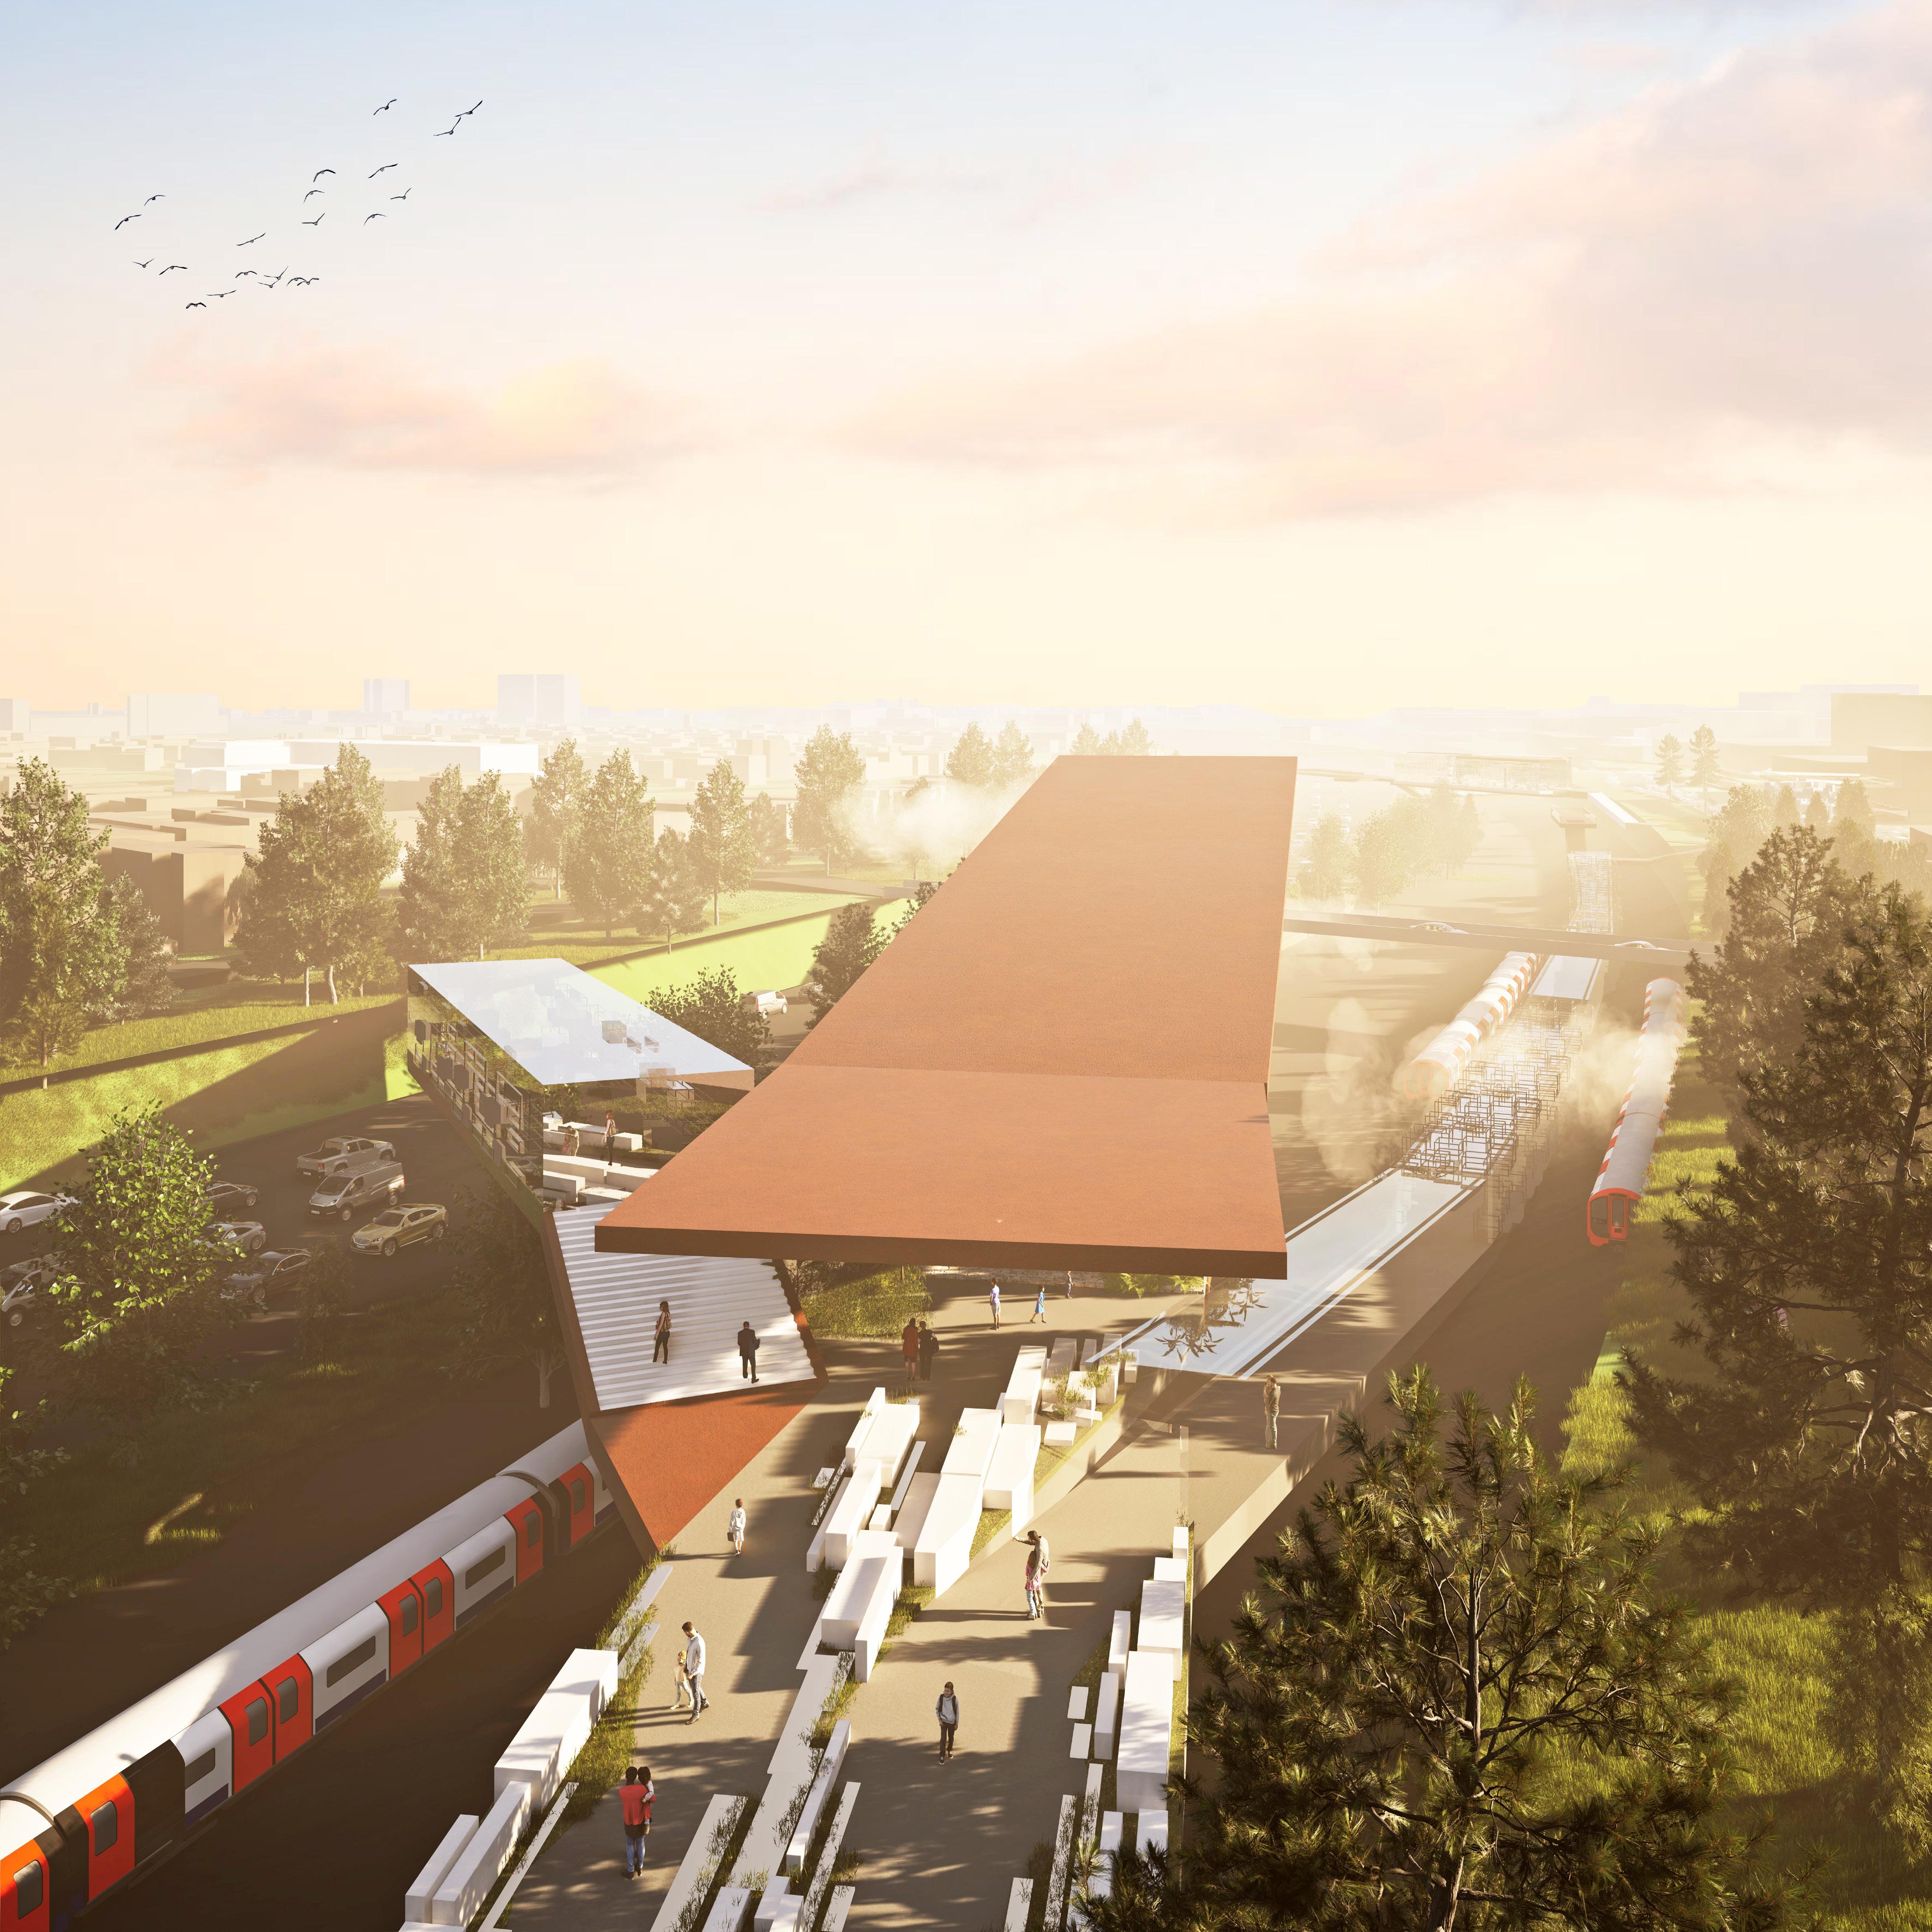
Provides many viewing platforms and lookout spots throughout the site which allows the children to gaze towards the entire site, surrounding railways and bustling metropolis of London.
Provides different functions and programs Empowerment Confidence
INTERVENTIONS
SECONDARY PATHWAY
MAIN PATHWAY
SITE PLAN: AGE CONCEPT SEGMENTATION
For each age between 5 and 11 years, which are the primary school year ages, we researched the most essential skills and ideas children need for their development which are not gained from a traditional school. We applied this idea to our site and segmented the site into three age-group sections. The sections being:
5-7 years old in cyan 7-9 years old in yellow 10-11 years old in neon red
So, the idea is, as you walk through the site, the interventions and educational spaces become suited to specific age-groups in chronological order. So, for each one of our interventions, we paired them and placed them in the most suitable age group in terms of significance to their development at their age. The overlapping zones between each age group section act as All-age inclusive zones due to their interventions and corresponding educational aspects being suited to all the age groups.
10-11 YEAR OLDS
5-7 YEAR OLDS
7-9 YEAR OLDS
ALL-AGE INCLUSIVE ZONE 2 EDUCATIONAL ASPECTS
ENVIRONMENTAL, SOCIAL, EMOTIONAL & EXPLORATORY
ALL-AGE INCLUSIVE ZONE 1 EDUCATIONAL ASPECTS
ENVIRONMENTAL, SOCIAL & AGRICULTURAL
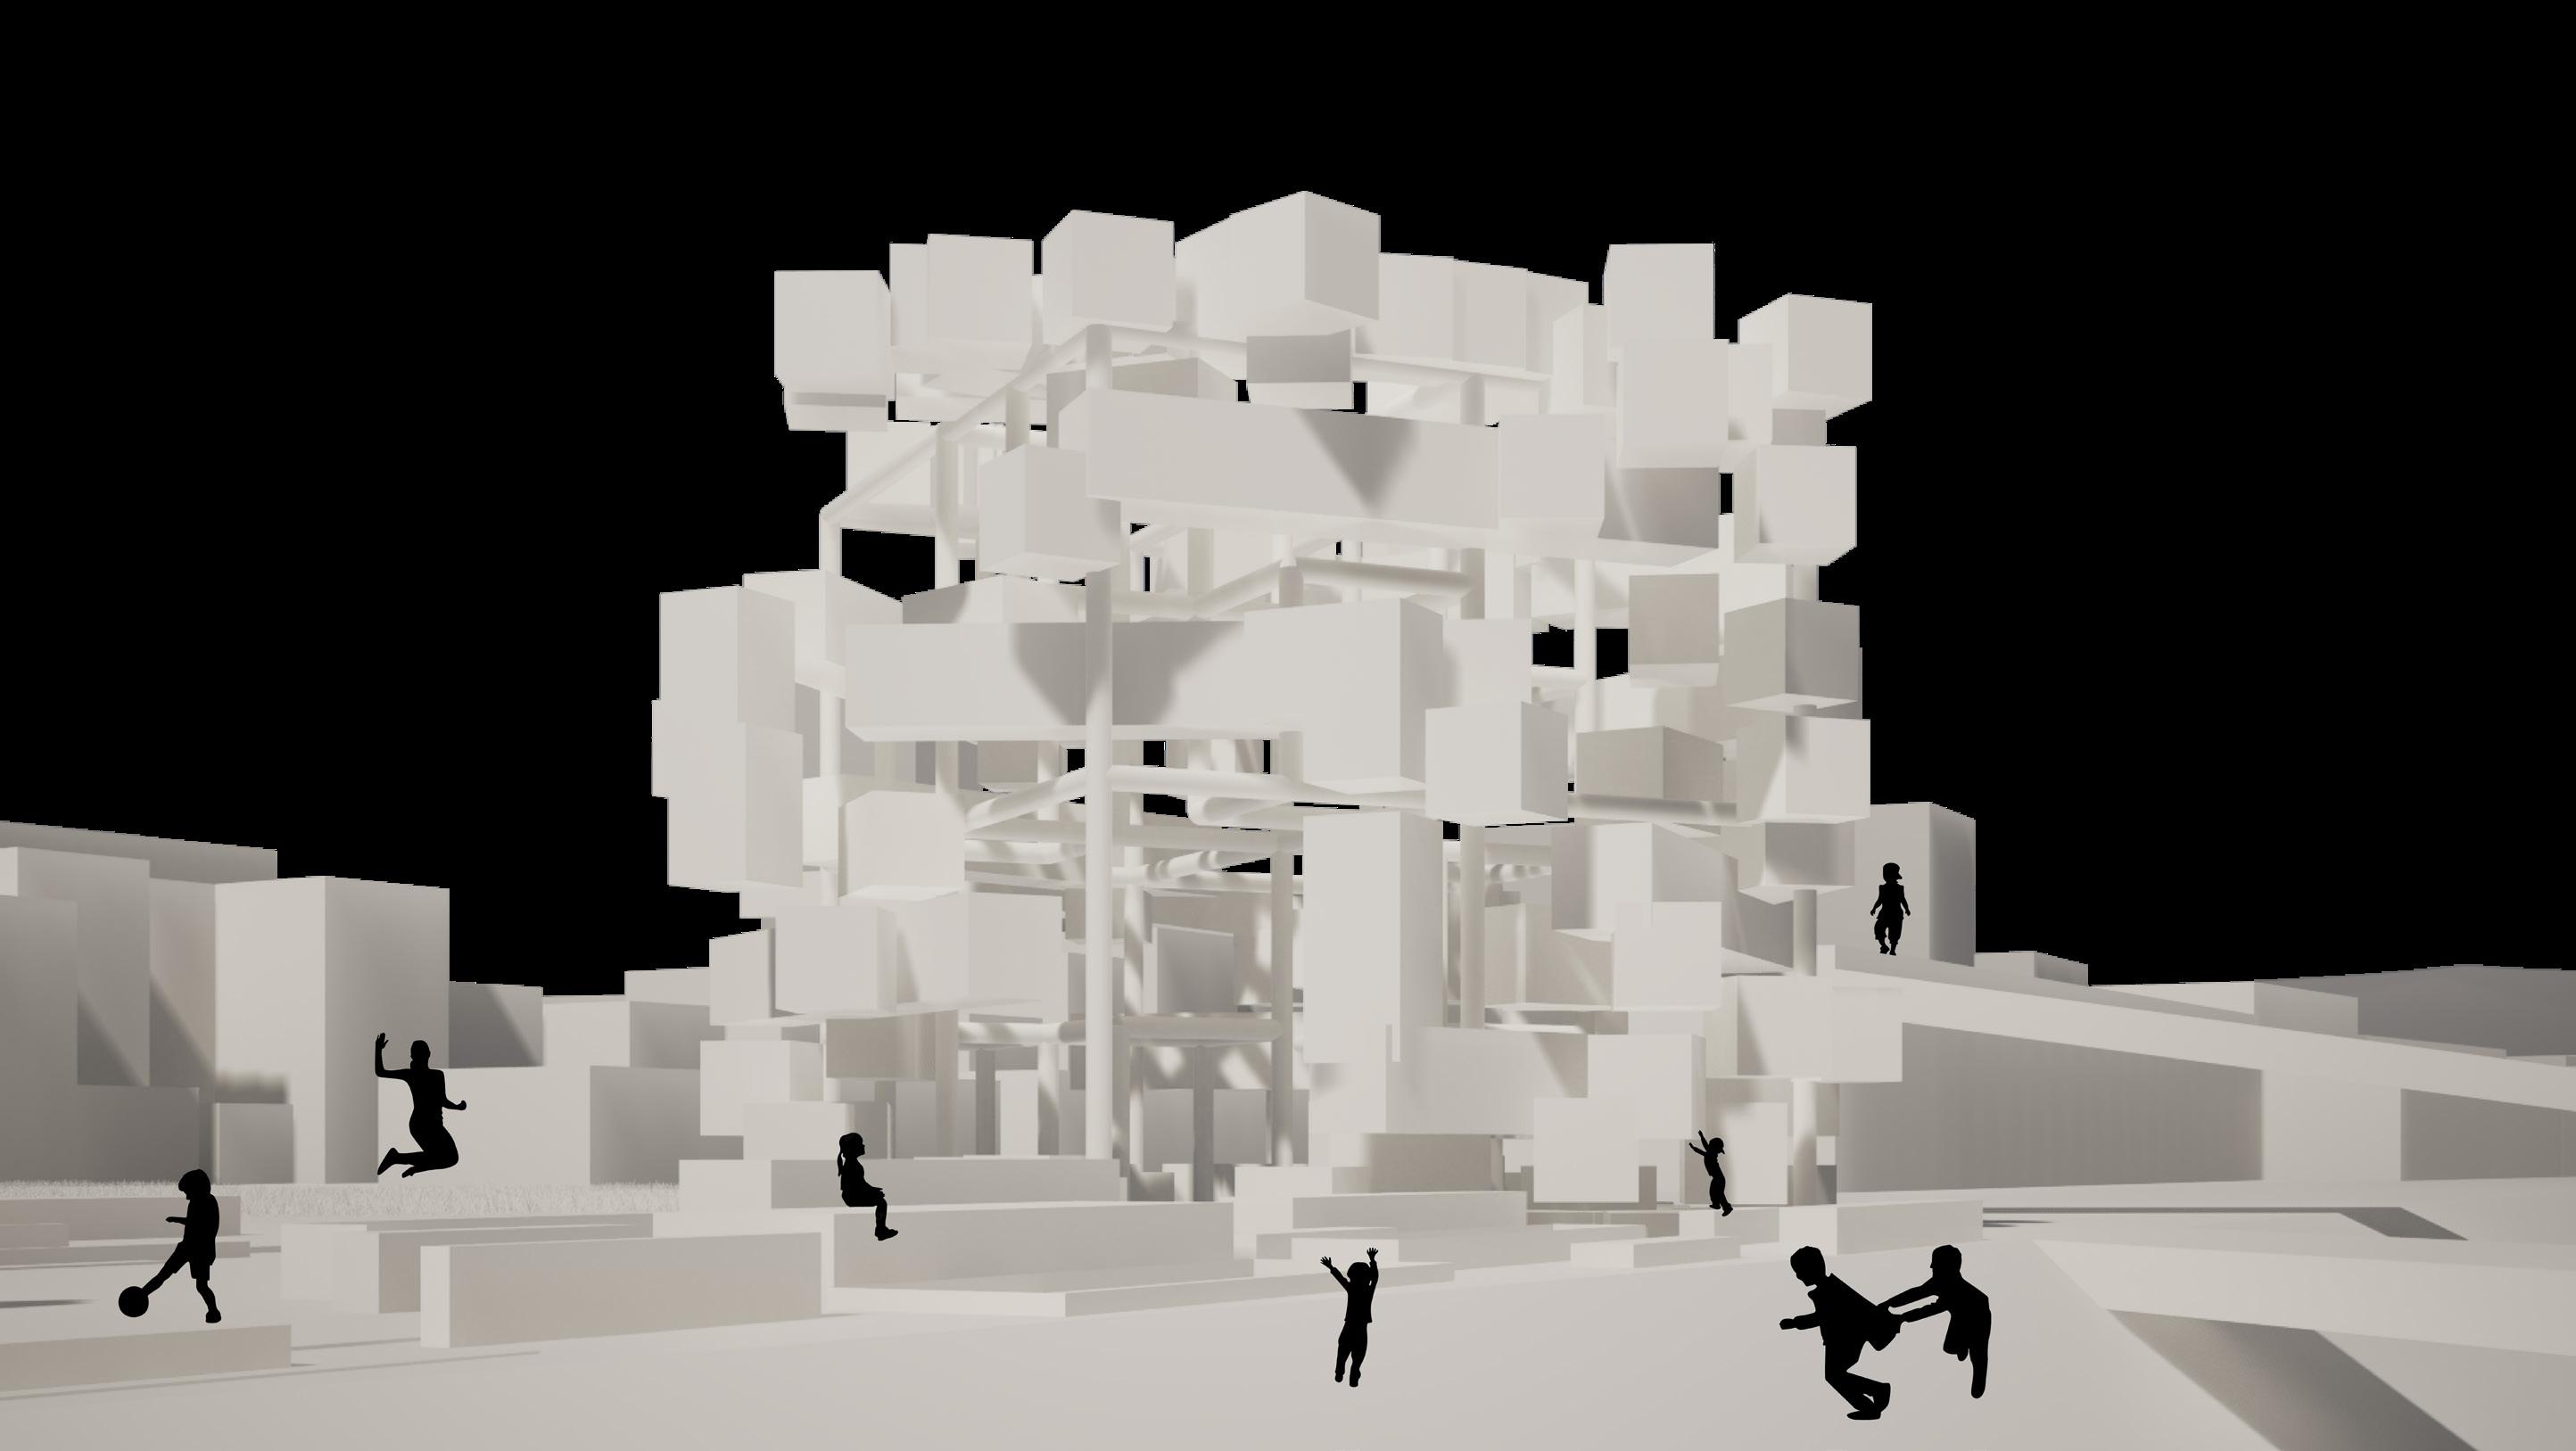
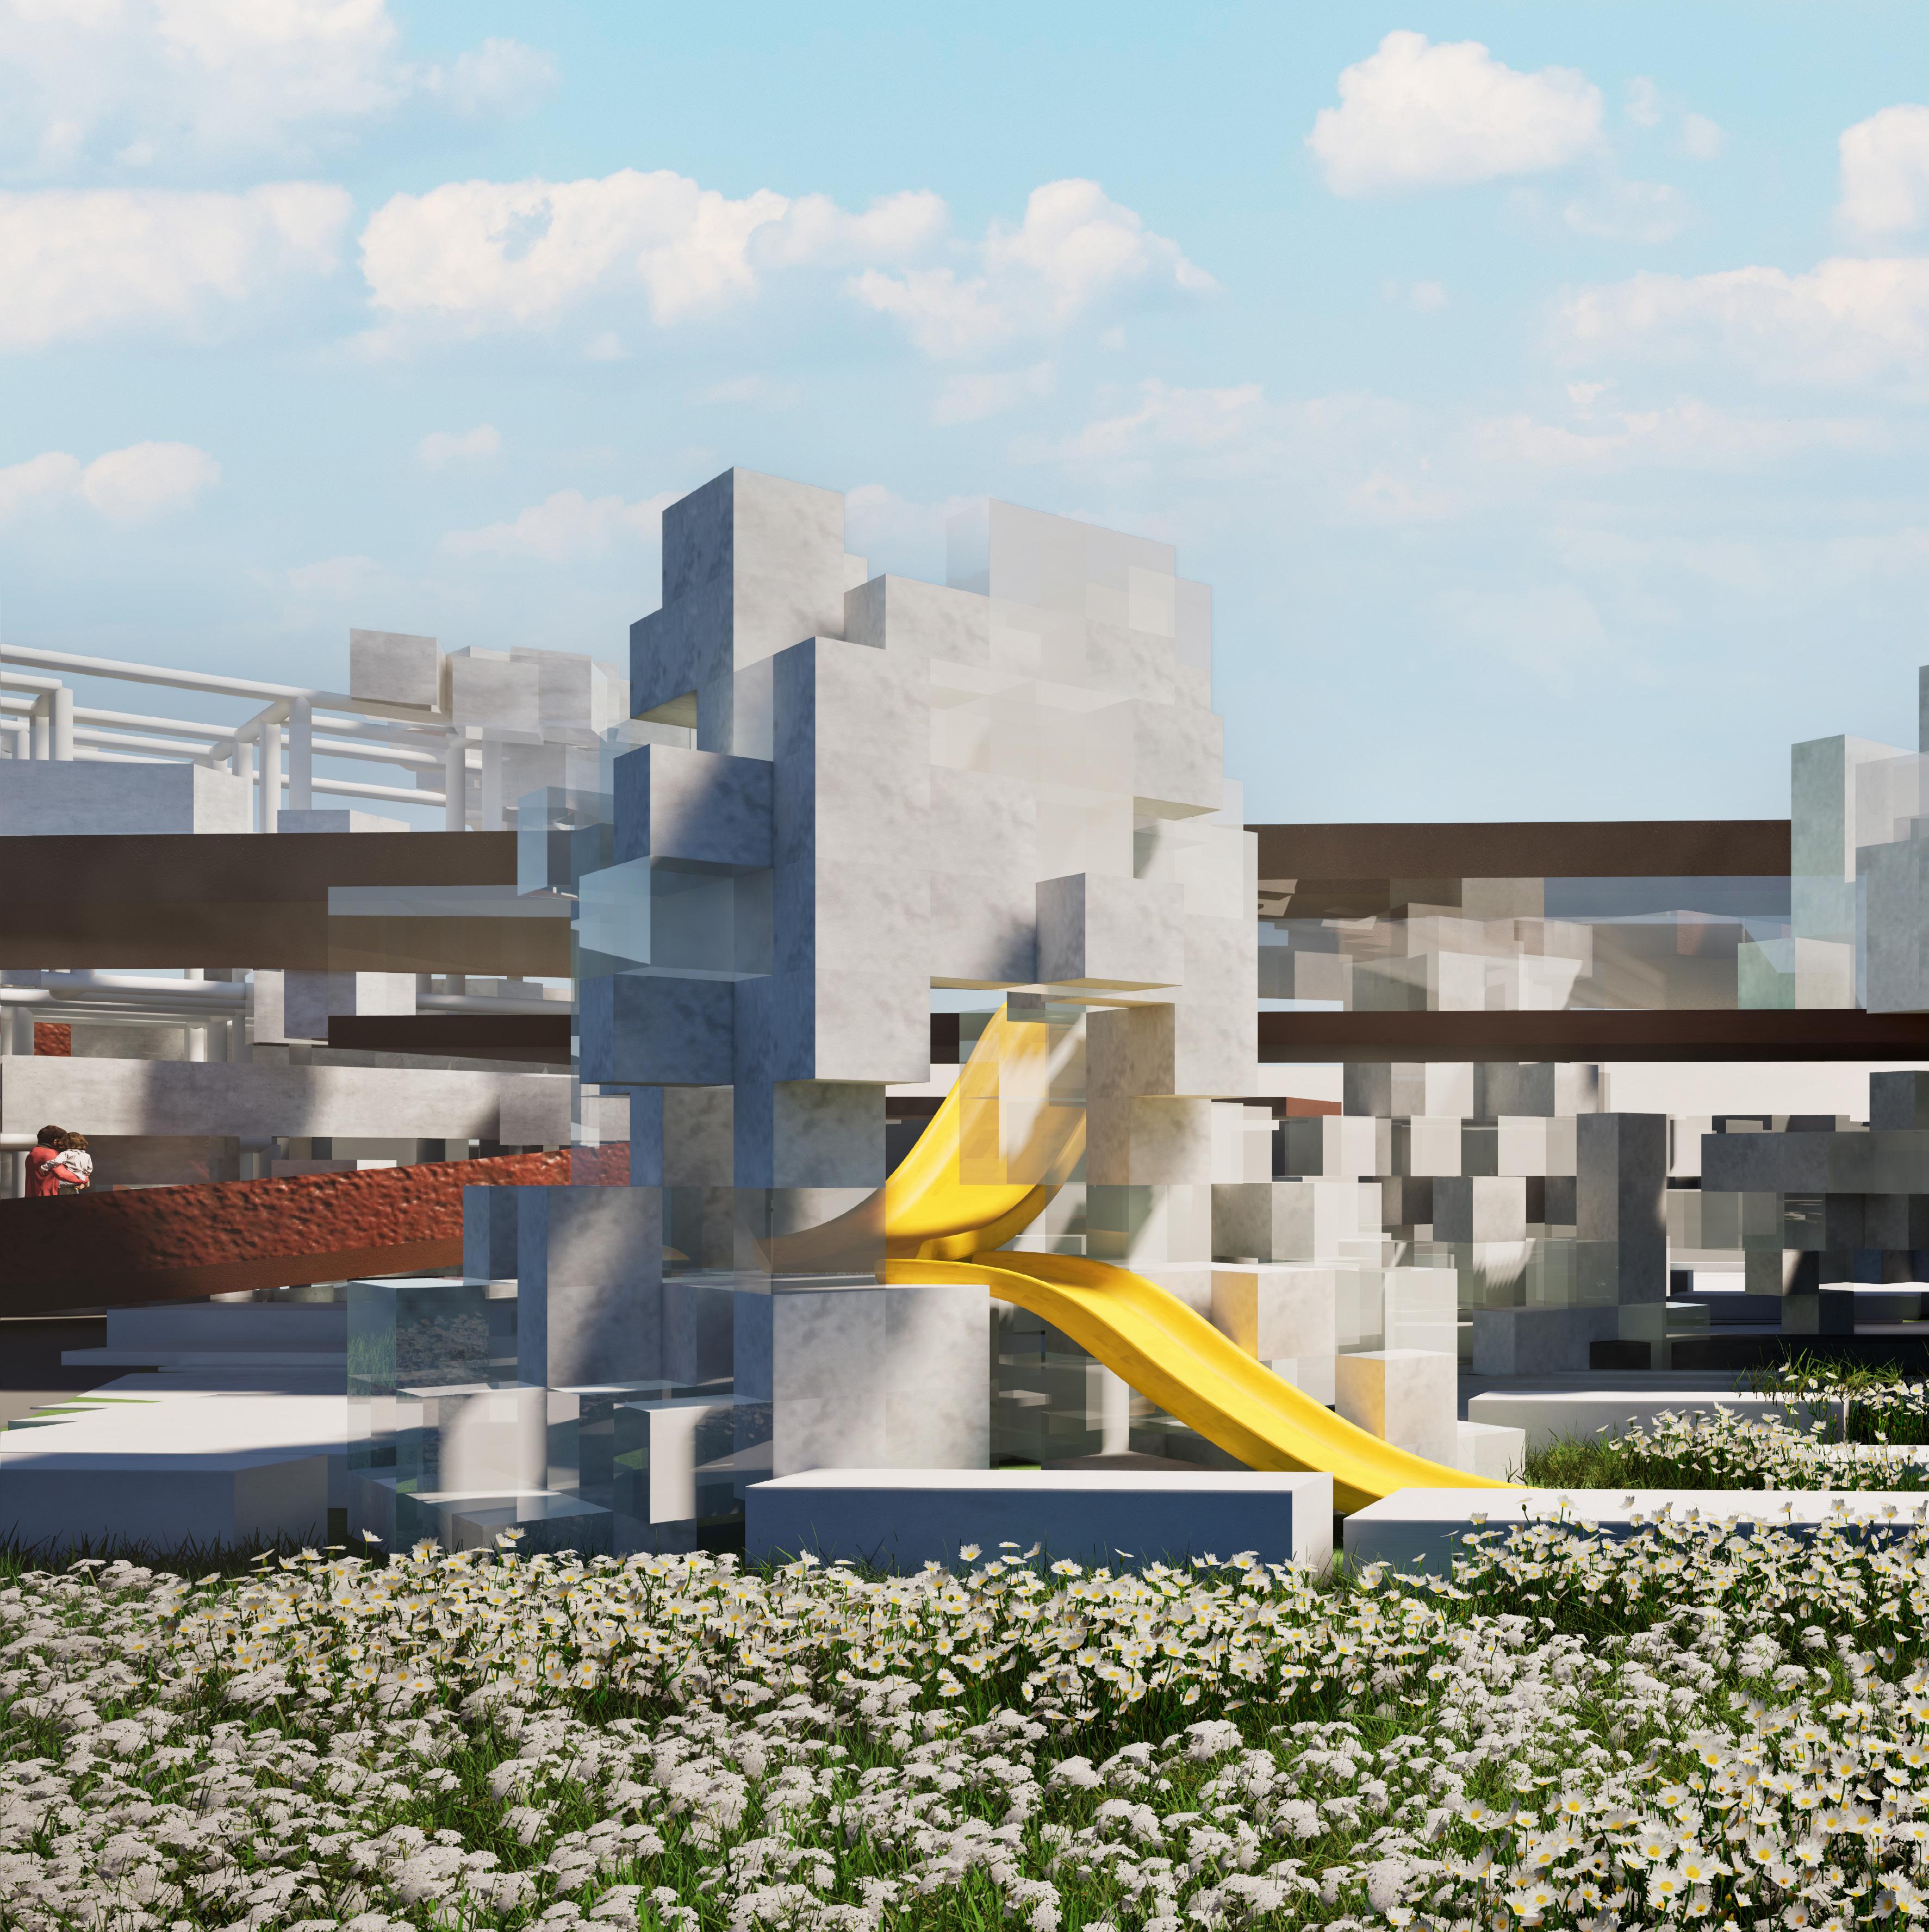
EMOTIONAL INTERACTIVE TOWER
PLAYGROUND
SOCIAL GATHERING SPACE
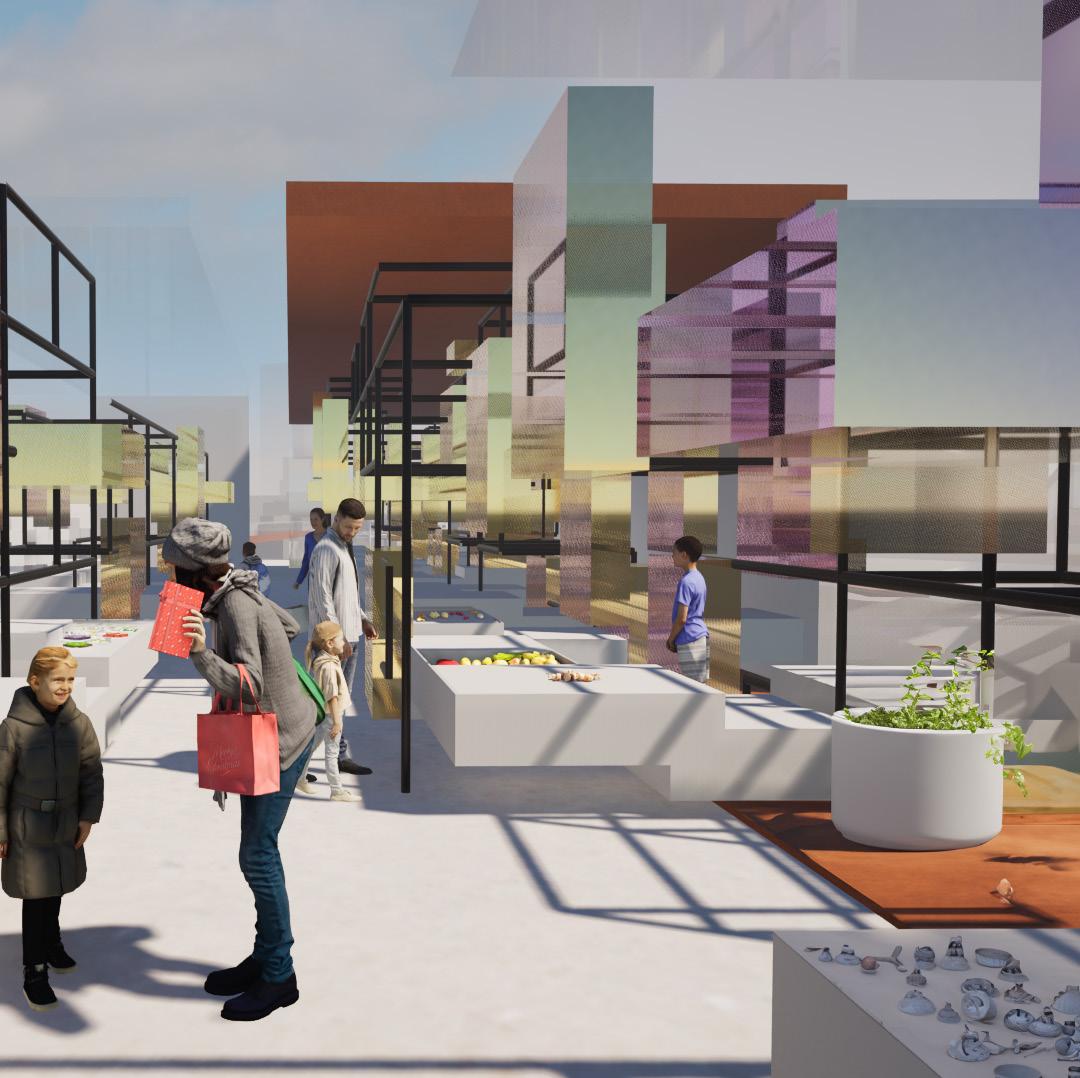
MARKET
ENTRANCE BUS STOPS
TROPICAL GARDEN
FARMING TUNNEL
SENSORY SANCTUARY
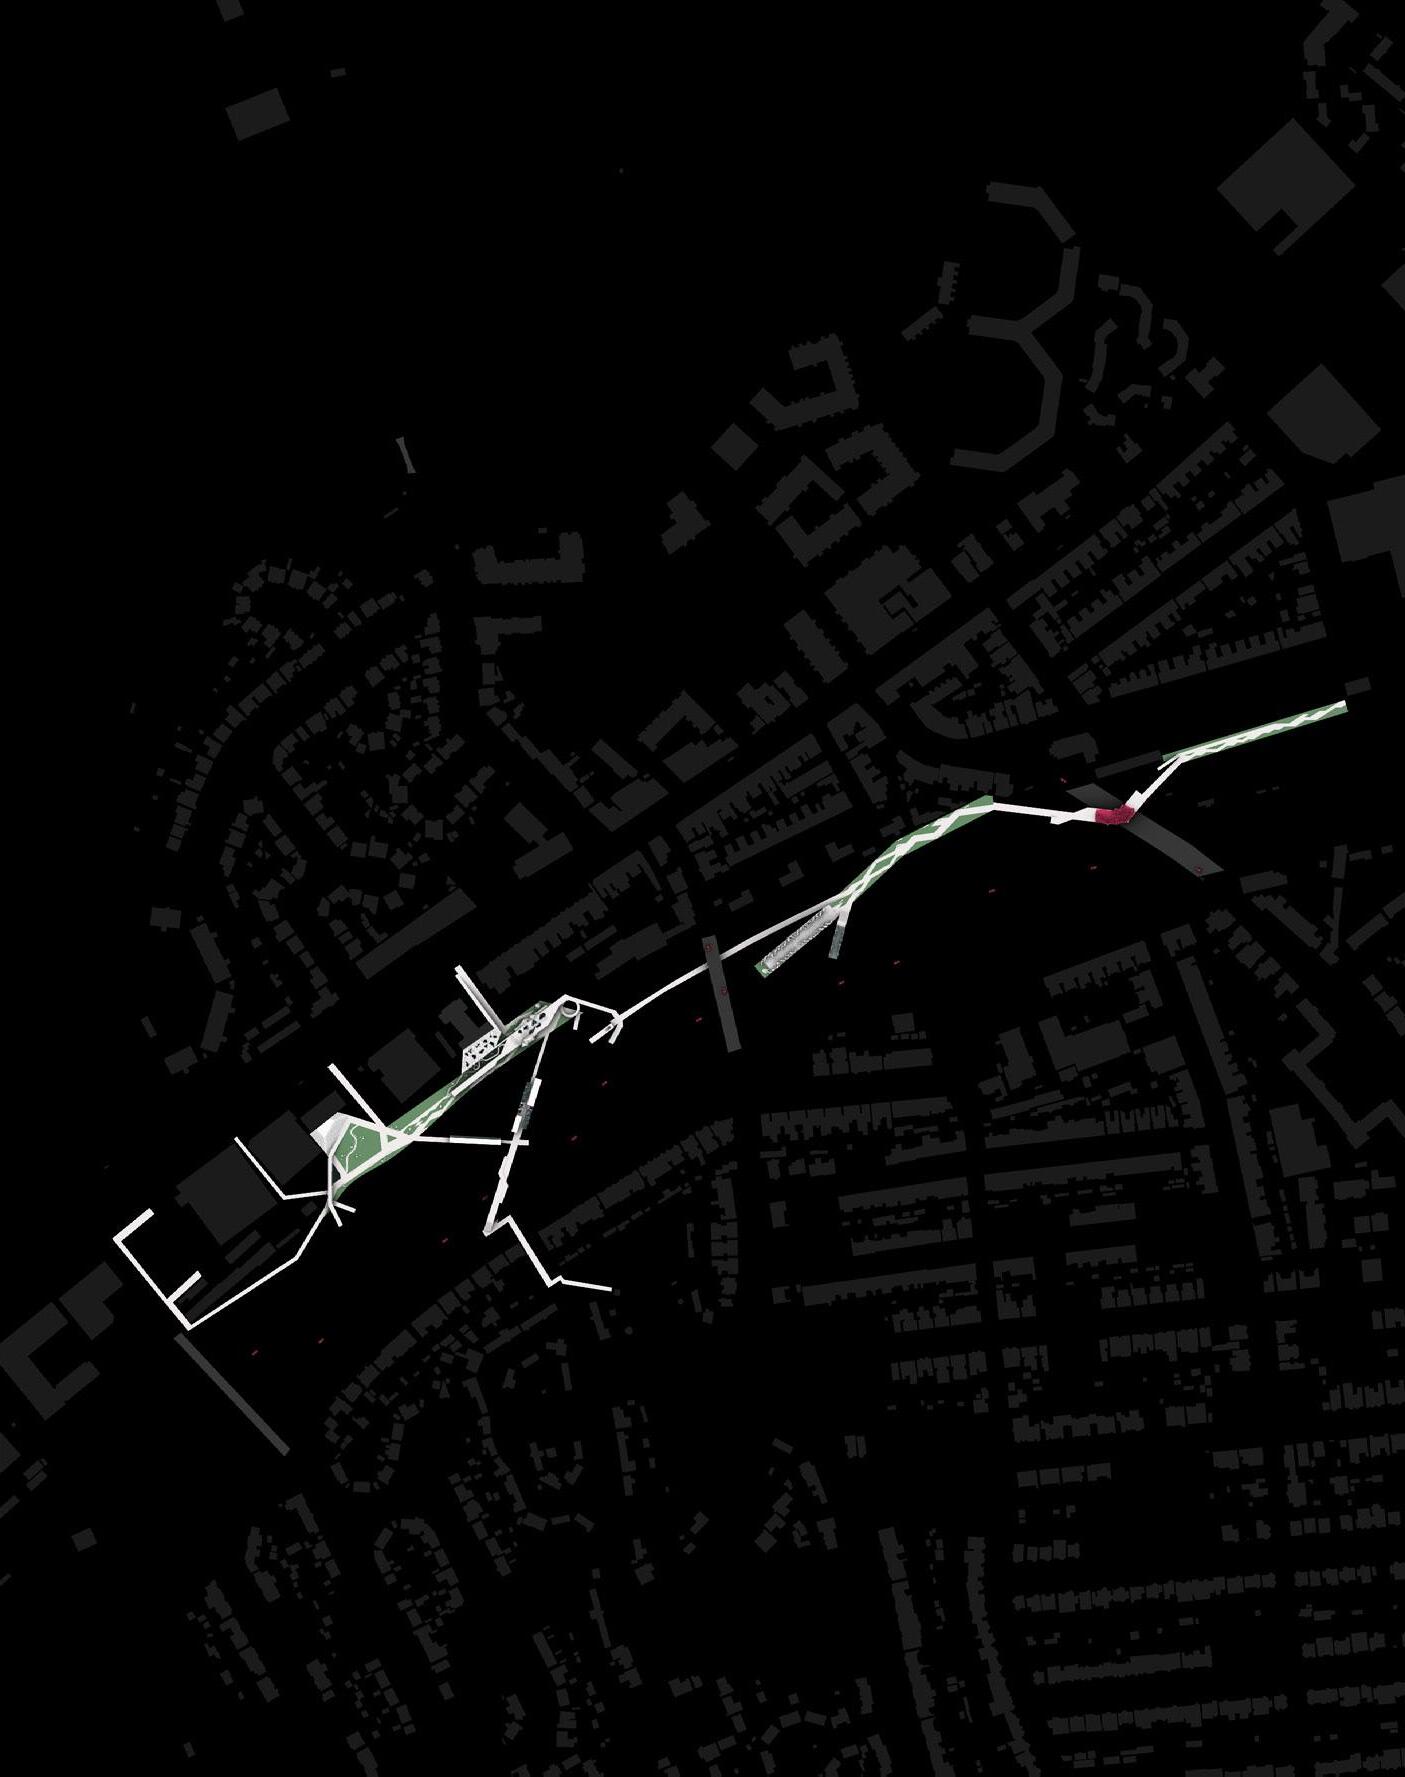
READING SPACE
INTERVENTIONS: READING SPACE
Age Group Suitability: 5 to 7-year-olds
Educational Aspect:
• Comfortable open-spaced and inspiring environment
• Diverse and multicultural literature to expose children to a wide range of perspectives and experiences
• Space serves as an active book swap space where children can share and discuss books in a positive open-spaced environment
• Diverse literature helps develop empathy, emotional intelligence, and self-awareness
Targeted Factor/s: Education, Health
INTERVENTIONS: SENSORY SANCTUARY
Age Group Suitability: 5 to 7-year-olds
Educational Aspect:
• Children can engage in activities such as feeding, walking with, and observing animals in a controlled, educational setting
• Plant species in the sanctuary exposes students to a wide range of textures, scents, and visual stimuli
• Visually stimulating flowers and colors
• Misty atmosphere to create a relaxing space
Targeted Factor/s: Education, Safety, Movement, Health
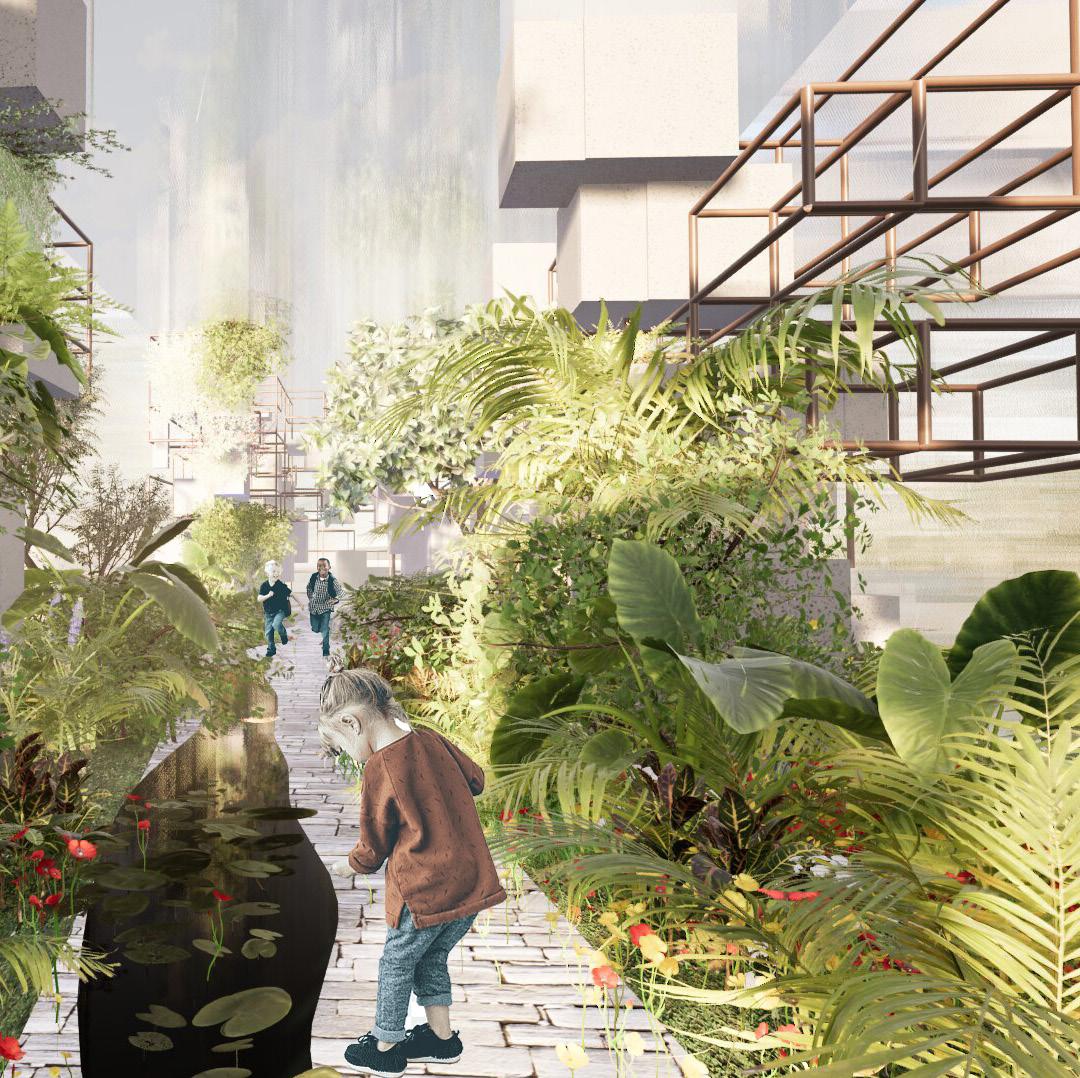
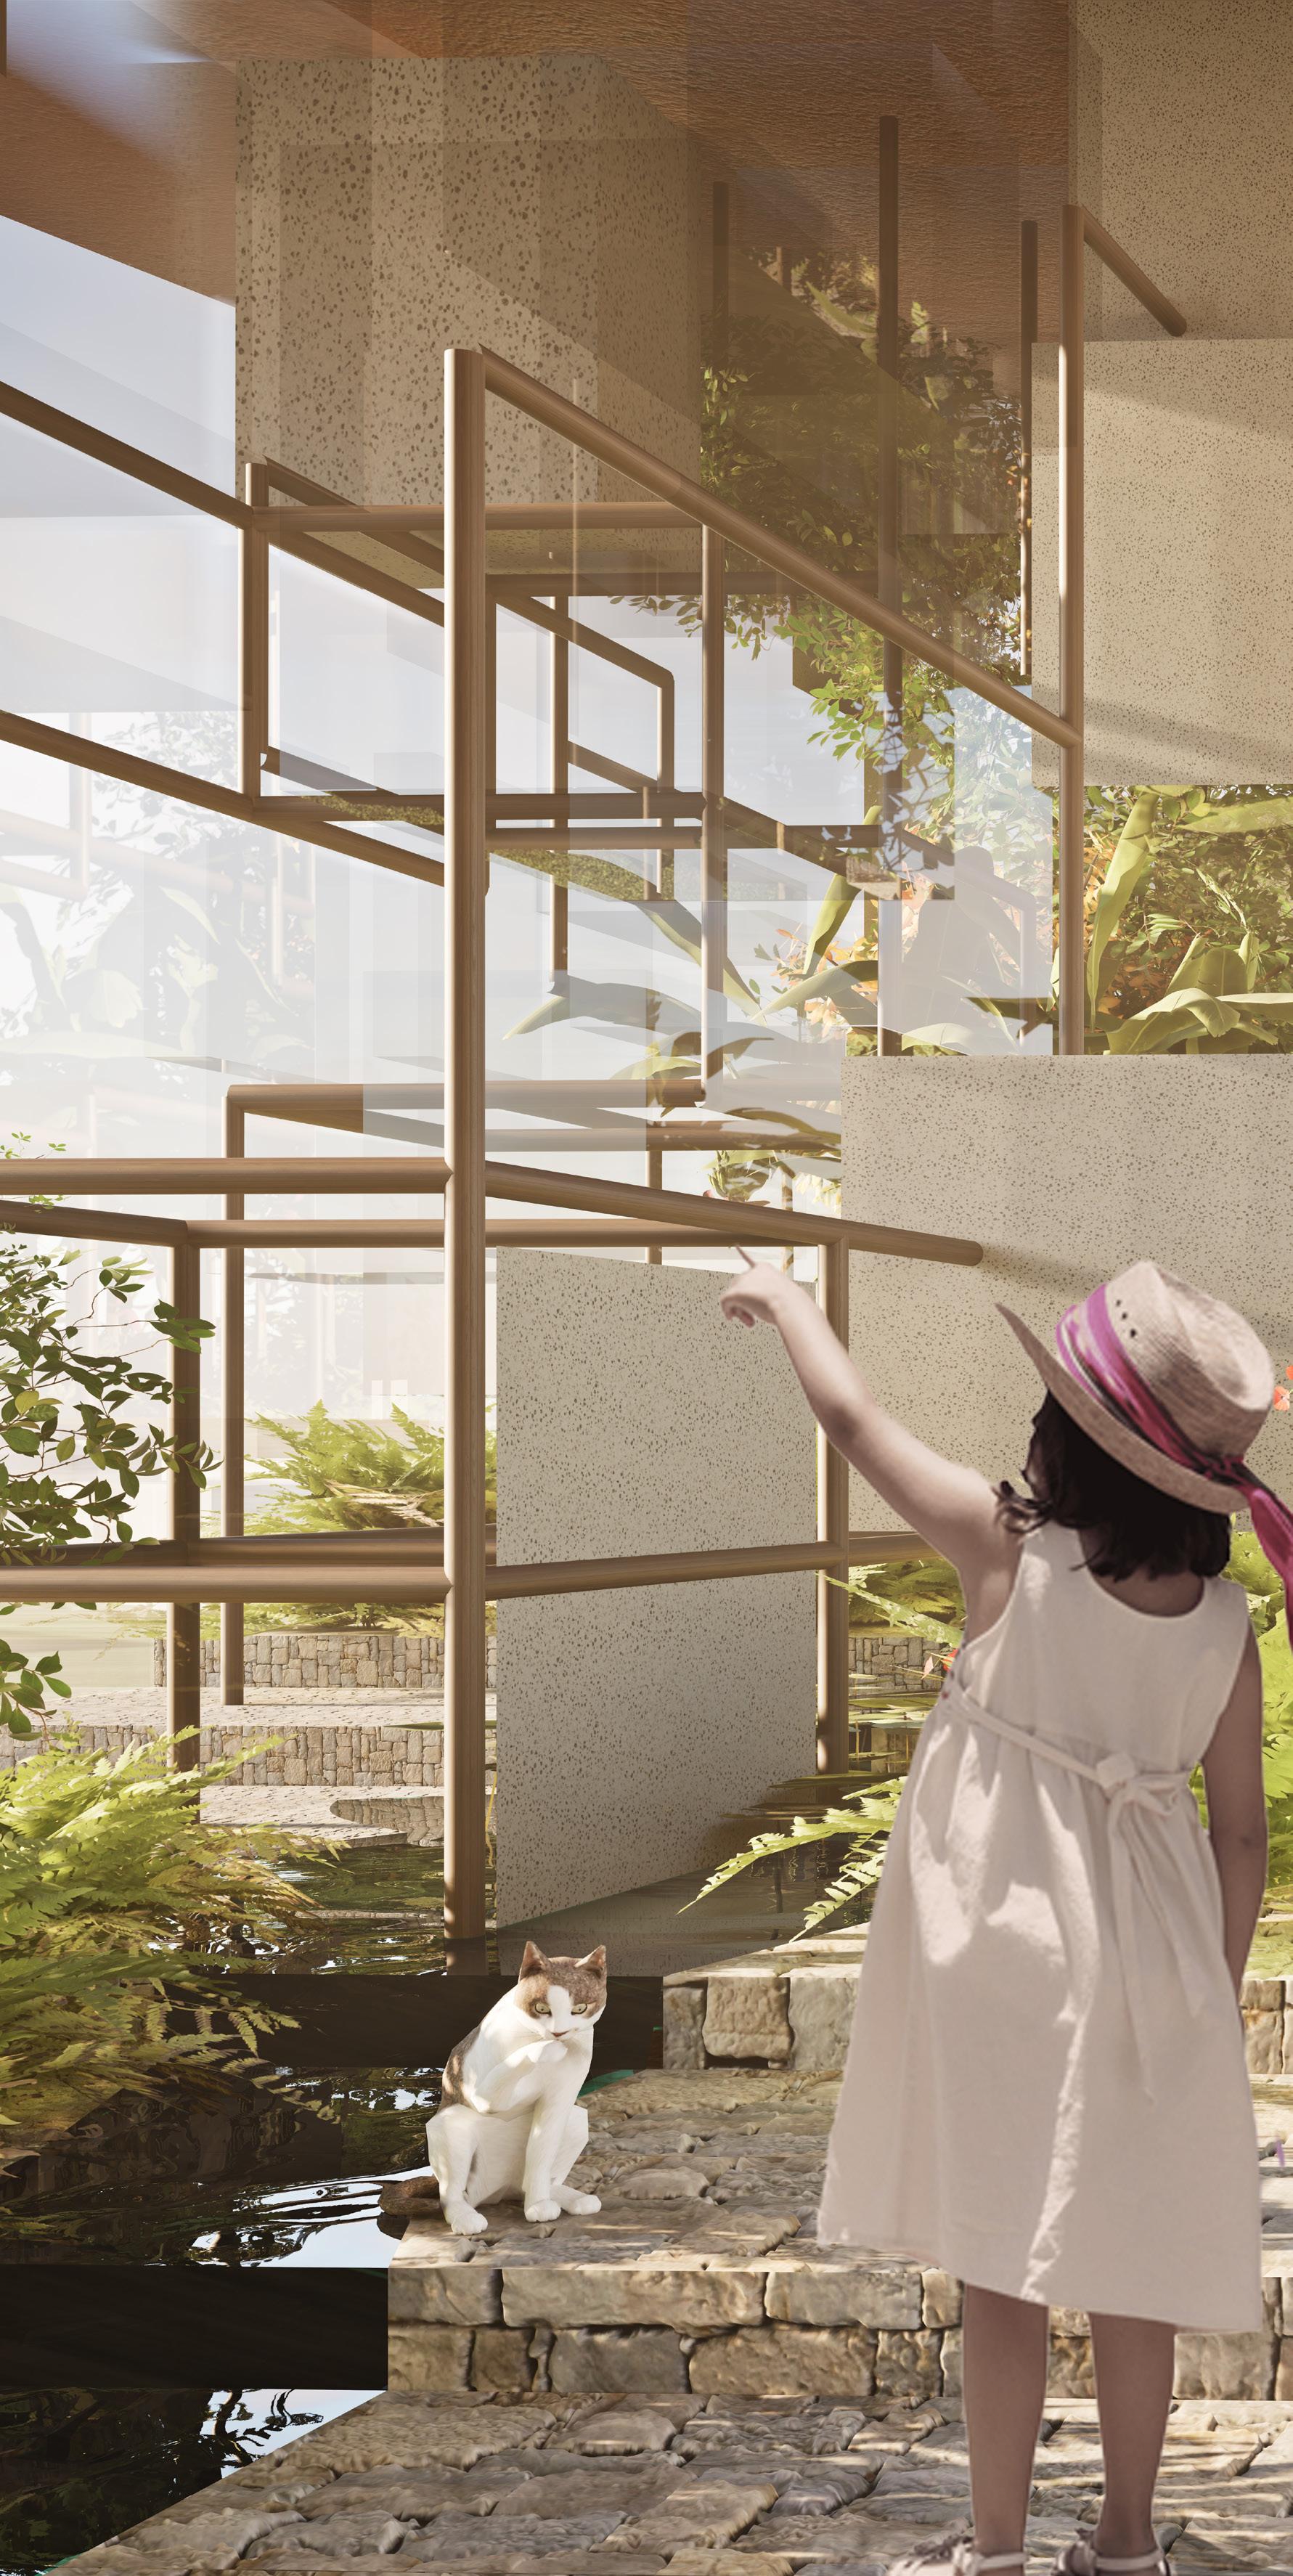
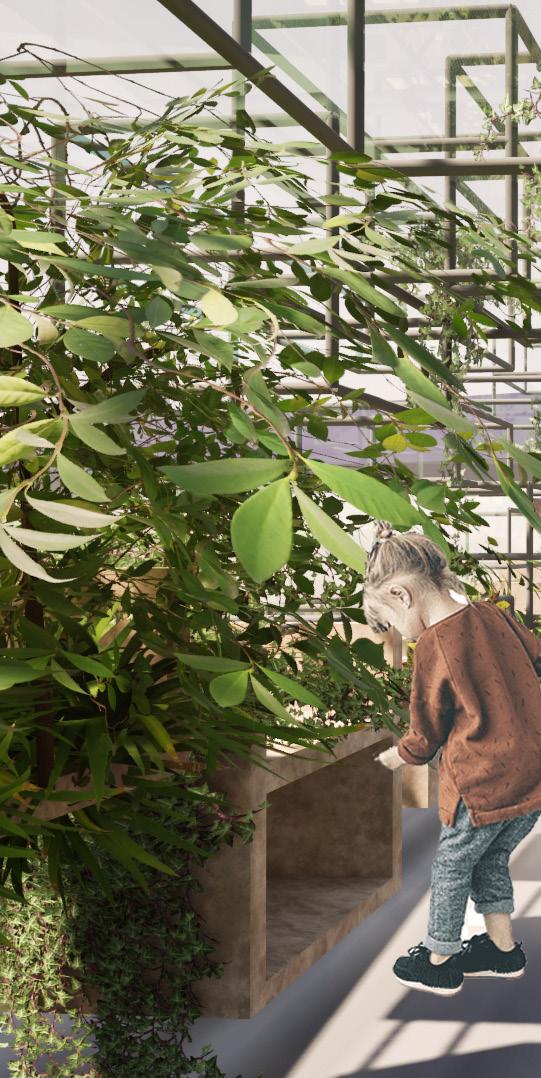
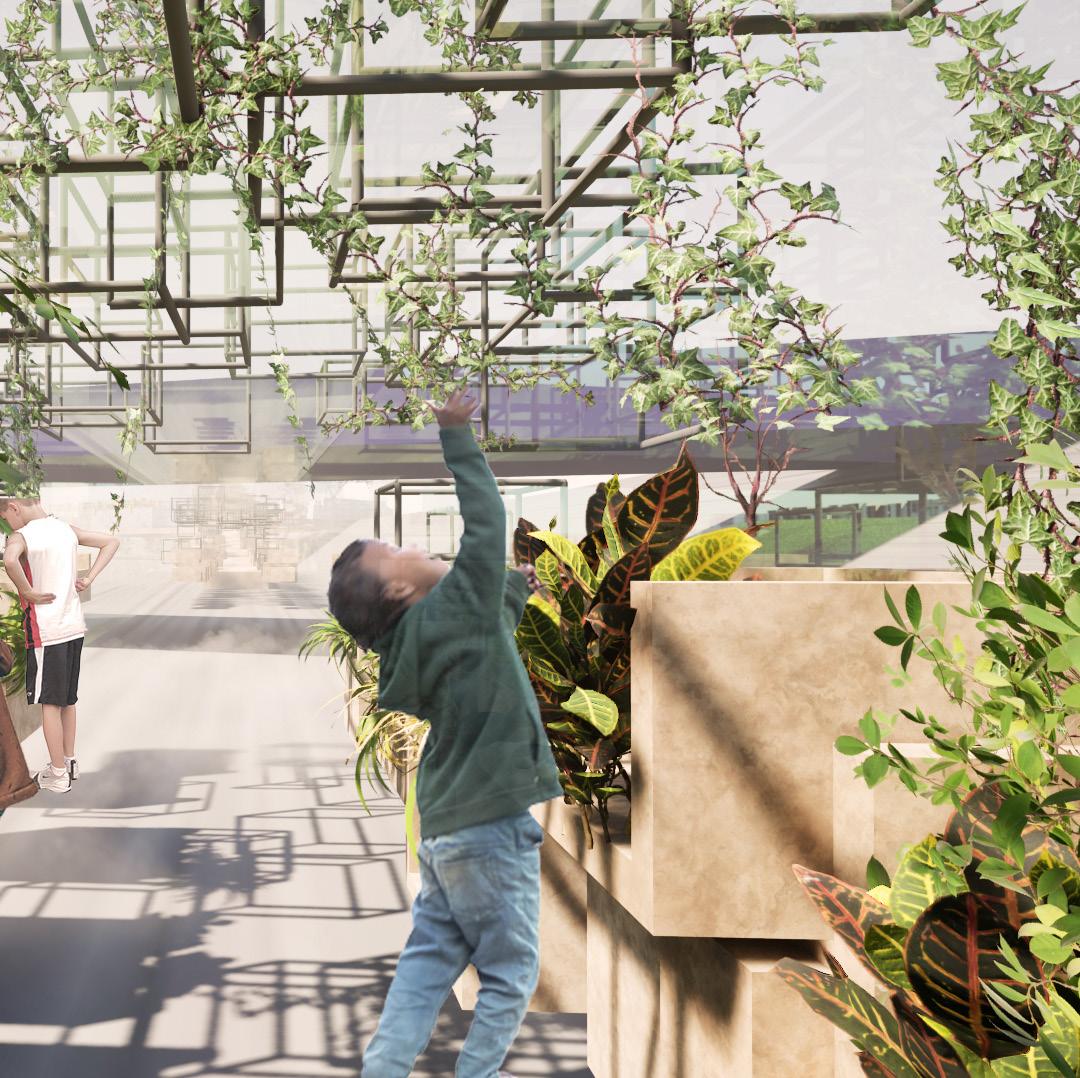
INTERVENTIONS: TROPICAL GARDEN
Age Group Suitability: 5 to 7-year-olds, 7 to 9-year-olds
Educational Aspect:
• Tropical Atrium space filled with a variety of plants for children to learn about
• Raised dead end platform overlooking the rest of the site to give the children the feeling of empowerment and making them feel as if they are on top of the world
• Providing a tangible connection to nature that goes beyond textbook learning
Targeted Factor/s: Education, Movement, Health
INTERVENTIONS: FARMING TUNNEL
Age Group Suitability: 7 to 9-year-olds
Educational Aspect:
• By actively participating in the care and maintenance of the farming tunnel, children gain a deeper understanding of plant biology and ecological processes
• Children learn how to plant and source their own food, an absent concept in traditional school settings
• The farming tunnel space serves as a living laboratory for environmental education, offering opportunities to learn about sustainability, conservation, and ecosystem dynamics that are often overlooked in traditional school curricula
• A market space led by children offers a unique educational environment that promotes autonomy, independent decision-making and entrepreneurial thinking
• Children can sell and offer their paintings, artwork, books, and crops grown and plucked from the farming tunnel
• Unlike traditional classroom settings, this space allows children to take charge of their learning experiences, fostering a sense of ownership and responsibility
• Allows children to understand monetary value and the value of objects
Age Group Suitability: 5 to 7-year-olds, 7 to 9-year-olds, 10 to 11-year-olds
Educational Aspect:
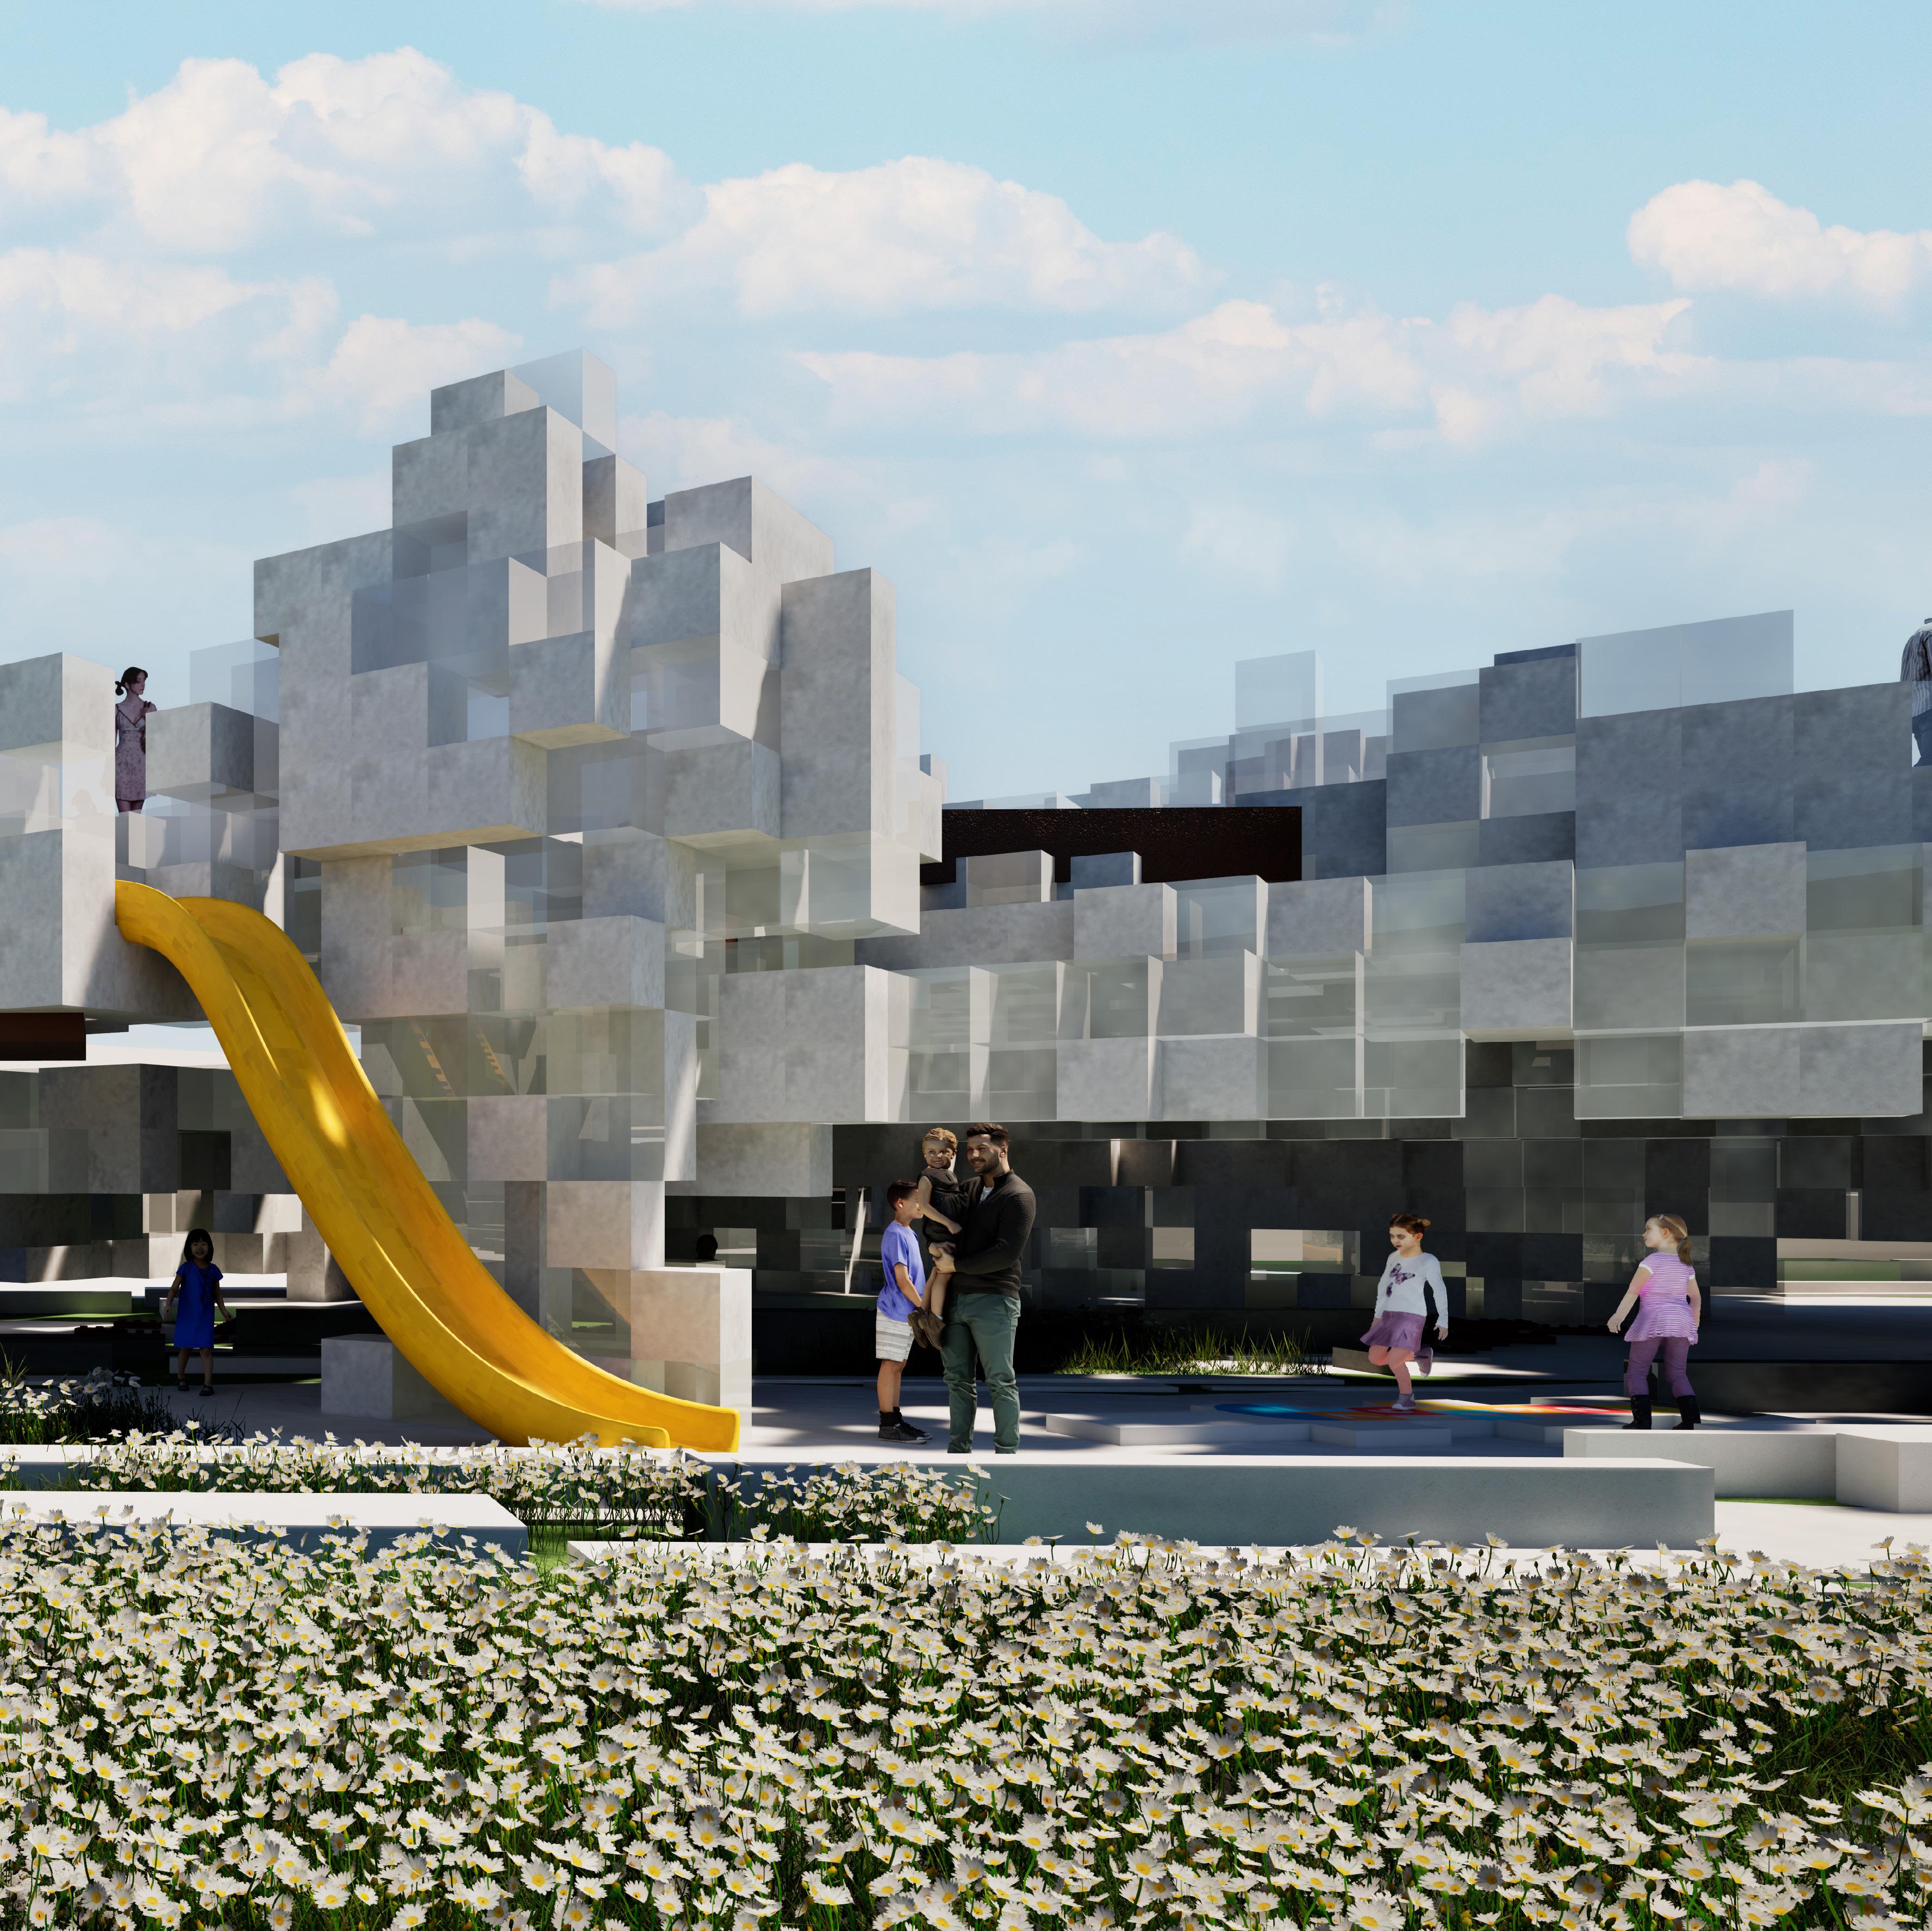
• The endless possibilities due to the multi-layered nature of the playground and its activities encourages them to think outside the box, climb, jump, run and problemsolve, transforming traditional learning into exhilarating adventures that fuel their innovative spirit
• The Playground serves as a bustling social arena, encouraging children to navigate social relationships, allowing them to engage in sharing, negotiating, and conflict-resolving
• Includes elements such as a melodic tile stepping game which brings forth another sensory dimensionality due to the musical aspect of the game
Targeted Factor/s: Movement, Education, Health
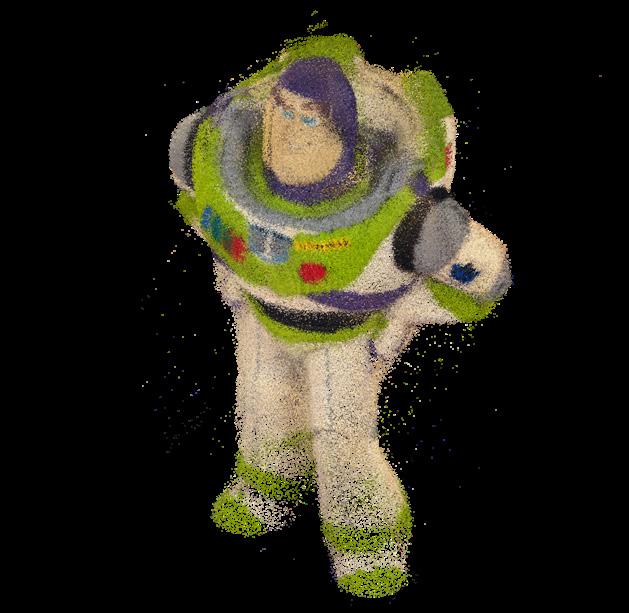
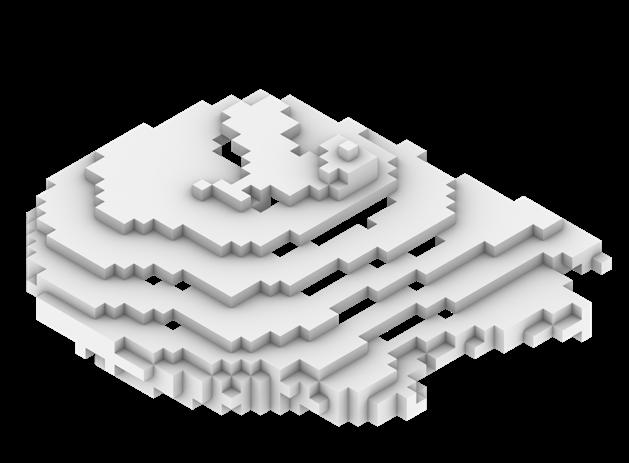
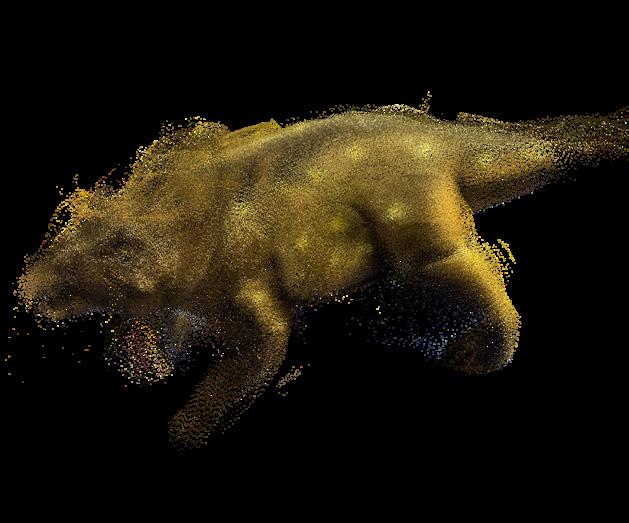
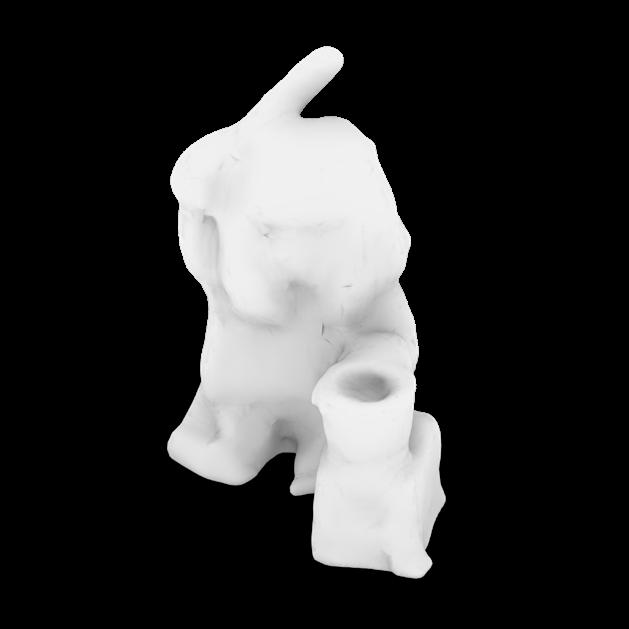
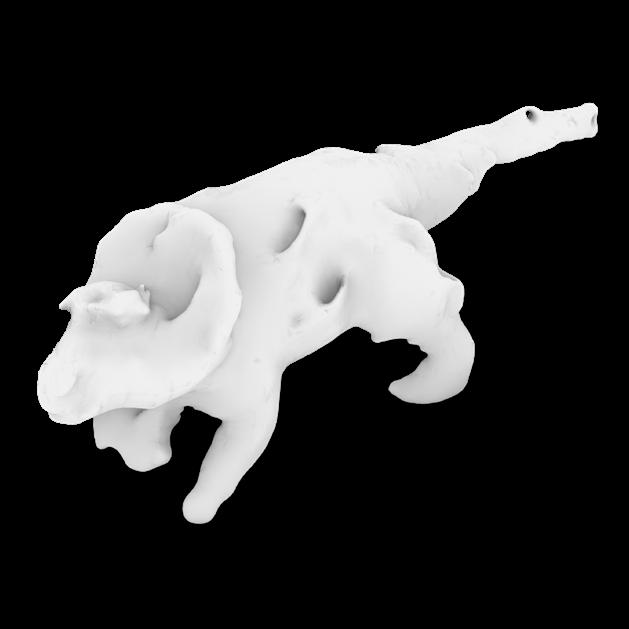
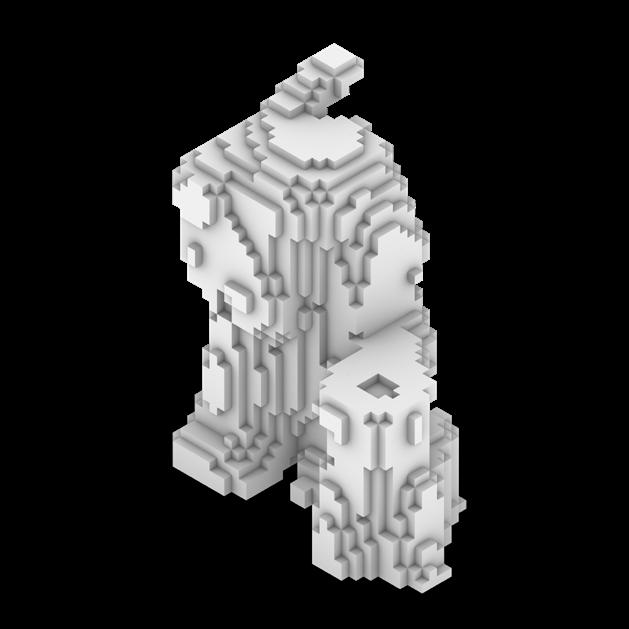
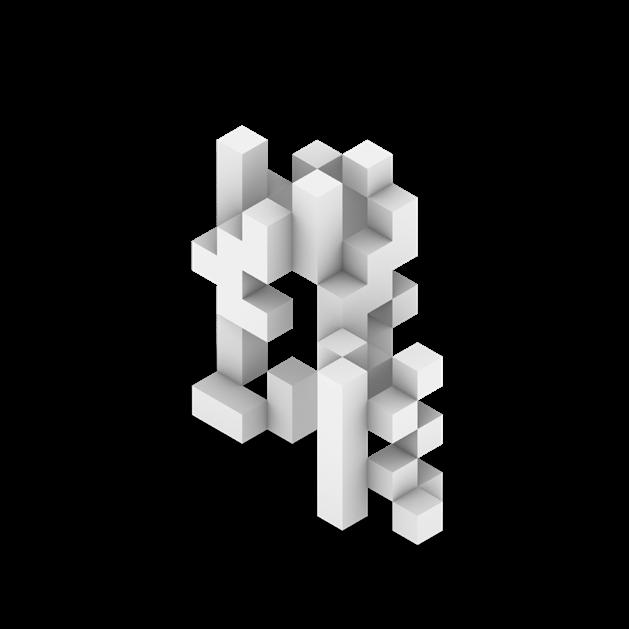
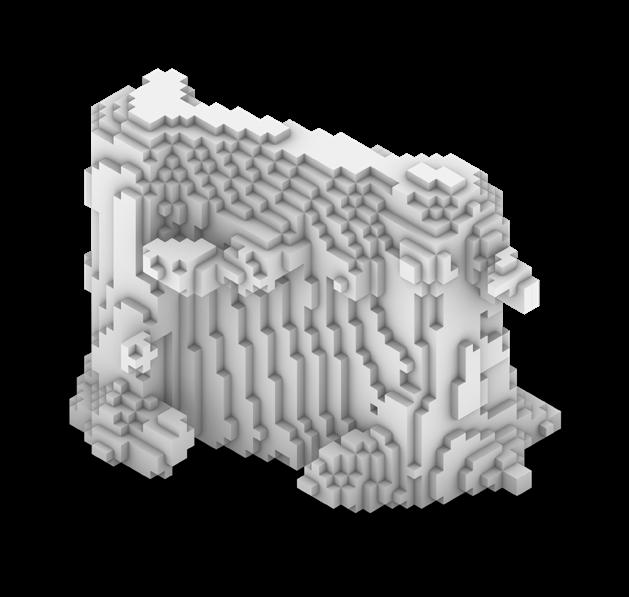
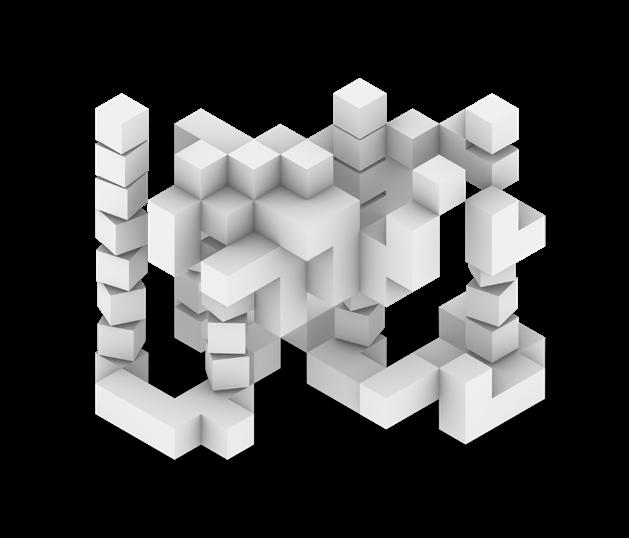
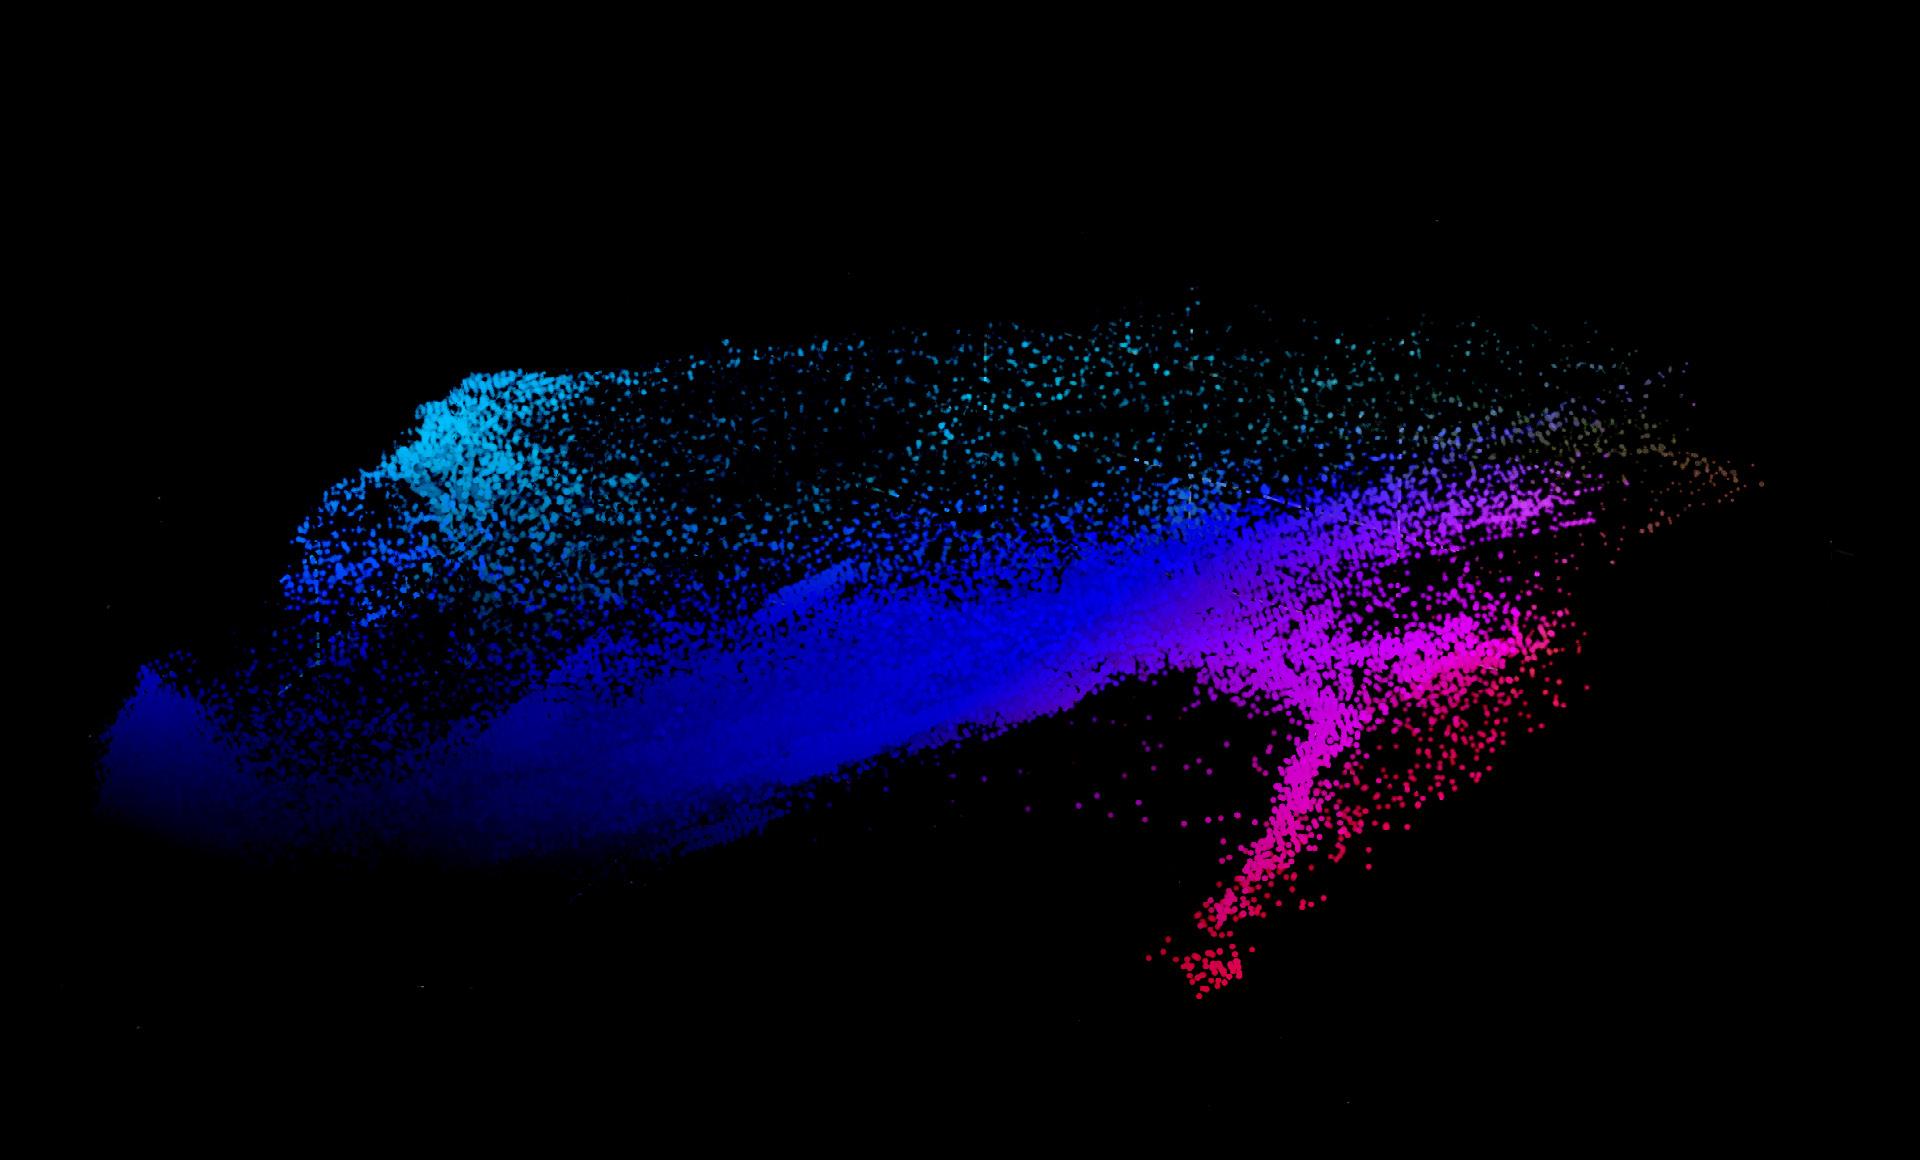
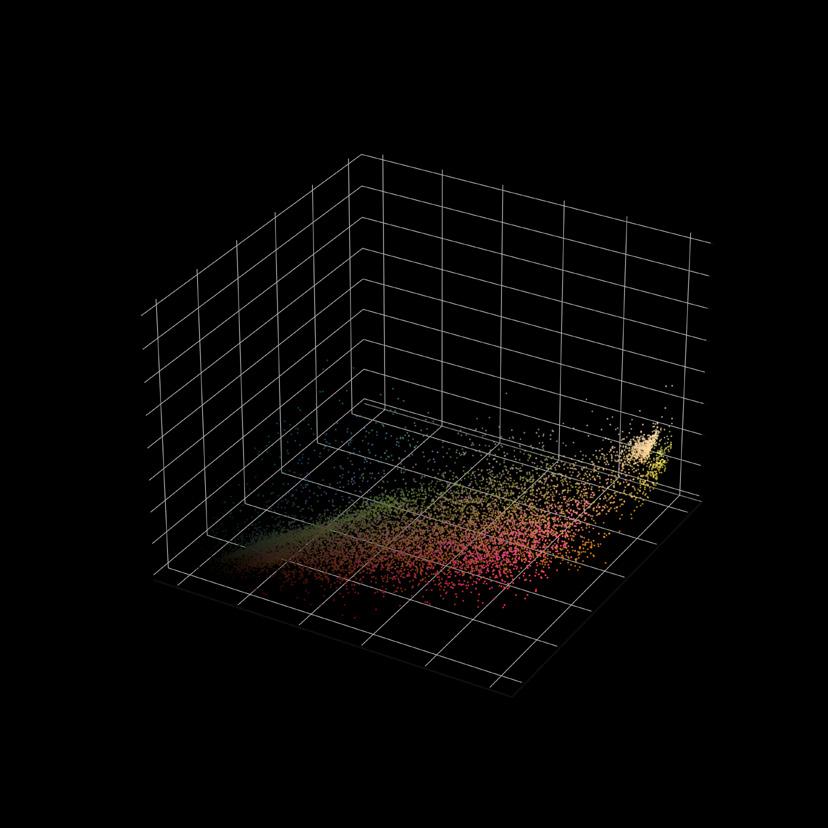
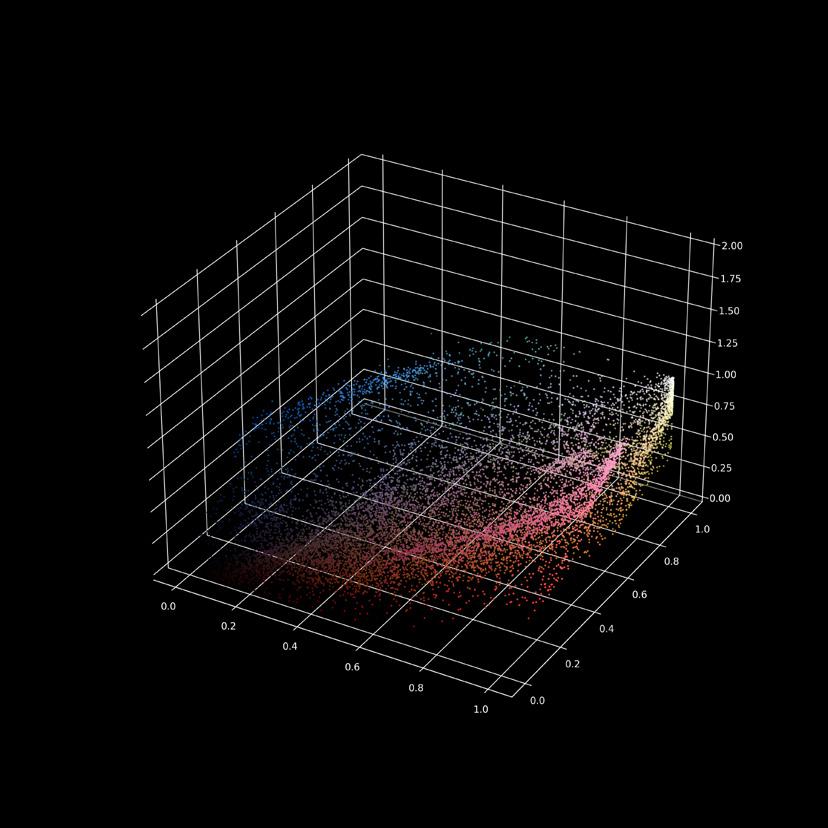
PLAYGROUND DESIGN FORM : POINT CLOUD SCANNING
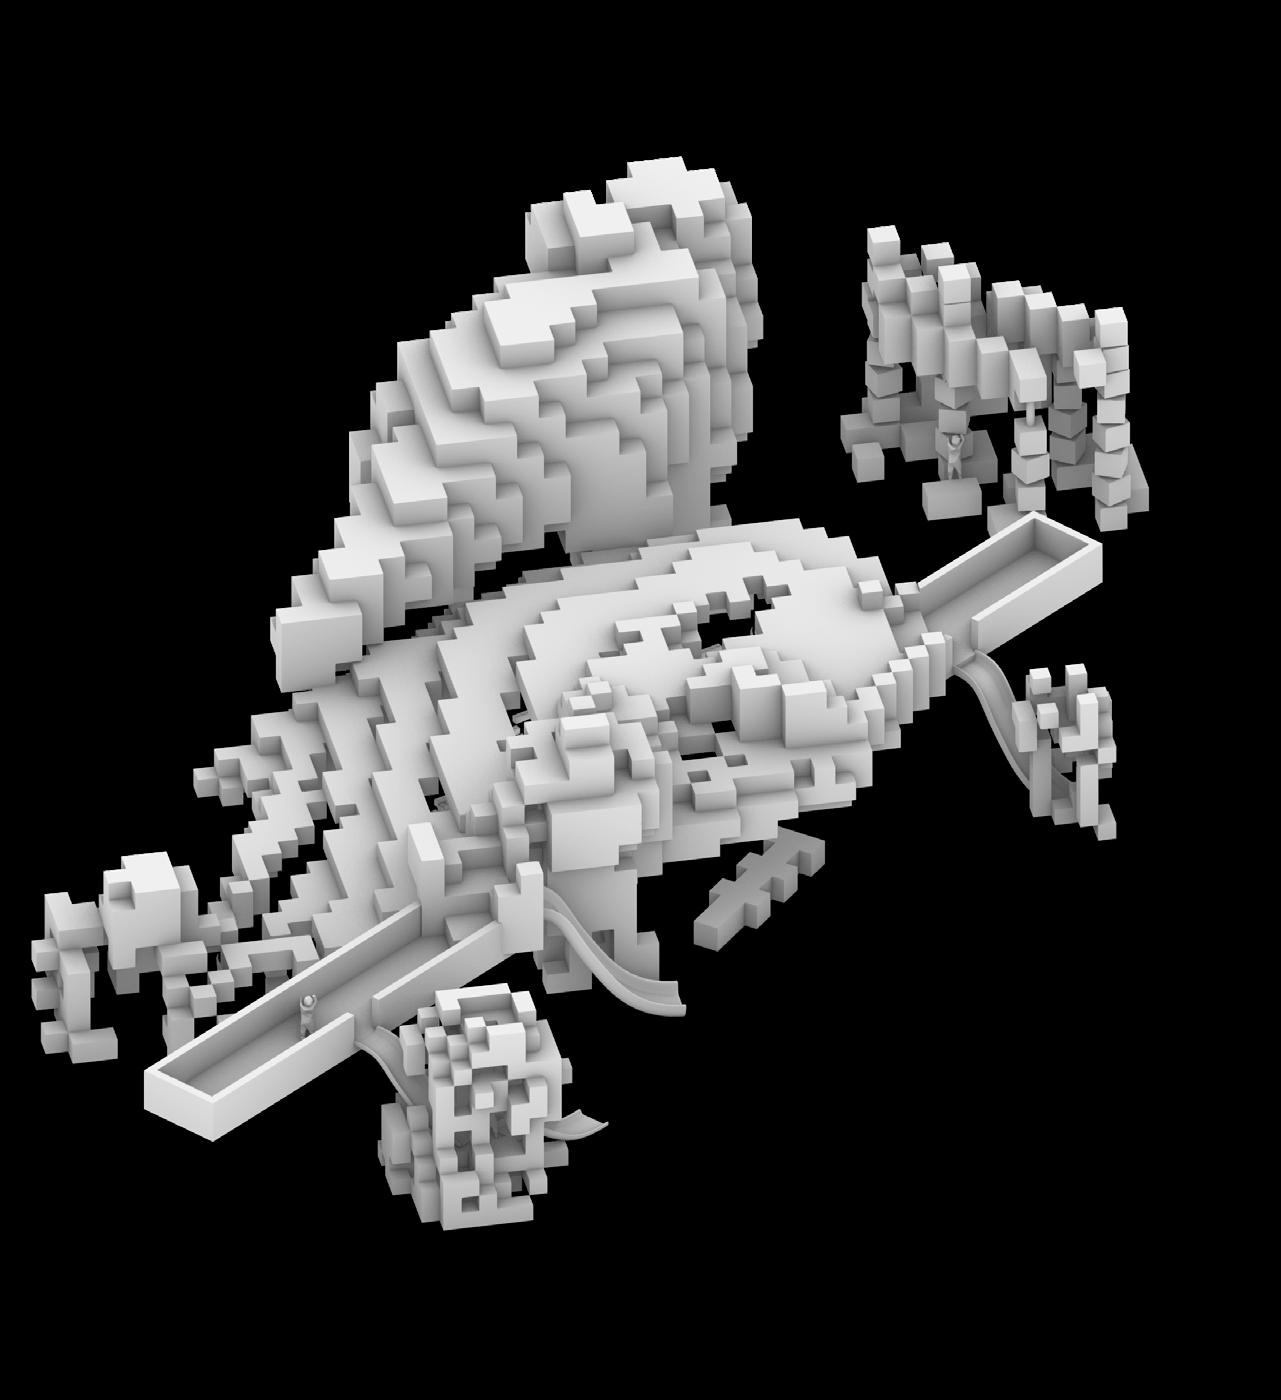
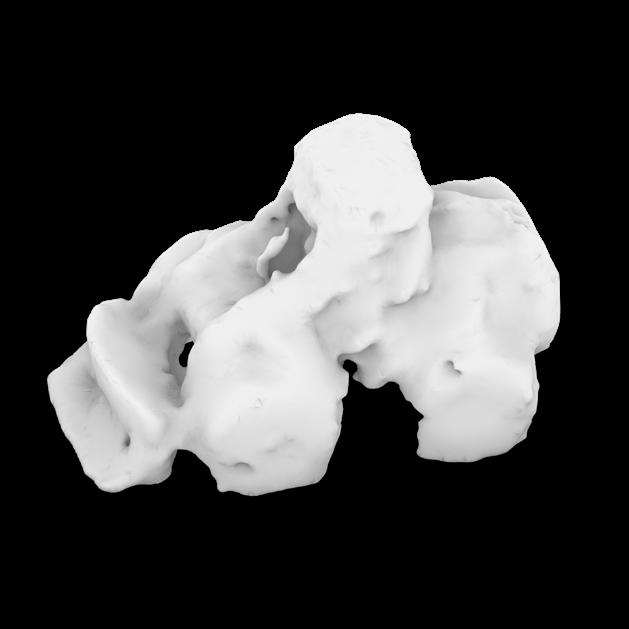
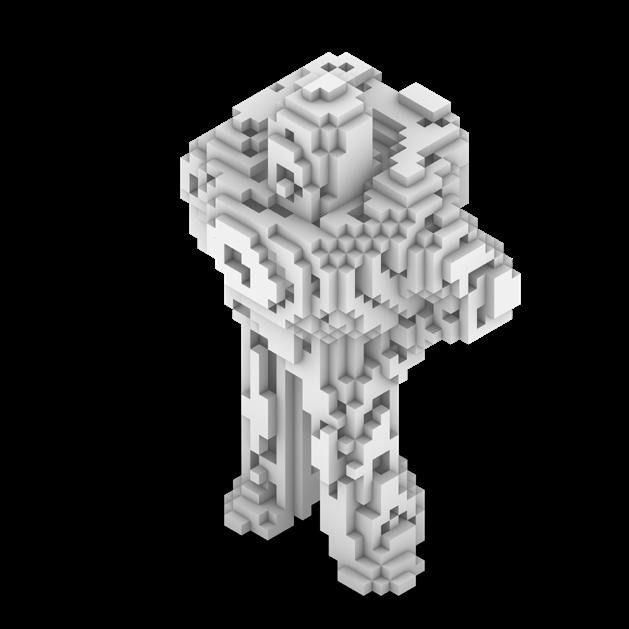
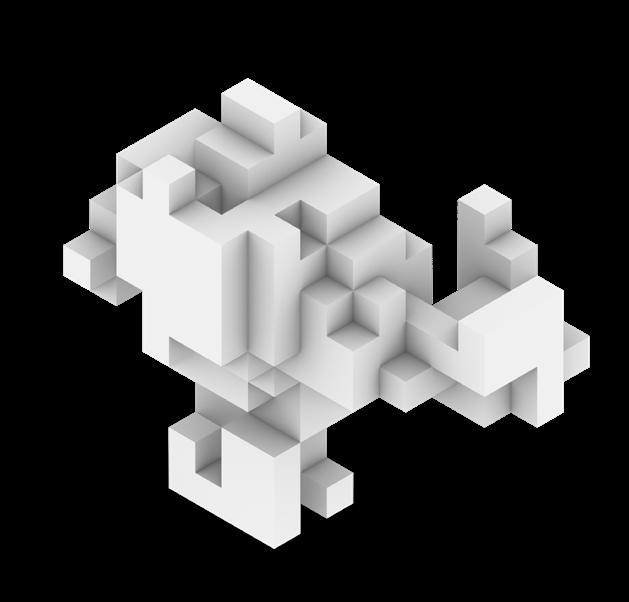
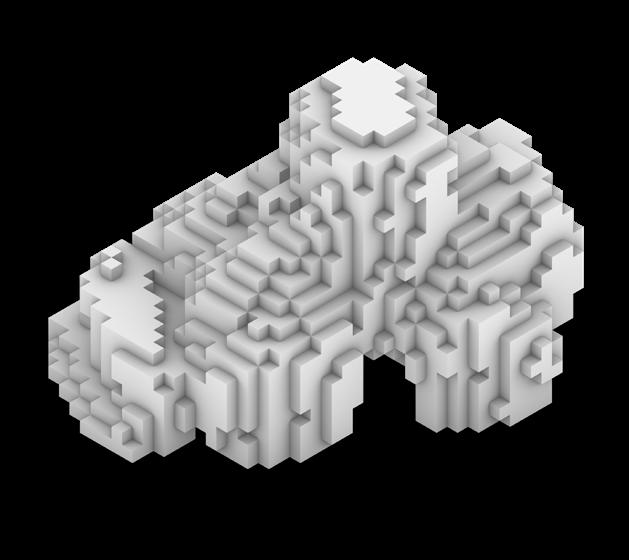
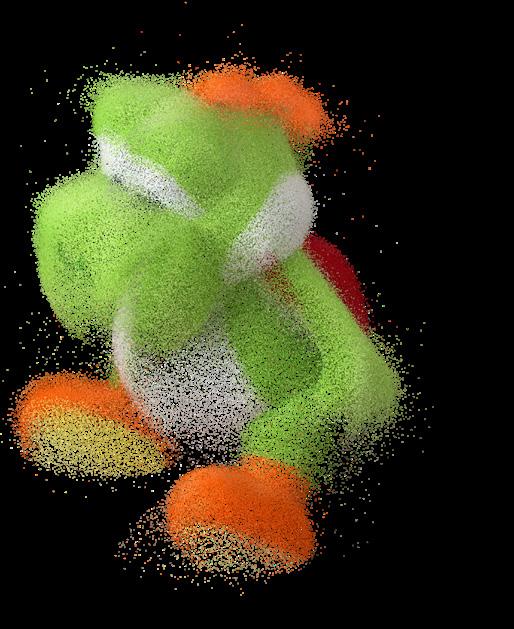
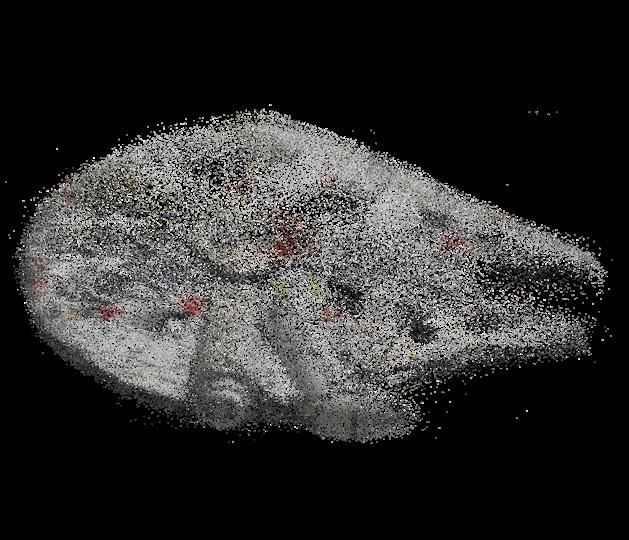
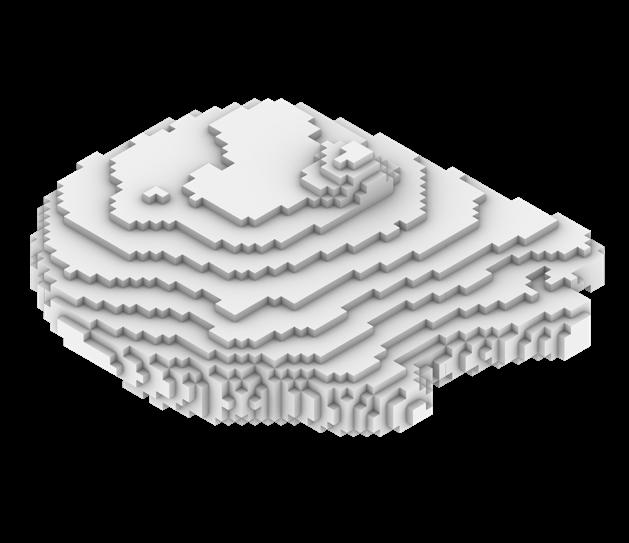
The forms of our playground elements were influenced by popular kids toys. The toys were LiDAR scanned to extract a point cloud scan. The point cloud scans were formed into meshes which would then allow us to voxelize them. The raw unedited voxelized forms required editing to allow them intended functionality and program. Examples of some of the functionality include slides, a maze, and a cave which includes a melodic tile stepping game.
Final Voxelized Playground
Edited Final Voxelized form
Point Cloud LiDAR scans
Point Cloud formed meshes
Raw Voxelized form
Buzz Light year: SLIDE Tractor: CAVE ENTRANCE
CHOSEN POPULAR KIDS TOYS PLAYGROUND PROGRAM
Yoshi: SLIDE Millennium Falcon: CAVE SHELL
Harry Potter: SLIDE Dinosaur: MAZE Abacus: SPINNING BLOCKS
INTERVENTIONS: SOCIAL GATHERING SPACE
Age Group Suitability: 5 to 7-year-olds, 7 to 9-year-olds, 10 to 11-year-olds
Educational Aspect:
• Group activities, explorative space, playing space
• Unlike the structured classroom setting, these relaxed and informal spaces allow for spontaneous interactions and conversations, helping children to become more confident and articulate in expressing themselves
• This natural approach to developing communication skills can be particularly beneficial for children who may struggle with more formal language instruction in traditional school settings
• Exposure to an Abundance of natural elements such as water streams and vegetation foster shared engagement between children and are linked to increased academic performance and attention
Targeted Factor/s: Education, Health
OUTER VIEW SOCIAL GATHERING SPACE
COLOR & EMOTION ANALYSIS
The color analysis of child-loved animated cartoons allowed us to extract colors correlated to core values crucial to a childs development. Numerous studies in child psychology have shown that children’s behavior and emotion are highly correlated with color. Essentially, the idea is to provide color schemes that promote healthy growth physiologically and psychologically to the children. The color schemes shall be applied carefully onto our emotional interactive tower intervention.
- Sharing & Family Values
‘Encanto’
‘Inside Out’ - Empathy & Awareness
‘Kubo’ - Freindship
‘Moana’ - Teamwork & Courage
‘Soul’ - Trust & Passion
‘The Good Dinosaur’Sharing & Family Values
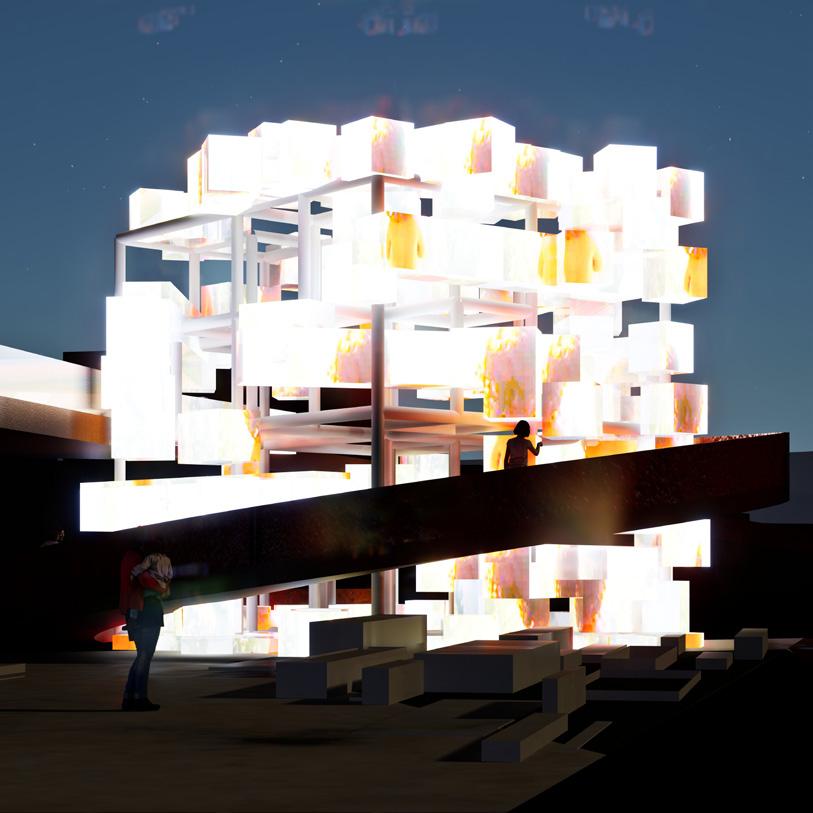
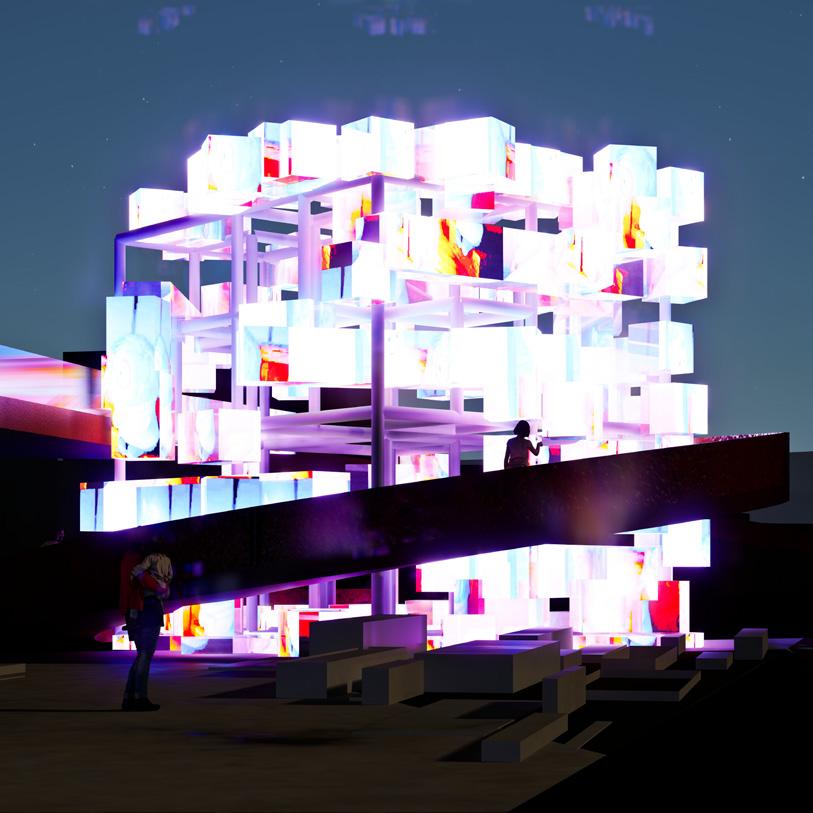
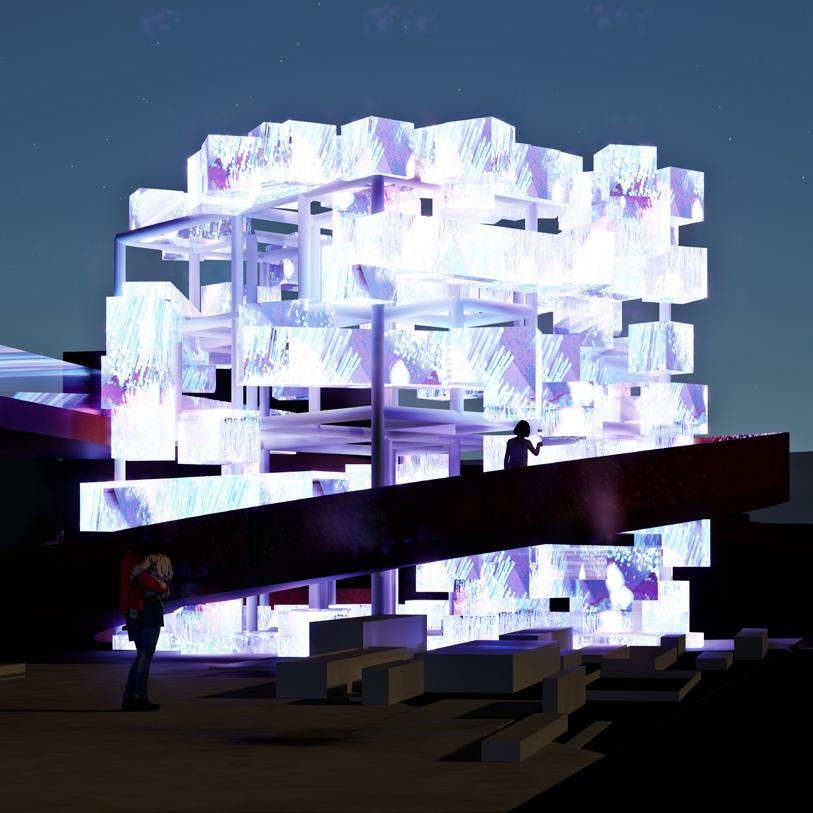
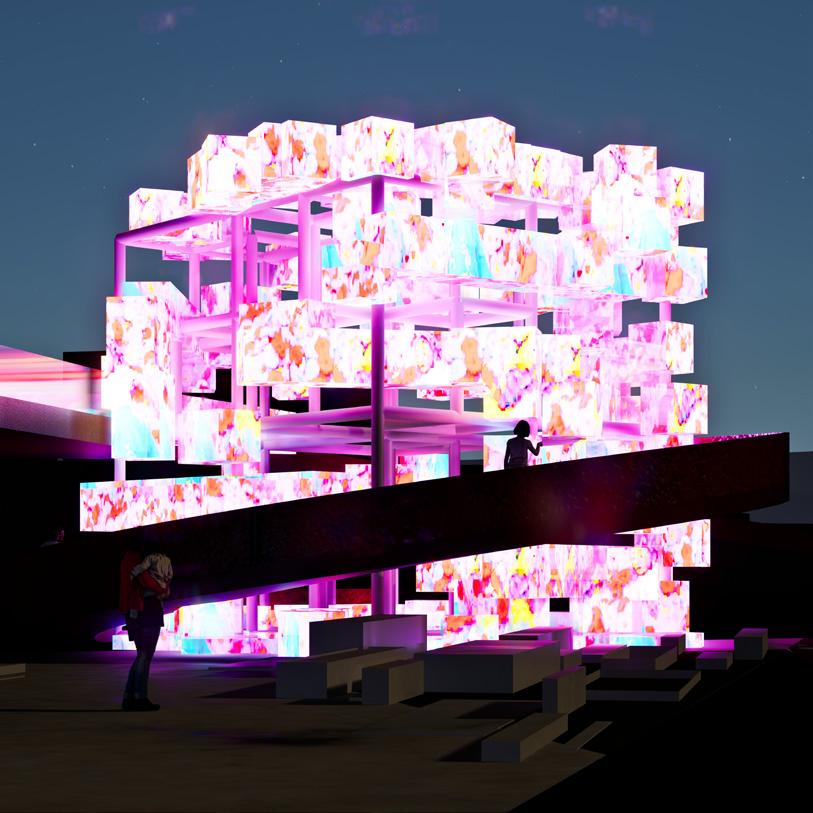
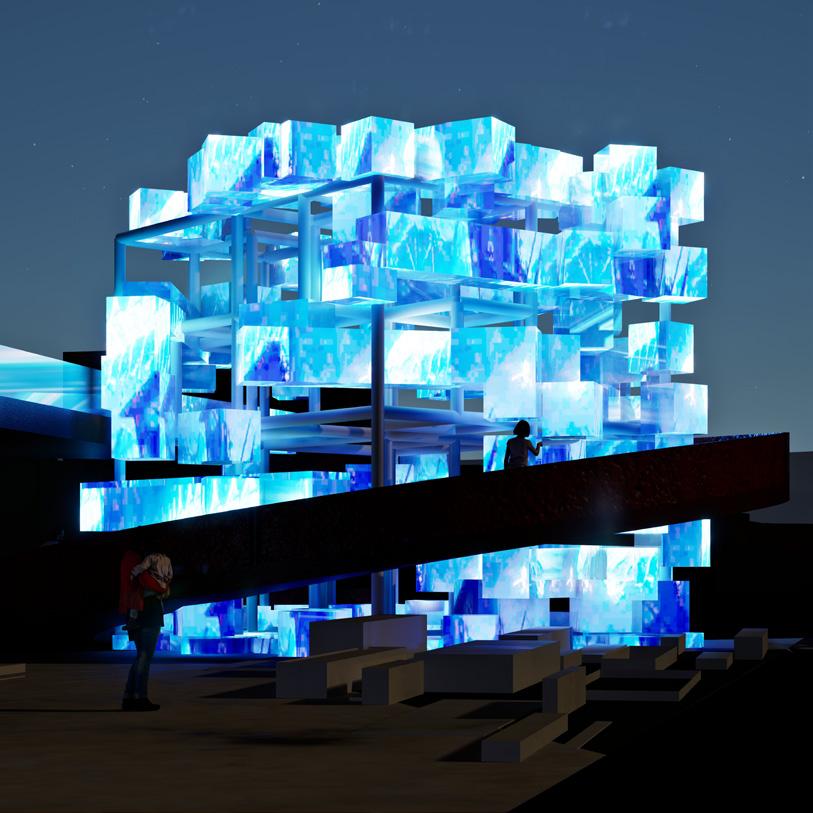
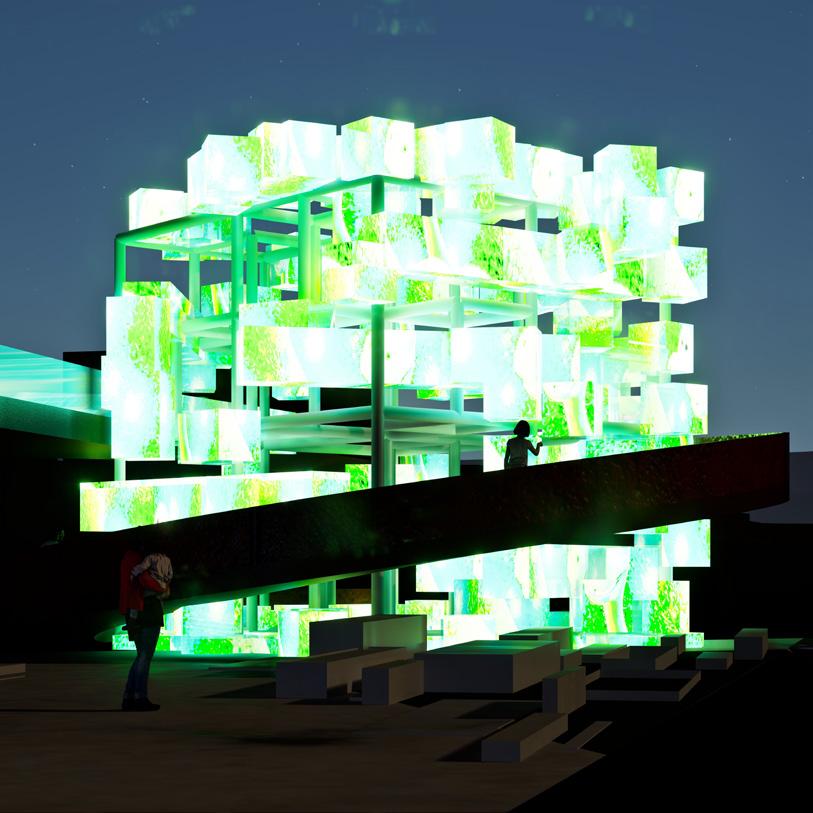
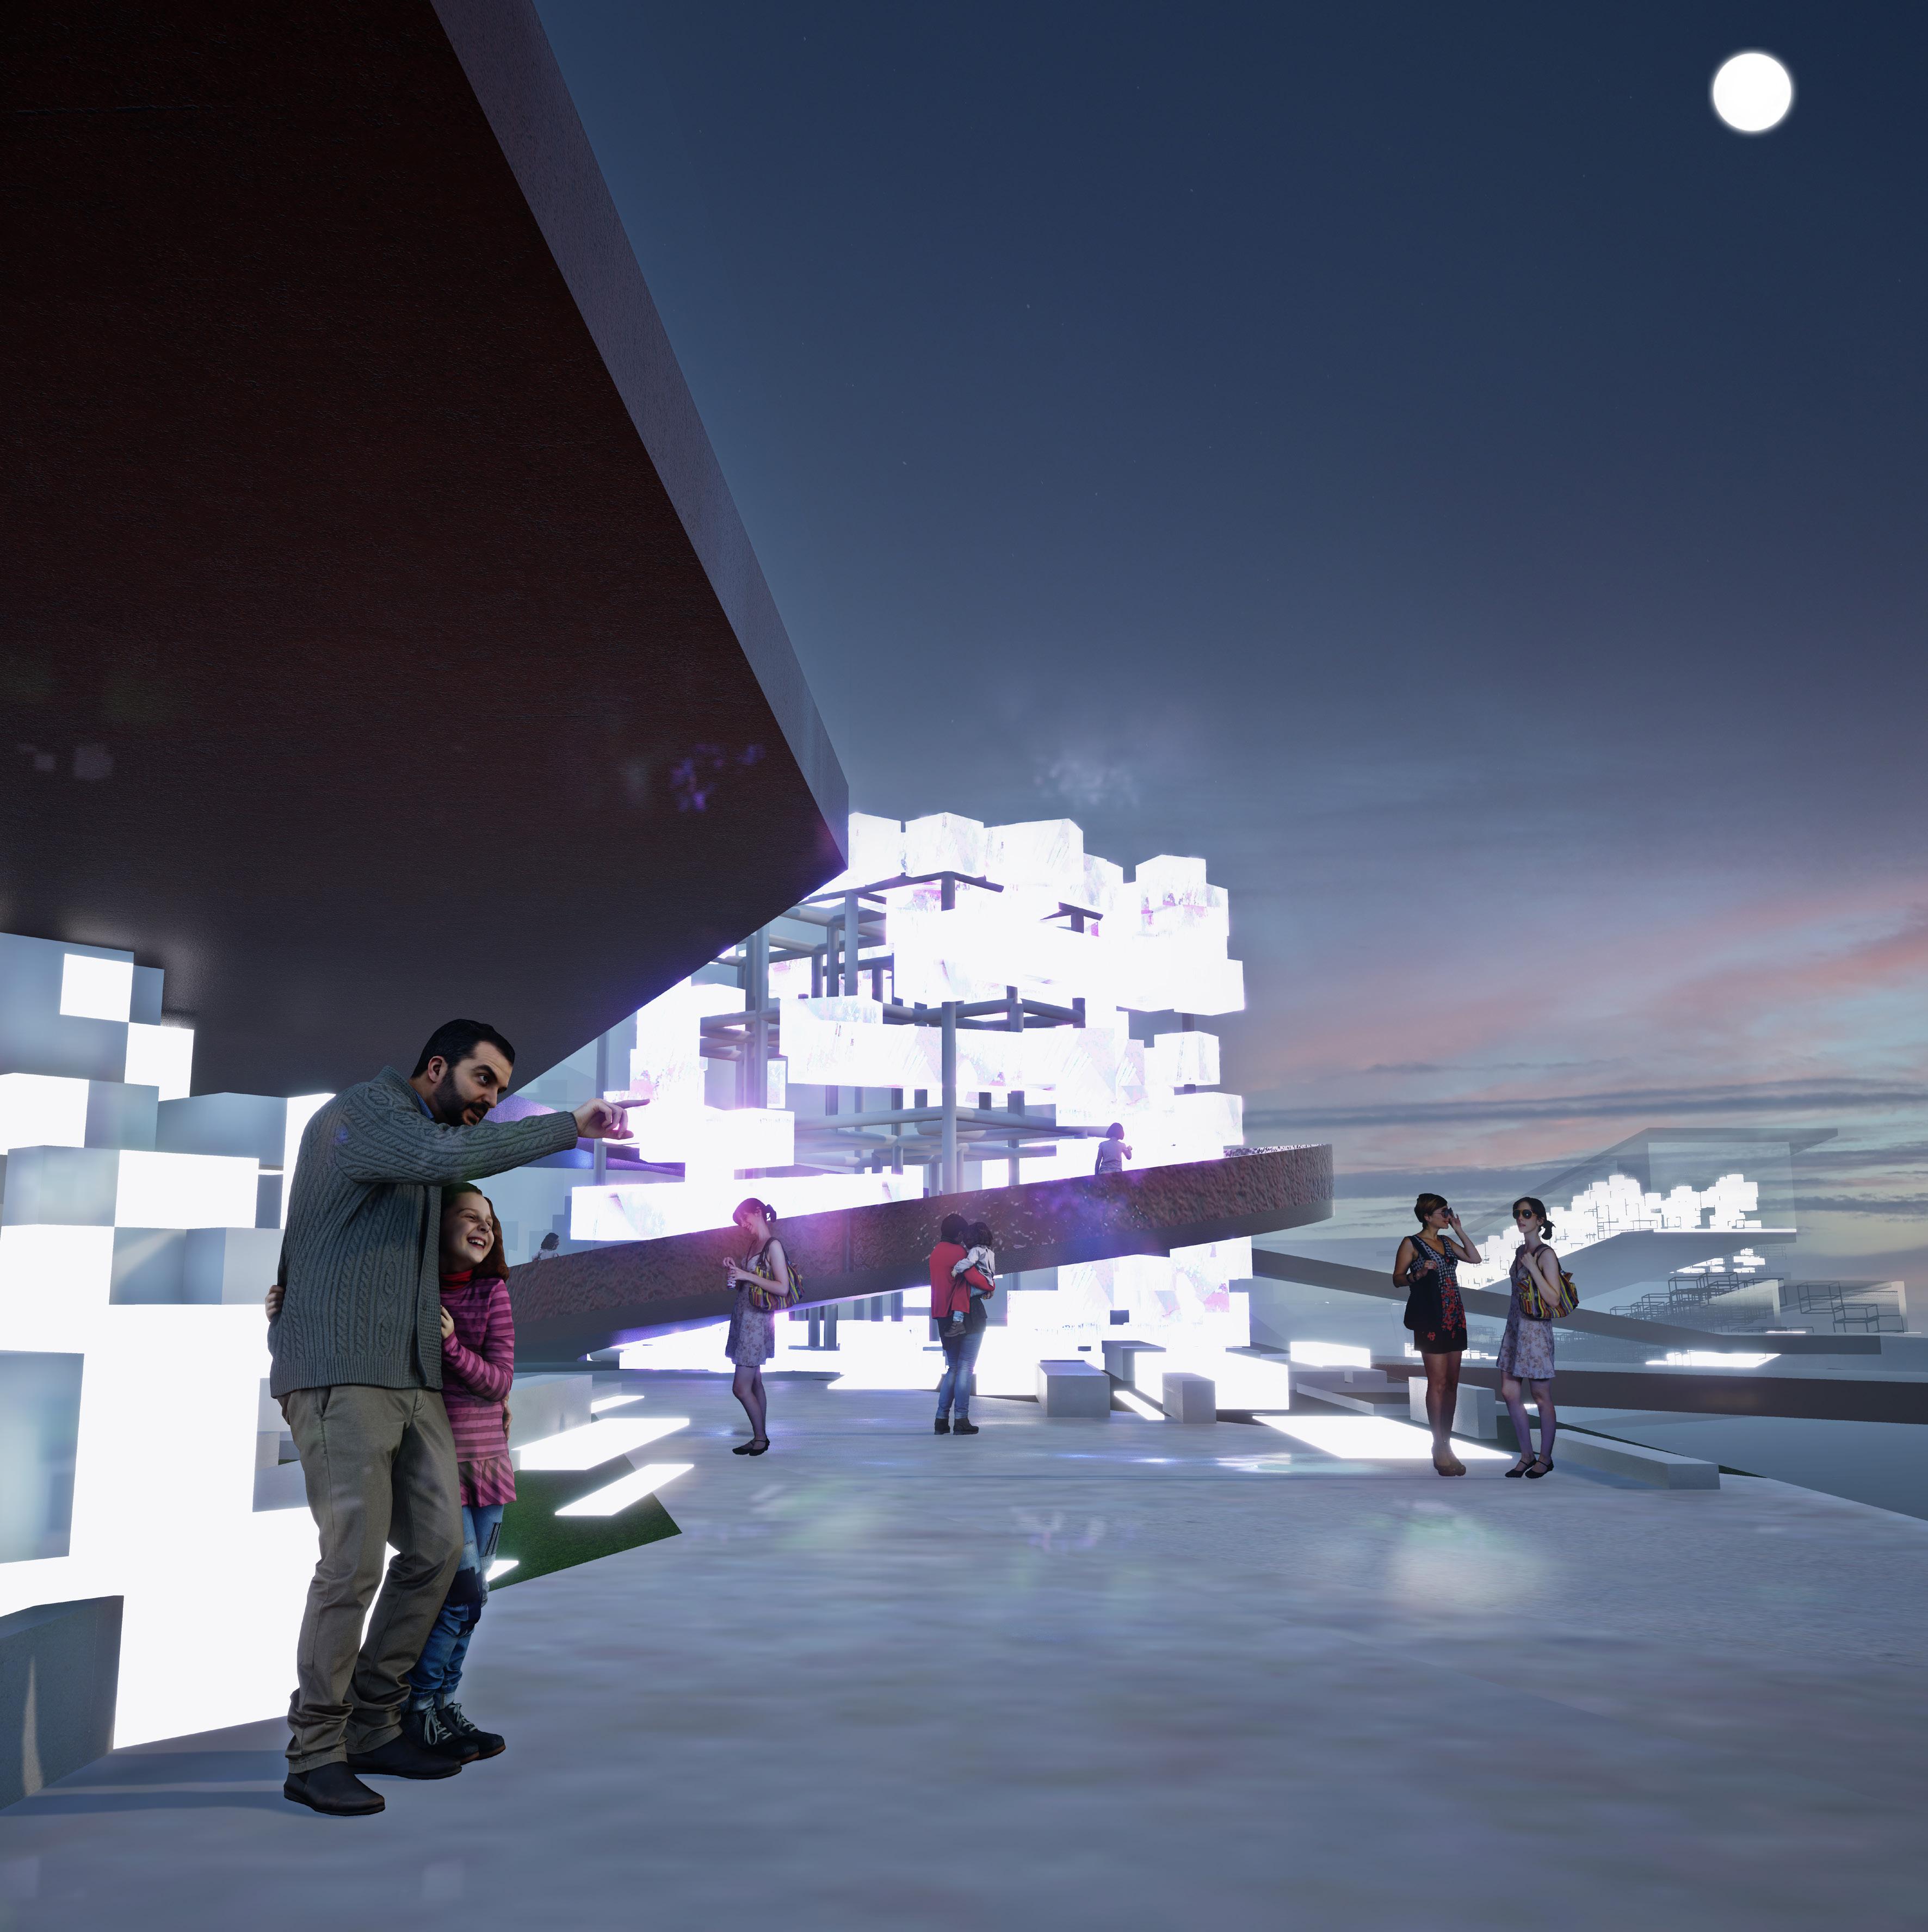
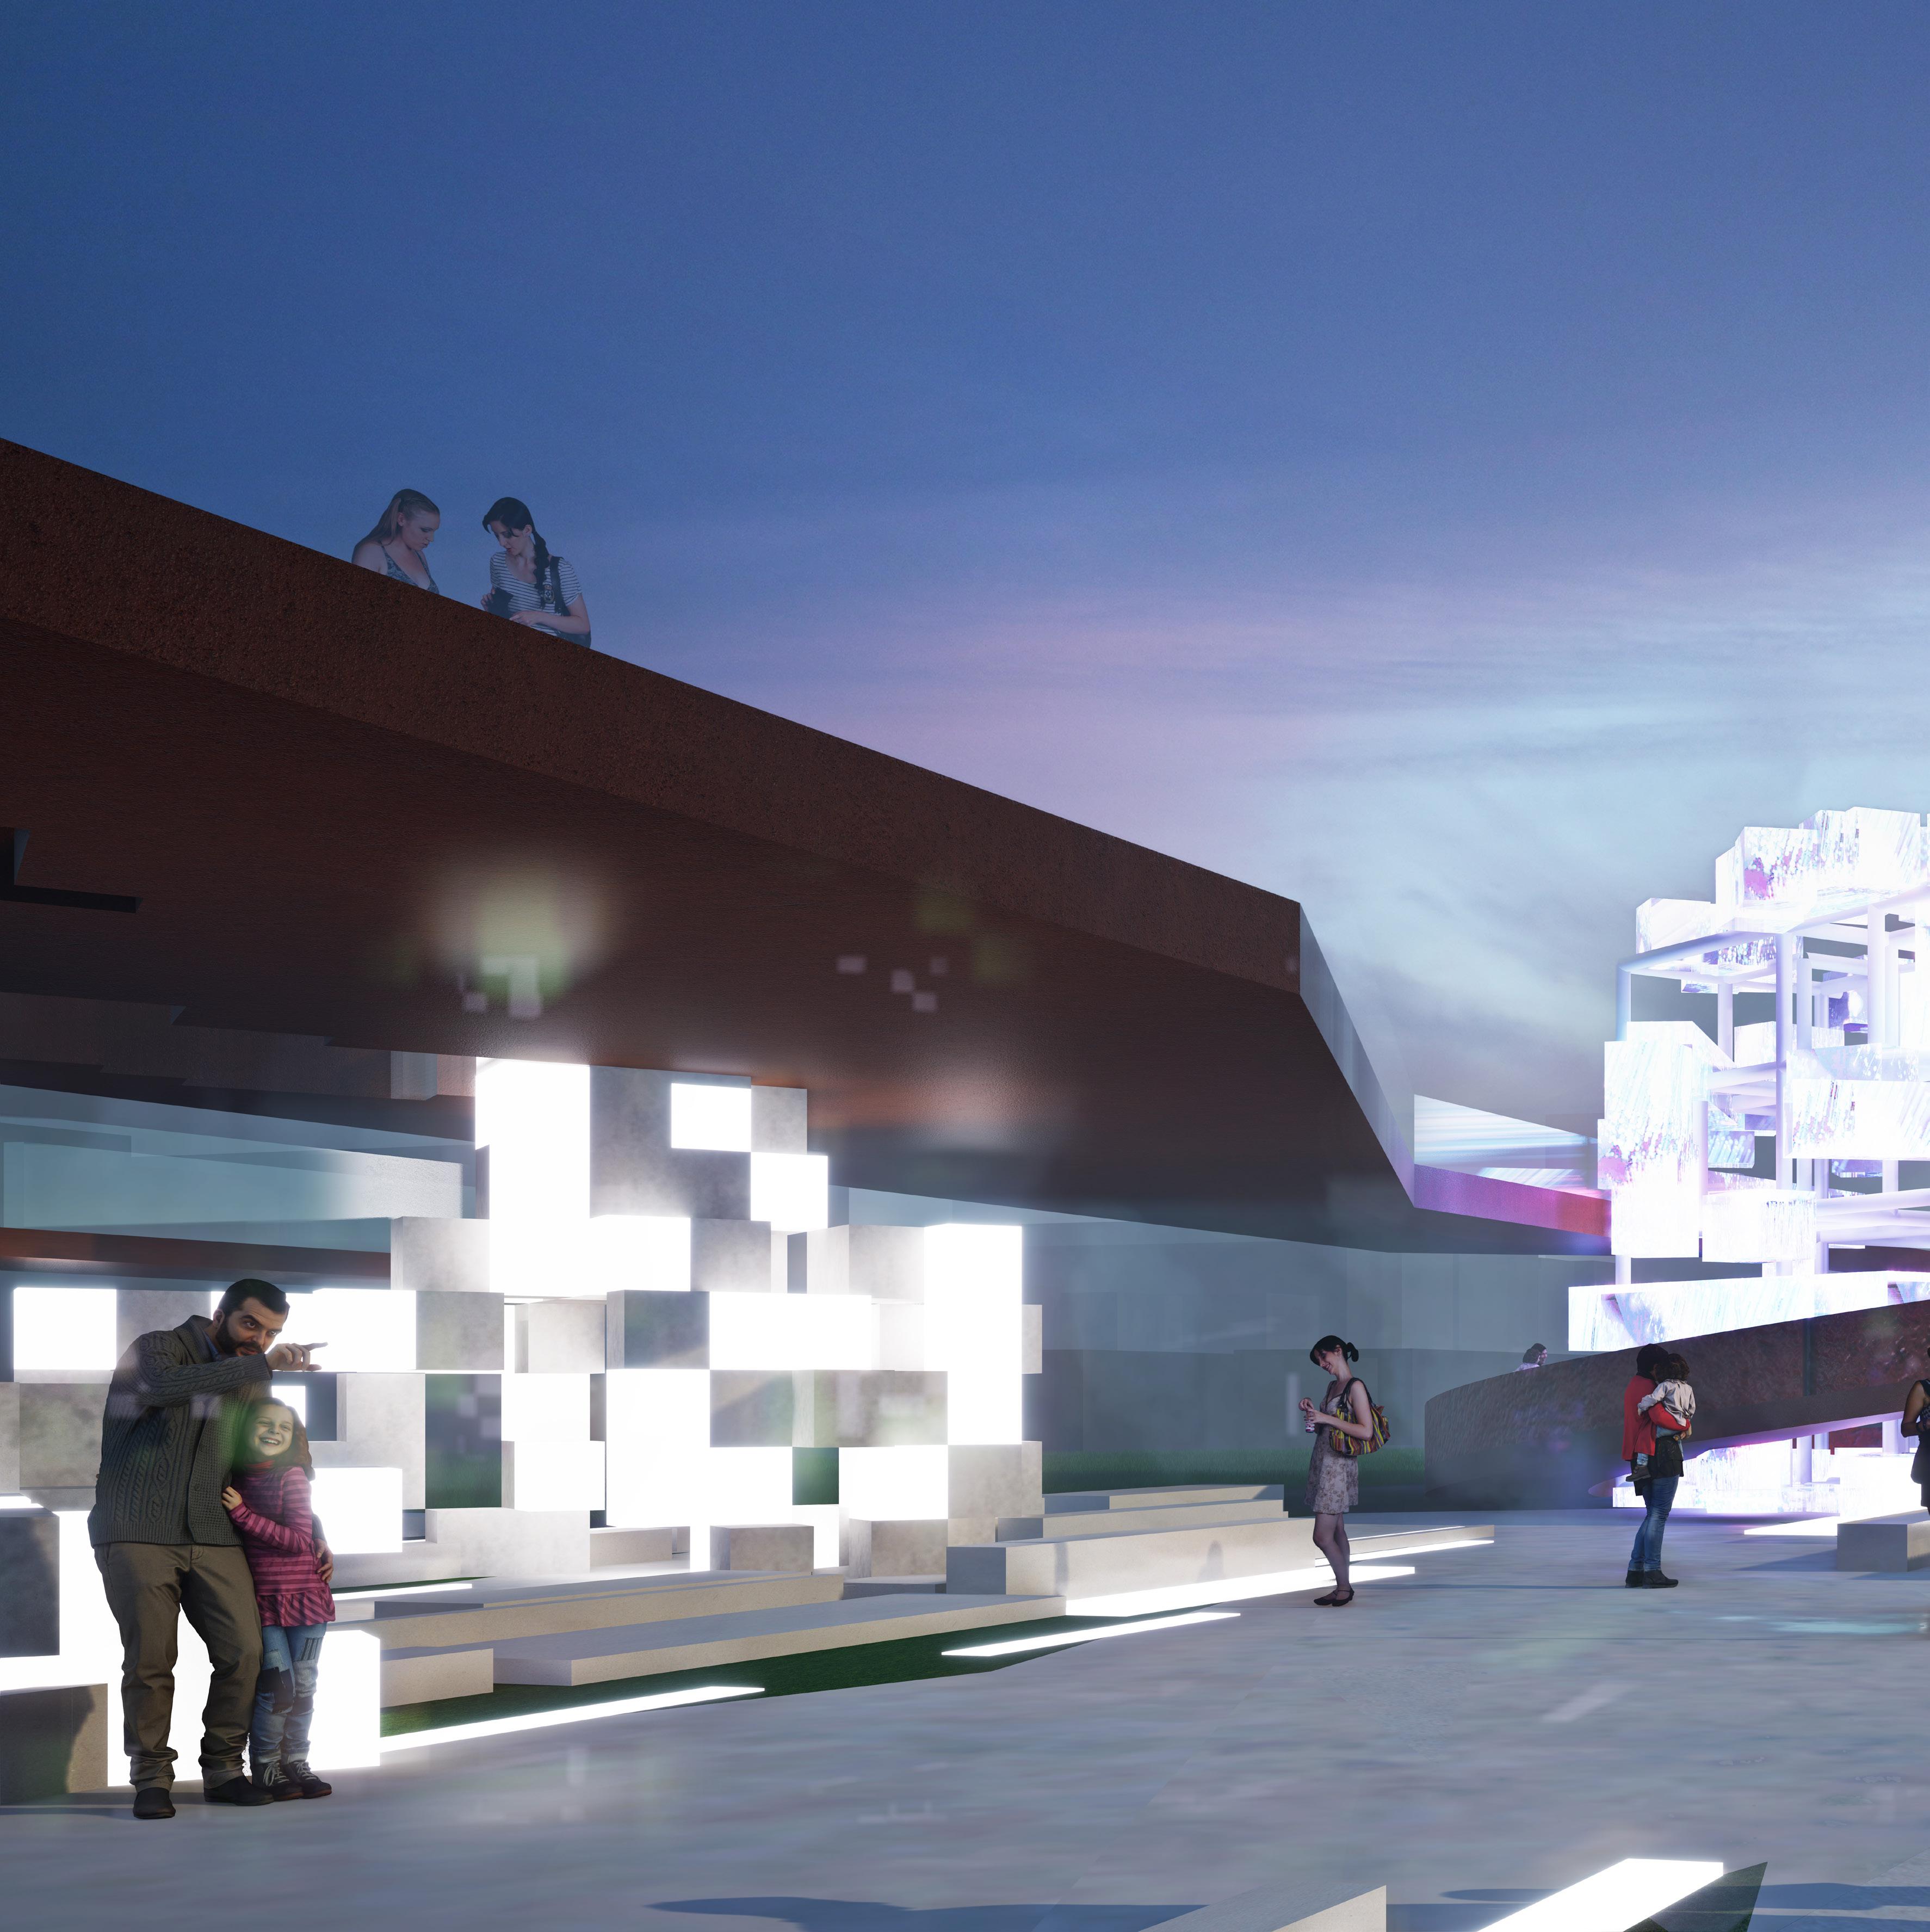
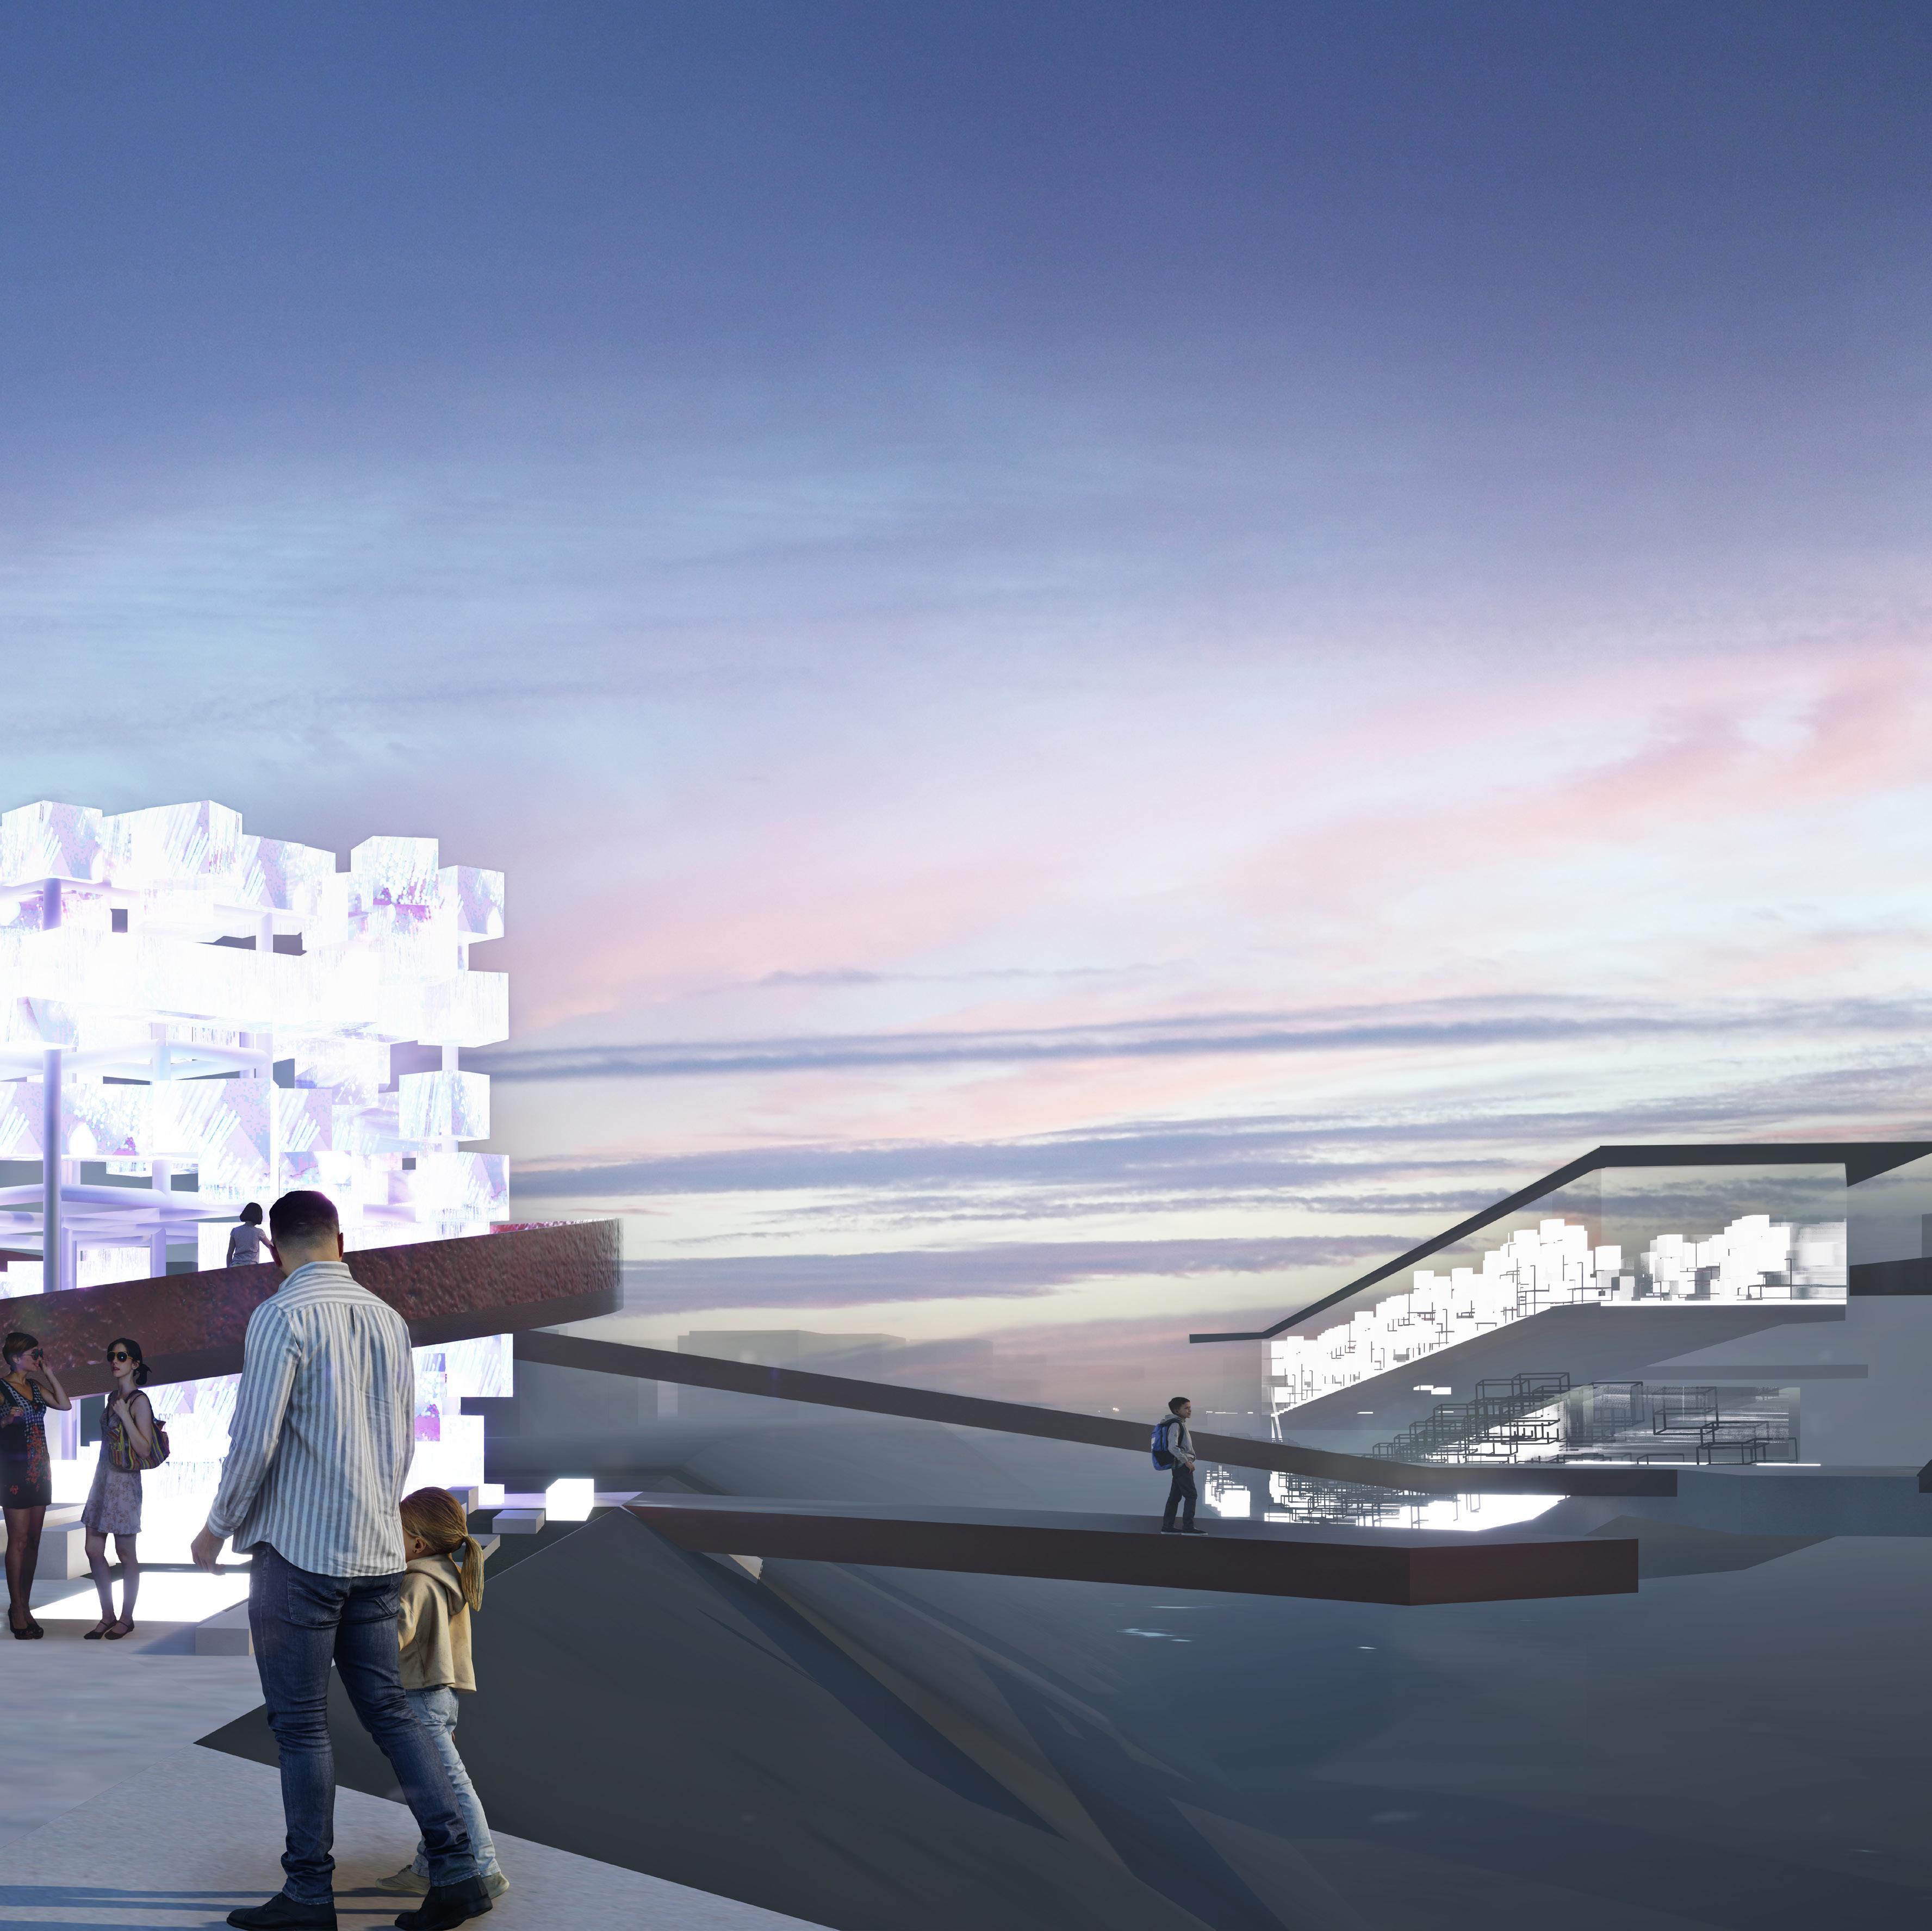
INTERVENTIONS: EMOTIONAL INTERACTIVE TOWER
Age Group Suitability: 5 to 7-year-olds, 7 to 9-year-olds, 10 to 11-year-olds
Educational Aspect:
• An Emotional Interactive tower uses color to revolutionize children’s understanding of emotions by immersing them in a vivid world where colors become the language of feelings and core values crucial to a child’s positive development
• A range of core values such as empathy, courage and freindship are displayed and suited to all age groups
• Children are not just participants, they become passionate creators, using their hands to paint colors as they interact with the structure
Targeted Factor/s: Education, Health, Safety, Movement
‘Encanto’ - Sharing & Family Values
‘Inside Out’ - Empathy & Awareness
‘Kubo’ - Freindship
‘Moana’ - Teamwork & Courage
‘Soul’ - Trust & Passion
‘The Good Dinosaur’Sharing & Family Values
ISOVIST DATA DESIGN INFLUENCE
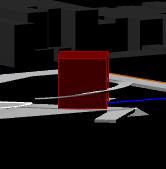
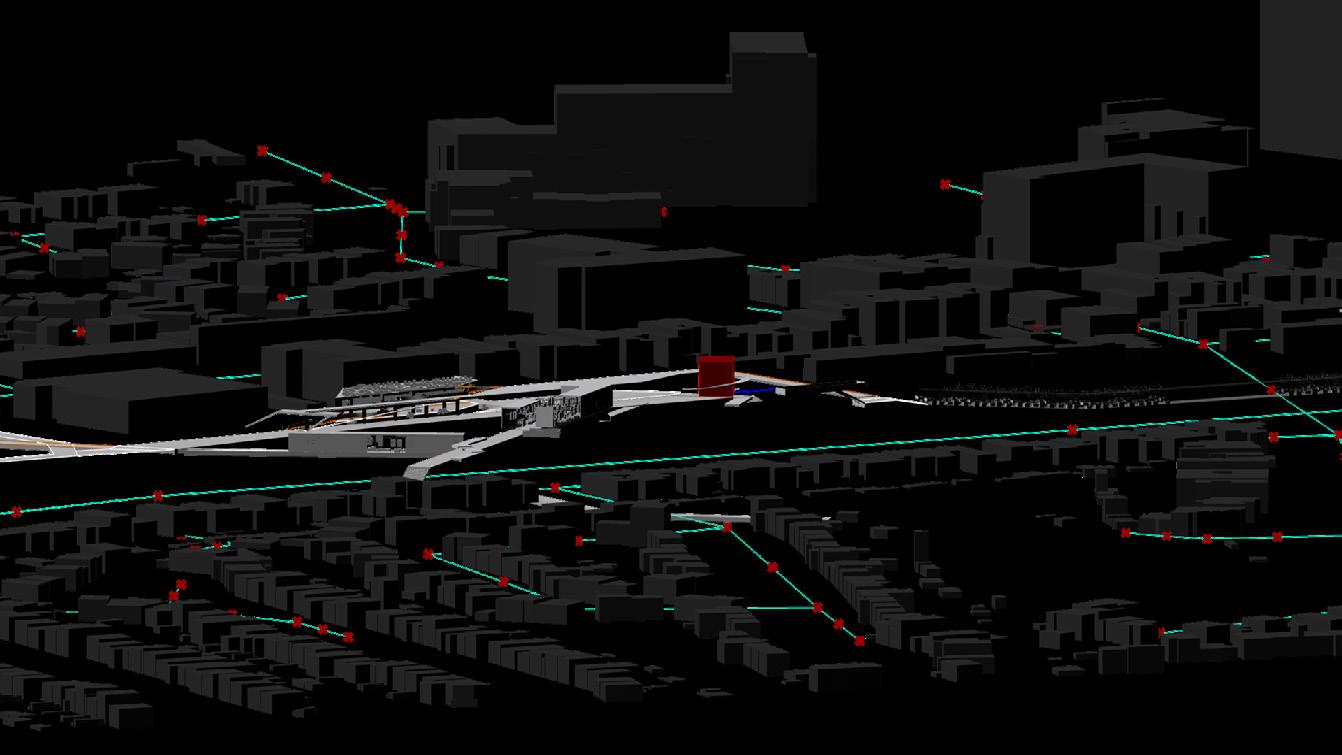
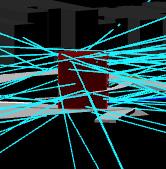
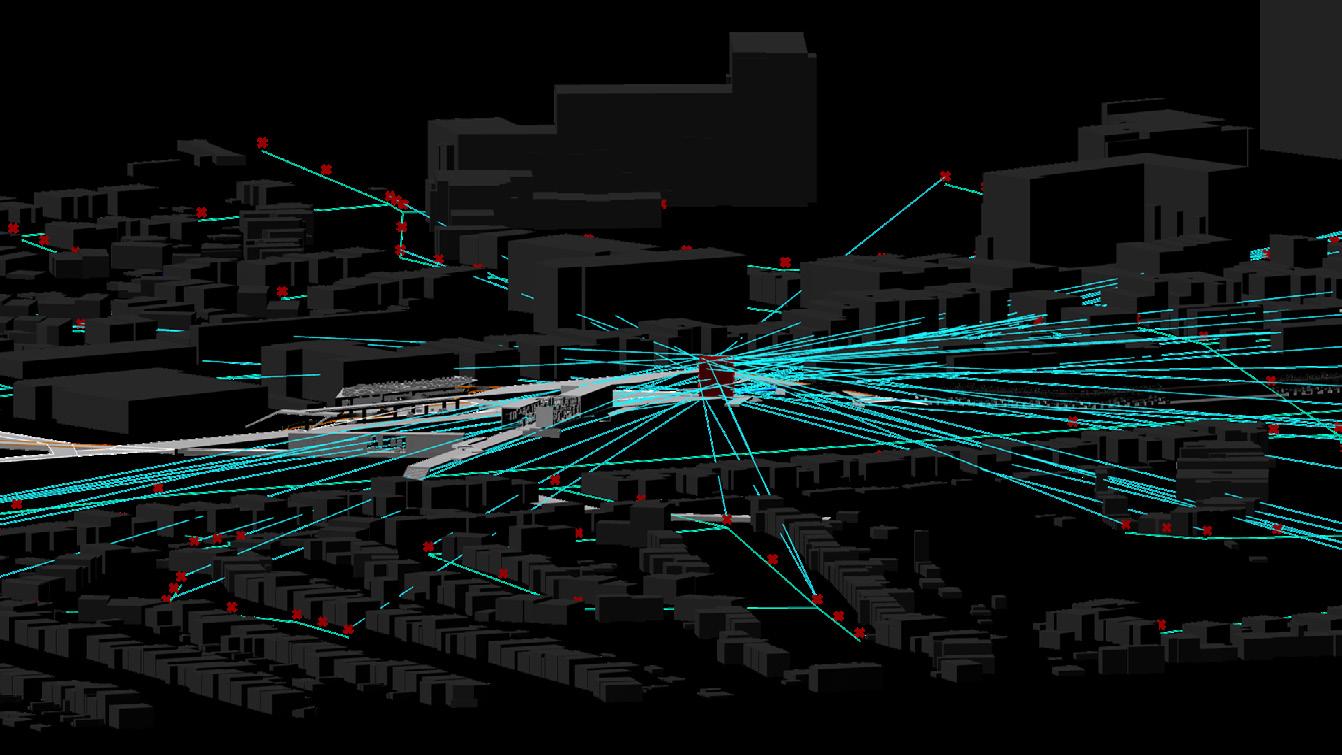
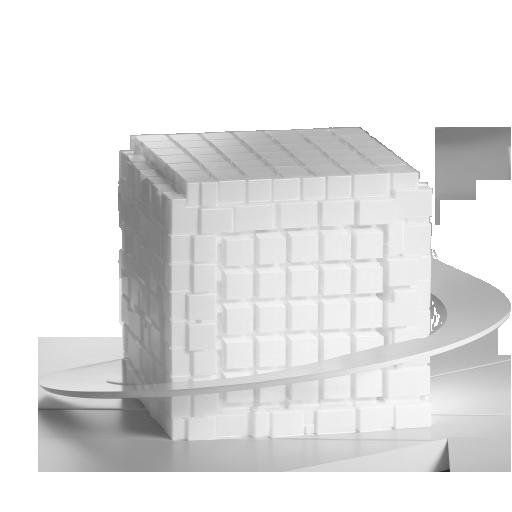
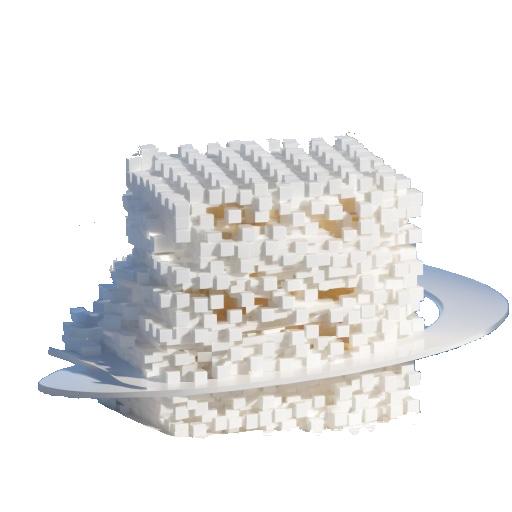
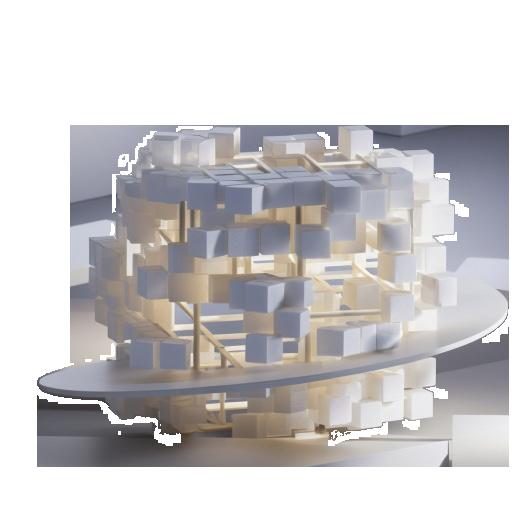
The design concept of the emotional interactive tower stems from isovist analysis. First we plotted viewing points from streets within the 800 meter catchment of the interactive tower. Then we calculated the isovist visibility towards the tower. The isovist rays from all the viewing points hit towards the tower at different points which prompted us to segment the tower into cube sections of where the rays hit. The cube sections were rotated according to the visibility calculations to increase visibility from all angles around the tower. The cube sections were increased in size to increase visibility and have a higher surface area to project the colors onto.
Base Cube Block tower
Projected isovist rays onto cube
Projected Isovist color calculations
Segmented into cube sections
Segmented Cube into sections
Rotated Cube structure to increase visibility
Increased size and rotated each individual cube to reduce low visibility areas
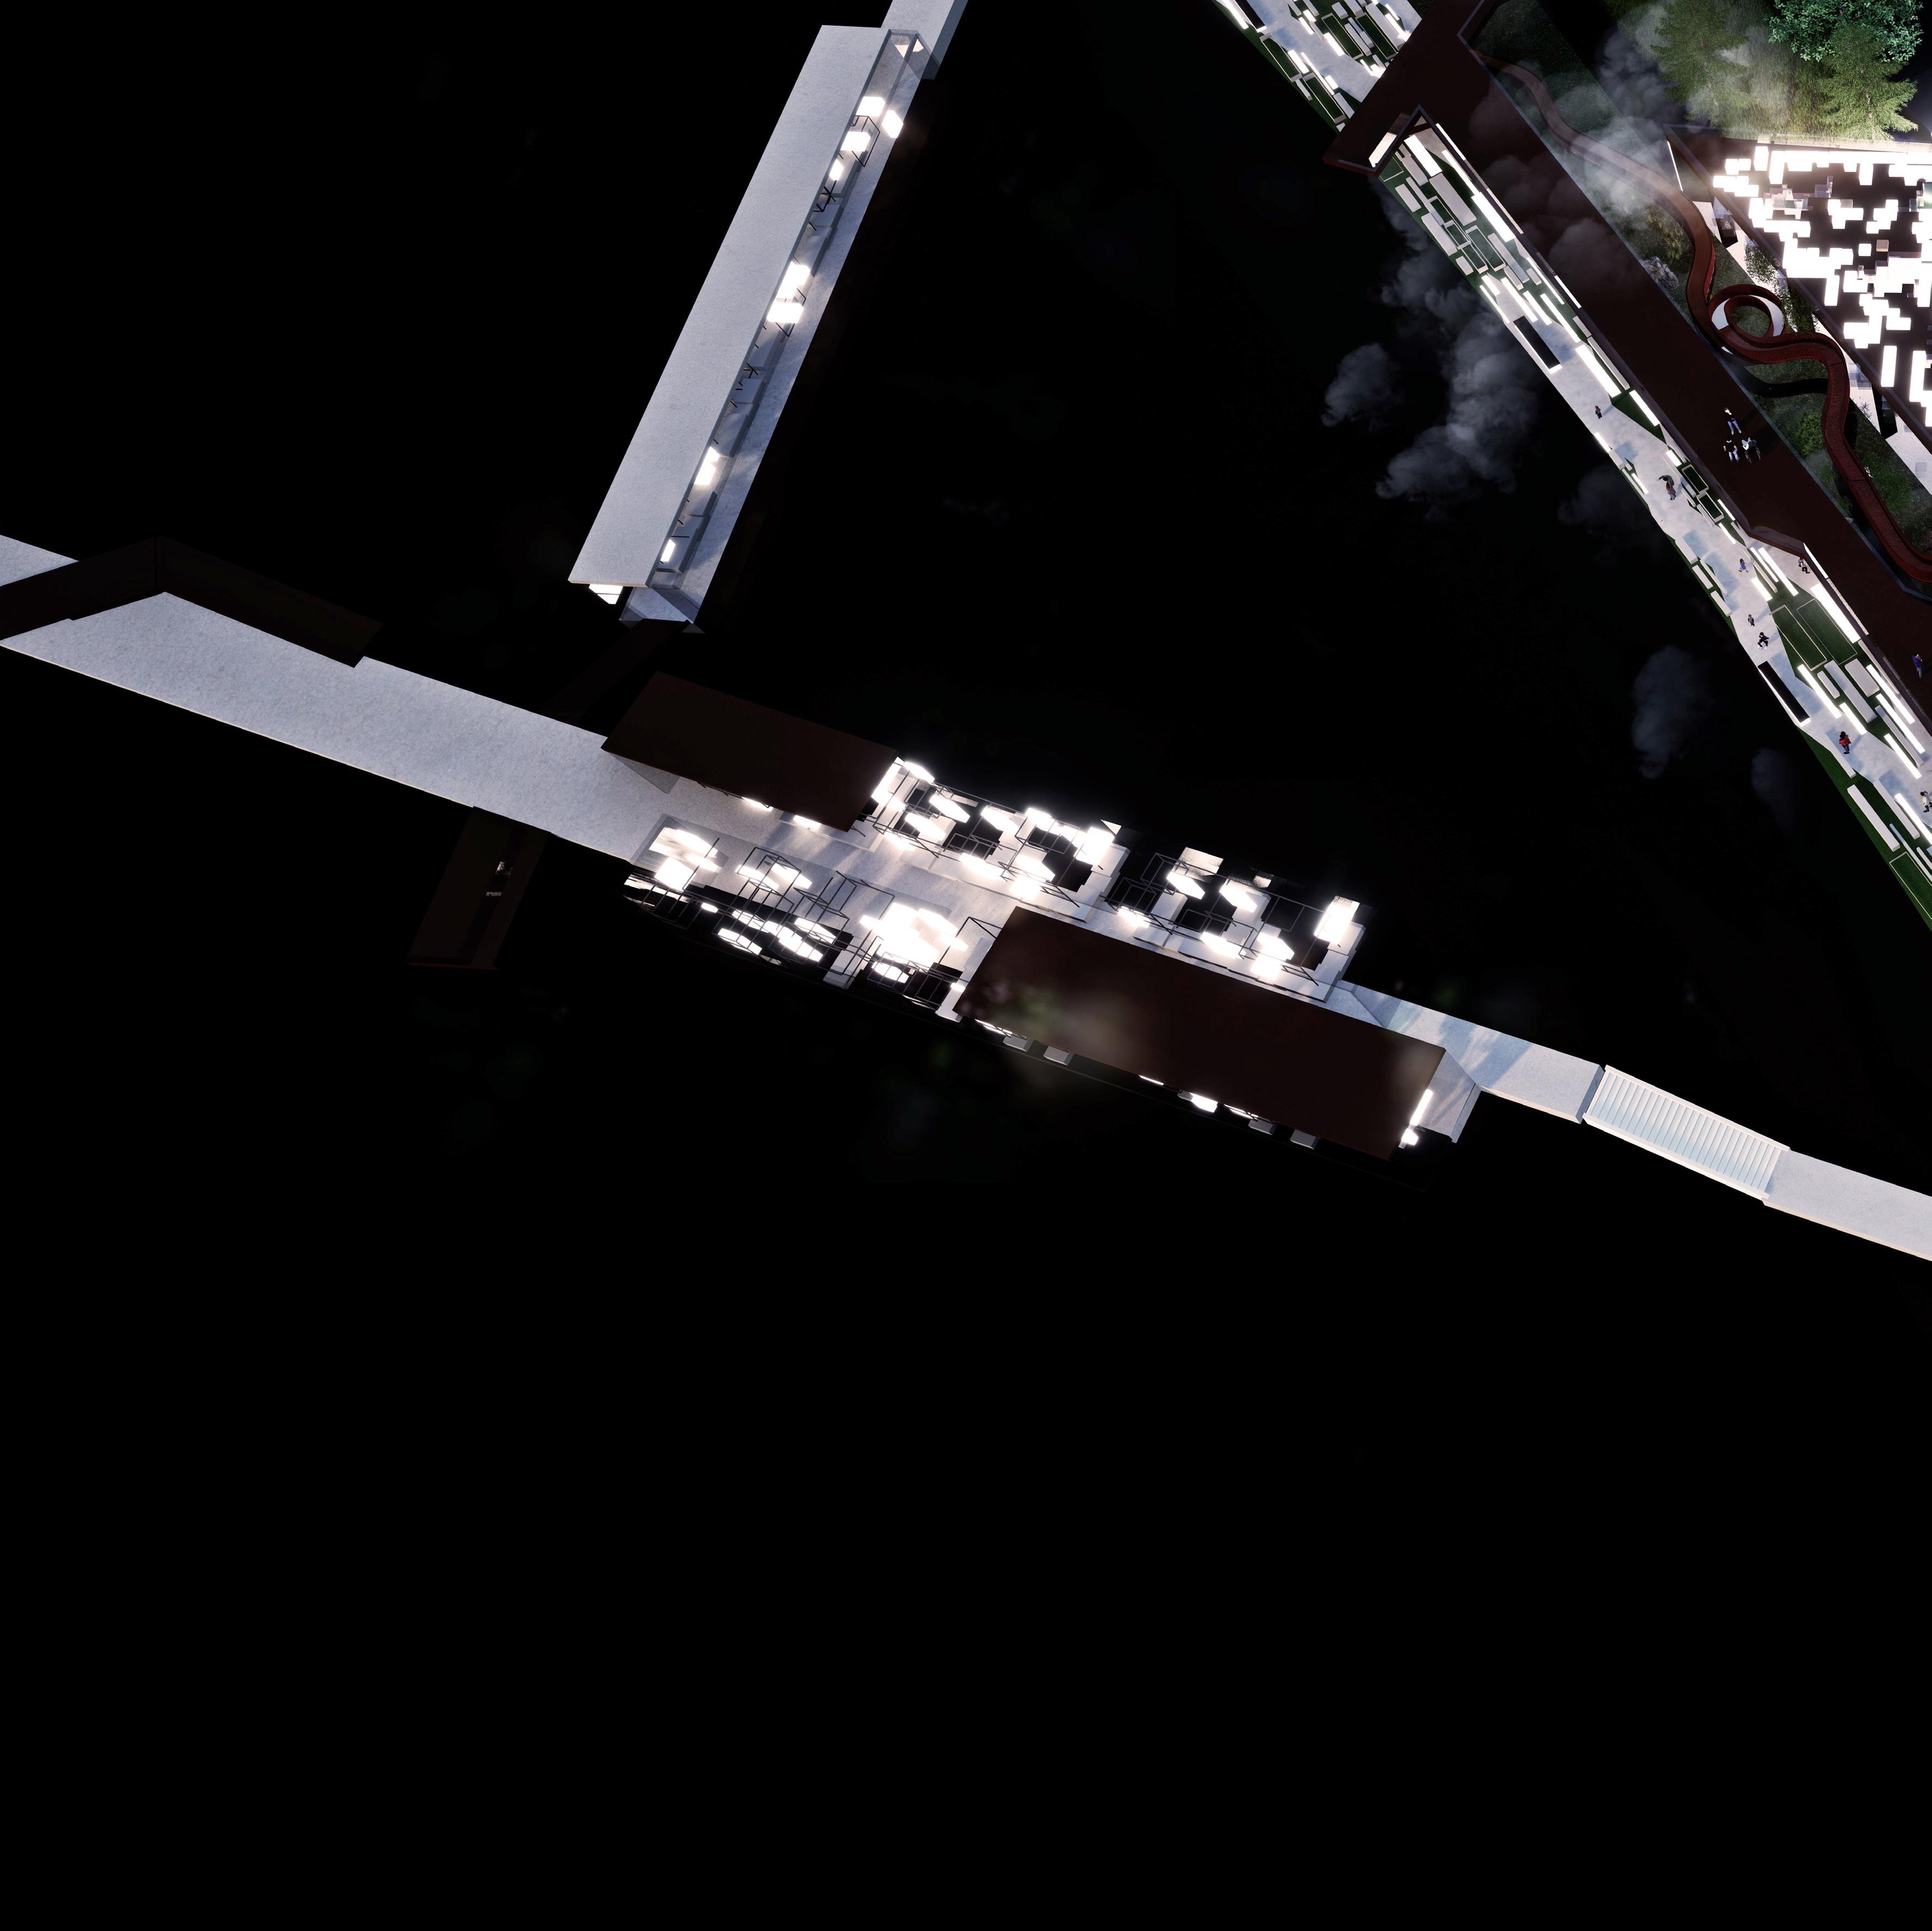
NIGHT VIEW INTERACTIVE TOWER
PROGRAMMATIC PERSPECTIVE: ALL-AGE INCLUSIVE ZONE 1
Our first all-age inclusive zone consists of the tropical garden and farming tunnel interventions. This zone is suited to all age groups due to the environmental, social, and agricultural educational aspects.
PROGRAMMATIC SECTION: ALL-AGE INCLUSIVE ZONE 2
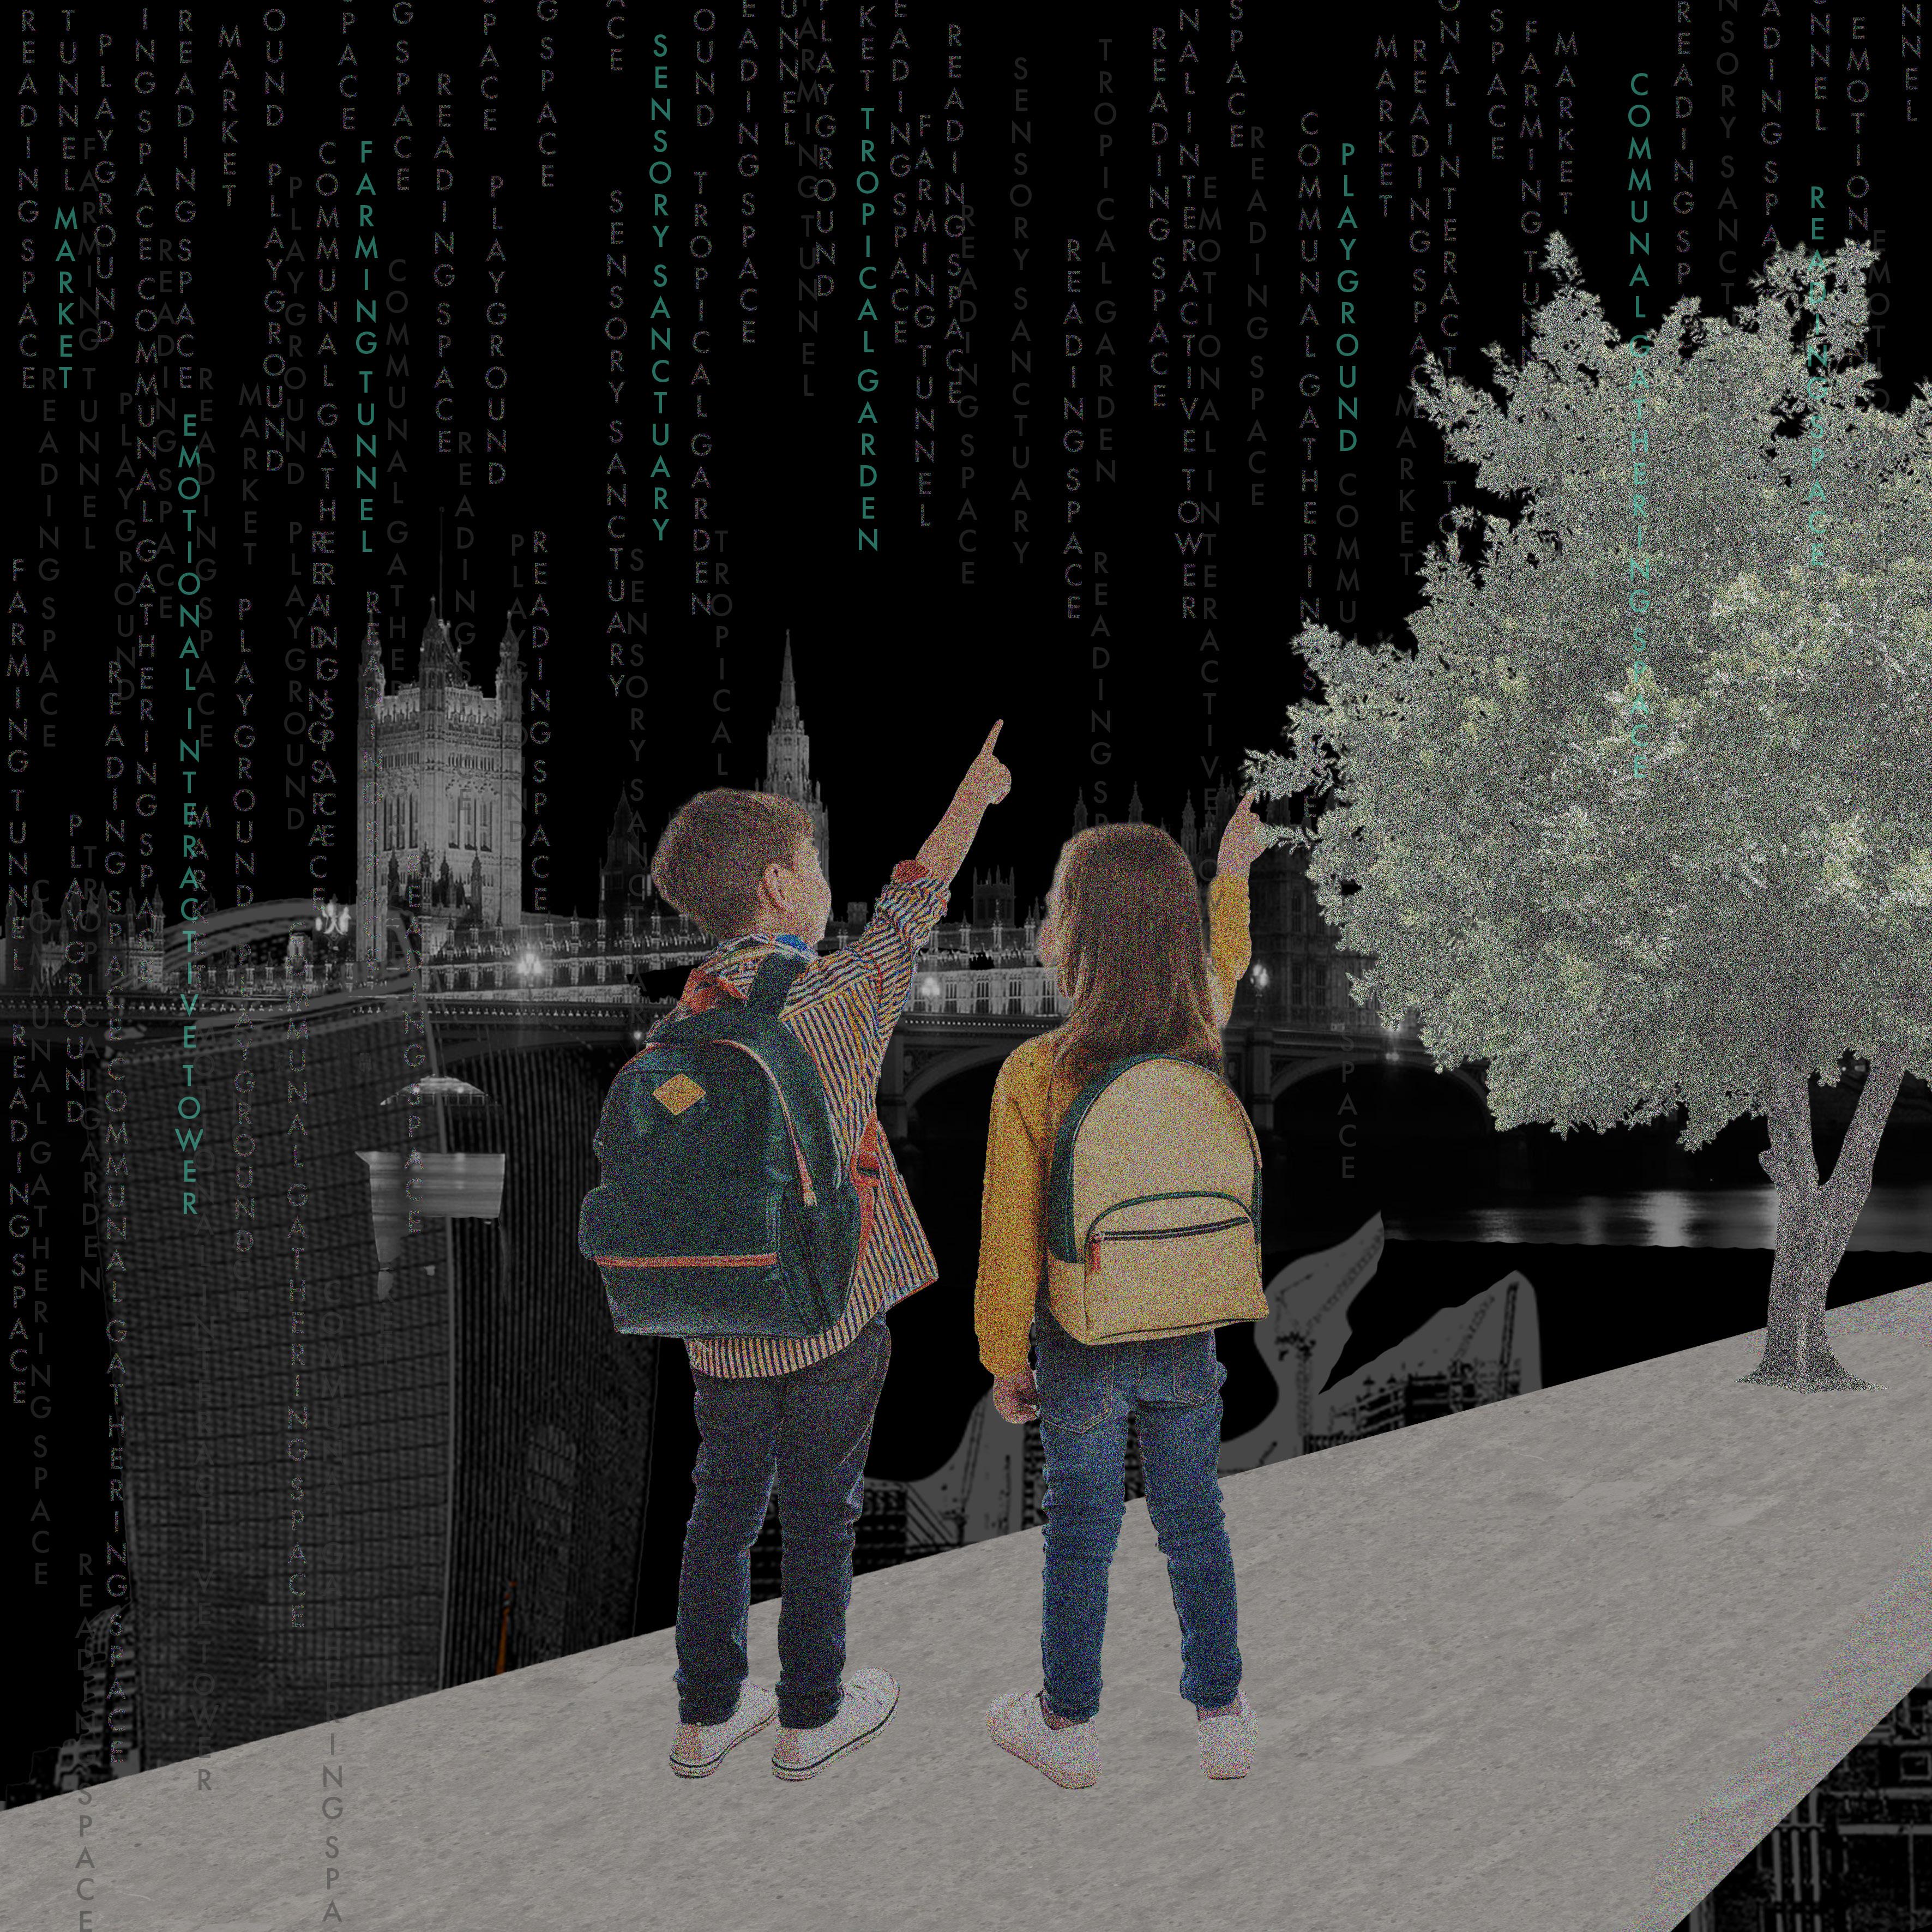
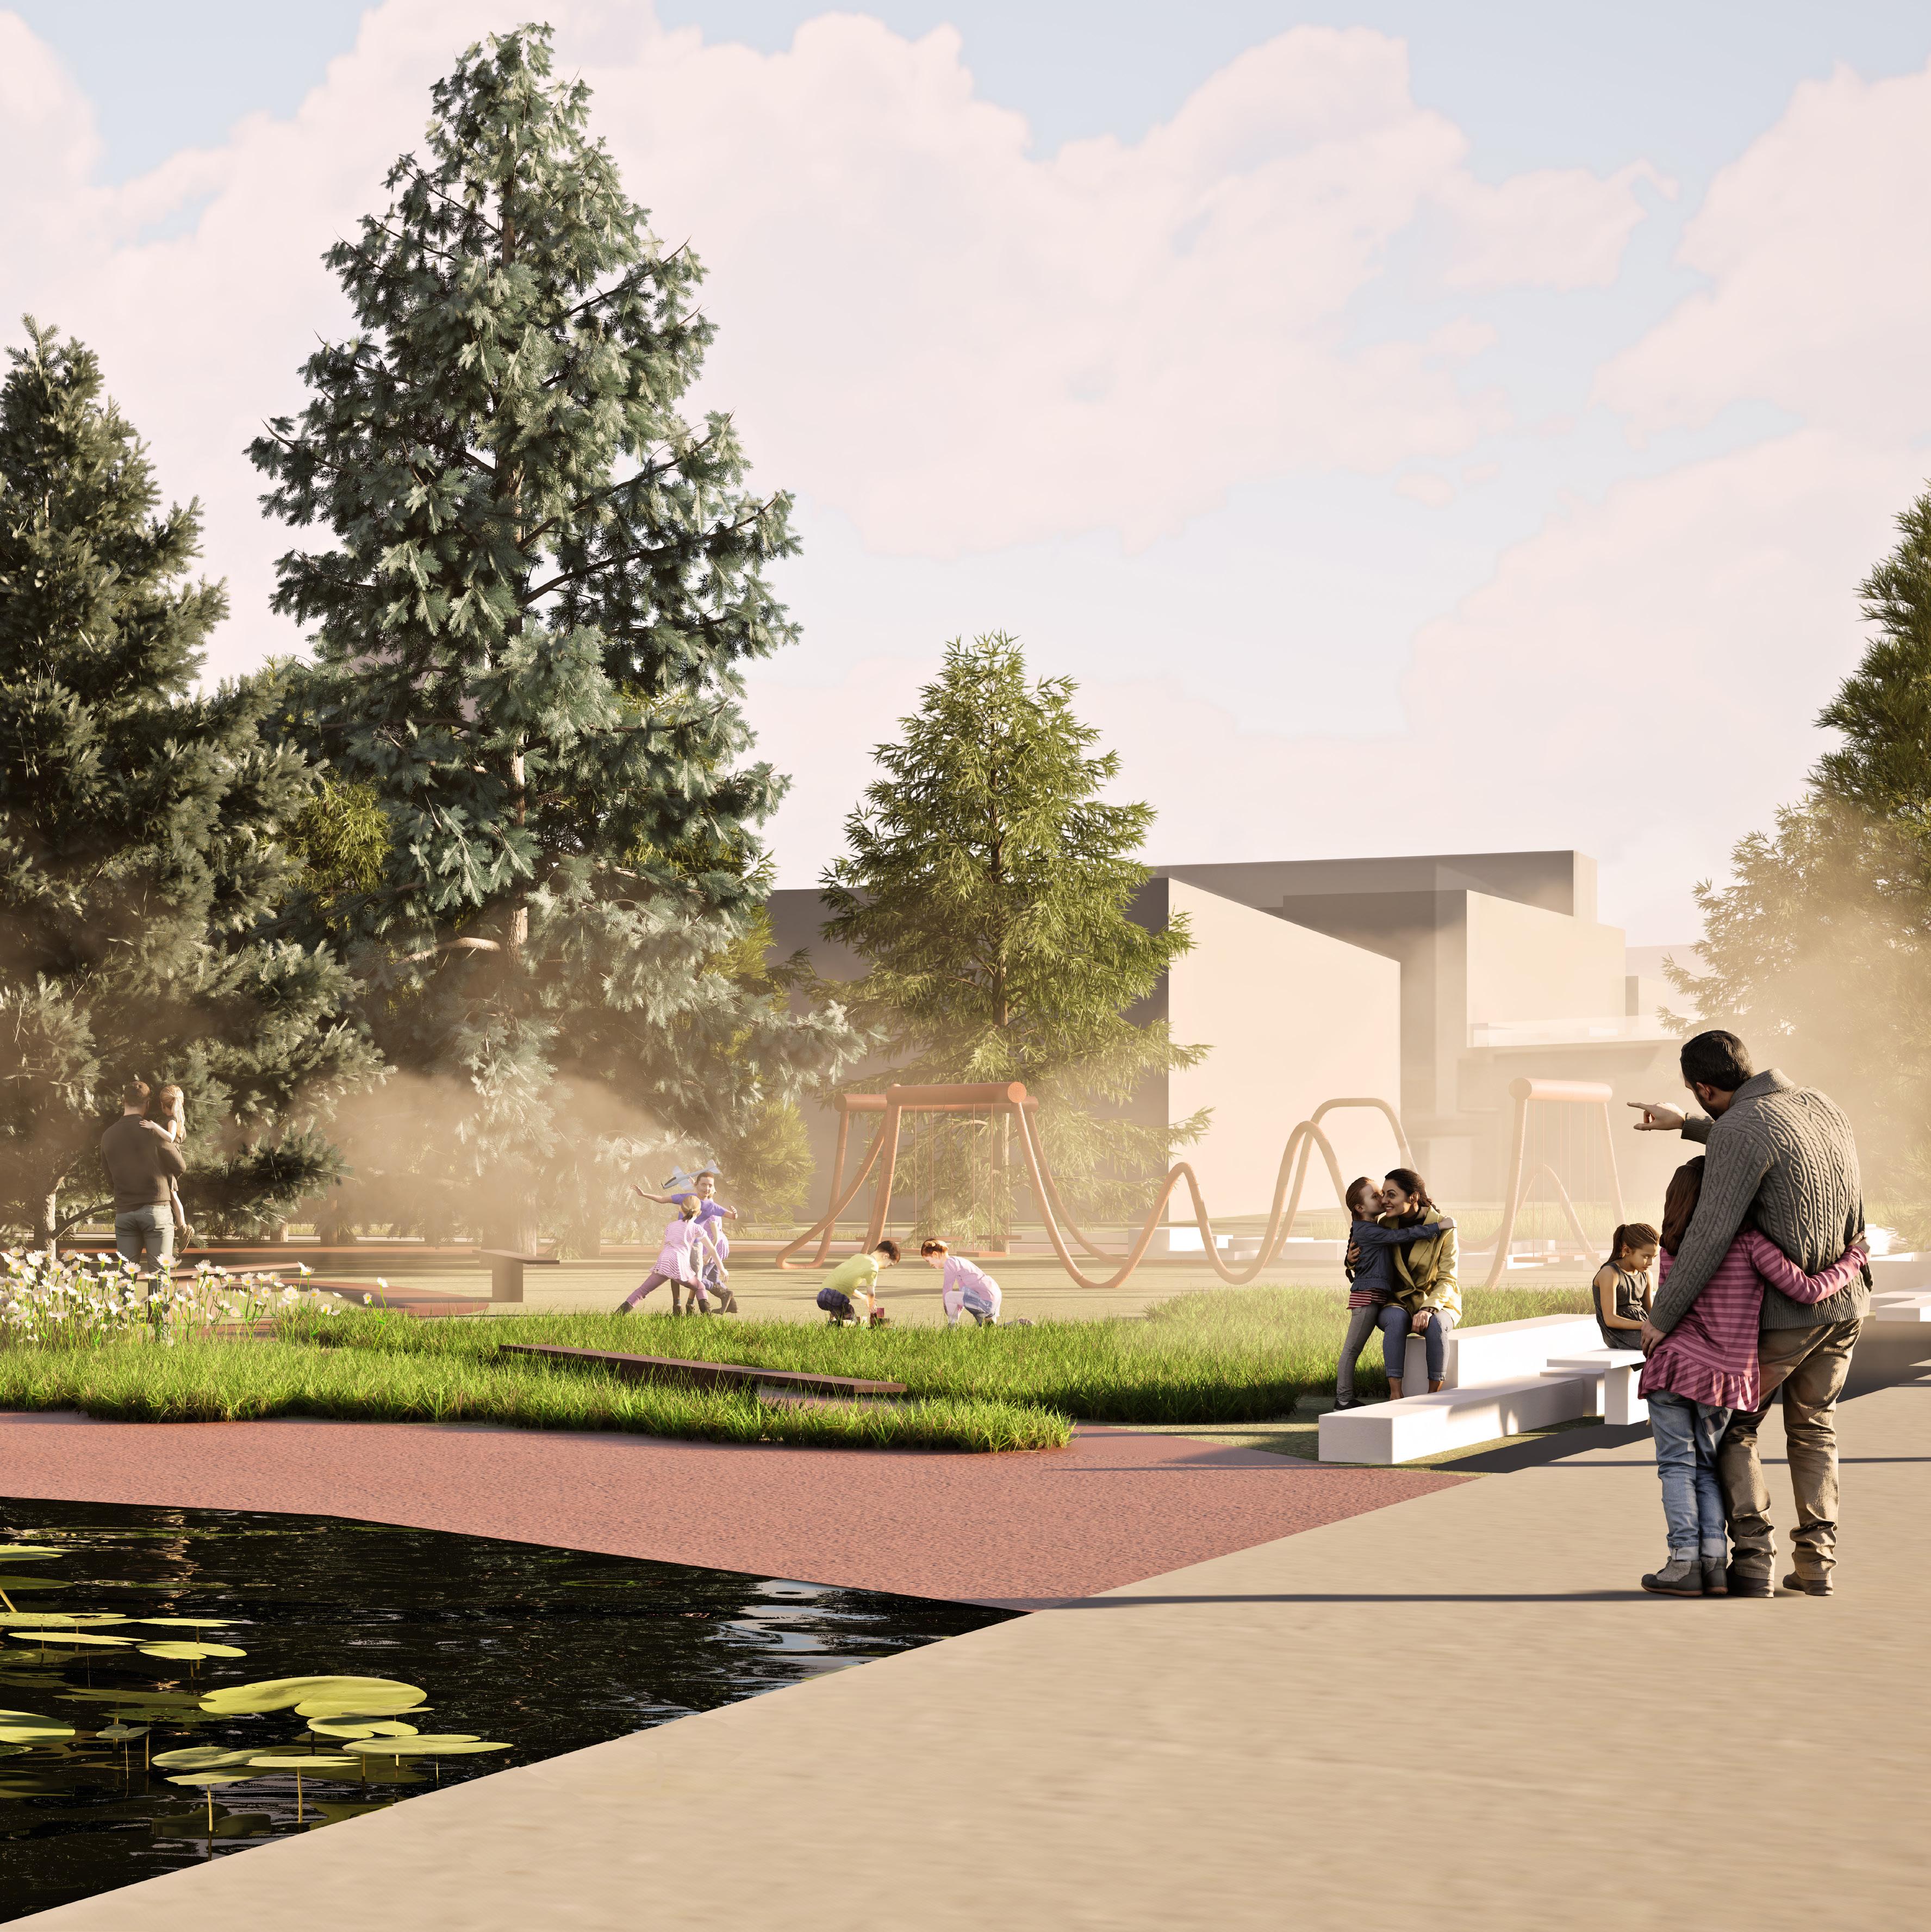
Our second all-age inclusive zone consists of the social gathering space, playground, and emotional interactive tower interventions. This zone is suited to all age groups due to the environmental, social, emotional, and exploratory educational aspects.
EMOTIONAL INTERACTIVE TOWER
PLAYGROUND
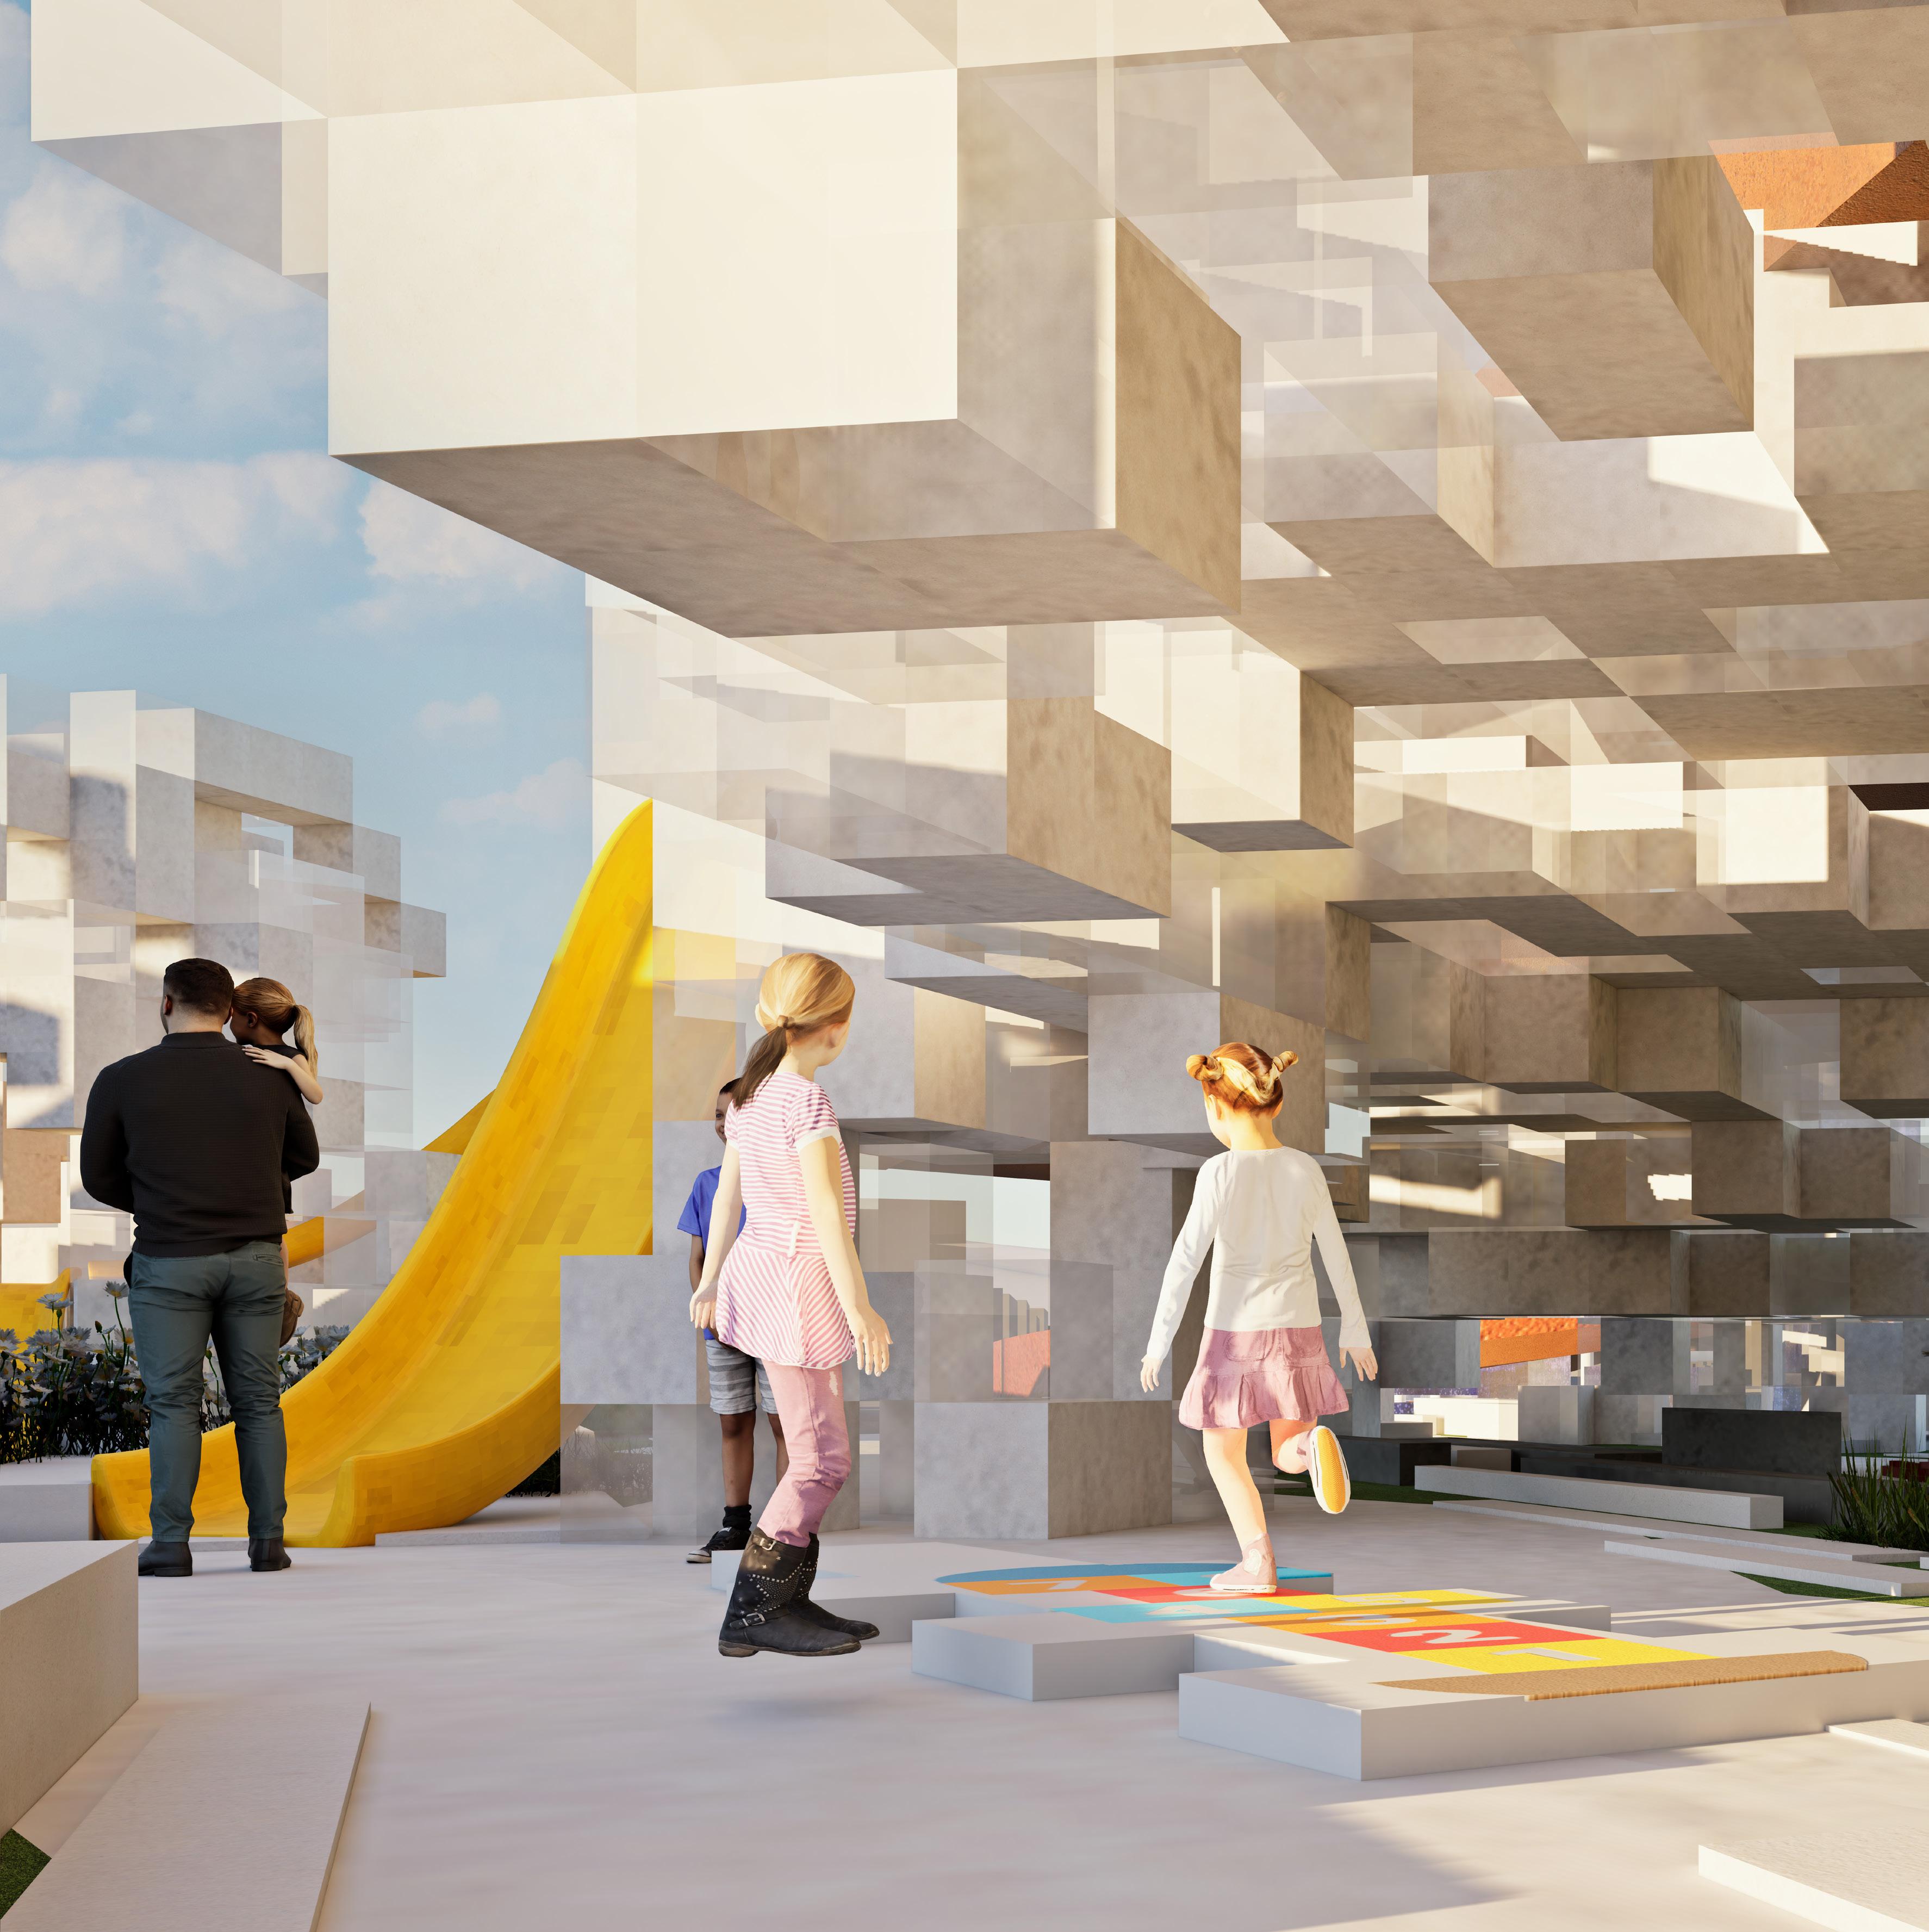
AFTERNOON VIEW PLAYGROUND
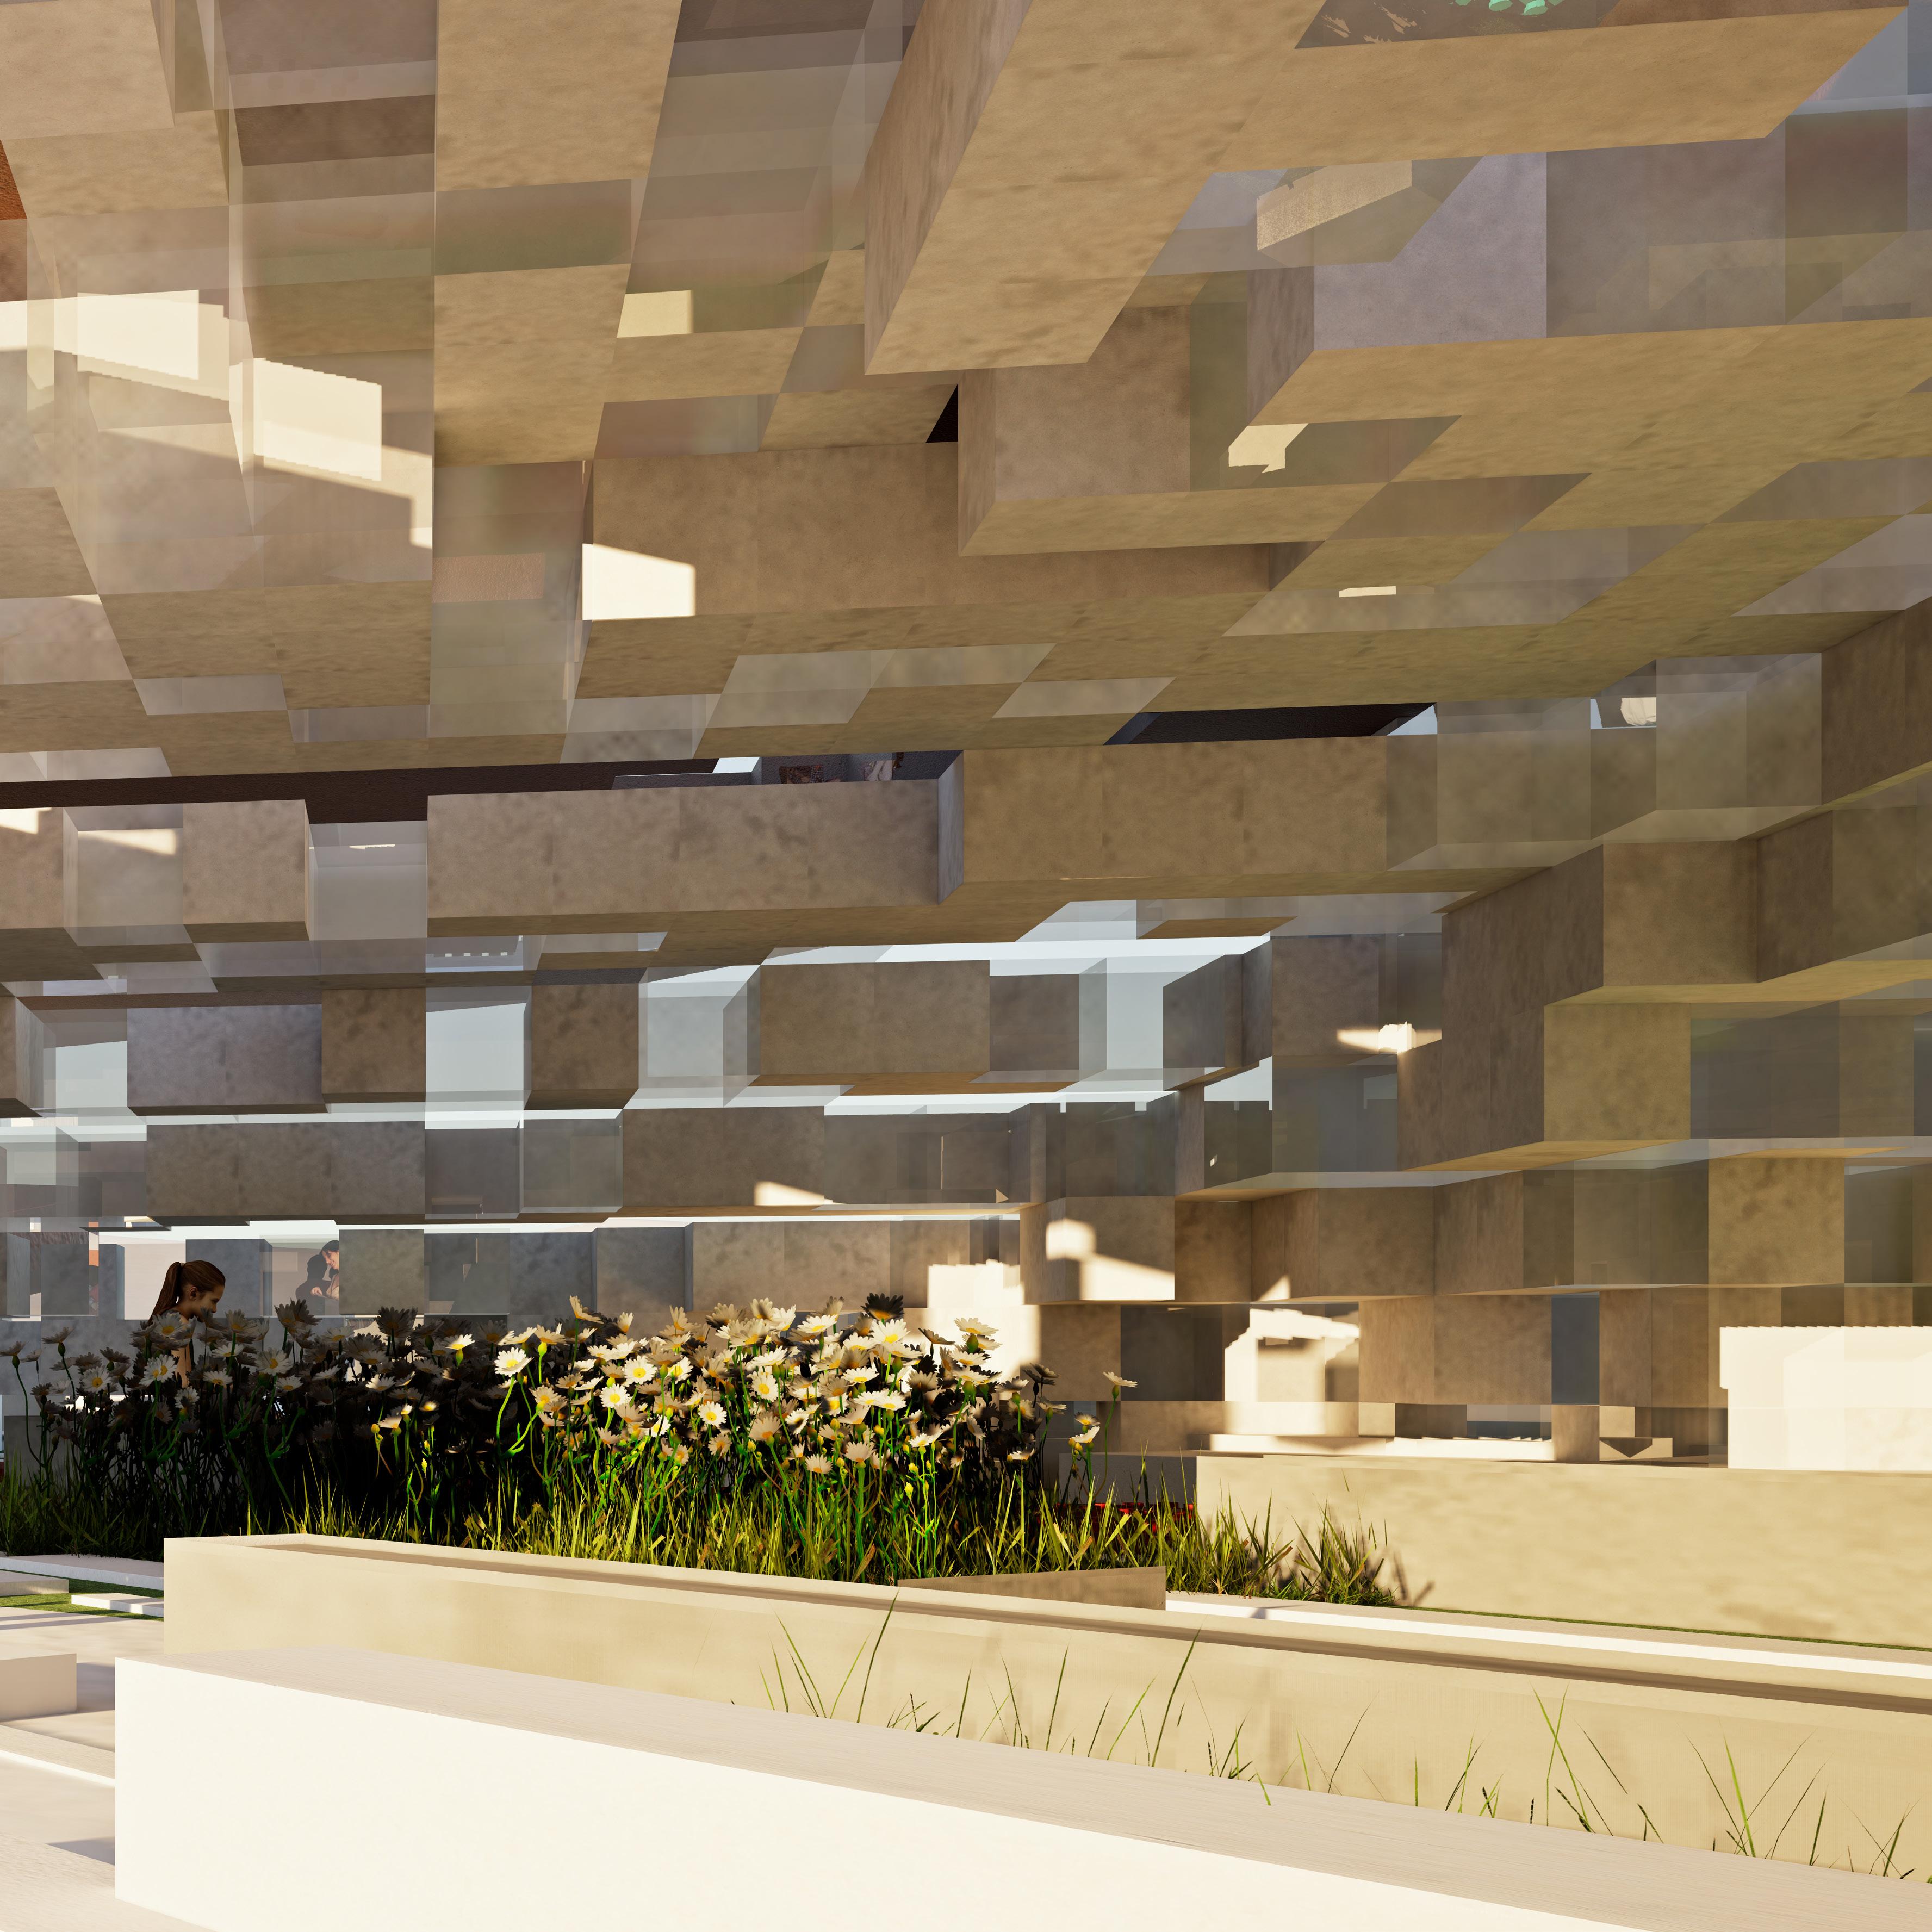
OUTER VIEW TROPICAL GARDEN
AFTERNOON VIEW PLAYGROUND
NIGHT VIEW PLAYGROUND
INNER VIEW PLAYGROUND
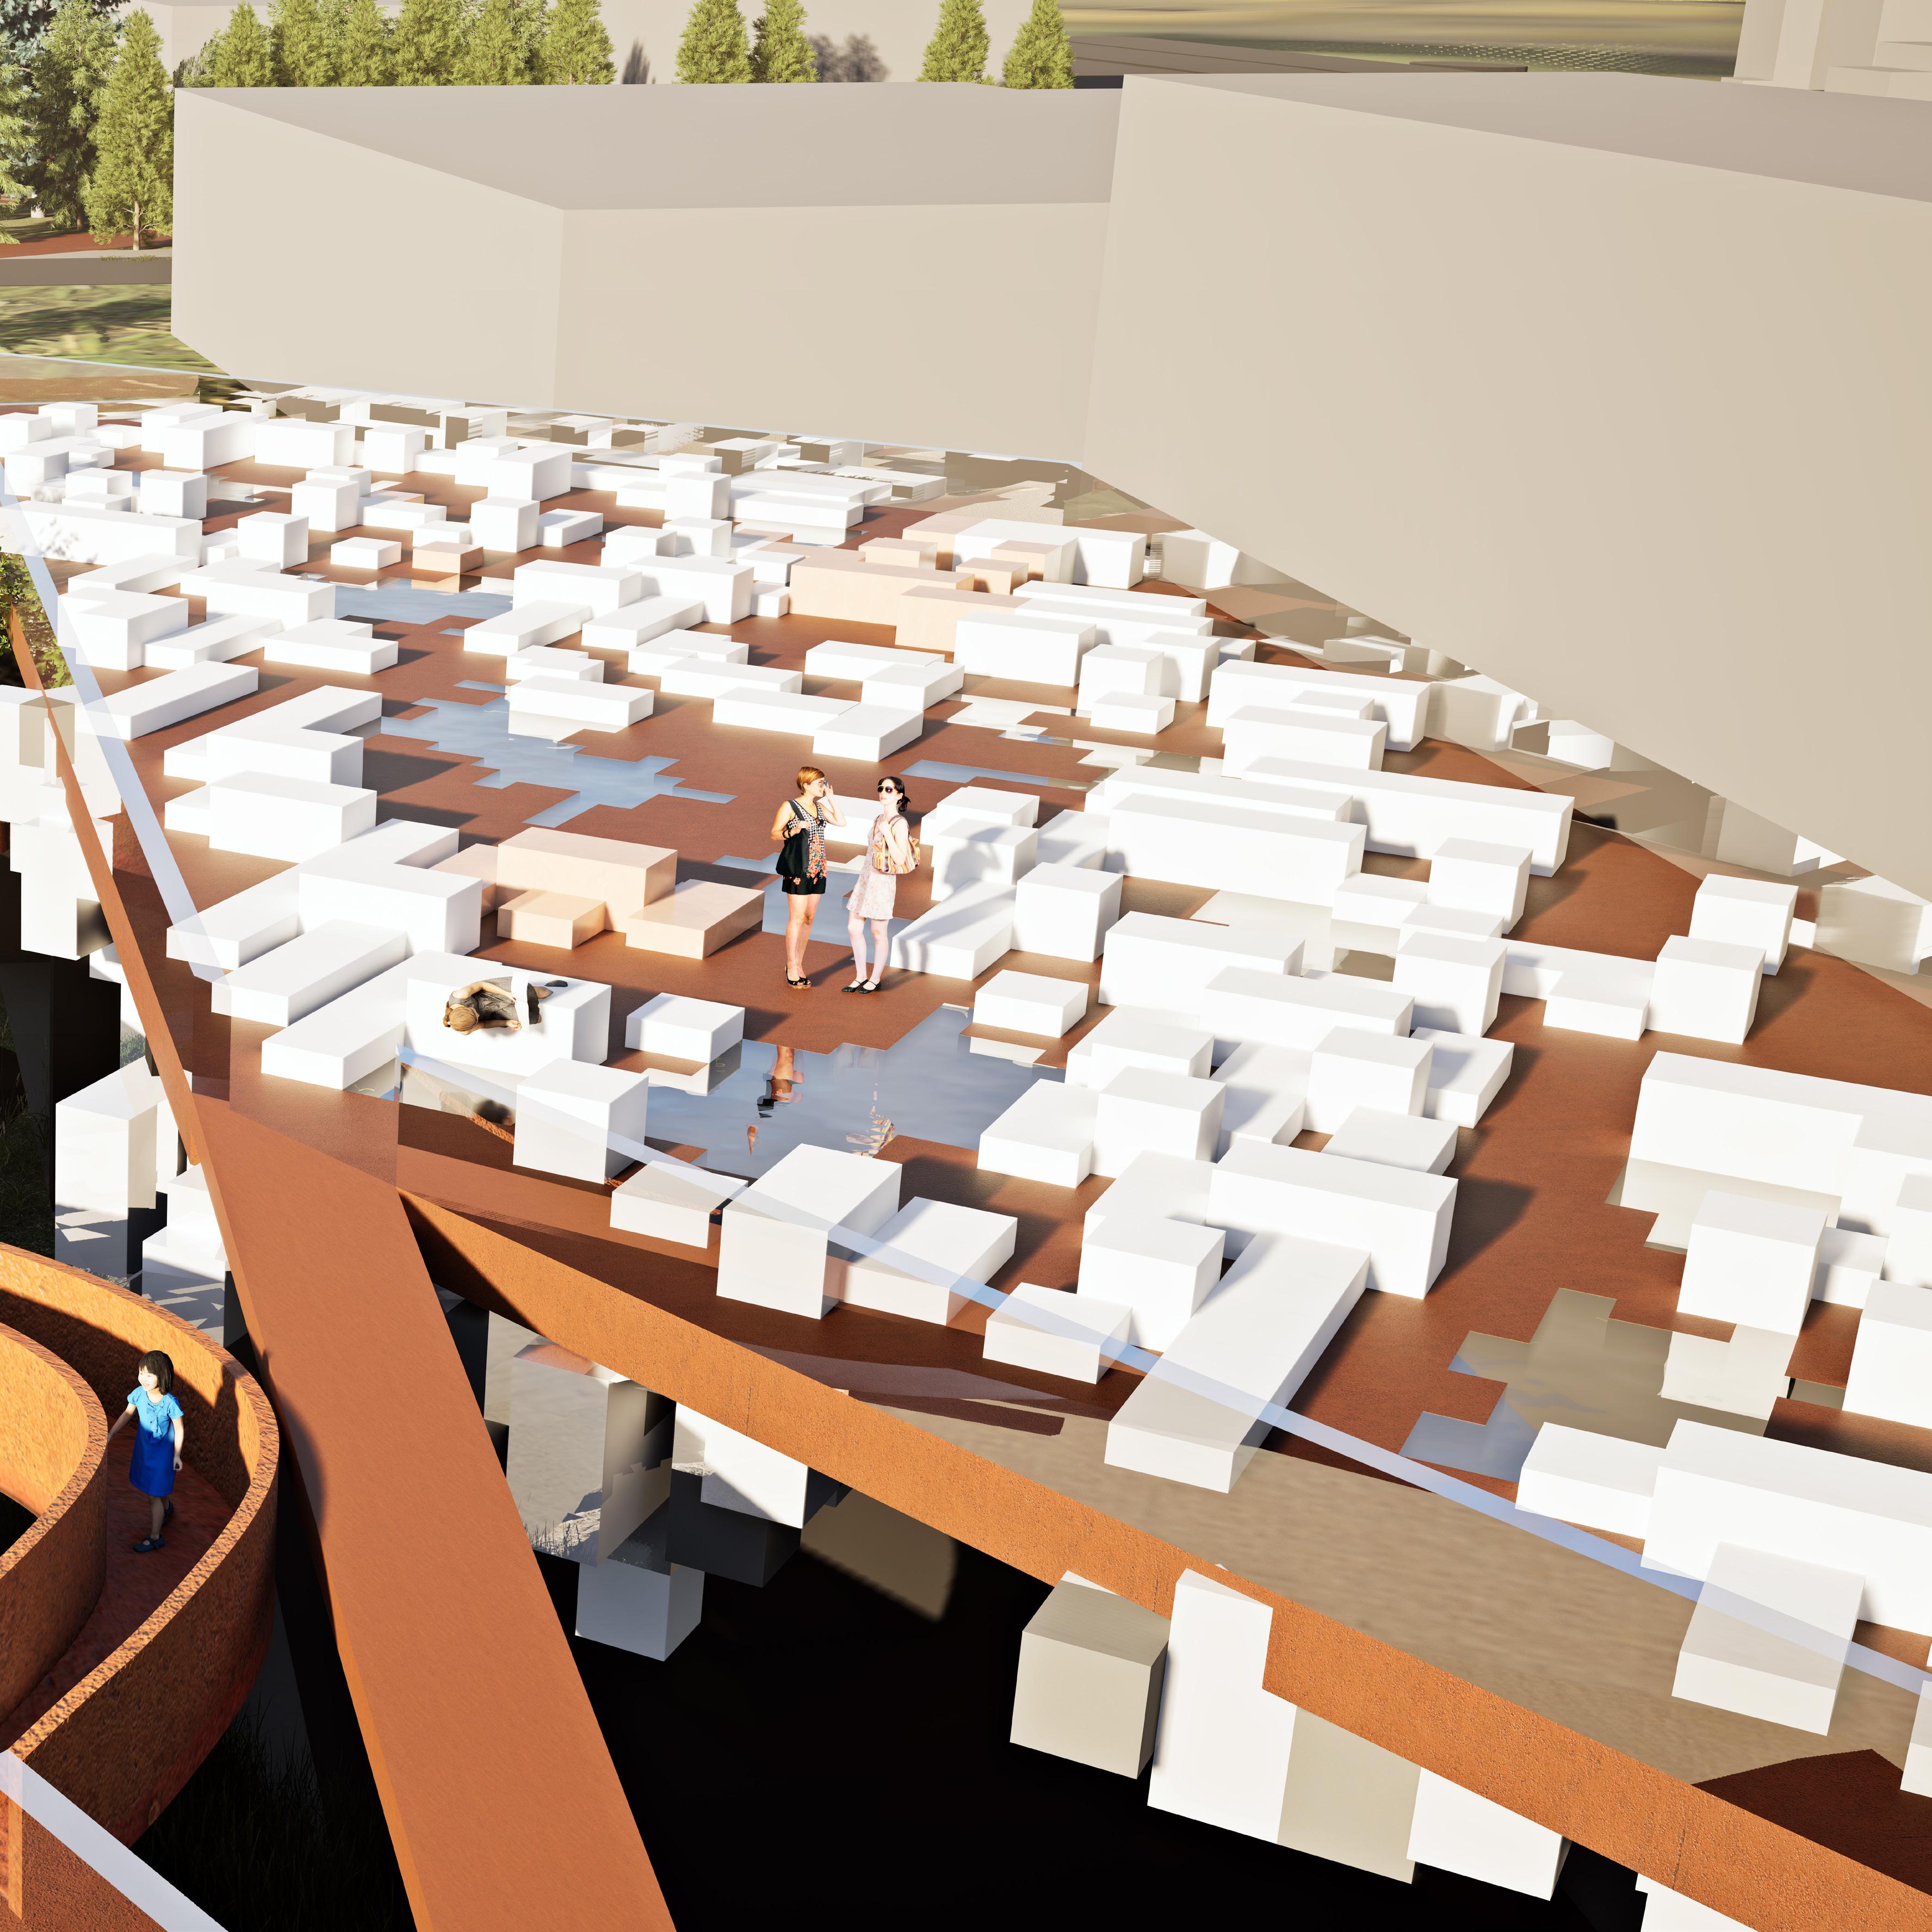
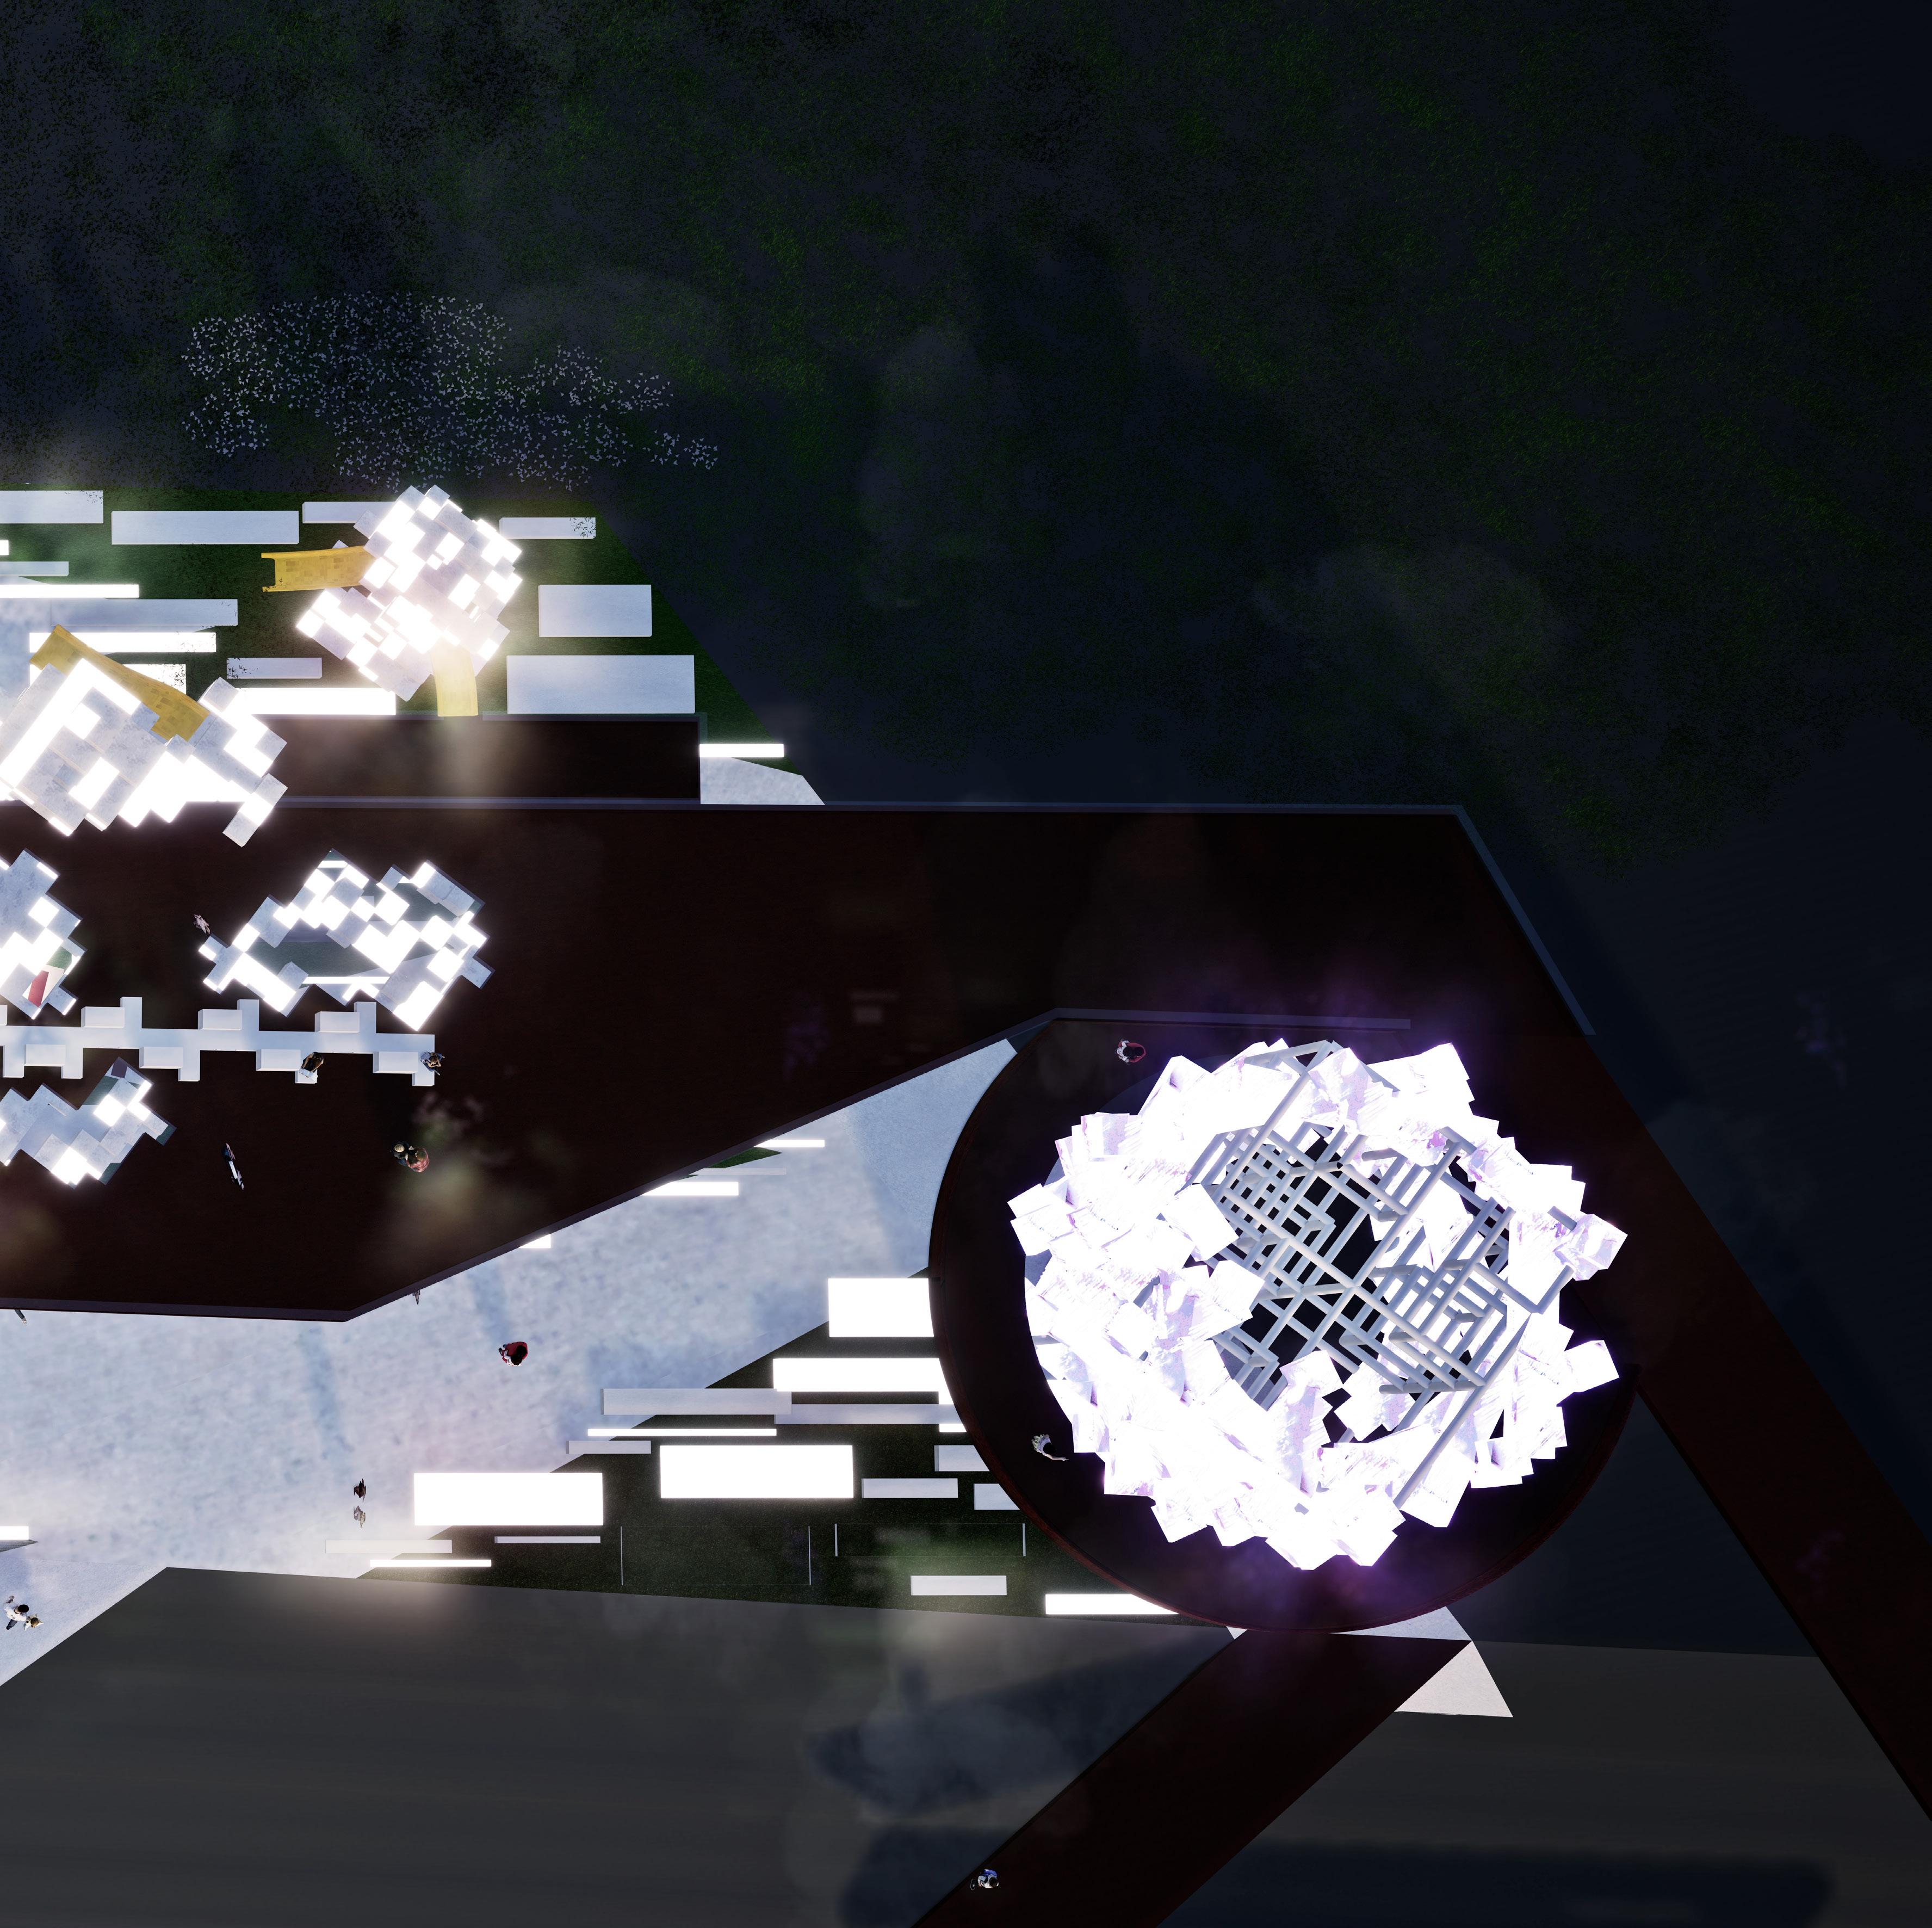
NIGHT VIEW SITE
AFTERNOON VIEW SOCIAL GATHERING SPACE
BPro M.Arch Urban Design 2023/2024
Research Cluster 14
The Bartlett School of Architecture University College London 22 Gordon Street London WC1H 0QB United Kingdom