51 minute read
Adding a New Football Program: The Impact of Socioeconomic and Geographic Diversity at Small, Private Institutions Joe Mullins & Daniel Teodorescu


Adding a New Football Program: The Impact on Socioeconomic and Georgraphic Diversity at Small, Private Institutions
Joe Mullins
Advertisement
Reinhardt University
Daniel Teodorescu
Clark Atlanta University
Journal of Higher Education Management, 35(2), 44-64 (ISSN 2640-7515). © Copyright 2020 by American Association of University Administrators. Permission to reprint for academic/scholarly purposes is unrestricted provided this statement appears on all duplicated copies. All other rights reserved.
The addition of a new college football program is an important, comprehensive decision for a small, private institution. College decision makers are adopting football programs to promote enrollment goals. College boards of trustees, presidents, and athletic directors along with the input of faculty, staff, and students strategically decide if starting football is the right decision. The decision to add football student-athletes to the campus life and culture is a decision that presents a plethora of ramifications for the institution. However, these ramifications are rarely the focus of administrative decision making. This research study examined how the addition of new football programs affected the economic and geographic diversity of student enrollment at small, private institutions.
The addition of a new college football program may increase total student enrollment and also the enrollment of underrepresented student populations (Dalton & Somers, 2015). Stern (2015) suggests that African American males, Latino males, and males in general lag behind the enrollment of other student groups in all colleges and universities. Stern suggests that many minority male students may not view college as an option because they are supporting a new family or living at home supporting their parents. The addition of new football programs on small, private college campuses provides an opportunity to grow male student enrollment by as much as 5% (Beaver, 2014). Blackhurst and Auger (2008) suggest that young minority male students identify with the culture of athletics, thus making college athletics an attractive aspect of college. Young minority males see the wealth and notoriety associated with professional sports and view college athletics as a way to reach professional sports (Blackhurst and Auger, 2008). Beamon (2010) suggests that young African American males often grow up with family members that push them to focus on athletics over academics. Thomas and Nasir (2013) propose that many African American males grow up in extreme poverty and feel pressure to excel in athletics to improve their social situation. Sage and Eitzen (2016) acknowledge that using athletics as a way to get out poverty is unlikely and a common myth within the African American community. Sage and Eitzen also note that the percentage of athletes making a professional career is very small and should not be the focus of college athletics. The current research, in part, examined if the addition of new small, private college football programs increases the diversity of enrollment on campus and provides opportunities for underrepresented minority students to earn a college degree.
Feezell (2009) suggests that the addition of football on small, private college campuses shifts the balance of power toward athletics because in many cases the student population is predominately athletes. This study is important because it explores football’s cultural impact on small, private college campuses. This study makes a unique contribution to sports literature because it adds to the existing knowledge regarding the addition of new football programs, in general, as an enrollment management tool on small, private college campuses. More importantly, this study contributes new
research that examines how adding a new football program impacted the diversity of student enrollment at small, private collegiate institutions.
Research Questions
Small, private colleges and universities continue to add new athletic teams to grow student enrollment. In particular, institutions are adding new football programs to increase total enrollment, male enrollment, and enrollment of underrepresented student populations (Dalton & Somers, 2015). Small, private colleges and universities are taking advantage of the fact that students often choose small colleges to continue their playing career (Bandre, 2011; Beaver, 2014). It is the opinion of the authors that college decision makers are starting football programs without considering how the addition of football will affect the diversity of student enrollment on campus. The purpose of this quantitative study was to explore if the addition of a new college football program resulted in an increase in the socioeconomic and geographical diversity of student enrollment at small, private institutions. The following research questions and hypotheses guided the study:
Research Question 1: To what extent does the addition of a football program result in increased enrollment of students receiving Pell Grants at small, private institutions compared to institutions that did not initiate a football program?
Research Question 2: To what extent does the addition of a football program result in increased enrollment of out-of-state students at small, private institutions compared to institutions that did not initiate a football program?
Literature Review
Socioeconomic Diversity. Socioeconomic diversity is an aspect of diversity that is important for university and sports leaders to understand. Research indicates that interactions with people of all socioeconomic backgrounds are important for learning (Goodman & Bowman, 2014). Also, having a socioeconomically diverse institution is good for campus climate and the overall diversity of an institution (Park & Denson, 2013). The challenge for colleges and universities is how to get lowincome students on campus. Policymakers are calling for colleges and universities to open up access to higher education for low-income families that lack representation in higher education (Hillman, 2012). A report by Rine and Eliason (2015) of the Council of Independent Colleges found that lack of representation of low-income families in higher education prevents them from moving to middleclass status. Low-income students also have significant obstacles in accessing education and are less likely to enroll in college (Hoxby & Avery, 2013; Rine & Eliason, 2015). Research indicates that lowincome students tend to be first generation students and are more likely to be ethnic minorities (Messer, 2016). In addition, low-income students are less likely to receive financial support from their parents and more likely to drop out of college (Gilbert, 2015; Hoxby & Avery, 2013).
The Pell Grant program is a large need-based financial aid program designed to provide lowincome students with access to higher education (Ehrenberg, Zhang, & Levin, 2006). Student Pell Grant participation is also a common measure of low-income student access to higher education (Chetty et al., 2017). Higher education institutions report the percentage of students attending their institution receiving Pell Grants each year along with other educational data. In an effort to improve low-income student access to higher education, the Obama administration mandated that the government double investments in the Pell Grant program (The Executive Office of the President, 2014).
A less understood aspect of diversity is the relationship between college athletics and the socioeconomic diversity of higher education institutions. Research indicates that low-income students that attend small, private institutions are more likely to participate in extracurricular activities such as athletics (Rine & Eliason, 2015). Davis’ (2011) study of small religious institutions with football programs found that university and athletic leaders believed that football programs added to the socioeconomic diversity of their institutions by enrolling more low-socioeconomic students at their colleges and universities. However, Shulman and Bowen (2003) noted that college athletics did little to improve socioeconomic diversity on college campuses and that there were better ways to recruit and enroll minority students (as cited in Fried, 2007). There are insufficient results on the effect that college athletics has on improving socioeconomic diversity on college campuses. Hence, the current study provides empirical evidence on how the addition of new football programs on small, private college campuses affects the socioeconomic diversity of the institution.
Geographic Diversity. Out-of-state and international students are valuable to all colleges and universities. In many cases, these students pay higher tuition, which benefits the finances of the institution. A study by Burd (2015) of Newamerica.org found that large universities are suffering from in-state budget cuts and in some cases shrinking in-state high school graduation rates that are forcing them to pursue affluent out-of-state students that pay a higher tuition. Burd (2015) suggested that the practice of recruiting more out-of-state students is hurting low-income in-state students. Large public universities like the University of Alabama are capitalizing on their success in high profile sports such as football to recruit more out-of-state athletes and general students (Burd, 2015). Smith (2011) reported that Texas Christian University experienced a substantial increase in out-ofstate student applications following its Rose Bowl appearance in football. Smith’s (2012) research on the relationship between college athletic success and tuition rates found that institutions were able to charge higher tuition for out-of-state students based on success in football. Hardwick-Day’s (2008) NCAA Values Study found that the ability for institutions to offer athletic scholarships attracted a large number of students from further than 300 miles from the institution, thus increasing the geographic diversity of the school.
Limited research exists, however, on the relationship between athletics, football in particular, and the geographic diversity of small, private institutions. Pope and Pope (2009) posited that success in athletics is more beneficial to private colleges than public colleges. Jones (2009) suggested that private colleges could see an increase in out-of-state applications resulting from athletic success. Davis’ (2011) study of private religious colleges with football programs found that university and sports leaders, as well as university students, believed that the football program contributed to the geographic diversity of the campus by bringing students from all over the country to campus. Yet, there is limited research on the impact that adding a new football program has on the geographic diversity of small, private college campuses, thus the need for the current study.
Diversity and Leadership. Diversity is a competitive advantage for organizations (Bolman & Deal, 2008). A successful organization with a good working environment places a focus on diversity (Bolman & Deal, 2008). Leadership is a key aspect to the continued advancement of any initiative within an organization, including diversity. Leaders must understand and value different cultures and promote diversity within their organizations. On college and university campuses, leaders at all levels must embrace diversity and decide how to make diversity a key aspect of campus culture (Wilson, 2015). The college president should be the driving force for developing, promoting, and instituting a diversity policy (Wilson, 2015). Because college athletics contribute so heavily to the total enrollment of many institutions and because athletics is a prominent part of college culture, sports
leaders have an important role in the diversity initiatives on college campuses. Sports leaders within university athletic departments must work in conjunction with coaches, faculty, university administration, and staff to promote a diverse learning and working environment for students and employees (Bernhard, 2015; Davis, 2011). In particular, university and sports leaders must assess how their institutions recruit and hire minority employees, recruit and enroll minority students, and how they accommodate minority students once they come to campus (Njororai Simiyu, 2012).
Research suggests that minority students, particularly African American males, struggle to adjust to college and desire to see more African American role models in leadership positions (Singer, 2009). The data pertaining to minorities in higher education leadership positions are grim. According to Lapchick, Agusta, Kinkopf, and McPhee’s (2012) racial and gender report card, whites occupied 85% of all college coaching jobs, more than 89% of all athletic director jobs, and 90% of college president positions. College athletic departments must be on the forefront of the push toward campus diversity by developing a culture that promotes multiculturalism and a diverse work environment (Bernhard, 2015). Sadberry (2010) recommended that athletic departments internally review how they serve minority student-athletes. The NCAA’s (2017) best practices through diversity and inclusion recommended that athletic departments have a diversity action plan, promote diversity training, and employ a diversity officer within the athletic department. Bopp et al. (2014) suggested that university athletic departments publicize their commitment to diversity and foster a culture that shows their commitment to diversity.
Research suggests that university and sports leaders can promote campus diversity initiatives by connecting minority students with faculty and staff mentors (Barker & Avery, 2012; Beamon, 2014; Clopton, 2011; Comeaux, 2011; Sadberry, 2010). Comeaux (2011) and Sadberry (2010) posited that university athletic departments can help African American student-athletes adjust to college life by providing programming that connects them with faculty and staff. Beamon (2014) recommended instituting a bridge program that helps connect minority student-athletes to campus life. Clopton (2011) suggested involving student affairs leadership in programming that brings all facets of the university together. Clopton found this type of programming was beneficial to African American student-athletes. Finally, Barker and Avery’s (2012) research centered on the use of an African American male leadership initiative as a way to improve the success of these students in all aspects of college life. The BMLI provided black male students with access to black faculty, university leaders, and alumni in hopes of developing relationships and finding role models.
For an organization to have diversity as a key component of its culture, it must recruit and employ diverse employees and have diverse leadership (Bolman & Deal, 2008). If a goal of higher education institutions is to improve the diversity of their student body, they must have diverse faculty and staff ready to serve minority students. Research demonstrates that colleges and universities lack minority faculty, athletic coaches, and athletic administrators (Beamon, 2014). Furthermore, colleges and universities should recruit and hire more diverse faculty, staff, and administrators (Beamon, 2014; Bernhard, 2015; Lapchick et al., 2012; NCAA, 2017; Njororai Simiyu, 2012). The NCAA’s (2017) best practices through diversity and inclusion provided specific recommendation that university and athletic leaders can follow to promote diversity. The NCAA recommends recruiting and hiring minority head and assistant coaches, athletic administrators, and management level positions. In addition, the NCAA recommends hiring minority recruiters in order to attract minority students. The addition of minority employees on campus coupled with a diversity plan provides higher education institutions and their leaders with a solid foundation toward making diversity an integral part of the university mission and culture.
Summary of Existing Literature. Colleges and universities are feeling pressure from policy makers to make college more accessible for low-income students (Hillman, 2012). The Pell Grant program provides financial aid to low-income students and is a common measure of low-income student access to education (Chetty et al., 2017; Ehrenberg et al., 2006). Research suggests that low-income students are more likely to participate in extracurricular activities like athletics (Rine & Eliason, 2015). Davis’ (2011) research suggests that university and athletic leaders at small religious colleges believe that having a football team added to the socioeconomic diversity of the campus. However, little or no research exists that explores the relationship between the addition or presence of athletics and an increase in students receiving Pell Grants. The current research examines whether the addition of a new football program on a small, college campus lead to an increase in enrolled students receiving Pell Grants, thus adding to the socioeconomic diversity of campus.
Colleges and universities struggling with finances and low in-state enrollment are turning to outof-state enrollment to fill the tuition revenue gap (Burd, 2015). Large, high profile, universities are capitalizing on their success in football to attract out-of-state students (Burd, 2015; Smith, 2011). Research shows that small, private universities can use success in athletics to attract more out-of-state students (Jones, 2009; Pope & Pope, 2009). Davis’ (2011) research suggests that university and sports leaders at small, religious institutions believe that their football team made their campus more geographically diverse, but no data exists showing a relationship between the presence or addition of football and an increase in out-of-state students. This research examines if the addition of a new football program on a small, private college campus increased the number of out-of-state students, thus increasing the geographic diversity of campus. The final section of this literature review discussed the literature pertaining to diversity and leadership. A diverse organization has an advantage and organizational leaders must understand, promote, and value diversity (Bolman & Deal, 2008). In higher education, the college president must be the driving force for promoting diversity on campus (Wilson, 2015). In the university setting, sports leaders must work within their athletic department and in conjunction with other aspects of campus to create a diverse environment that supports a diverse student body (Bernhard, 2015; Davis, 2011). University and sport leaders must understand the needs of a diverse student body and take the necessary steps to hire and train employees that can recruit, mentor, and serve a diverse university (Barker & Avery, 2012; Beamon, 2014; Comeaux, 2011; Lapchick et al., 2012; NCAA, 2017). Although our study does not address diversity in leadership, the results could be valuable to university and sports leaders considering the addition of a new football program on a small, private college campus.
Conceptual Framework
To remain fiscally stable in an environment of economic uncertainty and increasing competition, many small, private institutions utilize a tuition-driven enrollment model (Dalton & Somers, 2015). Small, private colleges and universities must meet their enrollment goals by recruiting students, enrolling and retaining them. In the tuition-driven enrollment model, the most critical resource for the university is the student. Resource dependency theory best explains why small, private colleges choose to start new collegiate football programs as part of their student enrollment strategy. In their 1978 (reprinted in 2003) seminal work The External Control of Organizations: A Resource Dependence Perspective, Pfeffer and Salancik (2003) formalized the resource dependency theory. Pfeffer and Salancik (2003) proposed that organizations need resources to function effectively and efficiently. To acquire resources, organizations must depend on their external environment, which may be unclear and challenging (Pfeffer & Salancik, 2003). Furthermore, most organizations are not
self-sufficient and must acquire external resources to survive (Black, 2001). The resource dependency theory explains how organizations address shortages in resources through innovations and explorations into alternative resources (Schulz & Lucido, 2011; Pfeffer & Salancik, 2003). In the context of higher education, the resource dependency theory explains how colleges and university enrollment managers respond to the changing environment of higher education (Black, 2001; Pfeffer & Salancik, 2003). As stated previously, small private colleges must meet enrollment needs to stay fiscally solvent and relatively affordable. In the quest to meet enrollment goals, institutional leaders must identify unrepresented or untapped student populations. Resource dependency theory accounts for the fact that small, private institutions are highly dependent on tuition revenue and that revenue derived from student enrollment is an important resource for small institutions (Black, 2001). The addition of new athletic teams has the potential to add new student enrollment and additional tuition revenue, thus helping institutions acquire a must needed resource.
Institutional leaders of small private institutions are turning to athletic programs, football, in particular, to help meet enrollment goals and to tap into a scarce resource on many small private college campuses - the male student (Dalton & Sommers, 2015). The resource dependency theory implies that college enrollment managers must examine what resources are scarce on a particular campus (Black, 2001). Starting a new football program can potentially help small, private colleges add more male students to the campus and improve their enrollment gender distribution (Getz & Siegfried, 2012; Lammers, 2010; Gardiner, 2010; McCloskey Jr., 2016; Pennington, 2006). Lammers (2010) found that the addition of football and other athletic programs at Lake Erie College helped bring the male/female enrollment percentage in line with national averages. Like Lammers, Getz and Siegfried (2012) found that Shenandoah University revived its football program to attract more males to campus.
Small college leaders utilize the resource dependency theory to analyze the underrepresented students on their campuses. Breneman (1994) suggested the resource dependency theory helps college leaders identify if their campus lacks enrollment diversity. Stern (2011) suggested that African American males are a scarce resource on small college campuses. The addition of a football program aligns with the resource dependency theory because it explains how colleges can recruit more racially diverse students to campus using innovative tactics to tap into that particular resource. This research examined if adding a new football program to an athletic department increased the diversity of enrollment on small, private college campuses. The existing research highlights both positive and negative enrollment trends on small college campuses that start new football programs. The current research aims to contribute to the existing literature regarding the relationship between starting a new football program and student enrollment. However, the larger goal of the research was to explore in a broader context how starting a new football program on a college campus affected the diversity of student enrollment. The resource dependency theory helps explain why college leaders may choose to add new football programs to athletic departments.
Methods
The current study utilized a non-experimental quantitative research design that was explanatory and retrospective in nature. According to Belli (2009), non-experimental research involves the study of variables as they exist instead of manipulating the variables (p.60). The current study is also explanatory because its focus is on explaining how a phenomenon, the addition of football on a small, private college campus, worked and because hypotheses were present to test a theory about the phenomenon (Belli, 2009). This study is also classified as retrospective because it looks back in time
using existing data to explain or explore a phenomenon (Belli, 2009). An explanatory retrospective research design was appropriate for the current study because past data were available to explain and test the research hypotheses.
Study Population and Sample Selection. The impetus for conducting the current research came from the authors’ observation that between the years 1990-2013 many small, private colleges and universities added new football programs. Data from numerous sources validated the claim that between the years 1990-2013 many small, private universities added new football programs (D3 Football, 2017; Dalton, 2011; NAIA, 2017; National Football Foundation, 2015; NCAA, 2017; NCAA Football, 2014). The available data suggested that approximately 65 small, private institutions added football during the defined timeframe (D3 Football, 2017; Dalton, 2011; NAIA, 2017; National Football Foundation, 2015; NCAA, 2017; NCAA Football, 2014). For inclusion into this study, institutions had to meet three criteria: be classified as private, enroll less than 2,500 students at the time of the addition of football, and belong to the National Collegiate Athletic Association (NCAA) Division III or National Association of Intercollegiate Athletics (NAIA) at the time of the addition of football. The comparison groups were selected randomly from a list of institutions that were classified as private, enrolled less than 2500 students, and belonged to NCAA division III or NAIA. Data from NCAA division III and NAIA member directories and the Integrated Postsecondary Education Data System were used in the identification and selection of qualifying schools for each research group (NAIA, 2017; National Center for Educational Statistics, 2017; NCAA, 2017).
Instrumentation. The current study utilized data from the National Center for Educational Statistics (NCES) (2017) Integrated Postsecondary Education Data System (IPEDS). The NCES uses the IPEDS surveys to collect data annually from higher education institutions to describe the state of higher education (National Center for Educational Statistics, 2017). The study utilized IPEDS fall enrollment data and student financial aid data for the years 1990-2013.
Independent Variables.
Presence or Absence of a Football Program (1990-2013). The researchers divided the institutions examined into three research groups: institutions that started football programs during the specified period, institutions with existing football programs, and institutions without football programs. It should be noted that the year the football program was launched varied across institutions.
Dependent Variables.
Percentage of Students Receiving Pell Grants (1990-2013). Percentage of Students receiving Pell Grants based on the Annual Student Financial Aid Survey from IPEDS.
Percentage of Out-of-State Student Enrollment (1990-2013). Percentage of Out-of-State Student Enrollment based on Annual Fall Enrollment Survey totals from IPEDS.
Validity and Reliability. IPEDS collects higher education institutional data from postsecondary institutions throughout the United States and in other U.S. jurisdictions (Ginder, Kelly-Reid, & Mann, 2016, pg. 1). Because the Higher Education Act of 1965 and other higher education amendments require colleges and universities to submit data to IPEDS to receive federal financial aid, the response rate is nearly 100% (Ginder et al., 2016). During each year of IPEDS data submission, a representative from each institution enters data into the IPEDS system (Ginder et al., 2016). IPEDS compares each year’s data against the previous year’s data for consistency, and the IPEDS system
automatically checks entries for missing data or values that are outside the expected range based on the previous year’s submissions (Ginder et al., 2016). Institutions have the ability to explain abnormal data and IPEDS staff follow up with institutions about abnormal data (Ginder et al., 2016).
Data Collection Procedures. This study utilized a multi-step process to collect data. Step one involved mining the IPEDS database. For the current study, the selection criteria for the institutions in the sample included the following institutional characteristics: U.S. only, private not-for-profit four year and above, primarily baccalaureate or above, and enrollment of 2,500 students or less. IPEDS produced a list of institutions that fit the search criteria starting with the year 2015. Upon the creation of the list of appropriate institutions, the researchers extracted data on enrollment by race/ethnicity and gender, which constitute the dependent variables for this study.
IPEDS allows users to add subsequent years of data using the same selection criteria for institutions. By starting at 2015 and working backward, IPEDS kept the list of institutions consistent from year to year, thus making data mining easier. The result of step one was the creation of 13-18 years of institutional data with each year’s data in a separate spreadsheet.
Step two in the data collection process involved consolidating data and creating new variables. All annual data spreadsheets were combined into one spreadsheet that follows each institution longitudinally. Because IPEDS did not create the exact variables needed for the study, we used formulas to create percentage of non-Caucasian students and percentage of male students. In addition, a new variable was created to measure the percentage change in each variable before and after the addition of a new football program.
Step three in data collection involved identifying the institutions needed for each of the three research groups:
Group 1 - the football addition group comprising institutions that had existing football programs between the years 1990-2013 (comparison group); Group 2 comprised of institutions that did not have football programs during the years 19902013 (comparison group); Group 3 - the football addition group comprising institutions that introduced football programs between the years 1990-2013.
Existing data from several sources identified institutions that added football between the years 1990-2013 and the year that they added football (D3 Football, 2017; Dalton, 2011; NAIA, 2017; National Football Foundation, 2015; NCAA, 2017; NCAA Football, 2014). A key aspect of the current study involved identifying the exact year that institutions enrolled new football studentathletes. For some institutions, the first football student-athletes arrived the same year that the institution played its first game. For other institutions, the first football student-athletes arrived a year before the first football contest. The identification of the correct year that the first football studentathletes arrived was critical in producing the most accurate data.
Step four involved assembling the data for the two comparison groups. The first comparison group comprised the same number of schools as the football addition group and comprised institutions that had existing football programs between the years 1990-2013. Group 2 comprised institutions that did not have football programs during the years 1990-2013 and had the same number of schools as the football addition group and group one. Existing data from the multiple sources were used to form a master list of schools for each group and random sampling was utilized to obtain a representative number of schools for each group (D3 Football, 2017; Dalton, 2011; NAIA, 2017; National Football Foundation, 2015; NCAA, 2017; NCAA Football, 2014).
The final step in the data collection involved finalizing the three groups of institutions for comparison. Fifty small, private institutions with existing football programs between the years of 1990-2013, and 50 institutions without football programs between the years of 1990-2013 served as comparison groups (see Table 1). The comparison groups were necessary to determine if any observed changes in minority enrollment resulting from the addition of a new football program were statistically different from changes in minority enrollment observed in institutions with existing football programs and institutions without football programs.
Group 1 50 small, private institutions that added new football programs between the years of 1990-2013 Table 1 – Final Research Groups Group 2 50 small, private institutions with existing football programs between the years of 1990-2013 Group 3 50 small, private institutions without football programs between the years of 19902013
Results
Characteristics of the Sample. The institutions included in the research sample were 150 small, private institutions with student enrollments of 2,500 students or less. All sampled institutions belonged to the National Collegiate Athletic Association (NCAA) Division III or National Association of Intercollegiate Athletics (NAIA) at some point during the years of 1990-2013 (see Table 2). In addition, they represented all regions of the U.S., as defined by Bureau of Economic Analysis (BEA) (see Table 2). Because the study encompasses institutions from all regions of the country, the data were representative of small, private institutions throughout the U.S.
Table 2 – Distribution of Colleges by Governing Body
Association and Region
Number Percent Governing Body
NAIA 58 38.7
NCAA Division III 92 61.3 Region
Far West 6 4.0
Great Lakes 26 17.3
Mid-East 27 18.0
Mew England 11 7.3
Plains 24 16.0
Rocky Mountains 2 1.3
Southeast 46 30.7
Southwest 8 5.3
Research Timeframe. Table 3 shows the research timeframe utilized for each of the three research groups. Group one consisted of the schools that added new football programs. For group one, 53
enrollment was measured as an average of the three years prior to the introduction of a new football program and as an average for the three years following the introduction of a new football program (see Table 3). The difference was measured in the change in enrollment between the pre and post football years and coded accordingly. For groups two and three, the institutions with existing football programs and without football programs, the pre-football three-year average enrollment was measured in the year (2006) with the most frequent additions of new football programs (see Table 3).
Group 1 Three-year average prefootball and three-year average post-football. Table 3 – Research Timeframe
Benchmark Year: Varies Group 2 Three-year pre-average and three-year post-average. Benchmark Year: 2006 Group 3 Three-year pre-average and three-year post-average. Benchmark Year: 2006
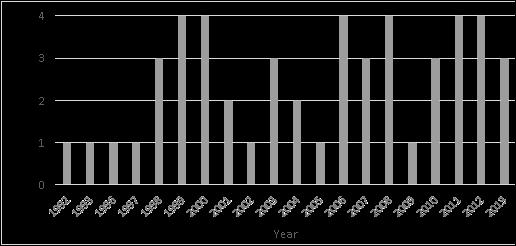
Figure 1 shows that the years of 1999, 2000, 2006, 2008, 2011, and 2012 were the most frequent years for adding a new football program. For the purpose of this research, 2006 was chosen as the benchmark year for research groups two and three (see Table 3).
Figure 1 – Number of Higher Education Institutions by Year of Football Addition
Pell Grant Enrollment. A review of the Integrated Postsecondary Education System (IPEDS) database on Pell Grant enrollment yielded a slight modification of the research sample. Table 4 summarizes the changes to the research sample. Starting in 2008, institutions were required to submit Pell Grant data. From 1999-2007, institutions reported Pell Grant data as federal grant aid. Prior to 1999, Pell Grant data were reported as dollars awarded. Based on these findings, the Pell Grant research sample was modified.
Group 1 Table 4 – Modified Pell Grant Research Groups Group 2 54 Group 3
38 small, private institutions 49 small, private institutions 50 small, private institutions that added new football with existing football without football programs programs between the years of programs between the years of between the years of 19901990-2013 1990-2013 2013
Table 5 presents the descriptive statistics for the enrollment of students receiving Pell Grants at small, private institutions that added new football programs between the years of 1990-2013. These institutions constitute the primary research group in the study. Enrollment of Pell Grant students was measured as an average percentage for the three years prior to the addition of a new football program and three years following the introduction of a new football program. The data were represented as the percentage of the institution’s total student enrollment that received Pell Grants. Table 5 indicates that the 38 small, private institutions that added new football programs had an average enrollment of students receiving Pell Grants of 35.2% (M = 35.2) for the three years prior to the introduction of a new football program. The same institutions had an average enrollment of students receiving Pell Grants of 38.4% (M = 38.4) for the three years following the introduction of a new football program. This group experienced an average change in enrollment of students receiving Pell Grants between the three years before adding football and the three years after adding football of 3.1% (M = 3.1).
Table 5 – Descriptive Statistics for % Enrollment of Pell Grant Students - Group 1
(Institutions that added new football programs)
N Mean SD
Post – Football Average Enrollment of Pell 38 38.4 16.5
Grants Students
Pre – Football Average Enrollment of Pell 38 35.2 14.0
Grant Students
Pre/Post Change in Enrollment of Pell Grant 38 +3.1 10.1
Students
Table 6 presents the descriptive data for the enrollment of students receiving Pell Grants for the two comparison groups. The comparison groups were formed because these institutions did not experience the introduction of a new football program, and because they provide data which allows for a comparison to the primary research group for the study, institutions that added new football programs. Groups two and three were 49 small, private institutions with existing football programs between the years of 1990-2013, and 50 small, private institutions without existing football programs between 1990-2013, respectively. For the comparison groups, 2006 was chosen as the benchmark year for data collection and analysis. Enrollment of students receiving Pell Grants was measured as an average of the three years prior to the benchmark year of 2006 and three years following the benchmark year of 2006. The data were represented as the percentage of the institution’s total student enrollment that received Pell Grants. Table 6 shows that the 99 small, private institutions with existing football programs as well as the institutions without football programs experienced an average enrollment of students receiving Pell Grants of 32.3% (M = 32.3) for the three years prior to the benchmark year of 2006. The same institutions had an average enrollment of students receiving Pell Grants of 29.2% (M = 29.2) for the three-year years following the benchmark year of 2006. The small, private institutions with existing football programs and without football programs experienced an average decline in the enrollment of students receiving Pell Grants between the three years before the benchmark year of 2006 and the three years after the benchmark year 2006 of – 3.1% (M = -3.1). 55
Table 6 – Descriptive Statistics for % Enrollment of Pell Grant Students - Groups 2 and 3
(Institutions with existing football programs and institutions without football programs)
N Mean SD Post – 2006 Average Enrollment of Pell Grants 99 29.2 14.4 Students Pre – 2006 Average Enrollment of Pell Grant 99 32.3 14.4 Students Pre/Post 2006 Change in Enrollment of Pell 99 - 3.1 6.3 Grant Students
Table 7 shows the cross-tabulation scores from the chi-square test of independence for enrollment of students receiving Pell Grants. The information in Table 7 is organized according to research groups and magnitude of change in the enrollment of students receiving Pell Grants. The research group labeled “add” were small, private institutions that added new football programs between the years of 1990-2013. The research group labeled “no” were small, private institutions that did not have a football program between the years of 1990-2013. The research group labeled “yes” were small, private institutions that had existing football programs between the years of 19902013. The research groups labeled “no” and “yes” were also the previously mentioned comparison groups. The Pell Grants codes of 1, 2, and 3 represent changes in the enrollment of students receiving Pell Grants. Code 1 includes institutions that experienced a 5% or more positive change in enrollment of students receiving Pell Grants. Code 2 indicates that institutions experienced no significant change in the enrollment of students receiving Pell Grants. Code 3 indicates that institutions experienced a 5% or more negative change in enrollment of students receiving Pell Grants.
Table 7 shows that 34.2% of institutions that added new football programs experienced a significant growth (5% or more) in enrollment of students receiving Pell Grants while only 4.1% of institutions with existing football programs and 8% of institutions without football programs experienced similar growth in the enrollment of students receiving Pell Grants.
Table 7 – Change in % Pell Grant Recipients by Group of Institutions Change in % Pell Grant Recipients
Added Football Np Football Existing Football 1. +5% or higher 34.2% 8.0% 4.1%
2. -4.99% to +4.99% 52.6% 58.0% 59.2% χ2 (4, N = 137) = 20.38, p < .001, Cramer’s V = .28 3. -5% or lower 13.2% 34.0% 36.7% N 38 60 49
A chi square test of independence was performed and found a significant relationship between institutions that added new football programs and an increase in enrollment of Pell Grant students
compared to institutions with existing football programs and institutions without a football program, χ2 (4, N = 138) = 20.83, p < .001, Cramer’s V = .27 (see tables 24 and 25). The Cramer’s V score of . 27 indicates a medium effect size and moderate association between the addition of a new football program and the increase in enrollment of students receiving Pell Grants.
Out-of-state Enrollment. A review of the Integrated Postsecondary Education System (IPEDS) database for out-of-state enrollment required a slight modification to the out-of-state enrollment measurement. Institutions were only required to submit out-of-state enrollment figures on even numbered years. Institutions were allowed to submit out-of-state enrollment every year if the institutions chose to do so. To stay consistent with the research methodology, only out-of-state enrollment data from even years were utilized for analysis. Table 8 shows the new out-of-state enrollment timeframe.
Table 8 – Modified Out-of-State Research Date Timeframe Group 1 Group 2 Group 3 Three-year average pre- Three-year pre-average and Three-year pre-average and football and three-year average three-year post-average three-year post-average post-football (2006) (even years) (2006) (even years) (even years)
Table 9 presents the descriptive statistics for the enrollment of out-of-state students for small, private institutions that added new football programs between the years of 1990-2013. These institutions were the primary research group in the study. Enrollment of out-of-state students was measured as an average of the three years prior to the addition of a new football program and three years following the introduction of a new football program. The data were represented as the percentage of the institution’s total student enrollment that were out-of-state students. Table 9 shows that the 50 small, private institutions that added new football programs had an average out-of-state enrollment of 32.3% (M = 32.3) for the three years prior to the introduction of a new football program. The same institutions had an average out-of-state enrollment of 31.3% (M = 31.3) for the three-year years following the introduction of a new football program. The small, private institutions that added new football programs experienced an average change in enrollment of out-of-state students between the three years before adding football and the three years after adding football of - . 97% (M = - .97).
Table 9 – Descriptive Statistics for % of Out-of-State Enrollment – Group 1
(Institutions that added new football programs)
N Mean SD Pre-Football Average Out-of-state Enrollment 50 32.3 20.7 Post-Football Average Out-of-state Enrollment 50 31.3 18.1 Pre/Post Football Change in Out-of-state 50 -.97 11.1 Enrollment
Table 10 presents the descriptive statistics for the enrollment of out-of-state students for the two comparison groups. Groups two and three were 49 small, private institutions with existing football 57
programs between the years of 1990-2013, and 50 small, private institutions without existing football programs between 1990-2013. For the comparison groups, 2006 was chosen as the benchmark year for data collection and analysis. Out-of-state enrollment was measured as an average of the three years prior to the benchmark year of 2006 and three years following the in the benchmark year of 2006. The data were represented as the percentage of the institution’s total student enrollment that was out-of-state students. Table 10 shows that the 99 small, private institutions with existing football programs and without existing football program had an average out-of-state enrollment of 39.7% (M = 39.7) for the three years prior to the benchmark year of 2006. The same institutions had an average out-of-state enrollment of 39.2% (M = 39.2) for the three years following the benchmark year of 2006. The small, private institutions with existing football programs and without existing football programs experienced an average change in out-of-state enrollment between the three years before the benchmark year of 2006 and the three years after the benchmark year 2006 of -.40% (M = -.40).
Table 10 – Descriptive Statistics for % Enrollment of Out-of-State Students - Groups 2 and 3
(Institutions with existing football programs and institutions without football programs)
N Mean SD Pre – 2006 Average Out-of-state Enrollment 99 39.7 22.4 Post – 2006 Average Out-of-state Enrollment 99 39.2 22.9 Pre/Post 2006 Change in Out-of-state 99 -.40 6.4 Enrollment
Table 11 shows the cross-tabulation scores from the chi-square test of independence for out-ofstate enrollment. The information in Table 11 is organized according to groups of institutions and codes representing change in out-of-state enrollment. The group labeled “add” were small, private institutions that added new football programs between the years of 1990-2013. The group labeled “no” were small, private institutions that did not have a football program between the years of 19902013. The group labeled “yes” were small, private institutions that had existing football programs between the years of 1990-2013. The groups labeled “no” and “yes” were also the previously mentioned comparison groups. The out-of-state codes of 1, 2, and 3 represent changes in the enrollment of out-
Table 11 – Change in % Pell Grant Recipients by Group of Institutions Change in % Pell Grant Recipients
Added Football Np Football Existing Football χ2 (4, N = 149) = 11.77, p < .05. 1. +5% or higher 28.0% 12.0% 34.7% 2. -4.99% to +4.99% 38.0% 52.0% 51.0% 3. -5% or lower 34.0% 36.0% 14.3% N 50 50 49
of-state students. Code 1 indicates that institutions experienced a 5% or more positive change in outof-state enrollment. Code 2 indicates that institutions experienced no significant change in out-of-
state enrollment. Code 3 indicates that institutions experienced a 5% or more negative change in outof-state enrollment.
Table 11 indicates that 28% of institutions that added new football program experienced significant growth (5% or more) in enrollment of out-of-state students. The table also shows that 34.7% of institutions with existing football programs and 12% of institutions without football programs experienced significant growth in enrollment of out-of-state students.
A chi-square test of independence was performed and found no significant relationship between institutions that added new football programs and an increase in enrollment of out-of-state students compared to institutions with existing football programs and institutions without a football program, χ2 (4, N = 149) = 11.775, p = .019.
Discussion of Findings
Pell Grant Enrollment. The current study found that small, private institutions that added new football programs experienced significant increases in the enrollment of students receiving Pell Grants compared to small, private institutions with existing football programs and small, private institutions without football programs. University and sport leaders are under continuous pressure from policymakers to increase access to higher education for low-income students (Hillman, 2012). The completion of a college degree is critical to low-income students trying to escape poverty (Rine & Eliason, 2015). College campuses benefit from having a socioeconomically diverse student body and having interactions with people of all socioeconomic backgrounds is important to the learning process (Goodman & Bowman, 2014; Park & Denson, 2013).
College and universities must measure their success in providing access to higher education of low-income students. The most common method utilized by higher education institutions and the federal government to track the enrollment low-income students is through the percentage of students receiving Pell Grants (Chetty, Friedman, Saez, Turner, & Yagan, 2017; Ehrenberg, Zhang, & Levin, 2006). There is limited research addressing the relationship between college athletics and socioeconomic diversity in higher education. Davis’ (2011) study found that university and sport leaders at small faith-based institutions believed that the presence of a football program on their campus contributed to the socioeconomic diversity of their campus by helping enroll low-income students. The current research found that small, private universities that started new football programs experienced on average a 3% increase in students receiving Pell Grants with 34.2% of institutions experiencing a 5% increase or more in students receiving Pell Grants. These results support Davis’ findings that football programs on small, private college campuses increase the socioeconomic diversity of the student body.
Shulman and Bowen (2003) noted that colleges and universities could find better ways than college athletics to promote access to higher education for low-income students. Furthermore, they believed that athletics did little to increase socioeconomic diversity on college campuses. The results of the current study both contradicted and confirmed Shulman and Bowen’s beliefs. On one hand, the current study’s findings contradicted Shulman and Bowen and that adding a new football program resulted in a significant increase in the enrollment of students receiving Pell Grants compared to institutions with existing football programs or institutions without football programs. On the other hand, the current study found that that 59.2 % of institutions with existing football programs experienced no change in the enrollment of students receiving Pell Grants and 36.7 % of institutions with existing football programs lost 5% more in the enrollment of student receiving Pell Grants. This finding suggests that after the initial increase in students receiving Pell Grants from football, universities received little benefit in socioeconomic diversity from having a football program, thus
supporting Shulman and Bowen’s views. While the findings from the current study showed that adding a new football program on a small, private college campus will lead to an increase socioeconomic diversity on campus, university and sport leaders must find additional methods for providing access to a college education for low-income and socioeconomically diverse students.
Out-of-State Enrollment. The current study found that the addition of a new football program on small, private college campuses resulted in no significant increase in the enrollment of out-of-state students. In fact, small, private institutions that added new football programs experienced lower enrollment of out-state students than institutions with existing football programs or institutions without football programs. A substantial portion of the literature pertaining to football and out-ofstate enrollment centers on the ability for large NCAA division I institutions’ ability to capitalize of their success in football to attract students from outside of their state. Research suggests that universities will experience growth in enrollment and applications following successful years in collegiate football (Burd, 2015; Smith, 2011). Jones (2009) suggested that small, private colleges could experience an increase in out-of-state enrollment if they have successful athletic programs. Since the current study did not factor the degree of athletic success into enrollment, it cannot contribute to the discussion on the relationship between football success and out-of-state enrollment.
The NCAA Values Study found that institutions that offered athletic scholarships attracted a large portion of students from over 300 miles from the institution (Hardwick-Day, 2008). The current study included a large portion of NCAA division III institutions that do not offer athletic scholarships, thus making it difficult to compare it to the Hardwick-Day study. Davis’ (2011) study of faith-based institutions with football programs concluded that university and sport leaders, as well as university students, believed that football brought students to campus from all parts of the country thus improving the geographic diversity of campus. The current study both confirms and contradicts Davis’ findings. On one hand, the current study did find that institutions with existing football programs experienced an increase in out-of-state enrollment at the time of the measurement. On the other hand, the current study found that adding a new football program did nothing to increase outof-state enrollment. The recruitment of out-of-state students does cost more money and may be difficult for small, private colleges that have limited resources. The current study’s contradictory findings regarding the relationship between the addition of a new football program and an increase in out-of-state enrolment should provide university and sport leaders with some information from which to make decisions. University and sport leaders must understand that the addition of a new football program may not provide an instant increase in out-of-state enrollment at the time of creation. However, as a new football program becomes established over a longer period of time (more than three years), the institutions could see increases in out-of-state enrollment.
Implications for University and Sports Leaders
The current study’s findings are valuable to practitioners in higher education and college athletics. For practitioners in higher education such as enrollment officers and college administrators responsible for enrollment, the current study provides insights into how enrollment will change after starting a new football program. Because the addition of a new football program will increase economic diversity, and minority diversity in particular, higher education administrators must become more aware of the need to hire diverse faculty and staff that can better relate and serve a diverse study body. For practitioners in college athletics, the current study’s findings provide valuable information for athletic directors considering adding a new football program at their institution. Athletic leaders can approach college and university decision makers with information related to how the addition of
a new football program will affect the diversity of student enrollment which will allow for better decisions regarding the addition of a new football program. The addition of a new football program will instantly add a significant number of male and low-income students on campus, thus potentially altering the current campus culture. University and sport leaders must be ready to cope with and address the expected changes from bringing such a large group of students to campus at one time.
Recommendations for Future Research
The findings from the current study contribute to the knowledge of how adding a new football program affects a small, private university. The current study also exposes gaps in the knowledge surrounding the topic and provides some unique opportunities for future studies.
While the current study supported the fact that adding a new football program helps small, private college diversify their campuses, the study did not account for the long-term diversification of small, private college campuses. Additional research should be conducted to determine if the addition a new football program, or any college sport, has lasting effects on the diversity of small, private college campuses.
The current study only examined small, private college with enrollments of 2,500 students or less. To make a more definitive statement on the impact of adding a new football program on college campuses, research must also examine private college campuses with enrollment of more than 2,500 students and at large public universities.
There is a great need for a qualitative study on the impact of a college football program on the diversity of a campus. The quantitative data provides evidence that starting a new a football program on a small, college campus will increase the diversity enrollment. However, there is a need to hear the stories of various stakeholders on the campuses that have started new football programs. A qualitative study will provide a narrative on how administrators, students, staff, and community members viewed the addition of a new football program. Interviews and focus groups can describe the impacts felt by those living and working on a campus that added a new football program.
Small, private universities, like all higher education institutions, are spending considerable time and effort trying to improve student retention and graduation rates. The addition of new athletic programs, football in particular, will have an impact on the retention and graduation rates at a small, private institution. Future studies are needed that examine how the addition of a new football program on a small, private campus affects the retention and graduation rates of the institution. A further step in advancing this line of research is to acquire qualitative data on the lived experiences of stakeholders on small, private college campuses that have added new football programs.
Limitations
A limitation of the current study is the time frame used for the analysis. The 50 institutions that served as the main research group started new football programs during the 1990-2013 timeframe. However, the comparison groups, institutions that had existing football programs and institutions without football programs, were only analyzed in reference to the 2006 benchmark year. Therefore, the data used for these groups were only representative of the years 2003-2008, thus leaving out a large portion of the 1990-2013 timeframe. While the results of the study are credible for the 2006 benchmark, the study could be improved by analyzing data from multiple years within the study timeframe. A second weakness of the study is that it does not account for other factors that could
affect enrollment at small, private institutions. While the literature is very clear that university and sport leaders at small, private institutions believed that adding a new football program could have the greatest potential impact of student enrollment, it is possible other factors influenced some of the changes in the diversity of student enrollment.
Conclusion
The purpose of the current study was to examine the impact that the addition of a new football program at small, private college campuses has on the economic and geographic diversity of student enrollment. This study found that the addition of a new football program on small, private college campuses resulted in a statistically significant increase in the enrollment of students receiving Pell Grants. This finding is important because it shows that by adding a new football program, small private institutions can provide low-income students with an opportunity to earn a college education. While the addition of a new football program can help small, private institutions address some of their enrollment shortcomings, higher education and sport leaders must do everything in their power to ensure the success of the new college students brought to campus through the addition of a football program. The current study’s findings add to the existing knowledge base on how the addition of a new football program affects a small, private college campus and provides unique data that is valuable to university and sport leaders.
References
Bandre, M. A. (2011). The impact of financial aid on the enrollment and retention of student athletes at National Collegiate Athletic Association (NCAA) division III colleges and universities: A review of literature. Journal of Student Financial Aid, 41(1), 38-45. Barker, M. J., & Avery, J. C. (2012). The impact of an institutional black male leadership initiative on engagement and persistence. College Student Affairs Journal, 30(2), 73-87. Beamon, K. (2014). Racism and stereotyping on campus: Experiences of African American males student-athletes. The Journal of Negro Education, 83(2), 121-132. Beaver, W. (2014). The changing nature of division III athletics. College and University, 89(3), 3240. Belli, G. (2009). Nonexperimental quantitative research. In S. D. Lapan & M. T. Quartaroli (Eds.),
Research essentials: An introduction to designs and practices (pp. 59-77). San Francisco, CA:
Jossey-Bass. Bernhard, L. (2015). Toward a better understanding: Three studies on diversity in intercollegiate athletics (Doctoral dissertation, UCLA). retrieved from http://escholarship.org/uc/item/3ft479cx Black, J. (2001). Strategic enrollment management revolution. Annapolis Junction, MD: AACRAO. Blackhurst, A. E., & Auger, R. W. (2008). Precursors to the gender gap in college enrollment:
Children's aspirations and expectations for their futures. Professional Scholl Counseling, 11(3), 149-158. Bolman, L. G., & Deal, T. E. (2008). Reframing organizations (4th ed.). San Francisco, CA: Jossey-Bass.
Bopp, T., Goldsmith, A., & Walker, M. B. (2014). Commitment to Diversity: The Impact of Diversity and Inclusiveness on Athletic Department Organizational Attractiveness and Job Pursuit
Intentions. Journal of Applied Sport Management, 6(4).
Breneman, D. W. (1994). Liberal arts colleges: Thriving, surviving, or endangered. Washington DC:
Brookings Institute. Burd, S. (2015). The out-of-state student arms race: How public universities use merit aid to recruit nonresident students. Retrieved from New America Education Policy website: http://www.newamerica.org Chetty, R., Friedman, J. N., Saez, F., Turner, N., & Yagan, D. (2017). Mobility report cards: the role of college in intergenerational mobility.: Equal Opportunity.org. Clopton, A. W., & Bourke, B. (2011). BIG-TIME COLLEGE SPORT IN BLACK AND WHITE:
Perceptions of the Impact of Athletics on Campus. College Student Affairs Journal, 30(1), 31-45. Comeaux, E. (2015). Innovative Research Into Practice in Support Centers for College Athletes:
Implications for the Academic Progress Rate Initiative. Journal of College Student Development, 56(3), 274-279. doi:10.1353/csd.2015.0029 D3 Football. (2017). Division III team names, schedules, and results. Retrieved from http://www.d3football.com/teams/index Dalton, B. F. (2011). Enrollment and fiscal health of small, tuition-dependent private colleges with new football programs (Unpublished Dissertation). University of Texas at Austin, Austin, TX. Dalton, B., & Somers, P. (2015). The "Hail Mary" touchdown: A study of how football became an enrollment management strategy for small, private colleges. Strategic Enrollment Management
Quarterly, 2, 294-306. doi:10.1992/SEM3.20054 Davis, J. (2011). The pigskin and the cross: Intercollegiate football on the faith-based campus (Doctoral dissertation, Indiana State University). Retrieved from http://scholars.indstate.edu/xmlui/bitstream/handle/10484/8106/JDavis.PDF? sequence=2&isAllowed=y Ehrenberg, R. G., Zhang, L., & Levin, J. M. (2006). Crafting a class: Trade-off between merit scholarships and enrolling lower-income students. The Review of Higher Education, 29(2), 195211. The Executive Office of the President. (2014, January). Increasing college opportunity for lowincome students.: The Executive Office of the President. Washington, DC Feezell, T. (2009). Adding football and the "uses" of athletics at NCAA division II and III
Institutions. New Directions in Higher Education, 148, 65-72. Gardiner, A. (2010, August 11). Schools find football programs spur buzz, campus growth. USA
Today. Retrieved from http://usatoday30.usatoday.com/sports/college/football/2010-08-11football-spurs-buzz-growth_N.htm Getz, M., & Siegfried, J. (2012). College sports: the mystery of the zero-sum game. Change, 52-59. Gilbert, A. J. (2015). Supporting first generation and low-income students on their path to college [PowerPoint slides]. Ginder, S. A., Kelly-Reid, J. E., & Mann, F. B. (2016). Integrated Postsecondary Education Data Systems (IPEDS) Methodology Report (NCES 2016-111). Washington DC: National Center for Education Statistics. Goodman, K. M., & Bowman, N. A. (2014). Making diversity work to improve college student learning. New Directions for Student Services, 147, 37-48. Hardwick-Day. (2008, January). NCAA Division II values study. Indianapolis, IN: NCAA.
Hillman, N. (2012, August). Economic diversity among selective colleges: Measuring the enrollment impact of "No-Loan" programs. Washington, DC: Institute for Higher Education Policy. Hoxby, C., & Avery, C. (2013). The missing "One-Offs": the hidden supply of high-achieving lowincome students. Brookings Papers on Economic Activity, 1-66. Jones, W. A. (2009). Athletics, applications, and yields. College and University, 85(2), 10-19. Lammers, J. (2010, April 11). Lake Erie College gets boost from athletics. The News- Herald. Lapchick, R., Agusta, R., Kinopfin, N., & McPhee, F. (2012). The 2012 racial and gender report card:
College Sport. Retrieved from http://nebula.wsimg.com/251912e6265591c105c61d509dc88f17?
AccessKeyId=DAC3A56D8FB782449D2A&disposition=0&alloworigin=1 McCloskey Jr., J. R. (2016). Campus culture effects from adding football at NCAA division I institutions (Unpublished Dissertation). Wilmington University, Newcastle. Messer, E. (2016). A qualitative study on the college choice process for first generation college students at a small, private, religious affiliated institution. Dissertation Abstracts International:
Section A. Humanities and Social Sciences. NAIA. (2017). NAIA member school directory. Retrieved from http://www.naia.org/ViewArticle.dbml?ATCLID=205322922 National Association of Intercollegiate Athletics. (2016). About the NAIA. Retrieved from http://www.naia.org/ViewArticle.dbml?DB_OEM_ID=27900&ATCLID=205323019 National Center for Educational Statistics. (2017). IPEDS. Retrieved from https://nces.ed.gov/ipeds/Home/UseTheData National Football Foundation. (2015, July 23). Colleges and universities offering football increases to all-time high of 773. Retrieved from http://www.footballfoundation.org/News/NewsDetail/tabid/567/Article/55373/colleges-anduniversities-offering-football-increases-to-all-time-high-of-773.aspx NCAA. (2017). NCAA best practices: Achieving excellence through diversity and inclusion. NCAA. (2017). NCAA division III membership. Retrieved from http://www.ncaa.org/governance/membership?division=d3 NCAA Football. (2014). Added and discontinued programs. Retrieved from http://fs.ncaa.org/Docs/stats/football_records/2014/programs.pdf Njororai Simiyu, W. W. (2012). Challenges of being a black student athlete on s US college campus.
Journal of Issues in Intercollegiate Athletics, 5, 40-63. Park, J. J., & Denson, N. (2013). When race and class both matter: the relationship between socioeconomic diversity, racial diversity, and student reports of cross-class interaction. Research in Higher Education, 54, 725-745. Pennington, B. (2006, July 10). Small college, short of men, embrace football. New York Times.
Retrieved from http://query.nytimes.com/gst/fullpage.html? res=9D00E0DF1120F933A2575C0A9609C8B63&pagewanted=all Pfeffer, J., & Salancik, G. R. (2003). The external control of organizations: A resource dependence perspective (Rev. ed.). Stanford, CA: Stanford University Press. Pope, D. G., & Pope, J. C. (2009). The impact of college sports success on the quantity and quality of student applications. Southern Economic Journal, 75, 750-780. Rine, P. J., & Eliason, J. (2015, March). Expanding access and opportunity: Hoe small and mid-sized independent colleges serve first-generation and low-income students. : Council of Independent
Colleges. Sadberry, S. (2010). College adjustment of black/African American student-athletes at predominately-white institutions and historically black colleges and universities (Doctoral dissertation, University of Missouri). Available from ProQuest. (3488937)
Sage, G. H., & Eitzen, D. S. (2016). Sociology of North American sport (10th ed.). New York: Oxford
University Press. Shulman, J. L., & Bowen, W. G. (2011). The game of life: College sports and educational values.
Princeton: Princeton University Press. Schulz, S. A., & Lucido, J. A. (2011). What enrollment management structures reveal about institutional priorities. Enrollment Management Journal, 5(4), 12-44. Smith, D. (2011, June 24). TCU sees rising interest from out-of-state students. Fort Worth Star-
Telegram. Retrieved from http://www.startelegram.com/living/family/moms/article3828024.html Smith, D. R. (2012). The curious (and spurious?) relationship between intercollegiate athletic success and tuition rates. International Journal of Sport Finance, 7, 3-18. Stern, G. M. (2011). How is the economy affecting private college enrollment? The Hispanic Outlook in Higher Education, 21(7), 12-13. Thomas, I., & Nasir, N. S. (2013, May 7). Black males, athletes and academic achievement.
Huffington Post. Retrieved from http://www.huffingtonpost.com/isiah-thomas/black-malesathletes-and-_b_3232989.html Wilson, J. L. (2015). Presidential plans: New college presidents and diversity efforts. Planning for
Higher Education Journal, 44(1), 76-86.


