Connect with the SFR owners, operators and investors driving strategy and deals.
Save 15% with discount code REU2796AAPL
*IMN is offering the first 20 investors who have not attended IMN’s SFR Forums with a complimentary pass to attend. Please reach out to stacey.kelly@imn.org to apply.
Rosa
30 Every Property Needs a Paper Trail
David Jacobs and Taylor Miller, Construction Inspection Specialists
34 Tightening Yields Demand a New Callsheet
Megan Castleton, Constructive Capital
40 Build in the Buffer
Jesse Goldberg, Park Place Finance
44 Claim Your Own Pond
Shaye Wali, Baseline
ADVOCACY
48 Protect the Plan with Prepayment Penalties
Alan Dettelbach, CV3 Financial Services
54 Housing Bill Targets
Corporate Home Buying
Matthew Gunter, Cardinal Capital Group
56 Rent and Eviction Bills
Advance in New England
Kat Hungerford, AAPL
LENDER LIMELIGHT
59 Forward at Full Volume with Kevin Kim
ACCOUNTING
68 Loan Participations: There’s More Below the Waterline
Chad Murphy, Richey May
74 Steer Through the Fog
Jacob Therrien, RCN Capital
78 The Data Trap
Kemra Norsworthy, Bull Funding
MARKET
82 The Sugar High Is Over
Daren Blomquist, Auction.com
88 End of the Breakaway
Nema Daghbandan, Lightning Docs
98 From New Frontier to Established Markets
Michael Fogliano and Sean Morgan, Forecasa
106 Urban Institute Report Validates
Private Lending’s Housing Role
Kat Hungerford, AAPL
FUNDAMENTALS
108 Your Trail Guide for Troubled Loans
Gene Buccola, High Plateau
Asset Management
VENDOR GUIDE
112 Summer Guide
LAST CALL
114 Lessons That Outlast the Uniform Jasen Miller, Corridor Funding
LINDA HYDE
President, AAPL
KAT HUNGERFORD
Executive Editor
CONTRIBUTORS
Daren Blomquist
Gene Buccola
Megan Castleton
Nema Daghbandan
Alan Dettelbach
Michael Fogliano
Jesse Goldberg
Matthew Gunter
David Jacobs
Mark Jury
Karen J. Krause
Jasen Miller
Taylor Miller
Sean Morgan
Chad Murphy
Kemra Norsworthy
Aleksandra Simanovsky
Jacob Therrien
Shaye Wali
COVER PHOTOGRAPHY
Elizabeth Trujillo
PRIVATE LENDER
Private Lender is published quarterly by the American Association of Private Lenders (AAPL). AAPL is not responsible for opinions or information presented as fact by authors or advertisers.
SUBSCRIPTIONS
Visit aaplonline.com/subscribe.
BACK ISSUES
Visit aaplonline.com/magazine-archive, email PrivateLender@aaplonline.com, or call 913-888-1250. For article reprints or permission to use Private Lender content including text, photos, illustrations, and logos: E-mail PrivateLender@aaplonline.com or call 913-888-1250. Use of Private Lender content without the express permission of the American Association of Private Lenders is prohibited.
Fraud is not new to private lending, but the speed and sophistication we are seeing today represent a concerning shift. What once appeared as isolated attempts to exploit documentation gaps has evolved into coordinated, technology- driven schemes that challenge even the most experienced operators. AI-generated documents, deepfake impersonation, and synthetic identities are active threats.
I’m not being alarmist; I’m calling for leadership. We need more lenders to collaborate to build strong controls, consistent processes, and an industry culture that values accuracy over speed.
AAPL has responded with tools designed to strengthen lender readiness and reinforce the integrity of our profession, but without leaders amplifying these signals, it won’t be enough. We need you to step up to ensure awareness—and we also need you to share what’s working in your organizations.
New AAPL Resources
PARTNERSHIP WITH RICHERVALUES. The OverSight Report offers a second evaluation layer for appraisals and comes with both a proven track record and ratings agency approval.
EXPANDED EDUCATION OFFERINGS. AAPL video courses have expanded and are free for members. Truepic helps course participants spot manipulated photos, video, and documents (with important limitations on DIY approaches), and Business Screen shares how to conduct and evaluate your own public records searches. Two other offerings on straw borrower fraud and appraisal/valuation fraud are in development.
AAPL MEMBER SCREENING. We now conduct background checks on all new and reinstated members, reinforcing our expectation that trust, transparency, and accountability remain foundational to our community. Fraud will continue to evolve, but so will we. The lenders who lead the next era of private lending will be those who pair innovation with discipline, growth with responsibility, and opportunity with ethics. AAPL remains committed to supporting that leadership through standards, education, and a community grounded in doing things the right way. Help us spread the word—and raise the bar.
LINDA HYDE President, American Association of Private Lenders
University of Virginia Students Earn AAPL’s CPLA Credential
What was once learned almost exclusively on the job is finding its way into formal education.
KAT HUNGERFORD, AAPL
Private lending has spent over a decade occupying an awkward space in the public imagination. To outsiders, it’s flattened into caricature: hard-money cowboys, opportunistic capital, transactional chaos, guys named Rick arguing over cracked drywall in a self-storage facility next to a mattress outlet. Finance, but with more dust.
Meanwhile, in the real world, billions of dollars in residential and transitional real estate projects are funded every year through private lenders operating sophisticated underwriting models, layered risk analysis, relationship-driven origination channels, and institutiongrade operational standards.
An entire ecosystem has matured in plain sight while much of higher education continued teaching real estate finance as if every viable loan begins and ends at a traditional bank. That gap is finally narrowing.
HOW A PROFESSOR BECAME A BELIEVER
This spring, students at the University of Virginia completed the Certified Private Lender Associate (CPLA) course through the American Association of Private Lenders, marking a meaningful moment for both the association and the broader private lending industry. For the first time, students from one
of the country’s most respected academic institutions are entering the workforce already viewing private lending as a legitimate, intellectually rigorous career path rather than a niche adjacent to “real finance.”
Universities like UVA do not casually insert industry credentialing into flagship coursework: Academic real estate is brutally competitive, and every course hour fights for oxygen. Faculty are expected to justify not merely educational value, but professional credibility, market relevance, and long-term applicability.
“I was first exposed to private lending about four years ago through my own real estate investments,” Assistant Professor Marcos Medeiros explained. “That was what caught my attention. … It was real deals, real properties, real risk, and real capital.”
Medeiros realized private lending occupied a strange blind spot inside traditional finance education despite being central to how enormous portions of real estate investment activity function.
“What surprised me was how important private lending is for real estate investors, especially when traditional banks are too slow or simply do not fit the deal,” he said. “I started thinking, ‘Why are we not teaching this more?’”
The answer, in part, is inertia. Academia tends to move carefully, especially in
finance disciplines where institutional reputation rides on intellectual seriousness and professional legitimacy. Private lending, despite its scale and sophistication, lacks the kind of structured career pathways universities instinctively trust.
“My background is a little different because I had a long career in industry before becoming a professor,” Medeiros said. “So, I always try to connect classroom learning with real-world application. Students can access information very easily. What they need from us is context, experience, and application. Private lending brings all of that into the classroom.”
WHAT HAPPENED IN THE CLASSROOM
Before bringing the certification into his curriculum, Medeiros completed the course himself. Although technical content stood out, its applicability is what made Medeiros decide the course needed a place in his curriculum.
“When I took the CPLA course, I liked how practical it was,” he said. “That is exactly the kind of content students need. It helps them connect finance theory to something they can see and understand.” That contrast became even more evident as students progressed through the course. They wanted to use CPLA’s principles to evaluate actual properties, discuss
real transactions, and work through the layered decision-making process.
“In one deal, students have to think about the property, the borrower, the numbers, the market, the risk, and the exit strategy,” Medeiros said. “They are asking, ‘Would I lend on this deal?’ or ‘Would I invest in this property?’”
Perhaps the most striking discovery was how naturally students gravitated toward the material. Medeiros noted that several were already thinking seriously about investing, entrepreneurship, and wealth-building while still in school.
“Many of them want to learn how to invest and build wealth now, not years from now,” he said. “When I started seeing students ask about buying investment properties, analyzing deals, and getting into real estate, I realized they needed this exposure earlier. Some of them are already taking steps toward their first investment property, which is exciting. I wanted them to have the right vocabulary and tools before jumping in.”
For their final projects, students underwrote real deals. Medeiros expected solid academic work; what he encountered looked like professional analysis.
“Some projects felt less like classroom assignments and more like real investment conversations,” he said.
That sentence may ultimately be the clearest signal of where the industry is headed.
A NEW TALENT PIPELINE
Private lending recruitment relies on career migration. Mortgage professionals, real estate operators, brokers, finance graduates, entrepreneurs, and accidental deal junkies eventually found their way into the business through fragmented exposure and industry networking. What UVA represents is
fundamental change to the talent pipeline: students intentionally entering adulthood already fluent in the vocabulary, mechanics, and analytical framework of private lending.
It also highlights AAPL’s evolving role within the industry. Trade associations often talk about education. Far fewer create educational standards capable of surviving academic scrutiny from a university environment that has little interest in promotional fluff or industry self-congratulation. UVA’s adoption of CPLA effectively validates that the curriculum is something durable: professional education with institutional credibility.
Medeiros sees broader implications beyond any single career path.
“Not every student will go into private lending,” he said. “But all of them benefit from understanding how capital, risk, and real estate connect.”
The industry has spent years insisting it deserves serious recognition. Now, students at UVA are building careers on the assumption it already has it.
Kat Hungerford is a digital project manager, operations strategist, and executive editor of Private Lender, the official trade publication of the American Association of Private Lenders (AAPL).
Drawing on a background in journalism, marketing, and systems design, she integrates technical execution with editorial oversight to advance AAPL’s digital infrastructure, publications, and member-facing initiatives.
AAPL is the oldest and largest national organization representing the private lending profession, providing education, oversight, and advocacy to support industry best practices.
Pictured: The first class of UVA students to earn AAPL’s Certified Private Lender Associate credential
KAT HUNGERFORD
Your Association at Work
From fraud prevention to government regulations, AAPL’s committees have moved well past discussion and into execution.
KAT HUNGERFORD, AAPL
AAPL has never been busier, and neither have the people helping move it forward.
What a lean internal team of three once handled has expanded into a sevenperson operation fully embedded across programming, partnerships, member services, events, content, and strategic initiatives. That growth has created more capacity to execute projects from “good idea” territory into actual deliverables.
At the same time, AAPL’s committees continue to serve as the association’s operational nerve centers. We’ve said goodbye to passive discussion groups or ceremonial line items on a website in favor of highly engaged industry professionals contributing expertise, pressure-testing ideas, identifying gaps, and helping shape initiatives that directly affect the private lending ecosystem.
The result is a more active association with more channels for member input, faster initiative development, and a deeper bench of operational support behind the scenes. The following is a snapshot of what those committees have been building, refining, monitoring, and occasionally arguing about productively on your behalf.
For members looking for more, AAPL’s quarterly Virtual Town Halls offer live committee updates, expanded context around active initiatives, and direct access
to the industry professionals helping shape them. We are also extending these conversations into select National Lending Experts events through in-person Town Halls, creating additional opportunities for members to engage with AAPL leadership, committee representatives, and fellow operators in a more interactive setting.
EDUCATION COMMITTEE
The Education Committee is focused on converting scattered expertise into structured, usable training that members can apply in real operations.
Leading the charge is the Intro to Private Lending course. It’s built to orient newer professionals while giving firms a stronger baseline for internal onboarding and team development. To avoid a onedimensional curriculum, the committee is pulling insight from operators across lending models and market cycles.
Also moving through production are several packaged learning programs:
» AI: A PRACTICAL EXECUTIVE PROGRAM
» DEFAULTS AND WORKOUTS
» CFM EXPANSION: OPERATIONAL DEEP DIVE
Already live are the DIY Background Check course and Media Fakes course, and the Fraud Committee is finalizing
coursework on Straw Buyer Fraud and Appraisal/Valuation Fraud.
Live programming is increasingly anchored to real operational friction rather than abstract theory. Upcoming webinars and roundtables tackle state licensing requirements, broker operations, fraud trends, and business design issues, all areas where lenders routinely encounter regulatory or financial complexity.
Private Lender magazine remains one of AAPL’s most consistent educational channels. Member subject matter experts write the content, with much of the editorial pipeline shaped by committee input on industry gaps and emerging challenges. The article on Dutch and Non-Dutch interest reserves on page 40 reflects that approach, moving beyond definitions to address servicing mechanics and capital implications.
The committee is also identifying underused resources already available to the industry, particularly legal and compliance materials, with plans for tighter integration into AAPL’s broader education ecosystem.
FRAUD STEERING COMMITTEE
The Fraud Steering Committee continues to turn known fraud patterns
into scalable tools, operational safeguards, and practical education.
A major development this quarter is the launch of a new AAPL member discount for private-lender-optimized background checks through Business Screen. The partnership expands member access to borrower and business diligence resources while reinforcing stronger front-end screening practices. Members preferring a hands-on approach can also access the new DIY public records background check course developed jointly by AAPL and Business Screen.
The educational pipeline remains active, with new courses on Straw Buyer Fraud and Appraisal/Valuation Fraud nearing completion. These programs help lenders identify fraud indicators earlier in the underwriting life cycle, ideally before the lesson arrives disguised as litigation expense or collateral impairment.
The committee also evaluated several concepts for improving fraud intelligencesharing without manufacturing legal headaches in the process. A proposed member fraud alert board generated strong interest, but privacy concerns and governance considerations shifted the conversation toward a more controlled intake process using AAPL’s existing reporting infrastructure. Members impacted by fraud schemes are encouraged to submit information at aaplonline.com/comments.
Rounding out this quarter’s fraud tool kit are AAPL’s partnership with RicherValues for appraisal oversight support and ongoing conversations with VerifyDial around identity and fraud detection infrastructure.
The broader strategy is to move the industry away from informal whisper networks/fragmented anecdotes and toward a more disciplined fraud prevention
framework built on verification, education, and controlled information-sharing.
ETHICS COMMITTEE
The Ethics Committee is tightening the way risk is identified, assessed, and communicated across the private lending ecosystem. The committee is now implementing new background check protocols for incoming AAPL members, with a deliberate focus on patterns of serious misconduct rather than one-off mistakes or administrative noise. The goal is straightforward: identify structural risk before it enters the network.
The committee also addressed a live Code of Ethics enforcement matter involving an AAPL member that engaged in largescale data scraping and AI-driven profiling of private individuals and then refused requests to correct or remove inaccurate information. Rather than align with AAPL’s standards, the firm forfeited its membership. Separately, the committee is reviewing a matter tied to potentially misleading advertising practices involving direct references to competitor entities.
Education remains one of the committee’s strongest preventive levers. Two Ethics Committee members contributed feature articles to this issue aimed at addressing common ethical blind spots in the industry. Jacob Therrien examines the “buck stops here” mindset around responsible use of industry tools (p. 74), and Kemra Norsworthy covers the ethical use of public records (p. 78).
GOVERNMENT RELATIONS COMMITTEE
The Government Relations Committee is actively tracking policy developments that may shape the operating environment for private lenders, whether or not immediate action is warranted.
We’ve said goodbye to passive discussion groups in favor of highly engaged industry professionals shaping initiatives that directly affect private lending.”
Current watch items include the 21st Century Road to Housing Act, rent stabilization proposals in Massachusetts and Connecticut, and California’s AB-1957. Historically, the GRC monitored legislative developments internally and elevated them to members only when action became necessary. That model is evolving toward broader visibility across policy touchpoints so members have clearer insight into what is being watched, why it matters, and where intervention may eventually be called for. Read more on pages 54 and 56.
One emerging issue under review stems directly from member concern: Pennsylvania’s treatment of prepayment penalties on smaller loans. The committee is evaluating the issue through several lenses, capital deployment constraints, borrower implications, political optics, and stakeholder alignment across lenders, brokers, and capital providers. This research will inform whether advocacy makes sense in Pennsylvania or comparable jurisdictions.
To ensure the committee’s priorities reflect actual member pain points rather than theoretical ones, the GRC is also circulating a broader survey on regulatory friction points affecting private lenders. Share your perspective through the one-minute survey at aaplonline.com/comments.
Finally, the committee is positioning AAPL’s operational initiatives, such as background checks, fraud alerts, and appraisal validation resources, as evidence of meaningful self-governance for advocacy discussions.
KAT HUNGERFORD
Kat Hungerford is a digital project manager, operations strategist, and executive editor of Private Lender, the official trade publication of the American Association of Private Lenders (AAPL).
Drawing on a background in journalism, marketing, and systems design, she integrates technical execution with editorial oversight to advance AAPL’s digital infrastructure, publications, and member-facing initiatives.
AAPL is the oldest and largest national organization representing the private lending profession, providing education, oversight, and advocacy to support industry best practices.
Multifamily RTL Is Ready for Its Own Track
Multifamily RTL has outgrown the residential framework it was born into, and the market needs to catch up.
BY ALEKSANDRA SIMANOVSKY, ADIGE ADVISORY
Anyone active in the Residential Transitional Loan (RTL) securitization market is familiar with the question that comes up when a portfolio is being assembled for a deal: “What do we do with the loans backed by 5+ unit multifamily properties?” The answer is usually some version of “Keep the concentration low, treat them conservatively, and move on.”
That approach made sense when multifamily loans were a small part of the market. It will make far less sense going forward.
As the RTL industry matures, more borrowers are gaining experience and renovating larger, higher-density properties. The collateral is evolving and the framework must evolve with it.
The multifamily RTL (MF RTL) market has grown meaningfully in scale and sophistication. Borrowers are more institutional, business plans are more detailed, and the properties themselves, including urban single-family density conversions to 5-story walk-ups and suburban value-add repositionings,
represent a distinct credit profile deserving a distinct capital markets treatment.
MF RTL market growth presents an opportunity to introduce an entirely new investor base to RTL securitizations: commercial real estate (CRE) investors already active in bridge lending but largely absent from today’s RTL securitizations. The question is whether the market is ready to structure and distribute the product appropriately.
Major structured finance asset classes started as something that did not fit the existing boxes. Non-qualified mortgage-backed (non-QM) securities, for example, began as outliers and grew to nearly 15% of the mortgage market, with $76.5 billion issuance in 2025, with its own framework, investor base, and performance history. Multifamily RTL sits at that same turning point.
CURRENT STATE
Most RTL securitizations are built and evaluated on a residential model, reflecting the segment’s single-family transitional loan roots. Rating agencies operating
within Residential Mortgage-Backed Securities (RMBS) frameworks often limit exposure because the approach for evaluating multifamily properties falls within commercial mortgage-backed securities (CMBS) methodologies, which is outside of their groups’ purview.
RMBS teams are unable to rate any pools with a material portion of multifamily loans, and the small number that do reach rated deals are subject to conservative assumptions—such as higher volatility scores—that ignore the assets’ location, value, income potential, and operational strength.
The result is a mismatch between the asset class and the framework used to evaluate it, not a reflection of any inherent weakness in the class itself.
DEFINING MULTIFAMILY RTL
A critical first step is clarity of definition. MF RTL generally consists of:
LOAN SIZE. These are typically $750,000 to $10 million, near the lower bound of CRE securitization loan sizes.
UNIT COUNT. In major urban markets, units range from five to 10, with valuations of approximately $500,000 per door. In suburban markets, this can extend to 20 or more, where values are closer to $100,000 per door.
MIXED-USE PROPERTIES. This is defined as properties where at least 50% square footage of the rent roll is residential and often includes ground-floor retail or neighborhood commercial use.
BUSINESS PLAN. Transitional execution is rehabilitation, lease-up, or repositioning. Payoffs are expected to be via sale or refinance into stabilized loans (e.g., small-balance CRE programs like
FIGURE 1. LOAN TYPE COMPARISON
Freddie Mac Small Balance Loans and Fannie Mae Small Loans).
A HYBRID ASSET
Multifamily RTL loans sit between residential and commercial real estate, as Figure 1 shows. On the one hand, they reflect residential characteristics such as entrepreneurial borrowers, shortterm bridge financing, and local market dynamics. On the other, they behave like commercial assets, where outcomes depend on income generation, tenant stability, property condition, and sale or refinance upon stabilization completion.
Multifamily RTLs materially differ from Multifamily CRE Collateralized Loan Obligations (CLOs), which are generally backed by larger loans, institutional sponsorship, and fully developed commercial underwriting frameworks.
MF RTL requires rapid underwriting and flexible, asset-based evaluation—qualities that conflict with the slow, costly, and riskaverse processes traditional institutions apply to higher-balance CRE loans. Conversely, RTL lenders can originate MF RTLs but do not yet have a securitization framework that reflects the diligence package CRE investors are familiar with.
That disconnect leaves MF RTL in between markets: too operationally intensive for CRE platforms and too
asset driven for traditional residential securitization frameworks.
That gap creates an opportunity to connect two investor bases that have historically remained separate.
EXPANDING THE INVESTOR BASE
Capital is the key to unlocking stand-alone MF RTL issuance: A broader investor base has the will to improve pricing, increase competition, reduce reliance on a narrow buyer group, and deepen market liquidity.
A large group of CRE investors already understand the risks embedded in transitional multifamily lending through exposure to debt funds, balance sheet lending, and CMBS. However, they have limited appetite for RTL securitizations, largely because the product has not been presented in a format that aligns with one they can easily evaluate.
Here’s the framework to fix that:
THE PILOT. Before bringing a stand-alone multifamily deal to the CRE investor market, issuers must demonstrate the ability to underwrite and present collateral to commercial real estate standards, as outlined in a standard CMBS multifamily due diligence package:
» ASSET SUMMARY REPORTS (ASR) that tell the story of the business plan, market, and path to stabilization.
» RENT ROLL ANALYSIS WITH market-level rent details.
» THIRD-PARTY REPORTS, INCLUDING appraisals, property condition reports, environmental studies, and seismic reviews where warranted.
These elements are standard in CMBS but largely absent from current RTL securitizations. Closing this gap is essential, not because rating agencies demand it, but because new investors will.
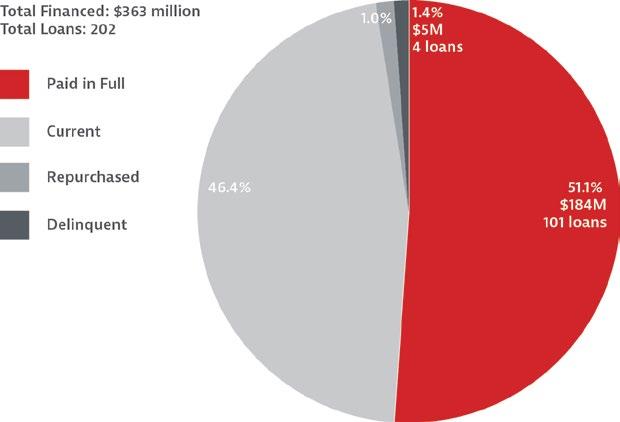
Preliminary proof-of-concept for the structure already exists in the form of unrated securitizations, the first of which was TRK 2024-2 as the first to be comprised entirely MF RTL transactions. The
2: TRK 2024-2 PERFORMANCE
Tired of raising capital and adding more bank lines of credit?
Crebrid is a Dallas-based private lender built to help correspondent lending partners scale originations — without building the operational overhead themselves. Bring us your deals — Fix-and-Flip, DSCR, or New Construction - as we move fast, protect your relationships, provide white-label term sheets, and deliver reliable execution from application through closing across all 50 states.
FIGURE
October 2024 issuance was initially backed by 98 loans totaling $166 million. As of the April 2026 remittance report, those figures have grown to 202 loans totaling $363 million during the revolving periord. See Figure 2 for performance details.
Although there has not yet been another stand-alone MF RTL issuance, the ICAP 2025-RTL1 issuance in July 2025 had an initial concentration of 82.6% MF RTL.
INVESTOR EDUCATION. Even strong collateral and sound structures can fail without effective communication. Issuers must maintain their existing investor relationships while actively engaging CRE investors who are new to the RTL market.
This requires presenting deals in commercial real estate terms, with assetlevel documentation (i.e., multifamily due diligence packages) and a clear explanation of how transitional multifamily risk differs from stabilized assets in traditional CMBS transactions. A wellexecuted marketing process can expand the buyer pool and improve execution.
For this, the advisory team matters more than the rating agency. A team focused solely on residential execution may struggle to reach CRE investors. Successful execution requires fluency in both markets and established investor relationships.
RATING METHODOLOGY DIALOGUE. This stage is key to engaging CRE investors who require institutional-grade diligence. With data and infrastructure in place, issuers can engage rating agencies in refining how multifamily collateral is evaluated. Greater emphasis should be placed on stabilized value, testing renovation assumptions, and analyzing income-based metrics such as debt yield and debt service coverage ratios upon renovation completion and stabilization.
The goal is to extend the existing residential framework. A hybrid approach preserves borrower-level insights while incorporating the asset-level analysis CRE investors require. This also makes the product more understandable to both existing and new buyers.
REPEAT ISSUANCE. Markets are built through consistency. Over time, repeat transactions allow investors to build familiarity, confidence, and pricing.
TRK 2024-2 priced with a discovery premium because investors wanted to be compensated for the novelty. As performance data grows and investor understanding improves, execution becomes more efficient. Repeat issuance also builds the track record required for institutional capital to participate at scale.
A critical and often underemphasized component of repeat issuance is asset management and servicing capability. MF RTL requires hands-on asset management, particularly during the construction inspection phases and in downside scenarios. Operational expertise and the ability to manage transitional business plans at the asset level, lease-up execution, and recoveries can materially increase investor confidence and broaden participation.
WHAT SUCCESS DEPENDS ON
Multifamily MF loans already exist and are already securitized within unrated RTL deals. Additionally, largerbalance MF RTL loans are already rated within the CRE CLO framework, so regulatory change is unnecessary.
Although competition among ratings agencies may improve outcomes at the margin, having just one agency willing to enter the dialogue is enough to start
the shift for smaller-balance MF RTLs. The true test is the industry’s ability to change the approach by engaging teams that can operate across both residential and commercial frameworks, adopting ResiMercial due diligence and treating MF RTL as commercial from the outset, and expanding distribution beyond traditional residential buyers. Every asset class begins as an exception. MF RTL is no different. The firms that move early will both improve execution and help define the market itself, an advantage that compounds over time.
ALEKSANDRA SIMANOVSKY
Aleksandra Simanovsky is the founder of Adige Advisory, helping private real estate lenders access and scale within capital markets. With more than 20 years in structured finance and commercial real estate, Simanovsky is a recognized leader in credit, underwriting, securitization, and capital formation. She is among the key architects of the Residential Transitional Loan (RTL) securitization market and a leading advocate for multifamily RTL as a distinct institutional asset class.
At Toorak Capital Partners, she led the first rated RTL securitization, driving major institutional adoption. Earlier, at Deutsche Bank, she spearheaded $40 billion in CRE securitizations after rating analyst roles at KBRA and Moody’s across CMBS, RMBS and ABS.
Raising Capital the Right Way Starts With the Right Structure
The framework you choose early will either support your growth or restrain it.
BY MARK JURY, ENTERPRISE BANK & TRUST
Raising capital is one of the most difficult aspects of building a successful private lending business. The capital-raising framework you choose early on will shape nearly every strategic decision that follows. Key considerations include fund versus non-fund structure, debt vs. equity capital raising, anticipated scale, and the types of investors you plan to target and whether that profile will evolve as the business matures.
Raising capital as debt carries significant limitations that private lenders must weigh carefully against their strategy and growth expectations.
FUND STRUCTURES
A common way to grow a scalable investor capital base is through a fund structure.
Funds are the primary way to raise capital as equity, unless you plan to give up ownership in your lending business. The
term debt fund technically refers to the type of assets held by the fund, meaning any fund containing mortgages qualifies as a debt fund. But since mortgage funds can raise capital as debt or as equity, we’ll use the term promissory note debt fund throughout this article specifically for funds that raise capital as debt.
Raising capital as equity involves having a general partner/limited partner (GP/ LP) structure, a situation where the private lender often owns the GP—
the entity that manages the fund and often invests in the fund—and offers LP ownership interests in the fund to investors in exchange for their capital.
Because investors are treated as owners and, therefore, as equity, they are inherently subordinated to senior secured credit facilities, such as a bank line of credit (LOC). This makes obtaining an LOC easier. Investors are typically paid in an equity style: Fees and expenses are defined first, and the investors receive the income that remains.
Under this framework, as the fund experiences good and bad performance, manager fees and expenses are paid first, and the resulting investor yield fluctuates correspondingly. One challenge GP/LP fund managers face in raising capital, particularly early in the fund’s life, is the lack of defined investor yield and track record of average returns, creating a yield uncertainty that may give potential investors pause. It is possible to have more defined returns for
investors if desired, which often involves a preferred return, various share classes, or sometimes even an explicitly defined yield.
An alternative structure addresses some of the challenges by raising capital as debt instead. Raising capital as debt can take a variety of forms, but as the name implies, it often involves issuing promissory notes to investors with specific maturities and defined yields. Capital raising can occur within or outside a fund, and various structures include directly assigning and endorsing individual mortgages and notes to investors, issuing security agreements to collateralize the investor notes with specific mortgage loans, offering Borrower Payment Dependent Notes (BPDNs), or using the private lending or fund entity to issue unsecured debt.
Either of these structures can be open-end/ evergreen funds (with no defined maturity date for the fund) or closed end (the fund has a defined date at which capital raising stops and the wind down period begins).
This distinction shapes how investors ultimately receive their principal back.
The mechanism for investors receiving their principal back differs between the two. For equity funds, whether closed-end (prior to maturity) or open-end, an investor must formally request their capital back via a redemption request. There has been a lot of news this year about high levels of redemption requests with private credit funds, making it imperative for equity-style funds to have strong gatekeeping rights (i.e., the ability to pause redemptions if liquidity is insufficient). For debt structures, promissory notes have defined maturity dates, so the concept of a redemption does not apply; however, it is still good practice to stagger maturity dates and build in notification periods to manage liquidity.
THE DEBT CAPITAL TRADE-OFF
Dating back to the early years of private mortgage lending, raising capital as debt
has often been viewed as the path of least resistance. There are many reasons for this, but these two stand out:
THE INVESTOR. The most natural investor in private bridge mortgage loans tends to be a real estate investor, someone already familiar with the underlying asset class, accustomed to underwriting individual properties, and comfortable taking ownership of specific real estate. That familiarity makes the leap to debt investing more intuitive.
RATE OF RETURN. Whether inside a fund structure or not, investors in debt secured by mortgages are accustomed to earning a fixed rate of return.
Promissory notes are a straightforward mechanism for defining the rate of return, and structures like trust deed investing, BPDNs, or similar arrangements make it easy to assign individual notes to investors, creating an investment vehicle that feels familiar to real estate investors.
That said, promissory note debt fund structures come with several potential shortcomings:
SCALING CHALLENGES. Matching an investor (or multiple investors) with individual loans can be challenging for timely closings and scaling, both because of the difficulty in aligning liquidity inflows and outflows and because investor preferences may not align with the loan opportunities available.
LIQUIDITY GAPS. If deteriorating performance or cash drag reduces yield on the portfolio, the fee and interest income may be insufficient to pay the fixed rates on the investor notes, which could result in the private lender having to pay the difference out of pocket or risk defaulting on the investor notes.
FEWER TAX BENEFITS. Only GP/ LP style funds permit the addition of real estate investment trusts (REIT) or sub-REIT structures to provide tax benefits to investors.
SMALLER INVESTOR POOL. Institutional investors (e.g., family offices, endowments, and registered investment advisers/ wealth managers) may prefer or even require that investments be made as LPs, so raising capital as debt may inhibit institutional capital relationships as your lending business grows.
LOC LIMITATIONS. Most banks or other LOC providers will only lend to funds, with the majority of those requiring GP/LP funds.
EQUITY FUND CONSIDERATIONS
As the fund model has evolved, it has become common to more clearly define the rate of return to investors in equity funds. There is nothing that prevents a GP/LP style fund from defining the rate paid to investors and having any excess income flow through to the GP/fund manager. More commonly, to protect the manager, fund expenses and a base management fee are defined and paid first. Then a fixed preferred return to the investors is paid, with any additional income split between the GP and LPs based on certain thresholds and percentages.
A hot topic so far this year has been redemption rights and restrictions for investors. There is a natural push-and-pull between what investors want (quick and easy return of principal when needed) and what fund managers want (stable capital where withdrawal requests cannot force liquidation of assets prematurely).
Although some investors may prefer more return of capital flexibility, most savvy investors will understand the need for these redemption restrictions and
limitations to ensure stable liquidity to run the lending business. As many private lenders have experienced, not having reliable capital to close deals can be the fastest way to turn off borrowers and crater a lending business. Institutional or large LPs may request additional flexibility in exchange for large investments, so the trade-off between this and how other LPs or LOC providers may view this special treatment should be evaluated.
To maintain a reliable capital base and avoid being forced to wind down the fund, the following are common redemption guardrails in GP/LP funds.
These are often employed together to protect the fund, its investors, and its managers from withdrawal activity too abrupt or large for the fund to sustain.
INITIAL LOCKUP PERIODS. These are typically 12 months.
PPM LANGUAGE. The fund’s private placement memorandum (PPM) will often include language stating the fund is not obligated to liquidate any assets, properties, or loans to accommodate a member‘s withdrawal or redemption request.
CAPS ON INDIVIDUAL INVESTOR REDEMPTIONS. For example, a fund
may limit redemptions to 25% of an investor’s balance per quarter, meaning it would take a year for an investor to be repaid their entire capital investment.
CAPS ON TOTAL INVESTOR REDEMPTIONS. For example, a fund may limit redemptions to 10% to 20% per year. As a real-world example, one leading private asset management firm enforced a 5% total redemption cap per quarter in early 2026.
Use of a REIT or sub-REIT structure has surged in popularity in GP/LP funds since the passing of the One Big Beautiful
Bill Act of 2025, which removed the 2026 sunset period for the qualified business income deduction (QBID). There are many considerations involved in these types of structures that should be evaluated carefully. The main benefit is the 20% deduction for the REIT dividend, regardless of an investor’s tax bracket.
DEBT FUND CONSIDERATIONS
Raising capital as debt via investor promissory notes, whether inside a fund or not, involves analogous practices to those used in GP/LP funds
to maintain capital base stability, and these are worth considering carefully.
Maturity dates of promissory notes can be staggered to avoid significant capital needing to be returned at the same time. Monitoring a large pool of investor notes with varying maturity dates can be challenging, but the benefit of smoother cash flow changes allows for better liquidity management.
Including auto-renewal provisions in the notes can help to avoid renegotiating terms every time or accidentally being in maturity default. Additionally, requiring a notice period prior to maturity for investors to be paid back (e.g., 90 days or more) allows for proper liquidity planning. Notes can also have firm requirements that the return of principal prior to the maturity date be solely at the manager’s discretion.
If possible, avoid directly associating individual mortgage loans with specific investor notes. This approach is not only challenging to scale, but it also prevents LOC providers who may consider lending to non-GP/LP funds from providing debt on these loans (notes can only be pledged to one party—the LOC provider). Investors familiar with direct real estate investing may want to be associated directly with a small number of loans, but this structure is limiting for obtaining debt facilities and places a significant administrative burden on the fund manager to match each loan with its corresponding investor.
A clause can be included explicitly allowing the manager to delay principal repayments for a defined period, typically 90-180 days, when insufficient liquidity is available to repay matured investor notes.
The other complication that is unique to raising capital as debt is how this debt instrument may potentially conflict with an LOC provider. The requirements of senior secured credit providers, which are inherent in GP/LP style funds, would need to be explicitly stated in notes and if applicable, the fund’s PPM. Such investor promissory note requirements include:
UNSECURED. There is no accompanying security agreement, UCC filing, or mention of individual mortgage loans in the investor note.
EXPRESSLY SUBORDINATED. Included are return of principal and the ability to stop payments to investors (with a mandatory return of improper payments) in an event of default on the senior credit facility.
ENFORCEMENT STANDSTILL DURING
A SENIOR LOAN DEFAULT. Investors cannot seek remedies while the senior loan is in default, including acceleration, pursuing the guarantors, placing liens
on the private lender, or pursuing repayment from any guarantors.
NOTIFICATION. The senior lender may require notice if any investor notes are in default.
Each LOC provider has different requirements, so it may be possible for a private lender to obtain a debt facility without all of these requirements. But the more that are missing, the less likely establishing an LOC becomes. These may seem harsh to investors, and without them, most LOC providers cannot proceed, which is why many private lenders who use lines of credit prefer to raise capital into GP/LP style funds rather than include these provisions in their investor promissory notes (and, if applicable, PPMs). When raising capital as debt, private lenders often do not include all these provisions; adding them later can be challenging for existing investors.
CHANGING INVESTMENT STRUCTURES
Although not ideal, there are a few ways to change your investment structure after it has been established and raised investor capital. Most commonly, private lenders choose to migrate to a fund model as they grow, but experienced private lenders may opt to move out of a fund if their mandate changes or investor composition shifts. Additionally, if the available loan products or asset classes shift meaningfully, the investment structure may need to evolve accordingly.
Adding a REIT or sub-REIT to your GP/ LP fund can be done for tax reasons, but because of the associated costs, fund managers often wait until reaching a critical size, like $50 million, before implementing. Though also not available until a fund reaches a certain size and
track record, using leverage/debt or specific amounts of it can help manage cash flows or boost investor returns and often aren’t available until the fund reaches a certain size and track record.
As a private lending business grows and establishes a strong track record, private lenders may be able to raise capital in larger chunks or at lower costs. Early investors are often enticed by higher returns that account for the risk of new funds. But as the fund scales, asking those same investors to accept lower returns becomes necessary for profitability, although the conversation can be a delicate one.
Lastly, similar to REIT structures or LOCs, use of third-party vendors may only be appropriate as the fund grows, but they may be a requirement for larger, more sophisticated investors.
Depending on the structure of your private lending entity and the significance of the changes, modifications may be made in a variety of ways:
NO FUND. If not governed by a fund structure, the ability to retain investors is the primary driving force for whether to make changes.
EXISTING PROMISSORY NOTE DEBT FUND. Changes will need to be made to your PPM and/or individual investor notes. If only a PPM modification is required, depending on the type of change, you may need to notify or gain consent from your investors.
EXISTING EQUITY FUND. Like a promissory note debt fund, you may need to change your PPM and/or individual LP agreements. Similarly, you may need to notify or gain consent from your investors.
NEW FUND. Rather than changing an existing structure, some private lenders choose to launch a new fund with new
terms. If you choose to retain your old entity as well, you must determine whether you will continue to operate and raise capital into both entities, and if so, what differentiates the two and how to determine which assets go in which entity.
The biggest challenge most new private lenders face is lack of consistent liquidity, so there is a natural inclination to begin with structures that favor investor flexibility. Understanding, analyzing, and choosing a framework suited to your launch conditions and your future goals can save you headaches down the road. Flexibility and adaptability are core tenets of the private lending industry, and evolving the business is natural and expected. Education, communication, and managing investor expectations are key to maintaining strong capital relationships as your private lender develops.
The information contained in this article is for informational purposes only. To determine which structure may be right for your private lending business or how to adjust it, please consult your professional relationships (legal, tax, accounting, investors, etc.).
MARK JURY
Mark Jury is senior vice president, private lender finance in Enterprise Bank & Trust’s Los Angeles region, servicing clients and providing lines of credit to private lenders nationwide.
New Appraisal Tool Wins Ratings Agency Approval
As the industry’s appraisal fraud problem proves more persistent than many assumed, AAPL adds to its member toolbox.
KAT HUNGERFORD, AAPL
RicherValues’ automated appraisal risk analytics solution, The OverSight Report, has received approvals from multiple ratings agencies and third-party review firms, clearing the way for its use as a direct replacement for traditional appraisal desk review products in securitized transactions.
Analysis of over 1,000 active DSCR loan files since January shows that approximately 20% of appraisals carry material overvaluation risk, a finding that reinforces longstanding concerns about the limitations of conventional tools, which have historically approved the overwhelming majority of appraisals without meaningful challenge.
In blind testing, OverSight detected every loan file associated with the Baltimore and Philadelphia appraisal fraud schemes while producing no false positives.
“Market participants have long understood that existing secondary appraisal review products fail to adequately detect overvaluation and coordinated fraud,” said Rodney Mollen, founder and CEO of RicherValues. “We built The OverSight Report to deliver independent, data-driven
clarity at scale. Ratings agency approval, combined with our finding that roughly one in five DSCR valuations remains overstated even after the Baltimore and Philadelphia fraud cases, reinforces both the validity of our approach and the need for a more rigorous standard. Early adoption has already shown that lenders can restructure loans or obtain appraisal revisions, improving origination pull-through while enhancing overall portfolio quality.”
HOW IT WORKS
The platform delivers automated appraisal risk assessments in under three minutes, flagging valuation anomalies, fraud indicators, and collateral inconsistencies with greater speed and precision than legacy review processes. Its automated grading framework identifies approximately 25% to 35% of appraisals for human review, allowing institutions to direct resources toward higher-risk files rather than reviewing every submission manually.
Early adopters report an average 85% to 90% reduction in internal appraisal review time — from roughly 45 minutes per file to under
5 minutes. Lenders replacing legacy review products are also realizing cost savings of 25% to 40% per loan, even when incorporating targeted human review for flagged files.
OverSight currently evaluates as-is property valuations. RicherValues is developing subject-to, or ARV, capabilities as part of its product road map. In the interim, the company recommends its FIRREA-compliant Renovation Analysis Report for renovation and ground-up construction projects.
AAPL PARTNERSHIP
AAPL has incorporated The OverSight Report into its Partner Program to accelerate adoption of enhanced fraud detection tools.
AAPL members will receive a 10% discount per report for the first 180 days of use.
“The OverSight Report addresses a clearly identified vulnerability in appraisal review and collateral risk assessment,” said Linda Hyde, AAPL president. “By bringing this solution into our Partner Program, we are providing our members with access to a tool that has demonstrated both analytical rigor and practical efficiency in real-world lending environments.”
AAPL members can contact RicherValues directly and mention their membership to access the discount. For product questions or to schedule a demo, contact Ryan Mollen at ryan@richervalues.com or 480-296-6554.
AAPL is the oldest and largest national organization representing the private lending profession, providing education, oversight, and advocacy to support industry best practices.
KAT HUNGERFORD
Kat Hungerford is a digital project manager and executive editor of Private Lender, the official trade publication of AAPL.
Private Lenders Can’t Ignore AML
The FinCEN real estate rule may be on ice, but anti-money laundering obligations for private lenders are very much alive.
KAREN J. KRAUSE, HARTMANN DOHERTY ROSA BERMAN & BULBULIA LLP
The private lending industry has watched the rollout and then recission of the Financial Crimes Enforcement Network (FinCEN) Residential Real Estate Rule with understandable concern, if not outright whiplash. A federal-district court has temporarily taken the rule off the table, but other real (yet manageable) regulatory matters remain for private lenders.
Let’s explore where things stand now, what might come next, and why. Regardless of the fate of the rule, you should be familiar with Bank Secrecy Act (BSA) anti-money laundering (AML) compliance if you are in the business of lending on 1- 4-unit residential properties.
THE RULE IS SUSPENDED BUT APPEALED
FinCEN’s Residential Real Estate Rule had created a new requirement as of March 1, 2026, for certain “reporting persons” (primarily title companies, settlement agents, and similar real estate professionals) to file a Real Estate Report with FinCEN for every cash and non-financed transfer of residential property to an entity or trust. Shortly thereafter, on March 19, the U.S. District Court for the Eastern District of Texas held in Flowers Title Companies,
LLC v. Bessent, that FinCEN had exceeded its statutory authority under the BSA and vacated the rule, thereby suspending the Real Estate Report obligation.
The bottom line: Although the Flowers order remains in effect, no one is required to file the Real Estate Report, and there is no federal penalty for not filing it.
As of the date of this writing, FinCEN, in conjunction with the DOJ, has filed an appeal seeking to have the Rule reinstated (two other federal district courts had already upheld the Rule). At this time, there is no certainty that the Rule will be resurrected in its current form, or at all, or perhaps in a narrowed or modified version. FinCEN has issued further guidance that, if it is successful and the court’s order is overturned, it will not enforce the Rule retroactively. Rather, it will provide a timeline for when the reports would again be required.
YOUR LOANS PROBABLY WEREN’T COVERED
But it likely doesn’t matter: The rule rarely reached your typical private lender loan.
Even before Flowers, most private lender loans secured by residential property were outside the parameters of the Residential
Real Estate Rule. The rule was designed to capture cash and nonfinanced transfers of residential real estate to entities and trusts. Many in the industry interpreted “nonfinanced” to mean any financing outside of traditional banks, such as hard-money or private lender loans. The rule defined a non-financed transfer in a very specific way. A transfer was treated as non-
financed if all transferees received an extension of credit that was both:
» SECURED BY THE PROPERTY BEING TRANSFERRED.
» EXTENDED BY A FINANCIAL INSTITUTION SUBJECT TO AML PROGRAM AND SAR OBLIGATIONS.
Put differently, a non-financed transfer included a transfer whereby
the lender was not already subject to the BSA’s AML/SAR regime.
RMLOS ARE ALREADY SUBJECT TO BSA
Your private lender loan transactions are not non-financed transfers when you are an RMLO subject to the BSA’s AML/SAR rules.
Under a separate FinCEN rule that predates the Residential Real Estate Rule, many nonbank lenders are already treated as Residential Mortgage Lenders and Originators, or RMLOs. This rule, called the Anti-Money Laundering Program and Suspicious Activity Report Filing Requirements for Residential Mortgage Lenders and Originators, has been in effect since 2012; it can be found at 31 C.F.R. § 1029.100 et seq. Under this rule, you are an RMLO if you are a nonbank business that:
» EXTENDS LOANS SECURED BY 1–4UNIT RESIDENTIAL PROPERTY OR RELATED RESIDENTIAL LAND.
Or
» TAKES APPLICATIONS FOR, OR OFFERS OR NEGOTIATES TERMS OF, SUCH LOANS.
Crucially, the definition of “residential mortgage loan” for these purposes is based on the collateral alone and not the stated purpose of the loan, unlike the various consumer protection laws that capture only loans for personal, household, or family purposes.
Whether you label the loan business purpose, investment purpose, or consumer purpose is not the key question here. If the loan is secured by a 1–4-unit residential property (or land for such a property) and you are making or originating those loans, you are very likely operating as an RMLO, even if your loans are business purpose.
And once you are an RMLO, from FinCEN’s point of view, your loans are part of a financed transfer market that is already subject to BSA oversight via your own obligations, not via the Residential Real Estate Rule’s reporting regime for cash and non-financed transactions.
AML AND SARS STILL REQUIRED
Regardless of the rule’s fate, if you are an RMLO, you should have an AML program and file SARs.
Here is the most important takeaway for private lenders: neither Flowers nor the Rule’s temporary recission (nor a successful appeal by the government) changes the already existing obligations of RMLOs under the law. Those rules currently generally require:
A WRITTEN ANTI-MONEY LAUNDERING (AML) PROGRAM. The program should include internal controls, a designated compliance officer, ongoing training, and independent testing; and
SUSPICIOUS ACTIVITY REPORTS (SARS). These must be filed with FinCEN when you detect transactions that may involve fraud, money laundering, or certain other violations of law.
Whether the rule is resurrected in whole or in part, private lenders that (1) extend loans secured by 1-4-unit residential properties, or (2) take applications for or offer or negotiate the terms of such loans, should assume they fall under the RMLO rule and act accordingly. That means putting in place a written AML program and building SAR reporting into your regular risk and compliance routines.
COMPLIANCE IS WITHIN REACH
BSA compliance is manageable, and you’re probably already doing at least
part of it. If you don’t already have one in place, implementing a basic RMLO-level AML program may not be as burdensome as you think, especially if your lending operation is relatively streamlined.
The core elements you need are:
» WRITTEN POLICIES AND PROCEDURES TAILORED TO YOUR PRODUCTS AND BORROWER BASE.
» A NAMED PERSON WHO IS RESPONSIBLE FOR AML COMPLIANCE.
» STEPS FOR ONBOARDING BORROWERS, IDENTIFYING BENEFICIAL OWNERS OF ENTITY BORROWERS, AND SCREENING FOR RED FLAGS.
» TRAINING FOR YOUR ORIGINATION, UNDERWRITING, AND OPERATIONS STAFF ON WHAT TO WATCH FOR AND HOW TO ESCALATE CONCERNS.
» PERIODIC TESTING.
In April 2026, FinCEN issued a new Notice of Proposed Rulemaking to fundamentally reform AML/CFT program requirements for all financial institutions with BSA program obligations, which includes RMLOs. The new rules, if and when they become effective, may change how existing AML programs are written or implemented and the elements. There are a number of service providers that can help you comply with the BSA rules. Many of these firms offer:
» TEMPLATE AML POLICIES CUSTOMIZED TO YOUR RISK PROFILE.
» OUTSOURCED BSA OFFICER SERVICES OR SUPPORT.
» TRAINING AND SAR PREPARATION ASSISTANCE.
According to some private lenders, implementing a compliant AML program is relatively inexpensive, with ongoing maintenance costs that are equally modest relative to overall lending volumes. Further, you can likely get into compliance within a few weeks.
MORE RULES ARE COMING
More regulation is almost certainly coming; proactive compliance demonstrates that we can police ourselves.
For years, FinCEN and others have highlighted residential real estate as a channel for potential money laundering. To combat and deter money laundering, regulators want better visibility into who is buying and financing U.S. residential properties, especially through entities and trusts and with nontraditional financing. When FinCEN adopted the 2012 Rule for RMLOs, it emphasized that this was the first step in an incremental approach to cover a broader universe of non-bank finance companies going forward. The Residential Real Estate Rule/Flowers litigation is just one chapter in this larger story.
As an industry, we have an opportunity to demonstrate we are good financial citizens by embracing reasonable AML controls and SAR reporting. You can show policymakers that additional heavy-handed regulation is unnecessary because the private lending sector is already identifying and reporting suspicious activity. At the same time, you can further protect your own business from being misused by bad actors.
Now is the right time for private lenders to tighten their anti-money laundering practices, not only because the federal rules require it, but because doing so is both good business and good for private lending.
The information presented is for general informational purposes only and should not be construed as legal advice, nor is it intended to be a substitute for legal counsel on this or any subject matter. The information presented is not legal advice, is not to be acted on as such, may not be current, and is subject to change without notice. No attorney-client relationship is created by your receipt or use of this information.
KAREN J. KRAUSE
Karen J. Krause is a partner in HDRB&B’s Private Lending Group. An experienced transactional attorney formerly specializing in M&A and securities law, Krause began practicing real estate law in 2014 and joined HDRB&B in September 2016.
She represents private lenders in real estate secured transactions, including acquisition and construction loans. She has closed hundreds of commercial loans involving the acquisition and/ or renovation of properties ranging from single-family homes to small apartment buildings and commercial facilities. Krause previously practiced corporate law at law firms in Newark, New Jersey, and New York City, where she represented small and mid-sized companies in public offerings, private placements, securities law compliance, mergers and acquisitions, and a wide variety of contracts and general corporate matters.
Every Property Needs a Paper Trail
Pre-construction documentation locks in your position before ever breaking ground.
DAVID JACOBS AND TAYLOR MILLER, CONSTRUCTION INSPECTION SPECIALISTS
Long before the first draw request is submitted, before the inspections begin, and before a single yard of concrete is poured on site, the quality of your pre-construction documentation determines how predictable, or volatile, your loan will be.
It is easy to think of this documentation as a routine part of underwriting— something to collect, file, and move past so the deal can close. But every missing detail, every unverified assumption, and every loosely defined scope becomes
embedded risk in your loan. You may not recognize it immediately, but it will surface later in the form of delays, disputes, and cost overruns. By the time these issues appear, your ability to control them is significantly reduced. The reality is that your risk profile is largely locked in before the first dollar ever leaves the account.
What follows examines each piece of pre-construction documentation—why it matters, what goes wrong when it is missing or incomplete, and the potential consequences of accepting it without
verification. Some are nonnegotiable, others are supplemental, but every one shapes the risk profile of your loan.
DO NOT PASS “GO,” DO NOT COLLECT YOUR $200
If you’re missing any of these, you’re likely to go straight to Monopoly Jail— in the form of delays, cost overruns, headaches, and default risk.
CONSTRUCTION CONTRACT. A fully executed construction contract should
be one of the first documents you obtain and verify. A strong contract clearly defines scope, pricing structure, and change order procedures, providing the legal and operational framework on which everything downstream is built. Without it, you are not financing a defined project; you are financing a negotiation that will continue long after capital has been deployed. Accepting a contract that is incomplete, missing exhibits, or still being negotiated at closing is one of the easiest ways to embed risk into a loan.
CONSTRUCTION PLANS. Complete construction plans define exactly what is being built and serve as the reference point against which budgets, schedules, inspections, and draw requests are measured. Partial drawings or inprogress architectural packages create a fundamental mismatch between what you are financing and what is being built. Every downstream decision becomes interpretive rather than verifiable, inspectors cannot validate progress against
a plan that does not yet exist, and budget reconciliation becomes a moving target.
Consider this example: A client hired professionals to perform inspections and track the level of progress on a construction project without being able to specify whether the retail space required a shell build out or was being built to suit a specific tenant. When the project reached about 80% completion, the scope of the retail space shifted suddenly from the former to the latter. This changed the inspector’s completion grading from 80% to 70%—but 80% of the funds were already disbursed.
Evolving scopes almost always lead to overfunding and often build team financial frustrations.
LINE-ITEM BUDGET. A detailed line-item budget gives you the visibility to evaluate pricing integrity and identify exactly where money is being spent. High-level budgets that aggregate costs into broad categories like “general construction” or “site work” may look sufficient on paper, but they remove the details you need to catch
overruns before they materialize. Accepting summarized budgets that are never reconciled against detailed plans means you are funding a financial abstraction rather than a verified cost structure, dramatically increasing the likelihood of unexpected change orders once construction begins.
CONSTRUCTION SCHEDULE. A credible construction schedule is essential, but it is one of the most overlooked documents in the process. A well-built schedule reflects realistic sequencing, permitting timelines, procurement constraints, and contractor availability. The document ties your draw structure and interest reserve assumptions to the real world. Many schedules submitted at closing are aspirational rather than operational, and borrower-provided schedules often go unvalidated. When delays inevitably occur, the original schedule becomes irrelevant, yet your loan structure is still tied to it through draw expectations and interest reserve assumptions.
PERMITTING STATUS. Permitting status must be clearly verified. A project that
is “in permitting” without documented approval status or a defined approval path introduces timing uncertainty that can cascade into financial strain. Jurisdictional variability, design revisions, and regulatory delays can extend timelines well beyond expectations, directly impacting carrying costs and borrower liquidity. What looks like a minor administrative delay on paper can completely reset the financial profile of your loan, so it pays to confirm the actual status and approval path before funding.
CONTRACTOR QUALIFICATION. The contractor is ultimately responsible for executing the project, making documenting experience, insurance, financial stability, and capacity for the specific scope foundational to managing execution risk. Some lenders have strong relationships with developers and builders. But just because a contractor successfully built a self-storage facility within the budgeted amount and within the provided time frame does not mean they are qualified to build a medical office building. Strong existing relationships with developers and overconfidence in their capabilities can replace rigorous vetting. Execution challenges almost always follow.
OPTIONAL, BUT BANKABLE
Beyond the non-negotiables, a second tier of documentation can significantly improve underwriting accuracy. The following are green flags for an experienced, organized borrower, and they make your job significantly easier.
GEOTECHNICAL REPORTS. Subsurface conditions can materially affect foundation costs and timelines. When geotechnical analysis is reviewed only at a surface level (pun intended) or skipped entirely, the foundation budget can become one of the most volatile line items in the project. Unexpected soil conditions, water table
issues, or load-bearing concerns can force redesigns and trigger cost overruns that would have been visible in a proper report obtained before funding.
SUBCONTRACTOR BIDS AND MATERIAL
TAKEOFFS. Detailed subcontractor bids and material takeoffs allow you to validate whether general contractor budget assumptions are realistic by providing an independent reference point at the trade level. Without them, the general contractor’s pricing is effectively accepted at face value, and assumptions that look reasonable in aggregate often fall apart in the details. Their absence usually becomes noticeable only after problems arise.
HEDGE YOUR BETS
Each of these documentation gaps has a direct impact on your bottom line and carries a risk of the borrower defaulting. Even when loans ultimately perform, gaps still cost you time spent resolving discrepancies, reviewing exceptions, and managing borrower communication. They reduce portfolio predictability and introduce variability into what should be a controlled lending process, which directly impacts your return on capital and operational efficiency.
This is why standardization at the preconstruction stage is so critical. When documentation requirements vary from deal to deal, so does your risk exposure. Establishing a consistent framework for what must be collected, verified, and approved before funding allows you to evaluate every loan through the same risk lens. It forces discipline into your underwriting, ensures every loan begins with the same foundational level of clarity, and makes draw reviews faster, inspections more objective, and portfolio performance more stable.
A well-performing construction loan portfolio is defined by the quality and consistency of the documentation you require and the discipline with which you enforce it.
David Jacobs is the director of operations for Construction Inspection Specialists. He has over 10 years of construction industry experience spanning on-site construction labor, operations, and site management. Jacobs is certified with the Association of Construction Inspectors and holds a CDT certification from CSI.
Taylor Miller is the project and marketing manager for Construction Inspection Specialists. Active in the construction and inspection industries since 2016, Miller’s experience includes real estate appraisals, construction labor, and construction lending risk management. He manages the company’s marketing campaigns and social media.
DAVID JACOBS
TAYLOR MILLER
Every core function in a single system of record
See the platform in action
Tightening Yields Demand a New Callsheet
Rising acquisition costs and shrinking margins must reshape how investors and lenders approach rental deals.
MEGAN CASTLETON, CONSTRUCTIVE CAPITAL
ATTOM’s latest annual “SingleFamily Rental Market” report, released in March 2026, confirmed what many private lenders and investors have been seeing for several quarters: Rental yields are tightening across much of the country, even as rents and wages continue to rise. On paper, that seems like a contradiction. In reality, investors are paying more to acquire and operate properties at a time when renters have less room in their budgets to absorb higher rents.
Although this shift is creating challenges, it does not mean opportunities are disappearing. It only means that investors who relied on rapid appreciation to make deals work now must evaluate deals more carefully, rethink where they buy, and pursue strategies that deliver value in different ways. And it means private lenders must adjust as well.
TODAY’S SCORE
As the ATTOM report lays out, rents are still rising in many markets, but they are not keeping pace with higher acquisition costs due to rising home prices.
From 2025 to 2026, median rents increased faster than home prices in 55% of the counties analyzed, underscoring that rent growth has remained positive over the past year. At the same time, acquisition costs have risen to record levels, with the national median home price reaching $360,000 in 2025. According to ATTOM’s “Q1 2026 U.S. Home Affordability Report,” that’s an 8% increase since first-quarter 2024.
But higher acquisition costs do not explain the full picture. In many markets, property taxes and insurance premiums have also increased dramatically during the past few years. According to a recent analysis by the National Association of Realtors, homeowners’ insurance alone increased by roughly 41% between 2019 and 2024, although there have been reports of premiums rising as much as 300% in some markets. Federal Reserve data shows the average homeowner spent about $2,300 a year on insurance in 2024, or roughly 2.7% of median household income, up from about 2% before the pandemic. The economy and a softer labor market are also playing a role. Recent U.S.
Labor reports have alternated between positive and negative job growth monthto-month. A recent Gallup poll found that in the fourth-quarter of 2025, 49% of U.S. workers reported struggling in their lives, up from 43% in the first quarter of 2022, while only 28% believed it’s a good time to find a quality job, down from 70% in the second quarter of 2022. According to the U.S. Bureau of Labor Statistics, the Consumer Price Index increased 3.3% over the 12 months ending in March 2026, while gasoline prices rose 18.9% over the same period. Federal Reserve policymakers expect full-year 2026 inflation to moderate to 2.7%.
Generally, rising operating costs are having the most impact on the DSCR market because they directly reduce cash flow. Higher acquisition costs remain a key constraint, particularly in markets where home prices have surged, while slower rent growth is not the primary driver of yield compression in most markets.
What is clear is that the rental market is shifting. But in some ways, it’s also becoming normalized after a period of extraordinary growth following the COVID pandemic. Prior to the pandemic, U.S. home prices increased at an annual rate of about 5-6%, according to Federal Housing Finance Agency House Price Index (HPI) data. By comparison, home prices grew by 18.02% year over year in 2021 and 10.9% in 2022 before moderating in subsequent years. In 2025, the HPI rose only by 3.37%.
Enormous home price gains created an environment where investors could often rely on appreciation to support the economics of an acquisition. Now that rental yields are tightening and appreciation has slowed, investors are taking a more disciplined approach to their acquisition strategies—focusing less on
short-term appreciation and more on the fundamentals of each deal.
SET YOUR PITCH STRATEGY
When rental yields tighten, how financing is structured becomes far more important to whether a transaction works. Gross rental yield is based on rent relative to property value, while net rental yield—which accounts for operating expenses—is typically what lenders focus on when evaluating deal performance. One area where this is clearly visible is in how lenders approach debt service coverage ratio thresholds. Structuring loan-to-value requirements around a 1.0x DSCR, calculated as net operating income divided by total debt service, has become the reasonable baseline expectation. Lower ratios, such as 0.65x or 0.75x that were common before COVID, have become a much bigger ask.
Historically, DSCR loans were often underwritten below 1.0, but today most lenders are looking for deals that can support at or above a 1.0, with stronger deals trending closer to 1.1 or higher. This shift is closely tied to rental yields. Before the pandemic, ATTOM reported average gross rental yields of 8.6% in 2019 and 8.4% in 2020. At the time, lenders were often comfortable underwriting below 1.0 DSCR.
Liquidity has also taken on greater importance. When borrowers bring additional reserves to a transaction, it can offset tighter DSCR calculations and provide lenders with a clearer picture of the borrower’s ability to support the property. Historically, lenders were often comfortable with more limited reserves when yields were higher—often a few months of payments. Today, many
lenders expect borrowers to carry six to 12 months of payments to absorb fluctuations in operating expenses.
Payment structures are also changing. Interest-only terms are one tool lenders are using to help investors qualify for financing while maintaining the leverage they seek. By lowering the initial payment burden, these structures can make it easier for investors to get into a deal and stabilize a property, particularly in situations involving tenant turnover. Word to the wise: interestonly payments can create increased risk on payoff or refinance. Consider carefully how well the exit plan pencils out.
Local tax policy can also influence how both lenders and investors evaluate rental opportunities. In some jurisdictions, tax abatement programs can temporarily
reduce property tax expenses during the early years of ownership. This matters because many investors refinance within the first three to five years of a loan. If a property is covered by a longer tax abatement period, investors may be able to refinance before higher tax costs materially affect the deal.
Tax abatement programs can vary significantly from one county or city to the next, but they are fairly common. According to Good Jobs First, a nonprofit research and policy organization, about 53% of the 801 jurisdictions it examined disclosed tax abatement programs, although the true number is likely higher. They are widely used as economic development tools, particularly in urban and redevelopment-focused markets.
Altogether, these factors have raised the bar for what constitutes a viable DSCR loan. DSCR volume continues to grow, but the composition of deals is shifting. In most cases, deals now need to underwrite at or above a 1.0 times DSCR using more conservative rent and expense assumptions and stronger borrower liquidity. Lower DSCR structures are still possible, but they typically require compensating factors such as lower leverage and higher reserves.
HOW HIT IT OUT OF THE PARK
Tightening rental yields are also changing how investors finance deals and where they are finding the strongest opportunities, particularly through a combination of DSCR and residential transition loan strategies.
Although DSCR loan volume continues to grow, tighter yields and rising operating costs are making marginal deals harder to justify, particularly on older properties. Rather than moving away from DSCR loans, some investors are using residential transition loans (RTLs)—short-term financing designed to fund property improvements before transitioning into longer-term permanent financing—to improve a property’s cash flow profile before moving into DSCR financing at a later date. RTLs allow lenders to qualify a property quickly while giving the investor time to complete upgrades that can meaningfully improve rents, tenant quality, and overall property performance.
We are also seeing growing interest among investors in infill properties where surrounding homes have already
been improved. According to the Urban Institute, an estimated 2.2 million vacant single-family homes nationwide could be rehabilitated, while more than 330,000 occupied single-family rental homes are considered severely inadequate. For investors, these numbers point to significant opportunities to acquire and update aging housing stock in markets where even modest improvements can help a property’s competitive position and cash flow profile.
Another aspect of RTL investing is the role it plays in extending the useful life of aging housing stock. Many communities across the country have a significant number of homes that are older but still structurally viable. Renovating those properties helps address housing supply challenges in markets where new construction remains limited.
Finally, higher acquisition costs are pushing investors to look beyond traditionally expensive coastal markets. The Midwest and other lower-cost regions are attracting growing interest because the underlying deal math is more favorable: Lower entry prices relative to rents create more room for deals to work even under tighter yield conditions.
TOP PLAYERS
As the rental market evolves, the type of lending partner that real estate investors choose is more important than ever. For instance, in DSCR lending, experienced lenders often consider a range of factors beyond the ratio itself, including the borrower’s credit profile, liquidity, and experience managing rental properties. In some cases, a FICO exception can be made, so the DSCR pencils. Experienced leaders understand that compensating factors can offset a weaker ratio, and structuring around those is often what separates a deal that closes from a missed opportunity.
A growing demand for more specialized financing options is also why many investors are moving away from independent mortgage banks that primarily focus on owneroccupied loans and typically do not offer many BPL options. According to a February 2026 report from the American Enterprise Institute, about 40% of small-investor purchases between 2018 and 2024 were financed through Fannie Mae and Freddie Mac. However, private lenders accounted for roughly 68% of conventional investor loan originations below the conforming loan limit in 2024, which indicates strong demand for financing outside traditional IMB channels. For certain acquisitions, many investors will transition a fix-and-flip acquisition into a long-term rental, yet many traditional IMBs are not equipped to accommodate this shift.
Enormous home price gains let investors rely on appreciation. Now, tighter yields are forcing a return to fundamentals.””
At the same time, more IMBs are entering the investor space, which means private lenders must be able to match the speed and technology experience that IMB borrowers are used to. Investors increasingly expect an efficient process, faster approvals, and fewer operational bottlenecks from their financing partner. Increasingly, well-capitalized private lenders are using offshore resources, AI, and other tools to lower underwriting costs, offer more competitive pricing, and compete in ways that IMBs and smaller lenders often cannot.
Product depth also matters. Because many conventional lenders do not even offer RTL products, large private lenders that offer both DSCR and RTL financing are often better positioned to accommodate different investment strategies. They may also offer blanket loans, portfolio loans, and cross-collateralized financing structures, and are often better equipped to finance deals involving trusts, layered entities, and other legally complex borrower structures. Although many conventional lenders avoid such transactions because they create extra complexity, many sophisticated private lenders have the legal resources to handle them.
As more investors adapt to tighter yields and more selective underwriting environments, lenders must also adapt by focusing more closely on product fit, operational efficiency,
and borrowers’ ability to execute their investment strategy. In compressed market environments, lenders should focus on three areas: technology that reduces operational cost, speed, and credit risk challenges; increasing innovative product offerings; and capitalizing on opportunities disguised as market challenges.
Castleton is the chief credit officer at Constructive Capital, a wholesale capital provider for mortgage brokers and real estate investors, where she oversees credit policy and drives innovation to ensure sound, efficient lending practices. She has nearly three decades of expertise in credit, risk management, and fraud prevention across both commercial and residential markets. She specializes in building and scaling mortgage operations and implementing risk-based strategies that focus on maintaining credit and operational integrity.
MEGAN CASTLETON
Megan
Build in the Buffer
The right interest reserve structure can help your next construction loan flourish.
JESSE GOLDBERG, PARK PLACE FINANCE
In an effort to find creative ways to mitigate risk on ground-up construction (GUC) projects while offering benefits to borrowers, business-purpose lenders deploy a variety of strategies. One of the industry’s not-so-secret tools is financed interest reserves.
Interest reserves, which have long been used in commercial and construction banking, offer a unique balance of protection for lenders against payment disruptions and give borrowers the breathing room needed to execute their projects. Although nonDutch (non-interest-bearing) construction holdbacks have reduced the initial interest payment burden for most GUC loans, borrowers may still be hesitant when they see their unpaid principal balance (UPB) grow and monthly payments climb well above their initial amount.
With Dutch (interest-bearing) structures, the interest reserve is included in the UPB from Day One, meaning the borrower pays interest on the full balance immediately. This accelerates depletion of the reserved funds, so calculations may need to be adjusted to ensure interest payments are covered for the full loan term. See the sidebar for an example that demonstrates
the difference between how Dutch and non-Dutch loans treat interest reserve.
KEEP THE PROJECT ALIVE
Interest reserves work on multiple fronts to protect both the lender and the borrower.
MONEY IN, LEVERAGE DOWN. At their core, construction loans are originated based on loan-to-cost (LTC) and loanto-completed-value (LTARV). Although interest payments are a cost associated with the loan, they do not create direct real property improvement value. By deferring interest payments to payoff, every dollar the investor spends can instead go directly into property improvements.
This dynamic pushes LTV leverage down while progressing the project toward its as-completed value. Typically, this occurs when the value added to the real property can be supported by an appraisal. Some soft costs, such as permitting expenses, may also contribute value, but unless those items are transferable or desirable to a future buyer, they may ultimately add little or no realizable value.
Although projects with ongoing interest payments can still progress, increasing monthly payment obligations may slow construction timelines. Any direct correlation to default risk is circumstantial, but a lender arguably is in a stronger recourse position with a progressing project carrying deferred payments rather than with a stalled project attempting to stay current.
REDUCED RISK OF FPD/EPD. Regardless of business strategy—whether balance sheet lending, secondary market execution, REIT structures, or otherwise—loan performance is commonly measured through First Payment Defaults (FPD) and Early Payment Defaults (EPD), which typically cover the first 90 days following origination.
When establishing an interest reserve policy, it is important to keep these guardrails in mind and establish minimum standards that reduce risk exposure. Interest reserves can be a powerful tool for mitigating portfolio-wide risk, especially in scenarios where collateral strength or borrower credit history may be thin during underwriting review.
If you want to further compound risk mitigation with interest reserves on construction loans, consider implementing a covenant requiring construction commencement within 90 days. This helps ensure forward project movement and continued reduction in leverage.
WHEN RESERVES DON’T WORK
Interest reserves are a great option for both borrowers and lenders, but they won’t always work into the scenario. Here are a couple of the most common situations where financing interest reserves may limit your lending ability.
LEVERAGE LIMITATIONS. When limiters such as LTARV or iLTC (initial loan-to-cost) prevent the loan amount from increasing, the financed interest reserve will have to be fronted by the borrower, resulting in higher cash-to-close.
PURCHASE TRANSACTIONS. Depending on how interest reserves factor into loan amount calculations and leverage metrics such as LTC, financed interest reserves on purchase loans may also increase cash-to-close requirements, creating a potential barrier to entry for borrowers.
TWO WAYS TO GROW
One of the more difficult questions for lenders is whether interest reserves should be structured as Dutch or nonDutch. The seemingly obvious answer
DUTCH VS. NON-DUTCH
The following example illustrates how Dutch and non-Dutch structures treat the same interest reserve differently.
Initial Loan Amount // $100K
Construction Holdback // $500K
Interest Rate // 9.99%
Interest Reserve // $50K/11 mos.
Non-Dutch UPB and payment // $100K @ $832.50
Dutch UPB and payment // $150K @ $1,248.75
For this case, the net interest is 33% higher with Dutch interest reserves.
FORMULA
The calculation evolves from lender to lender, depending on the lender’s risk threshold. Although there are different variations, the following calculation is widely adopted while being customizable as needed.
Total Interest Carry=
[(0.65 x C) + L0](r/12)(T-1)
C = Construction Holdback Amount
L0 = Initial Loan Amount
r = Annual Interest Rate
T = Loan Term in Months
The primary variable that changes across lenders is the “65%” assumption. The purpose of this portion of the calculation is to estimate the total construction exposure over the life of the loan and ensure there is neither an overage nor shortage at maturity. 65% tends to be the sweet spot for balancing exposure.
would be to structure them as Dutch in order to capture the financed amount as day-one UPB. However, the market has increasingly trended toward non-Dutch structures to remain competitive, putting pressure on lenders to follow suit.
Although economics are a major factor, loan servicing implications are equally important. Because they are immediately accrued into the UPB, Dutch reserves typically do not have special servicing considerations. NonDutch reserves, however, require more careful thought and coordination. The following are some of the top questions lenders should ask servicing partners to ensure payments are made on time.
WHO WILL CONTROL THE MONTHLY INTEREST DISBURSEMENTS? Depending on the servicer, monthly interest reserve disbursements may be managed by either
the servicer or the lender. For smaller lenders who lack dedicated accounting staff, self-managing this process requires careful attention to ensure the appropriate interest is charged and payments are made on time.
WHO HOLDS THE FUNDS? Interest reserves may be deposited into escrow, held by the lender until the payment is due, or held by the servicer through an approved account. For lenders relying on warehouse lines, immediate fund commitment may be a disadvantage because warehouse lines begin charging interest at disbursement, making Dutch interest a more attractive option.
CULTIVATE FLEXIBILITY
Creating optionality for borrowers through pricing adjustments or rate alternatives can be advantageous. If the average loan loses 1525 basis points from servicing strip income,
rate add-ons can offset that reduction while allowing borrowers to choose between Dutch and non-Dutch structures.
When evaluating profitability under these structures, consider that construction projects typically draw between 11–13% of the total budget, on average, at each stage—a rough estimate derived from the typical phases of construction from permits through final draw. Depending on the overall project size, the cumulative effect on total collected interest income can be meaningful.
As a more illustrative example, consider a $1,000,000 ground-up construction loan with a 10.99% note rate, a 12-month term, and a $600,000 construction holdback.
Under a non-Dutch structure, interest is charged only on the disbursed principal balance. If the borrower begins with a $400,000 initial advance and draws construction funds incrementally, the
lender’s average outstanding balance during the term may only approximate $790,000–$825,000, despite the total committed exposure being $1,000,000. In this scenario, the lender may collect roughly $87,000–$91,000 in total interest over the life of the loan rather than the $109,900 implied by a fully funded balance for 12 months.
Conversely, under a Dutch structure where a financed interest reserve is added into the UPB at origination, the lender captures a higher Day 1 balance and correspondingly higher servicing income. However, this comes at the expense of increased borrower carry costs and accelerated reserve depletion, which may create friction for rate-sensitive borrowers or projects with extended timelines.
This is where optionality becomes valuable. A lender may choose to offer a lower-rate non-Dutch option with
reduced monthly carrying costs and improved borrower cash flow flexibility, or a slightly higher-rate Dutch option designed to offset servicing compression and improve retained yield.
For example, if servicing economics compress net yield by 15-25 basis points annually, a modest pricing adjustment of 25-50 basis points on a non-Dutch structure may fully offset the reduction yet still remain attractive to borrowers compared to competitors requiring full Dutch accruals.
Ultimately, interest reserves are not simply an accounting mechanism. When structured thoughtfully, they become a strategic risk management and product design tool capable of improving loan performance, preserving project momentum, and balancing profitability with borrower flexibility.
JESSE GOLDBERG
Jesse Goldberg brings over a decade of expertise in private lending to his role as chief operating officer at Park Place Finance. His background spans sales, leadership, process improvement, and business scaling. Goldberg specializes in ground-up construction lending and building high-efficiency operational systems. He is known for his focus on innovation and execution, consistently enhancing client service and driving growth through strategic process optimization.
Claim Your Own Pond
The
best lending model isn’t what everyone else is doing; it’s one rightsized for how you want to swim.
SHAYE WALI, BASELINE
At some point in your lending career, you will be tempted to grow just because you can. An unexpected deal lands in your lap, capital is available, and the logic seems airtight. More loans mean more revenue. But before you hire another underwriter or raise another round, consider the framework that Abbas Jessa, founder of Wentwood Capital, has built his entire business around. It challenges almost every conventional instinct about what a successful lending operation should look like.
Wentwood is an investment firm with a lending component.
That’s because everything the company does is engineered around lessons Jessa learned while managing over $500 million in defaulted paper across more than 3,000 loans. He saw “volume chasing” lead to businesses serving their own infrastructure and experiencing decreasing returns despite more loan count, more capital, and impressively structured operations. Each element fed the volume machine, but in the end, volume didn’t keep the ship afloat.
RIGHTSIZE YOUR BUSINESS MODEL
Jessa lost all appetite for that structure and redefined the business model into
something sustainable for him. Framing his business as an investment firm that happens to earn returns through lending establishes the right constraints from the start.
Many business models genuinely benefit from larger volume when execution discipline remains intact, leading to improved pricing power, diversification, and operational leverage. Jessa’s model will not be right for everyone. The takeaway is to find, or create, the model that will fundamentally work for your goals.
To rightsize your model, ask questions about the following areas:
NOW AND LATER. What type of dayto-day business do you want to operate now? How about five years from now?
YOUR DEFINITION OF SUCCESS. Are you building for maximum volume, maximum margins, lifestyle flexibility, long-term durability, or something else?
YOUR ROLE AS A LEADER. Does your current growth strategy support your preferred role as a leader?
YOUR MOTIVATION FOR GROWTH. Are you expanding because the economics justify it, or because the industry rewards visible scale?
SERIES NOTE
This series will explore how industry leaders have operationally optimized their businesses to fit them—their strengths, weaknesses, and what they really want out of their careers.
“Right sizing” is what happens when all of this comes together.
YOUR ENERGY. What parts of the business feel energizing versus operationally draining?
GOAL ACHIEVEMENT. Can I achieve “enough” with this business model to reach my business and personal goals?
RIGHTSIZE YOUR PRODUCTS
Wentwood focuses on second liens, crosscollateralized structures, lower-creditscore borrowers, and loans with legal or asset management complexity. It targets 60-65% LTV in nonjudicial markets.
By concentrating on products that require additional judgment, Wentwood earns a premium and has less market competition. The trade-off is that complexity does not scale easily. Jessa cannot hire his way to expertise in second liens, so his staff are trained internally, and onboarding is much slower. Loans also require a more hands-on approach and limited (if
any) automated judgment. The willing investor pool is smaller, and there are few securitization opportunities.
This still works for the company because that complexity and risk is priced accordingly, and the product line fits the goals of the business model.
To rightsize your products, consider where your team’s expertise and judgment are genuinely strong, and where your firm possess a competitive advantage others avoid. Be honest about how much operational complexity your infrastructure can realistically absorb, and whether additional scale would improve or dilute underwriting
quality. Finally ensure your products align with your capital structure.
RIGHTSIZE YOUR CAPITAL
Wentwood keeps its capital base longterm and closed, which means Jessa feels less deployment pressure and can focus on judgment calls between “good” deals and “great” ones, growing the book organically by reinvesting proceeds.
This capital strategy matches both the company’s business model and its product line. By avoiding additional leverage or equity partners with preferred returns, Jessa stays focused on finding the best deals for a
closed group of investors. There are certainly liquidity constraints and growth ceilings, but he views those as acceptable trade-offs.
To rightsize your capital, consider whether your funding sources align with your investment horizon and risk tolerance, and whether additional capital would genuinely improve outcomes or simply increase expectations. Be clear about how much deployment pressure you are comfortable with and whether your current structure gives you the flexibility you need to pass on marginal deals.
RIGHTSIZE YOUR OPERATIONAL STRUCTURE
One of the defining features of Wentwood’s business is how closely its origination, underwriting, servicing, and asset management functions are connected. That integration ensures the people originating loans understand what happens when those loans perform as expected—or when they don’t.
By refusing to separate these functions, Jessa ensures his origination team never gets too volume-hungry at the expense of the service team inheriting the consequences, or that underwriters get too picky and starve loan officers of solid deals. This low-silo environment serves as a structural guardrail to ensure everyone keeps the firm’s return a top priority.
To rightsize your operational structure, consider whether your teams are incentivized toward the same business outcome; where silos may be creating friction, misalignment, or unnecessary risk; and the checks and balances that must be added for safe growth.
RIGHTSIZE YOUR INFRASTRUCTURE
Jessa makes an intentional decision to wait until a genuine bottleneck appears in
his business before acting. This requires a willingness to feel real operational discomfort. Through trial and error, Jessa has discovered that many infrastructure issues remain hidden and the business gets bigger without getting better if he hires the moment things get slightly uncomfortable.
Going into any infrastructure decision, Jessa has a clearly defined threshold: He is willing to scale process, data management, and administrative coordination but not credit judgment or relationship management. And any optimization must optimize for net results.
That means tax planning matters as much as origination volume, and servicing efficiency is as important as deal flow. In most cases, infrastructure upgrades look like use of offshore professionals, structured processes, and AI-enabled workflows. Only when those won’t solve the issue will he look at a permanent hire.
To rightsize your infrastructure, distinguish between bottlenecks that are temporary versus structural. Before adding headcount, ask whether process improvements could eliminate the need entirely, and which functions genuinely require human judgment versus those that don’t. Finally, consider not just whether an infrastructure will increase profitability, but by how much—and whether that change will scale fixed costs faster than it delivers operational efficiency.
THE UNCONVENTIONAL CONCLUSION
One final big-picture question will help ensure you’ve set the right parameters for your business: What is my risk tolerance for change or transition in uncertain markets?
A higher risk tolerance naturally creates more flexibility across these trade-offs. You’re more comfortable with needing to make
big operational and model changes based on changes in your environment and likely have a greater willingness to fight through potential instability. These are lenders geared toward a fast-paced, volume-centric model.
If stability is the name of the game, slow growth and careful scale are likely to be your North Star. And to be clear, “rightsized” doesn’t necessarily mean small; it means strategically aligned. By staying selective, keeping costs lean, integrating functions tightly, and measuring everything against net results, Jessa has built a business that performs, endures, and one he’s passionate about leading even as it grows.
The private lending industry rarely awards discipline with much more than a whisper, but it will punish overextension at earsplitting volume. Finding the “right size” growth goal for your business ensures that all elements are aligned with where you really want to be.
SHAYE WALI
Shaye Wali is the founder and CEO of Baseline, a software platform revolutionizing the private lending industry. Before starting Baseline, Wali worked at Morgan Stanley as a sales trader on the fixed-income team. He graduated from Tulane University, where he served as the captain of the varsity men’s tennis team.
YOUR BEST SALES REP NEVER SLEEPS
CONTENT THAT IS ALWAYS ON THE CLOCK
In private lending, trust is everything. And it’s built long before a borrower or capital partner ever reaches out to you. It's earned through the expertise you share, the authority you establish, and the story you tell about who you are.
Interrobang Solutions writes and edits content that helps private lenders stand out, build trust, and stay visible 24/7:
Thought leadership articles that establish your authority
White papers and case studies that demonstrate your track record
Company origin stories that humanize your brand
Website copy that converts curious visitors into real conversations
Before anything ever goes out the door, we ensure your content is polished, professional, and ready to represent you.
We write it. We refine it. You reap the results.
Let's talk about what great content can do for your business.
CONTACT US
Protect the Plan with Prepayment Penalties
Early payoffs cost more than most lenders realize, and the solution starts before the loan closes.
ALAN DETTELBACH, CV3 FINANCIAL SERVICES
You price risk, allocate capital, and build a return model around a specific timeline. When a borrower repays early, however, while you may recover the principal, you won’t recover the full return you and the borrower agreed was a fair exchange.
Especially on shorter-term loans, properly structured prepayment terms are part of the commercial bargain. They help you preserve yield and protect against costs that are easy to overlook but nonetheless real.
Unrecovered origination expenses are one example. Broker compensation, legal fees, underwriting, appraisal, and technology costs are all priced to amortize over the expected life of the loan. Early payoff leaves these costs partially unrecovered.
Capital drag is another. The 30 to 90 days (sometimes longer) between payoff and redeployment is dead time during which returned principal earns money market rates instead of loan-coupon rates.
Early payoffs also create warehouse and leverage friction. Paydowns to warehouse counterparties trigger borrowing-base recalculations and, in some cases, breakage costs on matched funding.
Secondary-market recapture is also a real exposure for lenders operating under forward-flow agreements, which often claw back premium or impose early-payoff penalties on the originator when a loan pays within the first three to six months. Enforceability of prepayment penalties can vary dramatically depending on borrower purpose, collateral type, state law, and how a court characterizes the transaction. If you lend nationwide, especially on one-to-four-unit residential collateral, you cannot assume that a business-purpose label alone will always carry the day.
Your job is to protect the bargain before the loan closes.
THE ECONOMICS
When you make a private loan, you commit capital for a defined term. You underwrite the borrower, evaluate the asset, negotiate the rate, and forecast your return. If the borrower pays off in two months instead of 12, your expected yield is materially reduced.
Consider the following scenarios for a $50 million portfolio, with 100 loans at $500,000, a 12-month term, a 10% interest rate, and a 60-day capital drag between
payoff and redeployment. All estimates in the scenarios are approximate.
SCENARIO 1 (CONTROL, ALL LOANS RUN FULL TERM). The gross interest income is $5 million.
SCENARIO 2 (10% PREPAY AT MONTH 4, NO PENALTY). The lender collects about four months of interest on those 10 loans ($167,000) instead of 12 months ($500,000), loses $333,000, plus $83,000 in drag on redeployed capital. The net hit is $416,000, about 8% of expected revenue.
SCENARIO 3 (10% PREPAY, 6-MONTH MINIMUM INTEREST PENALTY). The penalty recovers the missing two months ($83,000) plus offsets drag. The hit shrinks to roughly $0–$50,000.
SCENARIO 4 (5% PREPAY BECAUSE PENALTY DISCOURAGES REFISOF-CONVENIENCE). This scenario features fewer disruptions, and they are mitigated when they occur.
Compounded over two, five, and 10 years, Scenario 2 is the one that forces a lender to either raise rates, tighten leverage, or shrink the book to keep returns whole. That’s the policy point worth making: Penalty bans don’t just shift money from lender to borrower; they shrink the pool of capital available to the next borrower.
A borrower who pays off in two months instead of 12 likely creates several problems.
LOST INTEREST INCOME. The return you modeled assumed a certain loan life. An early exit compresses that timeline and may render the original deal mechanics unviable.
CAPITAL DRAG. In private lending, capital drag is the rule, not the exception, for two reasons. First, business-purpose loans almost always pay off in a lump sum at exit—through sale or refinance—rather than amortizing, so every payoff is a
Getting repaid early may look like a win, but unless you protected the economics of the deal, you have not received the full return.”
redeployment event. Second, origination pipelines are lumpy: A lender rarely has a fully underwritten, ready-to-fund loan waiting on the shelf the day a payoff hits. The industry rule of thumb is 30 to 90 days of cash drag between payoff and redeployment—longer if the lender is fundstructured and has to call capital or wait on warehouse advance mechanics. Scheduled maturity payoffs have drag too, but at least they are forecastable—the lender can line up the next deal against a known maturity date. Early payoffs are unscheduled, which is what makes drag worse, not just present.
UNRECOVERED ORIGINATION COSTS. Broker compensation, legal fees, underwriting, appraisal, and operational expenses are all priced to be recovered over the loan’s expected life, whether held on balance sheet or sold into the secondary market. Early payoff leaves those costs partially or fully unrecovered.
LOST RATE ADVANTAGE. If you priced the deal into a specific rate environment, an early payoff means you may reenter the market under whatever conditions exist at that moment, which may be less favorable.
A prepayment penalty helps mitigate the disruption. Courts have generally recognized these provisions as a reasonable pre-estimate of damages that compensates the lender for the
prepayment option granted to the borrower and protects the matched economics of the underlying funding.
DIFFERENT AIRSPACE
Private lenders finance investors, developers, and entrepreneurs across a wide range of business-purpose transactions. The purpose and structure of these loans make them fundamentally distinct from conventional consumer mortgages with 30-year terms secured by owner-occupied homes. Business-purpose borrowers are more sophisticated. They often borrow through entities, are represented by counsel, and are willing to pay for speed, flexibility, and access to capital.
When your loan documents clearly disclose the prepayment terms and the borrower knowingly agrees to them, the prepayment premium becomes part of the negotiated economics of the transaction, closer to a contract buyout than a penalty.
Private lenders should not be apologetic about reasonable prepayment premiums. These provisions help keep capital available. When you can rely on the economics you underwrite, you can price loans more efficiently, sell them with greater confidence, and recycle capital into more projects. When prepayment premiums are uncertain or easily avoided, that uncertainty gets priced
somewhere else, often through higher rates, tighter leverage, or reduced credit availability.
Reasonable prepayment protection benefits the market because it supports predictability. Borrowers want speed and certainty. Investors want yield and enforceability. You sit between those interests. Prepayment terms, when properly structured and disclosed, help align them.
STRUCTURE THE RUNWAY
A strong prepayment strategy starts with clarity and is defensible against the economics of the loan. Documents should state exactly when the premium applies, how it is calculated, whether a minimum interest requirement exists, and whether exceptions exist. Ambiguity is your enemy.
Common structures include a minimum interest period of three, six, or 12 months;
a fixed percentage of the principal balance if prepaid within a defined period; a step-down structure that reduces over time; and a yield-maintenance or make-whole formula for larger or more sophisticated transactions.
For many private lenders, minimum interest is the cleanest approach. Borrowers who repay early still owe a defined amount of interest—simple to explain and administer.
That being said, the best structure is fact-specific and based on loan type, borrower profile, and state risk:
FIX-AND-FLIP LOANS. A shorter minimum interest period is commercially reasonable because the borrower’s business plan depends on a quick exit.
BRIDGE LOANS. A step-down structure balances lender protection with borrower flexibility.
LARGER COMMERCIAL TRANSACTIONS. A yield-maintenance formula is usually appropriate.
The key is to match the provision to the economics of the deal rather than copying language from the last loan.
CREATE THE RECORD
Never hide the prepayment penalty.
A borrower who discovers the premium at payoff is more likely to dispute it. A borrower who understands the terms at the outset accepts it as part of the economics of the transaction. That is why disclosure is both a compliance issue and a relationship issue.
Put it in the term sheet. Repeat it in the loan agreement. Make sure the borrower acknowledges it, ideally by
initialing it. Where state law requires conspicuous disclosure or affirmative consent, build that into your closing process. Consider including it as standard practice across all your loans regardless of specific regulatory requirements.
Clear communication reduces borrower friction and strengthens your enforcement position.
TURBULENCE RISK
The biggest enforcement risk is whether the courts could recharacterize the loan as a residential mortgage.
You may call the loan commercial. The borrower may sign a business-purpose affidavit. The loan agreement may state that proceeds are for investment or business use. But if the facts suggest otherwise, a court may treat the loan as residential or consumer.
Some states restrict or prohibit prepayment penalties on certain residential mortgage loans. Depending on the jurisdiction, the analysis may turn on consumer purpose, the number of residential units securing the loan, borrower type, or how proceeds are used.
Your factual record matters as much as your contract language.
Build a file that clearly supports the commercial nature of the transaction. That means collecting and retaining businesspurpose certifications, entity formation documents, operating agreements or corporate authority documents, borrower experience summaries, use-of-proceeds statements, draw schedules for rehab or construction loans, leases, business plans or investment documentation, non-owner-occupancy certifications,
CHOICE OF LAW IS A TOOL, NOT A SHIELD
If you lend across multiple states, a choice-of-law clause can give you one predictable legal framework governing your prepayment premiums, default provisions, remedies, and economic terms. For California-based lenders, California law supports party autonomy in qualifying commercial transactions over $250,000 that are not primarily consumer-purpose agreements.
But a choice-of-law clause does not eliminate all risk. Courts often enforce these provisions when the chosen state has a substantial relationship to the parties or transaction and applying that law does not violate a fundamental public policy of another state. If the property is in a state that draws less distinction between business-purpose and consumer loans, a court may still question whether enforcing the prepayment clause conflicts with local public policy.
Use choice-of-law provisions, but do not treat enforceability as automatic. In states where business-purpose loans secured by residential real property occupy a legal gray area, local counsel and jurisdiction-specific document review are not optional.
and email correspondence confirming the borrower’s investment intent.
Ask yourself whether a future court reading the file would conclude without hesitation that this was a commercial transaction, that the borrower knew what they were signing, and that the prepayment premium was part of the agreed economics. If the answer is yes, you are better positioned going into state-specific variances.
CHECK THE CONTROL TOWER
State-by-state variation affects pricing, documentation, secondary-market confidence, and enforcement strategy.
Some states present relatively low risk for clearly documented business-purpose loans. For example, states that limit prepayment restrictions to consumerpurpose credit generally leave more room to enforce commercial prepayment terms. In those jurisdictions, your main risk is usually whether the loan could be recharacterized as consumer rather than business-purpose.
Other states require more caution. While not exhaustive, Ohio, Pennsylvania, and Rhode Island are examples of various types of residential mortgage interpretations with potentially negative impacts on business-purpose loans. In Ohio, the
law includes restrictions for certain residential mortgages, including limits on prepayment fees after specific time periods and prior caps. If a court treats the loan as a residential mortgage under the relevant statute, your prepayment premium may be capped or eliminated.
Pennsylvania’s residential mortgage framework focuses on loans secured by property containing two or fewer units, and some decisions have applied residential prepayment restrictions even in business-purpose contexts. That does not mean every business-purpose private loan is prohibited from carrying a prepayment premium, but factual records need to be especially strong and specific.
Rhode Island has limiting statutes that apply to loans secured by residential real estate with dwelling houses of not more than four units. Depending on whether the loan is purchase-money or nonpurchase-money, the law may impose specific limits, disclosure requirements, consent requirements, and timing restrictions. In states like Rhode Island, compliance with the local framework
may be more important than relying solely on your governing-law clause.
WHAT THIS MEANS FOR YOU
Prepayment premiums are a core portfolio-management tool, not boilerplate and not a borrower punishment.
They protect yield, support capital planning, and reinforce the commercial bargain. But they must be drafted, disclosed, and documented with care.
Four factors establish the strongest enforcement position: clear contract language, a valid governing-law clause, strong business-purpose documentation, and state-specific legal awareness.
Getting repaid early may look like a win, but unless you protected the economics of the deal, you have not received the full return the borrower promised to pay in exchange for your speed, flexibility, and higher risk tolerance. Prepayment clauses help ensure that when the borrower exits early, you still receive the benefit of the bargain you made.
and general counsel at CV3
Services, where he leads the company’s legal strategy, regulatory compliance, securitization, and corporate governance initiatives. With more than 30 years of experience advising Fortune 500 companies and high-growth financial services firms, Dettelbach is recognized for building scalable legal and compliance frameworks that support innovation and growth in private lending. Under his leadership, CV3 has expanded nationally while maintaining a strong culture of transparency, risk management, and operational excellence. He earned his J.D. from Loyola Law School and is an active member of the California State Bar.
ALAN DETTELBACH
Alan Dettelbach is the executive vice president
Financial
Housing Bill Targets Corporate Home Buying
Broad bipartisan support has pushed landmark legislation to the finish line, but most private lenders and their borrowers are unlikely to feel its effects.
MATTHEW GUNTER, CARDINAL CAPITAL GROUP
The U.S. Senate overwhelmingly approved S.2651, the 21st Century Road to Housing Act on March 12, closely mirroring a version the House previously passed. Although reconciliation is still required, the legislation has broad bipartisan support.
WHAT THE BILL WOULD DO
Section 901 of the bill, titled “Homeownership for Main Street America; Homes Are for People, Not Corporations,” would prohibit large institutional investors from purchasing single-family homes. Under the bill, a large institutional investor is any business entity engaged in investing in single-family homes that owns or controls 350 or more such properties after the act’s effective date. That threshold extends to affiliates and subsidiaries, not just a single entity. A single-family home is defined as a one- to two-unit residential structure.
The Treasury Department is authorized to refine these definitions through regulation, though the statutory thresholds themselves are not subject to change. Several exceptions would allow large institutional investors to continue
acquisitions. Permitted activity includes new construction or substantial renovation, build-to-rent or renovateto-rent programs subject to minimum renovation standards, rent-to-own programs, and REO acquisitions tied to foreclosure or workout agreements.
In some, though not all, of these scenarios, the investor must divest the property to an individual homeowner within seven years.
WHAT IT MEANS FOR PRIVATE LENDERS
Based on current language, AAPL members and their customers are unlikely to be materially affected. The 350 property threshold, combined with the broad exceptions, places most private lenders and their investor-borrowers well outside the scope of the restrictions.
AAPL and its Government Relations Committee have not taken an official position on this legislation given its limited impact on membership. The association remains attentive, however, to the broader implications of federal involvement in residential property ownership. Similar policies could emerge at the state level with significantly lower thresholds, which may warrant future engagement.
AAPL will continue monitoring developments and will update members should further action become necessary. Questions regarding the legislation or the Government Relations Committee may be directed to grc@aaplonline.com.
MATTHEW GUNTER
Matthew Gunter is the senior attorney with Cardinal Capital Group. His work focuses on corporate and loan-level compliance, closing matters, post-closing and foreclosure, asset management, and litigation. Gunter has been a member of AAPL’s Government Relations Committee since its inception. In his role, he serves the business-purpose mortgage lending community to bolster relationships with regulatory jurisdictions and to help ensure regulations over the industry are limited and reasonable.
Rent and Eviction Bills Advance in New England
Massachusetts and Connecticut proposals signal a regional shift in landlord-tenant policy.
KAT HUNGERFORD, AAPL
Two state-level proposals addressing rent regulation and eviction standards have advanced in Massachusetts and Connecticut. After reviewing them, the Government Relations Committee has elected to take a neutral position while continuing to monitor their downstream effects on private lending markets.
Massachusetts S.1447, An Act Enabling Cities and Towns to Stabilize Rents and Protect Tenants, would authorize municipalities to implement localized rent stabilization frameworks. These programs could include caps on annual rent increases, restrictions tied to tenant protections, and administrative oversight mechanisms. From a lending perspective, the introduction of rent controls at the local level introduces variability in asset performance. Aggressive stabilization policies may constrain income predictability for smaller-scale landlords and investor-borrowers. That said, the bill’s local-option structure avoids imposing a uniform statewide regime, preserving geographic flexibility in underwriting considerations.
Connecticut SB 257, An Act Concerning Evictions for Cause, would require landlords to ground evictions in defined “for cause” standards, limiting property
owners’ ability to terminate tenancies absent specific justifications. For private lenders, this shifts part of the risk calculus tied to borrower exit strategies. Extended tenant occupancy timelines can affect both collateral liquidity and servicing timelines. At the same time, clearer statutory standards may reduce litigation ambiguity, which has its own stabilizing effect in certain enforcement contexts.
The committee’s neutral position reflects a balancing exercise. Both bills engage politically salient objectives of tenant stability, housing affordability, and community continuity. Opposition in these contexts often invites unhelpful characterization, regardless of underlying policy merit. Yet unqualified support would ignore legitimate concerns around credit risk and operational friction for lenders and their borrowers.
Accordingly, the committee’s position prioritizes engagement. We will continue tracking implementation details, particularly at the municipal level in Massachusetts and through judicial interpretation in Connecticut, where practical effects often diverge from statutory intent. AAPL members operating in these jurisdictions should anticipate incremental
shifts in underwriting assumptions, especially regarding rental income durability and timelines associated with borrower remedies.
Kat Hungerford is a digital project manager, operations strategist, and executive editor of Private Lender, the official trade publication of the American Association of Private Lenders (AAPL).
Drawing on a background in journalism, marketing, and systems design, she integrates technical execution with editorial oversight to advance AAPL’s digital infrastructure, publications, and member-facing initiatives.
AAPL is the oldest and largest national organization representing the private lending profession, providing education, oversight, and advocacy to support industry best practices.
KAT HUNGERFORD
TMO Customers Grow Servicing UPB by 40%+
We analyzed YoY performance across our customers. The result was clear, TMO customers grow their servicing UPB 8x faster than the industry average.
Purpose-built for lenders
YoY UNPAID PRINCIPAL BALANCE (UPB) GROWTH
Servicing, origination, fund management, and construction in one platform.
Accuracy that compounds
Penny-perfect ledgers and automated compliance across every loan,
Scale without adding headcount
Automation handles high-volume admin so your team can focus on growth.
Trusted for enterprise scale
1,100+ lenders. $190B+ in loans. 5,230 annual hours saved. Built to grow with you.
Grow your portfolio with the platform proven to scale — Scan
FORWARD AT FULL VOLUME
TAsk Kevin Kim to describe himself. His answer bypasses the resume entirely.
he interview has been going for nearly an hour—law school, banking, the firm, COVID, his daughters, his father’s death—when AAPL asks the final question: If someone summed you up in one or a few words, and it actually fit, what would it be?
Kevin Kim doesn’t hesitate; his response lands too quickly to be self-analysis. It sounds more like witness testimony.
“’The loud Korean guy over there.’” He laughs. “’Oh yeah, you see that giant loud Korean guy over there?’ It’s always been that. For 43 years.”
Kim insists he was even louder in his youth, a proposition that initially sounds improbable. But he doesn’t know how to change the perception.
“It’s okay,” he says. “It’s served me well.”
The thread running through both Kim’s work and home life is a refusal to be anyone else. He is, depending on the moment, managing partner of the nation’s largest private lending law firm, a first-generation Korean-American kid who almost turned down the job that changed his life, and a man who will tell you with complete sincerity that the firm’s success was mostly luck and God’s grace.
TUNED BEFORE BIRTH
Kim’s parents immigrated in 1981. His father had a banking career. His grandfather was in banking too. And as the firstborn son in a line of firstborn sons, the family’s expectations for Kim’s career weren’t subtle: doctor, lawyer, engineer.
“Law school was pretty much a foregone conclusion by my second year of college,” Kim says. “I don’t know that I had another angle, to be honest with you.”
His father wasn’t opposed to law school— it was on the approved list. But he did want one detour first. Kim resisted.
“You bank, I’m not gonna be a banker.” His father didn’t let up the pressure, viewing banking less as a profession than a prerequisite: “The world of money … understanding how money works, how banks work … you start to understand how the world works.”
A couple years as a loan officer taught him the contours of the market. By the time he left for law school, he knew he wanted to stay in that world—but he didn’t yet know his specialization. Two years into law school, corporate and transactional coursework clicked. Litigation did not.
“I had it in my head that I wanted to be a securities attorney, working with
the government,” Kim said. An SEC internship reinforced the plan, with a job there penciled in after graduation. His graduation year? 2009.
STATIC
The next few years became a patchwork of whatever legal work the recession hadn’t destroyed: litigation in Koreatown, outsourced general counsel for small Korean community banks, and then a merger—which ended in a layoff. Then someone offered him contract work, part-time, at a small firm handling legal odds and ends for private lenders. He almost said no. He had student loans to pay off, and part-time contract work wasn’t
part of his envisioned career path. His mother disagreed. So did his girlfriend (now wife). Their combined assessment: “You’re being stupid. Drop your ego and try it.”
“They were right,” he says.
Kim already knew of the sector from his banking days refinancing fix-and-flips into long-term rental loans and other permanent takeout solutions for irregular deals. He found the whole thing curious, noticing private lenders were operating in spaces banks wouldn’t touch. And looking at the financial crisis, he thought he had a clearer read about what was coming.
“Me being a banker, knowing that banks are dead for the next 15 years, they’re not going
YOU’RE BEING STUPID. DROP YOUR EGO AND TRY IT.”
to be able to make loans anymore,” he remembers thinking. He could practically hear the air rushing into the void. Private lenders were positioned to fill it.
The part-time work became full-time, which led to running a department, and ultimately leading the firm. Kim was the firm’s fourth attorney. One of the founding partners retired, and Kim stepped up, though he immediately strips the story of any notion that the transition was the product of the meticulous planning typically associated with attorneys jockeying for position.
“It wasn’t really a well-planned-out situation.…I always joke that it was the luckiest happenstance kind of
luck situation,” he says. “By God’s grace, I was able to stick by it.”
The promotion was official. Credibility took longer.
DIALED IN
Private lenders have never been particularly impressed by resumes. Much of the industry’s first generation built businesses through instinct, tinkering, and grit. Authority is earned through spending years in conference rooms and on stages in front of people who’ve been making deals since you were a kid, and who will tell you, politely or otherwise, when they’re not buying what you’re selling.
For years, Kim and Nema Daghbandan, the firm’s third hire, were two young attorneys doing keynotes in front of audiences two decades older.
He can pinpoint the moment the industry stopped seeing a wet-behind-the-ears baby attorney and started seeing authority. His first daughter had been born a week or two earlier, and Kim wasn’t going to leave his wife to single parent a newborn. But Sieum Lim shoved him out the door, saying the two short days he’d be away were too important to the firm’s client base.
Kim and Daghbandan walked onstage for their keynote at the 2017 AAPL conference.
“The feeling in the room,” he says, pausing. “The reception was completely different. We had been struggling to gain market recognition, and that was the year we were like, oh man, people are really taking in what we’re putting out there, and they’re really respecting us as people.”
Then he laughed, adding: “Part of me also was kind of like, oh, I think now they recognize us as really adults. Because we have children now.”
Authority, it turns out, is easier to earn on a conference stage than in an office.
A STRONGER SIGNAL
Fortra’s operating philosophy was assembled the old-fashioned way: through trial, error, and occasional self-indictment.
Growing up in a traditional hierarchical Korean household, Kim inherited a management style before he ever supervised anyone, and like many, he mistook familiarity for universality.
“Managing others was a very similar approach to the way I was managed,” he recalls.
The problem was the blueprint worked on exactly one person: Kevin Kim. Somewhere between managing employees and raising daughters, his understanding of leadership changed.
“Life is too short to not create an environment where people love what they do,” he says now.
On the client side, the guiding principle is almost stubbornly simple: Don’t nickel and dime people.
“They’re paying us really good money. I’m negotiating with them what the fee’s gonna be, and I don’t want to nickel and dime them. Whether or not that means I lose a little bit of billing because of that, it’s okay.”
But the market was commoditizing, lenders were growing and lending across state lines, institutional money was arriving with higher compliance expectations. A boutique firm like Fortra that wanted to serve both the small operator in Ohio and the institutional player in New York had to find a way to deliver value without endless fee-chasing.
That tension was the catalyst for Lightning Docs, a cloud-based, automated loan document platform that Daghbandan now leads as a standalone company. What started as Fortra’s internal solution for drafting compliant loan packages across all 50 states has grown into the official loan document platform of the American Association of Private Lenders, processing more than 5,000 business-purpose loan transactions a month and trusted by more than 60 percent of the country’s top 50 private lenders.
“We’re not cheap,” Kim says of the firm’s broader positioning. “But we deliver highquality service at a very competitive price.”
Lightning Docs is the infrastructure that allows Fortra Law to keep that promise—it preserves institutional knowledge in a software package.
ON THE AIR
If Lightning Docs was built to sustain the industry, Kim’s podcast was designed to guard its memory. Lender Lounge exists because Kim hates watching good stories vanish, and in late 2020, the founder of Anchor Loans—an optometrist who became a pro poker player and built one of California’s biggest private lending companies—was retiring. To preserve Steve Pollack’s story, Kim recorded an interview. Then COVID hit and cleared the calendar, so Kim kept going with more stories.
“The angle was, hey, lenders want to know how [these people] got there. The stories behind the companies,” he says.
What Kim likes about the podcast is that it isn’t a sales or marketing vehicle.
“It’s not directly self-serving. There’s value to it; people get value out of it. And if I happen to be the secondary or tertiary beneficiary of that, great.”
His youngest daughter, now five, has confidently concluded that her father is a YouTuber. She’s got part of the picture right: the video, the talking, the large following. What she hasn’t processed yet is the context—when you have the mic, eventually you have to decide what to do with it.
AN UNPOPULAR FREQUENCY
The COVID-era market was in no mood for cautionary lectures, but Kim turned up the volume on a warning he’d been delivering for years: You need your own
balance sheet. Diversify your capital relationships. Don’t build your whole operation on a single line that can vanish the moment the market turns.
“A lot of the people who were buying loans were like, what are you doing, man? Like, we don’t agree with that,” he says. “But this is important for them too. Lenders need to survive for this market to thrive.”
Even so, Kim says he avoids too much back seat driving and views his role more as a vocal but objective advisor.
“I don’t run their business...and I don’t run the industry,” he acknowledges. “The industry’s a product of their hard work.”
He adds that his warning came with no villains attached. Kim doesn’t blame capital providers who froze purchases:
FAVORITES
Color BLUE
Family time
HORSEPLAY WITH THE KIDS, WATCH STUDIO GHIBLI MOVIES WITH LOTS OF POPCORN, DRIVING RANGE
Movie/TV show GAME OF THRONES (EXCEPT THE LAST SEASON)
Place to travel SEOUL, KOREA
Season of the year FALL
Music genre K-POP
Guilty pleasure DEL TACO
Sport/team
BASKETBALL: LAKERS BASEBALL: ANGELS
FOOTBALL : NONE
Business/leadership book 5 DYSFUNCTIONS OF A TEAM BY PATRICK LENCIONI
“You shouldn’t be mad at them either,” he admonishes. “They have their own masters to answer to. You have to protect your own business and make sure you can survive this storm.” Kim spent years advising lenders to prepare for what could disappear. Then life handed him a reminder that some things disappear anyway.
RETUNING
As we wear into the interview, the conversation gradually shifts from protecting businesses to protecting time. Kim’s father died a few years ago.
“For a long time, my prime focus was work,” he says. “Growing the business, the work, making sure everything’s running okay. And I realized this is not the right way to think about life.”
Since then, what anchors him week to week is fairly specific. Every week, church shrinks everything back to its proper size. It’s the reminder, as he puts it, that “all of this—” he gestures broadly to the work on his desk “—is not as important.” After church, he has dinner at his mother’s house with his brother and their families. Every week, like clockwork, but instead of ticking through the minutes, he’s resetting the stopwatch. On the day of our conversation, Kim was supposed to be in Arizona on a
business trip, but he called his client and asked to stay back, and not because of the interview. “I traveled on Monday, and I’m starting to feel like a parttime dad, and so that’s not ideal.”
Kim’s oldest daughter, now eight, knows her dad goes to an office, talks to a lot of people, and has something to do with houses.
Kim says she’s asked him: “Daddy, are you the principal?”
“No, I’m not the principal,” he tells her.
“Are you the boss?”
Also a “no.”
“I have five other partners,” he explains. “We work together, we work
very hard, we’re trying to support this business so we can take home some money to take care of our families but also make sure our clients, our friends over here, can make money.”
It’s the closest approximation of private lending and law firm management that makes sense to an eight-year-old, but the emphasis is telling. Even explaining his job, Kim talks about people before titles.
His daughter is beginning to see what Kim sees: relationships are their own kind of currency. Always more excited talking about his kids than the intricacies of legal work, Kim says his daughter is starting to understand that people matter more than transactions. She’s developing a sense of what it means to look out for people, and that the effort invested in relationships tends to come back around. The lesson, Kim says, feels more concrete echoed back.
A protective instinct is only half the lesson; the other half is the relentless effort required to back it up. He and Sieum Lim tell both their daughters the same thing after trips like the recent one to Hawaii: “We’re able to do these things because of hard work. Not because Daddy’s on YouTube. Because of hard work for the past 15 years, and the past 30 years.” Then, characteristically, he adds: “And luck. And God’s grace.”
But if luck and grace are abstract concepts, his wife, a CPA who works in transfer pricing, is the tangible foundation. For Kim that foundation comes through loud and clear: Sieum Lim is where it starts and ends. “I wouldn’t have achieved half of what I’ve done without her support.”
Most of the work that built Kim’s reputation
happened may have happened in public, but the bedrock is somewhere else.
STILL UNAPOLOGETICALLY LOUD
At some point in this industry, if you do the work long enough, people start making introductions you didn’t ask for. Kim mentions an incident almost in passing to drive that home: Someone writing a report on rental transition loans for the Urban Institute needed to interview relevant people, and Linda Hyde, AAPL’s president, pointed them to Fortra. Prospective clients arrive the same way, hearing about Fortra from someone else.
He says these moments are evidence, not objectives. “That’s really rewarding,” Kim says. “I guess that comes with influence, but I think it’s just rewarding that we know that our hard work has really paid off. What the firm has put together as a whole … the message we’re trying to put out there … the resources we’re putting out there … is more where the influence lies.”
Spend enough time around Fortra and the family resemblance becomes obvious. The firm sounds the way it does—direct, willing to deliver the uncomfortable messages, pricing fairly when it could probably charge more—because of who built it and how. There’s no version of Kim that’s different off the stage than on it. The industry gets the same Kevin Kim his daughters do.
“I don’t know how to change that perception,” he says about being the loud Korean guy in the room.
He’s been saying that for 43 years. If he’s trying to change, he’s keeping the project remarkably quiet.
Loan Participations: There’s More Below the Waterline
Most loan participations look like sales on the surface. Under ASC 860, many become secured borrowings instead.
CHAD MURPHY, RICHEY MAY
Did you sell the loan, or finance it?
Every private lender entering a loan participation should answer that question upfront, but it often surfaces later in an audit meeting, when the accounting treatment does not align with the financial statements. At that point, the focus shifts from deal structure to damage control.
Loan participations are flexible, valuable private lending tools. They are also one of the arrangements lenders most frequently get wrong on the books. The reason is almost always the same: The legal structure and the accounting framework are answering two different questions, and most lenders only realize the difference when something forces the issue.
The core of the issue is more simple than it sounds. ASC 860, the rule that governs transfers of financial assets, draws a hard line between a transfer that qualifies as a sale and one that doesn’t. A participation can fall on either side. Many private lending participations end up on the wrong side, as secured borrowings rather than sales.
CURRENT MARKET
Participations are appearing more frequently, not just at large platforms. Mid-sized and growing originators are using them as a
regular capital strategy, often with multiple participants on the same loan. What was once relationship-driven has become a repeatable part of the funding model.
Several factors are driving that change: capital efficiency matters more, higher rates and tighter liquidity are pushing lenders to keep originating without fully deploying their own balance sheet, and participations make that possible without losing the borrower relationship. Growth in DSCR and rental lending has also extended holding periods, making capital recycling more important.
Institutional pressure is another driver. Even lenders not using institutional capital today are feeling its influence on how deals are structured. Investors want exposure to these loans, and participations offer an accessible entry point that raises the bar on documentation.
Participations are growing fastest among mid-sized lenders with established origination pipelines and active investor relationships but still actively managing capital deployment. For those lenders, participations have stopped being a one-off tool and started becoming a routine part of the model. That’s also the point at which the accounting catches up with you.
WHAT IS A PARTICIPATION?
A participation lets a lender share the economics of a loan while continuing to manage the borrower relationship. The lender originates and typically services the loan, and the participant contributes capital and receives a share of cash flows. Nothing changes for the borrower. For the lender, the structure introduces a second layer of complexity, because two questions now need answers: Who owns the loan, and who controls the loan? Those answers determine everything about how the transaction is accounted for.
BENEATH THE SURFACE
Under U.S. GAAP, ASC 860, the accounting analysis for a participation runs in two steps. Most private lending participations don’t make it past the first.
STEP ONE: DOES THE INTEREST QUALIFY AS A PARTICIPATING INTEREST? Before any transfer can be considered a sale, ASC 860 requires the transferred portion to meet the definition of a participating interest. This is a threshold test, and it is more demanding than most lenders expect. The transferred interest must represent a proportionate, pro rata ownership interest
in the entire financial asset from the date of transfer. Cash flows from the loan must be divided proportionately among all interest holders, with no holder receiving a disproportionate share of principal versus interest. No interest holder’s interest can be subordinated to another—all holders must share on a pari passu basis, including in default scenarios—and no holder can have recourse to the transferor beyond standard representations and warranties.
This is where many private lending participations fail. If your participant receives a preferred return, has priority in a default waterfall, or if any interest in the loan is
subordinated to another, the transferred interest does not qualify. Sale accounting is off the table and the analysis is over.
To illustrate: You originate a $2 million bridge loan at 11% and then sell a 50% participation on the principal with a flat preferred return interest rate of 9%. For this to meet the proportionality test, your participant would need a pass-through of 50% of the actual loan interest. It does not matter how the agreement is labeled. The accounting result is a secured borrowing.
STEP TWO: THE THREE CONDITIONS FOR SALE ACCOUNTING. If the transferred
interest qualifies as a participating interest, lenders then evaluate three conditions under ASC 860.
The first is legal isolation. The transferred interest must be legally isolated from you and your creditors, even in bankruptcy. In practice, this typically requires a bankruptcyremote special-purpose entity holding the loan, supported by a true-sale legal opinion. In most private lending participations, no such structure exists. The loan remains in your name, the participant’s interest is contractual rather than ownership-based, and there is no legal separation between the asset and your company. That means
the isolation condition is not met, and sale accounting is not available, making it the most common reason participations end up as secured borrowings.
A note on special purpose entities (SPE): Setting up a bankruptcy-remote SPE may address legal isolation under ASC 860, but it does not end the analysis. Under ASC 810, if the lender is the primary beneficiary, the SPE must be consolidated back onto the balance sheet, and the asset returns through consolidation. Clearing ASC 860 without also clearing ASC 810 increases legal cost without changing the accounting result, which is why the ASC 810 analysis is sometimes worth doing first. If consolidation
is unavoidable, you save the time and expense of structuring around ASC 860 for a result that was never going to change. The second is the right to pledge or exchange The participant must have the right to pledge or exchange their interest without restriction. If the participation agreement requires your consent for the participant to exit, or if you retain a call option, you have not relinquished control and sale accounting is precluded.
The third is no effective control. You can’t retain effective control through a right or obligation to repurchase before maturity, or any ability to unilaterally pull the asset back.
If all three conditions are met, you recognize a sale and remove the participated
portion from your balance sheet. If any condition fails, the entire transfer is treated as a secured borrowing.
IT’S PROBABLY SECURED BORROWING
Secured borrowing accounting is the outcome for nearly all private lending participations. Under this treatment, the full loan remains on your balance sheet as an asset, and the participant’s contribution is recorded as a liability, effectively a borrowing secured by the loan. You continue recognizing interest income on the entire loan while also recognizing interest expense on the participation liability. The result is a balance sheet larger than you might have planned, with leverage ratios that reflect it.
This catches many lenders off guard; knowing the correct treatment from the start changes how you structure, document, and report participations.
So why does this matter beyond the mechanics? Secured borrowing treatment is not necessarily a problem, but a grossed-up balance sheet may have real downstream effects.
Start with leverage. Because the full loan stays on as an asset and the participant’s funding sits next to it as a liability, both sides of your balance sheet are larger than they would be under sale treatment, but your equity is unchanged. Your leverage ratios go up and your return on assets goes down, even though the underlying economics have not moved. On paper, you look more leveraged than you actually are.
That balance sheet leverage can quickly flow through to your other capital sources. Warehouse lines and bank facilities almost always carry financial covenants tied to leverage, liquidity, tangible net worth, or borrowing base calculations. Secured borrowing treatment consumes headroom you may have been counting on—in a tight quarter that can be the difference between compliance and a technical default. It can also shape how investors value the business and how counterparties price your credit.
The income statement, by contrast, is mostly a wash. The bigger catch is gain on sale. Sale treatment can let you recognize a gain at closing. Secured borrowing spreads the economics over the life of the loan. If you have been counting on day one gain on sale income, it is not there.
ROUGH WATER
What works on five deals gets harder at 50. The pressure points are predictable. They show up as small
inconsistencies that accumulate until something like an audit, capital raise, or covenant test force them into view.
Start with the mismatch between legal structure and accounting treatment. The participation agreement is often drafted as a sale, with assignment language and a “purchase and sale” framing, but it contains terms that destroy sale accounting (e.g., preferred returns, consent rights on transfer, indemnities that go beyond standard reps and warranties). The legal team produced a sale document. The accounting team is required to call it a financing. There is not one correct legal structure for either outcome, but the agreement should be drafted with the intended accounting treatment in mind, rather than as a stock sale form with custom economics layered on top.
Then there’s the reporting problem. Picture three 50% bridge participations on similar loans. The first is a clean pro-rata pass through. The second gives the originator a 25 basis point servicing skim. The third gives the participant a flat 10% return.
To you they look like the same product. Under ASC 860, the first might be a sale, the second is a closer call, and the third is clearly a secured borrowing. Three economically similar deals can end up with three different accounting treatments.
The operational piece is where it actually gets fixed. Internal systems that were never built to track participation liabilities separately from other debt make financial reporting harder than it needs to be. If you have knowingly committed to secured borrowing treatment going forward—which is the cleaner path for most private lenders—the fix is modest. It requires a dedicated general ledger account for participation liabilities (kept separate from warehouse and other facilities), a subledger that ties each
DEPTH CHECK
These are the questions that come up most often in practice and directly shape how your business is viewed by auditors and investors:
» Do your participants hold a proportionate, pro rata interest in all cash flows from the loan, including in a default scenario?
» Is any participant’s return structured as a preferred yield or flat rate rather than a passthrough of the loan’s actual economics?
» Can your participant’s pledge or exit their interest without your consent?
» Do you retain any call rights on participating interests?
» Has the accounting treatment for each participated loan been documented at inception?
» If you have participated in the same loan to multiple investors, are all of those interests pari passu with each other?
participation liability back to the loan and the participant it relates to, and a process that records the inception date accounting conclusions alongside the loan onboarding documents. Most accounting systems already support this. The bigger lift is treating it as part of the loan onboarding workflow rather than something the accounting team reconciles at quarter end.
Documentation is another common challenge. ASC 860 requires the accounting conclusions on a participation to be made at inception, based on the facts as they existed at the time of transfer. That
What treatment did you reach, and what was the basis for it at the time?
Without the support of the agreement, the analysis and the documented rationale, there is no way to verify the treatment was correct. The pattern is usually the same. Someone made the call informally and that person is gone now, or the bookkeeping just followed whatever the agreement said without anyone doing a GAAP analysis. On the light end, you get expanded audit procedures and higher fees. On the heavier end, you’re looking at proposed adjustments, prior-period
originate a $3 million DSCR loan and sell a 40% participation to Investor A on clean,
the loan is performing well, and you bring in Investor B for a 30% participation. But this time, Investor B negotiates a preferred return rather than a straight pass-through. That disproportionate cash flow allocation means Investor B’s interest does not qualify as a participating interest. Because all interests in the same loan must now be reevaluated under ASC 860, Investor A’s previously clean participation is also called into question. What started as a wellstructured sale turns into a restatement.
This scenario is occurring with greater frequency as lenders scale and bring in new capital partners with different return expectations. Fixing it after the fact is harder than preventing it, and the path depends on when you catch it. If the second participation hasn’t closed yet, the cleanest fix is restructuring Investor B’s terms to be pari passu with Investor A, having the same proportional cash flows, and no preferred return in order for both participations to qualify.
Once the second deal has closed, options narrow. You can try to negotiate or buy out Investor B’s interest, but that requires their cooperation, which usually isn’t free. More often the fix is recharacterized with Investor A’s previously clean sale being reversed and the entire participation structure on
that loan being brought back onto the balance sheet as a secured borrowing. The fix requires being intentional about keeping all participations in the same loan on equal economic footing.
NAVIGATE WITH VISIBILITY
Loan participations can be an effective way to grow a platform, manage concentration, and access additional capital. But they also introduce accounting complexity that is easy to underestimate. The difference between a strong participation structure and a problematic one usually comes down to clarity around economics, control, and documentation from Day One.
If your participation structures have not been reviewed from an accounting standpoint, now is the time. Details that seem manageable early tend to compound as platforms grow, and fixing them under pressure is far more costly than addressing them up front.
Disclaimer: “Richey May” is the brand name under which Richey, May & Co., LLP and RM Advisory LLC provide professional services. Richey, May & Co., LLP and RM Advisory LLC practice as an alternative practice structure in accordance with the AICPA Code of Professional Conduct and applicable law, regulations, and
professional standards. Richey, May & Co., LLP is a licensed independent CPA firm that provides attest services to its clients, and RM Advisory LLC and its subsidiary entities provide tax and business consulting services to their clients. RM Advisory LLC is not a licensed CPA firm.
Chad Murphy is a partner at Richey May, a national accounting, advisory, and technology firm, where he specializes in serving private lenders and mortgage companies nationwide. His more than 14 years of industry experience, including time as a controller and CFO at other lending institutions, gives him a unique perspective on both the operational and accounting sides of the business. He focuses on helping clients navigate complex topics like retained interests, participations, fair value measurements, securitizations, and financial reporting.
CHAD MURPHY
Steer Through the Fog
AI can improve efficiency, but governance determines whether it improves outcomes.
JACOB THERRIEN, RCN CAPITAL
AI-driven systems for nonconsumer lead generation, underwriting review, and credit decisioning are becoming embedded in how private lenders source business-purpose borrowers, assess risk, and deploy capital efficiently. But the more these systems become integral to your operation, the more accountability grows too.
The challenge is not only whether an activity is legally permissible, but whether it is professionally responsible. AI can certainly assist private lender operations just as easily as it can amplify harm and risk. Ethics at scale is a governance issue that directly affects
your reputation, regulatory exposure, and long-term competitiveness.
VISIBILITY MATTERS
Professional responsibility has never stopped at “human judgment,” but in today’s AI landscape, it must extend deeply into the systems shaping your decisions.
Financial services codes of ethics, including AAPL’s, impose duties to mitigate foreseeable harm. That includes harm arising from oversolicitation, data misuse, opaque decisioning, or unintended bias embedded in automated systems. Even when regulators lag behind technology, professional standards do not.
For example, an AI-driven lead-scoring system may deprioritize otherwise qualified borrowers because it overweights incomplete litigation history, outdated background information, or geographic correlations that have little relationship to actual loan performance. Without human review, those patterns shape who receives attention, pricing, or access to capital.
Even well-designed AI systems produce unexpected outcomes, especially once they begin operating at scale across hundreds or thousands of interactions, files, and decisions. Checks and balances matter because accountability ultimately attaches to both the process and the outcome,
whether the decision originated from a loan committee or an algorithm.
Although most private lenders operate primarily in business-purpose residential or commercial lending, that does not remove them from scrutiny. Background checks, credit pulls, guarantor analysis, solicitation practices, and the handling of personal information tied to entity principals and other natural persons can still trigger obligations related to privacy, data security, marketing compliance, and permissible use of consumer-related data. Regulatory treatment may differ from consumer finance, but reputational exposure and professional accountability often do not.
WHERE THINGS GET FOGGY
The latest generation of AI-powered tools promise sharper targeting, deeper background intelligence, faster workflows, and lower acquisition costs. Most systems rely on combinations of public and quasi-public records
scraping, proprietary algorithms, and AI-driven analysis for data enrichment.
Every layer introduces risk, and those risks compound when oversight disappears somewhere between data collection, AI analysis, and real-world use. AI tools can uncover insights old-school credit metrics or humans may miss, but they also introduce opacity into decision logic and risk assessment.
Traditional underwriting models and human judgment have always carried bias and inconsistency, but AI systems can magnify those issues through scale, speed, and adaptive complexity. A flawed manual process may affect dozens of files before concerns surface; a flawed automated system can influence thousands of interactions or decisions before anyone realizes patterns have drifted.
And when a model deprioritizes a prospect, declines a loan, or prices risk differently based on opaque inputs or correlations, accountability still lands with the lender. Technology
may assist the decision, but it cannot absorb responsibility for it.
Governance means recognizing that automated decisioning requires at least as much scrutiny as human decisioning, and often considerably more.
THIRD-PARTY TOOLS STILL CARRY FIRST-PARTY RISK
Many lenders are starting to heavily rely on vendors for lead sourcing/scoring, underwriting models, and decision engines. Operationally, that makes perfect sense. From a governance standpoint, however, vendor selection is still a risk decision.
Contractual outsourcing does not eliminate accountability when borrowers, regulators, investors, or the public associate the outcome with your lending operation. Even if a vendor supplies the data, model, or scoring logic, lenders still own the decision to adopt, rely on, and operationalize those systems.
That means conducting due diligence well beyond surface-level statements or marketing claims. You should understand, document, and test how vendors source data, evaluate bias, audit models, and handle disputes or corrections.
The accompanying AI Risk and Governance Checklist is a good place to start vetting both your own or a vendor’s AI integration. A vendor’s willingness to answer difficult governance questions transparently often tells you as much as the technology itself. The checklist’s questions represent standard due diligence and do not require exposing intellectual property.
NAVIGATIONAL DISCIPLINE
Regardless of how deeply you already use or plan to implement AI-integrated solutions,
it’s incumbent to begin developing oversight practices that can grow with your use of AI.
DATA PROVIDER DUE DILIGENCE.
Routinely assess data freshness, sourcing transparency, enrichment logic, and retention/audit trails. Small data quality problems rarely stay small once automated systems begin operating continuously and feeding other automated systems.
PERIODIC MODEL AUDITS. You do not need to rebuild models, but you should regularly review outputs for anomalies, drift, or inconsistent outcomes across borrower profiles. Lenders cannot afford to treat questionable outputs as someone else’s technical problem.
ALIGNMENT WITH CONSUMER
PROTECTION PRINCIPLES. Even if you operate in commercial or nonconsumer segments, expectations around fairness, transparency, and proportionality apply. Ethical alignment ahead of regulation reduces future exposure and ensures you uphold professional responsibility.
Enforcement and regulatory interpretation in these areas remains uneven and continues to evolve, particularly in business-purpose and commercial lending environments. That uncertainty raises the stakes for internal discipline because waiting for regulators to define every boundary usually means reacting after damage has already occurred.
TRUST IS YOUR BEACON
As regulators, investors, and borrowers become more skeptical of AI-driven financial systems, governance becomes a competitive differentiator. Not only do constraints decrease the probability of enforcement action, reputational damage, and forced remediation, they can steeply increase trust and positive
differentiation in a landscape that is increasingly AI-wary and cynical.
The kind of savvy investor you want to work with is likely to scrutinize governance controls during diligence, borrowers are becoming more sensitive to how their data is sourced and used, and regulators have shown growing interest in automated decisioning practices across financial services.
Firms that can clearly explain their processes, vendor oversight, and accountability structures are often better positioned to withstand scrutiny, resolve disputes efficiently, and maintain long-term confidence from capital partners and borrowers.
Governance eventually shapes everything from vendor selection and product positioning to how confidently your team can explain decisions to borrowers and capital partners. When transparency and accountability are built into your core, that governance becomes part of your brand and culture. In crowded markets, trust is differentiation.
Conversely, poorly governed systems can result in over solicitation, complaints from those you’ve contacted, media and professional scrutiny, or regulatory inquiries.
And once trust in the system breaks down (either internally or externally), you lose the efficiency gains automation promised in the first place. Teams spend more time combing outputs and then redoing work, investors raise questions about risk discipline, and borrowers become wary of inconsistent decisions. Those problems rarely disappear just because the software gets unplugged.
AI will continue to reshape how capital is deployed, but expectations
around responsibility will rise just as quickly. Waiting for explicit regulation to define acceptable behavior is a reactive strategy—and a risky one.
Private lenders will be better served by setting standards early, embedding them into operations, and holding both vendors and internal systems accountable before outside pressure forces the issue.
JACOB THERRIEN
Jacob Therrien has played a key role in the growth and evolution of BLN Software, now RCN Capital’s Technology platform. As director of lending implementation and development, he leads efforts to ensure brokers and private lenders successfully onboard, optimize, and scale their use of the software to support their lending operations.
Therrien has a deep understanding of the real estate and private lending landscape and works closely with clients and internal teams to develop practical solutions, refine workflows, and deliver educational resources centered on best practices. His collaborative approach helps bridge technology and lending strategy, empowering clients to operate more efficiently and effectively.
In recognition of his leadership and impact, Therrien was honored with AAPL’s Rising Star Award and appointed to the organization’s Ethics Committee.
AMERICAN ASSOCIATION OF PRIVATE LENDERS AI RISK AND GOVERNANCE CHECKLIST
Use these questions to understand the moving parts and determine whether systems create more exposure than advantages.
1 DATA ACQUISITION
» What categories of personal or sensitive data are being collected, and is collection limited to information with a documented business purpose?
» Are the data sources legally authorized for automated commercial use across all relevant jurisdictions affecting you, your vendor, and the individuals being profiled?
2 VENDOR OVERSIGHT
» What transparency rights do you have into vendor data sources, model logic, and audit practices?
» Who bears responsibility for disputes, inaccuracies, or regulatory inquiries tied to vendor outputs?
3 AI DECISION SYSTEMS
» Are you subject to the Fair Credit Reporting Act because the resulting individual’s profile may influence eligibility for credit or be reasonably interpreted to be a “consumer report” or “consumer profile?”
» What controls and audit procedures exist to detect hallucinations, weak correlations, bias, drift, or degraded model accuracy?
» What safeguards govern storage, access, retention, and security of model outputs and consumer data?
4 AI-ASSISTED DECISIONING AND OUTREACH
» Is there meaningful human oversight, and can decisions or prospect classifications be explained in plain language?
» Could the system create discriminatory or reputational risk that would become problematic if publicly disclosed or regulator-reviewed?
» Can individuals reasonably discover, access, correct, or opt out of the data collection process?
» Can the vendor demonstrate documented bias testing, governance controls, and incident response procedures?
» Can individuals access, correct, delete, appeal, or opt out of profiling and data sharing?
» Can the model’s reasoning and outputs be meaningfully explained to internal stakeholders, regulators, or affected individuals?”
» Who is accountable internally for reviewing, escalating, and correcting harmful or inaccurate outputs?
» Do outreach practices comply with applicable solicitation laws and include safeguards against excessive or reputationally damaging targeting?
The Data Trap
Access is not the same as permission.
KEMRA NORSWORTHY, BULL FUNDING
Private lending has entered an era where information abundance creates both strategic advantage and ethical instability. Lenders today can access traditional public records, aggregated datasets, scraped online content, behavioral indicators, predictive risk models, and vendor-generated borrower profiles whose sourcing and methodologies are rarely disclosed. The distinction between verified fact, probabilistic inference, and speculative noise has become increasingly difficult to identify.
This evolution presents a fundamental problem: the legality of accessing data is often mistaken for the legitimacy of using it. Many lenders possess enormous quantities of borrower information but without a coherent framework governing how to interpret, validate, document, or operationalize that information.
The resulting exposure is regulatory, reputational, operational, and structural. Poorly governed data practices can produce inconsistent underwriting outcomes, hidden bias, unreliable risk assessments, borrower distrust, and future scrutiny from regulators or litigants examining whether firms exercised reasonable judgment in their decision-making processes.
A defensible ethics model, therefore, becomes an institutional safeguard that helps lenders distinguish responsible intelligence gathering from reckless data opportunism.
TRACK DATA PROVENANCE
Modern borrower intelligence typically falls into the following four broad categories. For each one, lenders should still perform due diligence to understand source origin, verification status, update frequency, traceability, and confidence level. See Figure 1 for tier summary.
TIER 1: PRIMARY SOURCE PUBLIC RECORDS. These records are generated directly by governmental or judicial authorities and are generally considered the most reliable category of externally sourced borrower information.
Primary records are not inherently error-free, but they do possess identifiable provenance and traceability. Rather than downstream interpretation, they are originated by institutions with governing agency. Examples include property ownership records, tax liens, UCC filings, court judgments, bankruptcy filings, business registrations, recorded deeds and mortgages, and licensing records.
Even for primary sources, contextualization is important. A decades-old lawsuit, dismissed lien, or resolved bankruptcy may have limited relevance to present-day borrower risk. Other data, while “potentially useful” information, are not defensibly useful to business-purpose credit decisioning and should not be collected.
TIER 2: DERIVATIVE OR AGGREGATED DATASETS. These datasets compile information from multiple public and commercial sources into searchable
platforms. Derivative datasets increase efficiency but often degrade transparency.
Aggregation creates an illusion of authority. The same erroneous record replicated across multiple databases can appear independently verified when it is a single-source contamination event. Errors become both difficult to uncover and trace, so lenders should confirm with vendors where and how the information is sourced, and what confidence is placed on its accuracy. Examples include skip-tracing databases, credit header compilations, address histories, litigation aggregation tools, commercial borrower intelligence platforms, and data broker profiles.
TIER 3: ENRICHED OR INFERENTIAL PROFILES. The most ethically sensitive category involves vendor-generated intelligence products that infer characteristics, behaviors, or risk signals from fragmented data. These systems often combine verified and speculative information into a single output presented with unwarranted confidence. Examples include behavioral scoring, predictive default indicators, social relationship mapping, online reputation analysis, web-scraped identity associations, AIgenerated borrower summaries, and device and location pattern analysis.
TIER 4: UNVERIFIED OR SPECULATIVE INFORMATION. This includes information derived from unverified sources, AI-generated inferences, social media content, webscraped commentary, predictive profiling, or other data lacking reliable validation. While such information may warrant further investigation, it should not be used to support adverse credit decisions because its accuracy, relevance, and fairness cannot be established with sufficient confidence.
Before using any data from these sources, lenders must ensure conclusions are fully defensible and not based
FIGURE 1. DATA APPLICATIONS BASED ON SOURCE TIER
TIER DESCRIPTION PERMITTED USE
Tier 1 Verified primary records Core underwriting
Tier 2 Corroborated secondary data Supplemental review
Tier 3 Inferential/vendor-generated signals Escalation only
Tier 4 Unverified or speculative information Prohibited from adverse decisions
FIGURE 2. PRACTICAL OPERATIONAL WEIGHT HIERARCHY
DATA TYPE
RELIABILITY WEIGHT
Government-origin primary records High High
Independently corroborated records Moderate-High Moderate-High
Aggregated vendor data Moderate Limited
Scraped online content Low-Moderate Cautious
AI-generated summaries or inferences Variable Secondary Only
Anonymous allegations or unverifiable claims Low Non-Determinative
on weak correlations. Vendors are incentivized to prioritize scale over accuracy, and their terms of service may transfer liability to their end users.
DEFINE OPERATIONAL WEIGHT
Not all accessible data deserves equal operational weight. Data provenance—the origin, traceability, and validation status of information—should directly influence how lenders use borrower information in underwriting and servicing decisions. The danger emerges when firms flatten these distinctions and treat all surfaced information as equally authoritative. Figure 2 maps common data types to their recommended operational weight.
Failure in this category might look something like a vendor platform flagging a borrower as “associated with litigation risk” based on
a name match, scraped article, existence of a lawsuit (actually dismissed in borrower’s favor), or a non-verified business affiliation.
An underwriter, pressured by speed and volume, accepts the flag at face value without tracing the underlying evidence, introducing potentially false, contextless, or irrelevant information into a financial decision.
Assessing appropriate weight assumes the data should have been collected in the first place.
JUSTIFY COLLECTION AND USAGE
One of the most erroneous assumptions in lending intelligence is that if the information is publicly available, its use is automatically justified. A borrower may technically expose information online without reasonably expecting it to become part of a permanent underwriting
profile, and they are beginning to recognize when firms engage in invasive or opaque information gathering.
Similarly, scraped data may capture outdated, misleading, or sensitive material that bears little relationship to creditworthiness or repayment capability.
Lenders must create clear policies defining what information may and may not influence decisions, and why. Those policies should be tailored to specific products and underwriting criteria, covering when and how data may be collected, used, and weighted to ensure consistent application across loan files.
Clear policies and procedures ensure lenders can defend their credit decisions— and that the process is consistently and equitably applied to all loan files.
1 EXPLICITLY DEFINE:
» What is collected.
» Why it is collected.
» How it is validated.
2 SET ESCALATION PARAMETERS FOR:
» Contradictory information.
» Ambiguous identity matches.
» Potentially defamatory content.
» Who can use it.
» What weight it carries.
GOVERNANCE AS STRATEGIC RISK MANAGEMENT
Private lenders now operate within an information ecosystem in which public records, aggregated datasets, and AIgenerated intelligence coexist without clear boundaries. The absence of structure invites operational inconsistency and institutional vulnerability.
Many firms incorrectly view data governance as a friction layer that slows decisionmaking. The reality is that weak governance creates inefficiency. These commonly present as false positives, inconsistent underwriting, overdependence on vendors, and increased remediation costs.
A disciplined governance model forces lenders to separate meaningful intelligence from informational clutter.
The future of borrower intelligence will be defined by how responsibly lenders distinguish reliable evidence from speculative inference.
» Sensitive personal information.
» Behavioral indicators.
3 CREATE ESCALATION STANDARDS THAT ASSESS:
» Data reliability.
» Fair lending implications.
» Documentation standards.
4 AFTER DATA IS VERIFIED AND APPROVED FOR USE, DOCUMENT:
» Original source.
» Retrieval date.
» Verification method.
» Reviewing employee(s).
» The operational weight applied.
5 TO CONTEXTUALIZE CREDIT DECISIONING, DOCUMENT:
» What was reviewed.
» What influenced the decision.
» What was disregarded.
» Why judgment calls were made.
KEMRA NORSWORTHY
Kemra Norsworthy is the founder and CEO of Bull Funding, which provides hard money loans for commercial investments, including fix-and-flips, commercial loans, SBA loans, apartments, and ground-up on single-family homes and warehouses. Norsworthy is currently a member of AAPL’s Ethics Committee.
The Sugar High Is Over
Three years into a slow-motion correction, local market experts see more softness ahead before conditions improve.
DAREN BLOMQUIST, AUCTION.COM
Spiking mortgage rates in the second half of 2022 shocked the housing market out of its pandemic-triggered sugar high and initiated a slow-motion correction characterized by sluggish sales and anemic price appreciation over the last three years. Local community developers buying distressed properties at auction expect that slow-motion correction to continue for at least another year, although they are seeing some signs of light at the end of the tunnel.
“(I am) expecting more inventory in the second quarter of 2026. This is impacting how I am currently investing as more inventory will most likely lower overall prices,” wrote Patrick, an Auction.com buyer from Ohio, responding to an annual buyer survey in February 2026.
Since January 2024, nationwide home sales have flatlined near a three-decade low of about four million on an annualized basis, according to data from the National Association of Realtors (NAR). U.S. home prices have averaged an uninspiring 2.4%
in annual appreciation since then, with eight months where home prices decreased from a year ago. Three of those months have come in the last year, including a 2.2% drop in January 2026. Home prices were up just 0.9% in April 2026, the most recent data available from NAR.
About 30% of markets saw decreasing home price appreciation in April, according to data from Intercontinental Exchange (ICE). Those included Cape Coral, Florida (down 5%), Austin, Texas (down 4%), Seattle, Washington (down 2.4%) and Denver, Colorado (down 1.9%).
MORE EXPECT HOME PRICE DECLINES
A growing share of local market experts expect home prices to continue to decline in their local markets in 2026, according to a February 2026 survey of more than 400 Auction.com buyers (see Fig. 1). Most of those buyers are local community developers who track their local market conditions carefully and
whose success as real estate investors depends on accurately anticipating future trends in their market.
Forty-three percent of buyers surveyed said they expected home prices in their local market to decline in 2026, up from 33% in a 2025 survey to the highest share reported since 2022, when the survey began. Meanwhile, 40% expected home prices in their local market to increase between 1% and 5%, down from 47% in the 2025 survey to the lowest level since the 2023 survey. The remaining 17% of buyers surveyed said they expected home prices in their local market to increase more than 5% in 2026, but that was the lowest share expecting a 5-plus percent increase since the survey began in 2022.
PRICE EXPECTATIONS BY REGION
By geography, the survey data largely tracks with trends in the sales data cited in Figure 1. Buyers in the Central region of the country, which includes Texas, Ohio,
FIGURE 1. HOME PRICE EXPECTATIONS
Michigan, and Illinois, among other states, were most likely to expect decreasing home prices in 2026 (50%) followed by the Southeast (49%) and the West (47%).
Only 37% of buyers in the Northeast, which includes New York, New Jersey, Virginia, and Pennsylvania, among other states, said they expected home prices to decrease in 2026, the lowest of any region.
“I’m waiting for the market to come back down a bit,” wrote survey respondent Jolene from Pennsylvania.
MORE EXPECT RETREATING RENTS
A record-high share of local housing market experts are also expecting rent rates to decline in 2026, according to the survey data. Nearly one-third of all buyers
surveyed (31%) said they expect rent prices to decrease in their local markets in 2026, up from 26% in 2025 to a record high as far back as 2023, when this question was first asked in the survey (see Fig. 2).
The survey results painted a bit better picture for rent expectations than it did for home price expectations, however. The majority of buyers surveyed (58%) expect a modest increase of 1-5% in rents in 2026. Still, only 11% expected rents to increase more than 5% for the year—a record low for the survey.
Buyers in the Southeast, which includes Georgia, Florida, Tennessee, and Alabama, among other states, were the most likely to expect decreasing rents in 2026 (42%), followed by buyers in the West (38%).
“Rental inventory and pricing determine our investments,” wrote survey respondent Robert from South Carolina.
Buyers in the Central region (28%) and Northeast (27%) were closely aligned in terms of the share expecting decreasing rents in 2026.
According to a Realtor.com report, the survey results aligned closely with trends in asking rents, which declined nationwide on an annual basis for the 32nd consecutive month in March 2026 for 0- to 2-bedroom properties.
The report shows median asking rents declined on an annual basis in 34 of the 50 largest U.S. metropolitan areas in March 2026 (68%), including Austin, Texas (down 6%), Oklahoma City (down
5.3%), Memphis, Tennessee (down 4.9%), Phoenix, Arizona (down 4.5%), and San Antonio, Texas (down 4.5%).
FEWER OVERVALUED MARKETS
Although a rising share of local housing market experts are expecting declining home prices and rents in their local markets in 2026, a record-low share sees their market as overvalued—evidence that the slow-motion housing correction over the last three years has helped to improve affordability, albeit gradually (see Fig. 3).
More than one-third of buyers surveyed (36%) described their local housing market as “overvalued with a correction possible.” That was down from 43% in 2025 to the lowest level since Auction.com began conducting this survey in 2022.
”Three years of sluggish sales and modest appreciation are gradually restoring balance to an overheated housing market.”
FIGURE 3. HOUSING MARKET OUTLOOK
FIGURE 2. 2026 LOCAL RENT APPRECIATION EXPECTATIONS
Survey respondents in the West, which includes Arizona, California, Colorado, and Washington, among other states, were most likely to describe their local market as overvalued (43%) followed closely by survey respondents in the Southeast (42%).
Conversely, 31% of buyers surveyed described their local market as “fundamentally sound with solid growth,” up from 28% in last year’s survey to the highest level since the survey began in 2022.
Survey respondents in the Northeast were most likely to describe their market as fundamentally sound (39%) followed by survey respondents in the Central region (32%).
Twenty-nine percent of buyers surveyed described their market as having “soft fundamentals with select opportunities,” up from 26% a year ago to a record high for the survey.
Only 4% of buyers surveyed described their market as “undervalued with strong upside,” unchanged from a year ago.
MORE BULLISH ON PROPERTY PURCHASES
The gradually improving home affordability landscape resulting from the slow-motion housing correction over the last three years, particularly in the Southeast and West, is helping local market experts in some areas of the country to become more bullish about purchase expectations in 2026 (see Fig. 4).
Nationwide, 92% of all buyers surveyed said they expect their property acquisitions to increase or remain the same in 2026 compared to 2025, down from 94% in the 2025 survey to the lowest level since 2023.
But buyers in the West and Southeast were more likely to have bullish property purchase expectations for the year. Ninety-eight percent of buyers in the West and 96% of buyers in the Southeast said they expect purchases to increase or remain the same in 2026.
“I have bought four properties on Auction.com. Looking to buy more,” wrote survey respondent William from Tennessee.
Taken together, the survey data paints a picture of a housing market that remains under pressure but is gradually working through its excesses. Affordability has improved, overvaluation concerns have eased, and buyers in some regions are growing more confident about acquisitions. The correction is not over, but for patient local market operators, the light at the end of the tunnel may be getting a little brighter.
Daren Blomquist is vice president of market economics at Auction.com. In this role, Blomquist analyzes and forecasts complex macro and microeconomic data trends within the marketplace and greater industry to provide value to both buyers and sellers using the Auction.com platform.
Blomquist’s reports and analysis have been cited by thousands of media outlets nationwide, including all the major news networks and leading publications such as The Wall Street Journal, The New York Times, and USA Today. He has been quoted in hundreds of national and local publications and has appeared on many national network broadcasts, including CBS, ABC, CNN, CNBC, FOX Business, and Bloomberg.
DAREN BLOMQUIST
End of the Breakaway
The industry’s fastest-growing segment is slowing, rates are becoming more reactive, and competition is shifting from expansion to market share.
NEMA DAGHBANDAN, LIGHTNING DOCS
This year has introduced a more nuanced lending environment than many expected coming out of 2025. After a period of strong, consistent growth, particularly in DSCR lending, the market appears to be finding a new equilibrium as certain product categories grow more sensitive to broader economic conditions.
What’s emerging is a rebalancing of loan products, rate behavior, and regional activity. The following analysis looks at how bridge and DSCR lending have performed through the first four months of 2026, and what those patterns may signal for the rest of the year.
BRIDGE LENDING SETTLES INTO THE PACE
Figure 1 shows how bridge loans have stabilized and continued tepid growth leading into the second quarter of 2026. Each month has brought steady month-over-month increases, while year-over-year growth remains modest. April 2025 set a record high for bridge loan transactions that took nearly a year to match again.
METHODOLOGY AND SAMPLE SIZE
Lightning Docs provides automated loan documents for private lenders. Between January and April 2026, more than 25,366 business-purpose loans ran through the platform,
DEFINITIONS
A bridge loan is any loan with a duration of 36 months or less utilizing interest-only payments for the duration of the term and a balloon payment at maturity. Bridge loans are generally secured by a residential property for investment purposes and can be commonly referred to as residential transition loans, fix-and-flip, nonowner-occupied, or hard money.
including 11,828 bridge loans and 14,531 DSCR loans. The data set includes only loans between $50,000 and $500,000 with interest rates between 4% and 20%.
DSCR loans are 30-year term loans secured by rental properties. The primary underwriting for these loans divides the monthly net operating income of the property by the monthly debt service.
A user refers to a unique company using the Lightning Docs platform. If multiple individuals within the same company access the platform, they are counted as a single user.
FIGURE 1. BRIDGE LOAN VOLUMES BY SAME 221 USERS, 6.5% YOY GROWTH
When Lightning Docs data is compared to broader industry sources, several trends stand out among the top 100 private lenders. First, this group also experienced modest growth of 2.2% from first quarter 2025 to first quarter 2026. The real story, however, is who grew and who decreased in volume. As Figure 2 shows, of the top 100 lenders, 58 grew their business. This group actually showed significant growth, with an average increase of 51%. On the other hand, 41 of these lenders decreased their volume and did so by an average of -23%.
This significant jockeying for market share amid nominal industry growth indicates internal factors in play. Adaptability is becoming a key differentiator, whether through new product offerings, expansion into new markets, or the adoption of new technology. The market isn’t expanding at a rate where stronger contenders are capturing new clients; they’re absorbing them from less well-positioned competitors.
Average bridge loan interest rates have trended downward on a national level for some time. As of February 2026, however, that trend began to flatten. With other benchmark rates rising during the same period, bridge loan pricing may soon follow a similar path. Macroeconomic factors, particularly developments tied to global conflict and oil prices, will play a key role in how this segment adjusts. Average loan amounts have fluctuated over time but appear to be anchored around the $700,000 mark. See Figure 3.
DSCR IS BACK WITH THE PACK
Strong DSCR growth became the expectation throughout 2025, with yearover-year volume increasing by 91% from 2024 to 2025. That pace has moderated
The market isn’t expanding at a rate where stronger contenders are capturing new clients; they’re absorbing them from less wellpositioned competitors.”
FIGURE 2. VOLUME OF TOP 100 PRIVATE LENDERS, Q1 2025 VS. Q2 2026
FIGURE 3. BRIDGE LOAN RATES AND AVERAGE LOAN AMOUNTS, 48% YOY GROWTH
so far in 2026. As Figure 4 shows, yearover-year growth remains strong at nearly 50%, but the month-to-month trend tells a different story. After setting record highs in 10 of 12 months last year, 2026 has produced just one new monthly record high so far. This may signal an early rebalancing between bridge and DSCR lending following DSCR’s outsized growth in 2025.
DSCR interest rates had been following a similar downward trajectory as bridge loan interest rates, but they have proven more reactive to macroeconomic conditions entering the second quarter of this year, as you can see in Figure 5. After briefly dipping below 7%, rates increased by 14 basis points in April, marking the largest monthly jump since 2024. Loan amounts continue to fluctuate but generally remain centered around $300,000.
THE CLIMB BEGINS
As noted, bridge loan rates have flattened while DSCR rates have responded more directly to movements in the broader market, as Figure 6 shows. This aligns with increases in the 10-year Treasury yield and consumer mortgage rates. Although private lending rates are still
influenced by these external benchmarks, it is encouraging that spreads between DSCR rates and the 10-year Treasury have remained below 3%, demonstrating significant capital markets’ demand to purchase these loans at attractive rates. In fact, many private lenders can offer more attractive financing than the large consumer mortgage
After setting record highs in 10 of 12 months last year, 2026 has produced just one new monthly record high so far.”
FIGURE 4. DSCR LOAN VOLUMES BY SAME 51 USERS
FIGURE 5. DSCR LOAN RATES AND AVERAGE LOAN AMOUNTS
FIGURE 6. BRIDGE AND DSCR VS. INDEXES
lenders that also offer DSCR loans, largely because the big players carry significantly higher compliance costs that drive up their cost to produce loans.
POSITIONING MATTERS
Figure 7 shows the clear hierarchy among states for bridge loans. California, Florida, and Texas continue to hold the top three positions, with California maintaining a significant lead. Beyond that, there has been notable movement within the top 10. Ohio, in particular, has climbed five spots to reach the No. 4 position through the first third of 2026, despite not having a single county among the top 10 markets.
Figure 8 shows that at the county level, California, Texas, and Florida markets dominate bridge loan activity, as expected. However, differences in volatility are worth noting. Counties such as Los Angeles,
MOST
FIGURE 8. ACTIVE BRIDGE COUNTY RATE VOLATILITY
San Diego, and Orange show consistent, predictable volume month to month. In contrast, markets like Bexar County, Texas (San Antonio), and Philadelphia, Pennsylvania, have demonstrated the ability to more than double output from month to month, highlighting pockets of more dynamic activity.
As you can see in Figure 9, the top states for DSCR lending have remained remarkably consistent from 2025 to 2026, with the top seven states maintaining the same order. As DSCR activity continues to expand geographically, states such as Missouri, Illinois, and Maryland, which currently sit just
The opportunities remain strong, but performance in the months ahead will be shaped less by broad market tailwinds and more by how effectively lenders respond.”
FIGURE 9. TOP DSCR STATES BY VOLUME
outside this list, are well positioned to enter the top 10 in the near future.
At the county level, shown in Figure 10, the top three leading DSCR markets continue to show increasing volume month-to-month. Cook County, Illinois, typically the No. 3 market, is gaining traction after a slower start to the year. Baltimore City, Maryland, has significantly exceeded expectations and stands out as the only top-performing county from a state not currently ranked in the top 10.
READING THE COURSE
Taken together, the data from the first four months of 2026 point to a market in transition.
Bridge lending is showing renewed stability, with consistent, but modest growth and record-setting volume returning after a slower end to 2025.
DSCR lending, while still delivering strong year-over-year gains, is beginning to normalize after a period of rapid expansion, with growth becoming less predictable on a monthly basis.
At the same time, interest rate dynamics are shifting. The prolonged decline in rates appears to be leveling off, and in some cases reversing, as broader macroeconomic pressures begin to reassert themselves. That shift is already influencing borrower behavior, loan pricing, and overall transaction flow.
For private lenders, this environment places a greater emphasis on adaptability. The opportunities remain strong, but performance in the months ahead will be shaped less by broad market tailwinds and more by how effectively lenders respond to a more balanced and increasingly rate-sensitive landscape.
10. ACTIVE DSCR COUNTY RATE VOLATILITY
NEMA DAGHBANDAN
Nema Daghbandan is the founder and CEO of Lightning Docs, a proprietary cloud-based software that produces business-purpose mortgage loan documents nationally. The software produces attorney-grade short term bridge, construction, and other temporary financing, and term financing typically associated with DSCR rental loans. Lightning Docs is the official loan documents of the American Association of Private Lenders. The documents are considered the gold standard for business purpose loan documents.
FIGURE
Reliable Capital To Power Your Growth.
Technology built for the realities of construction lending.
Most platforms have their process. We adapt to yours.
• Faster draw approvals with real-time visibility
• Centralized collaboration for lenders, borrowers, inspectors, and vendors
• Flexible inspection workflows
• Audit-ready reporting
Fix & Flip Multifamily Ground-Up Construction DSCR
From New Frontier to Established Markets
Midwest and Southeast markets capture capital that coastal markets used to command.
MICHAEL FOGLIANO AND SEAN MORGAN, FORECASA
The 2025 data shows a private lending industry transitioning into a new normal after years of rate-driven disruption.
EXPANDING THE MAP
Growth occurred across every major topline metric, but the composition of that growth matters just as much as the aggregate percentages. Origination units increased 5.4% to 288,525, while dollar volume expanded 9.1% to $153.1 billion, indicating that market expansion was driven disproportionately by larger transactions rather than purely higher transaction counts.
Larger transactions are further demonstrated by a 3.6% increase in average loan size to approximately $531,000, despite elevated interest rates throughout much of the year. Several factors could
contribute to this: a combination of higher property acquisition costs, increased rehabilitation budgets tied to inflationary construction costs, and growing lender confidence in asset-backed underwriting stability. Persistent inflation in labor and materials remained a defining factor across residential investment property markets throughout 2024 and 2025, particularly for value-add and constructionoriented lending activity (see Fig. 1).
BUILDING DENSITY
Forecasa identified 15,865 active private lenders in 2025, a 14.5% increase over 2024’s 13,860. Although there was net growth, the market saw substantial churn. Notably, 6,128 lenders that originated in 2025 had not originated in 2024, representing 39% of the year’s active originator base. At the same time, 4,123
lenders that originated in 2024 did not originate in 2025. Net of those entrants and exits, the active lender base added more than 2,000 originators on the year.
Figure 2 indicates that private lending continues to attract entrepreneurial entrants and capital allocators even as consolidation pressures intensify. That combination typically signals a market viewed as structurally profitable rather than temporarily opportunistic—and one with plenty of specialized capital products to meet borrower needs.
Concentration at the top remained essentially unchanged. The top 10 private lenders by unit count captured 24.7% of 2025 originations versus 23.8% in 2024, while the top 10 by dollar volume held 21% in 2025 versus 20.6% in 2024. The market continues to be defined by a stable, concentrated top end and a deeply fragmented long tail.
METHODOLOGY
Forecasa collects, cleans, and analyzes residential data from county land records, standardizing party names and terminology to provide a clearer view of private lending market activity.
Forecasa defines a “private lender” as a mortgage originator that provides specific types of loans to residential investors. These include short-term fix-to-flip or bridge loans, 30-year rental loans/DSCR, ground-up construction loans, and multifamily loans. Although other lenders may offer these products, Forecasa categorizes private lenders separately (e.g., conventional, nonQM, etc.) to maintain clarity.
FIGURE 1. VOLUME AND GROWTH
FIGURE 2. LENDER LANDSCAPE
FIGURE 3. THE TOP 10 STATES BY ORIGINATION UNITS IN 2025
GROWTH CORRIDORS
Geographically, the data indicate a meaningful redistribution of private lending activity away from purely coastal appreciation markets and toward operationally cash-flow-oriented regions in the Midwest and Southeast. Figure 3 shows Texas, Florida, and California remain the largest markets by unit count, which aligns with their population growth, housing turnover, and investor concentration. However, the strongest percentage growth emerged from states such as Ohio (+23.8%), Pennsylvania (+16.4%), and Georgia (+14.9%), alongside metrolevel acceleration in Cleveland, Detroit, Cincinnati, Milwaukee, and Kansas City.
Institutional and private investors have increasingly targeted these regions because yield compression in gateway markets reduced the attractiveness of appreciationdependent strategies. Federal Reserve rate policy between 2022 and 2025 also materially increased financing costs,
which generally favors markets where investment returns are supported by cash flow rather than speculative appreciation.
MSA-level expansion patterns further imply that private lenders increasingly prioritize scalable middle-market geographies where housing affordability remains intact.
Among 2024’s top 50 private lending metros, these are the biggest winners:
» MINNEAPOLIS-ST. PAULBLOOMINGTON, MN-WI (+43.7%)
» KANSAS CITY, MO-KS (+42.1%)
» MILWAUKEE-WAUKESHA, WI (+33.5%)
» CLEVELAND, OH (+31.4%)
» BIRMINGHAM, AL (+28.8%)
» DETROIT-WARRENDEARBORN, MI (+24.3%)
» CINCINNATI, OH-KY-IN (+21.2%)
» PORTLAND-VANCOUVERHILLSBORO, OR-WA (+21.1%)
» RIVERSIDE-SAN BERNARDINOONTARIO, CA (+19.6%)
» RICHMOND, VA (+19.3%)
Minneapolis-St. Paul and Kansas City are particularly revealing because neither market has historically been considered a dominant speculative-investor hub. Their growth likely reflects migration of both borrowers and lenders toward markets with lower entry costs, more stable rent performance, and fewer regulatory constraints on housing development.
Similar trends have been documented nationally as investors moved capital into Midwest and Sun Belt metros offering stronger cap rates and lower volatility than coastal urban centers.
Declines were limited to a few select metros:
» SACRAMENTO-ROSEVILLEFOLSOM, CA (-27.0%)
» BALTIMORE-COLUMBIATOWSON, MD (-14.1%)
» LAS VEGAS-HENDERSON-NORTH LAS VEGAS, NV (-9.9%)
» SAN FRANCISCO-OAKLANDFREMONT, CA (-8.5%)
» CAPE CORAL-FORT MYERS, FL (-8.2%)
» BOSTON-CAMBRIDGENEWTON, MA-NH (-6.0%)
The contraction in markets such as Sacramento, San Francisco, Las Vegas, and Cape Coral suggests lenders became materially more cautious in regions exposed to valuation volatility, insurance cost escalation, affordability deterioration, or speculative investor saturation. Several of these metros experienced substantial pandemic-era appreciation followed by slowing transaction velocity and elevated carrying costs.
In Florida specifically, rapidly rising property insurance premiums and climate-related underwriting concerns have increasingly affected investment lending economics. Multiple national insurers reduced exposure or exited portions of the Florida market between 2023 and 2025 due to catastrophe risk and reinsurance cost pressure.
The Baltimore and Boston declines appear consistent with a risk-off reaction tied to fraud scrutiny and tightening underwriting discipline following the mid-2025 Fannie
Geographic capital flows are shifting decisively toward secondary and tertiary growth markets concentrated in the Midwest, Southeast, and Sun Belt.”
Mae fraud alert. Maryland also fell out of the top 10 states after declining 12.3% yearover-year. Secondary-market participants and warehouse providers often respond to fraud events with geographic overlays, heightened appraisal scrutiny, stricter documentation standards, or temporary pullbacks in perceived higher-risk regions.
CAPITAL MARKETS
Activity on the secondary market increased in 2025. Private lending assignment transactions (assignments where the loan
seller was a private lender) totaled 99,714 in 2025, up 5% from 94,545 in 2024.
That rise indicates continued maturation of loan liquidity infrastructure and stronger confidence among market participants in the transferability and valuation consistency of private credit assets. Secondary execution is becoming less episodic and more operationalized, which typically reflects deeper warehouse capacity, stronger investor appetite for short-duration real estate credit, and improved standardization in underwriting documentation and servicing practices.
The buy side of the market, however, is consolidating. The number of unique loan buyers active during the year declined 4.5% to 4,088 from 4,258. Additionally, the top 10 loan buyers of private lending loans accounted for 43.7% of all private lending assignments in 2025, up from 38.7% in 2024.
Fewer entities absorbing a larger percentage of available loan flow may signal that capital-intensive participants, including debt funds, REIT-affiliated buyers, family offices, securitization conduits, and institutional credit managers, are gaining pricing and negotiating leverage over smaller acquirers. This type of concentration pattern is common in maturing credit markets because scale advantages compound quickly. Larger buyers can absorb servicing complexity, diversify geographically, negotiate better financing terms, and tolerate thinner spreads due to lower funding costs. Smaller buyers often struggle to compete once markets become operationally sophisticated.
Looking ahead, increasing buyer concentration may gradually compress margins and increase dependency on a relatively small group of dominant capital providers. That dynamic mirrors the historical evolution of other nonbank credit sectors, where independent originators increasingly rely on a concentrated institutional investor base for takeout liquidity.
Turning the focus to originations, roughly 17% of private lending loans originated in 2025 had at least one associated assignment, down slightly from 18% in 2024. This rate will likely tick up modestly as more 2025 originations are sold and recorded in the months ahead.
While it is true that most private lending loans continue to be held by the originating lender, capital strategies vary widely across the top of the market. Some of the largest originators function as balance-sheet lenders that retain nearly all their production, while others originate-to-sell, transferring most loans to the secondary market within the first year. Among the top 25 lenders, we observe that about half are balance-sheet heavy (assign less than 15% of their loans) while the other half is equally split on a hybrid approach (assign anywhere from 15%-50% of their loans) and an originate-to-sell approach (sell more than 50% of their loans).
This assignment penetration rate demonstrates that the private lending market continues to prioritize interest income retention and longterm borrower relationships over fee-based origination velocity.
That being said, the substantial hybrid cohort indicates the market increasingly values optionality in capital strategy. Hybrid lenders can retain higherquality or strategically important assets while distributing loans that optimize liquidity, geographic exposure, duration management, or concentration limits.
This flexibility becomes especially valuable in volatile rate environments where securitization economics, funding spreads, and borrower payoff behavior can shift quickly. The persistence of all three models—balance-sheet, hybrid, and originate-to-sell—suggests the private lending ecosystem has not converged around a single institutional template because different capital structures continue to produce viable economics under varying market conditions.
VACANT LAND
Originations on vacant land properties grew 67% year-over-year to 24,650 units, with dollar volume up 44.8% to $19 billion. Vacant land’s share of total private lending units expanded from 5.4% in 2024 to 8.5% in 2025.
Vacant land is generally considered among the least liquid forms of real estate collateral because repayment often depends on future development or resale rather than existing cash flow. Expansion under these conditions signals strong lender conviction about future residential supply needs and land scarcity in growth markets. National housing supply shortages remained persistent entering 2025, with many analysts estimating the U.S. continues facing a structural underbuilding deficit accumulated over more than a decade.
Private lenders appear increasingly willing to finance the earliest stages of the housing development pipeline in anticipation of continued demand pressure.
The disparity between unit growth and volume growth also implies that average vacant land loan sizes declined meaningfully, suggesting broader participation in smaller-balance land transactions rather than concentration in a limited number of institutionalscale development plays. That pattern is consistent with heightened activity among smaller developers, infill builders, and entrepreneurial investors targeting future residential construction opportunities in growth-oriented secondary markets.
The geography of vacant land lending is notably concentrated. The top five states (Florida, Texas, North Carolina,
California, and Arizona) accounted for 55% of all vacant land private lending originations in 2025, well above the 43% Top Five concentration in the overall private lending market. Florida produced 4,921 vacant land originations, and Texas produced 4,260, representing 37% of the national total in just two states. North Carolina more than doubled its vacant land originations year-over-year (+137%), with Tennessee (+134%), Virginia (+123%), and Texas (+94%) close behind.
At the metro level, Florida placed four metros in the top 10 (Cape Coral-Fort Myers, Miami, Tampa, and Punta Gorda) and Texas placed two: Houston (which led all metros at 1,129 originations) and Dallas-Fort Worth. The remaining slots went to Phoenix, Atlanta, the New York metro, and Los Angeles.
This reinforces the thesis that private capital is positioning around long-term population migration and housing development trends. These states collectively share several characteristics: sustained domestic migration, relatively permissive development environments compared to coastal regulatory markets, continued household formation, and substantial suburban or exurban expansion corridors.
Population inflows into Sun Belt states remained a defining national housing trend throughout the post-pandemic period, particularly across Texas, Florida, North Carolina, Tennessee, and Arizona.
Florida’s growth is interesting, as it indicates lenders remain willing to fund land acquisition despite significant market challenges. On one hand, insurers and institutional investors have become increasingly cautious about coastal exposure and catastrophe risk. On the other, persistent population growth
and housing shortages continue driving development demand in those markets.
Separately, the triple-digit growth in North Carolina, Tennessee, and Virginia is significant because it indicates the vacant land boom is broadening beyond traditional Sun Belt markets into emerging regional growth corridors. These states have benefited from manufacturing investment, logistics expansion, corporate relocations, and comparatively affordable housing stock relative to coastal metros.
Despite the geographic concentration, the lender side of vacant land is spread out. In 2025, 4,626 distinct private lenders originated a vacant land loan, a 27% increase over the 3,649 that did so in 2024. The top 10 lenders in vacant land captured 18.7% of niche originations, well below the 24.7% top 10 share in the overall market. The segment is served by a wide population of lenders.
That fragmentation suggests several things simultaneously: barriers to entry remain relatively low, underwriting standards are highly localized, and institutional consolidation has not yet fully penetrated the category. Land lending often depends heavily on market-specific knowledge about zoning, entitlement timelines, utility access, and local development economics. Those characteristics tend to favor regional operators and entrepreneurial lenders over fully centralized underwriting platforms.
BEYOND THE BOOM
Taken together with the broader market and capital markets data, the vacant land segment helps complete a larger picture of where private lending is heading structurally. The industry is no longer behaving primarily as a reactive alternative to conventional financing gaps. Instead, it increasingly resembles a parallel real estate
credit ecosystem capable of funding projects across the entire property life cycle, from raw land acquisition through construction, bridge financing, rental stabilization, and secondary-market loan distribution.
Several interconnected themes emerge across all sections. Geographic capital flows are shifting decisively toward secondary and tertiary growth markets concentrated in the Midwest, Southeast, and Sun Belt. Investors and lenders are prioritizing affordability, cash-flow durability, and long-term demographic expansion over appreciation-dependent coastal speculation.
Simultaneously, the industry’s internal structure is bifurcating. On the origination side, lender participation is broadening, particularly in specialized categories as demonstrated by growth in vacant land lending. On the capital markets side, however, funding and secondary-market liquidity are consolidating into fewer large institutional buyers with growing influence over pricing and execution.
That combination, fragmented origination paired with concentrated capital markets, is characteristic of industries transitioning into institutional maturity. Community-level expertise and entrepreneurial sourcing remain essential at the front end, while capital efficiency and scale increasingly dominate the back end. The result is a market that appears larger, more liquid, more specialized, and more systemically interconnected than at any prior stage of private lending’s development.
The data also suggests private lenders are positioning for a longer-duration housing imbalance rather than a short cyclic rebound. Expansion into land acquisition, growth in development-oriented regions, and increased secondary-market sophistication all indicate confidence that housing undersupply, migration shifts, and constrained
conventional credit availability will continue supporting demand for private capital solutions well beyond a single rate cycle. The industry is gradually evolving from “alternative lending” to embedded infrastructure within residential real estate finance.
responsible for product development and data analysis. After studying mathematics, Fogliano gained experience in several different industries but always worked with complex data.
Morgan is the founder and CEO
where his primary focus is product and business development. With a background in oil and gas intelligence, Morgan and his team achieved a successful exit several years ago before entering the lending analytics space. Morgan began his career as a CPA for PwC, cultivating a strong foundation in data interpretation and strategic insights.
MICHAEL FOGLIANO
Michael Fogliano is a product manager at Forecasa,
SEAN MORGAN
Sean
of Forecasa,
Urban Institute Report Validates Private Lending’s Housing Role
A new report repositions residential transition lending as a measurable, market-driven force in U.S. housing production.
KAT HUNGERFORD, AAPL
The Urban Institute’s newly released report “The Evolution of Residential Transition Lending: From Hard Money to Housing Supply?” reframes residential transition lending (RTL) from a fringe financing mechanism into a material contributor to U.S. housing production.
Supported by the Housing Finance Innovation Forum, the April 2026 report concludes that RTL has evolved into a meaningful source of capital for small-scale residential construction and rehabilitation. Its activity is concentrated in infill development and the production of “missing middle” housing, including duplexes, triplexes, and small multifamily properties—segments that both institutional capital and public subsidy programs structurally underserve.
Drawing on market data and industry interviews, the report estimates that more than $85 billion in RTL originations occurred in 2025, including over $25 billion dedicated to one-to-four-family ground-up construction and more than $35 billion to property rehabilitation.
The findings position RTL as a supplemental, market-driven mechanism helping to address gaps left by traditional bank lending and large-scale developers. This was further
highlighted in the report’s contrasting of the banking sector’s $91 billion in outstanding single-family construction loans (as of EOY 2025) against RTL’s additional $30 billion.
WHO’S BORROWING—AND WHY
Unlike conventional mortgage channels that facilitate purchases of existing housing stock, RTL finances its creation and improvement. The report emphasizes that these loans disproportionately support modest, scatteredsite development in established communities, often resulting in affordable housing units.
The report also substantiates a distinction that industry participants have long observed. Drawing on borrower-level data from Forecasa, which the report characterizes as the most comprehensive and reliable source available for RTL borrower behavior, it segments the market between “casual” and more active investors. Casual borrowers—those completing three or fewer projects annually—generally lack access to bank construction financing due to underwriting constraints tied to experience, scale, and recourse.
More active borrowers, by contrast, often have the capacity to pursue lower-cost bank capital, yet continue to use RTL. The report attributes this preference to structural features of RTL
products, including asset-based underwriting, higher leverage, expedited execution timelines, and greater flexibility in loan terms.
This indicates that private lending does not function solely as a fallback for capitalconstrained borrowers. Instead, it operates as a deliberate financing choice across varying levels of borrower sophistication.
The report’s findings also reinforce several structural realities. RTL has matured significantly, transitioning from “hard money” into a more institutionalized market with diverse capital sources, standardized practices, and growing securitization activity. Conversely, the sector retains a distinct local orientation. The report notes that 83 percent of private lenders work with fewer than 10 unique borrowers, and those borrowers typically complete only one or two projects every few years.
It attributes this persistent hyperlocal structure to both operational realities and borrower demand—qualities that explain why the market is likely to remain distinct from banking’s evolutionary path of consolidation and standardization.
Short loan durations allow lenders to remain balance-sheet driven, reducing dependence on secondary market execution
and insulating them from the volatility observed during and after the pandemic. At the same time, borrower preferences reinforce this structure. Borrowers select RTL products for their flexibility, speed, and customization, characteristics that resist commoditization and diminish rate sensitivity relative to traditional lending channels.
This dynamic creates a structural tension with capital markets, which favor standardization and scale. Many RTL lenders resolve that tension by maintaining portfolio-based models that preserve underwriting discretion while managing risk exposure. The report further emphasizes that the constructionfocused nature of RTL reinforces localized expertise, requiring lenders to develop granular knowledge of neighborhood conditions, construction costs and timelines, contractor reliability, and the feasibility of exit strategies tied to rental or sale outcomes.
This type of activity is more commonly associated with governmentbacked housing initiatives, despite being entirely market-driven.
INSTITUTIONAL ATTENTION SIGNALS MARKET MATURATION
The involvement of the Urban Institute and the Housing Finance Innovation
Forum carries broader implications for the private lending sector. Their engagement signals a shift in how policy researchers and institutional stakeholders perceive RTL. The sector is now subject to rigorous, evidence-based analysis. That attention functions as validation. The report formally recognizes residential transition lending as a legitimate and measurable contributor to housing supply, supported by empirical data.
AAPL’S ROLE IN ADVANCING RESEARCH AND INDUSTRY VISIBILITY
The American Association of Private Lenders played a direct role in shaping the report’s evidentiary base.
“This report reflects what happens when rigorous research is informed by active market practitioners,” said Linda Hyde, AAPL’s president. “The report cited several thought pieces and data published in our flagship publication, Private Lender, demonstrating our infrastructure not only supports industry participants but also enables external stakeholders, including researchers and policymakers, to engage.”
AAPL’s involvement, Hyde said, reflects its broader strategy to provide public platforms for knowledge exchange. Through its
magazine, digital content, webinars, educational programming, and conferences, the association provides practitioners, researchers, and the public with access to real market intelligence.
Kat Hungerford is a digital project manager, operations strategist, and executive editor of Private Lender, the official trade publication of the American Association of Private Lenders (AAPL). Drawing on a background in journalism, marketing, and systems design, she integrates technical execution with editorial oversight to advance AAPL’s digital infrastructure, publications, and member-facing initiatives.
AAPL is the oldest and largest national organization representing the private lending profession, providing education, oversight, and advocacy to support industry best practices.
KAT HUNGERFORD
Your Trail Guide for Troubled Loans
Distressed loans rarely present a single solution; knowing which path fits the circumstances will preserve value and relationships.
GENE BUCCOLA, HIGH PLATEAU ASSET MANAGEMENT
In 2021, a private lender extended a threeyear construction loan. The plan was to get taken out by a commercial lender at stabilization. In 2023, interest rates rose, which means cap rates shifted. And the commercial bank, the one the private lender relied on from the outset to refinance at 70% loan-to-value, was now only going to 65%.
At origination, the gap wasn’t unreasonable to underwrite. After all, rates were low, valuations were on the rise, and the assumption that a commercial lender would be there at stabilization was wellfounded. Just two years later, that safe bet suddenly wasn’t valid anymore. The borrower simply didn’t have the reserves to cover a five-point LTV shift on the asset.
More consequences followed: Costs ran over, and rents came in below expectations. Both are common in this space. But now the borrower couldn’t pay off the note.
That scenario played out across the private lending market and continues today. The Mortgage Bankers Association estimated that $957 billion of commercial and multifamily mortgage balances matured in 2025. Another $875 billion will follow this year. As of this writing, data on how that 2025 cohort has resolved is still emerging, but the volume alone signals that private lenders will be
navigating a high volume of distressed situations for the foreseeable future.
So, what is your best option if you find yourself in this position?
WHEN YOU REACH A DEAD END
Not every distressed loan reflects a bad borrower. Legitimate projects and capable operators have struggled in the current environment. Interest rates rose quickly, commercial banks dropped their LTVs, and borrowers were left to fill the gap with cash. Construction costs climbed while multifamily rents fell. A borrower navigating those conditions isn’t one worth writing off.
Private lenders typically have four paths forward: a workout, a deed in lieu of foreclosure, foreclosure, or receivership. Each is an important part of a lender’s tool kit, but the secret is knowing which one to deploy—and when.
WORKOUT
A workout is the most borrower-friendly option, and the only one that offers the borrower a path to pay off the loan. There are many routes within this category, including adjusting interest, extending maturity, or offering a
forbearance agreement. If the borrower is operating in good faith, has met other milestones, and the underlying asset can realistically support payoff under modified terms, a workout is often the fastest and most cost-effective resolution available. Under these conditions, both sides maintain a path to win.
The challenge is that a workout may not be able to fix basis point rate movement or other significant market change that causes a previously solid loan to no longer pencil. If the conditions that broke the deal are not ones the borrower can mitigate, extending the timeline is likely to simply extend the loss.
DEED IN LIEU OF FORECLOSURE
For loans where a workout will not resolve the underlying issue with the loan, a deed in lieu is often a lender favorite because it turns over the keys without upfront litigation costs. This option may be ideal for lenders operationally geared to complete additional due diligence and absorb real estate, financial, and legal responsibilities.
The top due diligence items to address with a deed in lieu of foreclosure are:
» JUNIOR LIENS OR OTHER ENCUMBRANCES (DISCLOSED OR POTENTIALLY UNDISCLOSED)
» POTENTIAL ENVIRONMENTAL CONTAMINATION, ESPECIALLY DUE TO LAX STANDARDS DURING DEFAULT
» PROPERTY MAINTENANCE AND CODE VIOLATIONS
» IMPACTS OF MERGING THE MORTGAGE LIEN AND OWNERSHIP ESTATE
» RELEASES/COVENANTS TO PREVENT BORROWER COUNTERCLAIMS
» TRANSFER AND OTHER TAXES
» TITLING ISSUES AND TITLE INSURANCE TRANSFERS (OR LACK THEREOF)
» UNWINDING OF THE DEED IN LIEU IF THE BORROWER FILES BANKRUPTCY
A deed in lieu is not a decision to rush into, and it isn’t a quick fix. This structure can result in many surprises.
FORECLOSURE
Foreclosure is reliable and well-documented, and when it progresses in the lender’s favor, it ensures clear title to the property. For assets that don’t require active management to preserve value, or in cases where the borrower relationship has broken beyond repair, it may be the best option.
Distressed assets...require a skillset that many lenders haven’t had to adopt at scale since the Great Recession.”
Downsides to this option generally involve higher costs due to legal fees, strict compliance with statutory prerequisites to reach optimal outcomes, and longer timelines, during which the borrower retains control of the asset and its associated value and revenue. In judicial foreclosure states, timelines average 12-18 months
or longer, during which borrowers are, at minimum, often not in a financial position to care for the property.
RECEIVERSHIP
For private lenders holding construction loans, bridge loans, or interim financing on assets that have gone sideways
through no fault of the borrower, a receivership is often most effective. Its current underutilized status is primarily a branding issue—lenders aren’t aware of where and how it fits in the playbook.
With a receivership, a court appoints a neutral third party to take control of the asset. The receiver’s job is to stabilize the operation, manage the moving parts, preserve value as a first principle, and, in most cases, prepare for sale.
The receiver will collect rents, manage leases, pay operating expenses, make necessary repairs, and preserve the property’s income. The receiver’s fiduciary obligation runs to the asset itself, not to the borrower or any single creditor.
The process itself is supervised, with the receiver answering to the court for their actions and the property’s finances. This structure can avoid many of the liabilities and risks associated with deeds in lieu and foreclosure while allowing the private lender to maintain the borrower relationship. It threads the needle between inaction and full adversarial proceedings. A receiver is neither the lender’s hammer nor the borrower’s advocate, which can do a lot to preserve cool heads when money is on the table.
There are also potential trade-offs. The receiver’s fees are paid from the property’s income or, in some jurisdictions, can become a lien on the asset. Additionally, timelines aren’t always clear from the outset—court appointments vary by state and docket.
For some lenders, ceding direct day-to-day control may also be an issue. Although lenders are typically not required to advance funds to the receiver to preserve, maintain, or complete the property, receivers can petition the court for receiver
certificates. These debt instruments have priority over the lender’s mortgage.
As a rule, the receivership tool is most useful when all three of the following are true: the asset is income-producing but under stress, the borrower has lost the ability to manage the asset effectively, and you need the situation stabilized while working toward a longer-term resolution.
WHEN RECEIVERSHIP IS NOT ADVISED. Receivership isn’t a universal solution, and part of using it well is knowing when you’re better off without it.
In cases where the asset has little or no operating value to preserve, such as raw land, single-tenant property, or a property with expenses but no income, receivership is not likely to be costeffective. Value lies in assets needing active management: If there’s nothing to stabilize, the receiver’s fee is just another cost.
Receivership is also a poor fit when the borrower relationship is functional and the fundamentals of the deal are salvageable. For a borrower who communicates, has a credible path to payoff, and is both working to meet milestones and maintain the property, a workout is likely the faster and less expensive resolution. And if you still pursue a receivership even given those variables, it’s not uncommon for a judge to deny the motion, which adds legal expenses and puts you back at square one.
WHY COMMERCIAL RECEIVERSHIPS ARE ON THE RISE. There’s a confluence of factors driving an increase in receivership activity right now. Institutional dynamics reflect rising vacancy, compressed values, and stalled rent growth, which are likely to have follow-on effects for the collateral backing private lending portfolios. The assets are often the same and face the same stressors. Institutional multifamily vacancy
hit 6.8% in first quarter 2026, well above the 15-year average of roughly 5%, while values remain down 18% from their 2022 peak and rent growth has slowed to nearly zero.
Distressed assets don’t have to be the bogeyman, but they do require a skillset that many lenders haven’t had to adopt at scale since the Great Recession. Private lenders who optimize their playbook now will have the portfolios and the relationships to show for it on the other side of this cycle.
BUCCOLA
Gene Buccola brings more than 10 years of special asset banking experience managing bank-owned commercial real estate, including asset valuation, property preservation, and disposition. As a principal broker with more than 45 years of experience, Buccola handles marketing, negotiation, and transactions across asset classes.
He has served as a court-appointed receiver with fiduciary responsibilities for a range of individuals and entities. Buccola also has direct ownership and operating experience in private aviation, with networks spanning commercial and business aviation.
He serves on the AAPL Ethics Committee and holds leadership roles with the Commercial Receivers Association and Turnaround Management Association.
GENE
SUMMER GUIDE
If you’re looking for a service provider with real experience working with private lenders, this guide is your starting point. In each issue, we publish a cross section of specialties. These providers do not pay for inclusion. Instead, we vet them by reviewing their product offerings and talking to private lender references. AAPL members can access all vendors online at aaplonline.com/vendors.
w INTER
» ACCOUNTING
» BUSINESS CONSULTANTS
» DEFAULT & LOSS MITIGATION
» LEGAL SERVICES
» WAREHOUSE LENDERS
sp RING
» APPRAISERS & VALUATIONS
» CAPITAL PROVIDERS
» DATA
» ENVIRONMENTAL SERVICES
» LEAD GENERATION
» NOTE BUYING/SELLING
su MMER // THI s I ssu E! fa LL
» BROKERS
» FUNDS CONTROL
» LOAN ORIGINATION SERVICES
» LOAN SERVICING
AMillion Capital
amillioncapital.com (828) 243-4428
» Fix-and-Flips, Rentals, Ground-Up Construction
» Commercial and Bridge Loans
Blue Mountain Capital LLC blue-mountain-capital.com (719) 250-0000
» All Asset Types
» Private, HNWI, Family Offices, Institutional
» Bridge, Renovation, and Construction
Coonhound Capital coonhoundcapital.com (812) 381-7952
» Commercial and Private Real Estate Broker
» Full-Service REI Company with Property Manager, Realtor, and Contractors
» Loan Servicing: Unlimited Funding Sources, Track Loan Charges/Advances, Process Payments, Generate Emails for Borrower Bills/Statements, Document Storage, Escrow Administration Features, Letter Writing, E-File Tax Forms
Western Technologies Group, LLC wtgroupllc.com (732) 754-5857
» Flood Determination Reports
Alfred Tech
alfred.tech (424) 230-3080
LoanPASS
Loanpass.io (954) 361-9147
RTL Tech, Inc rtltech.ai (903) 403-3700
LendingWise lendingwise.com (888) 400-6516
ProDeal prodeal360.com (646) 387-4047
FCI Lender Services
myfci.com (800) 931-2424
» Private Money Servicer for Lenders of Any Size
» Specialty Loan Servicers
GoDocs
GoDocs.com (949) 640-9081
ICING
» Cloud-Based Loan Closing Document Preparation Software for Commercial, Multifamily, and 1-4 Unit Residential Properties.
Note Servicing Center, Inc.
noteservicingcenter.com (800) 646-3445
» New Notes/Loans
» Fixed Rate First Or Second
» Seller Carry Back Financing
» Installment Sale
» Impound/Escrow
» All Inclusive Trust Deeds (AITD)
» Other Specialized Servicing
Petra Loan Servicing
petraservicing.com (864) 483-7168
» Multi-Lender/Fractionalized
» Borrower/Lender Portals
» Investor Reporting
» Payoff/Reconveyance
» Title Monitoring
» Insurance/Tax Tracking
Provident Loan Servicing
Providentls.com (214) 937-0786
Servicing Pros Inc
servicingpros.com (877) 313-0095
» New Notes/Loans, Fixed-Rate First or Second Mortgages, Seller Carry-Back Financing, Installment Sale Financing, Impound/Escrow, Private Money Loans, Specialty Loans
» Online Portals for Brokers, Lenders, Borrowers
» Construction/Bridge/Holdback Draw Control
» Asset Management
Statebridge Company LLC
statebridgecompany.com (303) 332-7724
» Custom Loan Servicing for RTL, Residential, Commercial, Auto and Consumer Loans
L oa N u NDER w RITING s ER v ICE s Starter Stack AI
On September 16, 2001, after a Saturday night out with friends, I was awakened by a phone call giving me until Sept. 23 to report for active duty following the 9/11 attacks.
I was 30 years old, six months into a partnership at a real estate development company with 80 employees, and a month away from my wedding in Massachusetts— with 100 Texans already booked on flights to attend. Overnight, everything changed.
The call wasn’t entirely surprising. I had grown up in a military family, and on the morning of my 18th birthday, my father—an Air Force colonel who believed I could use more discipline— surprised me with a trip to a recruiter. After watching action-packed videos of military operations, I enlisted in the Air Force Reserves without hesitation.
I finished my last four months of high school, completed basic and technical training that August, and became part of the Phoenix Ravens,
Lessons That Outlast the Uniform
A military activation, a financial crisis, and a pandemic reinforced three leadership principles that still shape business decisions today.
JASEN
MILLER, CORRIDOR FUNDING
a squadron providing security for aircraft and crew in high-risk locations worldwide, primarily on missions targeting the international drug trade.
Through college, I balanced coursework with deployments—one week flying to a mountainside in Colombia or a jungle in French Guiana, the next back on campus with a paper completed aboard a C-130.
After earning my MBA, I moved into real estate development while continuing to serve. When I was activated after 9/11, I was helping oversee a project that would ultimately produce 850 residential lots. A trusted colleague stepped in to cover my civilian responsibilities, I traveled for my wedding as planned, and I would remain on active duty until May 2006.
Since then, the unexpected has kept arriving—the 2008 financial crisis, COVID, and everything in between. My military training has been the through line. The discipline I developed carrying
weapons in uniform has helped me just as well as carrying a briefcase.
My military experience shaped three convictions I carry into leadership today.
First, teams operate best when they are not just motivated, but also healthy and rested. That’s why I push back against the culture of sacrificing sleep and relationships in the name of success.
Second, leadership requires constant training and honest evaluation to keep teams sharp and free of complacency.
Third, the situational awareness the Phoenix Ravens demanded—owning everything within your force protection perimeter—translates directly to business.
I try to stay attuned to the economic forces affecting our company in real time, from geopolitical disruption to rising interest rates to inflation, and to anticipate challenges before they become crises.
The uniform may come off, but the training doesn’t.
Connect with verified private lenders who finance DSCR, Fix & Flip, Bridge Loans and
NOV. 9-10 2026 | LAS VEGAS
2 DAYS 50+ SPEAKERS 70+ VENDORS 900+ ATTENDEES
Join us for the 17 year as we bring together owneroperators, executives, and decision-makers for the industry’s premier education and networking conference.