
8 minute read
Career & Training


Facing Difficulties in Virtual Learning in a Zebrafish Facility
Written by Karen Dunford and Joseph Upstone
Introduction
Since March 2016, the University College London Zebrafish Facility has run the modular course for those wishing to use this model legally, which is required by the UK Home Office. The course had a successful format, with high pass rates. In 2020, we faced two changes that resulted in declining exam scores: the addition of 178 standardized questions provided by UK accrediting bodies, including the Royal Society of Biology, and the advent of an unexpected global pandemic. When the world went into lockdown, our original training paradigm was no longer possible, and face-to-face training (F2F) had to be quickly modified to fit the mold of a virtual course. The transition was difficult, and it may have also been detrimental to the performance of the students who now found that their living spaces had become their classroom. This was reflected in the overall decline of exam scores (ES). While the 2019 classes saw a passing rate of 82%, a sharp decline was seen in 2020 with only 59% of students passing the exam on the first attempt in the virtual course (Figure 1).
The results indicate that the F2F format was not as successful in a virtual environment. The alarming change required a re-examination of virtual methods. This led to a retrospective review of the new exam questions and the virtual transition. We hypothesized that increasing the quantity of virtual self-led interactive study material would raise exam performance.
100% Pass/Fail of Exams
Number of Exams Passed % 50%
83.9% 81.8%
59.3%
0%
F2F
2020 Virtual Course Type
Figure 1: The percentage of exams passed over the changes in the licence course: face to face, changes to exam questions, and virtual course due to the pandemic.
Exam Analysis
Initially, the exams were analyzed to determine if the new questions were too difficult. An item difficulty index (IDI) is frequently used in education to evaluate multiple choice exams by calculating the proportion of questions correctly answered in past exams1. This index, created retrospectively, results in a value, p. Questions with a high p-value are considered easy, and those with a low p-value are considered difficult. The IDI was created for each individual question, then the average p-value of each class is taken to create an overall value for the year (Table 1).
Module Learning Objective Question 2016 2017 2018 2019 F2F 2020 Virtual 2020 2021 2022 Avg p-value Rating
E1 1 MC1 1.00 0.78 0.53 0.65 1.00 0.85 0.73 0.79 2
TF1 0.93 0.73 1.00 0.89 1
2 MC1 1.00 1.00 1.00 1.00 1.00 1.00 1.00 1.00 1
MC2 0.75 0.86 0.93 0.90 TF1 1.00 1.00 1.00 0.91 1
1.00 1
MW1 0.88 0.73 0.83 0.82 1
Table 1: A selection of the item difficulty index (IDI) used to determine each question's p-value for the ethics module.
Face-to-Face Virtual
Coursebooks Hardcopies of textbook and study guide/exercise book
Digital copies of textbook and study guides/exercise book Group activities Culture of Care Culture of Care Sexing Fish Recognition of Pain Practicals Handling Sexing Fish (individually assessed) Embryo Identification Recognition of Pain
Summative Assessment Water Testing
Exam Embryo Identification Handling (in-person) Exam
Course Assessment Feedback form in course Feedback form online
Table 2: The differences between the first virtual course and the established F2F course.
Phase Additions
1 Course creation: includes all material from F2F as pdfs All group activities are done individually 2 Study material added: ethics vocab flash cards Average ES 76.8%
81.3%
3 Study material added: biology vocab flash cards 80.0%
Activities are returned to group activities Addition of a networking virtual room for use during breaks 4 Study material added: ethics quiz, legislation quiz, welfare quiz Course books changed to interactive 5 Study material added: learning objectives created as separate files 81.5%
82.5%
Table 3: The five phases of the virtual course, with the average exam score for each phase.
Difficulty Range Full Course (total points) Partial Course (total points)
Hard 71-105 51-75
Medium 36-70 26-50
Easy 0-35 0-25
Table 4: The ranges that determine if an exam is difficult, medium, or easy. Figure 2: The three groups for analysis, showing the overlapping factors (delivery and question set).
Course Format
Our study then turned to the new virtual format. We used a local version of the education platform Moodle and attempted to provide as similar an experience as possible to the F2F; one main exception was the group activities, which were made individual (Table 2).
However, with the decline in exam performance, changes in the format were required, although the learning outcomes had to remain the same. These occurred over 5 phases, which were implemented slowly over 2021 (Table 3). These included the re-introduction of the group-based activities and the creation of self-led study materials such as flash cards, and quizzes; the study materials were not mandatory. The course books also became interactive and therefore more virtually appealing.
Review: Item Difficulty Index
Three groups were created for analysis (Figure 2).
• Group 1: All exams March 2016 – 2019 • Group 2: All exams January - March 2020 • Group 3: All exams July 2020 - December 2021
The IDI is determined by taking the total number of correct answers divided by total number of people.
p = t / n p = p-value; t = total number of correct answers; n = total number of people
A p-value was determined for each exam question and the average of these over time was applied to the overall difficulty of the question. Each question was then categorized as easy (1 point), medium (2 points), or hard (3 points). This index then allowed for scoring each course’s exam to determine its overall difficulty (Table 4).
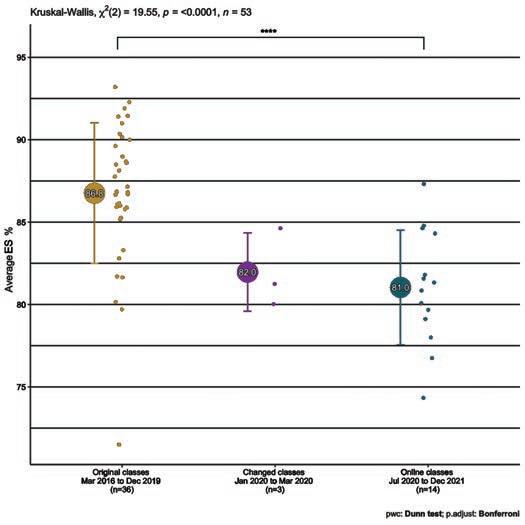
Figure 3: The average ES from Groups 1 (87.3) and 3 (81.9) are statistically different. There is no statistical difference between Group 1 and 2 (82.9) and 3 and 2.
Figure 4: A Kruskal-Wallis test showed no significant difference between the average difficulty for all exams within each group (i.e. partial and full course exams).

A Kruskal-Wallis test showed that the average ES from Group 1 and Group 3 are significantly different (Figure 3). Group 2 is not significantly different from either group. However, another Kruskal-Wallis test showed that the difficulty score of all exams were not significantly different between any of the three groups (Figure 4), and all exam difficulty scores fell within the medium category.
This determined that the virtual exams fell into an acceptable level of difficulty while still expecting a passing mark.
Virtual Format
The second review only looked at Group 3, the virtual group, and the changes made. Analysis of the efficacy of these changes was based on the average frequency with which students accessed the material available (data provided by the website). These data were then measured against exam scores.
Overall, exams scores increased from 76.8% in Phase 1 to 82.5% in Phase 5 (Table 3). Surprisingly, the results show a declining trend of ES across the entirety of the virtual course for those who accessed the material more frequently.
When individual phases are examined, however, the difference is all in Phase 4, which saw the highest creation of material; it has the highest average of frequency of access by students at 4.15, but only in those who failed. The other phases are approximately equal between those who pass and fail; those who passed averaged 1.9 frequency, and those who failed ranged between 1.7 and 2.1.
Discussion
The addition of new questions can be eliminated as the reason for the decrease in exam scores, as they all were scored for medium difficulty. Therefore, the issue lay with the virtual format.
The results for the review of the online material were surprising, as the hypothesis was that more material would increase ES. The changes made to adapt to online learning were helpful, as there was an overall increase in ES, but not to pre-COVID levels.
Phase 1 has a lower exam average than phases 2-5, indicating a positive impact from the inclusion of more material. But Phase 4, the greatest volume of material added, shows that a higher frequency of access resulted in failures. The danger is overloading the learner with too much or complex information. Improvements for a virtual format could be brevity and simplicity in material available, such as the simplistic vocabulary flash cards added in Phases 2 and 3 (Figure 5), instead of the more intensive quizzes added in Phase 4.
Returning to group activities in Phase 3, as in the original delivery, saw an improvement in ES compared to Phase 1, but was lower than the other phases (table
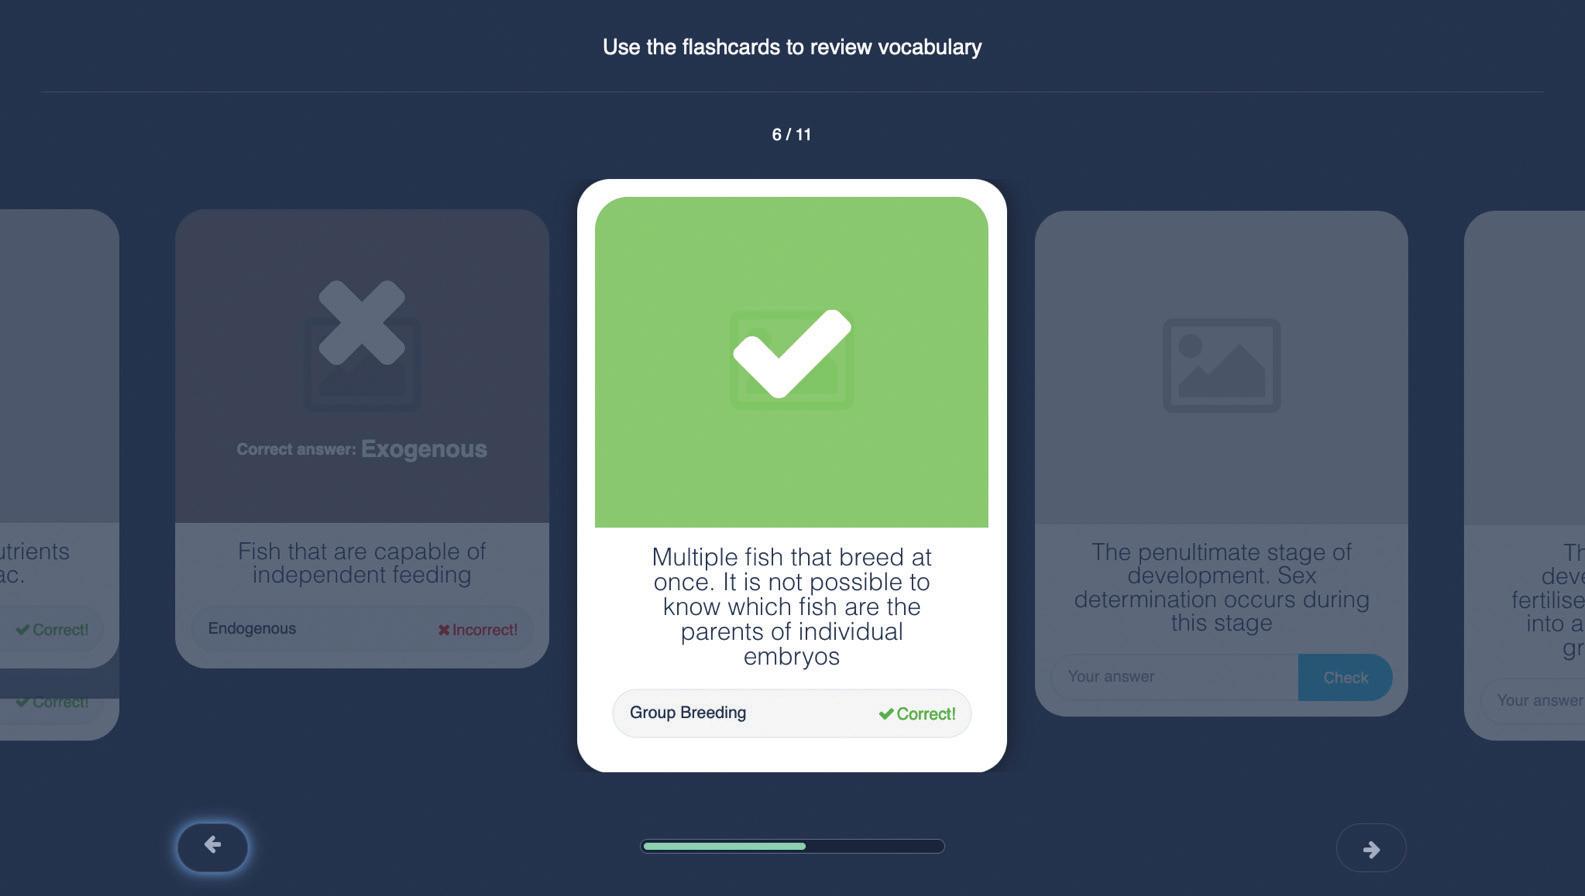
Figure 5: The vocabulary flash cards provided are direct and simplified in design.
3), which may indicate that human interaction is more impactful when in person. This is a current issue in the education field2,3. Despite this, it is crucial to include group activities in virtual learning as it is overall beneficial to students’ performance.
It should be noted, however, the above analyses cannot account for study habits, individual ability, and especially personal situations due to the pandemic. Further analysis of continued virtual learning performance, or the re-introduction of F2F learning, would help determine the latter’s role.
The results of translating a F2F course to virtual in a hurry implies that the intangibles of in-person learning were lost in transition and is therefore not effective. Both formats are advantageous, but virtual learning has to be carefully planned. Key points for improving a virtual transition are including human interaction and addition of simplistic and brief material. Training is not static, but dynamic and needs to change according to context. COVID has forced people to adapt and rethink ‘how we’ve always done it’. Just as we strive to constantly improve the ethical use of animals in research, we must apply that same ambition to how we approach training.
References
1. DiBattista D, Kurzawa L. 2011. Examination of the Quality of Multiple-choice Items on Classroom Tests. The Canadian Journal for the Scholarship of Teaching and Learning. 2(2). 2. Mahmood S. 2021. Instructional Strategies for Online Teaching in COVID-19 Pandemic. Human Behavior and Emerging Technologies. 3(1):199-203. 3. Nguyen MH, Gruber J, Marler W, Hunsaker A, Fuchs J, Hargittai E. 2022. Staying connected while physically apart: Digital communication when face-to-face interactions are limited. New Media & Society. 24(9):2046-2067.


