THE FLEET OUTLOOK 2022

THE GREEN ROAD AHEAD
How sustainability has become the key consideration for Britain’s fleets
 Powered by Fleet 250
How sustainability has become the key consideration for Britain’s fleets
Powered by Fleet 250
This is a pivotal year for the fleet sector as businesses emerge from the pandemic and the electrification of vehicles begins in earnest. Sustainability is now top of corporate agendas, and the transition to zero emission vehicles is a clear and powerful signal of intent to work towards net zero.
This report captures and analyses fleet plans for the next few years, highlighting intentions to operate electric vehicles, as well as the pain points that businesses still need to overcome as they the switch to battery power. EV charging, payment and employee-reimbursement solutions remain key challenges.
Fleet Outlook 2022 also addresses fleet attitudes to funding, the battle between vehicle manufacturers, dealers and leasing companies to ‘own’ the customer, and where fleet decision makers turn first to find the information they need for the successful adoption of electric vehicles.
The report has space only to showcase top level data from the detailed market analysis we have conducted. We have noted where there are significant discrepancies in approach and attitude between small and large fleets, but a more targeted approach to the market is also possible looking at the attitudes of fleets running fewer than 10, 11-20, 21-25, 26-49, 50-99 and 100-plus vehicles. This allows sales and marketing teams to undertake a more detailed analysis of target markets.
Finally, Fleet Outlook 2022 details the largest 250 fleets in the country, by the number of cars, vans and trucks they operate. These are the
‘weather makers’, the fleets with the buying power and corporate determination to drive changes that will cascade through the entire company car and van markets. Any ambitious supplier needs to have these fleets in its crosshairs.
Ian RichardsonManaging Director
360 Media Group
e: ian.richardson@360mediagroupltd.com

w: 360mediagroupltd.com
360 Media Group supports leading vehicle manufacturers, leasing companies and fleet service providers to make better informed sales and marketing decisions. Our unique data and analysis provide exceptional insights into the buying processes and intentions of fleet decision makers, from executives responsible for the UK’s largest fleets to directors at SMEs with a handful of cars. Our regular Barometer surveys and bespoke research projects generate robust evidence of fleet purchasing behaviours, operational pain points and key short, medium and long-term priorities. We conduct 300 in-depth fleet interviews on a quarterly basis, measuring 40 KPIs.
360 Media Group also offers our clients access to our fleet community via webinars, networking events and promoted content.
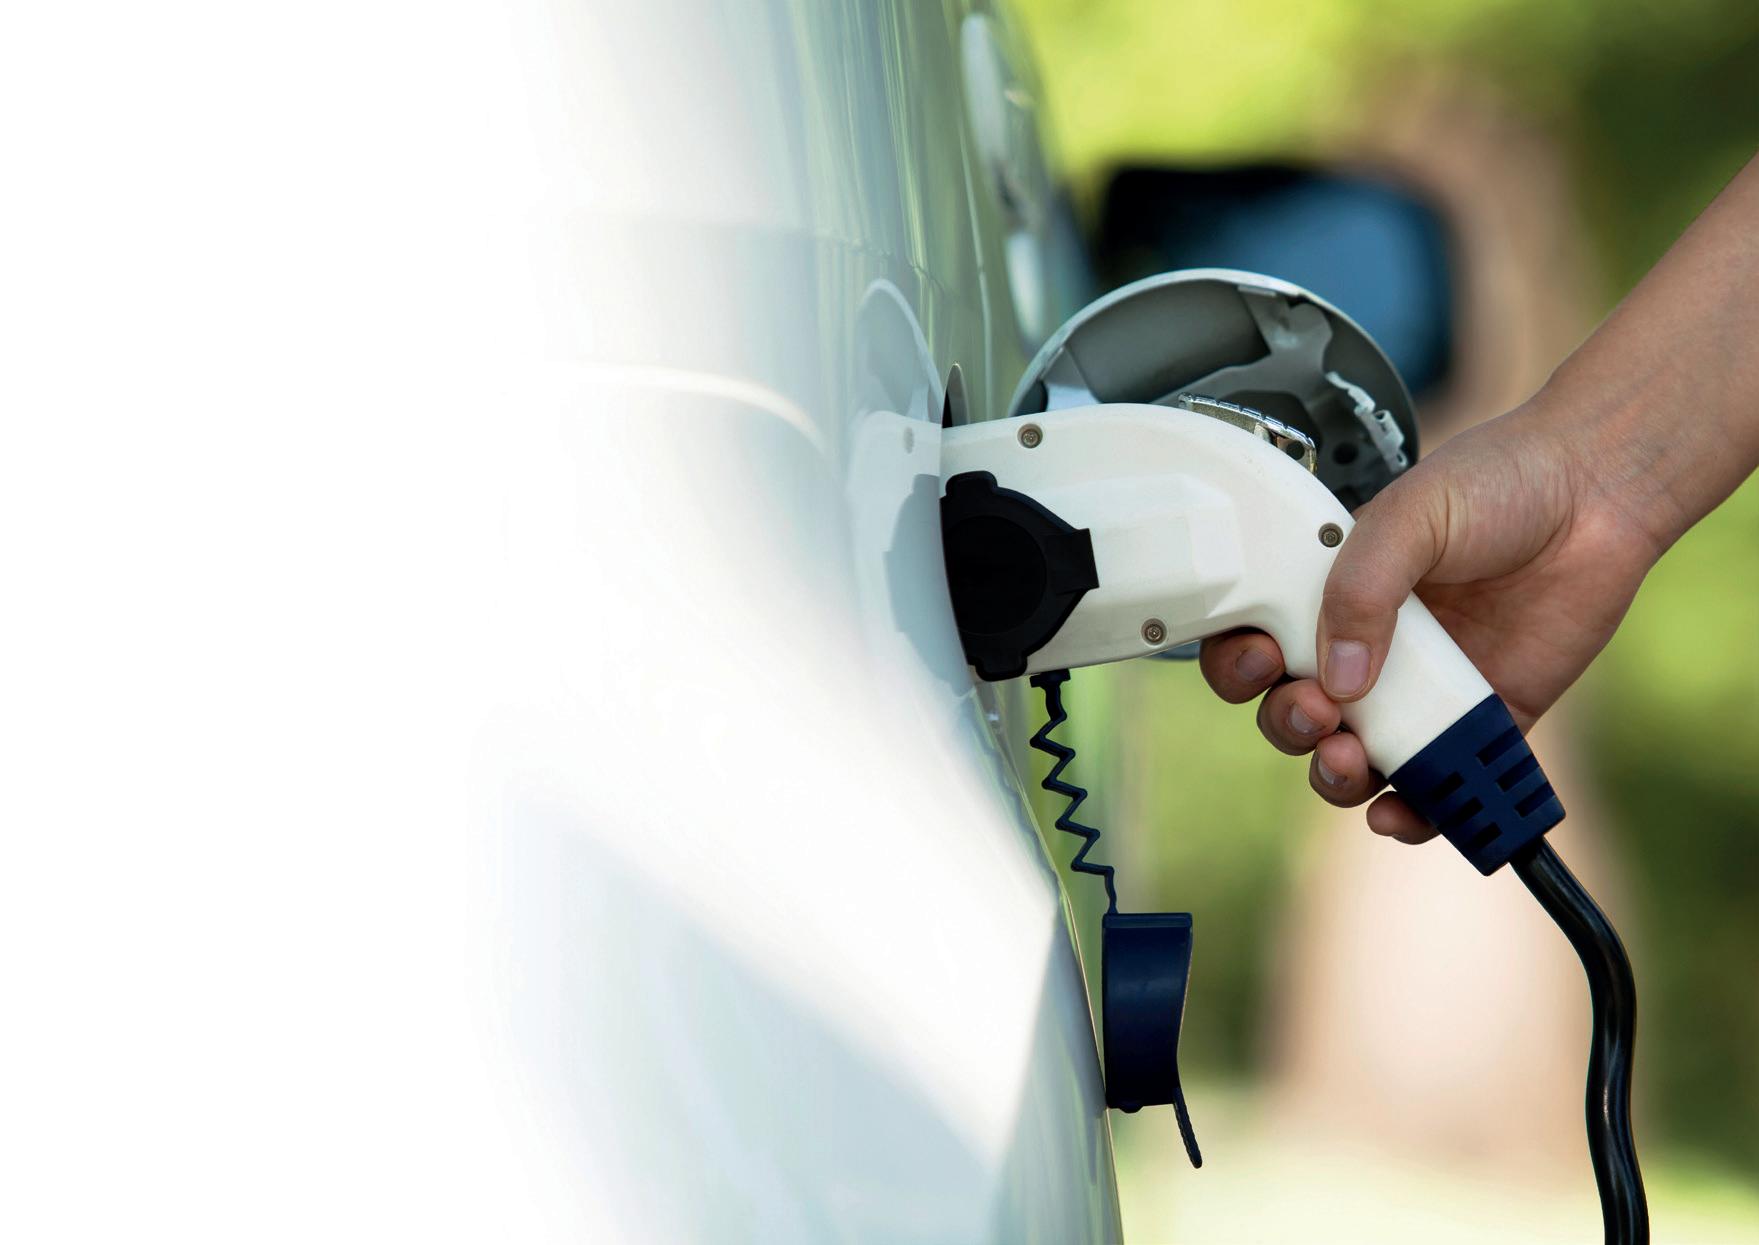
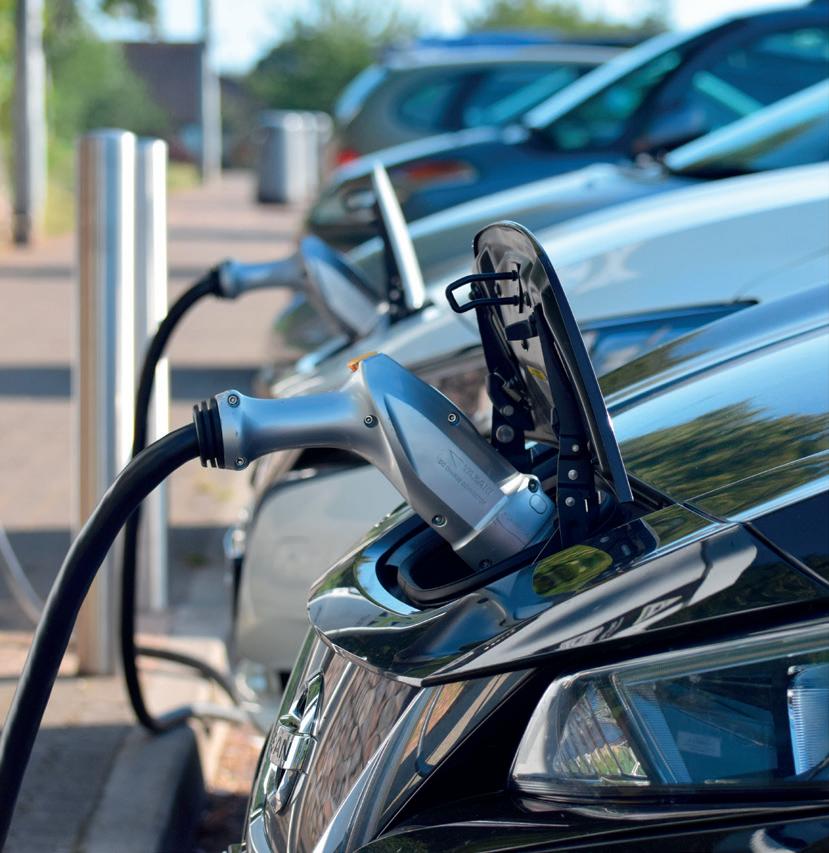
The typical 200-mile range of new electric cars is more than sufficient for the majority of company car drivers to complete journeys without having to stop to recharge; indeed, 43% of company car drivers only ever make journeys of less than 100 miles, making them prime candidates to switch to battery power. However, 22% of company car drivers do exceed 15,000 business miles per year, which presents charging difficulties for employees who do not have off-street parking where they can install a domestic charge point.
The use profile of light commercial vehicles makes them a significantly greater challenge to transition to electric than cars, a situation exacerbated by the negative impact on range of a full cargo of parcels, parts, tools and equipment. Two-thirds (65%) of fleet vans regularly drive more than 100 miles per day, and stopping mid-drive to recharge them represents a significant loss of productivity for businesses.
Vehicle reliability has improved to such an extent that avoiding costly repairs and downtime now rank lowest on reasons to replace company cars, a trend that is likely to develop further with the strong reliability of electric power trains. Somewhat surprisingly, safety is the number one reason for replacing company cars, followed by a host of sustainability related issues such as CO2 emissions, maintaining access to low emission zones and driver demand for cars with low benefit in kind tax charges.
Ease of budgeting is the number one criterion for fleets when assessing vehicle funding, particularly for fleets of 20 to 100 vehicles, where 71% identify the predictability of costs being a key consideration. This attitude plays into the hands of leasing and even subscription-type arrangements.
However, it is common for fleets to adopt multiple funding methods for their vehicles, with operating leases, finance leases and outright purchase frequently represented on the same fleet, if not to a similar volume.
The uncertainty of the pandemic followed by the shortage of new vehicles and the demand for electric models has led fleets to prioritise flexibility within their lease contracts. Fleets are looking both to extend existing contracts where necessary, but also to terminate other contracts early (without penalty) if it means they can switch a petrol or diesel model for an electric car.
There is a clear correlation between the size of a fleet and its requirement for support in emissions reduction. Sub-100 vehicle fleets, where there are less likely to be full-time fleet managers, are significantly more interested in support for emission-reduction initiatives than fleets running more than 100 vehicles.
More than half (56%) of fleets anticipate ordering their vehicles directly from a vehicle manufacturer, rather than through a dealer, although a similar percentage see their principal relationship being with their leasing supplier rather than a dealer or OEM.
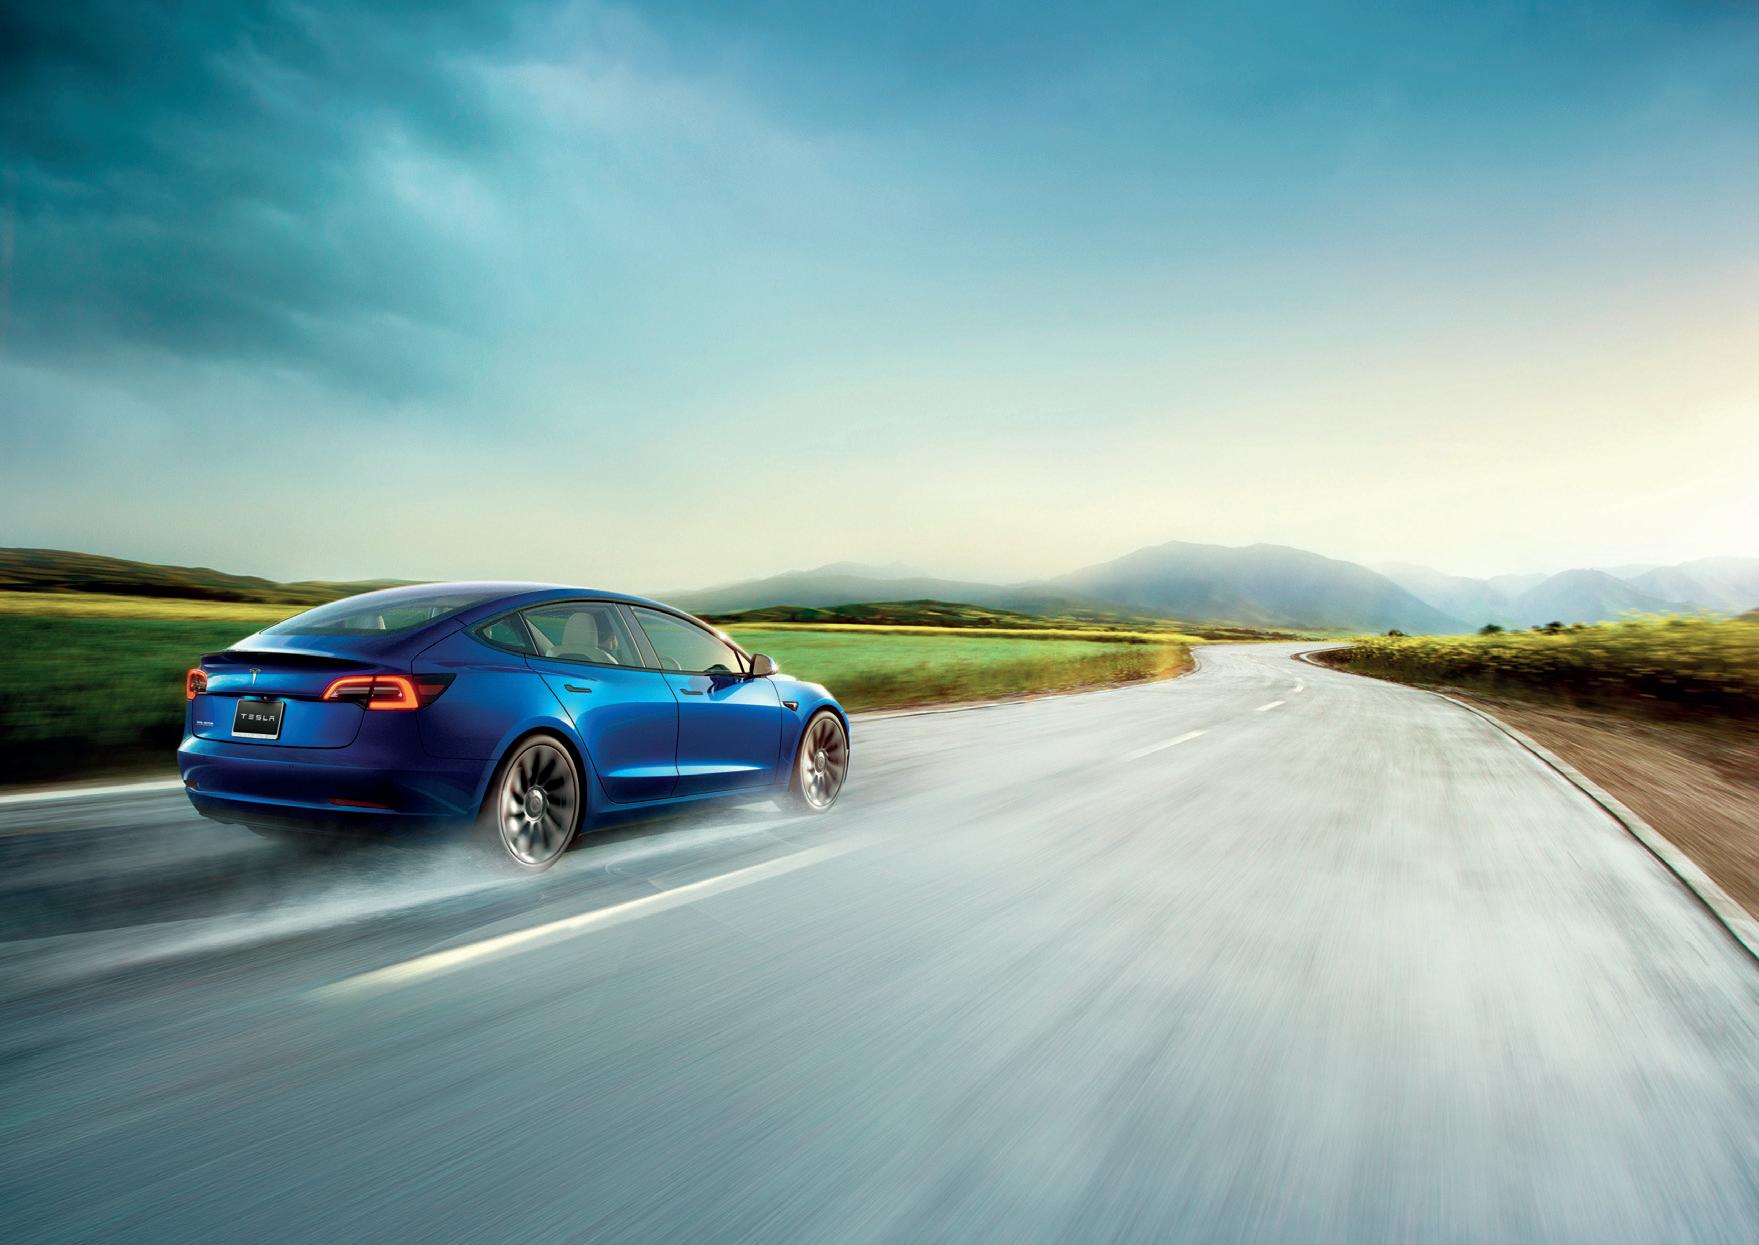
The number of fleets operating electric cars has doubled in the past three years, to 26% from 13%, and reaching 36% for 50+ car fleets. There has been a similar growth in the representation of plug-in hybrids, although their numbers are eclipsed by pure EVs. In terms of future intentions, 70% of fleets expect to order an EV this year, while almost a quarter (24.5%) do not intend to order a diesel-powered car in the next 12 months.
The introduction or prospect of ultra-low emission zones is the number one reason for fleets to select an electric car, thereby maintaining fee-free access to customers, followed closely by corporate social responsibility. Both of these motives have increased dramatically in importance in the last three years.
The transition to electric is facilitated by a 289% increase in driver demand for EVs over the past three years; 59% of fleets have actually seen employees return to the company car fold, thanks to the low benefit in kind tax rates for EVs, and 30% of fleets anticipate more drivers return to company cars this year. However, 27% of company car drivers are still resistant to EVs.
Fewer than half of fleets have redrafted their fleet policy / driver handbook to take account of EVs, failing to formalise policies for mileage reimbursements. This is a significant budgetary issue, given the importance of the lower per-mile cost of electricity, compared to petrol or diesel, for delivering competitive wholelife costs for EVs. It also raises the prospect of future headaches as drivers expect reimbursement for home, workplace and public charging, all of which have very different tariffs.
The significance of range as a barrier to EV adoption has increased in the last three years. There is a sense that the first wave of EV drivers had short and predictable journey profiles, whereas fleets are now looking for EVs to fulfil longer and less predictable business trips. The good news, however, is that cost of EVs and the importance of home charging have both declined sharply as perceived barriers to adoption.
More than nine-in-10 fleets are considering the installation of EV chargers at their workplaces to support both company car drivers and other employees. However, fewer than 20% of businesses are looking to make these charge points available to the wider public.
The transition of van fleets to electric power is still in its infancy compared to company cars, with 45% of operators yet to compile an e-LCV readiness report. A significant percentage of fleets are also looking for charging payment solutions and driver reimbursement mechanisms to enable their switch to electric vans.
More than three-quarters of electric van fleets are returning their vehicles to the depot overnight for recharging. While numbers of e-LCVs are still low, this secure and certain approach incurs the cost of installing charge points and potentially upgrading local grid connections, but means fleet operators can have full confidence that vehicles will have a full charge when they start the day. However, as a greater share of the LCV market electrifies, depot-based charging will have to be supplemented by home and public charging. Already, 57% of van fleets are having to rely on topup charges during the day, damaging productivity.
The official 5p per mile advisory electricity rate (AER) for reimbursing EV drivers for business miles are considered unfair by 44.5% of fleets, and more than half are actively seeking an alternative solution. This figure rises to 75% for large van fleets (the AER leaves drivers of e-LCVs particularly out of pocket). Almost two-thirds (64%) of large fleets are looking for a solution that accurately reimburses drivers for the actual
cost of electricity used, but in the absence of anything easier to use, 56% of fleets are using the AER.
The additional administrative complications of paying for EV charging, mean 41% of fleets want a payment solution to consolidate all charging expenditure into a single invoice.
Employers are putting in place procedures to help their company car and van drivers install a home charger, with 68% of fleets operating either a recommended or nominated supplier list. When looking for outside help, fleets are significantly more likely to look to their leasing company to oversee the installation of domestic charge points rather than vehicle manufacturers or dealers, despite the fact that some marques are including complementary chargers with each new EV and all have preferred suppliers.
Public charging may loom large in fleet operator imagination, but in practice is only moderately used. Only 4% of fleets rely on public charging for more than a quarter of their total charging needs. Occasional use of public chargers is far more common.
The total fleet size of Britain’s largest 250 fleets has shrunk slightly since the pandemic, down 3.4% to 581,779 vehicles. The smaller total is due to a 4.3% decline in the number of company cars, down to 238,390 units. This fall has been somewhat offset by an increase in the size of the Fleet250’s light commercial vehicle fleet, up 2.6% since 2020 to 295,158 units.
This appraisal of 200 UK fleets reflects the shape of the UK economy. It does not, however, reflect the importance of vehicles to different industry sectors. For example, vehicles are vitally important to the operation of blue light and utility fleets, even if these represent a relatively small share of the total parc. Moreover, the breakdown by industry fails to reflect that fact that
the largest sector (IT/software/leisure/media) is dominated by cars, whereas Transport/communications/distribution and Architecture/ construction/building are dominated by light commercial vehicles.
The data gathered for this report allows 360 Media Group to drill down into the profiles, plans and supplier expectations of each individual industry sector.
13% Wholesale/Retail/ Food/Medical
3% Utilities/Energy/Water/ Forestry/Fishing
14% Transport/ Communications/ Distribution
10% Architecture/ Construction/Building
2% Bluelight/ NHS Trusts
8% Government/ Public sector/ Education/Health
6% Heavy industries: Mining/ Engineering/Other
6% Insurance/ Accountancy/ Banking/Finance/Other
38% IT/Software/ Leisure/Media
Almost half (49%) of company cars undertake business journeys of at least 100 miles more than twice per week. Larger fleets are significantly more likely to have cars driving longer distances.
Company cars are used more than twice per week for business journeys by 81% of fleets.
42.5% of company cars typically drive less than 100 miles for individual business trips, making them prime candidates for a switch to electric without range anxiety.
More than half of all company cars drive at least 1,000 business miles per month.
Only 4% of company cars drive fewer than 5,000 business miles annually, highlighting the decline of the perk car sector.
Business trip statistics highlight the essential role of vans in keeping the wheels of business turning
The majority of light commercial vehicles are in almost daily use, whether driven for local business trips or national journeys. A slim majority (68%) drive less than 100 miles per trip, compared to 65% that make frequent journeys in excess of 100 miles.
The frequency of use and the fact that 65% of vans regularly drive more than 100 miles per trip highlights the challenge of transitioning to electric motors. The extra weight of racking, tools, and cargo limit range, while the lost productivity of downtime to recharge during the working day is a serious consideration for businesses.
30%
Few vans stand idle, with just three-in-10 used only once or twice per week for short journeys of less than 50 miles. This figure falls to 20% for occasional journeys of more than 100 miles.
Occasional national journeys (100+ miles per trip, once or twice per week)
Occasional local journeys (< 50 miles per trip, once or twice per week)
Frequent national journeys (100+ miles per trip)
Frequent local journeys (<100 miles per trip)
Operational experience suggests the conditions are right for longer holding periods for EVs
Three years remains the benchmark lease period; it will be interesting to track whether the contract extensions of 2021-22 and the switch to EVs, with their lower SMR costs, lead to longer leases.
77%
More than three-quarters of company cars are ending their fleet lives without any spike in SMR spend; repairs and downtime are no longer reasons to replace cars.
40%
More than half of fleets identify improvements in vehicle safety systems as a key reason to renew their company cars, highlighting the importance for OEMs to showcase the Advanced Driver Assistance Systems in their new models.
CSR targets and company car drivers’ benefit in kind tax bills are closely aligned, as employees seek electric cars with highly advantageous tax status, and businesses look to shrink their carbon footprints.
CO2 30% 20% 10% 0% 12 months 24 months 0%
Average length of car lease 36 months 15%
48 months 30%
60 months 45%
Other 60%
49%
The impact of vehicle breakdowns on business operations and fleet budgets means more (49%) decision makers investigate the reliability of potential company cars than any other selection criterion. “If only everything in life was as reliable...”
Safety features are as important as overall specification in search criteria, an important reminder for OEMs to promote Advanced Driver Assistance Systems as heavily as connected ‘infotainment’ options.
Information sought before ordering a new company car
Vehicle reliability
Brand/model reputation
Safety features
Car specifications
Servicing intervals
Lead times
Model reviews
Electric range
The low priority given to benefit in kind tax probably reflects the fact that so many new vehicle searches are now for EVs, which incur negligible tax of just 2% until 2025.
With no OEM offering a comprehensive range of EVs, fleet decision makers are no longer looking for a single badge supplier. Individual models that meet fleet requirements are prioritised over a solesupply agreement.
Location of franchised dealer
Dealer reviews
Flexibility of funding contract
BIK Tax
Range of models within the brand offering
59%
The certainty of fixed monthly repayments is the most important criterion when fleets decide on a method of finance, with ease of budgeting cited as a key consideration by 59% of businesses. This is especially the case for mid-size fleets running 20100 cars, for whom the figure rises as high as 71%. The figure drops for 100+ car fleets, which have the opportunity to spread risk and amortise unexpected costs over many more vehicles.
<20%
Smaller (<20 fleets) place less value on residual value risk protection than other fleets, which helps to explain why they are more likely to purchase than lease their cars.
Direct support for company car drivers is particularly highly valued by fleets of 20-50 cars, a sector with insufficient vehicles to justify employing a dedicated fleet manager, but with enough cars and drivers to generate significant volumes of administration and enquiries.
Contract hire, finance lease and outright purchase are the most common forms of funding company cars, with almost equal representation on fleets, albeit not in the same volumes.
Companies with 100+ cars are more likely to contract hire (45.5%) than purchase (36.4%) their vehicles.
Drivers with a cash allowance are 2.5 times more likely to use personal contract purchase than personal contract hire to fund their cars.
The smallest fleets (<10 cars) are least likely to use finance leasing, preferring to outright purchase their vehicles if they are going to take the residual value risk.
More than four-in-five leased vehicles is supplied with a service and maintenance contract, although this figure falls to 63.6% for large (100+) car fleets.
Tyre replacement is included in 62% of lease contracts, a further indication that fleets are looking for a genuinely fixed cost, easy-to-administer service when they decide to lease vehicles.
There is little evidence yet that fleets are looking to unbundle key value added services from lease contracts. If anything, the opposite seems true, with a number of fleets expressing interest in continental-style lease contracts that include insurance.
As a rule of thumb, the larger the fleet the more likely it is to be interested in sourcing each element of a full service lease independently, indicative of both the buying power of 100+ vehicle fleets as well as the internal administrative resource at their disposal.
63%
The race to electrification and the shortage of new cars due to the semiconductor crisis have seen almost two-thirds of fleets prioritise flexible lease contract terms, seeking the option to switch vehicles where possible. This is an exceptionally high priority among 100+ vehicle fleets, where 91% of respondents would consider changing their leasing supplier to gain more flexible contract terms.
23.5%
But fewer than one-in-four fleets would consider changing supplier merely to access immediately available vehicles, suggesting that no leasing company has significantly shorter lead times than its rivals.
Motives to consider changing leasing supplier vary significantly between 100+ vehicle fleets and sub-100 fleets. Larger fleets require much less support in emissions reduction initiatives (45.5% vs 64%); and place less weight on the provision of management reporting tools (36.4% vs 57%). This most likely reflects the fact that larger fleets have the resource to explore and implement sustainability programmes. They are also already likely to have dedicated fleet management software in place, either directly from their leasing supplier or a third party.
Are you considering changing your lease co?
45.5% 41%
Don’t know
13.5%
Access to immediately available vehicles
Access to pay-as-you go administration services related to driver
Provision of a suite of management and reporting tools
Support on emissions reduction initiatives
Increased administration support
A range of flexible contract terms and ability to switch vehicle
12%
The growth in lease van numbers between prepandemic 2019 Q3 and the same quarter of 2021.
72.4%
Almost three-quarters of lease cars are supplied to businesses, although personal contract hire is growing rapidly, up 17% in just 12 months between 2020 Q3 and 2021 Q3.
Business contract hire for cars declined between 2020 and 2021, but leasing companies are cofident of a resurgence thanks to the BIK-driven popularity of electric company cars.
48%
Almost half of fleets do no not need vehicles 365 days per year. The flexibility of car rental satisfies their requirements to cover short, fixed-term contracts as well as seasonal demand.
40%
Four-in-10 businesses will use a hire car to get new recruits mobile, but 70% of fleets will extend lease contracts, rather than incur the costs of hiring a car to bridge the gap between the de-fleet of one vehicle and the delivery of its replacement.
77%
More than three-quarters of company car drivers are scheduling service and maintenance work on their cars with office- or home-based days, or relying on garage courtesy cars, to avoid paying for a replacement hire car while their company car is in the workshop.
22%
Barely one-in-five fleets considers there is a future role for franchised dealers in new vehicle orders beyond delivery fulfilment. This falls to 9.1% for the largest (100+) car fleets.
56%
More than half of fleets anticipate ordering their vehicles directly from a manufacturer.
The battle to ‘own’ the customer continues to intensify, with 56.5% of fleets seeing their relationship with their leasing company, rather than dealer or OEM.
undermining
Which source for ordering company cars would you consider?
All lower emission technologies are increasing their share of the fleet sector 26%
Fuels represented on fleets, 2019 vs 2021
More than a quarter of fleets now have electric company cars, double the percentage of three years ago, and rising to over 36% for businesses with more than 50 cars.
Battery electric vehicles are better represented on fleets than plug-in hybrid models, with the gap widening since 2019. Fleets are now more likely to opt directly for electric power trains than drive PHEVs.
39.5%
Hybrid technology has become fleets’ preferred stepping stone away from diesel and towards lower emission technology, with 39.5% of fleets now running at least one hybrid car. The larger the fleet, the higher this percentage.
24.5%
Almost a quarter of fleets do not intend to order a diesel car in the next 12 months.
Proportion of new car orders by fuel type, 2022
The electric revolution is well under way, with 70% of fleets expecting to order an electric car in 2022.
Absolute electrification is still a remote prospect, with fleets waiting for cost effective vehicles in each category. As a result, only 4.5% of fleets now expect 100% of their orders to be electric.
Fleets are more likely to order self-charging hybrids in greater numbers than PHEVs. Anecdotal evidence suggests that if fleets are going to plug in a vehicle, they are increasingly likely to move directly for a pure battery electric model, while self-charging hybrids offer an attractive way to cut CO2 emissions without the particulate emissions associated with diesel or the charging infrastructure challenges of EVs.
Environmental considerations have overtaken costs as motives to switch to electric vehicles
Future-proofing fleet operations to avoid stiff daily charges to enter low emission zones (or even being barred from entry) is now the primary reason to adopt electric cars, followed closely by a desire to honour corporate social responsibilities.
There has been a four-fold increase in fleets turning to EVs to meet customers’ environmental expectations and demands.
Ultra-low emission zone journeys
Corporate Social Responsibility
Driver demand
To take advantage of government grants
Business contracts demand suppliers use of EVs
The decline in the importance of cost savings indicates that fleets already see cost parity or savings with EVs.
£1,500
The urgency of switching to EVs to take advantage of the Government’s £1,500 grant, while still available, has intensified as subsidies have shrunk.
289%
Driver demand for electric company cars has risen by 289% in three years.
Lower BIK tax

The benefit in kind tax advantages of electric cars are bringing cash allowance drivers back into car schemes
59% of fleets have already seen drivers return to company car schemes thanks to EV offerings. This compares to just 13% in 2019.
30%
30% of fleets expect more employees to migrate back into their company car schemes this year.
11% of fleet decision think EVs will not bring employees back to company cars, with this percentage rising to 18% in large fleets (100+ cars).
Yes, I have already noticed this Yes, in the next 12 months
No 9%
Fewer than half (49%) of fleets have rewritten their driver policies to take account of EVs, failing to formalise key issues such as reimbursement for home, workplace and public charging. Larger fleets (50+ cars) are much further advanced in rewriting their driver handbooks than smaller fleets.
We plan to update our driver policy shortly
42%
43%
A pro forma EV driver handbook that fleets could tweak to their own requirements could prove to be a highly valued offer from leasing and fleet management suppliers, given that 43% of fleets plan to revise their driver handbook to cover electric vehicles ‘shortly’.
Have you updated your driver handbook to cover EVs? Yes
49%
It’s been a short, steep learning curve, but decision makers feel they have a solid understanding of EVs
More than three-quarters of fleet decision makers feel confident in their knowledge of electric vehicle models, charging options and general EV management.
The larger the fleet the greater the fleet decision maker’s confidence in EV knowledge, signalling both the lead of bigger businesses towards zero emission motoring and the greater likelihood of a designated executive to manage the fleet.
Car fleet decision makers are more confident in their EV knowledge than van fleet operators, reflecting perhaps the greater operational demands of commercial vehicle fleets, and the fact that fleet managers have to play a greater role in overseeing e-LCVs than electric cars.
www.360mediagroupltd.com
Confidence level from 1 (not at all confident) to 10 (extremely confident)
Fleets are most likely to start their quest for EV information on a search engine, such as Google, with no dominant repository of trusted, useful information.
Comparison and leasing company websites are the first port of call for only 19% and 16% of fleets, respectively.
In the 25+ fleet sector, businesses are more likely to turn to a leasing company for EV information than a manufacturer.
In the sub-25 fleet sector, decision makers are far more likely to refer to manufacturer websites for their EV information than a leasing company site.
Interestingly, in the 100+ vehicle sector fleets are as likely to use a leasing company website as a manufacturer site for their EV information.
Longer range
Vehicle range is now the primary obstacle to fleets adopting EVs, cited as a barrier by 42% of decision makers.
Higher cost
32% of fleets still need convincing that the TCO of EVs is competitive with ICE vehicles.
More than a quarter (27%) of company car drivers are still resistant to EVs, despite the BIK wins.
4 5 6 10
Wider choice
26% of fleets still want a wider selection of electric vehicle sizes and body shapes. Admin burden 25% of decision makers think EVs require more admin for themselves and their drivers.
Managing charging payments and driver reimbursement is a barrier for a quarter of fleets.
7 8 9 10
The sharp, recent rise in energy prices is proving an obstacle for 24% of fleets.
Charging network 22% of fleets see the lack of charging infrastructure as an obstacle.
Doubts over future EV residual values and SMR costs make TCO modelling hard. Home charging Only 8% of fleets now say that their drivers’ ability to charge EVs at home is a barrier.
www.360mediagroupltd.com
Fleet decision makers are now more concerned about electric vehicle range than they were three years ago, despite a deluge of new battery-powered models capable of 200 miles between recharges. While the first wave of drivers to transition to EVs were typically selected due to the modest lengths of their daily journeys, drivers in the second and third waves of EV adoption have greater requirements for a longer range.
The substantially higher sticker price of EVs continues to be an obstacle to their uptake, despite mounting evidence of lower wholelife costs, due to tax advantages, fuel savings and cheaper service, maintenance and repair costs. Would an ‘all inclusive’ lease package, that included vehicle, finance, fuel and SMR persuade decision makers to adopt EVs more swiftly?
The rapid installation of home charging points has reassured fleet decision makers that many of their drivers will be able to charge their vehicles at home. This was a concern for a quarter of fleets in 2019, but only 8% in the latest survey, a decline of 68%.
Old obstacles have been overcome and new challenges arisen in the last three years
2x
Later adopters of electric company cars are more than twice as likely to want a like-for-like replacement in vehicle body shape when they switch to an EV.
9%
Fewer than one-in-10 large fleets (100+ cars) are waiting for EVs to have lower operating costs, compared to 40% of businesses with fewer than 20 cars; most likely due to a better understanding of TCO.
0-80% charge
The time it takes to give EV batteries a charge that delivers a meaningful mileage is a key consideration for the largest fleets, with 73% wanting to see shorter charging times. Recharging during the working day may impact employee productivity and is an issue for drivers without home chargers.
1/3
33% of fleets running 20+ cars (and 26.5% of all fleets) see the size and spread of public charging as a serious concern, and would be more likely to transition to EVs if charging infrastructure were better.
97%
Fleet decision makers are confident about future benefit in kind tax rates, with only 3% indicating that uncertainty is holding back their switch to EVs.
Changes needed to increase likelihood of buying
Lower operating costs
Longer vehicle range between charges
Lower purchase price
Shorter charging time
Increased availability of public charging
Ability to charge at home
Wider choice of EV body shapes
Remove admin burden of EV charging
Ability to charge at workplace
Affordable short-term rental of EVs
Access to quality used electric vehicles
Amortise cost of workplace chargers
More certainty on Government grants
Access to community chargers
Option to early terminate current lease
More certainty on future BIK tax
■
The operational demands placed on vans make the transition to battery power more difficult for fleets
The switch to electric vans is still in its infancy compared to car fleets, with 45% of operators still needing to compile an e-LCV readiness report. Van fleets are wrestling with how to balance operational objectives with CSR commitments.
Access live data on electric vehicle charge points
Access to a network of community chargers
Opportunity to terminate & replace lease agreement
The high acquisition cost of e-LCVs, particularly in the large van sector, has paved the way for almost a quarter of fleets to be interested in leasing used e-LCVs, although any supply of secondhand electric vans is likely to be severely limited in the next couple of years.
As a basic rule of thumb, van drivers are likely to earn less than company car drivers, which means a lower percentage will live in homes with off-road parking. This means fewer van drivers will have access to home charging, making the recharging of e-LCVs a more complicated challenge, with 43% of fleets seeking an EV reimbursement solution, 35% looking for an electric charge payment card and 21% interested in community charging solutions.
23% 13%
The time critical nature of some van fleet operations means 13% of fleets want access to live charge point information in order to minimise charging downtime.
Opportunity to lease used vans
Access to long-term demo vans
Fleet management software
Telematics for vans
Electric charge payment card
Electric charge payment reimbursement solution
Procurement study to identify the optimum e-LCVs
EV readiness report
Company car parks are set to see an invasion of EV chargers to support fleets and wider staff communities
More than nine-in-10 fleets are considering EV infrastructure at their premises.
Car fleets of all sizes show a similar appetite to install workplace chargers for all employees’ cars (both fleet and private), with 68% interested in this investment.
About two-thirds of medium-sized van fleets with 26-99 vehicles are interested in workplace chargers, but only one-third of the largest (100+) van fleets are investigating this option. Parking space, local grid capacity and the geographical dispersal of the biggest fleets means they are seeking alternative charging solutions.
Fewer than 20% of fleets are considering making their workplace chargers available to the public, although this figure rises to almost 30% for fleets with more than 25 cars.
78%
The vast majority of the first wave of e-LCV adopters are providing their own recharging solutions, by returning vans to the depot to recharge overnight. This secure and certain approach incurs the cost of installing charge points and potentially upgrading local grid connections, but means fleet operators can have full confidence that vehicles will have a full charge when they start the day.
57%
The limited range of e-LCVs means more than half are forced to top-up their batteries at public charge points during the day. Using route planning software to identify charge points near regular dwell spots or in convenient locations is vital for limiting lost productivity as employees wait for their vehicles to recharge.
17%
The lack of local charge points is a key issue for e-LCV operators if their drivers do not have a home charger. A slow (3-5kW) or fast (7-22kW) charge overnight is typically the cheapest charging solution, but only 17% of van drivers have this resource near their homes.
Drivers charge near their home (overnight)
Drivers charge at home
Public charge points
Top-up charge during the day
They return to depot and charge overnight
Combining home, workplace and public charging costs into a fair mileage rate is proving a headache
Almost half of fleets think HMRC’s official mileage reimbursement rate (AER) of 5p per mile is inadequate.
Almost three-quarters of large fleets (100+ cars) are setting their own EV mileage reimbursement rate.
64% of large fleets are actively seeking an EV payment solution. This figure rises to 75% for large van fleets.
25%
No 52%
Maybe 23%
Are you actively seeking an EV reimbursement solution?
Yes
Almost half of fleets want an EV charging payment solution that reimburses drivers accurately for their actual charging costs. This percentage rises to 64% for 100+ vehicle fleets.
Carbon reporting is surprisingly low on fleet agendas, although we will be tracking this carefully and would expect it to rise sharply as more businesses make CSR commitments and report their Scope 1, 2 and 3 greenhouse gas emissions.
1 bill
Fleets want the administrative simplicity of fuel cards to be extended to EV charging, consolidating home and public charging into a single invoice, and looking to itemise business and private mileages.
The risk of drivers facing an unexpectedly high electricity bill from their domestic energy supplier for home charging has led 40% of fleets to want a reimbursement solution that pays the energy supplier directly for all home recharging.
Precise payments for drivers’ actual charging costs
Single monthly invoice for entire fleet’s charging
Payments direct to drivers’ energy suppliers
Home and public charging combined
Ability to split business / personal miles
Tracking drivers’ energy supplier and tariff switches
Neither interested or uniterested
More than two-thirds of fleets have either a recommended list or a nominated supplier of home charger installation. More than 40% of fleets in the 11-25 vehicle category have a formal arrangement with a supplier.
We would like the vehicle manufacturer to arrange the installation
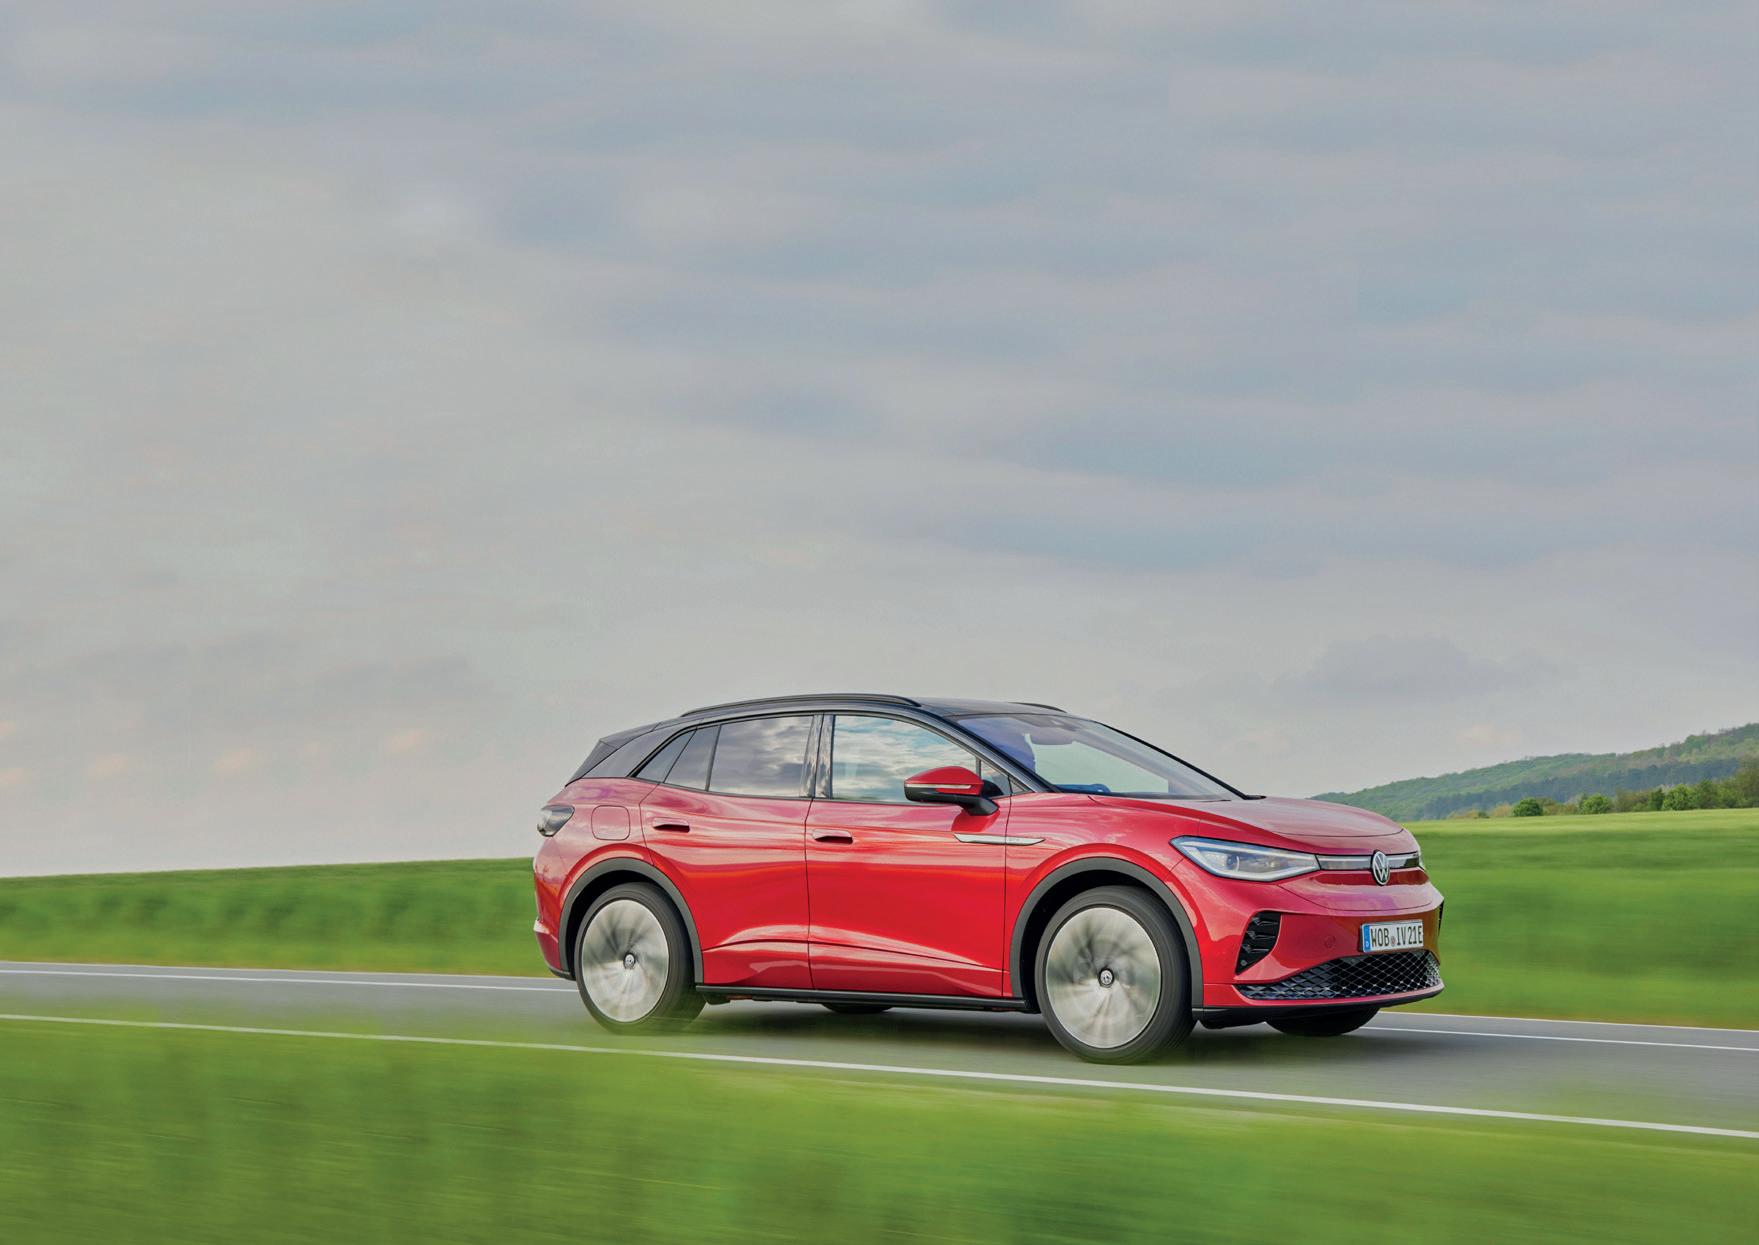
The closeness of the relationships between fleets and their leasing companies compared to their partnerships with manufacturers is thrown into stark relief by the fact that almost 20% of 100+ fleets would like their leasing supplier to arrange the installation of a home charger, while none expects the manufacturer to help. Only 4% of fleets, across all fleet sizes, want the manufacturer to get involved in this process, compared to 11.5% who would like leasing company support. This is surprising, given that OEMs such as Volvo and Audi have included a complementary wallbox with the sale of a new EV, and perhaps reflects the fact that leasing companies have direct contact with drivers.
We would like our leasing company to arrange the installation
It’s the driver’s responsibility
We have a formal arrangement with an installer
We have a list of recommended installers
The majority of fleets rely on home and workplace chargers
4%
Only 4% of fleets depend on the public charging infrastructure to recharge more than a quarter of their business miles, although this percentage more than doubles to 9.1% for 100+ vehicle fleets.
% of business miles powered by public charging
72.5% of fleets rely on public chargers for no more than a quarter of their charging needs. Over one third (34%) use public chargers for between 5-15% of their charging needs.
We would expect these percentages to rise as EVs start to reach company car drivers who do not have home chargers.
Even among the largest fleets, almost one-in-five (18.2%) use public chargers for less than 5% of their business miles.
A nationwide charging solution that enables company drivers to access multiple chargepoints, but generates a single invoice for the fleet, would encourage 85% of companies to include public charging within their electrification strategy.
Would a single nationwide public charging solution lead you to include it in your EV strategy?
Huge in scale but few in number, Britain’s 250 biggest car, van and HGV fleets account for a significant share of the total UK fleet market
Operating close to 600,000 vehicles, the largest 250 fleets in the UK wield extraordinary purchasing power in the company car, van and HGV sectors. Their fleet policies influence the shape of the entire fleet market, driving new product and service developments, especially in the areas of electrification, sustainability and driver support.
581,779
The total car, van and HGV fleet run by the Fleet250, down 3.4% on 2020’s figure of 602,330
The Fleet250 is not, however, a homogenous group. About 80% of the group are in the private sector and 20% in the public sector, all spread across different industries. These giant fleets have a mix of essential use and perk company cars, as well as huge numbers of light commercial vehicles deployed for the specific operational needs of their businesses.
238,390
The number of company cars run by the Fleet250, down 4.3% on 2020’s figure of 249,095
302,709
The number of light commercial vehicles run by the Fleet250, up 2.6% on 2020’s figure of 295,158
Words: Jonathan Manning Design: www.hilliard.design