Education Zone
Yangyang Yin a1739424
Project Title Education Zone Project An Education Zone in Adelaide CBD Author Yangyang Yin 1739424 Course Representation III DESST3515 Course Chair Carlos Bartesaghi Koc Tutor Sara Mirhadi Victor Calixto Sketchfab Model URL OPTION 1: https://skfb.ly/onosw URL OPTION 2: https://sketchfab.com/3d-models/education-zone-in-adelaide-cbd-7b6d857f9d0d4b8e8e70db18a0a5f11e
Contents Front Cover
Modified from PointCloud
Title Page 1
Contents
2
Introduction
3
Workflow
4
Site Analysis- Site
5
Site Analysis- Site and immediate surroundings
6
Model & Thermal Analysis
7
Section View
8
References Back Cover
1
Introduction The site is located at the North Terrace of Adelaide City in Australia. This site is focused on the education zone with surroundings in Adelaide CBD. The vast majority of site buildings are the North Terrace Campus of the University of Adelaide and the Where University of South Australia.
This model was downloaded from 2009 ELVIS. And it was created from Point Cloud, When segmented, and colored in CloudCompare. This model analyzes the environment of the site area through set different values of the ground and soil, vegetation, and building layer. Analyzing the surrounding area also can visualize the site environment at a better point. Moreover, this model also What visualizes the topography from cutting the site into sections and thermal analysis through coloring the site from blue to red.
The purpose of this project is to analyze the urban planning and potential environWhy mental impact of an educational area in the Adelaide Central Business District.
Potential audiences can be employees of government education departments and urban planning departments, school leaders, urban planners, landscape designers, Who and architects.
2
Workflow Assessment Reading University, Adelaide City
Purpose & Site Defining
Elevis, Opentopography Cloud
Model Downloading: PointCloud Model Site Confirming Ground & Soil Layer Vegetation Layer
Site Manipulating Site Segmenting Site Simulating
Building Layer
Site Coloring
Different Value Setting Site Analysing Surrounding Analysing
Sketchfab Uploading
Total area Analysing Section Cutting
Site Segmenting Example
Thermal Visualizing 3
Site Analysis
Site
Ground & Soil Layer
Vegetation Layer
Building Layer
4
Site Analysis
Site and immediate surroundings
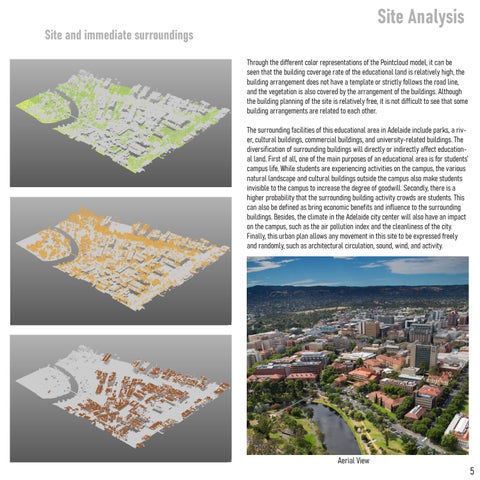
Through the different color representations of the Pointcloud model, it can be seen that the building coverage rate of the educational land is relatively high, the building arrangement does not have a template or strictly follows the road line, and the vegetation is also covered by the arrangement of the buildings. Although the building planning of the site is relatively free, it is not difficult to see that some building arrangements are related to each other. The surrounding facilities of this educational area in Adelaide include parks, a river, cultural buildings, commercial buildings, and university-related buildings. The diversification of surrounding buildings will directly or indirectly affect educational land. First of all, one of the main purposes of an educational area is for students’ campus life. While students are experiencing activities on the campus, the various natural landscape and cultural buildings outside the campus also make students invisible to the campus to increase the degree of goodwill. Secondly, there is a higher probability that the surrounding building activity crowds are students. This can also be defined as bring economic benefits and influence to the surrounding buildings. Besides, the climate in the Adelaide city center will also have an impact on the campus, such as the air pollution index and the cleanliness of the city. Finally, this urban plan allows any movement in this site to be expressed freely and randomly, such as architectural circulation, sound, wind, and activity.
Aerial View
5
Model & Thermal Analysis
Thermal analysis refers to the analysis of changes in the thermal energy of a building or an object. Thermal analysis can be defined by the density of the crowd. The color red to blue represents the thermal energy high to low. Through the visualizing point cloud model, it can be concluded that the higher the height of the building, the higher the thermal energy, the denser the building, the higher the thermal energy, and the vegetation has no thermal energy. Also, the heat energy in the city center is generally higher than in suburban areas. When looking at the urban design of an educational area, it is also important to visualize how the building and the vegetation interacting with each other to balance the thermal energy.
6
Section View
Looking at the section view, the educational area in the Adelaide city is relatively flat. There are also some areas where there is a difference in the height of the terrain, but the uneven terrain is well used by the building to closely integrate the terrain and the building.
7
References
https://www.adelaide.edu.au/ https://www.hangtimemedia.com/location-icon-png-3/ https://www.iconsdb.com/gray-icons/time-6-icon.html https://www.pngkey.com/detail/u2q8o0t4i1u2y3w7_city-buildings-png-transparent-images-clipart-icons-building/ https://toppng.com/ost-navigation-people-icon-grey-PNG-free-PNG-Images_227660 https://iconscout.com/icon/mission-1669778 http://www.adelaideconvention.com.au/university-of-adelaide-aerial-view-adelaide/
8