Western Journal of Emergency Medicine: Integrating Emergency Care with Population Health
Indexed
Clinical Practice
842 Neoplastic Incidentalomas in the Emergency Department: Incidence, Imaging Type, Location, and Clinical Relevance
C Nasta, R Morelli, AI Facciuto, F Palumbo, M Finelli, V Brunelli, M Puoti, A Palumbo, A Voza, G Paolisso, M Giordano
848 De-Labeling of Penicillin Allergy in the Emergency Department at a Veterans Affairs Hospital
B Chen, PKT Nguyen, M-P Pham, C Koh, CJ Graber
855 A Systems-based Emergency Department Intervention to Conserve Intravenous Fluids During a National Shortage
PD Jenkins, O Xu, K DeVane, M Hartenstein, H Manella, B Burns
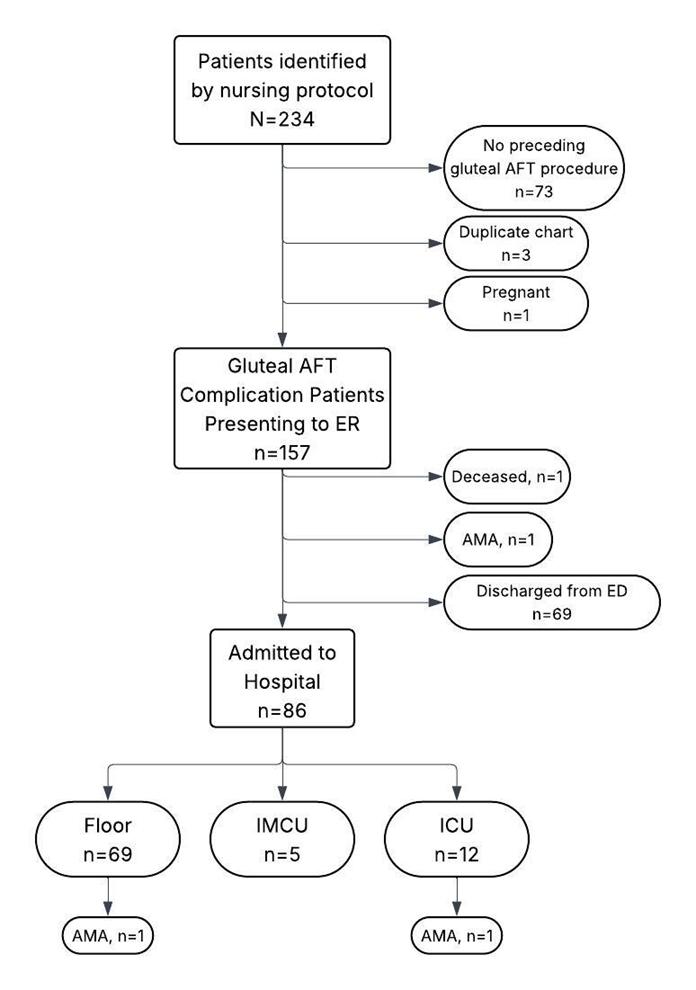
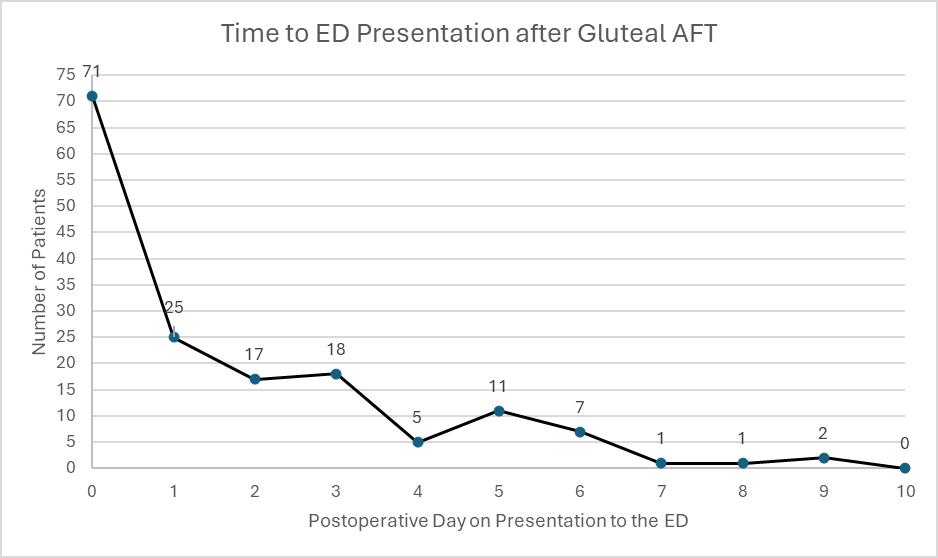
861 Autologous Fat Transfer Procedure Complications in Four Emergency Departments in Miami, Florida
MB Lee, J Goldstein, D Hercz, M Pyle
Behavioral Health
869 Emergency Department-initiated Naltrexone for Alcohol Use Disorder: Association with Recidivism
O Warren, J Gress, T Lin, M Lippmann, G Bubly
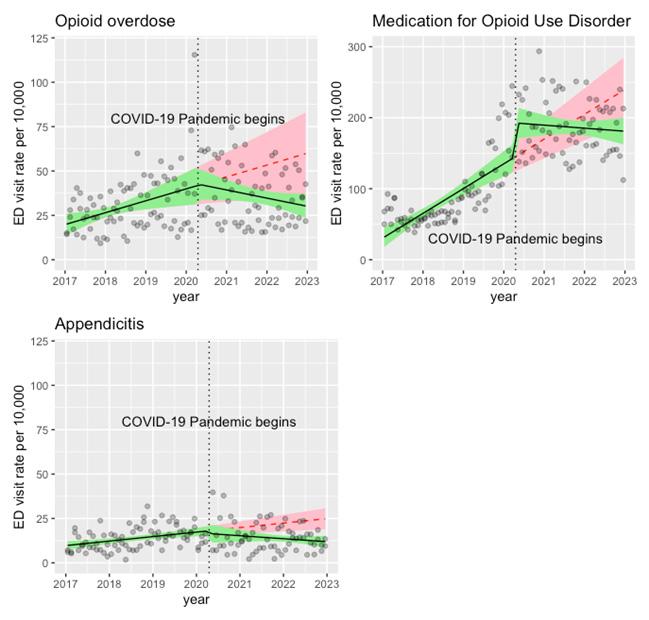
875 Opioid Overdose-Related Emergency Department Visits Pre- and Post-COVID-19
MF Molina, SD Pimentel, MC Raven, KT LeSaint, DG Dillon
880 Impact of Substance Use Disorder Curriculum and X-Waiver Training on Emergency Medicine Residents
C Chukwunyere, J Heil, R Haroz
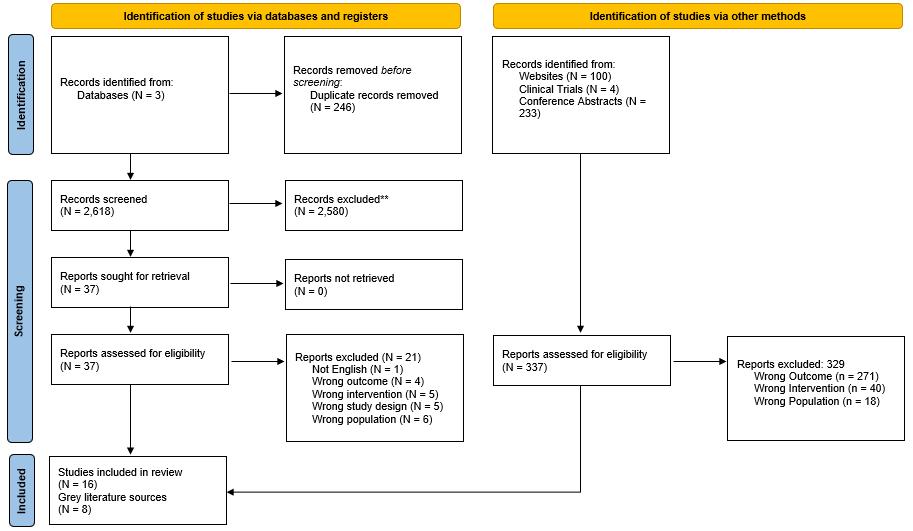
886 Oxygen Saturation Thresholds for Opioid-induced Respiratory Depression: A Systematic Review
A Manes, J Sran, I Samra, B Dhaliwal, A Soliman, N Puri
Penn State Health Emergency Medicine
About Us: Penn State Health is a multi-hospital health system serving patients and communities across central Pennsylvania. We are the only medical facility in Pennsylvania to be accredited as a Level I pediatric trauma center and Level I adult trauma center. The system includes Penn State Health Milton S. Hershey Medical Center, Penn State Health Children’s Hospital and Penn State Cancer Institute based in Hershey, Pa.; Penn State Health Hampden Medical Center in Enola, Pa.; Penn State Health Holy Spirit Medical Center in Camp Hill, Pa.; Penn State Health Lancaster Medical Center in Lancaster, Pa.; Penn State Health St. Joseph Medical Center in Reading, Pa.; Pennsylvania Psychiatric Institute, a specialty provider of inpatient and outpatient behavioral health services, in Harrisburg, Pa.; and 2,450+ physicians and direct care providers at 225 outpatient practices. Additionally, the system jointly operates various healthcare providers, including Penn State Health Rehabilitation Hospital, Hershey Outpatient Surgery Center and Hershey Endoscopy Center.
We foster a collaborative environment rich with diversity, share a passion for patient care, and have a space for those who share our spark of innovative research interests. Our health system is expanding and we have opportunities in both academic hospital as well community hospital settings.
Benefit highlights include:
• Competitive salary with sign-on bonus
• Comprehensive benefits and retirement package
• Relocation assistance & CME allowance
• Attractive neighborhoods in scenic central Pennsylvania
OCTOBER 17 | 8AM - 5PM
Plan to join California’s emergency medicine community for a day of advocacy, education, networking, and career growth!
FREE for Cal/AAEM Members | $35 for AAEM members and non-members
Please note: You must be a CAL/AAEM member for free registration.
More event details and registration information to be announced!
Western Journal of Emergency Medicine:
Integrating Emergency Care with Population Health
Indexed in MEDLINE, PubMed, and Clarivate Web of Science, Science Citation Index Expanded
Andrew W. Phillips, MD, Associate Editor DHR Health-Edinburg, Texas
Edward Michelson, MD, Associate Editor Texas Tech University- El Paso, Texas
Dan Mayer, MD, Associate Editor Retired from Albany Medical College- Niskayuna, New York
Gayle Galletta, MD, Associate Editor University of Massachusetts Medical SchoolWorcester, Massachusetts
Yanina Purim-Shem-Tov, MD, MS, Associate Editor Rush University Medical Center-Chicago, Illinois
Section Editors
Behavioral Emergencies
Bradford Brobin, MD, MBA Chicago Medical School
Marc L. Martel, MD Hennepin County Medical Center
Ryan Ley, MD
Hennepin County Medical Center
Cardiac Care
Sam S. Torbati, MD Cedars-Sinai Medical Center
Rohit Menon, MD University of Maryland
Elif Yucebay, MD Rush University Medical Center
Mary McLean, MD
AdventHealth
Climate Change
Gary Gaddis, MD, PhD University of California, Irvine School of Medicine- Irvine, California
Clinical Practice
Casey Clements, MD, PhD Mayo Clinic
Murat Cetin, MD
Behçet Uz Child Disease and Pediatric Surgery Training and Research Hospital
Carmine Nasta, MD Università degli Studi della Campania “Luigi Vanvitelli”
David Thompson, MD University of California, San Francisco
Tom Benzoni, DO Des Moines University of Medicine and Health Sciences
Critical Care
Christopher “Kit” Tainter, MD University of California, San Diego
Joseph Shiber, MD University of Florida-College of Medicine
David Page, MD University of Alabama
Antonio Esquinas, MD, PhD, FCCP, FNIV Hospital Morales Meseguer
Mark I. Langdorf, MD, MHPE, Editor-in-Chief University of California, Irvine School of MedicineIrvine, California
Shahram Lotfipour, MD, MPH, Managing Editor University of California, Irvine School of MedicineIrvine, California
Gary Gaddis, MD, PhD, Associate Editor University of California, Irvine School of Medicine- Irvine, California
Rick A. McPheeters, DO, Associate Editor Kern Medical- Bakersfield, California
R. Gentry Wilkerson, MD, Associate Editor University of Maryland
Dell Simmons, MD Geisinger Health
Disaster Medicine
Andrew Milsten, MD, MS UMass Chan Medical Center
John Broach, MD, MPH, MBA, FACEP University of Massachusetts Medical School
Christopher Kang, MD Madigan Army Medical Center
Scott Goldstein, MD
Temple Health
Education
Danya Khoujah, MBBS University of Maryland School of Medicine
Jeffrey Druck, MD University of Colorado
Asit Misra, MD University of Miami
Cameron Hanson, MD The University of Kansas Medical Center
ED Administration, Quality, Safety
Gary Johnson, MD Upstate Medical University
Brian J. Yun, MD, MBA, MPH Harvard Medical School
Laura Walker, MD Mayo Clinic
León D. Sánchez, MD, MPH Beth Israel Deaconess Medical Center
Robert Derlet, MD
Founding Editor, California Journal of Emergency Medicine University of California, Davis
Tehreem Rehman, MD, MPH, MBA Beth Israel Deaconess Medical Center
Anthony Rosania, MD, MHA, MSHI Rutgers University
Neil Dasgupta, MD, FACEP, FAAEM Nassau University Medical Center
Emergency Medical Services
Daniel Joseph, MD Yale University
Joshua B. Gaither, MD University of Arizona, Tuscon
Brian Yun, MD, MPH, MBA, Associate Editor Boston Medical Center-Boston, Massachusetts
Michael Pulia, MD, PhD, Associate Editor University of Wisconsins Hospitals and Clinics- Madison, Wisconsin
Patrick Joseph Maher, MD, MS, Associate Editor Ichan School of Medicine at Mount Sinai- New York, New York
Donna Mendez, MD, EdD, Associate Editor University of Texas-Houston/McGovern Medical School- Houston Texas
Danya Khoujah, MBBS, Associate Editor University of Maryland School of Medicine- Baltimore, Maryland
Julian Mapp, MD University of Texas, San Antonio
Shira A. Schlesinger, MD, MPH Harbor-UCLA Medical Center
Tiffany Abramson, MD University of Southern California
Jason Pickett, MD University of Utah Health Geriatrics
Stephen Meldon, MD Cleveland Clinic
Luna Ragsdale, MD, MPH Duke University
Health Equity
Cortlyn W. Brown, MD Carolinas Medical Center
Faith Quenzer, DO, MPH Temecula Valley Hospital San Ysidro Health Center
Victor Cisneros, MD MPH Eisenhower Health
Sara Heinert, PhD, MPH Rutgers University
Naomi George, MD, MPH University of Mexico
Sarah Aly, DO Yale School of Medicine
Lauren Walter, MD University of Alabama
Infectious Disease
Elissa Schechter-Perkins, MD, MPH Boston University School of Medicine
Ioannis Koutroulis, MD, MBA, PhD George Washington University School of Medicine and Health Sciences
Stephen Liang, MD, MPHS Washington University School of Medicine
Injury Prevention
Mark Faul, PhD, MA Centers for Disease Control and Prevention
Wirachin Hoonpongsimanont, MD, MSBATS Eisenhower Medical Center
International Medicine
Heather A. Brown, MD, MPH Prisma Health Richland
Taylor Burkholder, MD, MPH Keck School of Medicine of USC
Christopher Greene, MD, MPH University of Alabama
Chris Mills, MD, MPH Santa Clara Valley Medical Center
Shada Rouhani, MD Brigham and Women’s Hospital
Legal Medicine
Melanie S. Heniff, MD, JD Indiana University School of Medicine
Statistics and Methodology
Shu B. Chan, MD, MS Resurrection Medical Center
Soheil Saadat, MD, MPH, PhD University of California, Irvine
James A. Meltzer, MD, MS Albert Einstein College of Medicine
Monica Gaddis, PhD University of Missouri, Kansas City School of Medicine
Emad Awad, PhD University of Utah Health
Musculoskeletal
Juan F. Acosta, DO, MS NYU Langone Hospital
Neurosciences
Rick Lucarelli, MD Medical City Dallas Hospital
William D. Whetstone, MD University of California, San Francisco
Antonio Siniscalchi, MD Annunziata Hospital, Cosenza, Italy
Pediatric Emergency Medicine
Muhammad Waseem, MD Lincoln Medical & Mental Health Center
Cristina M. Zeretzke-Bien, MD University of Florida
Jabeen Fayyaz, MD The Hospital for Sick Children
Reshvinder Dhillon, MD University of Southern Alabama
Kathleen Stephanos, MD University of Mississippi Medical Center
Official Journal of the California Chapter of the American College of Emergency Physicians, the American College of Osteopathic Emergency Physicians, the California Chapter of the American Academy of Emergency Medicine, and Official International Journal of the World Academic Council of Emergency Medicine (WACEM)
Available in MEDLINE, PubMed, PubMed Central, CINAHL, SCOPUS, Google Scholar, eScholarship, Melvyl, DOAJ, EBSCO, EMBASE, Medscape, HINARI, and MDLinx Emergency Med. Members of OASPA.
Quincy Tran, MD, Deputy Editor University of Maryland School of Medicine- Baltimore, Maryland World Academic Council of Emergency Medicine
Editorial and Publishing Office: WestJEM/Depatment of Emergency Medicine, UC Irvine Health, 3800 W. Chapman Ave. Suite 3200, Orange, CA 92868, USA Office: 1-714-456-6389; Email: Editor@westjem.org
Western Journal of Emergency Medicine:
Integrating Emergency Care with Population Health
Indexed in MEDLINE, PubMed, and Clarivate Web of Science, Science Citation Index Expanded
Section Editors (Continued)
Public Health
John Ashurst, DO, MSc, EdD Lehigh Valley Health Network
Tony Zitek, MD Kendall Regional Medical Center
Erik S. Anderson, MD Alameda Health System-Highland Hospital
Toxicology
Jeffrey R. Suchard, MD University of California, Irvine
Howard Greller, MD Rutgers University
Trauma
Pierre Borczuk, MD Massachusetts General Hospital/Havard Medical School
Lesley Osborn, MD University of Colorado Anschutz Medical Campus
Ultrasound
J. Matthew Fields, MD Thomas Jefferson University
Chris Baker, MD University of California, San Francisco
Shane Summers, MD Brooke Army Medical Center
Robert R. Ehrman, MD, MS Wayne State University
Ryan C. Gibbons, MD Temple Health
Robert Allen, MD Keck Medicine of USC
Women’s Health
Elisabeth Calhoun, MD, MPH Trinity Health
Marianne Haughtey, MD Zucker School of Medicne at Hofstra/Northwell
Official Journal of the California Chapter of the American College of Emergency Physicians, the American College of Osteopathic Emergency Physicians, the California Chapter of the American Academy of Emergency Medicine, and Official International Journal of the World Academic Council of Emergency Medicine (WACEM)
World Academic Council of Emergency Medicine
Available in MEDLINE, PubMed, PubMed Central, CINAHL, SCOPUS, Google Scholar, eScholarship, Melvyl, DOAJ, EBSCO, EMBASE, Medscape, HINARI, and MDLinx Emergency Med. Members of OASPA.
Editorial and Publishing Office: WestJEM/Depatment of Emergency Medicine, UC Irvine Health, 3800 W. Chapman Ave. Suite 3200, Orange, CA 92868, USA Office: 1-714-456-6389; Email: Editor@westjem.org
Western Journal of Emergency Medicine:
Integrating Emergency Care with Population Health
Indexed in MEDLINE, PubMed, and Clarivate Web of Science, Science Citation Index Expanded
Amin A. Kazzi, MD, MAAEM
The American University of Beirut, Beirut, Lebanon
Anwar Al-Awadhi, MD
Mubarak Al-Kabeer Hospital, Jabriya, Kuwait
Arif A. Cevik, MD United Arab Emirates University College of Medicine and Health Sciences, Al Ain, United Arab Emirates
Brent King, MD, MMM University of Texas, Houston
Daniel J. Dire, MD University of Texas Health Sciences Center San Antonio
David F.M. Brown, MD Massachusetts General Hospital/ Harvard Medical School
Douglas Ander, MD Emory University
Edward Michelson, MD Texas Tech University
Edward Panacek, MD, MPH University of South Alabama
Editorial Board
Hoon Chin Steven Lim, MBBS, MRCSEd Changi General Hospital
Cassandra Saucedo, MS Executive Publishing Director
Isabella Choi, BS WestJEM Publishing Director
Annie Zhang, BS WestJEM Associate Publishing Director
Omid Haghkhah , BS CPC-EM Publishing Director
June Casey, BA Copy Editor
Official Journal of the California Chapter of the American College of Emergency Physicians, the American College of Osteopathic Emergency Physicians, the California Chapter of the American Academy of Emergency Medicine, and Official International Journal of the World Academic Council of Emergency Medicine (WACEM)
Available in MEDLINE, PubMed, PubMed Central, Europe PubMed Central, PubMed Central Canada, CINAHL, SCOPUS, Google Scholar, eScholarship, Melvyl, DOAJ, EBSCO, EMBASE, Medscape, HINARI, and MDLinx Emergency Med. Members of OASPA. Editorial and Publishing Office: WestJEM/Depatment of Emergency Medicine, UC Irvine Health, 3800 W. Chapman Ave. Suite 3200, Orange, CA 92868, USA Email: Editor@westjem.org
Western Journal of Emergency Medicine:
Integrating Emergency Care with Population Health
Indexed in MEDLINE, PubMed, and Clarivate Web of Science, Science Citation Index Expanded
JOURNAL FOCUS
Emergency medicine is a specialty which closely reflects societal challenges and consequences of public policy decisions. The emergency department specifically deals with social injustice, health and economic disparities, violence, substance abuse, and disaster preparedness and response. This journal focuses on how emergency care affects the health of the community and population, and conversely, how these societal challenges affect the composition of the patient population who seek care in the emergency department. The development of better systems to provide emergency care, including technology solutions, is critical to enhancing population health.
Table of Contents
Emergency Department Operations
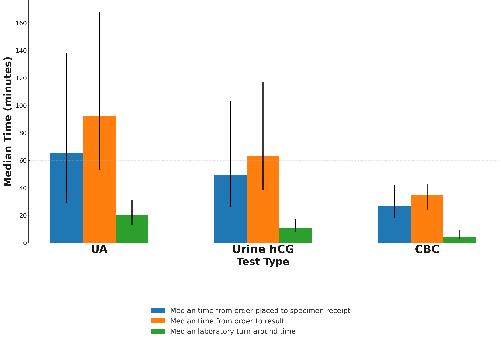
895 The Impact of Urinalysis Turnaround Times on Patient Disposition in the Emergency Department
DE Baymon, P Hernández, P Chen, LD Sanchez, D Im, Bukhman, JW Joseph
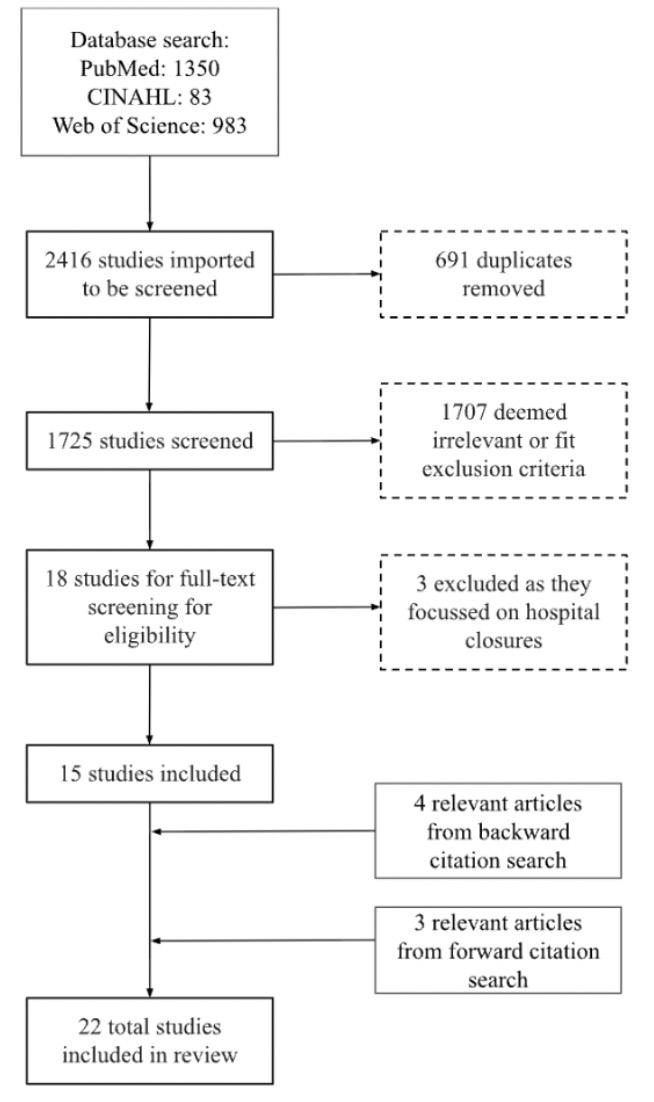
899 Emergency Department Closures and Patient Outcomes: Scoping Review of Impacts on Care, Equity, and System Performance
Z Ridha, A Steiner, H Son, S Upadyhe, S Strobel
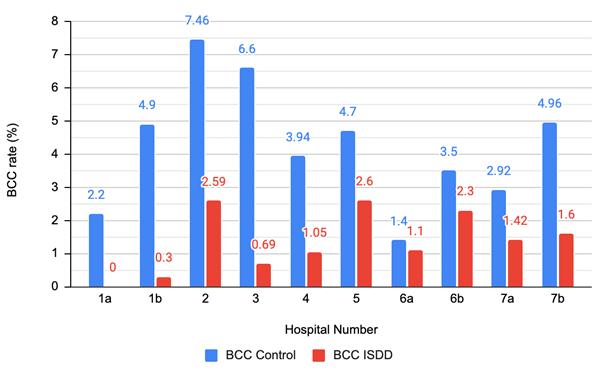
913 Initial Specimen Diversion Devices for Emergency Department Blood Cultures May Reduce Contamination Rates and Costs: Structured Literature Review
MD Ayres, MC Johnson, ME Andersen, AP Lewis, LS Farrow, AM Vopat, KM Spears
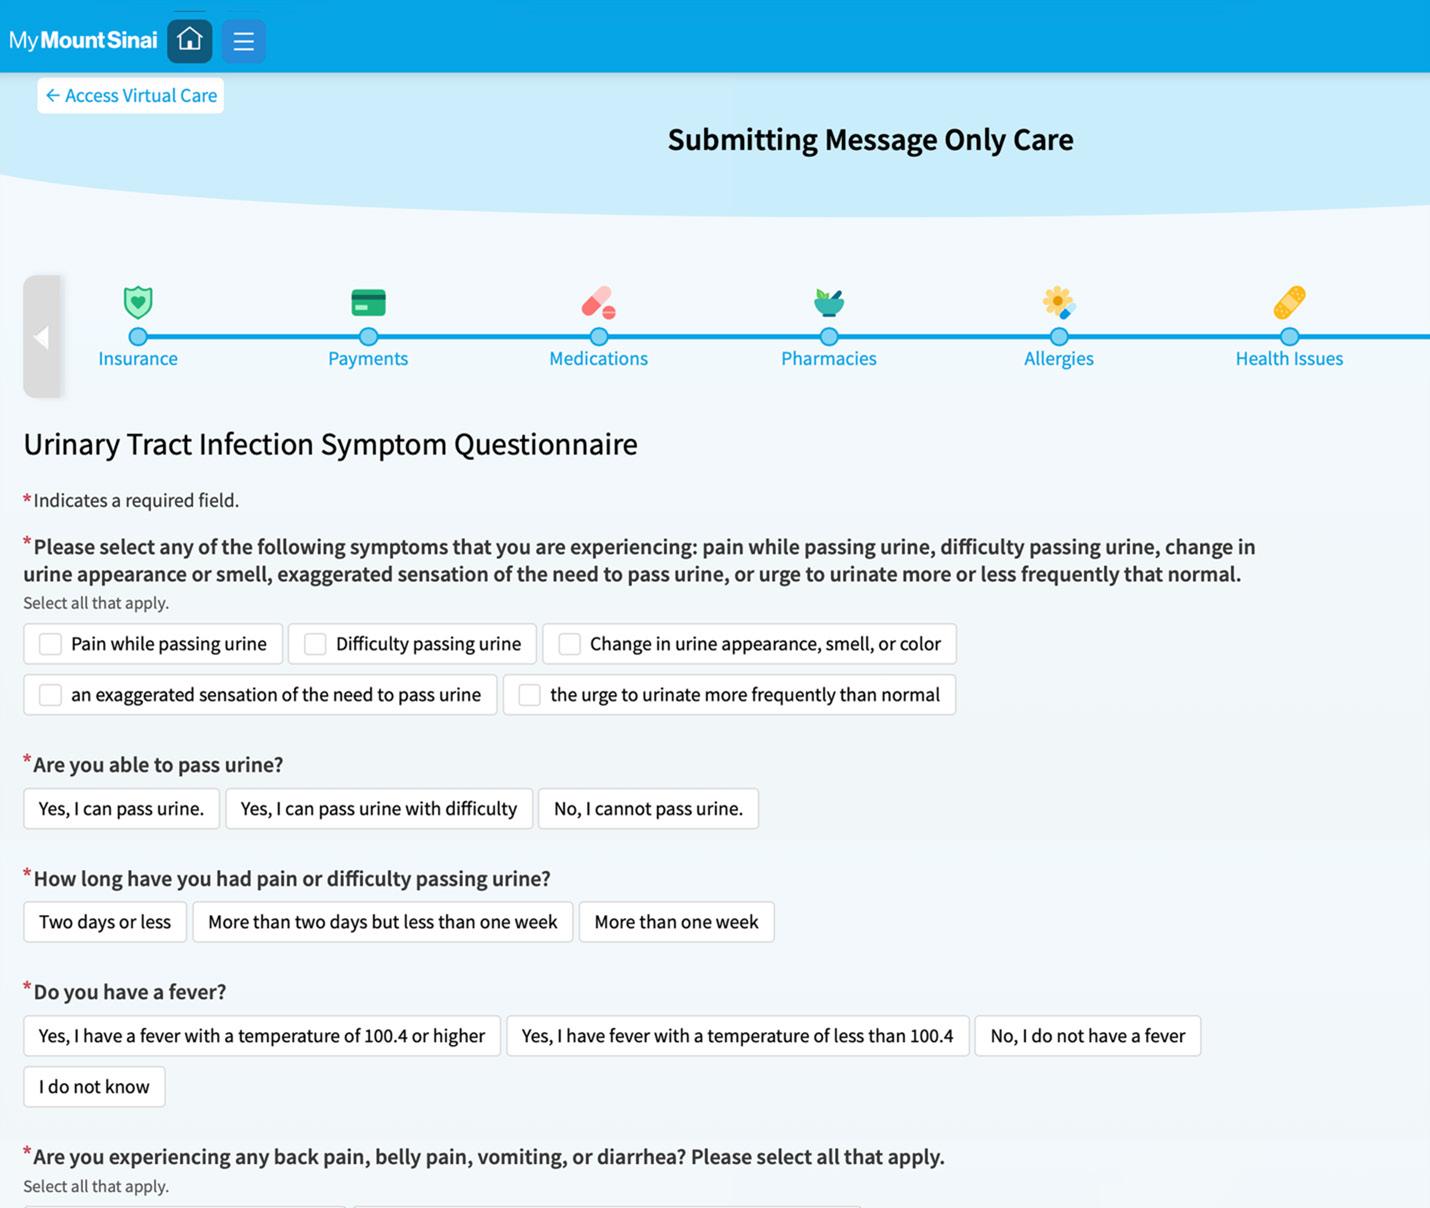
920 Clinical Characteristics of an Emergency Department-led Asynchronous Care Platform
S Shah, I Suri, H Gordon, N Schwartz, R Hossain, D Apakama, R Khakhkhar, T Marren, BS Abella, N Gavin, EE Abbott
Trauma
930 Potentially Avoidable Spine Transfers to a Level I Trauma Center: A Five-Year Retrospective Analysis
CM Marks, RC Burke, C Rasner, M Stippler, CL Rosen
938 Temporal Trends in Mortality from Gunshot Wounds for Emergency Medical Services Compared to Private Vehicle Transport
G Muller, K Miller, L Matheson, X Wang, L Gharahbaghian, P D’Souza, M Gautreau, MYAB Yiadom
947 A Quality Improvement Campaign Reduces Head and Cervical Spine Imaging in Low-risk Trauma Patients
JC Luke, RN Kubick, HJ Sucharew, K Winkler, ML Giles, NE Kreitzer, AL Goel, DO Thompson
Critical Care
956 Patient Monitor Position and Operator Ability to Visualize a Desaturation Event During Intubation
E Boccio, R Perkins, J Bonz
964 Emergency Front-of-neck Access: Comparing Needle and Surgical Cricothyrotomy Using a Human Cadaver Model
E Boccio, D Levi, J Bonz, J Belsky, J D’Amore
Policies for peer review, author instructions, conflicts of interest and human and animal subjects protections can be found online at www.westjem.com.
Western
Journal of Emergency Medicine:
Integrating Emergency Care with Population Health
Indexed in MEDLINE, PubMed, and Clarivate Web of Science, Science Citation Index Expanded
Table of Contents continued
971 Comparison of Emergency Department Boarders Managed by a Critical Care Consult Service versus Standard Care
M Johnson, A Bracey, A Ata, W DaSilva, SP Geary, I Aly, W Hayashi, R Leavitt, J Mantas, C Hanowitz, L Duncan, D Pauze, GP Wu
Women’s Health
977 Single Question vs Ongoing Violence Assessment Tool for Intimate Partner Violence Screening
G Nonawzki, Z Zhou, M Mohan, S Slowey, D Carden, R Hoelle
985 Association of Pregnancy Documentation with Radiological Imaging in the Emergency Department
AG Campbell, A Knies, P Musey, KK Ryckman, S Gharbi, S Wiehe
Toxicoloy
994 Point-of-care Ultrasound for Detecting Methamphetamine-associated Heart Failure in the Emergency Department
M Nashu, J Lam, Z Khan, S Saadat, R Almog, R Goubert, J Wasmund, H Choi, S Lahham, E Hsu, M Guy, JC Fox
1002 Rapid Turnaround Time for Toxic Alcohol Testing Is Associated with Shorter Hospital Length of Stay
S Chen, J Yudiono, V Vohra, R Lipscomb, R Mhaskar, JK Arnold, D Dean
Education
1011 Implementing a Multimodal Palliative Care Curriculum: Impact on Knowledge, Confidence, and Skills
T Hase, C Ndiaye, M Putman
1018 Does Skin Color Influence Differential Diagnosis Generation in a Simulated Cardiac Arrest?
HE Miller, C Tarrant, M Lamberson, C Nicholas, K Dolbec
Technology in Emergency Medicine
1023 Impact Evaluation of a Clinical Point-of-care Ultrasound Intervention in an Academic Emergency Department
A Platt, T Peterson, E Peethumnongsin, M Kuchibhatla, RG Theophanous
1034 Increase in Ultrasound-guided Nerve Blocks Observed After Implementation of a Nerve Block Supply Cart in the Emergency Department
A Jin, A Cohen, A Virella, N Bielawa, M Miller, M Nelson
Emergency Medical Services
1046 No “Golden Hour” in Alaska: Characteristics and Implications of Medevac-centered Emergency Care
B Rice, C Williams, CY Chang, J Wood, H Saul, A Pritchard, G Day, T Thomas, D Hao, C Britton, R Onders, T Hernandez-Boussard
Emergency Department Workforce
1048 Unveiling Unwritten Curricula: Enhancing Junior Faculty Development in Academic Emergency Medicine
A Bierowski, C Morrone, E Hoag, R Ghei, M Pasirstein, J Blaszczak, D Papanagnou
Western Journal of Emergency Medicine:
Integrating Emergency Care with Population Health
Indexed in MEDLINE, PubMed, and Clarivate Web of Science, Science Citation Index Expanded
Table of Contents continued
Disaster Medicine
1062 9-1-1 Call Data Modeling to Assess the Influence of a Mass Gathering on Host Community Metrics for Syndromic Surveillance
AH Yancey, E Robinson, T McMahan, GA Cotsonis
Health Outcomes
1073 Using “Own-Point-of-View” Video and Stimulated Recall to Reveal Physician Thought Processes: A Methodology Paper
M Manojlovich, C Cassady, SJ Parker, E Davis, C Ahr, D Ryamukuru, A Wang, K Pasupathy, H Singh, P Mahajan
Cardiology
1082 Social Deprivation Index Is Associated with 90-Day Emergency Department Revisits, but Not Admission, for Acute Heart Failure
RR Ehrman, NE Harrison, BD Haber, SJ Korzeniewski, MJ Favot, L Khait, PD Levy
Musculoskeletal
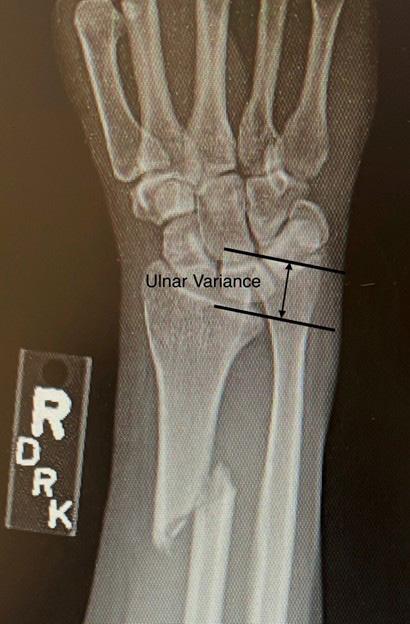
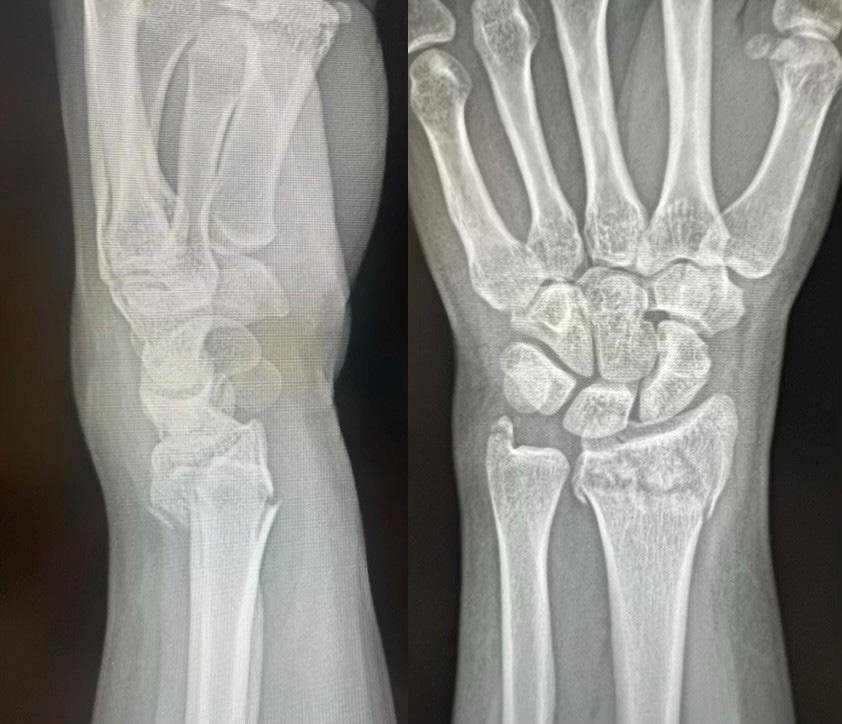
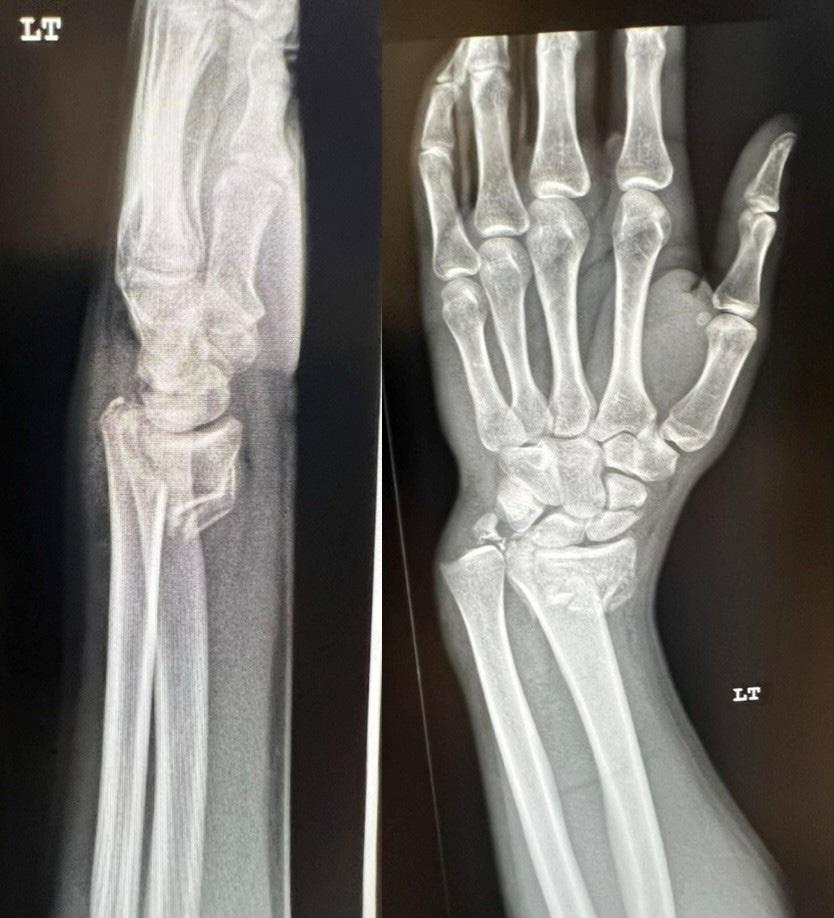
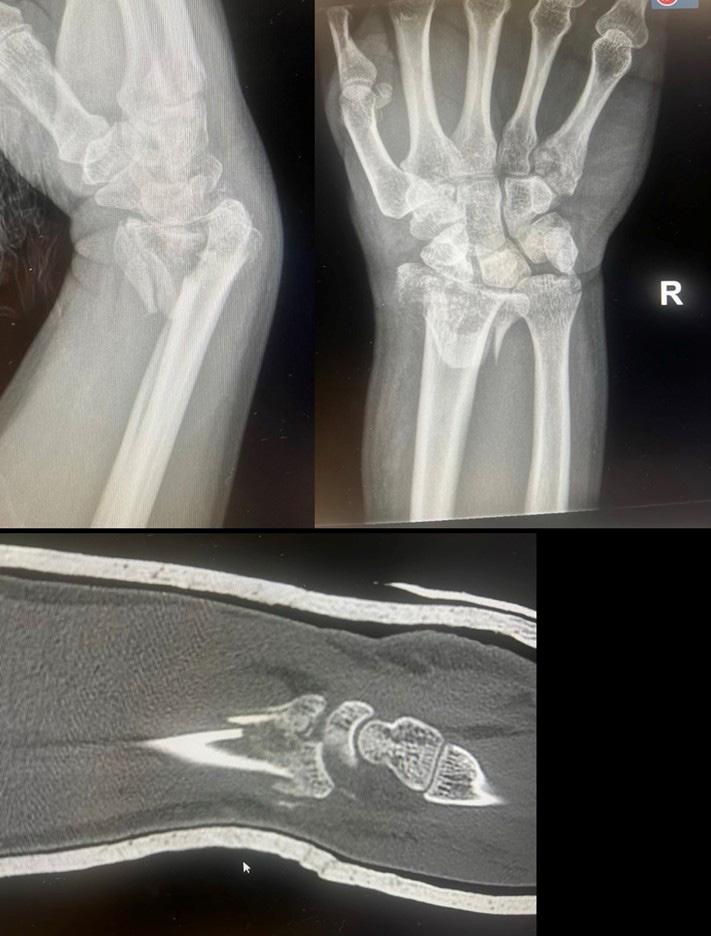
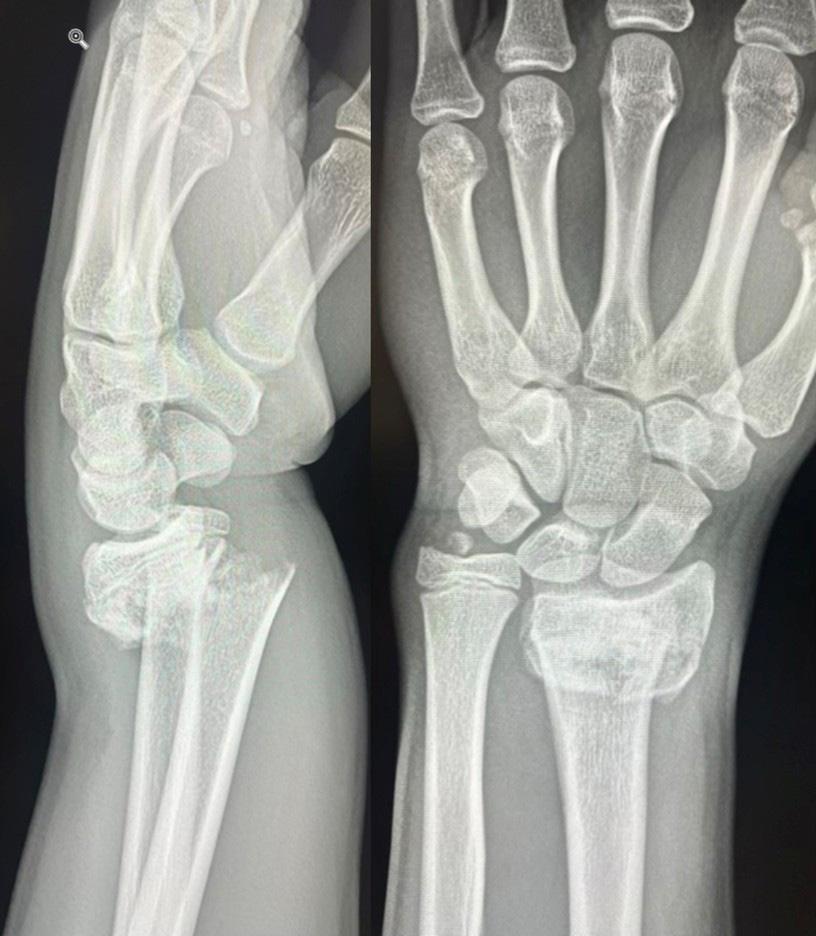
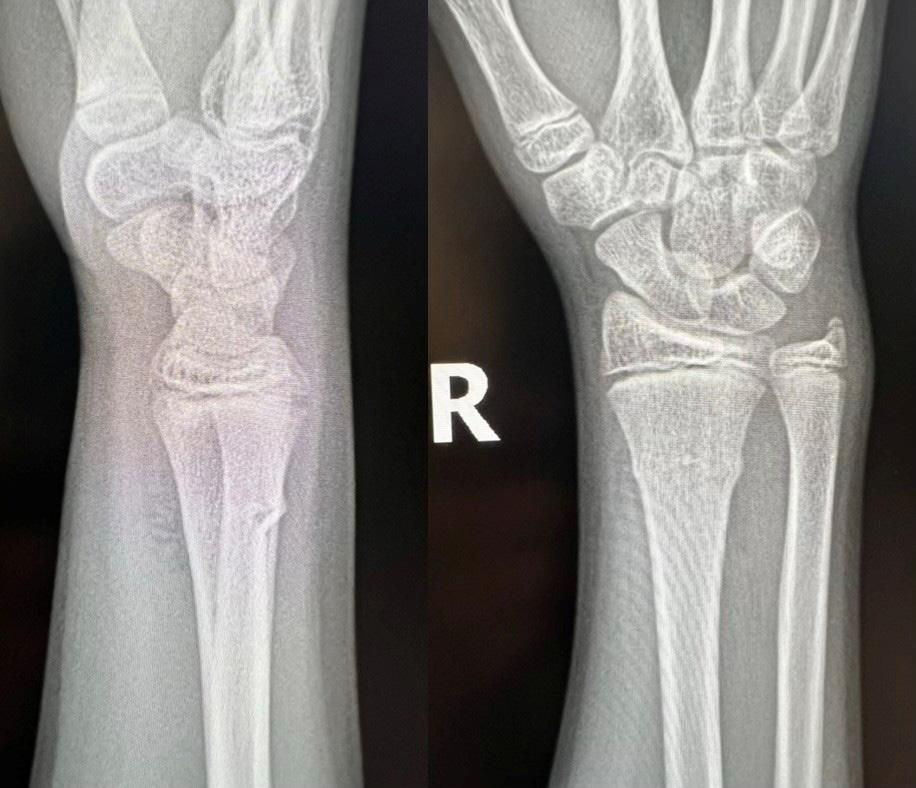
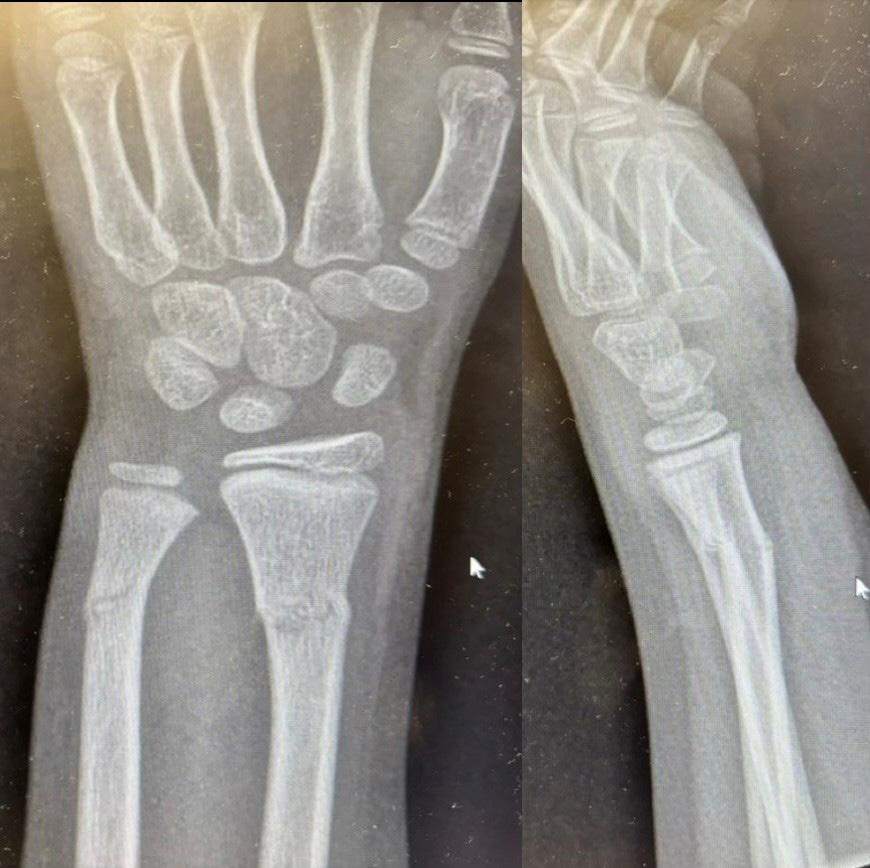
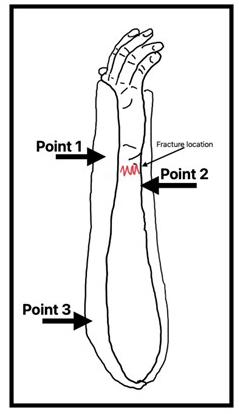
1090 Emergency Medicine Management of Distal Radius and Ulna Fractures: Narrative Review
T Kirchberg, R Nolan, S Tomberg
Climate Change
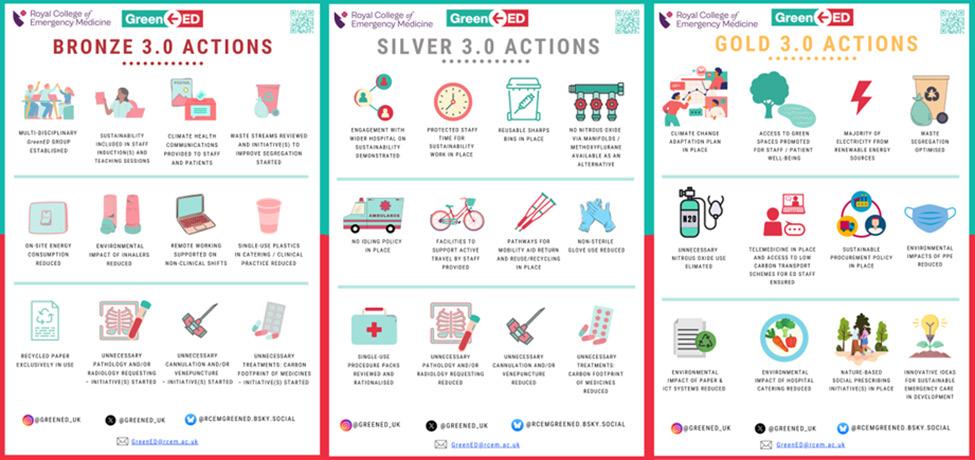
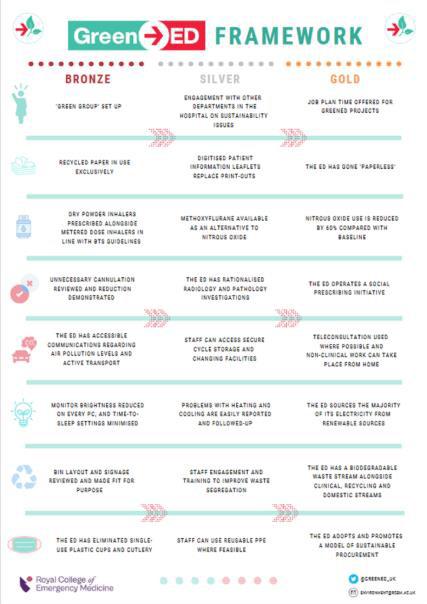
1105 Cultivating Environmentally Sustainable Emergency Departments with GreenED
JL Wood, A Robertson, T Spruell, Z Steley
Letters to the Editor
1113 Comment: Regarding Racial Disparities in Door-to-Clinician Time for Cardiac Chest Pain in the Emergency Department
CAI Ventura, AD Cabanilla, EE Denton
1115 Reply: Regarding Racial Disparities in Door-to Clinician Time for Cardiac Chest Pain E Awad
Western Journal of Emergency Medicine:
This open access publication would not be possible without the generous and continual financial support of our society sponsors, department and chapter subscribers.
Professional Society Sponsors
American College of Osteopathic Emergency Physicians
California American College of Emergency Physicians
Academic
Department of Emergency Medicine Subscriber
Alameda Health System-Highland Hospital Oakland, CA
Ascension Resurrection Chicago, IL
Atrium Health Wake Forest Baptist Winston-Salem, NC
Baylor College of Medicine Houson, TX
Baystate Medical Center Springfield, MA
Beth Israel Deaconess Medical Center Boston, MA
Brigham and Women’s Hospital Boston, MA
Brown University Providence, RI
Capital Health Regional Medical Center Trenton, NJ
Carilion Clinica-Virginia Tech Carilion School of Medicine Roanoke, VA
Carolinas Medical Center Charlotte, NC
Cedars-Sinai Medical Center Los Angeles. CA
Cleveland Clinic Cleveland, OH
Corewell Health William Beaumont University Hospital Los Angeles, CA
Denver Health Medical Center Denver, CO
Desert Regional Medical Center
Palm Springs, CA
Detroit Medical Center/Wayne State University Detroit, MI
Duke University Hospital Durham, NC
Eisenhower Health
Rancho Mirage, CA
Emory University Atlanta, GA
Florida International University of Herbert Westchester, FL
Franciscan Health Olympia Fields
Olympia Fields, IL
Geisinger Health System Danville, PA
State Chapter Subscriber
Arizona Chapter Division of the American Academy of Emergency Medicine
California Chapter Division of the American Academy of Emergency Medicine
Florida Chapter Division of the American Academy of Emergency Medicine
International Society Partners
George Washing University Washington, DC
HealthPartners - Regions Hospital St Paul, MN
Hennepin County Medical Center Minneapolis, MN
Henry Ford Hospital Detroit, MI
Henry Ford Wyandotte Hospital Wyandotte, MI
INTEGRIS Health
Oklahoma City, OK
Kaweah Delta Health Care District Visalia, CA
Kern Medical Bakersfield, CA
Lehigh Valley Hospital and Health Network Allentown, PA
Loma Linda University Medical Center (Adult)
Loma Linda, CA
Loma Linda University Medical Center (Peds) Loma Linda, CA
Louisiana State University Shreveport Shreveport, LA
Loyola University Medical Center
Cook County, IL
Maimonides Medical Center
Brooklyn, NY
Massachusetts General Hospital Boston, MA
Mayo Clinic College of Medicine Rochester Rochester, MN
Mayo Clinic College in Arizona Phoenix, AZ
Mayo Clinic College in Florida Jacksonville, FL
Medical College of Wisconsin Affiliated Hospitals Milwaukee, WI
Morristown Medical Center Morristown, NJ
Mount Sinai Medical Center Miami Beach Miami Beach, FL
Mount Sinai Morningside (West) New York, NY
New York - Presbyterian Queens Queens, NY
Niagara Health - South Niagara Group Niagara Falls, ON
Emergency Medicine
To become a WestJEM departmental sponsor, waive article processing fee, receive electronic
please go to http://westjem.com/subscribe or contact:
Stephanie Burmeister
WestJEM Staff Liaison
Phone: 1-800-884-2236
Email: sales@westjem.org
North Shore University Hospital Manhasset, NY
California Chapter Division of American Academy of Emergency Medicine
Northwestern University Feinberg School of Medicine
Chicago, IL
NYU Langone Health - Bellevue Hospital New York, NY
Ohio State University Wexner Medical Center Columbus, oH
Oregon Health and Science University Portland, OR
Orlando College of Osteopathic Medicine Orlando, FL
Penn State Milton S. Hershey Medical Center Hershey, PA
Riverside Regional Medical Center Newport News, VA
Rutgers Robert Wood Johnson Medical School New Brunswick, NJ
Saint Louis University School of Medicine St Louis, MO
Sarasota Memorial Hospital Sarasota, FL
Seattle Children’s Hospital Seattle, WA
Southern Illinois University School of Medicine Springfield, IL
Summa Health System Akron, OH
SUNY Upstate Medical University Syracuse, NY
Swedish Hospital Part of NorthShore Chicago, IL
Temple University Philadelphia, PA
Texas Tech University Health Sciences Center El Paso, TX
The University of Texas Medical Branch Galveston, TX
Thomas Jefferson University Philadelphia, PA
Trinity Health Muskegon Hospital Muskegon, MI
UMass Memorial Health Worcester, MA
University Services University of the Health Sciences Bethesda, MD
University of Alabama Medical Center
Birmingham, AL
University of Alberta Edmonton, AB
University of Arizona College of MedicineTuscon Tucson, AZ
University of California, Davis Medical Center
Sacramento, CA
University of California, San Francisco Fresno Fresno, CA
University of California, San Francisco General Hospital San Francisco, CA
University of Chicago, Chicago, IL
University of Florida, Jacksonville Jacksonville, FL
University of Illinois at Chicago Chicago, IL
University of Iowa Hospitals and Clinics Iowa City, IA
University of Kansas Health System Kansas City, KS
University of Louisville Louisville, KY
University of Maryland School of Medicine Baltimore, MD
University of Michigan Ann Arbor, MI
University of Missouri Columbia Columbia, MO
University of Nebraska Lincoln, NE
University of North Dakota School of Medicine and Health Sciences Grand Forks, ND
University of Ottawa Ottawa, ON
University of Pennsylvania Health System Philadelphia, PA
University of South Alabama Mobile, AL
University of South Florida Tampa, FL
University of Southern California - Los Angeles General Medical Center Los Angeles, CA
Western Journal of Emergency Medicine:
Integrating Emergency Care with Population Health
Indexed in MEDLINE, PubMed, and Clarivate Web of Science, Science Citation Index Expanded
This open access publication would not be possible without the generous and continual financial support of our society sponsors, department and chapter subscribers.
Academic Department of Emergency Medicine Subscriber (Continued)
University of Tennessee Knoxville, TN
University of Utah School of Medicine
Salt Lake City, UT
University of Vermont Medical Center Burlington, VT
University of Washington - Harborview Medical Center Seattle, WA
University of Wisconsin Hospitals and Clinics Madison, WI
Valleywise Health Medical Center Phoenix, AZ
Valleywise Health Medical CenterPediatrics Phoenix, AZ
Wellspan York Hospital York, PA
State Chapter Subscriber
Arizona Chapter Division of the American Academy of Emergency Medicine
California Chapter Division of the American Academy of Emergency Medicine
Florida Chapter Division of the American Academy of Emergency Medicine Great Lakes Chapter Division of the
International Society Partners
Emergency Medicine Association of Turkey
Lebanese Academy of Emergency Medicine
Mediterranean Academy of Emergency Medicine
Wright State University Boonshoft School of Medicine Dayton, OH
Yale School of Medicine New Haven, CT
Virginia
To become a WestJEM departmental sponsor, waive article processing fee, receive electronic copies for all faculty and residents, and free CME and faculty/fellow position advertisement space, please go to http://westjem.com/subscribe or contact:
Stephanie Burmeister
WestJEM Staff Liaison
Phone: 1-800-884-2236
Email: sales@westjem.org
Sociedad
Neoplastic Incidentalomas in the Emergency Department:
Incidence, Imaging Type, Location, and Clinical Relevance
Carmine Nasta, MD*
Romeo Morelli, MD*
Antonia Ida Facciuto, MD*
Francesca Palumbo, MD*
Martina Finelli, MD*
Vincenzo Brunelli, MD*
Mario Puoti, MD*
Alfredo Palumbo, MD*
Antonio Voza, MD, PhD†
Giuseppe Paolisso, MD, PhD*
Mauro Giordano, MD, PhD*
Section Editor: Patrick Meloy, MD
Università degli Studi della Campania Luigi Vanvitelli, Naples, Department of Advanced Medical and Surgical Sciences, Department of Emergency Medicine, Marcianise, Italy
Istituto di Ricovero e Cura a Carattere Scientifico Humanitas Research Hospital, Department of Biomedical Sciences, Milan, Italy
Submission history: Submitted July 09, 2025; Revision received September 17, 2025; Accepted November 2, 2025
Electronically published June 28, 2026
Full text available through open access at http://escholarship.org/uc/uciem_westjem DOI 10.5811/westjem.48928
Background: Incidentalomas—unexpected neoplastic lesions discovered during imaging for unrelated complaints—represent a growing clinical and ethical challenge in emergency medicine. Their detection has increased due to widespread use of advanced imaging, particularly in patients who may otherwise escape thorough diagnostic evaluation.
Objective: We sought to determine the frequency, anatomical distribution, and clinical management gaps of neoplastic incidentalomas observed in patients presenting with non-specific, low-severity complaints at the emergency department (ED). (In this paper, neoplastic incidentalomas include both lesions discovered incidentally during imaging for unrelated conditions and newly diagnosed malignancies plausibly related to the patient’s presenting symptoms,)
Methods: Data collection covered the period January 1–December 31, 2023. We conducted a retrospective observational study of all adult patients presenting to the ED of P.O. Anastasia Guerriero University Hospital in Marcianise, Italy. Incidentalomas were identified through discharge summaries and classified by imaging modality, anatomical site, and triage code. We analyzed data using descriptive and inferential statistics.
Results: Among 35,081 ED visits, 53 neoplastic incidentalomas were identified (1.52 per 1,000). The majority occurred in females (69%) and elderly (> 65 years) patients (61%), who often presented with minor complaints such as abdominal pain (38%) or anemia (15%). Most incidentalomas were gastrointestinal (31%) or pulmonary (23%) and primarily detected via computed tomography (51%). Notably, 100% of cases were triaged as non-urgent. Based on established guidelines, up to 20% of cases may represent potential overdiagnosis. The next most common modalities of detection were ultrasound (28%) and chest radiograph (22%).
Conclusion: Neoplastic incidentalomas are not rare in the ED setting, even among patients who present with low-severity symptoms. Our findings underscore the importance of structured follow-up protocols and integration of guideline-based reporting to avoid diagnostic delays, overdiagnosis, and unnecessary interventions. Emergency physicians should maintain diagnostic vigilance and consider incidental findings in clinical workflows. [West J Emerg Med. 2026;27(4)842–847.]
INTRODUCTION
The term incidentaloma refers to an unexpected mass or lesion detected during diagnostic studies performed for unrelated clinical indications. First coined in the early 1980s in reference to adrenal masses,1 the term now encompasses a broad range of anatomical sites and clinical implications. With the increased use of advanced imaging in emergency departments (ED), the detection of incidentalomas has become more frequent, raising critical questions regarding diagnosis, follow-up, and patient communication.2 This study investigates the prevalence and clinical profiles of neoplastic incidentalomas in a busy Italian ED, focusing on patients admitted for low-severity complaints and highlighting the implications for emergency clinical practice. Neoplastic incidentalomas encompassed two distinct clinical scenarios: 1) truly incidental lesions discovered during imaging for unrelated conditions; and 2) newly diagnosed malignancies that may have explained the patient’s presenting symptoms.
MATERIALS AND METHODS
Study Design, Setting, and Population
This was a retrospective, observational, cohort study conducted in the ED of the University Hospital in Marcianise, Italy. All adult patients (>18 years of age) who presented to the ED from January–December 31, 2023 were eligible to participate in the study. Exclusion criteria were as follows: patients who were < 18 years of age; and those who had incomplete records.
Data Collection.
We screened ED) discharge summaries for mention of incidental neoplastic findings. Data collected included demographics, reason for ED visit, triage code, type of imaging performed, and anatomical site of the incidentaloma. The review of ED discharge summaries was conducted January–March 2024 by two independent reviewers trained in clinical epidemiology. Discrepancies were resolved by consensus with a third senior investigator. We operationally defined neoplastic incidentalomas as radiologically confirmed solid lesions suggestive of malignancy, discovered during diagnostic imaging performed for symptoms not always directly attributable to cancer. For example, a pulmonary nodule identified during imaging for chest pain without signs of infection or hemoptysis was considered incidental. Additional examples include the following: gastrointestinal (GI) lesions (e.g., colonic masses identified on computed tomography [CT] performed for abdominal pain); breast findings (e.g., lesions detected incidentally after imaging for trauma); ovarian masses (e.g., adnexal tumors revealed on ultrasound for abdominal bloating); cerebral lesions (e.g., tumors discovered following imaging for seizures); and renal findings (e.g., masses detected on CT performed for anemia or hematuria).
For this study, we included both truly incidental neoplastic
Population Health Research Capsule
What do we already know about this issue? Incidental neoplastic findings are being detected with increasing frequency due to the widespread use of advanced imaging in emergency departments.
What was the research question? What is the incidence, distribution, and clinical significance of neoplastic incidentalomas among ED patients?
What was the major finding of the study? In 35,081 ED visits, 53 neoplastic incidentalomas were identified (1.52%), mainly in elderly females, with computed tomography the most common imaging modality (51% [P < .001]).
How does this improve population health? Our findings highlight the concealed oncologic risk in low-severity presentations and promotes adherence to evidence-based followup pathways to reduce diagnostic latency and overdiagnosis.
findings, defined as lesions detected during imaging performed for unrelated complaints, such as a renal mass identified on CT abdomen for suspected appendicitis, and newly diagnosed malignancies that could plausibly be related to the patient’s presenting symptoms, such as a colonic mass in a patient with abdominal pain and weight loss. Both categories were reviewed and reported together under the umbrella of “neoplastic incidentalomas,” while acknowledging their distinct clinical implications. We used descriptive statistics to summarize patient demographics and incidentaloma characteristics. Categorical variables were reported as frequencies and percentages. Continuous variables were expressed as mean ± standard deviation or median with interquartile range, as appropriate. We applied chi-square or Fisher exact tests to compare categorical data across subgroups (eg, sex, age group). A P-value < .05 was considered statistically significant. We analyzed data using IBM SPSS Statistics for Windows, v28.0 (IBM Corporation, Armonk, NY). All data were anonymized; ethics committee approval was not required for retrospective analysis of administrative data.
The methodology followed established best practices for
retrospective chart review studies in emergency medicine. In particular, the data abstraction process adhered to criteria proposed by Worster and Bledsoe, Gilbert and Lowenstein, and Kaji and Schriger,4,5 which emphasize independent review, predefined data fields, and reconciliation of discrepancies to enhance data reliability. While we adhered to elements from Worster and Bledsoe including use of predefined abstraction fields, independent chart reviewers, and consensus-based discrepancy resolution, not all their methodological recommendations were followed. Specifically, no formal abstractor training was conducted, inter-rater reliability was not quantified, and reviewers were not blinded to the study objectives. Additionally, the reporting of this observational study complies with the STROBE (Strengthening the Reporting of Observational Studies in Epidemiology) guidelines, to ensure transparency and reproducibility in study design, analysis, and interpretation.5,6
RESULTS
In 35,081 ED visits, 53 incidentalomas were identified, corresponding to an overall prevalence of 1.52 per 1,000 visits (95% CI, 1.12-1.98). Among patients ≥ 65 years of age, the prevalence increased to 2.47 per 1,000 (95% CI, 1.75-3.42). Incidentalomas were more frequent in women than in men (1.85 vs 1.07 per 1,000 visits, P = .09), and patients in the ≥
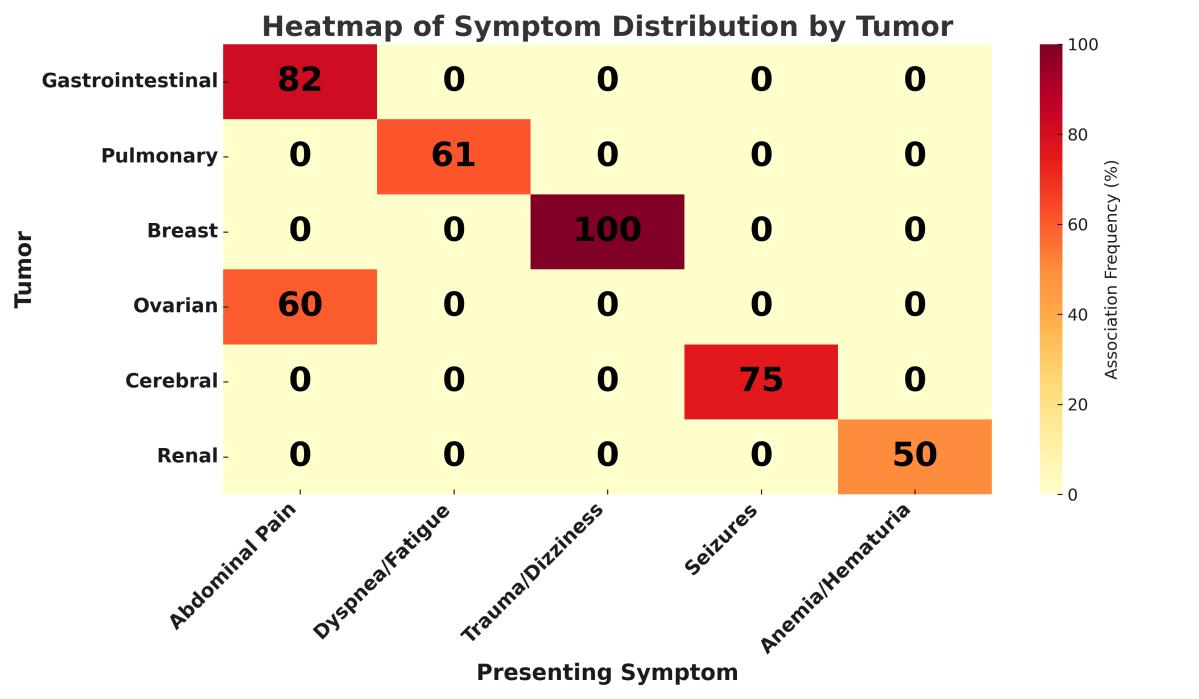
65 year of age group were significantly more likely to have an incidentaloma compared to younger cohorts (P < .01). Most patients with incidentalomas were female (69%), while 31% were male. The majority were > 65 years of age (61%), with 31% between 40-65 and 8% between 18-40 years of age. At triage, 62% were classified as green (minor urgency) and 38% as blue (deferred urgency). (13) The most frequent presenting complaint was abdominal pain (38%), followed by severe anemia (15%) and constipation (7%); less common symptoms included seizures, hemoptysis, dyspnea, urinary tract infection, and breast mass.
Computed tomography was the most common imaging modality leading to detection (51%), followed by ultrasound (28%) and chest radiograph (22%). Incidentalomas detected on CT were more often suspicious for malignancy (78%) compared with those found on ultrasound (42%) or chest radiograph (31%) (P = .02). In terms of anatomical distribution, incidentalomas were most frequently GIl (31%) or pulmonary (23%), while 15% each involved the breast and ovaries. Cerebral and renal findings each accounted for 8%. Site-symptom associations showed that GI tumors were strongly linked to abdominal pain (82%), pulmonary lesions to non-specific complaints such as dyspnea or fatigue (61%), and breast lesions were exclusively detected in women presenting with unrelated issues such as trauma or dizziness. Regarding patient disposition, 72% were discharged directly from the ED, 21% required hospitalization, and 7% were transferred to other facilities.
The heatmap in Figure 1 illustrates the frequency of association (percentage) between presenting symptoms and anatomical sites of neoplastic incidentalomas detected in the ED. Gastrointestinal tumors were most frequently associated with abdominal pain (82%), while pulmonary incidentalomas correlated with dyspnea or fatigue (61%). Breast incidentalomas were detected in patients presenting with
= not
= deferred urgency.
Table 1. Demographic and clinical characteristics of patients with incidentalomas in a study of the prevalence of incidentalomas identified in the emergency department.
Table 2. Triage codes, imaging modalities, and prevalence of incidentaloma findings on imaging in the emergency department.
Figure 1. Heatmap of symptom distribution by tumor site in a study of the prevalence of incidentalomas detected in the emergency department.
unrelated symptoms such as trauma or dizziness (100%). The intensity of color reflects the strength of association.
DISCUSSION
This study provides single-center, real-world evidence from a high-volume ED and highlights under-recognized cancer risk in low-severity triage presentations. Neoplastic incidentalomas are not rare events in the ED, particularly among patients presenting with non-specific, low-severity complaints. An important nuance of our findings is that the category of neoplastic incidentalomas encompassed two distinct clinical scenarios: 1) truly incidental lesions discovered during imaging for unrelated conditions; and 2) newly diagnosed malignancies that may have explained the patient’s presenting symptoms. The latter group is particularly relevant in the emergency context, as these cases reflect situations where potentially serious oncologic disease initially manifested with vague or non-specific complaints and was only recognized because of imaging. This distinction highlights the need for careful clinical interpretation, since not all detected malignancies represent incidental or unrelated findings. In fact, all cases were identified in patients assigned green or blue triage codes,7 traditionally considered non-urgent. Our findings underscore a paradox: potentially serious oncologic conditions may initially present with vague symptoms and low-priority triage classifications, thus escaping early recognition unless incidental findings prompt further investigation. The predominance of GI and thoracic tumors aligns with previous data reported in literature.8,9
The widespread use of CT imaging played a crucial role in identification, reinforcing the need for standardized protocols. Observed sex and age trends support the importance of considering incidentalomas in older female populations. In the present study, we report a prevalence of 1.52 per 1,000, consistent with previous reports from high- volume EDs in North America and Western Europe, which estimate incidentaloma detection rates of 0.8-2.0 per 1,000 visits.10,11 Our findings regarding the predominance of GI and pulmonary
lesions are in line with data previously reported in the literature.10,11 We report, for the first time, that in patients presenting with non-specific, low-severity pathologies at first ED visit there is a risk of underestimating the presence of neoplastic incidentalomas, particularly in patients with abdominal pain and anemia, as these were found in at least 50% of cases. In addition, these patients may be prematurely discharged without adequate follow-up planning, leading to delayed cancer diagnosis.
Our results suggest the need for structured documentation and handoff protocols for incidental radiologic findings, particularly in elderly female patients—a demographic disproportionately represented in our cohort. Furthermore, we need to be aware of ethical considerations regarding overdiagnosis. A significant proportion of the detected lesions may represent overdiagnosis, especially in asymptomatic elderly individuals with decreased life expectancy. Without clear follow-up protocols, incidentalomas may trigger cascade effects—unnecessary diagnostics, overtreatment, and patient anxiety—raising concerns about the balance between early detection and harm. Future prospective studies should incorporate validated patient-reported outcome measures to assess psychological and quality-of-life impacts.
Recommendations for Clinical Practice
Based on our findings and current evidence, we advocate for the following improvements in ED management of incidentalomas:
• structured radiology reporting, including a “Recommendations” section referencing criteria of the American College of Radiology (ACR), the European Society of Endocrinology (ESE) and the Fleischner Society guidelines;
• automated follow-up alerts to general practitioners or specialty clinics for lesions requiring surveillance;
• visual clinical algorithms, integrated into ED radiology software systems, to assist non-specialist clinicians in triage and follow-up planning;
• establishment of a clinical incidentaloma registry within the ED setting to support quality-improvement initiatives and future research.
Table 3. Presenting symptoms by tumor site in a study of emergency department findings of incidentalomas.
We further advocate for the integration of international guidelines and evaluation of overdiagnosis risk. To enhance the clinical applicability of our findings, we retrospectively evaluated the management of incidental neoplastic findings against established international guidelines of the ACR Incidental Findings Committee. The ACR provides detailed management recommendations for incidental findings in major anatomical regions (e.g., adrenal glands, liver, kidneys, lungs), stratified by radiologic features, such as size, margins, and enhancement, and clinical risk factors.9 The 2017 Fleischner criteria provide evidence-based
Nasta
Incidentalomas
algorithms for the management of incidental pulmonary nodules detected on CT, with recommendations based on nodule size, morphology, and patient risk profile (e.g., age, smoking history).12 For adrenal incidentalomas, the ESE recommends workup based on size (> 4 cm), attenuation values (< 10 Hounsfield units), contrast wash-out characteristics, and functional status.12
All detected neoplastic incidentalomas were retrospectively reviewed and, where data allowed, classified in accordance with these clinical frameworks. In particular, we compared CT-based lesions in the lungs, adrenal glands, and abdomen with guideline-directed thresholds for further imaging, biopsy, or follow-up. We also noted the presence or absence of explicit radiological recommendations and whether follow-up plans were communicated to patients at ED discharge.
Assessment of Overdiagnosis and the Cascade Effect
The unintended discovery of potentially oncologic lesions can initiate a chain of diagnostic and therapeutic interventions, often termed the “cascade effect.” This may include the following: unnecessary or low-value procedures, particularly in elderly or frail patients; invasive diagnostic interventions (e.g., biopsies, surgical exploration) with associated iatrogenic risk; increased psychological distress, including health anxiety triggered by ambiguous or unexpected results; and healthcare system burden, with resource-intensive follow-up often lacking standardized coordination. In our cohort 72% of patients with incidentalomas were discharged directly from the ED, and documented follow-up plans were absent from most discharge summaries. Based on guideline thresholds, we estimate that 15-20% of cases could represent potential overdiagnosis, consistent with prior systematic reviews.2,8 While direct assessment of psychological impact was beyond the scope of this study, future research should consider validated tools such as the Hospital Anxiety and Depression Scale (to quantify emotional consequences following incidental cancer findings).13,14
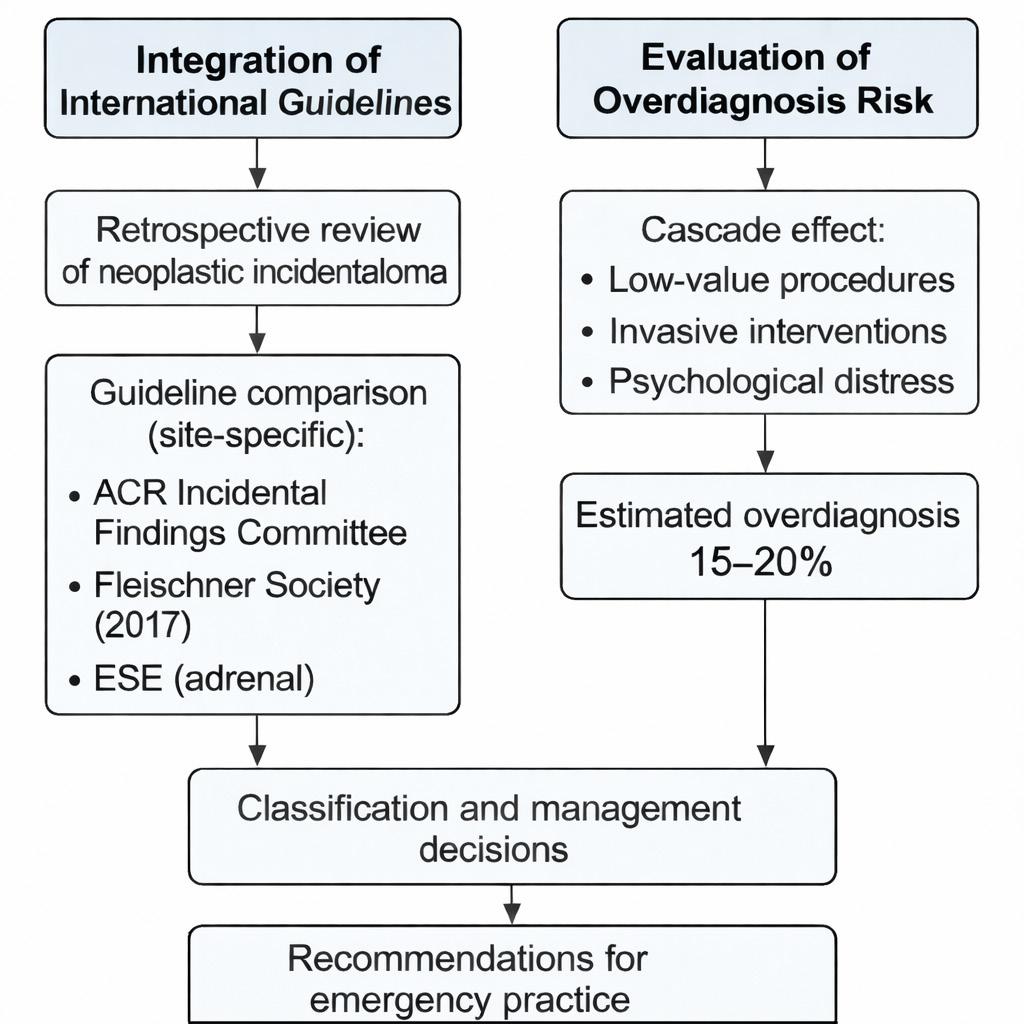
In Figure 2 we present the guideline alignment process, in which neoplastic incidentalomas were retrospectively classified and compared with site-specific recommendations from the ACR, Fleischner Society, and European Society of Endocrinology. On the right, we outline the assessment of overdiagnosis risk, focusing on potential “cascade effects” such as unnecessary procedures, psychological burden, and resource overuse.
LIMITATIONS
This study has several limitations. It is limited by its retrospective, single-center design, which may reduce generalizability. Secondly, we did not assess the psychological impact of incidental findings. Additionally, we did not formally separate incidentalomas from newly
Figure 2. Methodological framework for guideline integration and overdiagnosis risk evaluation in a study of emergency department incidentalomas.
ACR , American College of Radiology; ESE , European Society of Endocrinology.
diagnosed malignancies, potentially related to the reason for ED presentation. While both were reported together, this may have influenced prevalence estimates and clinical interpretation. Future studies should attempt to differentiate these categories more explicitly, as their management pathways and prognostic implications differ. Data were based on discharge summaries, which may have underreported clinical intent. Finally, we did not perform a formal sample-size calculation or power analysis, as the study design was retrospective and descriptive in nature. This limitation is inherent to the observational approach and should be considered when interpreting subgroup comparisons.
CONCLUSION
Detection of neoplastic incidentalomas is relatively frequent in emergency settings, particularly among elderly patients. Based on the results of this study, we advocate for increased awareness among emergency physicians regarding patients presenting with minor emergency complaints. These findings underscore the need for guideline-informed management of incidentalomas. Future studies are required to better investigate this issue.
Nasta et al. Neoplastic Incidentalomas in
Address for Correspondence: Carmine Nasta, MD, University of Campania L. Vanvitelli, Department of Advanced Medical and Surgical Sciences, Via De Crecchio 7, 80138, Naples, Italy, email: carminenasta1@gmail.com.
Conflicts of Interest: By the WestJEM article submission agreement, all authors are required to disclose all affiliations, funding sources, and financial or management relationships that could be perceived as potential sources of bias. No other author has professional or financial relationships with any companies that are relevant to this study. There are no other conflicts of interest or sources of funding to declare.
1. Fronticelli CM, Gentilli S, Quiriconi F, et al. Surgery of the incidentally discovered mass of the adrenal gland (incidentaloma). Panminerva Med. 1995;37(2):60-64.
2. Lumbreras B, Donat L, Hernández-Aguado I. Incidental findings in imaging diagnostic tests: a systematic review. Br J Radiol 2010;83(988):276-289.
3. Gilbert EH, Lowenstein SR, Koziol-McLain J, et al. Chart reviews in emergency medicine research: Where are the methods? Ann Emerg Med. 1996;27(3):305-308.
4. von Elm E, Altman DG, Egger M, et al. The STROBE statement: guidelines for reporting observational studies. PLoS Med. 2007;4(10):e296.
5. Worster A, Bledsoe RD, Cleve P, et al. Reassessing the methods of
medical record review studies in emergency medicine research. Ann Emerg Med. 2005;45(4):448-451.
6. Kaji AH, Schriger D, Green S. Looking through the retrospectoscope: reducing bias in emergency medicine chart review studies. Ann Emerg Med. 2014;64(3):292-298.
7. Italian Ministry of Health. *Linee guida di indirizzo nazionale sul triage intraospedaliero.* Available at: https://www.statoregioni.it/ media/1953/p-01-csr-atto-rep-n-143-01-agosto2019.pdf. Accessed October 2025.
8. Makary MA, Xie Y. Managing incidentalomas in radiology: embracing challenges as opportunities. Diagn Imaging. 2022. Available at: https://www.diagnosticimaging.com/view/managing-incidentalomasin-radiology-embracing-challenges-as-opportunities. Accessed October 2025.
9. Segal M. Management of radiographic “incidentalomas” in the emergency department. Med Justice Blog. 2025. Available at: https:// www.medicaljustice.com. Accessed October 2025.
10. Evans CS, Arthur R, Kane M, et al. Incidental radiology findings on computed tomography studies in emergency department patients: a systematic review and meta-analysis. Ann Emerg Med 2022;80(3):243-256. doi:10.1016/j.annemergmed.2022.03.027
11. Thomas R, Silver H. Managing low-risk incidentalomas: toward better ED discharge algorithms. J Emerg Med Res. 2025;43(1):54–60.
12. Australian Medical Association. First do no harm in responding to incidental imaging findings. Med J Aust. 2024;220(1):8–10.
13. ResearchGate. Incidentalomas and imaging: the emerging burden of overdiagnosis. ResearchGate Repository. Available at: https://www. researchgate.net. Accessed July 2025.
14. Khan S, Helms CA, Coleman BG, et al. Incidental findings in emergency imaging: clinical implications and recommendations. Emerg Radiol. 2016;23(5):469–475.
De-Labeling of Penicillin Allergy in the Emergency Department at a Veterans Affairs Hospital
Brian Chen, Pharm.D.*
Phuong Khanh T. Nguyen, Pharm D, BCIDP*
My-Phuong
Pham, Pharm D*
Cynthia Koh, MD†
Christopher J. Graber, MD, MPH‡
Section Editor: Murat Cetin, MD
Veterans Affairs Greater Los Angeles Healthcare System, Department of Pharmacy, Los Angeles, California
Veterans Affairs Greater Los Angeles Healthcare System, Department of Emergency Medicine, Los Angeles, California
Veterans Affairs Greater Los Angeles Healthcare System, Department of Infectious Disease, Los Angeles, California
Submission history: Submitted July 10, 2025; Revision received December 19, 2025; Accepted December 20, 2020
Electronically published June 28, 2026
Full text available through open access at http://escholarship.org/uc/uciem_westjem DOI 10.5811/westjem.48957
Introduction: Penicillin allergy is one of the most reported drug allergies, but studies have shown that patients who report an allergy frequently do not have a significant reaction when challenged. Avoidance of penicillin or beta-lactam antibiotics in these patients results in increased hospitalization costs, suboptimal antibiotic therapy, and risk for subsequent infection with multidrug resistant organisms.
Methods: This was a single-center, retrospective chart review that included patients ≥ 18 years of age with documented penicillin allergy who presented to the emergency department (ED) over a one-year period. Clinical pharmacy specialists in the ED reviewed and stratified patient allergy risk. Patients with low-risk allergy histories who were to be admitted and gave formal consent were given an oral amoxicillin challenge and then observed in the ED for at least one hour. Patients who were eligible for challenge but were to be discharged from the ED were given the option to be seen in the allergy clinic. The primary outcome was the incidence of adverse reactions related to the oral amoxicillin challenge for patients. An exploratory secondary outcome was the average length of stay (LOS) in the ED for oral amoxicillin-challenged patients compared to the average LOS for non-oral amoxicillin-challenged patients. We performed descriptive statistics on all variables.
Results: A total of 144 patients received an allergy assessment in the ED, 20 who received an oral amoxicillin challenge and 124 who did not. Baseline characteristics were similar in both groups. The average total LOS in the oral amoxicillin-challenged patients was a non-significant 36 minutes longer compared to the non-challenged patients (P = 0.4). Of 144 patients, 71 (49%) had their penicillin allergy removed as a result of the challenge.. One patient experienced a mild and self-limited reaction to the oral amoxicillin challenge (0.7%; 95% CI, 0.02-3.8%).
Conclusion: An ED pharmacist-led, penicillin de-labeling protocol was safe and feasible. A secondary exploratory analysis showed no significant difference in length of stay between patients who received the oral amoxicillin challenge in the ED vs those who did not. Performing a proper penicillin allergy evaluation in the ED can have lasting benefits for patients and antimicrobial stewardship. [West J Emerg Med. 2026;27(4)848–854.]
INTRODUCTION
Penicillin allergy is a commonly reported drug reaction. Although it is widely reported, about 80-95% of individuals
with self-reported penicillin allergy histories can tolerate penicillin after a proper allergy assessment.1-4 Efforts to de-label penicillin allergies have extended even to the emergency
department (ED) with success.5-6 Clinically significant immunoglobulin E (Ig-E)-mediated type I hypersensitivity is uncommon and rare, reported as < 5%.7 Despite the frequency of reported penicillin allergies, about 90% of patients have been shown to tolerate beta-lactams, as the cross-reactivity between penicillins and cephalosporins is relatively low at 1-3%.8-11 This is likely due to variations in the side chains attached to the core beta-lactam ring being the major determinants of allergic cross-reactivity, rather than the beta-lactam ring itself.12 Furthermore, approximately 80% of patients with IgE-mediated penicillin allergy will lose their sensitivity after 10 years.13 In a systematic review and meta-analysis, in a cohort of > 5,000 participants who had reported penicillin allergy and underwent drug challenge, ≥ 94% tolerated the penicillin challenge without any significant reaction.4
Inappropriate and unverified antibiotic-allergy documentation in patients’ health records can be recorded incorrectly after a non-immunological reaction such as gastrointestinal (GI) upset, headache, or fatigue.2 Some patients may be exposed to unnecessary extended-spectrum antibiotics given the self-reported penicillin allergy. Studies show that most patients who report penicillin allergy are unnecessarily avoiding penicillin- class antibiotics because either their penicillin allergy waned over time or previous reactions should not have been attributed to penicillin.1,13 Penicillin allergy labels have a direct impact on antimicrobial stewardship by resulting in use of potentially less effective and unnecessarily broad-spectrum antibiotics.
Currently, many healthcare professionals in clinical practice will avoid using penicillins or b-lactam antibiotics in patients with a reported penicillin allergy. However, this significantly limits appropriate antibiotic choice, resulting in increasing hospitalization costs, suboptimal antibiotic therapy, risk for subsequent infections with multidrug resistant organisms (eg, methicillin-resistant Staphylococcus aureus, vancomycin-resistant Enterococcus, and Clostridioides difficile).1-2, 15-17 Common alternatives to penicillin include vancomycin, clindamycin, and fluoroquinolones, which have been associated with greater adverse effects than beta-lactams, including nephrotoxicity and risk for C difficile infection.18 Moreover, a recent meta-analysis revealed that patient outcomes worsen beyond infectious concerns, with a penicillin allergy alone being associated with increased mortality, as well as heart failure and increased intensive care unit and ventilation complications.19
Regardless of specific clinical harms, the impact of penicillin labels on operational outcomes has been demonstrated, with multiple studies demonstrating that a penicillin allergy label is associated with longer hospital length of stay (LOS).20-22 Therefore, appropriate penicillin allergy assessment and management should be an important component of antibiotic stewardship, which can significantly improve treatment outcomes, decrease healthcare costs, and
Population Health Research Capsule
What do we already know about this issue? Most reported penicillin allergies are not true IgE-mediated allergies, and de-labeling can safely expand beta-lactam use.
What was the research question?
Can a pharmacist-led ED penicillin delabeling protocol safely remove penicillin allergy labels? Does this affect ED length of stay (LOS)?
What was the major finding of the study? 60 patients out of 144 (42%) were de-labeled directly in the ED, with one mild reaction (0.7%, 95% CI 0.02–3.8%) that required no intervention.
How does this improve population health? Removing inaccurate penicillin allergies in the ED supports safer, narrower antibiotic use and may have multiple clinical and operational benefits.
prevent antibiotic resistance. Here we evaluate a penicillin allergy assessment effort implemented in a Veterans Affairs emergency department (ED).
METHODS
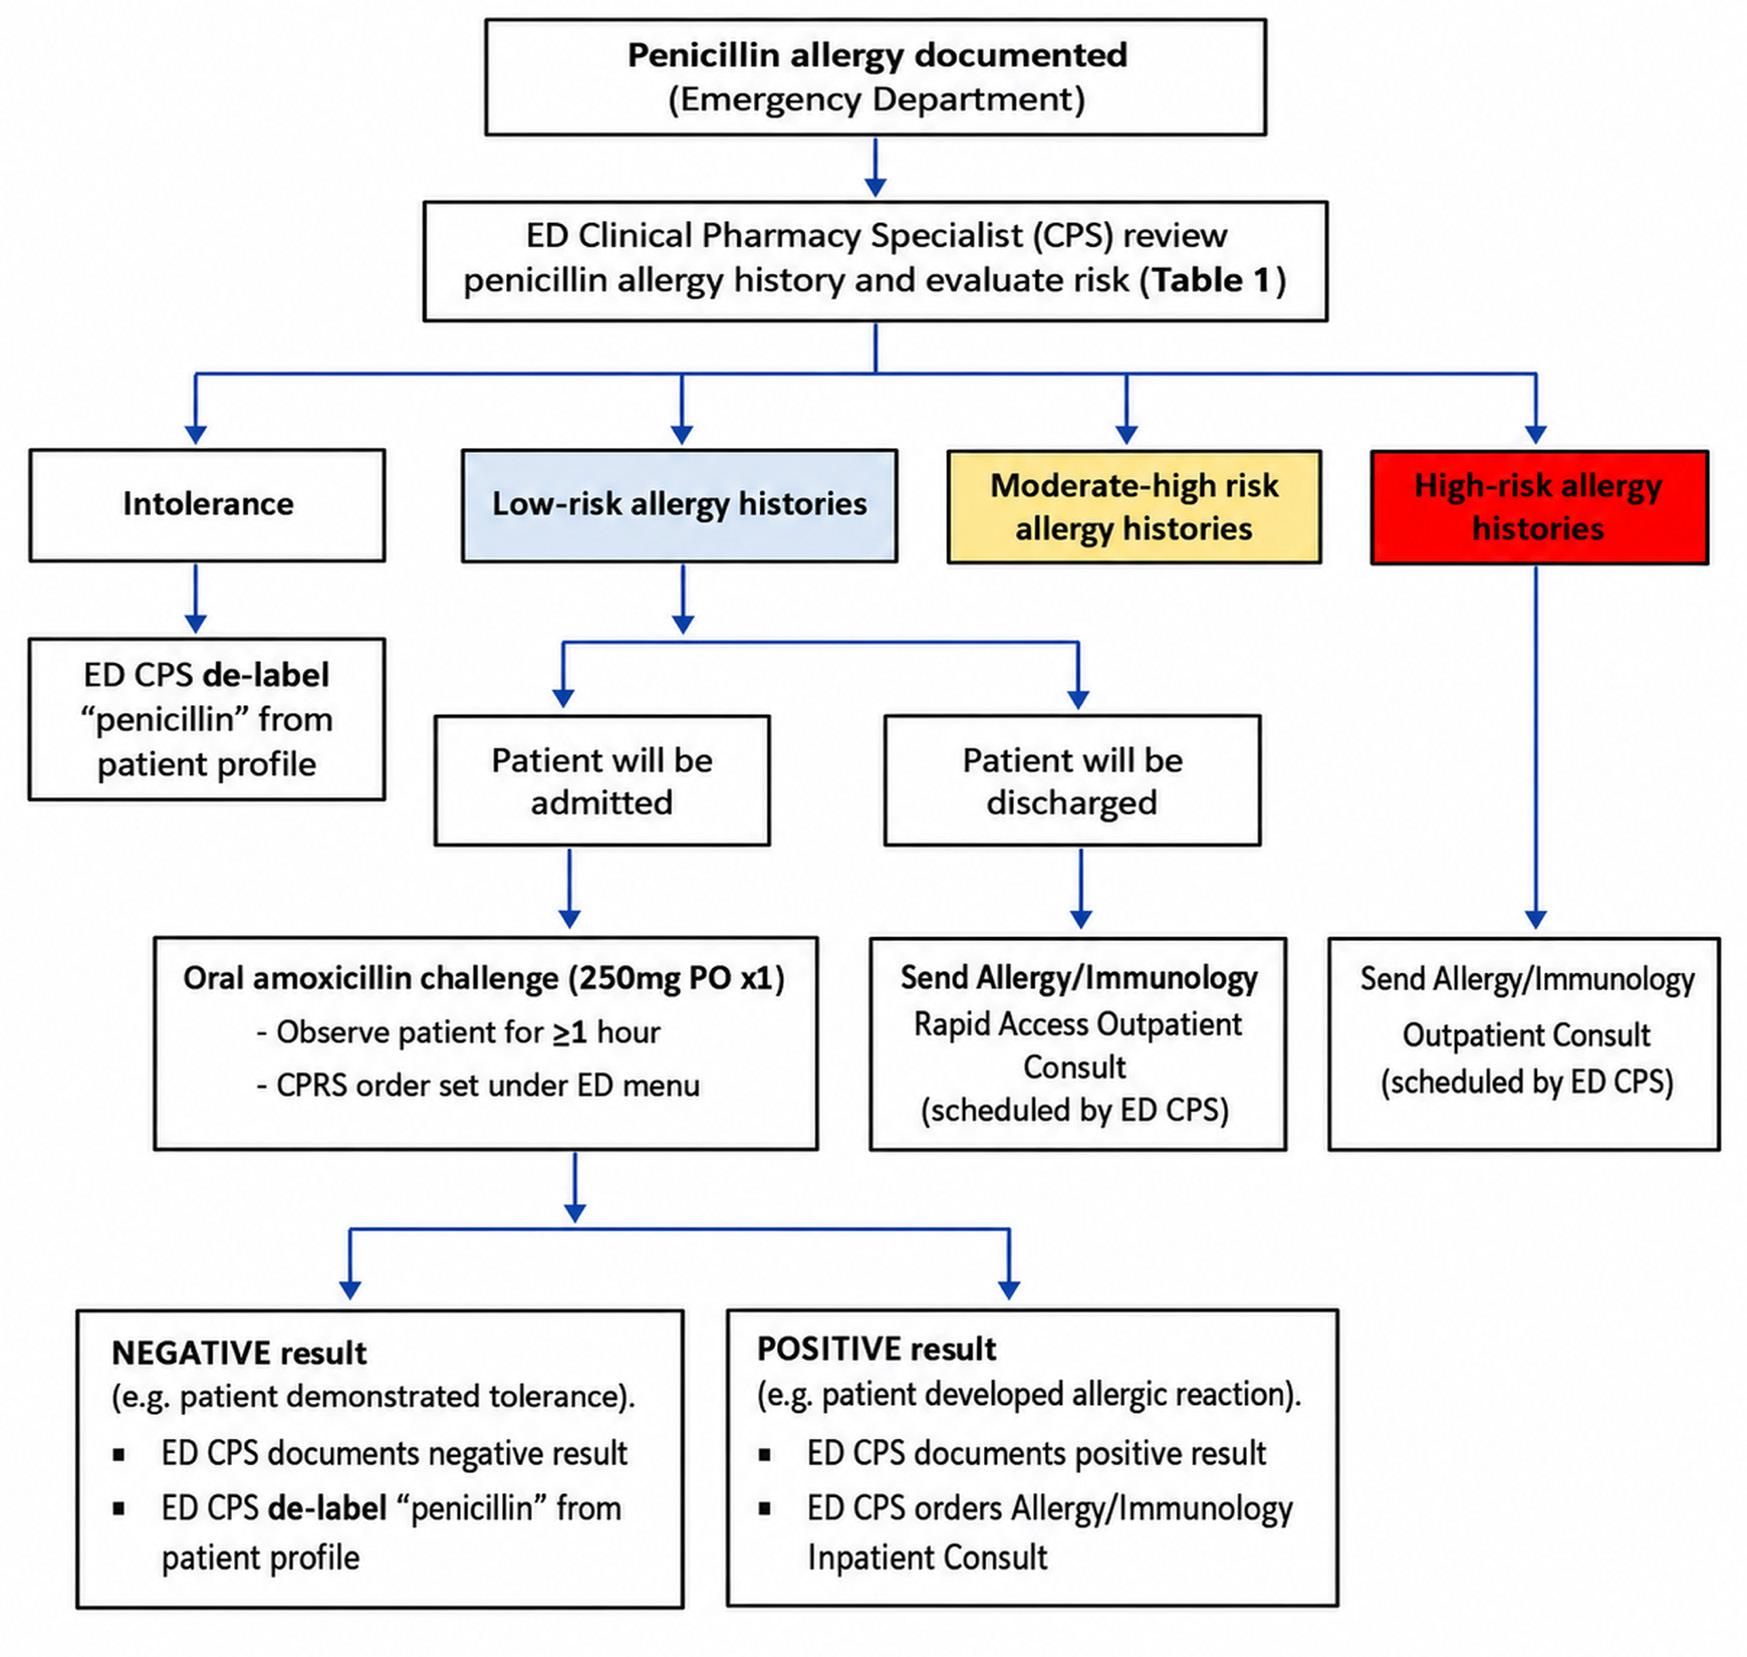
This was a single-center, retrospective chart review of adult veterans ≥ 18 years of age with a penicillin allergy who presented to the ED at the Veterans Affairs Greater Los Angeles Healthcare System (VAGLAHS) from January 1–December 31, 2021. Charts were reviewed based on the inclusion of a note specific to the pharmacy workflow detailed in Figure 1. One author (BC) reviewed all charts using a standardized form, and this review was monitored periodically by two other authors (PKN, MP) to ensure uniformity. As informed by Worster et al,23 we defined case selection criteria and variables, used an abstraction form, monitored performance, discussed interobserver reliability, identified the medical record, and obtained institutional review board (IRB) approval. The study was approved by the IRB by its standard protocol, including obtaining formal consent from all participants. We processed data on secure servers in accordance with institutional policies. There were no missing data for the key variables. Using the VAGLAHS ED Antibiotic Stewardship Program Pharmacy Penicillin Allergy Assessment
and Intervention Workflow (Figure), ED clinical pharmacy specialists (CPS) reviewed and stratified patient allergy risk.
Patients with history of penicillin intolerance (eg, an adverse effect such as GI upset, nausea, vomiting, or diarrhea that was not a true allergy) had the penicillin allergy delabeled from their patient profile, as did those who denied an allergy and those who did not know what their allergy was. Patients with moderate-high and high-risk allergy histories were not de-labeled, nor were they challenged in the ED; however, they were provided the option to be further assessed at the Allergy/Immunology Outpatient Clinic.
Patients were challenged with a single dose of amoxicillin 250 mg by mouth if they 1) were determined to have a low-risk history, 2) formally consented to the challenge, and 3) carried a disposition for admission. These criteria were chosen to limit the risk of a severe adverse reaction, and in the
case one occurred ensured that the patient would be able to be appropriately monitored and treated. The only patients who met these criteria but were not challenged were deemed by the care team to be too unstable. For patients who were eligible to receive the oral amoxicillin challenge but were to be discharged from the ED, they were given the option to be seen in the Allergy/Immunology Outpatient Clinic. Amoxicillin was the only antibiotic given in this challenge.
The treating ED team carried out observation for one hour after the dose was administered, with monitoring and intervention at the team’s discretion. Severity of the reaction was defined as mild if no intervention was needed; moderate if intervention was needed but required no upgrade in level of care; severe tier 1 if intermediate or intensive care was needed but no anaphylaxis was noted; and severe tier 2 if anaphylaxis was noted. The primary outcome was the incidence of adverse
Figure. Pharmacist workflow in a study describing an emergency department-based, pharmacist-led penicillin allergy de-labeling protocol CPRS, computerized patient record system; ED, emergency department.
Table 1 Characteristics of patient population in a study examining outcomes of an emergency department-based, pharmacist-led protocol to de-label penicillin allergy.
Drug
– n (%)
– n (%)
than 1 class of allergies, including antibiotics
Comorbidities
Comorbidity Index score (average)
Severity Index – n (%)
1 – immediate, life-saving intervention required
2 – high risk of deterioration
3 – stable with multiple types of resources
to investigate or treat
4 – stable with only one type of resource anticipated
5 – stable with no resources needed except oral or topical medications
Penicillin allergy history – n (%)
of last PCN allergy
10 years
of last allergic reaction
Type of last penicillin allergic reaction – n (%)
of penicillin allergy history – n (%)
N/V/D, nausea, vomiting, diarrhea; PCN, penicillin; SD, standard deviation.
Table 2. Results of a study examining outcomes of an emergency department-based, pharmacist-led penicillin allergy de-labeling protocol.
Outcome
Patients who received oral amoxicillin challenge (n = 20)
ED total length of stay – minutes (average) (SD) 401.3 (122)
Penicillin allergy removed in the ED? – n (%)
Yes
(95)
Patients who did not receive oral amoxicillin challenge (n = 124)
(172)
(33)
Total patients (N = 144) P value
(166) .4
(42) No 1 (5)
Allergy consult placed? – n (%)
Yes
(0)
(100)
ED, emergency department; SD, standard deviation.
(67)
(47)
(53)
reactions related to the oral amoxicillin challenge for patients. An exploratory secondary outcome was the average LOS in the ED for oral amoxicillin-challenged patients compared to the average LOS for non-oral amoxicillin-challenged patients. We performed descriptive statistics on all variables. We used the t-test to compare continuous data and chi-square test to compare categorical data. For all tests and analyses, statistical significance was determined with a P value < .05 (two-sided significance).
RESULTS
Baseline characteristics of the studied population, including classification based on allergy severity, are shown in Table 1. The ED LOS times for challenged vs non-challenged patients are presented in Table 2.
Of 144 patients who received penicillin allergy assessment in the ED via the protocol outlined in Figure 1, 71 (49%) were ultimately able to have their penicillin allergy de-labeled. Furthermore, 60 patients (42%) were de-labeled directly in the ED—19 (32%) through pharmacist assessment followed by penicillin challenge, and 41 (68%) via pharmacist assessment alone. An additional 11 patients (15%) were de-labeled after allergy clinic follow-up. Of the 20/144 patients (14%) who received the oral amoxicillin challenge, only one (0.7%; 95% CI, 0.02-3.8%) had a mild reaction that required no specific intervention, and his allergy was not de-labeled.
Table 3. Subsequent use of beta-lactams in 20 patients who had received an oral amoxicillin challenge in the emergency department through a pharmacist-led penicillin allergy de-labeling protocol.
n (%)
Penicillin
Cephalosporins
Carbapenems
(58)
7 (35)
4 (20)
0 (0)
More than 1 class of beta-lactams 1 (5)
Of 58 patients referred to the allergy clinic, 24 (41%) presented for their appointment, and among those 24 patients 11 (46%) had their labels removed; the rest were lost to follow-up. The average total LOS in the oral amoxicillinchallenged patients was 401.25 (SD 121.99) minutes vs 365.73 (171.99) minutes in the non-challenged patients (P = .4) (Table 2). The majority of patients in both groups had their last penicillin allergy > 10 years prior, and/or it had occurred when they were < 18 years of age. Therefore, this study supports the hypothesis that patients may lose their hypersensitivity to penicillin after 10 years. A dermatologic reaction was the most common allergy reaction reported in both groups. Finally, a significant benefit noted was that of the patients challenged, over half of them went on to safely receive treatment with a beta-lactam (Table 3).
DISCUSSION
Our ED-pharmacist-led, penicillin de-labeling study is safe and feasible for any ED with a dedicated pharmacist; our study led to challenged patients safely receiving subsequent betalactam therapy. As a strictly exploratory measure, there was no significant difference in average ED total LOS between patients who received the oral amoxicillin challenge compared to those who did not receive the challenge. Consideration of LOS, while important, should also be de-emphasized in view of the broader positive impact on the overall morbidity and mortality of penicillin allergy-labeled patients, which has been suggested by previous research and must be considered as potentially more impactful than operational concerns.
Removing mislabeled penicillin allergy has far-reaching downstream effects for improved patient outcomes. By removing inappropriate and unverified penicillin allergy labeling for any future hospitalizations, patients will receive appropriate empiric antibiotic therapy, if clinically indicated. This would decrease the risk for multidrug resistant organisms and C. difficile infection, potentially lowering healthcare costs and improving multiple patient outcomes beyond antibiotic
stewardship alone. The ED is a valuable place to intervene, and this research demonstrates that it can be operationalized safely, with a suggestion that it can be done without significant impact to ED workflow.
LIMITATIONS
An inherent bias of our protocol was the decision to challenge only those with low-risk allergy histories who were then admitted, with the rationale that this would be least likely to impact LOS. This study subsequently cannot provide a comparator group for challenged patients who were then discharged. However, the suggestion that the addition of an amoxicillin challenge did not appear to add to ED operational cost more than a typical admitted patient is a powerful argument in favor of the feasibility of this protocol, and against those who may be skeptical of the potential operational impact of a de-labeling effort. Additionally, there were patients who were eligible for the penicillin allergy assessment but were unable to undergo the oral amoxicillin challenge due to the clinical acuity of their presentation. These patients had low-risk allergy histories, but because of their clinical needs they were not administered the challenge to mitigate any additional risk associated with it.
Secondly, there were patients who declined to receive the oral amoxicillin challenge and/or outpatient allergy clinic consult. These patients elected to keep their penicillin allergy on their profile without any further workup. Lastly, as this study was done during the COVID-19 pandemic, it was noted that fewer allergy assessments were conducted during pandemic surges, as the ED faced larger patient volumes with higher acuity, higher risk patients. An additional consideration is the setting of our ED within a Veterans’ Affairs hospital, which may carry its own operational features that may differ from others. However, our protocol’s main operational requirements (other than typical ED operations) are an ED pharmacist and an outpatient allergy referral, with no particularly unusual measures to engage either. Therefore, we feel that this protocol will be highly reproducible in any ED with these resources.
The use of the allergy assessment protocol has expanded within this VA hospital to include inpatient services. Possible future directions include evaluating the rate of penicillin allergy re-labeling; for example, in this study, there was one patient who was excluded due to having their penicillin allergy removed, with subsequent re-labeling at a later ED visit. Therefore, future studies can assess how often penicillin allergy re-labeling occurs and the safety outcomes associated with initial penicillin allergy de-labeling. Furthermore, this study can be expanded to beta-lactam class allergy evaluation as there is low cross-hypersensitivity between the penicillin and beta-lactam classes.
CONCLUSION
There was no significant difference in the average ED total
length of stay for patients who received an oral amoxicillin challenge vs those who did not receive the challenge. The impact of penicillin allergy assessment and appropriate delabeling has far-reaching benefits for patients and antimicrobial stewardship. A proper evaluation, including assessing prior tolerance history, and subsequent documentation or de-labeling of penicillin allergy, are crucial to providing patients with optimal therapy for their suspected infection.
Address for Correspondence: Cynthia Koh, MD, Veterans Affairs Greater Los Angeles Healthcare System, Department of Emergency Medicine, 11301 Wilshire Blvd, Los Angeles, CA 90073. Email: ckoh007@gmail.com.
Conflicts of Interest: By the WestJEM article submission agreement, all authors are required to disclose all affiliations, funding sources and financial or management relationships that could be perceived as potential sources of bias. No author has professional or financial relationships with any companies that are relevant to this study. There are no conflicts of interest or sources of funding to declare.
1. Pongdee T. Evaluation and management of penicillin allergy. Mayo Clinic Proceedings. 2018;93(1):101-107.
2. Blumenthal KG, Peter JG, Trubiano JA, et al. Antibiotic allergy. Lancet. 2019;393(10167):183-198.
3. Bigby M, Jick S, Jick H, et al. Drug-induced cutaneous reactions. a report from the Boston Collaborative Drug Surveillance Program on 15,438 consecutive inpatients, 1975 to 1982. JAMA. 1986; 256(24): 3358–63.
4. DesBiens M, Scalia P, Ravikumar S, et al. A closer look at penicillin allergy history: systematic review and meta-analysis of tolerance to drug challenge. Am J Med. 2020;133(4):452-462.e4.
5. Raja AS, Lindsell CJ, Bernstein JA, et al. The use of penicillin skin testing to assess the prevalence of penicillin allergy in an emergency department setting. Ann Emerg Med. 2009;54(1):72-7.
6. Marwood J, Aguirrebarrena G, Kerr S, et al. De-labelling self-reported penicillin allergy within the emergency department through the use of skin tests and oral drug provocation testing. Emerg Med Australas 2017;29(5):509-515.
7. Shenoy ES, Macy E, Rowe T, et al. Evaluation and management of penicillin allergy: a review. JAMA. 2019;15;321(2):188-199.
8. Campbell S, Hauler G, Immler EL, et al. Pharmacist-led penicillin allergy assessment in the emergency department reduced empiric fluoroquinolone use. Clin Infect Dis. 2020;71(9):e506-e508.
10. Campagna JD, Bond MC, Schabelman E, et al. The use of cephalosporins in penicillin-allergic patients: a literature review. J Emerg Med. 2012;42(5):612–20.
11. MacFadden DR, LaDelfa A, Leen J, et al. Impact of reported beta-lactam allergy on inpatient outcomes: a multicenter prospective cohort study. Clin Infect Dis. 2016; 63(7):904–10.
12. Turner J, Muraoka A, Bedenbaugh M, et al. The chemical relationship among beta-lactam antibiotics and potential impacts on reactivity and decomposition. Front Microbiol. 2022;13:807955.
13. Joint Task Force on Practice Parameters; American Academy of Allergy, Asthma and Immunology; American College of Allergy, Asthma and Immunology; Joint Council of Allergy, Asthma and Immunology. Drug allergy: an updated practice parameter. Ann Allergy Asthma Immunol. 2010;105(4):259-273.
14. Thompson DF, Ramos CL. Antibiotic-induced rash in patients with infectious mononucleosis. Ann Pharmacother. 2017; 51(2):154–62.
15. Miguel A, Azevedo LF, Araujo M, et al. Frequency of adverse drug reactions in hospitalized patients: a systematic review and metaanalysis. Pharmacoepidemiol Drug Saf. 2012;21(11):1139–54.
16. Blumenthal KG, Lai KH, Huang M, et al. Adverse and hypersensitivity reactions to prescription nonsteroidal anti-inflammatory agents in a
large health care system. J Allergy Clin Immunol Pract 2017;5(3):737–43.e3.
17. Stone CA Jr, Trubiano J, Coleman DT, et al. The challenge of de-labeling penicillin allergy. Allergy. 2020;75(2):273-288.
18. Blumenthal K, Lu N, Zhang Y, et al. Risk of meticillin resistant Staphylococcus aureus and Clostridium difficile in patients with a documented penicillin allergy: population based matched cohort study. BMJ. 2018;361:k2400.
19. Zhang S, Dong T, Xian J, et al. Association between penicillin allergy labels and serious adverse events in hospitalized patients: a systematic review and meta-analysis. Front Pharmacol. 2025;15:1519522.
20. Sousa-Pinto B, Cardoso-Fernandes A, Araújo L, et al. Clinical and economic burden of hospitalizations with registration of penicillin allergy. Ann Allergy Asthma Immunol. 2018;120(2):190-194.e2.
21. Ali SB, Hughes T, Smith A. Penicillin or cephalosporin antibiotic allergy label: Influence on length of stay and hospital readmission. J Allergy Clin Immunol Glob. 2024;3(3):100272.
22. Huang KG, Cluzet V, Hamilton K, et al. The impact of reported beta-lactam allergy in hospitalized patients with hematologic malignancies requiring antibiotics. Clin Infect Dis. 2018;67(1):27-33.
23. Worster A, Bledsoe RD, Cleve P, et al. Reassessing the methods of medical record review studies in emergency medicine research. Ann Emerg Med. 2005;45(4):448-451.
A Systems-based Emergency Department Intervention to Conserve Intravenous Fluids During a National Shortage
Phillip D. Jenkins, MD
Obert Xu, MBBS, BSN
Kenneth DeVane, MS, MBA
Melinda Hartenstein, MN, RN, CEN, CPEN
Haley Manella, MD, MBA
Beech Burns, MD, MCR
Section Editor: Anthony Rosania, MD
Oregon Health & Science University, Department of Emergency Medicine, Portland, Oregan
Submission history: Submitted November 5, 2025; Revision received February 23, 2026; Accepted February 16, 2026
Electronically published June 16, 2026
Full text available through open access at http://escholarship.org/uc/uciem_westjem DOI 10.5811/westjem.53894
Background: Intravenous (IV) fluids are commonly used in emergency departments (ED), but their supply can be vulnerable to national shortages. In September 2024, Tropical Storm Helene disrupted production at a major manufacturing facility, triggering a nationwide IV fluid shortage. In response, our ED implemented a multiphase intervention aimed at reducing non-essential fluid utilization. We aimed to reduce total IV fluid use in the ED by at least 25% through a staged, systems-based conservation strategy.
Methods: We conducted a single-center, retrospective, pre-post quality improvement initiative in a tertiary academic ED with approximately 57,000 annual visits. Interventions were deployed across three Plan–Do–Study–Act cycles: 1) clinician education on fluid stewardship (7 days); 2) protocol modifications to reduce routine IV placement (11 days); and 3) electronic health record (EHR) clinical decision support tools, including an interruptive alert and oral hydration order set (32 days). We analyzed daily fluid administration volumes, and ED census data from September 2024 (preintervention) and November 2024 (post-intervention). The primary outcome was total IV fluid usage per day; a secondary outcome was IV fluid volume per patient encounter. We compared mean daily utilization between periods using two-sample t-tests.
Results: Average daily IV fluid use declined from 56.3 to 24.8 liters, a 56.0% relative reduction (P < .001), while ED volume remained stable (155.4 vs 153.1 encounters/day pre- vs post-intervention).
Normalized per-encounter IV fluid administration decreased from 0.36 to 0.16 liters per visit (P < .001), representing a 56% relative reduction. Assuming a pharmacy acquisition cost of approximately $2 per liter of crystalloid, the intervention was associated with an estimated reduction of $63 in IV fluid expenditures per day (31.5 liters), or $1,890 over the 30-day post-intervention period.
Conclusion: A structured intervention combining education, protocol changes, and EHR decision support significantly reduced IV fluid use in the ED without disrupting operations. This approach may serve as a scalable model for resource stewardship during future supply chain crises. The most substantial reductions occurred during the final intervention phase involving EHR-based decision support. [West J Emerg Med. 2026;27(4)855–860.]
INTRODUCTION
Background
Intravenous (IV) fluids are a foundational therapeutic intervention in emergency medicine, frequently used for
volume resuscitation, electrolyte management, and medication delivery.1 While often considered an abundant resource, the production and distribution of IV fluids are susceptible to supply chain disruptions.2,3 In September 2024, tropical storm
Helene made landfall on the eastern seaboard of the United States, causing major flooding and structural damage to the Baxter manufacturing facility in North Carolina, the primary producer of IV fluid solutions for the U.S. market.4 This event precipitated a national shortage of IV fluids, prompting healthcare institutions across the country to implement emergency conservation strategies.
Historically, national fluid shortages have forced hospitals to ration use, delay elective procedures, or identify alternative therapies.3 However, many frontline clinicians are unaware of the volume of fluids administered daily or the potential for overuse in non-critical contexts. In emergency departments (ED), IV fluids are often initiated reflexively, even in lowacuity settings, despite evidence supporting the safety and efficacy of oral hydration in many cases.5,6 These patterns highlight an important opportunity for system-level interventions to improve resource stewardship without compromising patient care.
Recent literature has highlighted both the risks of IV fluid overuse and the operational consequences of national shortages. Stenson et al analyzed early lessons from the 2024 fluid shortage and emphasized the need for proactive inventory control, clinician education, and real-time analytics to guide conservation efforts.7 Similarly, Mahroos et al described systemic vulnerabilities in medication supply chains during disasters,3 while Aghaie et al found that physicians often underestimate fluid volumes delivered via IV antibiotics, further contributing to overuse.6 These studies underscore the importance of both awareness and structured stewardship interventions in the emergency setting.
Local Problem
In the wake of the 2024 shortage, the ED at Oregon Health & Science University faced a declining stock of IV fluids and uncertain resupply timelines. Despite relatively stable patient volumes, the risk of exhausting available IV fluids posed a threat to safe and continuous emergency operations. An initial audit revealed widespread use of IV fluids for low-acuity complaints, extended maintenance infusions, and protocols that encouraged early IV access without clear indications. Leadership recognized an opportunity to address these practice patterns through targeted interventions.
Objective
The goal of this quality improvement (QI) initiative was to reduce total IV fluid use in our ED by at least 25% during the national shortage. The team sought to implement a phased, systems-based conservation strategy that included educational messaging, protocol modification, and electronic health record (EHR) decision support. We hypothesized that such an approach could reduce overall IV fluid use without affecting ED volume or clinical operations, and that it could serve as a scalable model for future resource stewardship initiatives.
Population Health Research Capsule
What do we already know about this issue? Intravenous (IV) fluid supply is vulnerable to national shortages, and emergency departments (EDs) often overuse IV fluids in low-acuity patients despite safe oral alternatives.
What was the research question?
Can a staged ED intervention reduce IV fluid use during a national shortage?
What was the major finding of the study?
A staged ED intervention reduced IV fluid use 56% (56.3→24.8 liters/day; P < .001) with stable ED volume.
How does this improve population health? Scalable ED stewardship can preserves scarce resources without harming operations during supply crises.
METHODS
Study Design and Setting
This was a single-center, retrospective, pre–post QI initiative conducted in the ED at a tertiary academic medical center with an annual combined adult and pediatric ED volume of approximately 57,000 visits. The institutional review board deemed the project exempt from full board review as a QI activity.
Intervention Strategy
We developed a staged fluid conservation approach informed by real-time supply levels, staff input, and institutional capacity. Interventions were designed and deployed using a Plan-Do-Study-Act (PDSA)8 framework. The timing and spacing of intervention phases were shaped by the operational urgency of an active national IV fluid shortage. To allow rapid deployment of education and protocol-level changes, PDSA cycles 1 and 2 were implemented in close succession, with limited opportunity for traditional wash-in or wash-out periods (Figures 1 and 2).
In contrast, PDSA Cycle 3 was deployed later due to the need for informatics development and testing and the institutional coordination required for EHR-based decision support tools. This variable pacing is consistent with the PDSA Model for Improvement, in which cycle duration reflects feasibility and infrastructure requirements for system-
Source: Oregon Health and Science University
Figure 1. Decision-support flow diagram surrounding intravenous (IV) fluid use in a systems-based conservation intervention In the emergency. department.
IV, intravenous; PO, per os
Figure 2. Tiered intravenous (IV) fluid conservation framework implemented in the emergency department during the national IV fluid shortage in 2024. The table outlines escalating stewardship strategies across three operational phases. Modified (Tier 1), Contingency (Tier 2), and Crisis (Tier 3), with progressively restrictive measures to preserve IV fluid supply. Interventions emphasize the preferential use of oral and intramuscular therapies, restriction of nonessential IV administration, and centralized fluid allocation during severe shortages. This framework guided clinical practice and resource distribution throughout the intervention period. PO, per os; IV, intravenous; NPO, nil per os.
level change. Representative materials used during the PDSA cycles are provided in Appendix A-B.
PDSA Cycle 1: Education and Best Practice Promotion
The first phase involved targeted education for clinicians and nurses on the principles of appropriate IV fluid stewardship. Messaging emphasized the use of enteral hydration for low-acuity patients, discouraged reflexive IV placement, and reviewed evidence-based thresholds for IV rehydration. These materials were shared during staff
Systems-based ED Intervention to Conserve IV Fluids During a National Shortage Jenkins et al. meetings, huddles, and email communication.
The second phase involved system-level changes, including modification of nurse-initiated protocols to limit automatic IV placement, encourage early IV-fluid discontinuation in stable patients, and promote oral or intramuscular antibiotic administration when clinically appropriate. Additionally, IV fluid stock was centralized at the institutional level, and volumes were distributed each day to match the estimated needs of individual units. Although additional fluids could be requested, this intervention was intended to mitigate overuse and discourage stockpiling.
PDSA Cycle 3: Clinical Decision Support Tools
The final phase included deployment of an interruptive EHR-based alert encouraging oral rehydration for eligible patients and the implementation of a dedicated oral hydration order set. These tools were developed in collaboration with clinical informatics and were designed to promote conservationcompatible behaviors during order entry among clinicians.
Data Collection and Outcome Measures
We obtained aggregate daily ED fluid-usage reports through the hospital’s analytics platform, which extracts administration volume data from the EHR. We collected patient census data from institutional dashboards, which were confirmed through internal reporting tools. The primary outcome was the average total volume of IV fluids administered per day across all ED patients. A secondary outcome was average fluid volume per patient per day, calculated by dividing total daily fluid volume by the number of ED encounters.
Statistical Analysis
Figure 3. Distribution of total intravenous fluid volume administered per day before and after a systems-based conservation intervention in an academic emergency department during a national shortage.
We compared pre-intervention data from September 2024 to post-intervention data from November 2024, reflecting one-month periods before and after full implementation of our QI initiative. Descriptive statistics were used to summarize fluid volume and ED census. We performed a two-sample t-test to compare mean daily fluid use between periods. A P value of < .05 was considered statistically significant. We prepared this manuscript in accordance with the Standards for Quality Improvement Reporting Excellence (SQUIRE 2.0) guidelines for reporting healthcare improvement studies. The intervention, context, study design, measures, analysis, results, and interpretation were structured to ensure transparency, reproducibility, and relevance for system-level improvement efforts. A completed SQUIRE checklist is available upon request.
RESULTS
We evaluated IV fluid use in the ED surrounding the implementation of a fluid conservation protocol in response to national shortages. Pre-intervention data were collected September 1–30, 2024, and post-intervention data November 1–30, 2024, following full implementation of the staged conservation measures. The ED served a demographically diverse and stable population across all phases. Approximately half of the patients were female; 35% were 18-45 years of age; and 17-18% were ≥ 65 years of age. Racial and ethnic distributions of patients were consistent across periods, with approximately 76-78% White, 8-9% Black, 5-6% Asian, and 15-16% Hispanic, supporting generalizability of the findings.
Primary Outcome: Reduction in Total Fluid Use
The average daily IV fluid use decreased from 56.3 liters (L)/day in the pre-intervention period to 24.8 L/day following
Figure 4. Weekly trends in intravenous (IV) fluid use during a systems-based conservation intervention in an academic emergency department. The line graph shows liters of IV fluid administered per week across the pre- and post-intervention periods, annotated with the timing of educational, protocol-based, and electronic health record decision support interventions. PDSA, Plan-Do-Study-Act.
Jenkins et al. A Systems-based ED Intervention to Conserve Intravenous Fluids During a National Shortage
implementation of all interventions, representing a 56.0% absolute reduction from baseline (P < .001). This reduction occurred despite a stable average ED patient census of 155.4 encounters/day pre-intervention and 153.1 encounters/day post-intervention, confirming that the observed change was not attributable to fluctuations in patient volume (Figure 3).
Per-Patient Fluid Use
Average daily IV fluid use declined from 56.3 to 24.8 L/ day, a 56.0% absolute reduction (P < 0.001). The ED volume remained stable (155.4 vs 153.1 encounters/day pre- vs post-conservation intervention). Normalized per-encounter IV fluid administration decreased from 0.36 to 0.16 L/visit (P < .001), representing a 56% relative reduction.
Weekly Trends and Stepwise Decline
A review of weekly use trends revealed a progressive decrease in fluid administration corresponding with the three phases of intervention. The earliest reductions were observed following department-wide education and best practice reminders (PDSA 1). A second stage (PDSA 2), which introduced conservation protocols triggered by stock levels, was followed by a more substantial decline. The most sustained reduction was observed after implementation of interruptive EHR-based clinical decision support tools and the addition of an oral hydration order set (PDSA 3) in late October 2024. This phased implementation was consistent with a cumulative and reinforcing effect of layered interventions. (Figure 4)
Cost Implications
Based on an estimated pharmacy acquisition cost of approximately $2 per liter of crystalloid solution, the reduction of 31.5 L/day in average daily use corresponds to an approximate savings of $63 per day, or $1,890 across the 30-day post-intervention period. Implementation resources consisted primarily of clinician and operational staff time for educational efforts, protocol review, and EHR build, representing a one-time investment. Although we did not perform a formal cost-effectiveness analysis, these estimates suggest that the intervention was associated with a favorable balance between one-time implementation effort and ongoing reductions in IV fluid use.
Operational Stability and Balancing Measures
Throughout the intervention period, ED operations and short-term safety indicators remained stable. Internal safety monitoring included a weekly review of return-visit rates, unplanned intensive care unit transfers, rapid-response activations, and mortality metrics via departmental quality dashboards and morbidity and mortality conferences. Mean daily ED volume was similar across phases (157.3 visits/day pre-intervention, 157.1 during PDSA cycles, and 153.6 post-intervention), and patient acuity distribution was
unchanged, with Emergency Severity Index 1–2 encounters comprising approximately 30% of visits in all periods. Short-term outcomes also remained stable, including 48-hour return visit rates (3.84% pre- vs 3.98% post-intervention) and deaths within 24 hours of arrival (0.20% pre vs 0.16% post). These findings support the feasibility and acceptability of the conservation strategy without evidence of unintended negative consequences.
DISCUSSION
In this single-center QI initiative, we implemented a phased fluid conservation strategy in the ED during a nationwide IV fluid shortage. Through education, protocol modification, and EHR-based decision support, we achieved a 56% absolute reduction in total IV fluid use without impacting patient volume. When normalized to ED census, fluid use per patient declined from 0.36 to 0.16 L/visit. These findings suggest that systems-based interventions can meaningfully reduce resource use during supply chain disruptions, even in high-acuity settings such as the ED.
Interpretation of Findings
The success of this initiative likely reflects the synergistic impact of multiple interventions. Early education helped to raise awareness and shift the culture regarding reflexive fluid use. Modifications to nurse-initiated protocols and centralization of supply stock created structural friction that discouraged low-value use. The most pronounced reduction followed deployment of interruptive EHR alerts and the addition of an oral hydration order set, reinforcing the existing literature demonstrating that clinical decision support tools have a particularly strong influence on clinician behavior.9,10 This layered approach aligns with other studies showing that combining education with workflow and system-level changes is more effective than isolated interventions.10-13
Intervention timing reflected operational feasibility: education and protocol changes were implemented rapidly during the shortage, whereas EHR-based tools required longer informatics development and approval timelines. This sequencing likely contributed to the stepwise reduction observed and highlights a practical consideration for teams aiming to generalize or replicate similar conservation efforts. Our findings also highlight how clinical practice norms, such as routine IV placement or prolonged administration of maintenance fluids, can persist despite evidence of limited benefit. By disrupting these default patterns, we encouraged a more intentional approach to hydration and medication administration. Importantly, the interventions targeted process rather than clinician judgment: clinicians retained autonomy but were prompted to reconsider standard practices considering the shortage.
Implications for Practice
This initiative demonstrates that significant reductions in fluid use are feasible, even in busy, complex clinical
Systems-based ED Intervention to Conserve IV Fluids During a National Shortage Jenkins
environments. Our approach may serve as a blueprint for other institutions facing similar shortages or seeking to promote sustainable resource use. Although this project was initiated in response to an acute supply chain disruption, the strategies deployed, especially EHR-based prompts and protocol review, may have ongoing value in promoting high-value care beyond the context of crisis. Furthermore, this work highlights the potential for EDs to serve as testbeds for rapid-cycle quality improvement and systems redesign.
LIMITATIONS
This study has several limitations. First, it was conducted at a single academic institution and may not generalize to community EDs or non-academic settings. Second, we evaluated only short-term outcomes and could not assess the durability of fluid conservation over time. We did not differentiate among crystalloid types administered (eg, lactated Ringer’s vs normal saline), which may have important cost and usage implications, particularly given the higher acquisition cost and more limited availability of balanced solutions. Finally, our pre-post study design limited our ability to draw definitive causal inferences. Future studies could evaluate specific patient-safety centered balancing measures to assess for unintended consequences.
CONCLUSION
This quality improvement initiative demonstrated that a structured, systems-based approach to IV fluid conservation can lead to significant reductions in use during times of critical supply shortage. As supply chain disruptions become increasingly common, scalable and sustainable models like ours may serve as valuable frameworks for institutions seeking to promote high-value care under constrained conditions.
ACKNOWLEDGMENTS
We gratefully acknowledge the Oregon Health & Science University Emergency Department staff for their support in developing and implementing this quality improvement initiative. We especially thank the nursing leadership team and clinical informatics colleagues for their partnership in revising protocols and deploying EHR-based decision support tools. We also acknowledge the contributions of the hospital analytics team for providing access to utilization and census data.
Address for Correspondence: Phillip D. Jenkins, MD, Oregon Health & Science University, 3181 SW Sam Jackson Park Road, Portland, OR 97239. Email: jenkinph@ohsu.edu.
Conflicts of Interest: By the WestJEM article submission agreement, all authors are required to disclose all affiliations, funding sources and financial or management relationships that could be perceived as potential sources of bias. No author has professional or financial
1. Douglas IS, Elwan MH, Najarro M, et al. Dynamic monitoring tools for patients admitted to the emergency department with circulatory failure: narrative review with panel-based recommendations. Eur J Emerg Med. 2024;31(2):98–107.
2. Malbrain MLNG, Langer T, Annane D, et al. Intravenous fluid therapy in the perioperative and critical care setting: executive summary of the International Fluid Academy (IFA). Ann Intensive Care. 2020;10(1):64.
3. Mahroos RE, Yuliwulandari R, Febriawan Z, et al. Medication supply chains during disaster. Glob Int J Innov Res. 2024;2(11):2586–2583.
4. Webb B, Prevatt DO, Kijewski-Correa T, et al, eds. Preliminary Virtual Reconnaissance Report (PVRR): Hurricane Helene. PRJ-5669. Building resilience through reconnaissance. StEER Network; 2024.
5. Messmer AS, Zingg C, Muller M, et al. Fluid overload and mortality in adult critical care patients: a systematic review and meta-analysis of observational studies. Crit Care Med. 2020;48(12):1862–1870.
6. Aghaie J, Lisby M, Jessen MK. Physician awareness of fluid volume administered with intravenous antibiotics: a structured interviewbased study. Clin Exp Emerg Med. 2024;12(1):66–75.
7. Stenson BA, Shaw DL, MacDougall G, et al. The impact of the 2024 intravenous fluid shortage on emergency department length of stay and 72-hour return rate. Am J Emerg Med. 2025;94:140–143.
8. Taylor MJ, McNicholas C, Nicolay C, et al. Systematic review of the application of the plan–do–study–act method to improve quality in healthcare. BMJ Qual Saf. 2014;23(4):290–298.
9. Jankulov A, As-Sanie S, Zimmerman C, et al. Effect of best practice alert on postdischarge opioid prescribing after minimally invasive hysterectomy: a quality improvement study. J Pain Res 2024;17:667–675.
10. Barnes GD, Spranger E, Sippola E, et al. Assessment of a best practice alert and referral process for preprocedure antithrombotic medication management for patients undergoing gastrointestinal endoscopic procedures. JAMA Netw Open. 2020;3(2):e1920548.
11. Rangachari P, Al Arkoubi K, Shindi R. A multi-level framework for advancing digital health equity in learning health systems: aligning practice and theory with the Quintuple Aim. Int J Equity Health 2025;24:253.
12. Harrison MI, Shortell SM. Multi-level analysis of the learning health system: integrating contributions from research on organizations and implementation. Learn Health Syst. 2021;5(2):e10226.
13. Burns BS, Nouboussi N, DeVane K, et al. Increasing use of rapid magnetic resonance imaging for children with blunt head injury. J Pediatr. 2024;272:114099.
Original Research
Autologous Fat Transfer Procedure Complications in Four Emergency Departments in Miami, Florida
Mary Bridget Lee, MD, MPH*
Joshua Goldstein, MD†
Daniel Hercz, MD‡
Matthew Pyle, MD§||
Montefiore Medical Center, Department of Critical Care Medicine, Bronx, New York Massachusetts General/Brigham Hospital System, Department of Pulmonary & Critical Care Medicine, Boston, Massachusetts PeaceHealth SW, Department of Emergency Medicine, Vancouver, Washington Jackson Health System, Department of Emergency Medicine, Miami, Florida University of Miami, Miller School of Medicine, Department of Surgery, Miami, Florida
Section Editor: Murat Çetin, MD
Submission history: Submitted November 11, 2025; Revision received March 13, 2026; Accepted March 17, 2026
Electronically published July 16, 2026
Full text available through open access at http://escholarship.org/uc/uciem_westjem DOI 10.5811/westjem.54037
Introduction: Our study objective was to share the experiences of four public emergency departments (ED) caring for patients with complications of gluteal autologous fat transfer (AFT), colloquially known as Brazilian butt lifts, to provide emergency physicians with a better understanding of these patients and potential complications associated with the procedure.
Methods: Jackson Health System in Miami, Florida, undertook an institutional initiative to prospectively collect data on patients presenting to any of the system’s EDs with gluteal AFT complications from October 2020–May 2023. We abstracted patient charts for demographics, disposition, lab values, diagnoses, and care-related charges to generate descriptive statistics. Our primary outcome measure was diagnostic code and diagnostic category. Secondary outcome measures were hemoglobin on presentation, units of blood transfused, admission level of care, hospital charge, length of stay, and mortality.
Results: Of 234 potentially relevant patient charts identified by our hospital protocol, 157 patients met our criteria. All were female, with an average age of 33. A total of 123 patients were from out of state, and one was international. The most common diagnoses were anemia/bleeding (81 patients), followed by pain (65), cardiac (36) and hypovolemia/dehydration (32). Our analysis revealed that 86 patients presenting to the ED required admission (54.8%), with 12 patients requiring intensive care unit care (7.6%). There was one death (0.6%). Total hospital charges for this cohort equaled $2,822,540, averaging $17,977 per patient.
Conclusion: Gluteal AFT procedures are associated with a wide range of complications, morbidity, and mortality. These patients have a high admission rate and the potential to be critically ill. Patients travel from around the country to have these procedures performed, and it is crucial that EDs nationally are prepared to care for them. [West J Emerg Med. 2026;27(4)861–868.]
INTRODUCTION
Background
Gluteal autologous fat transfer (AFT) procedures, colloquially known as “Brazilian butt lifts,” are gaining prominence in the aesthetic surgery community. A surgical technique to augment a patient’s buttocks, AFT involves
abdominal liposuction followed by re-injection of the fat into the gluteal area. The procedure has soared in popularity as beauty standards have shifted and cosmetic surgery has become increasingly transparent on social media platforms, with reported cases in the United States increasing from 614 in 2002 to 61,387 by 2021, a nearly 10,000% increase.1–3 The procedure
can cost thousands of dollars and requires significant postoperative care; in addition to typical postsurgical needs, patients often require aggressive lymphatic massage and have significant movement restrictions that include sleeping face down, avoiding sitting, and wearing compression garments.4
Importance
Plastic surgeons have been investigating complications of gluteal AFT for more than a decade.5–8 The most dangerous complication of gluteal AFT is pulmonary fat embolism. This type of embolism may also occur when fat is injected or absorbed into a blood vessel during the re-injection phase of an AFT procedure. It has even been suggested that moving the patient into a supine position postoperatively can put enough pressure on newly deposited adipose tissue to shift it into the bloodstream.7 Theoretically, ultrasound guidance should decrease this risk, which formed the basis for a 2022 Florida Board of Medicine regulation requiring its use.9 Pulmonary fat emboli from gluteal AFT are rare (1:1,030 procedures) but life-threatening. Mortality rates are as high as 50%6,10—the highest for any aesthetic procedure.6
Miami, Florida, has become a popular destination for these procedures. Unfortunately, as cases have increased, South Florida has also seen an increase in well-publicized poor outcomes. When seven gluteal AFT patients died in one year alone, the Florida Board issued an emergency regulation restricting fat injection to the subcutaneous space as opposed to injecting into muscle.11 Despite this new regulation, at least 13 deaths were reported in Miami-Dade County from 2019-2022, the three years immediately following the implementation of the subcutaneous injection regulation.7 These deaths led to another wave of regulations, the impact of which has yet to be reported.
Goals of the Investigation
Because a significant number of gluteal AFT procedures are performed at standalone outpatient surgical centers, accurate data on complication rates are difficult to obtain. The existing literature, which is aimed primarily at specialists in plastic and cosmetic surgery, relies on voluntary reporting, physician surveys, and postmortem reports.
Jackson Health System (JHS) is a nonprofit academic health system operated by Miami-Dade County and affiliated with the University of Miami Medical School. The system operates four main hospitals, one pediatric hospital, and a Level I trauma center. Three smaller JHS emergency departments (ED) are located in suburban Miami-Dade County: Jackson South (41,000 visits per year); Jackson West (27,000;) and Jackson North (53,000). Jackson Memorial, the larger, tertiary-care facility in downtown Miami has 112,000 visits per year. Many cases are transferred from other facilities to Jackson Memorial for subspecialist evaluation or when a higher level of care is required. These hospitals are well positioned to add quantitative data regarding emergency care of gluteal AFT procedures to the existing literature.
Population Health Research Capsule
What do we already know about this issue?
Gluteal autologous fat transfer (AFT) procedures are associated with high mortality rates compared with other aesthetic procedures.
What was the research question?
What are the patient characteristics and medical complications of gluteal AFT procedures presenting to the emergency department (ED)?
What was the major finding of the study?
The top diagnostic categories were anemia (51.6%), pain (41.4%), cardiac (22.9%) and hypovolemia (20.4%).
How does this improve population health?
This study provides the first description of this patient population in an ED setting and provides emergency physician-specific guidance for their care.
In this paper we aimed to describe the experience of caring for patients with gluteal AFT complications in the ED setting. Our goal was to fill a gap in the medical literature to assist emergency physicians nationwide in treating these patients who have had surgeries performed in their own cities or returned home following “medical tourism” trips.
METHODS
Study Design and Setting
We reviewed the 12 criteria for emergency medicine medical record review studies, as per Worster et al, and addressed them as described below.12 This was an institutional review board-approved cross-sectional chart review of patients presenting to JHS EDs with complications of gluteal AFT procedures during the 32 months between October 2020–May 2023 (Worster criteria 12). The Public Health Trust of MiamiDade County operates four hospitals in the JHS that serve as the medical safety net and major referral center for the region. Our health system also partners with the University of Miami School of Medicine in its capacity as a teaching hospital. The hospital system uses the Cerner electronic health record system (Oracle Health, Nashville, TN).
Selection
of Participants (Worster Criteria 2 and 10)
In 2020, JHS undertook an institutional initiative to identify patients with gluteal AFT procedure complications.
Nursing leadership created a patient safety event that enabled anonymous reporting by anyone involved in the patient’s care. An electronic form accessed through our in-house patient safety reporting system prompted clinicians to provide the patient’s medical record number and date of visit, as well as optional fields that included patient demographics, the nature of the complication, and the name of the facility where the procedure had been performed. Reminders were sent via institution-wide emails and announced at meetings where clinical staff were encouraged to submit the information whenever they had a patient who met the inclusion criteria: patients presenting to the ED after a gluteal AFT with a complication presumed to be secondary to the procedure.
Study investigators JG and MBL, working independently, manually reviewed all Cerner charts identified during the study period for exclusion criteria. Charts were excluded if the patient was < 18 years of age at the time of the visit, pregnant, incarcerated, or required a guardian or healthcare proxy due to cognitive impairment. We also excluded charts if the visit was not preceded by a gluteal AFT procedure (defined as liposuction followed by fat transfer to the gluteal area).
Measurements
Investigators reviewed Cerner medical record charts that met inclusion criteria and collected data regarding patient demographics, diagnostic codes, vital signs, medical interventions, blood transfusions, disposition, level of care, hospital length of stay, and mortality (Worster criteria 3 and 9). Missing demographic information was reported as unknown. Five patients did not have lab results; these patients were excluded from analysis related to hemoglobin level. No other missing data was encountered (Worster criteria 11). All charts included up to five International Classification of Diseases, 10th ed (ICD-10) diagnostic codes (primary through quinary) assigned to the encounter. JG and MBL performed the data collection and abstraction with the use of a standardized, closedresponse spreadsheet with pre-defined variables (Worster criteria 4). Study investigator MP adjudicated any discrepancies between the two primary abstractors (Worster criteria 5). Each patient was assigned a study number, and all identifying information, including name, birthdate, and medical record number, was removed from the data.
Abstractors were not blinded to the study hypothesis and did not receive formal training prior to data collection (Worster criteria 1 and 6). Interobserver reliability testing was not possible in the selection of the initial dataset as the medical record numbers were provided to us by the Office of Patient Safety based on the data from the event reporting program. However, two authors subsequently reviewed each chart individually to assess whether the patient met the predefined inclusion criteria and then extracted the relevant clinical data. There was 100% agreement on the 77 cases that did not meet inclusion criteria and were excluded; and intraclass correlation coefficient was > 0.75 for all clinical
data points extracted (Worster criteria 7 and 8).
We performed descriptive statistics on this de-identified data to reach our conclusions regarding the presentation and care of these patients. Often, similar (but not identical) diagnostic codes were used across the study population. Due to this variation in code assignment, reporting the prevalence of specific diagnostic codes would not have accurately reflected the prevalence of symptoms and disease states. Therefore, related diagnostic codes were grouped into diagnostic categories. All ICD-10 codes were reviewed and categorized by relevant body system. The ICD-10 diagnoses with the same or similar keywords were grouped together (eg, all ICD-10 codes with “anemia,” “hemorrhage,” or “blood loss” were categorized under “anemia”). The ICD-10 codes with “history of” language were not included in the categorization. Codes that were not related to a specific body system, or lacked similar keywords, were not placed in a category.
Our billing department provided cost analysis after patient discharge. For the purposes of this analysis we calculated only charges, rather than actual payments.
RESULTS
Nursing leadership provided investigators the 234 charts that had been flagged by the referral protocol during the study period. Three patients had more than one ED visit for complications related to the same procedure. These multiple encounters were treated as one entry. One patient had a positive pregnancy test at the time of her ED visit. We excluded 73 charts that did not reference a gluteal AFT procedure. In total, 77 charts were excluded, leaving 157 charts for analysis. See Figure 1.
Characteristics of Study Subjects
The average patient age was 33 (standard deviation 9.5). All patients (100%) were women, including one transgender woman. Patient charts identified 83 White women (52.9%), 71 Black women (45.2%), and three women (1.9%) whose race was listed as “Other.” In the study cohort, 25 (15.9%) were described as Hispanic or Latina in the medical record. There were 123 patients (78.3%) with a primary address out of state; one patient had an international address (0.6%); and four had no home address recorded (2.6%). Patients presented on median postoperative day 1 (IQR 3). The cohort included one patient presenting in 2020 (0.6%), 39 in 2021 (24.8%), 85 in 2022 (54.1%), and 32 in 2023 (20.4%). See Table 1 and Figure 2.
Main Results Disposition
The ED admitted 86 gluteal AFT patients (54.8%). Of those admitted, 69 (80.2%) were admitted to the medical floor, five (5.8%) to the intermediate care unit (IMCU), and 12 (14.0%) to the intensive care unit (ICU) (Figure 1). Average length of stay was 1.8 days (SD 2.2). Three patients left against medical advice.
1. Study flow diagram of patients presenting to Miamiarea emergency departments with complications following gluteal autologous fat transfer procedures.
AFT, autologous fat transfer; AMA, against medical advice; ED, emergency department; IMCU, intermediate care unit; ICU, intensive care unit.
Medical Complications
Patient visits often had more than one diagnostic code assigned. The most common diagnostic codes were related to anemia and bleeding (81 charts [51.6%]). The average initial hemoglobin level was 7.9 grams per deciliter (SD 1.9). Within the first 24 hours of presentation, 54 patients (33.1%) required a blood transfusion. Of those transfused in the first 24 hours, an average of 1.6 units (0.9) were transfused. A total of 63 patients (40.1%) required a blood transfusion at some point during their hospitalization.
There were 65 patient charts (41.4%) with ICD-10 codes associated with pain, 36 (22.9%) with cardiac-related ICD-10 codes, and 32 (20.4%) with diagnostic codes related to hypovolemia. Five patients required an operative intervention during their hospitalization for two hematoma evacuations, two bowel perforations, and one incarcerated ventral hernia. See Table 2 for additional information.
Table 1. Characteristics of patients presenting to the emergency department after gluteal autologous fat transfer procedures.
Study subject characteristics
Average age, years (SD)
Sex
Assigned female at birth, n (%)
33 (9.51)
156 (99.36%)
Assigned male at birth, n (%) 1 (0.64%)
Gender
Women, n (%)
157 (100%)
Men, n (%) 0 (0%)
Race
White, n (%)
Black, n (%)
83 (52.87%)
71 (45.22%)
Other, n (%) 3 (1.91%)
Ethnicity
Hispanic/Latina
Non-Hispanic/Latina
Home Address
In state (Florida)
Out of state (United States)
International
None
25 (15.92%)
132 (84.07%)
29 (18.47%)
123 (78.34%)
1 (0.64%)
4 (2.55%)
ED, emergency department; SD, standard deviation.
Severe Complications
After their procedures several patients suffered severe complications, defined as requiring an ICU admission or a cardiac arrest ICD-10 code. The reasons for ICU admission are listed in Table 3. The average age of patients with severe complications was 40.5 years (SD 8.1). Patients presented a median of one day post-procedure (IQR 2). Of the 12 patients admitted to the ICU, three required an operative intervention. The average presenting hemoglobin among the ICU patients was 8.8 (2.3). Seven ICU patients required a blood transfusion in the first 24 hours and nine at any point during their hospitalization. The nine patients who required a transfusion received an average of 3.2 units (1.7). The most common diagnostic categories for patients with severe complications were anemia (50%), shock (41.7%), respiratory (41.7%), cardiac (41.7%), and renal (33.3%).
See Appendix A for details regarding diagnostic categories.
Three patients had a cardiac arrest ICD-10 code. Of these, two had a cardiac arrest prehospital and one had an intraoperative cardiac arrest after admission. One of the prehospital cardiac arrest patients died. There were no other deaths in the study cohort.
Cost
The total hospital charges for these patients amounted to$2,822,540. Gluteal AFT complication care charges averaged $17,977 per patient (IQR $14,224).
Figure
Figure 2. Time to emergency department presentation from a retrospective chart review of patients presenting to Miami-area EDs with complications related to gluteal autologous fat transfer procedures.
ED, emergency department.
DISCUSSION
South Florida has been described as a hub for gluteal AFT procedures both in popular media and in the medical literature.2,4,7 Our study identified 157 patients who presented to JHS EDs with gluteal AFT procedure complications in a 32-month period. Because the study was limited to a single hospital system we could not determine whether the size of this cohort was disproportionate to other geographic locations. However, most patients appeared to have traveled from out of state for their procedures, suggesting that Miami is a destination for gluteal AFT procedures. Although patients typically presented within three days of their procedures, we saw patients presenting with gluteal AFT complications up to postoperative day 9. This suggests that some patients likely returned to their home states within the complication period and reinforces the importance of emergency clinician awareness of the procedure and its potential complications, regardless of their geographic location.
The most common presenting complaints were related to bleeding, pain, and cardiac abnormalities. Patients were anemic on presentation with an average hemoglobin of 7.9. One-third of patients required a blood transfusion within 24 hours of presentation. Patients admitted to the ICU had higher presenting hemoglobins but were more likely to require a blood transfusion and more units of blood, perhaps explained by the higher rate of return to the operating room in this group.
Postoperative pain emerged as another common concern. This was distressingly illustrated by a patient who overdosed on her home methadone in an attempt at better pain control. Safely treating postoperative pain improves patient experience and may reduce ED visits. The cardiac abnormalities that patients experienced represented a broad spectrum from sinus tachycardia to cardiac arrest. It is likely that some of the less-severe cardiac diagnoses were secondary to bleeding, pain, and other primary concerns.
A recent study by Weidman et al looked at complications of outpatient fat grafting and gluteal augmentation identified in QUAD A (American Association for Accreditation of Ambulatory Surgery Facilities). Although these complications were self-reported to a regulatory body after procedures performed in accredited facilities, the authors did find that complication rates doubled from 2020 to 2021, which represents the beginning of our study period. Of the 436 complications reported, wound infection was the most common (22.3%).13 Similarly, a 2023 systematic review of 1,788 gluteal fat augmentation procedures found seroma (6.9%) and infection (3.0%) to be the most common complications.14 Interestingly, we had much lower rates of infectious complications in our patient population. Given that the patients in our study presented on median postoperative day 1, it is possible our reporting protocol overidentified patients presenting early in their postoperative course.
Another study looked at complication rates of different autologous gluteal augmentation techniques in 185 patients and reported no major complications.15 The patients in that study underwent the procedure to correct truncal deformity after significant weight loss; the procedure itself differs from the gluteal AFT in several ways, notably the creation of a cutaneous flap. The absence of major complications in that study’s patient group may suggest that the patients in our review underwent a more invasive procedure, with environmental or technical differences that put them at greater risk.
Mortality associated with gluteal AFT procedures has increasingly come under scrutiny in the past few years. A 2017 report by the Aesthetic Surgery Education and Research Foundation (ASERF) estimated the incidence of mortality to be between 1:6,214 to 1:2,351; however, ASERF noted that the estimates were significantly limited by a lack of standardized reporting of complications.6 In 2019, ASERF conducted a survey of plastic surgeons, with responses suggesting a decrease in the occurrence of pulmonary fat emboli and incidence of mortality to 1:2,493 and 1:14,952, respectively.16 This would indicate that gluteal AFT is now safer than abdominoplasty (incidence of mortality, 1:13,147).6 However, absolute number of deaths from pulmonary fat emboli following gluteal AFT increased in South Florida after this report.7 Much of the existing literature on gluteal AFT complications focuses on pulmonary fat embolism; no studies have reported the number of patients presenting to the ED after a gluteal AFT procedure. The results of our study indicate that most patients presenting to the AD with gluteal AFT complications met admission criteria but were hemodynamically stable, with cases of critical illness relatively uncommon.
Pulmonary fat embolism is the most widely discussed serious complication of gluteal AFT in the media and scientific literature; however, this diagnosis can only be made at postmortem examination. Two patients in our cohort had
Table 2. Most common complications by diagnostic code and diagnostic category in a study of patients presenting to Miami-area emergency departments after undergoing gluteal autologous fat transfer procedures.
Most Common Diagnostic Categories
*If patients had multiple codes within the same diagnostic category, these were treated as one entry.
ICD-10, International Classification of Diseases, 10th Ed.
presentations highly concerning for pulmonary fat embolism but did not receive a definitive diagnosis. Both patients decompensated during or immediately after their gluteal AFT procedures: one had a cardiac arrest and was declared dead on ED arrival, and one developed stroke-like symptoms. At the time of publication, an autopsy report for the deceased patient was not available. It is difficult to compare mortality and presumed pulmonary fat embolism for our cohort to that reported in the literature given the different denominators. The incidence of mortality reported by ASERF is based on estimates of the total number of gluteal AFT procedures performed, whereas our study is based on number of patients presenting to the ED. For two patients, the timing of their critical illness appears to have been coincidental; one patient developed new-onset diabetes with diabetic ketoacidosis, and one patient developed a perforated marginal ulcer at the site of a prior bariatric surgery. For these patients there was no clear mechanism of injury related to the gluteal AFT procedure,
although a connection cannot be ruled out.
Patients with gluteal AFT complications accumulated significant hospital charges related to their care. The hospital charges equaled $2,822,540, or an average of $17,977 per patient. To our knowledge, we are the first to report on the financial implications of gluteal AFT complications. Reducing complication rates and appropriately evaluating these patients in the ED could reduce the financial burden on both patients and health systems.
We offer several recommendations to emergency physicians based on these findings. First, and most broadly, even though many of these patients are young and may have been in good health prior to their surgery, they have the potential to be critically ill; therefore, a high index of suspicion should be maintained in their evaluation. These patients are not suitable for “fast track” or low-acuity areas of the ED. Second, given the significant overlap in how the most common categories
complaints (pain,
and
Table 3. Reason for admission to intensive care unit and need for operative intervention in a study of patients presenting to Miamiarea emergency departments after undergoing gluteal autologous fat transfer procedures.
Patient Reason for ICU admission Operative Intervention?
1 Retained hematoma, anemia Yes
2 Hemorrhagic shock No
3 Hemorrhagic shock No
4 Pneumoperitoneum No
5 Altered mental status requiring intubation for airway protection No
6 Stroke syndrome No
7 Cardiac arrest No
8 Marginal ulcer perforation Yes
9 Small bowel obstruction with perforation Yes
10 Convulsions No
11 Pneumoperitoneum No
12 Diabetic ketoacidosis No ICU, intensive care unit.
internal data collected under a new hospital protocol. Accurate data collection depended on the care team participating in the reporting protocol (ie, our findings may not represent a comprehensive list of all gluteal AFT complications that presented during the study period). The time distribution of patients presenting to the ED was likely influenced by when staff received training and reminders about this initiative.
Additionally, because there is no standard reporting system or database for gluteal AFT procedures in Miami-Dade County, it is impossible to know with precision how many of these procedures were performed in the county during our study period. Without a denominator, we were unable to calculate the occurrence of complication for gluteal AFT procedures. For similar reasons, we could not make comparison between gluteal AFT complications and complications related to other cosmetic surgery procedures. This limited our ability to compare our findings to previously published data on this topic.
anemia) can present both clinically and hemodynamically, clinicians must take care not to anchor on any one cause and to recognize (and manage) the possibility of multiple simultaneous processes.
Third, given the high number of patients in our study who required blood transfusion, particular attention should be paid to clinical signs and symptoms of hemorrhagic shock or bleeding. Patients should have type and crossmatching sent as part of their initial lab evaluation, and clinicians should also be aware of the potential need for cross-sectional imaging, specifically angiography, to locate the source of the bleeding. Finally, clinicians should be aware of the specific challenges with these patients: they are frequently reluctant to remove their postoperative garment; they have often had their postoperative pain undermanaged; and they frequently travel for this procedure, which heightens their emotional and psychological distress because they were far from home while acutely ill—all of which can delay or complicate the initial evaluation.
LIMITATIONS
Our greatest methodological challenge was identifying all patients presenting with gluteal AFT complication from the medical record. There is no ICD-10 code specific for this diagnosis or for cosmetic surgery complications generally. These patients are assigned an array of different codes based on physician judgment, making a retrospective chart search difficult. Rather than manually reviewing all charts with general surgical complication codes, we were able to use
We relied on information collected during routine patient registration. As a result, some of the patient demographic information is limited. For example, our electronic health record offers three racial categories (Black, White, other), and there is no defined protocol for how these categories are determined (self-identified versus assigned). Although this results in a less-precise picture, it is sufficient to provide a basic understanding of the diversity of our patient population. Additionally, we created diagnostic categories to capture the true onset of certain symptoms and disease states. However, this is not a widely accepted and standardized process and may have introduced bias into our results.
Our goal was to increase awareness and assist emergency clinicians in caring for patients with complications of gluteal AFT procedures. However, many aspects of this procedure deserve additional research. Larger epidemiologic studies that can capture the total number of procedures performed will help elucidate the risk of complications and how it compares to other cosmetic procedures. Analysis of the impact of recent legislation regulating the performance of gluteal AFT will also help us determine what has been effective in making these procedures safer for patients. Our goal is to equip emergency physicians to care for these patients while additional research identifies ways to reduce the number of gluteal AFT complications.
CONCLUSION
We describe a racially and ethnically diverse population that often travels out of state for cosmetic procedures. Patients present to EDs primarily for bleeding, pain, and cardiac abnormalities and have a high admission rate. A smaller subset experience severe complications, including death. We recommend that emergency physicians maintain a high index of suspicion for critical illness, evaluate for post-procedural hemorrhage, and maintain sensitivity for the unique aspects of recovering from gluteal autologous fat transfer.
Address for Correspondence: Mary Bridget Lee MD, Division of Critical Care Medicine, Montefiore Medical Center, 111 E 210th St, Bronx, NY 10467. Email: mlee4@montefiore.org.
Conflicts of Interest: By the WestJEM article submission agreement, all authors are required to disclose all affiliations, funding sources and financial or management relationships that could be perceived as potential sources of bias. No author has professional or financial relationships with any companies that are relevant to this study. There are no conflicts of interest or sources of funding to declare.
1. Cosmetic Surgery National Data Bank: 2002 statistics. Am Soc Aesthetic Plast Surg. 2002.
2. Jennings R. The BBL effect: how the Brazilian butt lift went mainstream. 2021. Available at: https://www.vox.com/the-goods/22598377/bblbrazilian-butt-lift-miami-cost-tiktok. Accessed February 19, 2024.
3. Aesthetic Plastic Surgery National Databank Statistics 2020–2021. Aesthet Surg J. 2022;42(Suppl 1):1-18.
4. Garcia SE. Butt lifts are booming. Healing is no joke. 2022. Available at: https://www.nytimes.com/interactive/2022/05/11/magazine/brazilian-buttlift.html. Accessed January 5, 2023.
5. Cárdenas-Camarena L, Bayter JE, Aguirre-Serrano H, et al. Deaths caused by gluteal lipoinjection: What are we doing wrong? Plast Reconstr Surg. 2015;136(1):58-66.
6. Mofid MM, Teitelbaum S, Suissa D, et al. Report on mortality from gluteal fat grafting: recommendations from the ASERF task force.
Aesthet Surg J. 2017;37(7):796-806.
7. Pazmiño P, Garcia O Jr. Brazilian butt lift–associated mortality: the South Florida experience. Aesthet Surg J. 2022;43(2):162-178.
8. Bruner TW, Roberts TL, Nguyen K. Complications of buttocks augmentation: diagnosis, management, and prevention. Clin Plast Surg. 2006;33(3):449-466.
9. Vidal-Laureano N, Huerta CT, Perez EA, et al. Augmented safety profile of ultrasound-guided gluteal fat transfer: retrospective study with 1815 patients. Aesthet Surg J. 2024;44(4):NP263-70.
10. Che DH, Xiao ZB. Gluteal augmentation with fat grafting: literature review. Aesthetic Plast Surg. 2021;45(4):1633-41.
11. Florida Board of Medicine. Emergency rule on gluteal fat grafting effective June 27, 2019. 2019. Available at: https:// floridasosteopathicmedicine.gov/emergency-rule-on-gluteal-fat-graftingeffective-june-27-2019/. Accessed February 19, 2024.
12. Worster A, Bledsoe RD, Cleve P, et al. Reassessing the methods of medical record review studies in emergency medicine research. Ann Emerg Med. 2005;45(4):448-451.
13. Weidman AA, Foppiani J, Valentine L, et al. Complications from fat grafting and gluteal augmentation in outpatient plastic surgery: an analysis of AAAASF data. Aesthet Surg J. 2024;44(7):722-730.
14. Oregi P, Khatib M, Cavale N, et al. Comparing the safety profiles of implants and autologous fat grafting in gluteal augmentation: a systematic review. J Plast Reconstr Aesthet Surg. 2023;83:463-474.
15. Özkaya Ö, Ergan Şahin A. Comparison of complication rates of different autologous gluteal augmentation techniques in 185 consecutive body lift surgeries in massive weight loss patients. Aesthetic Plast Surg. 2025;49(10):2760-2770.
16. Rios L, Gupta V. Improvement in Brazilian butt lift (BBL) safety with current recommendations from ASERF, ASAPS, and ISAPS. Aesthet Surg J. 2020;40(8):864-870.
Emergency Department-initiated Naltrexone for Alcohol Use Disorder: Association with Recidivism
Otis Warren, MD
Jeremiah Gress, MD
Timmy Lin, MPH
Melanie Lippmann, MD
Gary Bubly, MD
Section Editor: Ryan Ley, MD, MBA
Brown University Health, Department of Emergency Medicine, Providence, Rhode Island
Submission history: Submitted October 7, 2025; Revision received March 19, 2026; Accepted March 20, 2026
Electronically published July 16, 2026
Full text available through open access at http://escholarship.org/uc/uciem_westjem DOI 10.5811/westjem.52971
Introduction: Alcohol use disorder (AUD) contributes to significant healthcare costs, disease, emergency department (ED) crowding, and recidivism. Naltrexone is a treatment for AUD that has been approved by the U.S. Food and Drug Administration and holds promise as a pharmacologic intervention for ED patients with AUD. We hypothesized that subjects who received naltrexone in the ED would have associated reduced recidivism in the 30 days after treatment.
Methods: This was a retrospective chart review of an AUD quality program comparing ED visits in the 30 days before with 30 days after initiation of naltrexone in the ED. We performed this study at two academic hospitals (one a Level I trauma center) and one community hospital.
Results: A total of 297 subjects (median age 43 years, 69.5% male) made 331 naltrexone index visits during the study period. There was no difference in the number of ED visits before versus after the index visit among all subjects (0 median visits before [interquartile range 0-1] versus 0 median after [0-1]). Subjects who were frequent ED users (defined as ≥ 4 ED visits in the 90 days preceding (N=56 [16.9%]) had a significant reduction in ED visits after administration of naltrexone (median of 5 visits [3-8] before versus 3 [2,6] after), with 36 of these subjects (64.3%) having reduced ED visits in the 30 days after naltrexone administration.
Conclusion: Naltrexone administered in the emergency department had no associated change on the study population’s rates of recidivism for alcohol use disorder, but it was associated with reduced ED recidivism in subjects with high ED use. [West J Emerg Med. 2026;27(4)869–874.]
INTRODUCTION
Alcohol use disorder (AUD) contributes significantly to disease burden, healthcare costs, hospitalization, and resource use for emergency departments (ED) throughout the United States. It is estimated that alcohol accounts for $249 billion in healthcare costs annually with heavy episodic drinking accounting for most of that cost at $191.1 billion.1–3 Additionally, patients with AUD are more likely to be frequent users of the ED and emergency medical services.1,4 Providing effective treatment to patients with AUD in the ED is difficult due to limitations of clinicians’ understanding of
pharmacotherapy options available, the lack of continuity of care, time constraints, and costs.5–7
Naltrexone is approved by the U.S. Food and Drug Administration (FDA) for treating AUD. Naltrexone is an opioid receptor antagonist, thought to reduce the opioidmediated pleasure response from ethanol use.8,9 Randomized studies in outpatient settings of naltrexone for AUD have shown mixed results with trends toward improvement in reduction in heavy drinking days, particularly when combined with behavioral therapy.10–13 This poses great potential for benefit in patients presenting to the ED with AUD and, more
specifically, in those who report “binge-drinking.” A limited number of feasibility studies have demonstrated increases in quality of life and reduction in alcohol cravings for patients starting naltrexone in the ED, suggesting the need for further study.14–16 There have been no studies evaluating naltrexone’s effect on ED visits and recidivism. In this study, we evaluated a quality program with insurers to provide naltrexone to patients with suspected AUD in the ED. Our hypothesis was that subjects who received ED-initiated naltrexone as part of the quality program would have associated reduced recidivism.
METHODS
We performed a retrospective chart review of naltrexone in an AUD quality program. Our primary outcome was ED visits by subjects with suspected AUD in the 30 days prior to ED-initiated naltrexone compared to ED visits in the 30 days following. Secondary outcome measures were a subject’s visits with non-high ED use (defined as fewer than four ED visits in the preceding 90 days) and high ED use (more than four ED visits in the preceding 90 days).
Naltrexone Quality Program
In July 2022, a quality program was developed between the hospital system and multiple insurers. After outreach, four of the major commercial and managed Medicaid insurers in our catchment area agreed to contract with the healthcare system to create a separate contractual carveout in addition to previously negotiated facility fees to cover the ED cost of extended-release (intramuscular) naltrexone (XR-NTX) to ED patients with suspected AUD. These insurers agreed to continue the program indefinitely with annual review. To date, none of the insurers have discontinued the contractual carveout. The clinical program was offered to patients with suspected AUD regardless of insurance status. The quality program was carried out at three hospitals within the same hospital system: 1) an urban, academic teaching hospital and Level I trauma center with an approximate annual ED volume of 138,000; 2) a community teaching hospital in the same city with an approximate annual ED volume of 70,000; and 3) a community hospital in a neighboring city with an approximate annual ED volume of 38,000.
Multiple educational lectures and resources were provided to attendings, residents, nurse practitioners, physician assistants, nurses, and pharmacists. This included lectures at residency conferences, faculty meetings and nursing huddles. Information was provided via slides with a summary of the evidence for naltrexone for AUD with attention paid to contraindications, particularly the risk of precipitated opiate withdrawal (see below). Follow-up emails to the above groups reiterated this information throughout the study period. Treatment with naltrexone was offered at the discretion of the clinician and the patient.
A chart flag was created alerting clinicians to consider
Population Health Research Capsule
What do we already know about this issue?
Alcohol-related complaints represent a large proportion of emergency department (ED) and healthcare costs. Naltrexone shows promise in reducing heavy drinking.
What was the research question?
Is initiating naltrexone in the ED associated with reduced ED use?
What was the major finding of the study?
64.3% (n = 36/56) of subjects with high ED use made fewer visits after naltrexone initiation (P < .001).
How does this improve population health?
Initiating naltrexone in the ED is associated with reduced ED use by patients with alcohol use disorder.
offering naltrexone to patients with AUD. This alert flagged charts of patients who had at least one diagnosis within the health system of an alcohol-related illness within the prior five years. This flagged any patient who had an International Classification of Diseases, 10th Rev, (ICD-10) code category F-10, which is a broad category defined as mental and behavior disorders due to use of alcohol.17 The alert—a banner that appeared on the side of the patient’s char—was visible upon first opening the chart and again in the disposition screen. It was not a “hard stop” flag and did not require physicians and advanced practice clinicians to interact with it. Clicking on the banner led to links to a standardized order set with safety measures and contraindications to naltrexone, as well as instructions for patient follow-up.
An order set standardized the dosing and safety components. All subjects were given outpatient follow-up in an addiction medicine clinic located at one of the study site hospitals. Referrals were made electronically, and appointments were available to subjects within 1-3 days. The clinic also allowed for “drop-in” visits without appointments during business hours. Community health workers facilitated follow-up and patient outreach.
The main contraindication to receiving naltrexone was current opiate use. Given the potential for precipitated opiate withdrawal, patients were screened with a comprehensive history, medication dispense reports, and urine toxicology screens. For the patients receiving XR-NTX, a test dose of
1. Demographics of index visits by patients who were not frequent users of the emergency department versus those who did present frequently.
All visits (N = 331)
Visits by subjects who did not have high ED use¹ (n = 275)
Visits by subjects who did have high ED use² (n = 56) P
n (%)³ or median (IQR) n (%)³ or median (IQR) n (%)³ or median (IQR)
Age 43 (34-55)
Female
Other
(15.5%)
(22.7%)
(33-54)
(23.3%)
Ethnicity .86
Hispanic or Latino
(24.1%)
(23.6%) 14 (25%) Not Hispanic or Latino
(75.9%)
(75.3%)
(75%)
¹More than 4 visits in the 90 days preceding the index naltrexone visit; ²Fewer than 4 visits in the 90 days preceding the index naltrexone visit; ³Percentage of each demographic category. ED, emergency department; IQR, interquartile range.
either 0.4 mg intravenous naloxone or 25 mg oral naltrexone was given prior to a full dose, and they were monitored for signs of opiate withdrawal. This was included in the order set.
Additional contraindications were allergy to naltrexone, pregnancy, age < 18 years, upcoming surgery within 30 days, and admission to inpatient on the index visit. Patients were excluded from XR-NTX administration if they had a history of Child-Pugh class III liver disease, or serum aspartate aminotransferase or alanine aminotransferase levels > 5 times above normal.
The decision to offer naltrexone to patients was at the discretion of the treating physician or advanced practice clinician. Patients who were receptive to starting naltrexone in the ED were offered either oral naltrexone or XR-NTX. The patient chose the specific formulation of naltrexone with counseling from the physician or advanced practice clinician. Patients were informed that XR-NTX would have a duration of action of 30 days and had the benefit of neither having to fill a prescription nor take a daily medication but was associated with pain at the injection site. Subjects received either 380 mg of intramuscular microsphere naltrexone (30-day duration of action) or 50 mg oral naltrexone in the ED with a 30-day prescription for 50 mg of once-daily oral naltrexone. Subjects were counseled to take this once daily either in the morning or before they would typically start consuming alcohol.
Upon discharge, patients were given standardized instructions on how to take the medication, safety precautions, and were advised that opiates would be less effective
during naltrexone treatment. All patients were referred to the comprehensive addiction medicine clinic. Concomitant treatment for potential alcohol withdrawal was at the discretion of the treating physician.
Data Collection and Analysis
This retrospective chart review of the quality metric was approved by the hospital’s institutional review board with a waiver of consent (IRB protocol number 2152433-6). We abstracted data from all subjects who received naltrexone in the ED between July 1, 2022–November 1, 2024. The single abstractor was blinded to the hypothesis. A standard data abstraction form was used. Subject data was deidentified after abstraction.17
We excluded subjects’ index visits from analysis if the subject was admitted to the hospital on the index visit or within the following 30 days, or if they received naltrexone in the 30 days prior to the index visit. Demographic data, modality of naltrexone used (XR-NTX versus oral), and 30day rate of ED visit prior and following the index naltrexone visit were recorded (Table 1). All ED visits were considered, not just those related to alcohol use. Frequent ED users were defined as having four or more ED visits in the 90 days preceding the index naltrexone visit.
We used t-tests for analysis of age data (Tables 1 and 3). Chi-squared tests were used for analysis of demographic data and impact of naltrexone index visit (Tables 1-3). We used the Wilcoxon signed-rank test for statistical comparisons of 30day prior and 30-day following data (Table 2).
Table
Table 2. Number of visits in the 30 days prior and the 30 days following the naltrexone index visit among all visits, comparing visits by patients who did not present frequently to the emergency department to those who were characterized as high users.
30 days prior median visits
30 days following median visits
30 days prior mean visits 30 days following mean visits P value median (IQR) median (IQR)
(SD)
(SD) All Visits (N = 331)
Visits by subjects who did not have high utilization of the ED¹ (n = 275, 83.1%)
Visits by subjects who had high utilization² (n = 56, 16.9%)
(0-0)
(3,8)
(0-0) 0.25 (0.53) 0.43 (1.34) .02
(2,6)
(3.84) 3.73 (3.88) .02
¹ <4 visits in the 90 days preceding the naltrexone index visit; ² ≥ 4 visits in the 90 days preceding the naltrexone index visit. ED, emergency department; IQR, interquartile range; SD, standard deviation.
RESULTS
During the study period, the chart flag banner “fired” for 37,320 patient encounters across the study sites. The number of patients who were approached about initiating naltrexone was not recorded. A total of 297 subjects made 331 index visits (median age 43 years, 69.5% male) during which naltrexone was given (26 subjects had more than one index visit during the study period). During 144 index visits, patients received XR-NTX, and during 187 visits patients received the oral formulation. Those with frequent ED use were significantly older than those who presented to the ED less frequently; otherwise, there were no significant demographic differences between the groups (Table 1).
Table 2 shows the number of visits 30 day prior to the naltrexone index visit and the number of visits in the 30 days following the naltrexone index visit in all index visits, those with non-high use and those with high use. There was no significant difference between visits prior to and following the naltrexone index visit among all visits. Visits by subjects who did not have frequent ED use increased significantly after the naltrexone index visit, while visits by subjects with frequent use decreased significantly after the naltrexone index visit.
Table 3 shows the association of the index naltrexone visit on subsequent ED visits. Most (64.3%) subjects who had high ED use decreased their ED visits in the following 30 days. Most subjects who did not have high ED use had no change in their ED visits (69.5%)
DISCUSSION
This is the first study to evaluate the association of naltrexone administration with rates of ED recidivism in patients with AUD. Although we found no difference in ED recidivism among all subjects, the majority of subjects with high ED use (64.3%) had reduced visits in the following 30 days. We also found a smaller but still significant increase in recidivism in subject visits with less frequent ED use, although most of these subjects had no change in the number
of visits (69.5%).
Alcohol use disorder impacts patients’ health as it burdens the healthcare system more than any other substance use disorder.1,3,4 In the ED, patients intoxicated with alcohol are frequently screened for concomitant illness and observed for safety monitoring without addressing their AUD, often to return again.19-21 Emergency departments are not the ideal place for comprehensive treatment of AUD, and an effective medication-based treatment is needed.
Administration of naltrexone in the ED holds promise for patients with AUD. Previous studies in ambulatory settings have shown reductions in alcohol consumption with naltrexone, particularly when combined with comprehensive support.10-12,22 Inpatient initiation of naltrexone has also shown similar reductions in alcohol consumption.23 In the past five years, naltrexone’s role in treating AUD in EDs has been explored. Several ED feasibility studies have shown moderate success in reduction of alcohol consumption and improvement in quality of life.14–16 These studies did not evaluate the impact
Table 3. Impact of naltrexone index visit on subsequent 30-day emergency department (ED) visits between subjects with high ED use and less frequent ED use (n = 331).
¹ < 4 visits in the 90 days preceding the naltrexone index visit; ² ≥ 4 visits in the 90 days preceding the naltrexone index visit. ED, emergency department.
Warren et al.
of naltrexone on healthcare use or ED visits. Our study adds to this growing body of literature and suggests that patients with frequent ED use and AUD may have associated reduced recidivism when treated with naltrexone.
The important unanswered question for future research is this: Does ED-initiated naltrexone reduce healthcare expenses incurred by alcohol use-related disease? Our study shows an association between naltrexone and reduced recidivism in patients with high ED use but ultimately does not answer this question. Several studies using economic modeling have suggested that naltrexone is a cost-effective intervention for AUD.24-26 One retrospective study demonstrated that outpatient medication use for AUD leads to lower healthcare costs for insurers even with more expensive formulations, such as XRNTX.27
However, the practicalities in clinical practice are complicated; XR-NTX has a retail cost of approximately U.S. $1,500 per monthly dose and typically requires insurance pre-authorization, potentially limiting its practicality in EDs. Recent data does suggest an increasing number of states are passing laws that limit health insurer’s prior authorization for opiate use disorder and AUD treatment.28,29 Oral naltrexone also requires daily adherence. Both treatments require followup in addiction medicine clinics or primary care clinics that are comfortable continuing these therapies. In this ED-based study of naltrexone for AUD, a system-wide treatment plan and coordination with pharmacy, insurers, and addiction medicine was developed. Collaborative efforts such as this model may lead to increased naltrexone use for AUD and further reduction in costly ED use for AUD.
Future studies are also needed to determine who will benefit most from ED-initiated naltrexone. Our study showed an associated reduced recidivism only in those subjects with high ED use, and a trend toward increased recidivism among subjects with less frequent ED use. And even among our subjects with high ED use, 23.3% increased their ED use. We chose a 30-day follow-up window because this was the duration of the prescription for oral naltrexone given and the approximate duration of action of XR-NTX. A regression to the mean after the 30-day follow-up in this study was possible. Future studies should evaluate long-term outcomes, as all EDbased studies (including this one) have used short-term end points. Prospective cost effectiveness should also be studied in a clinical setting rather than via theoretical models.24,26 If naltrexone is deemed cost effective, the incentive for hospitals and insurers to develop robust naltrexone-based AUD treatment protocols could provide great benefit.
LIMITATIONS
This study has many limitations. Firstly, because this was a retrospective chart review of a quality measure using naltrexone for AUD in the ED, any findings can only imply association and not causality. Many cofounders beyond the naltrexone itself could have contributed to the findings.
ED-initiated Naltrexone for Alcohol Use Disorder
Simply having the program and the departmental educational materials themselves could have led to better engagement with patients with AUD beyond naltrexone’s effect. Likewise, details about the subject’s alcohol use and quality of life were not collected. We also chose all ED visits, not just alcohol-related visits purposefully because of limitations in determining the reason for visit through a retrospective chart review. Patients were offered naltrexone at the discretion of the treating physician, and we do not know how many patients were offered naltrexone but declined. This factor also limits the standardization of the protocol and introduces biases with patient selection. Neither did we know the adherence rates in the subjects who were treated with the oral naltrexone.
This study was not designed to track adverse events and safety. While naltrexone is FDA-approved and has been shown to be generally well tolerated, we did not record adverse events or medication side effects. Additionally, other than ED visits, follow up with substance use services was not recorded. There was generally poor follow-up in our hospital’s addiction medicine clinic of approximately 5% (personal correspondence). Similarly, this study does not elucidate whether the changes in ED visit rates were due to naltrexone’s effect on alcohol consumption or other factors. We did exclude subjects who were admitted to the hospital during the 30 days after the index visit; however, there could have been admissions to hospitals outside our healthcare system.
We did not use a formal diagnosis of AUD when patients were offered naltrexone. Our chart flag was purposefully broad (at least one ICD-10 code for an alcohol-related disorder in five years). We likely included many subjects who did not meet AUD criteria; perhaps this is why our total population showed no difference with naltrexone.
We chose four or more visits in the prior 90 days to define subjects with high ED use. While there is no accepted standard of how many visits constitute a patient with high use, typical definitions use the number of four or more visits annually.30,31 We specifically chose the 90-day time frame to account for the 30-day study period immediately after that 90 days so as not to include patients whose frequent visits may have occurred earlier. We wanted to include patients who were currently using the ED frequently before the index naltrexone visit. Therefore, our study population may differ from other studies with subjects with high ED use.
These limitations aside, there is promise in this study to suggest that naltrexone may be associated with reduced ED recidivism in certain patients, particularly those who make frequent ED visits. The implications could have a significant impact in reductions in the burden of alcohol use disorder on healthcare expenses and ED use.
CONCLUSION
Naltrexone administered in the ED was associated with reduced ED recidivism in subjects with high ED use, but it had no associated change on the entire study population.
Address for Correspondence: Otis Warren, MD, Brown University Health, Department of Emergency Medicine, The Miriam Hospital, 164 Summit Ave, Providence, RI 02906. Email: owarren@ brownhealth.org.
Conflicts of Interest: By the WestJEM article submission agreement, all authors are required to disclose all affiliations, funding sources and financial or management relationships that could be perceived as potential sources of bias. No author has professional or financial relationships with any companies that are relevant to this study. There are no conflicts of interest or sources of funding to declare.
1. Mullins PM, Mazer-Amirshahi M, Pines JM. Alcohol-related visits to US emergency departments, 2001–2011. Alcohol Alcohol. 2017;52(1):119-125.
2. Sacks JJ, Gonzales KR, Bouchery EE, et al. 2010 national and state costs of excessive alcohol consumption. Am J Prev Med. 2015;49(5):e73-79.
3. McDonald AJ, Wang N, Camargo CA. US emergency department visits for alcohol-related diseases and injuries between 1992 and 2000. Arch Intern Med. 2004;164(5):531.
4. Verelst S, Moonen PJ, Desruelles D, et al. Emergency department visits due to alcohol intoxication: characteristics of patients and impact on the emergency room. Alcohol Alcohol. 2012;47(4):433-438.
5. Covarrubias I, Dart H, Adams L, et al. Evaluation of barriers and interventions for emergency department-initiated naltrexone for the treatment of alcohol use disorder. J Emerg Med. 2025;73:63-70.
6. Forsgren E, Steiger A, Perez Y, et al. Patient perspectives on emergency department initiation of medication for alcohol use disorder. Acad Emerg Med. 2024;31(5):471-480.
7. Philippine T, Forsgren E, DeWitt C, et al. Provider perspectives on emergency department initiation of medication assisted treatment for alcohol use disorder. BMC Health Serv Res. 2022;22(1):456.
8. Anton RF. Naltrexone for the management of alcohol dependence. N Engl J Med. 2008;359(7):715-721.
9. Qeadan F, Mensah NA, Gu LY, et al. Trends in the use of naltrexone for addiction treatment among alcohol use disorder admissions in US substance use treatment facilities. Int J Environ Res Public Health. 2021;18(16):8884.
10. Maisel NC, Blodgett JC, Wilbourne PL, et al. Meta-analysis of naltrexone and acamprosate for treating alcohol use disorders: when are these medications most helpful? Addiction. 2013;108(2):275-293.
11. Anton RF, O’Malley SS, Ciraulo DA, et al. Combined pharmacotherapies and behavioral interventions for alcohol dependence: the COMBINE study: a randomized controlled trial. JAMA. 2006;295(17):2003.
12. Krystal JH, Cramer JA, Krol WF, et al. Naltrexone in the treatment of alcohol dependence. N Engl J Med. 2001;345(24):1734-1739.
13. Morris PLP, Hopwood M, Whelan G, et al. Naltrexone for alcohol dependence: a randomized controlled trial. Addiction. 2001;96(11):1565-1573.
14. Cowan E, O’Brien-Lambert C, Eiting E, et al. Emergency department–
initiated oral naltrexone for patients with moderate to severe alcohol use disorder: a pilot feasibility study. Acad Emerg Med. 2025;32(5):488-497.
15. Anderson ES, Chamberlin M, Zuluaga M, et al. Implementation of oral and extended-release naltrexone for the treatment of emergency department patients with moderate to severe alcohol use disorder: feasibility and initial outcomes. Ann Emerg Med. 2021;78(6):752-758.
16. Murphy CE, Coralic Z, Wang RC, et al. Extended-release naltrexone and case management for treatment of alcohol use disorder in the emergency department. Ann Emerg Med. 2023;81(4):440-449.
17. World Health Organization. International Statistical Classification of Diseases and Related Health Problems, 11th ed. Geneva, Switzerland: WHO Press 2019.
18. Worster A, Bledsoe RD, Cleve P, et al. Reassessing the methods of medical record review studies in emergency medicine research. Ann Emerg Med. 2005;45(4):448-451.
19. Hawk K, D’Onofrio G. Emergency department screening and interventions for substance use disorders. Addict Sci Clin Pract. 2018;13(1):18.
20. Simioni N, Rolland B, Cottencin O. Interventions for increasing alcohol treatment utilization among patients with alcohol use disorders from emergency departments: a systematic review. J Subst Abuse Treat. 2015;58:6-15.
21. Warren O. Intoxicated, homeless, and in need of a place to land. Health Aff (Millwood). 2016;35(11):2138-2141.
22. Foa EB, Yusko DA, McLean CP, et al. Concurrent naltrexone and prolonged exposure therapy for patients with comorbid alcohol dependence and PTSD: a randomized clinical trial. JAMA. 2013;310(5):488.
23. Magane KM, Dukes KA, Fielman S, et al. Oral vs extended-release injectable naltrexone for hospitalized patients with alcohol use disorder: a randomized clinical trial. JAMA Intern Med. 2025;185(6):635.
24. Sluiter RL, Kievit W, van der Wilt GJ, et al. Cost-effectiveness analysis of genotype-guided treatment allocation in patients with alcohol use disorders using naltrexone or acamprosate. Eur Addict Res. 2018;24(5):245-254.
25. Avanceña ALV, Miller N, Uttal SE, et al. Cost-effectiveness of alcohol use treatments in patients with alcohol-related cirrhosis. J Hepatol. 2021;74(6):1286-1294.
26. Hopkins T, Garrison LP. Estimating the potential cost-effectiveness of long-acting naltrexone versus oral naltrexone for alcohol use disorder. Value Health. 2025;28(6):S138.
27. Baser O, Chalk M, Rawson R, et al. Alcohol dependence treatments: comprehensive healthcare costs, utilization outcomes, and pharmacotherapy persistence. Am J Manag Care. 2011;17(8):S222.
28. Hu J, Hutchings K, Jalali A, et al. State laws banning prior authorization for medications for opioid use disorder increased substantially 2015-23. Health Aff (Millwood). 2025;44(11):1369-1377.
29. Stewart MT, Feltus SR, Andrews CM, et al. Alcohol use disorder medication coverage and utilization management in Medicaid managed care plans. JAMA Netw Open. 2025;8(3):e250695.
30. Doupe MB, Palatnick W, Day S, et al. Frequent users of emergency departments: developing standard definitions and defining prominent risk factors. Ann Emerg Med. 2012;60(1):24-32.
31. Locker TE, Baston S, Mason SM, et al. Defining frequent use of an urban emergency department. Emerg Med J. 2007;24(6):398-401.
Opioid Overdose-Related Emergency Department Visits
Pre- and Post-COVID-19
Melanie F. Molina, MD, MAS*†
Samuel D. Pimentel, PhD‡
Maria C. Raven, MD, MPH, MS*†
Kathy T. LeSaint, MD*
David G. Dillon, MD, PhD§
Section Editor: Leon Sanchez, MD
University of California, San Francisco, Department of Emergency Medicine, San Francisco, California
University of California, San Francisco, Philip R. Lee Institute for Health Policy Studies, San Francisco, California
University of California, Berkeley, Department of Statistics, Berkeley, California
University of California, Davis, Department of Emergency Medicine, Sacramento, California
Submission history: Submitted October 23, 2025; Revision received February 28, 2026; Accepted February 2, 2026
Electronically published June 10, 2026
Full text available through open access at http://escholarship.org/uc/uciem_westjem DOI 10.5811/westjem.53227
Introduction: Understanding changes in opioid overdose-related emergency department (ED) visits and ED-based opioid use disorder (OUD) treatment post-coronavirus disease 2019 (COVID-19) pandemic can inform ongoing efforts to address the opioid crisis. We aimed to examine trends in opioid overdose-related ED visits, ED-based medication for OUD (MOUD) treatment, and appendicitis-related ED visits (as a control) before and after the initial COVID-19 peak in April 2020.
Methods: We conducted an interrupted time series analysis of monthly ED visits from January 2017–December 2022 at three hospitals in California. We modeled pre- and post-COVID-19 visit trends and the change in trend from pre- to post-COVID-19 peak using linear regression controlling for study site. Our primary outcome included monthly rates of opioid overdose-related ED visits, with monthly rates of ED visits with MOUD treatment as a secondary outcome. Appendicitis-related visits served as a control for temporal trends.
Results: Of the 781,488 ED visits across the entire study period, there were 2,536 (0.32%) opioid overdose-related visits, 9,755 (1.25%) MOUD treatment visits, and 1,123 (0.14%) appendicitisrelated visits. Pre-pandemic, monthly increases were observed in opioid overdose-related visits (6.7 visits/10,000 per month, 95% confidence interval [CI] 2.6-10.8, P = .001), MOUD-positive visits (34.9 visits/10,000 per month, 95% CI, 26.0-43.7, P < .001), and appendicitis visits (2.5 visits/10,000 per month, 95% CI, 1.2-3.9, P < .001). After April 2020, only MOUD-positive visits showed an immediate (level change) increase (49 visits/10,000 or 34% of April 2020 projected pre-COVID-19 visit rates, 95% CI, 26.1-71.9, P < .001), with opioid overdose-related visits subsequently declining (-4.6 visits/10,000 per month or -11% of April 2020 projected pre-COVID-19 visit rates, 95% CI, -7.2 to -2.0, P = .001).
Across the entire pre- to post-COVID-19 period, significant decreases in overall visit trends were observed across all visit types, greatest for MOUD-positive visits (-39.2 visits/10,000 per month, or -27% of April 2020 projected pre-COVID-19 visit rates, 95% CI, -51.5 to -26.8, P < .001), followed by opioid overdose visits (-11.3 visits/10,000 per month, or -27% of April 2020 projected pre-COVID-19 visit rates, 95% CI, -16.1 to -6.5, P < .001) and appendicitis visits (-4.2 visits/10,000 per month, or -23% of April 2020 projected pre-COVID-19 visit rates, 95% CI, -7.2 to -1.2, P = .01).
Conclusion: From pre- to post-initial COVID-19 peak, absolute ED-based MOUD treatment trends declined over three times faster than those of opioid overdose-related ED visits (although percentage changes relative to expected April 2020 rates were both -27%). These findings may reflect reduced perceived urgency as overdose presentations decreased and a shift away from crisis-driven implementation, underscoring the need for intentional integration of MOUD into routine ED practice to sustain treatment capacity. [West J Emerg Med. 2026;27(4)875–879.]
INTRODUCTION
The coronavirus disease 2019 (COVID-19) pandemic disrupted many aspects of society in the United States, necessitating social isolation and the shutdown of businesses, schools, and other public entities. These disruptions, combined with COVID-19 itself, not only negatively impacted the U.S. population’s physical1 and mental health2,3 but also reduced access to many social services.4
People with opioid use disorder (OUD) were particularly vulnerable to disruptions in access to addiction treatment and social support during the COVID-19 pandemic.5 While emergency department (ED) visits decreased overall during the peak of the pandemic,6 there was an increase in opioid overdose-related visits.5,7 Several factors likely contributed to this trend, including reduced access to in-person addiction services, heightened pandemic-related stressors (eg, social isolation, financial instability), and worsening mental health leading to increased substance use.8 These disruptions spurred innovative strategies to expand treatment access, including removal of prescribing restrictions and rapid expansion of telehealth-based addiction care. Around the same time, EDs— recognized as the safety net for patients without access to outpatient care—saw increased efforts to initiate medications for OUD (MOUD), such as methadone and buprenorphine.9
While trends in opioid overdose-related ED visits before and during the COVID-19 pandemic are well described, less is known about post-pandemic changes in overdose-related ED visits and corresponding MOUD treatment rates following these policy and practice changes. Understanding how opioid overdose-related ED visits and ED-based MOUD treatment have changed after the pandemic can offer valuable insights into the impact and sustainability of OUD treatment strategies, while also helping to identify persistent gaps in care that require targeted intervention. We sought to examine trends in opioid overdose-related ED visits and EDbased MOUD treatment around the first COVID19 peak. Prior studies have demonstrated substantial pandemic-associated declines in ED presentations for time-sensitive emergencies, including acute myocardial infarction,10 suggesting that utilization changes were diagnosis-specific. We used appendicitis as a comparator condition, as several U.S. studies found stable presentation volumes during the peri-pandemic period.11,12
METHODS
Using electronic health record data at the encounter level, we performed an interrupted time series analysis examining all monthly ED visits from January 2017–December 2022 at three hospitals (two academic; one county) in California, with April 2020 (first COVID-19 peak) as the interruption. Selecting December 2022 as the study end date avoided confounding from national policy changes implemented in 2023 (e.g., elimination of the Drug Addiction Treatment Act of 2000 (DATA 2000) Xwaiver). Our primary outcome was opioid overdose-related ED visits, defined by International
Population Health Research Capsule
What do we already know about this issue? While overall emergency department (ED) visits declined during COVID-19, opioid overdose-related ED visits increased.
What was the research question?
How did ED visits for opioid overdose and EDbased opioid use disorder (OUD) treatment trends change after the first COVID-19 peak?
What was the major finding of the study? Overdose visits declined -11.3 vs -39.2 visits/10k/month for OUD treatment (95% CIs, -16.1 to -6.5; -51.5 to -26.8).
How does this improve population health? Although overdose visits declined post-COVID-19, the faster drop in ED-based OUD treatment underscores the need to sustain treatment capacity.
Classification of Diseases, 10th Revision, Clinical Modification (ICD-10-CM) codes T40.0-T40.4 and T40.6. We calculated monthly visit rates by dividing overdose-related visits by total ED visits to account for secular trends affecting total ED volume. We examined appendicitis-related visits as a control for temporal trends.
To assess ED-based treatment for OUD, we classified ED visits as positive for MOUD if methadone or buprenorphine was ordered during the ED visit. Naltrexone was excluded as it is generally considered a second-line therapy for OUD. Because our goal was to measure system-level volumes, we counted each visit type (ie, opioid overdose, appendicitis, MOUD) separately and did not quantify overlap. For example, a single encounter could contribute to both overdose-related visits and MOUD treatment visits. We also did not distinguish MOUD given to mitigate withdrawal from MOUD initiated for OUD, as in ED practice, MOUD are typically given in the presence of withdrawal symptoms and, by design, serve as treatment for OUD.
We used linear regression controlling for study site with robust standard errors, establishing the underlying monthly visit trends and determining changes post-interruption.13 Excluding April 2020 data as a washout period, we estimated the level change in May 2020 using the interruption period variable and a slope change using the time after the interruption variable to assess trends over time. Autocorrelation plots showed no consistent correlation
between time points, so adjustment was deemed unnecessary. We performed three sensitivity analyses: 1) adjusting for seasonality by including yearly quarters in our model; 2) aggregating data by yearly quarters instead of monthly intervals; and 3) including April 2020 data in the exposure period. To preserve the full effect of the COVID-19 peak, we excluded patient- and encounter-specific variables potentially influenced by the pandemic.
We conducted analyses using R version 4.42 (The R Foundation for Statistical Computing, Vienna, Austria), The University of California, San Francisco Institutional Review Board approved this study, and we followed Strengthening the Reporting of Observational Studies in Epidemiology (STROBE) guidelines.
RESULTS
From January 1, 2017– December 31, 2022, we analyzed 781,488 ED visits (excluding 7,625 visits from April 2020 as part of the washout period), with 2,536 (0.32%) representing opioid overdose-related ED visits; 1,123 (0.14%) appendicitisrelated ED visits, and 9,755 (1.25%) ED visits during which MOUD were ordered. Total monthly visits in either study site ranged between 3,750–7,451 during the study period. The overall yearly ED visits by visit type are presented in Supplement 1.
Prior to the initial COVID-19 peak, opioid overdoserelated ED visits had been increasing by 6.7 visits/10,000 per month (95% CI, 2.6-10.8), with a steeper increase in MOUDpositive visits (34.9 visits/10,000 per month, 95% CI, 26.043.7). Appendicitis-related visits were increasing by 2.5 visits/10,000 per month (95% CI, 1.2-3.9). After April 2020, there was a sharp rise in MOUD-positive visits (49 visits/10,000 per month or 34% of April 2020 projected pre-COVID-19 visit rates, 95% CI, 26.1-71.9) with no significant level change in either opioid overdose- (1.2 visits/10,000 per month, 95% CI, -8.0 to 10.3) or appendicitisrelated ED visits (-1.4 visits/10,000 per month, 95% CI, -7.1to 4.3). We subsequently observed a significant decrease in opioid overdose-related ED visits by 4.6 visits/10,000 per month ( or -11% of April 2020 projected pre-COVID-19 visit rates, 95% CI, -7.2 to -2.0), and non-significant decreases in MOUD-positive visits (-4.3 visits/10,000 per month, 95% CI, -12.9 to 4.3) and appendicitis-related visits (-1.7 visits/10,000 per month, 95% CI, -4.4 to 1.0) (Figure).
All visit types showed significant decreases in slope from pre- to post-COVID-19, with appendicitis-related visits changing the least (-4.2 visits/10,000 per month or -23% of April 2020 projected pre-COVID-19 visit rates, 95% CI, -7.2 to -1.2), followed by overdose-related visits (-11.3 visits/10,000 per month or -27% of April 2020 projected pre-COVID-19 visit rates, 95% CI, -16.1 to -6.5), and MOUDpositive visits (-39.2 visits/10,000 per month or -27% of April 2020 projected pre-COVID-19 visit rates, 95% CI, -51.5 to -26.8) (Table). Sensitivity analyses confirmed our primary
Figure. An interrupted time series analysis of the monthly rate of ED visits, in a study examining trends in opioid overdose-related ED visits (2017-2022).
Shading indicates 95% CI; dashed lines, the forecasted ED visits; solid lines, the observed trends in ED visits; and dotted line, the initial COVID-19 peak. ED, emergency department.
findings, with the following exceptions: 1) in the quarterly analysis, the pre- to post-April 2020 slope change for appendicitis visits lost statistical significance; 2) when April 2020 data was included, the post-April 2020 decrease in opioid overdose-related ED visits lost statistical significance (-3.1 visits/10,000 per month, 95% CI, -6.5 to 0.3).
DISCUSSION
In this interrupted time series analysis of 781,488 ED visits at three hospitals, we found that all visit types were increasing before the pandemic. Immediately following the initial COVID-19 peak, only MOUD-positive visits showed a significant increase in level change. The subsequent decline in opioid overdose-related visits occurred nearly three times faster than that of appendicitis-related visits. All visit types experienced significantly decreased visit trends (ie, negative slope changes) from pre- to post-COVID-19 peak, with MOUD visits declining the most, followed by overdoserelated visits, and appendicitis-related visits.
Although our study period centered on the peri-pandemic era, it coincided with major regulatory changes and caredelivery innovations, serving as a natural experiment in how system-level change coincided with trends in ED presentation and treatment. The level changes in opioid overdose- and
Molina
Table. Interrupted time series models for emergency department visitsa by visit type before and after the initial COVID-19 peak, at three hospitals in California with a total of 781,488 visits (2017-2022).
Slope, Pre-COVID A
(2.6,
(26.0, 43.7)
.001
Appendicitis
(1.2, 3.9)
< .001
aEmergency department visits per 10,000 per month.
(-7.1, 4.3)
= .63
Post-COVID
(-4.4, 1.0)
.22
bEmergency department visits per 10,000 per month during which either methadone or buprenorphine were ordered MOUD, medication for opioiod use disorder.
(-7.2, -1.2) P = .01
appendicitis-related ED visits after April 2020 align with prior research showing increased overdose-related visits early in the pandemic, despite an overall decline in ED use.5 To address rising overdose rates, California expanded its ED Bridge Program between 2018–2020, partnering with 52 hospitals— including two of our three study sites—to provide lowthreshold buprenorphine treatment and connect patients to outpatient care and harm reduction services.14,15 While our data show an initial increase in ED-based MOUD treatment pre-pandemic, the overall decrease in MOUD-positive visits from pre- to post-April 2020 was more than three times greater than the decline in opioid overdose-related visits.
This pattern—an early rise followed by lack of sustained growth—highlights a continuing implementation challenge: expanding ED MOUD initiation capacity is achievable, but maintaining and scaling it requires deliberate sustainment infrastructure and policy support. Sustained integration of MOUD into ED practice will likely require addressing ED-specific barriers, including time constraints, competing clinical demands, and workflow disruptions that limit opportunities for treatment initiation.
The observed post-pandemic decrease in opioid overdoserelated ED visits may reflect multiple factors. While expanded access to addiction treatment services, including telehealth options and increased MOUD availability, may have played a role, the declining trend could also reflect the resolution of pandemic-related stressors. These included the lifting of social isolation requirements, economic recovery, and restored access to in-person mental health and community support services. As health systems moved into 2023, several concurrent developments may have influenced both overdose presentations and OUD treatment. Removal of the DATA 2000 Xwaiver and implementation of overthecounter naloxone broadened access, yet ED capacity strains due to inpatient boarding and staffing shortages may have reduced capacity to consistently initiate MOUD. Additionally, prehospital naloxone treatment may have shifted some nonfatal overdoses
away from the ED. Future work should extend these analyses beyond 2022 to evaluate the impact of these changes on overdose presentations and EDbased MOUD treatment.
LIMITATIONS
Our retrospective analysis covered the peri-pandemic period through 2022. Although practice patterns and access to addiction services have since evolved, this period functioned as a system-stress natural experiment that yields important lessons about ED MOUD adoption, utilization trends, and sustainment challenges. Our decision not to include patient- or encounter-level covariates in the interrupted time series models to preserve the effect of the initial COVID-19 peak may have obscured important subgroup interactions that warrant future study. Our aggregated, encounter-level timeseries approach showed visit-to-visit variability around trend lines, indicating heterogeneity across patients, clinicians, and sites; accordingly, the reported slopes should be interpreted as population-level directional estimates rather than uniform effects at the encounter level.
We could not identify the drivers of observed trends, which may have been influenced by local and regional factors. Our reliance on ICD-10-CM codes may have underestimated the true prevalence of overdose- and appendicitis-related visits due to coding variability and misclassification, although the presence of significant trends despite this limitation lends credibility to our findings. We measured MOUD orders rather than administrations to capture treatment efforts, acknowledging that not all orders result in medication administration. Finally, results from three Northern California hospitals may not generalize to other settings with different policies, resources, or addiction care infrastructures.
CONCLUSION
In an interrupted time series analysis of ED visits before and after the initial COVID-19 peak, absolute ED-based MOUD treatment trends declined over three times faster than
those of opioid overdose-related ED visits (although percentage changes relative to expected April 2020 rates were both -27%). The steeper decline in MOUD initiation may reflect reduced perceived urgency to initiate treatment as overdose presentations decreased, compounded by postpandemic ED capacity constraints and workflow pressures. Sustaining ED-based MOUD likely requires intentional integration into routine practice rather than reliance on crisis-driven implementation.
ACKNOWLEDGMENTS
Dr. Melanie Molina has grant funding through the National Institutes of Health/National Institute on Drug Abuse and the Robert Wood Johnson Foundation-supported Harold Amos Medical Faculty Development Program. Dr. Molina had full access to all the data in the study and takes responsibility for the integrity of the data and the accuracy of the data analysis.
Address for Correspondence: Melanie F. Molina, MD, MAS, University of California, San Francisco, Department of Emergency Medicine, 505 Parnassus Avenue, San Francisco, CA 94143. Email: melanie.molina@ucsf.edu
Conflicts of Interest: By the WestJEM article submission agreement, all authors are required to disclose all affiliations, funding sources and financial or management relationships that could be perceived as potential sources of bias. No author has professional or financial relationships with any companies that are relevant to this study. There are no conflicts of interest or sources of funding to declare.
1. CDC. COVID Data Tracker. Centers for Disease Control and Prevention. 2020. Available at: https://covid.cdc.gov/covid-datatracker. Accessed July 17, 2021.
2. Galea S, Merchant RM, Lurie N. The mental health consequences of COVID-19 and physical distancing: the need for prevention and early intervention. JAMA Intern Med. 2020;180(6):817-818.
3. McGinty EE, Presskreischer R, Han H, et al. Psychological distress and loneliness reported by US adults in 2018 and April 2020. JAMA 2020;324(1):93-94.
4. Holliday SB, Hunter SB, Dopp AR, et al. Exploring the impact of COVID-19 on social services for vulnerable populations in Los Angeles: lessons learned from community providers. RAND Corporation; 2020. Available at: https://www.rand.org/pubs/research_ reports/RRA431-1.html. Accessed January 11, 2022.
5. Soares WE, Melnick ER, Nath B, et al. Emergency department visits for nonfatal opioid overdose during the COVID-19 pandemic across six US health care systems. Ann Emerg Med. 2022;79(2):158-167.
6. Hartnett KP, Kite-Powell A, DeVies J, et al. Impact of the COVID-19 Pandemic on Emergency Department Visits - United States, January 1, 2019-May 30, 2020 Morb Mortal Wkly Rep. 2020;69(23):699-704. Published 2020 Jun 12.
7. Holland KM, Jones C, Vivolo-Kantor AM, et al. Trends in US emergency department visits for mental health, overdose, and violence outcomes before and during the COVID-19 pandemic. JAMA Psychiatry. 2021;78(4):372-379.
8. Melamed OC, deRuiter WK, Buckley L, et al. Coronavirus disease 2019 and the impact on substance use disorder treatments. Psychiatr Clin North Am. 2022;45(1):95-107.
9. Hawk K, Hoppe J, Ketcham E, et al. Consensus recommendations on the treatment of opioid use disorder in the emergency department. Ann Emerg Med. 2021;78(3):434-442.
10. Lange SJ, Ritchey MD, Goodman AB, et al. Potential Indirect Effects of the COVID-19 Pandemic on Use of Emergency Departments for Acute Life-Threatening Conditions - United States, January-May 2020 Morb Mortal Wkly Rep. 2020;69(25):795-800.
11. Theodorou CM, Beres AL, Nguyen M, et al. Statewide impact of the COVID pandemic on pediatric appendicitis in California: a multicenter study. J Surg Res. 2021;267:132-142.
12. Zaikos TD, Boudiab EM, Peshel EC, et al. Acute appendicitis severity during the early COVID-19 pandemic period. Trauma Surg Acute Care Open. 2021;6(1):e000809.
13. Bernal JL, Cummins S, Gasparrini A. Interrupted time series regression for the evaluation of public health interventions: a tutorial. Int J Epidemiol. 2017;46(1):348-355.
14. Snyder H, Kalmin MM, Moulin A, et al. Rapid adoption of lowthreshold buprenorphine treatment at California emergency departments participating in the CA Bridge Program. Ann Emerg Med. 2021;78(6):759-772.
15. California Opioid Response. California to receive $210 million for state opioid response over 2 years. DHCS Opioid Response. 2020. Available at: https://californiaopioidresponse.org/california-to-receive210-million-for-state-opioid-response-over-2-years/. Accessed August 18, 2025.
Molina
Impact of Substance Use Disorder Curriculum and X-Waiver Training on Emergency Medicine Residents
Chigozie Chukwunyere, BS*
Jessica Heil, MS*
Matthew Salzman, MD, MPH*†
Rachel Haroz, MD*†
Section Editor: Brad Bobrin, MD
* †
Cooper University Health Care, Center for Healing, Division of Addiction Medicine, Camden, New Jersey
Cooper University Health Care, Department of Emergency Medicine, Division of Addiction Medicine and Medical Toxicology, Camden, New Jersey
Submission history: Submitted September 24, 2025; Revision received February 23, 2026; Accepted February 16, 2026
Electronically published June 16, 2026
Full text available through open access at http://escholarship.org/uc/uciem_westjem DOI 10.5811/westjem.50864
Introduction: We incorporated an 8-hour standardized substance use disorder (SUD) curriculum and X-waiver training into our emergency medicine (EM) residency. We sought to assess whether the implementation of the standardized SUD curriculum and X-waiver training affected graduated EM residents’ comfort with treating SUD and prescribing practices, as well as their view of their future career paths.
Methods: Physicians who completed their EM residency at our hospital from 2016-2022 were invited to complete the survey in 2023. The primary outcome measure was the proportion of surveyed graduates who reported comfort and confidence in treating patients with SUD, measured by affirmative responses to survey items. The secondary outcome measure was the proportion of surveyed graduates reporting that participation in the SUD curriculum and X-waiver training during residency influenced their career plans, measured by affirmative responses to career-related survey items. For each outcome measure, we compared percentages of affirmative responses between physicians who completed residency prior to and after the implementation of the SUD curriculum and X-waiver training.
Results: Among 81 graduated EM residents invited to complete the survey, 63 (78.8%) responded. We grouped them based on whether they had completed residency prior to the addition of the standardized SUD curriculum (pre-curriculum, 2016–2017) or after (post-curriculum, 2018–2022). Of the 63 participants, 17 were pre- and 46 were post-curriculum residents. Of the pre-curriculum residents, 58.8% prescribed buprenorphine in their practice after residency, compared to 76.1% of the post-curriculum residents (Fisher exact test, P = .22, odds ratio [OR] 0.46, 95% confidence interval, 0.12-1.76). Of the post-curriculum graduates, 93.5% noted that they were better prepared to treat patients with SUDs than their peers compared to 88.2% of the pre-curriculum graduates (Fisher exact test, P = .605, OR .529, 95% CI, 0.055-6.909), and 69.6% believed the training impacted their careers professionally and increased their interest in helping patients with opioid use disorder.
Conclusion: Overall, a greater proportion of EM graduates who had been X waiver-trained in a substance use disorder curriculm during residency training at our institution prescribed buprenorphine to their patients than those who had not undergone specific training. Although the X-waiver is no longer a requirement, our SUD curriculum and training remain relevant for buprenorphine prescribing and may offer some opportunities for EM residents to develop their careers. [West J Emerg Med. 2026;27(4)880–885.]
INTRODUCTION
The opioid epidemic remains a public health crisis, resulting in 81,083 opioid-related overdose deaths in 2023 in the United
States.1 Buprenorphine, a partial mu-receptor opioid agonist, has been approved as treatment for opioid use disorder (OUD) since 2002; however, it is underused in the United States, with only
25% of adults with OUD receiving this effective medication.2, 3 Emergency departments (ED) continue to be a crucial interface for establishing access to care and decreasing mortality.4, 5 Thus, training emergency medicine (EM) residents to treat OUD should be considered critical in improving low-barrier access to evidence-based substance use care.
The Accreditation Council for Graduate Medical Education requires all graduate medical education programs to incorporate addiction training into their curricula.6 Residency programs that have incorporated addiction training have shown tremendous success in improving knowledge and reducing the stigma of OUD treatment.7 In one study, 79% of internal medicine residents felt more prepared to treat patients with OUD following didactic training.8 Yet a substance use disorder (SUD) curriculum, specifically one focused on OUD education and training, has not been standardized or incorporated into EM resident education nationally.
In 2016, our institution began initiating and prescribing buprenorphine in the ED. Subsequently, in 2017 a SUD curriculum was formalized for both faculty and residents.9 Interested residents from our institution, along with emergency physicians, contributed to the curriculum development. We successfully implemented an 8-hour SUD curriculum and X-waiver training for residents starting in 2018. The X-waiver training focused on OUD treatment, which was required for physicians to prescribe buprenorphine. The curriculum also featured formal SUD lectures, clinical exposure at an addictionmedicine specialty clinic, and a pre- and post-curriculum assessment. Before 2018, residents received SUD training solely through clinical experience and a limited lecture series Although the X-waiver regulatory program itself no longer exists, our EM residency’s SUD curriculum and OUD training remain relevant for meeting current training requirements and facilitating buprenorphine prescribing.
In this study we sought to examine the impact of this intervention on graduated residents’ practice and their comfort with treating patients with SUD. Additionally, we aimed to explore the perceptions of the SUD curriculum and mandatory X-waiver training on graduated residents’ career trajectories.
We hypothesize that the standardized SUD curriculum and mandatory X-waiver training led to more professional opportunities and greater confidence in treating OUD among graduated EM residents.
METHODS Study Setting
The hospital from which we recruited survey participants is a large, tertiary-referral and trauma center. The ED sees approximately 82,000 visits a year and hosts a 3-year residency as well as multiple fellowships.
Survey Content and Administration
The survey was developed through a collaborative process, leveraging the expertise of two addiction medicine
Population Health Research Capsule
What do we already know about this issue? Residency programs with substance use disorder (SUD) curricula have been shown to increase residents’ comfort with treating patients with SUD.
What was the research question?
Did our SUD curriculum and X-waiver training improve emergency medicine (EM) residents’ SUD confidence and career trajectories after they graduated?
What was the major finding of the study?
58.6% of pre- vs 76.1% of post-curriculum residents prescribed buprenorphine after graduating (odds ratio 0.46, 95% CI, 0.121.76; P =.22).
How does this improve population health?
Incorporating a standardized SUD curriculum and opioid use disorder training into EM residency promotes evidence-based substance use care.
and EM board-certified physicians who designed the curriculum at our institution. The survey asked about graduates’ current careers and whether the SUD curriculum has impacted their prescribing practices, improved confidence in treating SUD, and impacted their career. One open-ended question asked the following: “If your career was impacted by education and training during your residency in SUD and medications for opioid use disorder/X-waiver training, please explain below.” The survey and the open-ended responses are available as supplemental material.
The EM residency maintains a running list of contact information from physicians who completed the residency between 2016–2022. In 2023, recruitment emails with a unique Research Electronic Data Capture (REDCap) survey link were sent to graduates, ensuring identifiable information remained separate from responses.10, 11 Written informed consent was used, and consent was obtained after participants continued from the consent form to the survey. We excluded EM residents if they did not complete the survey or had yet to graduate from residency. The participants were compensated for completing the survey with a $25 gift card. The study was approved and deemed exempt by the hospital institutional review board.
Data Analysis
We conducted descriptive statistics using Microsoft Excel v2505 (Microsoft Corp, Redmond, WA). Statistical analysis was completed using RStudio v4.4.2 (Posit, PBC, Boston, MA).
RESULTS
Of the 80 graduated residents invited to participate, 63 (78.8%) responded and completed the survey (Table 1). Most graduates reported working in an urban setting (58.7%) within a community hospital (60.3%).
Overall, 71% of the graduates reported currently prescribing buprenorphine, and 92% of them had received their X-waiver (Table 2). Half (50.8%) of the graduates were working within an ED that had a formal protocol for buprenorphine initiation or dosing; of those graduates, 12.5% had helped create that protocol.
To determine the impact of a formalized curriculum on the graduates, we separated the graduated residents into two groups: before the standardized SUD curriculum was added to
the program (pre-curriculum, 2016–2017) and after the curriculum was in place (post-curriculum, 2018–2022). Of the 63 graduates who responded to the survey, 17 had been pre-curriculum and 46 post-curriculum residents. We found that 58.8% of pre-curriculum graduates prescribe buprenorphine, while 76.1% of the post-curriculum graduates prescribe buprenorphine. There was no statistically significant difference between the pre-curriculum and post-curriculum groups in their current buprenorphine prescribing practice (Fisher exact test, P = .22, odds ratio [OR] 0.46, 95% confidence interval, 0.12-1.76).
Nearly all graduates (95.3%) indicated that both clinical experience and didactic/X-waiver training had prepared them to treat SUD patients (Fisher exact test, P = 1.00, OR 0, 95% CI, 0-1167.81). There was a strong association between SUD clinical training impact and SUD education (Fisher exact test, P < .001, OR infinity, 95% CI, 6.88-infinity). Among graduates who indicated that their SUD clinical training impacted their career choice, 100% reported that their SUD education also impacted their career. Further, 50% of
substance use disorder lectures during didactic time
Did you participate in a 4-hour (1/2 and 1/2) X-waiver training during residency?
As a resident, did you and your attending prescribe and refer patients to follow-up during your residency?
Table 1. Demographic characteristics of emergency medicine residents in a study assessing the effects of implementing a standardized substance use disorder curriculum and X-waiver training.
Table 2. Survey data related to prescribing practices, comfort with patients, and career trajectories of emergency medicine graduates in a study assessing the effects of implementing a standardized substance use disorder curriculum and X-waiver training
Survey Question
Did you obtain your X-waiver?
All Resident Groups Pre-curriculum (2016–2017) Post-curriculum
Does your emergency department have a formal protocol for buprenorphine initiation or dosing?
If yes, did you help create this protocol?
Do you prescribe buprenorphine to patients now?
Do other physicians, nurses, or hospital staff utilize your knowledge in this area to help them with patient care?
Do you think your experience treating patients with opioid use disorder and substance use disorder during residency affected your approach to patients now?
Did the didactics and X-waiver training prepare you to treat patients with substance use disorder?
Do you feel that you were better prepared to treat patients with substance use disorders than your colleagues where you work now?
Has your substance use disorder training impacted where you chose to work and other career choices?
Has your education and training in substance use disorder and medications for opioid use disorder/X-waiver training impacted your career? (i.e., helped you get a job, more opportunities, advancement) Yes
graduates who indicated that their SUD education impacted their career choice also did not indicate that their SUD clinical training impacted their career.
Of the post-curriculum graduates, 93.5% felt that they were better prepared to treat patients with SUDs than their colleagues at their current workplace, compared to 88.2% of precurriculum graduates (Fisher exact test, P = .605, OR .529, 95% CI, 0.055-6.909). Lastly, for the open-ended question, 69.6% of post-curriculum graduates felt the training had affected their careers by allowing them to grow professionally and increase their interest in the OUD population (Table S1).
DISCUSSION
Our results suggest that EM residents who completed a formal SUD curriculum and X-waiver training credited that training with impacting their prescribing practices and to a lesser degree their career development.
It is worth noting that in 2022, the U.S. Congress eliminated the X-waiver requirement for buprenorphine prescribing from the Mainstreaming Addiction Treatment Act.12, 13 However, a separate act required that physicians satisfy at least one of multiple conditions to prescribe buprenorphine, including the completion of a residency
curriculum with a minimum 8-hour OUD training.13 The X-waiver elimination presents an opportunity to re-examine how our SUD curriculum is structured and delivered to EM residents. Data show that a large proportion of waivered clinicians in the United States do not prescribe buprenorphine.14 Kim and Samuels highlighted clinician discomfort with dispensing and prescribing buprenorphine as a barrier to ED buprenorphine.15
Research suggests that integrating SUD education into clinician training is an effective strategy for enhancing physician comfort, bridging knowledge gaps, and increasing buprenorphine prescribing.16 Our findings support these claims; graduates who were post-curriculum residents reported feeling knowledgeable, confident, and comfortable with patients after completing the SUD curriculum and X-waiver training, and a large majority of these graduates tended to prescribe buprenorphine to their current patients. Although the buprenorphine-prescribing practices between the pre- and post-curriculum groups were not statistically significant, there was a slightly higher percentage of the post-curriculum group who prescribed buprenorphine compared to the pre-curriculum group. This was despite residents being X-waivered either during residency (post-curriculum) or afterward (precurriculum residents).
Additionally, we examined the impact of the SUD curriculum and X-waiver training on EM residents’ career development. In the open-ended portion of our survey, some post-curriculum residents noted that their OUD knowledge provided more opportunities to educate their colleagues about OUD treatment, choose addiction-related fellowships, and secure leadership positions. Adding the open-ended question allowed us to probe deeper into the responses and find more subtle indications of career advancement and development. The survey responses also revealed that some of our residency graduates acted as physician champions for buprenorphine usage at their current jobs, which likely improves care for their patients with OUD and advances their colleagues’ understanding of OUD.
Interestingly, few post-curriculum residents answered “Yes” during the Yes/No portion of the survey when asked whether their SUD training had impacted where they chose to work (19.6%) or their SUD education and training impacted their career (37.0%). This could be due to varying interpretations of the word “impact” and, as a result, residents may not have counted certain informal opportunities as influencing their career, leading to more “No” responses. When we considered all residency graduates, however, we found that perceived influences of SUD education and training on career choice were closely linked, and educational exposure appeared to have a broader influence on career choice than SUD training.
Although we did not explicitly ask respondents whether they were generally satisfied with their current jobs, the literature suggests that the training may be associated with
increased job satisfaction for these residency graduates.17-20 When physicians perceive themselves as providing high quality care to patients and are given services that facilitate their jobs, their professional satisfaction and satisfaction toward their patients increases.17-20
LIMITATIONS
This study took place at a single institution. All EM residents at our academic, urban hospital were exposed to a larger-than-average SUD population and had access to a robust outpatient-referral capacity. This may limit the generalizability of the results. The survey that we sent out to graduates was not validated, as there were no validated surveys in the literature that captured the data we were interested in. We administered the survey in February 2023, around the same period that the X-waiver requirement was repealed. Some graduates may not have found the X-waiver component of the SUD curriculum to be relevant to their current practice, potentially impacting their responses. The institutions that the graduates currently work at could have also influenced their buprenorphine-prescribing patterns. Additionally, social desirability bias may have influenced how residents answered survey questions, as residents may have self-reported that they prescribe buprenorphine or have their X-waiver to align with perceived study expectations.
Finally, the pre-curriculum response numbers were smaller than post-curriculum response numbers. This may be related to the initiation of buprenorphine prescribing at our institution in 2016, and the subsequent implementation of the SUD curriculum and X-waiver training in 2018, resulting in a smaller pool of eligible pre-curriculum residents. Because our study had a low sample size, running statistics on the dataset resulted in sparse cell counts for test comparisons.
CONCLUSION
This study suggests that incorporating a standardized substance use disorder curriculum and X-waiver training into EM residency may increase EM residents’ confidence and comfort in treating opioid use disorder and may offer some opportunities for career advancement. Our results demonstrate that residency training remains an essential opportunity to promote the implementation of evidence-based addiction treatment in the ED. Future work should examine graduated residents’ clinical practice and career trajectories in the post X-waiver era.
Address for Correspondence: Jessica Heil, MS, Cooper University Health Care, Center for Healing, Division of Addiction Medicine, 101 Haddon Ave Camden, NJ 08103. Email: heil-jessica1@ cooperhealth.edu.
Conflicts of Interest: By the WestJEM article submission agreement, all authors are required to disclose all affiliations, funding sources and financial or management relationships that could be perceived
Chukwunyere et al. Substance Use Disorder Curriculum for EM Residents
as potential sources of bias. No author has professional or financial relationships with any companies that are relevant to this study. There are no conflicts of interest or sources of funding to declare.
1. Ahmad FB CJ, Rossen LM, Sutton P. Provisional Drug Overdose Death Counts National Center for Health Statistics Updated 2025. Available at: https://www.cdc.gov/nchs/nvss/vsrr/prov-county-drugoverdose.htm. Accessed April 4, 2025.
2. Dowell D, Brown S, Gyawali S, et al. Treatment for Opioid Use Disorder: Population Estimates — United States, 2022 Morb Mortal Wkly Rep 2024;73:567–574.
3. Heidbreder C, Fudala PJ, Greenwald MK. History of the discovery, development, and FDA-approval of buprenorphine medications for the treatment of opioid use disorder. Drug Alcohol Depend Rep 2023;6:100133.
4. Stewart MT, Coulibaly N, Schwartz D, et al. Emergency departmentbased efforts to offer medication treatment for opioid use disorder: What can we learn from current approaches? J Subst Abuse Treat 2021;129:108479.
5. Strayer RJ, Hawk K, Hayes BD, et al. Management of opioid use disorder in the emergency department: a white paper prepared for the American Academy of Emergency Medicine. J Emerg Med 2020;58(3):522-546.
6. Education ACfGM. Common Program Requirements. ACGME. Updated 2025. Available at: https://www.acgme.org/globalassets/ pfassets/programrequirements/2025-reformatted-requirements/ cprresidency_2025_reformatted.pdf. Accessed April 4, 2025.
7. Avery J, Knoepflmacher D, Mauer E, et al. Improvement in residents’ attitudes toward Individuals with substance use disorders following an online training module on stigma. Hss J. 2019;15(1):31-36.
8. Ari M, Oyler JL. A substance use disorder training curriculum for internal medicine residents using resident-empaneled patients. BMC Med Educ. 2024;24(1):478.
9. Gruber E, Zapp Z, Pescatore R, et al. Development of a sustainable
curriculum on substance use disorders for emergency medicine residents at Cooper University Hospital. Ann Emerg Med 2017;70(4):S71.
10. Harris PA, Taylor R, Thielke R, et al. Research electronic data capture (REDCap)--a metadata-driven methodology and workflow process for providing translational research informatics support. J Biomed Inform. 2009;42(2):377-81.
11. Harris PA, Taylor R, Minor BL, et al. The REDCap consortium: building an international community of software platform partners. J Biomed Inform. 2019;95:103208.
12. Substance Abuse and Mental Health Services Administration. Waiver Elimination (MAT Act). SAMHSA. Updated November 6, 2024. Available at: https://www.samhsa.gov/substance-use/treatment/ resources/mat-act. Accessed January 30, 2026.
13. Consolidated Appropriations Act, 2023, Pub L No. 117-328, 136 Stat 4459 (2022). Congress.gov. Available at: https://www.congress.gov/ bill/117th-congress/house-bill/2617/text. Accessed January 30, 2026.
14. Larochelle MR, Jones CM, Zhang K. Change in opioid and buprenorphine prescribers and prescriptions by specialty, 2016–2021. Drug Alcohol Depend Rep. 2023;248:109933.
15. Kim HS, Samuels EA. Overcoming barriers to prescribing buprenorphine in the emergency department. JAMA Network Open 2020;3(5):e204996-e204996.
16. Shuey B, Lee D, Ugalde I, et al. Evaluation of resident physicians’ knowledge of and attitudes towards prescribing buprenorphine for patients with opioid use disorder. J Addict Med. 2021;15(3):219-225.
17. Wakeman SE, Kanter GP, Donelan K. Institutional substance use disorder intervention improves general internist preparedness, attitudes, and clinical practice. J Addict Med. 2017;11(4):308-314.
18. Friedberg MW, Chen PG, Van Busum KR, et al. Factors affecting physician professional satisfaction and their implications for patient care, Health systems, and health policy. Rand Health Q. 2014;3(4):1.
19. Callister C, Lockhart S, Holtrop JS, et al. Experiences with an addiction consultation service on care provided to hospitalized patients with opioid use disorder: a qualitative study of hospitalists, nurses, pharmacists, and social workers. Subst Abus. 2022;43(1):615-622.
20. Heil JM, Lassiter JM, Salzman MS, et al. A qualitative assessment of emergency physicians’ experiences with robust emergency department buprenorphine bridge programs. Acad Emerg Med 2024;31(6):576-583.
Oxygen Saturation Thresholds for Opioid-induced Respiratory Depression: A Systematic Review
University of British Columbia, Faculty of Medicine, Undergraduate Medical Program, Vancouver, British Columbia, Canada
University of British Columbia, Faculty of Science, Vancouver, British Columbia, Canada
University of British Columbia, Faculty of Medicine, Department of Family Practice, Vancouver, British Columbia, Canada
Fraser Health Authority, Department of Addiction Medicine and Substance Use Services, Surrey, British Columbia, Canada
Section Editor: Howard Greller, MD
Submission history: Submitted November 27, 2026; Revision received February 24, 2026; Accepted February 25, 2026
Electronically published June 28, 2026
Full text available through open access at http://escholarship.org/uc/uciem_westjem DOI 10.5811/westjem.54000
Introduction: Hypoventilation and hypercapnia are the primary physiological indicators of opioidinduced respiratory depression (OIRD), while hypoxia is typically a later manifestation. However, use of pulse oximetry to measure oxygen saturation (SpO₂) level remains the most widely available and commonly used monitoring modality in both clinical and community settings, whereas capnography is not routinely accessible. Given this reality, it is important to evaluate hypoxia thresholds reported in the literature to inform practical detection and intervention strategies. Oxygen saturation monitoring may serve as a valuable support tool to help determine when individuals experiencing opioid toxicity require intervention; however, there is limited consensus on SpO₂ thresholds that indicate OIRD. Our objective in this study was to evaluate existing evidence on SpO₂ thresholds for OIRD as a physiological marker to incorporate with clinical assessment to potentially prevent opioidrelated outcomes such as hypoxemia, hypoxic brain injury, cardiac arrhythmias, and mortality, and to inform monitoring and intervention strategies for future research.
Methods: We electronically searched Ovid MEDLINE, Ovid Embase, PubMed, and grey literature databases for qualitative and quantitative studies published from 2014–2024. We included studies published in English where participants with opioid use disorder (OUD) experienced opioid toxicity and continuous SpO₂ monitoring in medical settings. Quality was evaluated using the modified Downs and Black checklist. The primary outcome measure was the SpO₂ level used to quantify opioid-induced respiratory depression.
Results: Of the 2,864 articles screened, 37 underwent full-text review, and 16 were included in data extraction and analysis (total patients, N = 12,887). Reported SpO₂ thresholds ranged from 85–95% (median 92, interquartile range 90–95). In three studies where patients experienced opioid-induced respiratory depression, SpO₂ levels dropped to a median value of 80%.
Conclusion: Although hypoxia is a late indicator of opioid-induced respiratory depression, SpO₂ monitoring remains a widely deployed tool for detecting clinically significant deterioration. Reported SpO₂ thresholds for defining OIRD ranged from 90-95% across studies of “excellent” and “good” quality, underscoring the need for standardized, patient-centered thresholds to guide monitoring and intervention in future research. [West J Emerg Med. 2026;27(4)886–894.]
INTRODUCTION
Opioid toxicity refers to the clinical syndrome resulting from excessive opioid exposure, presenting as central nervous system depression, decreased level of consciousness, respiratory depression, cyanosis, and/or miosis.1 The most life-threatening feature of opioid toxicity is opioid-induced respiratory depression (OIRD), which is defined as a reduction in the drive to breathe due to opioid action at μ-opioid receptors in the brainstem respiratory centers, leading to hypoventilation, hypercapnia, and potentially apnea and death.2-5 International opioid use has doubled in prevalence from 26-36 million people in 2010 to 61 million people in 2020 with epidemics currently ongoing in the United States, Canada, North Africa, West Africa, and the Middle East and Southwest Asia.6 According to the World Health Organization (WHO), of the 600,000 drug-related deaths in 2019, approximately 480,000 were related to opioids.7 In response, a range of harm-reduction strategies have been implemented including supervised consumption sites with immediate access to naloxone, where trained staff can identify and manage OIRD on site, reducing fatalities and hospital utilization.8-11
Opioid Use Disorder
Certain factors are associated with an increased risk of opioid toxicity: using opioids while alone; being male; < 25 years of age; being of Indigenous ancestry; having had previous episodes of opioid-induced respiratory depression, not being on any opioid agonist therapy; and having low socioeconomic status. Structural and access-related factors have also been associated with increased risk, including inconsistent drug supply with variable potency, limited availability of supervised consumption services, barriers related to policing practices, housing instability, limited access to regular healthcare, and food insecurity.12-19
Opioid Toxicity
Standardized tools including the Glasgow Coma Scale (GCS), Richmond Agitation-Sedation Scale (RASS), and Pasero Opioid-induced Sedation Scale (POSS) may be used to assess sedation or mental status, but they do not reliably reflect the physiological changes of opioid-induced respiratory depression.20 The decision to administer naloxone versus providing only ventilatory support in opioid toxicity is guided by the presence and severity of OIRD, with initial management prioritizing support of the airway and breathing.21 Naloxone is not administered if the patient is breathing adequately, regardless of mental status.21-22 For the layperson, especially in a stressful situation, it can be difficult to accurately assess respiratory rate, depth of breathing, and signs of hypoxemia or hypercapnia.
As clinical judgment determines whether someone receives naloxone, there is both over- and undertreatment.
Population Health Research Capsule
What do we already know about this issue? Hypoventilation and hypercapnia signal opioid-induced respiratory depression (OIRD) early; optimal hypoxia thresholds for intervention are unclear.
What was the research question?
Is there a consensus on SpO₂ thresholds that define opioid-induced respiratory depression?
What was the major finding of the study? SpO₂ thresholds ranged from 85–95%, while patients with OIRD reached a median SpO₂ of 80%.
How does this improve population health? Clarifying SpO₂ targets supports safer opioid monitoring in community settings, lowering risk of hypoxic complications and death.
Risks of overtreatment of naloxone include precipitated withdrawal, agitation, pulmonary edema, and loss of analgesia in patients with pain; whereas risks of undertreatment include persistent hypoxemia, progression to cardiac arrest, and death.22-24 In inpatient or emergency department (ED) settings, continuous monitoring (eg, mental status and vitals check, pulse oximetry, end-tidal carbon dioxide) is feasible due to the availability of medical staff, equipment, and protocols for rapid intervention.
Pulse Oximetry
An objective, cost-effective, and user-friendly technology that can assist in monitoring patients with opioid toxicity is pulse oximetry. Monitoring of oxygen saturation (SpO2) levels is widely used for its accessibility, portability, standardization, and ease of use by nonclinicians, providing a noninvasive, continuous, and quantitative measure of hypoxemia. It is also less subjective than clinical assessment tools such GCS, RASS, and POSS. Even in hospital, it can detect desaturation events that may be missed by intermittent clinical checks, especially in settings with high patient-to-nurse ratios.25 Its low barrier to use and widespread availability make it attractive for both hospital and home monitoring. Despite hypoxia being a late manifestation of opioid-induced respiratory depression, the broad availability of pulse oximetry relative to capnography makes it pragmatic to examine hypoxia thresholds reported in the literature.
Oxygen Saturation Thresholds for Opioid-induced Respiratory Depression
Oxygen Saturation Threshold in Opioid Users to Prevent Hypoxemia and Opioid Toxicity
Despite these limitations, mSpO₂ is an objective, noninvasive measure that can supplement clinical signs and symptoms to guide intervention in opioid-induced respiratory depression, particularly in community settings. It provides a threshold for hypoxemia, which is directly correlated to patient-important outcomes such as brain injury, cardiac arrhythmia, and death from tissue hypoxia.26 Various SpO₂ thresholds have been proposed in guidelines and the literature; however, there is no consensus on a specific SpO₂ threshold to guide interventions, and current practice relies on clinical judgment, which can be variable.27,28 Addressing this knowledge gap regarding the optimal SpO₂ target for initiating treatment in opioid toxicity is crucial because it directly impacts the balance between overtreatment and undertreatment, both of which carry significant risks for patients. Therefore, our objective in this study was to review SpO₂ thresholds, defined as oxygen saturation levels indicative of OIRD, to inform harm prevention and guide future research on developing and testing monitoring protocols.
METHODS
This study is reported using the PRISMA (Preferred
Reporting Items for Systematic Reviews and Metaanalyses) guideline.
Eligibility Criteria
Studies were eligible for inclusion if study participants met the following criteria: 1) ≥ 18 years of age; 2) had opioid use disorder; 3) had been exposed to opioids; 4) were continuously monitored using pulse oximetry or arterial blood gas; 5) and had experienced either opioid toxicity, hypoxemia, OIRD, ventilation, naloxone administration, hospitalization or death; 6) study design consisted of randomized controlled trials (RCT), cohort studies, systematic reviews/metaanalyses, quality improvement, case-control studies, or cross-sectional studies; and 7) the studies were published in English between 2014–2024. We excluded studies if they involved 1) pediatric populations, animal studies, cancer patients, surgical patients, or patients with conditions known to affect oxygenation or respiratory function (eg, diagnosed sleep-disordered breathing); or 2) study designs such as narrative reviews, case reports, commentaries, editorials, or nonpeer-reviewed articles. The study setting (community, inpatient, or outpatient) was not considered an eligibility criterion. We developed eligibility criteria to ensure comprehensive inclusion of all studies that measured SpO₂ in
Table 1. Study characteristics, including country, study design, and oxygen saturation threshold, stratified by study setting in a review of studies evaluating oxygen saturation targets for opioid poisoning across supervised consumption sites, emergency departments, prehospital emergency medical services, and clinical research settings.
Setting Article Country Article Type Oxygen Saturation Threshold
Supervision Consumption Site
Roxburgh 201737 Australia
Moe 202438 Canada
Prospective Cohort Study ≤ 85%
Prospective Cohort Study ≤ 90%
Jolley 201539 Austria Prospective Cohort Study < 90%
Cho 202240 Canada
Wishik 202141 USA
Dietze 201942 Australia
Retrospective cohort study < 91%
Retrospective cohort study < 95%
Randomized Controlled Trial < 95%
Thiessen 202443 Germany Prospective Cohort Study NR (SpO2 only reported during use)
Emergency Department Azar 202044 Iran
Clemency 201945 USA
Isoardi 202246 Australia
Ryan 201547 USA
Sabzghabaee 201448 Iran
Prehospital EMS Isoardi 202349 Australia
Nugent 201950 Canada
Clinical Respiratory Laboratory
Clinical Research Unit
Randomized Controlled Trial < 90%
Prospective Cohort Study < 92%
Prospective Cohort Study < 93%
Retrospective cohort study < 94%
Randomized Controlled Trial NR (SpO2 only reported at NLX administration)
Retrospective cohort study NR (SpO2 only reported only at NLX administration)
Retrospective cohort study NR (SpO2 only reported at NLX administration)
Tas 202233 United Kingdom Prospective Cohort Study < 90%
Lile 202451 Germany
Randomized Controlled Trial < 95%
EMS, emergency medical services; NLX, naloxone; SpO2, oxygen saturation level
Manes et al. Oxygen Saturation Thresholds for Opioid-induced Respiratory Depression
patients experiencing opioid toxicity, while focusing on clinically relevant, high-risk populations.
Search Strategy
An electronic search of the databases was conducted on July 23, 2024. The databases searched were Pubmed, Ovid MEDLINE, and Ovid Embase inclusive of all articles from January 1, 2014–July 23, 2024. The complete search strategy for Ovid MEDLINE, Ovid Embase, and Pubmed is found in Supplementary Material 1. Additionally, we conducted a comprehensive grey literature search of government and public health agency websites (U.S. Centers for Disease Control and Prevention, Health Canada, WHO, provincial/ state health websites), professional society guidelines (American Heart Association, Canadian Association of Emergency Physicians), clinical trial registries (ClinicalTrials.gov), protocols from supervised consumption services and poison control centers, and conference abstracts. We developed the search strategy in consultation with expert librarian staff at the University of British Columbia Faculty of Medicine. The eligible studies were imported into Covidence, which removed duplicates and allowed for independent study selection.
Study Selection
Two independent and blind reviewers (AM and JS) completed title and abstract screening of each study. Disagreements were solved by a third reviewer. Duplicates were removed using a Covidence tool that generates a reference list and accurately removes identical citations. AM also verified that the duplicates were accurately removed. An analogous process was used for full-text screening.
Data Extraction
Data was extracted via a standardized data collection form used independently by two reviewers (AM and JS). Discrepancies during data extraction were resolved through verbal discourse among reviewers upon completion of the data extraction stage. The collected data included basic article information (study ID, title, author names, publication date, sponsorship source, country of publication, journal name, and conflict of interest statements) and study-specific information (study design, setting, sample size, participant age, inclusion/ exclusion criteria, number of withdrawals and reasons for withdrawal, SpO₂ threshold used to define respiratory depression, and the proportion of adverse events). For adverse events, we extracted the study-defined criteria and, when reported, the frequency and classification of events.
Study Assessment
We used the modified Downs and Black checklist to assess the risk of bias and overall quality of the 16 included studies. The checklist is a questionnaire consisting of 27
questions across five categories: reporting; external validity; internal validity; and power (Supplementary Material 2). As per the researchers, scores are split into the following categories: excellent (26-28 points); good (20-25 points); fair (15-19 points), and poor (≤ 14 points). Two researchers (AM, JS) independently assessed the included studies. Disagreements were resolved through verbal discourse between both reviewers. We assessed reporting bias by reviewing each study’s published protocol, if available. If unavailable, the article’s methods section was compared to its results section to ensure all outcomes were reported.
Synthesis
We synthesized results through a narrative review, with key study characteristics and outcomes summarized in tables. Heterogeneity across studies was explored descriptively, considering differences in study populations, settings, definitions of opioid-induced respiratory depression, and SpO₂ thresholds. Inter-rater agreement for study selection and data extraction was assessed using the Cohen kappa coefficient (κ).
RESULTS
Study Selection
We selected 2,864 papers for abstract screening: 37 studies were selected for full-text review, and 16 were included in this review, as shown in the PRISMA diagram (Figure). We included all studies that met the eligibility criteria. The title and abstract screening stage showed substantial inter-rater agreement (Cohen κ = 0.77).
Study Characteristics
The SpO₂ thresholds in the included studies ranged from 85–95% (median 92%, interquartile range [IQR] 90–95).
Figure. PRISMA flow diagram illustrating the study selection process, including the number of studies screened, excluded, and included in the systematic review. PRISMA, Preferred Reporting Items for Systematic Reviews and Meta Analyses.
Oxygen Saturation Thresholds for Opioid-induced Respiratory Depression
Country-specific differences were minimal, with thresholds in Australia ranging from 85–95% (92%, [88–94]); the United States 92–95% (94% [92–95]); and single studies from Canada, Germany, Iran, Austria, and the United Kingdom falling within 90–95%, likely reflecting local guideline variations. In the ED setting, the median SpO₂ threshold used to define opioid-induced respiratory depression was 93% (90–93%). In the setting of medically supervised consumption sites, the median SpO₂ threshold was 90% (89–94%). Both the clinical research unit and respiratory lab settings included a single study each, with thresholds of 95% and 90%, respectively.
Across studies reporting adverse events, the proportion of patients experiencing hypoxemia or related outcomes ranged from 14–40%, with a pooled event proportion of approximately 18% (Table 2). Event rates varied substantially across studies but did not cluster around a consistent SpO₂ threshold.
Adverse outcome criteria varied across studies; however, all studies consistently included hypoxemia as a primary measure. Other outcomes generally reflected sequelae of low SpO₂, including oxygen supplementation, naloxone administration, mechanical ventilation, hospitalization, hypoxic brain injury, and death. In addition to SpO₂ levels during opioid-induced respiratory depression, several studies reported patient-oriented outcomes. Isoardi et al observed that a single 1.6 mg dose of naloxone reversed respiratory depression in 97% of presentations, with 3% requiring repeat doses; no deaths were reported. Nugent et al documented
significant improvements in SpO₂ for patients treated with naloxone (mean change 23.25%); they did not report on adverse events or deaths. Dibz et al also found significant increases in SpO₂ of > 20% post-administration, with no adverse events reported.
Overall, practice guidance reflected moderate variability in recommended SpO₂ thresholds but did not identify a universally accepted standard, with most recommendations falling within a narrow range centered around 90% (Table 4).
Assessment of Quality
Individual score breakdown is available in Table 5. One study was scored as ‘excellent’; 11 were scored as ‘good’; four were scored as ‘fair’; and zero studies were scored as ‘poor.’ Strengths of these studies included clear objectives, outcomes, and reliable analyses. However, external validity and generalizability varied and were not as strong for four of the included studies. Internal validity, including bias and confounding, also varied and was not as strong for four of the studies included.
DISCUSSION
Every peer-reviewed study included in this systematic review defined the threshold for opioid-induced respiratory depression ≥ 90% except for Roxburgh 2017, which was considered a study of ‘fair’ quality as per the modified Downs and Black checklist. Despite this, our synthesis reveals no true consensus on the optimal SpO₂ threshold for intervention in
“Opioids”
Table 2. Opioid formulation and associated adverse effects among patients in studies of opioid-related hypoxemia.
Table 3. Oxygen saturation levels and interventions in patients experiencing opioid toxicity in a systematic review of published studies.
Median: 80 (IQR: 70–90) Airway and ventilatory support, 1.6 mg naloxone IM (97% single dose, 3% repeat dose)
Mean: 79.9 (SD 25.3) Airway and ventilatory support, 1 mg IN naloxone
Mean: 72.1 (SD 7.3) 0.4 mg naloxone IV or IN
IQR, interquartile range; IM, intramuscular; IN intranasal; IV, intravenous; NR, not reported; SD, standard deviation.
OIRD. This lack of agreement is striking given the widespread use of SpO2 measures in both research and practice.
Studies and guidelines were found to have a range of SpO₂ thresholds, typically between 85–95%, with community and supervised consumption settings often using lower thresholds (≤ 85–90%), and hospital or clinical research settings using higher thresholds (92–95%). Lower SpO₂ thresholds are employed in community settings to balance sensitivity for clinically significant desaturation with the practical need to avoid unnecessary use of scarce resources.29 Because these sites often have less frequent monitoring, limited oxygen supplies, and reduced capacity for rapid on-site escalation of care, resource stewardship is prioritized.29 However, acute care settings have access to continuous monitoring and immediate access to advanced respiratory support, allowing clinicians to detect and respond rapidly to even mild hypoxemia.30 Hospitals can also escalate care quickly if a patient deteriorates, justifying intervention at higher SpO₂ thresholds.
The heterogeneity in SpO₂ intervention thresholds identified in this review may reflect differences in patient
populations, including comorbidities, as well as variation in opioid tolerance. Comorbid conditions commonly diagnosed in people with opioid use disorder, such as chronic obstructive pulmonary disease, affect normal resting SpO₂ values and are associated with increased risk of OIRD; hence, they require different thresholds to determine opioid-induced respiratory depression.31-33Additionally, in opioid-naive patients, the risk of OIRD at lower doses is higher than in opioid-tolerant individuals due to a lack of tolerance. These individuals require higher SpO₂ thresholds considering they are more sensitive to opioid effects and rapidly deteriorate compared to individuals with opioid use disorder.34
Differences in institutional guidelines also contribute to the heterogeneity among SpO₂ thresholds. For instance, in Canada two neighboring provinces have different prehospital response protocols to define OIRD and initiate oxygen therapy. The BC Overdose Prevention Services Guidelines state the SpO₂ threshold as < 90%, whereas Alberta Health Services state the threshold as < 94%.27,28 Furthermore, consistent with previous studies, our review also found that naloxone is highly effective in reversing hypoxemia and
WHO,
Table 4. Summary of grey literature in a systematic review of studies regarding the optimal oxygen saturation threshold for intervention in opioid-induced respiratory depression.
Table 5. Modified Downs and Black checklist scores used to evaluate research quality in a systematic review of studies regarding the optimal oxygen saturation threshold for intervention in opioid-induced respiratory depression.
Study Title Score (maximum 28)
Buprenorphine to reverse respiratory depression from methadone overdose in opioid-dependent patients- a prospective randomized trial
Hospital Observation Upon Reversal (HOUR) with naloxone–a prospective clinical prediction rule validation study
Effect of Intranasal vs Intramuscular naloxone on opioid overdose: a randomized clinical trial
Dedicated nursing care pathway improved management of opioid-poisoned patients in the emergency department: a before-after observational study
Acute opioid withdrawal following intramuscular administration of naloxone 1.6 mg: a prospective out-of-hospital series
Understanding heroin overdose: a study of the acute respiratory depressant effects of injected pharmaceutical heroin
Physiologic oxygen responses to smoking opioids: an observational study using continuous pulse oximetry at overdose prevention services in British Columbia, Canada.
Frequency and severity of non-fatal opioid overdoses among clients attending the Sydney Medically Supervised Injecting Centre.
Undetected respiratory depression in people with opioid use disorder
comparison of efficacy of treatment and time to administration of naloxone by BLS and ALS providers.
A dose-ranging study of the physiological and self-reported effects of repeated, rapid infusion of remifentanil in people with opioid use disorder and physical dependence on fentanyl.
Blood oxygenation and heart rate changes after diamorphine intravenous injection during opioid agonist treatment for outpatients with heroin dependence.
Naloxone therapy in opioid overdose patients: intranasal or intravenous? A randomized clinical trial.
Opioid overdose and naloxone dosing at insite supervised injection facility in British Columbia: a retrospective cohort
OIRD, producing rapid improvements in SpO₂ and with deaths being a rare occurrence in controlled settings.35,36
In outpatient settings, pulse oximetry is the most feasible and widely available method for monitoring oxygenation, given its noninvasive nature, portability, and ease of use. To make optimal use of pulse oximetry as a clinical indicator, it is helpful to define a reference threshold, similar to those set for other vital signs, which also require context-specific interpretation. Despite this, we discovered no consensus on a SpO2 threshold. By highlighting this gap, our study defines a clear agenda for future work: the development of standardized reporting practices.
Prospective research studies are needed to find a threshold that will be generalizable to the broader population, while acknowledging that certain subpopulations, such as those with chronic respiratory conditions or altered baseline oxygenation, may need to be excluded. Importantly, even if such a threshold is established, it would complement rather than replace clinical judgment. Airway support and naloxone remain the cornerstones of management for any patient with opioid toxicity and evidence of respiratory compromise. A standardized threshold would, however, be particularly
valuable for nonclinicians and in situations of diagnostic uncertainty, where rapid recognition and action can mean the difference between life and death.
LIMITATIONS
This systematic review is limited by the lack of RCTs addressing declines in SpO₂ during opioid-induced respiratory depression. This is likely due to ethical constraints in conducting RCTs where patients are experiencing OIRD. This reliance on observational study designs increases susceptibility to bias and limits the strength of inferences as seen in the scoring of non-RCTs in the modified Downs and Black checklist. Another limitation is the heterogeneity of included studies in terms of study setting (eg, emergency department versus supervised consumption sites) and country, which may limit the generalizability of findings across health systems and care contexts. Methodological limitations of this review include the restriction to English-language articles, the exclusion of studies published prior to 2014, and the inclusion of only participants with a diagnosed substance use disorder. While these criteria were selected to focus on clinically
Manes et al. Oxygen Saturation Thresholds for Opioid-induced Respiratory Depression
relevant data in high-risk populations, they may have excluded potentially informative studies.
Future studies should focus on conducting prospective research using the conservative range of SpO₂ thresholds to determine feasibility of the threshold, test statistics, prevention of adverse events, and mortality reduction. Future studies should also ethically investigate SpO₂ thresholds in cases of opioid toxicity to establish clear criteria for early intervention and improved patient outcomes.
CONCLUSION
Currently, assessing a person with opioid use disorder involves being diligent about the clinical signs and symptoms of opioid-induced respiratory depression. Individuals without healthcare backgrounds have difficulty in recognizing these signs and symptoms. While an oxygen saturation threshold alone would be insufficient to reliably indicate OIRD, it remains an objective measure that can serve as a valuable support tool. Therefore, prospective studies should test SpO₂ thresholds ranging from 90-95% in relation to opioid-induced respiratory depression to identify a standardized threshold.
Address for Correspondence: Nitasha Puri, MD, School of Medicine, Simon Fraser University, 13750 96 Ave, Surrey, British Columbia, Canada V3V 1Z2. Email: nitasha.puri2@fraserhealth.ca.
Conflicts of Interest: By the WestJEM article submission agreement, all authors are required to disclose all affiliations, funding sources and financial or management relationships that could be perceived as potential sources of bias. No author has professional or financial relationships with any companies that are relevant to this study. There are no conflicts of interest or sources of funding to declare.
1. Dolinak D. Opioid toxicity. Acad Forensic Pathol. 2017;7:19-35.
2. Baldo BA, Rose MA. Mechanisms of opioid-induced respiratory depression. Arch Toxicol. 2022;96:2247-60.
3. Boom M, Niesters M, Sarton E, et al. Non-analgesic effects of opioids: opioid-induced respiratory depression. Curr Pharm Des. 2012;18:5994-6004.
4. Manes A, Sran J, Bach H. Assessing the efficacy of nanoparticles in reversing opioid poisoning and preventing renarcotization. Nanomedicine. 2025;20(7):755-63.
5. Jonathan K. Phillips, Morgan A. Ford, and Richard J. Bonnie, using AMA style guidelines) National Academies of Sciences E, Division H and M, Policy B on HS, et al. Evidence on strategies for addressing the opioid
epidemic. In: Pain Management and the Opioid Epidemic: Balancing Societal and Individual Benefits and Risks of Prescription Opioid Use. National Academies Press; 2017.
6. International Overdose Awareness Day. Facts & stats. 2024. Available at: https://www.overdoseday.com/facts-stats/. Accessed July 12, 2024.
7. World Health Organization. Opioid overdose. 2023. Available at: https://www.who.int/news-room/fact-sheets/detail/opioid-overdose. Accessed July 12, 2024.
8. Ng J, Sutherland C, Kolber MR. Does evidence support supervised injection sites? Can Fam Physician. 2017;63:866.
9. Shaw LV, Moe J, Purssell R, et al. Naloxone interventions in opioid overdoses: a systematic review protocol. Syst Rev. 2019;8:138.
10. Khair S, Eastwood CA, Lu M, et al. Supervised consumption site enables cost savings by avoiding emergency services: a cost analysis study. Harm Reduct J. 2022;19:32.
11. Zang X, Skinner A, Krieger MS, et al. Evaluation of strategies to enhance community-based naloxone distribution supported by an opioid settlement. JAMA Netw Open. 2024;7:e2413861.
12. American Psychiatric Association. Diagnostic and Statistical Manual of Mental Disorders. 2025. Available at: https://psychiatryonline.org. Accessed September 7, 2025.
13. Government of Canada. Risk of non-medical drug overdose following prescription of opioids post-injury: a retrospective cohort study. 2022. Available at: https://www150.statcan.gc.ca/n1/pub/82-003-x/2022007/ article/00001-eng.htm. Accessed March 19, 2025.
14. Gicquelais RE, Genberg BL, Maksut JL, et al. Prevalence and correlates of using opioids alone among individuals in a residential treatment program in Michigan: implications for overdose mortality prevention. Harm Reduct J. 2022;19:135.
15. Altekruse SF, Cosgrove CM, Altekruse WC, et al. Socioeconomic risk factors for fatal opioid overdoses in the United States. PLoS One. 2020;15:e0227966.
16. Wang L, Hong PJ, Jiang W, et al. Predictors of fatal and nonfatal overdose after prescription of opioids for chronic pain. CMAJ. 2023;195:E1399-411.
17. Schiavon S, Hodgin K, Sellers A, et al. Medical, psychosocial, and treatment predictors of opioid overdose among high risk opioid users. Addict Behav. 2018;86:51-5.
18. Arsene C, Na L, Patel P, et al. The importance of social risk factors for patients diagnosed with opioid use disorder. J Am Pharm Assoc (2003). 2023;63:925-32.
19. Slaunwhite A, Min JE, Palis H, et al. Effect of risk mitigation guidance for opioid and stimulant dispensations on mortality and acute care visits. BMJ. 2024;384:e076336.
46. Isoardi K, Learmont B, Horan B, et al. Nursing care pathway in opioid poisoning. Emerg Med Australas. 2023;35:69-73.
47. Ryan N, Isbister GK. Tramadol overdose and seizure risk. Clin Toxicol. 2015;53:380-1.
48. Sabzghabaee AM, Eizadi-Mood N, Yaraghi A, et al. Intranasal vs intravenous naloxone. Arch Med Sci. 2014;10:309-14.
49. Isoardi KZ, Parker L, Harris K, et al. Acute opioid withdrawal after naloxone. Ann Emerg Med. 2022;80:120-6.
50. Nugent K, Matthews P, Gissendaner J, et al. Naloxone administration by EMS providers. Prehosp Disaster Med. 2019;34:350-5.
51. Lile JA, Shellenberg TP, Babalonis S, et al. Effects of remifentanil in opioid users. Psychopharmacology (Berl) 2024;241:1227-36.
52. Ontario Poison Centre. Street opioid resuscitation recommendations. 2018. Available at: https://www.ontariopoisoncentre.ca. Accessed December 1, 2024.
53. World Health Organization. Community management of opioid overdose. 2014. Available at: https://www.who.int/publications/i/ item/9789241548816. Accessed December 1, 2024.
54. Toward the Heart. Harm reduction resources and training. 2025. Available at: https://www.towardtheheart.com/. Accessed December 2, 2025.
55. Masimo Corporation. Oxygen saturation monitoring study. 2025. Available at: https://clinicaltrials.gov/ct2/show/NCT06217380. Accessed December 1, 2024.
56. Vancouver Coastal Health. Overdose prevention site manual. 2024. Available at: https://www.vch.ca/en/media/13086. Accessed December 2, 2024.
57. Kestler A, DeWitt C, Godwin J, et al. Opioid poisoning – in-hospital management. 2024. Available at: https://emergencycarebc.ca/ clinical-resources/opioid-poisoning-in-hospital-management/. Accessed December 2, 2025.
The Impact of Urinalysis Turnaround Times on Patient Disposition in the Emergency Department
DaMarcus E. Baymon, MD*o
Patricia Hernández, MD*†o
Paul Chen, MD, MBA*
Leon D. Sanchez, MD, MPH*
Dana Im, MD, MPP, MPhil*
Alice Bukhman, MD, MPH*
Joshua W. Joseph MD, MS, MBE*
Section Editor: Nour Barmo, MD
Harvard Medical School, Brigham and Women’s Hospital, Department of Emergency Medicine, Boston, Massachusetts
Harvard Medical School, Massachusetts General Hospital, Department of Emergency Medicine, Boston, Massachusetts Co-first authors
Submission history: Submitted November 11, 2025; Revision received March 12, 2026; Accepted March 17, 2026
Electronically published July 16, 2026
Full text available through open access at http://escholarship.org/uc/uciem_westjem DOI 10.5811/westjem.53952
Introduction: Diagnostic efficiency in the emergency department (ED) is crucial for workflow
Among these, urinalysis (UA) is a key test for abdominopelvic complaints. Prolonged UA turnaround times can extend patient length of stay and reduce patient satisfaction, highlighting the need for improvement. In this study qw sought to measure the correlation between UA turnaround times and time to disposition.
Methods: We conducted a retrospective analysis of discharged ED patients with abdominopelvic complaints who had a UA ordered between January–August 2022. Electronic health records data included UA order-to-result time, urine human chorionic gonadotropin (hCG), time to disposition, and complete blood count (CBC) turnaround time as a venipuncture comparator. Spearman correlation coefficients assessed associations between lab processing times and time to disposition.
Results: Among 6,708 discharged patients included in the study, 3,795 presented with abdominopelvic complaints. In this subgroup, 3,688 UAs, 1,285 urine hCG tests, and 2,966 CBCs were obtained. Median times from UA order-to-specimen receipt and result were 65 (IQR 29-138) and 92 (53-168) minutes, respectively. A modest positive correlation was observed between UA order-to-result time and time to disposition (ρ = 0.46), relative to CBC order-to-result time (ρ = 0.29). The relationship was slightly weaker for urine hCG (ρ = 0.35). Laboratory turnaround times showed minimal correlation with ED time to disposition (UA ρ = 0.04; urine hCG ρ = 0.03; CBC ρ = 0.09).
Conclusion: Urinalysis acquisition and processing times are modestly correlated with time to disposition in patients with abdominopelvic complaints. Reducing collection time for UA and urine hCG tests may improve throughput for this patient cohort. [West J Emerg Med. 2026;27(4)895–898.]
INTRODUCTION
Abdominal pain, dysuria, hematuria, and flank pain are among the most common emergency department (ED) presentations. Genitourinary diagnoses account for 8 million of 139 million ED visits per year suggesting that rapidly obtaining urinalyses (UA) may support efficient ED operations.1,2 Delays in UA turnaround times may prolong
disposition for patients who are otherwise ready for discharge. Longer ED length of stay is associated with lower satisfaction, worse outcomes, and increased costs.3-5
Relative to expensive, institution-level measures, such as increasing inpatient bed availability and staffing, reducing laboratory turnaround times is a feasible way to address delays.6 However, obtaining urine tests poses logistical
Impact
challenges because patients must have urine available and must participate in collection or catheterization. Prior studies suggest that faster turnaround times improve patient flow and reduce ED congestion, yet the specific impact of UA turnaround times on disposition remains unclear.7 A recent study found no improvement in ED time to disposition after implementing a urine collection triage system, although the sample size was limited.8 Thus, the objective of our study was to measure the correlation between UA collection and turnaround times and time to disposition among ED patients with abdominopelvic complaints.
METHODS
We conducted this retrospective study from January–August 2022 in a single urban ED with an annual volume of approximately 32,000 visits. The institutional review board exempted the study from informed consent since only anonymous data were used. Eligible participants were adults (≥18 years of age) discharged with abdominopelvic complaints (including “abdominal pain,” “flank pain,” “hematuria,” “dysuria,” “pelvic pain,” “vaginal bleeding,” and “vaginal discharge”) who had an order for UA or urine human chorionic gonadotropin (hCG). Electronic health records (EHR) data included timestamps of lab test orders, specimen receipts, test result times, and time to disposition. These totals reflect tests performed rather than unique patients, as some patients underwent multiple tests. Orders were all clinician-initiated because no triage protocol-based urine ordering was in place during the study period.
We defined order time as the test order entry timestamp, specimen receipt time as the laboratory accession timestamp, and result time as the final result reporting timestamp in the EHR. Lab turnaround time was defined as the interval between specimen receipt and result reporting. Time to disposition was defined as the interval between ED arrival and disposition decision timestamp. Disposition decision time was abstracted from EHR timestamps corresponding to the time at which the treating clinician entered the patient’s disposition. We abstracted complete blood count (CBC) collection times as a proxy for venipuncture-based tests.
We followed recommended methods for medical record reviews including explicit inclusion and exclusion criteria, predefined variable definitions, and a standardized data abstraction process as outlined by Worster and Bledsoe.9 The primary outcome was the correlation between UA turnaround time and disposition time. Secondary outcomes included the correlations between UA order-to-receipt interval, urine hCG processing times, and CBC turnaround time with disposition time.
Descriptive statistics, including medians with IQR, were computed for lab collection times and disposition times. We assessed normality with the Shapiro-Wilk test. Lab testing and collection intervals were compared using the Kruskal-Wallis test across the three test groups followed by Mann-Whitney-U testing between groups of pairs when significant. Spearman correlation coefficients were used to assess associations
Population Health Research Capsule
What do we already know about this issue? Urinalysis (UA) testing may prolong emergency department (ED) times to disposition. However, the relative impact of urine collection lab processing is unclear.
What was the research question? Is ED time to disposition correlated with urinalysis processing intervals?
What was the major finding of the study? UA order-to-result time was correlated with disposition time (ρ = 0.46); each 30-minute delay added seven minutes to disposition time.
How does this improve population health? Targeting urine collection delays may reduce time to disposition.
between lab collection times and disposition times. A twosided P value of .01 was considered significant.
RESULTS
A total of 6,708 patients were discharged during the study period. Of those, 3,795 patients (2,620 female, 69%) presented to the ED with abdominopelvic complaints between January–August 2022. A total of 3,688 UAs, 1,285 urine hCG tests, and 2,966 CBCs were obtained. These counts reflect tests performed rather than unique patients because some encounters included multiple tests; however, all three tests reflect independent orders, specimens, and reporting personnel at our institution. None of the laboratory intervals demonstrated normal distributions. Significant differences were observed between UA, urine hCG, and CBC for order-to-specimen receipt (Kruskal-Wallis H = 132, P < .001), order-to-result (H = 173, P < .001), and laboratory turnaround time (H = 427, P < .001). Urinalyses consistently took longer than any other test. The median time from the order being placed to specimen receipt for UA was 65 minutes (interquartile range [IQR] 29-138), while the median time from order-to-result was 92 minutes (53-168), encompassing a median lab turnaround time of 20 minutes (13-31), all of which were significant relative to urine hCG and CBC (P < .01 for all comparisons).
Urine hCG orders consistently took longer to complete than CBCs, with a median time from order-to-specimen receipt of 49 minutes (26-103), median time from order to result of 63 minutes (IQR 38-117), and median lab turnaround time of 11 minutes (8-17) (P < .01 for all comparisons). The
median times for CBCs were relatively rapid with median time of order-to-specimen receipt of 27 minutes (18-42), median time from order. to result of 35 minutes (24-43), and median turnaround time of 4 minutes (3-9). Time from clinician sign-up to order placement was rapid for Uas: median 5 minutes (3-6) and did not differ significantly compared to other tests. Median laboratory processing times for UA, urine hCG, and CBC are summarized in Figure 1.
Spearman correlation analysis demonstrated a positive relationship between UA order to result and time to disposition (ρ = 0.46). The correlation between urine hCG test ordering and result times and time to disposition was more modest (ρ = 0.9), while the CBC showed a weaker correlation (ρ = 0.29). All correlations were statistically significant. Lab turnaround times showed little to no correlation with time to disposition TTD for UA (ρ = 0.04), urine hCG (ρ = 0.03), and CBC (ρ = 0.09), and were not statistically significant, nor were intervals from clinician sign-up to order placement. A simple regression analysis of UA order-to-result times demonstrated that every additional 30-minute delay beyond the median order-to-result time was associated with an additional seven-minute delay in TTD.
DISCUSSION
This retrospective study demonstrated a modest, positive correlation between UA collection times and time to disposition in the ED, with a weaker trend for urine hCG tests. These findings align with prior work by Neyman et al. who reported that UA orders extended the ED length of stay by 35-45 minutes, and that time to disposition nearly doubled when both
Figure 1. Median time (in minutes) for urinalysis, urine human chorionic gonadotropin, and complete blood count in a retrospective study of emergency department patients with abdominopelvic complaints that examined the association between laboratory turnaround times and time to patient disposition. Error bars represent interquartile ranges.CBC, complete blood count; UA, urinalysis.
UAs and blood test were ordered, suggesting an additive effect.10 Anad et al similarly found that UA orders were associated with increased time to disposition among discharged patients.11 Together, these findings highlight the role of testing efficiency in patient throughput and ED operations.
Prior work evaluating lab turnaround time more broadly has demonstrated that improvements in turnaround time are associated with clinically meaningful reductions in ED length of stay. In a large retrospective analysis, Kaushik et al. reported that a 1-minute decrease in lab turnaround time was associated with a 0.50-minute decrease in ED length of stay, and Vrijsen et al similarly found that a one-minute increase in laboratory TAT was associated with a 0.32-minute increase in ED length of stay after adjustment for covariates.12,13 Our findings, focused on urine tests, suggests that delays relevant to time to disposition may occur predominantly before lab processing. However, given the observational design of our study and the absence of key operational covariates, delays in UA turnaround time should be interpreted as an associated marker of encounter complexity and workflow, rather than a direct casual driver of prolonged time to disposition.
While UAs required more time relative to other tests in this study, most delays occurred during specimen acquisition. Reducing collection time may improve throughput and patient satisfaction.14, 15 Although UA point-of-care testing could shorten order-to-result time, these results suggest that operational improvements in urine specimen collection, such as providing restroom instructions or standardizing collection when rooming patients, may also be effective. Enhancing communication among clinicians, nursing staff, emergency service assistants, and lab personnel may streamline workflow and reduce delays. Future studies should examine the impact of targeted UA ordering algorithms and automated notification systems on workflow and time to disposition.
While some studies indicate a clear impact, others suggest that factors beyond UA collection may play a greater role in ED throughput. Despite their frequent use, UAs do not consistently impact clinical decision-making, with up to 33% of results not influencing medical decisions, 25% not affecting disposition decisions, and 17% of UAs being canceled.11 A 2020 randomized controlled trial found no difference in time to disposition between patients who provided urine samples after physician evaluation and those who provided samples in triage.8 This inconsistency highlights the need to reconsider routine UA use in the ED to optimize time to disposition metrics and alleviate unnecessary burdens on patients and ED staff.
LIMITATIONS
This study has several limitations. Its retrospective nature limits causal inference. This preliminary study did not adjust for factors that may delay urine acquisition independent of lab performance, such as inability to provide a specimen due to pain, dehydration, or frailty, parallel diagnostic testing, or ED crowding and staffing, which may influence both collection
Baymon
and disposition timing. Future studies should measure and adjust for these clinical and operational drivers to better isolate the association between UA timing intervals and time to disposition. Additionally, conducting the study at a single institution and focusing on discharged patients reduces generalizability and may select for a less acute population with shorter time to disposition than admitted patients. Due to the de-identification process, our dataset did not include patient age as a covariate; thus, it is likely that for older patients with significant frailty, the logistics of obtaining a clean-catch UA relative to a catheterization could contribute significantly to the time needed to obtain a specimen. Similarly, while CBCs served as a proxy for venipuncturebased testing, chemistry panels may represent a more consequential prerequisite for imaging.
CONCLUSION
Delays in obtaining urinanalyses demonstrated a modest association with delays in patient throughput, and UAs took considerably longer than urine and blood tests ordered contemporaneously. Conversely, while UAs took longer to analyze, no lab turnaround times were associated with throughput for any test. These findings indicate that expediting UA collection may have an outsized effect on ED throughput relative to improving other tests. They also suggest a salient target for intervention, as meaningful improvements may result from improving collection practices and communication, rather than from faster lab equipment or increased staffing. Given the frequency with which urine studies are obtained in the ED, even modest reductions in urine acquisition delays may translate into significant improvements in ED throughput and patient experience. Further multicenter and prospective studies are needed to generalize these findings and evaluate future interventions.
Address for Correspondence: Patricia Hernández, MD, Brigham and Women’s Hospital, Department of Emergency Medicine, 10 Vining St, Suite NH-240-A, Boston, MA 02115. Email: phernandez9@mgb.org.
Conflicts of Interest: By the WestJEM article submission agreement, all authors are required to disclose all affiliations, funding sources and financial or management relationships that could be perceived as potential sources of bias. No author has professional or financial relationships with any companies that are relevant to this study. There are no conflicts of interest or sources of funding to declare.
1. Cairns C, Kang K. National Hospital Ambulatory Medical Care Survey: 2021 emergency department summary tables. 2021. Available at: https://ftp.cdc.gov/pub/Health_Statistics/NCHS/ Dataset_Documentation/NHAMCS/doc21-ed-508.pdf. Accessed January 24, 2025.
2. Nicolle LE, Gupta K, Bradley SF, et al. Clinical practice guideline for the management of asymptomatic bacteriuria: 2019 update by the Infectious Diseases Society of America. 2019;68(10):e83-110.
3. de Steenwinkel M, Haagsma JA, van Berkel ECM, et al. Patient satisfaction, needs, and preferences concerning information dispensation at the emergency department: a cross-sectional observational study. Int J Emerg Med. 2022;15:5.
4. Parker BT, Marco C. Emergency department length of stay: accuracy of patient estimates. West J Emerg Med. 2014;15:170-175.
5. Thompson DA, Yarnold PR. Relating patient satisfaction to waiting time perceptions and expectations: the disconfirmation paradigm. Acad Emerg Med. 1995;2:1057-1062.
6. Burgess L, Hines S, Kynoch K. Association between emergency department length of stay and patient outcomes: a systematic review protocol. JBI Database Syst Rev Implement Rep. 2018;16:1361-1366.
7. Yoon P, Steiner I, Reinhardt G. Analysis of factors influencing length of stay in the emergency department. CJEM. 2003;5:155-161.
8. Bahl A, Jamali AM, Ramesh G. Impact of early urine specimen collection on emergency department time to disposition: a randomized controlled trial. Cureus. 2020;12:e10495.
9. Worster A, Bledsoe RD, Cleve P, et al. Reassessing the methods of medical record review studies in emergency medicine research. Ann Emerg Med. 2005;45:448-451.
10. Neyman G, Dalsey W. A quantification of the impact of awaiting results of a urinalysis upon emergency department length of stay. J Emerg Med. 2021;60:158-164.
11. Anand A, Ballinger B, Ganti L. Impact of urinalysis on medical decision-making and length of stay. Cureus. 2018;10:e2531.
12. Kaushik N, Khangulov VS, O’Hara M, et al. Reduction in laboratory turnaround time decreases emergency room length of stay. Open Access Emerg Med. 2018;10:37-45.
13. Vrijsen BEL, Haitjema S, Westerink J, et al. Shorter laboratory turnaround time is associated with shorter emergency department length of stay: a retrospective cohort study. BMC Emerg Med. 2022;22:207.
14. Saxon K, London K, Bacharouch A, et al. Patients’ perceptions of waiting times and the effect on patient satisfaction in the emergency department. Ann Emerg Med. 2013;62:S82.
15. Handel DA. Associations between patient and emergency department operational characteristics and patient satisfaction scores in an adult population. Ann Emerg Med. 2014.
Emergency Department Closures and Patient Outcomes: Scoping Review of Impacts on Care, Equity, and System Performance
Zahra Ridha, BHSc* Adam Steiner, BA* Helena Son, BHSc*
McMaster University, Michael G. DeGroote School of Medicine, St. Catharines, Ontario, Canada
McMaster University, Division of Emergency Medicine, Hamilton, Ontario, Canada
McMaster University, Department of Family Medicine and Economics and Health Policy, Hamilton, Ontario, Canada
Submission history: Submitted November 15, 2025; Revision received February 7, 2026; Accepted February 8, 2026
Electronically published June 28, 2026
Full text available through open access at http://escholarship.org/uc/uciem_westjem DOI 10.5811/westjem.53973
Introduction: Emergency department (ED) closures have become increasingly common across health systems worldwide, reflecting mounting pressures from staffing shortages, resource constraints, and rising patient demand. Closures, whether temporary or permanent, pose potential risks to timely access to emergency care and may significantly impact patient outcomes and healthcare system performance. Despite growing attention from policymakers and the public, academic evidence on real-world impacts of ED closures remains fragmented. In this scoping review we compiled and summarized the current literature directly addressing the impacts of ED closures.
Methods: Using the Preferred Reporting Items for Systematic reviews and Meta-Analyses extension for Scoping Reviews criteria, we conducted a search of PubMed.gov, the Cumulative Index to Nursing and Allied Health Literature, and Web of Science databases for papers published in English after the year 2000 that directly addressed ED closures. We screened these papers by title and abstract. This search yielded 15 studies for which we then conducted a forward and backward citation search, ultimately producing 22 unique papers. Data from these papers were initially extracted into a spreadsheet and then organized into thematic tables based on the impacts they discussed.
Results: Our search yielded 1,725 papers, and we ultimately included 22 of these (1.3%). Most studies were observational or quasi-experimental, covering 147 unique ED closures, with some analyzing all United States closures (thousands). We found that we could organize the papers into four themes determined by the impact of ED closures had on the following: 1) patient outcomes (eg, mortality, likelihood of acute myocardial infarction treatment) (n = 14); 2) equity-deserving populations (n = 6); 3) alternate EDs that remain open (n = 10); and 4) on healthcare networks as a whole, including emergency medical services (n = 5). Most of the papers were observational or quasi-experimental in design and drew data from a wide scale of closures, from single-site to national ED closures (> 500 sites). The largest proportion (40%) of studies were based in the U.S.
Conclusion: The literature demonstrated mixed and context-dependent impacts of ED closures. The ED closures consistently adversely affected mortality rates of patients with time-sensitive conditions when travel times or distances exceeded certain thresholds. Closures also disproportionately affected equity-deserving populations. However, the negative impacts were often mitigated in the long term, and were less pronounced in well-resourced systems capable of adaptation. There are key gaps in the literature regarding impacts on conditions that are not time sensitive, on marginalized populations, and on broader system-level performance, which should guide future research. [West J Emerg Med. 2026;27(4)899–912.]
INTRODUCTION
Emergency department (ED) closures, both temporary and permanent, have become increasingly common across many healthcare systems. These closures arise from complex, intersecting pressures that include staffing shortages, constrained hospital capacity, resource limitations, and surging patient demand.1–3 In 2023 alone, 868 temporary or permanent ED closures were reported across Ontario, Canada, with rural hospitals being disproportionately affected.4 Estimates of ED closures in the United Kingdom (UK) suggest that there was a net reduction of 8% in the number of operating EDs in the 10-year period leading up to 2012.5 Similarly, in the United States, the total number of hospital-based EDs decreased from 4,500 to 4,460 from 2005 to 2015, while ED visits per hospital-based ED grew uniformly by 28.6% across urban and rural areas.6 These ED closures often occur in regions with high-baseline healthcare needs and limited alternative access points.7 For emergency physicians, these closures are not abstract administrative events. They reshape patient flow, redistribute acuity across neighboring hospitals, and alter the geography of access to care.
Emergency departments serve as the health system’s front line for unscheduled, acute care, and they function as a critical safety net for patients requiring rapid evaluation, stabilization, and disposition.8 They play a particularly essential role for patients with time-sensitive conditions, defined in this review as clinical presentations in which delays in ED-based assessment, diagnostic testing, or definitive intervention are associated with increased morbidity or mortality. These include conditions requiring rapid triage and intervention (eg, trauma, stroke, sepsis, myocardial infarction), as well as urgent surgical or medical conditions where delays to disposition or intervention may meaningfully affect outcomes (eg, appendicitis, bowel obstruction). While the applicable time window for care varies by condition, ED closures may disrupt multiple stages of care delivery, including prehospital transport, triage, ED throughput, and access to definitive treatment, significantly impacting patient outcomes and broader health system performance.
Our aim in this review was to synthesize the existing literature on the impact of ED closures on health systems, patients, and the workforce, with a focus on outcomes that are directly influenced by disruptions in emergency care access and delivery. Specifically, we examine the following: direct patient health outcomes, including mortality, morbidity, and delays in time-sensitive care as measured by triage, treatment, disposition, or access to definitive intervention; impacts on equity-deserving populations, such as individuals experiencing homelessness and rural communities that disproportionately rely on EDs; spillover effects on nearby EDs and hospitals, including changes in patient volumes, acuity, and clinical resource strain; and system-wide consequences, including emergency medical services (EMS) transport times, interfacility transfers, and broader emergency care capacity.
By mapping the scope, methods, and findings of existing
studies, we sought to clarify how ED closures affect emergency care delivery and to identify critical knowledge gaps to inform future research and health system planning.
METHODS
Scoping Review
This review summarizes research findings and identifies research gaps in the current literature on the impacts of ED closures,9 following the Preferred Reporting Items for Systematic reviews and Meta-Analyses extension for Scoping Reviews checklist.10 We did not conduct a critical appraisal of the sources, as the studies included highly variable methods, making comparison difficult.
Eligibility Criteria
We applied the inclusion and exclusion criteria outlined in Table 1 to select papers. We included only those that focused on the effects of ED closures. We excluded a sizable body of literature regarding hospital closures because they were not specific to the effect of ED closures. All the studies took place within developed countries and were published after 2000. This cut-off was applied to capture contemporary evidence that is most relevant to current policy and practice contexts. We did not include the grey literature, as our focus was on peer-reviewed papers, allowing for a more methodologically robust synthesis of the evidence. Much of the grey literature includes news and policy articles—sources that do not provide clear methods and outcomes for thematic comparison.
Search Strategy
We are aware of only one previous academic review of ED closures: Chambers et al reviewed the effects of how changing individuals’ distance to the nearest ED due to an ED closure impacted patient mortality risk.11 The authors found inconsistent evidence that mortality is impacted when an ED is closed and patients must travel further for urgent or emergent care.11 Their review informed concept scoping but
Table 1. The inclusion and exclusion criteria used to screen for studies in a review on the effects of emergency department closures.
Inclusion criteria
Primary research
Published in English
Studies in developed countries
ED closures
Temporary and permanent ED closure
Focused on outcomes of closures
Exclusion criteria
Reviews
Study methodologies
Hospital closures
Urgent care closures
Trauma center closures
Ambulance diversions from EDs
Studies published before 2000
News and perspectives articles Focus on ED crowding (not in the context of closures) ED, emergency department.
our strategy was independently developed to extend to other aspects of healthcare beyond patient mortality.
We searched PubMed.gov, the Cumulative Index to Nursing and Allied Health Literature and Web of Science (WoS) databases to collect a list of primary research papers on our subject published January 1, 2000–May 31, 2025. These databases were selected as they provide comprehensive coverage of health services, allied health, and multidisciplinary research, while ensuring feasibility of screening. We used the search terms outlined in Figure S1 and subsequently combined them using the Boolean terms ‘OR’ and ‘AND.’ We also manually screened the references of all the included papers (backwards citation search) to capture additional studies that the databases may not have included. We then used WoS to search for all papers that cited this pool of papers (forward citation search) and screened those for relevant papers that did not appear in our initial search. For papers that were not available in the WoS database, their citations were compiled using Google Scholar. One reviewer conducted database searches; title/ abstract and full-text screening were performed independently in duplicate, with third-party adjudication for disagreements. (See “Selection Procedure”.)
Selection Procedure
Using the systematic review tool Covidence, two reviewers (ZR and HS) screened the titles and abstracts based on our inclusion/exclusion criteria. A third reviewer (AS) resolved conflicts and finalized the list of included papers. Review of the full text was then completed by two reviewers (ZR and AS), and the principal investigator (SS) confirmed the final selection of papers.
Extraction and Analysis of Data
Three reviewers (ZR, HS and AS) extracted data from the final list of 22 papers and organized the information into a table similar to Table S1. The extraction categories were created to provide a summary of each paper, collecting data on study design, purpose, methods, and results. We completed a thematic analysis of the extracted data to identify common concepts in the study outcomes. Themes were developed inductively from the extraction tables, double-coded by two reviewers, and refined through consensus meetings with the principal investigator, consistent with scoping review guidance on collating, summarizing, and reporting results.9 Each theme had a table listing associated papers and their key features, such as the method, population, intervention, and outcomes (Table 2-5). Three reviewers each received a set of papers to organize into the thematic tables independently. The principal investigator (SS) verified the tables.
RESULTS
Our search yielded 2,416 results that we deduplicated (691 duplicates removed), producing 1,725 studies to be screened by title and/or abstract. We removed 1,707 that were irrelevant or
fell under the exclusion criteria. We calculated the interreviewer agreement during title/abstract screening using the Cohen kappa, and it was deemed substantial (Cohen κ = 0.66). We completed a full-text review of 18 studies, subsequently excluding three papers. We completed a manual search of the references (backward citation search) of the remaining 15 studies and found four unique papers deemed relevant. We also completed a forward citation search, yielding six relevant papers. This process yielded a total of 22 unique studies that we included in this scoping review (Figure 1).
Figure 1. A PRISMA* diagrammatic analysis of the literature search conducted for a scoping review on the effects of emergeny department closures.
Solid line boxes denote papers that were included; dotted line boxes represent excluded papers.
*PRISMA, Preferred Reporting Items for Systematic Reviews and Meta-Analyses.
CINAHL, Cumulative Index to Nursing and Allied Health Literature.
Table 2. Review of papers included in theme 1: “Impact of emergency department closures on patient outcomes,” as part of a thematic analysis completed in a scoping review on the effects of emergency department closures.
Paper:
Author, Year Method Population Intervention Control/ comparison
Hsia and Shen, 2019
Retrospective observational study
Liu et al, 2014
Retrospective observational study
Patients with acute MI at bystander EDs in the U.S. from 2001–2013
ED closures and openings, as measured by increases in driving time
No change in driving time from bystander hospital and next nearest ED.
Park et al, 2024
Mustonen et al, 2017
Retrospective observational cohort study
Patients receiving care at hospitals near ED closures in California from 1999–2010
OHCA patients in Ulsan, South Korea
All ED closures in California 1999–2010
Patient admissions that were not impacted by an ED closure within a California Hospital Service Area
One ED closure in Ulsan, South Korea
Outcome Primary finding
30-day, 90-day and one-year mortality rates. 30-day all-cause readmission rates. Treatment patients received (fibrinolytic therapy vs PCI).
Inpatient mortality rates at hospitals near an ED closure.
Closures resulting in a driving time increase of ≥ 30 minutes led to increases in one-year mortality (2.39%) and 30-day readmission rates (2.00%). Inverse effects were found with ED openings with similar changes in driving time.
Admissions to hospitals near an ED closure had 5% higher odds of inpatient mortality when compared to admissions to unaffected hospitals.
Adult nontraumatic OHCA patients preclosure
Effect on survival outcomes of out-of-hospital cardiac arrest patients; effect on the EMS system
Closure of an ED did not significantly affect overall survival to hospital discharge.
Observational and quasiexperimental study (pre-post)
Hsia et al, 2012 Nonconcurrent cohort study
A Finnish municipality with a primarycare ED closure.
ED closure in Finland
Nearby area without an ED closure
Change in monthly visits to primary and secondary care EDs, office-hour clinics; monthly mortality
The use of ED services decreased in nearby areas by 25% following closure, with no corresponding increase in primary care usage or mortality.
Patients admitted to hospital for time-sensitive conditions in California (1999–2009)
Bogh et al, 2023
Pre-post populationbased cohort
All Danish adults with unplanned ED contacts in 2008 and 2016
Increased distance to nearest ED after closure
Patients with timesensitive conditions experiencing no change in distance to the ED.
Inpatient mortality due to time-sensitive conditions.
No association between small increases in distances to the nearest ED and inpatient mortality from time-sensitive conditions.
Centralization of EDs (reduction from 40 to 21 sites)
Municipalities with constant, lost, or never had EDs
Changes in ED travel distance, ED use, overall mortality, and AMI mortality
No association between ED closures resulting in greater travel distance and increased in-hospital mortality.
Avdic, 2016 Quasiexperimental observational study
Swedish residents < age 74 who experienced an AMI between 1990–2010
Increased distance to emergency care access after emergency hospital closure
Patients with no change in hospital distance – or a shorter travel distance postclosure – during the study period.
Post-AMI mortality
Changes in survival based on proximity to emergency hospitals
The probability of surviving an AMI decreases by 2% for every 10-km increase in driving distance in the first year following a closure, but this effect fades after one year.
Table 2. Continued
Paper:
Author, Year
Method Population Intervention
Shen and Hsia, 2016 Observational cohort study
Shen and Hsia, 2012 Quasiexperimental retrospective cohort study
1.35 million Medicare beneficiaries (U.S.) with acute MI from 2001– 2011 Permanent ED closures, resulting in increased driving time to the next available ED
1.49 million Medicare beneficiaries hospitalized with acute MI in the U.S. between 1996 and 2005 Increased driving time to the nearest ED due to a local ED closure
Lee et al, 2021 Cross-sectional study 94,360 patients presenting to 46 EDs in South Korea between January-April 2020
Knowles et al, 2019 Controlled interrupted timeseries analysis
Residents in 5 UK urban catchment areas
Control/ comparison Outcome Primary finding
No change in driving time to the nearest ED
No change in driving time (stable ED access throughout the study period)
30-day, 90-day, 1-year mortality
Flojstrup et al, 2023 Interrupted timeseries analysis
Patients with unplanned emergency contacts in Denmark between 2007–2016.
Temporary closure of 6 major EDs due to COVID-19 exposure
Periods with all EDs open
Closure/ downgrade of 5 EDs (2009–2011)
National ED reconfiguration (steppedwedge design)
5 matched control areas with no ED changes
Patients with a driving time increase of > 10 minutes to the nearest ED had a significant increase in mortality from AMI.
Changes in mortality Small increase in 30-day to 1-year mortality rates among patients experiencing a < 10-minute increase in driving time. Substantial increase in long-term mortality with a > 30-minute increase. Most of these effects are transitory and eventually disappear after four years.
Pre-hospital time, ICU admission, length of stay, inhospital mortality
Temporary closures led to an increase in inhospital mortality rates among emergency patients.
Ambulance incidents, ED attendances/ admissions, and case fatality ratios
No evidence that reorganization of emergency care was associated with increased population mortality.
Pre-reconfiguration period
In-hospital and 30-day mortality with subgroup analyses on selected diagnoses
Emergency care reconfiguration was not associated with an improvement in in-hospital mortality, and was associated with a slight slowing in previous improvements of 30day mortality
Shen and Hsia, 2016 National observational study
1.35 million Medicare beneficiaries with AMI from 2001–2011
Permanent ED closures leading to increased driving time to nearest ED.
ZIP codes with no change in ED access.
Access to cardiac technology (CCU, cath lab, CABG), treatments, and mortality (30-day, 90-day, year)
ED closures have substantial consequences on patient outcomes, especially for timesensitive conditions. Driving time increases of > 30 minutes led to a 90-day mortality increase of 6.58%.
Table 2. Continued
Paper:
Author, Year Method Population Intervention
Price et al., 2020 Retrospective service evaluation 52,439 unscheduled adult admissions in the UK from 2014–2017.
Centralization of 3 EDs into a single Emergency Care Hospital.
Control/ comparison Outcome Primary finding
Pre-centralization baseline year vs. Year 1 and Year 2 post-centralization
60-day mortality, probability of discharge per day, readmission, ED reattendance, length of stay
Centralization of emergency care resulted in decreased 60-day mortality, faster discharges, and fewer readmissions.
Our thematic analysis of the 22 included papers yielded four themes linked to ED closures: impacts on patient outcomes; equity-deserving populations; alternate hospitals that remained open; and broader healthcare networks (Tables 2-5). As we explored these themes, we purposely omitted a discussion on the background of each of the closures included (eg, the health system the ED was part of or demographics of the catchment area), unless they explicitly related to the theme, as a great deal of heterogeneity exists. This is mentioned as a limitation in our discussion.
Theme 1: Impact of Emergency Department Closures on Patient Outcomes (14 papers; Table 2)
This theme generated the largest body of relevant literature and encompassed two subtopics: 1) access to care, including changes in distance and travel time; and 2) clinical outcomes, such as effects on mortality and time-sensitive conditions. Some papers examined the consequences of a single ED closure or a handful of closures (< 10), while others investigated closures across an entire region or country.
Many papers investigated how patient outcomes were affected by changes in distance/time to the next-closest ED after an ED closure. Early work by Shen and Hsia found that increases of less than 10 minutes were linked to modest rises in 30-day to one-year acute myocardial infarction (AMI) mortality that faded after three years. However, when travel times increased by > 30 minutes, elevated mortality persisted long term.12 In a later study, these authors found that a minimum increase of 10 minutes in driving time raised mortality, both directly through treatment delays and indirectly through reduced access to care.13 Avdic found similar results for AMI patients, although this effect disappeared a year after closure.14 Hsia and Shen suggested that longer travel times (≥ 30 minutes) had stronger effects on mortality for patients with AMI, in a later study.15
Not all studies, however, found a consistent link between increased travel time and higher mortality. Hsia et al reported no change in mortality associated with increasing distance to the ED for patients with time-sensitive conditions, although
the majority of those patients experienced a travel increase of < one mile.16 Likewise, Knowles et al found no evidence that ED closure was associated with an increase in mortality when the median increase in travel time to the nearest ED after closure/downgrading was nine minutes.17 This suggests mortality rises only once travel delays exceed a threshold. Other research focused on all emergency patients. Liu et al found that admissions to hospitals near an ED closure had 5% higher odds of inpatient mortality when compared to admissions to unaffected hospitals.3 Lee et al explored temporary ED closures due to COVID-19 and found that these closures led to an increase in the in-hospital mortality rate of emergency patients (odds ratio of closure compared to non-closure group: 1.22 for nonEMS-use group and 1.23 for EMS-use group).18 By contrast, other work did not identify clear harm for the general patient population. The centralisation of EDs in the UK, which resulted in multiple ED closures, was associated with improved outcomes. Price et al reported lower 60-day mortality, particularly among older adults, following the creation of a high-volume specialized ED in England.19 In Denmark, Bogh et al found no association between ED closures and mortality, and Fløjstrup et al noted only a slight slowing of prior improvements in 30-day mortality trends after Danish ED reconfiguration.20,21 Overall, there do not appear to be consistent results regarding mortality of the general patient population post-ED closure.
Beyond mortality, several studies assessed access to specific treatments. Shen and Hsia found that communities facing travel time increases > 30 minutes had higher rates of immediate primary percutaneous transluminal coronary angioplasty (PTCA).12 Later work by the same authors showed that small increases in driving time, even those < 10 minutes, were linked to greater PTCA use once access to cardiac technology was controlled for.13 These findings have been interpreted as reflecting differences in severity of presentation, with patients who arrive later being sicker and more likely to require urgent intervention.12
Later studies found more complex patterns in treatment use. In 2019 Hsia and Shen examined the effects of ED
Table 3. Review of papers included in theme 2: “Effects of emergency department closures on equity-deserving populations,” as part of a thematic analysis completed in a scoping review on the effects of emergency department closures.
Paper:
Author, Year Method Population Intervention
Hansen et al, 2011
Before-andafter study with comparative analysis Residents of Morsø municipality (N = 21,000), 1997–2003
Gummerson et al, 2022
Shen and Hsia, 2012
Retrospective chart review Homeless patients at two Rhode Island, USA, EDs near a closed hospital
Quasiexperimental retrospective cohort study
Larsen et al, 2023
Shen and Hsia, 2010
1.49 million Medicare beneficiaries hospitalized with AMI in the USA between 1996– 2005
GIS-based population analysis Population of the province of Ontario, Canada.
Retrospective observational study Population of the continental U.S. 2001–2005
ED hours reduced and then full ED closure
ED closure
Control/ comparison Outcome Primary finding
Residents of neighboring municipalities in Viborg County
ED utilization pre-closure
Change in use of ED and other services (GP visits, telephone consults, hospitalizations) by sex and SES
Post-closure increase in ED visits by homeless patients; greater impact vs housed patients
Increased driving time to the nearest ED due to a local ED closure (< 10 minutes, 10-30 minutes, > 30 minutes increase)
Closure of 14 EDs in Ontario.
No change in driving time (stable ED access throughout the study period)
Travel time changes and mortality rates for rural communities
Modest reduction in women’s use of healthcare services following ED closure, with no significant changes among men.
Homeless patients were disproportionately affected by an ED closure, with an increase in homeless patients seeking care at alternate EDs.
Patients with the largest increase in travel time, and worse outcomes, were disproportionately from rural communities.
Changes in geographical access to EDs between 2001–2005 in the continental USA
Baseline (all EDs open)
Communities with no deterioration in access to the ED.
Population access within 30-, 45-, 60-min travel thresholds to nearest ED
ED access among rural communities, SES, and ethnic background
Rural communities had relatively more ED closures and less healthcare access overlap.
ED closures disproportionately affected travel times for rural populations (average increase of 26 minutes) than urban populations (average increase of 5 minutes). Areas with a high proportion of Hispanic individuals also had a higher risk of a decline in ED access.
Shen and Hsia, 2016
Observational difference-indifferences study
1.35 million Medicare beneficiaries with AMI from 2001–2011
Permanent ED closures leading to increased driving time to nearest ED.
ZIP codes with no change in ED access
Access to cardiac technology, and mortality measures in low-income populations.
Increases in driving time (>. 30 minutes) to nearest ED resulted in statistically significant increases in 90-day and 1-year mortality.
AMI, acute myocardial infarction; ED, emergency department; GIS, geographic information system; GP, general practitioner; SES, socioeconomic status.
closures on hospitals operating near capacity. They found that when a closure increased driving times by ≥ 30 minutes, the probability of receiving percutaneous coronary intervention (PCI) fell by just over two percentage points.15 Conversely, the opening of a new ED that reduced driving times by ≥ 30 minutes was associated with higher PCI rates.15 Just as with mortality, the effects of ED closures on treatment patterns appear inconsistent with some studies pointing to reduced
access, while others suggest increased intervention due to delayed presentation.
Theme 2: Effects of Emergency Department Closures on Equity-deserving Populations (6 papers; Table 3)
Within this theme, we classified papers into four subthemes: 1) effects on low-income regions; 2) sex
Table 4. Review of papers included in theme 3: “Impact of emergency department closures on alternate hospitals that are still open,” as part of a thematic analysis completed in a scoping review on the effects of emergency department closures.
Paper:
Author, Year Method
Hsia and Shen, 2019
Avdic, 2016
Retrospective observational study
Quasiexperimental observational study
Shen and Hsia, 2016
Observational cohort study
Population Intervention Control/ comparison Outcome Primary finding
Patients with AMI at all EDs with nearby ED closure/opening in the U.S. from 2001–2013
ED closures and ED openings
No change in driving time from bystander hospital and next nearest ED.
30-day, 90-day and oneyear mortality rates; 30day all-cause readmission rates; treatment patients received (fibrinolytic therapy vs PCI) at high-occupancy vs lowoccupancy hospitals
ED closures led to significant changes in health outcomes at nearby hospitals that already had high occupancy, many of which already had limited resources.
Shen and Hsia, 2012
Quasiexperimental retrospective cohort study
Swedish residents under age 74 who experienced an acute MI between 19902010
1.35 million Medicare beneficiaries (USA) with AMI from 2001 to 2011
1.49 million Medicare beneficiaries hospitalized with acute MI in the U.S. between 1996 and 2005
Melnick and Fonkych, 2009
Mixedmethods trend analysis
California acute-care hospitals with licensed EDs
Increased distance to emergency care access after emergency hospital closure
Permanent ED closures, resulting in increased driving time to the next available ED
Increased driving time to the nearest ED due to a local ED closure
Patients with no change in hospital distance during the study period.
No change in driving time to the nearest ED
Mortality post-AMI, and changes in survival based on proximity to emergency hospitals
Negative effects occur at nearby hospitals for approximately one year following closure.
30-day, 90-day, 1-year mortality
No change in driving time (stable ED access throughout the study period)
Statewide ED closures and capacity trends (1996–2007)
Time-series comparison of hospital ED supply vs population and ED visits
Changes in 30-day, 90day, 1-year mortality
Patients with a driving time increase of more than 10 minutes to the nearest ED had a significant increase in mortality from AMI.
The negative effects of ED closures on nearby hospitals tend to disappear after four years.
ED bed counts; number of operational EDs; ED visit volume; population size; hospital admission rate from ED; geographic access (travel distance); patient severity risk
The supply of ED beds in California grew despite the number of hospital-based EDs decreasing.
Melnick et al, 2004 Retrospective economic and capacity trend analysis
Knowles et al, 2019
Lynch et al, 2019
Controlled interrupted time series analysis
Interrupted time-series analysis
All acute care hospitals in California with EDs, 1990–2001
Residents in 5 UK urban catchment areas
All patients recorded as waiting for inpatient beds in four Irish regions (2005–2015)
Changes in ED capacity at hospital level over time
Closure/ downgrade of 5 EDs (2009–2011)
ED closures and reconfigurations
Time-based comparison within hospitals: 1990–1995 vs 1996–2001.
5 matched control areas with no ED changes
Pre- vs postclosure trends in trolley numbers (patients waiting for beds)
ED utilization trends; ED capacity; distance to nearest ED; financial outcomes
Ambulance incidents; ED attendances/admissions; and case fatality ratios
Regional ED trolley counts as an indicator of overcrowding/bed pressures
Remaining hospitals responded to nearby closures by adjusting their capacity to meet demand.
No statistically significant spillover effects on alternate EDs following a closure.
ED reconfigurations led to short-term increases in overcrowding that generally resolved within a year.
Table 4. Continued
Paper:
Author, Year Method Population Intervention Control/ comparison Outcome Primary finding
Mustonen et al, 2017
Observational quasiexperimental study
Bogh et al, 2023 Pre-post populationbased cohort study
Finnish patients in a municipality with ED closure.
ED closure in Finland. Nearby area without an ED closure.
Change in monthly visits to primary and secondary care EDs; office-hour clinics; monthly mortality
All Danish adults with unplanned ED contacts, 2008 vs 2016
Centralization of EDs (reduction from 40 to 21 sites)
Municipalities with constant, lost, or neverhad EDs
Changes in ED travel distance; ED use; overall mortality; and AMI mortality
No increase in office-hour visits and a decrease in total usage of primary care physician services in areas experiencing an increase in distance to the nearest ED.
No statistically significant spillover effects on alternate EDs following a closure.
differences in post-closure effects; 3) impacts on rural communities; and 4) impacts on individuals experiencing homelessness. Closures were found to disproportionately affect low-income and minority communities. Shen and Hsia found that low-income communities had a higher risk of a decline in ED access compared to high-income ones.22,23 Areas that had a high proportion of Hispanic individuals also had a higher risk of decline in ED access.22
Hansen et al highlighted sex differences in healthcare utilization after an ED decreased its hours and later closed.24 They found a modest reduction in women’s use of healthcare services, while there were no significant changes for men.24 There was a decline in women’s use of general practitioner services (telephone consults [P = .007], face-to-face visits [P = .020] and home visits [P = .009]) as well as a decrease in inpatient hospital utilization, after ED hours were reduced.24
Rural communities also faced unique challenges after an ED closure. Shen and Hsia found that there was an average increase in driving time of 26 minutes for individuals from rural communities compared to 5 minutes for people who lived in urban communities.22 Larsen et al. found that ED closures resulted in lower potential access to emergency care in rural communities in Ontario, Canada. These communities had more ED closures and less healthcare access overlap, making the impact of closures inequitably felt by these populations.25
Gummerson et al studied the effects of closing an ED on homeless patients’ use of the nearby EDs that remained open.26 They found that neighbouring EDs saw an increase in 15.46% of homeless patients vs 2.69% housed patients, demonstrating that homeless patients were disproportionately affected by this closure.26 This evidence suggests that ED closures exacerbate existing inequities, with the most severe consequences borne by marginalized populations, including low-income or minority communities, women, residents of rural areas, and individuals experiencing homelessness.
Theme 3: Impact of Emergency Department (ED) Closures on Alternate EDs that Remain Open (10 papers; Table 4)
Ten papers explored the effect of ED closures on nearby hospitals that remained open. We classified these papers into subthemes, including the following: 1) ED volumes and crowding; 2) staffing outcomes; 3) operational constraints; 4) financial impacts, and 5) healthcare utilization patterns. These studies tended to focus on the ability of these alternate ED sites to absorb patients who are diverted from a closed ED. They generally found short-term negative effects on nearby hospitals, followed by adaptations that limited these effects.
Emergency department closures led to a significant change in health outcomes at nearby hospitals that already had a high occupancy (increase of 2.39% in one-year mortality and 2.00% in 30-day readmission rates), but not at other bystander hospitals with lower occupancy.15 The largest effects occurred in communities with limited resources,15 such as crowded urban settings. These closures created adverse consequences across multiple dimensions of care. Patients who lost access to a closed ED and those seeking care at neighboring facilities were both affected, as closures at one site often led to crowding at others.12 Closures may also have an impact on patients’ use of alternate EDs that remain open. Mustonen et al found that areas that experienced an increase in distance to ED services after closure saw a decrease in ED services use by 25% (P < .001).27
However, Knowles et al and Bogh et al did not find similar spillover impacts in their studies of ED closures.17,21
These studies also focused on how the effects of ED closures change over time. Negative effects may be limited, as EDs seem to be able to mitigate negative outcomes in the long term. Adaptation seems to be key to these results. Melnick and Fonkych and Melnick et al demonstrated how California hospitals have successfully adapted to the closures of EDs in recent years.28,29 They showed that the supply of
Table 5. Review of papers included in theme 4: “Impacts of ED closures on healthcare networks”, as part of a thematic analysis completed in a scoping review on the effects of emergency department closures.
Paper:
Author, Year Method
Park et al, 2024
Retrospective observational cohort study
Population Intervention
OHCA patients in Ulsan, South Korea
Bogh et al, 2023
Melnick et a., 2004
Pre-post populationbased cohort study
Retrospective economic and capacity trend analysis
All Danish adults with unplanned ED contacts, 2008 vs 2016
All acute care hospitals in California with EDs, 1990–2001
One ED Closure in Ulsan, South Korea
Centralization of EDs (reduction from 40 to 21 sites)
Changes in ED capacity at hospital level over time
Control/ comparison
Adult nontraumatic OHCA patients pre-closure
Municipalities with constant, lost, or never had EDs
Time-based comparison within hospitals: 1990–1995 vs 1996–2001.
Outcome
Effect on survival outcomes of out-ofhospital cardiac arrest patients; effect on the EMS system
Changes in ED travel distance; ED use; overall mortality; and AMI mortality
ED utilization trends; ED capacity; distance to nearest ED; financial outcomes
Primary finding
EMS transport times were slightly prolonged near the site of the ED closure, but there were no substantial delays that impacted the entire EMS system.
Reductions in mortality occurred uniformly throughout the country following centralization, including in regions that experienced an ED closure.
Following ED closures, California hospitals readjusted capacity such that there were no significant reductions in access throughout the state.
El Sayed et al, 2012
Retrospective EMS database analysis
Price et al, 2020
Retrospective service evaluation
Patients visiting a Level I trauma center in Boston, MA (2006–2009)
Consolidation of two functional EDs into one (closure of one ED)
52,439 unscheduled adult admissions in the UK from 2014–2017.
Pre-ED closure baseline
Centralization of 3 EDs into a single emergency care hospital. Precentralization baseline year vs. Year 1 and Year 2 postcentralization
Ambulance turnaround time; patient volumes transported by EMS; waiting times for patients transported by EMS; waiting times for walk-in patients
60-day mortality, probability of discharge per day, readmission, ED reattendance, length of stay
The ED closure led to a statistically significant increase in EMS turnaround time despite overall ED volume decreasing significantly.
System-level benefits, including fewer readmissions and reduced ED reattendance, appeared two years after centralization.
ED, emergency department; EMS, emergency medical services; OHCA, out-of-hospital cardiac arrest; UK, United Kingdom.
ED beds in California has grown by 17%, which far outpaced population growth. This is despite the number of hospital-based EDs falling between 1996–2007.28,29 The counterbalancing force is that “remaining hospitals appear to have responded by adjusting their capacity to meet the growing demand for ED care.”28
Shen and Hsia also found that the negative effects of ED closures on nearby hospitals tended to disappear after four years as healthcare resources were redistributed.12 Avdic similarly found that negative effects at alternate hospitals are only statistically significant for approximately one year following a closure, and that eventually, “a well-functioning emergency medical service system may be able to offset the adverse quality effects [of a closure].”14 The ED reconfigurations in Ireland were also found to cause short-term increases in crowding that generally resolved within a year.30
Some papers observed the effects of ED closures on
patient-use patterns of nonED health services. Mustonen et a. observed no increase in the use of local office-hour services, and a decrease in the total use of primary care physician services in areas that experienced an increase in distance to ED services after ED closure.27 Knowles et al did not find consistent changes in urgent care attendance after ED closure. 17
Theme 4: Impacts of Emergency Department Closures on Healthcare Networks (5 papers; Table 5)
Five of the studies included in this review looked at the impact of ED closures on larger healthcare networks. These were grouped into the following subthemes: 1) regional planning changes; 2) system-wide access issues; 3) policy responses; and 4) costs to regional governments and networks. In response to nearby ED closures in California, hospitals effectively adjusted their ED capacity so that there were no
significant negative effects on emergency care throughout the region.28 Additionally, network effects were studied after national-level reconfigurations of emergency medical care that involved closing EDs. In the UK, following the centralisation of emergency care and the closure of certain EDs, Price et al reported system-level benefits, including fewer readmissions (P < .01) and reduced ED reattendance (P <.01) that appeared by the second year after reconfiguration occurred.19 Similarly, following a national reconfiguration of emergency care in Denmark that aimed to halve the number of EDs in the country, reductions in mortality occurred uniformly across the country, including regions where an ED closed and others where they stayed open.21
Closures also have an impact on other emergency services. El Sayed et al found that closing a major ED in Boston, MA, led to a statistically significant increase in the mean ambulance turnaround time (0.89 minutes [P = .02]) despite overall ED volume being significantly decreased.31 They noted that this increase was not clinically significant at the ED level, but that it may have been significant at the EMS-system level.31 In South Korea, Park et al found that although EMS transport times (5.8 [SD 5.0] to 6.7 [5.5] minutes [P < .001]) were prolonged for certain populations near a closed ED in South Korea, there were no substantial delays or impacts seen throughout the entire EMS system.32
DISCUSSION
This review identified several patterns across heterogeneous study designs and health system contexts. First, patient outcomes may be correlated with ED closures and changes in distance or time to an alternative ED, particularly for time-sensitive conditions such as AMI but effects on the general ED population remain inconsistent. Second, closures impact care patterns in complex ways; for cardiac interventions, reduced access decreases intervention rates while delayed presentation paradoxically increases them due to greater acuity. Third, closures can disproportionately affect access to care for equity-deserving populations, including homeless, rural, and low-income populations, all of which already grapple with existing barriers to care.33–35 Policymakers should be aware of these differential impacts and take measures to cushion the effects of closures for these at-risk populations.
Fourth, ED closures are associated with strain on alternate EDs. However, these effects are temporary, often lasting < 4 years as systems adapt through redistribution of resources. Effects vary by context, with well-resourced systems adapting better than already overstretched ones. Finally, national or regional reconfigurations of emergency care that involve ED closures do not appear to be associated with overall poor patient outcomes, and in some cases may even improve them. System-level restructuring can buffer against local harms, although effects on equity and frontline experience may still be significant.
Nevertheless, the interpretation of findings from this review is constrained by limitations that are common to the existing literature on ED closures. The only other previous academic review of ED closures that we identified in the literature was by Chambers et al, who noted several studies are at “relatively high risk of bias because of their observational design.” Indeed, most studies that we identified rely on observational designs using administrative data, with limited causal inference and high susceptibility to confounding variables such as staffing shortages, EMS reorganization, or hospital consolidation. Additionally, access to emergency medical care was most often measured as changes in travel time or distance, which may incompletely capture real-world barriers such as ambulance availability or patient decision-making.
Similar to our review, Chambers et al found inconsistent evidence that mortality is impacted when travel times change following an ED closure.11 However, the main strength of our scoping review is its thematic analysis that extends our understanding of the effects of ED closures beyond mortality data to broader system-level effects, including impacts on nearby alternate EDs and entire healthcare systems. Additionally, it highlights gaps in the literature to guide future research, and it informs policy discussions in regions considering reductions in service.
These results have critical policy implications for proposed ED closures. Changes in travel time for patients upon closure of an ED are often shown to have a threshold effect on patient outcomes. Therefore, policymakers should consider defining maximum travel benchmarks when considering closures and ensure alternate EDs are resourced immediately. While transitions seem to eventually return patient mortality to a baseline level, there are associated increases in mortality especially in less well-resourced hospitals and EDs. Incorporating stakeholder input in these resource-allocation processes may also improve transparency and equity.36
Gaps in the Literature
This review highlights significant gaps in the current literature. First, most evidence on ED closures is observational, limiting causal inference. Although randomization of ED closures is not feasible, stronger application of quasi-experimental methods, such as differencein-differences or regression discontinuity designs, would help establish more credible causal estimates of closure effects. Second, research is largely focused on mortality, with little insight into morbidity, patient experience, or outcomes for non-time-sensitive conditions that represent most ED visits. Including morbidity and other patient-centered outcomes would provide a more complete picture of closure impacts.
Third, evidence on vulnerable populations remains sparse. Evidence covers rural and homeless populations, but rarely LGBTQ, migrant, and racialized or indigenous groups that already face well-documented barriers to accessing care.37–39
Fourth, economic impacts of closures are poorly understood. Within our included studies, we did not identify quantitative evaluations of local economic effects (eg, healthcare costs) following ED closures. This omission is striking given that closure decisions are frequently made with cost-saving goals in mind. Without rigorous evidence on local economic consequences, policymakers lack the information needed to fully weigh the trade-offs.
The final notable gap concerns the role of alternative models of care. Although policymakers often justify ED closures on the assumption that patients can be redirected to urgent care centers, walk-in clinics, or tele-emergency services, the existing literature provides little evidence on whether such substitution occurs. The few studies that do examine use patterns post-closure suggest that patients do not reliably shift into primary care or other local alternatives, raising the possibility that some care is simply foregone or delayed. Future research should investigate whether alternative care models absorb demand following ED closures, and under what conditions they can serve as effective substitutes.
LIMITATIONS
This review has several limitations. Despite a comprehensive search of multiple databases, publication bias and missed studies remain possible. Excluding grey literature and non-English publications may limit generalizability. Also, the decision to exclude papers that broadly addressed hospital closures may have led to missed ED-specific data present in the articles. While our decision to include a broad set of EDs from different countries and healthcare systems (with articles detailing individual and nation-wide closures) was meant to provide a comprehensive summary of current research, this diversity also weakens the strength of our conclusions. Moreover, heterogeneity in methods and outcome reporting hindered cross-study comparison, causal inference, and a formal critical appraisal of the evidence base.
Additionally, we were unable to calculate an exact total number of unique ED closures represented across all studies. Our estimate is approximate, as several analyses drew from overlapping national datasets or reported aggregate closures without site-level detail. Our analysis was also primarily descriptive and thematic, without pooled quantitative analyses or meta-analytic techniques. This approach allowed us to capture a broad range of study contexts and outcomes but precluded statistical estimation of effect sizes or the identification of subtle associations that may emerge through quantitative synthesis. Finally, the dynamic and contextdependent nature of ED closures, which often occur alongside broader healthcare system changes, makes it difficult to isolate the direct impact of closures from other coexisting factors.
CONCLUSION
In this scoping review, we aimed to synthesize the
existing literature on the impacts of temporary and permanent ED closures on patient outcomes, equity, and health system performance. We found that ED closures have contextdependent effects. They are generally associated with worse outcomes for time-sensitive conditions when travel times exceed specifiable thresholds and disproportionately impact equity-deserving populations, including rural, low-income, and homeless communities. However, impacts on the general population and system-level mortality are mixed, with many health systems demonstrating adaptive abilities to mitigate harmful effects in the longer term, even when short-term harms can be common. Evidence on non-emergency conditions and economic outcomes remains limited. Next steps should focus on establishing evidence-based thresholds for acceptable travel distances post-closure and requiring mitigation and transition resources for affected communities. These frameworks are increasingly required at a time when the rate of ED closures is accelerating worldwide; otherwise, closure decisions will continue to be driven by fiscal pressures rather than population health needs.
Address for Correspondence: Zahra Ridha, BHSc, McMaster University, Michael D. DeGroote School of Medicine,1280 Main St W, Hamilton, ON L8S 4L8, Canada. Email: zahra.ridha@ medportal.ca.
Conflicts of Interest: By the WestJEM article submission agreement, all authors are required to disclose all affiliations, funding sources and financial or management relationships that could be perceived as potential sources of bias. No author has professional or financial relationships with any companies that are relevant to this study. There are no conflicts of interest or sources of funding to declare.
1. Beresford L. Emergency dept. closures plague Canada’s emergency medical care. 2024. Available at: https://www.acepnow.com/article/ emergency-dept-closures-plague-canadas-emergency-medical-care/. Accessed August 6, 2025.
2. Ireton J, Ouellet V. 2024 worst year for Ontario ER closures, CBC analysis finds. 2024. Available at: https://www.cbc.ca/news/canada/ ottawa/data-analysis-er-closures-three-years-2024-worst-year-forscheduled-closures-1.7396789. Accessed August 6, 2025.
3. Liu C, Srebotnjak T, Hsia RY. California emergency department closures are associated with increased inpatient mortality at nearby hospitals. Health Aff (Millwood). 2014;33(8):1323-1329.
4. Ontario Health Coalition. Release & report: number of Ontario
hospital emergency closures soars to new record: Health Coalition demands Ford government finally take action. 2023. Available at: https://www.ontariohealthcoalition.ca/index.php/report-releaseunprecedented-and-worsening-ontarios-local-hospital-closures-2023/. Accessed August 6, 2025.
5. Knowles E, Shephard N, Stone T, et al. Closing five emergency departments in England between 2009 and 2011: the closED controlled interrupted time-series analysis. 2018. Available at: https:// www.ncbi.nlm.nih.gov/books/NBK513752/. Accessed August 6, 2025.
6. Venkatesh AK, Janke A, Rothenberg C, et al. National trends in emergency department closures, mergers, and utilization, 2005–2015. PLoS ONE. 2021;16(5):e0251729.
7. Sun Y, Ha TH, Grant K. Explore the emergency room closures in your area with our interactive map. 2025. Available at: https://www. theglobeandmail.com/canada/article-emergency-rooms-closureshospitals-methodology-map/. Accessed August 6, 2025.
8. CADTH. Emergency department overcrowding in Canada. Can J Health Technol. 2023;3(11).
9. Arksey H, O’Malley L. Scoping studies: towards a methodological framework. Int J Soc Res Methodol. 2005;8(1):19-32.
10. Page MJ, McKenzie JE, Bossuyt PM, et al. The PRISMA 2020 statement: an updated guideline for reporting systematic reviews. BMJ. 2021;372:n71.
11. Chambers D, Cantrell A, Baxter S, et al. Effects of service changes affecting distance/time to access urgent and emergency care facilities on patient outcomes: a systematic review. BMC Med. 2020;18(1):117.
12. Shen YC, Hsia RY. Does decreased access to emergency departments affect patient outcomes? Analysis of acute myocardial infarction population 1996–2005. Health Serv Res. 2012;47(1 Pt 1):188-210.
13. Shen YC, Hsia RY. Association between emergency department closure and treatment, access, and health outcomes among patients with acute myocardial infarction. Circulation. 2016;134(20):1595-7.
14. Avdic D. Improving efficiency or impairing access? Health care consolidation and quality of care: evidence from emergency hospital closures in Sweden. J Health Econ. 2016;48:44-60.
15. Hsia RY, Shen YC. Emergency department closures and openings: spillover effects on patient outcomes in bystander hospitals. Health Aff (Millwood). 2019;38(9):1496-1498.
16. Hsia RY, Kanzaria HK, Srebotnjak T, et al. Is emergency department closure resulting in increased distance to the nearest emergency department associated with increased inpatient mortality? Ann Emerg Med. 2012;60(6):707-15.e4.
17. Knowles E, Shephard N, Stone T, et al. The impact of closing emergency departments on mortality in emergencies: an observational study. Emerg Med J. 2019;36(11):645-651.
18. Lee DE, Ro YS, Ryoo HW, et al. Impact of temporary closures of emergency departments during the COVID-19 outbreak on clinical outcomes for emergency patients in a metropolitan area. Am J Emerg Med. 2021;47:35-41.
19. Price C, McCarthy S, Bate A, et al. Impact of emergency care
centralisation on mortality and efficiency: a retrospective service evaluation. Emerg Med J. 2020;37(4):180-186.
20. Fløjstrup M, Bogh SBB, Bech M, et al. Mortality before and after reconfiguration of the Danish hospital-based emergency healthcare system: a nationwide interrupted time series analysis. BMJ Qual Saf. 2023;32(4):202-213.
21. Bogh SB, Harbak J, Fløjstrup M, et al. Centralization of emergency hospital care is not associated with increased in-hospital mortality: a population-based cohort study. Acute Med. 2023;22(1):4-11.
22. Shen YC, Hsia RY. Changes in emergency department access between 2001 and 2005 among general and vulnerable populations. Am J Public Health. 2010;100(8):1462-1469.
23. Shen YC, Hsia RY. Geographical distribution of emergency department closures and consequences on heart attack patients. 2016. Available at: https://www.nber.org/system/files/working_papers/ w22861/w22861.pdf. Accessed March 2025.
24. Hansen KS, Enemark U, Foldspang A. Health services use associated with emergency department closure. J Health Serv Res Policy. 2011;16(3):161-166.
25. Larsen K, Nolan B, Gomez D. A system in crisis: exploring how recent emergency department closures influence potential access to emergency care in Ontario. CJEM. 2023;25(3):218-223.
26. Gummerson S, Smith M, Warren O. Effect of an emergency department closure on homeless patients and adjacent hospitals. West J Emerg Med. 2022;23(3):368-374.
27. Mustonen K, Kantonen J, Kauppila T. The effect on patient flow in local health care services after closing a suburban primary care emergency department: a controlled longitudinal follow-up study. Scand J Trauma Resusc Emerg Med. 2017;25(1).
28. Melnick GA, Nawathe AC, Bamezai A, et al. Emergency department capacity and access in California, 1990–2001: an economic analysis. Health Aff (Millwood). 2004;Suppl Web Exclusives:W4-136-142.
29. Melnick G, Fonkych K. Is California’s hospital-based ED system eroding? 2009. Available at: https://www.chcf.org/wp-content/ uploads/2017/12/PDF-EDSystemCapacityDemand.pdf. Accessed March 2025.
30. Lynch B, Browne J, Buckley CM, et al. An interrupted time-series analysis of the impact of emergency department reconfiguration on regional emergency department trolley numbers in Ireland from 2005 to 2015. BMJ Open. 2019;9(9):e029261.
31. El Sayed M, Mitchell PM, White LF, et al. Impact of an emergency department closure on the local emergency medical services system. Prehosp Emerg Care. 2012;16(2):198-203.
32. Park SY, Kim SH, Choi B. Impact of an emergency department closure on out-of-hospital cardiac arrest survival and emergency medical service system in Ulsan, South Korea. Heliyon. 2024;10(20):e39506.
33. Centers for Disease Control and Prevention. About rural health. 2025. Available at: https://www.cdc.gov/rural-health/php/about/index. html. Accessed August 17, 2025.
34. Liu M, Hwang SW. Health care for homeless people. Nat Rev Dis
Primers. 2021;7(1):5.
35. Richards J, Kuhn R. Unsheltered homelessness and health: a literature review. AJPM Focus. 2022;2(1):100043.
36. Mitton C, Smith N, Peacock S, et al. Public participation in health care priority setting: a scoping review. Health Policy. 2009;91(3):219-228.
37. Allan B, Smylie J. First peoples, second class treatment: the role of racism in the health and well-being of Indigenous peoples in Canada. 2015. Available at: https://www.wellesleyinstitute.com/wp-content/
uploads/2015/02/Summary-First-Peoples-Second-Class-TreatmentFinal.pdf. Accessed August 6, 2025.
38. Bränström R, Hatzenbuehler ML, Pachankis JE. Sexual orientation disparities in physical health: age and gender effects in a populationbased study. Soc Psychiatry Psychiatr Epidemiol. 2016;51(2):289-301.
39. Norredam M, Nielsen SS, Krasnik A. Migrants’ utilization of somatic healthcare services in Europe—a systematic review. Eur J Public Health. 2010;20(5):555-563.
Initial Specimen Diversion Devices for Emergency Department Blood Cultures May Reduce Contamination Rates and Costs: Structured
Makayla D. Ayres, MD*†
Maria C. Johnson, MD*†
Megan E. Andersen, MD*†
Alyson P. Lewis, BS*†
Lucas S. Farrow, BS*†
Amelia M. Vopat, BS*†
Kathleen M. Spears, PhD*†
Literature Review
University of Missouri-Kansas City School of Medicine, St. Joseph, Missouri Mosaic Life Care, St. Joseph, Missouri
Section Editor: Anthony Rosania, MD, MHA, MSHI
Submission history: Submitted August 21, 2025; Revision received February 18, 2026; Accepted February 25, 2026
Electronically published July 16, 2026
Full text available through open access at http://escholarship.org/uc/uciem_westjem
DOI 10.5811/westjem.50723
Introduction: Emergency departments (ED) are a primary site of blood culture collection in the United States. High rates of blood culture contamination, commonly seen in EDs, are associated with diagnostic inaccuracy, unnecessary antibiotic use, and increased costs. In this structured literature review, we evaluated the effectiveness of initial specimen diversion devices (ISSDs), which are attached to the needle tip and discard the initial 0.15-1.5 mL of blood. We paid particular attention to their applicability in reducing blood culture contamination in adult ED patients in rural healthcare settings. The average cost of an ISDD is $15–$30, and this upfront cost creates a significant barrier in rural EDs, which face resource scarcity.
Methods: In this review of primary literature from 2021–2025, we evaluated the efficacy of ISDD in lowering blood culture contamination rates in adult patients in the ED. Our primary outcome was the change in contamination rates after introduction of the ISDD. Secondary outcomes included changes in vancomycin duration of therapy, hospital length of stay, and total hospital costs.
Results: We screened 460 records across PubMed, EBSCO, and Embase. Eight papers were selected for full review, from 10 hospital systems. All studies demonstrated a decrease in the rates of blood culture contamination with the ISDD. Contamination rates were reduced by an average of 2.89% across all 10 study locations. Only three of 10 hospitals (30%) achieved a blood culture contamination rate below 1%. One rural community hospital saw an absolute reduction of BCCs from 3.94% to 1.05%. Another study reported a decrease in total yearly hospital costs from $1,120,000 to $383,690, and another reported a 31.4% reduction in mean duration of vancomycin therapy.
Conclusion: This review shows the clinical value of ISDDs to reduce blood culture contamination, and highlights the need for further research into scalable implementation strategies, especially in resourceconstrained systems, like rural hospitals. [West J Emerg Med. 2026;27(4)913–919.]
INTRODUCTION
Blood culture contaminations contribute to healthcare waste and adverse patient outcomes including delayed targeted therapy, higher patient costs, and increased length of stay in the hospital.1 Following blood culture contamination, the patient often receives an unnecessary course of antibiotics.2 Depending on the route of administration, antibiotic courses may require the patient to remain in the hospital to receive treatment, putting them at higher risk for hospital-acquired infections that further compound length of stay.2 Additionally,
as the patient receives antibiotics for a blood culture contamination, they are at risk for medication side effects such as acute kidney injury and associated infection with Clostridium difficile 2
A cost analysis performed in 2019 at the University of Houston demonstrated an approximately $4,500 increase in hospital-associated costs for patients who had a contaminated blood culture sample while inpatient.3 The same study also identified increased length of stay by two days, attributable to blood culture contamination.3 A second study indicated an increase of hospital costs of up to approximately $5,800 due to such contamination.4 Because of the potential for adverse effects on patients, the Clinical Laboratory Standards Institute (CLSI) announced a new recommendation in 2022 to maintain blood culture contamination rates below 1%.5
A blood culture is contaminated if it demonstrates growth of bacteria known to colonize skin. Specific species considered to be contaminants vary based on institution but are widely accepted to be from the genuses Staphylococcus, Corynebacterium, and Micrococcus. In prior work we investigated protocol weaknesses that lead to blood culture contamination and proposed minimally invasive quality improvement (QI) measures to offset these effects. Educational campaigns were implemented to promote adherence to blood culture collection protocol, which demonstrated successful reduction of contamination in the short term.6 A limitation of this study and of other related QI initiatives exists in the sustainability of change, necessitating investigation into more sustainable interventions that bypass human error in the blood culture collection process.
Prior studies have proposed solutions to the nationally elevated rates of blood culture contamination through use of initial specimen diversion devices.2,7-13 These small, single-use devices siphon the first predetermined amount of blood from a blood culture sample to prevent contamination. The device attaches to the distal end of the blood draw needle and connects the circuit to the collection bottle with the intent of removing bacteria introduced into the sample through initial skin penetration. The central hypothesis of this device rests on the understanding that the initial aliquot of blood taken in a blood culture sample is most likely to contain skin surface contaminants.13
The average cost of a single device is $15–$30 based on manufacturer and distributor.1,3,10 Trials of initial specimen diversion devices have been reported over the past 15 years and demonstrate efficacy in reducing blood culture contamination at their respective institutions.14,15 Emergency departments (ED) are particularly inundated with elevated rates of blood culture contamination due to the fast-paced environment and sheer volume of samples taken when compared to other hospital departments.1 Furthermore, rural EDs face unique challenges regarding resource scarcity, underscoring the importance of implementing fail-safe devices
Population Health Research Capsule
What do we already know about this issue?
ED blood culture contamination increases costs, drives unnecessary antibiotics, and worsens patient outcomes. ISDDs show promise in reducing contamination.
What was the research question?
Do initial specimen diversion devices reduce blood culture contamination in adult ED patients, including in rural settings?
What was the major finding of the study?
Diversion devices lowered ED contamination rates by an average 2.89% across 10 hospitals, with some sites achieving <1%.
How does this improve population health?
Reducing contamination decreases unnecessary antibiotics, lowers hospital costs, and may especially benefit resource-limited rural EDs.
to reduce patient costs and optimize outcomes. Rural hospitals function on lower operating margins compared to urban hospitals (3.1% compared to 5.4%, respectively).16 Therefore, use of such devices in the ED of rural hospitals could confer great results in terms of offsetting cost and in patient outcomes as they relate to blood culture contamination. Our objective in this structured literature review was to assess the efficacy and generalizability of initial specimen diversion devices as they relate to utilization in EDs and their potential impact in rural settings.
METHODS
Search Criteria
We conducted a literature search via databases including PubMed, EBSCO, and Embase databases using the key terms “initial specimen diversion device” AND “blood culture” OR “blood culture contamination.” All studies published between 2021 to the present day were considered. We selected studies included in review and formal analysis based on the following criteria: primary research; publication after 2021 (in the post-pandemic era) reported outcomes related to blood culture contamination rates in adult patients in the ED; results with quantitative data; reported completion of initial specimen diversion devices trial, and conduction of the study within the United States. The 2020 Preferred Reporting Items for
Systematic Reviews and Meta-Analyses (PRISMA) guidelines were used to screen possible papers for inclusion. For this structured literature review, we defined the primary outcome measure as the change in blood culture contamination rate after implementation of an initial specimen diversion device. We also investigated the secondary outcomes of vancomycin duration of therapy, hospital length of stay, and total hospital costs.
Statistical Analysis
We used descriptive statistics, primarily through averages, to provide a summary of findings from each paper and the aggregate efficacy of the device trials. Linear regression was used to ascertain the significance between blood culture contamination reduction and device type. Statistical significance was determined with a P value < .05.
Cost Analysis
A study by Buzard et al (Hospital 2) included a cost analysis that compared total hospital cost in adult patients (≥ 18 years of age) undergoing blood culture collection in the ED before and after the implementation of an initial specimen diversion device to estimate potential cost savings.10 Total hospital costs include expenditures associated with antibiotic therapy, repeat cultures, length of stay, labor costs, and laboratory testing.
RESULTS
PRISMA Flow Diagram
We followed the 2020 PRISMA guidelines to determine inclusion of studies in this structured literature review (Figure 1). We identified 460 records on initial literature search. After screening records based on the inclusion criteria for this study, nine records were chosen for review. We excluded one record due to limitations in access, as only an abstract had been published. Eight records were included in the structured literature review comprising data from 10 individual institutions.
All studies reported reduction in rates of blood culture contamination after implementing initial specimen diversion devices. Details of each study included in the analysis are summarized in Table 1. Three of the eight studies included data from trials conducted at two separate sites, as denoted by 1a/b, 6a/b, and 7a/b. Trial periods ranged from 5–31 months. Each study included in this review was evaluated for conflicts of interest and funding sources. One study received the devices from Magnolia Medical Technologies, Inc, the manufacturer for the SteriPath initial specimen diversion devices, via a Cooperative Research and Development Agreement.11 A second study received funding from a grant through the U.S. Centers for Disease Control and Prevention’s Emory Prevention Epicenter Program.12 The remaining studies either received support via their parent hospital institutions,7,9 declared no conflicts of interest,2,8 or did not specify altogether.10
*Consider, if feasible to do so, reporting the number of records identified from each database or register searched total number
**If automation tools were used, indicate how many records were excluded by a human and how many were excluded automation tools.
Figure 1. PRISMA flow diagram for paper selection in a study on initial specimen diversion device effectiveness in the emergency department. ISDD, initial specimen diversion device; PRISMA, Preferred Reporting Items for Systematic reviews and Meta-Analyses.
Results by Contamination Reduction
Source: Page MJ, et al. BMJ 2021;372:n71. doi: 10.1136/bmj.n71.
This work is licensed under CC BY 4.0. To view a copy of this license, visit https://creativecommons.org/licenses/by/4.0/
Relative reductions in blood culture contamination rates ranged from approximately 21%–100% across study sites, with absolute reductions varying by study design and implementation context.2, 7-12 Arenas et al reported a 100% relative reduction in contamination rates after five months of Steripath use,8 indicating elimination of false-positive bacteremia diagnoses during the study period. Results from a second site in the same study using Kurin devices demonstrated a 93.88% relative reduction.8 Nielsen et al similarly reported an 89.55% relative reduction following six months of Steripath implementation.11
One large multi-year retrospective analysis demonstrated a sustained absolute decrease of 2.1% in blood culture contamination rates over 20 months.12 The only rural hospital included in this review achieved a 73% relative reduction in contamination rates and a post-intervention contamination rate of 1.05%.2 Across all 10 sites, the mean post-intervention contamination rate was 1.37%,2, 7-12 consistently below the national benchmark of 3%. The pooled average absolute decrease from baseline was 2.89%, with an average relative reduction of 64.16%.2,7-12 Three sites achieved post-intervention blood culture contamination rates below 1%.8,11
Results by Device Type
Five sites implemented Steripath initial specimen
Table 1. Itemized list of studies included in the review of the effectiveness of initial specimen diversion devices in the emergency department with relevant study details and results. All studies included in this review involved treatment of adult populations.
diversion devices and five implemented Kurin devices. Steripath-based studies demonstrated a greater average absolute reduction in blood culture contamination rates (3.59%)2,7,10-12 compared with Kurin-based studies (2.19%).2,8,9 Average relative reductions followed a similar pattern, with Steripath devices associated with a 74.57% relative reduction 2, 7, 10-12 and Kurin devices with a 53.74% relative reduction.2,8,9 These results were not statistically significant (Table 2).
Results by Length of Stay and Cost
Only one study, reported by Buzard et al (Hospital 2), analyzed the effect of initial specimen diversion devices on
length of hospital stay.10 They reported no significant difference in length of stay before and after implementing initial specimen diversion devices. However, they did report a significant reduction in total hospital cost from an average of $1,120,000 pre- to $383,690 post-device implementation.10 Cost savings from reduced blood culture contamination rates generally arise from avoiding downstream consequences that include unnecessary antibiotic use, repeat testing, additional procedures, and prolonged length of stay.3
Results by Antibiotic Usage
Three hospitals reported further data on vancomycin
Table 2. Results of blood culture contamination rate changes stratified by type of initial specimen diversion devices in a scoping review of device effectiveness in the emergency department.
Of note: dDfferences are not statistically significant.
usage after the implementation of initial specimen diversion devices. Buzard et al (Hospital 2) reported no significant change in vancomycin duration of use following implementation of the devices.10 Nielsen et al (Hospital 3), however, did report a significant decrease in vancomycin duration of therapy (DOT) during their study.11 They reported an 18.4% decrease in vancomycin DOT with the implementation of nucleic acid amplification testing for eight months prior to the initiation of the initial specimen diversion device trial. After implementation of the trial, they reported another 31.4% decrease in vancomycin DOT.11 Wilber et al (Hospital 5) reported an initial increase in vancomycin DOT of 1.1%, followed by a slow trend downward that averaged 0.9% per month over the course of their study.12
DISCUSSION
To the best of our knowledge, this is the first structured literature review of its type to aggregate data investigating the impact of using initial specimen diversion devices exclusively in EDs in the United States in the post-COVID-19 era. Blood cultures are the main tool to identify bacteremia in ED patients and guide further inpatient care. It is imperative to accurately identify causative agents quickly for the best patient outcomes. Blood culture contamination compromises patient safety, increases hospital waste, and increases patient and hospital cost. Based on the findings from this review, use of initial specimen diversion devices demonstrate success in the effective reduction of blood culture contamination rates in adult patients across EDs in 10 different hospitals.2,7-12 All hospital sites demonstrated significant reduction in contamination rates below the previously established goal of < 3%, but only three reported rates < 1% in accordance with the 2021 CLSI guidelines.2,5,7-12 While SteriPath devices demonstrated a greater decrease in contaminants in these studies, this work does not intend, nor have the power, to compare device manufactures. Both devices demonstrate meaningful decreases. Additionally, it is important to consider the study duration when assessing the efficacy of these devices to reach the new benchmark.
One study, conducted by Wilber et al, had a study period over one year but only demonstrated blood culture contamination relative rate reduction by 44.98%.12 The average study duration was 9.33 months.2,7-12 The three most successful studies, as defined by rates of post-initial specimen diversion devices contamination rates of < 1%, had an average study duration of eight months.7,11 Due to the relatively small number of included studies, we did not assess. duration of the study as an independent factor influencing the reduction of blood control contamination rates. Follow-up intervals and surveillance should be performed regularly to assess long-term efficacy as these devices become increasingly used in hospital systems.
While initial specimen diversion devices demonstrate
efficacy in reducing blood culture contamination rates, their applicability in rural settings requires deeper examination. The implementation of these devices in rural hospitals presents unique challenges as these facilities operate with limited budgets, fewer specialized staff, and constrained infrastructure. Rural hospitals struggle to justify the initial investment in initial specimen diversion devices even when long-term savings and improved patient care is evident. Studies suggest that successful implementation of new practices in rural settings depends on early stakeholder engagement, integration into existing workflows, and external funding support.17,18
Including rural leadership in planning and evaluation phases may enhance buy-in and sustainability. Despite these limitations, rural hospitals may stand to benefit the most from the use of initial specimen diversion devices due to their heightened vulnerability to the clinical and financial consequences of contaminated cultures. The only study conducted at a regional community hospital in a rural setting reported a 73.35% relative reduction and a 2.89% absolute reduction in blood culture contamination rates from their ED following initial specimen diversion devices implementation. The absence of any studies examining the implementation or impact of these devices in resource-limited rural settings is a significant limitation of the current literature.2 Additionally, Buzzard et al discuss that hospitals without rapid diagnostic testing may derive greater benefit from initial specimen diversion devices when compared to hospitals with rapid diagnostic testing for blood culture processing.10 In the authors’ experience, it seems rural hospitals function more often without rapid diagnostic testing.
Previous research done by the authors of this review demonstrated marginal improvement of blood culture contamination rates through implementation of educational initiatives alone for healthcare professionals obtaining blood culture samples.6 While this has not been directly tested by these authors, it is reasonable to assume that educational initiatives and initial specimen diversion devices, when used in tandem, would further reduce contamination rates in EDs. Sautter et al conducted a systematic review comparing a variety of interventions including initial specimen diversion devices, phlebotomy teams, and educational/training initiatives.19 This group reports that regardless of the intervention, high-intensity education and training of staff is more strongly associated with a decrease in blood culture contamination rates than any intervention alone.19 Other initiatives such as education on correct blood draw protocol, the use of nucleic acid amplification test for most common causes of sepsis, and specific blood draw teams could help improve contamination rates when coupled with the use of initial specimen diversion devices.1,11 Further research should investigate the role of multiple modalities to address human error and educational gaps as causative agents for high rates of
Figure 2. Pre- and post-study blood culture contamination rate change by study site reported in a review of the effectiveness of initial specimen diversion devices in the emergency department. ISDD, initial specimen diversion device; BCC, blood culture contamination.
blood culture contamination.
Implementation of initial specimen diversion devices was also found to be associated with decreased vancomycin use at three hospital sites.8,11 Antibiotic stewardship is critical to prevent antibiotic resistance. Fewer days of vancomycin use prevents resistance to these potent broad-spectrum antibiotics. However, use of initial specimen diversion devices and reduced blood culture contamination rates were not associated with reduced length of stay for patients.10 Length of stay was analyzed by only one study.10 Future studies should investigate how blood culture contamination rates and repeat blood culture draws influence vancomycin use, DOT, and length of stay. With these metrics, cost should also be considered to further quantify the financial burden of blood culture contamination rates on both patients and hospital systems. While initial specimen diversion devices are shown to reduce contamination rates in EDs, more studies of a similar design are needed to analytically demonstrate the efficacy of these devices as a standard of patient care. A 2023 systematic review by Mohajer and Lasco evaluated the efficacy of both brand-name initial specimen diversion devices mentioned earlier, as well as an open technique that requires manual disposal of the first 1 mL of blood taken after collection across multiple hospital departments.15 While their results demonstrated significant improvement in blood culture contamination rates with the implementation of initial specimen diversion devices, their study failed to demonstrate a ubiquitous sample of studies reaching contamination rates < 1%.15 Callado et al also performed a systematic review of initial specimen diversion devices between 2013–2023 and performed a meta-analysis of three homogenous studies within their study selection.14 The results of their meta-analysis suggest a significant reduction in blood culture contamination
rates through use of initial specimen diversion devices but no reduction in the detection of true infection in those samples.14
LIMITATIONS
A common limitation described by Mohajer et al and Callado et al lies in the study design and controls for these prospective studies.14,15 The heterogeneity of the studies encouraged the use of the structured literature review format within this study team, rather than a systematic literature review approach. This review’s specific analysis is limited by the selection criteria in terms of publication date and inclusion of U.S.-only studies. The initial goal was to analyze the effectiveness of initial specimen diversion devices in adult patients in rural EDs; however, only one study met the criteria. This was a regional community hospital in a rural area and likely does not represent resource-limited settings such as critical access hospitals. An expanded search subsequently included diverse populations but kept the focus on these devices implemented in EDs while addressing the potential benefit of implementation in rural hospitals. The availability of data concerning washout periods was limited. Only one study specified the inclusion of a wash-out period, which occurred for an undefined amount of time between the period of initial specimen diversion devices use and standard equipment use.8 The blood culture contamination rate during this washout period was not reported.
Rural EDs have specific and unique needs within the U.S. healthcare system. Future studies should consider the implementation of initial specimen diversion devices in under-resourced rural EDs to characterize the impact of these devices in these communities, including cost implications. The general cost per device ranges between $15-$30, depending on the brand and model, which may create a significant obstacle to resource-limited hospitals.1,3,10 A diversion device priced at $20 per unit would yield an estimated cost of $20,000 for every 1,000 blood culture draws. Despite evidence that diversion devices reduce the roughly $4,500-$5,800 in additional costs incurred per contaminated blood culture, the required upfront expenditure of approximately $20,000 constitutes a significant barrier for hospitals operating with constrained resources.3,4
CONCLUSION
Results of eight independent analyses of the use of initial specimen diversion devices demonstrate a significant reduction in blood culture contamination rates in adult patients in hospital emergency departments, with associated benefits such as lower costs of care and a shorter duration of antibiotic therapy. While one study is not sufficient to draw conclusions, we hope future researchers explore funding opportunities and stakeholder engagement strategies, as well as assess the long-term impact of using initial specimen diversion devices in rural EDs. Further work is needed to develop scalable
models for implementation and consistent results of blood culture contamination rates < 1%.
ACKNOWLEDGMENTS
We would like to recognize Priya Patel, MD, and Ashley Ayers, MD, for initiating a blood culture contamination reduction project that sparked the creation of this project. We would also like to thank Thomas Ayres, PhD, for his guidance on structured literature review methodology and best practices.
Address for Correspondence: Makayla D. Ayers, MD, Wright Patterson Medical Center, General Surgery, 4881 Sugar Maple Drive, Wright-Patterson AFB, OH 45433. Email: makayla.d.ayres@gmail.com.
Conflicts of Interest: By the WestJEM article submission agreement, all authors are required to disclose all affiliations, funding sources and financial or management relationships that could be perceived as potential sources of bias. This project was supported by the Health Resources and Services Administration (HRSA) of the U.S. Department of Health and Human Services (HHS) as part of an award totaling $4 million T99HP52109 with 10% financed with non-governmental sources. The contents are those of the authors and do not necessarily represent the official views of, nor an endorsement, by HRSA, HHS, or the U.S. Government. There are no conflicts of interest to declare.
1. Marcelino C, Shepard J. Quality improvement initiative on reducing blood culture contamination in the emergency department. J Emerg Nurs. 2023;49(2):162-71.
2. Povroznik MD. Initial specimen diversion device utilization mitigates blood culture contamination across regional community hospital and acute care facility. Am J Med Qual. 2022;37(5):405-12.
3. Skoglund E, Dempsey CJ, Chen H, et al. Estimated clinical and economic impact through use of a novel blood collection device to reduce blood culture contamination in the emergency department: a cost-benefit analysis. J Clin Microbiol. 2019;57(1):e01015-18.
4. Dempsey C, Skoglund E, Muldrew KL, et al. Economic health care costs of blood culture contamination: a systematic review. Am J Infect Control. 2019;47(8):963-67.
5. Clinical and Laboratory Standards Institute. Principles and Procedures for Blood Cultures; 2nd ed. 2022. CLSI Document M47-E2. Clinical and Laboratory Standards Institute.
6. Patel P, Ayers A, Johnson M, et al. Decreasing blood culture contamination rates in a rural emergency department: a quality improvement initiative. BMJ Open Qual. 2025;14(3):e003144.
7. Arenas M, Boseman GM, Coppin JD, et al. Asynchronous testing of 2 specimen-diversion devices to reduce blood culture contamination: a single-site product supply quality improvement project. J Emerg Nurs 2021;47(2):256.
8. Arnaout S, Ellison RT, Greenough TC, et al. Prospective trial of a passive diversion device to reduce blood culture contamination. Open Forum Infect Dis. 2021;8(Suppl 1):S70.
9. Burnie J, Vining S. Clinical nurse specialist practice: impact on emergency department blood culture contamination. Clin Nurse Spec. 2021;35(6):314-17.
10. Buzard BA, Evans P, Schroeder T. Evaluation of an initial specimen diversion device (ISDD) on rates of blood culture contamination in the emergency department. Kans J Med. 2021;14(1):73-76.
11. Nielsen LE, Nguyen K, Wahl CK, et al. Initial specimen diversion device reduces blood culture contamination and vancomycin use in academic medical centre. J Hosp Infect. 2022;120:127-33.
12. Wilber EP, Babiker A, Howard-Anderson J, et al. Effect of an initial specimen diversion device on blood-culture contamination rates and vancomycin usage: a quasi-experimental study. Infect Control Hosp Epidemiol. 2024;45(1):100-102.
13. Rupp ME, Cavalieri RJ, Marolf C, et al. Reduction in blood culture contamination through use of initial specimen diversion device. Clin Infect Dis. 2017;65(2):201-205.
14. Callado GY, Lin V, Thottacherry E, et al. Diagnostic stewardship: a systematic review and meta-analysis of blood collection diversion devices used to reduce blood culture contamination and improve the accuracy of diagnosis in clinical settings. Open Forum Infect Dis 2023;10(9):1-10.
15. Al Mohajer M, Lasco T. The impact of initial specimen diversion systems on blood culture contamination. Open Forum Infect Dis 2023;10(5):ofad182.
16. Levinson Z, Godwin J, Neuman T. Hospital margins rebounded in 2023, but rural hospitals and those with high Medicaid shares were struggling more than others. Health Costs. 2024.
17. Chapman A, Buccheri A, Mohotti D, et al. Staff-reported barriers and facilitators to the implementation of healthcare interventions within regional and rural areas: a rapid review. BMC Health Serv Res 2025;25:331.
18. Greenwood-Ericksen MB, D’Andrea S, Findley S. Transforming the rural health care paradigm. JAMA Health Forum. 2020;1(9):e200987. Available at: https://jamanetwork.com/journals/jama-health-forum/ fullarticle/2770355. Accessed June 20, 2025.
19. Sautter RL, Parrott JS, Nachamkin I, et al. American society for microbiology evidence-based laboratory medicine practice guidelines to reduce blood culture contamination rates: a systematic review and meta-analysis. Clin Microbiol Rev. 2024;37:e00087-24.
Clinical Characteristics of an Emergency Department-led Asynchronous Care Platform
Shivam Shah, MD, MSc*
Ikaasa Suri, BS†
Helen Gordan, BS†
Nicole Schwartz, MD, MPH*
Rubayet Hossain, MD*
Donald Apakama, MD, MS*‡§||#¶
Rishi Khakhkhar, MD, MBA*
Taylor Marren, PA-C*
Benjamin S. Abella, MD, MPhil*
Nicholas Gavin, MD, MBA, MS*
Ethan E. Abbott, DO, MSCR*‡§||#¶
Section Editor: Laura Walker, MD
Icahn School of Medicine at Mount Sinai, Department of Emergency Medicine, New York, New York
Icahn School of Medicine at Mount Sinai, New York, New York
Icahn School of Medicine at Mount Sinai, Department of Population Health Science and Policy, New York, New York
Icahn School of Medicine at Mount Sinai, Institute for Health Equity Research, New York, New York
Icahn School of Medicine at Mount Sinai, Windreich Department of Artificial Intelligence and Human Health, New York, New York
Mount Sinai Icahn School of Medicine at Mount Sinai, The Hasso Plattner Institute for Digital Health, New York, New York
Icahn School of Medicine at Mount Sinai, Charles Bronfman Institute for Personalized Medicine, New York, New York
Submission history: Submitted October 30, 2025; Revision received February 20, 2026; Accepted February 20, 2026
Electronically published June 28, 2026
Full text available through open access at http://escholarship.org/uc/uciem_westjem DOI 10.5811/westjem.53265
Background: Asynchronous care has emerged as a promising approach to improving healthcare accessibility while potentially reducing costs, particularly for low-acuity conditions. Our objective was to describe the use patterns, patient characteristics, and short-term clinical outcomes of an emergency department (ED)–led asynchronous care platform managing low-acuity conditions in a large, academic health system.
Methods: We conducted a retrospective cohort study evaluating the Mount Sinai Health System asynchronous care platform for managing urinary tract infections, conjunctivitis, cold sores, vaginal candidiasis, emergency contraception, and oral contraceptive prescriptions between December 2023–October 2024 during an initial rollout period. Individual charts were reviewed by two trained abstractors and two emergency physicians. The primary outcome was any subsequent ED or clinic visit within seven days. Secondary outcomes included change in diagnosis and medication at relevant follow-up visits. We used descriptive statistics to characterize the cohort and outcomes.
Results: During the study period, there were 19,204 ED encounters for conditions matching asynchronous care chief complaint categories, of which 343 encounters (1.8%) from 277 unique patients were managed via the asynchronous care platform. The median patient age was 32.6 years (interquartile range IQR 28.3–41.2), and 258 (93.1%) were female. Overall chief complaints included cystitis/urinary complaints in 157 (45.8%) encounters, conjunctivitis/eye complaints in 57 (16.6%), and vaginal/vulvar candidiasis in 96 (28.0%). At the encounter level, 18 (5.2%) were up-triaged from the asynchronous care platform to synchronous virtual urgent care or in-person evaluation after initial screening. We observed the primary outcome of a subsequent ED or clinic visit within seven days in 68 patients (24.5%). Five patients (1.5%; 95% CI, 0.5-3.5%) were identified with a change in diagnosis within the seven-day outcome window, with all diagnostic changes occurring within 1-3 days of the index asynchronous care encounter (median one day).
Conclusion: In this single-center study, an asynchronous care platform demonstrated a viable pathway for managing select low-acuity conditions in an urban academic health system. This structured platform, with appropriate triage pathways and low rates of diagnostic discordance, shows promise as a model to expand access to care for select low-acuity complaints. [West J Emerg Med. 2026;27(4)920–929.]
INTRODUCTION
The rapid expansion of digital health solutions has reshaped the delivery of healthcare, particularly for ambulatory and emergency care settings. Asynchronous care, a model in which patients and clinicians exchange health information remotely without real-time face-to-face interaction, has emerged as a promising approach to improving accessibility while potentially reducing healthcare costs or emergency department (ED) visits.1 This model allows patients to submit structured, symptombased questionnaires or messages electronically that are rapidly reviewed by a clinician who provides a diagnosis, management plan, or triage decision. Asynchronous care differs from traditional telehealth visits by eliminating the need for synchronous audio or video interactions, offering increased flexibility and efficiency for both patients and clinicians.
The adoption of telemedicine more broadly has been accelerated by the growing burden on EDs and primary care clinics, particularly in the wake of the COVID-19 pandemic.2 Prior research has evaluated this surge in synchronous virtual care platforms, demonstrating that live virtual visits can effectively manage a range of low-acuity conditions while reducing ED visits and healthcare expenditures.3,4 However, within the context of a healthcare system where patients still face barriers to accessing care, asynchronous care offers even greater advantages over synchronous telehealth by eliminating the need for real-time scheduling, prolonged wait times, allowing clinicians to efficiently manage a higher volume of low-acuity cases without disrupting workflow, and affording patients with time constraints or limited broadband connectivity greater flexibility.
Recent evidence has begun to address the safety and efficacy gap for asynchronous care. Reed et al evaluated 24,584 encounters for urinary tract infections (UTI) and conjunctivitis across asynchronous e-visits, telephone visits, and video visits within Kaiser Permanente Northern California.5 They found that 69.1% of UTI visits were completed via asynchronous e-visits with comparable sevenday follow-up rates across all modalities (9.0% for e-visits versus 8.8% for telephone and 9.0% for video), and ED visits remained rare (< 1%) with no significant differences between visit types. However, given its novelty, the safety and efficacy of asynchronous care, particularly for common lower acuity complaints, remain less well understood. Key concerns still include diagnostic accuracy, appropriate triage decisions, and potential gaps in follow-up care.
Early evaluations of asynchronous care have shown promising results in managing lower-risk conditions, such as UTIs, conjunctivitis, and dermatologic complaints. 6 Prior research evaluating an asynchronous telemedicine platform for uncomplicated UTIs found that antibiotic prescribing patterns were consistent with guideline-based care and that patient satisfaction was high. 7 In the Kaiser study, the authors found that antibiotic prescribing patterns were consistent with
Population Health Research Capsule
What do we already know about this issue?
Asynchronous care platforms can manage lowacuity conditions like UTIs and conjunctivitis, but safety data from ED-led models remain limited.
What was the research question?
Is an ED-led asynchronous care platform safe and feasible for managing low-acuity conditions?
What was the major finding of the study?
Of 343 encounters, 1.5% (95% CI, 0.5-3.5%) had diagnostic changes within 7 days; 0.7% had unrelated ED returns.
How does this improve population health?
ED-led asynchronous care could safely expand access to care for low-acuity conditions, potentially reducing ED burden and improving healthcare accessibility.
guideline-based care, with 90.7% of UTI e-visit patients receiving antibiotics (reflecting the structured selection of uncomplicated cases) and appropriate variation for conjunctivitis cases. 5 Similarly, an evaluation of asynchronous dermatology consultations demonstrated reduced wait times and high diagnostic concordance with in-person assessments.8 These findings suggest that asynchronous care may be a viable and potentially scalable model for specific clinical scenarios. However, concerns persist regarding the potential for misdiagnosis, the adequacy of follow-up care, and the need for escalation to in-person visits.
While prior asynchronous care platform implementations have predominately been led by primary care, to our knowledge this represents a novel approach to asynchronous care delivery with an emergency medicine infrastructure. This ED-led model was selected as the asynchronous care platform is part of a broader digital health portfolio within the Department of Emergency Medicine at Mount Sinai Health System (MSHS), which also includes on-demand virtual urgent care. This existing infrastructure provided a natural foundation for asynchronous care integration, as emergency physicians and physician assistants (PA) already staffed virtual care workflows and are trained in the rapid evaluation of acute, undifferentiated complaints well-suited to the structured, algorithm-driven nature of asynchronous care. This distinction is important as an ED-led asynchronous care model potentially differs from primary care-led models across its
Clinical Characteristics of an ED-led Asynchronous Care Platform
integration with emergency triage pathways, ED staffing models, and the potential to divert low-acuity patients from ED visits.
In this descriptive study we sought to examine the use patterns and clinical characteristics of a Department of Emergency Medicine (EM)-led asynchronous care platform during its first year of rollout. The specific objectives were to evaluate feasibility, safety, and clinical outcomes of this ED-led asynchronous care platform by examining rates of up-triage, subsequent visits, and changes in diagnosis, to determine whether asynchronous care managed by emergency physicians and physician assistants can serve as a safe and efficient option for low-acuity conditions in an academic setting.
METHODS
Study Design and Setting
We conducted a retrospective cohort study evaluating the asynchronous care platform offered by MSHS, a multisite academic medical center in New York City. This model was developed by the ED to manage visits due to limited access or convenience and was part of a broader digital health initiative by system leadership. This platform is led and staffed by emergency physicians and PAs at MSHS. This model of care is also set up so PAs and emergency physicians are able cross-cover a virtual urgent care system (on-demand video visits for acute, unscheduled care) while also evaluating asynchronous care visits.
In December 2023, MSHS implemented an asynchronous care platform to manage a limited set of chief complaints, including female dysuria, vaginal discharge, and eye redness. In September/October 2024 emergency contraception and birth control prescriptions were added. The platform is marketed to existing MSHS patients through online web banners, portal messages, and hospital marketing. The MSHS serves a diverse patient population through an extensive network of hospitals, ambulatory practices, and specialty institutes located throughout the New York City metropolitan area. In this study we examined electronic health records (EHR) from patients who received an asynchronous online care visit between December 10, 2023– October 21, 2024, which was the initial rollout period.
Asynchronous Care Platform Design and User Interface
To access the platform, adult patients in the MSHS network can opt for “Message Only Care,” which selects the AC option in their online care portal through Epic’s MyChart (Epic Systems Corporation, Verona, WI), which serves as the EHR for the health system. Patients are prompted to complete a condition-specific questionnaire with automated branching logic tailored to their presenting symptoms (Figure 1). The program provides care for a limited set of predefined chief complaints, including UTI, yeast infection, red eye, cold sore,
birth control requests, and emergency contraception. Patients who select a chief complaint outside this restricted list are automatically directed to either a video visit or in-person care. Male patients are eligible for treatment of red eye or cold-sore complaints only.
For supported chief complaints, the branching logic incorporates structured screening for predefined high-risk clinical features. Endorsement of any red flag response is automatically highlighted for clinician review and prompts consideration of escalation of care. Specifically, for red eye complaints, high-risk responses include vision loss, double vision, severe eye pain, fever ≥ 101 °F, recent ocular trauma, history of serious eye injury, or autoimmune disease with potential ocular involvement. For UTI evaluations, red flags include fever ≥ 101 °F, flank pain, vomiting, known kidney disease, recent urologic procedure, or inability to void. For suspected vulvovaginal candidiasis, red flag criteria include fever, pelvic or abdominal pain, new sexual partner, possible sexually transmitted infection exposure, or severe or atypical vaginal discharge. Patients who screen as high risk, or for whom asynchronous management is deemed inappropriate upon clinician review, are candidates to be up-triaged to virtual urgent care for real-time video evaluation or directed to in-person care as clinically indicated and at the discretion of the treating clinician.
All electronic submissions are then reviewed by emergency physicians or PAs, who confirm the chief
Figure 1. Screening questionnaire for patients with urinary tract infection symptoms in a study describing the use patterns, patient characteristics, and short-term clinical outcomes of an emergency department–led asynchronous care platform managing low-acuity conditions.
complaint, assess questionnaire responses, and determine the appropriate management plan. Medication prescriptions are selected from a prepopulated, condition-specific list embedded within the asynchronous care platform. Laboratory testing, including urinalysis and urine culture, may be ordered at the discretion of the reviewing clinician. When a visit is uptriaged, it is designated as non-billable and patients are directed to a higher level of care using a standardized communication workflow. At present, the asynchronous care platform operates for patients in New York State and Florida from Monday–Friday 8:30 am – 8:30 pm and Saturday through Sunday 9 am – 5 pm.
Study Cohort Identification
For this study, adult patients met inclusion if they initiated an asynchronous care visit during the study period through the patient portal. Patients opted into the asynchronous care platform on their own initiative and were not enrolled by ED staff during an ED visit. Patients initiated an asynchronous care visit with a chief complaint of UTI, yeast infection, cold sore, red eye, or request for oral contraceptives or emergency contraceptives prescription. Patients were identified by an MSHS EHR query and filtered for only those who initiated asynchronous care. Within the health system an asynchronous care visit generates a unique patient numerical identifier that is distinct from other types of visits, allowing for capture of this population with high accuracy.
We included all patients who initiated an asynchronous care visit during the rollout period, representing a complete census of the eligible population rather than a sampled subset. Because of this, a formal sample size calculation was not performed, and inclusion was limited to adult patients who initiated an asynchronous care visit with a supported chief complaint during the study period (December 2023–October 2024). We excluded patients who canceled their asynchronous care appointment or whose chief complaint was not supported by the platform. Those who were screened on the asynchronous care platform and subsequently uptriaged to telehealth or referred to the ED or outpatient clinic were included in the initial cohort. As this is a descriptive study without comparative or multivariable analyses, we did not employ methods for handling formal missing data. Where diagnosis or medication data were unavailable, fields were recorded as “unknown.”
Covariates and Data Abstraction
We collected demographic information (age, sex) and asynchronous visit information (chief complaint, final diagnosis, visit duration, prescribed medications). We identified the following comorbidities using International Classification of Diseases ICD-10 codes: asthma; hyperlipidemia; hypertension; diabetes mellitus; and coronary artery disease. Two trained abstractors initially reviewed and
screened all asynchronous care visits in the cohort to ascertain whether patients were referred to the ED or follow-up visits within a seven-day period to the ED and clinics for related chief complaints. The index asynchronous care visit date and time was recorded as day 0. For relevant visits within prespecified interval follow-up visit, we captured final or change in diagnosis, and medications prescribed. To accomplish this, unstructured clinical narratives were reviewed and abstracted from the EHR for all patients in the cohort. This information was confirmed by a third reviewer who was an emergency physician. In equivocal cases, another emergency physician reviewed the data to make the final determination.
The follow-up visits were carefully reviewed to ascertain whether the visit was relevant to the index asynchronous care or it represented a routine/scheduled follow-up or unrelated visit for another chief complaint. For example, if a patient was diagnosed with acute cystitis without hematuria on asynchronous care and had a subsequent clinic visit within seven days with a diagnosis of cystitis or interstitial cystitis, this was classified as a relevant follow up and reviewed for change on diagnosis. In cases where diagnosis and medication information were missing, fields were marked as “unknown.” Patients who followed up outside MSHS were not captured, and we did not include data from health information exchanges in this analysis. Our approach to chart abstraction was informed by recommended methods for medical record review in emergency medicine. We used a standardized abstraction tool with explicitly defined variables, trained abstractors, and physician adjudication of ambiguous cases, consistent with Worster and Bledsoe’s methodological parameters for medical record reviews. 9
Outcomes
The primary outcome was subsequent ED or clinic visit within seven days related to the index asynchronous care encounter. Secondary outcomes included change in diagnosis and medication at relevant follow-up visits. These outcomes align with prior studies assessing efficacy and safety of asynchronous care. 6,10
Statistical Analysis
We reported descriptive statistics for continuous variables as means with standard deviations or medians with interquartile ranges. Frequencies with percentages were reported for categorical variables. We performed the analysis using Python version 3 (Python Software Foundation, Wilmington, DE) in MSHS’s secure Minerva supercomputing environment. This study was completed in accordance with the STROBE (Strengthening the Reporting of Observational Studies in Epidemiology) guidelines. The study was approved by the Mount Sinai Institutional Review Board, and a waiver of informed consent was granted for the use of this retrospective dataset (STUDY-24-00779).
RESULTS
Overall Cohort
We identified 277 unique patients that included a total of 343 encounters to the asynchronous care platform during the study period (Figure 2). At the encounter level, 5.2% (18/343) encounters were up-triaged to virtual urgent care or other care platform after completing initial screening (Table 2). Among the 18 up-triaged encounters, the majority (13/18, 72.2%) were directed to virtual urgent care, with one patient referred to in-person urgent care. The most common chief complaints among up-triaged patients were dysuria (n = 6) and vaginal discharge/vaginitis (n = 4), with up-triage for reasons including presentations outside the asynchronous care scope such as genital herpes simplex, traumatic iritis, and gastrointestinal complaints.
The median patient age was 32.6 years (IQR 28.3-41.2) (Table 1). The sample was predominantly comprised of 258 female patients (93.1%). Of 275 patients, 99.3% reported English as their primary language, and 229 (83.0%) patients reported an active primary care physician in the MSHS. Overall identified comorbidities were low: asthma (13.4%); hyperlipidemia (11.9%); hypertension (10.4%); diabetes mellitus (5.0%); and coronary artery disease (0.5%). Among 343 asynchronous care encounters, the most common chief complaints addressed were cystitis/urinary (45.8%, n = 157), followed by vaginal/vulva/candidiasis (28.0%, n = 96), and conjunctivitis/eye complaints (16.6%, n = 57), while smaller proportions presented for contraception/birth control (2.0%, n = 7). The median visit duration was 12.0 minutes (IQR 6.3-23.5). Overall, no laboratory testing was identified as being sent for patients in the cohort evaluated on the platform. For context, we also ascertained descriptive information
(without outcomes) regarding overall in-person ED encounters for the same set of conditions seen on the asynchronous care platform. Concurrently during the study period, there were 19,204 ED encounters with diagnoses matching the asynchronous care chief complaint categories (Table 2). Most of these ED visits were for cystitis/urinary conditions (77.9%, n = 14,956), followed by conjunctivitis/eye complaints (15.7%, n = 3,007) and vaginal/vulva/candidiasis diagnoses (6.0%, n = 1,158), with a small fraction categorized as other diagnoses (0.4%, n = 83).
Medications Prescribed
A total of 289 prescriptions were dispensed during the study period (Table 4). The most prescribed medications at the encounter level included nitrofurantoin monohydrate representing 30.8% (n = 102) of prescriptions, followed by fluconazole 23.9% (n = 79), and cephalexin at 9.1% (n = 30). Additionally, polymyxin b sulfate 10,000 unit-trimethoprim eye drops accounted for 6.3% (n = 21), and erythromycin ophthalmic comprised 3.9% (n = 13) of prescriptions.
Asynchronous Care Follow-up Outcomes
Among 277 patients, 68 (24.5%) had a follow-up visit within seven days in the MSHS outpatient system. Two patients (0.7%) presented to the MSHS ED within seven days, both for complaints unrelated to their index AC encounter (adjustment disorder with anxiety and dependent edema, respectively). After comprehensive chart review of all follow-up visits, five patients (1.5%; 95% CI, 0.5–3.5%) were identified with a change in diagnosis, with all changes occurring within 1–3 days of the index encounter (median 1 day) (Table 5). The most common pattern identified was a change in diagnosis between genitourinary complaints: two patients initially treated for presumed acute candidiasis of vulva and vagina were later diagnosed with bacterial vaginosis and prescribed doxycycline and metronidazole; conversely, two patients initially diagnosed with acute cystitis were later diagnosed with vaginal candidiasis and prescribed fluconazole; and one patient initially diagnosed with dysuria was later diagnosed with acute vulvovaginal candidiasis and prescribed fluconazole. No adverse outcomes, hospitalizations, or mortality were noted on chart review among these patients; however, any patients seeking care outside MSHS were not captured.
DISCUSSION
In this retrospective cohort study, we found that integrating an asynchronous care platform within a large, urban health system provided an effective option for managing common low-acuity conditions and could provide a safe alternative care pathway for select patients. Among the 68 patients who had subsequent follow-up visits within the Mount Sinai Health System, 5 patients (1.5%) underwent a
Figure 2: Flow diagram of cohort asynchronous care (AC) encounters in a study of an emergency department–led AC platform in a large urban academic health system, December 10, 2023–October 21, 2024.
Table 1. Demographic and clinical characteristics of 277 unique patients and 343 asynchronous care encounters managed on an emergency department–led asynchronous platform at Mount Sinai Health System, December 10, 2023–October 21, 2024. Characteristic
IQR interquartile range; MSHS, Mount Sinai Health System; PCP, primary care physician
Table 2. Characteristics of encounters up-triaged from asynchronous care (AC) after initial platform screening (n = 18). Patients were up-triaged from the AC platform to synchronous virtual urgent care (vUC), in-person urgent care (UC), or other care settings based on clinical presentation. Up-triage occurred when patients screened positive for high-risk features, presented with complaints outside the AC scope, or were escalated at clinician discretion. Chief complaint and final diagnosis reflect documentation from the AC screening and subsequent care encounter, respectively. Missing data indicate fields not documented in the electronic health record.
1 Missing Acute candidiasis of vulva and vagina
3 Acute vaginitis Acute vaginitis vUC Vaginal
4 Bacterial conjunctivitis
6 GERD without esophagitis
UTI, uncomplicated; gross hematuria
Dysuria Dysuria; ear pain
Urinary 8 UTI without hematuria UTI without hematuria
Urinary
Genital herpes simplex Genital herpes simplex vUC Other
Acute cystitis without hematuria Acute cystitis without hematuria
change in diagnosis after their asynchronous visit, and 2 patients were seen in the ED for unrelated complaints. This suggests that this model of care could augment or provide an alternative to traditional face-to-face or synchronous telehealth visits for select low acuity patient complaints if supported by careful clinical workflow design, robust followup protocols, and a thoughtful integration into existing health system digital infrastructure.
Our results mirror prior findings on asynchronous care platforms for conditions like uncomplicated urinary tract infections and dermatologic complaints, reinforcing the potential for asynchronous care to expand access and reduce resource utilization in overburdened EDs. A study analyzing electronic visits (eVisit) for minor acute illnesses found that 34% of patients had follow-up within 30 days, reducing to 20% when excluding patients specifically advised to followup. Factors significantly associated with follow-up included specific advice from the eVisit clinician and lack of prescription during the eVisit. Four diagnoses (UTI, sinusitis, upper respiratory infection, and conjunctivitis) comprised 87% of all eVisits. Importantly, only 14 patients required ED follow-up, and only one patient was hospitalized within 30 days, with zero deaths reported. 10
A 2023 systematic review specifically examining asynchronous care in general practice found no major safety concerns from 23 studies. This review demonstrated effectiveness in making diagnoses, prescribing medications, replacing other consultation types, providing timely care, and increasing patient convenience. 11 The results of our study also contribute to the growing body of literature evaluating novel digital health interventions and their role in the healthcare landscape. Given the increasing demand for telehealth services and the growing strain on traditional healthcare settings, understanding the utility of asynchronous care models is critical for guiding future implementations and policy decisions. If safe and effective, asynchronous care could offer a scalable solution to expanding access to care while maintaining high standards of patient safety and clinical quality.
Implementation effort and resource requirements are also important considerations for health systems evaluating potential implementation of similar asynchronous care models. The initial build of this asynchronous care platform required substantial clinical leadership effort to develop a framework that supports an excellent user experience for both patients and clinicians. Based on internal estimates, the total
Table 3. Emergency department encounters and asynchronous care encounters for matched chief complaint categories during the study period (December 10, 2023–October 21, 2024).
Chief complaint category ED Encounters, n (%) Asynchronous care encounters, n (%) Total encounters (ED + Asynchronous care) Asynchronous care
Contraception/birth control 7 (2.0%)
Uptriaged 18 (5.2%)
Missing 8 (2.3%)
*Asynchronous care encounters are reported for all 343 unique encounters including up-triaged, missing, and contraception/birth control categories. The asynchronous care as percentage of total column represents the proportion of all encounters (ED + asynchronous care) for each chief complaint category that were managed via the asynchronous care platform. ED, emergency department.
platform build cost and implementation cost was approximately $45,000. The estimated cost per individual AC encounter was $21.77, which was calculated based on the average emergency physician assistant salary of $180,000 (plus 24% fringe rate) and the minimum billable encounter time of 11 minutes. The technical effort was moderate and involved building intake, clinical documentation, ordering, billing, coding, and reporting workflows—essentially creating an entirely new visit type within the EHR. However, this work leveraged existing institutional investments in the EHR, patient portal, and telehealth staffing models rather than a
Table 4. Medications prescribed during asynchronous care encounters. Total prescriptions = 289.
Medications Prescribed per Encounter
Polymyxin b sulfate 10,000 unit-trimethoprim 1 mg/ml eye drops
Eighteen patients who were up-triaged were not included in this table.
standalone build. As a result, we were unable to isolate discrete startup or maintenance costs that would be generalizable to other settings. Once the framework was in place, adding new clinical conditions required relatively minimal incremental effort, focused primarily on building condition-specific intake forms and reaching consensus on “red flag” criteria that would preclude participation. Otherwise, existing workflows were reused.
While our study was not designed to directly measure equity outcomes, these findings carry important implications for population health and healthcare equity. Asynchronous care models may reduce barriers to access for patients with a higher burden of unmet health related social needs such as transportation or access to medical care, factors that can disproportionately affect underserved populations. However, we note that the current platform requires digital access, English-language proficiency, and enrollment in the health system’s patient portal, which may inadvertently limit reach to populations with higher digital literacy and connectivity. Future work should prioritize multilingual platform development, targeted outreach to underserved communities, and systematic collection of demographic data to evaluate whether ED-led asynchronous care models narrow existing disparities in healthcare access.
LIMITATIONS
There are several major limitations to our study. As this study occurred in a single large urban health system, the results may not be generalizable to smaller or rural health systems. Because this study evaluated the initial rollout period of the asynchronous care platform, it may not reflect similar outcomes with a larger sample size. A major limitation is our reliance on internal MSHS follow-up data, which introduced an important source of ascertainment bias, as patients who experienced complications or sought care at outside institutions would not have been captured, likely leading to an
Table 5. Patients with change in diagnosis within 7 days. Patients with outpatient follow-up relevant to index asynchronous care encounter with change in diagnosis from index asynchronous care encounter. Patients with outpatient follow-up and change in diagnosis from AC encounter (n = 5) patient Asynchronous care visit diagnosis Clinic diagnosis New medications prescribed Days to diagnosis change
1
3
4 Acute cystitis without hematuria Acute
5 Acute cystitis without hematuria
underestimation of our outcomes. We also did not validate clinical outcomes beyond chart-documented diagnoses and did not capture patient-reported outcomes such as symptom resolution or satisfaction. Furthermore, this study was not designed to measure the impact of asynchronous care on ED visit volume, crowding, or system-level use, areas to address in future studies.
Additionally, while we reviewed an initial sample of approximately 10% of charts to ensure consistent data capture between abstractors and performed secondary review of all charts with potential misdiagnoses, we did not calculate formal interrater reliability statistics. Given the relatively small number of charts with documented outcomes and the low observed misdiagnosis rate, this represents a potential limitation. We also acknowledge that over 99% of our cohort spoke English as their first language, making our results challenging to generalize to systems with greater proportions of non-English speakers. We also noted a large proportion of unknown category for the race and ethnicity of asynchronous care patients (39.4%), which may limit a comprehensive and granular analysis of use. This also further limits our ability to adequately assess equity in access and outcomes.
Access to the asynchronous care system requires access to the system through a digital device with a connection to the internet. This again would limit access to certain patient populations who may have higher digital and medical literacy and the ability purchase a mobile device or computer. Despite these limitations, the results of this study suggest asynchronous care as a potentially safe and effective tool for health systems and can provide high value care for a limited set of conditions.
CONCLUSION
In this single-center study, we found effective implementation of an asynchronous care platform within an urban academic health system. A structured platform with
1
1
1
appropriate triage pathways demonstrates feasibility as a safe model for managing select low-acuity conditions within an emergency medicine infrastructure, with minimal rates of diagnostic discordance or immediate return visits. Our study demonstrates that integration of an asynchronous care platform within a health system with appropriate safeguards that are carefully designed has the potential to expand access to care for select low-acuity complaints. Further research and randomized clinical trials are needed to confirm our results and understand if a broader set of conditions can be treated in the asynchronous care environment.
Address for Correspondence: Ethan Abbott, DO, MSCR, Icahn School of Medicine at Mount Sinai, Department of Emergency Medicine, 1 Gustave L. Levy Place, Box 1620, New York, NY 10029. Email: ethan.abbott@mountsinai.org.
Conflicts of Interest: By the WestJEM article submission agreement, all authors are required to disclose all affiliations, funding sources and financial or management relationships that could be perceived as potential sources of bias. No other author has professional or financial relationships with any companies that are relevant to this study. There are no other conflicts of interest or sources of funding to declare
1. Mehrotra A, Paone S, Martich GD, et al. A comparison of care at e-visits and physician office visits for sinusitis and urinary tract infection. JAMA Intern Med. 2013;173(1):72–74.
2. Shaver, J. (2022). The state of telehealth before and after the COVID-19 pandemic. Prim Care, 49(4), 517–530.
3. Ray KN, Shi Z, Gidengil CA, et al. Antibiotic prescribing during
4. Mabeza RMS, Maynard K, Tarn DM. Influence of synchronous primary care telemedicine versus in-person visits on diabetes, hypertension, and hyperlipidemia outcomes: A systematic review. BMC Primary Care 2022;23(1):52.
5. Reed M, Huang J, Sievers E, et al. Outcomes of asynchronous e-visits vs. telephone or video visits for common primary care concerns. J Gen Intern Med. 2025;40(14):3371–3378.
6. Johnson, K. L., Dumkow, L. E., Salvati, L. A., et al. Comparison of diagnosis and prescribing practices between virtual visits and office visits for adults diagnosed with uncomplicated urinary tract infections within a primary care network. Infect Control Hosp Epidemiol. 2021;42(5):586–591.
7. Martinez KA, Rood M, Jhangiani N, et al. Patterns of use and
correlates of patient satisfaction with a large nationwide direct to consumer telemedicine service. J Gen Intern Med. 2018;33(10):1768–1773.
8. Lee JJ, English JC, III. Teledermatology: a review and update. A J Clin Dermatol. 2018;19(2):253–260.
9. Worster A, Bledsoe RD, Cleve P, et al. Reassessing the methods of medical record review studies in emergency medicine research. Ann Emerg Med. 2005;45(4):448–451.
10. Penza KS, Murray MA, Pecina JL, et al. Electronic visits for minor acute illnesses: analysis of patient demographics, prescription rates, and follow-up care within an asynchronous text-based online visit. Telemed J E Health. 2018;24(3):210–215.
11. Leighton C, Cooper A, Porter A, et al. Effectiveness and safety of asynchronous telemedicine consultations in general practice: a systematic review. BJGP Open. 2024;8(1):BJGPO.2023.0177.
Potentially Avoidable Spine Transfers to a Level I Trauma Center: A Five-Year Retrospective Analysis
Clifford M. Marks, MD, MBA*
Ryan C. Burke, PhD, MPH*
Cody Rasner, MD*
Martina Stippler, MD†o
Carlo L. Rosen, MD*o
Section Editor: Pierre Borczuk, MD
Electronically published June 28, 2026
Harvard Medical School, Beth Israel Deaconess Medical Center, Department of Neurosurgery, Boston, Massachusetts Co-senior authors * † o
Harvard Medical School, Beth Israel Deaconess Medical Center, Department of Emergency Medicine, Boston, Massachusetts
Submission history: Submitted May 21, 2025; Revision received October 16, 2025; Accepted October 16, 2025
Full text available through open access at http://escholarship.org/uc/uciem_westjem DOI 10.5811/westjem.47485
Background: Emergency physicians frequently transfer patients with spine pathology to tertiarycare centers, although research suggests many are discharged without requiring a procedure or specialized imaging. Such transfers consume resources and remove patients from their families and communities. Better understanding these transfers might help identify which patients can receive care without transfer.
Methods: This was a retrospective cohort study of transfers for spine evaluation to an urban, tertiary-care, Level I trauma center from October 1, 2017–October 1, 2022. Transfers were defined as necessary if the patient a) went to the operating room (OR) within 12 hours of arrival, b) had a neurologic magnetic resonance image (MRI), c) was admitted to an intensive care unit from the emergency department (ED), or d) was admitted to either neurology or a surgical service (including neurosurgery and orthopedics, which share spine coverage in the study hospital).
Results: The study included 1,918 transfers with a spine evaluation, of which 617 (32.2%) were deemed potentially avoidable. Just 3.3% of all transfers went to the OR within 12 hours of receiving ED arrival, 45.7% had a neurologic MRI at the receiving hospital, and 36.6% were admitted to a neurology or a surgical service. For all transfers, 17.7% were discharged directly from the ED, 16.8% were placed in observation and then discharged, 6.8% were placed in observation and then admitted, and 58.7% were admitted to inpatient from the ED. The average ED length of stay for necessary spine transfers was 15.4 hours vs 16.6 hours for potentially avoidable transfers (P = .07). Compared to the overall rate of necessary transfers (67.8%), patients with the following conditions had a decreased incidence of necessary transfers: cervical spine fractures (62% necessary, P = .008), lumbar spine/sacrum/coccyx fractures (53.5% necessary, P < .001), and disc disorders (51.4% necessary, P = .003). Patients diagnosed with cervical spinal cord lesions (91.7% necessary, P = .01) had an increased incidence of necessary transfers.
Conclusion: Nearly one-third of spine evaluation transfers were potentially avoidable. Patients transferred for spine evaluation experienced prolonged ED stays, creating challenges for both receiving hospitals and patients. Further research is needed to prospectively identify patients who do not require tertiary care and to study methods for managing them in community settings. [West J Emerg Med. 2026;27(4)930–937.]
INTRODUCTION
Tens of thousands of patients in the United States are transferred to tertiary-care hospitals annually for spine evaluation.1 While a subset do require surgical care available
only at tertiary sites, earlier research suggests that as many as 79% of patients transferred for isolated spine pathology were discharged directly from the emergency department (ED), some with a brace and others with no treatment at all.2 These
potentially avoidable transfers can involve real harm from a social and patient perspective. Both patients and the healthcare system as a whole pay thousands and sometimes tens of thousands of dollars for each transfer, particularly when air medical transport is involved.2,3 In many cases, patients are sent far from their communities, making it difficult for family members to provide needed support.4 Moreover, the long lengths of stay associated with such cases can further burden tertiary EDs already plagued by a boarding crisis.
While reducing unnecessary transfers is a laudable goal, determining prospectively which patients are unlikely to benefit from transfer remains a central challenge. Pilot programs for spine telehealth evaluation suggest remote assessments can be quite accurate, but more research is needed to safely develop and study such interventions. To that end, we performed a five-year retrospective analysis of spine transfers to a U.S. Level I trauma center—the largest such study to date. Our objectives were to 1) characterize the magnitude of potentially avoidable spine transfers to a Level I trauma center over a five-year period; 2) identify patient and clinical characteristics associated with potentially avoidable transfers; and 3) determine which diagnostic categories are most strongly associated with unnecessary transfers to inform future intervention strategies.
METHODS Study Design
We conducted a retrospective cohort study of patients transferred for spine service evaluation to an urban Level 1 trauma center, where the ED sees 55,000 patients annually. The cohort included all visits from patients ≥ 18 years of age who were transferred between October 1, 2017–October 1, 2022 and evaluated by the spine consult service in the ED. The five-year study period was chosen to capture sufficient cases for meaningful analysis. No formal sample-size calculation was performed as this was a descriptive study aimed at characterizing all spine transfers in the study period, rather than one intended to test specific hypotheses with a predetermined effect size. Transferred patients with a spine consult in the ED were defined as transferred patients for whom the emergency physician in the receiving ED ordered a spine consult. This cohort, thus, included both transfers solely for spine evaluation and polytrauma transfers for which the spine service was consulted.
We did not collect data about the transferring clinicians or their working diagnosis at the time of transfer. A visit was excluded from this study if the patient died in the ED or if the ED disposition was eloped or left against medical advice, as these criteria rely on physician decisions to operate, admit, or order imaging and may not be reflected for patients who did not complete their ED workup. As this was an analysis of a database of patients, we did not perform manual chart review and, thus, did not report on abstractor training, use of abstractor forms, or inter-rater reliability.5 This study is
Population Health Research Capsule
What do we already know about this issue?
Many patients transferred to tertiary centers for spine evaluation are discharged without surgery or specialized imaging, suggesting some transfers may be unnecessary.
What was the research question?
What proportion of spine transfers to a Level I trauma center were potentially avoidable over five years?
What was the major finding of the study?
Of 1,918 spine transfers, 617 (32.2%) were potentially avoidable.
How does this improve population health?
The significant proportion of potentially avoidable transfers for spine evaluation represents a key opportunity to reduce costs, ED crowding, and harm to patients.
reported in accordance with the Strengthening the Reporting of Observational Studies in Epidemiology Statement6 (Supplemental Table 1).
Variables
We employed criteria previously used in a study of neurosurgical transfers to differentiate necessary spine transfers from potentially avoidable transfers.7 A transfer was deemed necessary if the patient a) went to the operating room (OR) within 12 hours of arrival to the ED; b) a neurologic magnetic resonance image (MRI), defined as an MRI of the brain, neck or spinal cord, was conducted in the ED; c) the patient was admitted to intensive care unit (ICU)-level care from the ED; or d) the patient was admitted to either neurology or a surgical service (including neurosurgery or orthopedics, which share spine coverage in the study hospital). A transfer that did not meet any of the above criteria was categorized as potentially avoidable.
We retrospectively collected demographic data, Emergency Severity Index (ESI) level, disposition, International Classification of Diseases, 10th Rev, (ICD-10) codes, and neurologic MRI ordering information in the ED via electronic health record data abstraction. Missing data patterns were assessed but not imputed. We evaluated data completeness for key variables, with only records containing
complete data for the primary outcome classification (necessary vs potentially avoidable transfer) included in the analysis. Drawing on a previously published categorization of spine injuries, we devised diagnostic categories (eg, “Cervical spine fracture” or “Spinal infection”) with relevant ICD10 codes assigned to each category8 (see Table 1). We then categorized each visit according to its ICD-10 codes. Because some visits had multiple ICD-10 codes, it was possible for one visit to be counted in more than one category. To ensure uniform coding practices regardless of patient disposition, analysis was restricted to ICD-10 codes assigned by the emergency physician at the time of disposition decision.
Statistical Tests
We summarized patient and clinical characteristics with frequencies and percentages, both overall and stratified by whether the transfer was classified as necessary or potentially avoidable. We assessed statistical differences between the two groups with a chi-square test for categorical variables and a t-test for continuous variables. A P value of < .05 was considered significant. A Benjamini-Hochberg adjustment for multiple comparisons was performed for the significance testing of diagnostic groupings. We performed all analyses in statistical analysis system SAS v9.4 (SAS Institute Inc, Cary, NC).
RESULTS
There were 1,949 visits by adult patients transferred for spine service evaluation during the study period. Of those, 31 were excluded based on ED disposition, leaving 1,918 visits in our study. Data required for primary outcome classification were complete for all 1,918 included patients. The mean age for this cohort was 65 years (standard deviation 19 years) and 943 were women (49.2%). The cohort contained 1,556 White patients (81.1%), 112 Black patients (5.8%), 54 Hispanic/Latino patients (2.8%), 38 Asian patients (2.0%), 90 patients listed as “other” (4.7%), and 68 whose ethnicity was unknown (3.5%).
Nearly one-third of transfers (617, 32.2%) were deemed potentially avoidable by our criteria. Sixty-four (3.3%) of all spine transfers went to the OR within 12 hours of arriving at the receiving hospital, 15.3% were admitted to the ICU from the ED, 45.7% had a neurologic MRI performed while in the ED, and 36.6% were admitted to neurology or to a surgical service (see Figure 1).
We present demographic and clinical characteristics for the study population overall and stratified by need for transfer in Table 2. Potentially avoidable transfers were significantly more likely to be female patients compared to needed transfers (57.7% vs 45.1%, P < .001). Potentially avoidable transfers were patients significantly older than those needing transfer (67 vs 65 years of age, P = .01). Race and ethnicity were statistically associated with transfer necessity (P = .009) but this significance disappeared when patients with unknown race/ethnicity were removed from the analysis (P = .77). Whether the patient was English speaking was not associated
Table 1. International Classification of Diseases, 10th Rev. codes associated with diagnostic groupings used in a study of interhospital transfers for neurosurgical evaluation.
Diagnostic groupings
Cervical spine fracture
Cervical spine rupture, dislocation, subluxation, or sprain
Cervical spine lesion
Thoracic spine fracture
Thoracic spine rupture, dislocation, subluxation, or sprain
Thoracic spinal cord lesion
Lumbar spine/sacrum/coccyx fracture
Lumbar spine rupture, dislocation, subluxation, or sprain
Lumbar spinal cord lesion
Cauda equina
Cord compression/paralytic syndromes
Spinal stenosis
Spinal infection
Primary/metastatic lesion
Disc disorders
Back pain
Spondylolysis or spondylolisthesis, unspecified site
ICD-10, International Classification of Diseases, 10th Rev.
with transfer necessity (P=0.72). The ESI was significantly associated with needing to be transferred (P < .0001), with a higher proportion of ESI 1 in the needing transfer group (17.5% vs 5.2%) and a lower proportion of ESI levels 3-5 (18.2% vs 32.3%). A statistically higher proportion of visits needing transfer were self-pay (7.1% vs 2.8%, P < .001).
The overall cohort had a mean ED length of stay of 15.8
Figure 1. Categorization of needed vs. potentially avoidable transfers in a study of interhospital transfers for neurosurgical evaluation. ED, emergency department; ICU, intensive care unit; MRI, magnetic resonance image; OR, operating room.
Table 2. Number and percentage of clinical and demographic characteristics by transfer necessity in a study of interhospital transfers for neurosurgical evaluation.
hours (SD 12.7 hours). Potentially avoidable transfers tended to spend longer in the ED than necessary transfers (mean 16.6 vs 15.4 hours), although this difference did not reach statistical
significance (P = .07).
Table 3 shows diagnostic categories for the transferred patients overall and stratified by need for transfer, as well as
the probability a patient in each diagnostic grouping needed transfer. Patients with diagnoses in the following categories were significantly more likely to have been potentially avoidable transfers: Cervical spine fractures (22.4% of potentially avoidable transfers vs 17.3%, P = .008), lumbar spine/sacrum/coccyx fractures (15.1% vs 8.2%, P < .001), back pain (23.3% vs 17.4%, P = .002), and disc disorders (5.5% vs 2.8%, P = .003). Patients with diagnoses designated as cervical spinal cord lesions (1.7% of needed transfers vs 0.3% of potentially avoidable transfers, P = .01) were significantly more likely to have been necessary transfers.
Table 4 shows disposition for the overall cohort, stratified by transfer necessity. For the overall transfer cohort, 17.7% were discharged home directly from the ED, 16.8% were placed in ED observation and subsequently discharged, 6.8% were placed in ED observation and ultimately admitted, and 58.7% were admitted to the hospital. Necessary transfers
were admitted 71.6% of the time, with 10.5% placed in ED observation status and discharged, 6.4% placed in ED observation and ultimately admitted, and 11.5% discharged home directly from the ED. For potentially avoidable transfers, 31.3% were admitted, 30.1% were placed in ED observation and then discharged, 7.6% were placed in ED observation and subsequently admitted, and 31% were discharged directly home.
Table 5 details the service for those patients who were admitted, both for the overall cohort and stratified by transfer necessity. For necessary transfers, 26.9% went to a spine service—12.6% went to the neurosurgery service, and 16.3% went to orthopedics. Larger numbers of patients were admitted to either the trauma service (32.4%) or to general medicine (28.4%). Of patients whose transfers were potentially avoidable, 95% of admitted patients went to general medicine, while 3.3% went to cardiology and 1.7% went to oncology.
Table 3. Diagnostic groupings by transfer necessity in a study of interhospital transfers for neurosurgical evaluation.
Spondylolysis or spondylolisthesis, unspecified site
*Percentage of visits needing transfer within the diagnosis group significantly higher than percentage of visits needing transfer not within the diagnosis group, using a chi-square test with a Benjamini-Hochberg adjustment and a false discovery rate set at 0.05.
ED, emergency department.
DISCUSSION
This five-year retrospective analysis of spine transfers to a Level I trauma center shows that even while using a broad definition of necessary transfers that included obtaining an MRI at the receiving facility, nearly a third of spine transfers were deemed potentially avoidable. This represents a potentially significant opportunity to reduce costs, ease strain on overburdened and crowded tertiary-care EDs, and save some patients afflicted with spine pathology the ordeal of being removed from their friends, families, and communities.
Just 3.3% of transferred patients in this study required emergent operative repair, and 34.6% were not even admitted to the hospital, including more than one in five patients with necessary transfers by our criteria. This suggests that even among the two-thirds of patients in this study whose transfers were considered necessary, a smaller proportion had truly emergent conditions.
Those transferred spent prolonged periods in the ED, with patients classified as potentially avoidable transfers staying an average of 16.6 hours. Ample research demonstrates that such prolonged stays can cause serious harm, particularly for elderly patients who may develop delirium in ED.9 These transfers also occupy scarce ED beds at a time of unprecedented crowding, and adding to this crisis may place these patients and others in crowded EDs at risk of harm. The challenge of unnecessary spine transfers must also be considered within the context of specialist availability at community hospitals. Research shows that neurosurgery is one of the most difficult specialties for maintaining ED call panels, yet neurosurgical transfers can be
financially beneficial for receiving physicians and hospitals.10 Improving transfer decision-making through interventions like telehealth consultation could help optimize this system by reducing unnecessary transfers while preserving both the financial incentives for neurosurgical evaluation and patient access to specialized care.
This study suggests that a few diagnostic categories in particular could prove fruitful in the search for unnecessary transfers. Similar to prior research, we found that transfers for C spine fractures. L spine/sacrum/coccyx fractures, and disc disorders were all more likely to be unnecessary.2 While having the ICD-10 code for back pain was associated with higher odds of a potentially avoidable transfer, this likely was not the diagnosis of the sending physician and, therefore, may not provide much insight when prospectively screening need for transfer. Patients with cervical spinal cord lesions, on the other hand, were significantly more likely to have required transfer by our metric.
While these data make clear the scope of the opportunity to reduce unnecessary spine transfers, more research is needed into how we might safely differentiate necessary from unnecessary transfers. Telehealth spine evaluations have proven accurate across multiple studies in the outpatient setting: One study of 65 patients who had a telemedicine spine visit followed by an in-person visit demonstrated no change in diagnosis 94% of the time.11,12 Research on spine telehealth evaluation in the emergency setting is comparatively lacking, although the implementation of a regional telehealth system for emergency neurosurgical consultation in France appeared to lower the rate
5. Admission service requested by necessity of transfer in a study of interhospital transfers for neurosurgical evaluation.
Table 4. Disposition by necessity of transfer in a study of interhospital transfers for neurosurgical evaluation.
Table
of transfers for spine pathology.13 In addition, multiple studies have validated the use of telemedicine for emergent evaluation of non-spine neurosurgical diagnoses.14 Piloting emergency telehealth evaluation focused on spine diagnoses that are high risk for unnecessary transfer is an important next step.
LIMITATIONS
This study has several limitations. First, given its retrospective design, we relied on the accuracy of the electronic health record to identify visits and whether a spine consult was performed, which may have introduced selection bias. The outside clinician’s decision about when to transfer patients also introduced possible selection bias, as we lacked data on patients with spine complaints who were not transferred. Additionally, the study was conducted at a single, urban Level 1 trauma center, which could limit the generalizability of our findings to other settings. To mitigate classification bias, we used objective outcome criteria based on documented clinical actions rather than chart review.
The ICD-10 codes here reflect the primary ED diagnoses at the receiving facility, rather than the diagnosis at the referring facility when the patient was transferred or a diagnosis based on subsequent chart review. This creates a risk of classification bias, as emergency physicians likely have different approaches to assigning diagnoses. Thus, it is unclear how often this diagnosis matches either the working diagnosis of the sending physician, the remote evaluation of the spine team at the time of transfer, or the patient’s final diagnosis. In addition, these ICD-10 codes often lacked specificity; for instance, the same lumbar fracture might be coded as “Unspecified fracture of unspecified lumbar vertebra,” “Compression fracture of lumbar vertebra, level unspecified,” or “Fracture of fourth lumbar vertebra, initial encounter for closed fracture.” This limited our analysis to broader diagnostic categories.
We deliberately chose conservative criteria to address any concerns that our metric might be inflating the number of potentially avoidable transfers. However, this does run the risk of underestimating the avoidable transfer problem. In particular, the inclusion of ED MRI imaging as a marker of necessary transfer significantly increased the proportion of transfers deemed necessary. This criterion reflects the fact that many community hospitals do not have MRI available. Some community hospitals do, however, and in such cases, access to MRI imaging would not have been a barrier to treatment in place. Our surgical service criterion reflects the presence of polytrauma transfers in this cohort. Transferred polytrauma patients who received spine service evaluation in the ED may have needed transfer to a trauma center for reasons unrelated to the spine consultation. Since it is difficult to determine whether these transfers were necessary for spine evaluation or some other trauma evaluation, we deemed transfers with admission to the trauma or other surgical service to be necessary. While we did not perform formal
sensitivity analyses, these conservative criteria—particularly including all MRI recipients as necessary transfers regardless of community hospital capabilities—effectively functions as a sensitivity analysis that biases toward underestimating rather than overestimating potentially avoidable transfers.
CONCLUSION
This study demonstrates that a third or more of patients transferred emergently for spine evaluation could potentially have been cared for in their community hospital. These data highlight a potential opportunity for the healthcare system to reduce costs and improve quality of care by treating some of these patients in their communities, particularly for conditions such as cervical or lumbar spine fracture that we found were more strongly associated with potentially avoidable transfers. Further research should evaluate the effectiveness and safety of neurosurgical telehealth programs in triaging community ED patients to either be transferred or be treated in place.
Address for Correspondence: Clifford M Marks, MD, MBA, Harvard Medical School, Beth Israel Deaconess Medical Center, Department of Emergency Medicine, One Deaconess Road, Boston, MA 02215. Email: cmarks2@bidmc.harvard.edu.
Conflicts of Interest: By the WestJEM article submission agreement, all authors are required to disclose all affiliations, funding sources and financial or management relationships that could be perceived as potential sources of bias. No author has professional or financial relationships with any companies that are relevant to this study. There are no conflicts of interest or sources of funding to declare.
1. Cole KL, Kassicieh AJ, Rumalla K, et al. Frailty predicts worse outcomes for spine surgery patients with interhospital transfer status: Analysis of 295,875 patients from the National Surgical Quality Improvement Program (NSQIP) 2015–2019. Clin Neurol Neurosurg 2023;224:107519.
2. Bible JE, Kadakia RJ, Kay HF, et al. How often are interfacility transfers of spine injury patients truly necessary. Spine J 2014;14(12):2877-2884.
3. Foster NA, Elfenbein DM, Kelley W Jr, et al. Comparison of helicopter versus ground transport for the interfacility transport of isolated spinal injury. Spine J. 2014;14(7):1147-54.
4. Mohr NM, Wong TS, Faine B, et al. Discordance between patient and clinician experiences and priorities in rural interhospital transfer: a mixed methods study. J Rural Health. 2016;32(1):25-34.
5. Worster A, Bledoe RD, Cleve P, et al. Reassessing the methods of medical record review studies in emergency medicine research. Ann Emerg Med. 2005;45(4):448-451.
6. von Elm E, Altman DG, Egger M, et al. STROBE Initiative. The Strengthening the Reporting of Observational Studies in Epidemiology (STROBE) statement: guidelines for reporting observational studies. J Clin Epidemiol. 2008;61(4):344-9.
7. Marks CM, Burke RC, Stippler M, et al. An analysis of potentially avoidable neurosurgical transfers to a tertiary-care level I trauma center. J Neurosurg. 2024;141(6):1723-1729.
8. Schroeder GD, McKenzie JC, Casper DS, et al. Descriptive analysis of associated factors for urgent versus nonurgent inpatient spine transfers to a tertiary care hospital. Am J Med Qual 2018;33(6):623-628.
9. Silva LOJE, Berning MJ, Stanich JA, et al. risk factors for delirium in older adults in the emergency department: a systematic review and
meta-analysis. Ann Emerg Med. 2021;78(4):549-565.
10. Langdorf MI, Lee S, Menchine MD. Financial implications for physicians accepting higher level of care transfers. West J Emerg Med 2013;14(3):227–232.
11. Bovonratwet P, Song J, Kim YE, et al. Telemedicine visits can generate highly accurate diagnoses and surgical plans for spine patients. Spine. 2022;47(17):1194-1202.
12. Melnick K, Porche K, Sriram S, et al. Evaluation of patients referred to the spine clinic via telemedicine and the impact on diagnosis and surgical decision-making. J Neurosurg Spine. 2023;39(4):600-606.
13. De Bustos EM, Berthier E, Chavot D, et al. Evaluation of a French regional telemedicine network dedicated to neurological emergencies: a 14-year study. Telemed E-Health. 2018;24(2):155-160.
14. Wright J, Elder T, Gerges C, et al. A systematic review of telehealth for the delivery of emergent neurosurgical care. J Telemed Telecare 2021;27(5):261-268.
Original Research
Temporal Trends in Mortality from Gunshot Wounds for Emergency Medical Services Compared to Private Vehicle Transport
Gregory Muller, DO*
Kate Miller, PhD, MPH†
Loretta Matheson, MS‡
Xinhang Wang, MSPH‡
Laleh Gharahbaghian, MD§
Peter D’Souza, MD*
Marc Gautreau, MD, MBA*
Maame Yaa A. B. Yiadom, MD, MPH, MSCI||
Section Editor: Pierre Borczuk, MD
Stanford University, Department of Emergency Medicine, Section of Prehospital and Disaster Medicine, Palo Alto, California
Stanford University, Quantitative Sciences Unit, Palo Alto, California
Stanford University, Department of Emergency Medicine, Study Design and Statistical Analysis Core, Palo Alto, California
Stanford University, Department of Emergency Medicine, Clinical Operations and Management, Palo Alto, California
Emergency Care Health Services Research Data Coordinating Center, Department of Emergency Medicine, Palo Alto, California
Submission history: Submitted October 16, 2025; Revision received March 13, 2026; Accepted March 14, 2026
Electronically published June 28, 2026
Full text available through open access at http://escholarship.org/uc/uciem_westjem DOI 10.5811/westjem.53151
Introduction: Despite expectations that emergency medical services (EMS) transport following a gunshot wound (GSW) would improve 30-day mortality compared to transport by private vehicle, the opposite has been found in several studies. In response, EMS has adopted interventions over the past decade to reduce patient mortality. We compared mortality of GSW patients transported by EMS versus private vehicle as these field practice advancements became widespread.
Methods: We conducted a retrospective cohort study using data from the National Trauma Data Bank (NTDB) from 2007–2021. We included adults (≥ 16 years of age) with GSW injuries transported solely by ground EMS (≤ 2 hours) or by personal vehicle to a Level I or Level II trauma center. The primary outcome was 30-day in-hospital mortality. We also aimed to describe demographic changes over time in these patient populations. A multivariable logistic regression model was developed to estimate the adjusted odds ratio (aOR) of mortality, with demographic and clinical controls. To describe change over time, we performed the multivariable logistic regression model separately within three-year periods. To determine whether the change was significant, we performed the multivariable logistic regression model with the same controls and the addition of an interaction term for transport mode with year group.
Results: Of 355,913 patients, 83.7% were transported by EMS and 16.3% by private vehicle. Unadjusted mortality was consistently higher for EMS patients, ranging from 18.8% (vs 3.7% private vehicle) in 2007–2009 to 19.3% (vs 4.3% private vehicle) in 2019–2021. The aOR for mortality in the EMS cohort decreased from 2.2 (95% CI, 1.7–2.8) in 2007–2009 to 1.6 (95% CI, 1.3–1.8) in 2019–2021. However, this temporal trend was not statistically significant (P = .17).
Conclusion: Our analysis suggests EMS transport remains associated with higher odds of mortality compared to private vehicle transport for patients with gunshot wounds. This may suggest that improvements in EMS clinical and transport practices have not yet proved sufficient to reduce relative mortality, or that there may be differences in injury severity or type of injury that are not adequately accountable from the NTDB data. [West J Emerg Med. 2026;27(4)938–946.]
INTRODUCTION
Background
A landmark 2014 study showed that gunshot wound (GSW) patients transported by emergency medical services (EMS) to trauma centers had twice the odds of in-hospital mortality compared to patients transported by private vehicle.1 That study used data from the National Trauma Data Bank (NTDB), included four years of data from 2007–2010, and used the same control variables as our study except for the use of the New Injury Severity Score instead of the Injury Severity Score (ISS) and with the addition of the patient’s need for ventilatory support. Previous single-center studies evaluating mortality by transport mode showed mixed results.2,3
Importance
The association of transport mode after GSW with survival is complex. It is likely that EMS transports a population with higher acuity and injury severity, as patients who are hemodynamically unstable or incapacitated are unable to transport themselves. Therefore, higher mortality in the EMS cohort may reflect this selection bias rather than a failure of prehospital care. It is also critical to acknowledge that GSW injuries do not occur in isolation but in communities, and they disproportionately impact racial and ethnic minorities. This reflects the underlying structural disparities that persist outside trauma systems of care. The transport decisions analyzed in this study must be understood within a context of unequal exposure to violence.
Advancements in understanding the complex associations at play have resulted in EMS protocols focused on shortening EMS on-scene and transport intervals to enable more of the early life-saving time window to occur at the destination hospital where there is additional access to life-saving interventions (ie, surgery). In parallel, EMS protocols have focused on bringing life-saving hospital interventions such as tourniquets and tranexamic acid (TXA)4–8 to the field as research identified the potential of these interventions to reduce mortality.9,10
Goals of This Investigation
Our study evaluated 15 years of NTDB data from 2007 to 2021—extending the span of the seminal work an additional 11 years during which significant developments in EMS field practice have occurred. Our primary goal was to assess whether EMS mortality-reducing efforts were associated with reduction in the relative mortality of GSW patients transported by EMS compared to private vehicle. Other researchers11–13 using NTDB data to examine the relative mortality of patients transported by EMS versus private vehicle did not allow for direct comparisons due to variations in study design. Our study extends prior findings by performing a longitudinal analysis using consistent methods across the entire period from 2007–2021, a period marked by widespread adoption of
Population Health Research Capsule
What do we already know about this issue?
Gunshot wound (GSW) patients transported by emergency medical services (EMS) have had twice the odds of mortality compared to private vehicle transport.
What was the research question?
Is there a persistent mortality gap between EMS and private vehicle transport for GSW trauma?
What was the major finding of the study?
Despite changes to EMS protocols over the last 15 years, a higher mortality persists for EMS transported gunshot wounds vs. private vehicle transports (aOR of mortality 1.6 in 2019–2021, CI 1.3-1.8).
How does this improve population health?
Transport by EMS has a persistently higher mortality compared to private vehicle transport, highlighting an ongoing need for EMS system improvement.
hemorrhage control adjuncts and modernized trauma treatment protocols. Unlike replication studies, our objective was to determine whether these efforts coincided with a narrowing of the survival gap between EMS and private vehicle transport. We recognize that EMS transport may be disproportionately used for patients with higher clinical acuity; however, we hypothesized that advancements in prehospital care would sufficiently mitigate this difference to narrow the mortality gap between EMS and private vehicle transport over the study period. This would be consistent with a positive effect of changes to prehospital care over the time frame under study.
METHODS Study Design
We developed a multivariable logistic regression model of the relationship between mortality and transport for GSW trauma patients from 2007–2021. We posited that if changes to EMS practices in the field and during transport have led to reduced mortality, then the odds of 30-day in-hospital mortality for patients transported by EMS compared to private vehicle should have improved over time. We also describe changes in the demographic and clinical characteristics of GSW trauma patients transported by EMS versus private vehicle over this full time frame. The protocol received institutional review board (IRB) exemption from the Stanford University IRB (#74250).
Setting
We used data from the NTDB, a national database maintained by the American College of Surgeons (ACS). The NTDB is the largest U.S. trauma registry and includes data on patient demographics, injury classification, EMS prehospital intervals, clinical variables present on patient arrival, and outcomes. The Trauma Quality Program (TQP) Participant Use Files (PUF) are the representative data files provided by the ACS and contain all records sent to the NTDB for any specified year.
Selection of Participants
We included adult patients (≥ 16 years of age), transported solely by either ground EMS or private vehicle, who initially presented to any Level I or Level II hospital (regardless of volume) with GSW injuries only. We analyzed the TQP PUF data files for admission years 2007–2021. Note that 2020 was the last year for which EMS transport interval data was collected. We excluded patients who were transferred from another hospital or transferred out to another hospital within 30 days. We also excluded patients transported by police. When EMS transport intervals were available, we established a cut-off duration of two hours and excluded patients with transport times above that threshold as outliers.
Patients with GSWs were identified using the TQP’s external cause of injury codes (e-codes, based on International Classification of Diseases codes) that TQP further categorizes into mechanism of injury. We included only those patients with a “Mechanism of Injury = Firearm,” and only if any secondary mechanism of injury was not a different type of injury, such as a fall.
Outcomes
The primary outcome was death within 30 days during the hospital admission, or survival to hospital discharge. To determine whether the patient either died in hospital or was discharged alive within 30 days, we used the following variables: ED discharge disposition; hospital discharge disposition; ED length of stay (LOS) (2017–2021 only); and hospital LOS. If ≥ 30 days, we used as a proxy for hospital LOS the following: ICU LOS; days in the hospital on a ventilator; and days to withdrawal of life support. For 2007–2010, the variable EDDEATH was used as a secondary determination of death in the ED.
Measurements
We describe the population clinical and demographic characteristics with means, medians, and percentages as appropriate, separated by transport type (EMS versus private vehicle). We also evaluated these characteristics within sequential time periods to examine any compositional changes to the population over time. We did not test for statistically significant differences in characteristics between EMS and
private vehicle patients to reduce the likelihood of a type I error that would result from running many statistical tests. Neither did we test for these differences because the large sample size (≥ 300,000) has statistical power to detect very small differences between groups, which may achieve statistical significance but carry little to no clinical or substantive meaning.
Data Analysis
We estimated the adjusted odds ratio (aOR) of 30-day mortality with multivariable logistic regression models. The predictor of interest was the binary variable for transport: EMS versus private vehicle. Control variables included patient age, sex, race and ethnicity, insurance status, ISS,14,15 and on presentation to the trauma center, the initial systolic blood pressure (SBP), heart rate, and motor component of the Glasgow Coma Scale (GCS). To test for statistically significant change in aOR over time, we report the P value of an interaction term between time period and transport type using all time periods pooled in one dataset. To facilitate interpretation of changes in aOR over time, a separate model was fit for each of five time periods: 2007–2009; 2010–2012; 2013–2015; 2016–2018; and 2019–2021.
Our primary analysis was complete case, reflecting that the missingness on any covariate was 3.2% at most (see Table 1). As a post-hoc sensitivity analysis, our study entailed multiple imputation to impute values on the six predictors with any missingness: gender; race; ISS; BP; heart rate; and GCS). We ran the primary model on each of five replicates and combined the estimated parameters using the Rubin rules. P < .05 was considered to be significant for all statistical tests. All analyses were conducted with SAS Enterprise Guide v8.1, update 2 (SAS Institute Inc, Cary, NC). The statistical analysis plan registered at Open Science Foundation prespecified all analyses (https://osf.io/ah4fb/). This manuscript was prepared according to the Strengthening the Reporting of Observational Studies in Epidemiology (STROBE) reporting guidelines.
RESULTS
Of 13,203,102 records in the NTDB for the years 2007–2021, the sample included 355,913 patients (2.7%) who met the inclusion criteria (Figure 1 and Supplement Table S1) and 330,146 patients who were not missing data among the model covariates used in the regression model. Of these, 297,733 (83.7%) were transported by EMS and 58,180 (16.3%) by private vehicle. Table 1 shows the demographic and clinical characteristics of the patient population by transport type. The unadjusted mortality for patients in the EMS group was 19.1% (n = 56,798), and 4.0% (n = 2,321) for the private vehicle group. The EMS patients were more likely to be older, a race/ ethnicity other than Black, and female compared to private vehicle patients. On arrival at the trauma center, the injuries of EMS patients were clinically more severe, as measured
Figure 1. Consort diagram of study population from the National Trauma Data Bank in a study comparing mortality of gunshot wound victims transported by emergency medical services versus private vehicle. EMS, emergency medical services.
Table 1. Demographic and clinical characteristics of patients by transport type.
Table 1. Continued.
multiple races, NHOPI*
Patient died in hospital ≤ 30 days
Coma ScaleMotor
*NHOP = Native Hawaiian or other Pacific Islander. Missing data as follows: sex, 0.2%; race and ethnicity, 2.0%; Injury Severity Score, 0.4%; systolic blood pressure, 3.2%, heart rate, 2.5%; and Glasgow Coma Scale–motor, 2.1%. EMS, emergency medical services; PV, private vehicle.
Table 1. Continued.
EMS, emergency medical services; PV, private vehicle.
by ISS, and EMS patients were in more critical condition, as measured by GCS-motor.
The complete case multivariable model, which controlled for demographic and clinical characteristics and included the full-time span of 2007–2021, found an overall higher mortality rate for patients transported by EMS compared to private vehicle. To facilitate interpretation, we present further results using separate models for the five time periods. Figure 2 presents the aOR and 95% confidence intervals of mortality for patients transported by EMS compared to private vehicle for each time period, adjusted for demographic and clinical characteristics. Although the estimated aOR fell from 2.2 in 2007-2009 (95% CI, 1.7-2.8) to 1.6 in 2019–2021 (95% CI, 1.3-1.8), this decline was not statistically significant (P = .17 for the interaction term of time and transport type in a model using all periods pooled). In the post-hoc sensitivity analysis using multiply imputed data, the interaction between time and transport type was highly significant at P = .004. Further diagnostics revealed that for certain covariates, the missingness was not at random but associated with both the exposure and outcome (Supplemental Table S2).
Many characteristics of the study population were stable across the study period for both EMS- and private vehicle-transported patients, including missing data patterns (Supplemental Table S3). This supplemental table also offers an understanding of univariate associations of mortality of EMS compared to private vehicle. The proportion of patients with profound ISS varied by less than one percentage point for both EMS patients (range 20.1%–20.3%) and private vehicle patients (range 5.6%–6.4%) (Figure 3). Two characteristics changed similarly for both EMS- and private vehicletransported patients over time: The population became older, with the percentage of patients > 24 years of age rising from 55.6% to 66.8% among EMS transports and 43.7% to 57.8% among private vehicle transports, and the female percentage rose, from 9.9% to 13.6% among EMS transports and 7.1% to 10.4% among private vehicle transports (Figure 3).
DISCUSSION
We found that between 2007–2021, the aOR of mortality
Figure 2. Adjusted and unadjusted 30-day in-hospital mortality for patients transported by emergency medical service relative to private vehicle by study period; odds ratios adjusted for demographic and clinical characteristics in a study of 15 years of National Trauma Data Bank data on mortality outcomes after gunshot wounds.
EMS, emergency medical services; PV, private vehicle.
Figure 3. Selected characteristics of the gunshot wound trauma population by study period in our analysis across 15 years of National Trauma Data Bank data on mortality outcomes after gunshot wounds, EMS, emergency medical services; ISS, Injury Severity Score; PV, private vehicle.
among GSW trauma patients was significantly higher among patients transported by EMS than those transported by private vehicle, adjusting for demographic and clinical characteristics. The aOR point estimates of mortality for EMS- versus private vehicle-transported patients did decline over time, although the decline was not statistically significant in complete case analysis, which does not support our initial hypothesis. The analysis using multiply imputed data did show a statistically significant decline. However, we observed patterns suggesting the missingness was not at random, which introduces systematic bias into the regression estimates, making it more
likely to find a significant difference that is an artifact of the imputation. In Supplement Table S2, we characterize the bias to enhance awareness of this in the literature. Our imputed analysis was a post-hoc sensitivity analysis. For these reasons, we placed less weight on its findings, found the complete case analysis to be more reliable, and considered the decline to not be statistically significant.
The finding of higher aOR of mortality among patients transported by EMS is consistent with other research,1,11–13 but our study is the first to measure the aOR of mortality longitudinally over an expanded time frame. In previous work focused on urban trauma systems, GSW patients transported by EMS were roughly twice as likely to die as those transported by private vehicle.11 Studies looking at expanded modes of transport again found roughly double the adjusted odds of mortality for EMS transport versus police or private vehicle.12 Finally, a study focused on torso-penetrating wounds found that the adjusted odds of mortality for EMS-transported patients was only 1.6 times that of private vehicle transport.13
We explored whether these results could have arisen from compositional changes in the population of GSW trauma patients over time. We found similar demographics to those reported by longitudinal studies conducted nationally16,17 and at individual Level I trauma centers18–20 throughout the United States covering the past two decades. Our study identified a shift toward an older (≥ 25 years of age) and increasingly female population, while other characteristics remained stable. The consistently high proportion of certain racial-ethnic groups in this population points to persistent disparities in GSW trauma exposure that warrants further investigation.
An important consideration in our results is the observed difference in patient populations between those transported by EMS versus private vehicle. Emergency medical services transported nearly five times as many patients as private vehicle, and these patients were more severely injured, with higher ISS, lower GCS–motor scores, and greater likelihood of low blood pressure and high heart rate on presentation to the trauma center. Given these differences, higher unadjusted mortality for the EMS transport cohort is to be expected.
Prehospital Interventions and Mortality
Prehospital interventions with the aim of decreasing mortality include the use of tourniquets, which have been found to be life-saving among military personnel4,5 and effective at preventing exsanguination among civilians.7 In a study of civilian public mass shootings, injuries to the extremities were found to be the most common and the most frequently associated with vascular injury.21 Similarly, CRASH-2,10 a landmark study in trauma care, demonstrated the effectiveness of TXA in preventing all-cause mortality; further research demonstrated the effectiveness of prehospital TXA at reducing early mortality after trauma.8 In urban contexts, certain prehospital procedures, including
intubation, needle decompression, tourniquet placement, cricothyroidotomy, and Advanced Cardiovascular Life Support care, were associated with a lower incidence of mortality in severely injured trauma patients and did not delay transport to definitive care.9 Blood administration was associated with a significant reduction in the odds of longterm mortality among all trauma patients but was inconclusive about hemorrhagic trauma patients.22
However, other prehospital procedures—or the extra time required to perform them—are associated with higher mortality. Seamon et al23 found that performance of prehospital procedures was the sole independent predictor of mortality: For each prehospital procedure performed, the patient was 2.6 times more likely to die before hospital discharge. Other studies demonstrated that select interventions thought to be beneficial, such as. endotracheal intubation24 and intravenous crystalloid administration,25,26 were either not associated with a mortality benefit or were detrimental. A 2018 meta-analysis found that longboard spinal immobilization was associated with increased mortality in penetrating trauma and had no benefit in mitigating neurologic defects.27
Scene and Transport Intervals and Mortality
Shorter transit intervals may be a key driver of the lower mortality rates observed for private vehicle transports; however, transit intervals in the NTDB are not available for private vehicle cases and are largely missing for EMS. Previous work on this question using NTDB data has emphasized this limitation1,11–13,28
Longer transit time has been considered a cause of increased mortality, and previous work has found positive associations between mortality and transit times for penetrating injury trauma patients.29 This association has been demonstrated for general trauma,30 penetrating injuries,31 specifically thoracic,32 and cardiac33 penetrating injuries. However, other findings differ. A single-center study found that after an intervention that reduced transport times by seven minutes on average for abdominal vascular injuries, mortality increased dramatically.34 Longer scene times were associated with lower mortality for severe trauma patients35 or not associated with increased 30-day mortality after adjustment for other variables.36
Study Results in Context
Since the initial 2010 finding that the mortality rates were higher for GSW patients transported by EMS compared to those transported by private vehicle,1 efforts have been made to eliminate time-wasting EMS interventions27,37 and to increase only those EMS practices associated with a mortality benefit.7,8,10,23,38 However, our study found only a slight, but non-significant, improvement in the aOR for mortality of GSW patients transported by EMS compared to those transported by private vehicle.
Unlike prior NTDB analyses that provided brief snapshots of trauma outcomes, this longitudinal study captures a period spanning significant evolution of prehospital trauma care. Despite the proliferation of advanced prehospital interventions (eg, TXA, tourniquets), the survival advantage associated with private vehicle transport has persisted. For this analysis and others using NTDB data,1,11,13,28 exploration of transit time has been hampered by the high and varying rates of missing data. We attempted to investigate the EMS transport and scene intervals, but the rate of missingness—higher than 50% in some years—prevented making reliable assertions about changes in EMS intervals over time.
LIMITATIONS
Assuming the total duration of the prehospital interval (ie, time of injury to arrival at ED) is a central factor in the association with mortality, the absence of timing for this interval among patients transported by private vehicle presented a challenge. One study did establish the interval time between injury and arrival at a single large urban trauma center for both EMS-transported and private vehicletransported patients and found surprisingly little difference in transport intervals, except for more critically injured patients (ISS ≥ 13) whose transport by EMS was slower than for those transported by private vehicle.3
The NTDB data also limited our analysis in several ways. First, the data do not capture patients who were first transported to a non-trauma hospital due to proximity, ignorance, clinical severity, or error, and who died at that location. Second, not all trauma centers contribute data to the NTDB, and each center is responsible for its data quality, which may have affected the availability of complete cases relied upon for this analysis. Third, we were unable to adjust for clustering at the level of the transporting agency or hospital because the NTDB does not provide unique EMS agency identifiers, and we were not able to obtain hospital identifiers. Clustering would not affect the point estimates but would likely widen the confidence intervals, which would not change our conclusion of no significant decline.
Fourth, several potential confounders are not captured in the NTDB: prehospital interventions; hospital-level quality of care; delays in EMS activation; distance to hospital; total estimated blood loss volume; complete details of transfusion requirements or surgical procedures; the caliber, number, and energy of projectiles inflicting injury; and the setting in which such trauma occurred. Last, in the course of our analysis we discovered that several clinical and demographic variables suggest missingness not at random with respect to transport type and 30-day mortality.
Excluding data from Level III and IV trauma centers from the study limits the generalizability of our results. We used the ISS to control for severity of injury, which is a widely used approach. However, there may be other aspects of injury
severity that are not captured by this rating method. For example, the ISS categorizes a “severe” injury to the head, neck, chest, or abdomen equally to a “severe” injury to an extremity. However, the clinical challenges of hemorrhage control and hemorrhagic shock differ significantly across these body regions, with substantially different mortality outcomes. The ISS does not apply weighted adjustments to account for these differences, thus limiting its effectiveness as a control for clinically significant injuries with a higher likelihood of mortality. The observational design of our study cannot establish a causal relationship between the mode of transport and mortality outcome.
Efforts to reduce the excess mortality among GSW patients associated with EMS transport must continue. A primary improvement would be the deterministic linkage of prehospital registries (eg, National Emergency Medical Services Information System) with hospital outcomes data (eg, NTDB). Such longitudinal datasets would allow for the analysis of specific prehospital interventions, such as the exact timing of tourniquet application or duration of the prehospital interval, and their impact on hospital outcomes such as mortality. Crucially, this linkage would enable multilevel analyses that cluster by EMS agency to determine whether prehospital practice heterogeneity (eg, staffing models, agency type, protocol variability) are associated with observed mortality differences.
Additional research identifying and quantifying the effectiveness of existing or novel prehospital interventions (eg, prehospital blood administration) and their impact on mortality can help advance the growing knowledge of what improves survival. Improving the robustness of injury severity ratings so that they are validated for alignment with medical intervention intensity and mortality risk in situations of active hemorrhage can improve our ability to understand survival epidemiology. Causal research into this question is not possible because data cannot be collected on prehospital care of personal vehicle-transported patients, and randomization is obviously impossible. However, improving the quality and scope of observational data would support stronger observational designs.
Educational research on best methods to effectively train EMS clinicians in caring for trauma patients could also help improve patient mortality by better matching field practice with optimal interventions. Finally, additional research is needed on the structural disparities driving transport decision, specifically examining how race, socioeconomic status, and community violence influence the likelihood of EMS versus personal vehicle transport.
CONCLUSION
In this retrospective analysis of gunshot wound patients, EMS transport remained associated with higher odds of mortality compared to private vehicle transport. Despite
Muller et al.
Temporal Trends in Mortality from GSW for EMS Compared to Private Vehicle Transport
reported improvements to EMS clinical and transport practices over the 15-year study period, we did not observe a statistically significant narrowing of the relative mortality gap between transport modes, highlighting an ongoing opportunity for EMS system improvement. These findings represent associations and not causal relationships. Deterministic linkages between prehospital and in-hospital trauma registries represents a valuable improvement in determining the effectiveness of prehospital interventions and their impact on mortality. There is little evidence of a shift in the demographic composition of the GSW population except for a small increase in older patients (≥ 25 years of age) and female patients.
Address for Correspondence: Gregory Muller, DO, Stanford University School of Medicine, Department of Emergency Medicine, 900 Wlech Rd. Ste. 350, Palo Alto, CA 94304. Email: emergency-care-hsr-dcc@stanford.edu.
Conflicts of Interest: By the WestJEM article submission agreement, all authors are required to disclose all affiliations, funding sources and financial or management relationships that could be perceived as potential sources of bias. No other author has professional or financial relationships with any companies that are relevant to this study. There are no other conflicts of interest or sources of funding to declare.
1. Zafar SN, Haider AH, Stevens KA, et al. Increased mortality associated with EMS transport of gunshot wound victims when compared to private vehicle transport. Injury. 2014;45(9):1320-1326.
2. Demetriades D. Paramedic vs Private Transportation of Trauma Patients: Effect on Outcome. Arch Surg. 1996;131(2):133.
3. Cornwell III EE, Belzberg H, Hennigan K, et al. Emergency medical services (EMS) vs non-EMS transport of critically injured patients: A prospective evaluation. Arch Surg. 2000;135(3):315-319.
4. Beekley AC, Sebesta JA, Blackbourne LH, et al. Prehospital Tourniquet Use in Operation Iraqi Freedom: Effect on Hemorrhage Control and Outcomes. J Trauma Inj Infect Crit Care 2008;64(2):S28-S37.
5. Kragh JF, Walters TJ, Baer DG, et al. Survival With Emergency Tourniquet Use to Stop Bleeding in Major Limb Trauma. Ann Surg 2009;249(1):1-7.
6. Hobensack M and Phan N. Tranexamic Acid During Prehospital Transport in Patients at Risk for Hemorrhage After Injury; A Doubleblind, Placebo-Controlled, Randomized Clinical Trial. J Emerg Med 2021;60(3):416-417.
7. Passos E, Dingley B, Smith A, et al. Tourniquet use for peripheral vascular injuries in the civilian setting. Injury. 2014;45(3):573-577.
8. Almuwallad A, Cole E, Ross J, et al. The impact of prehospital TXA
on mortality among bleeding trauma patients: A systematic review and meta-analysis. J Trauma Acute Care Surg. 2021;90(5):901-907.
9. Meizoso JP, Valle EJ, Allen CJ, et al. Decreased mortality after prehospital interventions in severely injured trauma patients. J Trauma Acute Care Surg. 2015;79(2):227-231.
10. CRASH-2 trial collaborators. Effects of tranexamic acid on death, vascular occlusive events, and blood transfusion in trauma patients with significant haemorrhage (CRASH-2): a randomised, placebocontrolled trial. Lancet. 2010;376:23-32.
11. Wandling MW, Nathens AB, Shapiro MB, et al. Association of Prehospital Mode of Transport With Mortality in Penetrating Trauma: A Trauma System–Level Assessment of Private Vehicle Transportation vs Ground Emergency Medical Services. JAMA Surg 2018;153(2):107-113.
12. Nasser AAH and Khouli Y. The Impact of Prehospital Transport Mode on Mortality of Penetrating Trauma Patients. Air Med J 2020;39(6):502-505.
13. Atkins K, Schneider A, Gallaher J, et al. The effect of transport mode on mortality following isolated penetrating torso Trauma. Am J Surg 2023;226(4):542-547.
14. Orhon R, Eren SH, Karadayi S, et al. Comparison Of Trauma Scores For Predicting Mortality And Morbidity On Trauma Patients. Turk J Trauma Emerg Surg. 2014;20(4):258-264.
15. Lovely R, Trecartin A, Ologun G, et al. Injury Severity Score alone predicts mortality when compared to EMS scene time and transport time for motor vehicle trauma patients who arrive alive to hospital. Traffic Inj Prev. 2018;19(sup2):S167-S168.
16. Huebinger R, Chan HK, Reed J, et al. National trends in prehospital penetrating trauma in 2020 and 2021. Am J Emerg Med 2023;72:183-187.
17. Kalesan B and Galea S. Patterns of gun deaths across US counties 1999-2013. Ann Epidemiol. 2017;27(5):302-307.
18. Foran CP, Clark D, Henry R, et al. Current Burden of Gunshot Wound Injuries at Two Los Angeles County Level I Trauma Centers. J Am Coll Surg. 2019;229(2):141-149.
19. Gross BW, Cook AD, Rinehart CD, et al. An epidemiologic overview of 13 years of firearm hospitalizations in Pennsylvania. J Surg Res 2017;210:188-195.
20. Moore DC, Yoneda ZT, Powell M, et al. Gunshot Victims at a Major Level I Trauma Center: A Study of 343,866 Emergency Department Visits. J Emerg Med. 2013;44(3):585-591.
21. Czaja MP, Kraus CK, Phyo S, et al. Nonfatal Injuries Sustained in Mass Shootings in the US, 2012-2019: Injury Diagnosis Matrix, Incident Context, and Public Health Considerations. West J Emerg Med. 2023;24(3):552-565.
22. Rijnhout TWH, Wever KE, Marinus RHAR, et al. Is prehospital blood transfusion effective and safe in haemorrhagic trauma patients? A systematic review and meta-analysis. Injury. 2019;50(5):1017-1027.
23. Seamon MJ, Fisher CA, Gaughan J, et al. Prehospital Procedures Before Emergency Department Thoracotomy: “Scoop and Run” Saves Lives. J Trauma Inj Infect Crit Care. 2007;63(1):113-120.
24. Shafi S and Gentilello L. Pre-Hospital Endotracheal Intubation and Positive Pressure Ventilation Is Associated with Hypotension and Decreased Survival in Hypovolemic Trauma Patients: An Analysis of the National Trauma Data Bank: J Trauma Inj Infect Crit Care November 2005:1140-1147.
25. Dretzke S, Sandercock J, Bayliss S, et al. Effectiveness of prehospital intravenous fluids in trauma patients. Health Technol Assess. 2004;8(23):1-123.
26. Bickell WH, Wall MJ, Pepe PE, et al. Immediate versus Delayed Fluid Resuscitation for Hypotensive Patients with Penetrating Torso Injuries. N Engl J Med. 1994;331(17):1105-1109.
27. Velopulos CG, Shihab HM, Lottenberg L, et al. Prehospital spine immobilization/spinal motion restriction in penetrating trauma: A practice management guideline from the Eastern Association for the Surgery of Trauma (EAST). J Trauma Acute Care Surg. 2018;84(5):736-744.
28. Nasser AAH, Nederpelt C, El Hechi M, et al. Every minute counts: The impact of pre-hospital response time and scene time on mortality of penetrating trauma patients. Am J Surg. 2020;220(1):240-244.
29. Harmsen AMK, Giannakopoulos GF, Moerbeek PR, et al. The influence of prehospital time on trauma patients outcome: A systematic review. Injury. 2015;46(4):602-609.
30. McCoy CE, Menchine M, Sampson S, et al. Emergency medical services out-of-hospital scene and transport times and their association with mortality in trauma patients presenting to an urban
Level I trauma center. Ann Emerg Med. 2013;61(2):167-174.
31. Brown JB, Rosengart MR, Forsythe RM, et al. Not all prehospital time is equal: Influence of scene time on mortality. J Trauma Acute Care Surg. 2016;81(1):93-100.
32. Swaroop M, Straus DC, Agubuzu O, et al. Pre-hospital transport times and survival for Hypotensive patients with penetrating thoracic trauma. J Emerg Trauma Shock. 2013;6(1):16-20.
33. Mina MJ, Jhunjhunwala R, Gelbard RB, et al. Factors affecting mortality after penetrating cardiac injuries: 10-year experience at urban level I trauma center. Am J Surg. 2017;213(6):1109-1115.
34. Ball CG, Williams BH, Tallah C, et al. The impact of shorter prehospital transport times on outcomes in patients with abdominal vascular injuries. J Trauma Manag Outcomes. 2013;7(1):11.
35. Kim J, Song KJ, Shin SD, et al. Does Prehospital Time Influence Clinical Outcomes in Severe Trauma Patients?: A Cross Sectional Study. Prehosp Emerg Care. 2017;21(4):466-475.
36. Funder KS, Petersen JA, and Steinmetz J. On-scene time and outcome after penetrating trauma: an observational study. Emerg Med J. 2011;28(9):797-801.
37. Liberman M, Mulder D, Lavoie A, et al. Multicenter Canadian Study of Prehospital Trauma Care. Ann Surg. 2003;237(2):153-160.
38. Kauvar DS, Dubick MA, Walters TJ, et al. Systematic review of prehospital tourniquet use in civilian limb trauma. J Trauma Acute Care Surg. 2018;84(5):819-825.
A Quality Improvement Campaign Reduces Head and Cervical Spine Imaging in Low-risk Trauma Patients
Jude C. Luke, MD*o
Rebecca N. Kubick, BA*o
Heidi J. Sucharew, PhD†
Kayla Winkler, MHA‡
Mary L. Giles, BS‡
Natalie E. Kreitzer, MD, MS†
Anita L. Goel, MD†§-
David O. Thompson, MD, MPH†§
Section Editor: Pierre Borczuk, MD
University of Cincinnati College of Medicine, Cincinnati, Ohio
University of Cincinnati, Department of Emergency Medicine, Cincinnati, Ohio
University of Cincinnati Health, Office of Performance Improvement, Cincinnati, Ohio
Co-first authors
Co-senior authors
Submission history: Submitted August 19, 2025; Revision received March 14, 2026; Accepted March 16, 2026
Electronically published July 16, 2026
Full text available through open access at http://escholarship.org/uc/uciem_westjem DOI 10.5811/westjem.50707
Introduction: While computed tomography (CT) is invaluable for detecting life-threatening injuries in the emergency department (ED), the literature shows increasing use of head CT and cervical spine CT in low-risk trauma patients without a corresponding rise in injuries identified. These low-yield exams expose patients to avoidable radiation, increase costs, and contribute to inefficiencies in already overburdened EDs. In this study we evaluated the impact of a multimodal quality improvement (QI) campaign to reduce the use of head and cervical spine CT in low-risk trauma patients.
Methods: This prospective QI intervention involved two EDs within one healthcare network: an academic trauma center and a community hospital. We collected data on baseline CT use for six months, followed by a 23-month intervention period. Primary outcomes were monthly rates of low-risk trauma head and cervical spine CT per 100 ED patients; secondary outcome was the rate of all-cause CT use per 100 ED patients. We plotted rates over time using u-charts with mean-shift lines. Pre- and post-shift differences were summarized as rate ratios (RR) with 95% confidence intervals, compared using the Poisson test.
Results: Use of head CT for low-risk trauma decreased from 5.00 to 4.01 per 100 patients at the academic site (RR = 0.80, 95% CI, 0.75-0.86, P < .001) and from 6.64 to 5.12 per 100 patients at the community site (RR 0.77, 95% CI, 0.73-0.82, P < .001). Use of cervical spine CT for low-risk trauma decreased from 3.36 to 2.83 per 100 patients at the academic site (RR = 0.84, 95% CI, 0.78-0.91, P < .001) and from 4.31 to 3.49 at the community site (RR = 0.81, 95% CI, 0.75-0.87, P < .001). Allcause CT use decreased at the academic site from 53.06 to 47.91 CT exams per 100 patients [RR = 0.90, 95% CI, 0.89-0.92, P < .001] but remained unchanged at the community site.
Conclusion: A structured quality improvement campaign led to a significant reduction in the use of head and cervical spine CT in low-risk trauma patients. These findings provide a framework for promoting evidence-based imaging practice. [West J Emerg Med. 2026;27(4)947–955.]
INTRODUCTION
United States emergency departments (EDs) see approximately 2.5 million head injuries annually, many of which are mild traumatic brain injuries.1 Computed
tomography (CT) imaging is highly effective in detecting acute intracranial injury and is the recommended tool for evaluation of traumatic head and cervical spine injuries.2 Several studies have reported on the substantial increase in the
use of CT in EDs in recent decades, including increasing use to evaluate head and cervical spine injuries.3-9 The National Hospital Ambulatory Medical Care Survey found that from 1995–2007 the number of U.S. ED visits that included a CT exam increased from 2.7 million to 16.2 million—a 5.9-fold increase—without a reciprocal increase in the prevalence of life-threatening conditions or hospital admissions.3,10 This suggested overuse of CT exposes patients to increased cumulative ionizing radiation and imposes excess financial and logistic burdens on the healthcare system.11-13
Recognizing this, the American College of Emergency Physicians identified reduction in the use of head CT in low-risk trauma patients as one of the top initiatives in their 2015 Choosing Wisely campaign.14 The problem of CT overuse, both all-cause and for low-risk trauma patients, has nevertheless persisted. A 2021 study of 305 EDs found that up to 72% of patients with minor head injuries were receiving head CTs, and suggested quality improvement (QI) initiatives to improve imaging stewardship and reduce low-value care.4 Another study found that over a third of head CT exams performed for trauma in the ED are likely not indicated.15 A separate study conducted at a Level I trauma center reported that 16% of cervical spine CT exams ordered did not have an indication according to clinical decision rule (CDR) criteria. Indeed, among these seemingly unnecessary cervical spine CT exams, no cervical injuries were identified.16
Several validated CDRs exist to reduce head and cervical spine imaging in low-risk trauma patients. These include the Canadian CT Head Rules (CCHR), New Orleans Criteria, and NEXUS (National Emergency X-Radiography Utilization Study) Criteria for head injuries, as well as the Canadian C-Spine Rules and NEXUS Criteria for C-spine injuries. Despite these CDRs being widely available and easy to apply, significant heterogeneity continues to be observed in the rates of head and cervical spine CT exams ordered by individual emergency physicians.17-21 This presents an opportunity to bridge the gap between evidence-based guidelines and current clinical practice patterns by investigating the factors behind these discrepancies and implementing strategies to resolve these clinical variations.22-23
Existing literature on successful ED initiatives to reduce the use of head CT24-28 and cervical spine CT29-30 exams in low-risk adult trauma patients has emphasized the paramount importance of facilitating access to and understanding of CDRs. One multicenter simulation-based randomized controlled trial identified that engaging clinicians in evidencebased education on three topics—CDRs, clinician fears of malpractice litigation, and the institutional and patient costs of excess CT use—was sufficient to precipitate a 21.1% reduction in CT ordering.31 The importance of patient education has also been emphasized, given that a common motivator behind unnecessary CT ordering is patient insistence.24 Across both the adult and pediatric interventions reviewed, the most consistent contributors to successful
Population Health Research Capsule
What do we already know about this issue?
Overuse of head and cervical computed tomography (CT) in low-risk trauma patients exposes patients to avoidable radiation while increasing costs without benefit.
What was the research question?
Can a quality improvement (QI) campaign safely reduce head and cervical CT use in lowrisk trauma patients?
What was the major finding of the study?
Per 100 patients, head CT use decreased from 5.00 to 4.01 at the academic ED, and from 6.64 to 5.12 at the community ED, while cervical CT decreased from 3.36 to 2.83 (academic) and 4.31 to 3.49 (community), all p < .001.
How does this improve population health?
A QI campaign led to a significant reduction in head and cervical CT exams in low-risk trauma patients, promoting safety and cost effectiveness.
reductions in the use of head and cervical spine CT in low-risk trauma patients are computer-assisted clinical decision support, clinician and patient education, and performance feedback.24-40 Emergency clinician surveys and reports of unsuccessful attempts to reduce head and cervical spine CT imaging for low-risk trauma patients have identified patient expectations, clinician confidence, medicolegal concerns, and ineffective education efforts as influential barriers to compliance with established CDRs in practice.41, 42
Prior to initiating this study, routine attending physician reviews within our health system revealed wide inter-clinician variability in rates of all-cause CT per 100 patients, with head CT, cervical spine CT, and CT abdomen/pelvis representing the most frequently ordered studies. Because validated CDRs exist to guide appropriate head and cervical spine CT use in trauma cases, we hypothesized that these two high-volume modalities would be the most amenable to standardized initiatives aimed at reducing practice variability. Therefore, in this study we focused on low-risk trauma patients, with the purpose of evaluating a multimodal QI initiative in reducing the use of head and cervical spine CT in these patients. We sought to achieve this goal by targeting driving factors behind our variable clinician practice patterns, especially in circumstances when CT was ordered outside CDR indications.
METHODS
Study Design and Rationale
We conducted a prospective, dual-site QI campaign designed to reduce the use of head and cervical spine CT among low-risk adult trauma patients in the ED. For this study we employed a pre/post intervention model that incorporated baseline assessment of CT-ordering patterns, survey-based identification of barriers to adherence with evidence-based CDRs, and implementation of targeted interventions to address these barriers. Baseline clinician CT-ordering patterns were obtained retrospectively over the 6-month pre-intervention period; survey results and subsequent ordering data were collected prospectively during the intervention period.
Study Setting and Clinician Population
This study was conducted simultaneously across two EDs within a Midwest U.S. healthcare network. The first site is an urban academic tertiary ED and Level I trauma center with approximately 60,000 patient encounters annually. The second site is a community hospital ED and Level III trauma center with approximately 40,000 patient encounters annually. Clinicians at both EDs received information about the study followed by consent to participate. Consenting clinicians included 66 board-certified emergency medicine faculty physicians, 21 advanced practice clinicians (APC), and 63 resident/fellow physicians training in emergency medicine. Patients in the study were either seen independently by an attending physician or jointly by an attending with a resident physician or APC. The 23-month continuous intervention period lasted from July 2022–June 2024. Institutional review board approval was obtained prior to the start of the study.
Patient Inclusion Criteria
Inclusion and exclusion criteria are summarized in Figure 2. Coinciding with the intervention period, all patients ≥ 18 years of age who received any type of CT in either ED between July 2022–June 2024 were considered for inclusion in the study. We collected data from the electronic health record, excluding patients < 18 years of age and patients whose CT orders were canceled. As noted in Figure 1, this initial group of patients and CT orders made up the secondary outcome of all-cause CT per 100 ED patients seen.
We identified the primary analysis cohort of low-risk trauma patients from this list of adult patients with all-cause CT, using the following exclusion criteria: patients without a head or cervical spine CT; and patients who were determined to not be low-risk trauma. Low-risk trauma patients were defined using chief complaint and primary diagnosis. Patients with “stroke symptoms” or “fever,” for example, were categorized as atraumatic, while patients with “MVC” (motor vehicle collision) or “stab wound” were categorized as traumatic. We excluded atraumatic cases from the primary analysis cohort. Patients with any trauma surgery activation were also excluded because these cases are defined by high-
Figure 1. This diagram of performance improvement methodology summarizes the specific goals of the quality improvement campaign, the drivers of computed tomography use, and interventions proposed to reduce use.
APC, advanced practice clinician; CCHR, Canadian CT Head Rule, CDR, clinical decision rule; CSCT, cervical spine computed tomography; EHR, electronic health record; HCT, head computed tomography; NEXUS, National Emergency X-ray Utilization Study; TBI, traumatic brain injury.
risk trauma features. The remaining patients were classified as low risk for trauma and included in the primary analysis.
Pre-Intervention Survey Administration
To identify drivers of CT ordering, we distributed two brief cross-sectional surveys to all 150 clinicians in both EDs; one survey focused on head CT practice patterns and the other on cervical spine CT practice patterns. Surveys were administered
Figure 2. Inclusion and exclusion criteria for primary and secondary analyses in a study evaluating the impact of a quality improvement campaign to reduce use of head and cervical spine computed tomography in low-risk trauma patients.
via REDCap data capture software and included multiple-choice and open-response items assessing use of CDRs, typical imaging approaches, and perceived system-level barriers. Response rates were 52% for the head CT survey and 39% for the cervical spine CT survey. Responses were reviewed by blinded investigators, and we used qualitative themes to inform selection of QI interventions and shape the educational content delivered during the campaign.
Interventions
The QI team organizing this campaign consisted of two emergency physicians, two performance improvement specialists employed by the health system, and a data analyst. Based on themes derived from clinician survey results, key drivers of unnecessary CT ordering were identified, and interventions were proposed to target each driver. For example, clinicians often expressed feeling pressured to order studies based on patient preference. To address this, the QI team created informative handouts to facilitate evidence-based discussions with patients regarding CT indications. Each key driver identified through the clinician survey was addressed similarly. The team worked together to choose interventions that were easy to implement administratively, straightforward to track, and would not be cumbersome to deploy among a large group of clinicians. The key drivers identified and corresponding interventions are outlined in Figure 1.
In addition to survey results, the QI campaign was informed by literature on similar successful campaigns. To encourage clinician adherence to validated CDRs, we embedded clinical decision support software (AgileMD Inc, San Francisco, CA) within the EHR, rather than hard-stop best practice advisories (BPAs). Education on the use of AgileMD was delivered via email and departmental presentations.
This QI campaign had a strong clinician education focus to standardize knowledge and care patterns. Clinician education efforts consisted of presentations on elements of CDRs, evidence behind the creation of these rules, baseline CT rates, and explanations of the interventions proposed to decrease the use of CT for low-risk trauma. To ensure that the educational content reached all clinicians, these presentations were given at the annual faculty retreat (approximately 80% in attendance), the annual APC retreat (70% in attendance), and during emergency medicine grand rounds, which are well attended by residents and faculty. Additionally, continued education content and reminders about the goals of the campaign were sent to clinicians by email monthly. Throughout the intervention period, individualized CT-ordering data was sent to clinicians quarterly, and departmental data were shared monthly. The CT-ordering data were always de-identified prior to dissemination to protect individual privacy. Individualized reports allowed each clinician to see where they stood in relation to their peers, with peers anonymized.
Safety Review
To assess the safety of our interventions, investigators
identified all patients (including nontrauma) over the course of the study who had 72-hour return ED visits resulting in admission; the focus was on missed injuries of the head or cervical spine on the first visit. They manually reviewed charts from the second visit to determine whether head or cervical spine injuries were identified on imaging that had not been performed during the initial visit. Patient encounters with a head or cervical spine CT obtained on their second visit underwent manual chart review to determine whether a head or cervical spine injury was discovered on imaging that had not been not discovered on the first visit due to lack of CT ordering. We tallied the total raw number of patients with a missed head or cervical spine injury.
Costs
We calculated the cost of the QI campaign by estimating the hours spent by the faculty leads, the data analyst, and the QI analysts along with an average salary rate for each. The total annual cost was calculated as the sum of the hours spent multiplied by estimated hourly pay. Cost also included the annual software license fee multiplied by percentage attributable to this project. We estimated the average reduction in total patient charges by multiplying the cost of a CT by the reduction in CT orders observed.
Statistical Analysis
We stratified analyses by academic and community ED sites. Demographics were summarized using count (percentage) for age, sex, race, and payor groups. The primary outcomes were monthly rates of low-risk trauma head CT and cervical spine CT per 100 patient encounters in the ED. The secondary outcome was the all-cause CT rate per 100 ED patient encounters.
For the primary outcome, outcome measures were displayed as u-charts, appropriate for count data. Interventions were noted throughout the u-charts by date of initiation so that any subsequent changes in CT ordering practices could be visualized. The centerline was plotted as the mean of the measure with baseline as the first 10 months (January–October 2022). The lower and upper control limits were estimated at three standard deviations below or above the centerline using a Poisson distribution. Based on standard QI methodology, a shift in the mean was indicated when there were eight points in a row on the same side of the center line. At these points, the center line and control limits were recalculated. For outcome measures with an observed shift in the mean, we compared the baseline rate to the shifted rate using a Poisson test along with the calculated rate ratio (RR) and 95% confidence interval. A similar analysis was performed for the secondary analysis of all-cause CTs ordered at academic and community sites. All analyses were performed using Excel v2408 (Microsoft Corp, Redmond, WA) with QI macro and SAS v9.4 (SAS Institute Inc, Cary, NC).
Demographic data of patients in both departments was determined retrospectively, including data that preceded the interventions to capture baseline characteristics. Demographic
analysis extended beyond the intervention period to capture data that could be timely and relevant to conclusions.
RESULTS
Among low-risk trauma patients with head CT, the percentage of those > 65 years of age was higher in the community ED (70.1%) than the academic site (33.3%) and for cervical spine CT the percentage of patients > 65 years of age was 23.2% community and 19.4% academic. Relative percent declines in low-risk trauma HCTs were 19.8% and 15.77% at the academic and community EDs, respectively.
Over the 23-month intervention period, there was a statistically significant reduction in low-risk trauma head CT and cervical spine CT ordering at both our academic and community ED sites. The mean rate of low-risk trauma head CT per 100 patients was reduced from 5.00 to 4.01 at the academic site (RR = 0.80, 95% CI, 0.75-0.86, P < .001) and from 6.64 to 5.12 at the community site (RR = 0.77, 95% CI, 0.73-0.82, P < .001) (Figures 3 and 4).
The mean rate of low-risk trauma cervical spine CT per 100 patients was reduced from 3.36 to 2.83 at the academic site (RR = 0.84, 95% CI, 0.78-0.91, P < .001) and from 4.31 to 3.49 at the community site (RR = 0.81, 95% CI, 0.75-0.87, P < .001) (Figures 5 and 6). Low-risk trauma cervical spine CTs were reduced by 15.77% at the academic ED and 19.02% at the community ED.
At the academic site, the intervention resulted in an estimated 594 fewer low-risk trauma head CT exams and 318 fewer low-risk trauma cervical spine CT exams per year. At the community site, the intervention resulted in an estimated 608 fewer low-risk trauma head CT exams and 328 fewer low-risk trauma cervical spine CT exams per year. For the secondary analysis, there was a statistically significant reduction in all-cause CT use at the academic site from 53.06 to 47.91 per 100 patients
Figure 3. Rate of computed tomography for head trauma per 100 patient encounters, by month, in an academic ED. Quality improvement campaign intervention milestones are noted temporally along the chart. ED, emergency department; HCT, head computed tomography.
Figure 4. Rate of computed tomography for head trauma per 100 patient encounters in a community ED by month.
Quality improvement campaign intervention milestones are noted temporally along the chart.
Relative percentage declines in low-risk trauma head CTs were 19.8% and 15.77% at the academic and community EDs, respectively. APC, advanced practice clinician; ED, emergency department; HCT, head computed tomography.
(RR = 0.90, 95% CI, 0.89-0.92, P < .001), corresponding with a relative reduction of 9.71%. All-cause CT use at the community site remained unchanged from the baseline value of 49.6 per 100 patients. As per our safety review of all patients who returned to the ED after a traumatic injury within 72 hours and subsequently required admission, we identified no dangerous missed head or cervical spine injuries during our study.
The estimated cost of the QI campaign was $20,000 annually. Two academic ED faculty spent 5-10 hours per month on the project. The data analyst spent 1-2 days per month extracting and organizing the CT data. The QI specialists spent 1-3 hours per month on the project. Software licensing to embed clinical pathways of CDRs into the EHR also carried associated costs, which are included in this estimate. However, the campaign resulted in 1,848 fewer CTs ordered annually. At an average cost of $1750 per CT, this means we avoided approximately $3,234,000 per year in unnecessary patient charges through our investment.
DISCUSSION
Our results demonstrated a statistically significant reduction in low-risk trauma head CT and cervical spine CT ordering at both our academic and community EDs. We additionally found that all-cause CT use remained stable over the study period at the community site and even decreased slightly at the academic site. Given that the natural history of CT use has been a general increase over time based on reports in the literature,3-10 our data suggest that our QI campaign was a driving factor behind these observed trends in the secondary outcome of all-cause CT reduction. Higher rates of low-risk trauma head and cervical
5. Rate of trauma cervical computed tomography per 100 patient encounters at the academic ED by month. Quality improvement campaign intervention milestones are noted temporally along the chart.
spine CT observed at our community site compared to the tertiary Level I trauma center could in part be due to an older patient population; however, this study was not designed to compare academic and community CT rates. Further research would be needed to explain these findings more conclusively. Review of the u-charts and timing of mean shifts do not point to any one single intervention that we can attribute to a reduction in CT use; rather, the effect was likely cumulative. At the academic site, shifts in low-risk trauma patient head and cervical spine CT rates occurred after we began providing more
Figure 6. Rate of trauma cervical spine computed tomography exams per 100 patient encounters at a community ED by month. Quality improvement campaign intervention milestones are noted temporally along the chart.
APC, advanced practice clinician; CT, computed tomography; ED, emergency department.
frequent individual feedback and delivering educational lectures at faculty, APC, and resident meetings. In contrast, at the community site, shifts in the means occurred a year earlier. Because this site is primarily staffed by attending physicians and senior residents, the earlier change may reflect a Hawthorne effect following departmental announcements that low-risk trauma CT reduction would soon be a priority. However, this effect alone would likely produce only a temporary shift. The sustained change observed at both sites is more consistent with the combined impact of our QI interventions, including education, regular clinician feedback, and embedded clinical decision support. These components align with strategies used in other successful adult and pediatric QI campaigns.40
In comparison to the existing literature on the topic, our approach to implementation of CDRs in the EHR differed from prior studies on CT reduction. Specifically, many previous QI efforts in both the pediatric and adult literature rely on “hard stop” tools, such as best practice advisory alerts that prevent clinicians from placing CT orders without confirming CDR use. Anticipating poor long-term acceptance of such alerts within our system, we instead adopted AgileMD, an optional-use embedded CDR software. Even without mandatory use, this intervention was temporally associated with reduced CT use across both sites, suggesting that accessible CDRs combined with clinician education can still promote evidence-based imaging reduction without the use of hard stop tools.
Because our academic department identified overuse of all-cause and low-risk trauma CT imaging as an opportunity for improvement, a modest investment was made to support the work. However, the reduction in CT orders would coincide with a reduction in unnecessary patient charges through this investment. Cost effectiveness would be an avenue for future research on similar QI campaigns.
The safety of reducing imaging in low-risk trauma was an essential consideration in this campaign. Review of the medical records for patients returning within 72 hours revealed no missed clinically important head or cervical spine injuries at either site, supporting the safety of our approach. This aligns with extensive evidence demonstrating that known head and cervical spine CDRs have high negative predictive values for clinically significant injuries and are safe to apply in routine practice. Our interventions including encouragement of known CDRs were also implemented within EDs that already maintain structured quality and safety oversight programs, including clinician-initiated case referrals, peer review processes, and regular morbidity and mortality conferences.
No adverse outcomes attributable to the campaign were identified through these mechanisms or chart review of patients returning within 72 hours who required admission. Although it is possible that some patients may have sought care at outside hospitals and, therefore, would not appear in our 72-hour return-admission review, we believe the likelihood of clinically important missed injuries escaping detection is low given that no such injuries were identified
Figure
Table 1. Demographic characteristics of emergency department patients at the academic and community sites within our health system from January 2020–December 2024, including all patients who underwent head or cervical spine computed tomography imaging for low-risk trauma.
among patients who did return to our sites. Based on our experience, we recommend that EDs adopting similar QI efforts ensure that comparable safety review structures are in place to monitor unintended consequences.
Overall, our findings indicate that a multimodal intervention including clinician and patient education, consistent clinician feedback, and CDRs embedded in the EHR can effectively reduce head and cervical CT exams in low-risk trauma patients, while maintaining patient safety outcomes. Short-term results were promising, but ongoing data collection is needed to assess sustainability of our interventions. Some regression is expected with less-frequent feedback, yet several campaign elements remain in place. Patient education handouts and embedded CDRs continue to be used. Although the formal QI campaign ended to allow focus on other department priorities, these components are likely to sustain the positive trend in CT use for low-risk head and cervical spine trauma. The hope is that our educational elements and overall campaign have caused a long-term culture shift with respect to clinician use of CT in low-risk trauma patients.
LIMITATIONS
Physicians practicing at the community site within this hospital system also work at and conduct research through the academic institution and may demonstrate ordering patterns similar to those at the academic site. Thus, it would be difficult to generalize our community ED findings to standalone community EDs. The study was not designed to examine clinicians’ practice patterns at the academic ED compared to the community ED but may represent an area of opportunity for future QI projects or research.
Additionally, there is no gold standard in the emergency medicine literature for the “correct” number of CT exams to order per 100 patients. Rates of CT use are governed by individual site-specific characteristics such as trauma center designation, individual patient characteristics (age, mechanism of injury, rate of anticoagulation, etc), and regional physicianordering practices. Therefore, results from this study may not be generalizable to all EDs.
This study is also subject to bias, namely the Hawthorne
HCT, head computed tomography; CSCT, cervical spine computed tomography.
Campaign Reduces Head and Cervical Spine Imaging in Low-risk Trauma Patients
effect. Clinicians may have changed their imaging practices simply due to the awareness of being observed, independent of the intervention’s impact. We sought to mitigate this bias by establishing a six-month pre-intervention baseline prior to introducing this project to clinicians and used the preintervention baseline to compare results of our post-intervention data with use of sensitivity analyses to ensure statistical significance. Moreover, because the study was not a randomized controlled trial, it was challenging to statistically assess the influence of individual interventions from this multimodal campaign. Future studies designed as randomized controlled trials or with methods to assess comparative effectiveness could provide more definite conclusions regarding the value and weight of individual intervention components.
CONCLUSION
Using quality improvement science, a multimodal campaign integrating patient and clinician education, data feedback, and EHR decision support significantly reduced head CT and cervical spine CT use in low-risk trauma patients. These findings provide a translatable and scalable framework to address unnecessary imaging in the ED and promote evidencebased clinical decision-making in emergency care.
ACKNOWLEDGMENTS
Gregory J. Fermann, MD, Kenneth Robert Thompson III, MD, MBA - University of Cincinnati College of Medicine, Department of Emergency Medicine
Address for Correspondence: David O. Thompson, MD, MPH, University of Cincinnati College of Medicine, Department of Emergency Medicine, Medical Sciences Building Room 1654, 231 Albert Sabin Way, PO Box 670769, Cincinnati, OH 45267-0769. Email: thomp2dp@ucmail.uc.edu.
Conflicts of Interest: By the West JEM article submission agreement, all authors are required to disclose all affiliations, funding sources and financial or management relationships that could be perceived as potential sources of bias. Natalie Kreitzer is a National Football League independent neurotrauma consultant and an inactive member of the Astra Zeneca Speaker Bureau. Gregory Fermann is an advisory board member for Milestone Pharmaceuticals. Natalie Kreitzer’s time is supported by NIH Grant K23HD102555. Anita Goel’s time is supported by a grant from Astra Zeneca for asthma quality improvement research. Gregory Fermann’s time is supported by a grant from Abbott Laboratories. No specific grant funding supported this project.
1. Taylor CA, Bell JM, Breiding MJ, et al. Traumatic brain injury–related emergency department visits, hospitalizations, and deaths—United
States, 2007 and 2013. MMWR Surveill Summ. 2017;66(9):1-16.
2. Wintermark M, Sanelli PC, Anzai Y, et al. Imaging evidence and recommendations for traumatic brain injury: advanced neuro- and neurovascular imaging techniques. Am J Neuroradiol. 2015;36(2):E1-11.
3. Larson DB, Johnson LW, Schnell BM, et al. National trends in CT use in the emergency department: 1995-2007. Radiology. 2011;258(1):164-73.
4. Venkatesh AK, Scofi JE, Rothenberg C, et al. Choosing wisely in emergency medicine: early results and insights from the ACEP emergency quality network (E-QUAL). Am J Emerg Med. 2021;39:102-108.
5. Yiadom MYAB, Napoli A, Granovsky M, et al. Managing and measuring emergency department care: results of the fourth emergency department benchmarking definitions summit. Acad Emerg Med. 2020;27(7):600-611.
6. Loftus TM, Wessling EG, Cruz DS, et al. Impact of the COVID pandemic on emergency department CT utilization: Where do we go from here? Emerg Radiol. 2022;29(5):879-885.
7. Kempter F, Heye T, Vosshenrich J, et al. Trends in CT examination utilization in the emergency department during and after the COVID-19 pandemic. BMC Med Imaging. 2024;24(1):283.
8. ElHabr A, Merdan S, Ayer T, et al. Increasing utilization of emergency department neuroimaging from 2007 through 2017. Am J Roentgenol. 2022;218(1):165-173.
9. Yun BJ, Borczuk P, Zachrison KS, et al. Utilization of head CT during injury visits to United States emergency departments: 2012–2015. Am J Emerg Med. 2018;36(8):1463-1466.
10. Korley FK, Pham JC, Kirsch TD. Use of advanced radiology during visits to US emergency departments for injury-related conditions, 1998-2007. JAMA. 2010;304(13):1465-1471.
11. Brenner DJ, Hall EJ. Computed tomography—an increasing source of radiation exposure. N Engl J Med. 2007;357(22):2277-2284.
12. Tien H, Tremblay L, Rizoli S, et al. Radiation exposure from diagnostic imaging in severely injured trauma patients. J Trauma. 2007;62(1):151-156.
13. National Research Council. Health Risks From Exposure to Low Levels of Ionizing Radiation: BEIR VII Phase 2. Washington, DC: National Academies Press; 2006:4-15.
14. American College of Emergency Physicians. ACEP announces list of tests as part of Choosing Wisely campaign. ACEP. 2013.
15. Sharp AL, Nagaraj G, Rippberger EJ, et al. Computed tomography use for adults with head injury: describing likely avoidable emergency department imaging based on the Canadian CT Head Rule. Acad Emerg Med. 2017;24(1):22-30.
16. Griffith B, Kelly M, Vallee P, et al. Screening cervical spine CT in the emergency department, phase 2: a prospective assessment of use. Am J Neuroradiol. 2013;34(4):899-903.
17. Stiell IG, Wells GA, Vandemheen K, et al. The Canadian CT Head Rule for patients with minor head injury. Lancet. 2001;357(9266):1391-1396.
18. Stiell IG, Clement CM, Rowe BH, et al. Comparison of the Canadian
CT Head Rule and the New Orleans Criteria in patients with minor head injury. JAMA. 2005;294(12):1511-1518.
19. Stiell IG, Clement CM, Grimshaw JM, et al. A prospective clusterrandomized trial to implement the Canadian CT Head Rule in emergency departments. CMAJ. 2010;182(14):1527-1532.
20. Hoffman JR, Mower WR, Wolfson AB, et al. Validity of a set of clinical criteria to rule out injury to the cervical spine in patients with blunt trauma. N Engl J Med. 2000;343(2):94-99.
21. Hoffman JR, Wolfson AB, Todd K, et al. Selective cervical spine radiography in blunt trauma: methodology of the national emergency X-radiography utilization study (NEXUS). Ann Emerg Med. 1998;32(4):461-469.
22. Stiell IG, Wells GA, Vandemheen K, et al. Variation in ED use of computed tomography for patients with minor head injury. Ann Emerg Med. 1997;30(1):14-22.
23. Laupacis A, Stiell I, Brison R, et al. Variation in emergency department use of cervical spine radiography for alert, stable trauma patients. CMAJ. 1997;156(11):1537-1544.
24. Masood S, Woolner V, Yoon JH, et al. Checklist for Head Injury Management Evaluation Study (CHIMES): a quality improvement initiative to reduce imaging utilisation for head injuries in the emergency department. BMJ Open Qual. 2020;9(1):e000811.
25. Kim JS, Carlucci M. Reducing unnecessary head computed tomographic scans in an adult emergency department. J Nurse Pract. 2021;17(6):749-752.
26. Ip IK, Raja AS, Gupta A, et al. Impact of clinical decision support on head computed tomography use in patients with mild traumatic brain injury in the ED. Am J Emerg Med. 2015;33(3):320-325.
27. Sharp AL, Huang BZ, Tang T, et al. Implementation of the Canadian CT Head Rule and its association with use of computed tomography among patients with head injury. Ann Emerg Med. 2018;71(1):54-63.e2.
28. Rowe BH, Yang E, Corrick S, et al. Reducing computed tomography imaging for adults with minor traumatic brain injuries in the emergency department. BMJ. 2024;386:e074867.
29. Baker M, Jaeger C, Hafley C, et al. Appropriate CT cervical spine utilisation in the emergency department. BMJ Open Qual. 2020;9(4):e000844.
30. Griffith B, Kelly M, Vallee P, et al. Screening cervical spine CT in the emergency department, phase 2: a prospective assessment of use. Am J Neuroradiol. 2013;34(4):899-903.
31. Gimbel RW, Pirrallo RG, Lowe SC, et al. Effect of clinical decision
rules, patient cost and malpractice information on clinician brain CT image ordering: a randomized controlled trial. BMC Med Inform Decis Mak. 2018;18(1):20.
32. Jennings RM, Burtner JJ, Pellicer JF, et al. Reducing head CT use for children with head injuries in a community emergency department. Pediatrics. 2017;139(4):e20161349.
33. Arora R, White EN, Niedbala D, et al. Reducing computed tomography scan utilization for pediatric minor head injury in the emergency department: a quality improvement initiative. Acad Emerg Med. 2021;28(6):655-665.
34. Elmoheen A, Salem W, Bashir K. Reducing unnecessary CT scan of the head for minor paediatric head injuries at the emergency department. BMJ Open Qual. 2021;10(1):e000973.
35. Puffenbarger MS, Ahmad FA, Argent M, et al. Reduction of computed tomography use for pediatric closed head injury evaluation at a nonpediatric community emergency department. Acad Emerg Med. 2019;26(7):784-795.
36. Corwin D, Durbin D, Hayes K, et al. Trends in emergent head computed tomography utilization for minor head trauma after implementation of a clinical pathway. Pediatr Emerg Care. 2021;37(9):437-441.
37. Waddell VA, Connelly S. Decreasing radiation exposure in pediatric trauma related to cervical spine clearance: a quality improvement project. J Trauma Nurs. 2018;25(1):38-44.
38. Connelly CR, Yonge JD, Eastes LE, et al. Performance improvement and patient safety program-guided quality improvement initiatives can significantly reduce computed tomography imaging in pediatric trauma patients. J Trauma Acute Care Surg. 2016;81(2):278-284.
39. Macias CG, Sahouria JJ. The appropriate use of CT: quality improvement and clinical decision-making in pediatric emergency medicine. Pediatr Radiol. 2011;41(Suppl 2):498-504.
40. Dunne CL, Elzinga JL, Vorobeichik A, et al. A systematic review of interventions to reduce computed tomography usage in the emergency department. Ann Emerg Med. 2022;80(6):548-560.
41. Melnick ER, Shafer K, Rodulfo N, et al. Understanding overuse of computed tomography for minor head injury in the emergency department: a triangulated qualitative study. Acad Emerg Med. 2015;22(12):1474-1483.
42. Stiell IG, Clement CM, Grimshaw JM, et al. A prospective clusterrandomized trial to implement the Canadian CT Head Rule in emergency departments. CMAJ. 2010;182(14):1527-1532.
Patient Monitor Position and Operator Ability to Visualize a Desaturation Event During Intubation
Eric Boccio, MD, MPH*
Rachelle
Perkins, MD†
James Bonz, MD‡
* † ‡
Mount Sinai Medical Center of Florida, Department of Emergency Medicine, Miami Beach, Florida Intermountain Medical Center, Department of Emergency Medicine, Murray, Utah Yale New Haven Hospital, Department of Emergency Medicine, New Haven, Connecticut
Section Editor: Dell Simmons, MD
Submission history: Submitted September 22, 2025; Revision received February 3, 2026; Accepted February 4, 2026
Electronically published June 16, 2026
Full text available through open access at http://escholarship.org/uc/uciem_westjem DOI 10.5811/westjem.52933
Introduction: During endotracheal intubation, equipment setup typically includes the patient monitor fixed at the head of the bed behind the back of the operator. Inability to directly visualize the patient monitor may result in delayed recognition of desaturation. Our primary aim in this study was to measure the association between patient monitor position and the time to recognition of a desaturation event during endotracheal intubation.
Methods: We performed a randomized crossover trial of emergency medicine residents across two Accreditation Council for Graduate Medical Education-accredited programs. Subjects were asked to perform direct and video-assisted laryngoscopy once on a difficult airway trainer in a simulation. The sequence of laryngoscopy modality (direct vs video-assisted) and monitor position (head vs left vs right of bed) were randomized prior to each attempt. The simulated patient’s peripheral capillary oxygen saturation (SpO2 ) was programmed to begin at 100% and decrease at a rate of 1% per second 10 seconds after the start of the subject’s attempt. The primary outcome measure was time to operator recognition of hypoxia defined as the observed period during which the simulated SpO2 was < 90%. Secondary outcomes were operator failure to visualize a desaturation event. We rendered Kaplan-Meier curves illustrating the time to visualization of hypoxia and performed a Cox regression adjusting for laryngoscopy modality and total number of previous intubations performed. Using multivariable linear regression, we modeled the association between time to recognition of hypoxia in seconds and patient monitor position with similar adjustments. To assess differences in the number of observed failure events between study arms, we used chi-squared or Fisher exact tests. The threshold for statistical significance was a two-sided P < 0.05.
Results: We observed 68 attempts by 34 subjects. Twenty-two (32.5%), 22 (32.5%), and 24 (35%) intubations were performed with the monitor positioned at the head, left, and right, respectively. The median times to recognition of hypoxia were 37 seconds [sec] (95% CI, 25-86 sec) for the head, 32 sec (95% CI, 18-50 sec) for the left, and 23 sec (95% CI, 19-34 sec) for the right groups, respectively. Cox regression demonstrated hazard ratios of 2.7 and 3.2 for the left and right groups when compared to the head group, and these findings were statistically significant (P = .04 and P = 0.03, respectively). We found no statistically significant associations between time to recognition of hypoxia and laryngoscopy modality or total number of previous intubations (P = .82 and .21, respectively). Failure rates across head, left, and right groups were similar, at 36%, 59%, and 50%, respectively (P = .30).
Conclusion: Positioning of the patient monitor at the head of the bed results in delayed visualization of desaturation events during simulated direct and video-assisted laryngoscopy across different levels of experience. Ideally, the patient monitor should be positioned on the side of the bed and within the operator’s direct line of sight. Further research is warranted to assess how equipment setup may impact procedural performance, operator ergonomics, and patient safety. [West J Emerg Med. 2026;27(4)956–963.]
INTRODUCTION
Rapid sequence intubation (RSI) is one of the most important life-saving procedures performed by emergency physicians. In the emergency department (ED) setting RSI is typically performed in a stepwise, procedural manner with preoxygenation immediately preceding administration of medications to sedate and paralyze the patient. Following the administration of the induction agent and, more definitively, the paralytic, the patient becomes apneic requiring that vital signs, including oxygenation status, be monitored throughout the intubation attempt. Vital signs can readily be displayed on a patient monitor allowing them to be visualized and interpreted by the operator in real time.
Commonly, the patient monitor is placed and fixed at the head of the patient’s bed against the rear wall of the examination room. This optimizes the physical floor plan, facilitating access to the patient and ease of ingress and egress. Additionally, this setup allows the team leader who traditionally stands at the foot of the bed to assess vital signs during clinical encounters and resuscitation efforts. When a physician is required to intubate a patient independently, they are typically positioned at the head of the bed facing the patient and, thus, have their back to the patient monitor. While intubating in this position, visualization of the patient monitor becomes difficult, which may lead to missed or delayed recognition of abnormal vital signs, procedural inefficiencies, and operator discomfort.
Several key insights into the ergonomics of endotracheal intubation are provided in the literature; however, they are limited to optimizing bed height, operator posture, and patient position. A randomized controlled trial demonstrated that xiphoid-level positioning of the patient’s bed significantly reduced peak and impulse laryngoscopy forces while also improving laryngeal view and operator comfort compared to when the bed is positioned at the level of the anterior superior iliac spine.1 A pilot study investigating the impact of operating table heights on the quality of laryngeal view and operator discomfort during endotracheal intubation demonstrated that higher operating table positions (at the xiphoid process and nipple level of the operator) provided superior laryngeal view grades and required smaller ranges of neck and lower back flexion corresponding to less subject-reported discomfort compared to table heights at the level of the umbilicus.2
In terms of patient positioning, evidence remains conflicting. The 2023 Society of Critical Care Medicine guidelines suggest that inclining the patient’s head and trunk to the semi-Fowler position (20-25 degrees) may increase first-pass success by improving the glottic view, reducing aspiration risk, and increasing the time to desaturation as opposed to the sniffing and neutral positions.3 However, in a multicenter, randomized trial involving pulmonary and critical care fellows performing endotracheal intubation in the intensive care unit setting, the semi-Fowler position did not improve oxygenation and worsened the Cormack-Lehane grade of glottic view, resulting in lower first-pass success and
Population Health Research Capsule
What do we already know about this issue? Patient monitors are typically fixed at the head of the bed during intubation, requiring operators to turn away from the patient to view vital signs.
What was the research question?
Does position of the patient monitor affect the time to recognition of hypoxia during endotracheal intubation?
What was the major finding of the study? Side-of-bed monitors improved hypoxia recognition vs head-of-bed location (hazard ratio 2.7-3.2).
How does this improve population health?
Optimizing equipment positioning may reduce delayed recognition of hypoxia, potentially decreasing peri-intubation complications and improving patient safety.
a higher total number of intubation attempts compared to the sniffing position.4 In obese patients specifically, back-up head-elevated positioning has been suggested to reduce the number of intubation-related complications5; however, the nonsupine positioning of patients undergoing endotracheal intubation in the ED was associated with higher odds of any adverse event compared to the supine position.6
While the importance of strategic setup during emergency procedures is recognized, research and standardized guidelines regarding the optimal positioning of equipment and devices during RSI remain limited. The National Association of EMS Physicians recommends continuous physiological monitoring during airway management to guide the timing of, limit the duration of, and inform decision-making during the performance of advanced airway insertion techniques. Guidelines include continuous monitoring of the patient’s vital signs including pulse oximetry, heart rate, and blood pressure, but they do not provide specific details regarding how these measurements are to be recorded and displayed to allow for physician interpretation.7 The 2012 Eastern Association for the Surgery of Trauma practice management guidelines recommend the monitoring of pulse oximetry and end-tidal carbon dioxide monitoring as Level 1 enhancements for safe and effective intubation in trauma patients, but they offer no recommendations regarding equipment setup or operator positioning to optimize procedural ergonomics.8
Boccio
Effect
A review of several published airway checklists for RSI in the ED revealed that while preparation- phase items typically cover patient assessment, equipment verification, personnel assignment, and backup planning, few mention equipment postioning.9-12 In fact, the only airway checklist we reviewed that mentioned the patient monitor as part of its pre-arrival checklist delineated “monitors and video laryngoscope screen positioned appropriately”; however, a description of what constituted an appropriate position was omitted.12 Our primary aim in this study was to investigate optimal patient monitor positioning during endotracheal intubation as determined by the operator’s ability to visualize a desaturation event. A secondary aim was to compare operator self-reported use of the patient monitor across various positions. We hypothesized that positioning the patient monitor within the direct line of sight of the operator throughout the intubation attempt would be associated with a shorter time to recognition of hypoxia while alleviating some of the technical challenges associated with the procedure.
METHODS
Study Design and Setting
We performed a multicenter, randomized crossover trial of emergency medicine (EM) resident trainees. The research intervention was implemented and subjects were observed in simulation centers located on the academic campuses of the respective recruitment sites. Each simulation center occupies over 4,000 square feet of physical space and contains state-ofthe-art equipment, clinical simulation bays, and audiovisual capture learning management systems operated and maintained by full-time staff with advanced training in medical simulation. The room setup and equipment positions were standardized across sites prior to subject enrollment.
Selection of Participants
Subjects were selected from the pool of resident trainees across two Accreditation Council for Graduate Medical Education-accredited EM residency programs. Site A hosts a 3-year residency program in EM with 48 trainees while Site B hosts a 4-year residency program in EM with 76 trainees. Both residency programs are affiliated with large, urban, academic healthcare systems with Level I trauma center certification in the northeast United States, and each healthcare system reports an annual census of approximately 110,000 adult ED patient visits. Subject participation was voluntary. An email containing information regarding the scope of the study, subject eligibility, and recruitment information was disseminated through established department listservs. The principal investigator’s contact information was made available prior to the consent process and after study completion. Subjects had an opportunity to withdraw from the study or withdraw data prior to analysis at any time and without consequence. The study was reviewed and approved by the affiliate institutional review boards (132564-39).
Intervention
Each subject was asked to perform endotracheal intubation a total of two times on a Deluxe Difficult Airway Trainer (Laerdal Medical, Stavanger, Norway) in a simulated environment. Subjects performed endotracheal intubation using direct laryngoscopy (DL) once and video-assisted laryngoscopy (VL) once using standard geometry laryngoscope blades. The sequence of laryngoscopy modality (DL/VL or VL/DL) and the patient monitor position (head, left, or right of the patient bed) were randomized prior to each attempt. Vital signs were programmed using Laerdal Learning Application (LLEAP) simulation software and displayed on a 24-inch portable monitor. To standardize the height and position of the patient monitor screen between attempts and across sites, it was placed on a rolling cart 1.5 meters above the ground. The cart’s wheel positions were demarcated with tape on the floor. For all VL attempts, a GlideScope Core System (Verathon Inc., Bothell, WA) was mounted on a mobile stand and placed at the right of the patient bed.
For DL attempts, the GlideScope Core System was removed from the simulated space (Appendix, Supplemental Material 1). The tongues of the difficult airway trainers were fully insufflated to ensure maximum difficulty when attempting visualization of the glottic opening and mechanical passage of the endotracheal tube to prolong the duration of the attempt as much as possible. Prior to each attempt, a script describing the clinical scenario and requested action was read to the subject by a member of the research team (Appendix, Supplemental Material 2). Subjects were asked to intubate the patient as quickly as possible while addressing and responding to the patient’s condition as they would in a real clinical scenario.
Simulated patient vital signs including systolic and diastolic blood pressures, heart rate, respiratory rate, temperature, and peripheral capillary oxygen saturation (SpO2) were displayed on the patient monitor. The simulated patient’s SpO2 was programmed to begin at 100% and decrease at a rate of 1% per second 10 seconds after the start of the subject’s attempt. Pulse oximetry pitch tone was muted. The scenario would end if one of three conditions was satisfied: 1) the subject successfully intubated the manikin; 2) the subject aborted the intubation attempt and began to reoxygenate the patient; or 3) the subject surrendered. All attempts were recorded using audiovisual capturing equipment, and these recordings were saved on local password-protected servers.
Research personnel (EB, RP) independently reviewed the recordings for all subjects, and final measurements were averaged. If measurements had differed by > 5%, recordings for that subject would have been reviewed and measurements adjudicated by a third member of the research team (JB). None of the measurements differed by > 5%, and there was no need for a formal adjudication process. Immediately after each attempt, the subject was asked to complete a survey consisting of five statements regarding their experience and use of the patient monitor (Appendix, Supplemental Material 3).
Subjects were asked to self-report their agreement with the statements on a 5-point Likert scale ranging from 1 (strongly disagree) to 5 (strongly agree).
Statements featured on the survey were as follows: 1) “I utilized the patient monitor effectively during the attempt”; 2) “I found it easy to visualize the patient monitor during the attempt”; 3) “I looked at the patient monitor at least once during the attempt”; 4) “I am confident that a desaturation event did not occur during the attempt”; and 5) “I am confident that a desaturation event did occur during the attempt.” Subjects were also asked to report their postgraduate year, estimated total number of previous intubations performed (< 50, 50-100, > 100), and handedness (right, left, ambidextrous).
Measurements and Outcomes
Patient monitor position (head, left, right) and laryngoscopy modality (DL, VL) were recorded as categorical variables. We defined the primary outcome—time to recognition of hypoxia—by the observed period during which the simulated patient’s SpO2 displayed on the monitor was < 90% and recorded as a continuous variable in seconds (sec). Scenario outcomes including failure, reoxygenation attempt, and surrender were categorized as binary variables. Previous studies have described that performing 50 intubations is enough to become proficient, while performing 100 intubations is required to reach mastery level.13-14 For that reason, we recorded the estimated total number of previous intubations performed as a categorical variable (< 50, 50-100, > 100), which we selected as a proxy for operator level of experience. We believe that the total number of previous intubations performed is a more valid measure of procedural proficiency than postgraduate year, as exposure to and familiarity with procedures during residency training are experience-dependent and may not strongly correlate with year of training.
Sample Size Estimation
Previous reports in the literature describe a median laryngoscopy duration of 35 sec, and attempts in which VL was used were 6 sec longer.15 There are no pre-existing data describing the association between patient monitor position and duration or likelihood of a desaturation event when performing endotracheal intubation. Through expert consensus, we hypothesized that the desaturation duration would be shorter when the patient monitor was positioned to the left or right as compared to the head of the patient bed. Using a two-tailed test with a desired power of 80% and an alpha equal to 0.05, a total of three subjects would be required if the mean desaturation duration for the left and right groups were 25 sec, while 11 subjects would be required if the mean desaturation duration were 30 sec. Because we had planned to include patient monitor position, estimated total number of previous intubations performed, and laryngoscopy modality in the final regression model, we targeted a sample size of 50.16
Statistical Analysis
We summarized subject characteristics and procedural performance measures using descriptive statistics. ShapiroWilk tests were applied to determine whether the distribution of data was normal. To assess the primary aim, Kaplan-Meier curves illustrating the time to visualization of a desaturation event were rendered, and we analyzed a Cox regression, adjusting for laryngoscopy modality and estimated total number of previous intubations performed. Given that subjects performed the intervention twice, we used a shared frailty model to account for within-cluster dependence. Additionally, we performed a multivariable linear regression analysis that included laryngoscopy modality and estimated total number of previous intubations performed as covariables.
To assess differences in the number of observed failure events, we used chi-squared or Fisher exact tests. For the secondary aim comparing differences in subject survey responses, Cochran-Mantel-Haenszel tests for trend were performed for each question to test the null hypothesis that the proportions of the dependent variable were the same among the ordered exposure categories. Additionally, we used analysis of variance (ANOVA) testing to compare the mean survey response score across groups. We applied Tukey’s multiple comparison tests with Bonferroni correction for results statistically significant at the global level. The threshold for statistical significance was prespecified as a two-sided alpha level of 0.05, and all analysis was performed using SAS Studio v9.4 (SAS Institute Inc, Cary, NC).
RESULTS
Characteristics of Study Subjects
We observed 68 intubation attempts and included them in the analysis. Subject characteristics and procedural performance measures for the overall sample are summarized in Table 1. The overall failure rate was 48.5%. The median desaturation duration for the overall sample was 28.5 sec (95% CI, 22-36).
Main Results
Twenty-two (32.5%), 22 (32.5%), and 24 (35%) intubations were performed with the patient monitor at the head, left, and right positions, respectively. Subject characteristics and procedural performance measures across groups are summarized in Table 2.
Kaplan-Meier curves illustrating the time to operator visualization of a desaturation event across groups for the overall sample and stratified by laryngoscopy modality and total number of previous intubations performed are provided in Figure 1.
Cox regression demonstrated hazard ratios of 2.7 and 3.2 for the left and right groups when compared to the head group, and these findings were statistically significant (P = .04 and P = .03, respectively). No statistically significant associations between time to hypoxia recognition and laryngoscopy
Boccio et al.
Table 1. Characteristics of study subjects and procedural performance measures for the overall sample in a randomized controlled crossover study investigating the effects of monitor positioning on time to operator visualization of a desaturation event.
Characteristic
Level of training (n, %)
Overall (N = 68)
PGY-1 20 (29.4)
PGY-2 18 (26.5)
PGY-3 20 (29.4)
PGY-4 10 (14.7)
Total number of previous intubations performed (n, %)
< 50 28 (41.2) 50-100 36 (52.9) > 100 4 (5.9)
Handedness (n, %)
Right 58 (85.3)
Left 8 (11.8)
Ambidextrous 2 (2.9)
Laryngoscopy Modality (n, %)
Direct
(32.4-58.1)
Median desaturation duration, seconds (95% CI) 28.5 (22-36)
Observed failure (n, %) 33 (48.5)
Observed reoxygenation (n, %) 35 (51.5)
Observed surrender (n, %) 0 (0)
PGY, postgraduate year.
modality or estimated total number of previous intubations performed were found (P = .82 and P = .21, respectively). The failure rates across head, left, and right groups were 36%, 59%, and 50%, respectively; these differences did not meet statistical significance (P = .30).
A summary of subject responses to the post-intervention survey questions is provided in Table 3. Cochran-MantelHaenszel tests for trend were statistically significant for questions 1 (P < .01), 2 (P <. .001), 3 (P <. .001), and 5 (P <.01). Global ANOVA demonstrated statistically significant differences in responses to questions 1, 2, 3, and 5. Pairwise comparisons demonstrated less effective utilization (H-L: -1.8, 95% CI, -2.6 to -0.9, P <.01, H-R: -1.2, 95% CI, -2 to -0.3, P <. .01); reduced ease (H-L: -2.8, 95% CI, -3.2 to -1.7, P < .01, H-R: -2.4, 95% CI: -3.2 to -1.7, P < .01); decreased overall utilization (H-L: -2.1, 95% CI, -3.1 to -1.1, P <0.01, H-R: -2.0, 95% CI, -3 to -1.1, P < .01) and reduced confidence in recognition of a desaturation event (H-L: -1.1, 95% CI, -2 to -0.2, P < .01, H-R: -1, 95% CI, -1.8 to -0.1, P < .01) when the monitor was positioned at the head as compared to left and right of the patient bed.
DISCUSSION
Endotracheal intubation is a uniquely challenging procedure to perform, especially when faced with the difficult airway; however, it can be reproduced with high fidelity in the simulated environment.17-18 Almost all existing simulation studies surrounding intubation focus on the technical procedure itself and vary only slightly regarding technique, equipment used, clinical setting, and subject scope and level of training. While fiberoptic devices and VL have replaced DL as the preferred technique for first attempt in the ED setting in recent years,19-20 far less attention has been directed toward equipment positioning and its potential impact on operator ergonomics and situational awareness. In this study, we found that patient monitor position impacted the time to operator recognition of hypoxia, with head-of-bed positioning associated with significantly longer times compared with side-of-bed placement. Mean desaturation events approached 70 sec with head placement, compared to 39 sec for left placement and 28 sec for right placement. Although this study was conducted in a simulated environment, similar delays in real-world clinical scenarios could increase the risk of periintubation complications, particularly in critically ill patients with limited physiological reserve.
When the patient monitor was located at the head of the bed, operators were required to rotate their necks and torsos to view the display. This additional effort likely reduced the frequency and efficiency of monitoring vital signs during the intubation attempt. Additionally, the patient monitor is not in the periphery of the operator’s visual field, making it less likely to draw attention when abnormal measurements are displayed. Importantly, these differences persisted regardless of laryngoscopy modality and operator level of experience, suggesting that even skilled EM residents remain subject to the ergonomic limitations of suboptimal patient monitor placement. We expected shorter times to hypoxia recognition for subjects reporting the highest estimated total number of previous intubations performed as clinical experience has been shown to correlate with situational awareness even in simulated environments.
Given that DL is more physically challenging and technically difficult than VL, as it requires the operator to bend forward and focus their attention on the patient’s airway instead of objects in the environment, we were surprised to find no statistically significant association between time to hypoxia recognition and laryngoscopy modality. Not surprisingly, times were shortest during attempts when the patient monitor was positioned to the right of the bed, as the screens displaying pertinent clinical information were consolidated in a smaller area of the operator’s visual field, thus requiring minimal body movement and gaze switching.
Ergonomics research in surgical and occupational domains provides insight into why patient monitor positioning may influence performance during advanced airway management. In minimally invasive surgery, for example,
Table 2. Characteristics of study subjects and procedural performance measures across groups in a randomized controlled crossover study investigating the effects of monitor positioning on operator ability to visualize a desaturation event.
Characteristic
Level of training (n, %)
Observed surrender (n, %)
IQR, interquartile range; PGY, postgraduate year; SD, standard deviation.
Head (n = 22) Left (n = 22)
misalignment between the operator’s visual display and task axis has been shown to impair technical efficiency, increase error rates, and heighten musculoskeletal strain.21 Displays placed outside the natural line of sight require awkward head or torso movements, which add both physical and cognitive constraints. Similarly, ergonomic studies of visual display terminals have demonstrated that neutral or slightly downward gaze angles (approximately 0-15 degrees below horizontal) reduce cervical strain and improve efficiency, whereas lateral or upward gaze increases musculoskeletal load and slows recognition of visual information.22
Regarding the subject experience, survey responses illustrated that head-of-bed monitor positioning significantly limits its effective use, which translated into uncertainty surrounding the patient’s clinical status. Repositioning the patient monitor to the left or right of the patient bed may facilitate its ease of use, thus increasing the frequency of vital sign reassessment, improving the likelihood of recognizing a desaturation event in a timely fashion, and increasing the physician’s confidence surrounding clinical decisions. In high-stress critical airway management scenarios, where operators must perform complex technical maneuvers and monitor and interpret patient physiology simultaneously, such
disadvantages may exacerbate cognitive load and delay recognition of critical events. We believe this phenomenon would be most pronounced in clinical scenarios that involve a single physician responsible for both resuscitating and performing procedures independently and without the support of an interdisciplinary ancillary team.
From a practical perspective, our results highlight the importance of careful consideration of equipment placement and installation when configuring ED patient-examination rooms and resuscitation bays. Adjustable ceiling-mounted or articulated monitors, which have been shown to better accommodate ergonomic gaze angles across different postures and body movements, may be preferred.23 When such modifications are unavailable or impractical due to physical or financial constraints, positioning patient monitors at the side of the bed rather than at the head may serve as a simple solution. Incorporating ergonomic guidelines into standardized airway setup protocols and checklists may improve both procedural performance, operator ergonomics, and patient outcomes.
Lastly, our findings raise important considerations for airway management training. Teaching resident trainees to deliberately optimize patient monitor positioning may instill safer habits that persist into clinical practice. Furthermore,
future studies should explore how patient monitor position may impact other operator factors, such as stress, fatigue, efficiency, satisfaction, and communication during advanced airway management. Integrating technologies such as motion capture, electromyography, or eye tracking could provide objective data linking head movement, posture, and gaze behavior to recognition delays and provide feedback regarding optimal operator biomechanics.
LIMITATIONS
Figure 1. Kaplan-Meier curves illustrating the time to operator visualization of a desaturation event in a randomized controlled crossover trial (A) across groups for the overall sample, (B) across groups stratified by laryngoscopy modality, and (C) across groups stratified by estimated total number of previous intubations performed.
There are several limitation to this study. Subjects consisted of only resident trainees from two EM training programs affiliated with large, academic healthcare systems with Level 1 trauma centers in the northeast U.S. This may limit generalizability across ED settings, geographic regions, scope of training, operator experience levels, and clinical specialties. Further, the research intervention was conducted in a simulated environment, which may not fully replicate the complexities and nuances of real-life clinical scenarios. The simulated desaturation rate of 1% per second beginning 10 seconds following the initiation of the intubation attempt and the maximally insufflated tongue of the difficult airway trainer may not match all clinical scenarios, which also affect the generalizability and transferability of results. The short period of time preceding desaturation facilitated data collection and ensured that simulation center resources were used efficiently. The maximally insufflated tongue ensured that the intubation attempt would be difficult, so that the scenarios would not end prior to the programmed desaturation event occurring.
The simulated intervention was designed to ensure standardization between subjects and across sites. The study incorporated state-of-the-art equipment stored and maintained in simulation centers with full-time staff trained and certified in conducting medical simulation. The pulse oximetry pitch tone was muted during subject attempts, and only statements regarding visualization of the patient monitor in the absence of auditory feedback could be made.
CONCLUSION
In this study we sought to enhance our understanding of how patient monitor positioning influences emergency physician procedural performance and experience during endotracheal intubation. The positioning of the patient monitor during endotracheal intubation significantly impacts the ease of its visualization and likelihood of its use in a simulated singleclinician scenario with pulse oximeter pitch tone muted. Fixation of the patient monitor at the head of the patient bed behind the turned back of the operator can impede visualization and timely recognition of desaturation events during both direct and video laryngoscopy and across varying levelss of EM resident skill. Further research into how positioning of the patient monitor during endotracheal intubation may optimize procedural performance, operator ergonomics, and patient outcomes in real-world clinical environments is warranted.
et al.
Address for Correspondence: Erin Boccio, MD, MPH, Mount Sinai Medical Center of Florida, Department of Emergency Medicine, 4300 Alton Rd, Miami Beach, FL. Email: bocciomedicalservices@ gmail.com.
Conflicts of Interest: By the WestJEM article submission agreement, all authors are required to disclose all affiliations, funding sources and financial or management relationships that could be perceived as potential sources of bias. No author has professional or financial relationships with any companies that are relevant to this study. There are no conflicts of interest or sources of funding to declare.
1. Lee JE, Hong KY, Chung C, et al. Effect of bed height on laryngoscopy force and operator ergonomics during simulated endotracheal intubation: a randomized controlled study. PLoS One. 2025;20(10):e0333104.
2. Lee HC, Yun MJ, Hwang JW, et al. Higher operating tables provide better laryngeal views for tracheal intubation. Br J Anaesth. 2014;112(4):749-55.
3. Acquisto NM, Mosier JM, Bittner EA, et al. Society of Critical Care Medicine clinical practice guidelines for rapid sequence intubation in the critically ill adult patient. Crit Care Med. 2023;51(10):1411-30.
4. Semler MW, Janz DR, Russell DW, et al. A multicenter, randomized trial of ramped position vs sniffing position during endotracheal intubation of critically ill adults. Chest. 2017;152(4):712-22.
5. Khandelwal N, Khorsand S, Mitchell SH, et al. Head-elevated patient positioning decreases complications of emergent tracheal intubation in the ward and intensive care unit. Anesth Analg. 2016;122(4):1101-7.
6. Stoecklein HH, Kelly C, Kaji AH, et al. Multicenter comparison of nonsupine versus supine positioning during intubation in the emergency department: a National Emergency Airway Registry (NEAR) study. Acad Emerg Med. 2019;26(10):1144-51.
7. Davis DP, Bosson N, Guyette FX, et al. Optimizing physiology during prehospital airway management: an NAEMSP position statement and resource document. Prehosp Emerg Care. 2022;26(sup1):72-9.
8. Mayglothling J, Duane TM, Gibbs M, et al. Emergency tracheal intubation immediately following traumatic injury: an Eastern Association for the Surgery of Trauma practice management guideline. J Trauma Acute Care Surg. 2012;73(5 Suppl 4):S333-40.
9. Zeuchner J, Graf J, Elander L, et al. Introduction of a rapid sequence induction checklist and its effect on compliance to guidelines and
10. Sherren PB, Tricklebank S, Glover G. Development of a standard operating procedure and checklist for rapid sequence induction in the critically ill. Scand J Trauma Resusc Emerg Med. 2014;22:41.
11. Conroy MJ, Weingart GS, Carlson JN. Impact of checklists on peri-intubation care in ED trauma patients. Am J Emerg Med. 2014;32(6):541-4.
12. Smith KA, High K, Collins SP, et al. A preprocedural checklist improves the safety of emergency department intubation of trauma patients. Acad Emerg Med. 2015;22(8):989-92.
13. Buis ML, Maissan IM, Hoeks SE, et al. Defining the learning curve for endotracheal intubation using direct laryngoscopy: a systematic review. Resuscitation. 2016;99:63-71.
14. Lee GT, Park JE, Woo SY, et al. Defining the learning curve for endotracheal intubation in the emergency department. Sci Rep. 2022;12(1):14903.
15. Donoghue A, O’Connell K, Neubrand T, et al. Videographic assessment of tracheal intubation technique in a network of pediatric emergency departments: a report by the Videography in Pediatric Resuscitation (VIPER) collaborative. Ann Emerg Med. 2022;79(4):333-43.
16. Vittinghoff E, McCulloch CE. Relaxing the rule of ten events per variable in logistic and Cox regression. Am J Epidemiol. 2007;165(6):710-8.
17. Goldberg JS, Bernard AC, Marks RJ, et al. Simulation technique for difficult intubation: teaching tool or new hazard? J Clin Anesth. 1990;2(1):21-6.
18. Garcia J, Coste A, Tavares W, et al. Assessment of competency during orotracheal intubation in medical simulation. Br J Anaesth. 2015;115(2):302-7.
19. Sakles JC, Mosier JM, Patanwala AE, et al. The C-MAC® video laryngoscope is superior to the direct laryngoscope for the rescue of failed first-attempt intubations in the emergency department. J Emerg Med. 2015;48(3):280-6.
20. Smischney NJ, Seisa MO, Heise KJ, et al. Practice of intubation of the critically ill at Mayo Clinic. J Intensive Care Med. 2017;32(3):885066617691495.
21. Gallagher AG, McClure N, McGuigan J, et al. An ergonomic analysis of the fulcrum effect in the acquisition of endoscopic skills. Endoscopy. 1998;30(7):617-20.
22. Rempel D, Willms K, Anshel J, et al. The effects of visual display distance on eye accommodation, head posture, and vision and neck symptoms. Hum Factors. 2007;49(5):830-8.
23. Kelts GI, McMains KC, Chen PG, et al. Monitor height ergonomics: a comparison of operating room video display terminals. Allergy Rhinol (Providence). 2015;6(1):28-32.
Boccio
Emergency Front-of-neck Access: Comparing Needle and Surgical Cricothyrotomy Using a Human Cadaver Model
Eric Boccio, MD, MPH*
Daniel Levi, MD†
James Bonz, MD‡
Justin Belsky, MD, MPH‡
Jason D’Amore, MD, MBA§
Mount Sinai Medical Center of Florida, Department of Emergency Medicine, Miami Beach, Florida Baptist Health, Department of Emergency Medicine, Miami, Florida Yale New Haven Hospital, Department of Emergency Medicine, New Haven, Connecticut Health + Hospitals/Jacobi Bronx, Department of Emergency Medicine, New York City, New York * † ‡ §
Section Editor: Christopher Tainter, MD
Submission history: Submitted September 14, 2025; Revision received February 11, 2026; Accepted February 14, 2026
Electronically published June 28, 2026
Full text available through open access at http://escholarship.org/uc/uciem_westjem DOI 10.5811/westjem.52840
Introduction: Emergency front-of-neck access may serve as a life-saving intervention when facing patients with difficult airways. Cricothyrotomy consists of needle and surgical techniques and is performed in approximately 0.2-0.5% of all airway management attempts. Our primary aim in this study was to compare procedural completion time and first-pass success of needle and surgical approaches to cricothyrotomy by civilian and military practitioners using a human cadaver model.
Methods: Emergency medicine (EM) attendings and residents and U.S. Air Force Pararescue specialists were randomized to perform either a needle or surgical cricothyrotomy on an unfixed human cadaver a single time following a 30-minute didactic session about both procedure types. We recorded procedural completion time, first-pass success, frequency and type of observed complications, and subject level of training. Our primary outcome measure was procedural completion time. Secondary outcome measures included first-pass success and complication rates. We used a Wilcoxon signed-rank test to compare the difference in median completion times between needle and surgical groups. We performed a Cox regression analysis to evaluate the relationship between technique and procedural completion time while adjusting for subject level of training. Chi-squared or Fisher exact tests were used to compare unadjusted first-pass success and complication frequencies between needle and surgical groups. Multivariable logistic regression analysis modeling the association between technique and first-pass success and complication events while adjusting for subject level of training was performed.
Results: A total of 99 subjects were enrolled, and 19 (19%), 68 (69%), and 12 (12%) were classified as EM attending, EM resident, and Pararescue specialist, respectively; 51 (52%) and 48 (48%) were randomized into the needle and surgical groups, respectively. The median time to procedural completion was shorter in the needle group than the surgical group (56.5 seconds [sec], 95% confidence interval, 54-66 sec vs 65 sec, 95% CI, 59-73 sec, respectively). The difference in median completion times was 8 sec (95% CI, -1.0 to 17 sec, P = .08). The hazard ratio comparing completion time of surgical to needle cricothyrotomy while adjusting for level of training was 1.41 (95% CI, 0.93-2.13, P = .11). First-pass success and complication rates were similar between the needle and surgical groups (94% vs 94%, P = .32, and 27% vs 33%, P = .52, respectively). The adjusted odds ratios comparing the likelihoods of first-pass success and complication between surgical and needle groups while adjusting for level of training were 1.06 (95% CI, 0.20-5.54, P = .95) and 1.40 (95% CI, 0.55-3.56, P = .48), respectively.
Conclusion: In this study using unfixed human cadavers, needle and surgical cricothyrotomy demonstrated comparable performance regarding procedural completion time, first-pass success, and complication rates. The 8-second difference in median completion time between groups was not found to be statistically significant and is unlikely to be clinically significant given the typical oxygen reserves in an apneic patient. These findings suggest that for practitioners in civilian and military settings, both needle and surgical cricothyrotomy remain viable options for emergency front-of-neck access, assuming adequate operator-level procedural proficiency and access to necessary equipment. [West J Emerg Med. 2026;27(4)964–970.]
INTRODUCTION
Emergency front-of-neck access may serve as a lifesaving intervention when facing the “cannot intubate, cannot oxygenate” airway. Cricothyrotomy is performed in approximately 0.28% of all airway management attempts in the emergency department (ED),1 and similar rates (0.5%) have been reported in the prehospital setting.2 There are two common classifications of cricothyrotomy approaches: needle/ percutaneous/Seldinger (needle); and surgical/open (surgical).3 The relatively high acuity and low occurrence of difficult airways limit opportunities for performing cricothyrotomy and maintaining procedural proficiency through clinical practice alone.4 There is a paucity of research comparing procedural performance of needle and surgical cricothyrotomy by emergency physicians and military medical personnel.
Previous studies have been largely limited to small samples of anesthesiologists and medical students observed performing emergency front-of-neck access on simulated airway models. As a result, strong evidence to support superiority of either approach is lacking. In clinical scenarios where there is a critical need to access, secure, oxygenate, and ventilate the airway as quickly as possible, the approach that can be performed faster, with a higher success rate, and which minimizes complications should be prioritized. This study builds upon the existing evidence by pairing a human cadaveric model, which preserves realistic anatomical landmarks, with a targeted cohort of emergency physicians and prehospital military personnel in a high-fidelity simulated environment.
Our primary aim in this study was to determine whether needle or surgical cricothyrotomy could be completed faster by practitioners responsible for performing emergency frontof-neck access in the civilian and military settings, using a human cadaver model. Secondary outcomes focused on comparing first-pass success and procedural complication rates.
METHODS
Study Design and Setting
To compare cricothyrotomy techniques, we performed a randomized controlled trial using a human cadaver model in a simulated environment. We recruited emergency physicians from a single, urban, academic institution in the northeast United States with an annual census of approximately 100,000 adult patients and an affiliate Accreditation Council for Graduate Medical Education (ACGME)-accredited EM residency program. At the time of the study, equipment across all clinical sites was standardized and featured the Melker Universal Emergency Cricothyrotomy Catheter Set (Cook Medical Inc, Bloomington, IN), which contained the necessary equipment to perform both needle and surgical techniques. There was no single standardized approach to emergency front-of-neck access practiced and residents were instructed on both. The study protocol was reviewed and approved by a
Population Health Research Capsule
What do we already know about this issue?
Emergency front-of-neck access is a rare, life-saving airway intervention, but evidence comparing needle and surgical techniques is limited by small samples.
What was the research question?
Does needle or surgical cricothyrotomy have faster completion time, higher rate of success, and fewer complications?
What was the major finding of the study?
Needle and surgical cricothyrotomy had similar median completion times (56.5 vs 65 seconds, hazard ratio 1.41), first-pass success (94%), and complication rates (27% vs 33%).
How does this improve population health?
Both techniques are viable options, allowing providers to prioritize the method that best matches their proficiency and available equipment.
central institutional review board prior to subject enrollment.
Selection of Participants
Subjects were selected from a stratified random sample of participants attending a one-day advanced airway management training course held in January 2017. Subjects consisted of EM attendings and residents and U.S. Air Force Pararescue specialists, and the sample was stratified based on type and level of training. In addition to basic military, combat dive, airborne, and survival, evasion, resistance, and escape training, Pararescue specialists may serve as licensed emergency medical technicians, paramedics, and field/combat medics and are trained and certified to perform emergency front-of-neck access in both civilian and military prehospital environments.
Interventions
Unfixed, fresh-frozen human cadavers were numbered sequentially, and subjects were randomly assigned to a cadaver. The cadavers were fresh-frozen to maintain tissue, color, and texture. Subjects assigned to odd-numbered cadavers were instructed to perform the needle technique, while those assigned to even-numbered cadavers were
instructed to perform the surgical technique. Each subject was instructed to perform the respective cricothyrotomy technique a single time, and each cadaver underwent cricothyrotomy a single time. All subjects were given a complete Melker set and advised to use the equipment necessary to perform their assigned approach. A single subject failed to follow instructions and performed a needle cricothyrotomy instead of surgical cricothyrotomy. Data pertaining to this subject were classified in the needle cricothyrotomy group during analysis. The cadavers were fresh-frozen to maintain tissue, color, and texture. All subjects were given a complete Melker set and advised to use the equipment necessary to perform their assigned approach.
Immediately preceding each attempt, subjects received a 30-minute didactics session taught by a board-certified emergency physician (JD) on emergency front-of-neck access, which featured content related to needle and surgical approaches to cricothyrotomy. For the needle approach, a Seldinger catheter-over-wire technique was described. After anatomic landmarks were identified and stabilized with the non-dominant hand, the introducer needle attached to a syringe containing 2 mL saline was inserted through the skin and subcutaneous tissue overlying the cricothyroid membrane caudally at a 45° angle.
The plunger of the syringe was simultaneously drawn back as the needle advanced until air was aspirated. Entrance into the trachea was confirmed through visualization of bubbles in the syringe. The syringe was subsequently removed, and a guide wire was inserted and passed through the needle shaft. While stabilizing the guide wire, the needle was then removed. A stab incision was made in the skin at the guide wire insertion site, and a dilator was advanced over the guide wire. The dilator was exchanged for a cannula, which was passed over the guide wire. Once properly positioned, the cannula was stabilized, and the guide wire was removed.
For the surgical approach, a scalpel-finger-endotracheal tube technique was described. Anatomic landmarks were first defined by thyroid cartilage superiorly, cricothyroid muscles laterally, and cricoid cartilage inferiorly. While stabilizing the larynx with the non-dominant hand, a cutting scalpel was used to create a vertical incision through the skin and subcutaneous tissue overlying the cricothyroid membrane. Once identified via direct visualization or palpation, a horizontal incision was made through the lower portion of the cricothyroid membrane. The index finger of the non-dominant hand was inserted through the stoma thus maintaining the tract and confirming proper positioning via palpation of the posterior tracheal rings. A 6.0 endotracheal tube was inserted, and the cuff was fully inflated. The use of a tracheal hook and gum elastic bougie was not described and, therefore, not investigated.
Outcome Measures
We defined the primary outcome measure—procedural completion time—as a continuous variable. Secondary
outcome measures included first-pass success and observed complications, which were defined as binary variables. We described and summarized observed equipment and procedural complications to comment on the general safety of each technique. Complication types were discussed via group expert consensus (EB, JB, JB, JD) a priori and classified as follows: 1) missed or repeated step; 2) needle insertion or incision not midline; 3) structural damage to the cricoid or thyroid cartilage; 4) structural damage to the trachea; and 5) ectopic catheter or endotracheal tube placement.
Data Collection
We recorded procedural completion time, first-pass success, frequency and type of observed complications, and subject’s level of training. Procedural completion time, in seconds (sec), was measured on digital stopwatches by designated research personnel (EB, JD) who received training on proper timing of the procedure. This was defined as the interval between initial skin contact with the needle tip or scalpel blade and the insertion of the catheter or endotracheal tube tip into the neck stoma, as directly visualized by research personnel at the bedside in real time. After each attempt, further dissection of the cadaveric tissue by research personnel was performed, and successful placement was confirmed through direct visualization of the catheter or endotracheal tube passing through the cricothyroid membrane and terminating in the trachea. It was also noted whether insertion and incision sites were midline, as injury to the perforating branches of the thyroid artery may be associated with greater bleeding complications.
Sample-size Calculation
Assuming mean completion times of 148 (96) sec and 55 (35) sec for first-pass success while using a percutaneous and surgical approach, respectively (as reported in a previous study of prehospital personnel performing cricothyrotomies on human cadavers5), 90% statistical power, and a twosided alpha of 0.05, we needed a sample of 44 subjects to confidently detect a difference between procedural completion times between the two study arms. On the day of subject enrollment 99 unfixed human cadavers were available, and all were used.
Statistical Analysis
We calculated summary statistics for each group and each outcome. A Wilcoxon signed-rank test was used to compare unadjusted median completion times between needle and surgical groups. We used chi-squared or Fisher exact tests to compare unadjusted first-pass success and complication frequencies between needle and surgical groups. KaplanMeier curves illustrating time to procedural completion for each technique for the overall sample and stratified by subject level of training were created. We performed a Cox regression analysis to evaluate the relationship between technique and
Boccio
Front-of-neck Access: Comparing Needle and Surgical Cricothyrotomy
procedural completion time while adjusting for subject level of training. The ratio of hazard rates between the two groups was assumed to remain constant over time. We performed multivariable logistic regression of first-pass success and complication events between techniques while adjusting for subject level of training. We assessed the goodness of fit for each model using a Hosmer-Lemeshow test. The threshold for statistical significance was set at 0.05 a priori. All analyses were performed using SAS Studio v9.4 (SAS Institute Inc, Cary, NC).
RESULTS
Characteristics of Study Subjects
Of the 99 subjects who were enrolled and included in analysis, 19 (19%), 68 (69%), and 12 (12%) were classified as EM attending, EM resident, and Pararescue specialist, respectively. A total of 51 (52%) and 48 (48%) subjects were randomized to the needle and surgical groups, respectively (Table 1). Of the cadavers characterized as obese based on subjective assessment of neck and torso size by research personnel (EB, JD), 12 (24%) and 5 (10%) were in the needle and surgical groups, respectively.
Results of Median Time to Completion and Rates of Complication
The median time to procedural completion was shorter in
the needle group as compared to the surgical group (56.5 sec, 95% CI, 54-66 sec vs 65 sec, 95% CI, 59-73 sec, respectively). The difference in medians was 8 sec (95% CI, -1.0 to 17 sec, P = .08). Three (6%) subjects in the needle group and three (6%) in the surgical group failed on first attempt. Complications observed in the needle group included missed or repeated procedural step (additional dilation attempt), structural damage to the cricoid or thyroid cartilage, and ectopic catheter placement. Complications observed in the surgical group included incision not midline, structural damage to the cricoid or thyroid cartilage, structural damage to the trachea, and ectopic endotracheal tube placement (Table 2).
The models for first-pass success and complication occurrence provided good fits to the data, as indicated by non-significant Hosmer-Lemeshow tests (P = .47 and P =.56, respectively). First-pass success and observed complication rates were similar between the needle and surgical groups (94% vs 94%, P = .32, and 27% vs 33%, P = .52, respectively). Kaplan-Meier curves illustrating time to procedural completion for each technique for the overall sample and stratified by subject level of training are displayed in Figure 1.
The hazard ratio comparing completion time of surgical cricothyrotomy to needle cricothyrotomy while adjusting for subject level of training was 1.41 (95% CI, 0.93-2.13, P = .11). The adjusted odds ratios comparing the likelihoods
of training, n (%)
EM, emergency medicine.
subjects (N = 99) Needle (n = 51)
(n = 48)
procedural outcome measures for needle and surgical groups in a study comparing procedural completion time and first-pass success of needle and surgical approaches to
Median completion time, 95% CI (seconds)
success, n (%)
n (%)
ETT, endotracheal tube.
Needle (n = 51)
54-66
(94)
Surgical (n = 48)
(94)
Level
Table 1. Characteristics of subjects’ level of training in a study comparing procedural completion time and first-pass success of needle and surgical approaches to cricothyrotomy
Table 2. Comparison of
cricothyrotomy
Figure 1. Kaplan-Meier curves illustrating (A) time to procedural completion of surgical and needle techniques and (B) stratification by subject level of training, in a study comparing procedural performance of cricothyrotomy on unfixed human cadavers.
of first-pass success and complication between surgical and needle groups while adjusting for subject level of training were 1.06 (95% CI, 0.20-5.54, P = .95) and 1.40 (95% CI, 0.55-3.56, P = .48), respectively. Subject type and level of training were not found to be statistically significant in any of the regression models.
DISCUSSION
In this human cadaveric study of cricothyrotomy techniques, the 8-second difference in median completion times between the needle and surgical groups was not found to be statistically significant by univariate analysis or Cox regression while adjusting for subject level of training. Comparison of the 75th percentiles of completion times in the needle and surgical groups demonstrates only a minor difference, unlikely to be of clinical significance when considering the theoretical risks during such a brief extension of the apneic period. Comparison of the crude KaplanMeier curve demonstrates an earlier drop in the needle group representing faster rates of completion compared to the surgical group. When stratified based on subject level of
training, the fastest 80% of attempts appear to have similar completion times across techniques. Variability in completion time was seen among the slowest 20% of attempts with EM attendings completing cricothyrotomy the fastest followed by Pararescue specialists and then EM residents. Emergency medicine attendings appeared to be equally proficient when performing either needle or surgical cricothyrotomy, while Pararescue specialists and EM residents were slower when performing the surgical technique.
Both needle and surgical groups had almost identical high first-pass success rates (~94%) with similar complication rates, and these differences were not found to be statistically significant. However, the types of complications observed differed between techniques. Missed or repeated procedural steps were only observed in the needle group, while incision not midline and damage to the cricoid or thyroid cartilage were only observed in the surgical group. Rates of damage to the trachea and incorrect positioning of equipment were similar between groups. The difference in observed complications between groups is most likely attributable to the micro skills composing each technique.
The needle technique requires more equipment and is composed of more individual steps than the surgical technique. Failure to adequately dilate is unique to the needle technique as the surgical technique does not involve the use of a dilator. The presence of bubbles in the saline-filled syringe during aspiration while performing the needle technique may provide visual feedback confirming entrance into the trachea. This likely explains why lateral insertion and damage to the cricoid or thyroid cartilage were observed only in the surgical group where subjects relied on anatomic landmarks and blind dissection through soft tissue to identify the cricothyroid membrane. Incisions made too deeply—laterally or above or below the cricothyroid membrane— were more likely to result in damage to cricoid or thyroid cartilage during the surgical technique. Although there were twice the number of obese cadavers in the needle group than the surgical group, we observed similar first-pass success and complication rates.
Cadaveric and simulation-based studies comparing emergency cricothyrotomy techniques among EM attendings, trainees, and other clinicians have shown broadly comparable outcomes, with variation in completion times, operator preference, and training influences. In one human cadaveric study, 20 emergency physicians performed 200 cricothyrotomies using both Seldinger and surgical methods. Although repetition did not improve proficiency, the Seldinger approach achieved shorter times to tracheal puncture and ventilation, with similar complication rates (11.8 vs 16%).6 A randomized crossover trial of 15 EM attendings and residents likewise found no significant differences in completion time, placement accuracy, or complication rates between wireguided and surgical approaches. Success was slightly higher with the wire-guided method (93.3 vs 86.7%), and participants preferred Seldinger, although the clinical significance of
et al.
Front-of-neck Access: Comparing Needle and Surgical Cricothyrotomy
smaller incision size and subjective ease remains unclear.7A prospective, randomized, comparative simulation study using a human cadaver model involving 63 inexperienced clinicians showed similar median completion times between surgical and catheter-over-needle techniques (78 vs 74 sec, respectively), with modestly higher success in the surgical group (94% vs 82%). We attributed slower times and higher failure rates to participant inexperience, limiting generalizability.8 Similarly, a trial of 20 medical students naïve to surgical airways reported a 95% success rate with the surgical technique, although the median completion time was slower (94 sec) and one complication involved esophageal placement. No association was found between cadaver biometric features and outcomes, reinforcing the influence of subject level of training.9
Conversely, some trials favored the surgical technique. A crossover study of Australian emergency physicians and trainees demonstrated a faster mean completion time while performing the surgical compared to the Seldinger technique (51.6 [16.3] sec vs 66.6 [14.9] sec, respectively), possibly reflecting training differences internationally.3 Likewise, anesthesiologists comparing open surgical and Melker approaches found the surgical method faster and less technically difficult, with a difference in mean completion time of 42 sec. Despite slower completion times, participants preferred the Melker technique, likely due to familiarity with Seldinger-based micro skills, although generalizability to EM practice is limited.10
The National Association of Emergency Medical Services Physicians (NAEMSP) strongly supports open scalpel cricothyrotomy over needle-based or Seldinger techniques for emergency front-of-neck access in the prehospital setting. The most recent position statement cites previous work demonstrating markedly higher success rates and a 2% failure rate when performing surgical cricothyrotomy compared to 65% for needle-based methods. Advantages reported include reduced reliance on specialized equipment and the ability to use adjuncts such as a tracheal hook or gum elastic bougie to confirm tract position. Our results corroborate the concern that additional equipment and individual steps may lead to higher observed complication rates when performing the needle technique; however, we are unable to comment on their clinical significance.
Additionally, while the inclusion of a tracheal hook or a gum elastic bougie may mitigate ectopic endotracheal tube placement during the surgical technique, we did not investigate these adjuncts in our study. However, it should be noted that the visualization of bubbles while aspirating with saline in the syringe during the needle technique does provide feedback regarding proper positioning of the needle in the trachea prior to guidewire insertion. While procedural modifications like vertical incision may mitigate common pitfalls such as misidentification of cricoid landmarks and ectopic endotracheal tube placement, our results show that these complications were not eliminated completely. While
the NAEMSP strongly supports an open surgical scalpelbased approach as first line to emergency front-of-neck access, we agree with the statement supporting regular simulation training in multiple emergency front-of-neck access techniques and further agree that additional controlled clinical trials of emergency surgical airways are necessary to strengthen current and future recommendations.11
Hybrid approaches to emergency front-of-neck access have also been evaluated. An “incision-first” Seldinger variation reduced procedural time, insertion attempts, and workload compared with a “needle-first” approach.12 A sequential technique combining transtracheal catheter oxygenation with Seldinger cricothyrotomy has likewise been proposed to expedite preoxygenation.13 Overall, evidence suggests both surgical and Seldinger methods are effective, with optimal technique influenced by operator experience, procedural familiarity, and available equipment.14
LIMITATIONS
Subjects were recruited from those in attendance at an advanced airway management training course, which exposed our study to selection bias. While subjects did not receive hands-on training of needle or surgical cricothyrotomy techniques prior to their attempt, each subject participated in a didactic session that reviewed the procedural steps of each approach. Emergency physicians were representative of a single academic department while EM residents were representative of a single ACGME-accredited program, both located in the Northeast U.S. and thus limiting generalizability.
While the unfixed human cadavers were screened for obesity prior to each attempt, we did not control for other anatomical variations that may have affected the difficulty in performing each technique (neck length and circumference, history of head and neck cancer, prior trauma, etc). While considered higher fidelity than manikin trainers, unfixed cadaveric tissue does not allow for assessment of neck vasculature; neither could bleeding from vascular injury be simulated. The severity of patient injury from procedural complications could not be quantified and, therefore, is speculative. Additionally, rigor mortis may have prevented the ability to fully extend and position the neck prior to each attempt. The controlled environment of a cadaver lab cannot fully replicate the cognitive load, time pressure, and environmental distractions inherent in real-life clinical scenarios involving emergent advanced airway management.
Subject demographics and prior clinical experience related to total number of years of experience and number of cricothyrotomies performed were recognized as potential confounders, but this information was not recorded. The risk of potential confounding was mitigated through block randomization of the procedure. After stratification by subject level of training, strata containing Pararescue specialists have small sample sizes (n < 10). Results drawn from subgroup
Boccio
analyses are, therefore, believed to be underpowered, and results could vary if the study were to be replicated with larger sample sizes. Finally, tracheal hooks and gum elastic bougies are common adjuncts used when performing surgical cricothyrotomy; however, we did not assess their use.
CONCLUSION
This human cadaveric-based study investigated the optimal approach to emergency front-of-neck access, addressing the limitations of prior studies through use of high-fidelity, unfixed human cadavers, randomization of subjects into procedural arms, and inclusion of a larger sample size of EM-trained subjects. The 8-second difference in median completion time between groups was not found to be statistically significant and is unlikely to be clinically significant given the typical oxygen reserves in an apneic patient. Both techniques achieved an identical 94% first-pass success rate with comparable overall complication rates, although the specific nature of complications differed based on the technical micro-skills unique to each procedure. These findings indicate that both needle and surgical cricothyrotomy remain viable options for emergency front-of-neck access and suggest that the choice of technique should be prioritized based on practitioner proficiency and equipment accessibility.
Address for Correspondence: Eric Boccio, MD, MPH, Mount Sinai Medical Center of Florida, Department Of Emergency Medicine, 4300 Alton Road Miami Beach, FL 33140, Email: bocciomedicalservices@gmail.com.
Conflicts of Interest: By the WestJEM article submission agreement, all authors are required to disclose all affiliations, funding sources and financial or management relationships that could be perceived as potential sources of bias. No author has professional or financial relationships with any companies that are relevant to this study. There are no conflicts of interest or sources of funding to declare.
1. Offenbacher J, Nikolla DA, Carlson JN, et al. Incidence of rescue surgical airways after attempted orotracheal intubation in the emergency department: a National Emergency Airway Registry
(NEAR) study. Am J Emerg Med. 2023;68:22–27.
2. Nwanne T, Jarvis J, Barton D, Donnelly JP, et al. Advanced airway management success rates in a national cohort of emergency medical services agencies. Resuscitation. 2020;146:43–49.
3. Mallows, JL, Tyler PA. Randomized controlled trial comparing an open surgical technique and a Seldinger technique for cricothyrotomy performed on a simulated airway. AEM Educ Train. 2021;5(4):e10699.
4. Bribriesco A, Patterson GA. Cricothyroid approach for emergency access to the airway. Thora Surg Clin. 28(3), 435–440.
5. Johnson D R, Dunlap A, McFeeley P, et al. (1993). Cricothyrotomy performed by prehospital personnel: a comparison of two techniques in a human cadaver model. Am J Emer Med, 1993:11(3), 207–209.
6. Schaumann N, Lorenz V, Schellongowski P, et al. Evaluation of Seldinger technique emergency cricothyroidotomy versus standard surgical cricothyroidotomy in 200 cadavers. Anesthesiology. 2005:102(1), 7–11.
7. Chan TC, Vilke GM, Bramwell K J, et al. Comparison of wire-guided cricothyrotomy versus standard surgical cricothyrotomy technique. J Emerg Med. 1999:17(6), 957–962.
8. Schober P, Hegemann MC, Schwarte L A, et al. (2009). Emergency cricothyrotomy: a comparative study of different techniques in human cadavers. Resuscitation,2009:80(2), 204–209.
9. Heymans F, Feigl G, Graber S, et al. Emergency cricothyrotomy performed by surgical airway-naive medical personnel: a randomized crossover study in cadavers comparing three commonly used techniques. Anesthesiology, 2016:125(2), 295–303.
10. Poole O, Vargo M, Zhang J, et al. A comparison of three techniques for cricothyrotomy on a manikin. Can J Resp Ther. 2017:53(2), 29–32.
11. Reardon, RF, Robinson, AE, Kornas R, et al. Prehospital surgical airway management: an NAEMSP position statement and resource document. Prehosp Emer Care, 2022:26(sup1), 96–101.
12. Kanji H, Thirsk W, Dong S, et al. Emergency cricothyroidotomy: a randomized crossover trial comparing percutaneous techniques: classic needle first versus “incision first.” Acad Emerg Med, 2012:19(9), e1061–e1067.
13. Boccio E, Gujral R, Cassara M, et al. Combining transtracheal catheter oxygenation and needle-based Seldinger cricothyrotomy into a single, sequential procedure. Am J Emerg Med, 2015:33(5), 708–712.
14. Dimitriadis JC, Paoloni R. Emergency cricothyroidotomy: a randomised crossover study of four methods. Anaesthesia. 2008 Nov;63(11):1204-8.
Boccio
Comparison of Emergency Department Boarders Managed by a Critical Care Consult Service versus Standard
Care
Matthew Johnson, MD
Alexander Bracey, MD
Ashar Ata, MD
William DaSilva, MD
Sean Patrick Geary, MD
Authors continued at end of article
Section Editor: Dell Simmons, MD
Albany
Submission history: Submitted October 1, 2025 Revision received February 27, 2026; Accepted February 28, 2026
Electronically published June 28, 2026
Full text available through open access at http://escholarship.org/uc/uciem_westjem DOI 10.5811/westjem.53002
Introduction: Emergency department (ED) boarding of critically ill patients awaiting intensive care unit (ICU) admission has been associated with delays in time-sensitive interventions, prolonged lengths of stay (LOS), increased crowding, and higher incidence of morbidity and mortality. To address this, our institution implemented an ED critical care consult team in 2020 and established a resuscitation and emergency critical care fellowship in 2022. The critical care consult team, staffed by emergency physicians with additional resuscitation or critical care training, provides consultative support for resuscitations and the management of boarding critically ill patients 10 hours per day, with the dual goals of improving clinical care and optimizing patient flow. The primary outcome of this study was to evaluate the rate of patients downgraded from their initial admission level of care (ICU, Intermediate care) to a lesser intensity of care (intermediate, ward, home). Secondary outcomes included ED, ICU, and hospital LOS.
Methods: We conducted a retrospective chart review of all patients ≥ 18 years old with ICU or intermediate care admission orders placed between November 1–30, 2024. Patients were sequentially identified via the electronic health record, and clinical and quality assurance data were collected in a REDCap database.
Results: During the study period, the ED critical care consult team was active on 73% of days, staffed primarily by resuscitation and emergency critical care fellows. Of 372 eligible patients, 18% (68/372) were managed by the critical care consult team after initial assessment by primary emergency physician staff, while 82% (304/372) served as controls and did not have involvement with the critical care consult team. Patients evaluated by the team had higher acuity, with 30.9% presenting with an Emergency Severity Index (ESI) score 1 compared to 4.6% in the control group. Despite this, the downgrade rate was significantly higher in the ED3CT cohort (29.4% vs 11.8%, p=0.001). No differences were observed in ED (0.62 days vs 0.60 days, P = .80), ICU (5.1 days vs. 5.2 days, P = .93), or hospital LOS (9.7 days vs 10.8 days, P = .68).
Conclusion: These findings suggest that ED-based critical care physicians, including fellows in training, may facilitate earlier identification of patients suitable for lower levels of care despite initially higher acuity. While there was no change in ED, ICU, and hospital length of stay, it is possible that this is related to systemic problems with hospital bed availability. The high rate of downgrades highlights the benefits of ED-based critical care physicians advancing care of critically ill patients boarding in the ED. [West J Emerg Med. 2026;27(4)971–976.]
Medical Center, Department of Emergency Medicine, Albany, New York
INTRODUCTION
The practice of emergency department (ED) boarding is among the most pressing issues in emergency medicine, notably in regard to critically ill patients waiting for an intensive care unit (ICU) bed. Prior work has demonstrated an increased number of critically ill ED patients in the last decade without a concomitant increase in the number of ICU beds.1,2 Critically ill patients boarding in the ED while awaiting ICU admission experience prolonged hospital length of stay (LOS), delays in time-sensitive interventions, increased crowding-related system strain, and higher risks of morbidity and mortality due to suboptimal nurse-to-patient ratios, reduced multidisciplinary ICU involvement, and inconsistent implementation of standardized critical care pathways.3 Various approaches have been employed to address these issues, including early identification systems, protocolized treatment plans, ED-based critical care teams or units, telemedicine support, and hastening ICU admissions.3-5 However, these approaches tend to be specific to the institution in which they are developed and lack generalizability and consistency of benefit.
We have previously described our local approach to this challenge and its impact on financial outcomes; in this study we describe the effects on clinical outcomes.6 At our institution (an academic, urban, quaternary referral center), we instituted the ED critical care consult team in 2020 and established a resuscitation and emergency critical care fellowship in 2022.7 Our adult ED has approximately 60,000 patient visits per year and is licensed for 73 acute care beds. Intensive care and intermediate care (also known as high-dependency care, stepdown care, or progressive care) admissions make up to 16% of annual visits. The ED critical care consult team is composed of emergency physicians with additional critical care training (critical care medicine, surgical critical care or resuscitation, and emergency critical care fellowships). This team assists with the management of critically ill patients boarding within the ED and active resuscitations.
The goal of our ED critical care consult team is multifactorial. Its focused delivery of critical care to patients boarding in the ED while awaiting placement in an ICU or intermediate care unit bed frees the broader ED to focus on other tasks. Implementation of similar programs, such as the Stanford Emergency Critical Care Program, has led to decreases in in-hospital mortality.8 In addition to improved clinical outcomes, one of the primary goals of the team is to improve flow through the ED. The primary outcome of this study was to evaluate the downgrade rate of patients managed by the ED critical care consult team—meaning those patients who received a downgrade order to a lesser intensity of care (ie, ICU-to-intermediate care or intermediate care-to-ward). We ultimately chose the downgrade rate because it is a marker of clinical improvement in a patient’s status, as well as an indication that the patient is less of a burden on the overall ED staff. Secondary outcomes included ED LOS, hospital LOS, and ICU LOS.
Population Health Research Capsule
What do we already know about this issue? Intensive care unit boarding in the ED is linked to delays in care, longer length of stay (LOS), and increased mortality among critically ill patients.
What was the research question?
Does an ED critical care team increase ICU downgrades vs standard care?
What was the major finding of the study? Downgrades were 3-fold higher with an ED critical care team (29.4% vs 11.8%, P = .001); ED LOS was unchanged.
How does this improve population health?
An ED critical care team improves ICU resource use and patient flow, reducing boarding strain and supporting safer ED care delivery.
METHODS
We conducted a retrospective chart review of patients for whom admission orders to an ICU or intermediate care unit were placed (ie, intended for admission) between November 1–November 30, 2024. All patients were ≥ 18 years of age. The study was approved by the institutional review board (STUDY00004598), and records were reviewed in accordance with best practices for emergency medicine research.9 Patients were sequentially identified by a single author through a query of the electronic health record (Epic Systems Corporation, Verona, WI). We collected data using a predefined abstraction to capture demographic, primary, and secondary outcome measures. Extracted data were entered into a secure REDCap database (Research Electronic Data Capture hosted at Albany Medical Center). We used medical record numbers and individual encounter numbers to link admission orders with corresponding demographic and outcome data. The abstractor was not blinded to the study hypothesis, and performance was not monitored. Because there was a single abstractor, interrater reliability was not assessed, and duplicate sampling was not performed. There were no missing data. Within our institution, the decision to admit to a specific level of care is made via conversation between the emergency physician and the accepting service, with specific indications noted in Table 1. The ICU subtypes included medical, surgical, neuroscience, cardiac, and cardiovascular surgical. The intermediate care subtypes included medical, surgical,
Table 1. List of criteria for admission to intensive care and intermediate care units at our institution.
Nursing or Lab Intervention
ICU Admission
Every hour intervention
IMC admission
Every 2-4 hour intervention
Vasopressors Greater than 10 μg/min of norepinephrine or equivalent < 10 μg/min of norepinephrine or equivalent
Vasopressors include norepinephrine, phenylephrine, and vasopressin. Inotropes and inodilators include epinephrine, dobutamine, dopamine, and milrinone. Continuous analgosedation permitted in the IMC is limited exclusively to dexmedetomidine. Extracorporeal therapies include CRRT, microaxial flow pump, IABP, and ECMO. All admission decisions are ultimately at the clinician’s discretion. CRRT, continuous renal replacement therapy; ECMO, extracorporeal membrane oxygenation; ICU, intensive care unit; IMC, intermediate care unit; IABP, intra-aortic balloon pump; μg, microgram.
neuro, cardiac, and spine intermediate care units. The ED critical care care team was not involved in the initial decision to admit to a specific level of care.
We summarized categorical variables as frequency counts and percentages and compared them via Pearson chi-square and Fisher exact test, as appropriate. Continuous variables were summarized as means and standard deviations and were compared via t-tests and Wilcoxon rank-sum tests, as appropriate. We used statistical software STATA 18.0 (StataCorp, LLC, College Station, TX) for analysis.
RESULTS
During the study period, the ED critical care consult team was active on 22 of 30 days (73%) between 2 pm - 12 am. All shifts were primarily staffed by resuscitation and emergency critical care fellows with backup on-call coverage available from the emergency physician critical care leadership. We identified 372 patients intended for ICU or intermediate care unit admission. Of those patients, 68 of 372 (18%) were managed by the ED critical care consult team, while 304 of 372 (82%) had no contact with the team and served as the control group. When comparing patients between the critical care consult team and control groups, we noted similar ages and primary ED diagnoses (Table 2). However, the rates of respiratory distress and sepsis were higher in the ED critical care consult team group compared with the control group. In contrast, the control group had high rates of neurologic and cardiac emergencies. In general, the patients seen by the ED critical care physician had higher acuity, with > 30% of patients having an initial ESI score of one compared to < 5% in the control group. This was further demonstrated by the initial disposition level of intensity, with trends toward higher
initial dispositions of ICU level of care being seen by the ED critical care consult physician (39.7% and 31.9%, respectively). Despite the overall higher acuity, the downgrade rates with the team were 29.4% versus 11.8% with the control group. This finding persisted when controlling for the initial disposition intensity of care (Figure 1). However, despite these higher rates of downgrades, we found no differences in ED, hospital, or ICU LOS.
DISCUSSION
Our findings add to the growing evidence in support of the utility of ED-based critical care consult physicians. We found that patients seen by these emergency physicians were three times more likely to be downgraded to a lesser intensity of care. This finding persisted across both ICU and intermediate care unit levels of care, despite minor differences in patient populations that may reflect the ED critical care consult team’s predilection for managing the sickest patients in the ED. This selection bias may have contributed to the observed similarity in hospital courses (both ICU/intermediate care unit and overall) between cohorts, despite a significant increase in patient downgrades with the critical care team cohort. These findings are similar to those reported by Gunnerson et al after the introduction of an emergency critical care center and Mitarai et al after the implementation of an emergency critical care program. Both observed a reduction in ICU admissions following their approaches to ED-based critical care.8,10 However, both studies used before-and-after comparisons, while our data are part of a sequentially enrolled cohort study.
The effects of boarding on critically ill patients have been well defined in the literature since the work of Chalfin et al showed an increase in mortality after six hours of boarding.11 In
Primary ED diagnosis (%)
Initial Level of Care
length of stay (days) 5.1 5.2 .93
ED3CT, emergency department critical care consult team: ESI, Emergency Severity Index; IMC, intermediate care unit, ICU, intensive care unit.
addition to the effects on the individual patient, prolonged ED boarding has effects across the healthcare system, including prolonged ED LOS for all patients, higher numbers of left before completion of care, and increased stressors on individual clinicians.3 The introduction of this team has nearly tripled the downgrade rate among critically ill patients boarding in the ED. Although it is a surrogate outcome, transitioning patients from the ICU or intermediate care unit to a lower level of care may serve as a marker of clinical improvement as well as reduced nursing and departmental intensity of care (ie, less frequent nursing checks, medication titrations, ventilatory support monitoring, etc).
Our data are likely the first to explore the impact of a resuscitation and emergency critical care fellowship on departmental throughput and ED-based critical care, as all ED critical care consult team shifts during this period were covered by resuscitation and emergency critical care fellows with backup from emergency physician critical care attending. To our knowledge, prior work has been exclusively focused on the
attending-level care. While this limits the generalizability of our data, it further reinforces the potential benefits of emergency physicians with additional critical care training and focus on the ED. It is plausible that our results underestimate the overall benefits of the ED critical care consult physician, given the difference in acuity between our groups, as well as the clinicians providing the direct bedside care still being in training.
Finally, despite the significant downgrade rate, we did not see any significant changes in ED LOS or ICU LOS. This likely owes to our institution typically operating at or above capacity. Importantly, downgrading patients who were boarding in the ED for an ICU or intermediate care unit bed did not lengthen the ED course, but did offload the ICU, potentially creating additional capacity for those who needed this scarce resource.
LIMITATIONS
There are several limitations to this report. First, these data are from a single center over one month. Second, our division has five emergency physicians with additional formal critical care fellowship training and a resuscitation and emergency critical care fellowship, which may limit the generalizability of these findings. Third, there are differences between our two patient populations, which are likely multifactorial and related to the methods of ED critical care team consultation, day-to-day variations in ICU boarding, and department-specific needs. This potentially introduces selection bias, although we reviewed all patients during the study period and found our results held across multiple subgroups. Fourth, we used the ESI to compare acuity and resource use between the control and intervention groups. However, the ESI is ultimately a triage tool that was developed to identify acuity on arrival to the ED and resource use, and not the severity of critical illness as do the APACHE or sequential organ failure assessment scores.
We do think that when considering patient ED boarding and resource use, the ESI has a role, but we acknowledge that it is not the best marker of overall patient acuity. Fifth, the specific indications for ICU and intermediate care unit admission vary between institutions (our specific indications are noted in Table 1). Ours requires admission for respiratory failure on noinvasive ventilatory support, as well as diabetic ketoacidosis requiring continuous insulin infusion and hourly finger sticks that may not require higher levels of care at other institutions. Ultimately, this leads to some system-specific benefits, and it is unclear what portion of our downgrades came from these populations (general diagnosis seen in Table 2). Nevertheless, we did not see changes in ED LOS; the prevention of ICU/ intermediate care unit admissions for patients with frequent short stays in the ICU has previously been associated with improved ICU bed use for more complex patients.12
Sixth, these patients were seen by resuscitation and emergency critical care fellows primarily with attending-level
Table 2. Demographic data and outcomes comparing patients managed by the emergency department critical care team and the control group in a prospective review of critically ill patients boarding in the emergency department.
Figure 1. Downgrade rates separated into initial level of care for patients managed by the emergency department critical care consult team and the control group in a prospective review of critically ill patients boarding in the emergency department. ED3CT, emergency department critical care consult team; ICU, intensive care unit; IMC, intermediate care unit.
oversight; we had no control group of patients re-evaluated by an emergency physician separate from evaluation by the ED critical care team. This raises the question about what specific level of clinician (ie, resident, fellow, general emergency physician, ED critical care physician, etc) is required to show benefit. However, patients are managed continuously throughout their ED stay by the general emergency physicians, and the downgrade rate is substantially lower than that seen by the ED critical care consult team. Whether this is due to comfort with transition in care by this team (resuscitation and emergency critical care fellows and ED critical care physicians) is not identified in this study.
Seventh, we did not record the length of time needed for each ED critical care team consultation; we estimate 30–60 minutes per patient, but this is purely anecdotal. Ultimately, we are reassured that despite this additional consultation, the ED LOS did not change. Eighth, at our institution, it is the responsibility of the emergency physician, rather than the intensivist, to assess for downgrades; this makes downgrades an emergency physician-driven process as opposed to an intensivist-driven process. This may limit generalizability at institutions where intensivist-driven downgrades are common. However, the significant benefit of a dedicated ED-based critical care physician is reflected in our data, as patients seen by the ED critical care consultation team were three times more likely to be downgraded than those who were not evaluated by the team. Further work is needed to evaluate whether this benefit is specific to ED-based critical care physicians, ICU physicians, or other clinicians.
CONCLUSION
Patients seen by an ED critical care consult physician had a
three times higher downgrade rate when compared to the control group. Given the significant stressors that critically ill patients boarding in the ED place on the department as a whole, we feel that targeted care to these patients with ED-based critical care physicians may have a growing role to play in the care of the sickest patients in the ED in the coming years.
AUTHORS CONTINUED
Iman Aly, MD
Warren Hayashi, MD
Rachel Leavitt, MD
James Mantas, MD
Christopher Hanowitz, MD
Luke Duncan, MD
Denis Pauze, MD
Gregory P. Wu, MD
Address for Correspondence: Matthew C. Johnson, MD, Albany Medical Center, Department of Emergency Medicine, 43 New Scotland, Albany, NY 12208. Email: johnsom6@amc.edu.
Conflicts of Interest: By the WestJEM article submission agreement, all authors are required to disclose all affiliations, funding sources and financial or management relationships that could be perceived as potential sources of bias. No author has professional or financial relationships with any companies that are relevant to this study. There are no conflicts of interest or sources of funding to declare.
1. Ruxin T, Feldmeier M, Addo N, et al. Trends by acuity for emergency department visits and hospital admissions in California, 2012 to 2022. JAMA Netw Open. 2023;6(12):e2348053. Available at: https:// jamanetwork.com/journals/jamanetworkopen/fullarticle/2812897. Accessed October 20, 2025.
2. Griffin G, Krizo J, Mangira C, et al. The impact of COVID-19 on emergency department boarding and in-hospital mortality. Am J Emerg Med. 2023;67:5-9.
3. Mohr NM, Wessman BT, Bassin B, et al. Boarding of critically ill patients in the emergency department. Crit Care Med. 2020;48(8):1180-1187.
4. Weingart SD, Sherwin RL, Emlet LL, et al. ED intensivists and ED intensive care units. Am J Emerg Med. 2013;31(3):617-20.
5. Leibner E, Spiegel R, Hsu CH, et al. Anatomy of resuscitative care unit: expanding the borders of traditional intensive care units. Emerg Med J. 2019;36(6):364.
6. Johnson M, Segev E, Bracey A, et al. Recovering lost opportunities in the management of critically ill patients boarding in the emergency department. Acad Emerg Med. 2025;32(6):699-701.
7. Bracey A, Tichauer MB, Wu GP, et al. Blueprint for the development of resuscitation and emergency critical care fellowships. AEM Educ Train. 2023;7(5):e10905. Available at: https://onlinelibrary.wiley.com/ doi/10.1002/aet2.10905. Accessed October 20, 2025.
8. Mitarai T, Gordon AJ, Nudelman MJR, et al. Association of an emergency critical care program with survival and early downgrade among critically ill medical patients in the emergency department. Crit Care Med. 2023;51(6):731-741.
9. Worster A, Bledsoe RD, Cleve P, et al. Reassessing the methods of medical record review studies in emergency medicine research. Ann Emerg Med. 2005;45(4):448-451.
10. Gunnerson KJ, Bassin BS, Havey RA, et al. Association of an emergency department–based intensive care unit with survival and inpatient intensive care unit admissions. JAMA Netw Open. 2019;2(7):e197584. Available at: https://jamanetwork.com/journals/ jamanetworkopen/fullarticle/2738625. Accessed October 20, 2025.
11. Chalfin DB, Trzeciak S, Likourezos A, et al. Impact of delayed transfer of critically ill patients from the emergency department to the intensive care unit. Crit Care Med. 2007;35(6):1477-1483.
12. Chidi OO, Perman SM, Ginde AA. Characteristics of short-stay critical care admissions from emergency departments in Maryland. Acad Emerg Med. 2017;24(10):1204-1211.
Single Question vs Ongoing Violence Assessment Tool for Intimate Partner Violence Screening
Gretchen Nonawzki, DO*‡o
Zhengqiu Zhou, MD*‡o
Maureen Mohan, MD*‡
Saria Slowey, DO*‡
Donna Carden, MD†
Robyn Hoelle, MD*‡
Section Editor: Tom Benzoni, MD
HCA Florida North Florida Hospital, Department of Graduate Medical Education, Gainesville, Florida
† ‡ o
University of Florida, Department of Emergency Medicine, Gainesville, Florida University of Central Florida/HCA Florida Healthcare, Gainesville, Florida Co-first authors
Submission history: Submitted July 16, 2025; Revision received February 4, 2026; Accepted February 5, 2026
Electronically published June 16, 2026
Full text available through open access at http://escholarship.org/uc/uciem_westjem DOI 10.5811/westjem.49021
Introduction: Intimate partner violence (IPV) represents a pervasive and costly public health issue. Many IPV victims seek care in the emergency department (ED) due to injuries or related medical complaints; yet a substantial number of cases remain undetected. The challenge lies in implementing effective screening tools within the demanding environment of an ED. In this study we aimed to assess the efficacy of two brief IPV screening tools— the single question, “Have you been hit, kicked, punched, or otherwise hurt by someone in the past year?” and the 4-item Ongoing Violence Assessment Tool— and to compare them to the more comprehensive Index of Spouse Abuse, a validated 30-item survey that is considered the gold standard for IPV assessment. Our objective was to identify improved strategies for IPV screening in the busy ED setting.
Methods: In this prospective study, every third English-speaking female patient 18-55 years of age presenting to our ED triage was invited to participate. Each participating patient was sequentially assigned to either the single question or the ongoing assessment screening group. Both groups completed feedback surveys about their experiences and the Index of Spouse Abuse survey. We used chi-square tests to compare categorical variables, and we used frequency tables to calculate the sensitivity, specificity, positive predictive value, and negative predictive value of each IPV screening tool. We compared test characteristics between the Ongoing Violence Asessment Tool or the single question screening tool to the Index of Spouse Abuse using the Fisher exact test. Mean duration was compared using two-tailed Student t-tests. The primary outcome was the sensitivity and specificity of the single question assessment. and the 4-item Ongoing Violence Assessment Tool, using the Index of Spouse Abuse as the gold standard for IPV screening. Secondary outcomes were to record the length of time needed to screen with the single question assessment and the Ongoing Violence Assessment Tool and to collect participant feedback on the two screening tools.
Results: A total of 400 participants were enrolled in the study and completed the designated surveys. Screening time was significantly shorter in the single question group (median 6 seconds) compared to the ongoing assessment group (median13 seconds; P < .001). Feedback surveys did not reveal significant differences between the two groups. When compared to the Index of Spouse Abuse, the single question tool exhibited sensitivity of 53.3% and specificity of 94.1%, while the ongoing assessment demonstrated slightly higher sensitivity levels of 75.0% and lower specificity of 92.8%. For the single question assesssment, the positive predictive value was 42.1% and negative predictive value was 96.1%. For the Ongoing Violence Assessment Tool, the positive predictive value was 40.1% and the negative predictive value was 98.2%.
Conclusion: The 7-second reduction in overall IPV screening time for the single question compared to the 4-item Ongoing Violence Assessment Tool likely has little clinical benefit, especially with its low sensitivity. Further studies are needed to identify the optimal screening tool for intimate partner violence in the emergency department. [West J Emerg Med. 2026;27(2)977–984.]
INTRODUCTION
Intimate partner violence (IPV) is a pervasive healthcare issue that continues to affect millions of U.S. residents annually and disproportionately affects woman.1,2 The 2016/2017 National Intimate Partner and Sexual Violence Survey demonstrated that 2 in 5 women (51.2 million) have experienced IPV in their lifetime.3 Almost six million women in the U.S, reported IPV in the form of contact sexual violence, physical violence, and/or stalking victimization within the 12 months prior to the survey.3 To address the challenges in IPV recognition and intervention within the healthcare setting, the Joint Commission for the Accreditation of Healthcare Organizations began requiring policies and procedures for IPV screening in hospitals and clinics in 1992.4 However, the efficacy of universal IPV screening remains controversial due to the resources required to execute screening and a lack of evidence that recognizing abuse results in positive outcomes.5 Furthermore, instituting successful screening and intervention programs is especially challenging in busy clinical environments like the emergency department (ED) due to time and privacy restraints. To address these challenges, several studies have evaluated the effectiveness of various questionnaires for IPV screening.6
Two IPV screening tools previously validated in the ED setting are the single question “Have you been hit, kicked, punched or otherwise hurt by someone in the past year?”7 and the four-item Ongoing Violence Assessment Tool.8 The single question assessment is a “yes” or “no” answer, with a response of “yes” being considered a positive screen. This question was the most sensitive and specific of the three questions in the previously validated Partner Violence Screen7,9 and the only one that directly addressed physical violence.7 In comparison, the Ongoing Violence Assessment Tool is a 4-item questionnaire with true or false answers. The questionnaire consists of statements that involve physical and emotional aspects of abuse. The items on the survey include the following: 1) “Within the last month my partner has threatened me with a weapon”; 2) “Within the last month my
Population Health Research Capsule
What do we already know about this issue? Intimate partner violence (IPV) screening in the emergency department (ED) is important for patient safety.
What was the research question?
We compared a single question assessment and a 4-item survey to the Index of Spouse Abuse for IPV screening.
What was the major finding of the study?
The single question assessment was minimally faster than the 4-item survey (7 seconds) but had lower sensitivity (53% vs 75%).
How does this improve population health?
Additional studies are needed to determine more efficient and effective screening tools for intimate partner violence.
partner has beaten me so badly that I had to seek medical care”; 3) “Within the last month my partner has had no respect for my feelings”; and 4) “Within the last month my partner has acted like he/she would like to kill me.” If a participant answers true to any of these items, then that individual screens positive for IPV. Ernst et al found that the. sensitivity of the Ongoing Violence Assessment Tool in detecting ongoing IPV was 86%, and specificity was 83%.8
Developed by Hudson and McIntosh in 1981, the Index of Spouse Abuse (ISA) consists of 30 questions requiring an answer on a 5-point scale from “never” to “very frequently.”10 It remains the gold standard for IPV screening and has been evaluated and validated in many different settings to detect both physical and non-physical violence. However, due to the length of time needed to complete an assessment, it does not allow for timely IPV screening in the ED. In this study, we compared the use of a single question tool and a. 4-item ongoing assessment screening tools to the Index of Spouse Abuse, the time required for administration of each of the screening tools, and patient satisfaction with survey administration. We aimed to evaluate the efficacy of brief IPV screening tools for use in the emergency care setting.
METHODS
Study Setting and Population
This study was a prospective, single center study in a large, academic ED over a two-month period from May–June 2013.
Figure. Sequence of questionnaires conducted in a study of intimate partner violence screening tools. OVAT, Ongoing Violence Assessment Tool; ISA, Index of Spouse Abuse.
Women 18-55 years of age who presented to the ED for treatment were eligible for inclusion. Exclusion criteria included patients who were medically unstable, non-English speaking, had altered mental status, were unable to be interviewed separately from their partner, had a chief complaint of sexual abuse or sexual assault exam, or were previous enrolled in the study. Every third female presenting to the ED who met the inclusion and exclusion criteria were approached and invited to enroll in the study by a trained research assistant (RA) during the hours that an RA was available.
Study Design
The RA approached patients in a private treatment room, and visitors/family members were asked to leave for the consent process and survey administrations. If the patient’s visitors declined to leave or re-entered the room and the participant was unable complete the survey in private, that participant was excluded from the study. We did not record the number of patients who were approached, refused, or were unable to separate from their companion; our goal was to protect the patient’s privacy and avoid generating potentially identifiable records in this vulnerable population.
Once alone in a private room, participants were informed about the IPV study and asked to provide verbal consent if they chose to be enrolled. No written consent was collected due to safety concerns. Once patients consented to participate, they were sequentially assigned to either the single question or the 4-question ongoing assessment group. The RA then administered the assigned survey, reading aloud the question (s), and they recorded the participants’ answers using REDCap (Research Electronic Data Capture). This reproduced routine screening processes in triage. We defined “screening time” as the number of seconds needed to administer either assessment. After answering either the single question or the Ongoing Violence Assessment Tool questionnaire, participants of both groups were administered the Evaluation of Screening Tool, which we developed to assesses participants’ comfort with and their opinions regarding the appropriateness of the screening tool they had just experienced. Both groups were then administered the 30-question Index of Spouse Abuse. Both the Evaluation of Screening Tool and the Index of Spouse Abuse were verbally administered by the RA and recorded on REDCap. Any positive answer on any of the screening tools was considered concerning for IPV and triggered the RA to ask the woman’s permission to contact the ED social worker to provide support, which is the standard process when a patient is considered to be experiencing IPV. The RAs were trained to follow a script for recruiting participants, administering the questionnaires, and reacting to positive screens to maintain consistency between participants (Supplemental Document 1). Participants’ baseline demographics were recorded on REDCap during enrollment as well.
Outcomes
The primary outcome was the sensitivity and specificity of
the single question and the 4-item ongoing assessment tools using the Index of Spouse Abuse as the gold standard for IPV screening. Secondary outcomes were time needed to screen with each questionnaire and participants’ feedback on the assessment tools.
Sample Size
We completed sample size calculations prior to study implementation. To detect a 10% change in positivity rates between the two screening tools, assuming an α of 0.05 and β of 0.2, 200 subjects were needed in each study arm for a total of 400 participants.
Analysis
We used chi-square to compare categorical variables and frequency tables to calculate the sensitivity, specificity, positive predictive value, and negative predictive value of each IPV screening tool. Test characteristics between the single question and the 4-item ongoing assessment of violence tool were compared to the Index of Spouse Abuse using the Fisher exact test. We compared mean duration using twotailed Student t-tests. Statistical analyses were done with SAS v13.2 (SAS Institute Inc, Cary, NC).
RESULTS
Over the two-month study period, 400 women participated in this study. For privacy purposes we did not record the number of women who were approached and chose not to participate or stopped participation during the assessment. Of the 400 study participants, 202 were assigned to the single question group and 198 to the 4-itemn assessment for ongoing violence group. Participant demographics are summarized in Table 1. There were no significant differences in age, relationship status, or insurance status between the two groups. The number of participants who screened positive for IPV were similar between the two groups (Table 2). In the single question group, 19 (9.5%) participants had a positive screen for IPV and 182 (90.6%) had a negative screen. In the 4-item ongoing violence assessment group, 24 (12.2%) participants had a positive screen for IPV and 172 (87.8%) had a negative screen While the screening positivity rates showed no significant difference, there was a significant difference between the time required to complete the surveys. The single question survey took significantly less time, with a median of 6 seconds (interquartile range [IQR] 2) vs the Ongoing Violence Assessment Tool survey with a median of 13 seconds (IQR 16, P < .01).After answering the single question or the 4-item ongoing assessment of violence surveys, each participant also completed the Evaluation of Screening Tool consisting of three yes-or-no questions. The first question, “Do you think the screening tool should be given to every patient (men and women) in the emergency room?” was answered “yes” by 180 (89.1%) participants in the single question group and 174 (89.2%) in the Ongoing Violence Assessment Tool group. The
Table 1. Characteristics of patients undergoing screening for intimate partner violence using either the single question tool or the 4-question Ongoing Violence Assessment Tool. Characteristics
Relationship status
standard deviation; IQR, interquartile
second question, “Do you think the screening tool will help patients report violence or abuse that may be occurring at home or with a partner” was answered “yes” by 181 (89.6%) participants in the single question group and 179 (91.8%) in the 4-question Ongoing Violence Assessment Tool group. The final question, “Did you feel uncomfortable answering the screening tool” was answered “yes” by 7 (3.5%) participants in the single question group and 10 (5.1%) in the Ongoing Violence Assessment Tool group. There was no significant difference in
feedback survey results between the two groups for any of the Evaluation of Screening Tool questions (Table 3). The Index of Spouse Abuse questionnaire was answered by 394 of 400 study participants. The 30-item questionnaire includes two sections: the ISA-P, which contain questions that screen for physical abuse, and the ISA-NP, which contain questions that screen for nonphysical abuse. Results are considered positive when the ISA-P score is > 10 points or ISA-NP score is greater than 25 points. Thirty-six (9.1%) participants had a positive screen in
Table 2. Intimate partner violence screening outcomes using the single question and 4-item Ongoing Violence
Single Question, n = 201
1. Have you been hit, kicked, punched or otherwise hurt by someone in the past year?
= “True”
= “False”
Ongoing Violence Assessment Tool, n = 196
1. Within the last month my partner has threatened me with a weapon. Positive = “True” Negative = “False”
2. Within the last month my partner has beaten me so badly that I had to seek medical care.
= “True”
3. Within the last month my partner has had no respect for my feelings. Positive = “Occasionally” or more Negative = “Rarely” or “Never”
4. Within the last month my partner has acted like he/she would like to kill me. Positive = “True”
(88.3)
Table 3. Outcomes of participant experience survey (Evaluation of Screening Tool) in participants assessed by the single question or 4-item Ongoing Violence Assessment Tool for intimate partner violence screening.
1. Do you think the screening tool should be given to every patient (men and women) in the emergency room?
2. Do you think the screening tool will help patients report violence or abuse that may be occurring at home or with a partner?
3. Did you feel uncomfortable answering the screening tool?
the ISA-P group, 32 (8.1%) in the ISA-NP group, and 27 (6.9%) participants were positive in both the ISA-P and ISA-NP (Supplemental Table 1). The mean and median scores are also summarized in Supplemental Table 1. Breakdown of responses to individual questions on the Index of Spouse Abuse are summarized in Supplemental Table 2.
When looking at the frequencies of positive and negative screenings using the single question and 4-item ongoing violence assessment compared to the Index of Spouse Abuse, we found they were statistically different. Eight participants were positive for both the single question assessment and the ISA-P and -NP combined; seven were positive for the ISA-P and -NP combined but negative for the single question assessment; 11 were positive for the single question assessment but negative for the ISA-P and -NP combined; and 174 were negative for both the single question assessment and the ISA-P and NP combined (P < .001). Nine participants were positive for both the Ongoing Violence Assessment Tool and the ISA-P and -NP combined, three were positive for the ISA-P and -NP combined but negative for the ongoing violence assessment, 13 were positive for the ongoing violence assessment but negative for the ISA-P and -NP combined, and 168 were negative for both the ongoing violence assessment and the ISA-P and -NP combined (P < .001, Table 4). Additional details on frequencies of ISA-P and ISA-NP separated and their P values are listed in Table 4.
The single question screening tool had sensitivities of 42.9% when compared to the ISA-P, 50.0% when compared to the ISA-NP and 53.3% when compared to the ISA-P and -NP combined. Specificities were 94.4% when compared to the ISA-P, 94.5% when compared to the ISA-NP, and 94.1% when compared to the ISA-P and -NP combined (Table 4). The Ongoing Violence Assessment Tool displayed slightly higher sensitivities—66.7% when compared to the ISA-P, 71.4% when compared to theISA-NP and 75.0% when compared to the ISA-P and NP combined. Specificities of the Ongoing Violence Assessment Tool were similar to the single question survey: 93.3% when compared to both the ISA-P and ISA-NP individually and 92.8% when compared to the ISA-P and -NP
combined (Table 4). For the single question survey, positive predictive value ranged between 42.1%-47.4% and negative predictive value was 93.4%-96.1%. For the Ongoing Violence Assessment Tool, positive predictive value was 40.1%-45.5% and negative predictive value was 97.1%-98.2% (Table 4).
Interestingly, when grouped by positive vs negative ISA results, there was no significant difference in the survey evaluation results in the first two questions: 1). “Do you think the screening tool should be given to every patient in the emergency room?”; and 2) “Do you think the screening tool will help patients report violence or abuse that may be occurring at home or with a partner?.” However, the third question “Did you feel uncomfortable answering the screening tool?”, women who screened positive on the ISA more often felt uncomfortable answering the screening tool vs those who did not (Table 5).
DISCUSSION
Intimate partner violence is an epidemic that affects millions of people every year worldwide.3 It is also highly under-recognized, in part due to lack of available, wellvalidated screening tools that can be completed in a timely manner. In this study we analyzed the efficacy of using a single question survey. and 4-item Ongoing Violence Assessment Tool compared to the ISA, which is the current gold standard for ongoing IPV evaluation. Comparing each violence screening tool to the ISA, we found that both the single question and Ongoing Violence Assessment Tool had adequate specificity, but low sensitivity. The single question tool had higher specificity compared to the Ongoing Violence Assessment Tool, while the ongoing assessment had higher sensitivity. The single questio survey was significantly quicker to administer than the Ongoing Violence Assessment Tool. Feldhaus et al showed that the three-question Partner Violence Screen achieved a sensitivity of 64.5% and a specificity of 80.3% when compared to the ISA.7 In our study, using the single question survey alone, which is one of the three questions from the Partner Violence Screen, we observed lower sensitivity but an increase in specificity compared to the
Table 4. Test characteristics of the single question survey and the 4-item Ongoing Violence Assessment Tool in comparison to the 30item Index of Spouse Abuse. Single Question vs Index of Spouse Abuse (n = 201)
Ongoing Violence Assessment Tool vs Index of Spouse Abuse (n = 196)
ISA, Index of Spouse Abuse; ISA-P, Index of Spouse Abuse physical; ISA-NP, Index of Spouse Abuse nonphysical; PPV, positive predictive value; NPV, negative predictive value.
three question Partner Violence Screen. This reduction in sensitivity may be due to the focus only on physical abuse. The single question could potentially miss non-physical IPV, as IPV can also manifest in other forms such as sexual or psychological abuse. Other, more generalized single question screens such as “Do you feel safe at home?” have also been evaluated but demonstrated a sensitivity of only 8.8% and a specificity of 91.2% in primary care settings,11 highlighting the ongoing challenge of identifying quick, effective single question IPV screening tools.
When the Ongoing Violence Assessment Tool was previously compared to the Index of Spouse Abuse, it was shown to have a sensitivity of 86% and specificity of 83% in the ED setting.8 Our study demonstrates a lower sensitivity at 75% but higher specificity of 93% when combining physical and nonphysical Index of Spouse Abuse items. Numerous factors may have contributed to the differences in the two studies’ results including different patient population, study time frames, and methods of administering the questions. For instance, studies have shown that computer-based screening had higher detection rates of IPV than in person-to-person screenings likely due to a computer‘s increased privacy and added sense of security.12 In our study, we chose to simulate actual ED screening circumstances as closely as possible while keeping the participants safety in mind.
This efficacy study demonstrated a significant difference in time to complete the single question vs the Ongoing Violence Assessment Tool. Although the Ongoing Violence Assessment Tool had higher sensitivity, completing it took
more than twice as long as the single question (median 13 seconds and 6 seconds, respectively). This may be significant when total ED triage time is expected to be < 5 minutes on average.13 However, the clinical significance of a 7-second shorter median screening time should be further evaluated. The American College of Emergency Physicians emphasizes that screening should occur only after initial stabilization and not delay access to care.14 The optimal balance between triage efficiency and time spent on screening for various social determinants of health is yet to be determined.15
To improve IPV outcomes, increased ED triage screening alone is unlikely to be helpful.16, 17 Adequate institutional resources such as improved ED workflow, staff training, and the availability of services for patients who screen positive are needed to translate screening into effective care. Programs should include defined referral pathways and institutional capacity to address immediate safety and psychological needs of patients. Improving clinicians’ knowledge of available resources and nonjudgmental communication may improve patient experience and engagement with follow-up, which is crucial for improved outcomes.
LIMITATIONS
This study has multiple limitations. First, it was conducted at a single site, which may limit generalizability to other clinical settings. Second, only English-speaking women were included. This excludes populations, such as Hispanic communities, which are disproportionately affected by IPV.18 Third, the study was restricted to participants 18-55 years of
Table 5. Participants’ assessment of the single question survey and the 4-item Ongoing Violence Assessment Tool using the Evaluation of Screening Tool results separated by Index of Spouse Abuse results.
1. Do you think the screening tool should be given to every patient in the emergency room?
2. Do you think the screening tool will help patients report violence or abuse that may be occurring at home or with a partner?
3. Did you feel uncomfortable answering the screening tool?
ISA-P, Index of Spouse Abuse physical; ISA-NP, Index of Spouse Abuse nonphysical.
age. Although IPV is less frequently reported among individuals > 55, studies have shown that up to 27.4% of adults > 60 may still experience IPV.19 Fourth, sampling only included every third woman due to RA staffing issues and limited space to hold private conversations. Fifth, while the RAs approached approximately 600 women to achieve 400 enrollments, this only represented a 5% sample of the total number presenting to the adult ED at our institution during the study period. This may limit the representativeness of the broader ED population and introduce sampling bias. Sixth, the study did not assess IPV among male patients, despite evidence that > 40% of men in the U.S. report lifetime experiences of IPV.3
Further research is needed to determine whether these screening tools perform similarly in other populations, such as men. Seventh, the Evaluation of Screening Tool developed by research personnel has not been validated. Finally, the study was conducted in 2013, which may limit the relevance of the findings to current practice. However, there are still no standard practices for IPV screening and no widely adopted new screening tools.15, 20 Therefore, updated studies involving broader and more diverse populations are needed to further guide best practices in IPV screening.
CONCLUSION
Our study showed that while the single question “Have you been hit, kicked, punched, or otherwise hurt by someone in the past year?” minimally decreased ED screening time for intimate partner violence, the question had low sensitivit — missing about half the cases identified by the Index of Spouse Abuse. The 4-item Ongoing Violence Assessment Tool had slightly higher sensitivity than the single question. However, given the low sensitivities of both screening tools, their utility as screening strategies for detecting IPV in the ED setting must be further evaluated. The 7-second shorter screening time for the single question survey, as compared to the Ongoing Violence Assessment Tool, likely has little clinical relevance, especially given the single question’s sub-optimal sensitivity for detecting IPV. Physicians should be made aware of the potential for the under-recognition of IPV cases with these rapid screening tools and remain vigilant for any signs of partner abuse.
Address for Correspondence: Robyn Hoelle, MD, HCA Florida North Florida Hospital, 1147 Northwest 64th Terr, Gainesville, FL 32605. Email: robyn.hoelle@hcahealthcare.com.
Conflicts of Interest: By the WestJEM article submission agreement, all authors are required to disclose all affiliations, funding sources and financial or management relationships that could be perceived as potential sources of bias. This research was supported (in whole or in part) by HCA Healthcare and/or an HCA Healthcare-affiliated entity. The views expressed in this publication represent those of the author(s) and do not necessarily represent the official views of HCA Healthcare or any of its affiliated entities. Author RH was supported by a grant from University of Florida Emergency Medicine Junior Faculty Research Grant. There are no conflicts of interest to declare.
1. Tjaden PG. Full report of the prevalence, incidence, and consequences of violence against women: findings from the National Violence Against Women Survey. 2000. Available at: https://stacks. cdc.gov/view/cdc/21948. Accessed January 6, 2025.
2. Centers for Disease Control and Prevention. Costs of Intimate Partner Violence Against Women in the United States. 2003 Available at: https://stacks.cdc.gov/view/cdc/6543/. Accessed October 30, 2024.
3. Leemis RW, Friar N, Khatiwada S, et al. The National Intimate Partner and Sexual Violence Survey: 2016/2017 report on intimate partner violence. 2022. Available at: https://stacks.cdc.gov/view/ cdc/124646. Accessed October 30, 2024.
4. Joint Commission on Accreditation of Healthcare Organizations. Comprehensive Accreditation Manual for Hospitals: The Official Handbook. Oakbrook Terrace, IL: Joint Commission Resources; 2001.
5. Wilbur L, Noel N, Couri G. Is screening women for intimate partner violence in the emergency department effective? Ann Emerg Med. 2013;62(6):609-611.
6. Rabin RF, Jennings JM, Campbell JC, et al. Intimate partner violence screening tools. Am J Prev Med. 2009;36(5):439-445.e4.
7. Feldhaus KM, Koziol-McLain J, Amsbury HL, et al. Accuracy of 3 brief screening questions for detecting partner violence in the emergency department. JAMA. 1997;277(17):1357-1361.
8. Ernst AA, Weiss SJ, Cham E, et al. Detecting ongoing intimate partner violence in the emergency department using a simple 4-question screen: the OVAT. Violence Vict. 2004;19(3):375-384.
9. Basile KC, Hertz MF, Black SE. Intimate partner violence and sexual violence victimization assessment instruments for use in healthcare settings. Version 1. 2007. Available at: https://stacks.cdc.gov/view/ cdc/44660. Accessed October 30, 2024.
10. Hudson WW, McIntosh SR. The assessment of spouse abuse: two quantifiable dimensions. J Marriage Fam. 1981;43(4):873-888.
11. Peralta RL, Fleming MF. Screening for intimate partner violence in a primary care setting: the validity of “feeling safe at home” and prevalence results. J Am Board Fam Pract. 2003;16(6):525-532.
12. Trautman DE, McCarthy ML, Miller N, et al. Intimate partner violence and emergency department screening: computerized screening versus usual care. Ann Emerg Med. 2007;49(4):526-534.
13. Jiménez JG, Murray MJ, Beveridge R, et al. Implementation of the Canadian Emergency Department Triage and Acuity Scale (CTAS) in the Principality of Andorra: Can triage parameters serve as emergency department quality indicators? CJEM. 2003;5(5):315-322.
14. Screening questions at triage. Ann Emerg Med. 2023;81(1):e9.
15. Rabin RF, Jennings JM, Campbell JC, et al. Intimate partner violence screening tools: a systematic review. Am J Prev Med. 2009;36(5):439-445.e4.
16. Saberi E, Hutchinson M, Hurley J. Implementing intimate partner violence (IPV) screening within emergency departments – barriers, challenges and enablers experienced by intimate partner violence practice change champions. Int Emerg Nurs. 2023;69:101311.
17. Duchesne E, Nathoo A, Walker M, et al. Patient and provider emergency care experiences related to intimate partner violence: a systematic review of the existing evidence. Trauma Violence Abuse. 2023;24(5):2901-2921.
18. Sawin EM, Sobel LL, Annan SL, et al. From systematic review to call for action. Hisp Health Care Int. 2017;15(2):79-87.
19. Gerino E, Caldarera AM, Curti L, et al. Intimate partner violence in the golden age: systematic review of risk and protective factors. Front Psychol. 2018;9:1595.
20. Ziola EA, Gimenez MA, Stevenson AP, et al. The role of emergency medicine in intimate partner violence: a scoping review of screening, survivor resources, and barriers. Trauma Violence Abuse. 2024;25(5):3923-3937.
Association of Pregnancy Documentation with Radiological Imaging in the Emergency Department
Angela G. Campbell, PhD, MPH*
Austin Knies, PhD†
Paul Musey, MD‡
Kelli K. Ryckman, PhD§
Sami Gharbi, MS||#¶
Sarah Wiehe, MD, MPH||#¶
Section Editor: Elisabeth Calhoun, MD
Indiana University, School of Public Health, Department of Applied Health Science, Bloomington, Indiana
Abt Global, Cambridge, Massachusetts
Indiana University School of Medicine, Department of Emergency Medicine, Indianapolis, Indiana
Indiana University, School of Public Health, Department of Epidemiology and Biostatistics, Bloomington, Indiana
Indiana University School of Medicine, Children’s Health Services Research, Indianapolis, Indiana
Indiana University School of Medicine, Department of Pediatrics, Indianapolis, Indiana Regenstrief Institute, Indianapolis, Indiana
Submission history: Submitted August 22, 2025; Revision received January 31, 2026; Accepted February 4, 2026
Electronically published June 28, 2026
Full text available through open access at http://escholarship.org/uc/uciem_westjem DOI 10.5811/westjem.50731
Introduction: Emergency department (ED) encounters are common for pregnant individuals in the United States. Radiological imaging is frequently ordered for diagnostics in the ED but generally avoided during pregnancy. This study examines missed pregnancy documentation and the association of pregnancy documentation with radiological imaging among individuals who have an ED encounter while pregnant.
Methods: We used a retrospective cohort of pregnant individuals who had a live birth in an urban county in Indiana 2022–2023. We pulled all ED encounters occurring between 42-279 days of gestation (N = 4,597) that did not occur within five days of delivery. Our primary outcome measure was pregnancy documentation in the patient’s electronic health record and receipt of radiological imaging (radiograph and computed tomography) of the chest, abdomen or spine. We used descriptive statistics and logistic regressions for the analysis.
Results: Pregnancy was not documented in 273 of the 4,597 encounters (5.9%). A larger percentage of encounters with missed pregnancy documentation occurred with non-Hispanic Black patients (162/273, 59.3%) compared to non-Hispanic White patients (75/273, 27.5%); (odds ratio 1.70, 95% CI, 1.21-2.41) for non-Hispanic Blacks relative to non-Hispanic Whites. Radiological imaging occurred in 147 of the 4,324 encounters with a documented pregnancy (3.4%), compared with 30 of the 273 encounters where the pregnancy was not documented (11.0%). Missed pregnancy documentation was associated with 2.11 times (95%CI, 1.30-3.42) the odds of receiving radiological imaging when adjusted for confounders.
Conclusion: Missed pregnancy documentation occurred in 5.9% of emergency encounters with pregnant patients. While this is uncommon, it is still significantly associated with receipt of radiological imaging. Disparities in odds of pregnancy documentation in the ED may contribute to differences in maternal outcomes and highlights the necessity of ensuring equitable care for all pregnant individuals. [West J Emerg Med. 2026;27(4)985–993.]
INTRODUCTION
Compared to other developed countries, the United States has the highest maternal mortality rate.1 There are many reasons for this, such as fragmented care,2 poor communication between specialists for patients with chronic conditions,2 and poor prenatal care.3 Pregnant individuals who use the emergency department (ED) are more likely to belong to racial and ethnic minority populations, be publicly insured, be younger, rural, and have less formal education, and have higher health risks.4-7 Pregnant individuals with pre-existing comorbidities such as hypertension and diabetes are also more likely to use the ED.8 In fact, it is estimated that over one-third of pregnant individuals visit the ED at some point in their pregnancy.4,6
Emergency departments are care settings where the risk for medical error is heightened. Factors associated with this heightened risk include the following: physicians treating unfamiliar patients; crowding and/or understaffing; the need to provide care 24 hours a day; and the urgency of decisionmaking required for critically ill patients.9,10 Documenting the pregnancy status of individuals in the ED is crucial, as it informs risk assessment and clinical decision-making. Symptoms such as elevated blood pressure that may be mildly concerning in a non-pregnant patient could indicate serious issues in a pregnant patient.11 Treatment pathways and medication choices also change when an individual is pregnant because the physician must consider the health of both the pregnant patient and the fetus.12,13
Although it may seem intuitive that a pregnant individual would identify themselves as pregnant to clinical staff, or that they could be easily identified visually, this is not always the case. On average, pregnancy is recognized at 5.5 weeks, but 23% of individuals recognize at seven weeks or later.14 Later pregnancy recognition is more common among racial and ethnic minorities and for unintended pregnancies.15
Radiological imaging, such as radiographs and computed tomography (CT), is frequently used in the ED but is generally avoided during pregnancy unless absolutely necessary.16 It has been demonstrated that singular radiographs and CT typically give a dose of radiation that is below the threshold for fetal harm; however, because radiation exposure is cumulative17 the standard of practice is to minimize exposure during pregnancy whenever possible.16 Imaging is usually reserved for situations where the expected benefits outweigh the risks, and alternatives such as ultrasound or magnetic resonance imaging (MRI) are not available.18 While some EDs may have policies related to pregnancy testing before radiological imaging, there are no national guidelines regarding testing,19 and some clinical locations may waive testing if the patient states they are not pregnant or reports that the first day of their last menstrual period occurred within 10 days of the date of imaging.19
Research has documented a rise in the use of radiological imaging among pregnant individuals20,21 with evidence that Black pregnant patients are more likely than their White
Population Health Research Capsule
What do we already know about this issue? Emergency department (ED) visits in pregnancy are common. Radiological imaging in the ED is also common but avoided in pregnancy.
What was the research question? Among pregnant patients in the ED, is missed pregnancy documentation associated with more radiological imaging?
What was the major finding of the study? Missed pregnancy documentation was associated with increased odds of radiological imaging (11.0% vs 3.4%; aOR 2.11, 95% CI 1.30–3.42).
How does this improve population health? Improving pregnancy documentation/screening in the ED can reduce unnecessary radiation, guide safer medications/triage, and address inequities in patient care.
counterparts to receive imaging.21 While this trend may partially reflect increased confidence in the safety of imaging during pregnancy, it also raises the possibility that some imaging occurs without knowledge of the pregnancy. In this study we examine how pregnancy documentation is associated with the use of radiological imaging in the ED.
METHODS
Study Design and Data Source
We constructed a retrospective cohort study of pregnant individuals with a live birth in any hospital located within an urban county in Indiana that was part of a single, large health system between January 2022–July 2023 using electronic health records (EHR) data. The primary outcomes of interest were missed pregnancy documentation (defined below) and radiological imaging of the abdomen, chest, or spine. Our final sample included all ED encounters occurring between 42 days (six weeks) and 279 days (40 weeks minus one day) of gestation within a pregnancy period for pregnant patients in this retrospective cohort. The data used in this sample were first sourced from encounter data for the retrospective cohort. Using the pregnant patient’s unique health system identification number, we merged additional data from person files, diagnosis code files, orders files, and events files to the
encounter data to obtain additional patient and encounter characteristics for the analysis.
We further limited pregnancy-specific encounters for pregnant patients in our cohort to those identified as an ED encounter and to those encounters with at least one diagnosis code. We removed observations that occurred on or within five days of the delivery date and that were duplicates for pregnant individuals with more than one live birth in the same pregnancy. If there was International Classification of Diseases, 10th Rev (ICD-10) code documentation of a delivery prior to 40 weeks (eg, delivery at 31 weeks), then we adjusted gestational age to reflect this and used this information to limit encounters. In this example, an infant born at 31 weeks would have a 217-day window for encounters, and only those encounters between 42 days (six weeks) and 217 days (31 weeks) that did not occur within five days of the delivery date would be included. All ICD-10 codes used in this study are listed in Appendix A.
Pregnancy is typically not detectable until the fourth week of pregnancy,22 and gestational age estimates can be off by as much as 14 days if an ultrasound was not obtained in the first trimester.23 Therefore, in an effort to conduct conservative analyses, we only included pregnancies that were at least six weeks along and, thus, detectable via a urine test for pregnancy. Emergency encounters that occurred through the end of the pregnancy were included to get a more accurate picture of the frequency of missed pregnancy documentation throughout the pregnancy. Thirteen observations lacked documentation of race/ethnicity. Because we considered this to be not large enough to justify making it a separate category or to justify more advanced data imputation procedures, these observations were dropped. Our data-cleaning process resulted in a study sample of 4,597 ED encounters for pregnant patients who had a live birth within a large health network in an urban Indiana county between January 2022–July 2023. The institutional review board (IRB) agreement allowed for sampling of births occurring within one health system in a single county. However, all encounter data within the health system was examined so that all emergency encounters, including those that occurred outside the county of birth were included, provided that the facility offering emergency care was part of the health system of birth.
Because pulling EHR data for a study differs from manual chart abstraction, we used data scientists and coders to pull the study sample and define an algorithm to identify cases rather than training abstractors and using abstraction forms. The data scientists were not blinded to the hypothesis as their expertise was used to help us identify the data fields we needed to define our variables. Their performance was not monitored in a formal manner, and there was no inter-rater reliability discussed or tested because one person was responsible for writing each portion of the code, although the contents of the code/algorithm were discussed at length. There are, however,
some best practices related to manual chart abstraction that we adhered to.24 The variables in this study are clearly defined, the medical record database is identified as records pulled from a large health system in the Midwest, the sampling method was described, and IRB approval was obtained. There was very little missing data, with only 13 observations being dropped due to lack of race/ethnicity data; this comprised just 0.28% of the sample and was determined to be acceptable.
Variables
Radiological Imaging
In this study, the primary outcome of interest was whether radiological imaging of the abdomen, chest or spine was performed on a pregnant patient during an ED encounter that fell between 42-279 days gestation and did not occur within five days of delivery. Using data from medical orders and events files merged to each encounter, we identified whether radiological imaging (either radiograph or CT) was performed during the encounter. If there was documentation in the order status fields that the ordered radiograph or CT was canceled or terminated without results, then that scan was excluded. We could not determine the reason for the cancelation from the abstracted data.
Missed Pregnancy Documentation
The treatment variable in this study was whether the ongoing pregnancy was documented during the encounter. Due to the methods we used to filter the sample, all pregnant individuals in the sample were pregnant during each ED encounter. The flag for a missed pregnancy documentation was meant to identify whether the pregnancy had not been documented in the EHR by the medical staff during the ED encounter. We assigned a missed pregnancy-documentation flag to the encounter if the following criteria held: 1) no prenatal care or obstetric diagnosis codes were issued for the encounter (defined in Appendix A); 2) pregnancy was not acknowledged in the descriptive variables in the EHR data (this included a free-text note field attached to the encounter record and a free-text reason for visit variable); and 3) no pregnancy test was given during the encounter. When the pregnancy was documented, 96.6% of the time it was done via ICD-10 code. A full breakdown of the location of pregnancy documentation in the patient’s record is available in Appendix B.
Control Variables
Using data matched to the pregnant patient, we extracted the race/ethnicity (non-Hispanic White, non-Hispanic Black, Hispanic and Asian/other), insurance status at delivery (commercial/private, Medicaid/public, uninsured/self-pay/ other), and age (in years) of the pregnant individual at the time of encounter. We also extracted encounter characteristics in the data such as time of day of encounter (grouped into four-hour increments), and month, year and location of
encounter. The location variable was grouped into encounters at county hospital A, county hospital B, and encounters that occurred outside the county. The number of weeks gestation at the time of the encounter was coded continuously, with a squared term in the analytic models to account for nonlinearity. Finally, we used the ICD-10 diagnosis codes associated with each encounter to construct flags if the encounters were trauma-related or had diagnoses of pain in the abdomen, chest or back (ICD-10 codes listed in Appendix A).
Statistical Methods
We examined descriptives statistics followed by bivariate logistic and multivariate logistic regressions, and we used Stata 18 (StataCorp, LLC, College Station, TX) for all analyses. These data were at the encounter level, and some pregnant individuals may have had multiple ED encounters during their pregnancy. To account for repeated measures for an individual, all models were estimated with a specification to cluster the error term by the pregnant patient’s ID number. This study follows the Strengthening the Reporting of Observational Studies in Epidemiology cohort reporting guideline. The primary outcomes are pregnancy documentation and radiological imaging. The secondary outcome is race/ethnicity as it is associated with pregnancy documentation and radiological imaging.
RESULTS
Within this sample of 4,597 ED encounters, 5.9% had a missed pregnancy documentation, and 3.9% of the encounters included radiological imaging of the abdomen, chest, or spine (Table 1). Minoritized racial/ethnic groups made up 61.2% of the sample, and 80.5% of pregnant individuals in this sample were insured by Medicaid or uninsured at the time of delivery. Most of the patients in the sample (86.0%) gave birth between the ages of 18-34. Trauma ICD-10 codes were present in 5.2% of encounters, and ICD-10 codes indicating pain were present in 26.5% of encounters. The average number of weeks gestation at the time of the encounters was 25 (SD 10.3).
More than three quarters (77.7%) of missed pregnancy documentation occurred in the first or second trimester (Table 2). Radiological imaging occurred in 147 of the 4,324 encounters with a documented pregnancy (3.4%), and 30 of the 273 encounters where the pregnancy was not documented (11.0%).
In univariate logistic regression models, non-Hispanic Black pregnant patients had 1.70 times the odds of not having their pregnancy documented (95% CI, 1.21-2.41) (Table 3) compared to non-Hispanic White pregnant patients. Pregnant individuals with a trauma ICD-10 code did not have significantly different odds of having a missed pregnancy documentation relative to pregnant individuals without a trauma ICD-10 code. Receipt of a pain-related ICD-10 code was associated with 0.16 times reduced odds (an 84%
Table 1. Descriptives of emergency department encounters that occurred during pregnancy (N = 4,597) in a group of patients who gave birth in a single, urban county in Indiana, 2022-2023.
Receipt of radiological imaging for abdomen chest, or spine, at ED encounter
variables
Pregnant individual’s race
Time and location variables
Location of emergency encounter
Year of ED encounter
ED, emergency department; ICD-10, International Classification of Diseases, 10th Revision; SD, standard deviation.
reduction) of a missed pregnancy documentation (95% CI, 0.10-0.25)]. Receipt of radiological imaging of the abdomen,
Table 2. Cross-tabulation of study variables by pregnancy documentation status for emergency department encounters that occurred while pregnant (N = 4,597) in a retrospective cohort of individuals who gave birth in a single urban county in Indiana, 2022-2023. Pregnancy was documented (N = 4,324) Pregnancy was NOT documented (N = 273)
Receipt of radiological imaging for abdomen chest, or spine, at ED encounter
Sociodemographic variables*
Pregnant individual’s race
at Delivery
Clinical variables
Trauma ICD-10 diagnosis
Pain ICD-10 diagnosis
Trimester of encounter
(%)
(51.6%)
*Some categories were combined to meet reporting requirements. ED, emergency department; ICD-10, International Classification of Diseases, 10th Revision.
chest or spine was not significantly associated with race/ ethnicity, age at delivery, or type of insurance in the bivariate analyses. Receipt of a trauma ICD-10 code was associated with 2.54 times the odds of receiving radiological imaging (95% CI, 1.62-3.98). Receipt of a pain-related ICD-10 code was significantly associated with 1.46 times the odds of receiving radiological imaging (95% CI, 1.06,2.02).
Missed pregnancy documentation was associated with 1.91 times the odds of receiving radiological imaging of the abdomen chest or spine (95% CI, 1.24-2.98) in the model that was not adjusted for sociodemographic or clinical factors (Table 4). In the fully adjusted model, missed pregnancy documentation was associated with 2.11 times the odds of receiving radiological imaging (95% CI, 1.30-3.42). Receipt
of a trauma-related ICD-10 code was associated with 2.20 times the odds of radiological imaging the fully adjusted model 95% CI, 1.39-3.50). Receipt of a pain-related ICD-10 was associated with 1.63 times the odds of radiological imaging (95% CI, 1.15, 2.30).
DISCUSSION
In this study we found that pregnancy was not documented in 5.9% of ED encounters. Missed documentation was more likely to occur among patients who were nonHispanic Black, and the lack of documentation was significantly associated with receipt of radiological imaging (radiograph or CT). Given that radiological imaging is typically avoided during pregnancy unless necessary,16 these
Table 3. Bivariate logistic regressions examining the relationship of sociodemographic and clinical variables with pregnancy documentation and radiological imaging at emergency department encounters that occurred while pregnant (N = 4,597) in a retrospective cohort of individuals who gave birth in a single urban county in Indiana 2022-2023.
Receipt of radiological imaging for abdomen, chest or spine
Pregnant Individual’s Race
Trauma ICD-10 diagnosis
Number of weeks gestation at time of encounter 1.29 (1.18, 1.40)
*Controls for time of day, month, year, and location of encounter were included in all bivariate regressions. ICD-10, International Classification of Diseases, 10th Revision; OR, odds ratio.
findings underscore the critical role of accurate documentation in ensuring optimal clinical decision-making and safeguarding maternal and fetal health.
It is important to acknowledge that some degree of medical error is inevitable in the ED environment, where crowding, understaffing, and limited access to patient histories pose significant challenges.10,25 Further, if a patient is in critical condition, the necessity of diagnostic imaging may outweigh the radiation risks posed to the pregnant individual or fetus. The positive association of trauma ICD-10 codes with missed pregnancy documentation, suggests that this may apply to a portion of the sample. However, only 25 of the 273 (9.2%) encounters with a missed pregnancy documentation had a trauma code. Additionally, the results demonstrate that even when controlling for trauma and pain, the likelihood of receiving imaging is not distributed equally between pregnant patients whose pregnancy is documented in their record and those whose pregnancy is not documented. This suggests that some of these patients might have been evaluated using
alternative modalities such as MRI had their pregnancy status been known.
Missed pregnancy documentation was disproportionately common among non-Hispanic Black compared to nonHispanic White individuals. This aligns with prior qualitative research indicating that non-Hispanic Black individuals experience poor communication with clinicians when receiving medical care.26 Unlike in previous studies, we did not find that race and ethnicity were significantly associated with receipt of imaging21 in the bivariate or multivariate models; however, this does not make the relationship of race and ethnicity with a missed pregnancy documentation less concerning. Pregnancy documentation may influence how the individual is triaged (eg, high blood pressure could be an indicator of preeclampsia in pregnant individuals) and what medications are prescribed.27 Non-Hispanic Black patients who are pregnant already face the highest rates of maternal morbidity and mortality in the U.S. relative to all other racial and ethnic groups,28 and are more likely to receive care in the
Table 4. Logistic regressions examining the relationship between missed pregnancy documentation in an emergency department encounter with odds of receipt of radiological imaging that occurred while pregnant (N = 4,597) in a retrospective cohort of individuals who gave birth in a single urban county in Indiana 2022–2023.
*Controls for time of day, month, year, and location of encounter were included in all regressions. ED, emergency department; ICD-10, International Classification of Diseases, 10th Revision; OR, odds ratio.
ED relative to non-Hispanic White individuals5; therefore, minimizing risk to this population is a priority. Non-Hispanic Black individuals also tend to recognize their pregnancies later than non-Hispanic Whites,14 highlighting a potential need for more systematic pregnancy testing protocols in the ED to account for cases where the individual may not yet be aware of their pregnancy. Understanding the reasons behind the lower rates of pregnancy documentation in this population could inform targeted interventions to improve care.
LIMITATIONS
This study is not without limitations. First, Current Procedural Terminology codes were not available for this study, which could have impacted our documentation measure. Second, while most documentation was done using ICD-10
code, these codes were likely not entered directly by the clinician providing care to the pregnant individual. Physicians, especially those in large practices, often document patient information in structured notes in the patient’s record,29,30 and these notes are later turned into diagnosis codes by trained coders.31 Some documentation of pregnancy could have been “lost in translation,” if it was not deemed to be a billable ICD-10 code diagnosis or it was recorded in the patient’s chart outside the free-text fields included in this study. Therefore, absence of pregnancy documentation in the patient’s record does not necessarily indicate that the pregnancy was not verbally discussed. Third, some patients may have chosen not to disclose their pregnancy status to their clinician due to privacy concerns. Further qualitative research is needed to explore whether such concerns contribute to missed
documentation and affect care.
Finally, our study population consisted of pregnant individuals who delivered within the same health system in one geographic county during a defined period. As a result, the sample does not represent national trends or even all ED encounters involving pregnant patients at these facilities. Pregnant patients who received care at these EDs but did not deliver within the sample health system and sample county were not included, and we cannot assess how this might have influenced our estimates of documentation. Indeed, the rarity of studies on missed pregnancy documentation in the ED may reflect the difficulty of identifying undocumented pregnancies, as large public datasets such as the National Hospital Ambulatory Medical Care Survey lack the means to identify pregnant patients who had no pregnancy recorded during their ED visit.
CONCLUSION
Over one third of pregnancies in the U.S. have at least one emergency department encounter,4,6 and understanding how to provide optimal care to pregnant patients in need of emergency services is important for maternal health. This study leveraged rich electronic health records data to examine the impact of pregnancy documentation during an ED encounter on the use of radiological imaging as a clinical outcome. Pregnancy was not documented in 5.9% of ED encounters, with missed documentation disproportionately affecting non-Hispanic Black individuals. The absence of pregnancy documentation was significantly associated with increased use of radiological imaging, even after accounting for trauma-related cases. While documentation errors in the ED are serious,32 they may be due to systemic issues that require interventions at multiple levels10,32,33 rather than simple interventions at the clinician level. Interventions to improve pregnancy documentation—such as standardized screening protocols or improved clinician support—may be essential steps toward advancing care quality and equity.
ACKNOWLEDGMENTS
We acknowledge the contribution of the Regenstrief Institute, Inc, to this project in providing data and data-related guidance. This work was funded, in part, by the Health Excellence Achieved through Learning health systems Research (HEALeR) Collaborative, a partnership between Indiana University Health’s Office of Health Equity Research and Engagement and the IU School of Medicine, generously funded by a Cook Group Incorporated Advances in Medicine (AIM) award. The funder/ sponsor did not participate in the work.
anggcamp@iu.edu.
Conflicts of Interest: By the WestJEM article submission agreement, all authors are required to disclose all affiliations, funding sources and financial or management relationships that could be perceived as potential sources of bias. There are no conflicts of interest to declare.
1. Tikkanen R, Gunja MZ, FitzGerald M, et al. Maternal mortality and maternity care in the United States compared to 10 other developed countries. Commonw Fund. 2020;10:1-17.
2. Wong PC, Kitsantas P. A review of maternal mortality and quality of care in the USA. J Matern Fetal Neonatal Med. 2020;33(19):3355-67.
3. Yan J. Healthy babies: Does prenatal care really matter? Am J Health Econ. 2020;6(2):199-215.
4. Kilfoyle KA, Vrees R, Raker CA, et al. Nonurgent and urgent emergency department use during pregnancy: an observational study. Am J Obstet Gynecol. 2017;216(2):181.e1-7.
5. Vladutiu CJ, Stringer EM, Kandasamy V, et al. Emergency care utilization among pregnant Medicaid recipients in North Carolina: an analysis using linked claims and birth records. Matern Child Health J. 2019;23(2):265-76.
6. Matenchuk BA, Rosychuk RJ, Rowe BH, et al. Emergency department visits during pregnancy. Ann Emerg Med. 2023;81(2):197-208.
7. Preiksaitis C, Saxena M, Zhang J, et al. Prevalence and characteristics of emergency department visits by pregnant people: an analysis of a National Emergency Department Sample (2010–2020). West J Emerg Med. 2024;25(3):436-43.
8. Cunningham SD, Magriples U, Thomas JL, et al. Association between maternal comorbidities and emergency department use among a national sample of commercially insured pregnant women. Acad Emerg Med. 2017;24(8):940-7.
9. Weant KA, Bailey AM, Baker SN. Strategies for reducing medication errors in the emergency department. Open Access Emerg Med. 2014;6:45-55.
10. Peth HA. Medication errors in the emergency department: a systems approach to minimizing risk. Emerg Med Clin North Am. 2003;21(1):141-58.
11. U.S. Preventive Services Task Force. Screening for Preeclampsia: US Preventive Services Task Force recommendation statement. JAMA. 2017;317(16):1661-7.
Address for Correspondence: Angela G. Campbell, PhD, MPH, Indiana University, School of Public Health, Department of Applied Health Science, 1025 E 7th St, Bloomington, IN 47405. Email:
12. Andrade SE, Raebel MA, Morse AN, et al. Use of prescription medications with a potential for fetal harm among pregnant women. Pharmacoepidemiol Drug Saf. 2006;15(8):546-54.
13. Kulaga S, Zagarzadeh A, Bérard A. Prescriptions filled during pregnancy
Campbell et al. Association of Pregnancy Documentation with Imaging in the ED for drugs with the potential of fetal harm. BJOG. 2009;116(13):1788-95.
14. Branum AM, Ahrens KA. Trends in timing of pregnancy awareness among US women. Matern Child Health J. 2017;21(4):715-26.
15. Ayoola AB. Late recognition of unintended pregnancies. Public Health Nurs. 2015;32(5):462-70.
16. Wiles R, Hankinson B, Benbow E, et al. Making decisions about radiological imaging in pregnancy. BMJ. 2022;377:e070486.
17. Gargani L, Picano E. The risk of cumulative radiation exposure in chest imaging and the advantage of bedside ultrasound. Crit Ultrasound J. 2015;7:4.
18. American College of Obstetricians and Gynecologists Committee on Obstetric Practice Opinion No. 656: Guidelines for diagnostic imaging during pregnancy and lactation. Obstet Gynecol. 2016;127(2):e75-80.
19. Abushouk AI, Taheri MS, Pooransari P, et al. Pregnancy screening before diagnostic radiography in emergency department: an educational review. Emergency (Tehran). 2017;5(1):e60.
20. Smith-Bindman R, Miglioretti DL, Johnson E, et al. Use of diagnostic imaging studies and associated radiation exposure for patients enrolled in large integrated health care systems, 1996–2010. JAMA. 2012;307(22):2400-2409.
21. Kwan ML, Miglioretti DL, Marlow EC, et al. Trends in medical imaging during pregnancy in the United States and Ontario, Canada, 1996 to 2016. JAMA Netw Open. 2019;2(7):e197249.
22. Wilcox AJ, Baird DD, Dunson D, et al. Natural limits of pregnancy testing in relation to the expected menstrual period. JAMA. 2001;286(14):1759-61.
23. American College of Obstetricians and Gynecologists Committee on Obstetric Practice Opinion No. 611: Method for estimating due date.
Obstet Gynecol. 2014;124(4):863-6.
24. Worster A, Bledsoe RD, Cleve P, et al. Reassessing the methods of medical record review studies in emergency medicine research. Ann Emerg Med. 2005;45(4):448-51.
25. Kulstad EB, Sikka R, Sweis RT, et al. ED overcrowding is associated with an increased frequency of medication errors. Am J Emerg Med. 2010;28(3):304-9.
26. Post W, Thomas A, Sutton KM. “Black women should not die giving life”: the lived experiences of Black women diagnosed with severe maternal morbidity in the United States. Birth. 2024.
27. Dathe K, Schaefer C. The use of medication in pregnancy. Dtsch Arztebl Int. 2019;116(46):783.
28. Joseph KS, Boutin A, Lisonkova S, et al. Maternal mortality in the United States: recent trends, current status, and future considerations. Obstet Gynecol. 2021;137(5):763-71.
30. Belden JL, Koopman RJ, Patil SJ, et al. Dynamic electronic health record note prototype: seeing more by showing less. J Am Board Fam Med. 2017;30(6):691-700.
31. Rahmathulla G, Deen HG, Dokken JA, et al. Implementation and impact of ICD-10 (part II). Surg Neurol Int. 2014;5(Suppl 3):S192.
32. Hautz WE, Kämmer JE, Hautz SC, et al. Diagnostic error increases mortality and length of hospital stay in patients presenting through the emergency room. Scand J Trauma Resusc Emerg Med. 2019;27(1):54.
33. Croskerry P, Sinclair D. Emergency medicine: a practice prone to error? CJEM. 2001;3(4):271-276.
Original
Point-of-care
Ultrasound for Detecting Methamphetamineassociated Heart Failure in the Emergency Department
Madison Nashu, MD*‡
Jordan Lam, BS*†
Zarak Khan, BS*
Soheil Saadat, MD, MPH, PhD*
Roy Almog, MD*
Ron Goubert, MD*
Joshua Wasmund, MD*
Heesun Choi, DO*§
Shadi Lahham, MD, MS*||
Edmund Hsu, MD, MS*
Megan Guy, MD*
John C. Fox, MD*
Section Editor: Robert Allen, MD
University of California Irvine, Department of Emergency Medicine, Orange, California
University of California Irvine School of Medicine, Irvine, California
Yale New Haven Hospital, Department of Emergency Medicine, New Haven, Connecticut
Eisenhower Health, Department of Emergency Medicine, Rancho Mirage, California
Kaiser Permanente, Anaheim, California
Submission history: Submitted November 16, 2026; Revision received March 10, 2026; Accepted March 7, 2026
Electronically published July 16, 2026
Full text available through open access at http://escholarship.org/uc/uciem_westjem
DOI 10.5811/westjem.53982
Introduction: Methamphetamine-associated heart failure with reduced ejection fraction is a serious consequence of methamphetamine use often underrecognized in the emergency department (ED). Pointof-care ultrasound (POCUS) offers rapid, non-invasive cardiac screening for high-risk populations. This study evaluated the diagnostic yield of POCUS for detecting methamphetamine-associated heart failure with reduced ejection fraction in ED patients who use methamphetamine.
Methods: We conducted this prospective cohort study between December 2020–February 2024 at an urban Level I trauma center ED. The primary outcome was diagnostic yield of cardiac POCUS for abnormal left ventricular ejection fraction (LVEF) and abnormal sex-specific left ventricular end-diastolic diameter in patients with methamphetamine use, with secondary analyses assessing associations with use duration and frequency. Diagnostic yield was calculated as the proportion of completed POCUS examinations identifying abnormalities. We used E-point septal separation to calculate LVEF; < 40% was abnormal. Left ventricular end-diastolic diameter abnormality (> 5.8 cm males, > 5.2 cm females) was categorized as mild, moderate, or severe (mild, 5.9-6.3/5.3-5.6; moderate, 6.4-6.8/5.7-6.1; severe, > 6.8/> 6.1 cm males/females). Physician-performed POCUS assessed LVEF and left ventricular end-diastolic diameter in patients with a methamphetamine use history and a comparison group of non-users.
Results: Of the 136 enrolled patients, 84 (61.8%) reported methamphetamine use. Among methamphetamine users, diagnostic yield of cardiac POCUS was as follows: reduced LVEF in 22 of 70 with measurable LVEF (31.4% [20.9–43.6%]); any sex-specific left ventricular end-diastolic diameter abnormality in 30 of 84 (35.7% [25.6–46.9%]); and severe sex-specific left ventricular end-diastolic diameter abnormality in 15 of 84 (17.9% [10.4–27.7%]). Corresponding values in non-users were 3 of 52 (5.8% [1.2–16.0%]; P < .001), 10 of 52 (19.2% [9.6–32.5%]; P = .05), and 3 of 52 (5.8% [1.2 - 16.0%]; P = .07), respectively. Longer duration (odds ratio [OR] 6.05, 95% confidence interval [CI] 1.46–25.10) and higher frequency (OR 5.93, 95% CI, 1.52–23.06) of methamphetamine use were associated with reduced LVEF.
Conclusion: Cardiac point-of-care ultrasound demonstrated a clinically significant diagnostic yield in detecting methamphetamine-associated heart failure with reduced ejection fraction among methamphetamine users in the ED, suggesting POCUS could aid early detection in this population, potentially streamlining management before disease progression. [West J Emerg Med. 2026;27(4)994–1001.]
INTRODUCTION
Methamphetamine is an addictive central nervous system stimulant that is widely abused in the United States, with the National Survey on Drug Use and Health (NSDUH) reporting over 2.7 million people ≥ 12 years of age with usage in 2022.1 The abuse of this highly addictive substance has become increasingly prevalent, with an increase of 231% in hospital admissions from 2008 to 2020.2 Approximately 1.8 million people who reported methamphetamine use on the NSDUH met diagnostic criteria for methamphetamine use disorder.1 Methamphetamine use disorder is a rapidly developing condition marked by cycles of heavy methamphetamine use followed by periods of abstinence. It results in serious medical consequences that are difficult to treat, such as cognitive, neurological, cardiovascular, and cerebrovascular conditions, and can lead to death.3 An increased risk is seen in males, those without a high school degree, individuals who earn < $20,000 annually, and those with Medicaid only or no insurance.4,5 Given the high rate of methamphetamineassociated morbidity, increasing usage rates are highly likely to increase methamphetamine-related morbidity, emergency department (ED) visits, and healthcare costs.
One of the most dangerous consequences of methamphetamine use is systolic heart failure, traditionally characterized by reduced left ventricular ejection fraction (LVEF), increased left ventricular mass index, and increased end-diastolic volume index.6-8 Heart failure of this etiology is known as methamphetamine-associated heart failure with reduced ejection fraction. As with other forms of heart failure, optimal management and reduction in morbidity and mortality require early diagnosis, accurate assessment of left ventricular function, and timely intervention. 9
The ED often serves as the entryway to the healthcare system for methamphetamine users, typically during acute methamphetamine-related medical emergencies. As many of these patients are frequently discharged without a hospital admission, the ED may be their only interaction with the healthcare system.10 However, because methamphetamine users often present to the ED with non-cardiac complaints, including altered level of consciousness, skin infections, abdominal pain, suicide attempts, psychosis and/or trauma,11 underlying cardiac dysfunction may be underrecognized in this setting.
The risk of missed identification of this type of systolic heart failure underscores the need for efficient, accessible tools to screen for cardiac dysfunction in methamphetamine users. Compared with formal echocardiography, point-of-care ultrasound (POCUS) provides a rapid and more readily accessible assessment of cardiac function at bedside in the ED and may serve as a valuable tool for screening early-onset heart failure in methamphetamine users. Despite its potential utility, the diagnostic yield of POCUS in identifying methamphetamine-associated heart failure with reduced ejection fraction in this high-risk population has not been previously studied. Therefore, in this study we aimed to
Population Health Research Capsule
What do we already know about this issue?
Methamphetamine use is associated with systolic heart failure with reduced left ventricular ejection fraction (LVEF).
What was the research question?
What is the diagnostic yield of point-of-care ultrasound (POCUS) for detecting heart failure in emergency department patients who use methamphetamine?
What was the major finding of the study?
The diagnostic yield of cardiac POCUS in methamphetamine users was 31.4% (20.9–43.6%) for reduced LVEF.
How does this improve population health?
Cardiac POCUS may serve a public health role by enabling early heart failure detection in methamphetamine users.
determine the diagnostic yield of POCUS in detecting abnormal LVEF and abnormal left ventricular end-diastolic diameter by sex in methamphetamine users presenting to the ED, compared to non-users.
METHODS
Study Design and Participant Selection
We conducted this prospective cohort study at an urban, Level I trauma center within an academic quaternary-care facility that hosts an established emergency medicine residency and emergency ultrasound fellowship training program. Trained research associates (RA) screened and enrolled a convenience sample of adult participants who presented to the ED between December 2020–February 2024. Patients who reported a history of methamphetamine use during their ED visit were eligible for inclusion in the methamphetamine-user group, regardless of their chief complaint. The non-user group was recruited from the general ED population to allow assessment of POCUS findings in patients who denied methamphetamine use or had no prior methamphetamine-positive urine toxicology screen. The RAs enrolled a convenience sample of these participants, regardless of their presenting complaint, provided their presentation did not meet any exclusion criteria. Exclusion criteria included individuals who were pregnant or found to be pregnant, as well as those with a history of heart failure unrelated to methamphetamine use, peripartum cardiomyopathy, coronary
POCUS Detecting Methamphetamine-associated Heart Failure in the ED Nashu
artery disease, valvular diseases, previous heart transplant, left ventricular assist devices, congenital heart failure, moderate to severe trauma, acute respiratory failure, or known malignancy. Only participants with the capacity to understand and sign written informed consent in English were eligible for inclusion in the study.
The POCUS examinations were performed by ultrasoundtrained attending physicians and resident physicians in the ED using the Mindray TE7 ultrasound system or TE X portable ultrasound system (Mindray DS USA Inc., Mahwah, NJ) with a phased-array 2-5 megahertz transducer on preprogrammed cardiac settings. The study protocol was reviewed and approved by the University of California, Irvine Institutional Review Board.
Data Collection
After obtaining informed consent, trained RAs collected demographic and clinical information from patients through a survey. This included age, sex, history of controlled and uncontrolled hypertension, history of prior and current methamphetamine use, history of tobacco smoking, and history of other recreational drug use. Patients who reported positive tobacco, methamphetamine, or other drug use were further queried about the frequency and duration of their use. Following the survey, POCUS examinations were performed during the patient’s ED stay. Some patients were acutely intoxicated; others had a history of methamphetamine use without current intoxication, and some had no history of methamphetamine use. Patients were positioned in the supine or left lateral decubitus position for the cardiac POCUS to be performed. Trained emergency physicians obtained a parasternal long-axis view. In this view, the physician measured the E-point septal separation using M-mode. This approach was chosen because it enables convenient assessment of left ventricular systolic function in timesensitive settings and has been found to be associated with LVEF, providing a rapid, reliable assessment for left ventricular systolic function, particularly in emergency settings.12 The E-point is the maximum anterior motion of the anterior mitral valve leaflet during early diastole. It is seen as the highest peak on the M-mode tracing of the mitral valve. The physician obtained this tracing by placing the cursor over the distal tip of the anterior leaflet of the mitral valve. To determine the E-point septal separation, the ultrasound calipers were used to measure the distance between the E-point and the interventricular septum on the tracing.
We calculated the LVEF using the following formula: LVEF = 75.5 - [2.5 * (E-point septal separation in mm)]. Subsequently, maintaining the parasternal long-axis view, physicians measured the left ventricular end-diastolic diameter using M-mode by placing the cursor just outside the anterior leaflet of the mitral valve to obtain another tracing. The ultrasound calipers were used to measure the distance between the interventricular septum and the inner surface of the wall of
the left ventricle. The LVEF values < 40% were considered abnormal. We defined left ventricular end-diastolic diameter abnormality by sex as end diastolic diameter of left ventricle > 5.8 cm in males and 5.2 cm in females. Left ventricular end-diastolic diameter values were further categorized as mild (5.9–6.3 cm for males; 5.3–5.6 cm for females), moderate (6.4–6.8 cm for males; 5.7–6.1 cm for females), and severe (> 6.8 cm for males; > 6.1 cm for females). These cutoff values are defined by the American Society of Echocardiography.13
Statistical Analysis
We estimated the sample size based on power (0.9) to detect an R² of 0.1 attributed to two independent variable(s) using an F-test with a significance level (alpha) of 0.05. The variables tested are adjusted for an additional two covariates that have a combined R² of 0.1 by themselves. The effect size was determined conservatively. We used Power Analysis and Sample Size Software v19.01 (NCSS, LLC. Kaysville, UT) for sample size calculations. The diagnostic yield was calculated as the proportion of completed POCUS examinations that identified the abnormality of interest.14
Frequencies were presented as counts and percentages. We used comparisons across categories of nominal variables using the Pearson chi-square test or Fisher exact test. Comparisons across ordinal variables were conducted using the Mantel chi-square test for trend. For multivariable analysis, we used logistic regression to find variables associated with reduced LVEF (coded as normal or reduced) and ordinal regression to assess left ventricular end-diastolic diameter abnormality for sex (categorized as normal, mild/ moderate abnormality, severe abnormality). Analyses were performed using IBM SPSS Statistics for Windows v28.0 (International Business Machines Corporation, Armonk, NY). A P value < .05 was considered statistically significant.
RESULTS
Study Sample
We enrolled 84 patients with self-reported methamphetamine use in the user group, and 52 patients with no history of methamphetamine use in the non-user group. Sixty-two (73.8%) patients in the user group and 38 (73.1%) in the non-user group were male (Table 1). Of the 84 participants with self-reported methamphetamine use, LVEF measurements were available for 70, with 14 examinations excluded due to incomplete or technically inadequate imaging. The LVEF measurements were available for all 52 participants in the non-user group.
The distribution of smoking history (n = 75, 55.1%) and hypertension (n = 46, 33.8%) was similar between men and women (P = .44 and .29, respectively). The distribution of reduced LVEF (n = 25, 20.5%) and abnormal left ventricular end-diastolic diameter by sex (n = 40, 29.4%) did not differ significantly between sexes (P = .19 and .20, respectively) (Table 1).
Nashu et al. POCUS for Detecting Methamphetamine-associated Heart Failure in
Table 1. Demographic and point-of-care ultrasound (POCUS) characteristics in a prospective study of POCUS screening for methamphetamine-associated heart failure.
Any differences in denominators between rows are due to missing values for the respective variable, including 14 inadequate LVEF images in the methamphetamine-user group. Percentages represent proportions within each sex category.
LVEF, left ventricular ejection fraction; LVEDD, left ventricular end-diastolic diameter.
Point-of-care Ultrasound Characteristics
Among 122 subjects with LVEF data, mean LVEF was 54.0% (17.0) (median 60%, interquartile range 48-65.5).
Mean LVEF was 54.9% (17.0) in men and 51.2% (16.8) in women. Among 136 participants with left ventricular end-diastolic diameter data, mean left ventricular enddiastolic diameter was 4.9 (1.8 cm), 5.1 (1.8) cm in men vs 4.4 (1.7) cm in women.
Diagnostic Yield
The diagnostic yield of cardiac POCUS for detecting abnormalities in the user group was as follows: reduced LVEF in 22 of 70 subjects (31.4%; 20.9–43.6%); any sex-specific left ventricular end-diastolic diameter abnormality in 30 of 84 (35.7%; 25.6–46.9%); and severe sex-specific left ventricular end-diastolic
in 15 of 84 (17.9%; 10.4–27.7%).
POCUS Detecting Methamphetamine-associated Heart Failure in the ED
Corresponding values in non-users were 3 of 52 (5.8%; 1.2–16.0%; P < .001), 10 of 52 (19.2%; 9.6–32.5%; P = .05), and 3 of 52 (5.8%; 1.2–16.0%; P = .07), respectively.
Association Between Methamphetamine Use and Reduced Left Ventricular Ejection Fraction
In a univariable analysis, methamphetamine use was associated with reduced LVEF (Table 2, P < .001). Reduced LVEF was identified in 22 of 70 participants in the user group (31.4%) compared with 3 of 52 participants in the non-user group (5.8%) (Table 2; P < .001). The LVEF could not be confirmed for 14 participants in the user group. Reduced LVEF was more common with increasing duration and frequency of methamphetamine use (both P < .001) (Table 2).
In logistic regression analysis, reduced LVEF was associated with methamphetamine use (P = .02, odds ratio [OR] 5.03) and hypertension (P = .02, OR 3.32). Age, sex, and smoking failed to retain statistical significance and were excluded from the final model (Table 3). Longer duration (OR 6.05, 95% CI, 1.46–25.10) and higher frequency (OR 5.93, 95% CI, 1.52–23.06) of methamphetamine use were associated with reduced LVEF after adjusting for hypertension.
Association Between Left Ventricular End-diastolic Diameter Abnormality by Sex and Methamphetamine Use
In univariable analysis, methamphetamine use was associated with an abnormal left ventricular end-diastolic diameter by sex (P = .02) (Table 2). Abnormal left ventricular end-diastolic diameter was observed in 30 of 84 participants (35.7%) in the user group and 10 of 52 participants (19.3%) in the non-user group. This difference was statistically significant (P = 0.02) (Table 2). The duration of methamphetamine use was also associated with an abnormal left ventricular end-
diastolic diameter by sex, indicating that left ventricular end-diastolic diameter abnormalities increased with prolonged methamphetamine use (P < .001) (Table 2). A statistically significant association between the self-reported frequency of methamphetamine use per week and abnormal left ventricular end-diastolic diameter by sex was not observed (P = .08) (Table 2).
We assessed the association between abnormal left ventricular end-diastolic diameter by sex and the duration of methamphetamine use using ordinal regression analysis. Years of methamphetamine use and hypertension (P = .01) were found to be associated with abnormal left ventricular enddiastolic diameter by sex (Table 4).
DISCUSSION
We observed a consistent association between methamphetamine use and early-onset heart failure. The diagnostic yield of POCUS for detecting indicators of methamphetamine-associated heart failure with reduced ejection fraction—31.4% for LVEF abnormality, 35.7% for sex-specific left ventricular end-diastolic diameter abnormality, and 17.9% for severe left ventricular end-diastolic diameter abnormality—represents a clinically significant rate of detection in a population that is not routinely screened for cardiac dysfunction. These findings underscore the potential value of using cardiac POCUS to screen for heart failure of this etiology in methamphetamine users who present to the ED, regardless of their chief complaint.
The high diagnostic yield of POCUS highlights the need for increased awareness among emergency physicians regarding the cardiovascular risks of methamphetamine use, especially in geographical areas where methamphetamine use is prevalent. Notably, patients at risk for methamphetamine-
end-diastolic diameter abnormality by sex with methamphetamine use, duration, and frequency.
* Based on Mantel-Haenszel chi-square test for trend.
** Based on Fisher exact test. Denominators for percentages can be calculated by summing the n values within each category. Denominators differ between LVEDD and LVEF due to 14 inadequate images in the methamphetamine-user group for LVEF. LVEF, left ventricular ejection fraction; LVEDD, left ventricular end-diastolic diameter; POCUS, point-of-care ultrasound
Table 2. Associations of point-of-care ultrasound-measured left ventricular ejection fraction abnormality and left ventricular
Table 3. Association of methamphetamine use, frequency, and duration with reduced left ventricular ejection fraction, adjusted for hypertension—logistic regression analysis. Models
Model 2:
Years of methamphetamine use
Years of methamphetamine use (reference: 0)
Years of methamphetamine use: 1-10
Years of methamphetamine use: >10
Model 3:
Frequency of methamphetamine per week
Frequency of methamphetamine use per week (reference: 0)
Frequency of methamphetamine use per week: 1-3
Frequency of methamphetamine use per week: >3
Model constant
associated heart failure with reduced ejection fraction may not present with typical heart failure symptoms.
Methamphetamine users often present with non-cardiac complaints, such as altered mental status, skin infections, abdominal pain, suicide attempts, or trauma,11 yet remain at a significantly elevated risk for heart failure compared to nonusers. Many of the patients in our sample interacted with the healthcare system solely through the ED and were frequent utilizers, suggesting they may lack access to consistent preventive care. Thus, greater awareness of the risks associated with methamphetamine-associated heart failure with reduced ejection fraction should be accompanied by targeted ED screening protocols for this etiology of systolic heart failure
Screening methamphetamine-users in the ED with cardiac POCUS may offer an accessible strategy for the early identification of methamphetamine-associated heart failure with reduced ejection fraction, even in the absence of overt heart failure symptoms. Identification of cardiac dysfunction through POCUS screening may prompt further evaluation, including comprehensive echocardiography, B-type natriuretic peptide testing, and troponin measurements, as well as the initiation of medical management, such as antihypertensive or diuretic therapy. It also creates additional opportunities for engaging patients in social work and substance use disorder treatment services. Given the increasing availability of POCUS in emergency departments and the high proficiency of emergency physicians in its use,15,16 integrating POCUS into ED screening protocols for methamphetamine users represents a feasible and potentially high-impact strategy for mitigating the burden of methamphetamine-associated heart failure with reduced ejection fraction.
This study also observed a dose-response relationship between the frequency and duration of methamphetamine use and heart failure severity. This relationship remains statistically significant after adjusting for hypertension. The observed dose-response relationship is consistent with one of Hill’s criteria for causality (17), supporting an association between greater methamphetamine exposure and more severe cardiac dysfunction. Furthermore, the biological plausibility of these findings is well-supported by existing literature,18–20 which outlines the well-known cardiovascular toxic effects of methamphetamine, reinforcing the idea that increased use has a dose-dependent effect on the severity of heart failure.
Although the exact mechanisms behind the development of methamphetamine-associated heart failure with reduced ejection fraction remain unclear, several factors are believed to contribute to its development. These include increased free radical production leading to oxidative stress, elevated p53 activity that promotes apoptosis, mitochondrial dysfunction, altered gene expression, and disruptions in intracellular calcium homeostasis.20 These pathological processes impair contractile function by disrupting electricalmechanical coupling, calcium signaling, and increasing inflammation. Over time, chronic inflammation, myocyte loss, and fibrosis lead to dilated cardiac chambers and reduced systolic function, resulting in dilated cardiomyopathy and heart failure with reduced ejection fraction.18,19 Additionally, methamphetamine-induced sympathetic activation causes prolonged periods of hypertension and tachycardia, which can further exacerbate methamphetamine-associated heart failure with reduced ejection fraction.19 Notably, it has been shown that the
LVEF, left ventricle ejection fraction; OR, odds ratio.
POCUS Detecting Methamphetamine-associated Heart Failure in the ED
condition is reversible if methamphetamine use ceases before cardiac fibrosis develops.18,21 This, combined with our finding of a dose-response relationship between methamphetamine use and increased severity of heart failure, underscores the importance of early detection and intervention, particularly in the ED, where methamphetamine users frequently present.22
The observed dose-response relationship between frequency and duration of methamphetamine use and heart failure severity may provide an opportunity to counsel patients that increased dose and frequency of use can lead to worsening heart failure, even if they are not yet experiencing typical heart failure symptoms. Additionally, these findings suggest that, among individuals with methamphetamine use disorder, reduction in dose and frequency, even without complete cessation, may be associated with improved cardiovascular outcomes and slower disease progression. Such education, combined with interventions such as substance use counseling, community resources, exercise, and closer follow-up, can help to reduce long-term cardiovascular risk and encourage positive behavioral changes. Additionally, providing access to psychosocial interventions such as contingency management, which promotes reduction in substance use and abstinence through positive reinforcement, and cognitive behavioral therapy, which targets harmful thought patterns, can be effective in reducing methamphetamine use and supporting long-term recovery.23
While this study has multiple implications for further work in emergency medicine and cardiology, an alternative potential direction for future research could be to explore the use of handheld or cart-based ultrasound devices in primary care settings or substance use disorder treatment centers. Given that the Accreditation Council for Graduate Medical Education has made POCUS a requirement in family medicine residency programs,24 there is greater potential for POCUS in outpatient settings to monitor improvements in LVEF, left ventricular end-diastolic diameter, and cardiac dilation over time. This approach offers a promising opportunity for early detection, intervention, and proactive cardiovascular disease monitoring among methamphetamine users in outpatient care settings. Future work should also evaluate the costeffectiveness, feasibility, and optimal implementation strategies of POCUS screening in these non-ED settings to ensure broader applicability and sustainability. This work also encourages collaboration between the specialties of cardiology and emergency medicine, perhaps indicating a need for easy access to outpatient clinic services for those in our community most at risk for undiagnosed and untreated methamphetamineassociated heart failure with reduced ejection fraction. Ultimately, integrating cardiac POCUS into both acute and preventive care pathways may not only improve the early detection of this condition but also serve as a critical touch point for engaging patients in treatment and mitigating the long-term consequences of methamphetamine use.
LIMITATIONS
In this prospective study, we enrolled a convenience sample of patients from a single large academic medical center in Orange County, California. Patients were enrolled from 8 am to midnight, meaning that those who presented outside this time range were not enrolled. Given that the consent information was available in English, non-English-speaking patients were not included in the study population. These factors may have introduced selection bias, affecting both methamphetamine-user and non-user groups, which potentially limit generalizability. The POCUS examinations were performed by multiple trained physicians; however, interobserver variability was not formally assessed. Physicians performing POCUS were not blinded to patient exposure status, which could have introduced measurement bias. Formal echocardiography was not systematically performed; thus, POCUS findings were not validated against a gold standard. Additionally, this study was not designed to distinguish acute methamphetamine-induced cardiac effects from chronic cardiomyopathy.
While we were able to control for confounders such as hypertension and smoking, we were unable to control for other potential confounders such as additional substance use, which may influence LVEF. The accuracy of the data associated with dose dependency is related directly to our patients’ responses. Recall bias may affect these responses, especially for events in the distant past. Additionally, many enrolled patients suffer from polysubstance use disorder, which may have impaired their recall of methamphetamine use duration and frequency. Self-reporting bias is also likely when evaluating reported data associated with a highly stigmatized substance. Lastly, we had a limited sample size of patients with severely reduced ejection fraction, likely due to the high mortality rates associated with the severe cardiomyopathy seen in patients with higher frequency and duration of methamphetamine use.
CONCLUSION
Methamphetamine use was consistently associated with early-onset heart failure, and cardiac POCUS demonstrated a clinically meaningful diagnostic yield in this population. While these findings suggest POCUS could aid in early detection among methamphetamine users presenting to the ED, further multicenter studies are needed to assess cost effectiveness, feasibility, and long-term outcomes before broader implementation.
Address for Correspondence: Megan Guy, MD, University of California Irvine, Department of Emergency Medicine, 3800 W. Chapman Ave., Suite 3200, Orange, CA 92868. Email: guym@ hs.uci.edu.
Nashu et al. POCUS for Detecting Methamphetamine-associated Heart Failure in the ED
Conflicts of Interest: By the WestJEM article submission agreement, all authors are required to disclose all affiliations, funding sources and financial or management relationships that could be perceived as potential sources of bias. No author has professional or financial relationships with any companies that are relevant to this study. There are no conflicts of interest or sources of funding to declare.
1. Substance Abuse and Mental Health Services Administration. 2023. Key Substance Use and Mental Health Indicators in the United States: Results from the 2022 National Survey on Drug Use and Health (HHS Publication No. PEP23-07-01-006, NSDUH Series H-58). Center for Behavioral Health Statistics and Quality, Substance Abuse and Mental Health Services Administration.
2. Al-Yafeai Z, Ali S, Brown J, et al. Cardiomyopathy-associated hospital admissions among methamphetamine users: geographical and social disparities. JACC Adv. 2024;3(7):100840.
3. Paulus MP, Stewart JL. Neurobiology, clinical presentation, and treatment of methamphetamine use disorder: a review. JAMA Psychiatry. 2020;77(9):959-966.
4. Jones CM, Compton WM, Mustaquim D. 2020. Patterns and characteristics of methamphetamine use among adults — United States, 2015–2018. Morb Mortal Wkly Rep. 2020;69(12), 317–323.
5. Han B, Cotto J, Etz K, et al. Methamphetamine overdose deaths in the US by sex and race and ethnicity. JAMA Psychiatry 2021;78(5):564-567.
6. Yeo KK, Wijetunga M, Ito H, et al. The association of methamphetamine use and cardiomyopathy in young patients. Am J Med. 2007;120(2):165-171.
7. Jariwal R, Narang V, Raza N, et al. Echocardiographic findings in heart failure patients with methamphetamine use: a case-control study. Cureus. 2021;13(7):e16170.
8. Richards JR, Harms BN, Kelly A, et al. Methamphetamine use and heart failure: prevalence, risk factors, and predictors. Am J Emerg Med. 2018;36(8):1423-1428.
9. Wang H, Gao C, Guignard-Duff M, et al. Importance of early diagnosis and treatment of heart failure across the spectrum of ejection fraction. Eur Heart J. 2023;44(Supplement_2):ehad655.892.
10. Substance Abuse and Mental Health Services Administration, Center for Behavioral Health Statistics and Quality. 2014. The DAWN Report: Emergency Department Visits Involving Methamphetamine: 2007 to 2011. Rockville, MD.
11. Richards JR, Hamidi S, Grant CD, et al. Methamphetamine use and
emergency department utilization: 20 years later. J Addict 2017;2017:4050932.
12. McKaigney CJ, Krantz MJ, La Rocque CL, et al. E-point septal separation: a bedside tool for emergency physician assessment of left ventricular ejection fraction. Am J Emerg Med. 2014;32(6):493-497.
13. American Society of Echocardiography. WFTF chamber quantification summary document. American Society of Echocardiography; July 2018. https://www.asecho.org/wp-content/ uploads/2018/08/WFTF-Chamber-Quantification-Summary-DocFinal-July-18.pdf. Accessed June 6, 2025.
14. Park HY, Suh CH, Kim SO. Use of “Diagnostic yield” in imaging research reports: results from articles published in two general radiology journals. Korean J Radiol. 2022;23(12):1290-1300.
15. Choi W, Cho YS, Ha YR, et al. Role of point-of-care ultrasound in critical care and emergency medicine: update and future perspective. Clin Exp Emerg Med. 2023;10(4):363-381.
16. Accreditation Council for Graduate Medical Education (ACGME). Common Program Requirements: Emergency Medicine. Accreditation Council for Graduate Medical Education; 2023. https:// www.acgme.org/globalassets/pfassets/programrequirements/110_ emergencymedicine_2023.pdf. Accessed June 6, 2025.
17. Hill AB. The environment and disease: association or causation? Proc R Soc Med. 1965;58(5):295-300.
18. Schürer S, Klingel K, Sandri M, et al. Clinical characteristics, histopathological features, and clinical outcome of methamphetamine-associated cardiomyopathy. JACC Heart Fail 2017;5(6):435-445.
19. Reddy PKV, Ng TMH, Oh EE, et al. Clinical characteristics and management of methamphetamine-associated cardiomyopathy: state-of-the-art review. J Am Heart Assoc. 2020;9(11):e016704.
20. Jafari Giv M. Exposure to amphetamines leads to development of amphetamine type stimulants associated cardiomyopathy (ATSAC). Cardiovasc Toxicol. 2017;17(1):13-24.
21. Sliman S, Waalen J, Shaw D. Methamphetamine-associated congestive heart failure: increasing prevalence and relationship of clinical outcomes to continued use or abstinence. Cardiovasc Toxicol 2016;16(4):381-389.
22. Vivolo-Kantor AM, Hoots BE, Seth P, et al. Recent trends and associated factors of amphetamine-type stimulant overdoses in emergency departments. Drug Alcohol Depend. 2020;216:108323.
23. AshaRani PV, Hombali A, Seow E, et al. Non-pharmacological interventions for methamphetamine use disorder: a systematic review. Drug Alcohol Depend. 2020;212.
24. Accreditation Council for Graduate Medical Education (ACGME). Common Program Requirements: Family Medicine. Accreditation Council for Graduate Medical Education; 2024. Available at: https:// www.acgme.org/globalassets/pfassets/programrequirements/2024prs/120_familymedicine_2024.pdf. Accessed June 8, 2025.
Original Research
Rapid Turnaround Time for Toxic Alcohol Testing Is Associated with Shorter Hospital Length of Stay
Steven Chen, BA*
Jacob Yudiono, BS*
Varun Vohra, PharmD†‡
Rebecca Lipscomb, MS§
Rahul Mhaskar, MPH, PhD§||
Justin K. Arnold, DO, MPH*#¶
Diana Dean, MD*#¶
Section Editor: Robert Allen, MD
USF Morsani College of Medicine, Tampa, Florida
Wayne State University School of Medicine, Department of Emergency Medicine, Detroit, Michigan
Wayne State University School of Medicine, Michigan Poison & Drug Information Center, Detroit, Michigan
USF Morsani College of Medicine, Department of Medical Education, Tampa, Florida
USF Morsani College of Medicine, Department of Internal Medicine, Tampa, Florida
University of South Florida, Department of Emergency Medicine, Tampa, Florida
Florida Poison Information Center – Tampa, Tampa, Florida
Submission history: Submitted November 30, 2025; Revision received March 6, 2026; Accepted March 4, 2026
Electronically published July 16, 2026
Full text available through open access at http://escholarship.org/uc/uciem_westjem
DOI 10.5811/westjem.56974
Introduction: Toxic alcohol poisoning (methanol or ethylene glycol) can cause severe metabolic disturbances, end-organ damage, and death. Timely diagnosis is paramount and predicated on history, lab markers, and confirmatory laboratory testing, which inform antidote use and/ or hemodialysis. Confirmatory toxic alcohol testing capabilities and turnaround times vary by geographic region. Our objective in this study was to evaluate how differences in toxic alcohol testing turnaround times impact our primary outcome of hospital length of stay and secondary outcomes of antidote (fomepizole) administration and medical outcomes (including death, major, moderate, and minor effects) among patients with suspected toxic alcohol poisoning.
Methods: This is a retrospective cohort study of toxic alcohol poisoning cases reported to two U.S. poison centers, Michigan Poison and Drug Information Center (MiPDC) and Florida’s Poison Information Network (FPIN), from 2018–2022. Based on investigator experience with each center’s practice patterns, MiPDC had a toxic alcohol testing turnaround time of 12-24 hours, while FPIN had turnaround times averaging 5-7 days. We queried poison center databases for cases where fomepizole was recommended and/or administered. Medical outcomes were categorized using National Poison Database System definitions: minor effects (minimally bothersome symptoms); moderate effects (pronounced symptoms requiring treatment); major effects (life-threatening or significant disability); and death. We excluded cases if there was no concern for toxic alcohol poisoning or if fomepizole was administered for acetaminophen poisoning.
Results: A total of 963 cases met inclusion criteria: (MiPDC, n = 590; and FPIN, n = 373). Patients reported to FPIN had a longer median hospital length of stay compared to MiPDC (65.0 versus 48.0 hours, P < .001). FPIN patients received more doses of fomepizole (2.0 versus 1.0 doses, P < .001). FPIN patients had 4.1 times the odds of major effect (95% CI, 1.3-13.3) (P = .02) and 4.7 times the odds of minor effect (95% CI, 1.4-15.8) (P = .01), without significant association for moderate effects or death.
Conclusion: Access to rapid confirmatory toxic alcohol testing was associated with shorter hospital length of stay, reduced antidote use, and improved medical outcomes in suspected toxic alcohol poisonings. Future studies are warranted to comprehensively characterize the variation in regionspecific care and inform efforts to standardize confirmatory testing capabilities. [West J Emerg Med. 2026;27(4)1002–1010.]
INTRODUCTION
Toxic alcohol poisoning in the United States is most associated with intentional or unintentional ingestions of substances containing methanol or ethylene glycol. In the absence of a confirmed or witnessed ingestion, toxic alcohol poisoning remains a clinical concern in patients presenting with high anion-gap metabolic acidosis. Clinical diagnosis is often predicated upon a combination of patient history, physical examination, laboratory results, and confirmatory toxic alcohol testing. Delays in diagnosis and treatment can lead to severe metabolic acidosis, permanent end-organ damage, and death. Thus, timely quantitative results and therapeutic interventions are critical.1
Quantitative toxic alcohol testing using gas or liquid chromatography with or without mass spectrometry (LC-MS) and/or flame ionization offers a highly sensitive and specific tool that can guide antidote administration with intravenous fomepizole and inform definitive treatment with hemodialysis.1 Healthcare facilities with confirmatory toxic alcohol testing capabilities can provide rapid results. Swift turnaround times aid clinicians with accurate and timely diagnoses and allow rapid de-escalation and discontinuation of hospital resources (eg, antidotes and/or hemodialysis) in the setting of negative toxic alcohol confirmatory testing.2
Readily available toxic alcohol measurements, however, are not routinely available in many clinical settings, with accessibility varying regionally. Clinicians without access to rapid confirmatory testing must evaluate possible toxic alcohol exposures using surrogate lab markers such as serial electrolytes and serum osmolality to gauge acid-base status, anion and osmolal gap calculations, and evolving end-organ damage. However, despite these lab markers being readily available, their use is associated with limitations, including interindividual variability of baseline values with the osmolal gap, the need for precise simultaneous lab draws, and potential confounding from other conditions that can also elevate the osmolal gap.2-7
In the setting of an unknown toxic alcohol concentration, clinicians often treat empirically with fomepizole (4-methylpyrazole, or 4-MP) with treatment regimens on the order of days being common.8 The literature is sparse regarding appropriate triage, treatment, and medical clearance guidance for toxic alcohol poisoned patients without confirmatory results.2 More routine and widespread use of testing capabilities has been limited at an institutional level, which in part may be related to its significant upfront (instrument and peripherals) and upkeep costs (maintenance, calibration, technical expertise).2,9 Nonetheless, readily available confirmatory lab testing may improve patient outcomes, optimize hospital resource allocation and use, and reduce healthcare expenditures.
In this study, we aimed to evaluate the impact of timely access to confirmatory toxic alcohol testing on patient care
Population Health Research Capsule
What do we already know about this issue?
Toxic alcohol poisoning requires rapid diagnosis, but confirmatory testing availability and turnaround times vary across regions.
What was the research question?
Do toxic alcohol testing turnaround times affect length of stay, antidote use, and medical outcomes?
What was the major finding of the study?
Prolonged testing turnaround time was associated with a longer hospital length of stay (65 vs 48 hours, P < .001).
How does this improve population health?
Expanding rapid testing may reduce hospital stays, limit unnecessary antidote use, and improve outcomes in suspected toxic alcohol poisoning.
including therapeutic interventions, hospital length of stay (LOS), and medical outcomes. We hypothesized that access to rapid toxic alcohol testing—defined as access to confirmatory testing results within 24 hours—would be associated with decreased hospital LOS, less fomepizole administration, and improved medical outcomes.
METHODS Study Settings
This was a retrospective cohort study of suspected toxic alcohol cases, in which fomepizole was recommended/given and reported to two U.S. poison centers in different geographic regions with differing access to confirmatory toxic alcohol testing. The MiPDC covers a population of approximately 10 million people, receives between 55,00060,000 calls per year, and covers approximately 200 inpatient healthcare facilities. The MiPDC coordinates toxic alcohol testing for much of its state by facilitating the transport of lab samples from outlying hospitals to have chromatographic testing performed at a hospital lab. Based on investigator experience, this results in a turnaround time of 12-24 hours in most cases. In contrast, all hospitals within the FPIN catchment area rely on third-party commercial labs for confirmatory toxic alcohol testing. Based on investigator experience, this results in turnaround times averaging 5-7 days. The FPIN covers a population of approximately 21
Turnaround
million people, receives about 113,000 calls per year, and covers approximately 360 inpatient healthcare facilities.
Data Abstraction
We queried the two centers’ respective databases using ToxSentry (an electronic health record system for poison centers) for all toxic alcohol exposure cases between January 1, 2018–December 31, 2022, where fomepizole was recommended and/or administered (inclusion criteria). Cases were excluded if toxic alcohol poisoning was not mentioned in any part of the reviewed case narratives, if fomepizole was being administered for acetaminophen poisoning, and if there was a non-human exposure.
All extracted cases were de-identified. We recorded age, sex, reason (eg, intentional [self-harm, desire for intoxication], unintentional [exploratory, no intent of selfharm]), clinical effects, therapies, and medical outcome. Case narratives were reviewed for hospital LOS, time until first fomepizole dose, doses of fomepizole administered, historical features of presentation, details about hemodialysis session(s), and any documented quantitative toxic alcohol concentrations. Our primary outcome was hospital LOS, which we defined as the time of hospital entry to time of hospital discharge or time of last poison center follow-up. Secondary outcomes included the number of doses of fomepizole administered and patient outcomes.
We defined fomepizole dosage as the number of discrete doses (rather than weight-dependent vials) administered during a patient’s hospital stay. Typically, the loading dose of fomepizole is 15 milligrams per kilogram (mg/kg), with maintenance doses of 10mg/kg administered as needed thereafter. Detailed methods for abstraction of hospital LOS and doses of fomepizole administered are described in Appendices A and B. For subgroup analysis, patients were deemed to have a “known toxic alcohol ingestion in their presentation” when ingestion of a toxic alcohol was selfreported by the patient or witnessed by another person and subsequently reported to the clinician.
We coded medical outcomes (eg, major effects, moderate effects, minor effects, no effects, death) according to the predefined criteria set forth by the National Poison Database System Coding Manual (NPDS). 10 Cached under the banner of “minor effects” are cases that were not followed or could not be followed to a known outcome but were judged as likely nontoxic exposures, exposures with minimal clinical effects, or exposures deemed not responsible for the effects. We excluded cases that could not be followed but were judged as a potentially toxic exposure from statistical analyses comparing medical outcomes.
Chart abstraction was performed by two trained investigators (SC and JY) blinded to each other’s abstraction. A third study investigator (DD) reviewed cases with significant discrepancies between the two abstractions. Our
study was compliant with the following medical record review criteria listed: abstractor training; case selection criteria; variable definition; abstraction forms; abstractor performance monitoring; interrater reliability discussion; interrater reliability testing; medical record identification; sampling method; and institutional review board approval.11
Data Analysis
We used the Cohen kappa and the Spearman correlation coefficient to measure the agreement between chart abstractions. The Mann-Whitney U test compared hospital LOS between poison centers, sexes, and hemodialysis administration. We performed pairwise Spearman correlation coefficient analyses to measure the correlation between LOS, age, and doses of fomepizole. Pearson chi-squared test compared medical outcomes between poison centers and sex of patient. The Kruskal-Wallis test was performed to compare medical outcomes with age, time to first dose of fomepizole, and number of doses of fomepizole. We used the HodgesLehmann estimate to calculate median differences and confidence intervals for hospital LOS, doses of fomepizole, and time until first fomepizole dose between poison centers. Linear regression and multinomial logistic regression were used to investigate the relationships between LOS (primary outcome) and medical outcomes (secondary outcome), respectively, adjusting for confounders (including age, sex, doses of fomepizole, time until first fomepizole dose, intent of overdose, and rates of increased anion gap). The LOS was logarithmically transformed to meet regression assumptions, and reported beta values have been exponentiated. One outlier from FPIN was removed from LOS analyses (725 hours).
We conducted analysis using IBM SPSS v29 software (International Business Machines Corp, Armonokm NY), P values < .05 (alpha) were considered statistically significant. Figure 1 displays a study flow diagram. This study was reviewed and considered exempt by the institutional review board.
RESULTS
Over the five-year study timeframe, 373 suspected toxic alcohol exposures were reported to the FPIN network, while 590 exposures were reported to MiPDC. The median ages were 43.0 (interquartile range [IQR], 28.0-56.0) at MiPDC and 47.0 (IQR, 35.0-58.0) at FPIN. There were 71 reported pediatric exposures (MiPDC, n. = 62/590 (10.5%) versus FPIN, n = 9/373 (2.4%). Major medical outcomes were most frequent at (MiPDC, n = 221/573 (38.6%) versus FPIN, n = 166/363 (45.7%). Acidosis, increased anion gap, and central nervous system depression were the most reported clinical findings. There were 71 reported deaths: (MiPDC, n = 39/575 (6.8%) versus FPIN, n = 32/363 (8.8%). Rates of dialysis, clinical effects, critical therapies, and intents of overdose from the two poison centers can be found in Table 1.
Comparative analyses revealed the median hospital LOS
Figure 1. Study flow diagram in a study comparing the effect of turnaround times for testing between two U.S. poison centers, MiPDC and FPIN, in cases of suspected toxic alcohol exposures.
MiPDC, Michigan Poison and Drug Information Center; FPIN, Florida’s Poison Information Network.
was longer in FPIN (65.0 hours [41.0-101.0] versus 48.0 hours [20.0-89.0]; P < .001) with a median difference of 18.0 hours (95% CI, 12.0- 23.0). The median number of doses of fomepizole administered was higher in FPIN (2.0 [1.0-4.0] versus 1.0 [1.0-2.0]; P < .001), with a median difference of 0 doses (95% CI, 0.0-1.0). The median time (hours) to administration of the first dose of fomepizole was higher in FPIN (4.0 hours [2.5-8.5] versus 3.0 [1.5-5.0]; P < .001), with a median difference of 1.0 hours (95% CI, 0.5-2.0). Patients in FPIN were more likely to have at least one dose of fomepizole (92.8% versus 83.9%; P < .001). FPIN patients were more likely to have metabolic acidosis (62.7% vs. 51.9%; P < .001). Figure 2 illustrates the distribution of hospital LOS between MiPDC and FPIN.
There was a strong positive correlation between both abstractors’ datasets (P = .998) for both primary and secondary outcomes.
Upon bivariate linear regression analysis, hospital LOS was 19.8 hours shorter in the MiPDC group (95% CI, -30.3 to -9.3; P < .001). Adjusting for covariates, including age, sex, doses of fomepizole, time until first fomepizole dose, rates of increased anion gap, and intent, on multivariate analysis demonstrated that LOS in the FPIN group was higher by a factor of 1.2 (95% CI, 1.0-1.4) (P = .02). For every additional dose of fomepizole, the estimated LOS increased by a factor of 1.2 (95% CI, 1.2-1.2; P < .001). The effect of each variable on hospital LOS is listed in Table 2.
Bivariate analysis of medical outcomes indicated that FPIN had 4.7, 4.1, and 3.8 times the odds of major, moderate, and minor clinical effects, respectively (P < .001). On multivariate analysis, after adjusting for age, sex, doses of fomepizole, time until first fomepizole dose, and intent, FPIN had 4.1 times the odds of major effect (95% CI, 1.3-13.3) (P = .02) and 4.7 times the odds of minor effect (95% CI, 1.4-15.8) (P = .01). There was no significant association in the odds of moderate effect (95% CI, 1.0-10.2; P = .05) or death between groups (95% CI, 1.0-21.8; P = .06). Table 3 displays the association between various variables and patient medical outcomes.
In MiPDC, 68.1% of charts (n = 402/590) had a documented quantitative methanol concentration and 71.0% (n = 419/590) had a quantitative ethylene glycol concentration. In FPIN, 3.2% of charts (n = 12/373) had a documented quantitative methanol concentration and 7.0% (n = 26/373) had a quantitative ethylene glycol concentration. Table 4 displays data on the quantitative toxic alcohol concentration results obtained at MiPDC and FPIN.
Subgroup Analysis
Among patients with a self-reported or witnessed (ie, “known”) toxic alcohol ingestion in their presentation (n = 447), the median LOS (hours) was higher in FPIN (54.0 hours [31.0, 82.0] versus 32.0 [9.0, 64.0]; P < .001). In this subgroup, the median number of fomepizole doses
Table 1. Descriptive variables in a study comparing suspected toxic alcohol exposures between two U.S poison centers: MiPDC (with a 12-24 hour toxic alcohol testing turnaround time) and FPIN (with a 5-7 day turnaround time).
*MiPDC has a 12-24 hour turnaround time for toxic alcohol testing. FPIN has a 5-7 day turnaround time.
**Patients deemed to have “known toxic alcohol ingestion in their presentation” when ingestion of a toxic alcohol was self-reported by the patient or witnessed by another and subsequently reported to the clinician
Values n (%) unless otherwise specified.
ª Median (Q1, Q3)
CNS, central nervous system; CPR, cardiopulmonary resuscitation; LOS, length of stay; 4-MP, 4-methylpyrazole; MiPDC, Michigan Poison and Drug Information Center; FPIN, Florida’s Poison Information Network.
management of patients with suspected toxic alcohol exposures. For our primary outcome, access to prompt confirmatory toxic alcohol testing capabilities in the MiPDC cohort was associated with a shorter median hospital LOS by 18 hours. Similarly, patients in the MiPDC group received fewer median doses of fomepizole. Our findings suggest that rapid confirmatory testing capabilities may enable clinicians to more quickly and accurately identify patients who require treatment with fomepizole and inform more appropriate discontinuation criteria. In contrast, lack of time-sensitive confirmatory testing requires ongoing clinician monitoring of surrogate laboratory markers, which are less sensitive and result in more extensive prophylactic treatment with antidote, prolonged hospitalizations, and increased healthcare resource utilization.
administered was higher in FPIN (2.0 hours [1.0, 4.0] versus 1.0 [1.0, 3.0]) (P = .003). In the subgroup of patients without a “known” toxic alcohol ingestion in their presentation (n = 516), FPIN exhibited a greater mean LOS (hours) (74.0 [50.0, 129.0] versus 63.0 [36.0, 118.0]) (P = .006). Median doses of fomepizole were not significantly different: 1.0 [1.0, 3.0] versus 1.0 [1.0, 2.0]) (P < .001).
DISCUSSION
Our retrospective study highlights the importance of readily available access to rapid confirmatory testing in the
Toxic alcohol exposures reported to poison centers can largely be grouped based on whether there was a self-reported or witnessed ingestion of a toxic alcohol, or undifferentiated severe metabolic acidosis. Our data demonstrate that the use of healthcare resources (ie, LOS, fomepizole administration) was higher in the FPIN group. In patients who self-reported a toxic alcohol ingestion or had a witnessed ingestion, patient care is centered around determining whether the patient ingested sufficient quantities requiring fomepizole and/or hemodialysis.1 This information could be gleaned most accurately via quantitative toxic alcohol concentrations. We observed that in this subgroup of patients, the FPIN group, which lacked prompt confirmatory testing, was associated with a hospital LOS over 20 hours longer but only administered one additional dose of fomepizole. This relatively smaller difference in the number of fomepizole doses may be in part due to MiPDC’s practice of recommending a prophylactic dose of fomepizole while awaiting confirmatory quantitative testing results, while FPIN typically relies on trending serial metabolic panels.
For patients with no “known” history of toxic alcohol ingestion, suspicion of a toxic alcohol exposure is considered
hospital length of stay in a study comparing suspected toxic alcohol exposures between two U.S. poison centers: MiPDC (with a 12-24 hour toxic alcohol testing turnaround time) and FPIN (with a 5-7 day turnaround time).
Dependent variable hospital length of stay was log-transformed. Regression coefficients have been exponentiated. 4-MP, 4-methylpyrazole; MiPDC, Michigan Poison and Drug Information Center; FPIN, Florida’s Poison Information Network.
Figure 2. Distribution of hospital lengths of stay in a study comparing the effect of turnaround times in suspected toxic alcohol exposures between two U.S. poison centers.
LOS, length of stay.
Table 2. Coefficients table for multivariate analysis of
Table 3. Parameter estimates of multinominal logistic regression with medical outcomes in a study comparing suspected toxic alcohol exposures between two U.S poison centers: MiPDC (with a 12-24 hour toxic alcohol testing turnaround time) and FPIN (with a 5-7 day turnaround time).
No effect (reference)
Effect
in patients presenting with a high anion gap metabolic acidosis.1 Our data show that patients in the FPIN group were associated with a longer hospital LOS of approximately 10 hours, potentially reflecting the inability to swiftly rule out toxic alcohol poisoning as a diagnosis without ready access to quantitative testing.
Prior research indicates that clinicians may be overtreating toxic alcohol poisoning with empiric fomepizole for patients who lack sufficient quantitative toxic alcohol concentrations to meet treatment threshold.2,6,12 Our findings show that across both populations, only 6.5% of methanol concentrations and 18.2% of ethylene glycol concentrations reached the standard threshold
for continuous treatment with fomepizole (> 20 mg/dL). However, without ready access to confirmatory toxic alcohol testing, clinicians must rely on less-sensitive surrogate lab markers, which have implicit limitations (eg, osmolal gap) that may lead to clinician hesitancy with treatment discontinuation.7 Patients in the FPIN group had higher rates of acidosis, which may help explain the more significant medical outcomes. Patients in the FPIN group experienced a higher rate of major and minor clinical effects, although no difference in moderate clinical effects or mortality was observed. Whether this was due to a later presentation to the healthcare facility, late involvement of the managing poison center, more accurate charting or
MiPDC, Michigan Poison and Drug Information Center; FPIN, Florida’s Poison Information Network.
Table 4. Quantitative concentrations of methanol and ethylene glycol levels in a study comparing suspected toxic alcohol exposures between two U.S, poison centers: MiPDC (with a 12-24 hour toxic alcohol testing turnaround time) and FPIN (with a 5-7 day turnaround time).
Documented
Number of positive ethylene glycol results*
Median ethylene glycol concentration among positive results 99 mg/dL 70 mg/dL
* A concentration of > 20 mg/dL was deemed a positive methanol or ethylene glycol result. mg/dL, milligrams per deciliter.
another factor, remains unclear. One potential explanation is that access to rapid LC-MS testing enables more definitive toxic alcohol treatment protocols that allow clinicians to either quickly identify a poisoned patient or consider other etiologies. The ability to rapidly diagnose toxic alcohol poisoning also may have significant cost-savings implications. Between 2010–2021, over 24,000 cases of fomepizole administration for possible toxic alcohol exposure occurred in the United States.13 The cost for a vial of fomepizole (1.5 grams/1.5 milliliters) is $1,200-$2,000.13 With the limiting assumption of one vial per dose of fomepizole, the average patient from FPIN receiving a mean of 0.7 additional doses over MiPDC would incur an extra cost of $1,300. Expanding confirmatory testing capabilities represents a cost-effective investment that reduces unnecessary fomepizole doses, hospital LOS, and overall healthcare expenditures associated with resource use. Following conservative estimates of hospitalization cost of $1,937 per inpatient day, MiPDC, which had 590 suspected toxic alcohol exposures, saved an estimated total of $850,000 over the five-year study period.14
Like the region managed by FPIN, many areas in the United States lack ready access to rapid toxic alcohol testing. In 2022, a survey involving 36 U.S. poison centers concluded that only 19.4% (n = 7/36) reported regional healthcare facilities capable of confirmatory toxic alcohol testing results within 24 hours.2 Moreover, 61% of poison centers (n = 22/36) reported ≤ 10% of regional hospitals in their catchment area had access to 24-hour confirmatory testing facilities.2 Given these gaps, access to confirmatory LC-MS testing could have a widespread impact that should prompt further prospective and higher. powered retrospective studies to validate the effect of rapid toxic alcohol testing on toxic alcohol management. In today’s world of complex healthcare administrative decisions, our findings may generate further discussion and action for expanded confirmatory testing capabilities that can optimize both patient care and mitigate strains on resource demand in an already overburdened healthcare landscape.
LIMITATIONS
This study had several limitations. Our dataset may not be a complete representation of all cases of possible toxic alcohol exposures in a region because poison control data rely on passive and voluntary information communicated by healthcare clinicians or callers from the public. Data may be skewed toward cases of higher complexity as clinicians may be less likely to report cases in which toxic alcohol toxicity is unlikely or where medical management is considered relatively uncomplicated. Therefore, poison center data should not be interpreted as a representation of the true statewide incidence of toxic alcohol exposures.
The intent of our study design was to demonstrate the utility of a negative toxic alcohol concentration, based on the recommendation or administration of fomepizole, which did not include all reported toxic alcohol exposures. Specifically, we did not include cases managed with only extracorporeal treatments in this study. Furthermore, the available information in ToxSentry can vary depending on the accuracy and completeness of the poison center records, which in turn depends on the individual recording documentation, leading to information and reporting biases. For example, the hospital LOS was estimated based on the patient’s hospital arrival time and the time of the last poison center follow-up. However, patients may have had longer LOS beyond the time of last follow-up, which could not be abstracted based on available poison center information.
We did not have access to electronic health records from individual hospitals to verify the poison center data. Other variables, such as the number of doses of fomepizole administered and the time to first fomepizole dose, may also be subject to error due to a lack of complete information. Additionally, while most hospitals in the MiPDC catchment area had access to rapid toxic alcohol testing, some hospitals did not, which may have led to a measurement bias. Inherent differences between poison center follow-up guidelines may also exist, which can reflect wider practice pattern
across geographic regions. Additionally, the higher frequency of acidosis, elevated anion gap, elevated osmolal gap, and hemodialysis in FPIN may be a confounding variable contributing to worse medical outcomes and increased hospital LOS.
The baseline differences in these variables between MiPDC and FPIN could reflect underlying differences in patient acuity or severity of illness at presentation. Although we attempted to account for this difference by including the frequency of “increased anion gap” as a variable in our multivariate models, residual confounding is still possible. On the other hand, some of these baseline differences can be partly attributed to variations in practice patterns. For example, clinicians in MiPDC may be less likely to order surrogate lab tests, such as the osmolal gap or anion gap, because they have ready access to quantitative toxic alcohol levels.
CONCLUSION
Our retrospective cohort study findings suggest that ready access to rapid confirmatory toxic alcohol testing is associated with shorter hospital length of stay, administration of fewer doses of fomepizole, and improved medical outcomes. Clinical severity of ingestions may represent a significant confounding factor in our study. Expansion of confirmatory toxic alcohol testing capabilities warrants investigation due to the potential for significant translational impacts in optimizing acute patient care and outcomes.
The authors confirm that the data supporting the findings of this study are available within the paper and its supplementary materials.
Address for Correspondence: Steven Chen, BA, USF Morsani College of Medicine, 560 Channelside Dr., Tampa, FL, 33602. Email: schen1@usf.edu.
Conflicts of Interest: By the WestJEM article submission agreement, all authors are required to disclose all affiliations, funding sources and financial or management relationships that could be perceived as potential sources of bias. No author has professional or financial relationships with any companies that are relevant to this study. There are no conflicts of interest or sources of funding to declare.
1. Gallagher N, Edwards FJ. The diagnosis and management of toxic alcohol poisoning in the emergency department: a review article. Adv J Emerg Med. 2019;3(3):e28.
2. Dean D, Arnold J, Funk A. Variations in toxic alcohol testing across America’s poison centers [Abstract]. In: North American Congress of Clinical Toxicology (NACCT) 2022. Clin Toxicol. 2022;60:1–162.
3. Krasowski MD, Wilcoxon RM, Miron J. A retrospective analysis of glycol and toxic alcohol ingestion: utility of anion and osmolal gaps. BMC Clin Pathol. 2012;12:1.
4. Kraut JA. Diagnosis of toxic alcohols: limitations of present methods. Clin Toxicol (Phila). 2015;53(7):589-595.
5. Hayman CV, Pires KD, Cohen ET, et al. Elevated osmol gaps in patients with alcoholic ketoacidosis. Clin Toxicol (Phila) 2024;62(10):609-614.
6. Fichadiya H, Noori MAM, Khandait H, et al. A rare case of elevated osmolar gap in diabetic ketoacidosis/hyperosmolar hyperglycaemic state in the absence of concomitant toxic alcohol ingestion. Eur J Case Rep Intern Med. 2022;9(3):003248.
7. Vohra V, Hodgman MJ. Elevated osmol gaps not explained by toxic alcohols: a retrospective review. Am J Emerg Med. 2025;93:211-212.
8. Ghannoum M, Gosselin S, Hoffman RS, et al. Extracorporeal treatment for ethylene glycol poisoning: systematic review and recommendations from the EXTRIP workgroup. Crit Care 2023;27(1):56.
9. Thomas SN, French D, Jannetto PJ, et al. Liquid chromatographytandem mass spectrometry for clinical diagnostics. Nat Rev Methods Primers. 2022;2(1):96.
10. American Association of Poison Control Centers. National Poison Data System (NPDS) Coding Users’ Manual Version 4.4.3. NPDS. 2023.
11. Worster A, Bledsoe RD, Cleve P, et al. Reassessing the methods of medical record review studies in emergency medicine research. Ann Emerg Med. 2005;45(4):448-451.
12. Bisoski L, King A. If it’s not a toxic alcohol, what is it? [Abstract]. In: American College of Medical Toxicology (ACMT). Abstracts from the 2017 American College of Medical Toxicology (ACMT) Annual Scientific Meeting. J Med Toxicol. 2017;13(1):3-46.
13. Leonard JB, Minhaj FS, Erickson K, et al. Fomepizole use reported to United States Poison Centers from 2010 to 2021. Clin Toxicol (Phila) 2024;62(2):120-125.
14. Skinner HG, Coffey R, Jones J, et al. The effects of multiple chronic conditions on hospitalization costs and utilization for ambulatory care sensitive conditions in the United States: a nationally representative cross-sectional study. BMC Health Serv Res. 2016;16:77.
Implementing a Multimodal Palliative Care Curriculum: Impact on Knowledge, Confidence, and Skills
Travis Hase, MD*†‡
Cindy
Ndiaye, MPH§
Margaret Putman, DO
||
Advocate Christ Medical Center, Department of Emergency Medicine, Oak Lawn, Illinois
University of Illinois College of Medicine at Chicago, Department of Emergency Medicine, Chicago, Illinois
Wake Forest University School of Medicine, Department of Emergency Medicine, Winston-Salem, North Carolina
Advocate Christ Medical Center, Department of Graduate Medical Education Research, Oak Lawn, Illinois
University of Chicago Pritzker School of Medicine, Section of Geriatrics and Palliative Medicine, Chicago, Illinois
Section Editor: Jeffrey Druck, MD
Submission history: Submitted November 4, 2025; Revision received February 22, 2026; Accepted February 24, 2026
Electronically published June 28, 2026
Full text available through open access at http://escholarship.org/uc/uciem_westjem DOI 10.5811/westjem.53884
Introduction: Emergency physicians frequently care for patients with serious or terminal illnesses, yet they often lack formal palliative care training. Our primary objective was to develop a structured, multimodal palliative care curriculum for emergency medicine (EM) residents and evaluate whether this curriculum improved residents’ knowledge, comfort level, and perceived application of skills to care for patients with chronic or terminal illness in the emergency department (ED). Our secondary objective was to determine whether EM residents found palliative care education important and to identify which educational modalities are most effective for acquiring palliative care knowledge and skills.
Methods: We implemented an eight-hour multimodal curriculum for EM residents at a single, large Level I trauma center (four hours of didactics, a three-hour simulated patient communication skills lab, and one hour of high-fidelity simulation). Our primary outcome was pre- and post-intervention surveys (12 questions) that assessed perceived knowledge, comfort, and skill application on fivepoint Likert scales. We analyzed paired responses using the Wilcoxon signed-rank test, with a P value of < .05 considered statistically significant. Effect size was calculated using Cohen d. Our secondary outcome measure was a post-intervention survey (six questions) that assessed participants’ opinions on the effectiveness of the different educational methods.
Results: There was a 100% response rate among 41 residents from all postgraduate years 1-3. Significant improvements (P < .001) were observed in residents’ self-reported abilities across all domains with large effect sizes. Median scores and interquartile ranges increased for conducting goals-of-care discussions (4 [3–4] vs 4 [4–5]), interpreting advance directives (3 [2–4] vs 4 [4–4]), managing end-of-life symptoms (3 [2–3] vs 4 [3–4]), communicating bad news (3 [2–4] vs 4 [4–4]), and coordinating with palliative or hospice teams (2 [2–3] v. 4 [4–4]). All educational modalities were rated effective, with simulation and small-group sessions preferred over lectures.
Conclusion: A structured, multimodal palliative care curriculum significantly enhanced EM residents’ perceived preparedness to manage patients with palliative care needs. Embedding didactic and simulation-based palliative training in EM residencies is both feasible and impactful, addressing critical gaps in palliative competencies and aligning with national best-practice guidelines. [West J Emerg Med. 2026;27(4)1011–1017.]
INTRODUCTION
Background
As the U.S. population ages and becomes increasingly medically complex, the need for palliative care far exceeds the availability of subspecialty-trained palliative care physicians.1 The emergency department (ED) remains a frequent point of contact for these patients. Half of those living in the United States visit the ED in their last month of life and 75% in the prior six months, with frequent repeat visits.2 Most adults do not have advance directives completed at the time of ED visits.3
Because many patients present to the ED while critically ill and requiring urgent interventions, it is imperative that emergency physicians be able to quickly align with patients and families to determine values and offer recommendations for further medical treatment. A systematic review completed in 2019 found that palliative care in the ED (most often delivered by palliative care specialists) improved quality of life, reduced hospital length of stay, and did not decrease survival rate compared with usual care.4-5 Having early and effective goalsof-care conversations can improve symptoms, reduce suffering, and decrease healthcare costs.6-9 Implementing palliative care in the ED for actively dying patients has been shown to improve patient care, optimize comfort measures and emotional support, increase patient satisfaction, and reduce overall hospital admissions.10 Emergency physicians often practice in environments without readily available palliative care specialists and, therefore, need to have primary palliative skills to provide excellent and holistic care to patients with chronic and/or terminal illnesses.11
Emergency physicians have reported that palliative care is an important competence in their practice, yet they feel they are not adequately educated in providing such care. They report discomfort regarding physician orders for lifesustaining treatment forms and navigating conflict around withholding life-prolonging treatment.12-16 A needs assessment of emergency medicine (EM) residents showed specific areas in which there were self-reported knowledge gaps, including managing hospice patients, withdrawal of life support, prognostication, and pain management.17
Palliative care training in EM residency is highly variable. One study that surveyed EM residency program directors showed a general lack of formal palliative care training in EM residencies, with opportunities for competency training and gaps in resident skill level.18 Previously reported EM residency palliative curricula have included adaptation of the Education in Palliative and End-of-Life Care Emergency Medicine (EPEC-EM) curriculum in synchronous and asynchronous formats, as well as case-based simulation, and were effective methods to increase knowledge and increase resident confidence in palliative care skills.19-20
In 2018, an expert panel assembled by the American College of Emergency Physicians Palliative Medicine Section, consisting of academic EM faculty, community emergency
Population Health Research Capsule
What do we already know about this issue? Emergency physicians often feel ill-prepared to address palliative care needs in the ED, yet palliative care training during residency remains limited.
What was the research question?
We investigated whether a multimodal curriculum would improve residents’ comfort with and knowledge of palliative care skills.
What was the major finding of the study? Participants reported significant knowledge improvements across multiple domains of primary palliative care (P <.001 for all domains).
How does this improve population health? Integrating palliative care training in EM residency may improve outcomes for patients with life-limiting illness. Further research is needed to assess translational impacts.
physicians, EM residents, and nurses, created hospice and palliative medicine EM milestones. These competencies are modeled after the EM milestones established by the Accreditation Council for Graduate Medical Education and can serve as guidance for EM residency programs.21 In 2021, best-practice guidelines for primary palliative care in the ED were published, again emphasizing the importance of this skillset for emergency physicians.11
Study Objectives
Our primary objective was to develop and implement a multimodal palliative care curriculum for EM residents at a large, tertiary center and to evaluate its impact on residents’ knowledge, level of comfort, and perceived skill application in caring for patients with serious life-limiting and/or terminal illness in the ED. A secondary objective was to determine whether EM residents find palliative care education important and to identify which modalities they found effective to acquire palliative care knowledge and skills.
METHODS
Curriculum Design
In our review of the literature, previous palliative care curricula for EM residents have predominantly employed single educational modalities, most commonly didactics or a
single simulation experience. We identified an opportunity to provide a more comprehensive and layered simulation approach that combines small-group simulated patient workshops with high-fidelity manikin simulation, allowing for deliberate practice and scaffolded learning.
This was a pilot curriculum with a goal of determining effectiveness, feasibility, and durability within our institution. Our intention was to create a framework that would be easy to replicate and adapt to future needs. We sought to use educational modalities that optimized the benefits of experiential and simulation-based learning. Curriculum implementation followed Kern’s standardized six-step curriculum design process.22 We conducted a general needs assessment by reviewing available published survey data of emergency physicians, residents, and program leaders, and we identified knowledge and experience gaps in several domains specific to palliative care. A targeted needs assessment of our residents was then performed to focus our intervention’s efforts on the domains our learners felt they would encounter in their practice.
With this information, we developed a palliative care curriculum for EM residents. Total training time was eight hours. The curriculum consisted of four didactic sessions, each lasting one hour; a three-hour communication skills lab using simulated patients; and an hour of small-group simulation using a high-fidelity manikin. The format of the simulation case necessitated the active participation of all learners. This pilot curriculum was implemented over a six-month period during regularly scheduled conference and simulation learning times.
The first didactic session was an introduction to palliative care. In this session, palliative care was defined and differentiated from hospice care, learners were taught to interpret various advance directive forms, and to understand the role that emergency physicians may play in the overall care of patients with serious life-limiting or terminal illnesses. The second didactic session focused broadly on the principles of palliating symptoms, ensuring comfort, and addressing symptoms refractory to usual care. It also included teaching on disposition options for hospice and patients with palliative needs. The third didactic session focused on teaching about the active death process, end-of-life care, and transition to hospice. In advance of the communication skills lab, a fourth didactic session focused on providing a toolbox of communication skills and techniques for assessing values, communicating bad news, and assessing goals of care as part of a serious-illness conversation. Specifically, several welldeveloped communication tools were reviewed, including the SPIKES protocol for delivering bad news, the NURSE mnemonic for responding to emotion, and the REMAP framework for goals-of-care conversations.23-26
The communication skills lab focused on providing learners with the tools to hold a rapid goals-of-care conversation with patients and families. Frameworks for
delivering bad news, assessing values, and providing valuesbased recommendations were taught. Learners then had the opportunity to practice these skills in small groups, rotating through six different scenarios with simulated patients in a rapid-cycle deliberate practice format.27 Lastly, learners participated in a small-group, high-fidelity simulated patient experience where they were asked to apply the skills they had previously learned. Specifically, they evaluated a patient with terminal and worsening illness, delivered bad news based on the findings of their workup, assessed the patient’s values, and transitioned into a goals-of-care conversation. Learners needed to discuss palliation and medical management options and ultimately provide recommendations based on an alignment with the patient’s values.
Study Design
Approval was obtained from the institutional review board, and the study was deemed exempt. We performed a comprehensive literature review of palliative care needs in the ED and previously implemented palliative curricula for EM residents. The study population was EM residents in all levels of training at a large, university-affiliated Level 1 trauma and tertiary referral center. All residents were exposed to this curriculum regardless of participation in the study; completion of the surveys was voluntary. Inclusion criteria were all residents who completed both the pre- and post-intervention surveys. One resident was excluded from the study population, as they were a co-investigator.
Surveys used Likert-scale questions to capture residents’ perceived ability regarding each component. This survey instrument was created de novo based on identified needs from the published literature and consisted of 12 identical questions on both the pre- and post-survey.11, 17, 18, 21 In addition to a self-assessment, participants were asked six questions on the post-survey to evaluate the effectiveness of the various educational modalities used in our curriculum: didactics; small-group learning with simulated patients; and simulationbased experiential learning. As simulation training likely poses the greatest barrier to replication due to cost, equipment availability, and faculty experience, our survey asked additional questions regarding simulation to inform and support future resource allocation.
The pre-intervention survey data were collected from July 26–August 2, 2022. Post-intervention survey data were collected from December 21, 2022–January 1, 2023. We sent pre-notifications and targeted reminders during the survey collection window to achieve a high response rate.28 No incentive was offered for survey completion.
Research Methods
To conduct a statistical comparison, we converted Likertscale items to corresponding numerical values (1-5): strongly disagree; disagree; neutral; agree, and strongly agree. For each
Likert-scale question, their distribution was assessed for normality via the Shapiro-Wilk test (P > .05 denoting a normal distribution). All variables were found to be not normally distributed, leading to the use of the nonparametric equivalent of the paired t-test, the Wilcoxon signed-rank test. A P value of < .05 determined a significant difference in Likert scores pre-tests versus post-tests. We calculated effect sizes for each survey item using Cohen d. And we used the statistical software SAS v9.4 (SAS Institute Inc, Cary, NC) for all statistical analyses.
RESULTS
There was a 100% response rate, with 41 of 41 potential respondents across all postgraduate years (PGY) fully participating. In total, 13 PGY-3, 14 PGY-2, and 14 PGY-1 residents engaged with the curriculum and completed both the pre- and post-intervention surveys in their entirety. Table 1 details the survey questions and the median Likert-scale survey score with interquartile range, both pre- and postintervention, as well as the effect size for each question. Survey results showed most residents agreed (36.6%) or
strongly agreed (51.2%) that EM has an important role in providing palliative care. Most residents agreed (48.8%) or strongly agreed (41.5%) that palliative care education was important in EM residency training. There was no significant change in these opinions pre- versus post-implementation (P = 1.0 and P = .83, respectively). There was a statistically significant improvement in residents’ understanding of the differences between hospice and palliative care (P < .001).
All other survey questions assessing perceived confidence in knowledge and skills pertaining to palliative care were found to have statistically significant improvement pre- versus post-intervention, with large effect sizes (Table 1). These items evaluated ability to determine decision-making capacity, have goals-of-care discussions, interpret advance directive forms, treat symptoms associated with the last hours of living, effectively negotiate decision making with patients and families, treat refractory symptoms associated with chronic or terminal disease, perform effective acute pain management in patients with palliative care needs, and effectively communicate bad news. Residents’ ability to initiate contact with and involve palliative and/or hospice teams to optimize care for patients in
Survey Question
I feel confident…
bad news including death, errors, and unexpected outcomes while caring for patients with life-limiting illnesses
Table 1. Survey results of emergency medicine residents’ perceived palliative care knowledge and skills pre- versus post-implementation of a palliative care curriculum.
the ED also had statistically significant improvement (P < .001).
Survey results evaluating learning modalities showed residents felt lecture, small-group discussion, and simulation were all effective educational tools (Figure 1).
The prompt “Lecture is an effective educational tool to learn EM palliative care skills,” resulted in 29.27% neutral, 65.85% agree, and 4.88% strongly agree. The prompt “Smallgroup discussions are an effective educational tool to learn EM palliative care skills,” resulted in 7.32% neutral, 48.78% agree, and 43.9% strongly agree. The prompt “Simulation is an effective educational tool to learn EM palliative care skills,” resulted in 9.76% neutral, 36.59% agree, and 51.22% strongly agree; 2.44% of residents disagreed about simulation’s effectiveness.
Regarding simulation specifically, 12.20% of residents felt neutral, 43.90% agreed, and 43.90% strongly agreed that simulation improved their ability to hold goals-of-care conversations, while 14.63% felt neutral, 39.02% agreed, and 46.34% strongly agreed that simulation improved their ability to disclose bad news. Regarding the perception that simulation improved their ability to align with patients’ values to make treatment recommendations, 12.20% felt neutral, 43.90% agreed, and 43.90% strongly agreed.
DISCUSSION
The implementation of this palliative care curriculum for EM residents demonstrated a significant improvement in their perceived knowledge and skills across multiple domains of
palliative care. Consistent with expected, early-stage outcomes following a curriculum intervention, the self-assessment results reflect perceived improvements in key palliative care competencies, aligning with the “knows” and “knows how” levels of Miller’s pyramid.22 These findings represent gains in learner confidence and self-reported preparedness and are best understood as necessary precursors to subsequent behavioral change and skill acquisition, which warrant evaluation through objective, performance-based assessments in future work. The structured, case-based approach provided residents with opportunities for active learning, hands-on practice, and real-time feedback, all of which contributed to their development. Additionally, the integration of simulation-based training allowed residents to apply their new knowledge in a controlled setting. The ability of simulation to offer a highfidelity, low-stakes environment for practicing skills makes it an ideal tool for learning sensitive and challenging communication skills.
Our results demonstrate that the deployment of a multimodal curriculum may be additive in addressing the knowledge and experience gaps in emergency physicians’ comfort and skills in managing patients with palliative, hospice, or end-of-life needs while in the ED. This work contributes to a limited body of research similarly addressing the gap in primary palliative care training for EM residents. Nguyen and Matese assessed the effect of a curriculum on self-perceived skill and knowledge acquisition and primarily used a self-directed learning format consisting of free, open-
Figure 1. Survey results of emergency medicine residents’ preferred educational modality to learn palliative care skills EM, emergency medicine.
access medical education content along with a lecture series.29 Goldonowicz and colleagues used a single educational modality with a simulation case.20 Their format allowed for experiential learning from a limited number of study participants with most learners observing the simulation rather than actively participating. Benesch’s study group describes a longitudinal and multimodal educational intervention that used the fee-based VitalTalk training program for emergency physicians, EMTalk, and the RE-AIM framework to evaluate impact.30
Our work describes a comprehensive, multimodal curriculum consisting of varied educational methodologies. We leveraged the benefits of experiential learning using both standardized patients and high-fidelity simulation. Our simulation-based learning used rapid-cycle deliberate practice formats of practice, and the small-group, high-fidelity simulation case necessitated the active participation of all learners. Our didactics and communications skills lab are adaptable to evolving educational need, learner interest, and new methods. Notably, our content and overall methods avoid the use of proprietary courses and materials, because those courses may be cost prohibitive for some institutions.
Given this pilot’s success, we incorporated this palliative care training as an enduring and longitudinal component of our overall residency curriculum. We believe the time and financial investment to be acceptable and sustainable, especially for programs with a well-established simulation training program. The multimodal framework is easy to replicate, and specific content areas are sufficiently modifiable based upon evolving program-specific needs. Anticipated annualized cost of the curriculum is estimated to be approximately $2,000 and represents the expense of standardized patients and guest speaker honorarium. The capital, operating, and personnel expense otherwise associated with our existing simulation center and program are incurred irrespective of this curriculum.
Opportunities for future scholarship include an objective assessment of at least a subset of palliative care domains to assess knowledge and successful application of learned skills. Querying longitudinal attitudes toward palliative care in the ED, as well as gauging comfort in knowledge and skills after a longer interval, may also be insightful. Additionally, the future development of a mastery-learning curriculum for a subset of skills, in particular serious-illness conversation, symptom management at the end of life, and palliative extubation, may prove particularly useful in preparing trainees to skillfully approach sensitive conversations and complex symptoms with patients and their families.
LIMITATIONS
Our study has several limitations worth discussing. While our high response rate limits non-response bias, our results are limited to a single institution and may not generalize broadly
because of selection bias inherent to our study design. Furthermore, our results are limited by the lack of objective assessment from an outside observer and may not fully reflect skill acquisition. The assessment instrument used was a subjective, unvalidated questionnaire, which is vulnerable to the biases inherent in self-assessment. Self-assessment relies on perceptions, which may not accurately reflect actual skill and knowledge and is subject to response bias and the Hawthorne effect. Our educational modality survey is not symmetric across the varying domains; therefore, it is underpowered by design, limiting interpretability.
While an improvement in perceived abilities is not unsurprising after the implementation of a curriculum intervention, our study may be affected by a ceiling effect bias, whereby the post-intervention survey is limited in its ability to measure improvement. In the pre-intervention survey, participants rated their perceived abilities relatively highly, limiting the instrument’s ability to measure improvement on the post-intervention survey.
Our study participants’ attitudes toward palliative care were high in both the pre- and post-survey, suggesting a relatively positive and accepting attitude toward this topic. This may have reflected a high level of interest in the topic and subsequently may have affected motivations to engage in the curriculum. Thus, our results may not generalize to institutions with varying attitudes toward palliative care or to environments where there is heightened resistance toward or barriers to providing this type of curriculum in the ED.
Our short-term assessment period may also not have captured long-term retention or application of knowledge and skills. Incorporating objective assessments, a longitudinal follow-up, or the use of randomized groups would have strengthened our results. Nonetheless, the findings highlight the value of a mixed didactic, interactive, and experiential curriculum in advancing the care of patients with palliative care needs in the ED and ensuring residents are better equipped to manage these complex clinical scenarios. The demand on resources and time is an additional consideration, and this may pose some barriers to others wishing to implement a multimodal curriculum such as this.
CONCLUSION
Our palliative care curriculum for EM residents significantly improved their self-reported knowledge, level of comfort, and perceived application of skills in caring for patients with chronic and/or terminal illnesses in the ED. They found palliative care education to be important. Lecture, small-group discussion, and simulation were all felt to be effective modalities for learning palliative care skills. Our results highlight the feasibility and effectiveness of embedding structured palliative care training in EM residency training, and the implementation of similar curricula is likely broadly scalable.
Given the frequency with which emergency physicians encounter patients with serious illness, integrating longitudinal approaches may further strengthen residents’ preparedness. Broader adoption of such curricula could help align EM training with emerging national best-practice guidelines and milestones for palliative care in emergency medicine.
Address for Correspondence: Travis Hase, MD, Advocate Christ Medical Center, Department of Emergency Medicine, 4440 W 95th St, Oak Lawn, IL 60453. Email: travishase@gmail.com.
Conflicts of Interest: By the WestJEM article submission agreement, all authors are required to disclose all affiliations, funding sources and financial or management relationships that could be perceived as potential sources of bias. No author has professional or financial relationships with any companies that are relevant to this study. There are no conflicts of interest or sources of funding to declare.
1. Quill TE, Abernethy AP. Generalist plus specialist palliative care— creating a more sustainable model. N Engl J Med. 2013;368:1173-1175.
2. Smith AK, McCarthy E, Weber E, et al. Half of older Americans seen in emergency department in last month of life. Health Aff (Millwood). 2012;31:1277-1285.
3. Oulton J, Rhodes SM, Howe C, et al. Advance directives for older adults in the emergency department. J Palliat Med. 2015;18:500-505.
4. Wilson JG, English DP, Owyang CG, et al. End-of-life care and palliative consultation in the emergency department. J Pain Symptom Manage. 2020;59:372-383.
5. Kirkland SW, Ghalab A, Kruhlak M, et al. Emergency department-based interventions for advanced illness. J Palliat Med. 2021;24:605-618.
6. Ciemins EL, Blum L, Nunley M, et al. Economic and clinical impact of inpatient palliative care consultation. J Palliat Med. 2007;10:1347-1355.
7. Meier DE, Beresford L. Fast response is key to partnering with the emergency department. J Palliat Med. 2007;10:641-5.
8. Mahony SO, Blank A, Simpson J, et al. Palliative care and case management project in an emergency department. J Urban Health. 2008;85:443-451.
9. Morrison RS, Penrod JD, Cassel JB, et al. Cost savings with hospital palliative care programs. Arch Intern Med. 2008;168:1783-1790.
10. Rojas E, Schultz R, Linsalata HH, et al. Implementation of a lifesustaining management protocol. J Emerg Nurs. 2016;42:201-206.
11. Loffredo AJ, Chan GK, Wang DH, et al. US best practice guidelines for primary palliative care in the ED. Ann Emerg Med. 2021;78:658-969.
12. Mirarchi FL, Doshi AA, Zerkle SW, et al. Emergency physicians’ understanding of POLST forms. J Patient Saf. 2015;11:1-8.
13. Smith AK, Fisher J, Schonberg MA, et al. Provider perspectives on palliative care in the ED. Ann Emerg Med. 2009;54:86-93.
14. Stone SC, Mohanty S, Grudzen CR, et al. Emergency physicians’ perspectives of palliative care. J Palliat Med. 2011;14:1333-1338.
15. Rivera MR, Torres FS. Lack of training and comfort with palliative care. Bol Asoc Med P R. 2015;107:92-96.
16. Gisondi MA. Education in palliative and end-of-life care in emergency medicine. Acad Emerg Med. 2009;16:181-183.
17. Lamba S, Pound A, Rella JG, et al. Resident education in palliative care: a needs assessment. J Palliat Med. 2012;15:516-520.
18. Kraus CK, Greenberg MR, Ray DE, et al. Palliative care education in EM residency training. J Pain Symptom Manage. 2016;51:898-906.
19. Gisondi MA, Lu DW, Yen M, et al. Adaptation of EPEC-EM curriculum. West J Emerg Med. 2010;11:491-499.
20. Goldonowicz JM, Runyon MS, Bullard MJ. Palliative care education in the ED. BMC Palliat Care. 2018;17:43.
21. Shoenberger J, Lamba S, Goett R, et al. Hospice and palliative medicine skills for EM residents. AEM Educ Train. 2018;2:130-145.
22. Thomas PA, Kern DE, Hughes MT, et al. Curriculum Development for Medical Education: A Six-Step Approach. 3rd ed. Baltimore, MD: Johns Hopkins University Press; 2016.
23. Baile WF, Buckman R, Lenzi R, et al. SPIKES protocol for delivering bad news. Oncologist. 2000;5:302-311.
24. Mahendiran M, Yeung H, Rossi S, et al. Effectiveness of the SPIKES model. Am J Hosp Palliat Care. 2023;40:1231-1260.
25. Back AL, Arnold RM, Baile WF, et al. Approaching Difficult communication tasks in oncology. CA Cancer J Clin. 2005;55:164-177.
26. Childers JW, Back AL, Tulsky JA, et al. REMAP framework for goals of care. J Oncol Pract. 2017;13:e844-850.
27. Ng C, Primiani N, Orchanian-Cheff A. Rapid cycle deliberate practice in simulation. Med Sci Educ. 2021;31:2105-20.
28. Phillips AW, Reddy S, Durning SJ. Improving response rates in surveys. Med Teach. 2016;38:217-228.
29. Nguyen D, Matese T. Effect of palliative curriculum on EM residents’ knowledge. Am J Hosp Palliat Care. 2023;40:462-467.
30. Benesch TD, Moore JE, Breyre AM, et al. Primary palliative care education in EM residency. AEM Educ Train. 2022;6:e10823.
Does Skin Color Influence Differential Diagnosis Generation in a Simulated Cardiac Arrest?
Hannah E. Miller, MD*
Claudia Tarrant†
Miles Lamberson†
Cate Nicholas, EdD, MS†
Katherine Dolbec, MD*
Section Editor: Amy Hildreth, MD
University of Vermont Health, Robert Larner College of Medicine, Department of Emergency Medicine, Burlington, Vermont
University of Vermont, Robert Larner College of Medicine, Burlington, Vermont
Submission history: Submitted October 19, 2025; Revision received March 6, 2026; Accepted March 6, 2026
Electronically published June 28, 2026
Full text available through open access at http://escholarship.org/uc/uciem_westjem DOI 10.5811/westjem.53204
Introduction: It is not known whether skin color influences inclusion of substance use on medical students’ differential diagnoses for a simulated cardiac arrest. Our objective in this study was to investigate whether the presence of a dark-skinned or light-skinned manikin in the lab correlated with their decision to include substance use on the differential as a possible cause of cardiac arrest.
Methods: In this study at a single institution, all fourth-year medical students in an emergency medicine course participated in a manikin-based cardiac arrest simulation case. The simulation sessions alternated between the use of a light-skinned and a dark-skinned manikin. Both were adult sized. After the first shock was delivered, students individually documented their differential diagnosis for the cause of the cardiac arrest on deidentified, free-text research forms. We excluded forms if they were blank, had been completed by a non-medical student, or could not be associated with the skin color of the manikin used. The primary outcome measure was how often students included substance use as a cause of cardiac arrest anywhere in their differential diagnoses. We compared the relationship between manikin skin color and the students’ consideration of substance use as a cause of cardiac arrest, using the Fisher exact test.
Results: Of 270 eligible participants, 271 surveys were returned; 75 (27.7%) were excluded. Of the remaining 196 surveys, 96 were associated with the light-skinned and 100 with the dark-skinned manikin. Among the 100 respondents using the dark-skinned manikin, one student (1%) listed substance use as the leading diagnosis, while none (0%) of the students using the light-skinned manikin listed substance use as the leading diagnosis. In each group, only 20% of students (n = 39 total) listed substance use anywhere on the differential diagnosis (P = 1.00).
Conclusion: Among fourth-year medical students participating in a simulated cardiac arrest, we found no correlation between manikin skin color and the inclusion of substance use on their differential for cardiac arrest. Overall, their decision to include substance use in their differentials was low regardless of skin color, suggesting the need to improve their awareness of substance use as a potential cause of cardiac arrest. [West J Emerg Med. 2026;27(4)1018–1022.]
INTRODUCTION
Drug overdose deaths are a leading cause of mortality in the United States. There were nearly 108,000 drug overdoserelated deaths in 2022, according to the National Institutes of
Health.1 In 2023 the U.S. Centers for Disease Control and Prevention’s State Unintentional Drug Overdose Reporting System reported victim demographics as follows: most were male (71.6%); 23% were Black, 61.3% were White; and
25.9% were 35-44 years of age.2 Of note, in recent years overdose death rates have increased disproportionately among non-Hispanic Black and non-Hispanic American Indian/ Alaska Natives.3 Demographics describe the social milieu that helps inform how society constructs stereotypes of groups more likely to experience substance use.
Evidence is limited regarding the ways in which bias based on skin color affects clinical decision-making. Previous investigations of explicit and implicit bias in clinical practice were based on clinical case vignettes, rather than on actual human behavior in clinical scenarios (in situ or simulation-based).4 In those vignettes it was noted that participants tended to spend similar amounts of time on cases and create similar differential diagnoses regardless of patient presentation and/or background.5
We began this study at a time when racial inequities were discussed more frequently and race-based medical guidelines were being questioned and in flux. We believe that medical students have become more aware of and are more likely to consider the intersection between race and health outcomes and that their perceptions would influence their clinical practice. (Philips and Soltis describe this as the conceptual framework of knowledge construction and schemas.6)
Our objective was to investigate how often medical students included substance use on their differential diagnosis as a cause of cardiac arrest, depending on whether they interacted with a dark- or light-skinned manikin in the simulation lab. We hypothesized that students would be more likely to include substance use on their differential diagnosis regarding etiology of the cardiac arrest when performing the simulation on the darker-skinned manikin.
METHODS
This was a prospective, double-arm experimental study performed at a single academic institution. Eligible for inclusion in the study were all fourth-year medical students enrolled in the four-week emergency medicine (EM) course, along with EM-bound visiting students from other medical schools. Demographically, most residents (91%) of our institution’s catchment area identify as White, while 24% of our medical students identify as being from groups that are under-represented in medicine.
Students received an information sheet describing the study’s purpose. They were given the choice to opt out of the study but still complete the required educational simulation case. They were blinded to the fact that the manikin’s skin color was relevant to the study. All enrolled students participated in a manikin-based simulation to learn the basic concepts of Advanced Cardiac Life Support (ACLS). Two adult-sized manikins (of no specific age or sex) with different skin colors but identical functionalities were used.7 The light- and darkskinned manikins were alternated in each course section; thus, students were assigned to a manikin based on their course section enrollment. The case simulated a patient presenting as
Population Health Research Capsule
What do we already know about this issue? There is a knowledge gap of how bias based on skin color affects clinical decision-making.
What was the research question?
In a simulated cardiac arrest, would the manikin’s skin color influence medical students’ differential diagnosis?
What was the major finding of the study?
Whether the manikin was light- or darkskinned, only 20% of students listed substance use as a cause of cardiac arrest on their differentials (P = 1.00).
How does this improve population health? Exploring the effect of racial bias, represented by skin color, on clinical decision-making could lead to more equitable healthcare.
unresponsive and pulseless, with no contextual information provided. After the first shock was delivered, each student completed a deidentified research form with multiple blank spaces that allowed space to create an open-ended differential in order of likelihood, thereby limiting any leading bias.
Research coordinators entered the data into a Research Electronic Data Capture (REDCap) electronic data capture tool hosted at the University of Vermont.8,9 The primary outcome was the proportion of cases in which, substance use was included on the differential diagnosis. We used the term “substance use” to encompass substance use, drug overdose, or anything related to a toxicologic etiology. The secondary outcome was whether the student’s primary diagnosis related to substance use. We grouped the data by manikin skin color. Data forms were excluded if they were left blank, had been filled out by a non-medical student, or if they could not be associated with a particular manikin.
We compared the outcome using a two-tailed Fisher exact test. A P value of .05 was used to determine significance. A study team member blinded to the manikin skin-color assignment completed data analyses We then conducted a post-hoc power analysis.
The study was deemed exempt by the Institutional Review Board.
RESULTS
Eligible participants included 270 medical students, 38 of
Influence of Skin Color on Differential Diagnosis in Simulated Cardiac Arrest
whom were visiting from other medical schools. A total of 271 surveys were returned (Figure 1), and 75 were excluded. Of the remaining 196 surveys completed during simulations, 96 were completed by students using the light-skinned manikin and 100 by those who used the dark-skinned manikin.
As shown in Table 1, 20% of the students in each group (N = 39 total) listed substance use somewhere on the differential diagnosis as a cause for the simulated patient’s cardiac arrest. A post-hoc power analysis demonstrated that the proportion of cases in which substance use was included on the differential diagnosis in the dark-skinned manikin group would need to be 38% for 80% power.
DISCUSSION
In this study of fourth-year medical students participating in a simulated cardiac arrest case, we found no difference in their consideration of substance use as the etiology of the cardiac arrest based on manikin skin color. This study contributes to the medical education literature as there have been limited prior attempts to investigate whether there is a measurable effect of bias (predicated on the concept of knowledge constructivism) on clinical decision-making among healthcare professionals.6,10 Similar to the results of earlier published research, we found that manikin skin color
Figure 1. CONSORT-style flow diagram describing the population of medical students who participated in a simulated cardiac arrest case using dark- and light-skinned manikins. CONSORT, Consolidated Standards of Reporting Trials.
did not affect the differential diagnosis.5 We chose skin color as the independent variable to indirectly communicate and test the concept of racial bias in the simulation environment. We acknowledge that skin color cannot be conflated with race; however, it does function as a cue to indicate social differences, given that various identities are associated with stereotypical external presentations.
Racism, rather than race itself, serves as the foundation for disparities. Health inequities are primarily driven by structural racial bias, the physical environment, health behaviors, and social determinants.11 Medical schools play an active role in propagating racial health bias. Researchers often rationalize racial group differences and perpetuate them as “scientific fact” during the production and propagation of knowledge. As a result, students construct mental maps that can bias clinical practice.6 Educational spaces are often regarded as racially neutral because whiteness is “invisible” (“color blind”) and presumed normative. Clinical training modules and lecture materials extensively use white bodies for clinical representations, thus serving as the norm with which topics are learned. Racism and racist ideologies are reified via the medical curriculum when students learn to associate race with phenotypes, behaviors, and diseases. Even cultural competency instruction tends to describe the practices of “other” cultural/racial groups as opposed to White culture, reinforcing the standard of White customs.11 This ultimately positions “others” as a deviation from the norm, creating subliminal content for construction of cognitive schemas that can lead to implicit and/or explicit bias.6
This study demonstrates a weak relationship between skin color and bias—or premature closure—when considering the potential causes of cardiac arrest in a patient. Of note, it is concerning how infrequently substance use was considered in the medical students’ differential diagnoses. It is important that they be taught to consider substance use when managing unresponsive patients and those in cardiac arrest, as drug overdose deaths are a significant source of mortality in the U.S. The American Heart Association (AHA) guidelines prioritize performing cardiopulmonary resuscitation (CPR) in cardiac arrest.12 As outlined in AHA algorithms, if components of CPR are not delayed, naloxone can be administered along with standard interventions if depressed respiration and/or opioid ingestion is suspected to have played a role.13,14 Future research could focus on medical students’ subjective experience within the simulation environment to elucidate the factors leading to their formulation of a differential diagnosis.
LIMITATIONS
This study was completed at a single institution, limiting generalizability and external validation. The data collection form had an open-ended design, which led to inconsistencies in the data obtained. We did not control for medical student education on the topics of bias, race, or social disparities. This
Miller et al.
Influence of Skin Color on Differential Diagnosis in Simulated Cardiac Arrest
Table 1. Medical students’ differential diagnoses regarding the etiology of a simulated cardiac arrest in a study investigating whether manikin skin color influenced their perceptions.
Total Light- skinned Manikin Dark- skinned Manikin
Relative Risk (95% confidence interval) N =196 n = 96 n =100
P value
Primary Diagnosis related to SU 1% (1) 0% (0) 1% (1) 1.00 Undefined
Any differential diagnosis includes SU 20% (39) 20% (19) 20% (20) 1.00 1.01 (0.58, 1.77)
SU Absent from Differential 80% (157) 80% (77) 80% (80) 1.00 1.00 (0.87, 1.15)
SU, substance use.
may have affected how students, particularly visiting students, interacted with the simulation experience. We excluded approximately six months’ worth of data because of the inability to match data forms with manikin color, leading to decreased power. The age of the manikin/simulated patient was not disclosed or evident, which may also have affected the differential diagnoses created by the students.
CONCLUSION
Among fourth-year medical students who participated in a cardiac arrest simulation, we found no difference in their propensity to include substance use in their differential diagnoses, whether the manikin had dark- or light-colored skin. The overall rates of including substance use on their differentials for cardiac arrest were low (20%), regardless of manikin skin color, suggesting the need to increase student awareness of substance use as a possible cause of cardiac arrest.
Address for Correspondence: Hannah E. Miller, MD, University of Vermont Health, Robert Larner College of Medicine, Department of Emergency Medicine, 111 Colchester Avenue, EC2-406, Burlington, Vermont, 05401. Email: hannah.miller@uvmhealth.org.
Conflicts of Interest: By the WestJEM article submission agreement, all authors are required to disclose all affiliations, funding sources and financial or management relationships that could be perceived as potential sources of bias. No author has professional or financial relationships with any companies that are relevant to this study. There are no conflicts of interest or sources of funding to declare.
1. National Institute on Drug Abuse. Drug Overdose Deaths: Facts and Figures.. https://nida.nih.gov/research-topics/trends-statistics/
overdose-death-rates. August 21, 2024. Accessed February 20, 2025.
2. U.S. Centers for Disease Control and Prevention. State Unintentional Drug Overdose Reporting System (SUDORS). Final Data. Atlanta, GA: US Department of Health and Human Services, CDC; Available at: https://www.cdc.gov/overdose-prevention/data-research/ facts-stats/sudors-dashboard-fatal-overdose-data.html. Accessed February 25, 2025
3. Kariisa M, Davis NL, Kumar S, et al. Vital signs: drug overdose deaths, by selected sociodemographic and social determinants of health characteristics — 25 states and the District of Columbia, 2019–2020. Morb Mortal Wkly Rep 2022; 71:940–947.
4. Dehon E, Weiss N, Jones J, et al. A systematic review of the impact of physician implicit racial bias on clinical decision making. Acad Emerg Med 2017;24(8):895-904.
5. Al Alwan I, Magzoub ME, Al Haqwi A, et al. Do poor patients suffer from inaccurate diagnoses more than well-to-do patients? A randomized control trial. BMC Med Educ 2019;19(1):386.
6. Dong H, Lio J, Sherer R, et al. Some learning theories for medical educators. Med Sci Educ. 2021;31(3):1157-1172.
8. Harris PA, Taylor R, Thielke R, et al. Research electronic data capture (REDCap) – A metadata-driven methodology and workflow process for providing translational research informatics support. J Biomed Inform. 2009 Apr;42(2):377-381.
9. Harris PA, Taylor R, Minor BL, et al. The REDCap consortium: building an international community of software partners, J Biomed Inform. 2019 May 9
10. Featherston R, Downie LE, Vogel AP, et al. Decision making biases in the allied health professions: a systematic scoping review. PLoS One. 2020;15(10):e0240716.
11. Plaisime MV, Jipguep-Akhtar MC, Belcher HME. ‘White people are the default’: a qualitative analysis of medical trainees’ perceptions of cultural competency, medical culture, and racial bias. SSM - Qual Res Health 2023; 4:100312.
12. Lavonas EJ, Akpunonu PD, Arens AM, et al. 2023 American Heart Association focused update on the management of patients with
Influence of Skin Color on Differential Diagnosis in Simulated Cardiac Arrest
cardiac arrest or life-threatening toxicity due to poisoning: an update to the American Heart Association Guidelines for Cardiopulmonary Resuscitation and Emergency Cardiovascular Care. Circulation 2023;48(16).
Miller et al.
13. Cpr.Heart.Org, 2020 Algorithms. https://cpr.heart.org/en/resuscitationscience/cpr-and-ecc-guidelines/algorithms. Accessed 9 May 2025.
14. Saybolt MD, Alter SM, Dos Santos F, et al. Naloxone in cardiac arrest with suspected opioid overdoses. Resuscitation. 2010;81(1):42-46.
Impact Evaluation of a Clinical Point-of-care Ultrasound Intervention in an Academic Emergency Department
Alyssa Platt, MA*
Timothy Peterson, MD†
Erica Peethumnongsin, MD, PhD†
Maragatha Kuchibhatla, PhD*
Rebecca G. Theophanous, MD, MHSc†
Section Editor: J. Matthew Fields, MD
Duke University School of Medicine, Department of Biostatistics and Bioinformatics, Durham, North Carolina
Duke University School of Medicine, Department of Emergency Medicine, Durham, North Carolina
Submission history: Submitted November 8, 2025; Revision received March 4, 2026; Accepted March 11, 2026
Electronically published June 28, 2026
Full text available through open access at http://escholarship.org/uc/uciem_westjem DOI 10.5811/westjem.53918
Introduction: Point-of-care ultrasound (POCUS) can expedite patient diagnoses and improve procedural safety in emergency department (ED) patients. Nevertheless, clinical POCUS use lags in many ED sites nationwide, with only 40% of community physicians using POCUS according to a study from 2019-2021. We studied the impact of a multifaceted clinical POCUS intervention to address barriers and increase clinical POCUS use.
Methods: We conducted a prospective cohort study at a single academic hospital that included ED attendings, residents, and advance practice clinicians (APC). A multifaceted four-week intervention for emergency clinicians from December 2023–January 2024 addressed barriers to POCUS use identified on a pre- and post-intervention survey. The intervention included POCUS education during clinical shifts by ultrasound faculty, clinical POCUS workflow demonstration during resident conference/faculty meetings, and QR code reference files on machines for a total of two hours of additional training per clinician. The primary outcome was the number of clinical ED POCUS performed during the 18 months pre-intervention and 12 months post-intervention. Secondary outcomes were POCUS workflow knowledge exam scores and POCUS revenue. We analyzed clinical POCUS numbers from July 2022–December 2024 using an interrupted time series model.
Results: Forty-two of 99 emergency clinicians (42.4%) responded to surveys pre-intervention and 28 post-intervention (28.3%). Fifty-six physicians/APCs (56.6%) participated in the in-person POCUS intervention (17 attendings, 34 residents, 5 APCs). The unadjusted number of POCUS exams performed increased from 6,708 pre-intervention (18 months) to 11,600 post-intervention (12 months). After controlling for the underlying secular trend, we saw no effect of the intervention with no significant increase in overall number of POCUS exams performed per 100 ED patients after the intervention (mean level change = -0.81, 95% CI, -2.43 to 0.82; P = .33). Neither was there an increase in the slope of the secular trend post-intervention (difference in slope, β = 0.00, 95% CI, -0.10 to 0.10; P = .98 for post-intervention, β = 0.02, 95% CI, -0.08 to 0.12 for sustainability period). Monthly POCUS revenue increased ~$55,000 in total billed and $10,000 reimbursed (~16% reimbursement). This was the professional component only that was billed by the physician and not the technical component covering equipment and maintenance. Post-intervention mean knowledge scores were 88% correct (standard deviation 12.0) with 16/22 participants (72.7%) passing the assessment (score > 90%).
Conclusion: A multifaceted intervention was not shown to improve clinical point-of-care ultrasound use and revenue when accounting for an underlying sustained secular upward trend in number of POCUS exams performed per 100 emergency department patients throughout the study period. Future interventions directed toward low POCUS users and identification of clinical POCUS champions may improve clinical POCUS use. [West J Emerg Med. 2026;27(4)1023–1033.]
INTRODUCTION
Use of point-of-care ultrasound (POCUS) can improve patient care by expediting diagnosis in both medical and trauma emergency department (ED) patients.1,2 Studies show that POCUS use improves first-pass success in central line placement and other procedures and decreases complication rates.1,2 Emergency medicine (EM) guidelines recommend POCUS as a bedside clinical tool to improve patient care.3,4 Emergency ultrasound streamlines patient care workflows by reducing radiology orders and transport of critically ill patients, yielding improved ED and hospital throughput and cost efficiencies.1,5 Performing POCUS also improves patient satisfaction with direct hands-on interaction at the bedside.1,5
The American College of Emergency Physicians and the Accreditation Council for Graduate Medical Education guidelines require POCUS training and performance as a core diagnostic and procedural skill for residency graduation.3,4 Nevertheless, < 50% of faculty at most clinical sites in the United States are credentialed to teach and perform POCUS.1,6,7 Although EM is a leading specialty for POCUS education and training, many emergency physicians who trained prior to 2008 lack the necessary training and skills to clinically perform POCUS, creating a persistent gap between POCUS training and clinical use.1,6-9 Furthermore, Russell and Smalley et al found that community emergency physicians performed POCUS on only 40% of patients from 2019-2021 compared to 68% of academic physicians, despite adequate ultrasound equipment.10,11 Studies at the Veterans Affairs (VA) healthcare system and rural EDs have identified several important factors contributing to this gap in POCUS use. The most common barriers are lack of POCUS training (84% of VA sites in 2020), lack of a systemwide POCUS documentation and archiving program (35%), and lack of hospital resources or funding (28% lack funding for support staff and 50% for training). Fewer sites reported a lack of adequate POCUS equipment (29%).8,9,12-17
Multiple studies have sought ways to increase clinical POCUS uptake and use, but no standardized process exists. Mosier et al identified expert ultrasound faculty, simulation training, and regular review sessions as necessary to improve ultrasound training and use.2 Furthermore, Amini et al reported that 75% of the 70 nonacademic EDs included in their study did not have someone responsible for reviewing POCUS images for quality assurance (QA), and 50% of sites did not have a mechanism for archiving images, which are both areas for potential POCUS system improvements. Some studies have implemented an institution-specific POCUS program for EDs or inpatient services with variable success.18-22 Thus, additional studies are needed to address the barriers identified throughout the clinical POCUS pathway for a comprehensive program including image acquisition, documentation, archival, quality review, and billing processes.18-22
Population Health Research Capsule
What do we already know about this issue? Point-of-care ultrasound (POCUS) can expedite diagnoses and improve procedural safety, yet clinical use lags in hospitals nationwide.
What was the research question?
We studied the impact of a multifaceted clinical POCUS intervention to increase clinical POCUS use.
What was the major finding of the study? A program to enhance use of POCUS was not effective at increasing ultrasound scans performed per 100 patients (mean change = -0.81, 95% CI, -2.43 to 0.82; P = .33), or increasing professional revenue over general trends (+ 16%).
How does this improve population health? Future interventions directed toward identification of clinical POCUS champions may improve clinical POCUS use.
Objective
Our study objective was to evaluate the impact of a clinical POCUS intervention built using barriers and facilitators to POCUS use, which were identified by emergency physicians and advanced practice clinicians (APC) at a single academic hospital. Our goal was to increase the number of ED-performed clinical POCUS exams and revenue post-intervention, developing a model for future dissemination to other EDs and healthcare sites.
METHODS
Study Design
We performed a prospective cohort study from July 2022–December 2024 that identified barriers and facilitators to clinical POCUS use by EM attending and resident physicians and APCs working at a single academic hospital ED, which is described in a separate paper.23 To complement the prospective cohort study, we also conducted a retrospective analysis of electronic health data extracted from the ED POCUS Butterfly® archiving system beginning July 1, 2022 and including a sustainability period through December 31, 2024. The study was performed according to the Strengthening the Reporting of Observational Studies in Epidemiology (STROBE) guidelines24 (Supplemental File 1), The study was approved by the institutional review board (Pro00114618) and followed ethics guidelines.
Study Setting
We conducted this study at a single, tertiary-care, academic, Level I trauma center with 1,048 inpatient hospital beds, almost 85,000 annual ED visits, and 29.8% admissions (ED patients admitted to the hospital). The ED’s diagnostic ultrasound machines included two General Electric Healthcare Venue cart-based systems, three Sonosite M-Turbos, and two Sonosite Edges (with two new Sonosite X-porte machines added in July 2024). The ED also had three procedural vascular Sonosite Nanomaxx machines. The four Butterfly® IQ handheld ultrasounds with clinical capability were only used during educational sessions. The study site had an emergency ultrasound director and five emergency ultrasoundfellowship trained faculty. The EM program had 12 residents per academic year and 1-2 emergency ultrasound fellows. Epic Maestro Care was the electronic health record (EHR), and Butterfly® Network cloud was the POCUS manager for image storage and archival. Ultrasound faculty performed QA image review weekly for all clinical POCUS exams.
Selection of Participants
All clinicians working in the ED during the study period were invited to participate. The target study population included 45 attending physicians, 19 APCs, and 35 residents (postgraduate years [PGY] 1-3). All emergency physicians and APCs were invited to participate in both the surveys and training sessions with participation advertised via email, at weekly EM resident conference, and at monthly EM faculty meetings.
Data Collection
All ED attendings, residents, and APCs were emailed a secured REDCap survey (with a website link and QR code) pre- and post-intervention to assess their understanding of the ED clinical POCUS workflow and their opinions on barriers or potential facilitators for the process. The survey was created by ultrasound-content experts and based on validated surveys from other POCUS studies.18,19,21,25 Responses were based on a five-point Likert scale.
The clinical POCUS intervention is described in a prior paper. Briefly, we identified POCUS use barriers and facilitators at our facility with a pre-survey one month preintervention (November 2023). Then, over a four-week period emergency physicians and APCs underwent a multifaceted training intervention to address these barriers. This training involved the following: 1) emailing an online presentation and creating QR codes with a reference document outlining the standardized POCUS image acquisition and archival process; 2) presenting the current clinical POCUS workflow process at an ED faculty meeting, faculty development session, and EM resident conference day; and 3) ultrasound faculty leading an in-person demonstration of the clinical POCUS process for small groups of emergency clinicians during clinical shifts.
We invited emergency physicians and APCs to participate in a six-month post-intervention survey including a knowledge exam to obtain feedback on the POCUS intervention and assess workflow improvements (Supplemental File 2).
Ultrasound faculty extracted data from the Butterfly® ultrasound clinical archiving system on the number and type of POCUS exams done in the ED; subsequently, authorized administrative support staff in the ED. extracted clinical POCUS billing data for the study team. Daily ED patient volume was obtained from ED administrative leadership.
Study Outcomes
Our primary outcome measure assessing the impact of the POCUS program intervention was the number of clinical POCUS exams performed by emergency physicians and APCs (per 100 patients) during three distinct periods including pre-intervention (July 1, 2022–December 18, 2023), post-intervention (December 19, 2023–June 30, 2024), and a sustainability period (July 1–December 31, 2024) as measured by counts of POCUS exams saved to Butterfly® software. Additional outcomes included the type of clinical POCUS exams being performed, ED POCUS billing and reimbursement data, self-perceived POCUS frequency, and a knowledge assessment on clinical POCUS workflow. We hypothesized that clinical ED POCUS use would increase post-intervention.
Data Sources
We used Epic Maestro Care to obtain the daily number of ED patient visits and Butterfly® Network software to review POCUS exams performed in the ED. Surveys built using the institution’s secured REDCap server were emailed to emergency clinicians pre-intervention in November 2023 and six months post-intervention in June-August 2024, with reminders sent weekly for two weeks. We retrospectively obtained ED clinical POCUS billing data from administrative and support staff six months post-intervention.
Bias
Our principal investigator (RGT) wrote the survey, and to reduce bias it was edited by ED ultrasound faculty experts who were not study team members. The survey was modeled after ultrasound surveys used and tested in other published studies. 16-18,25 The survey was pilot tested with an emergency physician at another local institution with research training who was not eligible for the study.
Participants were enrolled with implied consent after reading the study information sheet with the REDCap survey link emailed by the PI. All participation was voluntary with participant withdrawal allowed at any time. Only study personnel had access to data, which was secured in an institutional database as per standard research protocols. Participant names and dates linked pre-/post-intervention
Platt
survey data to assess for improvement after the POCUS intervention and were necessary for analysis of responses and to maximize process improvements. Survey data was deidentified by the study PI and coded with a key for biostatistician review and analysis. All POCUS studies are saved within the institution’s approved and secured Butterfly® cloud system and written reports in Epic Maestro Care as part of standard clinical care. Deidentified data was presented to the ED group for feedback and process improvements.
We evaluated our POCUS intervention using Kirkpatrick’s levels of learning, assessing participants’ reaction to the POCUS intervention through REDCAP surveys and their learning through an 11-question multiple-choice knowledge assessment on clinical POCUS workflow. We evaluated behavior via in-person observed demonstrations of faculty completing a clinical POCUS exam during on-shift teaching. Finally, we reviewed ED POCUS program costs and revenue.26
Statistical Methods
We summarized patient characteristics and descriptive outcomes using means (with standard deviations) and medians (within interquartile range) for continuous variables and counts with percentages for categorical variables. Survey data collected both pre- and post-intervention were summarized by time period. We summarized time series analyses descriptively by aggregated time period (ie, weeks for POCUS data or months for billing data).
We analyzed our primary outcome—the number of Butterfly® POCUS exams performed—using interrupted time series models with exams aggregated to weekly counts, divided by total weekly ED patient volume, and scaled to number of exams per week per 100 ED patients. Multiple types of POCUS exams performed during the same saved Butterfly® session were counted as separate exams. We extended the time series back one year and six months prior to the start of the intervention (ie, starting in July 2022) to better estimate a secular trend and control for any seasonal fluctuations in exam rates. Interrupted time series models were implemented using linear regression models with a fixed effect for secular trend (ie, weeks from July 1, 2022), an indicator for post in-person training, and a fixed effect for number of weeks from the end of the training period that took a value of zero before the training period and count of weeks after the training period.
Similarly, we included indicator and week count fixed effects for the sustainability period. We reported the regression constant and indicator for post-training and sustainability periods to quantify rates at the beginning of the study period, post-training, and sustainability periods, respectively. We reported parameter estimates for the secular trend and a linear combination of secular trend and post-intervention trends to quantify slopes pre- and post-intervention. To aid in interpretation of time series analysis, we plotted observed
weekly rates (per 100 ED patients) alongside fitted regression lines for pre- and post-training periods. We excluded exam rates between December 19, 2023–January 31, 2024 (ie, the training period) from analysis because the intervention had not been fully implemented and its relatively short duration precluded reliable estimation of a separate time trend. To ascertain whether regressions needed to incorporate autoregressive error structure, we used a Breusch-Godfrey test for higher order serial correlation to test for up to six lags, and we computed the Durbin-Watson d statistic to confirm firstorder serial correlation (if present).27,28
Missing data from blank responses on surveys are reported in results tables. Characteristics of respondents were compared by survey response pattern (ie, responded to both pre- and post-surveys versus responding to one or the other) to add context to pre/post results and potential impact of missing data via non-response. We calculated P values using an alpha of 0.05 for statistical significance. With only one primary outcome, no adjustments were made for multiple testing. All analyses were performed using Stata v19 software (StataCorp, LLC, College Station, TX).
RESULTS
Characteristics of the Study Subjects
In the 18-month pre-intervention to six-month postintervention plus six-month sustainability period from July 1, 2022–December 31, 2024, a total of 128,468 adult ED patients were seen and 18,308 POCUS exams were performed. Of 103 emergency physicians and APCs, four attendings were on the study team and ineligible for the survey to prevent bias. Forty-two eligible clinicians (42.4%) responded to the preintervention survey, including 26 EM attendings (59.1% of eligible), 14 EM residents (38.8% of eligible), one APC (5.3% of eligible), and one unidentified user. The post-intervention survey had 22 analyzable responses (22.2% of eligible) after removing six duplicate responses. Additional participant survey characteristics are described in the prior paper and in Table 1.23 Attendance at the in-person training was 60 total (17 attendings, 35 residents, six APCs) among 54 individual participants and 17 sessions, with attendance ranging from 1-12 individuals per session.
Per survey responses, there were 26 male participants (51.0%), 25 female (49.0%), 9 Hispanic/Latin/x/Spanish origin (18.8%), with mean age 35 (SD 7.6) (range 29-38 years of age), and a mean 8.0 years (7.5) of clinical work in EM (range 2.2-10 years). Fourteen participants (26.9%) reported fellowship training. Responses per level of training included the following: three APCs (5.8%); six PGY-1 residents (31.6%); seven PGY-2 (36.8%), six PGY-3 residents (31.6%); no fellows; and 30 attending physicians (57.7%) (Table 1). Characteristics of the 42 pre-intervention and 22 post-intervention survey respondents were largely similar, with more respondents having fellowship training and POCUS training in residency.
Table 1. Characteristics of survey participants by survey response pattern in a study to assess the impact of a clinical intervention to address barriers and increase clinical point-of-care ultrasound use.
One Survey (n = 42) Both
Number of years in clinical practice working in the emergency department (including residency/fellowship)
Number of POCUS personally performed in residency training
Survey Observation Pattern
*Percentages associated with PGY-1, PGY-2, and PGY-3+ residents are calculated with a denominator of all residents.
**Fellowships completed: health services research, emergency medical services, sports medicine, hyperbaric and undersea medicine, geriatric emergency medicine, emergency ultrasound.
PGY, postgraduate year; POCUS, point-of-care ultrasound; SD, standard deviation.
Objective Use of Point-of-care Ultrasound (Butterfly® Data and Billing Data)
Excluding those performed during the training period, there were 18,308 POCUS exams performed from July 1, 2022–June 30, 2024, with 5,720 (31.2%) recorded in “draft” status and 12,066 (65.9%) with “finalized” status (Supplemental Table 1). The most common diagnostic exam type was cardiac (n = 4,042 scans, 36.1% of diagnostic exams), while the most common procedural guidance POCUS type was for paracentesis (n = 121, 55.3% of procedural guidance exams). There was little
difference seen in types of diagnostic or procedural guidance POCUS, except for a modest increase in the proportion of POCUS exams that were cardiac in the sustainability period and a modest decrease in proportion of exams with finalized status in the sustainability period (Figure 1). At our site we do not save images for vascular access; thus, those numbers are not reported under procedures. All clinical POCUS exams (100%) are archived in Butterfly® Durbin Watson and Breusch-Godfrey tests showed no evidence of autocorrelation of errors; thus, we used a simple
Figure 1. Diagnostic and procedural Butterfly® point-of-care ultrasound exam types and exam status by study period.
*We excluded the following diagnostic exam types with low frequencies: one appendix exam in the pre-intervention period, one in the sustainability period, and none in the post-intervention period); 13 obstetrics/gynecology exams in the pre-intervention period, and none in the post-intervention or sustainability periods; and one pediatric abdomen exam in the pre-intervention period and none in the postintervention or sustainability periods.
ordinary least squares regression with robust standard errors and no additional autoregressive error structure. Rate of POCUS per 100 ED patients at week 0 (ie, July 1-7, 2022) was 3.88 (95% CI, 3.09–4.66), and there was evidence of a sustained secular upward trend in exams per 100 ED patients during the pre-intervention period (pre-intervention slope, β = 0.03, 95% CI, 0.01–0.04; P < .001) (Table 2).
After controlling for the underlying secular trend, there was no significant increase in overall level of POCUS per 100 ED patients after the intervention (mean level change = -0.81, 95% CI, -2.43 to 0.82; P = 0.33) and no increase in the slope of the secular trend post intervention (difference in slope, β = 0.00, 95% CI, -0.10 to 0.10; P = .98 for post-intervention; difference in slope, β = 0.02, 95% CI, -0.08 to 0.12 for sustainability period). Level is defined by the overall mean number of POCUS during a particular time frame. Raw and fitted values for the time series are visualized in Figure 2.
Approximately 16.5% of finalized studies were QA reviewed pre-intervention and 22.5% post-intervention.
Table 2. Interrupted time series linear regression analysis preand post-intervention in a study to assess the impact of a clinical intervention to address barriers and increase clinical point-of-care ultrasound use.
Mean Level Change (95% CI) P value
POCUS per 100 ED patients at week 0 3.88 (3.09 to 4.66) < .001
Slope: Pre-training 0.03 (0.01 to 0.04) < .001
Level change: Post-training -0.81 (-2.43 to 0.82) .329
Slope change: Post-training 0.00 (-0.10 to 0.10) .978
Level change: Sustainability -2.46 (-4.91 to -0.00) .050
Slope change: Sustainability 0.02 (-0.08 to 0.12) .756
Slope: Post-Training 0.03 (-0.07 to 0.13) .540
Slope: Sustainability Period 0.04 (-0.06 to 0.15) .385
*Training period from December 2023-January 2024 was excluded from analysis.
**Durbin Watson statistic = 1.75, Breusch-Godfrey P value (first lag) = .179.
Figure 2. Raw point-of-care ultrasound exam counts (all types) with fitted linear regression lines pre- and post-intervention in a study to assess the impact of a clinical intervention to address barriers and increase clinical point-of-care ultrasound use. ED, emergency department; POCUS, point-of-care ultrasound.
Concomitant with the percentage increase in number of clinically billed POCUS exams, amounts billed and reimbursed for POCUS also increased over the course of the six months prior to. and six months post intervention (Supplemental Figure 2). Overall, post-intervention monthly POCUS revenue increased ~$55,000 in total billed and $10,000 reimbursed (approximately 16% reimbursed). However, the causal linkage between the intervention and financial impact is unclear without interrupted time series modeling.
Intervention Evaluation and Knowledge Scores
Mean knowledge scores on post-surveys were 88% correct (SD 12.0) with 16 participants (72.7%) passing the assessment (score > 90% or a score of ≥ 10 correct answers) (Table 3).
The most frequently missed knowledge test questions were number of days to complete and sign a study before it disappears (n = 11 correct, 50%) and requirements to perform and document an educational POCUS (n = 16 correct, 72.7%) (Supplemental Figure 3).
Post-intervention, 17 of 22 (81%) respondents found the POCUS education/training intervention (which included ultrasound faculty live demos on shift, PowerPoint/online presentation, and QR codes to reference material reviewing ultrasound machine use and Butterfly® documentation) to be useful. Eight respondents (36.4%) found the training intervention very useful, six (27.3%) somewhat effective, eight (28.6%) felt neutral about the intervention, and two respondents thought it was somewhat ineffective(Table 3).
DISCUSSION
Our POCUS intervention did not show a statistically
Table 3. Post-intervention evaluation participant survey responses on clinical emergency department point-of-care ultrasound training and knowledge scores in a study to assess the impact of a clinical intervention to address barriers and increase clinical point-of-care ultrasound use. Total (N = 22)
Did you find the ultrasound educational/ training intervention useful?
Did you find the ultrasound intervention teaching format to be effective?
Very effective 8 (36.4%)
Somewhat effective 6 (27.3%)
Neutral 6 (27.3%)
Somewhat ineffective 2 (9.1%)
Since the POCUS intervention (1 month ago), do you feel like your ultrasound use
Significantly increased 3 (13.6%)
Somewhat increased 10 (45.5%)
Stayed the same 9 (40.9%)
Percentage correct knowledge questions
(SD)
(Q1, Q3)
Passed knowledge exam
No (0-9)
Correct (≥ 10)
6 (27.3%)
16 (72.7%)
POCUS, point-of-care ultrasound; SD, standard deviation.
significant change in mean level of POCUS use per 100 patients post-intervention after adjusting for a secular trend with increasing numbers of POCUS exams performed throughout the study period. The ED leadership and faculty development sessions have focused on increasing ED POCUS use over the past 2-3 years, potentially contributing to the positive POCUS use slope leading into the intervention period. Thus, the ongoing longitudinal POCUS teaching at education conferences and faculty development sessions made it difficult to isolate the dependent effect of the discrete POCUS training intervention.
The combined in-person plus online training format was similar to the intervention reported by Schnittke et al, integrating in-person resident education on POCUS documentation and archiving.18 However, that study was limited to EM residents, whereas we also included attendings and APCs as regular clinical POCUS users. Additional studies support hands-on learning as the mainstay of POCUS education.19,21 Russell et al found that 87% of medical students had increased confidence in identifying the gallbladder and performing a cardiac exam and 98% reported increased confidence with performing a focused assessment with sonography in trauma (FAST) exam after learning POCUS through hands-on integration into anatomy, physical examination skills, and clerkship courses.1
In contrast to community EDs where POCUS knowledge is identified as a major barrier, our study found high mean knowledge scores (88% correct), with 16 participants passing the assessment (> 90% correct).6,7,10,11 Results suggest POCUS workflow knowledge retention at six months post-intervention, although we do not have further sustainability data. Janjigian et al also found POCUS knowledge and skill retention (knowledge median score of 85% post-course to 81% at 12 months post-intervention and hands-on image acquisition skills median score 75% post-course to 74% at 12 months post-course) in 23 hospitalists at four clinical sites after participating in a two-day hands-on POCUS course plus longitudinal phase curriculum.21 The academic hospital environment with continuous resident training, frequent lectures, and hands-on education sessions likely contributed to the increased comfort with POCUS reported by participants. Nevertheless, a gap remains between POCUS education and clinical POCUS use, which is true at most clinical sites nationwide.8,12-14 When reviewing our clinical POCUS data, we found that almost 30% of clinical POCUS exams remained in draft status (eg, the worksheet was incomplete or the study was unsigned, preventing it from being published in the clinical chart or from being billed). A small percentage of studies were “pending attestation” (about 2% pre-intervention and 3% post-intervention), which means the EM resident or APC saved their POCUS images and completed the exam worksheet, but an attending physician did not sign it. Therefore, the images could not be published in the EHR and be billed. Also, participants reported sometimes performing
POCUS without saving images on the machine (eg, “phantom” exams). These workflow problems create an opportunity for individualized feedback focusing on emergency clinicians who are performing fewer POCUS exams and not completing the process. The same problem is shared across POCUS leadership and hospital sites nationwide; thus, additional work is needed to better understand where the breakdown in workflow processes is occurring and how it can be improved.2,12-14,18
Regarding intervention impact evaluation, most respondents (17/22) found the POCUS education/training intervention to be useful (eg, in-person plus online reminders of the clinical workflow process). Additional repetitive sessions could further bolster reinforcement and likely increase clinical POCUS uptake. Our prior studies done with clinicians of mixed training backgrounds (internal, family, and emergency medicine) at the VA hospital found strong support for peer influences and feedback as facilitators to POCUS use.17 Similar positive reinforcement could be implemented at our ED site. Furthermore, identification of POCUS champions has increased POCUS use in other studies, including at the VA hospital, and could be promoted to remind people about appropriate POCUS use.17,19,29
The most common diagnostic exams performed are cardiac (about 36%), extended € FAST (about 16%), biliary (about 9%), and aorta (about 6%). The number of these exams, particularly cardiac and eFAST, are likely higher than would be seen at a community ED. This is partially because our academic institution’s patients can be seriously ill with recent surgical or invasive procedures, frequent malignancy, organ transplant, or subspecialty population rates, and increasing complexity of transferred patients. Furthermore, our hospital’s status as a Level I trauma center increases the proportion of exams evaluating for trauma such as cardiac, lung, and eFAST, necessitating performance of these POCUS exams.
The most common procedural applications were paracentesis (almost 54%) and abscess drainage (17-21%), which are also common ultrasound-guided procedures being performed at VA and community EDs.6,7,14,17 Ultrasoundguided vascular access is also a common indication, but numbers could not be reported because those images are not saved at our site. Therefore, the types of POCUS exams being performed will be guided by the local ED environment to facilitate both expedited diagnosis and safer procedures.
Our recent parallel study at the local VA involved clinicians of mixed training backgrounds and focused only on ED attending physicians plus one APC, identifying a statistically significant increase in clinical POCUS exams from 72 to 267 performed in six months.17 The lack of statistical significance for our current study could be because all clinicians were EM-trained here, potentially starting at a higher baseline rate of POCUS knowledge and skills. Furthermore, the clinical environment of EM residents eager
to learn and perform procedures may have increased the overall number of POCUS exams. Both studies support standardized ED POCUS documentation and an archiving system, with simple steps to perform the POCUS exam and a clear documentation protocol.13,15,17 Future studies should address time constraints on shift, ease of locating machines with designated storage areas, and repetitive or longitudinal POCUS training opportunities.30-32
Finally, a comprehensive POCUS system costs money to establish and maintain but can generate revenue for physicians and the healthcare system.32,33
Estimated costs for a comprehensive POCUS program based on prior clinical and administrative data include 0.25 faculty hours for a POCUS director for 12 months; approximately $15,000 to host a large-group POCUS training course for 20-25 participants; an estimated $100,000 for two cart-based diagnostic machines and one vascular access machine; and between $50,000-$100,000 for an ultrasoundarchiving software license, implementation, and five-year maintenance costs.17 Although the causal linkage between the intervention and financial impact is unclear without interrupted time series modeling, the numerous POCUS studies still in draft status signifies high potential revenue loss both pre-intervention (1,869/6,708 studies, 27.9%) and post-intervention (727/2,603, 27.9%). Other studies that have performed financial analysis of POCUS systems show significant cost savings and program effectiveness through increased use of POCUS, decreased number of radiology studies, and improved ED length of stay and hospital throughput.32,33 Thus, establishing and maintaining a clinical POCUS system should be beneficial to healthcare facilities.
LIMITATIONS
The single academic hospital setting limits study generalizability, but this study design was chosen to improve current barriers in our site’s ED. While the self-selected sample method may have introduced bias, it was used to maximize study participation and was a department-wide quality improvement initiative. The small sample size limits scalability and power, and the low survey response rate may have skewed results. People who were not motivated to complete the surveys may not be interested in performing POCUS or participating in improving the clinical ED POCUS workflow. Furthermore, the low post-intervention survey response rate and different survey sample pre- to postintervention has few respondents with paired data. This limits within-person change analysis and limits conclusions about educational impact. Also, the lack of pre-intervention knowledge and technical skills scores limits assessment of improvement post-intervention. Surveys were adapted from previously published studies and developed by the study PI with review from expert ultrasound faculty. Survey validation, reliability testing, and item analysis were not performed in this
specific hospital setting or with this study population group. Therefore, conclusions from survey and knowledge assessments are limited.
The APCs had few survey responses and low clinical POCUS use, perhaps because APCs do not attend resident education conference, where we teach POCUS once a month. Also, APCs work shifts in the clinical observation unit or fast-track ED areas, where they may not have a direct supervising attending physician to perform POCUS clinically. Extrinsic factors such as problems with ED and hospital boarding and variability in staffing models and ED personnel per day/month can affect study data results and ED workflow, which may contribute to decisions on whether to perform POCUS. The surveys were de-identified to prevent unintended work influence and bias. Thus, emergency clinicians did not receive direct feedback to improve their POCUS use unless they participated during clinical shift in-person education.
We are planning a targeted training approach for emergency physicians with the most clinical hours and fewest POCUS exams performed, conducting individualized in-person learning sessions to further improve clinical ED POCUS use and documentation. Finally, protocol dissemination at additional sites can compare or contrast POCUS barriers and facilitators and adapt the intervention for each site.
CONCLUSION
A multifaceted point-of-care ultrasound intervention with in-person teaching, an accessible reference document, and image-based learning tool did not significantly increase mean level of clinical ED POCUS use per 100 ED patients postintervention after adjusting for an underlying secular positive trend. Detecting incremental intervention effects in academic systems with ongoing culture and educational initiatives is difficult. Future studies can incorporate individualized interventions for infrequent POCUS users or institutional-wide initiatives with POCUS clinical champions to achieve clinical POCUS improvements.
Address for Correspondence: Rebecca G. Theophanous, Duke University School of Medicine, 2301 Erwin Road, Durham, NC, 27710. Email: rebecca.theophanous@duke.edu.
Conflicts of Interest: By the WestJEM article submission agreement, all authors are required to disclose all affiliations, funding sources and financial or management relationships that could be perceived as potential sources of bias. No other author has professional or financial relationships with any companies that are relevant to this study. There are no other conflicts of interest or sources of funding to declare.
1. Russell FM, Kennedy SK, Rood LK, et al. Design and implementation of a basic and global point of care ultrasound (POCUS) certification curriculum for emergency medicine faculty. Ultrasound J. 2022 Feb 19;14(1):10.
2. Mosier JM, Malo J, Stolz LA, et al. Critical care ultrasound training: A survey of US fellowship directors. J Crit Care. 2014;29(4):645-649.
3. American College of Emergency Physicians. ACEP guidelines Policy Statement. Ultrasound guidelines: Emergency, Point-of-care, and clinical ultrasound guidelines in medicine. 2023. Available at: https:// www.acep.org/siteassets/new-pdfs/policy-statements/ultrasoundguidelines--emergency-point-of-care-and-clinical-ultrasoundguidelines-in-medicine.pdf. Accessed June 9, 2024.
4. ACGME Program Requirements for Graduate Medical Education in Diagnostic Radiology. Accreditation Council for Graduate Medical Education (ACGME) guidelines. 2020. Available at: https://www. acgme.org/globalassets/pfassets/programrequirements/420_ diagnosticradiology_2021.pdf. Accessed June 9, 2024
5. Choi YJ, Jung JY, Kwon H. Effectiveness of ultrasound education in point-of-care ultrasound-assisted physical examinations in an emergency department: a before-and-after study. Medicine. 2017;96:25(e7269).
6. Amini R, Wyman MT, Hernandez NC, et al. Use of emergency ultrasound in Arizona community emergency departments. J Ultrasound Med. 2017;36(5):913–21.
7. Moore CL, Molina AA, Lin H. Ultrasonography in community emergency departments in the United States: access to ultrasonography performed by consultants and status of emergency physician-performed ultrasonography. Ann Emerg Med. 2006;47(2):147-53.
8. Sanders JL, Noble VE, Raja AS, et al. Access to and use of point-ofcare ultrasound in the emergency department. West J Emerg Med. 2015;16(5):747-52.
9. Stein JC, River G, Kalika I, et al. A survey of bedside ultrasound use by emergency physicians in California. J Ultrasound Med. 2009;28(6):757-63.
10. Russell FM, Ferre RM, Kennedy SK, et al. Emergency Medicine Faculty Utilization of Point-of-Care Ultrasound in the Clinical Setting. Cureus. 2025;17(2):e78868.
11. Smalley CM, Simon EL, Muir MR, et al. A Real-World Experience: Retrospective Review of Point-of-Care Ultrasound Utilization and Quality in Community Emergency Departments. West J Emerg Med. 2023;24(4):685-692.
12. Feng W, Ye X, Lv H, et al. Current use and training needs of point-of-care ultrasound in emergency departments: a national survey of VA hospitals. Am J Emerg Med. 2019;1784-1805.
13. Boyd JS, LoPresti CM, Core M, et al. Current use and training needs of point-of-care ultrasound in emergency departments: A national survey of VA hospitals. Am J Emerg Med. 2019;37(9):1794-1797.
14. Resop DM, Basrai Z, Boyd JS, et al. Current use, training, and barriers in point-of-care ultrasound in emergency departments in
2020: A National Survey of VA hospitals. Am J Emerg Med. 2023; 63:142–146.
15. Remskar MH, Theophanous RG, Bowman A, et al. Current use, Training, and Barriers of Point-of-care Ultrasound in Anesthesiology: A National Survey of Veterans Affairs Hospitals. Journal of Cardiothoracic and Vascular Anesthesia. J Cardiothorac Vasc Anesth. 2023;37(8):1390-1396.
16. Theophanous RG, Tupetz A, Ragsdale L, et al. A qualitative study of perceived barriers and facilitators to point-of-care ultrasound use among Veterans Affairs Emergency Department providers. PLoS One. 2024;19(11): e0310404.
17. Theophanous RG, Staton CA, Ragsdale LC, et al. Co-designed point-of-care ultrasound program development and implementation at a Veterans Affairs emergency department. Intern Emerg Med. 2026;252-263.
18. Schnittke N, Damewood S. Identifying and Overcoming Barriers to Resident Use of Point-of-Care Ultrasound. West J Emerg Med 2019;20(6):918-925.
19. Russell FM, Herbert A, Ferre R, et al. Development and implementation of a point-of-care ultrasound curriculum at a multi-site institution. Ultrasound J. 2021,13:9
20. Hayward M, Chan T, Healey A. Dedicated time for deliberate practice: one emergency medicine program’s approach to point-of-care ultrasound (POCUS) training. CJEM. 2015;17(5):558-561.
21. Janjigian M, Dembitzer A, Srisarajivakul-Klein C, et al. Design and evaluation of the I-SCAN faculty POCUS program. BMC Med Educ. 2021,21:22.
22. Thompson B, Schoenfeld E, Westafer L, et al. Implementation of an automated, user-centered point-of-care ultrasound workflow improves documentation and billing. Acad Emerg Med. 2023;(30)3:180-186.
23. Theophanous RG, Platt A, Peterson T, et al. Prospective Cohort Study Identifies Barriers to Point-of-care Ultrasound use in an Academic Emergency Department. medRxiv 2025;25334181.
24. Von Elm E, Altman DG, Egger M, et al. The Strengthening the Reporting of Observational Studies in Epidemiology (STROBE) Statement: guidelines for reporting observational studies. Ann Intern Med. 2007;147(8):573-577.
25. Kern J, Scarpulla M, Finch C, et al. The assessment of point-of-careultrasound (POCUS) in acute care settings is benefitted by medical school integration and fellowship. J Osteopath Med. 2023;123(2):6572.
26. Neubauer R, Recker F, Bauer CJ, et al. The Current Situation of Musculoskeletal Ultrasound Education: A Systematic Literature Review. Ultrasound Med Biol. 2023;49(6):1363-1374.
27. Godfrey, LG. Testing Against General Autoregressive and Moving Average Error Models when the Regressors Include Lagged Dependent Variables’ Econometrica. 1978;46:1293-1301
28. Durbin, J and Watson GS. 1950. Testing for serial correlation in least squares regression. I. Biometrika. 37;409-428.
29. Flanagan ME, Plue L, Miller KK, et al. A qualitative study of clinical champions in context: Clinical champions across three levels of acute
Platt et al.
Impact Evaluation of a Clinical POC Ultrasound Intervention in an Academic ED care. SAGE Open Med. 2018;6:2050312118792426.
30. Melton M, Rupp JD, Blatt MI, et al. Description of the Use of Incentives and Penalties for Point-of-Care Ultrasound Documentation Compliance in an Academic Emergency Department. Cureus. 2021;13(7):e16199.
31. Conner S, Anstey JE, Jensen T, et al. Pocus training for hospitalists: results from a novel tiered training program. Abstract published at Hospital Medicine 2020, Virtual Competition. Abstract 357. J Hosp
Med. https://shmabstracts.org/abstract/pocus-training-for-hospitalistsresults-from-a-novel-tiered-training-program/. June 11th 2024.
32. Adhikari S, Amini R, Stolz L, et al. Implementation of a novel point-of-care ultrasound billing and reimbursement program: fiscal impact. Am J Emerg Med. 2014;32(6):592-5.
33. Soremekun OA, Noble VE, Liteplo AS, et al. Financial impact of emergency department ultrasound. Acad Emerg Med. 2009;(16)7:674-680.
Increase in Ultrasound-guided Nerve Blocks Observed After Implementation
Aurora Jin, MD*
Allison Cohen, MD*
Aileen Virella, DO†
Nicholas Bielawa, DMSc, PA-C*
Martin Miller, MD‡
Mathew Nelson, DO*
Section Editor: Robert Ehrman, MD
of a Nerve Block Supply Cart in the
Emergency Department
North Shore University Hospital, Department of Emergency Medicine, Manhasset, New York
Plainview Hospital, Department of Emergency Medicine, Plainview, New York
North Shore University Hospital, Department of Anesthesiology, Manhasset, New York
Submission history: Submitted November 11, 2025; Revision received February 20, 2026; Accepted February 21, 2026
Electronically published July 16, 2026
Full text available through open access at http://escholarship.org/uc/uciem_westjem DOI 10.5811/westjem.53900
Introduction: Ultrasound-guided nerve blocks (UGNB) are an effective and safe method of pain control that are increasingly used for pain management in the emergency department (ED). However, performing these procedures is often time-intensive due to the need to locate and gather necessary supplies. Our ED recently implemented use of a nerve block cart, which contains all the supplies needed for performing a nerve block. Our objective in this quality improvement study was to assess whether the presence of an ED nerve block supply cart was associated with an increase in the number of UGNBs performed.
Methods: We conducted a retrospective review of point-of-care ultrasound examinations performed in a single academic quaternary-care community ED over 22 months, looking at 11-month time periods before and after implementation of an ED nerve block supply cart in March 2023. Our primary outcome measure was documentation of a UGNB, and our secondary outcome measure was the type of UGNB performed.
Results: We reviewed 14,321 ultrasound exams over 22 months—11 months pre-cart (6,853) and 11 months post-cart (7,468) implementation. We noted a statistically significant increase in the number of UGNBs, from 21 performed in the pre-cart period (0.31% of all ultrasound exams [95% CI, 0.17- 0.43%], to 50 UGNBs in the post-cart period (0.67% of all ultrasound exams [95% CI, 0.460.86%], P < .01). The fascia iliaca block was the most common UGNB performed in both the pre(52.4%) and post-cart (62.0%) periods.
Conclusion: We found that the deployment of an ED nerve block supply cart was associated with an increased number of ultrasound-guided nerve blocks performed by emergency clinicians in our hospital. [West J Emerg Med. 2026;27(4)1034–1038.]
INTRODUCTION
Ultrasound-guided nerve blocks (UGNB) are an effective method of pain control, and they are increasingly becoming a core component of multimodal pain management in the emergency department (ED).1,2 A survey of academic EDs
with ultrasound fellowships found a 16% increase in the number of EDs that reported performing UGNBs from 2016 to 2022.1,2 A literature review also demonstrated an increasing number of academic publications discussing UGNBs between 2003–2025, with two-thirds of all articles published since
2020.3 Effective procedural setup is key to performing UGNBs, and the availability of specialty supplies, such as nerve block needles, anesthetic, and intralipid, improves the success of ED nerve block programs.4,5 To date, no emergency medicine literature has documented whether efforts to improve procedural setup and access to supplies increases the number of UGNBs performed in the ED.
In March 2023, our ED and anesthesiology service jointly implemented a quality improvement (QI) project to facilitate emergency clinician performance of UGNBs; the QI project entailed the creation of an ED nerve block cart, which holds all the supplies needed to perform a UGNB. A standard medical supply cart with six drawers includes long- and short-acting anesthetics, nerve block needles, intralipid, syringes and regular needles, sterile ultrasound gel, and sterile gloves. (For exact supplies, see Table 1.) The cart is stationed in a central zone of the ED and is jointly stocked by the anesthesiology department. The information on charges for cart supplies was provided by our ED supply distribution operations coordinator and the anesthesiologist who handles stocking of the anesthetics. Cart contents were determined based on hospital anesthesiology policy and emergency clinician recommendations regarding the size of block needles. The primary objective of this QI project was to determine whether having an ED nerve block cart was associated with an increased number of UGNBs performed.
METHODS
We conducted a retrospective quality review of all point-ofcare ultrasound (POCUS) exams performed in a single, quaternary-care, academic-affiliated ED from April 1, 2022–January 31, 2024. We referenced the SQUIRE 2.0 guidelines to ensure that our study meets established standards for QI research.6 The study was conducted with the assistance of our emergency ultrasound division. We chose to review POCUS imaging to identify UGNBs performed and interpret this number in the context of all scans performed in our ED, which has many ultrasound-trained clinicians. Per departmental policy, all UGNBs must be performed by a credentialed clinician, images and/or clips must be saved, and a procedure note must be documented in the electronic health record (EHR) noting the type and amount of anesthetic used. Thus, all UGNBs were performed either by credentialed clinicians, which included the study authors, or directly under their supervision.
We further describe below elements of optimal retrospective chart review that we adhered to, as delineated in Worster and Bledsoe 2005.7 Our sampling method was as follows: We reviewed all POCUS exams performed in the ED for UGNBs—our dependent variable—over 22 months, representing 11 months prior to (pre-cart) and 11 months after (post-cart) nerve block cart implementation—our independent variable. An ultrasound fellow and a senior ultrasound fellowship-trained attending reviewed the scans using the
Population Health Research Capsule
What do we already know about this issue?
Ultrasound-guided nerve blocks (UGNB) are an effective and safe method of pain control, but many factors may hinder their use in the emergency department (ED).
What was the research question?
Was implementation of an ED nerve block supply cart associated with an increase in the number of UGNBs performed?
What was the major finding of the study?
The number of UGNBs increased from 0.31% (95% CI, 0.17-0.43%) to 0.67% (95% CI, 0.46-0.86%) of all ultrasound exams after cart deployment (P < .01).
How does this improve population health?
Implementing nerve block carts in the ED may encourage the use of UGNBs to control pain and could decrease rates of complication for many acute conditions.
QPathE software platform, which archives ED POCUS exams. (A small number were reviewed by another ultrasound fellow and a third-year emergency medicine resident with additional experience in preparation for ultrasound fellowship.) All abstractors had sufficient prior training and clinical experience in recognizing a nerve block on ultrasound; thus, abstractor performance was not explicitly monitored. Chart review was performed on our EHR system, Sunrise, for all UGNBs visualized on QPathE and included in the study.
Abstractors were also proficient with use of the EHR to identify nerve block documentation, as this process is identical to how charts are abstracted for weekly ED POCUS quality review. Institutional review board review and exemption were determined to be not required per institutional review and health system guidelines regarding QI projects. Additionally, our department reviews 100% of all ED ultrasounds for quality assurance.
All sonography exams were reviewed for the presence of UGNBs. Our case selection criteria were as follows: We included scans if images and/or clips of a UGNB were identified. Included scans had to show an echogenic needle approaching a hyperechoic nerve bundle, followed by instillation of anesthetic around the nerve bundle. The UGNB was then confirmed through chart review of the procedure
3
note on the EHR to ensure that the scan was identified accurately. The type of UGNB was also recorded. To manage any missing data, we excluded scans if patient and/or confirmatory procedure note information were absent or incorrect. The data were transcribed in a standardized abstraction form in Microsoft Excel. We analyzed the data using a chi-squared test to compare the percentages of UGNBs performed out of all ultrasound exams identified during the pre- and post-cart time periods.
RESULTS
We reviewed 14,321 ultrasound exams for this study (Table 2). A total of 6,853 were performed in the pre-cart period, while 7,468 were performed in the post-cart period. One scan, which was initially identified as a possible UGNB, was excluded upon chart review confirming it was an ultrasound-guided trigger point injection. No scans had to be excluded due to lack of or incorrect patient or ultrasound information. While 21 UGNBs, or 0.31% (95% CI, 0.17-0.43%), were performed in the pre-cart period, 50 UGNBs, or 0.67% (95% CI, 0.46-0.86%), were performed in the post-cart period, representing a statistically significant increase (P < .01). The fascia iliaca block was the
most common UGNB performed in both the pre-cart (11) and post-cart (31) periods (Table 3). Using the data presented in Table 1, we estimated that the annual cost to stock the cart would be around $1,200 based on the number of UGNBs performed post-cart implementation.
DISCUSSION
Our study demonstrated that implementation of an ED nerve block supply cart more than doubled the number of UGNBs performed in our ED. Ultrasound-guided nerve blocks are a safe and effective means of providing analgesia in the ED and are used for many indications, including fractures, intra-abdominal conditions, and facilitation of procedures.1,2,8-14 The UGNB is particularly useful for hip fractures and has been given a “strong” recommendation by the American Academy of Orthopedic Surgeons for use in preoperative pain management.15 Use of UGNBs for hip fractures has been found to improve patient-centered outcomes including reducing opioid use, decreasing postoperative delirium events, and improving morbidity and mortality.9,16-17 Thus, UGNBs are increasingly becoming the standard of care for
management in the ED.
Table 1 Contents and cost of a nerve block supply cart created as part of a quality improvement project to increase the number of ultrasound-guided nerve blocks performed in the emergency department.
Table 2. Total ultrasound images reviewed before and after nerve block supply cart implementation with number of ultrasound-guided nerve blocks performed respectively during each time period.
Category Pre-cart (4/1/2022-2/28/2023)
(3/1/2023-1/31/2024)
Total nerve blocks 21 (0.31%) 50 (0.67%)
Improving barriers to performing UGNBs has been an ongoing challenge for emergency clinicians. There are numerous proposed limiting factors, including the time requirements to perform the procedure, available personnel, and locating the necessary supplies.4,5 A prior study demonstrated that instituting an ED nerve block team led to a rise in both the number and variety of blocks performed in the ED.18 Our study adds an additional potential solution to the challenge of locating supplies for performing UGNBs. Having an available, fully stocked nerve block cart in the ED would likely reduce the time needed to gather supplies as they would be located in one central location. Additionally, our study highlights the successful results of an interdepartmental collaborative initiative between the ED and anesthesiology to increase use of of UGNBs in the ED.
The general reception to the cart has been positive due to ease of use and ability to make UGNBs easier to perform. We believe that the cart’s ability to facilitate UGNB procedures clears one of the many hurdles that EDs can face in encouraging clinicians to perform more UGNBs. Additional system-level hurdles include procedure credentialing, UGNB educational initiatives, buy-in from other departments, ability to conduct quality review of the procedures performed, and supply availability and cost.4,5 The startup cost of the project, including the supplies and cart itself, was approximately $2,298, and we estimate a yearly maintenance cost of $1,200 based on cart supply information (Table 1) and our data over the one-year period after project implementation. Additional factors that would influence this estimate apart from the number of UGNBs performed include any clinician preference for specific anesthetics, nerve block needles, and/or other supplies with multiple options that vary in cost.
Further research examining the factors that can improve procedural setup and increase UGNBs performed in the ED will be extremely important as UGNBs become the standard of care for various indications. Our results demonstrate that an initial investment in setting up an ED nerve block cart may be a useful consideration in EDs looking to significantly increase the number of UGNBs performed by emergency clinicians.
Table 3. Types of ultrasound-guided nerve blocks performed during the time periods before and after implementation of the nerve block supply cart.
Nerve block type Pre-cart (4/1/2022-2/28/2023) Post-cart (3/1/2023-1/31/2024)
Fascia iliaca 11 (52.38%) 31 (62.00%)
Sciatic nerve 0 (0.00%) 5 (10.00%)
Erector spinae 1 (4.76%) 5 (10.00%)
Serratus anterior 3 (14.29%) 1 (2.00%)
Radial nerve 1 (4.76%) 2 (4.00%)
Median nerve 2 (9.52%) 3 (6.00%)
Ulnar nerve 0 (0.00%) 1 (2.00%)
Posterior tibial nerve 1 (4.76%) 1 (2.00%)
Supraclavicular 2 (9.52%) 1 (2.00%)
LIMITATIONS
The main limitation of this study is that it was conducted at a single center with a strong pre-existing academic ultrasound division. In many EDs, this is not the case; therefore, the barriers to performing UGNBs are likely multifaceted and not remedied by simply improving access to supplies. We suspect that, at minimum, experienced clinicians and UGNB education must already be in place to demonstrate similar results. A second limitation is that our study was a retrospective chart review. Some UGNBs may have been missed if they were not recorded, but additional non-UGNB images that were not recorded might also exist, both of which would affect our reported percentages of UGNBs performed. However, we feel this is unlikely in an ED with a strong ultrasound presence and a formal policy of recording all scans and documenting them with a procedure note.
A third limitation of this study is that chart reviewers were not blinded to the study objective when reviewing scans, and inter-rater reliability and chart accuracy review were not formally performed. However, if an UGNB was found, chart review was conducted to ensure that it was correctly identified. Given the objective nature of chart abstraction for presence or absence of a nerve block, this was thought to represent little risk of bias. Another limitation is that clinical outcome data, such as improvement of pain and reduction of opioid use, were not obtained; thus, the extent to which the UGNBs performed were successful is unknown. This study was also limited by the small sample size of UGNBs identified. As this was a pilot program to assess the efficacy of the QI project, a one-year mark was chosen as the period for review. Despite the small sample size, our results indicate the effectiveness of instituting a nerve block cart to increase the frequency of the procedure. Future studies are needed to ensure that this practice continues.
Finally, the increase in the number of UGNBs performed
Increase in UGNB Observed After Implementation of a Nerve Block Supply Cart in the ED Jin et al.
that we identified may be part of a nationwide trend that has been observed in EDs with ultrasound fellowships to increase multimodal pain control, especially for hip fractures.1,2 This increase may also be attributed to multiple pre-existing interventions at our hospital, including UGNB educational initiatives for emergency clinicians and support from the departments of anesthesiology and orthopedics. Because these initiatives were already in place prior to introduction of the nerve block cart, we suspect that the significant increase in UGNBs performed was observed specifically in association with supply cart implementation.
CONCLUSION
Introduction of a nerve block cart was associated with an increased number of ultrasound-guided nerve blocks performed in our ED. Accessibility of supplies for emergency clinicians who work in a high-acuity, fast-paced environment may play a significant role in driving procedural awareness and performance. Further studies are needed to determine whether similar interventions within EDs at different institutions would have similar results.
Address for Correspondence: Aurora Jin, North Shore University Hospital, Department of Emergency Medicine, 300 Community Dr. Manhasset, NY 11030 Email: ajin3@northwell.edu.
Conflicts of Interest: By the WestJEM article submission agreement, all authors are required to disclose all affiliations, funding sources and financial or management relationships that could be perceived as potential sources of bias. No author has professional or financial relationships with any companies that are relevant to this study. There are no conflicts of interest or sources of funding to declare.
1. Amini R, Kartchner JZ, Nagdev A, et al. Ultrasound-guided nerve blocks in emergency medicine practice. J Ultrasound Med 2016;35(4):731-736.
2. Goldsmith AJ, Brown J, Duggan NM, et al. Ultrasound-guided nerve blocks in emergency medicine practice: 2022 updates. Am J Emerg Med. 2024;78:112-119.
3. Gawel RJ, Hong JX, Lege-Matsuura J, et al. Emergency physicianperformed ultrasound-guided nerve blocks: A scoping review of the published literature. Am J Emerg Med. 2025;97:200-206.
4. Farrow RA, Shalaby M, Newberry MA, et al. Implementation of an
ultrasound-guided regional anesthesia program in the emergency department of a community teaching hospital. Ann Emerg Med 2024;83(6):509-518.
5. Milgrim F, Riscinti M, Goldsmith A, et al. Ultrasound-guided nerve blocks: developing a ultrasound-guided nerve block program. Intern Emerg Med. 2025;20(3):933-937.
6. Ogrinc G, Davies L, Goodman D, et al. SQUIRE 2.0 (Standards for QUality Improvement Reporting Excellence): revised publication guidelines from a detailed consensus process. BMJ Qual Saf 2015;25(12):986-992.
7. Worster A, Bledsoe RD, Cleve P, et al. Reassessing the methods of medical record review studies in emergency medicine research. Ann Emerg Med. 2005;45(4):448-451.
8. American College of Emergency Physicians. Ultrasound-guided nerve blocks. April 2021. Accessed July 6, 2025. Available at: https://www. acep.org/patient-care/policy-statements/ultrasound-guided-nerve-blocks
9. Ritcey B, Pageau P, Woo MY, et al. Regional nerve blocks for hip and femoral neck fractures in the emergency department: a systematic review. CJEM. 2016;18(1):37-47.
10. Haley CB, Beauchesne AR, Fox JC, et al. Block time: a multispecialty systematic review of efficacy and safety of ultrasound-guided upper extremity nerve blocks. West J Emerg Med. 2023;24(4):774-785.
11. Lyons C, Herring AA. Ultrasound-guided axillary nerve block for ED incision and drainage of deltoid abscess. Am J Emerg Med 2017;35(7):1032.e3-1032.e7.
13. Mahmoud S, Miraflor E, Martin D, et al. Ultrasound-guided transverse abdominis plane block for ED appendicitis pain control. Am J Emerg Med. 2019;37(4):740-743.
14. Mantuani D, Luftig J, Herring A, et al. Successful emergency pain control for acute pancreatitis with ultrasound guided erector spinae plane blocks. Am J Emerg Med. 2020;38(6):1298.e5-1298.e7.
15. American Academy of Orthopaedic Surgeons. Management of hip fractures in older adults evidence-based clinical practice guideline. Published December 03, 2021. Accessed March 19, 2025. Available at: https://www.aaos.org/hipfxcpg
16. Guay J, Kopp S. Peripheral nerve blocks for hip fractures in adults. Cochrane Database Syst Rev. 2020;11(11):CD001159.
17. Lim EJ, Koh WU, Kim H, et al. Regional nerve block decreases the incidence of postoperative delirium in elderly hip fracture. J Clin Med 2021;10(16):3586.
18. Perice L, Hoffman T, Hsu J, et al. A nerve block team in the emergency department. Acad Med Surg. Published February 18, 2024. Accessed October 8, 2025. Available at: https://academic-medsurg.scholasticahq.com/article/94119-a-nerve-block-team-in-theemergency-department
No “Golden Hour” in Alaska: Characteristics and Implications of Medevac-centered Emergency Care
Brian Rice, MDCM, MSc*
Chelsea Williams, MD, MPH†‡
Cindy Y. Chang, MD, MPH†||# Jeremy Wood, MD¶
Authors continued at end of article
Section Editor: Scott Goldstein, MD
Stanford University, Department of Emergency Medicine, Palo Alto, California Maniilaq Association, Kotzebue, Alaska University of Washington, Department of Emergency Medicine, Seattle, Washington Brigham and Women’s Hospital, Department of Emergency Medicine, Boston, Massachusetts
Submission history: Submitted October 16, 2025; Revision received February 1, 2026; Accepted February 2, 2026
Electronically published June 16, 2026
Full text available through open access at http://escholarship.org/uc/uciem_westjem DOI 10.5811/westjem.53174
Introduction: Rural areas in the United States have higher mortality rates than urban regions, particularly from emergency care-sensitive conditions. Air medical ambulances (medevacs) are critical to emergency care access in the rural U.S., but limited data hinder the ability to study this critical system. In Alaska, medevac services often represent the sole method for connecting Alaska Native patients in remote clinics to physician emergency medical care. This study characterizes medevac use and timing between tribally administered village clinics and hospitals in Northwest Alaska. Our objective in this study was to describe the use and timing of medevacs and investigate how medevac decision-making impacts medevac transport times.
Methods: We conducted a retrospective cohort analysis of medevac transfers between 2020–2024 from 11 Alaskan village clinics within the Maniilaq Association, which serves ~8,000 people over 35,862 square miles.We included 1,579 medevacs representing 1,119 unique patients flying from remote clinics to a central critical access hospital hub.. Our primary outcome measure was the association between short medevac decision times (< 60 minutes), and short total medevac times (< 180 minutes). We measured “flight time,” “decision time,” and “ground time” (time spent waiting for an aircraft to become available) as key components of total medevac time.
Results: A total of 1,579 medevacs were deployed for predominantly Alaska Native (96.8%) patients, of whom 22.2% had traumatic injuries. Between 4.1-7.9% of community members in the region are transported by medevac each year. Median medevac time was 262 minutes (interquartile range [IQR] 196–402 [101–4,142]) from activation call to arrival at the critical access hospital. No medevacs were < 100 minutes. “Ground time” was the longest phase of medevac encounters overall (median ground time 105 minutes (IQR 81–187]) vs median decision time 75 minutes (IQR 42–130) or median flight time 44 minutes (IQR 35–77). We found no association between short medevac decision times and short medevac response time (P = .93). Medevac decision-making was the longest phase in only 6% of the shortest total medevacs (< 190 minutes), but it was the longest phase in 40% of the longest total medevacs ( > 400 minutes).
Conclusion: We found four key themes: 1) no medevacs were < 100 minutes. Independent of human or system factors,atients cannot be transferred from a village clinic to a critical access hospital within the “golden hour” of emergency care; 2) short medevac decision times were not significantly associated with short overall medevac times; 3) the longest phase in a medevac transfer was “ground time”; and 4) in the subset of the longest total medevacs, medevac decision-making was much more likely to be the longest phase than in the shortest total medevacs. This emergency transfer system is not responsive to patient condition and suggests that medevac decision support may help for a subset of encounters. [West J Emerg Med. 2026;27(4)1039–1047.]
INTRODUCTION
Rural areas of the United States have higher age-adjusted mortality rates than urban areas, and this rural–urban gap has widened over the past two decades.1 When cause-specific mortality is studied, many of the causes with the greatest disparities, such as stroke and unintentional injuries, are emergency care-sensitive conditions whose outcomes depend on timely emergency care.2–4 Rural areas differ from urban areas in many ways affecting health and mortality outcomes including social determinants of health and healthcare access.5
Although 98.4% of people who live in the U.S. can reach an emergency department (ED) within 60 minutes, in Alaska, the largest and most rural state, only 80.7% can.6
This access gap reflects Alaska’s unique geography. The state averages 1.2 people per square mile across a landmass larger than California and Texas combined. Furthermore, over 80% of the state is not connected to a road system and consists of Alaska Native (AN) communities situated on ancestral lands connected primarily by airplanes.7 The AN people come from a legacy of strengths, and enormous cultural benefits come from living on traditional lands. Most of these communities have no health facilities staffed by physicians or nurses. Instead, primary, preventative, and emergency healthcare in rural Alaska is provided by the Alaska Tribal Health System (ATHS) using a “spoke and hub” system of village clinics and referral hospitals.8 The outlying “spoke” clinics are entirely staffed by non-physician clinicians (NPC), usually community health aide/practitioners (CHA/P).9
Without roads, private vehicles or ambulances cannot be used to connect patients at “spoke” clinics to physicians at “hub” facilities. Almost all emergencies within this off- the-road system require an air medical ambulance (medevac) to connect to higher levels of care. While it is known that response times for emergency medical services (EMS) can result in excess mortality, and that the majority of excess mortality in rural Alaska is associated with emergency conditions, the exact role of medevacs in this system has yet to be studied.10–14EBSCO (Elton B. Stephens Company
Elsewhere in the U.S., medevacs are part of a larger EMS systems, predominantly using helicopters instead of ground ambulances for critical trauma patients.15–18it still remains unknown which group of trauma patients might benefit most from HEMS rescue. Consequently, the unique aim of this study was to reveal which patients might benefit most from HEMS rescue. Methods Trauma patients (ISS ≥9 This builds on the “golden hour” for trauma rule, which stipulates that the first 60 minutes is most critical for patient survival; medevac time savings of just 17 minutes improve mortality.19,20 About 300,000 medevacs occur annually (~0.1% of the population); 30% are scene responses, and 70% are interfacility transports.21both fixed- and rotor-wing. Transfers where then subcategorized into interfacility and scene responses. Frequencies for each category were generated and reported.\ nRESULTS: A total of 317,267 air medical transfers were
Population Health Research Capsule
What do we already know about this issue? Little is known about the rural Alaska medevac system, which provides the only link to emergency care for communities in the state’s off-the-road system.
What was the research question?
What are the use patterns of medevacs in rural Alaska, and are short medevac decision times associated with short medevac response times.
What was the major finding of the study?
Annually, 4–8% of Alaskans were medevacked; none in < 100 minutes, and decision time < 60 min showed no association with total time of <180 min (P = .93).
How does this improve population health? By quantifying high use of a critical service that cannot respond faster to patient needs, findings redirect efforts to optimizing premedevac care and targeted decision support.
completed in 2021. These included 19,421 (6 % By comparison, medevacs in rural Alaska are the sole emergency lifeline; no 9-1-1 services or ambulances exist in most villages. The CHA/P (or rarely nurse practitioner or physician assistant) who staff the clinics anchor frontline care and are trained to recognize emergencies. When they do, they contact a physician at one of six regional “hub” hospitals by phone or videoconference. Together they decide whether a patient can remain in the village, is stable enough to take the next available commercial flight to the nearest town with a critical access hospital to present to the ED there, or they require a medevac. Medevacs typically transport the patient from the village clinic to a critical access hospital ED. These critical access EDs are staffed 24 hours a day by family medicine and/or emergency physicians but lack surgical or specialty services. When specialty care (eg, pediatrics, general surgery, obstetrics, intensive care) is required, the patients receive medevacs to the tertiary referral center, the Alaska Native Medical Center (ANMC) in Anchorage. Only one previously published paper to date has looked at the use of medevacs within this spoke-and-hub model, but it did not contain patient-level detail.22
No prior work has quantified each medevac phase: decision, ground, and flight times. Decision time spans the
patient’s arrival at a village clinic to medevac activation; ground time covers crew and aircraft preparation and may be extended by medevacs already engaged with other emergencies, duty-hour limits, and severe weather conditions; flight time is round-trip travel. Medevac teams (pilot plus two medics and/or nurses) can deliver advanced point-of care testing, airway support, blood products, and therapeutics including broad-spectrum antibiotics, vasopressors, and thrombolytics. All flying in Alaska carries an element of risk with the highest per capita crash rate in the U.S., and medevac accidents have proven disproportionately fatal.23,24
Studying each phase is essential for improving system quality. Medevac delays are so notorious that a recent Arctic emergency preparedness conference pronounced, “There is no golden hour in Alaska.”25 The challenges of linking clinic, flight, and hospital data has stymied patient-level analyses to date. Consequently, while medevac delays may be a modifiable mortality driver, without these data we cannot a) quantify time-loss bottlenecks, b) link operational delays to clinical outcomes, c) identify targets for quality improvement), or d) identify when to streamline medevacs vs bolster village care.
Our research provides the first patient-level analysis of medevac timing and utilization in rural Alaska. The ATHS provides all clinical care and accepts almost all transfers in these regions and, thus, represents an almost entirely closed system. The high quality, birth-to-death electronic health record (EHR) data for AN patients within this system create an environment uniquely suited for associating patient emergencies with long-term outcomes to better understand the impact of rural transport on emergency care.26 Generated from six years of collaboration between AN tribal health organizations and academic partners, these findings establish a foundational evidence base for developing protocols, enhancing training, implementing clinical decision support using machine-learning, and making systems improvements aimed at reducing mortality in rural AN emergency care.
METHODS
Study Design and Ethics and Tribal Review
This was a retrospective review of existing administrative, medevac, and EHR data. Ethical approval was obtained from the Alaska Area Institutional Review Board (IRB), with an IRB Reliance Agreement from Stanford University. Tribal approvals were received from the Maniilaq Association, Southcentral Foundation, and the Alaska Native Tribal Health Consortium (ANTHC).
Study Site
The Maniilaq Association is a regional tribal health organization within the ATHS that represents 12 federally recognized Tribes in Northwest Alaska. They administer the Maniilaq Health Center, a 17-bed critical access hospital in Kotzebue, AK, and collaborate with the ANTHC that along with Southcentral Foundation help administer care at the
ANMC in Anchorage. The Maniilaq Health Center has telemetry capacity and a five-bed emergency department (ED) serving a rural population of approximately 8,000 people. This facility has physicians and nurses, non-physician clinicians, obstetric midwives, dentistry, optometry, and behavioral health but no obstetricians, and no surgical or subspecialty services. Medevacs originate from 11 villages with a mean distance of 87 miles (range 42.4-155.3 miles) from the critical access ED, with no road access. Patients are seen in village clinics with limited treatment and testing capacity, staffed by one or more non-physician clinicians from 8 am–5 pm but with a nonphysivcian clinician on call 24 hours a day, 365 days a year.
Data Sources
We included all medevacs from Maniilaq Association village clinics to either a critical access or tertiary referral center ED from 2020-2024 in this study. We excluded rare, special-case destinations (eg, Providence Alaska Medical Center in Anchorage for specific cardiac emergencies). Medevacs were identified using internal administrative data. We then cross-referenced patients and dates with the Cerner EHR to link them to structured and unstructured EHR data. Medevac data available in the EHR were also exported and linked to each patient encounter. We obtained all patient characteristics from the Cerner EHR. Data were collected for each patient encounter in the window from seven days prior to medevac until 30 days post-medevac. We linked exported EHR data to administrative data using Python (Python Software Foundation, Wilmington, DE). For all 2023 patients, a physician reviewer manually extracted patient data. These data were used to error-check automated data extraction and linking. We used publicly available census, map, and shapefile data for location and map generation.
Data Cleaning
We performed all data-cleaning in Python. Administrative data was extensively manually cleaned and normalized. The patient identifiers from these administrative data were crossreferenced against EHR records, which served as the “gold standard” for patient identifiers. Deterministic matching was followed by probabilistic matching using the fuzzywuzzy library requiring two or more matching identifiers (among name, dates of birth, and medical record numbers) to establish a match. If a two-identifier match could not be produced, the record was excluded from further analysis. The EHR-derived locations of service replaced manually entered data in all cases of disagreement. Times and dates of medevac activations and facility encounters were all obtained from EHR data and replaced manually entered dates in all cases of disagreement.
Variables
We defined “medevac decision time” as the time from a patient encounter starting at the village clinic until the medevac activation event. This decision time was classified as
Air Medevac Transfers in Rural Alaska
Air Medevac Transfers in Rural Alaska
“short” if a decision was made in < 60 minutes, and “long” if it took > 60 minutes. Because no standard definition exists for medevac decision- making, this definition was developed by consensus among three physicians involved in medevacs in the Maniilaq Association. “Flight time” was generated for each village using an average flight speed of 200 mph (appropriate for the craft typically flying in this region) and round-trip straight-line distances between villages and Kotzebue. “Ground time” was obtained by subtracting this flight time from the total time between medevac activation and the patient arriving at the receiving facility. Ground time was classified as “short” if it was < 180 minutes (defined using the upper limit of the interquartile range [IQR]), and “long” if it was > 180 minutes.
We extracted free-text chief complaints from free-text fields and classified them using a regular expressions approach that identified “obstetric” and “trauma” chief complaints and then labeled the remainder “medical/surgical.” Health insurance, race, sex, age, and vital signs were extracted from EHR. Cutoffs for hypoxia were oxygen saturation < 92%, a fever was defined as > 100.3 °F, and age-specific cutoffs were
used for hypotension and tachypnea, and tachycardia for pediatric and adult patients.
Data Analysis
Figures were produced in Python using matplotlib and maps using geopandas. Descriptive statistics (including means, standard deviations [SD], medians, IQR, and ranges) and comparative analysis was done in R (The R Foundation for Statistical Computing, Vienna, Austria). We analyzed categorical variables for significance using chi-squared tests. Continuous variables were analyzed for significance using t-test for means, Mann-Whitney for medians, Pearson correlation for linear correlation, and Spearman correlation for monotonic correlation. A threshold of 0.05 was set for significance.
RESULTS
Overall, we located 2,670 records of medevacs for the Maniilaq Association from January 2020– December 2024. We found matching records between manual administrative and EHR data for 2,615 (97.9%) medevacs. Of this total, we included 1,579 in the analysis. The other 1,036 medevac
1. Map of medevacs within the Maniilaq Association, an Alaskan regional tribal health organization, in a study of medevac use and timing displaying village population, overall medevac use, and annual medevac rates per 1,000 persons, 2020–2024.
Figure
interfacility transfers between critical access EDs and tertiary referral EDs were outside the scope of this study. Of the medevacs originating from village clinics, 1,257 (79.6%) had a medevac activation time, 1,350 (85.5%) had a village clinic encounter start time, and 1,460 (92.4%) had an ED arrival time. Medevacs went primarily to the critical access ED (97.1%, n = 1,535), with 44 patients (2.8%) bypassing the critical access ED and flying directly from the village to the tertiary referral center. The distribution of the patients flying to the critical access ED is shown as a map in Figure 1 Between 4.1-7.9% of the population of people living in rural villages in the Maniilaq Association receive a medevac each year (annual rates 41-79 per 1,000 persons). The characteristics of village clinic patients receiving a medevac are described in Table 1 below. These data show that the patients receiving medevac
Table 1. Village clinic medevac patient characteristics (n = 1,579) in a study of medevac use and timing in rural Alaska. Characteristic
% Female 52.8% (n = 834) Age,
Race
Indian or Alaska Native
(25.2)
(n = 1,529)
Non-American Indian or Alaska Native 3.2% (n = 50)
Age Group (years)
<5 8.6% (n = 136)
5-17 10.4% (n = 164)
18-40 37.3% (n = 589)
40-64 20.6% (n = 326)
65-80 15.8% (n = 250)
80+ 7.2% (n = 114)
Insurance
54.8% (n = 866)
(n = 312) Indian
transport are overwhelmingly AN across a broad age range, and their primary payor is Medicaid. Most patients have at least one abnormal vital sign, and trauma accounts for only 22.2% of patients.
The median medevac was > four hours (262 minutes), and no patient transports occurred within one hour (minimum time 101 minutes). The longest medevac (4,142 minutes) took just under three days. A substantial minority of patients (39.1%) had a short medevac decision-making time of < 60 minutes. Most patients (64.0%) had a short medevac ground time of < three hours. Almost half the medevac activations (49.4%) occurred outside standard clinic operating hours.
Table 3 displays the association between medevac decision time and ground time. We found no association in the proportion of patients receiving a short medevac decision and a short ground time (chi-squared P-value = .93). Additionally, there was no significant difference in mean (t-test = 0.73) or median (Mann-Whitney = 0.72) ground time between short and long decision times, as well as no significant linear correlation (Pearson correlation P = .06) or monotonic correlation (Spearman correlation P = .93).
Figure 2 illustrates medevac timing at a population level, grouping medevacs by quartiles of total time. Across all quartiles, median flight time remained consistent, and ground time represented the largest phase. Decision time was less than ground time in all quartiles, and both times increased monotonically across quartiles.
Table 4 describes the distribution of times for medevacs at the patient level. Overall, ground time was the longest phase for most (65.4%) patients. However, there was a sizable minority of patients (29.5%) for whom medevac decision was the longest phase. This proportion of patients increased for the longest two quartiles of patients, rising to 42.5% in Q3 and 39.9% in Q4.
DISCUSSION
(n = 173)
(n = 204) Commercial
Other 1.5% (n = 24)
Vitals in Village Clinic
All vitals
(n = 538) Tachycardia
In this first published study of patient-level data for medevac transfers from rural Alaska, we uncovered important insights into the timing and utilization of air medical services
Table 3. Lack of association between medevac decision time and ground time in a study of medevac use and timing in rural Alaska.
(n = 504)
(n = 620) Tachypnea
Hypoxia
Febrile
Hypotension
Chief complaint
(n = 91)
(n = 90)
2.0% (n = 31)
Medical/surgical 71.7% (n = 1,082)
Trauma/injury
(n =. 335)
Obstetric 6.1% (n = 92)
SD, standard deviation.
Decision time
†Chi-squared test used for significance. min, minute.
Figure 2. Bar plot of time spent in each phase of medevac process in a study of medevac use and timing, by quartiles of total medevac time (shortest to longest). min, minutes; Q1-Q4, quartiles 1-4.
medevacs play in overall public health for these regions. Without external comparators, optimal medevac rates remain uncertain. The next step is to link activations to ED dispositions and outcomes to identify who benefits from medevac and which incurs risk, displacement, and cost without clinical gain. Merging these data with regional and clinician decision-making trends, high-using patients, and local disease patterns can immediately inform policy and training. Furthermore, this next step can form the basis of clinical-decision support machine-learning models. We hope this overall research trajectory will empower long-term efforts to optimize use of this essential and limited resource and to improve emergency care outcomes for rural Alaskans.
in these remote areas. Our findings highlight the critical role that medevac services play in ensuring access to emergency care for rural Alaskan and especially AN communities. By examining the timing of medevac encounters, we provide a deeper understanding of the challenges faced by rural healthcare systems. This work identifies key areas for improvement in emergency response protocols and training, ultimately aiming to enhance the efficiency and effectiveness of village clinics and medevac services in rural settings. This analysis highlights the central community health role of medevacs services. We report that 4.1-7.9% of all people living in these villages receive a medevac each year (Figure 1). This rate is 40-80 times higher than medevac rates in the continental U.S. but is similar to the 4.7% per capita annual EMS activation rate in rural America.27 While medevac is traditionally thought of as a high-resource, high-reward alternative for the sickest (typically trauma) patients, in rural Alaska it also fills a role similar to a standard ground ambulance as well as providing rapid access to high-level care for high-acuity patients. This underscores the major role that
The similarities between medevacs and ambulance EMS rates underscores the stark dissimilarities in the ability of these two systems to respond to critical patients (Table 3). Our study showed there was no association between fast medevac decisions and fast medevac responses. This highlights how medevacs in rural Alaska should be clearly understood to be interfacility transfers between clinic and ED rather than an extension of an EMS system. Conventional EMS coordinates multiple resources and prioritizes the critically ill with priority dispatch, running “lights and sirens” and – rarely – medevacs. In rural Alaska, the CHA/Ps provide de facto EMS by going to patient homes or accident scenes in the village but are outside the formal Alaska EMS system (although they do employ the skills of an emergency trauma technician or emergency medical technician that they receive in their training). However, true EMS services require components including staffing, training, communications, transportation, access to care, public safety agencies, standardized record-keeping, and system review and evaluation that do not exist in this context.28
The lack of association between decision and ground time reinforces the common regional understanding that medevac response times are largely independent and cannot respond to patient conditions. This critical finding has huge implications for public health policy. Medevacs are a critical but largely invariable tool. To reduce the time until a higher level of early emergency care can be provided, we must focus on the time prior to the medevac arrival. Opportunities exist to (a) expand the number of and integrate village non-physician clinicians into larger statewide EMS systems, and/or (b) expand the scope of care and resuscitation they can provide prior to medevac arrival. Combining this with expanding use of
Table 4. Time spent in each medevac phase in a study of medevac use and timing in rural Alaska. Which medevac phase was the longest? All Medevacs
min, minutes; Q, quartile.
Table 2. Summary of medevac timing in a study of medevac use and timing in rural Alaska. Characteristic Value
Medevac timing
Median decision time (clinic arrival to medevac activation) (min)
Median ground time (medevac activation to take off) (min)
Median calculated flight time (round trip from critical access ED to village and back) (min)
Median total time (village clinic arrival to critical access ED arrival) (min)
Medevac decision time
75 [IQR: 42–130, Range: 0–1057]
105 [IQR: 81–187, Range: 23–4046]
44 [IQR: 35–77, Range: 25–93]
262 [IQR: 196–402, Range: 101–4142]
Short (0-60 min decision time) 39.1% (n = 369)
Long (≥ 60 min decision time)
Medevac ground time
Short ground time (≤ 180 min activate to takeoff)
Long ground time (> 180 min activate to takeoff)
Medevac total time (distribution across 4-hour categories)
existing telehealth capacity for emergency care may help address the crisis of higher incidence of mortality related to emergency care and sensitive conditions in these regions.
The origins of the CHA/P program were rooted in the understanding that rural Alaska requires novel approaches and task-sharing to address rural care needs. When tuberculosis was the major issue 70 years ago, Alaska trained a novel cadre of paramedical professionals to expand rural care. Now, with a much-evolved system and increasing understanding of the needs for improved emergency care, it is possible to build on the CHA/P legacy of expanding the remote provision of care rather than following current trends in medical administration nationwide, which focus on the centralization of healthcare services.
Finally, our study characterizes total and phase-specific timing of medevac utilization. First, this study supports the adage that “There is no golden hour for trauma in Alaska,” as medevacs took hours or even days rather than minutes. No medevac response occurred in < one hour, with the shortest response times 101 minutes, the longest almost three days, and the median four hours and 22 minutes (Table 2). This underscores the need to strengthen village clinic-level care during these initial “golden hours.” Beyond total time, our analysis also showed that ground time exceeds decision time, and flight time is short and invariable (Figure 2). While some ground time is always required (preflight checks; moving crew and patients between plane and clinic), weather delays and aircraft/crew availability are the main driver of this longest time
segment. While weather is uncontrollable, utilization is not and represents another target for quality improvement. Every medevac activation has downstream effects as duty-hour limits and single-mission capacity create queues that increase ground time for subsequent calls. Currently, medevac oversight rests with the hub physician and medevac dispatch and relies on their individual expertise and experience. Adding additional systemlevel metrics and decision support may improve medevac coordination and prioritization.
Decision time, while shorter than ground time, constitutes a large share as total time increases (Table 4). It is the longest phase for approximately 40% of the longest half of medevacs. This reflects the current clinical understanding that medevac patients are bimodal, including those with (a) immediately identifiable medevac needs, and (b) evolving needs identified after physician consultation, re-evaluations, and treatment response. This assessment process creates a median decision time of over three hours for the longest medevac encounters and presents a target for quality improvement. Standardized protocols and clinical decision support for non-physician clinicians and physicians could both expedite transfer decisions and identify patients who can safely remain in the village. Expanding village-based diagnostics, therapeutics, and telepresence/remote consultations may further optimize utilization at system and individual levels.
These findings highlight the need for targeted improvements in medevac protocols, training, and decisionmaking processes to enhance response times and overall patient outcomes. For community members, this research emphasizes the necessity of advocating for better healthcare resources and support systems. Developers and policymakers are encouraged to leverage these insights to create more effective emergency response frameworks that address the unique challenges of rural healthcare delivery in Alaska. By fostering collaboration among stakeholders, including clinicians, community organizations, and government agencies, we can work toward a more efficient and equitable emergency care system that ultimately saves lives and improves health outcomes in these underserved areas.
LIMITATIONS
There are several limitations to this analysis. First, we use data from a single, critical-access hospital. Utilization may vary across other tribal hospitals, but since the structure of medevac services is similar across the ATHS, our findings are likely highly generalizable. This analysis includes medevac flights only and excludes commercial flights. This introduces potential selection bias as interventions targeting medevac efficiency may not address needs among patients who are transported by commercial aircraft. Medevac phases were extrapolated from facility EHR data rather than medevac EHR data. Flight times were derived using the average cruising speed of the aircraft used in the region rather than flight registers. Incorporating flight dispatch and medevac EHR data
into future studies would improve timing accuracy. Finally, reliance on administrative data introduced human error with data entry. While extensive data-cleaning addressed this limitation, future studies would benefit from EHR adaptations to incorporate medevac activations as structured data fields.
CONCLUSION
This study highlights the vital importance of medevac services in providing emergency care for rural Alaska and particularly the Alaska Native communities, representing a similar rate comparable to rural ambulances in the wider U.S. (4.1–7.9%). However, unlike traditional EMS systems, medevacs in the Alaska Tribal Health System are interfacility transports, and short decision times were not associated with short response times. Median medevac times were 4 hours, 22 minutes (range 101 minutes to ~3 days), reinforcing the absence of a “golden hour” for rural Alaskan emergency care. This evidence base lays the foundation for clinical decision support and health policy to reduce emergency care mortality in rural Alaska.
ACKNOWLEDGMENTS
Research reported in this publication was supported by National Institute on Minority Health and Health Disparities of the National Institutes of Health (NIH) under award number K08MD016445. The content is solely the responsibility of the authors and does not necessarily represent the official views of the NIH.
Authors and Affiliations Continued
Henry Saul, BA*
Angelica Pritchard, BS*
Gretchen Day, MPH¶
Timothy Thomas, MD¶
David Hao, MD, MPH*
Carla Britton, PhD**
Robert Onders, MD, JD, MPA†
Tina Hernandez-Boussard, PhD, MSc, MPH††
||Harvard Medical School, Department of Emergency Medicine, Boston, Massachusetts
#Rural Provider Network, Alaska Native Tribal Health Consortium, Anchorage, Alaska
¶Alaska Native Tribal Health Consortium, Research Services, Anchorage, Alaska
**Alaska Native Epidemiology Center, Alaska Native Tribal Health Consortium, Anchorage, Alaska
††Stanford University, Department of Biomedical Informatics Research, Palo Alto, California
Address for Correspondence: Brian Rice, MDCM, MSc, Stanford University, Department of Emergency Medicine, 1199 Welch Road, Stanford, CA 94304. Email: brice@stanford.edu.
Conflicts of Interest: By the WestJEM article submission agreement, all authors are required to disclose all affiliations, funding sources and financial or management relationships that could be perceived as potential sources of bias. No author has professional or financial relationships with any companies that are relevant to this study. There are no conflicts of interest or sources of funding to declare.
1. Cross SH, Califf RM, Warraich HJ. Rural-urban disparity in mortality in the US from 1999 to 2019. JAMA. 2021;325(22):2312-4.
2. Carr BG, Conway PH, Meisel ZF, et al. Defining the emergency care sensitive condition: a health policy research agenda in emergency medicine. Ann Emerg Med. 2010;56(1):49-51.
3. Probst JC, Zahnd WE, Hung P, et al. Rural-urban mortality disparities: variations across causes of death and race/ethnicity, 2013–2017. Am J Public Health. 2020;110(9):1325-1327.
4. Vashi AA, Urech T, Carr B, et al. Identification of emergency care–sensitive conditions and characteristics of emergency department utilization. JAMA Netw Open. 2019;2(8):e198642.
5. Singh GK, Siahpush M. Widening rural–urban disparities in all-cause mortality and mortality from major causes of death in the USA, 1969–2009. J Urban Health. 2014;91(2):272-292.
6. Carr BG, Branas CC, Metlay JP, et al. Access to emergency care in the United States. Ann Emerg Med. 2009;54(2):261-9.
7. Alaska Department of Transportation and Public Facilities. Alaska Moves 2050. 2023. Available at: https://dot.alaska.gov/ alaskamoves2050/. Accessed August 18, 2025.
8. Golnick C, Asay E, Provost E, et al. Innovative primary care delivery in rural Alaska: a review of patient encounters seen by community health aides. Int J Circumpolar Health. 2012;71.
9. Health Aides of Alaska. CHAP Alaska. Available at: https://www. akchap.org/. Accessed August 8, 2025.
10. Alanazy ARM, Wark S, Fraser J, et al. Factors impacting patient outcomes associated with use of emergency medical services operating in urban versus rural areas: a systematic review. Int J Environ Res Public Health. 2019;16(10):10.
11. Byrne JP, Mann NC, Dai M, et al. Association between emergency medical service response time and motor vehicle crash mortality in the United States. JAMA Surg. 2019;154(4):286-293.
12. Kai TR, Broady MJ, Davenport DL, et al. The effect of emergency
medical system transport time on in route clinical decline in a rural system. J Trauma Acute Care Surg. 2020;88(6):734.
13. Mathiesen WT, Bjørshol CA, Kvaløy JT, et al. Effects of modifiable prehospital factors on survival after out-of-hospital cardiac arrest in rural versus urban areas. Crit Care. 2018;22(1):99.
14. Rice B, Britton C, Rasmus S, et al. Where the road ends: emergency care sensitive conditions drive excess mortality in medevacdependent rural Alaska. Emerg Med J. 2025;42(11):736-737.
15. Andruszkow H, Schweigkofler U, Lefering R, et al. Impact of helicopter emergency medical service in traumatized patients: Which patient benefits most? PLoS ONE. 2016;11(1):e0146897.
16. Bledsoe B, Wesley A, Eckstein M, et al. Helicopter scene transport of trauma patients with nonlife-threatening injuries: a meta-analysis. J Trauma Inj Infect Crit Care. 2006;60(6):1257-1266.
17. Kerr WA, Kerns TJ, Bissell RA. Differences in mortality rates among trauma patients transported by helicopter and ambulance in Maryland. Prehosp Disaster Med. 1999;14(3):52-57.
18. Sullivent EE, Faul M, Wald MM. Reduced mortality in injured adults transported by helicopter emergency medical services. Prehosp Emerg Care. 2011;15(3):295-302.
19. Abhilash KPP, Sivanandan A. Early management of trauma: the golden hour. Curr Med Issues. 2020;18(1):36.
20. Boland S, Lu L, Silver DS, et al. How many minutes matter: association between time saved with air medical transport and survival in trauma patients. J Trauma Acute Care Surg. 2025;98(6):890-898.
21. Reimer AP, Shew J. Using NEMSIS to report annual air medical transport statistics. Air Med J. 2024;43(3):226-228.
22. Rice B, Wood J, Britton C, et al. Medevac utilization and patient characteristics in rural Alaska 2010 to 2018. Air Med J. 2020;39(5):393-398.
23. Bensyl DM, Moran K, Conway GA. Factors associated with pilot fatality in work-related aircraft crashes, Alaska, 1990–1999. Am J Epidemiol. 2001;154(11):1037-1042.
24. Handel DA, Yackel TR. Fixed-wing medical transport crashes: characteristics associated with fatal outcomes. Air Med J. 2011;30(3):149-52.
25. Hale Borealis Forum. Hale Borealis. Available at: https:// haleborealisforum.com/. Accessed August 7, 2025.
26. Worster A, Bledsoe RD, Cleve P, et al. Reassessing the methods of medical record review studies in emergency medicine research. Ann Emerg Med. 2005;45(4):448-451.
27. Hanson CS. Drivers of emergency medical services (EMS) utilization in the United States in 2019–2020. 2022.29997810.
28. Moore L. Measuring quality and effectiveness of prehospital EMS. Prehosp Emerg Care. 1999;3(4):325-331.
Unveiling Unwritten Curricula: Enhancing Junior Faculty Development in Academic Emergency Medicine
Abagayle Bierowski, MD, MEHP*†
Casey Morrone, MD, MEHP*†‡§
Erin Hoag, DO*†
Ridhima Ghei, MD*†||
Michael Pasirstein, MD, MPH*†
Julie Blaszczak, MD, MEHP#¶
Dimitrios Papanagnou, MD, MPH, EdD*†
Thomas Jefferson University, Department of Emergency Medicine, Philadelphia, Pennsylvania
Sidney Kimmel Medical College, Philadelphia, Pennsylvania
Wake Forest University, Department of Emergency Medicine, Winston-Salem, North Carolina
Wake Forest University, School of Medicine, Winston-Salem, North Carolina
NYU Langone Hospital, Department of Emergency Medicine, Mineola, New York
University of Michigan, Department of Family Medicine, Ann Arbor, Michigan
University of Michigan Medical School, Ann Arbor, Michigan
Section Editor: Cameron Hanson, MD
Submission history: Submitted September 6, 2025; Revision received February 28, 2026; Accepted February 14, 2026
Electronically published June 28, 2026
Full text available through open access at http://escholarship.org/uc/uciem_westjem DOI 10.5811/westjem.50856
Introduction: The transition from resident to junior faculty in academic emergency medicine (EM) may be shaped not only by formal training and institutional policies but also by the “unwritten curriculum,” a set of norms and expectations embedded in institutional culture. However, the unwritten curriculum and its potential to impact junior faculty development remains largely unexplored. Little is known about how junior faculty perceive, experience, and navigate these informal expectations, or the formal and informal structures that influence this process. In this study we aimed to explore junior faculty members’ experiences with the unwritten curriculum in academic EM, with a focus on how they interpret and navigate institutional norms and identify supports and barriers encountered during their early faculty development.
Methods: Within their first five years, EM faculty at academic institutions distinct from their residency training sites completed an anonymous, iteratively developed survey designed to explore experiences with the unwritten curriculum, informed by Schlossberg’s transition theory framework. The primary analytic focus was identification of themes describing how junior faculty perceive and navigate implicit institutional norms. Open-ended responses underwent thematic analysis using a structured codebook, applied by two independent reviewers with consensus-based coding and adjudication by a third when disagreements arose.
Results: A total of 35 junior faculty members completed the survey. All participants indicated influence of the unwritten curriculum on their professional development. Major themes identified include the unspoken importance of mentorship and peer guidance; implicit expectations and norms surrounding engagement, productivity, and visibility; work-life integration; cultural adjustment; scholarly output; and gaps in onboarding, feedback, and role clarity. Participants emphasized challenges in navigating departmental politics, understanding hierarchical nuances, and balancing unspoken expectations for committee involvement and informal social participation. Additionally, unclear feedback processes, inconsistent evaluation expectations, and cultural norms for active engagement were noted as barriers to integration and professional growth.
Conclusion: Junior faculty in academic EM described the unwritten curriculum as a meaningful influence on their early faculty experience. Within this sample, participants highlighted mentorship, feedback transparency, and structured faculty development as potential mechanisms to support navigation of implicit expectations during the transition to junior faculty. These findings reflect individual perceptions rather than program characteristics and should be interpreted within the context of the study’s scope. [West J Emerg Med. 2026;27(4)1048–1061.]
INTRODUCTION
The transition from resident to junior faculty in academic emergency medicine (EM) extends beyond formal training and technical proficiency. Junior faculty must also navigate the “unwritten curriculum”—a set of implicit norms, values, and expectations. While formal curricula provide structured education in teaching and clinical practice, the unwritten curriculum operates beneath the surface, embedded within institutional culture, workplace dynamics, and professional interactions. The unwritten curriculum is conceptually distinct from the hidden curriculum, which has been extensively examined in the medical education literature and refers to institutional-level transmission of implicit values and norms.1 Because junior faculty play a critical role in academic growth and innovation, the success of academic health centers is closely tied to how effectively they are recruited, supported, and advanced.2
Studies suggest that residents and newly graduated attending physicians actively engage with, shape, and attempt to influence these informal learning processes as they navigate their professional development.1 This underscores the need for structured mentorship and early career guidance to help junior faculty assimilate and contribute meaningfully to their academic environments. National needs assessments of EM faculty development echo this point, revealing gaps in education-related programming, persistent deficits in mentorship and wellness resources, and varying levels of early career satisfaction, all of which highlight the need for more tailored and intentional support.3,4 Faculty retention is also linked to implicit workplace expectations, with breaches of unwritten contract obligations contributing to departures.5 These findings suggest that the unwritten curriculum extends beyond faculty training, influencing career satisfaction and long-term engagement in academic EM.
Existing literature explores the hidden curriculum in medical education, which transmits attitudes and values through what is (or isn’t) taught and has been shown to influence professional development.1,6,7 The hidden curriculum is often viewed as a negative, institutional-level concept involving unintended or obscured lessons.8,9 Related constructs describing implicit or informal learning processes have also been used to characterize norms and expectations conveyed through culture, behavior, and professional socialization. By contrast, the unwritten curriculum has been less consistently defined and consists of implicit norms and expectations that may influence faculty development but are not formally documented or explicitly taught. Rather than containing intentionally obscured information, the unwritten curriculum instead represents a series of implicit norms and expectations that faculty must piece together to fully assimilate into academia.
In this study, we use the term unwritten curriculum to describe this subset of informal learning processes as they are experienced during early faculty transitions. This unwritten
Population Health Research Capsule
What do we already know about this issue?
Junior EM faculty report challenging transitions, but structured onboarding and mentorship models remain poorly defined.
What was the research question?
What gaps exist in onboarding and support during junior EM faculty transition?
What was the major finding of the study?
Only 35% rated first-year support as good/ excellent; 64% reported unclear role expectations.
How does this improve population health?
Identifying onboarding gaps may improve faculty retention, well-being, and stability of the emergency care workforce.
curriculum remains largely unexplored in the transition to faculty life, leaving new educators to navigate implicit expectations through trial and error, which may hinder career growth, scholarly productivity, and institutional integration. Because faculty who remain at their residency training institution may already be familiar with local norms and expectations, this study focused on junior faculty whose first academic appointment was at a different institution to better capture active navigation of the unwritten curriculum and reduce bias related to prior institutional socialization.
This study explores how junior faculty experience, interpret, and navigate the unwritten curriculum in academic EM. The primary objective was to identify recurring themes describing junior faculty perceptions of implicit norms and expectations during the transition to their first academic faculty role. Secondary objectives included examining the formal and informal strategies junior faculty use to navigate these expectations and identifying perceived facilitators and barriers to early faculty integration and development.
METHODS
Study Design and Conceptual Framework
Faculty participated in an anonymous online survey through REDCap (Research Electronic Data Capture), a secure, web-based software platform designed to support data capture for research studies.10,11 We selected a surveybased qualitative design to allow anonymous participation from junior faculty across institutions and to encourage candid reflection on implicit norms and expectations. Open-
ended qualitative questions were designed to address the four key domains of adaptation in Schlossberg’s transition theory framework.12 (See Appendix B for complete survey.) We selected Schlossberg’s transition theory because it provides a structured framework for examining how individuals experience and adapt to professional transitions. The framework identifies four key domains influencing an individual’s ability to cope with transition: situation (circumstances); self (personal attributes); support (resources); and strategies (coping methods). These domains informed the study design by guiding the areas of inquiry related to junior faculty transition experiences in academic EM.
We developed the survey using tenets of constructivism, which posits that individuals build meaning based on their personal experiences and interactions with their environment. This perspective shaped the overall study design by prioritizing participants’ subjective interpretations of institutional culture, professional identity, and transition experiences. This informed our inclusion of open-ended questions to allow participants to express individualized perspectives and reflections on their transitional experiences. Furthermore, the structure of the survey encouraged participants to reflect on how their identity, values, and institutional context shaped their perception of professional growth and challenges.13
Study Setting and Population
We recruited EM faculty within their first five years of practice at academic institutions distinct from their residency training sites using a combination of purposive and convenience sampling. Eligible participants were identified through professional networks, national EM education communities, and snowball sampling. Participants were invited via direct email outreach; recruitment occurred over a defined period and included an initial invitation with a brief study description and survey link, followed by one reminder email. Recruitment targeted individuals who fit our inclusion criteria: universityappointed EM residency program faculty with ≤ 5 years of postresidency experience, practicing at academic hospitals unique from their residency training program.
Eligibility was confirmed through self-report screening questions embedded at the beginning of the survey, including confirmation of years in practice, current academic appointment, and whether the participant’s current institution differed from their residency training site. Participants who did not meet inclusion criteria were not permitted to proceed with the survey. Recruitment continued until thematic saturation was reached—defined as the point at which no new themes or insights were emerging from the data. This approach is consistent with qualitative research standards for exploratory, open-ended, survey-based studies.14 All participants were aware of the investigators’ goals for the project and were offered the opportunity to download a copy of their responses after survey completion, although no post-submission edits were permitted.
Survey Development
In the absence of any pre-existing surveys appropriate for modification, the survey instrument (Appendix B) was developed iteratively by the research team, guided by existing literature on junior faculty development, transition challenges, and professional identity formation in academic medicine. It was reviewed by two EM faculty development and medical education experts to assess content validity, clarity, and relevance. The instrument was then pilot-tested with four early-career EM faculty who met inclusion criteria and then were excluded from the final study sample. Their feedback led to revisions in wording, layout, and flow, ensuring alignment with the conceptual framework and study objectives. While the survey was not formally validated through psychometric testing, expert input and pilot testing supported face validity and informed content refinement consistent with the conceptual framework.
The survey included five demographic questions followed by 17 content questions: 10 open-ended; 5 Likertscale items; and 2 open-text fields in a conclusion section. Content questions were grouped into five thematic sections: perceptions of the unwritten curriculum, and the four domains of Schlossberg’s transition theory (situation, self, support, and strategies). Each domain-based section included two open-ended questions and one Likert-scale question. A final concluding section invited participants to reflect on their overall transition experience and provide any additional comments they felt were relevant. Questions were presented in a fixed order to preserve conceptual coherence and minimize participant confusion. To ensure human (non-bot) responses, two simple challenge questions were embedded within the survey, prompting participants to perform basic tasks (eg, “four plus four”). Given the open-response format, instructions encouraged participants to respond freely without requiring a minimum word count.
Ethical Considerations and Reporting Standards
We obtained ethical approval from two institutional review boards (iRISID-2024-3224; HIRB00019708). Participants were invited to voluntarily complete an anonymous online REDCap survey, with consent implied by submission. No identifying information was collected to maintain confidentiality. Participants were not asked to provide feedback on the findings following study completion. This study adhered to the Standards for Reporting Qualitative Research, a synthesis of recommendations to ensure methodological rigor and transparency in the design, data collection, and reporting of qualitative findings (Appendix C).15
Research Team and Reflexivity Statement
The research team for this project consisted primarily of emergency physicians, along with one family medicine physician who contributed to project conception, data analysis
review, and final manuscript preparation. All team members (two male, five female) held MD degrees, with additional credentials including an MEHP, an MPH, and an EdD, reflecting diverse expertise. The research team represented two academic institutions. Most team members were junior faculty with strong interests and backgrounds in medical education, while three researchers were senior faculty who brought additional leadership and experience to the project, and one was an expert on qualitative research. Six of the seven authors trained at institutions different from their first academic job. We report no conflicts of interest and received no external funding.
Outcomes
The primary outcome of the study was thematic characterization of junior faculty perceptions and experiences related to the unwritten curriculum during early academic career transitions.
Data Analysis
We used computer-assisted qualitative data analysis software to review and analyze all qualitative data. Narrative analysis was based on content analysis, a qualitative method for classifying and categorizing textual information.16 Given the limited amount of literature on the unwritten curriculum particularly within academic medicine, categories were derived iteratively through close reading of textual data rather than through external thematic imposition. Two independent reviewers randomly reviewed and openly coded a subset of 50 randomly generated narrative responses. Following this, the lead researcher (INTIALS) developed a tentative codebook including code definitions and direct narrative quote examples. All 385 narrative responses were extracted and uploaded into Dedoose v9.0.107 (SocioCultural Research Consultants, LLC, Los Angeles, CA), a cloud application for managing, analyzing, and presenting qualitative and mixed method research data.1 We used the software to organize and manage narrative responses, apply manual codes, and facilitate code-based retrieval and analysis.
Two coders reviewed all responses, iteratively revising the codebook throughout textual content coding as appropriate. Coding discrepancies were reviewed collaboratively, and any disagreements that could not be resolved through discussion were adjudicated by a third member of the research team. The final codebook was limited to fewer than 20 codes, a strategy commonly used in content analysis. Not all reviewed comments were assigned a code; responses that were off topic, ambiguous, or unrelated to the study aims were excluded from thematic coding. Once coding was complete, we summarized content for each code and extracted quotes to include in the results reporting. Thematic analysis was conducted both for the survey’s narrative responses as a whole and separately for each individual question.
RESULTS
A total of 35 junior faculty members completed the survey. We collected demographic data (age range, sex, and practice location) to examine the diversity of representation of individuals and regions (Table 1). Participants represented a range of academic environments, including universityaffiliated tertiary-care centers, safety-net hospitals, and hybrid community-academic programs, spanning both 3and 4-year EM residency models. While most participants had educational or clinical leadership roles, their scholarly interests varied, with some pursuing research-oriented careers and others focused on education, administration, or quality improvement.
All 35 participants indicated that the unwritten curriculum had some degree of influence on their professional development during their first year as a faculty member (Figure 1). Figure 2 depicts the distribution of thematic codes across narrative responses. The six most salient themes are presented below in order of prevalence. Additional themes and illustrative quotations are summarized in Appendix A.
Mentorship and Peer Guidance
Mentorship and peer guidance emerged as the most salient theme in qualitative responses. Participants consistently emphasized the importance of access to both formal and informal mentors and the value of peer guidance in navigating their challenges as a new academic faculty member.
Formal Mentorship
Most participants spoke of the importance of departments using deliberate formal mentorship programs to better support junior faculty. One wrote, “Mentorship from senior faculty members has been invaluable in guiding my career path and providing insight into department culture.” Respondents yearned for senior faculty mentors not only with similar interests but also ideally with a nonjudgmental attitude and one “that works a similar clinical burden.” Several suggested that departments create formal mentorship programs pairing junior faculty with experienced mentors to “help clarify the unwritten rules and expectations.” Multiple participants also requested more frequent check-ins with formal mentors or senior faculty, particularly during their first year, citing performance metrics and clinical statistics as areas of interest to discuss.
Informal Mentorship
Beyond formal mentorship, most participants also emphasized the critical role of informal mentorship in easing their transition into academic faculty groups. One wrote:
Informal mentors that I identified and befriended throughout the assimilation process ended up helping me more than anything else.
Bierowski
Table 1. Demographics of junior academic emergency medicine faculty who completed a survey as part of a study of the “unwritten curriculum”—a set of implicit norms, values, and expectations.
South (AL, AR, DC, DE, FL, GA, KY, LA, MD, MS, NC, OK, SC, TN, TX, VA)
West (AK, AZ, CA, CO, HI, ID, MT, NV, NM, OR, UT, WA, WY)
*At some institutions, promotion to associate professor may occur after four years at the assistant professor rank, which explains the presence of associate professors within five years of residency completion.
promotion, academic prioritization, troubleshooting problems or unique situations on shift, “decoding cultural norms,” and learning about unwritten expectations or norms not formally communicated to faculty. Senior colleagues were the most frequently cited source of informal mentorship, although some also listed past colleagues, charge nurses, and other ancillary staff as sources of support and clarity. Participants suggested departments offer more opportunities for “informal ‘off the record’ candid discussions with senior or mid-career faculty,” citing “watercooler conversations” and social interactions as the most helpful informal channels that helped them learn insights not formally communicated.
Peer Guidance
While formal and informal mentorship provide crucial professional guidance and support, peer support offers a uniquely reciprocal and community-driven dynamic, fostering a sense of belonging, alleviating isolation, and addressing the emotional challenges of transitioning to an academic faculty role. “Connection with fellow junior faculty members” was frequently cited as the most helpful type of support during faculty transitions. One wrote, “Being lucky to find friends helping me navigate was my most important strength.” Some were surprised at their reliance on peers: “The most striking aspect of my transition was how much I had to rely on peers for guidance.” Participants consistently described the transition as overwhelming and isolating but emphasized that connecting with other junior faculty fostered camaraderie, facilitated advice exchange, and provided mutual support. Participants also found peer guidance useful in navigating topics such as salary transparency, project development, and clinical process clarity.
Implicit Expectations/Norms
Numerous participants revealed a range of implicit expectations and norms encountered while assimilating into new academic environments (Table 2).
Several participants expressed the utility of informal mentorship in navigating departmental dynamics. One wrote:
Formal training didn’t address how to navigate departmental politics, but informal conversations with peers and mentors filled in the gaps.
Other areas participants found informal mentorship helpful included strategies for career advancement and
These expectations spanned various categories, including the nuanced role of mentorship, the importance of networking to establish professional relationships, navigating the balance between autonomy and collaboration within academic teams, and engaging in extracurricular activities to demonstrate commitment beyond clinical or teaching responsibilities. When asked to reflect on crucial unspoken insights and how they acquired this knowledge, participants wrote “many insights often come from informal channels” such as peers, mentors, informal social events, and through experiential and observational learning. While many supported making implicit norms more explicit through resources like guidebooks or presentations, they acknowledged that full acclimation ultimately comes through time and experience.
Work-Life Integration
Participants identified work-life integration as a major challenge during the transition to faculty life (Table 3).
1. Perceived influence of the unwritten curriculum on professional development among junior academic emergency medicine faculty during their first year.
Figure 2. Distribution of thematic codes related to the unwritten curriculum across open-ended survey responses from junior academic emergency medicine faculty.
Figure
Table 2. Junior emergency medicine faculty perceptions of implicit expectations and institutional norms during early academic transition.
What specific expectations or norms have you encountered while assimilating into a new academic culture that were not formally communicated to you?
Sub-theme Definition(s) Supportive quotes
Mentorship The importance of informal mentorship
Being available to mentor residents
Networking Importance of networking to career advancement
Prioritization of informal events, not just formal ones
• “Mentorship also emerged as an essential part of the culture, though it was not always explicitly outlined. Senior faculty members often took a hands-on approach to providing guidance, but it was up to me to seek them out and foster those relationships.”
• “Constant availability for mentorship without clear acknowledgment or support”
• “I found that collaborating with certain key individuals in the department significantly boosts your reputation, but this wasn't openly discussed.”
• “I've learned that showing up to informal events and getting involved in the department's social life is just as important as the formal responsibilities. No one told me that being 'present' outside of the clinic or classroom would be so crucial for building connections and a solid reputation.”
• “It became clear that maintaining visibility by attending social events and informal gatherings was important for career progression.”
Balance between autonomy and collaboration
Importance of networking in research
• “I quickly learned that networking within the department is essential for securing research opportunities, something no one formally mentioned.”
• “Publishing papers often required collaboration with other researchers, and participating in joint projects or interdisciplinary teams was seen as a valuable way to build one’s academic reputation”
When to escalate/ask for help from a senior colleague and when to figure it out on your own
Extracurricular involvement Taking on academic tasks and responsibilities not outlined in contract
Taking on committee roles
Demonstration of leadership
Availability to work on resident projects
Increased involvement as junior faculty
Research
Clinical care
Expected patient flow and expectations of attending vs other staff
Sign-out culture
How to manage APNs
Number of patients per hour being higher than communicated
• “Knowing when to approach senior faculty for advice and when to take the initiative”
• “Unspoken norms included balancing autonomy with collaboration”
• “There was an underlying emphasis on autonomy, especially in managing clinical responsibilities and research projects, while simultaneously being expected to seek help when needed (a balance that wasn’t clearly communicated up front)”
• “I noticed that I was expected to take on some academic tasks and responsibilities on my own initiative, even without explicit rules.”
• “There was an unspoken expectation to take on additional committee roles to demonstrate involvement, which wasn't explicitly outlined during onboarding.”
• “There was an unspoken expectation to... demonstrate leadership, even if I was still adjusting to my role.”
• “Being available to work with residents on projects”
• “There's an unspoken understanding that junior faculty often take on more tasks to prove themselves, even though it wasn't spelled out.”
• “The research component/expectations and what that looks like”
• “The new academic culture also attaches great importance to the practicality and application of academic research.”
• “Expected patient flow. Expected responsibilities of the attending vs the other staff in terms of patient care - picking up supplies, cleaning the room, etc”
• “The sign-out culture is a big one.”
• “The hand-off culture and structure was not specified.”
• “The role of supervising APNs. I felt confused about how to manage with little guidance and nonexperience doing this previously.”
• “At my new institution the volume of patients was higher than communicated.”
• “Expected number of patients to see per hour/day.”
What specific expectations or norms have you encountered while assimilating into a new academic culture that were not formally communicated to you?
Sub-theme Definition(s)
Clinical care Attitude toward consultants, expectations for timely recommendations, and conflict mediation
Senior resident/attending interactions and level of supervision
Department culture Adapting to department’s culture
Norms about departmental politics
Communication Email etiquette, response times, and communication channels
Administrative Pay structure and buy down
Pay differences
Promotions
Work habits and productivity
Scheduling and shift trade culture
Supportive quotes
• “There is a much more laid-back attitude towards delays in consultant recommendations and how they communicate those recommendations.”
• “Delineated responsibilities between departments and who mediates disputes when informal discourse fails”
• “Culture regarding communication with surgical services (ie, attendings do not want to talk to ED attendings)”
• “Attending/resident relationship expectations”
• “Expectation from senior residents that I should not be ‘questioning’ their plans or focusing on teaching because they are prioritizing their speed and seeing the bulk of the patients in the department”
• “Lack of ownership of senior residents to take accountability to help teach and help their juniors on shift”
• “Adapting to the department's unique culture, values, and expectations”
• “I discovered unspoken expectations to prioritize departmental loyalty over personal boundaries.”
• “Publication and academic presentations are most valued. This was odd to me, coming from a more clinically focused residency.”
• “Hierarchy and role of senior EM leadership within the ED”
• “There were unwritten rules about how to navigate the hierarchy.”
• “Who mediates disputes when informal discourse fails”
• “Informal channels for communicating with administrators”
• “There's an implicit norm to respond promptly to emails, especially from senior faculty, even outside of standard working hours.”
• “I often have to cross-check my paycheck to make sure that things haven't been missed.”
• “The process of buy down”
• “There is often a pay gap in my shop between women and men.”
• “How academic promotions work”
• “Norms around work hours, flexibility, and productivity metrics”
• “The schedule of academic activities is often flexible.”
• “Schedule requests”
• “At my current institution if you don’t request (off for a holiday) you likely won’t get a “vacation” around then because you’ll be doing the in-between days.”
• “People are constantly paying each other to swap shifts.”
They described difficulty balancing clinical, teaching, research, administrative, and personal responsibilities, often citing a lack of preparation and unclear expectations. Subthemes included administrative burden, unspoken role expectations, competing demands, unequal clinical load, emotional labor, and the need for strategic time management. While some rspondents voiced concerns about long-term sustainability, others found fulfillment in the diversity of the role. Strategies such as prioritization, mentorship, and institutional support were noted as helpful in managing these pressures.
Cultural Adjustment
Another key theme was cultural adjustment, or adapting
to a department or institution’s unique culture and values, distinct from implicit expectations as it aimed to encompass broader institutional dynamics beyond individual roles. Many respondents found this to be the most challenging aspect of their transition, emphasizing the importance of navigating informal power dynamics and aligning with the cultural values of their institution. Others noted the unexpected influence of cultural norms on clinical practice, such as adjusting patient loads based on anticipated sign-out dynamics. One participant observed:
It took longer to integrate myself into the overall culture of the department, which is nuanced and constantly shifting.
Sub-theme Definition
Role complexity Juggling multiple expectations beyond clinical care
Administrative burden Challenges with paperwork, evaluations, and institutional processes
Unspoken expectations
Unclear or evolving job scope
Competing demands
Feeling pulled in many directions simultaneously
Strategic time use Triaging and prioritizing nonclinical work amid clinical duties
Clinical load disparities
Perceived higher workload for junior faculty
Sustainability and fulfillment Tension between burnout and professional satisfaction
Emotional labor Navigating interpersonal stress and emotional resilience
Support needs Calls for institutional recognition and support
Supportive quotes
• “Balancing clinical duties, teaching, and research feels overwhelming compared to the singular focus on patient care during residency.”
• “As a faculty member, the expectations shift significantly to include not only clinical practice but also a significant amount of teaching, research, service, and administrative work. The challenge lies in managing this balance. The pressure to excel in all these areas can be overwhelming, and there’s often no one-size-fits-all approach to finding that equilibrium.”
• “I quickly realized that the expectations for research, teaching, and administrative duties required a steep learning curve.”
• “Formal onboarding barely addressed the realities of juggling clinical work, academic expectations, and unspoken departmental norms…”
• “The most challenging aspect of being a faculty member compared to a resident is the increased administrative burden. As a faculty member, I have additional responsibilities like committee work, grant writing, and academic leadership roles. These responsibilities can be time-consuming and take away from clinical work and research.”
• “Managing administrative tasks and understanding institutional policies was never part of my training, making it a steep learning curve.”
• “It was challenging transitioning to this role, not just switching from a resident to faculty role but everything that comes with that—such as managing resident notes, filling out evaluations, participating in committees, putting out academic output for promotion, etc.”
• “There were unspoken expectations about how to balance clinical work, research, and teaching responsibilities.”
• “I think at first I was just going to be someone who came into work and went home—but the reality is, especially within academics, there is so much more expected of you that you don’t know until you start.”
• “It feels like there's always something else pulling my attention; and managing it all without neglecting any one part has been tough.”
• “Your attention is constantly being divided, yet you are still expected to be professional, teach residents and students, move the department to meet metric expectations, and escalate issues in a timely fashion. It’s an incredible amount of responsibility and pressure.”
• “The stress of being pulled in so many directions of patient care, medical student expectations, and often it feels like when you’re trying to do the right thing for patients it gets weaponized that you were unprofessional or crossed a line by asking questions.”
• “As time has progressed, I have a better understanding of what is essential to be completed in the short term, the near term, and the far term. This has helped me better triage what needs to get done now from a nonclinical perspective, which tends to be more porous RE deadlines. That skill is particularly important when I'm working a lot clinically and have little bandwidth.”
• “Junior faculty were working more clinically and often being asked to take on more than their senior colleagues.”
• “I just have recognized how hard it will be to sustain my career.”
• “While the workload can be demanding, I’ve grown to appreciate the diverse range of opportunities and challenges” …
• “It wasn't just about the technical aspects of the role but understanding how to deal with the emotional and social pressures of academia—whether it's the challenge of balancing work and personal life, or learning how to respond to the stress and frustrations of colleagues and students.”
• “A focus on work-life balance and acknowledgment of faculty contributions would also help [better support junior faculty].”
Table 3. Work-life integration challenges experienced by junior academic emergency medicine faculty
Mentorship and emotional intelligence also played critical roles in facilitating cultural adjustment. Strategies for success included establishing good relationships with staff, admitting when one doesn’t know something, and applying lessons learned from residency. Some found familiarity in cultures that mirrored their training, while others underscored the dynamic nature of academic environments that require adaptability and patience to navigate. However, many recognized that no amount of preparation could fully capture the unique and everevolving nuances of each institution’s culture.
Scholarly Output
Junior faculty consistently expressed stress about research and grant writing, frequently citing unclear expectations for scholarly output:
I encountered ambiguity around departmental expectations for research productivity.
And:
Unlike residency, there’s a greater expectation to contribute to the department’s academic output, which can feel daunting sometimes.
Navigating unclear expectations about publication frequency and the level of initiative required often depended on informal consultations with peers and senior faculty to clarify departmental norms. The emphasis on research output, sometimes perceptively valued over teaching, also added to the pressure. One faculty shared, “I am expected to produce double the publications per year that I was expecting.”
The stress of unclear research expectations was further compounded for many by an absence of formal training in essential skills such as study design, statistics, and grant writing. One wrote, “The research without formal training has been challenging.” Another suggested, “More formal support on research skills would help.” Despite these challenges, respondents acknowledged the potential of research as a vessel for career advancement, collaboration, and networking. One faculty noted the following:
Publishing papers often required collaboration with other researchers, and participating in joint projects or interdisciplinary teams was seen as a valuable way to build one’s academic reputation.
Many stressed the importance of protected time and institutional funding for research, for these greatly ease the challenge of balancing research with other professional responsibilities.
Onboarding and Role Transparency
Onboarding and role transparency were identified as critical areas for improvement. Many respondents cited gaps in their orientation, unclear role expectations, and a lack of open communication during the onboarding process as significant challenges. One participant described, “Orientation lacked any practical guidance on managing academic priorities, navigating politics, or finding mentors.” This lack of clarity extended to areas such as patient flow, staff responsibilities, committee expectations, promotion pathways, reporting measures, and bonus structures, often leaving faculty to rely on informal channels and experiential learning for information. “There are definite expectations for ‘new’ attendings, especially junior ones, that are not mentioned. True ‘onboarding’ often occurs on the job through direct experience, because these things are difficult to communicate in an official manner.” Many described this approach as insufficient and advocated for clearer communication, greater transparency, and more structured onboarding. One participant urged,
Overhaul the onboarding process. Being more open and transparent from the get-go about all procedures. Nothing should be hidden.
Other suggestions included guidance on reporting structures, salary models, and advancement pathways, along with practical supports like shadow shifts and documented job responsibilities.
DISCUSSION
This study highlights the role of the unwritten curriculum in shaping how junior faculty adapt to and navigate their new academic environments in EM. Unlike the hidden curriculum, which reflects broad institutional messaging, the unwritten curriculum identified in this study was characterized by situational, role-specific expectations that junior faculty described as needing to actively decode during early faculty transitions. While the results are presented thematically based on inductive coding, the findings align conceptually with Schlossberg’s transition theory. Themes related to clinical/ academic workload and institutional expectations reflect the “situation” domain. Feelings of unpreparedness and imposter syndrome align with the “self” domain, while mentorship, onboarding, and peer support represent aspects of “support.” Strategies such as seeking peer mentorship or navigating unwritten expectations correspond to the “strategies” domain. This alignment reinforces the utility of Schlossberg’s framework in understanding junior faculty transitions, even when themes emerge inductively.
A key finding of this study was the common experience of isolation and the common desire for a sense of belonging among new faculty. Although we did not collect demographic
Bierowski
data on race or ethnicity, prior studies have shown that minoritized faculty often face racism and disparities in development, promotion, and mentorship, contributing to greater feelings of isolation than their non-minoritized peers.18 Isolation has also been linked to imposter syndrome, which can impact work performance, clinical decision-making, and ultimately patient care and outcomes.18,19 Similarly, developing a sense of belonging has been recognized as a crucial factor in faculty engagement and career satisfaction across academic disciplines, highlighting its role in fostering collaboration, professional fulfillment, and overall retention.20-22 However, the barriers to faculty developing this sense of belonging have not been well explored.20
Given the centrality of belonging in early faculty experiences, institutions should take intentional steps to foster inclusive environments that reduce isolation. Structured onboarding programs should extend beyond logistics and compliance to include relational integration such as community-building sessions, faculty affinity groups, or cross-departmental peer networks. Additionally, new faculty should be explicitly welcomed into the academic culture through introductions at meetings, early involvement in committees, and transparent conversations about institutional norms and expectations. While such efforts may seem small, they are key in promoting psychological safety and cultivating a sense of professional identity and community.
Although most responses emphasized challenges and unmet needs, several participants also shared positive reflections on institutional or interpersonal support that helped facilitate their transition. These included the proactivity of department chairs in checking in with them, and their access to informal mentors, structured orientation programs, and strong peer communities. However, such examples were often framed as exceptions rather than standard practice, frequently described using terms such as “lucky” or “not everyone had this.” This pattern suggests that while effective structures do exist, they may be inconsistently implemented or inequitably distributed across departments.
Our findings suggest that new faculty benefit most from structured mentorship that includes clear expectations, defined career milestones, and frequent feedback. Given that responsibilities may shift rapidly within a faculty member’s first year, mentorship should be ongoing rather than episodic. Institutions should consider quarterly mentorship check-ins, structured six-month and one-year progress reviews, and faculty development programming tailored to early-career needs. Ideally, departments would offer incentives for mentorship participation; however, most academic hospital systems prioritize scholarship over citizenship within promotion criteria, making mentoring a lower priority.23 This imbalance can discourage faculty engagement in mentorship and exacerbate challenges in meeting academic expectations, particularly in scholarly productivity.
Because we did not systematically collect information on what formal structures were in place at each participant’s institution, it is difficult to determine whether certain supports (such as assigned mentors, regular check-ins, or orientation programs) were absent or simply experienced as ineffective. Several participants described having access to such structures “on paper” but lacking meaningful engagement or followthrough. Others noted that formal supports existed but felt this support was impersonal or misaligned with their actual needs. Accordingly, our recommendations should be interpreted as highlighting variability in implementation rather than universal absence of support.
Although mentorship was briefly referenced in one survey question and not formally defined, many participants used the term unprompted in their responses, indicating its salience in early faculty experiences. Their reflections suggest that mentorship needs to extend beyond traditional academic guidance to include role modeling, advocacy, and help interpreting institutional culture. National survey data highlight the same variability, with fewer than half of EM departments reporting formal mentoring programs, inconsistent structures and training, or recognizing the association of strong mentoring practices with greater scholarly productivity and National Institutes of Health funding.24 In our survey, participants described a wide range of mentorship experiences, reinforcing the need for relationshipcentered, longitudinal mentorship that supports both professional and personal development.
Notably, some participants expressed a desire for senior mentors who shared similar clinical burdens, highlighting a tension between expectations and the reality of academic progression. Rather than reflecting individual shortcomings, these perspectives underscore the importance of transparent mentorship conversations about role evolution, competing demands, and the multidimensional nature of academic success.
While formal mentorship has long been recognized as a cornerstone of faculty development, our findings suggest that peer-support structures are equally critical in fostering professional belonging and resilience. Many participants described relying on peer support to bridge gaps left by formal orientation programs, with some considering themselves “lucky” to find supportive colleagues; this raises the question of whether faculty integration should be left to chance or whether institutions can take deliberate steps to foster meaningful connections. Our findings suggest that structured interventions, such as peer mentorship programs, faculty learning communities, and intentional networking opportunities, may help mitigate early-career isolation and improve professional satisfaction. Similar to our participants’ reliance on peer networks, prior qualitative work has shown that early professional socialization hinges less on formal orientation and more on the quality of senior colleagues’ interactions, with approachable and supportive behaviors
from consultants fostering a safe learning environment while ineffective or dismissive behaviors undermine it.25 Peer mentorship can also be highly effective when new faculty mentor each other by sharing insights, fostering collaboration, strengthening relationships, and enhancing scholarly productivity.26 Peer-driven affinity groups and specialty-specific networks may further support early-career development.27
Another key finding was the challenge of meeting scholarly expectations, which raises questions about gaps in residency training, faculty development, or both. Many participants felt unprepared for research responsibilities in academia, suggesting deficiencies in residency research training. While barriers to scholarly productivity during residency are well studied, fewer studies have examined faculty challenges post-transition.28-39 Prior work suggests that structured research opportunities and institutional investment may improve preparedness for academic careers, although similar factors in EM remain unclear.39-42 These findings support a dual approach that includes both improved research training during residency and structured faculty development addressing scholarly productivity and promotion expectations.
Finally, many studies highlight the challenge of balancing work and home life and finding strategies to ease this burden.43-48 However, few respondents in our study mentioned difficulties integrating personal and professional responsibilities; instead, nearly all focused on the challenge of balancing academic and clinical duties. While we did not collect detailed family demographic data, this finding suggests that early-career stress for this cohort was driven primarily by competing professional demands, highlighting another dimension of the unwritten curriculum.
LIMITATIONS
While our sample was geographically diverse, it may not fully represent the breadth of experiences across all academic EM programs, and institutional identifiers were not collected to preserve anonymity. Thus, we cannot confirm that all responses came from distinct institutions, although participants were recruited broadly and not intentionally sampled from the same sites. Most participants were personally known to at least one member of the research team, which may have introduced selection bias by oversampling individuals with similar professional interests or greater engagement with medical education scholarship.
Although all participants were within their first five years of academic practice, five held the rank of associate professor; their advanced rank may reflect prior experience or faster promotion and could have biased responses toward more successful transitions and greater familiarity with the academic environment. Neither did we elicit fellowship training status and faculty size were, which may influence comfort with academic expectations and access to mentorship.
The survey was administered in a fixed order, opening potential for respondent fatigue; however, analysis of character counts across open-ended responses showed no decline in response length over time. The final, mandatory, open-ended question under the “strategies” domain had a higher average character count (275.8) than both the first open-ended question in the survey (206.4) and the first domain-based question under “situation” (234.5), suggesting minimal evidence of fatigue-related decay. Some participants may have provided more concise answers than they would have in a verbal format, potentially limiting the depth of certain narratives.
Future research could build on our findings by exploring how faculty experiences evolve beyond their initial transition period and assessing whether structured mentorship and faculty development initiatives lead to measurable improvements in career satisfaction, scholarly productivity, and long-term retention.
CONCLUSION
The findings of this study underscore the potential impact of the unwritten curriculum on junior faculty experiences in academic emergency medicine. Providing clear guidance, fostering structured mentorship, and supporting scholarly growth are essential to ensure that new faculty members thrive in their roles. Additionally, the disconnect between scholarly expectations and faculty preparedness highlights an area for improvement in both residency training and faculty development programs. Faculty success should not depend on luck or chance; by prioritizing mentorship, transparency, and structured career development, institutions can create an environment where junior academic faculty do not merely survive but rather excel early in their careers. Taken together, these findings function as a needs assessment that identifies actionable targets for improving onboarding and early faculty development in academic emergency medicine.
Address for Correspondence: Abagayle Bierowski, MD, MEHP, Thomas Jefferson University Hospital, Department of Emergency Medicine, 1020 Sansom Street, Thompson Building - Suite 1615, Philadelphia, PA 19107. Email: abagayle.bierowski@jefferson.edu.
Conflicts of Interest: By the WestJEM article submission agreement, all authors are required to disclose all affiliations, funding sources and financial or management relationships that could be perceived as potential sources of bias. No author has professional or financial relationships with any companies that are relevant to this study. There are no conflicts of interest or sources of funding to declare.
1. MacNeil KA, Regehr G, Holmes CL. Contributing to the hidden curriculum: exploring the role of residents and newly graduated physicians. Adv Health Sci Educ Theory Prac. 2022;27(1):201-213.
2. Chapman AB, Guay-Woodford LM. Nurturing passion in a time of academic climate change: the modern-day challenge of junior faculty development. Clin J Am Soc Nephrol. 2008;3(6):1878-1883.
3. Karademos, JE, Yarris LM, Jordan J, et al. Faculty development and the emergency medicine educator: a national needs assessment. J Emerg Med. 2023;65(1):17–27.
4. Farley H, Casaletto J, Ankel F, et al. An assessment of the faculty development needs of junior clinical faculty in emergency medicine. Acad Emerg Med. 2008;15(7):664-668.
5. Erstad BL, Blakely CG, Romero A, et al. Best practice strategies for retaining faculty during times of rapid change. Am J Pharm Ed 2023;87(11):100579.
6. Burton JL. The autopsy in modern undergraduate medical education: a qualitative study of uses and curriculum considerations. Med Educ 2003;37:1073-1081.
7. Rauf A, Fatima F, Gilani R, et al. Development and validation of a questionnaire about hidden curriculum in medical institutes: a pilot study. Front Med. 2023;10:996759.
8. Lawrence C, Mhlaba T, Stewart KA, et al. The hidden curricula of medical education: a scoping review. Acad Med. 2018;93(4):648-656.
10. PA Harris, R Taylor, R Thielke, et al. Conde, Research electronic data capture (REDCap) – A metadata-driven methodology and workflow process for providing translational research informatics support. J Biomed Inform. 2009;42(2):377-81.
11. PA Harris, R Taylor, BL Minor, et al. REDCap Consortium, The REDCap consortium: building an international community of software partners. J Biomed Inform. 2019;95:103208.
12. Schlossberg NK. Counseling Adults in Transition: Linking Practice with Theory. Princeton, NJ: Springer Publishing Co. 1984.
13. Narayan R, Rodriguez C, Araujo J, et al. Constructivism— constructivist learning theory. In: Irby BJ, Brown G, Lara-Alecio R, and Jackson S. (Eds.), The Handbook of Educational Theories Charlotte, NC: Information Age Publishing. 2013:159-183.
14. Saunders B, Sim J, Kingstone T, et al. Saturation in qualitative research: exploring its conceptualization and operationalization. Qual Quant. 2018;52(4):1893-1907.
15. O’Brien BC, Harris IB, Beckman TJ, et al. Standards for reporting qualitative research: a synthesis of recommendations. Acad Med 2014;89(9):1245-1251.
16. Hsieh HF, Shannon SE. Three approaches to qualitative content analysis. Qual Health Res. 2005;15(9):1277-1288.
17. SocioCultural Research Consultants, LLC. Dedoose Version 9.0.17, cloud application for managing, analyzing, and presenting qualitative and mixed method research data. 2021. Available at: www.dedoose. com
18. Campbell KM. Mitigating the isolation of minoritized faculty in academic medicine. J Gen Intern Med. 2023;38(7):
19. Huntwork MP, Myint MT, Simon E, et al. Perceptions of communities of practice and sense of belonging: focus groups of academic pediatric raculty. Cureus. 2024;16(7):e63605.
20. Stanford News. The Stanford Six: building a supportive faculty peer mentoring group. 2023. Available at: https://news.stanford.edu/ stories/2023/02/the-stanford-six. Accessed: February 8, 2025.
21. Burhan Q, Malik MF. Concept of workplace camaraderie: developing and testing an integrated model leading to incivility. Int J of Conflict Management. 2024;35(3):453-470.
22. Levy BD, Katz JT, Wolf MA, et al. An initiative in mentoring to promote residents’ and faculty members’ careers. Acad Med 2004;79(9):845-850.
23. Welch J, Sawtelle S, Cheng DP, et al. Faculty mentoring practices in academic emergency medicine. Acad Emerg Med. 2017;24(3):362370.
24. Goodall K, Boyle AA, MacKenzie R. Qualitative study of new doctor induction and socialization. Emerg Med J. 2024;41(9):532-537.
25. Jacelon CS, Zucker DM, Staccarini JM, et al. Peer mentoring for tenure-track faculty. J Prof Nurs. 2003;19(6):335-338.
26. Gaetke-Udager K, Knoepp US, Maturen KE, et al. A women in radiology group fosters career development for faculty and trainees. AJR Am J Roentgenol. 2018;211(1):W47-W51.
27. Dennis M, Batalini F, Demers L, et al. Overcoming barriers to resident scholarly productivity and research at a large academic institution. MedEdPublish. 2019;8(1):213.
28. Rothberg MB, Kleppel R, Friderici JL, et al. Implementing a resident research program to overcome barriers to resident research. Acad Med. 2014;89(8):1133-1139.
29. Takahashi O, Ohde S, Jacobs JL, et al. Residents’ experience of scholarly activities is associated with higher satisfaction with residency training. J Gen Intern Med. 2009;24(6):716-20.
30. Merino T, Rojas V, Fuentes-López E, et al. Barriers for research activities in residency programs: a mix-methods study. Medwave 2023;23(1):e2627.
31. Faber LS, Jurado M, Bennett-Perez R, et al. Scholarly activity and research training in urology residency programs: assessment of current practice and barriers. Urology. 2022;168:41-49.
32. Hames K, Patlas M, Duszak R. Barriers to resident research in radiology: a Canadian perspective. Can Assoc Radiol J 2018;69(3):260-265.
33. Ho AH, Sansevere MJ, Chou JC. Barriers to research among residents in oral and maxillofacial surgery. J Dent Educ 2024;88(6):755-764.
34. Carter S, Liew S, Brown G, et al. Barriers to completion of research projects among orthopaedic trainees. J Surg Educ. 2018;75(6):16301634.
35. Fournier I, Stephenson K, Fakhry N, et al. Barriers to research among residents in otolaryngology—head & neck surgery around the world. Eur Ann Otorhinolaryngol Head Neck Dis
Bierowski et al. Enhancing Junior Faculty Development in Academic EM 2019;136(3S):S3-S7.
36. Canadian Plastic Surgery Research Collaborative (CPSRC). Barriers and attitudes to research among residents in plastic and reconstructive surgery: a national multicenter cross-sectional study. J Surg Educ. 2017;74(6):1094-1104.
37. Jaroonvanichkul V, Deerojanawong J. Residents’ obstacles and attitudes toward research during residency training. J Med Assoc Thai. 2016;99(2):239-44.
38. Gangwish DJ, Parshall CA, Qeadan F, et al. Predictors and barriers to faculty scholarly activity in United States urology residency programs. Urology. 2020;139:37-43.
39. Beeson MS, Barton MA, Reisdorff EJ, et al. Comparison of performance data between emergency medicine 1-3 and 1-4 program formats. J Am Coll Emerg Physicians Open. 2023;4(3):e12991.
40. Ehmann MR, Klein EY, Kelen GD, et al. Emergency medicine career outcomes and scholarly pursuits: the impact of transitioning from a three-year to a four-year niche-based residency curriculum. AEM Educ Train. 2020;5(1):43-51.
41. Sullivan JF, Keck JW, Stephens MB, et al. Increased scholarly activity: a benefit of 4-year family medicine residencies. Mil Med 2023;188(3-4):e479-e483.
42. Shanafelt TD, Boone S, Tan L, et al. Burnout and satisfaction with work-life balance among US physicians relative to the general US population. Arch Intern Med. 2012;172(18):1377-85.
43. Mitra LG, Sharma J, Walia HS. Improving work-llfe balance and satisfaction to improve patient care. Indian J Crit Care Med 2024;28(4):326-328.
44. Pudasaini S, Schenk L, Möckel M, et al. Work-life balance in physicians working in two emergency departments of a university hospital: results of a qualitative focus group study. PLoS One 2022;17(11):e0277523.
45. Parida S, Aamir A, Alom J, et al. British doctors’ work-life balance and home-life satisfaction: a cross-sectional study. Postgrad Med J 2023;99(1169):198-206.
46. Skotnicki BS, Wilson PM, Kazmerski TM, Pet al. Work-life integration for women in pediatric emergency medicine: themes identified through group level assessment. Pediatric Emerg Care. 2024;40(1):71- 75.
47. Skotnicki BS, Wilson PM, Kazmerski TM, et al. Gender differences in work-life integration, career satisfaction, and burnout in pediatric emergency medicine physicians: a cross-sectional analysis. Pediatr Emerg Care. 2024;40(6):480-485.
Original Research
9-1-1 Call Data Modeling to Assess the Influence of a Mass Gathering on Host Community Metrics for Syndromic Surveillance
Arthur H. Yancey, II, MD, MPH*
Elijah Robinson, MD*
Timothy McMahan, AAS†
George A. Cotsonis, MA‡
Section Editor: Lesley Osborn, MD
Emory University School of Public Health, Department of Biostatistics, Atlanta, Georgia * † ‡
Emory University, School of Medicine, Department of Emergency Medicine, Atlanta, Georgia
Grady Emergency Medical Services Information Systems, Atlanta, Georgia
Submission history: Submitted October 13, 2025; Revision received April 23, 2026; Accepted April 27, 2026
Electronically published June 16, 2026
Full text available through open access at http://escholarship.org/uc/uciem_westjem
DOI: 10.5811/westjem.53142
Introduction: Multi-day planned mass gatherings are prevalent in various forms of sports competitions, concerts, professional, political, and religious conferences. The largest, the World Cup competition, will be hosted by large cities of the United States, Canada, and Mexico in June and July, 2026. These can present risks to the health of spectators, participants, organizers, and host communities, which if discovered faster, facilitates more effective responses in preventing morbidity/ mortality. This study demonstrates visually modeled 9-1-1 medical data that uniquely contributes to existing syndromic surveillance activities by its practicality and time sensitivity.
Objectives: Using data from the nine-day period of 2019 Super Bowl LIII festivities, this retrospective, quantitative, descriptive, population-based study was conducted to demonstrate how 9-1-1 emergency medical dispatch (EMD) data could be practically modeled to more rapidly detect changes from baseline host community 9-1-1 data. Our ultimate objective is to illustrate these visual models in the attempt to improve syndromic surveillance.
Methods: All 9-1-1 medical calls from three host municipalities were processed and categorized at the Grady Emergency Medical Services (EMS) Communications Center during game day and eight preceding days of festivities (time frame-standardized to nine-day events period). This events period call volume was contrasted to that of the identical nine-day pre- and post-events periods. The mean 24 one-hour interval call volumes for each day of these three periods were analyzed. Data visualization techniques (a data table, bar graphs, geo-, and heat-mapping) were constructed to illustrate differences in 9-1-1 call volumes of three categories (hypothermia, traffic injury incidents, and violence-induced injuries), for the three periods. The most similar previous such studies were reviewed and related to our study.
Results: The events period call volume (3,267) was less than that in pre- (3,356) and post-(3,460) events totals. Directional (increasing versus decreasing) patterns in hourly call frequencies were similar among all three periods. Cold exposure calls decreased across the three periods (successive period were 9, 7, and 4 respectively). Changes in traffic incidents were minimal (36, 39, and 38, respectively). Violent act injury calls increased during the post-events period (151, 150, and 166, respectively).
Conclusion: Data from 9-1-1 calls could provide readily discoverable trends reflective of clinically significant syndromes threatening host community health status associated with planned mass gatherings. The study demonstrates practical data modeling to enhance syndromic surveillance. Recommendations are offered for enhancing 9-1-1 data analysis in conducting syndromic surveillance.[West J Emerg Med. 2026;27(4)1062–1072.]
INTRODUCTION
The 2019 Super Bowl LIII and its multi-day, pre-game festivities, which were held in the City of Atlanta, Georgia and surrounding municipalities, presented the opportunity to assess the feasibility of using 9-1-1 emergency medical dispatch (EMD) data for improving syndromic surveillance of planned mass gatherings and their host communities. Syndromic surveillance includes public health-related activities that involve data collection and analyses to rapidly identify and, if necessary, respond to injury and disease outbreaks.1
Although the Super Bowl championship game was played in Atlanta, there is a large event-related entertainment venue in the City of College Park. Furthermore, the necessity of traversing a contiguous third municipality (East Point) to reach College Park from Atlanta provided the rationale for its study inclusion. At the time of Super Bowl LIII, 540,000 citizens of, and visitors to, these municipalities were potentially exposed to and could have been affected by health threats associated with the events festivities. All 9-1-1 medical calls from these three municipalities are routed to the Grady EMS (GEMS) Emergency Communications Center for standardized processing through the EMD call-processing software program.
The Super Bowl LIII Game and pre-game festivities were hosted across a nine-day period in the late January-February 2019. Concerts, festivals, parties, awards ceremonies, military aerial exhibitions, permitted rallies, and protests were held preceding the championship game. According to a mediabased report, “more than one-half million people went to Super Bowl Experience and Super Bowl Live.”2 There were no known official estimates of attendance at > 100 related overlapping events held at various times across the nine days,2 Following this multi-day, multi-festivity mass gathering, the host cities’ 9-1-1 EMD total call volumes, selected specific types, call-time periodicity, and geographic patterns of call origin were investigated to search for data patterns that could have represented threats to community health status. The resulting data were modeled for practical vision-based analysis, in a search for possible roles in conducting mass gathering syndromic surveillance.
The near real-time analysis of 9-1-1 EMD data can provide unique potential contributions to public health surveillance. The term, “practical significance,” refers to variations in events and/or comparison period call volumes that are large enough to threaten or actually deplete community healthcare resource availabilities.The immediate and continual access to data, as events evolve, could lead to earlier discovery of health threats. This should enhance mobile response resource re-positioning, future strategic resource planning, as well as etiology investigation for syndrome mitigation.3 These characteristics are critical to improving lifesaving response measures.
Published investigations pertaining to use of EMD data for enhancing population-based syndromic surveillance
Population Health Research Capsule
What do we already know about this issue?
Research is sparse regarding the potential contribution of 9-1-1 call data to syndromic surveillance in the setting of mass gatherings.
What was the research question?
Can modeling be designed to display evolving statistics for timely detection of threatening health trends?
What was the major finding of the study?
Data are modeled in a table, bar graphs, a time-period graph, geographic point, and heat maps.
How does this improve population health?
9-1-1 call data could be used to detect and track health threats as they relate to their boundary areas, direction, speed, and density.
for mass gatherings are few and nonevidence based. Only two are Super Bowl-based. These provide documentation of surveillance resources from which morbidity data was collected. No host community-based EMD data was provided. Plans for collecting this data was mentioned in one study.4 A retrospective Canadian study covering public health surveillance of the 2018 G7 Summit reported no increases or differences in specified call types into Info-Sante. Preselected categories of clinical call type were listed without corresponding call volume data.5 A scoping Dutch review of combined utility of emergency call center, dispatch, and ambulance data was executed for syndromic surveillance limited to infectious diseases, and not focused solely on or mainly for mass gatherings.6
Conclusions drawn by interviewing participating experts were that EMD surveillance timeliness was most advantageous, followed by cost efficiency, convenience, and data standardization. The public health implication in these articles is that 9-1-1 EMD data analysis may enhance other more traditional, less time- sensitive sources and modes of public health surveillance by contributing the aforementioned attributes. Our study uniquely displays modeling of this readily generated, easily visible, medically standardized and categorized call volume data, to rapidly facilitate discovery of threatening trends, their medical nature, and geographic traits of size, density, rate and direction of spread. Our display of real call volume statistics also reveals the visibly minimal differences that categorical comparisons illustrate during uneventful baseline periods.
Yancey
The intent of this study is to demonstrate the transformation of 9-1-1 medical calls data from this multiday mass gathering and its host communities into visible surveillance formats that are easily comprehended, and then describe the qualitative analysis contrasting results in three distinct standardized time frames of nine days each: before (pre-events); during (events); and after (post-events). The subsequent discussion includes recommendations by which visible modeling of this data may enhance syndromic surveillance in the service of mass gathering and host community health protection.
METHODS
Data Source and Collection
This retrospective study is based on secondary data collected by GEMS EMD call processing. The Priority Dispatch Corp.’s International Academy of Emergency Dispatch (IAED), Medical Priority Dispatch System (MPDS) software protocols are used by GEMS’ communication center personnel to process each 9-1-1 medical call.7 The callers answer telecommunicator-directed questions from the standardized MPDS V13.1 protocols. Answers are classified using IAED-designed electronic classification of answers. For example, all call questions related to cold exposure are listed in protocol 20. The corresponding answers are translated into programmatically matched standardized category codes that identify standardized sets of response resources to be sent to patient locations, thereby, optimizing system effectiveness and efficiency. Telecommunicators simultaneously provide the callers with standardized scripted instructions for efficient bystander-provided patient care appropriate to the telephonic setting. No duplicate calls are included in the reported call volumes, as digital call batching through electronic capture of caller location/address and confirmatory call processing eliminates recurrent calls about the same incident. “False alarms” are never classified as such through 9-1-1 calls, and a physical response to the caller location is dispatched for disposition and EMS classification. The data resulting from processing these calls was categorized digitally by MPDS v13.1 at GEMS, through use of Microsoft Access.
Organization of Study Population Data
The assessment of the event’s effect on 9-1-1 call demand for EMS services was designed and organized as follows. The total medical call volume during the nine-day events period (01/26/2019 – 02/03/2019) was contrasted with those of the nine-day pre- (01/17/2019 – 01/25/2019) and nine-day post(02/04/2019 – 02/12/2019) events periods. The study time frames were unified according to the nine days (events period) that encompassed all Super Bowl-related activities. Methods for more detailed investigation of the temporal effects of events period festivities on call volumes were conducted by analyses of the collated 24 one-hour interval 9-1-1 call volumes for each day of the events period compared to those same one-hour
intervals of the daily pre- and post-events periods.
The following three specific medical emergency types from four MPDS v13.1 software protocols were selected, based upon the theoretical likelihood of their increased rates during the events period, and more important to the integrity of the study, linkage to the likelihood of their timely optimal initial discovery and thorough data documentation by way of 9-1-1 call capture and processing.
1) Hypothermia (MPDS Protocol 20) from cold exposure was included because most event activities were held outdoors at this winter event. The average minimum daily temperatures in each period were collected for correlation with period-based hypothermia call volumes.
2) Traffic/transportation injuries (MPDS Protocol 29) were included in anticipation of a concentrated influx of motor vehicles and vehicle-pedestrian interfaces in the ambulatory population-concentrated central portion of the city, where most outdoor festivities were held.
3) Violence, including stabs/gunshots (MPDS Protocol 27), and assault (MPDS Protocol 4) categories, was included in anticipation of a social environment of tense emotions from festivities-related revelry and competition rivalry8 .
Data Visualization Designs
Data were summarized in a table and plotted in the form of bar charts to facilitate formation of visual impressions of contrasts between total call volumes in the events period and the baseline comparison (pre- and post-events) periods. Since the data collected represented emergency care demand from the entire stable population of the three host municipalities, statistical tests and confidence intervals are not appropriate or necessary. Data presented here are descriptive and should not be used to infer results at any other event. The data analysis was conducted to search for contrasting meaningful differences among the three periods. The practical significance used refers to results large enough to matter in real world applications. In this study, such significance was reached only if increase(s) in 9-1-1 call-mediated demand for emergency clinical care resources occurred to a degree that it threatened to deplete, or actually depleted, the availability of routinely assigned community EMS resources.
Two mapping techniques were applied to the data to detect incident clustering. Heat mapping was used to contextually visualize the total 9-1-1 call volume geographic densities for all three periods.9 With this technique, each mapped incident serves as the center of a radius that expands to areas of overlap with its neighboring incidents. Through degrees of color shading, each neighboring incident, therefore, had a contextualized visual relationship with all other neighbors, such that the heatmapping provided immediate visual impression information on call location density trends.
Geographic point-mapping of each of the three types of categorized 9-1-1 calls (ArcMap 10.7.1 software), can include measures of call location spacing, with use of a distance scale.
This technique can facilitate formation of traceable patterns of density through display of comparative syndrome progression/ regression of incidents across time by sequentially re-mapping evolving data with the same template. Practically significant differences throughout the comparisons of period data groups refer to whether EMS resources designed and purposed for the routine level out-of-hospital care for the public were threatened with depletion by a surge or surges in 9-1-1 call demand volume and/or call concentration beyond the capacity for a host jurisdiction to provide them.
The Emory University Institutional Review Board deemed this study exempt from IRB review, because it was “not human subjects research.”
RESULTS
Call Demand and Time Distribution
Total call volume during the events period decreased relative to the pre- and post-events periods (Figure 1).
Heat maps did not reveal visible differences in call volumes or geographic patterns of call concentrations among pre-events, events, and post-events periods (Figure 2).
The total hourly call-demand counts revealed similar trends in the three periods, throughout the 24 one-hour time frames (Figure 3).
The highest one-hour interval total of 9-1-1 medical calls in the nine-day events period occurred from 3 pm – 4 pm. This total did not exceed either of the peaks in the two comparison
1. 9-1-1 medical calls of the 9-day pre-event, event, and post-event periods for the evaluation of the study mass gathering’s influence on the host community’s total call volume.
2. Heat maps illustrating densities of total 9-1-1 medical call locations for the pre-event, event, and post-event periods to evaluate the influence of the study mass gathering on the host community’s call volume.
Figure
Figure
Figure 3. Hourly mean 9-1-1 medical call counts for the pre-event, event, and post-event periods to evaluate the influence of the study mass gathering on the host community’s call volume.
periods in any one-hour interval. The lowest one-hour call volume was in the events period from 4 am – 5 am.
Call Types
Cold exposure injury calls analysis illustrates the declining volumes of 9-1-1 calls in the three successive study periods (Figure 4).
The average minimum daily temperatures were 35.78 °F. in the pre-events period, 33.11 in the events period, and 46.78 in the post-events period, with no meaningful
Figure 4. Cold exposure 9-1-1 medical calls for the pre-event, event, and post-event periods including number of calls and percent of these calls for each period to evaluate the influence of the study mass gathering on the host community’s call volume.
differences in period call volumes that correlated with the minimal temperatures among the three periods.
The number of injury-related traffic incidents in the preevents period was lower than those in the events and postevents periods (Figure 5).
The increase during the events period, remained in the post-events period. The subset of pedestrian vs. vehicle crashes and their subsequent related 9-1-1 calls eradicated the minimal variation in the preceding pattern (Table 1).
Violent acts, resulting in traumatic injury-related 9-11 calls, revealed marked similarity between the pre-events period and the events period. (Figure 6).
An increase was evident in the post-events period, compared to the two preceding periods. Self-inflicted incidents
by stab and gunshot were practically insignificant when compared to each period’s categorical numbers (Table 1), and they did not change the preceding trend when these were extracted from totals in each of the three violent trauma time periods. Point geo-mapping of the foregoing three categories in each of the three time periods did not illustrate changes in period density patterns (Figure 7).
DISCUSSION
Study Interpretations
This study demonstrated how 9-1-1 EMD data could be displayed for efficiently surveying the host community’s evolving emergency health status and how these corresponding displays could lead to earlier discovery of
5. Traffic/transportation 9-1-1 medical calls for pre-event, event, and post-event periods including number of calls and percent of these calls for each period to evaluate the influence of the study mass gathering on the host community’s call volume.
Table 1. Call volume categories of the nine-day pre-event, event, and post-event periods include undifferentiated totals, cold exposure, traffic collision/transportation incidents, and violence/intentional injuries, in a study that evaluated the extent to which these morbidities adversely affected the host community through call volume expansion. Number of calls and percentage of totals are reported.
Figure
Figure 6. Violent incident 9-1-1 medical calls for the pre-event, event, and post-event periods, including number of calls and percent of these calls for each period, to evaluate the possible influence of the study mass gathering on the host community’s call volume.
Figure 7. ArcMap 10.7.1 geographical maps illustrating 9-1-1 cold, traffic, and assault injury call locations across the pre-event, event, and post-event periods to evaluate the influence of the study mass gathering on the host community’s density of type-specific call volume.
time-sensitive threats than traditional methods of surveillance, if both were compared to baseline health status. Further studies based on the following data classifications and visual depictions hold important implications for improving mass gathering EMS surveillance planning.
Although non-specific in pertaining to medical information, unexplained total call volume expansion could be crucial and easiest to discover in first alerting respective telecommunications, medical, and public health officials of the need to initiate more detailed investigation of etiology. No meaningful (practical) differences in the call volumes’
peaks and valleys among this study’s events periods were found. The similar trends of events’ and comparison periods’ hourly call volume dipping lowest at the 5 am period could be accounted for by visitors and citizens alike being indoors, asleep, and at low risk for sustaining emergencies. Similarly, the hourly call volume during the events period peaked at 4 pm, equaling the similar trend in the post-events period, and exceeding that in the pre-events comparison period. This peak possibly reflects the time of maximal movement of pedestrian and vehicular traffic in the event period, corresponding to the onset of afternoon vehicular “rush hour,” as well as that
of social interactions involving ambulatory event visitors leaving daytime festivities, in transition to subsequent evening festivities, leaving them susceptible to pedestrian-vehicular interface incidents.
Multiple festivities, occasionally simultaneous, occurred throughout the events period. This hourly data measure is valuable in revealing a more granular temporal pattern of tracking related medical emergencies than the daily volumes, facilitating associations of 9-1-1 hourly incident patterns with scheduled and unscheduled event activities. The logical actionable responses to such linkable patterns would be the provision of safety information and instructions to the public about associated risky time periods and their associated possible dangers. The optimal prepositioning of resources and professional responders for injury prevention and time-sensitive responses should also exhibit improvement. Contingency planning for future similar events should include detection measures from 9-1-1 medical call volume monitoring, as depicted herein.
Cold exposure injuries are a prominent possibility at this annual event, given the usual cold weather in the greater Atlanta area and most Super Bowl host communities during their winter season. The decreased volume of cold exposurerelated calls is possibly reflective of effective sheltering and clothing provision in reaction to the near- but above-freezing temperatures in the pre-events and events periods, and a warming trend in the post-events period. The extremely small call numbers in each of the three categories prevent declaration of trends of population importance.
The 9-1-1 calls in the traffic/transportation events period superseded that in the pre-events period by three calls, which was of no practical consequence to the host population’s collective health status. The absence of a subsequent decrease in traffic/transportation calls in the post-events period suggests that the occurrence of Super Bowl LIII did not contribute to an increased risk of motor vehicle crashes. The subset of 9-1-1 calls for pedestrian versus vehicle traffic incidents (Table 1) showed no meaningful difference throughout the three periods of study. Comparative dampening of the increase in traffic incidents during the crowded events period was possibly related to increased congestion preventing comparative high speeds, an increased law enforcement presence, and/or street traffic blockages during the events period, reducing speeding and distracted driving.
Tension related to passionate team loyalty and associated rivalry, as well as gambling, is thought to be associated with violence surrounding various sporting events.8 An increase in the calls reporting aggregated assaults, gunshots, stabbings, and self-inflicted injuries was documented in the post-events period, compared to both previous periods. Subtracting self-inflicted stabs and gunshots did not erase this pattern of increase (Table 1). This increased frequency suggests the need for future use of special event law enforcement protocols, implemented across study periods to guide investigations of
events-related (versus non-events related) causes. The study did not reveal study periods evidence of adverse events of a magnitude that would threaten depletion of community response resources. Table 1 and Figures 4, 5, and 6 reflect call volumes of specific types and their small percentages (between 0.21%–4.80%) of all calls within their time periods.
Studies on the Role of 9-1-1 Call Data in Syndromic Surveillance
The organizational structure of the study data visualization models of the foregoing results uniquely incentivizes focus on the issue of 9-1-1 medical data’s role in potential contributions to community syndromic surveillance during planned mass gatherings. The following related publications are few, with either focus on the relationship of 9-1-1 data to syndromic surveillance or the relationship of syndromic surveillance to mass gatherings, but none of them describing and evaluating the role of 9-1-1 data in syndromic surveillance for mass gatherings, as in the present study. A pioneering study of the relationship of using 9-1-1 calls to track influenza-like illness was implemented in New York City by the health department, in 19981.0 This evolved into an investigation of the dispatch center data utility for detecting bioterrorism events that manifest with a respiratory component, such as the inhalational anthrax attacks of 2001. A thorough 2022 scoping review of global scale was executed covering syndromic surveillance systems for mass gatherings, investigating their methodologies (data collection and related analysis) and applications (locations, dates, surveillance periods, event types, data sources, and attendance).11 Of the 19 studies reviewed for inclusion in this publication’s data extraction, only one used remote access (mobile phone app), without remote systematic public access to emergency care (EMD).
An expanded scope of public health surveillance for Super Bowl XLI in 2007 involved linking four event-related health departments for sharing their data across a system, known as Early Notification of Community-based Epidemics (ESSENCE).12 While 9-1-1 medical data was not used, it could have provided enhanced surveillance data input across these departments, which were representative of both host and hotel guest populations. It would require that a corresponding common or similar emergency medical dispatch system be employed across these four jurisdictions’ 9-1-1 centers, with data feeds into the respective health departments. The data from EMD feeds could have been analyzed for surveillance relevance, then integrated into ESSENCE with results from other data sources.
A 2017 paper from the U.S. Centers for Disease Control and Prevention focused on recommendations for syndromic surveillance systems, specifically in relation to mass gatherings.13 The article’s hallmarks of desirable data systems are sustainability and operational continuity, as opposed to
Yancey et al. Mass Gatherings, EMD Data, Syndromic Surveillance
“drop-in” surveillance systems, erected only for the span of the event. This is critically important advice for the detection of infectious disease outbreaks, given consideration of prolonged incubation periods. The economic and labor-saving advantages, and the system improvements inherent in using a critical continually operational public safety system such as 9-1-1 were highlighted. Clinical specificity of electronic syndromic surveillance systems could be enhanced by integrating complementary clinical systems, such as EMS patient care reports from on-scene care, toxicology findings, and emergency department reporting. Being able to access and query historical baseline electronic 9-1-1 data prior to mass gathering events is recommended. Recognition that morbidities characterized by high criticality are usually time sensitive (cardiac arrest), and/or obviously visible (injuries), are more accurately captured by 9-1-1 than the subtleties of infectious disease. This data access concept led to the selection of the specific call types in our current study. Regarding data interpretation, this article highlights that longer event durations enrich syndrome identification accuracy. Choice of the multiday Atlanta Super Bowl mass gathering footprint for our study was in recognition of this attribute.
Only the following three peer-reviewed articles addressed the three constructs of 1) emergency medical call data, 2) mass gatherings, and 3) syndromic surveillance, thereby being directly relevant to our evidence-based study. None of these studies provided the 9-1-1 call volumes involved (reflecting degree of demand) from their covered events and/or host communities, and none provided graphic visual data modeling and/or graphic depictions as in this current study.
One relevant publication, based on the earlier 2015 Super Bowl XLIX planning, was a description of the public health surveillance strategies planned.4 Sources of data collection were guest hotels, animal control agencies, poison centers, the medical examiner’s office, urgent care facilities, emergency departments, and EMS documentation of on-scene responses. All the data from these various point sources were subsequently reported to the Maricopa County Department of Public Health for centralized integration and pattern analysis every 24 hours. In our present study, the 9-1-1 capture of data and its EMD coding provides the opportunity for superior temporal sensitivity, due to real-time continual electronic collection in a templated fashion, supported by immediately available contrasting historical digital data. Calls into 9-1-1 provide verbal and/or electronic capture of caller location, contributing to the immediate formation of electronic geographic mapping.
The study most closely resembling the structure and methodology of our present one was performed in Quebec, Canada, during the June 2018 G7 Summit.5 A prospective strategy for the detection of public health threats was implemented across three days prior, three days during, and six days post-event. No hazardous incidents of a scale that threatened the public’s health were detected. The project
data included using that from Info-Sante (Quebec 9-1-1” equivalent). The authors surmised that this type of data would support high sensitivity but low clinical specificity. This would be a credible concern if surveillance emanated solely from 9-1-1 EMD data.
A thorough scoping review of the utility of emergency call center-dispatch data linked to EMS on-scene data for syndromic surveillance of infectious diseases was performed in 2019, derived from twenty peer-reviewed and 24 gray literature publications, as well as 11 interviews of experts.6
Conclusions drawn that advocated for employing EMD data in syndromic surveillance were its near real-time data accessibility, high-level data standardization, its clinical nature, and low service cost. While this study was not databased, these advantages of EMD data were interpreted as being boosted by their combination with EMS on-scene data, collected by field medic evaluations, and documented with digital patient care report tablets. This combination enhances clinical specificity, which 9-1-1 data sources alone may comparatively lack.
The system that has performed continuously operational, digital, early warning bio surveillance for EMS services based on EMD data, is FirstWatch, since 1998.14 It has experience in organizing and operating systems for syndromic surveillance of mass gatherings, such as Super Bowl XLVII, as a component of comprehensive long-term surveillance, covering coordination of public health and safety, fire and EMS data from 9-1-1. The implementation of this strategy has provided the program with its broad capabilities to track wide-ranging community morbidities, from disease epidemics, and their more prolonged periods of presentation to drug overdoses, which have prolonged sequences of sudden recurrences, and toxic exposures, both intentional and non-intentional. The outcome of this ongoing tracking is digital historical data that is readily available and prospectively organized for robust timely statistical comparison to the templated data being surveyed during any given mass gatherings. For the XLVII Super Bowl, FirstWatch comprehensively organized this function into “geo-fence” areas that included zones (hospitality, hotel, and convention Center) officially covering the Super Bowl festivities and participants, as well as a citywide zone. Simultaneously, “triggers” were monitored for specific types of classified calls, as in our current study. The call volumes data from the simultaneous Super Bowl/Mardi Gras organizational event strategy and other mass gatherings (Republican and Democratic Party conventions) has not been subcategorized and reported formally which would enable comparison with that from our 2019 Super Bowl LIII.
Advantages to 9-1-1 Data Use in Syndromic Surveillance
The public has immediate direct access to and interface with 9-1-1 telecommunicators. The 9-1-1 centers’ continual operation enables immediate access to historical digital call-based categorized data. This contributes to shorter
time frames for investigations and conduct of on-going uninterrupted analysis. The data is organized and archived according to a standardized emergency medical framework, which facilitates the accuracy and guidance of continual and sequential investigations. Immediate electronic capture of ill or injured individuals’ locations at the time of their inbound 9-1-1 calls enables timely sequential geographic mapping of etiologically related call volumes and selected specific call types. The visual depictions facilitate discovery of syndromic location(s), geographic scope, density of victims, direction and rate of spread, and etiology. These foregoing attributes would be expected to enhance investigations, interventions, and resolution of public safety and health threats by facilitating earlier dispatch of incident-appropriate professionals, in numbers more efficiently appropriate to population need.
Recommendations for the Enhancement of 9-1-1 Databased Syndromic Surveillance
The relative deficiency of clinical specificity would qualify as an important limiting characteristic if syndromic surveillance was conducted by sole-source 9-1-1 data analysis. However, continually dedicated inclusion of EMS physicians in EMD call center quality improvement/assurance processes should enhance addressing this issue. The EMD data should be integrated electronically with other, more traditionally sourced syndromic surveillance data and jointly analyzed by EMS clinicians and public health epidemiologists, using the visual surveillance tools depicted in this present study. Concurrent with any given event, real-time reciprocal voice communications should link jurisdictional public health personnel to 9-1-1 telecommunicator staff and EMD/ EMS medical directors. This would likely expedite earlier identification of deleterious syndromes, with enhanced clinical accuracy, leading to more appropriate responses. For example, earlier interventions may involve pre-established public address system and media messaging to warn and protect threatened populations, both at hosted mass gatherings and in their surrounding threatened communities.
LIMITATIONS
This retrospective study used secondary data and did not include pre-formed protocols that could have supported on-scene investigations into possible causal relationships of specific 9-1-1 call incidents to the mass gathering under study. No known attempts were made to obtain concurrent event period-related baseline (denominator) population estimates, as citizens and visitors attended multiple festivities simultaneously, ingressing and egressing the activity areas at unmeasured and highly variable times and dates. Because of this lack of attendance/participation measurement, no attempts to determine denominator data were performed and no incidence rates could be calculated. While other population morbidities were considered for inclusion, respiratory complaints would be problematic in terms of the correlation
of 9-1-1 calls to the relatively short events period onset and confounding unrelated influenza season-related calls. The local weather variable’s possible effects on traffic incidents and violence call volumes were not included, as temperature variations were small and climate conditions not considered hazardous throughout all of our study periods.
CONCLUSION
This was a study on the use of 9-1-1 medical calls data to determine the possible effects of a multi-day mass gathering on the surrounding community’s health status. It presents a process for data collection, organization, and visualization methods tha,t hopefully, will be developed to reveal associated clinical syndromes of a scale and time frame that could threaten or adversely impact event participants’ and the hosting public’s health status. Our retrospective analysis of this call data revealed no adverse event(s) that threatened the health status of the host community. Recommendations are made for enhancing syndromic surveillance from the 9-1-1 medical data domain, to serve the safety and health of mass gathering participants, spectators, and host communities.
ACKNOWLEDGMENTS
Gratitude is extended to Drs. Timothy Moran and Jonathan Rupp of the Emory University Department of Emergency Medicine and to Kimberley Koporc, MPH, MBA, of the Task Force for Global Health for their reviews, critiques, and recommendations.
Address for Correspondence: Arthur H. Yancey, II, MD, Emory University, School of Medicine, Department of Emergency Medicine, 2526 Flair Knoll Court, Atlanta, Georgia 30345. Email: iyancey@emory.edu.
Conflicts of Interest: By the WestJEM article submission agreement, all authors are required to disclose all affiliations, funding sources and financial or management relationships that could be perceived as potential sources of bias. No author has professional or financial relationships with any companies that are relevant to this study. There are no conflicts of interest or sources of funding to declare.
1. U.S. Centers for Disease Control and Prevention. 2021. What Is Syndromic Surveillance? U. S. Department of Health and Human Services. Centers for Disease Control and Prevention. Available at: http://www.cdc.gov/nssp/overview.html
2. Aldridge, AD. 2019. Here’s how many people attended Super Bowl events in Atlanta. 11Alive.com. Available at: Here’s how many people
Yancey et al. Mass Gatherings, EMD Data, Syndromic Surveillance
Gatherings, EMD Data, Syndromic Surveillance
attended Super Bowl events in Atlanta | 11alive.com Accessed March 20, 2023.
3. Highberger JP, Merriman-Nai S. The value (and nuances) of mapping as a public health tool. DelaJ Public Health 2021;7(3):1-8.
4. Ayala A, Berisha V, Goodin K, et al. Public health surveillance strategies for mass gatherings: Super Bowl XLIX and related events, Maricopa County, Arizona. Health Security 2015;14(3):1-12.
5. Huot C, Paradis A, Hammond-Collins K, et al. A public health enhanced surveillance system for a mass gathering event. CCDRs 2019;45(7/8):212-224.
6. Duijster JW, Doreleijers SDA, Pilot E, et al. Utility of emergency call centre, dispatch, and ambulance data for syndromic surveillance of infectious diseases: a scoping review. Eur J Public Health, 2019;1-9.
7. Clawson JJ, Dernocoeur KB, Murray C. Principles of Emergency Medical Dispatch, 6th Ed. Salt Lake City, Ut: Priority Press, 2015. (3.2-3.27) ISBN: 0-9658890-2-5
8. Koski A, Pappinen J, Kouvonen A, et al. Preparedness for mass gatherings: rescue and emergency medical services’ workloads during mass gathering events 2022. Scand J Trauma, Resusc Emerg
Medicine 2022;20(15):1-7.
9. Rahul A. Heat Map (heatmap). Business Analytics. Tech Target and Informa Tech’s digital businesses combine. Available at: https:// www.techtarget.com/searchbusinessanalytics/definition/heat-map Accessed May 11, 2025.
10. Mostashari F, Fine A, Das D, et al. Use of ambulance dispatch data as an early warning system for communitywide influenza like illness, New York City. J Urban Health. 2003;80(2): Supplement 1 2003, i43–i49.
11. Spector E, Zhang Y, Guo Y, et al. Syndromic surveillance systems for mass gatherings: a scoping review. Int J Environ Res Public Health. 2022;19(8):4673
12. Lombardo JS, Sniegoski CA, Loschen WA, et. al. Public health surveillance for mass gatherings. Johns Hopkins APL Tech Dig 2008;27(4):347-354
13. Fleischauer AT, Gaines J. Enhancing surveillance for mass gatherings: the role of syndromic surveillance. Public Health Rep 2017;132(Supplement 1):95S–98S.
14. Goodwin J. Being super ready. How technology keeps New Orleans alert in real time. J Emerg Med Serv 2013;38(5):54-58.
Original Research
Using “Own-Point-of-View” Video and Stimulated Recall to Reveal Physician Thought Processes: A Methodology Paper
Milisa Manojlovich, PhD*
Caitlin Cassady, PhD†
Sarah J. Parker, MPH†
Ellie Davis, BA†
Charlotte Ahr, BSN*
David Ryamukuru, MSN*
Anna Wang, BSN*
Kalyan Pasupathy, PhD‡
Hardeep Singh, MD, MPH§
Prashant Mahajan, MD, MPH, MBA†
Section Editor: James Meltzer, MD
University of Michigan School of Nursing, Ann Arbor, Michigan
University of Michigan, Department of Emergency Medicine, Ann Arbor, Michigan University of Illinois at Chicago, Chicago, Illinois
Baylor College of Medicine, Michael E. DeBakey Veterans Affairs Medical Center, Center for Innovations in Quality, Effectiveness and Safety, Houston, Texas
Submission history: Submitted November 20, 2025; Revision received March 13, 2026; Accepted March 17, 2026
Electronically published July 16, 2026
Full text available through open access at http://escholarship.org/uc/uciem_westjem DOI 10.5811/westjem.54032
Introduction: Video methods used in medicine have been described as the “gold standard” because they show events as they occurred and with a level of detail unattainable when events are reconstructed using other methods. In stimulated recall, video or pictures during interviews prompt discussion about participants’ thoughts or feelings when images were captured. Coupled with video, stimulated recall can deepen researchers’ understanding of a participant’s thinking at the time. However, conducting video-based stimulated recall interviews with participants is poorly described in the literature because of word count limits in today’s journals. In this paper we describe how we used video with stimulated recall interviews to learn how the diagnostic process evolves for emergency physicians.
Methods: We used the theory of distributed cognition to describe how information processing develops over time and occurs across physicians, the technologies used, and social organization. We conducted a qualitative study, collecting data in pediatric and adult emergency departments (ED) of an academic Level I trauma center. Participants wore head-mounted video cameras for two hours while providing care to ED patients and revealed their thinking throughout the diagnostic process in subsequent stimulated recall interviews. We reviewed video recordings to identify situations related to the diagnostic process or to one of the concepts in distributed cognition. We identified short video clips from each session to display during interviews and prepared accompanying questions. Stimulated-recall interviews were conducted using video conferencing technology, audio recorded, transcribed, and verified for accuracy. We used content analysis to analyze results.
Results: Eleven attending physicians from February 2022–May 2023 (five from the pediatric ED and six from the adult ED) interacted with 52 patients over a total of 24.4 hours on video. We obtained patients’ permission to film encounters before a participating physician provided care, wearing the head-mounted camera. We conducted individual stimulated recall interviews (mean 53 minutes, range 33–63 minutes) with all 11 physicians, which uncovered perspectives beyond what was revealed on film. For example, the complexity of cognition resides in patients as well as physicians. Thus, physicians must exert great effort to elicit the patient story and make a likely diagnosis in the chaotic, noisy environment of the ED.
Conclusion: Using innovative methods to uncover emergency physicians’ cognitive processes has the potential to advance our understanding in other settings. This methodology brings awareness to how one’s thoughts can become visible and, thus, amenable to reflection and change. [West J Emerg Med. 2026;27(4)1073–1081.]
INTRODUCTION
Video-based methods have been used in medicine for over 50 years.1 Video has been described as the “gold standard” because it shows events as they occurred and with a level of detail unattainable when events must be reconstructed using other methods.2 Video can be re-viewed multiple times to facilitate viewer interpretation. Stimulated recall is a procedure in which video or pictures are used during interviews to prompt discussion about participants’ thoughts or feelings at the time when the images were captured3 since the images themselves do not display participants’ thought processes.4 When coupled with video, stimulated recall can be used to deepen researchers’ understanding of a participant’s thinking at the time.3 Thus, the pairing of video data and simulated recall are especially suited to learn more about cognitive processes and decision-making in medicine.
Video-stimulated recall can be done in a variety of ways.5 The decision should rest on the type of data the researcher aims to gather, whether that be recall, re-living, or reflection, all of which can be produced by stimulated recall interviews.5,6 Data quality can be enhanced when researchers design their studies to focus on the kind of data they want.6 For example, the usual video portion of the methodology involves focusing the camera on the participant and capturing interactions between the participant and others. An adaptation of the method is to have participants wear head-mounted cameras so that the camera captures what the participant is looking at (“own point-of-view”), prioritizing the participant’s choice of view rather than that of researchers. This variation was used by Pelaccia and colleagues who examined how expert emergency physicians generated and evaluated diagnostic hypotheses as they worked.7
A common criticism of video-based research is that participants react to the camera and behave differently than they would if the camera were not present. A study was conducted to address the potential reactivity of cameras in medical interactions by filming interactions between 45 patients and 14 medical oncologists and then coding the film for camera-related behaviors.8 Results indicated that camerarelated behaviors were infrequent (occurring 0.1% of the time) and most often occurred in very early stages of an interaction. Diagnostic decision-making is a highly complex cognitive process that is susceptible to errors. There is inherent uncertainty in the diagnostic process, making it one of the most difficult tasks for the human mind.9 Unsurprisingly, emergency physicians are particularly vulnerable to making diagnostic errors because the emergency department (ED) is a fast-paced, dynamic setting where complex decision-making occurs under severe time, information, and resource constraints. By some estimates, there are about 7 million instances of error among the approximately 143 million visits to United States EDs every year, with half having a potential for patient harm.10 The purpose of this overall qualitative
Population Health Research Capsule
What do we already know about this issue? ED physicians are vulnerable to making diagnostic errors. The pairing of video data and stimulated recall are well-suited to identify cognitive processes and learn from them.
What was the research question?
Can video with stimulated recall interviews describe how the diagnostic process evolves for ED physicians?
What was the major finding of the study? This methodology uncovers the cognition of physicians during the diagnostic process to reveal how they think, as cognition is the heart of diagnosis.
How does this improve population health? This methodology has the potential to reduce diagnostic error and thereby improve population health.
study was to describe how the diagnostic process evolves for emergency physicians in both pediatric and adult ED settings. We were interested in understanding how the diagnostic process unfolds for emergency physicians because those who work in EDs are particularly vulnerable to making diagnostic errors. We adapted Pelaccia’s method in which a physician wears a head-mounted camera to film their “own point-ofview” however, rather than using it to generate diagnostic hypotheses, we used their method to gain a better understanding of how the diagnostic process unfolds for emergency physicians
When publishing research, word count limits in today’s journals restrict authors from providing the methodological detail needed to replicate or design future studies combining video and stimulated recall methods. As a result, conducting video-based stimulated recall interviews with participants after filming remains poorly described in the literature, limiting the ability of researchers to gain experience in this method, which is suited to explore cognitive processes and decision-making in medicine. In this paper, we provide details of the methods we used to first film physicians’ activities and subsequently conduct stimulated recall interviews with them. However, we did not formally test the proof of concept of combining video review with stimulated recall interviews in the real world with busy emergency physicians.
Theoretical Model
We used the theory of distributed cognition to describe how information processing develops over time and occurs across various physicians, the technologies they use, and their social organization. Distributed cognition, a social cognitive theory, is gaining traction in healthcare because of the recognition that physicians work in social groups and the work is context dependent. There are three main principles of distributed cognition: the physical organization of work; the information flow; and the artifacts.11 All three principles must interact for distributed cognition to occur, underscoring the central premise of the theory that cognition is dispersed across people, places, and things.12
The physical organization of work refers to how work is configured and adapted to a specific context. It also includes things that can be seen, heard, and accessed by the people doing the work. The physical organization of work affects the second principle, information flow, which refers to the mechanism that allows a system to operate. Information flow is a bidirectional process that involves interactions between patient and/or family member and physician. Information flow is accomplished through communication using all mediums (eg, face to face, electronic, telephone) and types (eg, verbal, nonverbal).
Artifacts make up the final major principle in the theory of distributed cognition and refer to cognitive aids that support a physician’s ability to make a diagnosis. The most used artifact is the electronic health record (EHR), which maintains an account of a patient’s past history and present illness and serves as a repository for lab values and other diagnostic testing results. The EHR has many other uses such as providing templates for discharge instructions and patient education materials. Another artifact used in the ED is the white board,which displays patient names (or initials), physician room assignment, care team members who are working that shift, and status (ie, discharge, test results pending, admit). Other artifacts that support physicians’ cognition include paper and electronic reminders. The ED is unpredictable and uniquely dynamic compared to hospital or clinic settings13,14; thus, a theory that can describe how distinct attributes of the ED affect physicians’ thinking may help shed more light on the diagnostic process.
METHODS
Setting
The setting for our study was an academic medical and Level I trauma center in the midwestern United States that houses both an adult and pediatric ED.
Recruitment
We used multiple strategies to recruit attending-level physicians as participants in the study. We first garnered the support of physician leadership of both EDs through brief
one-on-one meetings. We developed a one-page flyer that was distributed via email to all attending emergency physicians. We attended a physician faculty meeting where we described the scope of the study and answered questions. Apprehension about being recorded during clinical practice is a known barrier to participation.15 To overcome this barrier, we framed participation as an opportunity to contribute to reducing diagnostic error and improving the quality of care.15 We also stressed that we were not critiquing clinical practice or competency. Once a physician agreed to participate and signed a consent form, a member of the research team scheduled a day and time for the video recording that aligned with a regularly scheduled clinical shift of the participant and the availability of two research team members. We conducted recruitment of 11 attending-level physicians (six in the adult ED and five in the pediatric ED; four were female, and seven male) on a rolling basis from February 2022–May 2023. We also notified other ED staff (eg, residents, medical students, physician assistants) about the study via e-mail and posted signs (while we were present and recording) for transparency. Since nurses have a role as team members in the diagnostic process, we also met with ED nursing leadership to garner their support. Then we attended staff nurse huddles to describe the study and answer questions. We also distributed a one-page study information sheet in person and via email to to all nursing staff.
Pre-Data Collection Procedures
Researchers spent a total of seven hours observing physicians in both EDs before any video recording occurred. The purpose of these preliminary observations was to understand the dynamic nature of ED operations and discover ways to minimize potential interruptions to physician workflow. Preparing for data collection also included testing the camera and microphone.
Data Collection from Video
Two research team members collected video data across day and evening shifts. They followed a checklist of activities that was completed before the start of each session, during filming, and before leaving the unit. (See Supplemental Appendix A.) At the start of each session, research team members met briefly with the participant to identify patients who would be appropriate to approach. We included patients who were assigned to a participant and would be seen during their scheduled shift. We excluded patients deemed inappropriate by the participant (eg, critically ill or those with mental health complaints) and those who were awaiting disposition because they did not require further diagnostic decisions. We did not enter “special precautions” rooms (eg, patients under investigation for COVID-19 infection) to avoid the need to clean the equipment upon leaving the room. One member of the research team outfitted the participant with the
Own-Point-of-View Video to Stimulate Recall and Reveal Physician Cognition Manojlovich
head-mounted camera and a miniature, clip-on lavalier microphone to amplify the audio portion of recordings. We introduced participants to the equipment and allowed them to voice concerns or ask questions.
The ED is a noisy environment, and it was not always possible to hear the participant or their conversations. Initially, we planned on having two sources of audio capture (audio from camera and microphone) to provide adequate sound quality, but we had trouble capturing the voices of people talking with the participant, and sometimes ambient noise overpowered all voices. After the fifth recording session, we added a portable audio recorder that had two microphones. The center microphone captured dialogue while the side microphone captured environmental sound that was adjusted during postproduction to enhance overall sound quality.
Roles of Research Team Members
Research team member roles and responsibilities are described in Table 1. Once recording began, research team member “A” conducted general observation to capture contextual features of the environment that otherwise would have been missed while the participant was wearing the camera; at the same time, research team member “B” took unstructured field notes. After two recording sessions we
realized that rather than documenting observation field notes, research team member “B” was needed to enter the room ahead of the participant and inform patients of the study while research team member “A” stayed with the participant and took notes. Research team member “B” had several tasks: 1) deliver the prepared verbal script to each patient who was assigned to the participating physician and any family members/visitors and provide them with a one-page study overview; 2) secure patient approval to be filmed or give them the opportunity to decline the presence of a video camera in their room; and 3) note all requests to blur images of individuals caught incidentally on film to protect anonymity (eg, nurses who were also present in the room). Across recording sessions, 69 patients were briefed on the study, and 54 approved the use of recording equipment during the visit. Without this division of labor, the participating physician was unable to work at their usual pace and had to slow down or wait for the research team to determine whether the next patient would agree to video recording. When participants needed to see patients who opted out or were excluded, all audio and visual recording was stopped, and research team member “A” helped the physician to remove equipment and then reattach it after the patient encounter was complete. During each session research team members also introduced
Table 1. Team structure and team responsibilities in a video-based study describing how the diagnostic process evolves for emergency physicians.
Research team member Qualifications
Project manager Master’s degree in Public Health. Over five years’ experience as a project manager
Clinical research coordinator (CRC) PhD candidate in anthropology with training in ethnography
Maintain equipment (camera and microphone), complete the checklist, lead research activities on site, outfit the participant with recording equipment, work with the participant and research team members to identify patients and families who needed to be informed and approve of or opt out of recording, enter patient rooms to gain approval or opt-out when the RA was unavailable, shadow the participant while wearing the camera, take field notes, upload and organize data files, communicate the need for anonymity measures (blurring)
Research team member “A” Undergraduate or graduate student with nursing or premedicine major, or full-time
ED research coordinator
Research team member “B” Undergraduate or graduate student with nursing or premedicine major, or full-time
ED research coordinator
Research assistant (RA) Specific audio and video technology expertise.
Co-investigator PhD-prepared professor of nursing with experience in video-based studies
Help prepare equipment, post notices of recording on site, work with the CRC and participant to identify patients and families who needed to be informed and approve of or opt out of recording
Enter the patient’s room ahead of time to secure approval, note requests to blur images of those caught incidentally on camera, assist with cleaning and checking equipment and uploading data or recording field notes, if needed
Combine video and audio files, improve audio quality, place Gaussian blur on faces of those who requested it
Replace either the CRC or RA, as needed
themselves to other physicians, described the study, and answered any questions. They distributed one-page study information sheets and helped facilitate future recruitment and lessen any anxiety related to their presence.
The research team worked together to keep track of the cumulative recording time, aiming for two hours of audio and video data showing multiple participant-patient interactions for each participant. When recording was complete, research team member “A” removed equipment from the participating physician, thanked them for their time, and informed them that we would analyze data and schedule a follow-up interview to discuss what was captured on film. The research team was on site for 2.5-6 hours for each session to allow for preparations, equipment removal due to patient/family refusals, special precautions encounters, and resuscitation responses.
Post Video Recording Procedures
Immediately after filming was done, research team member “A” returned to a designated research office and uploaded video and audio data files to a secure server. After confirming that all files had been securely uploaded, they were erased from the video and audio recorders. The camera and microphones were cleaned and recharged after each session. Before the research team reviewed video data, a research assistant with expertise in audio and video technologies combined the video and audio files, overlaying the audio data from the lavalier microphone and portable audio recorder onto video data, generating enhanced video data later used for analysis. Several other important tasks were also completed: using features to balance audio, they were able to increase volume, reduce background noise, and remove both low frequency static and high frequency buzzing sounds; they amplified the audio of individuals to whom the participant was speaking directly; and they placed a Gaussian blur on the faces of ED staff members who requested to be blurred from the video data.
Data Collection from Stimulated Recall Interviews
We prepared interview guides for individual follow-up interviews with each participating physician, which were scheduled for one hour and conducted via video conferencing technology (ie, Zoom). From each recording session, we selected 3-4 short video clips related to each of the three concepts within our theoretical model (for a total of 9–12 clips) to display during interviews and prepared interview questions to accompany each video clip. For each exemplar clip, we developed a brief introduction to the clip, interview question, and probes designed to add context for the clip and elicit participants’ reflections on their decisions and diagnostic process. Supplemental Appendix B displays the number of video clips selected for each participant, along with the total and average length of each clip, arranged by questions according to the theory of distributed cognition. For example, during interview #3, we opted to explore further with the
participant four clips where there was discussion of workflow, three clips that discussed how the EHR helped or hindered the diagnostic process, and six where there was discussion about interactions with others. Our goal was to keep the total time of video clips that we played during each interview to no more than 10 minutes to allow an in-depth conversation with each participant about their thoughts and feelings related to their diagnostic process.
Scheduling interviews with participants who were on service for a week or two at a time took longer than anticipated. After the first two interviews, we moved to a rapid analysis methodology to shorten the time from data collection to interview. Rapid analysis provides actionable, rigorous qualitative data in less time than traditional analysis.16 We developed a template based on the three major concepts of distributed cognition—our deductive framework—to help organize data (Table 2). Research team members independently reviewed video recordings to identify situations related to the diagnostic process or one of the three major concepts of our deductive framework. We met weekly to discuss our individual impressions of video footage and came to consensus on timestamps for clips that were the best examples of one of the three concepts of distributed cognition. Selected video clips were embedded into a PowerPoint presentation that was shown to the participating physcian during individual interviews.
A “dry run” was done prior to each interview to make sure that questions aligned with the selected video clip, verify video clip times (to ensure there was enough context on the clip for the participant to answer the question), and confirm that the wording was clear. Audio quality was further enhanced, if needed. Two research team members conducted each interview. One asked questions while the other advanced the slides and played video clips, as well as asking additional questions. All interviews were recorded, transcribed, and verified for accuracy.
An important consideration before undertaking a project such as ours is cost. The head-mounted camera we used (including mounting brackets) cost $188 and included software to download videos onto a laptop computer. We did not purchase a project-specific laptop, but these have a wide range of prices ($550 - $1,800). The lavalier microphone cost $29 (range $11–$70) and the Zoom microphone cost $200 ($100–$280). We did not purchase video editing software, which ranges in price between $40–$264. As technology advances, costs for audio and video equipment have been declining, making it feasible to conduct projects without great expense.
DISCUSSION
We report a methodology that we used to describe how the diagnostic process evolves for emergency physicians in both pediatric and adult ED settings. There are several advantages to our approach that warrant discussion. First, the
Table 2. “Rapid” video analysis template used in a video-based qualitative study describing how the diagnostic process evolves for emergency physicians.
Examples of Workflow
Video # Start time Stop Time
Examples of EHR and Artifacts
Video # Start time Stop Time
Examples of Interactions with Others
Video # Start time Stop Time
Why am I including this clip?
Why am I including this clip?
Why am I including this clip?
Instructions for Analysts: While watching a video think about which of three categories might best fit what you are noticing: 1) How does the physician arrange or organize their workflow, and what are the implications of that workflow pattern for diagnosis (includes interruptions)? 2) How do the EHR and other artifacts (such as paper notes, white board) help or hinder the diagnostic process? 3) How do interactions with others affect the diagnostic process (can be with other clinicians, nurses, allied health personnel, or with patients/ family members)? Every time you notice something that fits into one of the three categories, please also note the start and stop time stamps for that activity and document it in the appropriate box below. Add as many rows as you would like, and please remember that we will also have to jointly choose the top three clips as bests examples of each category. EHR, electronic health record.
type of method dictates the kind of data that will be generated because each method captures a specific type of data.19 The use of video provided us with details of the ED environment that could not be captured by observation or interview alone.20 Observation is limited to those select activities that an observer can notice at any one time, and interviews provide a retrospective view of the opinions of the interviewees rather than a window into the here-and-now, as is possible with video. Given the busy, chaotic, and interruption-driven nature of EDs, the unique perspective provided by video allowed us to understand the context of the physician’s encounter, while stimulated recall interviews revealed its effect on their thought processes.
A second advantage to video is the ability to rewind and review what was on the film. To improve efficiency and facilitate throughput in a fast-paced ED, physicians usually multitask and engage in several activities at the same time. Without the ability to rewind and review a video, important and subtle nuances of the diagnostic process as manifested by concurrent activities could be lost. Up to 80% of
communication may be nonverbal,21 and since communication plays such a large role in the diagnostic process,22 video captures these nonverbal communication behaviors (eg, body language, eye gaze) with high fidelity and a greater level of detail than other observational methods. Finally, by having the physician wear the camera, what was captured indirectly was the physician’s thought processes as they looked at a person, the computer screen, or artifact such as a piece of paper. In subsequent stimulated recall interviews, we were able to confirm or refute what the physician remembered about their own thoughts and feelings in the moment.
Stimulated recall interviews provided another type of data. Prompts provided by video clips during interviews allowed participants to describe thoughts and feelings as they organized their work or communicated with others. Associated interview probes gave participants the opportunity to expound on their thinking and provide the rationale for their activities, thereby extending the information gained.
One of the earliest uses of head-mounted video capture followed by stimulated recall interviews in healthcare was in
the field of occupational therapy to study the therapist’s clinical reasoning while working with a patient.23 More recently, video-stimulated recall has been used to understand differences in perspectives between the healthcare team and family members during family-centered rounds at a pediatric hospital,24 to examine the primary care physician-patient consultation process,25 and to analyze interactions between physicians and patients with osteoarthritis.14 The wide variety of applications of this method suggests that reflection while watching video and deliberation during recall interviews have value beyond either method in isolation.
The use of head-mounted video cameras in healthcare applications without subsequent stimulated recall interviews is growing, although the video is used for different purposes post-filming. More recently, head-mounted video cameras have been used to teach surgical residents in the operating room,26,27 to train learners on simulated intubation procedures,28 and to train pulmonary critical care medicine fellows in performing thoracentesis on actual patients.29 In these cases, post-video film provided objective evaluation of skill development.
To the best of our knowledge, there has been very limited use of head-mounted cameras and post-filming stimulated recall interviews to understand how emergency physicians think or develop diagnoses. Our study and the study by Pelaccia and colleagues are the only ones to date that have sought to uncover cognitive processes related to diagnosis; however, our methods differed in significant ways. In the study by Pelaccia, each filmed encounter ranged from 8.5–20.5 minutes in duration, which is considerably less than the two hours of film generated for each of the 11 physicians in our study. This speaks to the difference in objectives between the two studies. Pelaccia found that hypothesis generation was primarily an intuitive process and that most physicians had formulated a hypothesis even before initially seeing the patient.7 Because they were interested in capturing each physician’s initial hypothesis, they sought to minimize the effects of recall bias by conducting interviews within an hour or two after recording the encounter. In contrast, on average 60 days elapsed between filming an encounter and the recall interview in our study.
Because diagnostic error is a multifaceted phenomenon, many approaches will be needed to reduce it, particularly in the chaotic ED setting. Technological advances,30 improving communication,31 and listening better to patients and family members32,33 are some of the more common approaches being used and these employ a host of methods. The strength of the methodology we describe is in uncovering the cognition of physicians during the diagnostic process to reveal how they think because cognition is at the heart of diagnosis.
LIMITATIONS
The use of video coupled with stimulated recall interviews
to capture visible practice and invisible cognitive processes is a promising methodology for studying complex processes such as diagnosis. However, there are several limitations associated with this methodology. As with all qualitative methods, the aim of video-based research is to develop an in-depth understanding of some phenomena rather than to achieve generalizability; thus, its scalability and wider application are limited. The camera, even one as small and unobtrusive as the one we used, becomes part of the research and introduces the possibility of a Hawthorne effect, although such effects do appear to be small.6,17,18
On average, 60 days elapsed between filming and recall interview for many participants, reducing the accuracy and trustworthiness of responses.3 Participants made comments, such as “I don’t remember this case” or “I remember this one,” which did not appear to be associated with the time delay between when the video was recorded and the interview. Finally, it is not clear whether in reviewing the video clips the participating physicians were recalling their thoughts and feelings from the time the video was taken or were reacting to what they were viewing in the present.3 Thus, narratives produced from review may not represent the conscious or unconscious cognitions taking place at the time of the video recorded episode.3
CONCLUSION
Video recording a physician’s clinical practice in the emergency department as it occurs, followed by videostimulated recall interviews with them, has the potential to advance our understanding of the diagnostic process. From the physician’s perspective, becoming aware of how one thinks allows what was hidden to become visible and, once visible, more amenable to reflection and change, to bring us closer to reducing diagnostic error.
ACKNOWLDGMENTS
The authors wish to acknowledge the clinicians and patients who participated in the study. Dr. Singh is funded in part by the Houston VA HSR&D Center for Innovations in Quality, Effectiveness and Safety (CIN 13-413) and the Agency for Healthcare Research and Quality (R01 HS028595 and R18 HS029347).
Address for Correspondence: Milisa Manojlovich, PhD, Univerity of Michigan School of Nursing, 400 N. Ingalls, Room 4306, Ann Arbor, MI, 48109-5482. Email: mmanojlo@umich.edu.
Conflicts of Interest: By the WestJEM article submission agreement, all authors are required to disclose all affiliations, funding sources and financial or management relationships that could be perceived as potential sources of bias. This project was funded under grant number R18HS026622 from the Agency for
Own-Point-of-View Video to Stimulate Recall and Reveal Physician Cognition
Healthcare Research and Quality (AHRQ), U.S. Department of Health and Human Services (HHS). The authors are solely responsible for this document’s contents, findings, and conclusions, which do not necessarily represent the views of AHRQ, HHS, the Department of Veterans Affairs, or the U.S. government. Readers should not interpret any statement in this report as an official position of AHRQ, HHS, the Department of Veterans Affairs, or the U.S. government. None of the authors has any affiliation or financial involvement that conflicts with the material presented in this report. There are no conflicts of interest to declare.
1. Korsch BM, Gozzi EK, Francis V. Gaps in doctor-patient communication. Pediatrics. 1968;42(5):855-871.
2. Jordan B, Henderson A. Interaction analysis: foundations and practice. J Learn Sci. 1995;4(1):39-103.
3. Lyle J. Stimulated recall: a report on its use in naturalistic research. Br Educ Res J. 2003;29(6):861-878.
4. Pelaccia T, Tardif J, Triby E, et al. A novel approach to study medical decision making in the clinical setting: the “own-point-of-view” perspective. Acad Emerg Med. 2017;24(7):785-795.
5. Paskins Z, McHugh G, Hassell AB. Getting under the skin of the primary care consultation using video stimulated recall: a systematic review. BMC Med Res Methodol. 2014;14(101):18.
6. Henry SG, Fetters MD. Video elicitation interviews: a qualitative research method for investigating physician-patient interactions. Ann Fam Med. 2012;10(2):118-125.
7. Pelaccia T, Tardif J, Triby E, et al. How and when do expert emergency physicians generate and evaluate diagnostic hypotheses? A qualitative study using head-mounted video cuedrecall interviews. Ann Emerg Med. 2014;64(6):575-585.
8. Penner LA, Orom H, Albrecht TL, et al. Camera-related behaviors during video recorded medical interactions. J Nonverbal Behav. 2007;31(2):99-117.
9. Newman-Toker DE, Makary MA. Measuring diagnostic errors in primary care. JAMA Intern Med. 2013;173(6):425.
10. Newman-Toker D, Peterson S, Badihian S, et al. Diagnostic errors in the emergency department: a systematic review. Comparative Effectiveness Review No. 258. Rockville, MD: Agency for Healthcare Research and Quality. 2022;22(23):744.
11. Blandford A, Furniss D. DiCoT: a methodology for applying distributed cognition to the design of teamworking systems. In: Gilroy SW, Harrison MD, eds. Interactive Systems. Design, Specification, and Verification. DSV-IS 2005. Lecture Notes in Computer Science, vol 3941. Springer Berlin Heidelberg; 2006:26-38.
12. Hutchins E. (1995). Cognition in the Wild. Cambridge, MA: MIT Press.
13. Paskins Z, Sanders T, Croft PR, et al. Exploring the added value of video-stimulated recall in researching the primary care doctor–patient consultation. Int J Qual Methods. 2017;16(1):1-11.
14. Paskins Z, Sanders T, Croft PR, et al. The identity crisis of osteoarthritis in general practice: a qualitative study using videostimulated recall. Ann Fam Med. 2015;13(6):537-544.
15. Lloyd A, Dewar A, Edgar S, et al. How to implement live video recording in the clinical environment: a practical guide for clinical services. Int J Clin Pract. 2017;71(6):1-7.
16. Lewinski AA, Crowley MJ, Miller C, et al. Applied rapid qualitative analysis to develop a contextually appropriate intervention and increase the likelihood of uptake. Med Care. 2021;59(6 Suppl 3):S242-251.
17. Themessl-Huber M, Humphris G, Dowell J, et al. Audio-visual recording of patient-GP consultations for research purposes: a literature review on recruiting rates and strategies. Patient Educ Couns. 2008;71(2):157-168.
18. Paradis E, Sutkin G. Beyond a good story: from Hawthorne effect to reactivity in health professions education research. Med Educ. 2017;51(1):31-39.
19. Wyer M, Iedema R, Hor S-Y, et al. Patient involvement can affect clinicians’ perspectives and practices of infection prevention and control. Int J Qual Methods. 2017;16(1):160940691769017.
20. Manojlovich M, Cassady C, Parker SJ, et al. Using video ethnography and stimulated recall interviews to describe the diagnostic process in the emergency department. Acad Emerg Med. 2025;32(11):1189-1196.
21. Hill K. The sound of silence—nurses’ non-verbal interaction within the ward round. Nurs Crit Care. 2003;8(6):231-239.
22. Manojlovich M, Bettencourt AP, Mangus CW, et al. Refining a framework to enhance communication in the emergency department during the diagnostic process: an eDelphi approach. Jt Comm J Qual Patient Saf. 2024.
23. Unsworth CA. Using a head-mounted video camera to study clinical reasoning. Am J Occup Ther. 2001;55(5):582-588.
24. Carayon P, Li Y, Kelly MM, et al. Stimulated recall methodology for assessing work system barriers and facilitators in family-centered rounds in a pediatric hospital. Appl Ergon. 2014;45(6):1540-1546.
25. Paskins Z, Sanders T, Croft PR, et al. Exploring the added value of video-stimulated recall in researching the primary care doctorpatient consultation: a process evaluation. Int J Qual Methods. 2017;16(1):1-11.
26. Brennan HL, Kirby SD. Intraoperative video recording in otolaryngology for surgical education: evolution and considerations. J Otolaryngol Head Neck Surg. 2023;52(1):1-9.
27. Wentzell D, Dort J, Gooi A, et al. (2019). Surgeon and assistant point of view simultaneous video recording (p. 489-493). In: Bartle-Clar JA, Bliss G, Borycki EM, Courtney KL, Kuo AM-H, eds. Studies in Health Technology and Informatics. Amsterdam, Netherlands:IOS Press/ Sage Publishing.
28. Koh W, Khoo D, Pan LTT, et al. Use of GoPro point-of-view camera in
Own-Point-of-View Video to Stimulate Recall and Reveal Physician Cognition
29. Singas E, Quintero LD, Dhar S, et al. Training pulmonary critical care medicine fellows in thoracentesis using a head-mounted video camera. ATS Sch. 2021;2(4):632-641.
30. Graber ML, Byrne C, Johnston D. The impact of electronic health records on diagnosis. Diagnosis (Berl). 2017;4(4):211-223.
31. Hettinger AZ, Benda N, Roth E, et al. Ten best practices for improving
emergency medicine provider–nurse communication. J Emerg Med. 2020;58(4):581-593.
32. Bell SK, Bourgeois F, Dong J, et al. Patient identification of diagnostic safety blindspots and participation in “good catches” through shared visit notes. Milbank Q. 2022;100(4):1121-1165.
33. Giardina TD, Haskell H, Menon S, et al. Learning from patients’ experiences related to diagnostic errors is essential for progress in patient safety. Health Aff (Millwood). 2018;37(11):1821-1827.
Social Deprivation Index Is Associated with 90-Day Emergency Department Revisits, but Not Admission, for Acute Heart Failure
Robert R. Ehrman, MD, MS*
Nicholas E. Harrison, MD, MS†
Brian D. Haber, MD*
Steven J Korzeniewski, PhD*
Mark J. Favot, MD*
Lyudmila Khait, MD*
Phillip D. Levy, MD, MPH*
Section Editor: Tom Benzoni, MD
Wayne State University School of Medicine, Integrative Biosciences Center, Department of Emergency Medicine, Detroit, Michigan
Indiana University School of Medicine, Department of Emergency Medicine, Indianapolis, Indiana
Submission history: Submitted December 07, 2025; Revision received February 19, 2026; Accepted March 19, 2026
Electronically published July 16, 2026
Full text available through open access at http://escholarship.org/uc/uciem_westjem DOI 10.5811/westjem.61392
Background: Prevalence of heart failure is increasing, with an associated rise in emergency department (ED)-related care. Social determinants of health (SDoH) are associated with adverse health outcomes, but the extent to which they influence ED use for heart failure care is poorly understood. We sought to describe the relationship between community-level social vulnerability and ED revisits and hospital admissions for heart failure within a single health system.
Methods: We conducted a retrospective review of Social Deprivation Index (SDI) scores (higher score = more deprivation) by ZIP code paired with administrative clinical data. Zero-hurdle regression was used to model the relationship between SDI and ED revisits within 90 days of a prior ED visit for heart failure (logistic model for > 0 revisits; Poisson model for count of revisits). We used a mixed-effects logistic model—accounting for repeat visits—to test the association of SDI with hospital admission at any given ED visit.
Results: From January 2022–December 2023, there were 3,569 ED visits from 2,406 patients. Each standard deviation increase in SDI (30.3) was associated with increased odds of at least one 90-day revisit (OR, 1.53; 95% CI, 1.08-2.16). Higher SDI was also associated with more 90-day revisits, with varying magnitude by hospital. After adjusting for characteristics of prior ED visit, SDI was not associated with hospital admission.
Conclusion: Our results suggest that area-level social vulnerability influences the decision to seek heart failure-related care in the ED. Patients from more deprived areas may not have more severe clinical presentations, however, as evidenced by lack of association of SDI with hospital admission.
[West J Emerg Med. 2026;27(4)1082–1089.]
INTRODUCTION
The number of heart failure-related emergency department (ED) visits is increasing. Data from the early 2000s found they accounted for approximately 1% of all ED visits,1 while a more recent study reported an increase to nearly 4%.2 Most (70-80%) visits for acute decompensation of heart failure
(acute heart failure) result in admission, and 30% of patients are re-admitted within 90 days.3 Many of those discharged from the ED have return visits within 90 days.
Heart failure-related ED revisits are driven by multiple factors, including symptoms (eg, dyspnea, peripheral edema) and tangible needs (eg, medication refills). Social determinants
of health (SDoH)—the level of education, socioeconomic status, access to reliable transportation, etc—are also likely drivers of real and perceived need to return to the ED. Social determinants of health are known to increase the risk for development of chronic diseases and decrease the likelihood of high-quality disease management, leading to enhanced risk for ED visits and hospital (re)admissions.4,5
The effects of SDoH, operating at the area-level (neighborhoods, ZIP codes, etc), on overall health outcomes are well-described,6,7 but the association with heart failurerelated ED use is understudied and incompletely understood.8,9 Therefore, our goal in this study was to assess the association with area-level SDoH and heart failure-related ED revisits within a single health system in Detroit.
METHODS
Study Design and Participants
In this retrospective cohort study we used billing data for ED visits that occurred between January 2022–December 2023 at an integrated health system in Detroit, affiliated with Wayne State University (WSU). Eligible patients were those with a primary or secondary ED diagnosis of heart failure who presented to any of the four teaching hospitals within the health system. The study was approved by the WSU Institutional Review Board. Manuscript preparation was in accordance with the Strengthening the Reporting of Observational Studies in Epidemiology (STROBE) guidelines.10
Clinical Setting and Data
Combined annual ED volume at the four hospitals is approximately 150,000 patients. Included are Detroit Receiving Hospital (DRH), an urban academic Level 1 trauma center; Harper University Hospital (HUH), an urban academic tertiary-care center that does not receive 9-1-1 traffic; SinaiGrace Hospital (SGH), an urban community teaching hospital; and Huron Valley Sinai Hospital (HVSH), a suburban academic-affiliated hospital.
Emergency department-level data available for each visit included the following: date of service; birthdate; biological sex; ED disposition (admit, discharge, left against medical advice (AMA), and death in the ED), home ZIP code; and International Classification of Diseases, 10th Revision (ICD10) codes assigned for billing purposes. Admission location (intensive care unit floor) and hospital disposition were not available, nor were patients’ full street addresses. Unique medical record numbers were available for each patient, enabling us to track repeat visits.
Case Definition
Heart failure was defined by ICD-10 code I50.x. We excluded patients with co-occurring ICD-10 codes that may have confounded reason for presentation (eg, ST-elevation myocardial infarction, pneumonia). The full list of exclusions
Population Health Research Capsule
What do we already know about this issue?
Social vulnerability is associated with adverse health outcomes, but the relationship with emergency department (ED) use for acute heart failure is not well characterized.
What was the research question?
Our goal was to determine whether the Social Deprivation Index (SDI) is associated with 90day ED revisits, or admissions, for heart failure.
What was the major finding of the study?
Each standard deviation increase in SDI (30.3) was associated with increased odds of a 90day revisit (OR, 1.5; 95% CI, 1.08-2.16).
How does this improve population health?
Identifying factors associated with ED visits for heart failure is a critical first step in designing interventions to optimize care and resource allocation.
is provided in the Supplement (Table S1, n = 156 patients). We performed chart reviews for a random sample of 25 included, and 25 excluded, patients to confirm the presence or absence of acute heart failure (no erroneous inclusions or exclusions were found during manual adjudication) and to optimize rigor and reproducibility. We excluded 21 patients who died in the ED (18 on index visit and three at repeat visits) because death was outside the scope/focus of this investigation, and the low number of deaths precluded detailed analysis.
Primary and Secondary Exposures
We extracted area-level data from WSU’s PHOENIX Virtual Data Warehouse.11 We chose the Social Deprivation Index (SDI) as our primary exposure of interest because our data included ZIP codes but not full street addresses or ZIP+4. The SDI is a seven-item composite score that includes percentages of the following: living in poverty; attaining < 12 years of education; living in single-parent households; in rented housing units; in overcrowded housing units; in households without a car; and having non-employed adults < 65 years of age. Scores range from 1 (least) to 100 (most deprivation).12
Secondary area-level exposures included data at the ZIP code level on the following metrics: extreme income disparities (Index of Concentration at the Extremes, ranging
from -1 [least wealth] to 1 [most wealth],13 as per the U.S. Census Bureau); lack of health insurance (expressed as percentage of adults 18–64 years of age, as per the U.S. Centers for Disease Control and Prevention: ED use (as ED visits per adult population, based on ED surveillance data); and hypertension prevalence (from local ED surveillance data, using ICD-10 codes for hypertension; and median systolic blood pressure (from ED surveillance data). The latter two were chosen given the close link between hypertension and development of heart failure and progression of disease, as well as the association between area-level hypertension prevalence and adverse cardiovascular outcomes.14,15
Primary and Secondary Outcomes
The primary outcome measure was occurrence of at least one ED-revisit for acute health failure within 90 days of a prior heart failure-related ED visit (Outcome 1). We hypothesized that increased social vulnerability, as measured by SDI, would be associated with greater likelihood of 90-day revisits. This 90-day endpoint was chosen to allow sufficient time for SDoH to manifest themselves (eg, inability to attend a follow-up visit at which medication refills could be provided), as opposed to shorter time frames that may more prominently reflect undertreatment and/or treatment failure at the initial encounter. While the exact time frame over which SDoH have maximal impact on outcomes for acute heart failure is not known, the chosen timepoint includes the early posthospital discharge vulnerable phase,16,17 when adverse outcomes are greatest for patients with acute health failure. Secondary outcome measures included the per-patient count of 90-day heart-failure revisits (Outcome 2), and overall likelihood of heart failure-related hospital admission for any given heart failure-related ED visit (Outcome 3).
For the purposes of 90-day outcomes, a visit was considered an “index” visit if there were no prior ED visits or admissions within the preceding 90 days. We excluded visits within the first 90 days of the dataset because it was not possible to determine whether these represented index visits or re-visits. Patients with index visits that occurred in the prior 90 days of the dataset were also excluded from 90-day outcome assessment.
Given that the sample size was determined by the amount of available data, no power calculation was performed.
Statistical Analysis
Descriptive data are reported as medians (with interquartile range [IQR]), or proportions, as appropriate. To account for the excess zeros in the count of 90-day revisits, outcomes 1 and 2 above were modeled using two-step zerohurdle regression. The primary outcome (0 versus ≥ 1 90-day revisit) was modeled with a logistic model for the zero-hurdle component (ie, likelihood of ≥ 1 versus 0 revisits, Outcome 1)
and a positive Poisson model (representing ≥ 1 revisit) was used for the count portion (Outcome 2). Covariates included in all models were SDI, age, biologic sex, and hospital. The additional SDoH variables listed above were also considered for inclusion. We also considered two- and three-way interactions, as well as non-linear transformation of continuous covariates (restricted cubic spline with 5 knots, at quantiles 0.05, 0.275, 0.5, 0.725. and 0.95 [18]). Numerical variables were mean-centered and scaled. Variable selection was performed using Akaike Information Criteria and likelihood ratio testing for nested models. The same covariates were considered for both the zero and count components, with the number of index ED visits included as an offset in the count model. Assessment of over-dispersion in the count data was performed to ensure appropriate use of the Poisson distribution. After final model selection, the following diagnostics were performed on each sub-model: visual inspection of QQ plot; Studentized residual plot; calibration plot (for logistic model); and plots of DFFITS/DFBETAS. We assessed multicollinearity using variance inflation factor.
We used mixed-effects logistic regression to model the likelihood of hospital admission for any given A ED visit related to acute heart failure (Outcome 3). Fixed effects for this model included the following: SDI; age; biologic sex; hospital; days elapsed since prior ED visit (set to 0 for index visits); and disposition at prior ED visit (index, admit, discharge, or AMA). Other area-level factors, as detailed above, were also considered for inclusion. To account for repeat visits we added a random intercept for each patient. Numerical variables were mean-centered and scaled. Contrasts between levels of categorical variables were calculated as estimated marginal means (ie, at mean values for continuous variables and averaged across levels of categorical variables).
We performed sensitivity analyses, excluding patients at HVSH (suburban vs urban location of other hospitals) to test whether this altered the effect of SDI on outcomes. Statistical analysis was performed using RStudio Integrated Development Environment for R v2024.4.2.764 (Posit Software, PBC, Boston, MA). Models were fit with the “glmmTMB” package, and marginal means were calculated using “emmeans” and “mariginaleffects” packages. All models were estimated with maximum likelihood and cluster-robust (by hospital) standard errors. Statistical significance was set at 0.05.
RESULTS
Participant Characteristics
After exclusions (Figure 1), there were 2,406 unique patients from 129 ZIP codes, included for analysis. Approximately half of the participants were female, the median age was 66 (IQR 57-75) years, and the median ZIP-code-level SDI was 94 (IQR 79-96). Additional characteristics are listed in Table 1.
Table 1: Baseline Patient Characteristics.
Visits Assessed for Eligibility (N =4,558)
Included (n = 3,569 visits)
Excluded (n = 989)
Visit not for AHF (n = 132)
Visit in first/last 90 days of data (n = 857)
Death in ED (n = 21)
Unique Patients (n=2,406)
Patients with 1 visit (n =1,789)
Patients with ≥ 2 visits (n = 617)
Unique ZIP codes (n=129)
Figure 1. Patient flow diagram in a study describing the relationship between community-level social vulnerability and emergency department revisits and hospital admissions for heart failure. AHF, acute heart failure; ED, emergency department.
Visit Characteristics
During the study period, there were 3,569 total ED visits from 2,406 unique patients; 1,789 patients had a single visit and 617 patients had > 1 visit. The median number of ED visits in the full cohort was 1 (IQR 1-2); for patients with > 1 visit, the median ED visit count was 2 (IQR 2-3). For those with > 1 visit, the median time between ED visits was 53.5 (IQR 22-130) days. In patients with single visits, median SDI was 94 (IQR 79-95); for patients with ≥ 1 revisit, median SDI was 95 (IQR 90-96). Median area-level SDI for each hospital was 95 (IQR 95-97) for DRH, 95 (IQR 91-97) for HUH, 91(IQR 90-95) for SGH, and 13.5 (IQR 10-24) for HVSH.
Overall, 72% of ED visits (2,577/3,569) resulted in admission, and 70% of patients (1,683/2,406) had at least one admission. Hospital admission occurred in 72% of index visits (2,042/2,822). Comparison of disposition on the index, versus non-index, visits is shown in Table 2.
Missing Data
Social Deprivation Index and health insurance data were missing for the same single ZIP code, which resulted in exclusion of one visit from primary and secondary outcome analyses. Median systolic blood pressure was missing for 17 ZIP codes, which resulted in exclusion of 18 and 21 visits from the primary and secondary outcome analyses, respectively. Complete data were available on all other variables.
Biological Sex
Characteristic N = 2,4061
(49%)
(51%)
1n (%); Median (IQR); DRH=Detroit Receiving Hospital; SGH= Sinai-Grace Hospital; HUH= Harper University Hospital; HVSH= Huron Valley Sinai Hospital; AMA=Against Medical Advice; SDI= Social Deprivation Index; SBP=systolic blood pressure; HTN= hypertension
Primary and Secondary Outcomes
Of the 2,406 total patients, 409 (17%) had ≥ 1 re-visit for acute heart failure within 90 days of a prior heart failure visit. For the zero-hurdle component (Outcome 1), each 1 SD increase in SDI (30.3) was associated with increased likelihood of at least one 90-day revisit (OR 1.53; 95% CI, 1.08-2.16). For the count model (Outcome 2)—but not the zero-hurdle model—there was a significant SDI*hospital interaction (P = .02). As shown in Figure 2, increasing SDI was associated with greater number of 90-day revisits, but the magnitude varied by hospital. Predicted counts of 90-day revisits at varied levels of SDI are provided in the Supplement (Table S2).
In addition to SDI (and the SDI*hospital interaction in the count component), the final models included age, biological sex, hospital, median systolic blood pressure, and ZIP codelevel percentage without health insurance; parameter estimates are provided in Table 3. For the zero-hurdle component, significant differences for biologic sex and hospital were found, but there were no significant associations with age,
Table 2: Disposition at index vs. non-index visits
Disposition at current visit
Disposition at prior visit1
Index visit2 Admit N = 5202 AMA N = 712 Discharge N = 1562
Admit 2,042 (72%) 434 (83%) 34 (48%) 67 (43%)
Discharge
1The most recent visit compared to current visit
2n (%)
(20%) 57 (11%) 17 (24%) 78 (50%)
Rows represent disposition at the most current visit; columns represent disposition at the immediate prior visit, except “index”, which, by definition, has no prior visit (e.g., of the 71 patients who left “AMA” at prior visits, 34 were admitted at the current visit, 17 were discharged, etc).
health insurance status, or median systolic blood pressure. Income disparity was not statistically associated with revisits and worsened model fit; therefore, we excluded it. In the count model, median systolic blood pressure was associated with increased visit count (RR 1.47; 95% CI, 1.17-1.84) per SD (2.07) increase. Other significant associations were age and lack of health insurance (inverse relationships) and biologic sex (more revisits for males).
Mixed-Effects Model (Outcome 3)
Fixed-effects variables included in the final model were age, biological sex, hospital, days elapsed since prior visit (set to 0 for index visit), and disposition at prior visit (reference category set to Index visit). Best model fit was achieved with inclusion of SDI median systolic blood pressure, and
Figure 2. Plot of hospital-Social Deprivation Index interaction for count model in a study describing the relationship between community-level social vulnerability and emergency department revisits and hospital admissions for heart failure. ED, emergency department.
percentage without health insurance, although none achieved statistical significance (Table 4). Increasing age was associated with greater likelihood of admission (OR 1.25; 95% CI, 1.14-1.76 per SD (14.1 years) increase, as was increasing time between visits (OR 1.45; 95% CI, 1.29-1.62) per SD (76.3 days) increase (alternatively, OR 1.13 per 25.4 days). Income disparity was excluded from the final model for the same reasons as with the primary outcome.
The SD of the random intercept was 0.59, which translates to a patient-level effect on the OR of admission at any given visit of +/-1.80 and indicates substantial patient-level variability when compared to fixed-effects estimates (ie, the average effects in the full sample population).
Associations between disposition at prior visit and hospital on the odds of admission, as well as all as all sensitivity analyses, are provided in the Supplement (Figures S1, S2 and Tables S3 and S4).
DISCUSSION
In this single-center, retrospective study we found that higher SDI score was associated with increased risk and frequency of 90-day ED revisits for heart failure but not with hospital admission. These results suggest that while neighborhood-level social vulnerability is associated with the decision to seek heart failure-related ED care, that vulnerability does not necessarily result in more severe clinical presentations that require hospital admission. Results of the sensitivity analysis, however, suggest that the effect may vary across the spectrum of vulnerability (ie, in areas with high versus low SDI). Additional studies, encompassing the full range of SDI scores, are needed to elucidate the mechanisms through which social vulnerability influences the decision to seek ED care. Such data are critical for the development of interventions to safely reduce ED use among patients with heart failure.
Identification of acute heart failure patients who are safe for discharge from the ED has been studied extensively.19 Despite the existence of several reliable risk stratification tools, they remain poorly used.20 Equally important, but
Table 3: Zero-Hurdle Poisson Model.
Characteristic OR/RR1 95% CI p-value
Zero-hurdle (Logistic) model
SDI 1.53 1.08, 2.16 0.016
Hospital
DRH
HVSH
without health insurance
2.09 0.97, 4.53 0.061
1.34 0.99, 1.81 0.061
1.81 1.34, 2.44 <0.001
0.79, 1.13 0.5
Age 0.89 0.80, 1.00 0.051
Median SBP (ZIP code level) 1.15 0.92, 1.43 0.2
Biological sex
Count model (Positive Poisson) SDI
1.28 1.03, 1.59 0.028
7.34, 2,672 0.001
3.52, 148 0.001
1.60, 57.6 0.013
11.1 1.86, 66.7 0.008
without health insurance 0.64 0.49, 0.84 0.001
Age 0.68 0.60, 0.76 <0.001
Median SBP (ZIP code level) 1.47 1.17, 1.84 <0.001
Biological Sex F
M 1.57 1.26, 1.96 <0.001
SDI * Hospital
SDI * HVSH 0.02 0.00, 0.35 0.008
SDI * HUH 0.01 0.00, 0.25 0.004
SDI * SGH 0.02 0.00, 0.48 0.015
Continuous Variables are mean-centered and scaled 1OR, odds-Ratio for Logistic Model; RR, relative risk for Count model; CI, confidence interval.
Table 4: Odds ratio of admission at any given visit.
studied less, are strategies that safely keep patients from visiting the ED. Asthana et al found that a brief, heart failurefocused educational intervention in the ED reduced revisits at 30- and 90-days.21 The intervention focused on basics of outpatient heart failure management, as well as suggestions of when to seek outpatient versus ED care. While doubtless critical to long-term disease stability, this approach presupposes that patients have access to a litany of resources (medications, healthy foods, outpatient care, etc), which may not always be the case.
Our results are novel, in that we identified modifiable, community-level risks of increased ED use related to heart
Disposition at prior visit
Index
SD of Random Intercept 0.59
Continuous Variables are mean-centered and scaled CI, confidence interval; DRH, Detroit Receiving Hospital; SGH, Sinai-Grace Hospital; HUH, Harper University Hospital; HVSH, Huron Valley Sinai Hospital; AMA, Against Medical Advice; SDI, Social Deprivation Index; SBP, systolic blood pressure; SD, Standard deviation.
failure, but also complementary to those of Asthana et al, in that understanding the geospatial distribution of social vulnerability may allow targeted deployment of interventions based on area-level needs. For example, mobile health units could target highly vulnerable areas to ensure patients receive post-discharge follow-up visits and medication refills.
Another unique aspect of our study is that we explored the association of social vulnerability on ED revisits and hospital admissions (irrespective of whether a visit was an index or a revisit, while accounting for repeat visits by individual patients and disposition at the prior visit). Social determinants of health have been linked to adverse health outcomes6,7; therefore, a plausible assumption is that the most vulnerable patients would be frequent ED users and likely to be admitted at each visit. However, this was not the case, as increased SDI was associated with ED use but not admission. These results show that careful and nuanced interpretation of such data is warranted so that interventions can be appropriately developed and implemented where need is greatest. The (estimated) patient-level variability on the odds ratio of admission (+/1.80) likewise highlights the importance of collection of robust, patient-level measures of vulnerability owing to
heterogeneity of treatment effect (whereby composite scores may not be equally associative for all patients).
We found that among patients with at least one 90-day revisit, greater mean systolic blood pressure was associated with more ED revisits (RR 1.47; 95% CI, 1.17-1.84). Given the relationship between lack of blood pressure control and disease progression, patients from ZIP codes with higher mean systolic blood pressure may represent a “sicker” population and, thus, potentially more likely to have heart failure-related ED visits. Moreover, because systolic blood pressure is such an important risk factor for heart failure, it also represents a potential quality-of-care indicator with worse population-level control, reflecting challenges such as poor access to care or inability (or unwillingness) to adhere to a prescribed diet/ medication regimen. While these explanations reflect the reasoning for inclusion of this covariate in our models, further study is needed to delineate the relationship between mean systolic blood pressure and heart failure outcomes.
The finding that the association between SDI and number of 90-day revisits varied by hospital, and with larger magnitude at higher SDI scores, may be due to patient- and/or hospital/ physician-level factors. Elucidating causal effects will require populations with greater variation of SDI scores (particularly in the mid-range), consideration of patient clustering withinphysicians and collection of patient-level data.
Increased age and proportion with health insurance were both negatively associated with fewer ED revisits (RR 0.68; 95% CI, 0.60-0.76, and 0.64; 95% CI, 0.59-0.84, respectively). Younger patients may be those with a newer heart failure diagnosis and, owing to lesser duration of disease, they may not yet have acquired health insurance or established relationships with outpatient clinicians, thereby resulting in more ED use. Existing studies suggest that, overall, those with health insurance tend to use the ED more often than the uninsured,22 although robust heart failurespecific data are notably lacking. In contrast, other SDoH, including non-Hispanic Black race, low educational attainment, and low household income, have been associated with more ED use for heart failure.23,24 This highlights the need for more detailed investigation in this area as both individual- and community-level needs and behaviors likely influence the decision to seek ED care.
LIMITATIONS
There are several limitations to our results that warrant discussion. Our data may not generalize to other locations and populations, the observational nature of our study precludes determination of causation versus association, and area-level data are subject to the ecologic fallacy. Eligible patients were identified via ICD-10 codes—an imperfect although practical and frequently used approach that has strong negative predictive value.25 With limited patient-level data, we were unable to assess how these characteristics may have influenced
our outcome, although a prior investigation found minimal added explanatory effect of clinical in addition to SDoH data, in terms of association with acute heart failure-related hospital admission.26 We also lacked data on in-hospital death, a competing risk for ED revisits and re-admissions.
Individual-level vulnerability may be more informative than area-level data, but the former are often inaccurately or incompletely collected.27,28 While ZIP codes may not align as well with population characteristics as other delineations (eg, census tracts), ZIP-level data are widely available and have been successfully implemented in outcome models related to acute heart failure.29 Cautious interpretation is needed, however, as area-level measures, including composite measures, may not align well with individual vulnerabilities.30
Finally, the suburban hospital (HVSH) had substantially different median SDI compared to the urban locations (13.5 versus 91-95). While the magnitude of SDI associations changed when HVSH patients were excluded, there was no loss of statistical significance. This could be due to sparse data in the mid-range of SDI scores, unmeasured hospital-level effects, or residual confounding. While not definitive, our results nonetheless provide an important first step toward elucidating the relationship between area-level social vulnerability and ED use related to acute heart failure.
CONCLUSION
In this single-center, retrospective study from an urban health system, we found that increased community-level social vulnerability was associated with a higher number of 90-day revisits related to acute heart failure, but not with hospital admission. By identifying a risk factor for increased ED use, our results provide a foundation for understanding the complex decision of when and why to seek ED care for acute heart failure. This is a critical step toward developing targeted interventions to safely reduce ED revisits.
Address for Correspondence: R. Ehrman, MD, MS, Department of Emergency Medicine, Wayne State University School of Medicine, Detroit, MI 48201. Email: rehrman@med.wayne.edu
Conflicts of Interest: By the WestJEM article submission agreement, all authors are required to disclose all affiliations, funding sources and financial or management relationships that could be perceived as potential sources of bias. No other author has professional or financial relationships with any companies that are relevant to this study. There are no other conflicts of interest or sources of funding to declare.
1. Storrow AB, Jenkins CA, Self WH, et al. The Burden of Acute Heart Failure on U.S. Emergency Departments. JACC: Heart Failure. 2014;2(3):269-77.
2. Zhang X, Qiu P, Prushinskaya A, et al. Characteristics of emergency department admissions with congestive heart failure in the United States: a Nationwide cross-sectional study. BMC Emerg Med. 2022;22(1):16.
3. Khan MS, Sreenivasan J, Lateef N, et al. Trends in 30- and 90-Day Readmission Rates for Heart Failure. Circ Heart Fail.. 2021;14(4):e008335.
4. Cockerham WC, Hamby BW, Oates GR. The Social Determinants of Chronic Disease. Am J Prev Med. 2017;52(1)s1:S5-s12.
5. Sterling MR, Ringel JB, Pinheiro LC, et al. Social Determinants of Health and 30-Day Readmissions Among Adults Hospitalized for Heart Failure in the REGARDS Study. Circ Heart Fail. 2022;15(1):e008409.
6. Cohen DA, Mason K, Bedimo A, et al. Neighborhood physical conditions and health. Am J Public Health. 2003;93(3):467-71.
7. Dankwa-Mullan I, Pérez-Stable EJ. Addressing Health Disparities Is a Place-Based Issue. Am J Public Health. 2016;106(4):637-9.
8. Enard KR, Coleman AM, Yakubu RA, et al. Influence of Social Determinants of Health on Heart Failure Outcomes: A Systematic Review. J Am Heart Assoc. 2023;12(3):e026590.
9. Memedovich A, Asante B, Khan M, et al. A mapping review of interventions to address patients who frequently seek care in the emergency department. BMC Emerg Med. 2024;24(1):49.
10. von Elm E, Altman DG, Egger M, et al. The Strengthening the Reporting of Observational Studies in Epidemiology (STROBE) statement: guidelines for reporting observational studies. Lancet (London, England). 2008;61(4):344-349.
11. Korzeniewski SJ, Bezold C, Carbone JT, et al. The Population Health OutcomEs aNd Information EXchange (PHOENIX) Program - A Transformative Approach to Reduce the Burden of Chronic Disease. Public Health Inform. 2020;121:e3.
12. Robert Graham Center. Social deprivation index. 2026. Available at: https://www.graham-center.org/maps-data-tools/social-deprivationindex.html. Accessed July 1, 2026.
13. Massey DS. The age of extremes: concentrated affluence and poverty in the twenty-first century. Demography. 1996;33(4):395-412; discussion 3-6.
14. Musaogullari A, Moorhead J, Plana A, et al. Space for improvement: ZIP codes should not determine cardiovascular longevity, a scoping review. Trends Cardiovasc Med. 2024;35(4):214-218
15. Weng X, Vaughan AS, He S, et al. County-Level Hypertension Prevalence and Control in the United States: A ZIP3-County Crosswalk Using Electronic Health Record Data. Prev Chronic Dis. 2024;21:E95.
16. Chioncel O, Mebazaa A, Harjola VP, et al. Clinical phenotypes and outcome of patients hospitalized for acute heart failure: the ESC Heart Failure Long-Term Registry. Eur J Heart Fail. 2017;19(10):1242-54.
17. Greene SJ, Fonarow GC, Vaduganathan M, et al. The vulnerable phase after hospitalization for heart failure. Nat Rev Cardiol. 2015;12(4):220-9.
18. Harrell, F. E. (2015). General aspects of fitting regression models. In Regression modeling strategies: With applications to linear models, logistic and ordinal regression, and survival analysis (2nd ed., pp. 13–44). Cham, Switzerland: Springer.
19. Miró Ò, Rossello X, Platz E, et al. Risk stratification scores for patients with acute heart failure in the Emergency Department: A systematic review. Eur Heart J Acute Cardiovasc Care. 2020;9(5):375-98.
20. Fountoulaki K, Ventoulis I, Drokou A, et al. Emergency department risk assessment and disposition of acute heart failure patients: existing evidence and ongoing challenges. Heart Failure Reviews. 2023;28(4):781-93.
21. Asthana V, Sundararajan M, Ackah RL, et al. Heart failure education in the emergency department markedly reduces readmissions in unand under-insured patients. Am J Emerg Med. 2018;36(12):2166-71.
22. Zhou RA, Baicker K, Taubman S, et al. The Uninsured Do Not Use The Emergency Department More-They Use Other Care Less. Health Aff (Millwood). 2017;36(12):2115-22.
23. Hasegawa K, Tsugawa Y, Camargo CA, et al. Frequent Utilization of the Emergency Department for Acute Heart Failure Syndrome. Circulation: Cardiovascular Quality and Outcomes. 2014;7(5):735-42.
24. Savitz ST, Chamberlain AM, Dunlay S, et al. Co-Occurrence of Social Risk Factors and Associated Outcomes in Patients With Heart Failure. J Am Heart Assoc. 2023;12(14):e028734.
25. Bates BA, Akhabue E, Nahass MM, et al. Validity of International Classification of Diseases (ICD)-10 Diagnosis Codes for Identification of Acute Heart Failure Hospitalization and Heart Failure with Reduced Versus Preserved Ejection Fraction in a National Medicare Sample. Circulation: Cardiovascular Quality and Outcomes. 2023;16(2):e009078.
26. Patel SA, Krasnow M, Long K, et al. Excess 30-Day Heart Failure Readmissions and Mortality in Black Patients Increases With Neighborhood Deprivation. Circ Heart Fail. 2020;13(12):e007947.
27. Chen M, Tan X, Padman R. Social determinants of health in electronic health records and their impact on analysis and risk prediction: A systematic review. J Am Med Inform Assoc 2020;27(11):1764-73.
28. Harle CA, Wu W, Vest JR. Accuracy of Electronic Health Record Food Insecurity, Housing Instability, and Financial Strain Screening in Adult Primary Care. JAMA. 2023;329(5):423-4.
29. Deo SV, Al-Kindi S, Motairek I, et al. Impact of Residential Social Deprivation on Prediction of Heart Failure in Patients With Type 2 Diabetes: External Validation and Recalibration of the WATCH-DM Score Using Real World Data. Circ Heart Fail. 2024;17(3):e010166.
30. Bensken WP, McGrath BM, Gold R, et al. Area-level social determinants of health and individual-level social risks: Assessing predictive ability and biases in social risk screening. J Clin Transl Sci. 2023;7(1):e257.
Emergency Medicine Management of Distal Radius and Ulna Fractures: Narrative Review
Tyler Kirchberg, MD*
Robert Nolan†
Spencer Tomberg, MD†
Section Editor: Juan F. Acosta, DO
Denver Health, Department of Emergency Medicine, Denver, Colorado
Stanford O’Connor, Department of Primary Care Sports Medicine, San Jose, California
Submission history: Submitted October 1, 2025; Revision received March 20, 2026; Accepted March 13, 2026
Electronically published July 16, 2026
Full text available through open access at http://escholarship.org/uc/uciem_westjem DOI 10.5811/westjem.52930
Importance: Distal radius fractures and distal ulna fractures are common orthopedic injuries treated in emergency departments (ED). Our goal in this narrative review was to present emergency physicians with a single source that covers the evaluation and treatment of distal radius fractures and distal ulna fractures across the lifetime of our patients. There are differences in the treatment algorithms for distal radius fractures between pediatric, young adult, and geriatric patients.
Observations: Pediatric distal radius fractures are defined by their relation to the growth plate and are influenced by the gradual calcification of the developing bone. Some pediatric distal radius fractures can heal through significant displacement, while others require anatomical reduction to limit the risk of growth arrest. For adult patients with a distal radius fracture, there are established guidelines for both appropriate reduction goals and for when operative treatment is indicated. For geriatric patients, management strategies have evolved over the last decade after multiple studies demonstrated no functional difference between operative and nonoperative management. Given this, most geriatric distal radius fractures are managed nonsurgically, which makes effective reduction in the ED important to optimize long-term wrist function.
Conclusion and Relevance: Emergency physicians need to be well versed at both identifying fracture patterns and be knowledgeable about radiographic fracture-reduction goals. This emergency medicine-focused and illustrated narrative review will assist physicians, nurse practitioners, and physician assistants in meeting those goals. We also summarize pain management, splint molding, possible complications and follow-up considerations for emergency physicians treating patients with distal radius fractures. [West J Emerg Med. 2026;27(4)1090–1104.]
INTRODUCTION
Distal radius fractures and distal ulna fractures are common orthopedic injuries treated in emergency departments (ED). Distal radius fractures account for between 0.66-2.5% of all ED visits.1 They represent approximately one sixth of all fractures seen in the ED, > 25% of all pediatric fractures, and 18% of geriatric fractures (patients > 65).2,3 These fractures peak in a bimodal distribution; boys < 18 and women > 65 years of age have the highest prevalence. The risk of distal radius fractures in older women is so pronounced that there is a 15% chance that a woman > 50 years of age will have a distal radius fracture in her lifetime.4,5 The prevalence of distal radius fractures has
increased in proportion to the increase in the geriatric population, with a Danish study showing a 20% increase in incidence between 1997 and 2018.6 Most pediatric distal radius fractures occur from high energy falls or during sporting events. Torus fractures are the most common fracture pattern, followed by bicortical fractures and physeal fractures. Salter Harris II fractures comprise the majority of physeal fractures.7
Diagnosis and management strategies for treating distal radius fractures have evolved over the last decade. Optimizing pediatric fracture management, using ultrasound in the management of fractures, and a focus on nonoperative management of geriatric fractures are some of these changes.
Evaluation of distal radius fractures should include radiographs, a physical examination assessing and documenting motor and sensory function, and adequate pain control. Treatment and reduction goals depend on the degree of displacement, intraarticular involvement, and age.8,9 Splinting choices depend on the injury pattern; options range from removable Velcro wrist braces to molded plaster/ fiberglass splints.10,11
There are differences in the treatment algorithms for distal radius fractures between pediatric, young adult, and geriatric patients. Pediatric injuries are treated with a specific focus on their relation to the growth plate. Because of the ability of pediatric bones to heal through significant displacement, the guidelines for appropriate pediatric reductions sometimes allow for more angulation and displacement than for older patients.12 For adult patients with a distal radius fracture, there are established guidelines for both appropriate reduction goals and for when operative treatment is indicated. Recent studies have shown that geriatric patients (> 65 years of age) have equivalent patient-centered outcomes with operative and nonoperative management .4,13–16 Because of this, both the American Academy of Orthopedic Surgeons and the American Society for Surgery of the Hand have emphasized the importance of optimizing initial reduction and having clear conversations with patients about the lack of benefit associated with surgical treatment.9
This narrative review summarizes the current treatment guidelines for distal radius fractures for pediatric, young adult, and geriatric patients in the ED. The review can be used to guide the treatment of these fractures across a broad spectrum of injuries. It covers fracture patterns, radiographic identification of distal radius fractures, fracture reduction guidelines, imaging, analgesia, splint molding, complications, and follow-up considerations.
Clinical Presentation
The most common mechanism leading to a distal radius fracture is a fall onto an outstretched hand.17 The physical exam starts with assessment for gross deformity, which suggests displacement of the fracture. Pain with dorsiflexion or pronation, ecchymosis, wrist edema, and deformity are strong predictors of a fracture.18 Lacerations or puncture wounds can indicate open fractures. Physical examination should also include an evaluation of the motor and sensory function of the hand and forearm nerves.19
When there is a clinical concern for a distal radius fracture, history should focus on the mechanism of injury, timing, and severity of symptoms. To understand the impact the injury may have on work/school, ascertain the patient’s dominant hand, profession, and comorbidities. Past medical history should include a review of risk factors for osteopenia/ osteoporosis (female sex, advanced age, body mass index < 18.5, tobacco use, and previous fractures).20 Patients with
osteopenia/osteoporosis are at higher risk for nonunion, and fracture instability.21 Distal radius fractures may also be the sentinel event in the “fragility fracture cascade” because they typically occur earlier than hip or vertebral fractures. Identification at this stage can aid in earlier diagnosis of osteoporosis and more aggressive medical interventions.22
Compartment syndrome is a known but rare (< 1% of cases) complication of distal radius fractures.23 The two main findings associated with compartment syndrome of the forearm are pain out of proportion to exam and pain with passive stretch of the muscles in the compartment. Because both can be difficult to assess prior to fracture stabilization, this evaluation should continue after the splint is applied. The other classic signs of compartment syndrome are paresthesias, paralysis, pallor, and pulselessness, all of which are late signs that may indicate permanent damage has occurred; therefore, the clinician should prioritize diagnosing compartment syndrome before symptom onset.24 Structures deep in the volar compartment of the forearm are most at risk of injury from compartment syndrome because they lie between bony structures, the interosseous membrane of the forearm, and deep muscle fascial layers. These at-risk structures include the median nerve and anterior interosseous nerve. Structures in the superficial volar, dorsal, and mobile wad compartments are less tightly bound and are less likely to experience acute compartment syndrome.24
The physical examination should also include an evaluation of the motor and sensory function of the radial, ulnar, median, anterior interosseous and posterior interosseous nerves of the hand and forearm. Details on this examination are provided in Table 1.11,25–29
Nothing in the literature supports the broad use of twopoint discrimination to evaluate fracture-associated nerve injury in the acute setting. In the subacute setting, two-point discrimination has correlated with electromyography studies examining median nerve dysfunction in patients who developed acute carpal tunnel syndrome related to a distal radius fracture, but these electromyography studies were done months after the injury occurred.30 It is not the authors’ practice to include two-point discrimination in the evaluation of acute distal radius fractures, unless there is another injury that is concerning for nerve transection.31
Anatomy
There are two primary bones in the forearm. The ulna is the stable/fixed unit of the forearm. The proximal end is the olecranon, which tapers through the forearm until it ends at the ulnar styloid. The radius rotates around the ulna as the forearm pronates and supinates. Proximally, the radial head articulates with capitellum of the humerus. Distally, the radius becomes the larger of the two bones. The distal radius and ulna articulate with each other at the distal radioulnar joint and with the scaphoid, lunate and triquetrum carpal bones.2 The
Kirchberg et al.
Table 1. Physical examination of nerve function for patients with a distal radius fracture in a narrative review summarizing optimal evaluation and treatment strategies.
Nerve Motor (Prompt and function)
Posterior interosseous
“Give me a thumbs up.”
Extension of the thumb
Anterior interosseous “Make an A-Okay sign.”
Flexion of the thumb at the interphalangeal joint (flexor pollicis muscle)
Median “Make a claw.”
Flexion of the PIP and DIP of the 2nd and 3rd digits.
(The ulnar nerve provides this flexion function of the 4th and 5th digits)
Ulnar “Spread your fingers wide and cross your fingers”
Controlled by the ulnar nerve innervated dorsal interosseous muscles.
most significant ligamentous stabilizers of the distal radioulnar joint are the volar and dorsal radioulnar ligaments of the triangular fibrocartilage complex.33 (Figure 1)
Figure 1. Anatomy of the distal radius and ulna. The radius and ulna articulate with each other at the distal radioulnar joint. The triangular fibrocartilage complex is the most significant stabilizing structure of this joint. The radius and ulna articulate with the triquetrum, lunate, and scaphoid carpal bones.
Imaging Radiograph
Three-view wrist radiographs with posteroanterior (PA), lateral, and oblique views are the standard radiographs for evaluating injuries concerning for distal radius fractures.34 The addition of the oblique view to the PA and lateral views has been shown to detect 4-5% more fractures.35–37 The measurements guide the need for fracture reduction from the PA and lateral views.35 Dedicated forearm radiographs are not typically indicated for these injuries unless there is concern for
Sensory Areas Notes
Motor only
Motor only
Thenar eminence. Volar thumb, 2nd, 3rd digits and radial half of the 4th digit.
Hypothenar eminence. Volar 5th digit and ulnar haft of 4th digit
Dorsal hand, thumb, 2nd, 3rd digits
Branch of the radial nerve
Branch of the median nerve
more proximal injuries based on physical exam.17 Radiography has a sensitivity of approximately 95% for detecting distal radius fractures and is 57% sensitive for detecting all wrist fractures including carpal bones.38,39
The relationship of the radius to the ulna can be simplified by the “Rule of 11s”: The radius should be 11 mm longer than the ulna, the radius should have 11° volar tilt, and the radius should have 22° inclination.40 Understanding these anatomic measurements is also important for defining when a fracture reduction is adequate and when surgery is indicated. These reduction goals are discussed in detail in Table 2 of the adult fracture pattern section.
Radial length is measured on PA radiographs with normal radial length of 10-13 mm. This is calculated as the distance between lines drawn perpendicular to the main axis of the radius at the distal tip of the radial styloid and the articular surface of radius where it abuts the ulna.39,41,42 (Figure 2)
Figure 2. Measuring radial length.
Kirchberg et al. EM Management of Distal Radius and Ulna Fractures
Radial inclination is measured on PA radiographs with normal radial inclination ranging between 21°–25°. Radial inclination is defined as the angle between a line drawn perpendicular to the shaft of the distal radius that starts at the sigmoid notch of the radius and a line connecting the sigmoid notch of the distal radius and the distal tip of the radial styloid.2 (Figure 3)
Volar tilt is measured on lateral radiographs. The normal volar tilt is between 2°–20°. Volar tilt is the angle between a line perpendicular to the long axis of the radius that starts at the palmar rim of the radius and a line connecting the dorsal and palmar rims of the articular surface of the distal radius.2 (Figure 4)
Ulnar variance is measured on PA radiographs by calculating the difference between a line drawn through the sclerotic margin of the distal radius (running perpendicular to the longitudinal axis of the radius) and the distal rim of the ulnar dome.2 Positive ulnar variance occurs when the ulna extends beyond the lunate fossa of the radius, and negative ulnar variance indicates the ulna does not reach the lunate fossa.2 (Figure 5)
Computed Tomography
Computed tomography (CT) of distal radius fractures has limited utility for the initial evaluation of wrist fractures in the ED. Computed tomography of a distal radius fracture can identify occult fractures not seen on radiograph and provide details of the intraarticular extent of complex fractures. The American College of Radiology (ACR) Appropriateness Criteria defines CT for initial evaluation of blunt or penetrating wrist trauma as “usually not appropriate.” In the acute setting the ACR recommends CT only if initial radiographs are negative and one of three conditions exist: disruption of the distal radioulnar joint; carpal malalignment; and penetrating trauma with suspected foreign body.43 Computed tomography for operative planning may be beneficial. Multiple studies have demonstrated that CT identifies injury patterns that change management for patients between 20-48% of the time.44–47 Overall, CTs do not impact care in the ED but may change surgical management.33
Other Imaging Modalities
Ultrasound has been shown to have a sensitivity of up to 98% and a specificity of 93% compared to radiograph for identifying adult and pediatric forearm fractures.48 Ultrasound can identify irregularities in the bone cortex at the fracture site, and this can be used to visualize the target for hematoma blocks (discussed in the analgesia section). Furthermore, ultrasound has utility for real-time visualization of cortical alignment during fracture reduction attempts.49,50 Although ultrasound has not been found to have a significant impact on surgical intervention rates or functional outcomes, using ultrasound instead of fluoroscopy can decrease radiation exposure for patients.51
Magnetic resonance imaging (MRI) is most useful for evaluating soft tissue injury, such as injuries to the triangular fibrocartilage complex, scapholunate ligament, and lunotriquetral
Figure 5. Measuring ulnar variance.
Figure 3. Measuring radial inclination.
Figure 4. Measuring volar tilt.
EM Management of Distal Radius and Ulna Fractures Kirchberg
ligament, but it has little utility in evaluating acute fractures. Thus, MRI is not indicated in the acute ED setting.43
Adult Fracture Patterns
The seven most common distal radius fracture patterns are discussed below. Emergent surgery for distal radius fractures is recommended in the setting of neurovascular compromise, compartment syndrome, open fracture, or irreducible dislocations.17 When patients have nonemergent surgery, outcomes are optimized when surgery is completed within 6-15 days of the initial injury.52
Figure 6. This Image of a Colles fracture demonstrates dorsal displacement with no intraarticular involvement. The fracture has an associated ulnar styloid fracture.
Colles fractures account for one-sixth (17.5%) of wrist fractures. In this injury pattern, the distal radius fracture fragment is comminuted with dorsal angulation and displacement but does not have intraarticular involvement (Figure 6).53
Figure 7. This image of a Smith fracture demonstrates volar displacement with no intraarticular involvement. While the anteroposterior image raises concern for an intraarticular component, the lateral images demonstrate that the distal radius articular surface is intact. This fracture has an associated ulnar styloid fracture.
A Smith fracture, also referred to as a reverse Colles fracture, is a volarly displaced fracture that is comminuted and does not involve the articular surface (Figure 7).54
A Barton fracture is a distal radius fracture with involvement of the dorsal intraarticular rim leading to dorsal displacement of the distal radius and can involve subluxation/dislocation of the radiocarpal joint (Figure 8). Young males and motorcycle riders account for approximately 70% of Barton fractures.8 A reverse Barton fracture is a fracture along the volar intraarticular surface of the distal radius. In an emergency setting, closed reduction and splinting should be attempted for both Barton and reverse Barton fractures; however, due to the instability of these fractures and involvement of the articular surface, surgery is necessary to stabilize the joint and approximate the articular surface.55,56
The reduction goals for Colles, Smith, Barton, and reverse Barton fractures are the same: restore radial length and inclination (PA radiographs); limit intraarticular stop-offs (PA, oblique, and lateral radiographs), and restore appropriate volar/dorsal angulation (lateral radiographs). While uninjured wrists have approximately 11° of volar angulation, the reduction goals are to restore the anatomy so there is not greater than 5-10° of dorsal angulation.9 Surgery is generally indicated if these goals are not achieved.9 (Table 2)
A Galeazzi fracture is a fracture of the distal one-third of the radius with dislocation of the distal radioulnar joint, which leads to an unstable fracture. It accounts for 7% of adult and 3% of pediatric forearm fractures. For adults, the treatment of a Galeazzi fracture is open reduction and internal fixation (ORIF), because 80% of closed reduction attempts in adults fail.57–59 In pediatric patients, closed reduction and casting is attempted first. A study by Eberl et al found successful closed
Figure 8. Barton fracture with disruption of the intraarticular radial rim.
Kirchberg et al. EM Management of Distal Radius and Ulna Fractures
Table 2. Fracture reduction goals in adults (18-65 years of age) for Colles, Smith, Barton, and reverse Barton fractures.9
Intraarticular Step Off < 2 mm PA, oblique and lateral radiographs
Change in Radial Inclination <5° PA radiographs PA, posteroanterior.
9. Galeazzi fracture. The radius fracture is easy to locate. The
is distally displaced (+ ulnar variance) indicating disruption of the ligamentous structures of the distal
reduction is possible in 85% of pediatric cases, with only 15% requiring ORIF.60 (Figure 9)
10. The
is a distal radius fracture through the radial styloid.
A chauffeur fracture is an oblique or transverse intraarticular fracture of the distal radius through the radial styloid. The radial styloid fragment remains attached to the carpal bones through multiple ligaments, and there is typically significant displacement of the radial styloid from the remainder of the radius.61 Chauffeur fractures are treated operatively if there is more than 2 mm of displacement between the radius and radial styloid.62 (Figure 10)
Ulnar styloid fractures are present in 40% of distal radius fractures and are typically treated nonoperatively, but generally lead to increased pain and disability within the first
year after the injury.63 Surgical fixation can be considered when the fracture occurs at the base of the ulnar styloid with displacement of greater than 2 mm, which can compromise the stability of the distal radioulnar joint.64
Figure 11. The die-punch fracture is an impaction fracture of the radius caused by force from the lunate.
Die-punch fractures (lunate fossa fracture) are intraarticular compression fractures at the lunate fossa of the distal radius that occur due to axial loading from a fall on an outstretched hand.. There are five subtypes of die-punch fractures, and all of them generally require open reduction and internal fixation.65,66 (Figure 11)
Geriatric Fractures
In 2022, the American Academy of Orthopaedic Surgeons and the American Society for Surgery of the Hand issued a strong recommendation to treat distal radius fractures nonoperatively in patients > 66 years of age.9 Studies that look at functional outcomes using scales including the Disabilities of the Arm, Shoulder, and Hand (DASH) Score and the Michigan Hand Outcomes Questionnaire, have demonstrated that long-term outcomes are similar between closed reduction and casting/splinting compared to operative treatment of distal radius fractures in this population.4,9,13–15 A 2022 meta-analysis demonstrated significantly lower DASH scores (representing higher functional capacity) in the casting group by –2.55 points on the 100 point scale across 11 studies. While this change in DASH scores does not reach the threshold of ten points for being a clinically significant improvement, it does demonstrate that casting is not inferior to surgical treatment in this age group.4,16 As a result of this data, each of these professional societies emphasize the importance of effective initial reduction, assessment of patient’s functional status, and focused conversations with patients to explain that surgery is unlikely to improve their long-term function.
Figure
ulna
radioulnar joint.
Figure
chauffeur fracture
Pediatric Fractures
Pediatric bones are comprised of four distinct areas. The epiphysis sits at each end of the bone and contains the articular surfaces. The physis is the active site of longitudinal bone growth (commonly known as the “growth plate”) and is the region with the most healing potential. The metaphysis is adjacent to the physis away from the articular surface. The diaphysis is the mid-section of the bone and is comprised of matured dense cortical bone.
The physis contains the growth center of pediatric bones. It is made up of four zones that each have a specific role in bone development. Nearest to the epiphysis is the zone of resting cells. This is followed by the zone of proliferating cells, which is where chondrocytes rapidly divide.67 The third zone is the zone of maturing cells (hypertrophic zone), where bone lacks collagen and is not calcified. This is the most likely zone to fracture. Finally, the zone of provisional calcification is where bone develops greater strength (Figure 12).
Most of the blood supply for the physis is supplied through the epiphyseal artery, which lies between the epiphysis and the zone of resting cells. Disruption of the epiphyseal artery places the bone at risk for growth arrest. This can occur with Salter Harris III, IV and V fractures.68,69 The rate of growth arrest related to distal radius Salter Harris fractures has been approximated to be 5%, while the risk for Salter Harris fractures of the ulna are much higher at near 50%.70,71 The risk of growth arrest in Salter Harris III and IV injures is 10 times the risk associated with Salter Harris I and II fractures (0-4.6%). Data on Salter Harris V fractures is limited because they are rare injuries, occurring in <0.1% of fractures 72
Physeal Fractures
Physeal fractures make up 15-20% of all pediatric distal radius fractures, and most can be managed nonoperatively. The Salter Harris classification system describes pediatric
physeal fractures to predict risk of growth arrest and recommend interventions.
• Salter Harris I: Injury directly at the physis.
• Salter Harris II: Fracture starts at the physis and extends away from the articular surface.
• Salter Harris III: Fracture extends from the physis towards the articular surface.
• Salter Harris IV: Fracture involves the physis and extends both towards the articular surface and away towards the metaphysis.
• Salter Harris V “Erasure”: Crush or compression injury to the growth plate, involving erasure of the growth plate.
à Occurs because of repetitive micro-trauma across the growth plate (classically in gymnasts’ wrists) or from an acute force.69
à This fracture pattern has the potential to initially be missed radiographically. the radiograph can appear normal because there is no visible fracture line and the injury occurs to germinal cells within the epiphysis.73 Eventually, it can be seen as a bony bar that arrests growth at the physis.69
Figure 13. Displaced Salter Harris I fracture through the growth plate on a lateral view. The injury can also be occult where there are no radiographic findings, but an injury occurs at the growth plate.
Salter Harris I fractures can either be obvious with the distal radius completely slipped off the radial shaft, or they can be occult where the fracture occurs within the growth plate (see Figure 13). Radiographic evidence of Salter Harris I fractures can be absent on initial radiographs, and the accepted practice is to immobilize the extremity if there is pain with palpation over the growth plate, even if no fracture is identified. These patients should be referred to their pediatrician for repeat radiographs in 10-14 days; this is a somewhat arbitrary timeframe as radiographic signs of occult fracture healing can take up to 35 days to appear on
Figure 12. Zones of the growth plate and location of Salter-Harris fractures in relation to the epiphyseal artery and zones.
Kirchberg et al. EM Management of Distal Radius and Ulna Fractures radiograph.74 In addition, recent studies have shown that the rate of MRI-proven fractures in pediatric patients splinted with concern for occult Salter Harris I fracture is as low as 3%.75 For displaced Salter Harris I fractures, a closed reduction is recommended to restore normal bony anatomy.
Salter Harris II fractures do not disrupt the blood supply from the epiphyseal artery, which allows for more remodeling potential. The risk of growth arrest is reported to be 0-4.3%.76 These injuries occur more frequently in adolescents, with one series reporting 70% of Salter Harris II fractures occurring in patients > 12 years old.77 The closer the patient is to skeletal maturity the less opportunity there is for remodeling of displaced fractures.76 Injuries < 1 cm of shortening and 15º of angulation are acceptable without reduction.78,79 (Figure 14)
Salter Harris III/IV fractures disrupt the epiphyseal artery and enter the articular surface; therefore, they must be reduced and splinted into anatomic alignment to limit the risk of partial growth arrest and cartilage damage. Most displaced Salter Harris III or IV fractures will be treated with percutaneous pinning or ORIF. 80 These are rare injuries that make up ≤ 5% of all Salter Harris fractures.1 (Figure 15 and 16)
Figure 16. Salter Harris IV fractures involve the physis and extend both toward the articular surface and away from the articular surface.
All Salter Harris fractures that are managed nonoperatively require serial radiographs every one to two weeks to ensure fracture reduction is maintained. The patient must be followed until growth is visualized on radiographs to ensure there is no growth arrest. If loss of reduction occurs after seven-= days, the general practice is to not. attempt re-reduction, because late manipulation can lead to iatrogenic physeal arrest.80 One study found loss of reduction in roughly one-third of patients with pediatric Salter Harris II fractures, most of which were identified within the first two weeks post-reduction.81 (Table 3)
Table 3. Physeal fracture reduction goals for Salter Harris fractures.
Salter Harris I If displaced, restore anatomic alignment
Salter Harris II < 1 cm of shortening and < 15° of angulation are acceptable without reduction
Salter Harris III
Salter Harris IV
Restore anatomic alignment: usually surgical treatment
Restore anatomic alignment: usually surgical treatment
Salter Harris V Nondisplaced fracture pattern
Risk of Growth Arrest
Treatment of pediatric fractures that involve the physis focus on minimizing the risk of growth arrest. Factors associated with higher risk of growth arrest include younger age (< 10 years), greater initial displacement and angulation of the fracture, recurrent injury to the same joint, and higher grade Salter Harris fractures (III, IV, V).82
Metaphyseal Fractures
The metaphysis is the portion of the bone that widens between the physis and the diaphysis of the forearm. This zone contains bone that is partially calcified and is vulnerable to fractures. Metaphyseal fractures can be further categorized into buckle fractures, greenstick fractures, and complete fractures. (Figure 17)
Figure 14. Salter Harris II fractures extend away from the articular surface.
Figure 15. Salter Harris III fractures extend from the physis to the articular surface.
Metaphyseal fractures that involve disruption of both cortices of the bone (complete) can remodel through a significant range of displacement depending on the age of the patient. Fractures within the tolerances presented in Table 4 can be splinted in place without further reduction. Metaphyseal fractures outside of these ranges require closed reduction prior to splinting.83–86
A study by Orland et al found that 27% of pediatric patients < 10 years of age who received sedation for closed reduction of a distal radius fractures in a Level I pediatric trauma center did not require reduction if acceptable displacement guidelines were followed.89 Beyond the patient safety concerns associated with unnecessary sedation, studies have shown that the cost difference between casting with sedation in the ED and casting in an orthopedic clinic is $3,800–$7,000.89,90
In all cases, complete metaphyseal fractures require a molded splint to reduce the risk of further fracture displacement. Multiple studies have demonstrated that these fractures have a rate of re-displacement between 11-39%.91–95 They should also have follow-up radiographs at one week after the injury to evaluate for re-displacement of the fracture.91 Patients will be transitioned to a cast at that visit, and they can expect to be in a cast for 4-6 weeks.
Buckle fractures demonstrate no cortical lucency and include a stable, nondisplaced compression injury of one
cortex. They are managed nonoperatively with a removable Velcro wrist splint or short-arm cast.96,97 A recent study found that orthopedic management of distal radius buckle fractures is trending toward use of removeable wrist splinting for approximately three weeks, minimal follow up, and no reimaging.96 The 2023 FORCE trial found similar pain relief (3.21 versus 3.14) for wrist splints versus rigid immobilization, and no differences in pain or function at six-week follow-up.98 (Figure 18)
Greenstick fractures are defined as partial thickness fractures where the cortex and periosteum are interrupted on one side of the bone while they remain uninterrupted on the opposing side. Greenstick fractures typically occur in patients 5–14 years of age.83,84 (Figure 19)
Age range Acceptable sagittal angulation Acceptable coronal angulation Shortening from Bayonet apposition (the bone is offset side-to-side without angulation)
5-9 years83,84
≥10 years
Not tolerated if < 2 years of growth remaining: Growth typically completes at 14 years of. age in girls and 16 years of age in boys.
Figure 17. Complete metaphyseal fracture, with associated ulnar styloid fracture.
Figure 18. Distal radius buckle/torus fracture.
Figure 19. Greenstick fractures of the radius and the ulna.
Table 4. Acceptable displacement of pediatric metaphyseal fractures by age.
Nondisplaced greenstick fractures require initial immobilization with a sugar-tong splint and transition to a short-arm cast at clinic follow-up.99 Table 5 lists the acceptable limits of angulation and shortening for greenstick fractures based on age. For fractures outside these limits, closed reduction is recommended for optimal recovery.100,101
The mechanisms that lead to a greenstick fracture involve rotational forces; therefore, reduction requires the opposite rotation. If the fracture apex points to the volar arm, reduction requires traction and pronation. If the apex of the fracture points to the dorsal arm, reduction involves supination. The rule of thumb is to rotate the hand toward the apex of the fracture to reduce it. Splints should be applied with the forearm in the position required to achieve reduction (pronation or supination).86
Acute
Analgesia
There are multiple pain management options for patients with distal radial fractures. Nonsteroidal anti-inflammatories (NSAIDs) are a cornerstone of pain management and have been shown to not have a detrimental impact on extremity fracture healing in adult or pediatric patients, which makes ketorolac a reasonable choice for analgesia in the acute setting.102–106 Intravenous (IV) opiates, such as fentanyl, hydromorphone, and morphine may be necessary to treat acute fracture pain. Fentanyl has a half-life of approximately 45 minutes and may require multiple doses compared to the longer acting opiates hydromorphone (2-hour half-life) and morphine (4-hour half-life). Low-dose IV ketamine (0.1-0.3 mg/kg) has been shown to have similar analgesic effects to morphine and is a reasonable alternative, or adjunct, to IV opiate medications. Ketamine has been shown to have significant analgesic effect up to one hour.107–109
Hematoma blocks have been shown to be safe and effective for the reduction of distal radius fractures. Multiple studies have found that compared to procedural sedation, hematoma blocks are noninferior in treating pain during fracture reduction, may improve post-reduction pain and decrease ED length of stay.110–112 Specifically, a study by Bear et al found that pediatric patients who received a hematoma block spent 2.2 hours less time in the ED compared to procedural sedation.113 To perform a hematoma block the following steps are taken:
• Localize the fracture site by palpation, ultrasound, or fluoroscopy.
• Clean the forearm skin using chlorhexidine,
povidone-iodine, or another disinfecting solution.
à The incidence of infection from hematoma block is exceedingly low, with multiple studies reporting zero complications of infection.114–116
à There was no reported difference in infection rates between chlorhexidine and povidoneiodine.117
• Introduce a 21-guage sterile needle 1-3 cm proximal to the fracture at approximately a 30–45° angle and advance it until blood is aspirated from the fracture hematoma.
• Inject 5-10 mL of 1% lidocaine into the fracture hematoma.
• Perform reduction 5-10 minutes after the hematoma block is placed.118
Analgesia for distal radius fractures can also be achieved by ultrasound-guided nerve blocks of the forearm.119,120 Of note, our institution requires that any nerve block impacting the median nerve (both blocks of the median nerve itself or more proximal blocks) only be performed with ultra-short acting anesthetic (chloroprocaine) because of the risk of masking acute carpal-tunnel syndrome if the median nerve is entrapped because of injury or during reduction. This is a rare complication, found in roughly 4% of distal radius fractures and is associated with high-energy injuries and polytrauma. While this can present acutely, symptoms generally appear one week after injury.121
Bier blocks are used for analgesia in some institutions. The procedure involves placing a tourniquet on the proximal arm, exsanguinating the arm through elevation and pressure wrapping, and injection of IV anesthetic into the extremity to achieve anesthesia. While Bier blocks have been shown to provide similar analgesia and quality of reduction compared to hematoma blocks, risks including local anesthetic systemic toxicity, tourniquet pain, and resource intensity buffer the potential benefits of performing Bier blocks in the ED.122
Outpatient Pain Management
Patients discharged from the ED will require a thoughtful analgesia plan. The American Academy of Orthopedic Surgeons recommends that fractures be treated with “nonopioid pain medication (eg, ibuprofen, acetaminophen), splint, ice, elevation, and reassurance.”123 When opiates are deemed necessary, they should be low dose and of short duration (2-3 days).124–127 Opiates premixed with acetaminophen can cause confusion for patients trying to calculate acetaminophen dosage; when possible, noncombination medications may be more appropriate. A randomized trial evaluating five oral analgesic plans, including ibuprofen/acetaminophen and opioid/acetaminophen combinations, found no difference in analgesia between nonopioid and opioid combinations.128 Significantly more nausea and vomiting were reported among patients receiving opioids. Thus, priority should be placed on
Kirchberg et al.
ensuring proper dosing of ibuprofen and acetaminophen.129 If it is decided that a patient warrants opiate pain medication, the clinician should follow the U.S. Centers for Disease Control and Prevention 2022 Clinical Practice Guidelines for Prescribing Opioids for Pain, which recommend three days or less of an opioid prescription in the setting of acute fracturerelated pain.130
For pediatric patients, multiple studies have demonstrated no benefit of adding opiates to NSAIDs and acetaminophen for outpatient pain management once an extremity fracture has been immobilized.131–134 Pain management strategies should focus on rest, ice, elevation, and reassurance. Immobilizing with a sling or elevating the affected limb while sleeping are nonpharmacologic adjuncts for pain management, although specific data is limited on pain improvement from these interventions.135
Reduction Techniques
Closed reduction of distal radial fractures in the ED entails use of both manual manipulation and finger trap techniques. Finger trapping involves suspending the hand vertically with the use of finger traps attached to an IV pole while applying weights (typically 10 pounds) to the upper arm to provide longitudinal traction across the fracture site. This is maintained for approximately 15 minutes. While this is a common practice, there is minimal literature reviewing the efficacy of this technique.136
Fracture reduction technique depends on the direction of displacement of the distal radius. Fractures with dorsal displacement, such as Colles, Barton, and some die-punch fractures, first require traction in line with the deformity and then re-creation of the injury with exaggerated dorsal tilt of the distal part of the fracture. This maneuver disengages the fracture fragments from the periosteum to liberate the distal bone so that it can be pushed/reduced volarly and in line with the radial shaft. Volarly displaced radius fractures, such as Smith, reverse Barton, and certain die-punch fractures, are reduced with a mirrored reduction technique. With longitudinal traction in place, volar displacement is first accentuated, and then dorsal pressure reduces the fracture to be in line with the shaft of the radius.
Pediatric Galeazzi fractures require sedation for reduction and may require general anesthesia for appropriate closed reduction. After reduction, they are splinted in supination to support the reduction.58,60,137
Displaced distal radius fractures should be immobilized with a sugar-tong splint, which limits both wrist flexion/ extension and forearm pronation/supination.138 While patients may be transitioned to a cast that does not include the elbow at clinic follow-up, in the acute setting splints for distal radial fractures should immobilize the elbow.139 It is not standard of care to provide thumb immobilization with the splint; a recent metanalysis found that thumb
immobilization does not improve scaphoid fracture healing, pointing to limited utility of thumb immobilization even if there are associated carpal fractures.140
Indications for surgery after closed reduction include postreduction radial shortening > 3 mm, dorsal tilt > 5-10°, intraarticular displacement (chauffeur and Barton fractures), or fracture step-off > 2 mm.9,141 Any open fracture or fracture associated with neurovascular injury requires emergent orthopedic surgery evaluation (see the section on open fractures below for more details).
Splint Molding
A detailed discussion about splinting is beyond the scope of this paper, but it is important to understand splint molding. Many fractures re-displace during splint application. Fractures that are most likely to re-displace include those with concomitant ulnar fractures, completely displaced fractures, and those with significant oblique angulation from the original axis.138 Effective three-point molding techniques can minimize the risk of re-displacement after reduction. One study found that the rate of redisplacement of fractures between ED reduction and orthopedic clinic follow-up following targeted teaching on three-point molding technique decreased from 65% to 44%.142 Attempts at re-reduction of displaced distal radial fractures in the ED generally do not significantly improve radiographic alignment or decrease need for surgery.143
To place a three-point mold use the following steps:
• Point 1: Apply pressure just distal to the fracture in a direction that supports the displaced fragment from moving back to its original location.
• Point 2: Apply pressure just proximal to the fracture and in the opposite direction of point 1.
• Point 3: Apply pressure to the proximal forearm in the same direction as point 1.
à The third point both molds the splint and limits rotation of the forearm.
Figure 20. Three-point mold for a dorsally displaced distal radius fracture in a sugar-tong splint.
The cast/splint index is a measure of adequate compression of a splint and is defined as a ratio of anteroposterior to lateral internal diameters of the splint at the level of the fracture.144 Studies have demonstrated that a cast/splint index > 0.8 correlates with increased risk of re-displacement of the fracture.145,146 For example, if the volar width of the splint is 5 cm (which should match the width of the forearm), then the diameter on lateral radiograph should be < 4 cm to have an appropriate cast/splint index (< 0.8). (Figure 20)
Open Fractures
An open fracture requires urgent operative intervention and stabilization. The American Academy of Orthopaedic Surgeons Practice Guidelines on Preventing Surgical Site Infection recommends debridement and irrigation in the operating room of open fractures as soon as reasonable, and within 24 hours post-injury, to decrease risk of fracturerelated infection and surgical site infections.147 Administering antibiotics within an hour of an open fracture limits the spread of infection.148 Studies have found 2.4 times increased risk of infection if antibiotics are given > 120 minutes after injury, and an infection rate of 20% if antibiotics are given > 150 minutes following injury, compared to 4% if given within one hour.149,150
The Gustilo-Anderson system was created to help define the severity of open fractures and it guides antibiotic choice for open fractures.151
• Type I: < 1 cm wound length. Simple fracture pattern. Minimal soft tissue damage and contamination.
• Type II: > 1 cm wound length. Simple or comminuted fracture pattern. Moderate soft tissue damage/ contamination.152
• Type III: > 1 cm wound length. Extensive soft tissue damage and trauma.
For grade I and II open fractures, 2 g cefazolin IV is the recommended antibiotic, or 3 g for patients > 120 kg. For grade III open fractures, additional Gram-negative coverage is recommended and often achieved with the addition of 6 mg/kg gentamicin IV.140
LIMITATIONS
There are several limitations to this narrative review. The first is that because a significant proportion of the data related to the treatment of distal radial fractures comes from the orthopedic literature, it must be translated to the ED clinical setting. Additionally, evidence for the use of ultrasound and ultrasound-guided nerve blocks in the ED for the treatment of distal radial fractures is still provisional. While some data has been intriguing, the tools have not been widely adopted into community practice.153 Guidelines on appropriate criteria for pediatric fracture reduction goals vary between sources; thus, we have presented recommendations that compile data from multiple studies conservatively. Finally, we did not discuss
appropriate splinting methods in this review; there is variable practice between locations on appropriate materials and methods for splinting/casting.
CONCLUSION
Distal radial fractures are common in patients of all ages. Initial evaluation should involve radiographs, a physical exam assessing for motor and sensory deficits, and adequate pain control. Treatment and reduction of the fracture depend on the specific fracture pattern, degree of displacement and patient age. Adequate reduction of fractures in adult patients (18-65 years of age) is defined using the following measurements: < 5 mm of radial shortening; < 5-10° of dorsal angulation (or within 20° of the other wrist); < 2 mm intraarticular step off; and < 5° of radial inclination change. In patients > 65 years of age, nonoperative management of displaced distal radius fractures has recently been shown to have noninferior outcomes to patients who are treated surgically. Therefore, most geriatric patients are treated with closed reduction alone; this means that the reduction in the ED will determine longterm bony alignment. Pediatric patients have the ability to heal significantly displaced fractures. There are age and fracturemorphology guidelines that guide whether pediatric distal radial fractures require reduction prior to splinting in the ED.
ACKNOWLEDGMENTS
The authors would like to acknowledge Daniel Kolb, radiology technician at Denver Health Winter Park Ski Area Clinic for assistance with obtaining fracture images.
Address for Correspondence: Spencer Tomberg, MD, Denver Health Medical Center, Department of Emergency Medicine, 777 Bannock St., Denver CO 80204. Email: spencer.tomberg@ denverem.org.
Conflicts of Interest: By the WestJEM article submission agreement, all authors are required to disclose all affiliations, funding sources and financial or management relationships that could be perceived as potential sources of bias. There are no other conflicts of interest or sources of funding to declare.
1. Nellans KW, Kowalski E, Chung KC. The epidemiology of distal radius fractures. Hand Clin. 2012;28(2):113-125.
2. Bunch PM, Sheehan SE, Dyer GS, Sodickson A, Khurana B. A biomechanical approach to distal radius fractures for the emergency radiologist. Emerg Radiol. 2016;23(2):175-185.
Kirchberg et al.
Management of Distal Radius and Ulna Fractures
3. Loredo RA, Sorge DG, Garcia G. Radiographic evaluation of the wrist: a vanishing art. Semin Roentgenol. 2005;40(3):248-289.
4. Yang Q, Cai G, Liu J, Wang X, Zhu D. Efficacy of cast immobilization versus surgical treatment for distal radius fractures in adults: a systematic review and meta-analysis. Osteoporos Int. 2023;34(4):659-669.
5. MacIntyre NJ, Dewan N. Epidemiology of distal radius fractures and factors predicting risk and prognosis. J Hand Ther. 2016;29(2):136-45.
6. Viberg B, Tofte S, Rønnegaard AB, et al. Changes in the incidence and treatment of distal radius fractures in adults - a 22-year nationwide register study of 276,145 fractures. Injury. 2023;54(7):110802.
7. Shah AS, Guzek RH, Miller ML, et al. Descriptive Epidemiology of Isolated Distal Radius Fractures in Children: Results From a Prospective Multicenter Registry. J Pediatr Orthop. 2023;43(1):e1-e8.
8. Mauck BM, Swigler CW. Evidence-Based Review of Distal Radius Fractures. Orthop Clin North Am. 2018;49(2):211-222.
9. Kamal RN, Shapiro LM. American Academy of Orthopaedic Surgeons/American Society for Surgery of the Hand Clinical Practice Guideline Summary Management of Distal Radius Fractures. J Am Acad Orthop Surg. 2022;30(4):e480-e486.
10. Stevens NM, Pean C, Norris Z, et al. Clinical and Radiographic Comparison of Splinting Constructs for Distal Radius Fractures: An Effort to Free the Elbow. J Orthop Trauma. 2022;36(9):465-468.
11. Handoll HH, Elliott J, Iheozor-Ejiofor Z, et al. Interventions for treating wrist fractures in children. Cochrane Database Syst Rev. 2018;12(12):CD012470.
12. Liu DS, Murray MM, Bae DS, et al. Pediatric and Adolescent Distal Radius Fractures: Current Concepts and Treatment Recommendations. J Am Acad Orthop Surg. 2024;32(21):e1079-e1089.
13. Nordback PH, Ragupathi T, Cheah AEJ. A proposed paradigm shift in the management of distal radius fractures. J Orthop. 2024;49:117-122.
14. Luokkala T, Laitinen MK, Hevonkorpi TP, et al. Distal radius fractures in the elderly population. EFORT Open Rev. 2020;5(6):361-370.
15. Chung KC, Kim HM, Malay S, et al. Wrist and Radius Injury Surgical Trial Group. The Wrist and Radius Injury Surgical Trial: 12-Month Outcomes from a Multicenter International Randomized Clinical Trial. Plast Reconstr Surg. 2020;145(6):1054e-1066e.
16. Sorensen AA, Howard D, Tan WH, et al. Minimal clinically important differences of 3 patient-rated outcomes instruments. J Hand Surg. 2013;38(4):641-649.
17. Patel DS, Statuta SM, Ahmed N. Common Fractures of the Radius and Ulna. Am Fam Physician. 2021;103(6):345-354.
18. Eyler Y, Sever M, Turgut A, et al. The evaluation of the sensitivity and specificity of wrist examination findings for predicting fractures. Am J Emerg Med. 2018;36(3):425-429.
19. Pierrart J, Tordjman D, Ikeuchi N, et al. Nerve injuries associated with distal radius fractures. Hand Surg Rehabil. 2016;35S:S75-S79.
20. Xiao PL, Cui AY, Hsu CJ, et al. Global, regional prevalence, and risk factors of osteoporosis according to the World Health Organization
diagnostic criteria: a systematic review and meta-analysis. Osteoporos Int. 2022;33(10):2137-2153.
21. Clayton RAE, Gaston MS, Ralston SH, et al. Association between decreased bone mineral density and severity of distal radial fractures. J Bone Joint Surg Am. 2009;91(3):613-619.
22. Shah GM, Gong HS, Chae YJ, et al. Evaluation and Management of Osteoporosis and Sarcopenia in Patients with Distal Radius Fractures. Clin Orthop Surg. 2020;12(1):9-21.
23. Khoshhal KI, Alsaygh EF, Alsaedi OF, et al. Etiology of trauma-related acute compartment syndrome of the forearm: a systematic review. J Orthop Surg. 2022;17(1):342.
24. Hwang RW, de Witte PB, Ring D. Compartment syndrome associated with distal radial fracture and ipsilateral elbow injury. J Bone Joint Surg Am. 2009;91(3):642-645.
25. Sensory Exam by Nerve | Hand Surgery Resource. Available at: https://www.handsurgeryresource.net/sensory-exam-nerve. Accessed March 9, 2026.
26. Ljungquist KL, Martineau P, Allan C. Radial nerve injuries. J Hand Surg. 2015;40(1):166-172.
27. DaSilva MF, Moore DC, Weiss AP, et al. Anatomy of the palmar cutaneous branch of the median nerve: clinical significance. J Hand Surg. 1996;21(4):639-643
28. Wynter S, Dissabandara L. A comprehensive review of motor innervation of the hand: variations and clinical significance. Surg Radiol Anat SRA. 2018;40(3):259-269.
29. Woo A, Bakri K, Moran SL. Management of ulnar nerve injuries. J Hand Surg. 2015;40(1):173-181.
30. Hergár L, Agócs G, Váncsa S, et al. Assessing the severity of carpal tunnel syndrome during physical examination by measuring two-point discrimination: Post-hoc analysis of prospectively collected data. Injury. 2024;55 Suppl 3:111536.
31. Feinberg J. EMG: Myths and Facts. HSS J. 2006;2(1):19-21.
32. Viberg B, Tofte S, Rønnegaard AB, et al. Changes in the incidence and treatment of distal radius fractures in adults - a 22-year nationwide register study of 276,145 fractures. Injury. 2023;54(7):110802.
33. Kim KW, Lee CH, Choi JH, et al. Distal radius fracture with concomitant ulnar styloid fracture: does distal radioulnar joint stability depend on the location of the ulnar styloid fracture? Arch Orthop Trauma Surg. 2023;143(2):839-845.
34. Metz VM, Gilula LA. Imaging techniques for distal radius fractures and related injuries. Orthop Clin North Am. 1993;24(2):217-228.
35. Porrino JA, Maloney E, Scherer K, et al. Fracture of the distal radius: epidemiology and premanagement radiographic characterization. AJR Am J Roentgenol. 2014;203(3):551-559.
36. Jackson ME, Henderson JE. Following trauma, should adult wrist radiographic examinations be two or three projections? Emerg Radiol. 2010;17(2):87-93.
37. De Smet AA, Doherty MP, Norris MA, et al. Are oblique views needed for trauma radiography of the distal extremities? AJR Am J Roentgenol. 1999;172(6):1561-1565.
Kirchberg et al.
38. Etli I, Kozaci N, Avci M, et al. Comparison of the diagnostic accuracy of X-ray and computed tomography in patients with wrist injury. Injury. 2020;51(3):651-655.
39. Balci A, Basara I, Çekdemir EY, et al. Wrist fractures: sensitivity of radiography, prevalence, and patterns in MDCT. Emerg Radiol. 2015;22(3):251-256.
40. Heng BQH, Kang YC, Lim JXY, et al. Epidemiology of Distal Radius Fixations and Functional Outcomes in the Superelderly Population. J Hand Surg Asian-Pac Vol. 2020;25(1):26-31.
41. Wheeless CI. Distal Radial Fracture: Radial Length. In: Wheeless’ Textbook of Orthopaedics. 2020. Available at: https://www. wheelessonline.com/trauma-fractures/distal-radial-frx-radial-length/ Accessed September 9, 2025.
42. Chan PYW, Silver JM, Phelan J, et al. How Are Radial Height and Radial Shortening Defined in the Treatment of Distal Radius Fractures? A Critical Review. Hand NY. 2024;19(5):726-733.
43. Expert Panel on Musculoskeletal Imaging, Torabi M, Lenchik L, et al.
ACR Appropriateness Criteria ® Acute Hand and Wrist Trauma. J Am Coll Radiol. 2019;16(5):S7-S17.
44. Harness NG, Ring D, Zurakowski D, et al. The influence of three-dimensional computed tomography reconstructions on the characterization and treatment of distal radial fractures. J Bone Joint Surg Am. 2006;88(6):1315-1323.
45. Azi ML, Teixeira MB, de Carvalho SF, et al. Computed Tomography vs Standard Radiograph in Preoperative Planning of Distal Radius Fractures with Articular Involvement. Strateg Trauma Limb Reconstr. 2019;14(1):15-19.
46. Cole RJ, Bindra RR, Evanoff BA, et al. Radiographic evaluation of osseous displacement following intra-articular fractures of the distal radius: reliability of plain radiography versus computed tomography. J Hand Surg. 1997;22(5):792-800.
47. Dankelman LHM, Barvelink B, Verhofstad MHJ, et al. Traditional radiography versus computed tomography to assess reduced distal radius fractures. Eur J Trauma Emerg. 2024;50(5):2313-2321.
48. Caroselli C, Zaccaria E, Blaivas M, et al. A Pilot Prospective Study to Validate Point-of-Care Ultrasound in Comparison to X-Ray Examination in Detecting Fractures. Ultrasound Med Biol. 2020;46(1):11-19.
49. Douma-den Hamer D, Blanker MH, Edens MA, et al. Ultrasound for Distal Forearm Fracture: A Systematic Review and Diagnostic MetaAnalysis. PloS One. 2016;11(5):e0155659.
50. Sabzghabaei A, Shojaee M, Arhami Dolatabadi A, et al. UltrasoundGuided Reduction of Distal Radius Fractures. Emerg Tehran Iran. 2016;4(3):132-135.
51. Malik H, Appelboam A, Nunns M. Ultrasound-directed reduction of distal radius fractures in adults: a systematic review. Emerg Med J. 2021;38(7):537-542.
52. Persitz J, Baltzer H, Calzavara A, et al. Impact of Time-to-Surgery on Adverse Outcomes for Distal Radius Fractures: A Population-Based Study. J Orthop Trauma. 2026;40(1):e9-e16.
53. Lim JA, Loh BL, Sylvestor G, et al. Perioperative
management of distal radius fractures. J Perioper Pract. 2021;31(10):1750458920949463.
54. Matsuura Y, Rokkaku T, Kuniyoshi K, et al. Smith’s fracture generally occurs after falling on the palm of the hand. J Orthop Res. 2017;35(11):2435-2441.
55. Tang Z, Yang H, Chen K, et al. Therapeutic effects of volar anatomical plates versus locking plates for volar Barton’s fractures. Orthopedics. 2012;35(8):e1198-1203.
56. S J K, Ethiraj P. Do Variable Locking Plates Provide Better Functional and Radiological Outcomes in Volar Barton Fractures? Cureus. 2022;14(11):e31427.
58. Atesok KI, Jupiter JB, Weiss APC. Galeazzi fracture. J Am Acad Orthop Surg. 2011;19(10):623-633.
59. Alajmi T. Galeazzi Fracture Dislocations: An Illustrated Review. Cureus. 2020;12(7):e9367.
60. Eberl R, Singer G, Schalamon J, et al. Galeazzi Lesions in Children and Adolescents: Treatment and Outcome. Clin Orthop. 2008;466(7):1705-1709.
61. Wheeless CI. Chauffeur’s Fracture: Radial Styloid Fractures. In: Wheeless’ Textbook of Orthopaedics. 2020. Available at: https:// www.wheelessonline.com/joints/chauffeurs-fracture-radial-styloidfractures/. Accessed September 9, 2025.
62. Reichel LM, Bell BR, Michnick SM, et al. Radial Styloid Fractures. J Hand Surg. 2012;37(8):1726-1741.
63. Daneshvar P, Chan R, MacDermid J, et al. The effects of ulnar styloid fractures on patients sustaining distal radius fractures. J Hand Surg. 2014;39(10):1915-1920.
64. Richards TA, Deal DN. Distal ulna fractures. J Hand Surg. 2014;39(2):385-391.
65. Zhang B, Hu P, Cheng XD, et al. Volar, Splitting, and Collapsed Type of Die-Punch Fracture Treated by Volar Locking Plate (VLP): A Retrospective Study. Orthop Surg. 2020;12(3):869-877.
66. Zhang J, Ji XR, Peng Y, et al. New classification of lunate fossa fractures of the distal radius. J Orthop Surg. 2016;11(1):124.
67. Cooper GM. Cell Proliferation in Development and Differentiation. In: The Cell: A Molecular Approach. 2nd Edition. Sinauer Associates; 2000. Available at: https://www.ncbi.nlm.nih.gov/books/NBK9906/ Accessed September 9, 2025.
68. Perron AD, Miller MD, Brady WJ. Orthopedic pitfalls in the ED: pediatric growth plate injuries. Am J Emerg Med. 2002;20(1):50-54.
69. Cepela DJ, Tartaglione JP, Dooley TP, et al. Classifications In Brief: Salter-Harris Classification of Pediatric Physeal Fractures. Clin Orthop. 2016;474(11):2531-2537.
70. Bellaire LL, Vuillermin C, Steinman S, et al. Traumatic Physeal Arrests at the Wrist. J Pediatr Orthop Soc N Am. 2021;3(2).
71. Dabash S, Prabhakar G, Potter E, et al. Management of growth arrest: Current practice and future directions. J Clin Orthop Trauma. 2018;9(Suppl 1):S58-S66.
72. Deng H, Zhao Z, Xiong Z, et al. Clinical characteristics of 1124
EM Management of Distal Radius and Ulna Fractures
children with epiphyseal fractures. BMC Musculoskelet Disord. 2023;24:598.
73. Kallini JR, Fu EC, Shah AS, et al. Growth Disturbance Following Intra-articular Distal Radius Fractures in the Skeletally Immature Patient. J Pediatr Orthop. 2020;40(10):e910-e915.
74. Larsen MC, Bohm KC, Rizkala AR, Ward CM. Outcomes of nonoperative treatment of salter-harris ii distal radius fractures: a systematic review. Hand. 2016;11(1):29-35.
75. Davis DR, Green DP. Forearm fractures in children: pitfalls and complications. Clin Orthop. 1976;(120):172-183.
Cultivating Environmentally Sustainable Emergency Departments with GreenED
Jennifer L. Wood, MBChB, BSc*†
Alexander Robertson, MBChB*‡
Tim Spruell, MBChB, MSc*§
Zoe Steley, MBBS, BA, MA*||
GreenED, Royal College of Emergency Medicine, London, United Kingdom
National Health Service Lothian, Environmental Sustainability Team, Edinburgh, United Kingdom
National Health Service Fife, Victoria Hospital, Emergency Department, Kirkcaldy, United Kingdom
University Hospital Sussex, Emergency Department, Brighton, United Kingdom
Sydney Hospital and Syndey Eye Hospital, New South Wales, Australia
Section Editor: Mark I. Langdorf, MD, MHPE
Submission history: Submitted December 7, 2025; Revision received March 12, 2026; Accepted March 17, 2026
Electronically published July 16, 2026
Full text available through open access at http://escholarship.org/uc/uciem_westjem DOI 10.5811/westjem.61385
Introduction: Collective leadership within healthcare is critical if we are to deliver on net zero targets and provide high-value, low-carbon care to our patients. However, driving change in systems under considerable strain from crowding, limited resources, and increasingly complex caseloads can be a daunting task and often feels out of reach. In July 2023, the Royal College of Emergency Medicine (RCEM) launched a sustainability initiative to support environmentally sustainable healthcare within emergency departments (ED). This 12-month support and accreditation scheme centers around a framework of 36 actions and has been designed to make sustainability interventions accessible to staff, enabling individuals, groups, and networks to become leaders within their own spheres of influence and elicit measurable changes. The objective of this study was to evaluate the impact of the accreditation scheme over a 2-year period.
Methods: The primary outcome measures were the financial and carbon savings made by participating sites. Secondary outcome measures were derived from a thematic analysis of written submissions, undertaken to identify co-benefits and generate qualitative insights into both barriers to, and enablers of, environmental sustainability interventions within EDs.
Results: Five sites were successfully accredited for Bronze and Silver awards in 2024, and 10 sites for Bronze, Silver and Gold awards in 2025, with combined projected annual savings of £351,366 and 157,724 kg of carbon dioxide equivalent.
Conclusion: To our knowledge, this is the first time that a collaborative, structured, dynamic, and scalable approach to sustainable healthcare in emergency medicine has been used worldwide.
[West J Emerg Med. 2026;27(4)1105–1112.]
INTRODUCTION
Sociopolitical factors are now the rate-limiting step in rolling out high-value, low-carbon healthcare.1 Collective leadership is, therefore, imperative if we are to stimulate the structural reorganisation and new behaviours within our healthcare system and society that are required to address the increasing presentations of climate crisis patients at the ‘front door’ in emergency medicine (EM).2,3 As a threat multiplier,
the climate crisis will continue to exacerbate existing health and social inequalities for future generations and challenge our already struggling systems.
In response to the existential threat of climate change, the UK’s National Health Service (NHS) committed to reaching net zero emissions in October 2020, becoming the world’s first health service to do so.4 However, the healthcare system itself compounds this crisis, generating around 4-6% of the UK’s total
Cultivating Environmentally Sustainable EDs with GreenED Wood
carbon footprint.5, 6 Some examples include the overuse of non-sterile gloves, which are derived from fossil fuels and often flown or shipped from Asia; meter dose inhalers, which contain a hydrofluoroalkane gas 1,300 times stronger than carbon dioxide and whose plastic, derived from fossil fuels, is currently difficult to recycle; and low-value radiology and pathology tests, which all have financial and environmental concerns, as well as patient safety concerns when inappropriately utilized.7-10
We commend NHS Scotland’s Climate Change Risk Assessments and Adaptation summary report and NHS England’s Green Plan guidance which help to identify the next steps in decarbonising the NHS. However, amid crowding, staff shortages, and increasingly complex presentations, many healthcare workers lack the time, knowledge, support, and confidence in their ability to enact behavioural and systemslevel change.11-13
The Royal College of Emergency Medicine (RCEM) launched a sustainability initiative called GreenED in July 2023, after a pilot study in England from 2021–2022.14 This framework of actions has been designed by emergency clinicians to help emergency department (ED) staff in high resource settings to reduce environmental impacts of clinical practice and departmental operations whilst quantifying carbon and financial savings associated with transitioning to highvalue, sustainable models of patient care. To our knowledge, this is the first time that a collaborative, structured, dynamic,
and scalable approach to sustainable healthcare in EM has been used. This brief report will discuss the scheme which consists of the development of the framework and share insights from the EDs that were accredited at Bronze, Silver, and Gold levels in 2024 and 2025.
What is it?
GreenED is a 12-month support and accreditation scheme that consists of evidence-based actions, structured into three levels by order of feasibility —immediate changes (Bronze); mid-term changes (Silver); and long-term changes (Gold)—to make an ED more environmentally sustainable (Figure 1). Sites typically progress through these levels in a stepwise manner.
Whilst some resources are open access, sites can pay a fee (£2,200 as of 2026) to access further resources. These include an online portal with customized collated resources which equips participants to design and implement practical departmental changes, and monthly troubleshooting meetings facilitated by clinicians with sustainable healthcare expertise, which help to share achievements and identify barriers to action implementation. This iterative process enables participants to become leaders in their own spheres of influence, feeding innovative case studies back into the scheme to empower others and grow the evidence base for environmentally sustainable emergency healthcare.
Figure 1. GreenED Framework 3.0 Bronze, Silver and Gold levels (updated May 2025). This figure depicts the actions in Framework 3.0, separated into Bronze, Silver and Gold, that emergency departments (ED) can undertake to make their ED more environmentally sustainable over the short-term, mid-term, and long-term. respectively. ED, emergency department.
How was it created?
In 2019 the RCEM established the Environmental Specialist Interest Group (ESIG) and tasked the appointed volunteers with developing ways to make daily clinical practice more environmentally sustainable. A working group of emergency physicians and advanced care practitioners from hospitals in the UK was assembled to discuss environmental sustainability actions which could be enacted in an ED setting.
With potential actions identified, ESIG and the RCEM Quality Team collaborated with the founders of the Laboratory Efficiency Assessment Framework (LEAF), a certification in sustainable laboratory operations managed by University College London, on the proposed initial GreenED framework, termed Framework 1.0 15 An induction webinar was held in November 2021 for emergency clinicians interested in trialing the framework as pilot sites where the background to the Framework 1.0 was shared along with its potential to contribute towards the target of NHS net zero 2040 targets. Ten sites in England registered for an eight-month pilot. Initial seed funding of £83,000 from a healthcare public body allowed for the development of the framework and pilot project to be undertaken. Sites were provided with digital monthly catch ups with members of the GreenED team, the Framework 1.0, infographics, and a project folder where they could submit required reports (following a standardised reporting format) and evidence of their actions in the form of reports, photos, videos, slide decks and posters.
Accreditations standards and minimum evidence requirements were developed with ESIG, LEAF and the RCEM quality directorate. Submissions were examined by members of the ESIG and LEAF teams at the end of the eight-month period and included discussions with the site leads. Eight of the sites were accredited with Bronze level awards. Feedback from sites and teams involved in the pilot was used to improve and develop the GreenED Framework 2.0 which was reviewed and endorsed by a healthcare public body. Improvements included the building of a customized online portal hosted by the RCEM and customized carbon calculators, along with some minor adjustments to the framework (difficult-to-attain actions were moved to Silver levels), and it was launched by the RCEM in July 2023 for sites in the UK to voluntarily sign up to.
METHODS
Participating groups worked through the GreenED Framework 2.0 in ‘communities of practice’ to enable collaboration and troubleshooting. Using the portal, sites submitted qualitative data about achieving actions and describing barriers faced, along with quantitative data using the customized portal carbon calculators for certain actions, including adjusting computer monitor brightness, low-carbon staff travel, using recycled paper, energy efficiency of light emitting diode (LED) lights, and use of cannulas. Carbon
savings are measured using carbon dioxide equivalent (CO2e), a universally recognised metric that expresses the warming impact of all greenhouse gases in terms of the equivalent amount of CO2. Financial savings for each action were reported by sites according to the local procurement data in their ED in pound sterling. Savings categories were defined as Patient Pathways, Procurement, Energy, Waste, and Travel.
Patient pathways included savings made in cannulation pathways, pathology/radiology savings, reduced non-sterile glove use, and switching from nitrous oxide to methoxyfluorane in the ED. Methoxyfluorane (Penthrox) has a longer duration of analgesia compared to nitrous oxide, can be delivered via a small hand-held inhaler, and has a significantly lower CO2e than nitrous oxide. Other pathways include the following: procurement savings related to recycled paper and reusing mobility aids; waste savings related to correct waste streaming between domestic, clinical, and recycling bins; energy savings from reducing monitor brightness/reducing time to idle, switching to LED lights and using sensors to reduce use in low-use areas; and travel savings related to staff changing modes of transport to work or by working remotely on non-clinical days.
Assessors reviewed the quantitative savings submitted by sites along with the evidence submitted for these savings. Quantitative evidence was then sorted into savings categories as defined above and extrapolated to calculate projected annual financial and carbon savings. If sites were unable to produce sufficient evidence for their calculations (such as incomplete procurement data or savings which were part of a Trust-wide initiative as opposed to an ED-only initiative) these savings were not included in the final calculations in Tables 1 and 2.
Institutional governance approval for the thematic analysis was obtained by the Clinical Effectiveness Team in a UK district general hospital. Using peer-reviewed standards, a pool of clinicians who assessed the submissions, performed a thematic analysis on the evidence from the five sites that submitted for accreditation in 2024. Each submission was reviewed separately by two assessors who created codes and identified initial themes. Themes from the written submissions were then shared with and collated by the GreenED team. The team also compiled the available data on carbon and financial savings from all sites that submitted in 2024 and 2025.
RESULTS
Summative quantitative results are listed in Table 1, highlighting projected financial savings per year that can be made whilst maintaining high-value, low-carbon clinical care, whilst Table 2 shows the individual sites projected carbon and cost savings made through the specific actions they chose to target.
The GreenED actions resulted in clear financial and carbon savings for EDs. Quantitative savings are a
Table 1. Projected quantitative savings rounded to the nearest pound (£) and kilogram from emergency departments using GreenED Framework 2.0.
2,carbon dioxide.
Table 2. Site-specific projected annual savings in kilograms and pounds sterling (£) from emergency departments using GreenED Framework 2.0.
Figure 2. An original GreenED Infographic which has since been developed into GreenED Framework 3.0 (see Figure 1). ED, emergency department.
between hospital specialties and departments was reported. One site acknowledged that ‘conversations on sustainability that begin in [the] ED can be continued in primary care’, highlighting the interface between ED and primary care. Another site reported that after ‘the Sustainability fellow...for ED was employed...the momentum for sustainability work took off’, highlighting that strong environmental leadership within a collective can influence entire organisations.
Multidisciplinary and inclusive teams are the most effective,
‘We have a large Initiative working group which meets up every three months. Our group includes doctors, nurses, advanced clinical practitioners, emergency nurse practitioners, managers, pharmacists, IT managers and sustainability managers.’
All sites reported that the success of the GreenED teams relied on inclusive and multidisciplinary teamwork; colleagues from different departments gravitated towards the group, breaking down professional silos. Many teams are now in regular contact with professionals in estates, domestics, sustainability as well as other community and hospital specialties.
The Initiative saves money and carbon.
‘We changed our screen brightness settings from 80% to 50%, installed a night mode to our screens and have communicated with our IT teams about changing our screensaver times. This is projected to save 3,500 kg CO2e per year.’
Figure 2. One of the original GreenED Infographics which has since been developed into GreenED Framework 3.0 (see Figure 1).
conservative projection due to limitations on data-gathering abilities in busy departments. This is being examined and improved for Framework 3.0. Not all departments were able to undertake comprehensive audits or submit projected savings due to time and capacity constraints, and results are likely an underestimate.
The thematic analysis revealed 28 different themes which are showcased in Table 2. We discuss particular theme highlights below.
Theme Highlights
Sustainability leads can effect change beyond the emergency department,
Sites reported that education and leadership from the GreenED team contributed to departmental level changes and had a positive impact on department culture, leading to sustainable changes in work and at home. Sites found that GreenED actions complemented Trust sustainability plans, and sustainable working practices were ‘shared and taken up by other areas of the hospital’. Extensive co-operation
All actions were designed to meet the triple bottom line, used to describe the intersection of improved patient care, improved environmental sustainability, and financial savings. Addressing systemic waste by optimising IT settings, enhanced waste segregation as well as reducing low-value care (such as unnecessary cannulation) resulted in reductions in carbon emissions, whilst also resulting in financial savings. If scaled across the hospital sites, the interventions could lead to significant cost and carbon savings.
Systemic barriers to progress were identified across a variety of actions.
‘We have struggled to meet this target. Salbutamol DPI [dry powder inhaler] is not available on our regional formulary’.’
Systemic barriers to specific sustainability actions were identified by sites during the monthly catch. ups and accreditation process. Commonly encountered barriers included not having a kitchen to wash reusable cups, as well as dry powder inhalers not being available on regional formularies. Departments would struggle to overcome these barriers alone, but by identifying them through the accreditation process, the RCEM’s ESIG was able to advocate for changes at regional and national levels.
Table 3. Qualitative themes identified from thematic analysis of the Initiative site submissions 2024-2025.
Thematic analysis from submissions
Sustainability work was already underway in some EDs before starting GreenED accreditation.
The accreditation has led to innovative sustainability work both within and out of the ED.
Implementing clear signage on bins and teaching sessions on waste segregation are useful ways to instigate change.
Digital communication including Microsoft Teams, email, social media, and video are invaluable tools for a successful project.
Posters, notice boards and suggestion boxes are well used to exchange sustainability information with patients and staff.
GreenED teams are most effective when multidisciplinary, inclusive and with good working relationships with teams in the wider hospital.
GreenED teams see that a close working relationship with Trust sustainability managers helps to progress projects.
Departments have used the champion role and badges to identify core GreenED members.
Prioritising the Initiative by adding it as a standing agenda item both departmentally and at Trust level saw improved project success.
Regular meetings of the Initiative group are important to keep momentum going and check on progress.
Staff could still participate in the Initiative despite the limited time available.
The initiative saves money and carbon emissions.
The initiative has reduced single-use plastic waste.
Showing strong environmental leadership by having sustainability specific roles leads to quicker change both in the ED and wider hospital and can even change hospital culture.
ED staff already have concerns about our impact on the environment; listening to these concerns helps inform sustainability action and increases engagement.
Introducing new waste streams and rearranging bin placement were needed for departments to improve their waste segregation.
Small-scale changes can empower staff and lead to positivity within the workforce.
Changing firmly held ideas and behaviors about sustainability can be difficult.
Initiative calculators help to quantify carbon and cost savings.
Going through the GreenED process has spurred improvements in the sustainability of the built environment. Teams have identified systemic barriers to progress in a variety of actions.
The initiative aligns with Trust sustainability plans and acts as a trigger for innovative NHS wide sustainability changes.
Further work needs to be done to determine patient perspectives on sustainability.
Remote working is well embedded in EDs and reduces the carbon footprint of travel to the hospital.
Listening to staff feedback on sustainability increases engagement.
Reductions in unnecessary cannulation saves time and improves patient experience.
Quality improvement methodology was used to implement changes. There are a variety of sustainability resources and initiatives in the wider NHS that can be used to support work on GreenED.
In total, 28 themes were identified in the thematic analysis from the reports generated by the five sites who submitted for accreditation in 2024.
ED, emergency department; NHS, National Health Service.
DISCUSSION
Leadership, in the case of sustainable healthcare, is making change accessible, thus enabling individuals, groups and networks to become leaders in their own right. This produces collective leadership which has the capacity to activate socioeconomic tipping points and build alignment and commitment into organizations.3, 16 Analysis of the 15 sites achieving accreditation revealed that the RCEM GreenED initiative helped to facilitate staff action by providing structured guidance, resulting in coordination and continued effort in sustainable healthcare actions. The most successful sites had teams consisting of multidisciplinary members, and their improvements led to changes in the wider hospital, not just in their department. Through the site submissions, we have been able to identify systemic barriers, and this evidence has allowed us to advocate for change at national and
international levels.
Though an underestimate due to limitations of data collection, between 2024–2025 the 15 sites saved a total of £351,366 and 157.72 tonnes of CO2e per year, demonstrating that environmentally sustainable healthcare is beneficial for patients, staff, finances, and the planet. This is an underestimate, as some data were excluded due to insufficient evidence from sites due to participant capacity constraints, difficulties sourcing data due to limitations of the systems that we operate in or, in one case, because the savings made were felt to be attributable to a hospital-wide scheme of mobility aid reuse, as opposed to the ED spurring this itself. However, whilst a modest reduction in both pounds sterling and CO2e, it is the first quantified reduction using a tailored sustainability initiative in an ED setting that we know of. Participants were able to achieve this with no protected or paid time to carry out
these initiatives, and whilst prioritizing emergency care in the context of departments which are facing record levels of ambulance waits and crowding leading to patient harm, moral injury, and staff turnover.17,18,19 As some of the first to carry out this work, we also wish to highlight that some systems and items have not had life cycle analyses carried out, which further complicates the ability to calculate carbon and financial savings. With participants feedback, data collection for CO2e and finances is developing rapidly and improving for Framework 3.0 (Figure 1), which was recently published on our website.14
Through the thematic analysis, we discovered that GreenED enables staff to adopt leadership roles within their circles of influence and can result in collective leadership at an organisational level. Sites reported the positive deconstruction of professional silos, a key factor in effecting behavioral change and scaling sustainable healthcare.20
LIMITATIONS
There were several limitations to our evaluation. The first limitation is that participation in GreenED is voluntary, thus making the study vulnerable to self-selection bias. Sites that have chosen to participate are likely to have a higher level of environmental awareness and motivation than nonparticipating sites. Consequently, findings may overestimate the ease with which findings could be replicated more broadly. Similarly, the joining fee will limit some sites from being able to participate in the scheme. Whilst most individuals overseeing the management of GreenED are voluntary, resources are required for the RCEM to run the portal and website and cover RCEM quality team time. To improve this, we have approached some governments to ask if they would consider funding the joining fee for sites in a particular country (e.g., Wales) to remove that barrier.
The second is the size of the evaluation; 15 sites took part in the accreditation scheme between 2024-2025 from England and Wales, which is relatively small. However, these are sites of different sizes with different demographics, and each site was able to follow the GreenED framework and execute the actions to a satisfactory level for accreditation. We have 49 sites that have signed up for Framework 3.0 in 2026 which will allow us to analyse a far greater collection of data and a more accurate estimation of CO2e and financial savings.
Lastly, data collection methods could have been improved. Patient safety and departmental requirements will always come first, and that can make consistent data collection difficult during a busy ED shift; our financial and CO2 predicted savings are all underestimates because of this. Improved data collection systems are being developed for Framework 3.0.
CONCLUSION
A systematic and supported approach to environmentally
sustainable emergency medicine can elicit rapid decarbonisation and lead to substantial annual financial savings. Applying the guiding principle of ‘Think big, start small, scale quickly’, GreenED has rapidly expanded to provide leadership at an international level. An Australian pilot (13 sites) is in its final stages, and the 2025/26 programme has expanded to Ireland (4 sites), with 32 sites from England and Wales taking part and interest being expressed from EDs in mainland Europe. We are also investigating the feasibility of a modular approach to the frameworks, allowing sites to substitute actions from one level into another to give greater flexibility.
We are currently developing GreenED International which we envision being used as an internationally recognised benchmark for environmentally sustainable emergency care in high resource settings. Rapid decarbonisation of healthcare requires that best practices are shared, and we hope that other countries and specialties can use the initiative as a blueprint to adapt and grow environmentally sustainable and resilient healthcare beyond the ED.
Address for Correspondence: Jennifer L. Wood, MBChB, BSc, Victoria Hospital Emergency Department, Hayfield Road, Kirkcaldy, United Kingdom, KY2 5AH. Email: jennifer.wood@ doctors.org.uk.
Conflicts of Interest: By the WestJEM article submission agreement, all authors are required to disclose all affiliations, funding sources and financial or management relationships that could be perceived as potential sources of bias. JW, AR, TS, FB and ZS all hold voluntary positions in the RCEM Environmental Specialist Interest Group; JW, AR, TS, FB and ZS have all been reimbursed by RCEM for attending emergency medicine conferences to promote GreenED; ZS is paid by RCEM as a project coordinator for GreenED. There are no sources of funding to declare.
1. Watts N, Adger WN, Agnolucci P, et al. Health and climate change: policy responses to protect public health. Lancet. 2015;386:1861-1914.
2. Howard C, MacNeill AJ, Hughes F, et al. Learning to treat the climate emergency together: social tipping interventions by the health community. Lancet Planet Health. 2023;7:e251-264.
3. Salas RN. The climate crisis and clinical practice. N Engl J Med. 2020;382:589-591.
4. NHS England Greener NHS. Delivering a net zero National Health Service. 2020. Available at: https://www.england.nhs.uk/greenernhs/ wp-content/uploads/sites/51/2020/10/delivering-a-net-zero-national-
Cultivating Environmentally Sustainable EDs with GreenED Wood et al. health-service.pdf. Accessed March 11, 2026.
5. Health Care Without Harm. Healthcare climate footprint report. 2019. Available at: https://noharm-global.org/documents/health-careclimate-footprint-report. Accessed December 5, 2025.
6. Pichler P, Jaccard I, Weisz U, et al. International comparison of health care carbon footprints. Environ Res Lett. 2019;14(6):064004.
7. Worrall JC, Hendin A, Kanji S. Just say no to metered dose inhalers. CJEM. 2025;27:317-318.
8. Azlan NR, Massey D, Andrew L, et al. Time to hang up the gloves: a scoping review of evidence on non-sterile glove use during intravenous antimicrobial preparation and administration. J Adv Nurs. 2025;0:1-17.
9. Socha K, Couffinhal A, Forde I, et al. Tackling wasteful spending on health. 2017. Available at: https://www.oecd.org/content/dam/oecd/ en/publications/reports/2017/01/tackling-wasteful-spending-onhealth_g1g72f29/9789264266414-en.pdf. Accessed March 11, 2026.
10. Kjelle ER, Andersen AM, Krokeide LJJ, et al. Characterizing and quantifying low-value diagnostic imaging internationally: a scoping review. BMC Med Imaging. 2022;22(1).
11. Kotcher J, Maibach E, Miller J, et al. Views of health professionals on climate change and health: a multinational survey study. Lancet Planet Health. 2021;5:e316-323.
12. Hunter DJ. At breaking point or already broken? The National Health Service in the United Kingdom. N Engl J Med. 2023;389:100-103.
13. Kemple T, Smith JN, Sowman G, et al. Primary care and the climate
and ecological emergency. Br J Gen Pract. 2021;71:439.
14. Royal College of Emergency Medicine. GreenED: environmentally sustainable emergency medicine. Available at: https://greened.rcem. ac.uk. Accessed December 5, 2025.
15. University College London. Laboratory efficiency assessment framework. Available at: https://www.ucl.ac.uk/sustainable/takeaction/staff-action/leaf-laboratory-efficiency-assessment-framework. Accessed December 6, 2025.
16. Kjellström S, Stålne K, Törnblom O. Six ways of understanding leadership development: an exploration of increasing complexity. Leadership. 2020;16(4):434-460.
17. British Medical Association. NHS hospital beds data analysis. 2025. Available at: https://www.bma.org.uk/advice-and-support/nhsdelivery-and-workforce/pressures/nhs-hospital-beds-data-analysis. Accessed March 11, 2026.
18. Jones S, Moulton C, Swift S, et al. Association between delays to patient admission from the emergency department and all-cause 30-day mortality. Emerg Med J. 2022;39:168-173.
19. Royal College of Emergency Medicine. Emergency medicine clinical leads snap survey. 2026. Available at: https://rcem.ac.uk/wp-content/ uploads/2026/03/Snap-Survey-Final-Results-March-2026.pdf. Accessed March 11, 2026.
20. Holmes S. We can progress sustainable healthcare by breaking silos and changing behaviours. BMJ. 2024;385:q813.
Regarding Racial Disparities in Door-to-Clinician Time for Cardiac Chest Pain in the Emergency Department
Christian Angelo I. Ventura, MSPH*
Ava D. Cabanilla, BA*
Edward E. Denton, MD, MPH†
Section Editor: Mark I. Langdorf, MD, MHPE
Kansas Health Science University, Kansas College of Osteopathic Medicine, Wichita, Kansas
University of Arkansas for Medical Science, College of Medicine, Little Rock, Arkansas
Submission history: Submitted March 14, 2026; Revision received March 15, 2026; Accepted March 16, 2026
Electronically published June 28, 2026
Full text available through open access at http://escholarship.org/uc/uciem_westjem DOI 10.5811/westjem.63931
[West J Emerg Med. 2026;27(4)1113–1114.]
To the Editor:
Awad and colleagues are to be commended for a methodologically careful examination of racial and ethnic disparities in emergency department door-to-clinician time among a clinically homogeneous cohort of patients with confirmed acute cardiac chest pain.1 Their finding that Hispanic/Latino patients experienced a statistically significant 22% increase in door-to-clinician time compared with White patients (18.2 vs 14.9 minutes; adjusted rate ratio 1.22; 95% CI, 1.09-1.36) after adjustment for triage acuity, age, sex, clinician type, and initial vital signs represents a meaningful contribution to the disparities literature. We highlight several considerations that may sharpen the interpretation and translational impact of these results.
First, the authors appropriately acknowledge that their adjusted model did not capture language preference, insurance status, or mode of arrival. We would argue that language discordance between patient and triage clinician may represent an important mechanistic pathway through which the observed disparity operates. Patients with limited English proficiency may require interpreter services at triage, introducing delays that are structurally imposed rather than purely reflective of individual clinician bias.2-4 Disentangling these mechanisms is not a trivial distinction. If interpreter access is a proximate driver, then one efficient intervention would be universal language screening linked to immediate professional interpreter deployment, rather than implicit bias training alone. The authors’ proposed interventions are reasonable, but future studies should capture language preference and interpreter use directly.
Second, the triage acuity finding deserves closer scrutiny as a potential mediator rather than a covariate. The authors note that Asian patients had the highest proportion of Emergency Severity Index (ESI) level 3 triage (72.9%) and Hispanic/Latino patients were also disproportionately triaged at level 3 (64.0%) relative to White patients (59.3%), a difference that reached statistical significance. If clinician-assigned ESI level is itself
shaped by racial or ethnic factors, then adjustment for ESI may partially attenuate a true disparity rather than isolate an independent racial effect.5-7 A formal mediation analysis partitioning the total effect of race and ethnicity into direct and indirect components through ESI assignment would strengthen causal interpretation and more precisely identify intervention targets within the triage workflow.
Third, the null finding for Black patients warrants careful contextualization. The study enrolled 213 Black patients (5.4% of the cohort) at an institution where non-White patients constitute approximately one quarter of emergency department volume. This sample size affords limited power to detect modest but clinically meaningful differences. The observed adjusted mean of 16.5 minutes for Black patients represents a 1.6-minute excess over White patients, and the confidence interval for the rate ratio (0.94-1.30) remains compatible with disparities of potentially meaningful magnitude. Absence of statistical significance in a small, racially homogeneous sample at a single institution should, therefore, not be taken as definitive evidence of equitable care for Black patients with cardiac chest pain.
Finally, the study period spans 2019 through 2025, encompassing the COVID-19 pandemic and associated disruptions to emergency department workflow, staffing, and patient acuity mix. Without temporal stratification or sensitivity analyses restricted to distinct operational periods, it is difficult to determine whether the observed disparities were stable across this heterogeneous interval or were amplified during periods of greater system strain.
These observations do not diminish the significance of this work. Awad et al provide rigorous single-center evidence that disparities in time-sensitive cardiac evaluation persist despite standardized triage protocols, using a generalized linear model with gamma distribution and log link appropriate for a heavily skewed outcome. Their identification of Hispanic/Latino patients as a particularly vulnerable group in
Racial Disparities in Door-to-Clinician Time for Cardiac Chest Pain in the ED
a western U.S. setting that is underrepresented in the disparities literature is an important contribution. We encourage the authors to pursue the multisite replication they advocate, with prospective collection of language preference, interpreter utilization, and operational variables, and to apply mediation frameworks that can move the field from description toward actionable mechanistic understanding.
Address for Correspondence: Christian Angelo I. Ventura, MSPH, Kansas Health Science University, Kansas College of Osteopathic Medicine, 217 E Douglas Ave, Wichita, KS 67202. Email: cventura@mail.kansashsc.org
Conflicts of Interest: By the WestJEM article submission agreement, all authors are required to disclose all affiliations, funding sources and financial or management relationships that could be perceived as potential sources of bias. No author has professional or financial relationships with any companies that are relevant to this study. There are no conflicts of interest or sources of funding to declare.
1. Awad E, Raju S, Alsayyed H, et al. Racial disparities in door-toclinician time for cardiac chest pain in the emergency department. West J Emerg Med. 2026;27(1):18-24.
2. Karliner LS, Jacobs EA, Chen AH, et al. Do professional interpreters improve clinical care for patients with limited English proficiency? A systematic review of the literature. Health Serv Res. 2007;42(2):727-754.
3. Ngai KM, Grudzen CR, Lee R, et al. The association between limited English proficiency and unplanned emergency department revisit within 72 hours. Ann Emerg Med. 2016;68(2):213-221.
4. Schulson L, Novack V, Smulowitz PB, et al. Emergency department care for patients with limited English proficiency: a retrospective cohort study. J Gen Intern Med. 2018;33(12):2113-2119.
5. Joseph JW, Kennedy M, Landry AM, et al. Race and ethnicity and primary language in emergency department triage. JAMA Netw Open. 2023;6(10):e2337557.
6. Schrader CD, Lewis LM. Racial disparity in emergency department triage. J Emerg Med. 2013;44(2):511-518.
7. Peitzman C, Carreras Tartak JA, Samuels-Kalow M, et al. Racial differences in triage for emergency department patients with subjective chief complaints. West J Emerg Med. 2023;24(5):888-893.
Reply: Regarding Racial Disparities in Door-to Clinician Time for Cardiac Chest Pain
Emad Awad, PhD
Section Editor: Mark I. Langdorf, MD, MHPE
University of Utah Spencer Fox Eccles School of Medicine, Department of Emergency Medicine, Salt Lake City, Utah
Submission history: Submitted March 18, 2026; Accepted March 18, 2026
Electronically published July 16, 2026
Full text available through open access at http://escholarship.org/uc/uciem_westjem DOI 10.5811/westjem.63979
[West J Emerg Med. 2026;27(4)1115.]
To the Editor:
We thank the letter writers for their thoughtful engagement with our study.1 Their comments are well taken, align with several limitations we acknowledged, and highlight important directions for future research.
We agree that language discordance may contribute to delays in care through mechanisms such as interpreter access, which are distinct from individual clinician bias. Our model did not capture language variables, and we support prospective collection of preferred language and interpreter use in future studies. We also agree that Emergency Severity Index (ESI) assignment may function not only as a confounder, but also as a potential mediator if triage decisions are themselves influenced by race or ethnicity. In our analysis, we adjusted for triage acuity to estimate associations independent of ESI level. However, mediation analysis in larger cohorts may better clarify these pathways.
As noted in our article, the relatively small sample of Black patients (n = 213) limits the precision of subgroup estimates. The confidence interval (0.94–1.30) remains compatible with clinically meaningful disparities, and the absence of statistical significance should not be interpreted as evidence of equity.
The letter writers also appropriately note that our 2019–2025 study period spanned the COVID-19 pandemic, during which emergency department operations changed substantially. As with most observational studies, however, complete temporal control is difficult without compromising model stability, particularly in smaller subgroups. Stratifying by period or introducing multiple interaction terms would have reduced effective sample size and increased the risk of unstable estimates. As George Box observed, “All models are wrong, but some are useful.”² Our aim was to provide a useful real-world estimate of disparities in door-to-clinician time,
while recognizing that unmeasured temporal factors may remain. Larger multisite studies will be better positioned to evaluate whether disparities vary across operational periods.
Several of the issues raised by the letter writers, including language discordance and sample size limitations, were acknowledged in our discussion. We appreciate their further elaboration on these points and their emphasis on future work.
We value this dialogue and join the letter writers in calling for larger, multisite studies with richer clinical, language, and operational variables to advance equitable emergency cardiac care.
Address for Correspondence: Emad Awad, PhD, University of Utah Spencer Fox Eccles School of Medicine, Department of Emergency Medicine, Salt Lake City, UT 84112. Email: emad.awad@utah.edu.
Conflicts of Interest: By the WestJEM article submission agreement, all authors are required to disclose all affiliations, funding sources and financial or management relationships that could be perceived as potential sources of bias. No author has professional or financial relationships with any companies that are relevant to this study. There are no conflicts of interest or sources of funding to declare.
1. Awad E, Raju S, Alsayyed H, et al. Racial disparities in door-toclinician time for cardiac chest pain in the emergency department. West J Emerg Med. 2026;27(1):18-24.
2. Box GEP, Draper NR. Empirical Model-Building and Response Surfaces. New York, NY: John Wiley & Sons; 1987:424.
JET
Journal of Education & Teaching in Emergency Medicine
™ A publicati of CORD
Focus Educati & Sch ship
At JETem, we believe that all learners should benefit from active learning and that educators should have the opportunity to publish and distribute outstanding, scholarly academic work so that it may be widely distributed, thereby increasing the significance of their results.
JETem is published by the UC Irvine Health School of Medicine and Department of Emergency Medicine in conjunction with the Council of Emergency Medicine Residency Directors (CORD).
We are an online, open access, peer-reviewed, PMC-indexed journal-repository for EM educators in all major topic areas. JETem is published quarterly. We publish team-based learning, small group learning, simulation, podcasts, lectures, innovations, certifying exam cases, curricula and image-based case reports (VisualEMs).