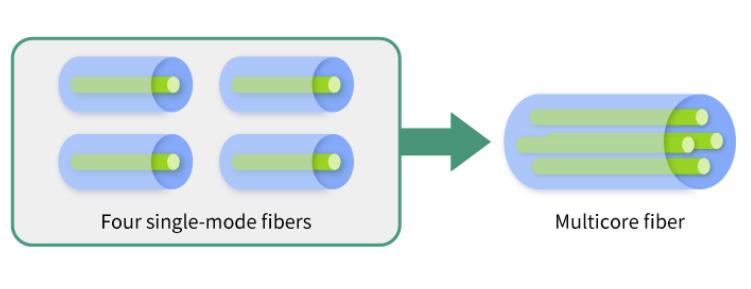
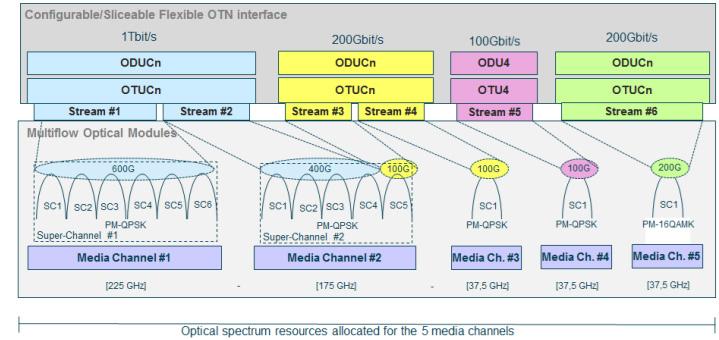
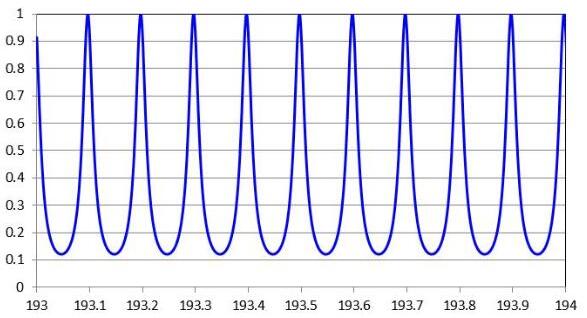
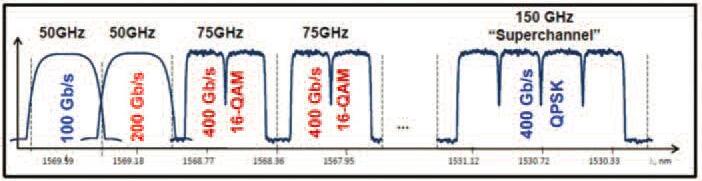
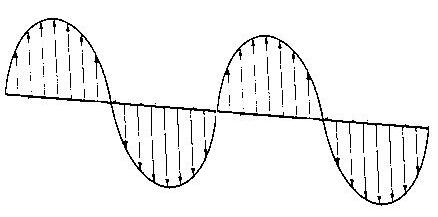
SPATIAL DIVISION MULTIPLEXING IN POWER-CONSTRAINED SUBSEA CABLES
Explaining SDM for power-constrained submarine cables.
by Jose Chesnoy, Jean-Christophe Antona
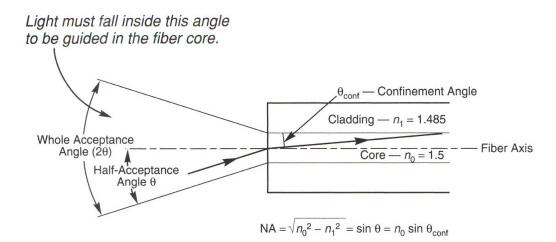
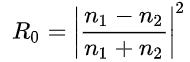
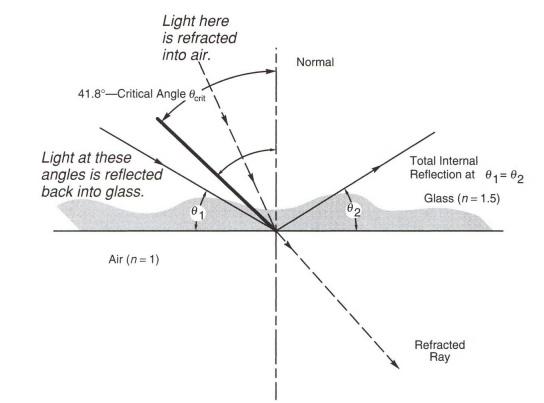
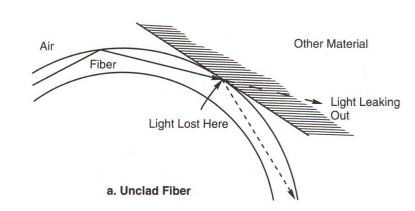
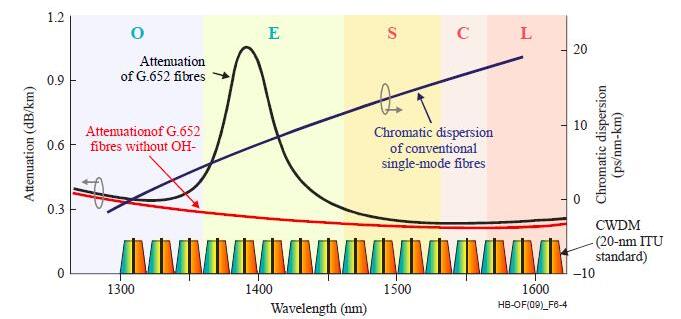
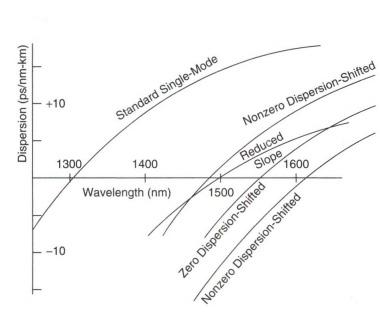
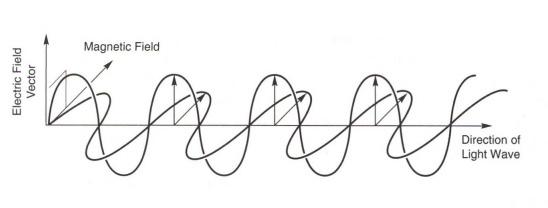
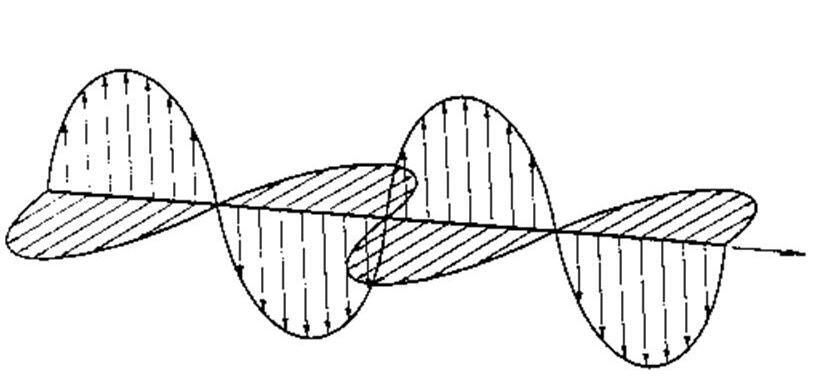
88 FROM MAXWELL’S EQUATIONS TO SUBSEA FIBRE OPTICS (PART 2)
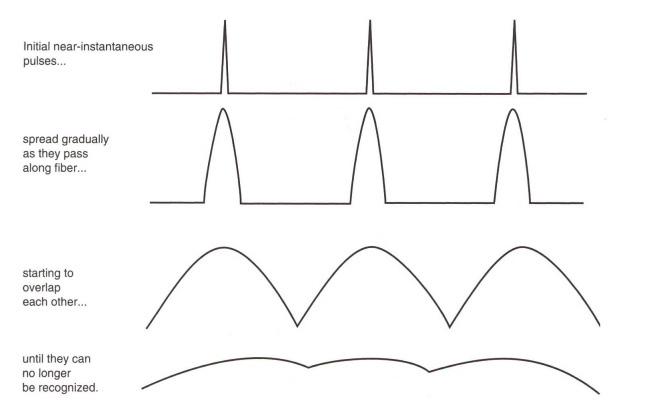
Explaining optical waveguides through fiber physics.
by Anna Bridget Sheehan, Derek Cassidy
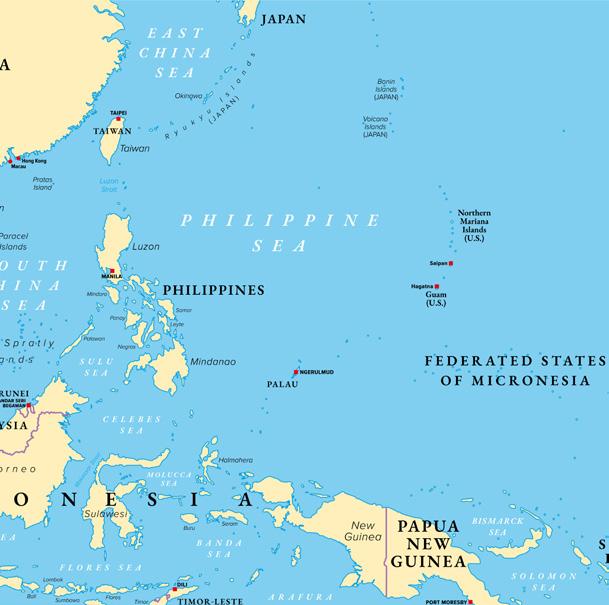
THE SOUTH CHINA SEA ROUTING TAX
Investigating geopolitical costs reshaping Indo-Pacific cable routing. by Billy Buddell
NIS2’S EXTENDED SCOPE TAKES A DEEP DIVE
Unpacking NIS2 expansion into submarine infrastructure.
by Mike Conradi, Nicholas De Lacy-Brown, Christian Keogh, Henry Kilding, Lola Stirling
CONFERENCE PREVIEW
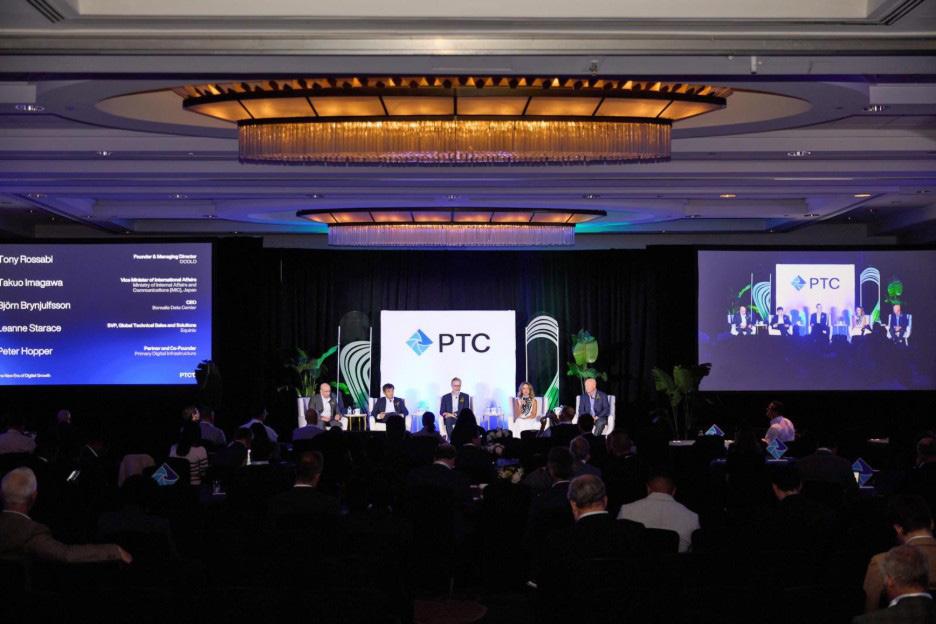
6 QUESTIONS WITH BRIAN MOON AND TONY ROSSABI
Talking Submarine Cable Industry with PTC’s CEO and Chairman/President 46 WHY ATTEND?
Bringing infrastructure, policy, and investment leaders together.
INSIDE SUBTEL FORUM:
25 Years of Submarine Cable Intelligence
In 2026, SubTel Forum marks 25 years as the leading independent intelligence platform serving the global submarine cable industry. Over a quarter century, SubTel Forum has evolved from a specialist publication into the industry’s most trusted source for data, analysis, mapping, and editorial insight. SubTelForum.com now stands as the central reference point for operators, suppliers, investors, governments, and advisors shaping global connectivity.
What follows is a guide to SubTel Forum’s most important products and resources for 2026.
IN DEPTH INDUSTRY PUBLICATIONS
At the core of SubTel Forum are its flagship publications, which define how the industry understands itself.
Submarine Telecoms Industry Report (Annual)
The industry’s benchmark analytical report. Each edition delivers rigorous assessment of market
structure, ownership trends, capacity growth, investment drivers, and forward outlooks. It remains essential reading for executives and policymakers navigating an increasingly strategic infrastructure sector.
Submarine Cable Almanac (Biannual)
A data driven reference providing detailed system level coverage of global submarine cable networks. Each biannual edition includes maps and structured data on routes, capacity, ownership, status, and technical attributes. It is one of the most frequently cited resources in the industry.
Cableship Codex (Biannual, Launching 2026)
New in 2026, Cableship Codex is a biannual intelligence product focused exclusively on the global cable ship fleet. It delivers authoritative coverage of vessels, ownership, technical capability, utilization trends, and market dynamics. For the first time, the industry gains a structured, recurring reference
dedicated to the assets that build and maintain global subsea infrastructure.
CABLE MAPS AND VISUALIZATION TOOLS
Online SubTel Cable Map
An interactive digital platform mapping more than 600 submarine cable systems worldwide. It supports research, planning, and analysis through an intuitive interface designed for professionals.
Printed Submarine Cable Map
The definitive physical reference of global submarine fiber infrastructure. Updated and reprinted multiple times each year for distribution at key industry conferences, it reflects the latest system developments and is widely displayed in offices, boardrooms, and event venues across the global subsea sector.
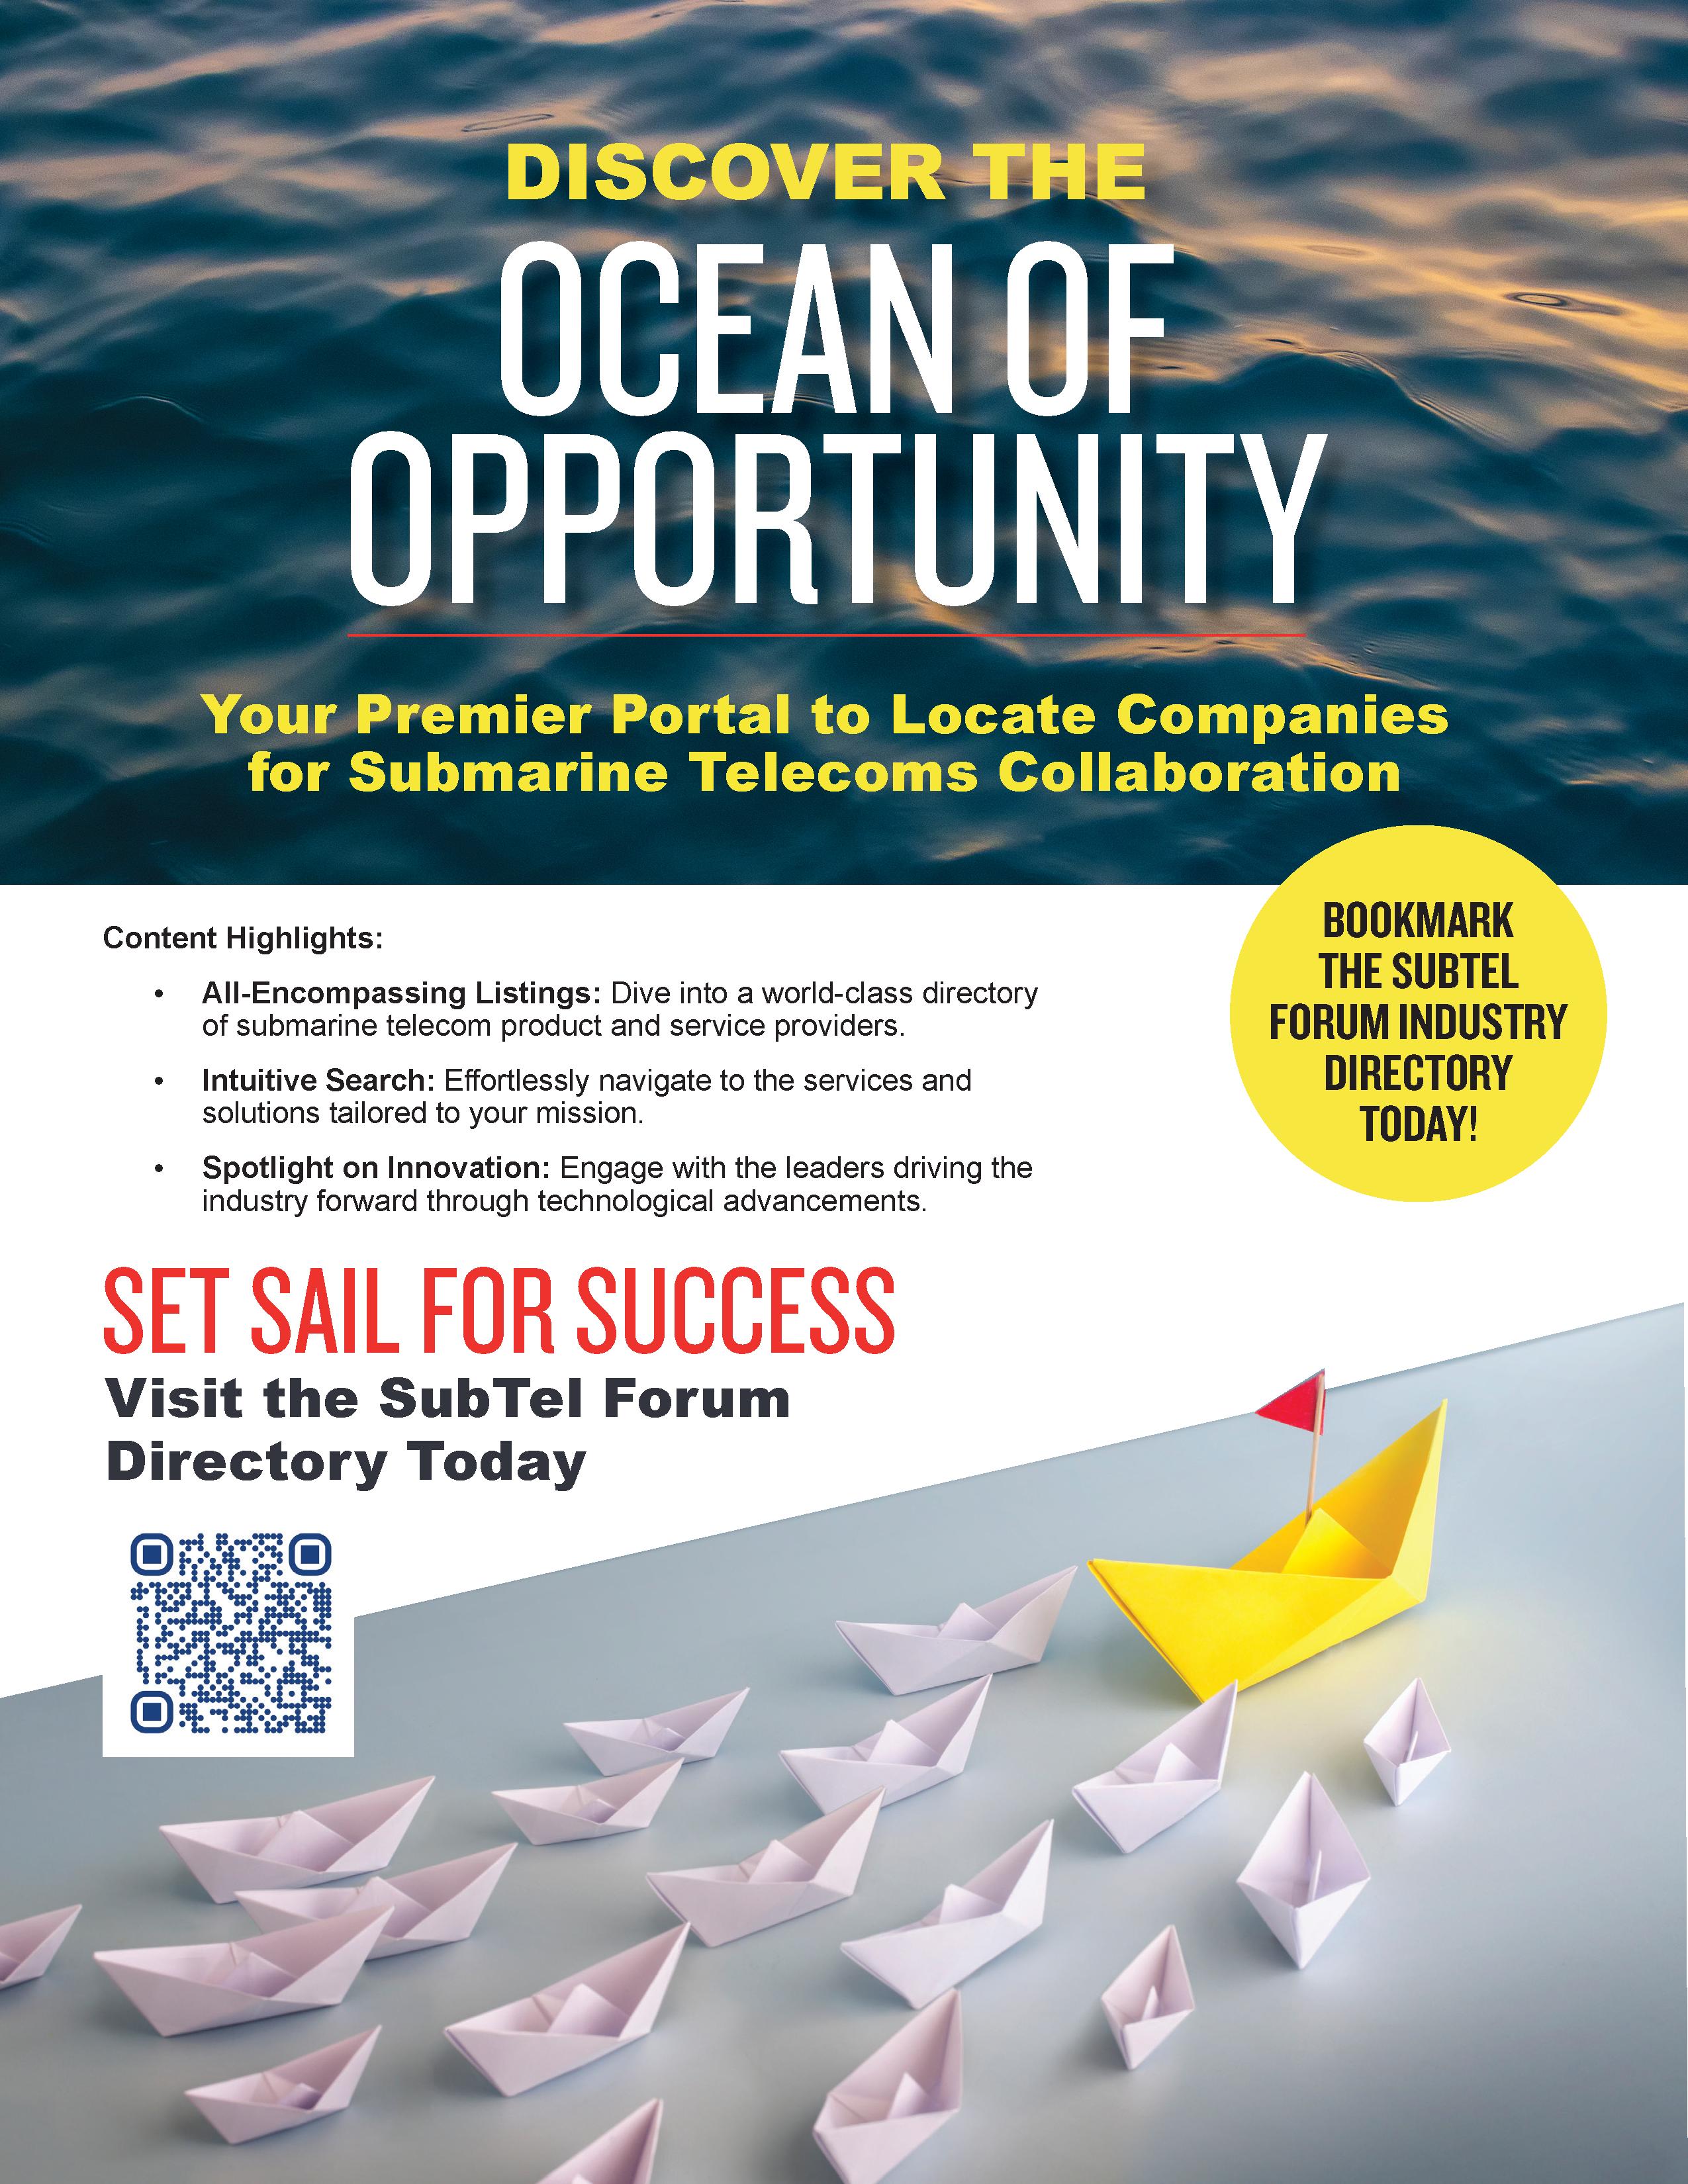
SubTelForum.com Directory
The SubTel Forum Directory is the industry’s most comprehensive free listing of vetted submarine cable companies, service providers, and specialists. Designed for speed and clarity, it enables practical commercial discovery and strengthens community connectivity across the ecosystem.
NEWS AND DAILY INTELLIGENCE
News Now RSS Feed
The daily pulse of the submarine cable industry. News Now curates global coverage spanning projects, outages, regulation, technology, and geopolitics. It is a core tool for staying informed in a fast moving sector.
SubTel Forum App
The SubTel Forum App continues to mature in 2026 as a primary mobile access point. It integrates news, editorial content, data driven insights, and alerts into a streamlined experience built for real time awareness and professional use.
EDITORIAL KNOWLEDGE HUB
Must Reads and Q&As
A curated collection of long form articles, interviews, and expert discussions exploring the technical, commercial, historical, and strategic dimensions
of submarine communications.
Magazine Archive
Spanning more than 25 years, the Submarine Telecoms Forum Magazine Archive offers an unmatched historical record of the industry’s evolution. It serves as a living institutional memory for researchers, analysts, and practitioners.
Authors Index
The Authors Index enables readers to locate articles by contributor and follow the work of leading industry voices, reinforcing SubTel Forum’s role as the platform of record for submarine cable thought leadership.
Bespoke and Special Reports
SubTel Forum produces tailored reports addressing specific market needs, including Global Outlook analyses, data center and OTT studies, offshore energy connectivity, regional systems assessments, unrepeatered systems reviews, and comprehensive cable datasets covering more than 550 systems.
After 25 years, SubTelForum.com remains the industry’s most complete and trusted intelligence platform. Built on continuity, independence, and execution discipline, it continues to support those designing, financing, building, and operating the infrastructure that connects the world.
EXORDIUM
Welcome to Issue 148 of SubTel Forum, our Global Capacity edition, featuring a preview of PTC‘DC 26.
The first time I visited Iceland was in 1991 when Dick Borwick and I traveled to explain all things submarine cables to the Icelandic PTT.
At the time Ísland was considering the feasibility of building a festoon that would ring the country and bring its first fiber, and as a result of our efforts, BTM would later be awarded the first-ever system as a subcontractor to STC. Thirty-five years later this month I returned with Peg to Reykjavik and environs, and experienced the remarkable connectivity of a country once considered remote at the edge of practical telecoms infrastructure – and it still works!
That transformation provides a fitting transition into Issue 148 of SubTel Forum.
As submarine networks become increasingly critical to cloud, AI, national security, and global commerce, this issue examines the evolving challenges surrounding resilience, ownership, operational risk, and the future direction of the subsea industry.
INSIDE ISSUE 148: TECHNOLOGY, GEOPOLITICS, AND THE EVOLUTION OF GLOBAL CONNECTIVITY
Inside Issue 148, contributors explore the technologies, infrastructure strategies, and geopolitical pressures reshaping global connectivity, including PTC’DC 26, coherent pluggable transponders, SDM architectures, next generation optical network testing, Pacific regional connectivity, shifting global traffic patterns, diesel electric cable recovery vessels, the South China Sea routing tax, Europe’s expand-
ing NIS2 framework, and the continuing evolution of optical waveguide physics.
CABLE MAP – SUBMARINE NETWORKS EMEA 2026
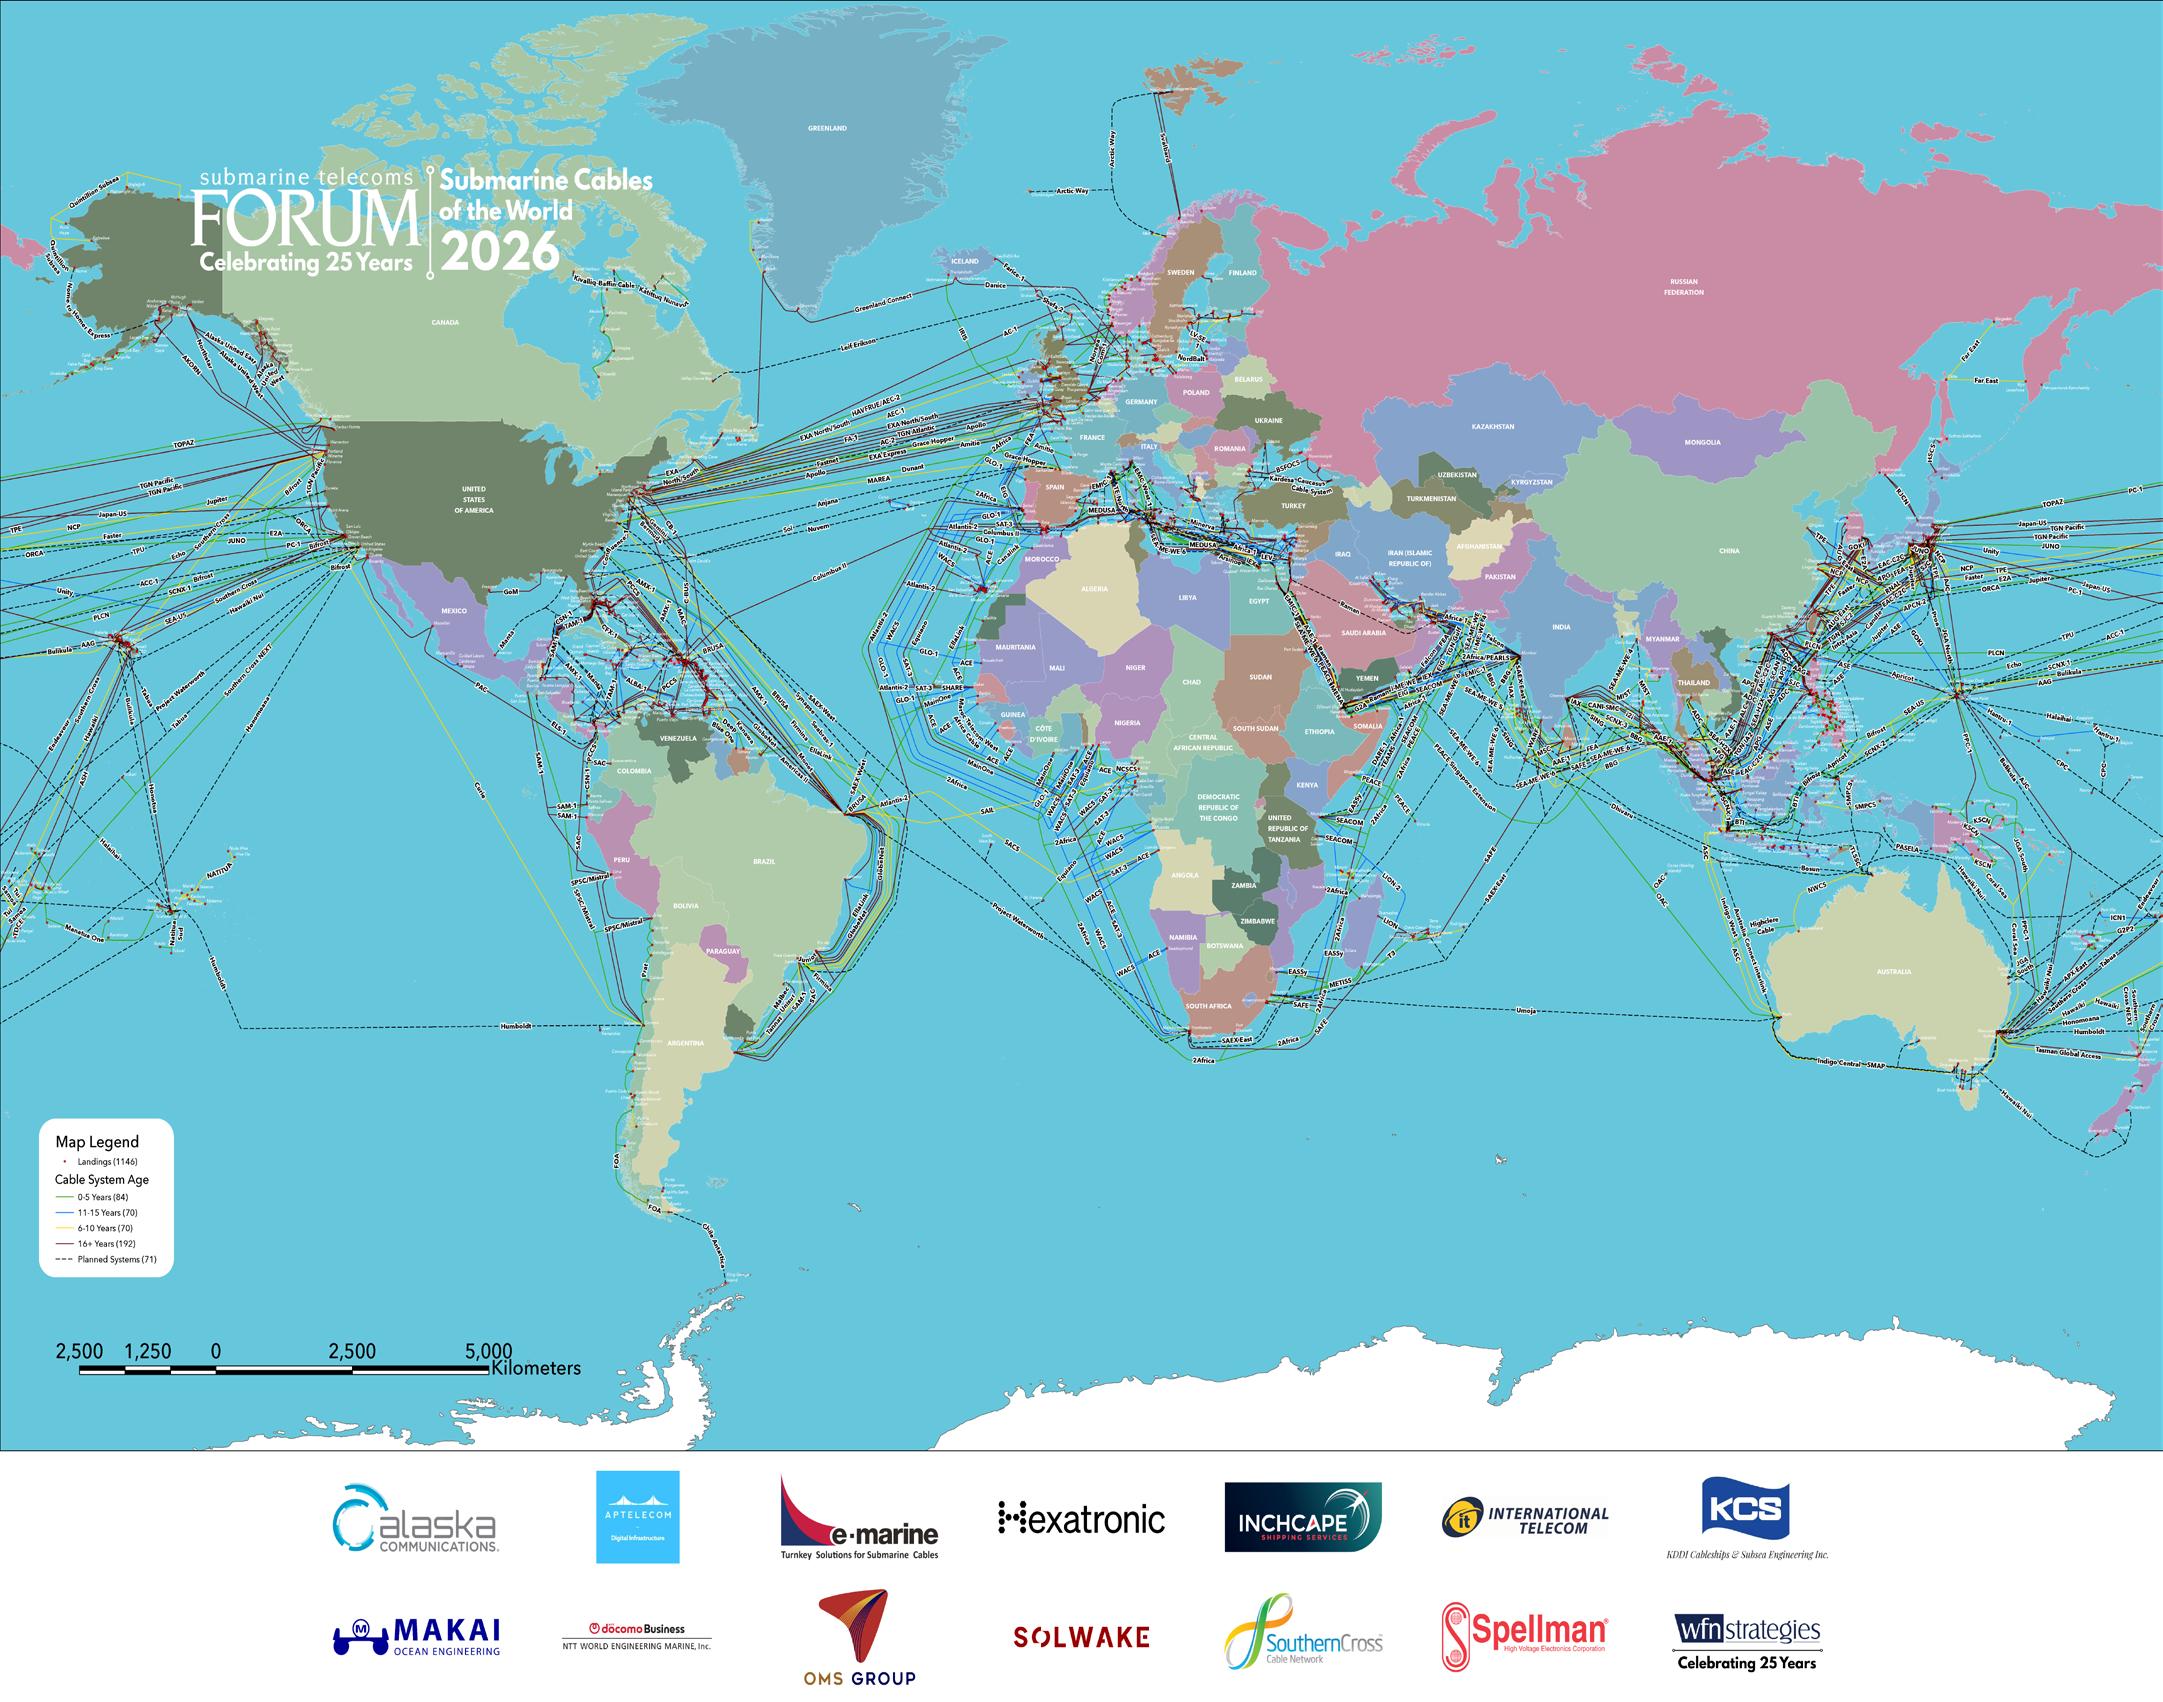
As the industry gathers in London for Submarine Networks EMEA 2026, SubTel Forum will once again publish the latest edition of the global Submarine Cable Map, one of the most widely used visual references in the subsea community. Distributed to attendees and decision makers across the event, the map places your brand directly in the hands of operators, suppliers, investors, and policymakers who rely on it throughout the year.
CABLESHIP CODEX – ISSUE 1, MAY 2026
This May, SubTel Forum launches Issue 1 of the Cableship Codex, a new reference publication dedicated to the global fleet that builds, installs, and maintains the world’s submarine cable infrastructure. The Codex will provide detailed insights into vessels, capabilities, and operational trends supporting the subsea industry. As the inaugural edition, it offers a unique opportunity for companies to position their brand alongside this important new industry resource.
Advertising space is now available for the May release. To reserve space, contact Nicola Tate
CABLE MAP – SUBMARINE NETWORKS WORLD 2026
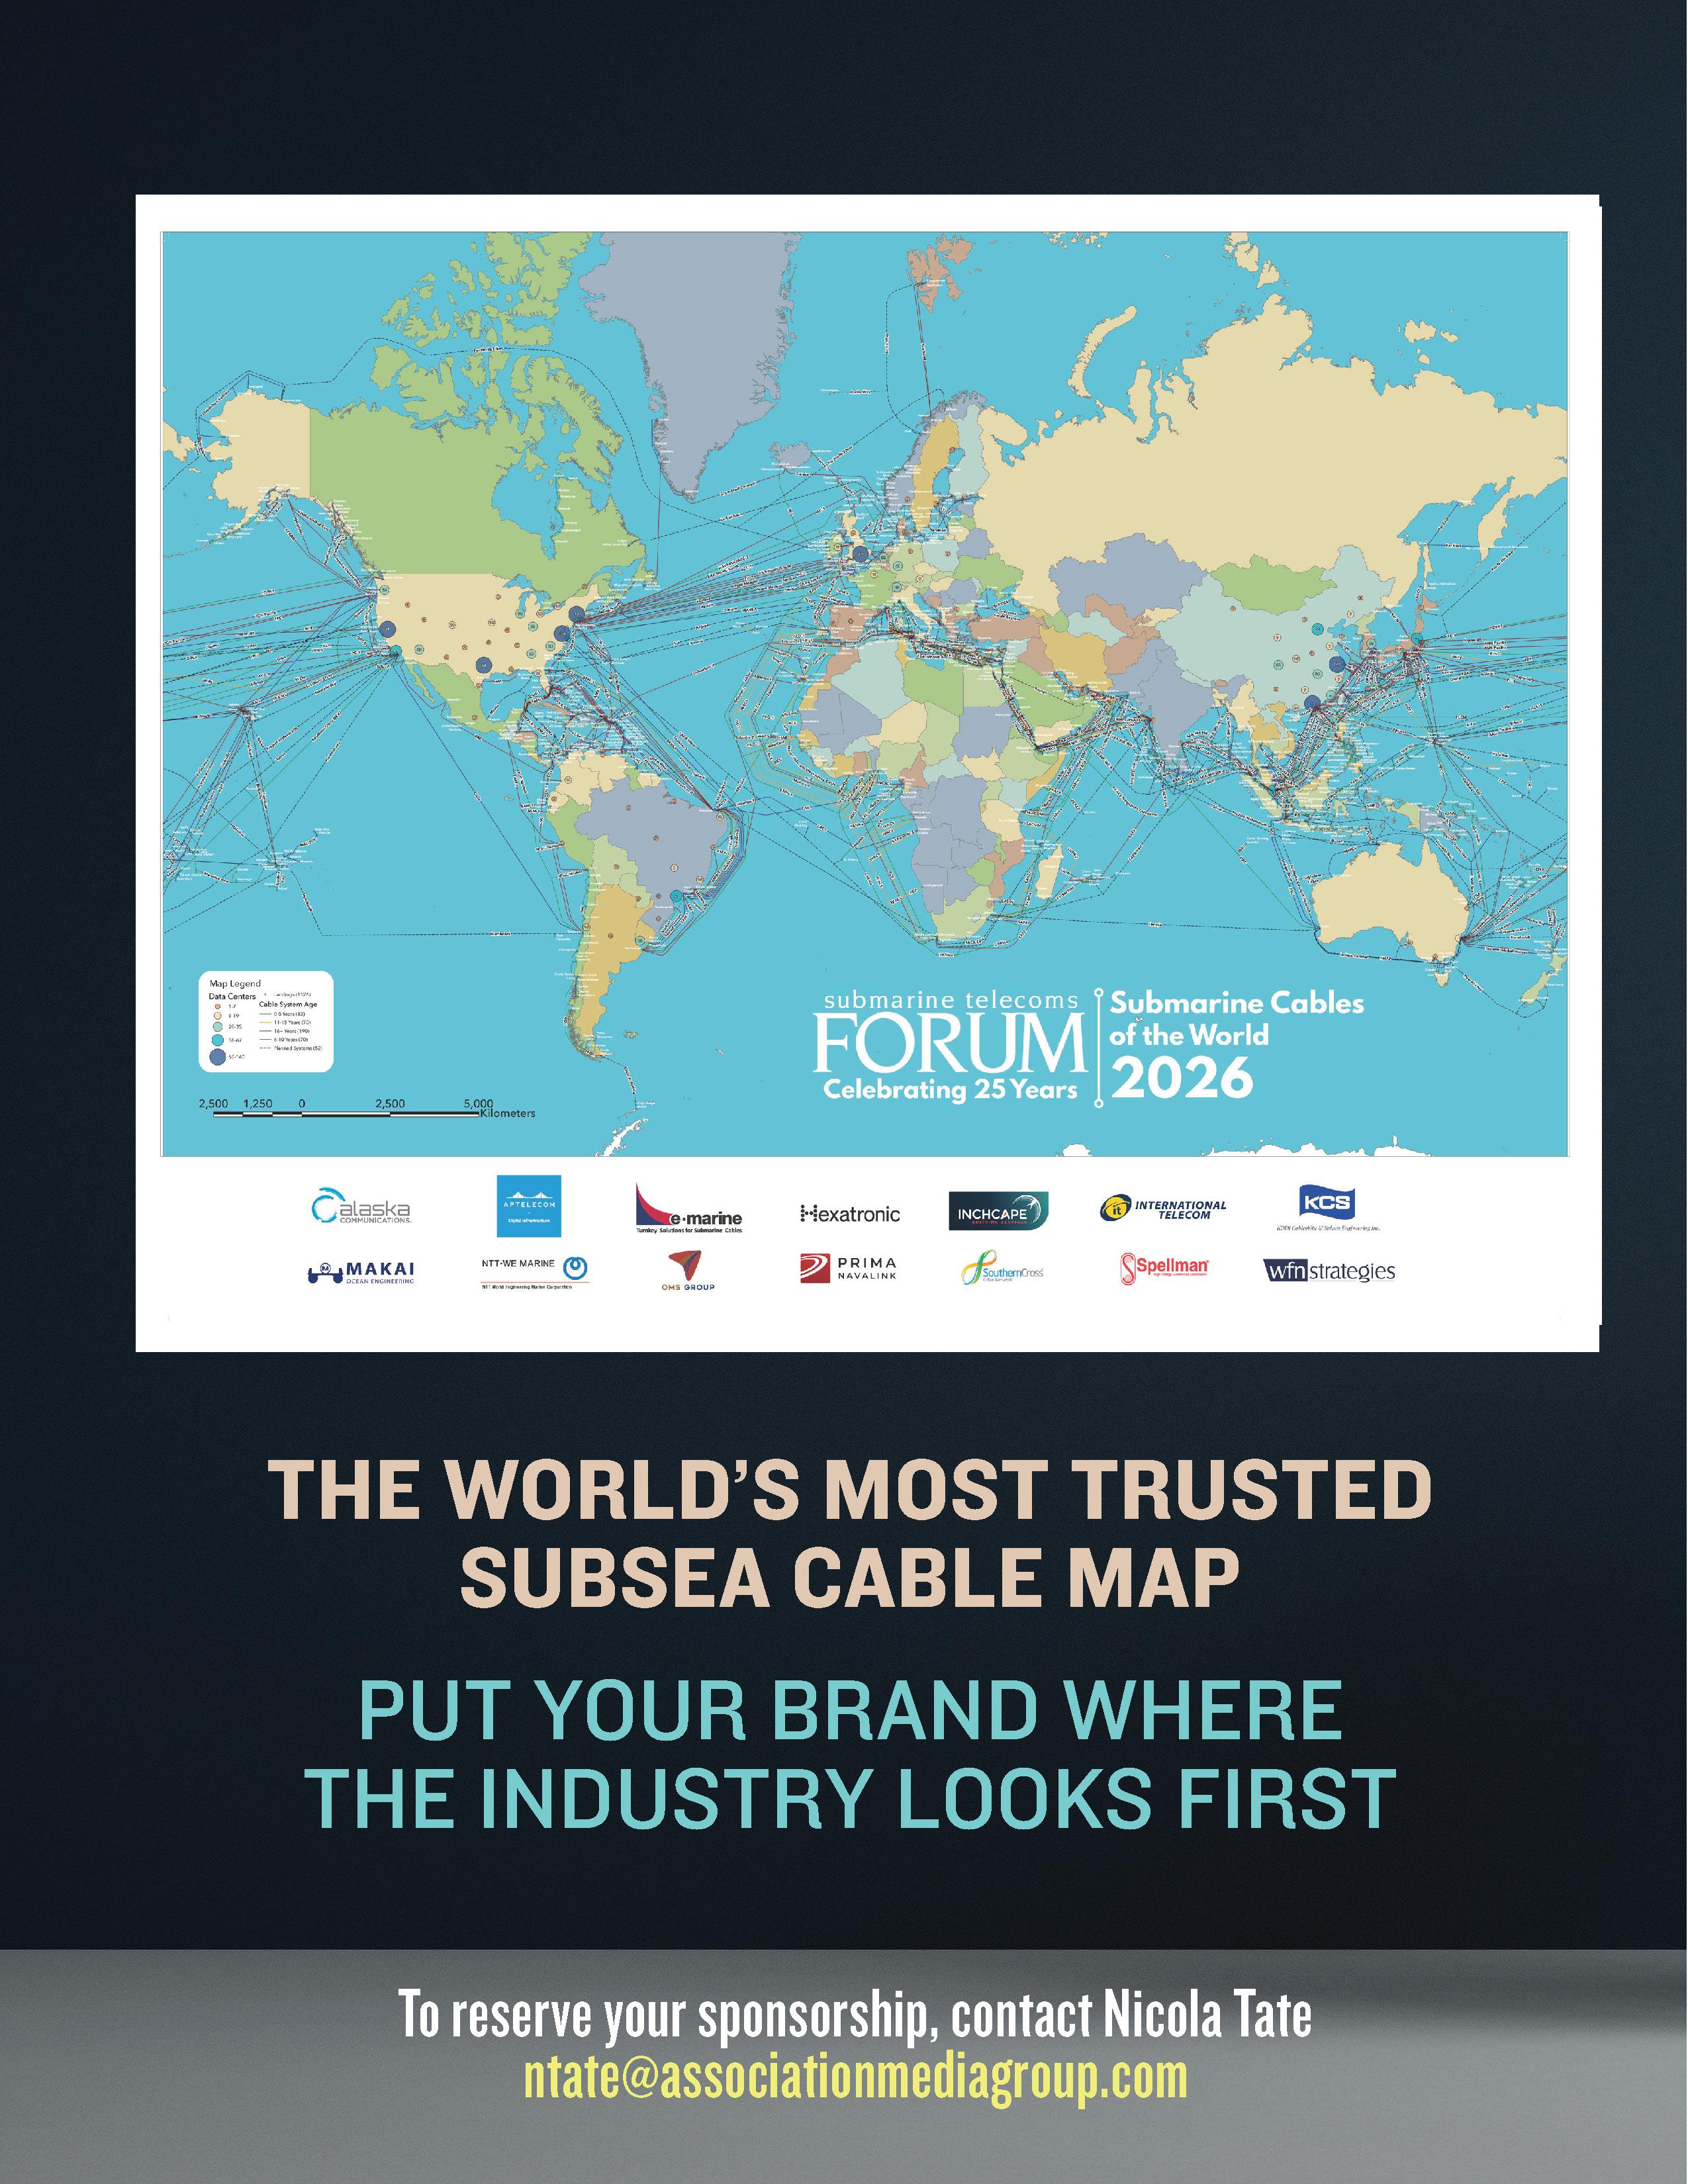
SubTel Forum will produce an updated edition of the Submarine Cables of the World wall map for Submarine Networks World in Singapore this September. The map remains one of the most widely recognized visual references in the industry, appearing in offices, meeting rooms, and project spaces across the global subsea community. Advertising opportunities are now available for the September edition, placing your brand directly in front of industry leaders attending Submarine Networks World and on walls throughout the year. Click here to secure your spot!
THANK YOU
Our thanks, as always, go to our outstanding authors. Special appreciation to this issue’s advertisers: ACS, Anritsu, Assured Communications, APTelecom, Fígoli Consulting, and WFN Strategies. And don’t miss our perennial reader favorite, Where in the World Are All Those Pesky Cableships?
Good reading, and Slava Ukraini . Wayne Nielsen is the founder and publisher of Submarine Telecoms Forum, one of the industry’s most trusted intelligence platforms, reaching more than 150,000 readers in 115 countries. He is also Managing Director of WFN Strategies, with over 35 years of global submarine cable experience spanning commercial, governmental, and offshore energy systems.
Vice President
Kristian Nielsen | knielsen@subtelforum.com | +1 703 861 3647
Contributions from SubTel Forum editorial staff and industry experts including Derek Cassidy, Kieran Clark, René d'Avezac de Moran, Andrés Fígoli, Anup Gupta, David Howard, John Manock, Brian Moon, Wayne Nielsen, Kristian Nielsen, Phillip Pilgrim, Tony Rossabi, Nicole Starosielski, Nicola Tate, and Federica Tortorella
Feature Writers
JoAnn C. Adkins, Simon Appleby, Jean-Christophe Antona, Geoff Bennett, Billy Buddell, Derek Cassidy, Jose Chesnoy, Mike Conradi, Nicholas De Lacy-Brown, Sumudu Edirisinghe, Christian Keogh, Henry Kilding, John Maguire, Joel Ogren, Anna Bridget Sheehan, Lola Stirling, Mitsuhiro Usuba, Wouter van Terwisga, and Shu Zhuang
NEXT ISSUE
July 2026 – Regional Systems featuring Submarine Networks World
Authors Index subtelforum.com/authors-index Industry Directory directory.subtelforum.com
Wayne Nielsen, Margaret Nielsen, Kristian Nielsen and Kacy Nielsen Corporate information: subtelforum.com/corporate-information
SUBMISSIONS
Contributions are welcomed and should be submitted to: pressroom@subtelforum.com
PUBLISHING AND LIABILITY NOTICE
Submarine Telecoms Forum magazine is published bimonthly by Submarine Telecoms Forum, Inc. It is an independent commercial publication serving as a freely accessible forum for professionals engaged in submarine cable systems and global digital infrastructure. No part of this publication may be reproduced or transmitted in any form, in whole or in part, without prior written permission from the publisher.
SUBSCRIPTIONS AND ENQUIRIES
Submarine Telecoms Forum, Inc. | 19471 Youngs Cliff Road, Suite 100 | Sterling, Virginia 20165 USA | Phone: +1 703 861 3647 | Website: www.subtelforum.com
While every effort is made to ensure accuracy, the publisher accepts no liability for errors or omissions in editorial or advertising content, or for any consequences arising therefrom. The editor reserves the right to edit all submitted material.
MAPPING THE WORLD’S SUBMARINE CABLE INFRASTRUCTURE
by Kieran Clark
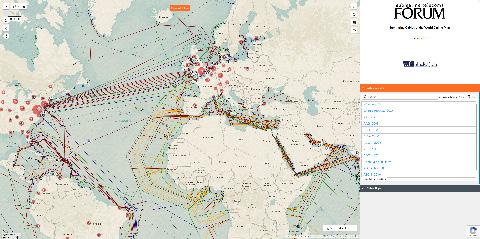
The SubTel Cable Map—powered by Esri’s ArcGIS platform—offers an interactive and detailed way to explore the global network of submarine cables.
This indispensable resource provides information on over 440 existing and planned systems, more than 50 cable ships, and upwards of 1,100 landing points. Connected directly to the SubTel Forum Submarine Cable Database and integrated with our News Now Feed, the map enables real-time tracking of industry activity and cable-specific news coverage.
Submarine cables serve as the foundation of global digital infrastructure, carrying more than 99% of international data traffic. These systems enable the seamless connectivity the world depends on—from personal communication to enterprise operations. Without them, modern, high-speed global communication simply wouldn’t be feasible.
Our analysts continually update the map using verified data from the Submarine Cable Almanac and valuable input from industry contributors. This ensures a timely and accurate picture of the subsea cable landscape, spotlighting the latest deployments and developments. As we approach the end of the year, map updates may slow during the holiday season, but our commitment to delivering reliable insights remains unchanged.
We’re proud to feature WFN Strategies as the current sponsors of the SubTel Cable Map. Additional sponsorship opportunities are available—offering high-visibility placement for your logo and a direct link to your organization. It’s a great way to align your brand with global connectivity and the future of the submarine cable industry.
We invite you to explore the SubTel Cable Map and gain a deeper understanding of the vital role submarine cable systems play in our interconnected world. As always, if you are a point of contact for a system or company that requires updates, please email kclark@subtelforum.com
We hope the SubTel Cable Map proves to be a valuable resource for you, offering insight into the continually evolving submarine cable industry. Dive into the intricate network that powers our global communications today. Happy exploring!
Kieran Clark is Senior Analyst at Submarine Telecoms Forum, Inc. He joined in 2013 as a Broadcast Technician supporting live event streaming, bringing over eight years of production experience. Promoted to Analyst in 2014, he now leads research and maintenance for the SubTel Forum Submarine Cable Database and Online Map, with analysis featured across most SubTel Forum publications.
EXPLORE DISCOVER CONNECT
The world's most comprehensive interactive submarine cable map
UPDATED. ACCURATE. ESSENTIAL.
JANUARY 18, 2026
NEW SYSTEMS:
• ELS-1
• Nome to Homer Express
• SCNX-1
• SCNX-2
• SCNX-3
• SCNX-4
GLOBAL CAPACITY: A SNAPSHOT OF WHERE WE ARE AND WHERE WE ARE HEADED ANALYTICS
Reprinted Excerpts from SubTel Forum’s 2025/26 Submarine Industry Report
Global capacity growth across major submarine cable routes continues to highlight the shifting dynamics of investment and demand within the industry.
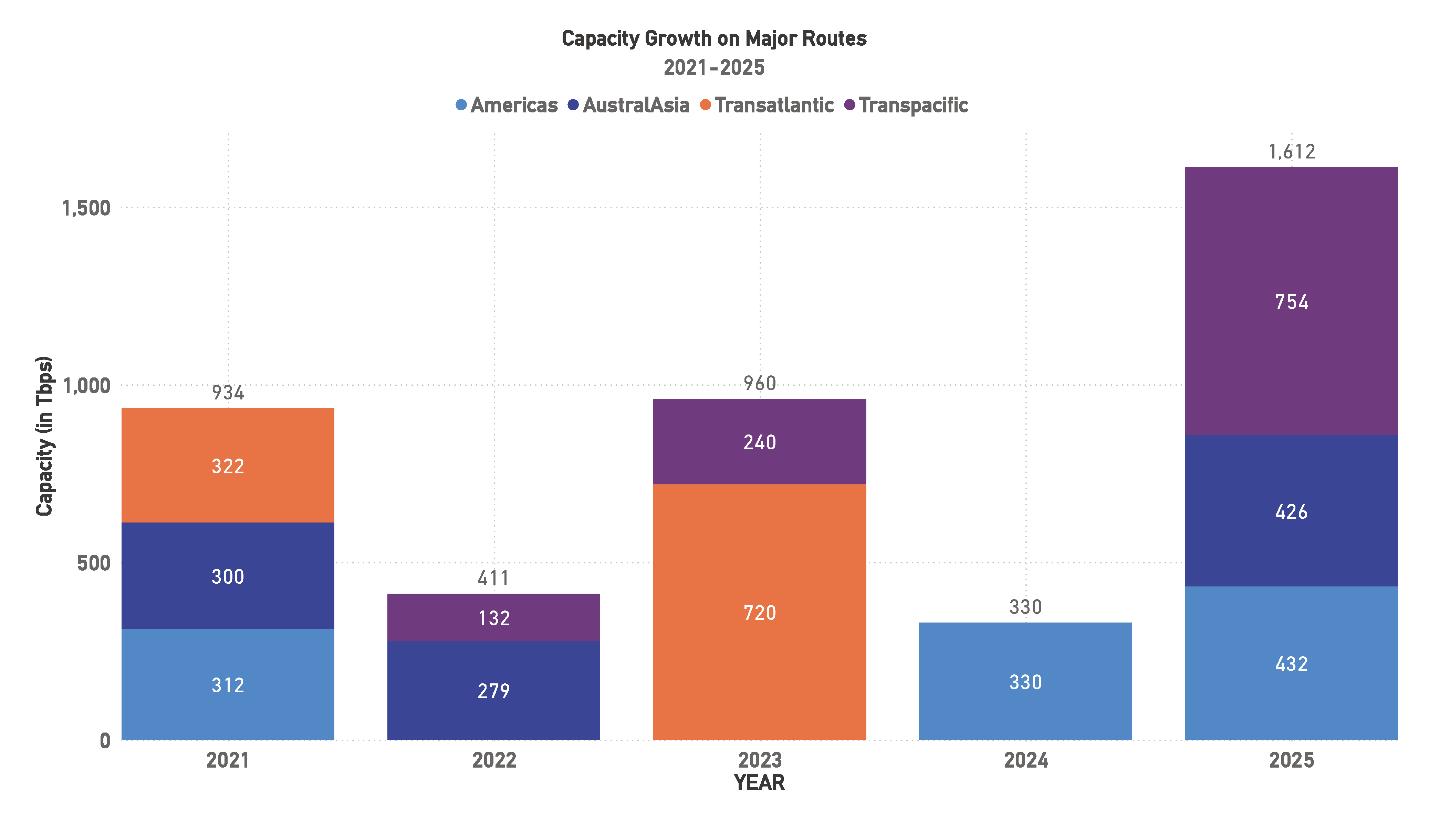
Between 2021 and 2025, a clear pattern emerges: while overall demand for international connectivity remains robust, the timing and distribution of new capacity along major arteries such as the Transatlantic, Transpacific, Americas, and AustralAsia routes have varied considerably year by year.
drop was driven largely by a lack of growth across the Americas and Transatlantic routes, with AustralAsia adding just under 280 Tbps and Transpacific contributing a smaller 132 Tbps. The slowdown reflected a gap in the commissioning of large-scale new systems, even as demand fundamentals remained strong.
A recovery took shape in 2023, with 960 Tbps of new capacity added across major routes. The Transatlantic segment dominated with 720 Tbps, underscoring its central role as one of the most competitive and well-developed corridors. The Transpacific route contributed 240 Tbps in the same year, marking an important step forward in expanding links between North America and Asia-Pacific markets. Notably, AustralAsia and the Americas did not register major contributions during this period, highlighting the uneven distribution of capacity growth across routes.
In 2021, the industry recorded one of the stronger capacity additions of the period, with 934 Tbps brought online across the major routes. The largest contributions came from the Transatlantic and Americas segments, which together accounted for more than 600 Tbps of new capacity. AustralAsia also played a significant role, adding 300 Tbps during the year. This growth underscored the continued demand across both east–west and north–south routes, particularly for transoceanic systems connecting the U.S. and Europe with Asia and beyond.
By contrast, 2022 represented a sharp decline in new additions, with only 411 Tbps deployed. This
Capacity growth slowed again in 2024, with just 330 Tbps added, all of it on the Americas route. This represented one of the lowest totals in recent years, particularly when compared to the significant volumes added in 2021 and 2023. The limited growth underscores the variability in project completions, as capacity additions remain closely tied to the timing of individual system launches.
In 2025, the industry is preparing for a substantial wave of new capacity across major routes. A total of 1,612 Tbps is projected to be added, the largest annual increase of the five-year period. The Transpacific route is expected to contribute 754 Tbps, representing nearly half of total new growth this year, followed by AustralAsia with 426 Tbps and the Americas with 432 Tbps. Together, these three
Figure 1: Capacity Growth on Major Routes, 2021-2025
Click here for the full
Submarine Telecoms Industry Report 2025/2026
regions account for more than 95% of projected additions in 2025, reflecting a renewed emphasis on strengthening intercontinental connectivity and expanding east–west traffic corridors.
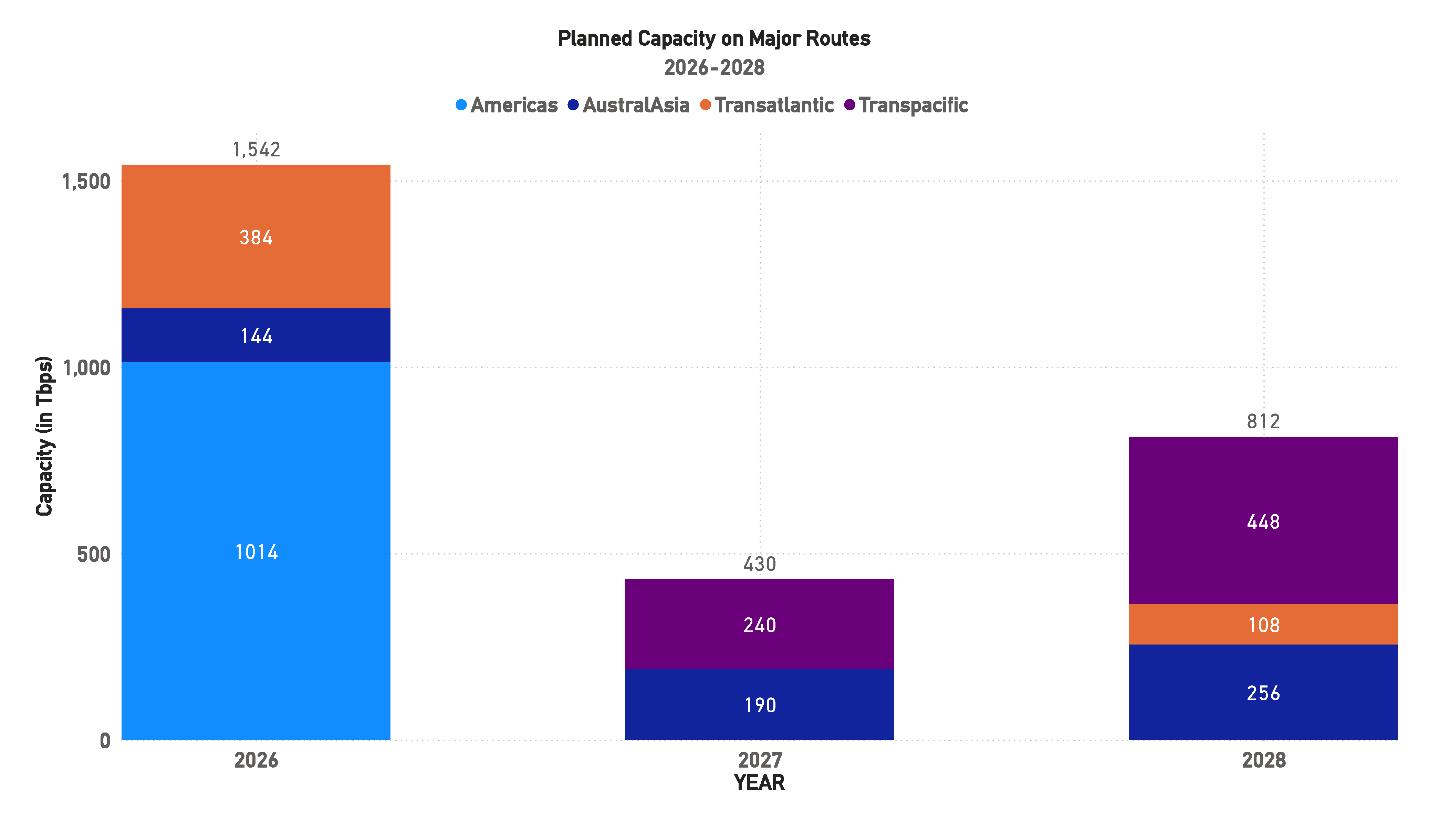
Beyond 2025, the outlook indicates continued capacity growth but at a more measured pace. In 2026, an estimated 1,542 Tbps will be added, the majority of which—over 1,000 Tbps—will come from the Americas route. This makes 2026 another high-capacity year, with important implications for data flow between the U.S., Latin America, and other regions. In 2027, capacity additions are projected to decline significantly, with only 430 Tbps planned, largely split between the Transpacific (240 Tbps) and AustralAsia (190 Tbps). By 2028, the pipeline anticipates 812 Tbps of new capacity, with Transpacific once again playing a leading role at 448 Tbps.
the forecast suggests slower activity in 2027 before growth resumes in 2028, a reminder of the cyclical nature of the industry.
It is important to note that these figures represent growth across the industry’s major arteries and do not capture all new capacity added globally. They are, however, indicative of where the most competitive and heavily developed routes are headed in terms of near- and medium-term growth. As in previous years, the adoption of advanced transmission technologies—including higher-order modulation, greater fiber pair counts, and spectrum sharing arrangements—will play a critical role in ensuring these new systems meet the escalating demand for global data transmission.
Taken together, the results from 2021 to 2025 and the planned deployments through 2028 underscore the scale and complexity of managing global submarine cable capacity. With demand continuing to rise across all regions, the industry’s ability to deliver large volumes of new capacity on its most important corridors remains central to supporting the world’s digital infrastructure.
Compared to last year’s projections, the timing of growth has shifted, with some systems now scheduled for later years, particularly in the Transpacific and Transatlantic segments. The concentration of activity in 2025 and 2026 highlights the clustering effect often seen in large-scale submarine cable deployments, where multiple projects reach completion within a short timeframe. At the same time,
LIT CAPACITY
The global submarine cable landscape continues to expand rapidly, with major routes seeing significant increases in both lit capacity (the in-service bandwidth actively being used) and total design capacity (the theoretical maximum if fully equipped). Year-over-year growth from 2024 to 2025 has been robust across all key routes, driven by hyperscaler investments, data center expansion, and surging demand from 5G and cloud services. However, regional disparities and constraints – from economic and regulatory challenges to geopolitical tensions – are influencing how this capacity is utilized. Below, we provide an updat-
Figure 2: Planned Capacity on Major Routes
ANALYTICS
ed region-by-region breakdown for the Americas, Intra-Asia, Transatlantic, and Transpacific routes, including 2024 and 2025 figures and projections for 2026, along with analysis of trends, drivers, and emerging technologies.
Americas (North America–Latin America Routes)
Capacity Growth: The Americas routes (primarily connecting the U.S. with Latin America and the Caribbean) have sustained strong growth. Total design capacity nearly doubled between 2020 and 2024, rising from about 913 Tbps to 1,524.8 Tbps in 2024, while lit capacity grew from 802 Tbps to 1,102.2 Tbps over the same period. This represents a significant increase, although growth has been uneven year to year. From 2024 to 2025, total capacity continued to climb – bolstered by new systems like Google’s Firmina cable (approximately 12 fiber pairs, ~240 Tbps design) – reaching an estimated ~1,650 Tbps. Lit capacity is likewise up in 2025 to roughly ~1,200 Tbps, reflecting ongoing traffic growth. By 2026, with additional projects coming online (including high-fiber-count cables such as the planned 36-pair AMX-3/Tikal cable at ~360 Tbps (BNAmericas, 2024)), total design capacity is projected to approach ~1,750 Tbps, with lit capacity around ~1,300 Tbps as service uptake gradually fills the available bandwidth.
ly 72% of available capacity was lit in 2024 – but growth in lit bandwidth has been slower and prone to fluctuation. In the years immediately prior, lit capacity saw double-digit growth (29% in 2020) that tapered off to mid-single digits (around 4% in 2021) before rebounding to about 16% by 2024. This volatility stems from economic and political factors in Latin America. Demand is heavily concentrated in the United States, which continues to drive traffic, whereas many Latin American markets are still ramping up digital adoption. Hyperscalers (like Google, Meta, and Microsoft) have been key investors in new North–South cables connecting the U.S. to Brazil, Chile, Argentina and beyond.
“New cable builds are creating major bandwidth headroom, but the real test will be whether regional demand can catch up before capacity turns into overbuild.”
These new private cables (e.g., Google’s Curie and Firmina, Meta’s Juno and others) contribute enormous design capacity, but much of it is dedicated to the hyperscalers’ own cloud and content needs. As a result, unless wider market demand catches up or access to these systems broadens, a significant portion of the theoretical capacity remains unlit. Indeed, the Americas route has struggled with underutilized capacity in certain segments, as cloud and streaming services growth in Latin America, though accelerating, has not yet fully tapped the available bandwidth.
Route Capacity (Tbps)
Utilization and Drivers: The Americas region currently utilizes a large share of its capacity – rough-
Regional Considerations: Economic challenges and regulatory hurdles in parts of Latin America continue to temper demand growth. Political instability and slower enterprise cloud adoption in some countries mean that the full potential of new cables is not immediately realized. Nevertheless, there are positive signs: telecom and data center investments are increasing in major economies like Brazil, Mexico, and Chile, and 5G rollouts and rising internet use are steadily boosting international bandwidth needs. By 2025, cloud providers and content networks are expanding their presence in Latin America, driving more traffic onto subsea routes.
Table 1: Americas Route Lit Capacity 2024-Present
The utilization trend in the Americas is expected to continue upward but at a measured pace. The lit-to-design capacity ratio may actually dip in the near term (with big new cables coming online), then gradually rise as market usage catches up to the built capacity. Careful infrastructure planning will be required to avoid overbuild scenarios – recent growth has created a healthy buffer, and going forward the industry is likely to take a more measured approach to adding new cables in this region. At the same time, any underestimation of future demand could lead to bottlenecks: if Latin American digital services and cloud adoption accelerate faster than expected, currently unlit capacity will need to be lit quickly, and additional investments might be pulled forward. Operators and consortia are therefore balancing caution with readiness, ensuring that plenty of headroom exists for the Americas while monitoring indicators like data center traffic and 5G uptake in the region’s emerging markets.
Intra-Asia (Within Asia Regional Routes)
Capacity Growth: The Intra-Asia routes (connecting major Asian hubs and emerging markets within Asia) have seen moderate but steady expansion in design capacity, punctuated by large jumps when new systems come online. In 2020, total design capacity on key intra-Asian connections was around 708 Tbps (with only ~77.5 Tbps lit). By 2024, total capacity reached approximately 1,200 Tbps, with lit capacity about 145.7 Tbps. This represents substantial growth in available bandwidth, although lit usage remains a small fraction (barely 12% of design capacity in 2024). The year 2025 is a watershed for Intra-Asia capacity: multiple high-capacity consortium cables launched or are coming online. Notably, the Apricot cable (a 12,000 km intra-Asia system led by Meta and Google) launched in late 2024 with an initial design capacity over 190 Tbps and the MIST cable (connecting Southeast Asia to India) was commissioned by 2025 with 200+ Tbps design capacity (Grey, 2025).
These, along with other new links (e.g., Asia Direct Cable and regional extensions of 2Africa in the In-
dian Ocean), boost intra-Asian design capacity to an estimated ~1,600 Tbps in 2025. Lit capacity is also rising but more gradually – expected to exceed ~180 Tbps by 2025, as new routes begin carrying traffic. By 2026, with additional systems (such as the long-delayed SJC2 cable potentially coming into service at ~144 Tbps and other planned upgrades), total design capacity could approach ~1,800 Tbps, while lit capacity might reach ~250 Tbps, assuming demand catches up to some of the newly added headroom.
Utilization and Drivers: Intra-Asia routes stand out for their low utilization relative to other regions. As of 2024, only about 12% of available capacity is lit – a reflection of significant capacity oversupply designed into Asian systems and the nascent stage of demand in some markets. This route’s lit capacity Compound Annual Growth Rate (CAGR) plunged from 36% in 2021 to roughly 7% in 2024, indicating that after a burst of early growth, usage has leveled off even as new cables were added. The nature of intra-Asia infrastructure development is often irregular, with big jumps when major cables are completed and quieter periods in between. In 2024–2025, we are in one of those jump phases: demand for connectivity within Asia is climbing, driven by booming internet use and cloud adoption in countries like India, Indonesia, Vietnam, and the Philippines.
The rise of local data centers and cloud regions in South and Southeast Asia is spurring more intra-regional traffic (e.g., content delivery networks serving video and social media locally), which in turn lights up more capacity. Even so, intra-Asian lit capacity remains a small fraction of what’s installed. This suggests a huge buffer of unlit fiber – in 2024 the
THE SUBSEA INDUSTRY’S BENCHMARK REPORT
The 2025/2026
INDUSTRY REPORT
TRUSTED DATA. CLEAR ANALYSIS. REAL INTELLIGENCE.
• Global system coverage—active, planned, future
• Capacity forecasts and regional build trends
• Supply chain, investment, and geopolitical insights
• Verified datasets based on real industry research
• Essential for strategic planning
average lit capacity on Asian routes was only ~61% of design globally, and far lower in Asia specifically. Such a buffer can be positive, ensuring ample room for growth, but it also reflects that many Asian links (especially those involving smaller economies) are underutilized.
Regional Considerations: Several factors contribute to Asia’s capacity imbalance. First, hyperscaler investments in Asia are often forward-looking –companies like Google, Meta, and regional telecom consortia have built extremely robust cables (e.g., Apricot’s 190 Tbps, MIST’s 216 Tbps) anticipating future needs (NTT Data, 2025). Many of these systems came online only recently, so operators are in the early stages of lighting fiber pairs as traffic grows. Second, traffic patterns in Asia historically skewed toward Transpacific routes, since a large portion of Asian internet content was hosted in North America. That is gradually changing: with more content caching and cloud infrastructure within Asia, east-west intra-Asia traffic (e.g., between data hubs like Singapore, Hong Kong, Tokyo, Mumbai) is rising. The region’s diversity is also a factor – regulatory and geopolitical issues can delay projects and constrain utilization. For example, geopolitical tensions (such as US–China tech frictions) have impacted intra-Asia cables – one consortium cable (SJC2) was delayed due to concerns about Chinese participation (Huston, 2022), and alternative routes avoiding the South China Sea are being pursued. Regulatory approval processes in various countries can be slow, affecting when capacity actually becomes available for use. Despite these challenges, the outlook for intra-Asia capacity is optimistic. Cloud and 5G adoption are accelerating in populous markets, ensuring that lit capacity will continue to grow steadily. Projections show lit capacity potentially reaching ~200 Tbps by 2028, implying a solid upward trajectory. Key to realizing this will be fully leveraging
new technologies – the latest cables in Asia employ higher fiber counts and advanced optical tech (e.g., wavelength selective switches and space-division multiplexing) to maximize throughput. The implication for planning is that Asia’s network has plenty of headroom, but operators must focus on driving utilization – through initiatives like lowering bandwidth costs, improving regional connectivity (more landing stations and terrestrial backhaul), and ensuring political support for cross-border data exchange. In the near term, Asia’s lit vs. total gap signifies a buyers’ market for bandwidth, with infrastructure ready and waiting for the region’s continuing digital boom.
Transatlantic (North America–Europe Route)
“Asia’s subsea network has enormous built-in headroom, but operators now face the challenge of turning surplus infrastructure into sustained regional utilization.”
Capacity Growth: The Transatlantic route – historically the busiest subsea corridor – has experienced explosive capacity growth over the past few years, fueled by new generation cables. Between 2018 and 2022, several ultra-high-capacity systems (e.g., Dunant, Marea, Grace Hopper, Amitié) came online, and the trend continues. As of 2024, total design capacity on the North Atlantic route reached 2,278.6 Tbps, with lit capacity around 1,571.0 Tbps. This marked a significant year-over-year increase, as just two new 2022 cables (Grace Hopper and Amitié) had boosted Transatlantic capacity by 70% in that year alone (Hamilton, 2024). The growth persisted into 2024–2025: for example, Meta’s Anjana cable, a 24-fiber-pair system with 480 Tbps design capacity, became operational in 2024 (Hardy, 2023), further raising the Atlantic’s ceiling.
By early 2025, total Transatlantic design capacity is estimated to have exceeded ~2,700 Tbps, an increase of roughly 20% over 2024, while lit traffic rose commensurately to about ~1,700 Tbps. Looking ahead to 2026, additional projects are in the pipeline (e.g., the planned Nuvem cable from South Carolina to Portugal in 2026). With these, the Trans-
atlantic route is projected to approach 3,000 Tbps of design capacity by 2026, and lit capacity is expected to climb toward ~1,900–2,000 Tbps, assuming current demand trends hold.
Utilization and Drivers: The Transatlantic route in 2024 had roughly 69% of its capacity lit (1.57 Pbps lit vs 2.28 Pbps total), reflecting both strong demand and the ongoing presence of unused headroom. Notably, lit capacity growth on this route has begun to moderate in percentage terms – the lit capacity CAGR peaked at ~59% in 2021 (when huge amounts of new bandwidth were activated) and has since slowed to about 9% as of 2024. This deceleration signals a maturing phase: after the early 2020s “boom” where content providers lit fibers at breakneck speed to meet surging video and cloud traffic, the rate of expansion is stabilizing. However, even a high-single-digit annual growth on such a massive base translates to enormous absolute capacity increments.
The drivers of Transatlantic demand remain very robust. The U.S.–Europe data corridor carries huge volumes of cloud computing, enterprise data replication, and internet content delivery. Hyperscalers continue to dominate this route – companies like Microsoft, Google, Meta, and Amazon are not only major users but also investors in the cable systems. Cloud services growth (enterprise migration to cloud, AI workloads, etc.) and the proliferation of bandwidth-heavy applications (high-definition streaming, augmented reality, etc.) are pushing up utilization steadily. Additionally, 5G networks and edge computing in both North America and Europe are elevating the need for low-latency, high-capac-
ity links across the Atlantic to connect distributed data centers.
Regional Considerations: The Transatlantic segment benefits from a relatively stable geopolitical and economic context compared to other routes. There is healthy competition and diversity – currently around 17 subsea cables connect North America and Europe (Hamilton, 2024), landing in multiple countries (U.S., UK, France, Spain, Portugal, etc.). This redundancy and competition have kept prices in check and encouraged continuous upgrades. One emerging factor is security and geopolitical strategy: European policymakers have grown cognizant of the importance of subsea cables and the need for resilience. Recent concerns about potential sabotage (e.g., incidents in the North Sea) have led to increased security measures on critical Atlantic cables (Inskit Group, 2025).
There is also a push for additional diverse routes –for instance, routes that land in the Iberian Peninsula or Nordics rather than the traditional UK landing, to distribute risk and support new data hub locations (Portugal’s upcoming Nuvem cable is an example, aiming to create a direct SC–Portugal link). Despite these developments, the main story is technology: the Transatlantic route is at the forefront of new cable tech adoption. Many cables here feature 12 to 24 fiber pairs and have been early adopters of 400 Gbps wavelength technology, with trials of 800 Gbps wavelengths successfully conducted in 2024 (Cisco, 2024). The Amitié cable, for instance, demonstrated 800 Gbps channels across 6,200 km, showcasing that next-gen coherent optics can nearly double per-channel throughput on transoceanic spans (Cisco, 2024). These advancements mean operators can light additional capacity on existing fibers, boosting lit capacity without new cable lay. Infrastructure planning for the Atlantic is now focused on incremental upgrades and selective new builds.
Given the slight cooling in CAGR, there is a cautious approach to avoid overcapacity; yet stakeholders are mindful that any demand surprise (e.g., a spike
from AI or metaverse applications) could rapidly consume the reserve. The consensus is to proceed with continued investments (there are still several cables in development or recently completed) while maintaining vigilance on utilization rates. Overall, the Transatlantic corridor remains highly utilized and critical, and the industry is aligning capacity expansion to closely match the sustained, if no longer exponential, growth in traffic.
Transpacific (North America–Asia Route)
Capacity Growth: The Transpacific route linking East Asia (Japan, East/Southeast Asia, Australia) with North America is witnessing exceptional capacity expansion, rivaling the Atlantic in scale. In 2020, Transpacific design capacity was about 589.3 Tbps, with 464.6 Tbps lit. By 2024, total capacity had soared to 1,485.3 Tbps and lit capacity to 902.8 Tbps, reflecting massive investments in new systems. The period from 2021 to 2024 saw multiple hyperscaler-led cables completed, including JUPITER (Japan-U.S.), PLC segments, and others, which tripled Pacific capacity. Notably, the CAGR for lit capacity fell from an astounding 78% in 2020 to about 12% in 2024 as the initial boom moderated.
However, growth is picking up again with a new wave of cables in 2024–2025. By the end of 2025, at least four major Transpacific systems will have been recently RFS: JUNO (Japan-U.S., 20 fiber pairs, 350 Tbps, RFS 2024), Bifrost (Singapore-Indonesia-U.S., 260 Tbps (Keppel, 2025), RFS 2024/25), Echo (Indonesia-U.S., ~144 Tbps (Huston, 2022), first segments in service 2023–24), and Southern Cross NEXT (U.S.-Australia via Pacific Islands, 72 Tbps, RFS 2022). These have catapulted total Transpacific design capacity to an estimated ~1,900 Tbps in 2025, a ~28% jump from 2024. Lit capacity is also rising fast – likely exceeding 1,100 Tbps in 2025 as the hyperscalers begin utilizing these new routes for Asia-Pacific traffic. By 2026, with further additions (such as the planned CAP-1 cable to the Philippines and other expansions to Oceania), Transpacific design capacity is forecast to reach ~2,200 Tbps or more, while lit capacity could be in the ballpark of
Transpacific Capacity (Tbps) 2024 2025 2026 (proj.) Total Design Capaci-
Utilization and Drivers: In 2024, about 61% of Transpacific capacity was lit – a substantial utilization level, but slightly lower than the Atlantic’s, indicating a bit more spare capacity in the Pacific. The Pacific route, however, is now catching up quickly in absolute terms; lit traffic (903 Tbps in 2024) is only about 10% lower than the Atlantic’s despite a later start in hyperscaler build-out. Drivers on this route are powerful: North America-Asia internet and cloud traffic continues to grow exponentially, fueled by Asia’s large user base and digital economy expansion. The Pacific has seen the world’s largest new cables by fiber count because U.S. tech giants and Asian telecoms anticipate enormous demand. Hyperscalers like Google, Meta, Microsoft, and Amazon are heavily invested – for instance, Google and Meta’s Apricot cable (190+ Tbps) adds intra-Asia capacity that ultimately connects into U.S. routes, and Meta’s planned ORCA cable will link the U.S. and SE Asia in the coming years.
Cloud computing is a major factor: as companies in Asia adopt cloud services, cross-Pacific data flows to U.S. cloud regions surge. Similarly, media and entertainment (e.g., video streaming, gaming) and emerging applications (like AI data exchange, which often involves U.S.-Asian data center interactions) drive demand. The Transpacific route is also critical for connecting data center hubs (Silicon Valley, Tokyo, Singapore, Sydney, etc.), so enterprise network needs and financial trading routes contribute to continuous growth.
Regional Considerations: The Transpacific theater is not without challenges. Perhaps the biggest is geopolitical tension affecting cable routes. Over
the past few years, U.S. authorities have blocked or scrutinized cables with direct China or Hong Kong connections, citing security concerns. This led to the cancellation or rerouting of some high-profile projects (e.g., the PLCN cable was reconfigured to avoid Hong Kong). As a result, new Pacific cables increasingly land in allied territories (Japan, Taiwan, Philippines) or use diverse paths through Southeast Asia, sometimes at the expense of direct U.S.-China connectivity. This geopolitical filtering has somewhat constrained route choices, but traffic demand has simply shifted to alternative paths (for example, more cables landing in Taiwan or Japan and then reaching China via terrestrial networks). Another consideration is natural disaster risk: the Pacific “Ring of Fire” region is prone to earthquakes (Japan, Taiwan) that can break cables, so operators have been adding redundant routes via the south Pacific and designing cables with more resiliency. In terms of utilization, the Transpacific route still has a healthy buffer – the influx of new cables means lit % may temporarily dip as of 2025 (with so much fresh capacity coming online).
Space Division Multiplexing to maximize total capacity (Keppel, 2025). Trials of 1.3 Tbps per wavelength have even been conducted on Pacific cable segments (Qiu, 2024), hinting at future upgrades where existing cables can carry far more traffic through better modulation.
“Transpacific capacity is scaling at extraordinary speed, but geopolitical routing pressures and Asia’s bandwidth appetite will determine how fast that headroom is used.”
All these developments ensure that, while utilization is rising, so too is the capability to scale. The key implication is that the Pacific route’s strategic importance is ever-growing – it is the conduit for communication between the world’s largest economies – and thus it is being fortified with both sheer capacity and improved resilience (Keppel, 2025). To avoid future capacity crunches, consortiums and companies will continue to build and upgrade aggressively, mindful that any slowdown could leave the region under-provisioned given Asia’s appetite for bandwidth.
KEY TECHNOLOGY AND PLANNING CONSIDERATIONS
But industry projections show lit usage climbing steadily thereafter; one estimate foresees Pacific lit capacity reaching 1.5–1.8 Pbps by 2028, reflecting strong demand growth. Infrastructure planning here is focused on staying ahead of an exceptionally dynamic demand curve. Stakeholders are keenly aware that Asia’s internet growth outpaces that of more mature regions, necessitating continuous investments. The pipeline of planned cables through 2027 (e.g., Hawaiki Nui connecting NZ–US, Unity-2/JUNO which achieved 350 Tbps, and others) suggests the Pacific will likely equal or surpass the Atlantic in raw capacity within a few years. Fortunately, technological advancements are keeping pace: many Transpacific systems now deploy high fiber-pair counts (12, 16, even 20) and advanced
Across these regions, a common theme has emerged over the past years. Hyperscaler investments have fundamentally reshaped the submarine cable industry – today’s largest cables are often financed or wholly owned by content and cloud providers, and they boast unprecedented scale. For example, a single modern cable can offer on the order of 300–500 Tbps (as seen with Grace Hopper at 340 Tbps and Anjana at 480 Tbps) (Poutonnet, 2020), (Hardy, 2023), far outstripping earlier-generation systems. These enormous design capacities are achieved through high fiber-pair counts (12, 16, 24 pairs vs. the traditional 4 or 8) and advances in optical transmission technology. The move from 100 Gbps wavelengths a few years ago to 400 Gbps channels is now mainstream on new cables, and the industry is already trialing 800 Gbps waves on live systems (Cisco, 2024). Vendors like Ciena, Infinera, Nokia and Cisco (Acacia) have demonstrated that
ANALYTICS
ASK THE EXPERT
Question for the author(s)? Click here!
even transoceanic distances can support 800 Gbps per wavelength with new modulation techniques and signal processing (Cisco, 2024). This means that lit capacity can increase not only by laying new cables but also by upgrading the equipment on existing fibers – a strategy that many operators will use to incrementally boost lit capacity (e.g., upgrading older Atlantic cables with next-gen optics effectively raises their lit throughput without changing the design capacity).
Market drivers continue to be cloud and content usage. The rise of AI and machine learning workloads is one new factor on the horizon – training AI models often involves replicating large datasets globally, and tech companies are interconnecting their data centers across oceans with ever-fatter pipes. Likewise, data center expansion in second-tier markets (e.g., new hubs in Africa, Latin America, Southeast Asia) is creating fresh regional routes that complement the big transoceanic links. 5G adoption indirectly fuels submarine cable demand by multiplying mobile data traffic (much of which ultimately traverses international links for cloud services or content). For instance, as 5G rolls out in South Asia and Latin America, more consumers access high-bandwidth applications, driving up international IP transit.
Regional disparities, however, mean that not all capacity is utilized equally. The data shows mature routes (Transatlantic, Transpacific) have lit well over half of their available capacity, whereas routes involving emerging markets (Intra-Asia, some Americas segments) have large portions of unlit capacity remaining. Economic and regulatory barriers contribute to this: places with less developed internet ecosystems take longer to generate the traffic that fills a modern cable, and regulatory issues (like licensing and landing permits or protectionist policies) can slow down both cable deployment and usage. Geopolitical issues – from concerns over espionage to actual cable sabotage risks – overlay additional complexity. For instance, heightened geopolitical tensions have led to calls for more route redundancy to avoid single points of failure in politically sensitive areas (Inskit Group, 2025). This has
planning implications: cable consortia are now more carefully considering route diversity (e.g., avoiding certain choke points or exclusive economic zones) and building in security and resilience measures.
Utilization trends overall indicate that, despite the huge growth in design capacity, the industry has managed to keep lit capacity growing in tandem with demand. Recent data collection improvements (such as more comprehensive FCC reporting on U.S.-connected cables) show that on average lit capacity is around 60% of total design capacity globally as of 2024. This is a much higher utilization ratio than observed in the mid-2010s (when it was closer to ~18% on major routes) – signaling that global bandwidth demand is indeed catching up with the massive supply that’s been deployed. It also suggests a more efficient use of infrastructure: operators are not simply laying dark fiber strands undersea; they are actively lighting them to carry traffic for cloud, streaming, and enterprise needs. From a planning perspective, this trend underscores the importance of accurate demand forecasting. Cable systems take years to plan and build, and their lifespan is 20-25 years, so anticipating traffic growth is critical. Thus far, hyperscalers have been very adept at forecasting and have often led the push to add capacity just as it’s needed (sometimes a bit before, to ensure a cushion) (Wong, 2022)
The slight slowdown in lit capacity growth rates on the busiest routes is not an indication of slackening demand, but rather a sign that supply and demand are reaching a new equilibrium. Going forward, industry players will aim to avoid both excess and shortfall: too much excess capacity can strain project economics, while any capacity shortfall would cause congestion and higher costs.
SUBSEA
GREEN CABLE SHIPS FOR A GREENER INTERNET – FROM LIFE: ALTERNATIVE FUEL CHOICES FOR CABLE MARINE
by David Howard, René d’Avezac de Moran, and Derek Cassidy
Alternative fuels for the ships used to install and repair submarine cables can significantly reduce lifecycle greenhouse gas emissions of subsea cables by transitioning away from heavy fuel oil towards alternative greener fuels.
The objective is for marine operations to reach net-zero greenhouse gases (GHG) in line with International Maritime Organization (IMO) [1] targets. Uncertainty around IMO policy and the choices of alternative fuels leave ship designers with difficult decisions.
The Sustainable Subsea Networks team has been working over the past year to develop models to investigate the quantity of GHG each aspect of the industry generates during the survey, manufacture, installation, commissioning and operation (including maintenance) of typical transatlantic and transpacific systems. The reason for developing these models is so we can critically examine how the GHG emissions of these systems can be reduced, ideally to Net Zero, and to enable us to demonstrate to system users that the submarine cable industry is environmentally compliant.
This article focuses on the marine aspects of the systems’ carbon budgets principally:
• Survey,
• Installation,
• Maintenance,
• End-of-Life recovery.
An initial review of the main GHG contributors for the marine activities, related to cable lifecycle, showed that the overwhelming main cause is emissions from fuel consumption. The working group therefore decided to focus its efforts on fuel initially as it dwarfs other aspects such as construction of ships, waste and recycling from PLGR, cable installation
and repairs impact on the environment, journey planning or remote operations. All these should be kept in mind when discussing ways to reduce the carbon footprint of marine activities [2]. And while this article focuses primarily on transoceanic systems, the fleet sustainability challenge extends to subfluvial cable projects such as those in Brazil’s Amazon River. These operations will require specialized vessel types with potentially more emissions reductions needed from repairs.
Nearly all cable ships currently use Heavy Fuel Oil (HFO), but survey and other small vessels may use diesel for their propulsion. These produce significant GHG emissions, so we discuss alternative fuels that may reduce this impact. The marine industry is currently a major generator of GHG, but the IMO is working to reduce these to Net Zero by 2050. Current estimates are that GHG emissions exceed one billion tonnes of CO2 per year, and this may double by 2050 [3] unless aggressive mitigation measures are implemented urgently.
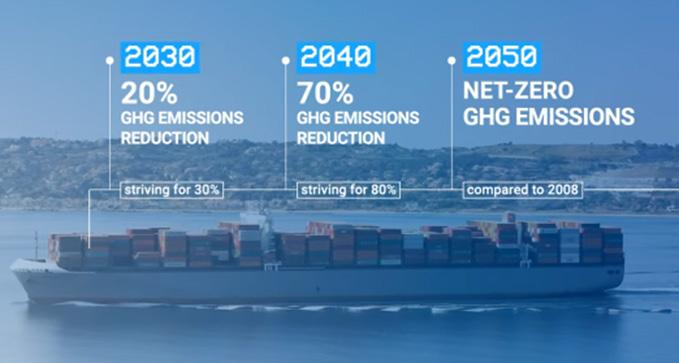
The IMO met in April 2025 and agreed, though not unanimously, a Net Zero Framework (NZF) which would gradually reduce ships’ GHG emission, starting in 2030. Non-compliant ships would pay into an IMO ‘Net Zero Fund.’ The revenues, from this fund, would be distributed to reward low-emission ships, support research and initiatives in developing coun-
Figure 1. IMO’s Goals and Timeline for Vessel GHG Emissions Reductions. Source: IMOHQ 2025.
FROM SURVEY TO END OF OPERATIONS
tries, power the IMO GHG Strategy, and mitigate negative impacts on certain states. Payments would ramp up to incentivise ship owners to adopt low GHG technologies. Cable ships are a very small percentage of the global merchant shipping fleet and are not shown as a separate category in IMO publications on GHG emissions. It is therefore unlikely they would be exempt from IMO charges. The IMO met again in October 2025 to ratify the agreement and start work on the details, but three petro-states used aggressive tactics to block the NZF, and a decision was deferred until the upcoming October 2026 meeting [4], leaving the timetable for implementation of NZF uncertain.
This is bad news for the cable industry. While some ‘ordinary’ merchant ships have 25-year lives, cable ships are routinely exceeding design lives of 25 years [5]. The IMO plan was to complete the transition of the marine industry to net zero by 2050 but it now seems likely this will be pushed back. Cable ships on the drawing board now will probably still be in service by 2050 so designers have a dilemma – what engine technology should they use if their ships are not to be obsolete before their design life has expired? And for more nascent areas of ship development where vessel types still lack names, such as with river cable systems, in what direction should engineers start off?
IMO rules and their effects are not the only uncertainty facing ship designers. There are several possible engine technologies that could replace heavy fuel oil and diesel, and which ones will prevail is not clear. These are the main criteria designers must consider when weighing up the design options:
• Total lifetime cost of the ship,
• Lifetime fuel usage and GHG emissions,
• Availability of the selected fuel in the ships’ theatres of operation,
• Safety,
• Maintenance and availability of spare parts,
• Crewing levels, skills and training required.
These criteria are not only financial. There are also environmental and political factors that come into play, so ship designers’ lives are not easy [6]. There may, however, be opportunities for the cable industry to develop and test new technologies in partnership with adjacent sectors. For example, plans for offshore wind farms in the shallow waters between Fortaleza and São Luís, Brazil, could provide a proving ground for new designs of cable vessels. The shallow depths of both the wind farm sites and the trunk routes of nearby submarine cables suggest that fuel consumption — and therefore emissions — for these operations could be significantly lower than for deep-water work, creating economic incentives for emerging companies in this space.
We will now look at the most promising alternative power options for future cable ships. In considering the factors listed above, we also need to understand the sources of the fuels we select and whether they are truly ‘green.’ For example, hydrogen is considered a ‘green’ fuel, as it only produces water vapour when used, but it is not green if it is made from oil [7]. In measuring the climate impact of conventional fuels, the most common metric is ‘Well-to-Wake’ emissions. This means not only measuring the GHG emissions from burning the fuel but also adding in the pollution caused by extraction, transport, storage, engine efficiency and other processes. Similar rigorous metrics are needed when assessing alternative fuels for cable vessels, both for transoceanic and emerging subfluvial systems [8].
There are two key quantitative parameters that must be considered when assessing marine fuels: Energy density by mass (MED) and energy density by volume (VED). Major marine fuel types are shown in Table 1, and we will use HFO as our
Table 1. Comparisons of Marine Fuels (Source: Google AI from 15 Sources)
benchmark as this is the most common fuel today. The move away from HFO will inevitably have major implications for ship design. For example, some fuels will need larger tanks, some will need specialist handling equipment, and these factors will significantly affect ship design. Additionally, some may require radical changes in crew training [9].
It can be seen from Table 1 that fuel choices, even based on mass and volume criteria, are not obvious. Other factors will also affect the direction of travel for the cable industry, so the next section looks at our choices in a bit more detail [9].
LIQUEFIED NATURAL GAS (LNG)
LNG is readily available and has lower emissions than HFO. Extensive production, storage, transport infrastructure and bunkering already exists. It liquefies at -161oC (at atmospheric pressure) so must be stored under pressure and be used with specialised handling equipment. Its MED is higher than HFO, but its lower VED requires larger fuel tanks [10].
Some
LNG can be made from sustainable biological sources, such as agricultural waste. This is currently around 2% of the worldwide LNG market but growing rapidly [11].
LNG is a hydrocarbon containing mostly methane, so emits GHG when it is burnt. Methane is a powerful GHG, the leakage of which adds to global warming – more even than carbon dioxide.
LNG is seen as a transition fuel – better than fuel oil but not GHG free. It is uncertain if bio-LNG production can ramp up to meet global demand without impacting food production [12, 13, 14].
METHANOL
This is a readily available fuel, which boils at 64oC so it is easy to handle. It is miscible in water so the risk from spills is low. It is however toxic and flammable. Some bunkering exists today and some diesel engines can be modified to run on methanol. Methanol’s MED and
are significantly lower
than HFO so larger fuel tanks would be needed, and a greater mass of fuel would need to be carried for a given operation [12, 13, 14].
AMMONIA
Ammonia liquefies at -33oC, an improvement from LNG. However, its toxicity and corrosive nature require specialised storage and handling equipment. It is widely produced but not currently using green technology. It is not yet used extensively in marine applications, so bunkering is limited [12, 13, 14].
Its MED and VED are poor so significant changes to ship design would be needed.
HYDROGEN
The boiling point of hydrogen is -253oC at (atmospheric pressure) so it requires high-pressure cryogenic storage and handling. It can be used as a fuel in internal combustion engines or in fuel cells to provide electrical energy and does not produce GHG. It can be made as a zero-carbon fuel, by electrolysis using electricity from wind farms, for example, but today it is mostly be made using fossil fuels, so the source needs to be established before claiming GHG savings [12, 13, 14].
Hydrogen has a very high MED but a very low VED, so large tanks would need to be included in future ship designs. The tanks would need to be specifically designed to store cryogenic, high-pressure hydrogen.
BATTERY-POWERED SHIPS
Battery technology is developing rapidly, and several working battery-powered ships are in service today. These are mostly short-distance container ships such as ferries, tugboats and other smaller vessels. Electric ships are more expensive to build but have lower life-time fuel and maintenance costs. They may be recharged (from green sources) during port calls or use battery swaps, particularly for batteries that are containerised. However, batteries currently have a poor MED and VED so are confined to specialist applications [14,15]. Hybrid ships are being developed which mostly use battery power but
also have the capability to use other fuels to extend their range.
So far, the Sustainable Subsea Networks team has studied transoceanic systems. We also see that innovation for the maintenance of subfluvial cables is just beginning, growing into another area of development in the coming years. There are other systems, such as coastal festoon and river systems where battery-powered ships may be useful for installation and repair work. River environments and the ships that navigate them are different from ocean counterparts, not to mention the role of cable ships and the practices of design, surveying, laying, operation and maintenance. One successful example is the Inova project in Brazil, where a 12,000-kilometre fibre optic network is being installed to link 58 cities in the highly sensitive Amazon River ecosystem [16]. The logistics of battery charging, or swaps, for electric cable ships would be a challenge, but not insurmountable, for systems with short links.
We do not currently see battery propulsion as a major contributor to decarbonising the cable ship fleet used for transoceanic cables, but it will certainly have applications in some areas, such as systems with short links, inshore survey vessels, tugboats and other scenarios. Shore power, if generated from green sources, should always be used when
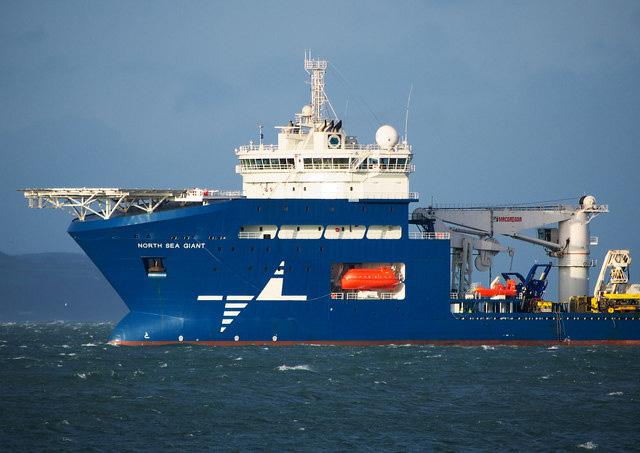
Figure 2. The North Sea Giant in Bangor Bay, Northern Ireland, a diesel electric cable ship with battery power. Source: Wikimedia Commons.
cable ships are in port.
URANIUM 235
Uranium 235 would be a strong fuel choice for cable ships. It is currently used on some military ships and Russian ice breakers, so its technical feasibility is proven. Uranium’s very high MED means vessels would only need refuelling every 10 – 20 years. However, the political, safety and training issues of uranium are significant barriers to its adoption for nuclear-fuelled civilian fleets. Small modular reactors are being developed, but these are not likely to be available for at least another decade [17].
DIESEL ELECTRIC PROPULSION
Diesel electric propulsion is a current tech-
nology but can offer substantial cost, fuel and GHG reductions. Diesel electric engines burn fossil fuels, and contribute to GHG emissions unless biodiesel is used, so this should be considered as an interim option until we have vessels with net zero emissions for cable operations.
COAL
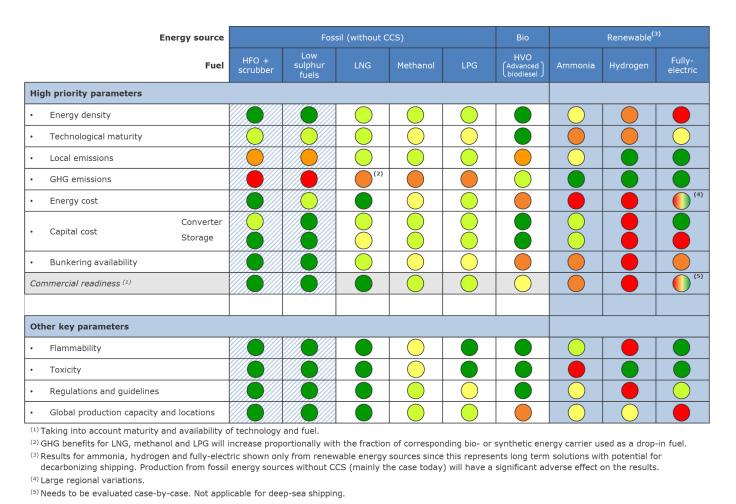
Coal was a very important marine fuel from the mid19th century to the mid-20th century and is included here as a historic footnote. Being almost pure carbon, it is a very high emitter of GHG and other unpleasant pollutants. It has poor MED and VED and, as a solid, is difficult to handle. This leaves it as a poor contender for an alternative cable ship fuel. The chart below is marine assurance and risk management firm DNV’s interpretation of results and evaluation of status of viability for different alternative fuels (internally rated with five colours), within selected assessment parameters (i.e. potential barriers). 2020 compliant conventional fuels have also been included for reference and for these the given
Figure 4. DNV GL’s interpretation of results and evaluation of status of viability for different alternative fuels from DNV “Comparison of Alternative Marine Fuels.” Source: DNV 2019.
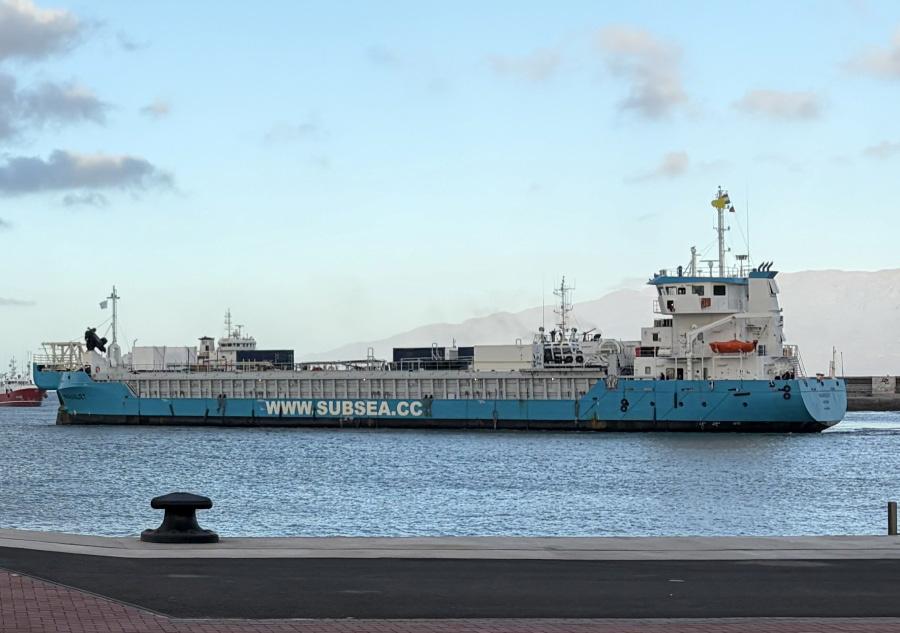
Figure 3. MV Maasvliet, a cable recovery ship launched in February 2025 powered by a diesel-electric engine. Source: Simon Appleby, Subsea Environmental Services.
colour is based on a simplified assessment by DNV [18].
THE WAY FORWARD
Today, the way forward for ships used in the cable industry is currently unclear. We will need to move to fuel or fuels that are likely to be widely available throughout the lifetime of our ships. The delay in the IMO NZF process is damaging for both our industry and the wider marine community because uncertainty usually causes additional cost and avoidable time delays. Hopefully, this will be resolved at the October 2026 IMO meeting, and the way forward can be planned.
On the optimistic side, both the marine and cable industries historically take change and uncertainty in their stride. The marine industry has changed many times – from canoes to sailing ships, then to coal-fired steam ships and, most recently, to modern fossil fuels like LNG. They have also adapted to different cargoes and commercial demands. It is now certain that fuels such as HFO will be phased out though their replacement and timescales are uncertain. Despite the delays at the IMO, the marine industry is already moving towards net-zero, albeit it that some of these moves are experimental [19]. We need to keep up with these developments so we can design our new ships, and perhaps modify existing ones to be consistent with the direction (or directions) of travel adopted by the main-stream marine industry. Additionally, we need to monitor developments in IMO.
During the early 1980s the change from copper cables to fibre optics (and simultaneously from analogue to digital) was inevitable but we, in the submarine cable industry, had little idea what changes would be needed to ship design, and the many other aspects of our industry, to complete the transition successfully. By 1988, thanks to the concerted efforts of many talented people, the first transatlantic fibre-optic systems [20,21] were installed and coaxial cables, like telegraph cables before them, were consigned to a bygone era.
Today, we stand on the edge of another threshold. The transition to net-zero is inevitable and will be driven by customer demand, political and financial forces. In the submarine cable industry, we will need follow the developments in the wider marine industry, so we can fuel our ships easily and economically. We must also keep up to date with development in technology, for example: new fuels, batteries etc. but we remain confident the submarine cable industry can overcome the new challenges we now face.
This article is an output from a SubOptic Foundation project, Sustainable Subsea Networks, funded by the Internet Society Foundation.
WORKS CITED
[1] Soltani Motlagh, H. R., Issa Zadeh, S. B., & Garay-Rondero, C. L. (2023). “Towards International Maritime Organization carbon targets: A multi-criteria decision-making analysis for sustainable container shipping.” Sustainability, 15(24), 16834. https://doi.org/10.3390/ su152416834
[2] International Maritime Organization. IMO and the environment. Retrieved April 6, 2026, from https://wwwcdn.imo.org/localresources/en/OurWork/Environment/Documents/ IMO%20and%20the%20Environment%202011.pdf
[3] International Maritime Organization. Fourth Greenhouse Gas Study 2020. (2020).
[4] Seas at Risk. A year’s delay for shipping’s decarbonisation: What happened at the IMO. (31 Oct. 2025). Retrieved April 6, 2026, from www.seas-at-risk.org
[5] Global Marine. C.S. Sovereign. Retrieved April 6, 2026, from https:// globalmarine.co.uk/vessels-trenching-assetts/cs-sovereign
[6] Bourgeon, C. (2023). IMO action on reducing GHG emissions from international shipping. International Maritime Organization.
[7] Bhuiyan, M., Siddique, Z. (2025). Hydrogen as an alternative fuel: A comprehensive review of challenges and opportunities in production, storage, and transportation. International Journal of Hydrogen Energy, Vol. 10, 2025. https://doi.org/10.1016/j. ijhydene.2025.01.033
[8] Ultrabulk. Understanding well-to-wake emissions in maritime transport. (2024, March 1). Retrieved April 6, 2026, from https://ultrabulk.com/understanding-well-to-wake-emissions/
[9] Center for Resource Solutions. Clean fuels in the maritime shipping sector. (2024). Retrieved April 6, 2026, from https://re-
[10] Rivera, V., Adaku, A., Harris, O. Evaluation of LNG technologies. (2008). University of Oklahoma.
[11] Grand View Research. Bio-LNG market size, share & trends analysis report, 2024–2030. (2024). Retrieved April 6, 2026, from www. grandviewresearch.com
[12] World Biogas Association. Making bio-LNG happen by 2030. (2026, February 12).
[13] Methanol Institute. Methanol Production. Retrieved April 6, 2026, from https://methanol.org/wp-content/uploads/2016/06/MI-Combined-Slide-Deck-MDC-SlidesRevised-PDF
[14] Pawelec, G. Comparative report on alternative fuels for ship propulsion. (2020). Interreg EU.
[15] The Liquid Grid. All-electric and hybrid ships. Retrieved April 6, 2026, from theliquidgrid.com/maritime-decarbonization/electric-ships/ [16] RNP. Optical Cable Is Laid in the Bed of the Amazon River. In The Field. (2022, March). Retrieved April 6, 2026, from www.inthefieldstories.net/optical-cable-is-laid-in-the-bed-of-the-amazon-river
[17] Tsvetkov, P. Nuclear power-deployment operation and sustainability. (2011). InTech.
[18] Anders Ryste, J. Comparison of alternative marine fuels. (2019). DNV-GL. Retrieved April 8, 2026, from https://sea-lng.org/ wp-content/uploads/2020/04/Alternative-Marine-Fuels-Study_final_report_25.09.19.pdf
[19] European Commission CORDIS. Strategic research for innovative marine propulsion concepts. (2024). Retrieved April 8, 2026, from https://cordis.europa.eu/project/id/233896/reporting
[20] Easton, R., L. “TAT-8: The First Transatlantic Optical System,” Fiber Optics Reliability: Benign and Adverse Environments III. (1989). SPIE, Vol. 1174. https://doi.org/10.1117/12.963235
[21] Wikimedia Foundation. TAT-8. Retrieved April 8, 2026, from en.wikipedia.org/wiki/TAT-8
David Howard is a Chartered Electrical Engineer with a career spanning the evolution from coaxial to fiber optic submarine cables. He served as Project Director for early systems including PTAT 1 and NPC, later worked with Cable & Wireless and MCI, and led his own consultancy supporting offshore oil and gas fiber systems. He is now retired and contributes to Sustainable Subsea Networks.
René d’Avezac de Moran is Telco Group COO at OMS Group, overseeing telecom operations. He previously led global subsea cable services development at Fugro, including desktop studies and route surveys, and spent 25 years across offshore positioning and hydrographic services. He is an active member of SubOptic and ICPC communities.
Derek Cassidy is doing a part-time PhD in the field of Optical Engineering and a second one on Submarine Cable Technology with UCD. He is a Chartered Engineer with the IET/UK Engineering Council & Engineers Ireland and Past-Chair and current Committee Member of IET Ireland. He is Chair of the Irish Communications Research Group and Advisory Board Member of Submarine Networks EMEA/World.
WELCOMING CAROLINE CROWLEY AS THE NEW EDITOR OF THE SUSTAINABLE SUBSEA COLUMN
by Federica Tortorella and Nicole Starosielski
Sustainable Subsea Networks (SSN) is pleased to announce that Caroline Crowley will serve as the new editor of the “Sustainable Subsea” column in Submarine Telecoms Forum, a leading source of news, analysis, and market intelligence for the global submarine cable industry.
Sustainable Subsea Networks is a research initiative initially supported by the SubOptic Foundation and funded by the Internet Society Foundation. Today, SubOptic’s Sustainable Subsea Network Working Group brings together industry members from across the value chain with sustainability experts and academic researchers to assess and enhance the sustainability of the global subsea system, a network of fiber optic cables that carries nearly 99% of transoceanic internet traffic.
“Sustainable Subsea” has been published bi-monthly since January of 2022. This month’s article, shepherded into production by Crowley, will be the column’s 27th release.
“Sustainable Subsea” is the longest running, and todate, still the only regular source of news on subsea cable sustainability. Articles range from the coverage of Sustainable Subsea Networks researchers, to the latest subsea cable industry developments, to reviews of conferences by newcomers, and interviews with industry experts. Across these articles, authors have highlighted an array of perspectives on and challenges to enhancing subsea cable sustainability.
Crowley joins the SSN team as an undergraduate student at the University of California, Berkeley, where she is pursuing a degree in Environmental Economics and Policy. As a former member of the SubOptic Sustainable Subsea Networks research team, she is currently developing a thesis on the environmental and economic dimensions of digital infrastructure, including the policy frameworks that shape their development and impact.
cole Starosielski had informally served as the column editor. Formalizing this role as a rotating editorship will enable researchers and industry members alike to participate in new and more active ways. Topics are developed by SubOptic’s Sustainable Subsea Networks Working Group. Crowley will work closely with industry members to bring the complexity of sustainability to SubTel’s readers as well as to translate these to a broader audience.
The first article under Crowley’s editorship is authored by David Howard, René d’Avezac de Moran, and Derek Cassidy and featured in this issue of SubTel Forum. It focused on the marine aspects of subsea cables’ carbon budgets and the most promising alternative power options for future cable ships.
As subsea cables continue to play a central role in enabling global communication, initiatives such SubOptic’s SSN Working Group can help companies to assess, document, and collaborate on sustainability.
We are delighted to welcome Caroline Crowley to this role and look forward to her contributions to “Sustainable Subsea.”
Caroline Crowley is an undergraduate at the University of California, Berkeley studying Environmental Economics and Policy and Data Science. Alongside experience in utilities, nonprofits, and federal agencies, she served as a research assistant to the SubOptic Foundation’s Sustainable Subsea Networks team, now moving towards a career in energy and infrastructure finance. Her research and upcoming thesis analyze the policies regulating the environmental and economic impact of data centers and other digital infrastructure.
For the past four years, UC Berkeley Professor Ni-
A FLEET REGAINS DEFINITION
by Kieran Clark
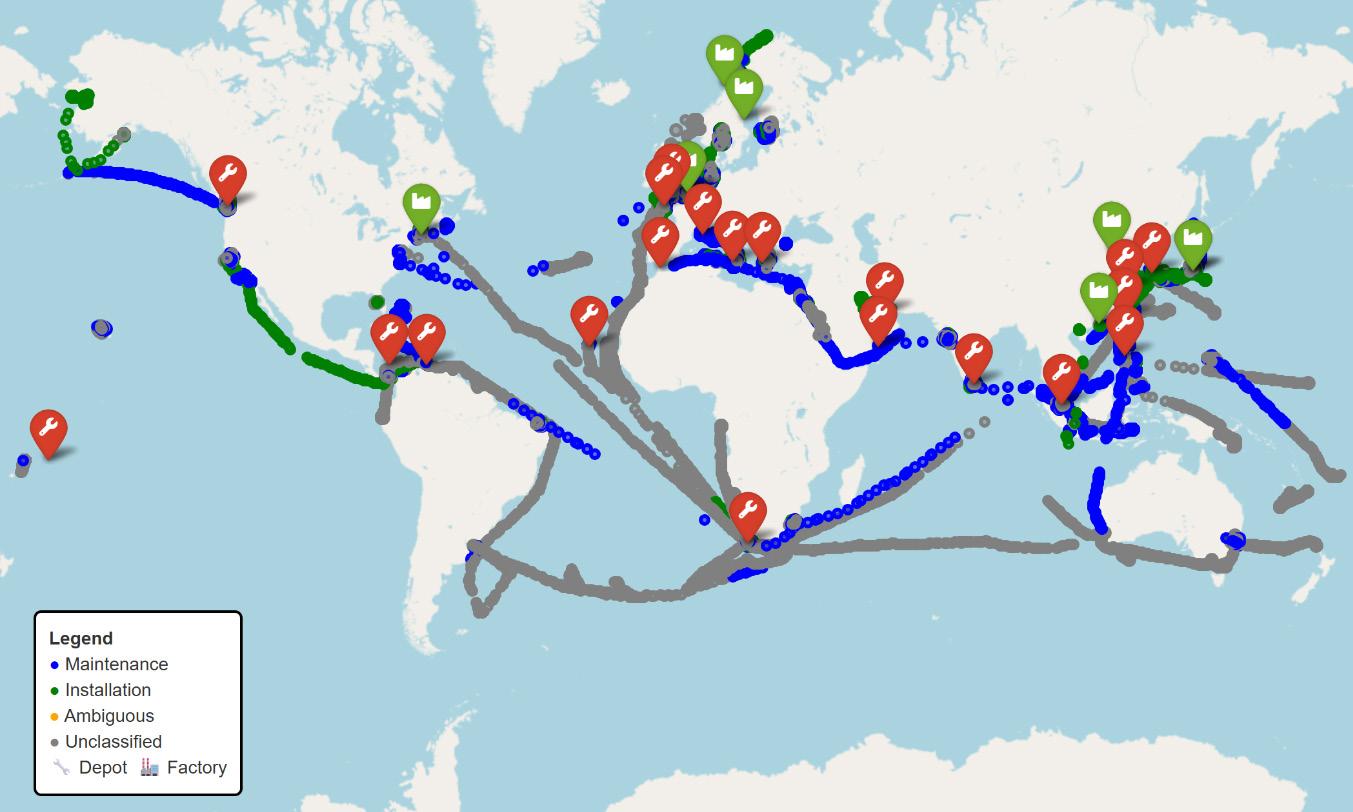
At the start of 2026, the global cable-ship fleet appeared busy but analytically indistinct. Vessels continued to move through the world’s main cable basins, but many of their pauses occurred away from clear operational anchors. Maintenance corridors remained visible, and factory-linked activity still appeared in places, but the fleet’s overall behavior was harder to classify than it had been during the closing months of 2025.
March and April present a clearer picture. The fleet remains widely distributed, but vessel behavior is more strongly tied to the infrastructure that normally defines cable work. Maintenance activity again forms the dominant rhythm of the fleet, while installation signals become more visible around factory-linked regions. Unclassified behavior remains present, but it no longer overwhelms the dataset.
The result is a spring operating pattern that looks more structured than the one seen in January and February. Ships are still moving across the same global basins, but their pauses now align more often with depots, factories, and recognizable cable corridors. The fleet appears less transitional and more firmly connected to identifiable operational roles.
FLEET ACTIVITY AT A GLOBAL SCALE
Viewed at a global scale, the March-April activity map shows a fleet operating across all of the familiar regions of the subsea cable network. Activity remains concentrated around the North Atlantic, Western Europe, the Mediterranean, the Indian Ocean, East Asia, Southeast Asia, and the Pacific approaches. Compared with the opening months of the year, the pattern is more coherent. Vessel pauses are still geographically broad, but they cluster more consistently around known corridors and support locations.
Across the North Atlantic and adjacent European waters, maintenance-linked behavior traces routes that connect North America, Western Europe, and the Mediterranean. These are some of the most mature and heavily used cable regions in the world, and the vessel pattern reflects that operational density. Instead of appearing as scattered pauses across a broad transit corridor, many idle points sit closer to the infrastructure framework that supports repair readiness.
East and Southeast Asia remain among the most active regions on the map. Dense cable infrastructure, a concentration of landing points, and proximity to factories create overlapping signals of maintenance and installation activity. The spring map shows a more legible blend of those roles than the early-year dataset, with installation-linked points appearing near factory-associated regions while maintenance-linked pauses continue to follow established routes through Japan, China, the South China Sea, and surrounding waters.
Figure 1: Vessel Activity Map (Mar-Apr 2026)
The Indian Ocean and waters around southern Africa also stand out as connective regions. Activity there links the Atlantic, Mediterranean, Middle East, and Asian basins, reinforcing the importance of these waters as both transit corridors and operational staging areas. Taken together, the global map suggests a fleet that is not merely repositioning between assignments, but interacting with the subsea network in more recognizable ways.
THE ACTIVITY MIX REBALANCES
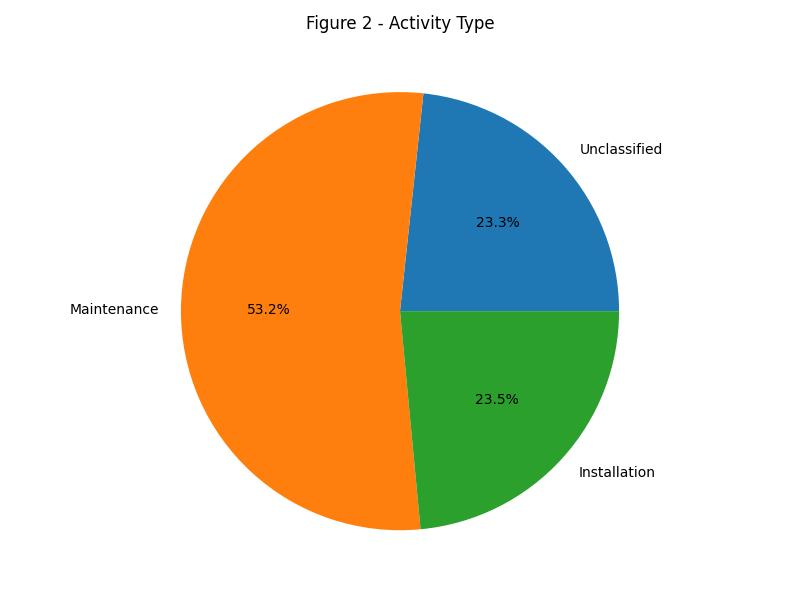
The activity breakdown marks the clearest shift from the January-February pattern. Maintenance accounts for 53.2% of idle observations, installation accounts for 23.5%, and unclassified behavior accounts for 23.3%. In raw terms, the dataset includes 2,300 maintenance points, 1,016 installation points, and 1,007 unclassified points, out of 4,323 total idle observations.
This distribution changes the interpretation of the fleet. Earlier in the year, the largest signal was uncertainty itself: vessels were active, but the surrounding context often did not support a confident operational classification. In March and April, classified activity becomes the majority of the dataset. The fleet is still geographically dispersed, but its pauses are more often tied to recognizable maintenance and installation settings.
Maintenance remains the dominant category. That is consistent with the structure of the cable industry, where repair readiness is a constant requirement regardless of the installation cycle. Cable ships must remain positioned to respond to faults across large regions, and that readiness naturally produces recurring idle behavior near depots, repair corridors, and strategic transit points.
Installation activity also becomes more visible. While it does not dominate the total, its share is strong enough to suggest a more active project environment than the one visible during the early-year period. Installation-linked behavior appears less like a set of isolated factory-adjacent pauses and more like a defined component of the fleet’s spring work-
INFRASTRUCTURE CONTEXT
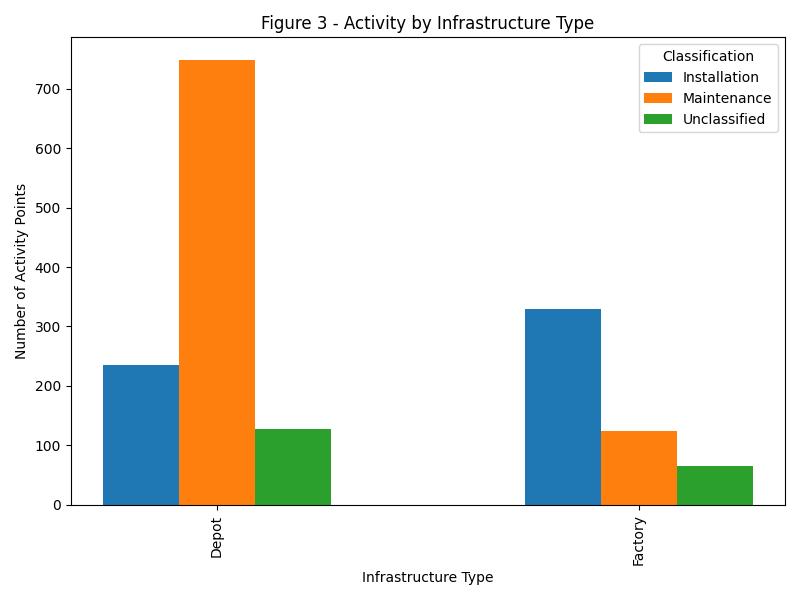
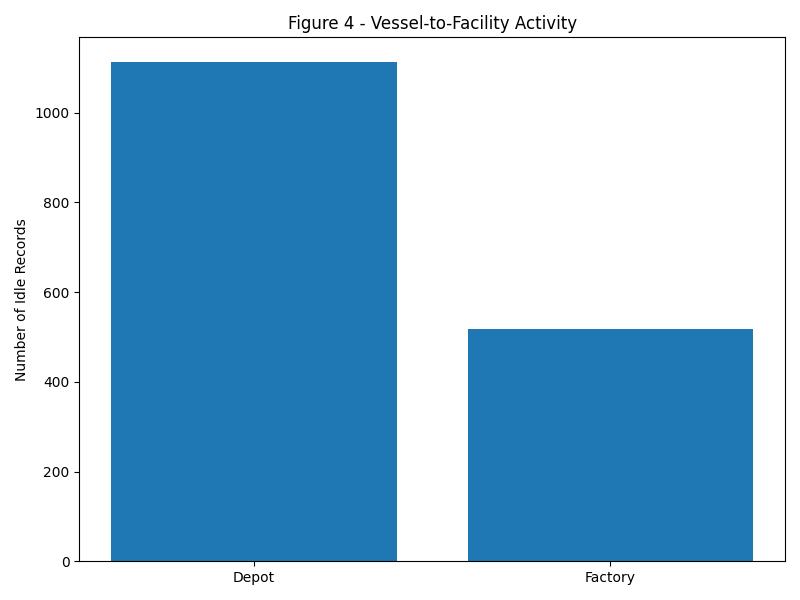
Breaking the activity down by infrastructure type clarifies how different facilities shape vessel behavior. Depots continue to serve as the main anchors for maintenance activity. Around depot-linked areas, maintenance remains the largest category by a wide margin, reflecting the role these facilities play in spare cable storage, crew movement, provisioning, repair preparation, and standby response.
The depot pattern is especially clear in the classification data. Depot-linked activity includes 749 maintenance points, compared with 235 installation points and 128 unclassified points. This confirms that depot proximity remains strongly associated with repair readiness and operational support rather than new system deployment.
Factory-linked activity shows a different profile. Near factories, installation becomes the leading classification, reflecting the role these sites play in cable loading and project mobilization. Vessels do not interact with factories as continuously as they do with depots, but when they do, those interactions are more likely to be associated with installation campaigns.
Factory-linked activity includes 329 installation points, compared with 124 maintenance points and 65 unclassified points. The contrast with depot behavior is important. Depots support the daily operating rhythm of the repair fleet, while factories mark more specific project phases tied to cable produc-
Figure 2: Activity Type (Mar-April 2026)
tion, loading, and deployment.
ASK THE EXPERT
Question for the author(s)? Click here!
Unclassified behavior remains present near both infrastructure types, which is expected. Not every pause near a depot or factory represents a clear operational phase. Some may reflect short transits, waiting periods, port approaches, crew or supply movements, or behavior that does not meet the thresholds used for classification. Even so, the underlying relationship is clear: depots pull the dataset toward maintenance, while factories pull it toward installation.
FACILITY ANCHORS IN FLEET BEHAVIOR
Looking directly at vessel proximity to facilities reinforces the same pattern. During March and April, depot-linked idle activity totaled 1,112 records, while factory-linked idle activity totaled 518 records. Vessels were therefore more than twice as likely to idle in depot-linked areas as in factory-linked areas.
This imbalance reflects the basic operating structure of the cable fleet. Depots are recurring anchors. Ships return to them for spares, supplies, crew coordination, repairs, and standby positioning. These interactions generate steady background ac-
tivity even when no major new installation program is visible.
Factories play a narrower but highly important role. They are not general-purpose return points for the fleet in the same way depots are. Instead, they are tied to specific installation cycles, when vessels load cable and prepare for deployment. As a result, factory-linked activity tends to rise around project phases and then recede once vessels depart for the route.
The March-April dataset shows both dynamics at work. Depot activity continues to define the underlying maintenance posture of the fleet, while factory activity confirms that installation work is again a meaningful part of the operating picture. The fleet is not installation-dominated, but it is no longer defined mainly by weakly signaled or difficult-to-classify movement.
A FLEET RETURNING TO OPERATIONAL FORM
Compared with January and February, the MarchApril period shows a cable-ship fleet whose movements are easier to interpret and more closely tied to recognizable operational roles. Maintenance and installation together account for most idle behavior, and the relationship between vessel activity and infrastructure is much more distinct.
This does not necessarily mean that the fleet is dramatically busier overall. Rather, it suggests that the character of activity has changed. Ships are spending less time in transitional or weakly signaled states and more time in locations that align with repair readiness, project staging, and identifiable cable corridors.
Maintenance remains the baseline condition of the fleet, supported by repeated interactions with depots and established repair regions. Installation activity, meanwhile, has become more visible around factory-linked areas and along routes associated with deployment. Together, those patterns point to a fleet that has regained operational definition after a less certain start to the year.
Figure 3: Activity by Infrastructure Type (Mar-Apr 2026)
AIS data will always require caution. Vessel movement alone cannot capture every operational decision, and some pauses will remain difficult to classify without direct project information. But the March-April pattern is coherent. The global cable-ship fleet appears active, structured, and more
clearly aligned with the infrastructure that supports both repair readiness and new cable deployment.
Kieran Clark is Senior Analyst at Submarine Telecoms Forum, Inc. He joined in 2013 as a Broadcast Technician supporting live event streaming, bringing over eight years of production experience. Promoted to Analyst in 2014, he now leads research and maintenance for the SubTel Forum Submarine Cable Database and Online Map, with analysis featured across most SubTel Forum publications.
THE ROAD LESS ROUTED: WHY DIVERSITY IS THE NEW RESILIENCE
by Anup Gupta & John Manock
Robert Frost once wrote: “Two roads diverged in a wood, and I — I took the one less travelled by, and that has made all the difference.”
For decades, the submarine cable industry took the road most travelled — the tried, the tested, the familiar. The routes were known. The chokepoints were accepted. And the industry, largely, slept well at night. That comfort, it turns out, was a vulnerability in disguise.
The internet has always been a living organism — evolving, expanding, and occasionally, breaking. But somewhere along the way, the decision-makers who designed its physical backbone — the submarine cables that carry over 99% of the world’s international data — made a quiet, collective bet. The bet was on speed. On latency. On the shortest path between two points. It was a reasonable bet for a reasonable time. What it was not, was a complete bet. Because latency only matters on networks that are alive or as they say in Submarine Cables - Up. And in a world of chokepoints, geopolitical turbulence, and deliberate sabotage, the question of whether a network is up has become far more urgent than how fast it is.
THE LATENCY OBSESSION — A NOBLE BUT INCOMPLETE MISSION
The fixation on latency has driven some of the most impressive engineering achievements in submarine cable history. Cables were designed with great-circle routes in mind. Amplifier spacing was optimized. Modulation schemes were pushed to the limits of physics. The industry raced to shave milliseconds off the Asia-Europe corridor, and the results were genuinely remarkable.
But the conversation around performance quietly crowded out the conversation around resilience. Network operators and their customers celebrated low-latency paths with justifiable pride, while the physical geography of those paths — the shallow straits, the politically contested seabeds, the nar-
row shipping lanes — remained a persistent, unaddressed risk. The logic went something like this: “my network is fast, my country is stable, and therefore I am fine.” This is precisely the kind of reasoning that leaves entire regions dark.
The problem is that submarine cables do not respect borders. For Example - A cable built to connect Asia to Europe does not begin and end in stable waters. It transits coastlines, straits, and seabeds that may be thousands of kilometers away from the operator’s home country — and entirely outside their political or regulatory control. When something goes wrong in one of those transit zones, the consequences travel at the speed of disruption, not diplomacy.
WHAT HAS CHANGED — THE CONTEXT SHIFT
It would be too simple to say the industry got it wrong. For most of the internet’s commercial history, the assumptions that underpinned the latency-first approach were reasonable ones. Geopolitical risk was present but manageable. Repair vessels operated in predictable cycles. Digital infrastructure, while important, had not yet crossed the threshold into being considered strategic national assets. And data demand, while growing, was growing on timelines that planning cycles could absorb.
What has changed is not just the technology. It’s the context.
We are now operating in an environment where geopolitical risk is more visible — and far less predictable. Where repair and maintenance assumptions that the industry once took for granted are no longer guaranteed. Where digital infrastructure is increasingly seen as strategic and therefore exposed. And where demand growth, driven by AI and cloud workloads, is outpacing the traditional planning cycles that networks were designed around.
In that environment, optimizing for the shortest path starts to look incomplete. Because the shortest path is also, very often, the most crowded. And the most exposed.
CHOKEPOINTS — THE FRAGILITY HIDDEN IN PLAIN SIGHT
The Red Sea is perhaps the most vivid illustration of this fragility. In February 2024, cable cuts affected four major systems — Seacom, TGN, AAE-1, and EIG — with initial reports suggesting 25% of Europe-Asia traffic was disrupted. The actual figure, according to network diagnostics from RETN, was closer to 70%. That discrepancy alone should prompt a rethinking of how the industry communicates, measures, and prepares for disruption.
The Red Sea did not stop there. In September 2025, cables SMW4 and IMEWE were severed near Jeddah, triggering internet disruptions across India, Pakistan, and the UAE. Microsoft Azure users reported elevated latency until rerouting stabilized — a reminder that even hyperscalers, with their formidable redundancy, are not immune to physical infrastructure failures. The repair timeline? Weeks to months — in a conflict zone where vessels are reluctant to operate.
tightened approval requirements for building and maintaining submarine cables within its nine-dash line claim. In April 2024, a Vietnamese cable-repair crew operating within Hanoi’s exclusive economic zone was confronted by Chinese coast guard vessels — raising costs, delaying repairs, and signaling to the industry that access to critical infrastructure cannot be guaranteed in contested waters.
DIGITAL INFRASTRUCTURE UNDER FIRE — THE MIDDLE EAST DIMENSION
“Submarine cable resilience is no longer just an engineering challenge — in an era of chokepoints, geopolitical friction, and AI-driven demand, route diversity has become a strategic necessity.”
This is the brutal arithmetic of chokepoints. You can engineer the finest network in the world, and one anchor drag, one vessel operating under suspicious circumstances, one act of deliberate sabotage in a narrow strait, and your traffic is rerouted into a bottleneck that was never designed to carry it. Between 2024 and mid-2025, submarine cable damage events numbered 44 across 32 locations globally, with a significant portion attributed to vessels linked to state actors. This is no longer a question of engineering probability. It is a question of geopolitical reality.
THE SOUTH CHINA SEA — A DIFFERENT KIND OF RISK
If the Red Sea illustrates physical vulnerability, the South China Sea illustrates regulatory and political vulnerability — a risk that is slower to manifest but no less consequential. China has progressively
The ongoing conflict in the Middle East has added a dimension to infrastructure vulnerability that the industry cannot afford to underestimate. Beyond the Red Sea cable incidents, the broader conflict has placed digital infrastructure itself in the crosshairs. Communications towers, data centers, and terrestrial fiber assets in conflict zones have been damaged or destroyed, and the fear of deliberate targeting of submarine cable landing stations has moved from theoretical to operationally relevant.
This is a fundamental shift. For much of the internet’s history, submarine cables were treated as neutral, civilian infrastructure — beneath the threshold of deliberate military or political targeting. That assumption no longer holds. Landing stations, which represent the points where submarine cables come ashore and connect to terrestrial networks, are concentrated, identifiable, and — in conflict zones — exposed. The call for diversity is therefore not merely a commercial or operational argument. It is a security imperative.
TRUE DIVERSITY — NOT DIFFERENT ON PAPER, INDEPENDENT IN REALITY
This is where the idea of true diversity starts to take shape. Not as an abstract principle, but as a practical requirement.
It means building routes that are not just different
on paper, but independent in reality. Different seas. Different landing ecosystems. Different geopolitical exposures. It means accepting that the commercially obvious route may not always be the strategically correct one.
There is a tendency in mature industries to keep refining what already exists — to make incremental improvements, to optimize within known boundaries. And for a long time, that approach served subsea networks well. But the current moment feels different. Not because the fundamentals of submarine cable engineering have changed, but because the constraints have become undeniably clearer. The risk is no longer hypothetical. It has a name, a date, and a damage report.
Building along less established paths comes with real challenges. The ecosystems are not always mature. The traffic assumptions require conviction rather than precedent. The commercial models can take longer to validate. But these are not new problems — they are the same ones the industry solved when it first began connecting regions that had no existing infrastructure at all. The difference now is that we are not building from absence. We are building away from dependence.
THE NEW GEOGRAPHY OF CONNECTIVITY — SOUTH-SOUTH AND ROUTE-DIVERSE NETWORKS
The industry is already responding, and the response is architecturally significant. A new generation of cables is being built — not along the old corridors, but around them.
Project Waterworth, announced by Meta in February 2025, is the world’s longest planned submarine cable at over 50,000 km, connecting five continents. It is designed to maximize deep-water routing at up to 7,000 meters to avoid the shallow-water vulnerability that makes cables susceptible to anchor damage and human interference. This is not incremental improvement. This is a reimagining of the routing philosophy itself.
Umoja, the Google-backed cable system, connects
Africa to the rest of the world through a new overland-subsea hybrid route — running through Africa before transitioning to a subsea system reaching Australia. It deliberately bypasses traditional chokepoints and builds a new South-South corridor that strengthens African connectivity while reducing dependence on legacy routes through contested straits.
SEACOM 2.0, announced in late 2025, targets a design capacity of 2,000 Tbit/s across 25,000 km, going live in 2029–2030. Its architects are openly positioning it to meet the coming surge in AI-driven data demand — demand that will require not just more capacity, but capacity that can be trusted to remain available.
These are not isolated projects. They represent a coherent, industry-wide shift in how connectivity is being architected for the next decade. New cables, new routes, new resilience — this is the emerging paradigm.
THE APTELECOM PERSPECTIVE — FROM SHORTEST PATH TO MOST RELIABLE NETWORK
At APTelecom, this is a conversation we are increasingly part of — not at a theoretical level, but in the structuring of real projects. We see it in how governments are rethinking their connectivity priorities: nations that once asked only “how fast?” are now asking “how safe?” and “how diverse?” We see it in how operators and owners are reassessing route selection beyond immediate cost and latency metrics. And we see it in how investors are beginning to factor resilience into long-term value assessments, incorporating geopolitical risk alongside traffic projections.
“Submarine cable resilience is no longer just an engineering challenge — it has become a geopolitical, security, and strategic imperative for the future of global connectivity.”
Because ultimately, the question is shifting. From:
ASK THE EXPERT
Question for the author(s)? Click here!
“What is the best route today?” To: “What is the most reliable network over time?” The two are not always the same.
What APTelecom brings to this conversation is a combination of technical depth, market intelligence, and strategic perspective — helping clients navigate a landscape that is changing faster than traditional planning cycles can capture. Whether it is advising on route selection for a new cable system that bypasses contested corridors, structuring a business case for a diversity-first network in an emerging market, or helping a government understand the strategic value of a cable landing station as national critical infrastructure — we are in the business of enabling the road less routed.
The shortest path is measurable. The most resilient path requires judgment. That judgment is what this moment demands.
CONCLUSION — THE MILES YET TO BE LAID
Robert Frost’s traveler stood at a fork in the wood and made a choice — not because the less-traveled road looked easier, but because something about it felt right. The submarine cable industry is standing at its own fork.
On one path lies the familiar — the well-worn corridors, the established chokepoints, the assumption that things will mostly work and that disruptions will mostly be temporary. On the other lies something harder to build but far more valuable: a network architecture that embraces diversity not as a luxury but as a necessity, that treats resilience as a design principle rather than an afterthought, and that builds the routes others have not yet laid.
The world’s data is not waiting. AI demand is accelerating. Geopolitical risk is escalating. The repair fleet is stretched. And the chokepoints are not getting any wider.
The road less routed is not just the better road. In the world we now inhabit, it may be the only road that leads where we need to go.
Still building. Still routing. And still convinced that
the most important infrastructure is the infrastructure that stays up.
Anup Gupta is President for India and SAARC at APTelecom, focused on advancing subsea cables and digital infrastructure as strategic platforms for hyperscale, data center, and AI growth. He works with infrastructure owners and stakeholders across markets to position assets and unlock long term value that underpins global connectivity.
John Manock is Vice President and Head of Research at APTelecom, where he leads research initiatives supporting strategic insights across subsea cable systems and digital infrastructure markets.
6 QUESTIONS WITH BRIAN MOON AND TONY ROSSABI: TALKING SUBMARINE CABLE INDUSTRY
PTC’DC 2026 TO ADDRESS SECURITY, SOVEREIGNTY, AND THE FUTURE OF DIGITAL INFRASTRUCTURE
Artificial intelligence is accelerating infrastructure demand. Energy constraints are tightening. Geopolitical considerations are increasingly influencing how and where cables are deployed. For the global submarine cable community, 2026 is shaping up to be a year of significant transition and opportunity.
As these forces converge, PTC’DC 2026 — taking place 17 September 2026, in Reston, Virginia — will bring system owners, hyperscalers, policymakers, regulators, and investors together to address the realities shaping the world’s digital backbone.
SubTel Forum spoke with Tony Rossabi, Chairman & President of PTC, and Brian Moon, CEO of PTC, about why this year’s gathering carries particular weight — and how closer alignment across industry and government can help strengthen the resilience, security, and long-term sustainability of global connectivity.
1. At a time of rising geopolitical tension and accelerating AI demand, what is the core mission of PTC’DC 2026 — and why is this gathering essential now?
Tony Rossabi: Infrastructure decisions no longer happen in isolation. They’re shaped by policy, capital markets, energy availability, and national security considerations — often all at once.
The mission of PTC’DC is to bring those forces into the same room. System owners, hyperscalers, investors, regulators, and policymakers need direct, candid dialogue. AI-driven demand is accelerating deployment, while energy constraints and regulatory complexity are increasing. At the same time, global cable security has become a shared priority.
When leaders align across those dimensions, it creates clarity. That clarity supports smarter long-term investment and strengthens the resilience of the subsea ecosystem overall.
2. The industry calendar is more crowded than
WITH PTC’S CEO
ever. Why does PTC’DC remain a central forum for decision-makers?
Brian Moon: There are more events, but very few convene this level of senior leadership — particularly in the Washington, D.C. area. The decision to change venues this year to Reston, Virginia was intentional – to be closer to the data hub of the world.
PTC’DC isn’t about product launches or announcements. It’s about strategic direction. Policy alignment, infrastructure protection, capital deployment, and cross-border coordination are the focus. Those conversations require decision-makers, not just attendees.
There’s also continuity. Discussions that begin at our Annual Conference in Honolulu, as highlighted in PTC’26 Rewind, carry forward in PTC’DC, where the emphasis shifts toward governance and resilience. That sustained dialogue is what keeps PTC’DC central year after year.
3. As the global cable map expands, how is PTC strengthening participation from emerging markets and underrepresented regions?
Brian Moon: The subsea network is expanding rapidly, and participation in governance discussions needs to expand with it.
Emerging markets are increasingly critical as landing points and growth corridors. Yet historically, they haven’t always had equal representation in policy and standards conversations. At PTC’DC 2026, we are placing deliberate emphasis on engaging regulators, operators, and newer infrastructure stakeholders from those regions.
Inclusion isn’t symbolic — it strengthens resilience. The broader the participation shaping global frameworks, the more durable and effective those frameworks become.
4. What advancements in fault detection, cyber-physical security, and infrastructure resilience will be explored at PTC’DC 2026?
Tony Rossabi: Subsea cables are highly reliable, but the operating environment is evolving. Monitoring
CEO AND CHAIRMAN/PRESIDENT
systems are becoming more advanced. Fault detection capabilities are improving. And the integration of cyber and physical security is far more sophisticated than even a few years ago.
One of the key themes this year is integration. Physical threats and cyber vulnerabilities can no longer be treated separately. Operators and governments are moving toward a more holistic protection model.
We’re also examining coordinated response frameworks — how information is shared, how incidents are managed, and how resilience planning adapts as geopolitical conditions shift. These are practical, operational discussions with long-term implications.
5. How does the 2026 agenda reflect rising hyperscaler demand, sovereignty priorities, and increasing pressure on subsea infrastructure?
Tony Rossabi: AI workloads and hyperscaler expansion are fundamentally reshaping global infrastructure requirements. Capacity expectations are increasing at an unprecedented pace, and deployment timelines are tightening significantly. That acceleration is driving new demands around scale, resiliency, and speed to market.
At the same time, governments are placing greater emphasis on digital sovereignty, supply chain integrity, and oversight of strategic assets. Subsea infrastructure sits directly at that intersection — it is both the backbone of global connectivity and an increasingly strategic geopolitical
Brian Moon is Chief Executive Officer of the Pacific Telecommunications Council, responsible for executing its strategy, leading operations, and serving its global membership. He previously spent 15 years at the Consumer Technology Association in senior sales and business development roles and has held leadership positions with major industry associations.
Tony Rossabi is Founder and Managing Member of OCOLO, a marketplace for data centers, and also leads Aura Principal Group while chairing Beyond Data Centers. With over 25 years in technology and telecom, he has held senior roles at Recovery Point Systems, TierPoint, Digital Realty, and Telx, and serves on multiple corporate and nonprofit boards.
asset.
The 2026 agenda reflects that reality. We are creating space for meaningful dialogue around how to balance rapid digital expansion with regulatory oversight, national priorities, and long-term infrastructure resilience. Managing that balance between growth, security, and sovereignty will define infrastructure strategy for years to come.
6. Looking beyond 2026, what is PTC’s long-term vision for its role in global cable protection and policy coordination?
Brian Moon: Digital infrastructure is now recognized as strategic infrastructure. That recognition increases the need for trusted coordination.
PTC’s role is to serve as a neutral platform where industry and government can engage constructively and consistently. Looking ahead, we intend to deepen engagement around cable protection frameworks, resilience best practices, and cross-border regulatory alignment.
The pace of technological and geopolitical change will continue to accelerate. Our goal is to ensure that dialogue, trust, and collaboration accelerate with it.
WHY ATTEND?
Taking place in Reston, Virginia, the world’s largest data hub, PTC’DC convenes executives, government leaders, policymakers, investors, and innovators for focused dialogue on the forces shaping global digital infrastructure.
As artificial intelligence accelerates demand, energy constraints tighten, and geopolitical considerations increasingly influence infrastructure decisions, alignment across industry and government has become essential. PTC’DC creates a forum for these conversations, bringing together the stakeholders responsible for shaping the next phase of global connectivity.
Now in its third year, PTC’DC continues to grow as a trusted platform for advancing discussions on infrastructure resilience, security, and long-term sustainability.
WHERE INFRASTRUCTURE, POLICY, AND INVESTMENT ALIGN
PTC’DC is designed to address how policy, capital, and technology come together to shape infrastructure decisions.
Sessions focus on government challenges, fiber and regulatory issues, artificial intelligence, regulatory barriers to data centers, and energy.
Unlike broader industry events, PTC’DC offers an intimate setting that encourages candid, high-level discussion. Participants engage directly with peers across sectors, gaining practical insight into how these forces influence deployment, investment, and long-term strategy. This year, all sessions will take place on Thursday, 17 September.
A CURATED GATHERING OF DECISION-MAKERS
PTC’DC is intentionally designed as a targeted gathering of senior leaders actively shaping the future of digital infrastructure.
Attendees include subsea cable operators, hyperscalers, investors, regulators, and policymakers. This is a gathering of individuals responsible for real decisions around infrastructure investment, policy development, and network expansion.
Being in the room with this group offers a distinct opportunity. Conversations move quickly from insight to action, and access to this level of leadership creates possibilities that extend well beyond the event itself.
For government and industry leaders who may not have been able to attend PTC’s Annual Conference in Honolulu, PTC’DC provides a highly valuable opportunity to engage with the PTC community and participate in these important discussions. At the same time, it serves as a natural continuation point for those who did attend the Annual Conference, extending key conversations into a more policy-focused setting.
NETWORKING THAT MOVES CONVERSATIONS FORWARD
At its core, PTC is about fostering connection and advancing the industry through shared knowledge. PTC’DC reflects this mission by creating an environment where dialogue continues, relationships deepen, and collaboration evolves over time.
PTC MEMBERSHIP BENEFITS FOR PTC’DC
The PTC’DC Reception on Thursday, 17 September is a key occasion for attendees to connect in a more informal environment. With a highly curated group of participants, the reception offers the opportunity to continue discussions from the day’s sessions, exchange perspectives, and build relationships in a setting designed for conversation.
PTC’DC attendees also gain exclusive access to the PTC’DC Mobile App, offering a streamlined way to navigate the agenda, connect with fellow attendees, and schedule meetings in advance.
Whether reconnecting with peers or building new relationships, attendees are part of a community working collectively to strengthen global connectivity.
As a global membership organization, PTC offers its members early access to registration and exclusive member rates for PTC’DC.
Membership further enhances the experience by providing additional opportunities to connect and stay engaged in ongoing industry dialogue throughout the year.
A STRATEGIC FORUM FOR THE FUTURE OF DIGITAL INFRASTRUCTURE
PTC’DC brings together industry leaders, policymakers, and innovators for focused, high-impact discussions at a pivotal moment for global connectivity. With senior-level participation, timely topics, and meaningful opportunities to engage, it is a forum where critical ideas are exchanged and lasting connections are made.
Join us in Reston, Virginia, on 17 September 2026, to be part of the conversations shaping what comes next.
Learn more → ptc.org/ptcdc
COHERENT
PLUGGABLE TRANSPONDERS IN SUBMARINE NETWORKS: A NEW ARCHITECTURAL OPTION?
By Geoff Bennett & Sumudu Edirisinghe
In recent years, impressive improvements of pluggable coherent optics performance and data rate improvements positioned them as a viable rival to well established embedded coherent transceivers for metro and long-haul terrestrial applications.
In these applications coherent pluggable optics, that can be deployed in a variety of architec-
tures, can offer important savings in power, space, and cost for network operators. However, their use has not been widely explored in ultra-long-haul subsea cable systems, where performance-optimized embedded coherent optics continue to be the prevalent solution deployed.
As we will show here, recent field trials indicate that the performance of the latest generation of pluggable transponders has improved dramatically, and this technology could increasingly become an option in today’s
fast-moving and high demand market for submarine network capacity.
EMBEDDED VS PLUGGABLE TRANSPONDERS
Historically the form factor for a coherent transponder was determined by the transponder manufacturer and would usually be optimized for an existing platform. Figure 1 shows three potential transport network architectures: embedded transponder, thin transponder and IPoDWDM.
A modern embedded transponder is usually housed in a compact modular transport platform using a “sled” module – in this case one that includes two DWDM line side wavelengths of up to 1.2 Tb/s each (a total of 2.4 Tb/s for the sled), plus multiple client port sockets that typically support 100 GbE or 400 GbE (or OTN equivalent) pluggable gray optics mod-
ules. As you see from the capability summary, embedded optics offer the highest capacity per fiber, the widest feature set and are the standard approach operationally. But the price we pay for this is that they would consume more electrical power and rack space.
For many years the IP over DWDM (IPoDWDM) architecture proposed to install coherent pluggable optics directly in the IP router or switch, thus avoiding the need for a separate optical layer chassis. This does reduce cost, space and power, but it has less capable optical performance and a limited feature set. But the biggest problem with IPoDWDM is that it does not fit the typical operational model for most network operators since it combines the optical and packet layers and removes a clear service demarcation point. That said, groups like Telecom Inra Project and IEEE continue to work on solutions for IPoDWDM management.
current effort underway for embedded transponders.
COHERENT PLUGGABLE EVOLUTION
In late 2016, the Optical Internetworking Forum (OIF) started work on a pluggable coherent solution with approximately 10 contributing companies, and it published its first 400ZR implementation agreement five years later. 400ZR was revolutionary in that it provided a 400 Gb/s tuneable coherent transponder in a standard, QSFP-DD form factor with a power consumption under 15 Watts and multi-vendor
length speeds, interoperable modulation formats such as Probabilistic Constellation Shaping (PCS) and proprietary high gain Forward Error Correction (FEC), to achieve longer reach and exceeding the power and heat dissipation envelopes defined in the original standard.
As ASIC technology has advanced, and since the original 400ZR standard was published, most of these ZR+ enhancements have been drawn back into the standards track , culminating in 400OpenZR+, 800ZR/ZR+ and even new 1600ZR specifications
A relatively recent approach is the “thin transponder”. In this architecture pluggable optics are installed in a simplified optical shelf that provides a clear service demarcation to fit with operational procedures, has better cost, space and power characteristics than an embedded transponder, but offers a more limited optical performance because of the pluggable coherent transponders used. However, in the past ten years or so the performance of pluggable transponders has been improving dramatically. Moreover pluggables continue to improve their multi-vendor interopability while there is no such
interop and enabled multi-vendor interoperability for for pluggable coherent WDM modules supporting a reach of 100 km reach, which was perfectly adequate for the initial use case of metro data center interconnect.
Even as the standard 400ZR technology was being developed, manufacturers were pushing the performance boundaries of what they could achieve outside of the OIF specification, resulting in an initially informal label of “400ZR+”. These implementations have led to the continued evolution of pluggable coherent optics, including scaling to higher baud rates and 800Gb/s wave-
that describe highly capable and standards-based coherent transponders. Since one of the main application areas would be to install the pluggable directly into a switch or router, the typical pluggable form factors are primarily driven by what switch/router vendors support within their architecture; but the most common options would be QSFP-DD and OSFP because these are favoured form factors for router/ switch manufacturers to achieve higher front plate port density. In the past few years the evolution of embedded transponder feature sets has been facing the challenge of approaching a basic performance limit – described
by the Shannon-Hartley Equation and often dubbed “the Shannon Limit” for convenience. The result is that, as it becomes increasingly difficult for embedded transponders to squeeze out more spectral efficiency, the leading edge pluggable designs are beginning to close the performance gap and are delivering genuinely useful performance levels while reducing capital costs, power consumption and rack space for a given service demand.
Let us be clear, however…there is still a significant gap, and operators who need the absolute maximum in optical performance will still almost always choose embedded transponders. Nevertheless the performance of the latest coherent pluggables has improved to the point where regional submarine cable distances could be achievable at the data rates needed by submarine network operators (ie. to support 400G and 800G Ethernet services). But do all submarine cables present the same optical challenges? Let’s take a look.
cables that were specifically designed to support coherent transmission (typically RFS from 2015 onwards), and which include the most recent Space Division Multiplexing cable types.
Both cable types present challenges for all types of coherent transponders. Older, dispersion-managed cables have a higher nonlinear penalty because they operate with low chromatic dispersion levels and also use fiber types that have a lower effective area. So, while the transponder does not have to compensate for high levels of chromatic dispersion, it does face the issue of a lower Optical Signal to Noise Ratio (OSNR) from nonlinear effects. Embedded transponders include nonlinear mitigation and
marine cable to understand the progress made already on coherent pluggables, and also the factors that might influence how useful this architectural option might be on your cable.
Note that, in both cases the spectral efficiency achieved with pluggables was below that of embedded transponders – typically between 10% and 20% lower than the ideal configuration. The exact reduction in total capacity is highly dependent on specific scenarios since many “regional length” cables tend to operate with multiple generations of transponder sharing a fiber pair as new capacity has been deployed over an extended period of time.
FIELD TRIAL 1: DISPERSION-MANAGED CABLE
“Coherent pluggables are reshaping submarine network design — narrowing the performance gap with embedded transponders while reducing power, space, and deployment costs.”
THE MANY TYPES OF SUBMARINE CABLE
There are almost 600 submarine cables operating around the world today and they range in length from a few tens of kilometers to trans-Atlantic distances of around 7,000 km and trans-Pacific distances of 15,000 km or even more. In addition to a variation in length, submarine cables fall into two broad categories: dispersion-compensated cables that predate coherent technology (Ready for Service, or RFS usually dating from around 2000 to 2014); and uncompensated
compensation features to help boost performance over these older cables.
In contrast newer, uncompensated cables have a low nonlinear penalty, but that’s because they use fibers with high chromatic dispersion (and a larger effective area). In a typical embedded DSP design about 30% of the DSP gates are dedicated to chromatic dispersion compensation. In a pluggable transponder there simply isn’t the space on the DSP, or the power/heat budget to support very high levels of CD compensation.
Let’s take a look at two recent, record-breaking field trials on two distinctly different types of sub-
The first of these trials took place on a 1,932 km regional cable system that was RFS in the early 2000s, which means that it’s a first generation dispersion-managed system. This type of cable can be a particular challenge because the spectrum includes regions of zero and near-zero dispersion, which have a resulting high nonlinear penalty. An embedded transponder can include specific features for nonlinear mitigation – such as the use of Nyquist subcarriers – as well as active nonlinear compensation algorithms. These are normally absent from conventional pluggable transponders. However, Nokia’s ICE-X 800G ZR+ coherent pluggables include the ability to operate at multiple baud rates and modulation constellations in order to achieve the highest possible performance. On this cable system the headline performance
numbers are:
1,932 km closed with operating margins at 400 Gb/s.
3,864 km closed with operating margins at 400 Gb/s.
1,932 km closed above the FEC limit, but below operating margins at 600 Gb/s.
There are many older, regional submarine systems that fall well within these transmission distances. Moreover, many of these older cables do not require the maximum spectral efficiency delivered by embedded transponders and the lower CapEx and OpEx costs of pluggable might well be an attractive option.
FIELD TRIAL 2: UNCOMPENSATED CABLE
The second field trial took place on a 2,841 km uncompensated cable segment between Puerto Rico and the USA that was RFS within the last 10 years. The trial results are the subject of a post-deadline paper that was accepted for the OFC conference in March this year (2026) in Los Angeles. As before the trial was performed using Nokia ICE-X 800G ZR+ coherent pluggables that are based on a highly innovative 3nm capable of operation up to 135Gbaud, and 400G, 600G and 800G line rates per wavelength. These were deployed alongside live customer traffic on the same fiber.
In this case the record-breaking performance numbers include:
• 5,682 km closed with operating margins at 400 Gb/s.
• 2,841 km closed with operating margins at 600 Gb/s.
• 2,841 km closed above the FEC limit at 800 Gb/s but be-
low operating margins.
As expected, the optical performance of a coherent transponder over an uncompensated cable should be better than over an older, compensated cable. But in this case the innovation in the ICE-X 800G DSP is a novel chromatic dispersion compensation algorithm that, in the case of the loopback test, allowed unusually high CD compensation of 126 ns/nm for the 5,682 km loopback path.
CONCLUSION
The two field trials detailed here give a clear indication that coherent pluggables are becoming a real option for submarine network operators today. The current generation of coherent pluggable optics have demonstrated the capability to close well over 5,000 km on a modern uncompensated cable to deliver 400GbE services in a form factor that is lower cost, lower power consumption and more compact rack space compared to a conventional embedded transponder. In the near term, for operators of regional cable systems that do not stress the capacity limits of a given fiber pair, a thin transponder approach could offer significant value through lower power, space and cost. While today’s drawback is that pluggables cannot deliver the same spectral efficiency as a high performance embedded transponder, future upgrades leveraging continued advances in Moore’s Law and higher performance DSPs will enable continued advances, including trans-oceanic transmission over repeatered cables >6000km.
Geoff Bennett is the Director of Solutions & Technology for Nokia. He has over 35 years of experience in the data communications industry, including IP routing with Proteon and Wellfleet; ATM and MPLS experience with FORE Systems; and optical transmission and switching experience with Marconi, where he held the position of Distinguished Engineer in the CTO Office.
Sumudu Edirisinghe is currently a principle subsea engineer at Nokia and a visiting professor at Kotelawala Defense University. In a career stretching over more than 20 years he has worked in R&D and as a design Engineer for several telecommunication equipment manufactures in Europe and USA. He is senior member of IEEE and a Fellow of IET, and holds several US patents.
• 180+ projects for 90+ clients across every ocean
• Vendor-neutral advice from feasibility through operations
• ISO 9001, 14001, 27001 & 45001 certified
• Trusted by commercial, government, and offshore energy clients
THE BENEFITS OF THE WORLD’S FIRST DIESEL/ ELECTRIC SUBMARINE CABLE RECOVERY SHIP
By Simon Appleby & Wouter van Terwisga
When it came time for Subsea Environmental Services SARL (Subsea) (www.subsea.cc) to expand their cable recovery fleet the company was faced with a dilemma.
Conversion costs for a new or older vessel were similar, in fact modification of crew accommodation of an older freighter posed greater problems than building from new, however the opportunity to employ a modern diesel electric vessel in submarine cable recovery work promised considerable operational benefits including fuel economies in the long term.
These economies in fuel also potentially represented a significant reduction in operating costs although the numbers quoted seemed too good to be true. An estimated 40% reduction in fuel usage were discussed at the design phase, which, when the volatility of energy prices were taken into consideration, made a compelling argument. A new diesel
electric vessel also presented a significant improvement in emissions generated as part of recovery operations, further enhancing the sustainability of the vessel’s recovery work, the company as a whole and specific customer related projects.
A purpose-built vessel also provided significant benefits for the crew with individual cabins, including personalised entertainment and state of the art high speed internet connections for all, important when you consider
tions?
When the vessel now known as M.V. Maasvliet was first discussed, the question was practical: could the CIP3800*1 platform, originally developed as a diesel-electric general cargo vessel, be adapted for cable recovery work? The vessel’s hull had already been constructed and prepared for general cargo transport. However, Subsea and Hudig & Veder (www.hudigveder. nl), recognised that this platform could offer more.
“Maasvliet demonstrates how modern diesel-electric design can fundamentally improve submarine cable recovery operations, delivering major gains in fuel efficiency, crew welfare, operational flexibility, and environmental sustainability.”
each recovery voyage can last upto 60 days. There was also the opportunity to install an upgraded bow thruster which could operate on a 24/7 basis, improving vessel manoeuvrability.
The promise was significant, but would this vessel meet expecta-
At first sight, it was not an obvious combination. The CIP3800 was not originally seen as a dedicated cable recovery vessel and that is exactly what made the project interesting. It required that Subsea had to look beyond the usual vessel categories and recognise the value of the underlying platform. In the view of the designer, ConoShip International (www.conoship.com), that was the right approach. Good ship design starts with the actual operational profile and with a clear understanding of which ship characteristics really matter for 1. ConoShip International Projects 3800
the work it has to do.
The CIP3800 platform had already been developed around qualities that go beyond cargo transport alone: very low fuel consumption, practical buildability, a robust diesel-electric basis, and enough flexibility in the design to allow adaptation to future needs. In the case of Maasvliet, the challenge was therefore to modify the design where the operation demanded it, without losing the strengths that made the platform attractive in the first place.
A major part of that work was the integration of the cable recovery equipment supplied by Subsea. That affected the arrangement, the use of deck space, the electrical load distribution and more generally the way the vessel functions as a working platform. In projects like this, success usually lies in the way the ship and the mission equipment are made to work together as one coherent system.
The operational profile of Maasvliet also differs in important ways from that of a standard cargo vessel and that immediately affects the design priorities. A cable recovery vessel must support people and operations offshore for longer periods of time, with low-speed work and extended durations at sea compared to a vessel carrying cargo from A to B. That means accommodation becomes more important, but so do endurance-related functions such as fuel capacity, stores and freshwater capacity. If the ship is expected to stay out longer, carry more people and operate as a working offshore platform, then those onboard support functions must match that role.
The vessel’s behaviour at sea was another important consideration. For cable recovery operations, seakeeping and comfort are very important for crew welfare, but they also influence how effectively and safely the work can be conducted. In that respect, the stability characteristics of the platform proved to be a real advantage. The vessel offers a solid basis, helping to limit excessive motions and accelerations when working offshore. These calmer characteristics improve onboard comfort and, more importantly, supports the vessel’s suitability for the actual working profile required in cable recovery operations.
The diesel-electric basis of the
cases ships originally built as far back as the 1970s. Maasvliet belongs to the first generation of vessels where a newbuild platform is converted directly into a cable recovery vessel from the start. That brings clear operational advantages. A newer vessel can move from one project to the next with far less risk of major maintenance demands after each campaign. The initial investment is clearly higher, but that is balanced by lower operational costs, better reliability and a platform that is far easier to deploy across multiple jobs.
The match may not have been obvious at first, but the platform characteristics of the CIP3800 turned out to be highly suitable once combined with the right modifications. For the designers and ship builders, that is what good ship design is about: a practical answer to a real operational requirement.
“Built from a modern cargo-vessel platform and adapted for cable recovery, Maasvliet reflects a broader industry shift away from aging legacy fleets toward purpose-built vessels optimized for long-duration offshore operations.”
CIP3800 also remains relevant in this adapted role. A vessel such as Maasvliet does not operate in one fixed condition. It combines transit, low-speed operational work, station-keeping behaviour, and varying onboard load cases. In that kind of profile, diesel-electric propulsion offers useful flexibility and control. It fits naturally with a vessel concept that combines specialist equipment, changing operational modes and efficient power management.
Another important aspect is the age of the existing cable recovery fleet. Until now, cable recovery work has often been conducted by relatively old vessels, in some
This diesel electric vessel is powered by a combination of three Volvo D13 diesel generators. Three provide contingency in the event of a single or double point of failure. In normal operating conditions, the vessel is usually run using a single generator which produces electric power for all vessel requirements, including propulsion. The propeller is powered using one of two electric motors, once again contingency is a key element of safety, with power being instantly available to the Master when required.
The vessel produces significantly less noise than traditionally powered craft. The engine room is more like a server room, with electric control panels replacing
the diesel engine and auxiliary generators which are normally located in this area.
This low operating noise profile also reflects very positively when operations involve potential interaction with cetations and other marine mammals.
So how does this new technology perform?
After 12 months of activity the numbers are in and they are impressive to say the least.
The following table provides a comparison between the traditionally powered and diesel electric vessel in the Subsea fleet and
the needs of the individual providing a good mix of public and private space.
The vessel performs in exactly the same general terms as the other vessel in the fleet. Transit speeds are identical, vessel manoeuvrability is improved, the upgraded bow thruster provides effective positioning ability. The upgraded capability to operate this bow thruster on a permanent basis is also recognised as a positive.
In summary, the M.V. Massvliet has fulfilled and in some cases significantly exceeded the ben-
Simon Appleby is Director of Subsea Environmental Services SARL, specializing in submarine cable recovery and recycling. Since 2010, he has supported the recovery of more than 75,000 km of cable and 120,000 metric tonnes of material, including decommissioning projects such as TAT 14. He holds a BSc in Geography and an MBA.
M.V. Maasvliet. The table is divided into three specific activities, Transit, Cable Recovery and Cable Offload as follows;
Taken overall, the fuel requirements for the diesel/electric vessel are 53.6% less than the traditionally powered craft when a direct voyage comparison is made.
In economic terms, given the current market conditions for fuel oil, this represents a saving of approximately 600 metric tonnes of MGO and an estimated $1,000,000 saving in operating costs.
Feedback from the crew, in terms of operating characteristics and crew comfort are also wholly positive.
Crew accommodation respects
efits envisaged at the design phase. Her cable recovery capabilities match those of more traditional platform provided by the M.V. Rebecca, Subsea’s first cable recovery vessel. Cable recovery rates are identical for the two vessels. Her economies, with respect to fuel oil consumption, have exceeded all expectations, in excess of 25% better than originally anticipated. This further enhances the sustainability goals of Subsea and this is further reflected on customer specific special projects where the vessel is employed.
Did she meet expectations? The response is a resounding YES!
Maarten Sickler is a naval architect and maritime professional with over 25 years of experience in shipbuilding, classification, and technical risk assessment. He is Director of Conoship International Projects, focusing on bankable standardized vessel designs. His background includes roles at CIG, Bureau Veritas, and Vuyk Engineering, with expertise in due diligence and strategic maritime development.
CONNECTING AN OCEAN: HOW THE CENTRAL PACIFIC CABLE INITIATIVE COULD RESHAPE THE DIGITAL FUTURE OF THE PACIFIC
By John Maguire
Pacific Island nations have always faced a structural connectivity challenge.
Small populations, vast ocean distances, difficult geography and limited infrastructure have meant that communications networks in the region have often been expensive to build, difficult to maintain and slow to scale.
From the 1960s and 70s, satellite connectivity played an important role in helping bridge that gap. It enabled basic international communications, supported public services and allowed remote communities to participate in the wider digital world. Over time, however, and especially in recent years, the demands placed on communications networks have grown dramatically.
Education, health care, public administration, banking, commerce, social services and everyday communication now depend on high capacity, reliable digital infrastructure. Mobile usage has grown. Cloud based services are now part of daily life. Communities increasingly require not just a connection, but a resilient, affordable, scalable connection. That is
the context in which the Central Pacific Cable initiative, or CPC, matters.
CPC is not just another submarine cable project. Its real importance lies in its potential: what it could make possible for a region that has too often been treated as peripheral to global connectivity. Properly developed, CPC has the potential to support a far more integrated Pacific digital environment, one in which island communities are not merely connected to remote digital hubs but increasingly connected more directly to each other.
This distinction is important. Historically, Pacific cable systems have been designed to connect an island nation to a larger external market. That model has undoubtedly delivered enormous benefits, but it reinforced a pattern where regional traffic must leave its Pacific origin before returning to another Pacific destination. In practical terms, that can mean higher costs, greater latency, reduced resilience and a continued dependence on distant points of interconnection.
CPC creates the possibility of something different.
A Regional Platform, Not Just A Cable
At its core, the initiative is about using new subsea infrastructure to expand access, improve resilience and create a platform for regional digital growth. The current CPC scope includes five Pacific territories: Tuvalu, Kiribati, the Republic of the Marshall Islands, the Federated States of Micronesia and American Samoa. Each has its own market conditions, policy settings and infrastructure needs, but all share a common challenge: how to convert physical connectivity into accessible, affordable and sustainable digital capability.
The achievement to date is significant. Tuvalu, for example, received its first submarine fiber optic cable landing in December 2024 with the landing of its VAKA cable. For a country of around 10,000 people spread across three islands and six atolls, that is no minor infrastructure milestone. It is a national development event. It creates the potential for better education, stronger health services, improved public administration, more resilient communications and greater op-
portunities for young people to remain in their own country while participating remotely in the global economy.
Other participating island nations now can benefit from the same broader shift. But the arrival of subsea infrastructure is not the end of the story. In many ways, it is only the beginning.
A cable landing creates potential. It does not, by itself, guarantee that local communities, businesses, schools, clinics and government agencies will receive affordable, fit-for-purpose services. The challenge is to turn infrastructure into wholesale capacity and that, in turn, into practical national and regional outcomes.
This is where CPC becomes particularly interesting. The Pacific does not need connectivity in the abstract. It needs connectivity that can be used. A country like Tuvalu, for example, with its population of some 10,000 people does not need multiple fiber pairs—it needs 100Gbps, maybe even 10Gbps. This means that infrastructure needs to support capacity, and capacity must be broken down to levels that local markets can absorb. It means operators need commercial structures that make sense. It means national networks, landing stations, backhaul, internet exchange points, data centres, cloud access, caching and local service ecosystems all need to develop in parallel.
The real prize is not simply more cable landings, or more bandwidth. The real prize is a functioning regional platform.
TURNING CAPACITY INTO PRACTICAL OUTCOMES
Such a platform could allow Pacif-
ic operators to cooperate where it makes sense, compete where it adds value, and collectively improve the economics of digital services across the region. Wholesale telecommunications has always involved this balance or cooperation and competition. Operators may compete fiercely in their home markets, but still work together on shared infrastructure, capacity acquisition, routing, resilience and regional interconnection. This model, if adopted in the Pacific, could render CPC a far greater thing than the impressive sum of its parts.
A possible pathway is the development of a regional wholesale layer that allows participating operators and other qualified parties to aggregate demand, acquire capacity at efficient scale, and then distribute that capacity in smaller, usable increments across individual markets. Whether that occurs through a consortium, coordinated bilateral arrangements, a special purpose vehicle or another commercial framework is a secondary question. What matters is the principle: CPC capacity needs to be translated into services that match the scale and requirements of Pacific markets. That is how the initiative moves from impressive global infrastructure delivery to material local economic and social impact.
A key opportunity is in intra-regional connectivity. Historically, a Pacific island connected by submarine cable often gained a route out of the region, but not necessarily a direct or efficient route to its neighbours. A connection from one Pacific country to another could still need to travel via Australia, New Zealand, Hawaiʻi or the mainland United States. That made regional digital integration
more difficult than it really ought to be.
CPC can now underpin a change to that. With the right network design, commercial arrangements and interconnection strategy, the region can begin to support more direct Pacific-to-Pacific traffic flows. That has implications for cost, resilience, latency and service quality. It also has implications for regional identity. A more connected Pacific can support more regional collaboration in education, health, commerce, tourism, disaster response and public administration.
The opportunity extends beyond the countries directly connected to CPC. Other Pacific markets, including those with existing cable systems, could benefit from improved interconnection, capacity exchange and access to regional traffic hubs. In that sense, CPC should not be viewed only as a cable serving five territories. It should be viewed as part of a broader Pacific connectivity fabric.
THE CASE FOR IN REGION EXCHANGE
A logical next step is the development of stronger in region internet exchange capability. If more local and regional traffic can stay within the Pacific, service quality improves and costs can fall. Local content, government services, education platforms and business applications all benefit when traffic does not need to take unnecessarily long routes through distant markets. Aggregated demand can also improve the case for caching, cloud access and other digital infrastructure that has historically been difficult to justify in smaller island markets. That again is how a ca-
ble becomes much more than a cable.
There is also a resilience argument. Pacific island nations are exposed to natural disasters, climate related risks and the practical challenges of operating across vast ocean distances. Better regional interconnection can provide alternative routing, improve network redundancy and reduce dependence on single paths. In an increasingly digital world, resilience is not a luxury. It is a core part of national infrastructure planning.
The same is true for affordability. Many Pacific markets have made real progress in improving telecommunications access, but the underlying cost of international capacity and network operations remains a constraint. CPC has the potential to improve the economics of supply, but only if the commercial model is designed to meet the realities of small markets. Large blocks of capacity may make sense at a backbone level, but local operators need access to increments and pricing structures that allow them to serve schools, hospitals, households, government agencies and businesses. This must be the next phase of work.
THE WORK AHEAD
The question is no longer whether important infrastructure can reach parts of the Central Pacific. We have seen that it can. And does. The question now is how to ensure that the infrastructure is used to its fullest potential.
That will require cooperation between governments, larger regional operators, development partners, regulators, technical experts and local commercial
stakeholders. It will require practical planning, not just aspiration. It will require a focus on last mile access, wholesale structures, local market absorption, regional traffic exchange and long-term sustainability.
The opportunity is substantial. CPC can help reduce isolation, improve regional integration and create a stronger digital foundation for Pacific communities. It can support national development goals while also contributing to a more resilient and interconnected region. It can help move the Pacific from a model of fragmented connectivity toward a model of shared regional capability.
There is much to celebrate already. VAKA, Tuvalu’s first submarine fiber optic cable landing is a landmark achievement. The inclusion of Kiribati, the Republic of the Marshall Islands, the Federated States of Micronesia and American Samoa points to a wider regional opportunity. The infrastructure now being put in place can support better services, stronger economies and more resilient communities.
But the larger task remains ahead.
CONCLUSION
CPC’s greatest value will not be measured only in route kilometres, cable landings or theoretical capacity. It will be measured in whether Pacific communities can use it. It will be measured in whether students can access better learning, whether hospitals and clinics can rely on stronger connectivity, whether governments can deliver better services, whether businesses can reach new markets, and whether island nations can communicate with each other more directly and af-
fordably. That is the promise of CPC.
It is an exciting time for the Pacific. The region has an opportunity to turn new subsea infrastructure into a genuine platform for digital inclusion, resilience and growth. The foundation is being laid. The next step is to ensure that the benefits reach the people, communities and economies that need them most.
There is much to celebrate.
And much more to do.
John Maguire is Director, EMEA at APTelecom with 30 years of telecommunications experience across global markets. He has sold security and network control software, built regional federation fibre networks, and established interconnect and wholesale structures in emerging markets. His career spans OEM and service providers, fixed and mobile domains, and roles in general management, sales, operations, and business development. He is Dublin-based and has worked worldwide.
GLOBAL CAPACITY IN TRANSITION: HOW SHIFTING TRAFFIC PATTERNS ARE RESHAPING NETWORK STRATEGY
By Joel Ogren
For decades, global network strategy was largely defined by a straightforward equation: more demand required more capacity.
As internet adoption expanded, cloud services proliferated and digital transformation accelerated, operators focused primarily on adding bandwidth along the most efficient and commercially viable routes. Capacity planning centered on building bigger pipes, adding more subsea systems and expanding terrestrial reach to keep pace with growing consumption, a model now being further strained by AI-driven workloads that are rapidly increasing traffic volumes and placing greater emphasis on low-latency, highly reliable connectivity.
That model is changing. Global capacity is no longer just about how much bandwidth can be delivered, but how intelligently traffic can be moved in response to a rapidly shifting world. Ongoing geopolitical tensions, regional instability and evolving regulatory environments are not theoretical risks, they are actively influencing
network decisions in real time. Geopolitical tensions, regional instability, regulatory changes, supply chain disruptions and economic uncertainty are all influencing how operators think about routing, infrastructure investment and risk. In this environment, traditional static planning assumptions, where traffic predictably follows established corridors, are giving way to more adaptive, resilience-driven strategies, as networks must now simultaneously accommodate both external risk factors and the growing performance demands associated with AI and data-intensive applications.
Across the industry, network operators, hyperscalers, carriers and infrastructure investors are reevaluating where traffic should flow, which markets present concentration risks and how to avoid overdependence on geographic “hotspots.” The result is a fundamental transition in global capacity strategy: from building solely for scale to building for resilience, optionality and strategic flexibility, driven by the need to actively avoid risk exposure in certain regions.
This shift is reinforced by the increasing visibility of network disruptions. Whether caused by physical cable damage, regulatory intervention or regional instability, recent events have demonstrated how quickly traffic flows can be constrained. These incidents are prompting operators to rethink not only where capacity is deployed, but how quickly it can be reallocated when conditions change.
WHAT WE’RE SEEING IN THE MARKET: ACCELERATION, DIVERSIFICATION AND TRAFFIC REBALANCING
One of the clearest trends emerging today is acceleration. Customers are not simply planning for these shifts, but are actively accelerating projects in response to current global conditions.
Across subsea, terrestrial and interconnection markets, operators are moving faster to secure route diversity, develop new partnerships and establish optionality before conditions change further. Projects that may once have followed slower, phased deployment timelines are being reevaluated and, in many cases, expedited, driven not only by
geopolitical uncertainty but also by the rapid growth of AI-related traffic, which is compressing infrastructure timelines and increasing urgency around deployment.
This acceleration is being driven by a growing recognition that network flexibility has become a competitive advantage. Companies are increasingly moving traffic away from perceived high-risk areas and redistributing it across more diversified corridors. This does not necessarily mean abandoning major global routes, but it does mean reducing overreliance on any single region or pathway. In practice, this is translating into deliberate efforts to avoid specific geographic risk points and maintain continuity if conditions deteriorate. Customers are seeking ways to preserve service continuity even if one corridor becomes constrained, politically sensitive or operationally compromised.
This shift is also changing customer priorities. Rather than relying exclusively on long-term fixed assumptions about where traffic will originate or terminate, operators are placing greater value on adaptability as market conditions evolve. Flexibility is becoming as valuable as capacity itself.
This has implications for every layer of the ecosystem. Subsea cable developers are reassessing landing point strategy. Terrestrial providers are exploring alternative backhaul corridors. Data center operators are evaluating how
importance of east–west connectivity. For years, many network architectures heavily emphasized north–south corridors, especially where traffic aggregation naturally aligned with established metropolitan and regional hubs. But as operators look to avoid congestion or geopolitical concentration points, east–west routes are becoming increasingly significant as complementary pathways that create additional flexibility.
“Global network strategy is shifting from building purely for scale to building for resilience, flexibility, and the ability to reroute traffic as geopolitical and operational risks evolve.”
At the same time, traffic rebalancing is becoming more dynamic. Instead of relying on predictable, long-term flow patterns, operators are preparing for more frequent adjustments driven by external factors. This includes the ability to shift capacity between regions in shorter timeframes, sometimes in response to rapidly evolving geopolitical developments or regulatory changes that were previously considered low-probability risks. This represents a shift from long-term planning cycles to more immediate, responsive decision-making, with operators increasingly exploring the use of AI and advanced analytics to better understand traffic patterns and inform how capacity is dynamically allocated.
proximity to diverse routes can strengthen their role in traffic orchestration. Across the board, the market is increasingly prioritizing infrastructure that can support rapid directional shifts.
IMPACT ON INFRASTRUCTURE STRATEGY: RETHINKING ROUTES, CORRIDORS AND CONTROL POINTS
As traffic patterns evolve, infrastructure strategy is becoming more multidimensional. Rather than concentrating investment solely on historically dominant pathways, operators are seeking a broader mix of subsea and terrestrial options that improve strategic resilience. Physical diversity, ensuring traffic can move across geographically distinct pathways, is increasingly critical to minimizing disruption risk.
This is also elevating the strategic
East–west infrastructure can open alternative market access, connect underserved strategic regions and create bypass opportunities around traditional bottlenecks. In many cases, these routes are becoming core strategic assets, particularly as operators look to introduce alternative pathways that reduce reliance on any single corridor.
Cable landing stations are evolving in a similar fashion. Historically viewed as endpoints where subsea systems reached shore, landing stations are increasingly functioning as strategic control points within broader frameworks. Their location, diversity of onward terrestrial connections and integration with inland infrastructure now carry greater strategic importance.
In addition, operators are beginning to evaluate landing station ecosystems rather than individual sites. Factors such as permitting stability, power availability, security considerations and proximity to multiple fiber routes are now influencing site selection. This broader lens reflects the growing understanding that resilience is not determined by a single asset, but by how interconnected
infrastructure elements perform together.
Landing stations with limited inland diversity tend to offer less resilience than those connected to multiple geographically distinct terrestrial routes. As a result, operators are increasingly evaluating landing points not simply by proximity or capacity, but by their role in enabling a more flexible traffic strategy.
This is where inland networks become particularly important. The ability to dynamically shift traffic once it lands can significantly strengthen network resilience. Integration between subsea systems and terrestrial ecosystems is becoming a defining factor in next-generation capacity strategy.
DESIGNING FOR RESILIENCE, NOT JUST SCALE
The industry is entering a phase where resilience planning must sit alongside capacity expansion. Global demand for connectivity is continuing to grow, fueled by AI, cloud services, edge deployments, content delivery and enterprise transformation. But scale alone is no longer sufficient, networks must also be designed to adapt.
strategic flexibility when external pressures require rapid rerouting.
Beyond physical design, operational agility is becoming just as important. Software-defined networking, real-time traffic monitoring and automated rerouting capabilities are enabling operators to respond more quickly to disruptions. These tools allow networks to behave more dynamically, aligning infrastructure capabilities with the need for rapid decision-making in uncertain conditions, and are increasingly being complemented by AI-driven capabilities that can assist in predicting demand shifts and optimizing traffic flows in near real time.
Designing for network durability also requires balancing cost and speed with long-term strategic value. The lowest-cost route may not always be the most strategically sound. Similarly, the fastest deployment may create future
becoming less about fixed optimization and more about strategic flexibility.
A STRATEGIC REALIGNMENT FOR THE INDUSTRY
The logic behind the deployment of global capacity is changing. As external pressures intensify, decision-making timelines are compressing. Operators are being forced to make strategic infrastructure decisions faster, often with incomplete certainty, because waiting may reduce optionality or increase exposure.
This compression is reshaping competitive dynamics. Companies that can quickly identify emerging route opportunities, secure strategic partnerships and deploy durable architectures may gain significant advantage over those tied too tightly to legacy assumptions.
“Next-generation networks will be defined not just by how much capacity they deliver, but by how flexibly they can adapt to disruption, reroute traffic, and sustain resilience under pressure.”
This requires a broader framework for infrastructure design. One that emphasizes redundancy, physical diversity and alternative pathways as foundational principles rather than optional safeguards.
Redundancy ensures continuity when disruptions occur. Physical diversity reduces exposure to localized geopolitical, environmental or operational events. Alternative pathways provide
constraints if it reinforces concentration in vulnerable corridors.
This is leading many operators to adopt more scenario-based planning models. Rather than optimizing only for current traffic patterns, they are evaluating how infrastructure can perform under multiple future conditions, such as geopolitical shifts, regulatory changes, market migrations or unexpected regional disruptions.
In essence, network strategy is
It also means collaboration across the ecosystem is becoming more important than ever. Subsea developers, terrestrial carriers, data center operators, landing station owners and interconnection providers all play interconnected roles in resilience. No single infrastructure layer can solve dynamic traffic challenges alone. True adaptability requires ecosystem-level coordination.
At the same time, capital allocation strategies are evolving. Investors are placing greater emphasis on projects that demonstrate not only strong demand fundamentals but also long-term strategic relevance in a volatile environment. This is influencing which routes move forward, how projects are structured and where partnerships are formed.
This creates significant opportunities for new regions, emerging corridors and alternative infrastructure models to gain strategic importance. Areas previously viewed as peripheral may become essential due to their geographic neutrality, route diversity or ability to bridge shifting traffic flows. In many ways, the industry is witnessing a redistribution of strategic relevance.
THE PATH FORWARD
Global capacity is entering a more dynamic and strategically complex era. The next phase of network evolution will be defined by who can build the most adaptable infrastructure. As traffic patterns shift in response to geopolitical pressures, economic uncertainty and changing market priorities, resilience will become a defining competitive differentia-
tor. This means planning for both demand and uncertainty alike.
The companies best positioned for the future will recognize that global capacity strategy now demands versatility as a core principle. Success will come from building infrastructure ecosystems that can respond to shifting traffic patterns, diversify routes, maintain continuity under pressure and evolve alongside geopolitical and economic realities.
In a world where uncertainty is now a constant factor in infrastructure planning, resilience has become essential to next-generation connectivity. The future will favor networks designed with flexibility, strategic diversity and the ability to adjust quickly as global conditions continue to change.
Joel Ogren is Chief Executive
Officer
of Assured Communications, which he founded in 2013. With over 38 years in information and communications technology, he has supported US federal agencies, led the Center for National and Nuclear Leadership Command Capabilities, and held senior roles at Ocean Networks, GoTo Networks, the University of Hawai'i, and Johns Hopkins APL. He holds an MS from the US Naval Postgraduate School.
ESTABLISHING TEST PROCESSES TO ENSURE
SUCCESSFUL SCALE-ACROSS AND SCALE-OUT NETWORKS
By Mitsuhiro Usuba & Shu Zhuang
Subsea networks (figure 1)represent one of the most demanding optical environments.
From deep-ocean pressures and rough seabeds to seismic events and human factors such as ship activities, maintaining network performance poses many challenges.
Another emerging issue that must
be addressed is capacity due to ever-growing Internet demand. In fact, capacity per system is rising rapidly along with the growing number of systems, with some expected to exceed 320 Tb/s. To address this scenario, hyperscalers, operators and Network Equipment Manufacturers (NEMs) are implementing new deployment techniques. These include scale-across through technolo-
gies such as multicore fiber (MCF) and scale-out via the expansion of links, routes, and systems.
While technologies used in subsea optical networks have remained consistent, market dynamics require a testing evolution. Two of the most influential
Figure 1: Subsea optical networks create testing challenges, particularly due to scale-out and scale-across implementation.
2: MCFs address growing bandwidth requirements by integrating multiple independent cores within a single fiber.
conditions are:
• High-bandwidth Use Cases – Application traffic and per-application bandwidth requirements are soaring due to cloud computing, growing streaming services, AI/ML, 5G/edge, IoT, and Content Delivery Networks (CDNs). Wet and dry plants are forced to expand to meet the demand.
Traditional single-core optical fibers have reached their capacity limit. To meet the increased demand, Space Division Multiplexing (SDM) is being utilized, specifically through multicore fiber (MCF) that integrates multiple independent cores into a single fiber (figure 2).
MCFs come in two types – strongly coupled and weakly coupled. Of these, the weakly coupled MCF is particularly promising, as it minimizes interference between cores and enables stable signal quality and high-capacity transmission. It brings clear longterm advantages for hyperscalers and large carriers on heavytraffic trunk routes, but requires new wet/dry plant designs, SDM-capable repeaters/terminals, spe-
cialized operations, and careful risk/redundancy planning.
One drawback of MCFs is that they are known to be very susceptible to inter-core crosstalk (figure 2), which can degrade transmission quality. Inter-core crosstalk occurs when an optical signal traveling through one core leaks into an adjacent core, causing signal interference. As crosstalk increases, signal quality degrades due to inter-core interference, leading to reduced transmission performance.
While limiting crosstalk in MCF is primarily the responsibility of the cable manufacturer, hyperscalers, service providers, and NEMs must be cognizant of it. They must also recognize that because MCF is more sensitive than conventional fiber, monitoring of fiber bending, mechanical stress (e.g., tension), cable condition, and individual core performance within the cable takes on added importance.
From a testing perspective, MCF aligns with scale-across architectures, where capacity is increased by adding spatial channels within the same physical fiber. This introduces new validation requirements, including simultaneous multi-core characterization, inter-core crosstalk evaluation, and consistency across cores.
Certain multi-channel OTDR solutions (figure 3) enable practical and efficient evaluation of MCF in real network deployments. Such instruments feature a builtin 4-channel synchronized OTDR that can precisely visualize transmission loss and reflection along
3: Multi-channel OTDRs, such as the one above, accurately evaluate MCFs in network deployments.
Figure
Figure
the fiber length. By simultaneously testing up to four cores, such OTDRs allow users to instantly assess transmission characteristics such as crosstalk, fiber breaks, connector losses, and bending issues for each core individually. It simplifies cross-talk measurements and shortens test times compared to conventional measurement methods.
• Global Uncertainty – The risk of cable cutting and other scenarios in which subsea cable faults or breaks occur is increasing due to our current unstable global situation. Regional conflicts may lead to damaged cables. Given the heightened state, testing takes on added significance.
SCALE-ACROSS AND SCALEOUT IMPLEMENTATION
As previously mentioned, operators, hyperscalers, and NEMs are meeting the staggering capacity requirements through scaleacross and scale-out implementation. Both are needed because subsea capacity growth is multidimensional – networks must expand sideways and vertically to balance meeting exploding demand with cost, resilience and time-tomarket parameters.
Scale out achieves capacity and resilience expansion through the deployment of additional links, routes, cable systems, landing sites, transponders, and distributed infrastructure. While it requires a higher financial investment and deployment effort, the benefit is it delivers better resilience and near-unbounded capacity, making it a viable alternative in certain use cases.
Scale across expands capacity expansion within a single physical route. It is a more cost-efficient approach that expands capacity across multiple paths, including submarine routes, cable systems, landing stations, and Points of Presence (PoPs).
Each approach has different testing requirements. Because scale out has many links and distributed systems, long-haul validation and automated, reliable measurements must be made. A coherent OTDR (C-OTDR) is well suited to these test requirements. Scale across testing must include parallel fiber/core validation, crosstalk, and spatial correlation. For these reasons, a multi-channel OTDR is recommended.
MAINTAINING SUBSEA NETWORK PERFORMANCE TO MEET KPIS
Comprehensive testing must be done during deployment and expansion, while regular maintenance and monitoring processes during ongoing operation should be implemented, as well. Overall
diagnose, predict, and prioritize actions). This type of approach can minimize service disruption and maintain signal quality.
Physical layer testing must be performed to ensure network performance to monitor specific conditions, such as:
• Physical Faults – At the top of the list to maintain performance are monitoring for cable faults and breaks and repairing them as soon as possible. Both can be caused by many factors, including manmade issues such as anchors dropping on cables and fishing nets dragging them. Natural concerns, such as earthquakes and other seismic incidents, can damage cables, as well.
• Aging Infrastructure – Infrastructure and network elements, such as repeaters and amplifiers, age faster in wet plants than dry plants. The result is degraded performance across multiple wavelengths, creating a need for monitoring and regular maintenance testing.
“Subsea networks are evolving beyond the limits of traditional single-core fiber, forcing operators to adopt multicore architectures, advanced testing methodologies, and new approaches to monitoring performance at massive scale.”
verification to maintain network performance and achieve KPIs should include parallelized measurements (provides capacity and redundancy), automated test workflows (fast, consistent control and remediation), and correlated analysis across cores and links (contextual intelligence to
• Capacity Saturation – As noted, high-bandwidth usage is increasing dramatically. Coupled with conventional spikes in demand, networks can slow due to congestion, lowering QoS.
Dedicated test solutions are necessary for each of these factors to maintain KPIs. A C-OTDR best addresses physical faults and aging infrastructure in ultra-long submarine links. To support capacity saturation challenges, an MCF-OTDR that accurately and repeatedly measures core cross-
talk characterization in MCF deployments is recommended.
C-OTDR KEY MEASUREMENT SOLUTION
Subsea optical networks represent a challenging environment for optical testing. Transmission distances can extend to tens of thousands of kilometers, with cascaded EDFAs introducing amplified spontaneous emission (ASE) noise and reducing OSNR. In addition, physical access to the cable is extremely limited, making accurate fault localization essential. These conditions require a test solution with high sensitivity, long measurement range, and precise event resolution—capabilities provided by coherent OTDR (C-OTDR).
A C-OTDR has the performance to accurately, repeatedly, and reliably verify today’s subsea networks. It injects an optical pulse into one cable end and uses the backscatter light and Fresnel reflection of light returning to the C-OTDR after passing through the optical fiber to conduct measurements. Coherent detection improves dynamic range and SNR so events and weak reflections on very long submarine spans are detectable without excessive averaging. By combining reflection, phase, and polarization diagnostics in one platform for comprehensive characterization, C-OTDRs eliminate the need for multiple instruments.
livering higher spatial and event resolution at long distances, a C-OTDR can better distinguish closely-spaced events on long links (landing-to-landing) and more accurately measure event loss and distance.
Among the benefits of a C-OTDR are:
• Phase and Polarization Information – Access to phaseand polarization-sensitive
formance margins are increasingly tight.
• Live-line and Low-impact Testing – A C-OTDR can characterize links with lower probe power or while portions of service remain active, aiding in commissioning and troubleshooting without full service shutdowns. This can be beneficial in scale-across and scale-out projects.
“As submarine systems scale across and out, testing is becoming as critical as capacity itself — enabling operators to detect faults faster, reduce downtime, and maintain performance in increasingly complex optical environments.”
HOW TO SELECT A C-OTDR
A main benefit of C-OTDRs over conventional OTDRs is their high sensitivity via the coherent detection method that detects interference signals (beat signal) caused by signal light (backscatter) and reference light (local light). By de-
measurements helps detect subtle impairments, including microbends, polarization mode dispersion shifts, and slow degradation, that conventional OTDRs can miss. This is particularly important in advanced high-capacity subsea systems where per-
Not all C-OTDRs are equal, however. The importance of a C-OTDR comes from enabling accurate fault location on any length of submarine network. The data point resolution of many traditional OTDRs is normally determined by the km range setting of the instrument. This becomes an ever more critical issue with submarine networks as the distance of the submarine portion is several orders of magnitude larger than terrestrial networks. Performance metrics that need to be considered include:
Figure 4: Some C-OTDRs have wide dynamic range, fast measurement capability, and high accuracy.
• Measurement Distance –Standard optical submarine cables have repeaters every 50 km to 60 km but some cables have repeater intervals of more than 80 km. To get the most efficient, accurate measurements, a C-OTDR needs a minimum measurement range of 12,000 km, with some extending to 20,000 km.
• High Resolutions – Because of the long distances of subsea optical cables, instrument resolution is necessary for precise measurements. High-resolution troubleshooting measurements with repeaters at intervals of more than 80 km (10 µs pulse width, theoretical value) is required. A resolution of 10 meters is suggested, as it allows for measurement and photo detection while supporting a distance of 20,000 km.
• High Accuracy – A C-OTDR should have a built-in tunable light source with wavelength accuracy of ±0.05 nm. Accurate measurements helps reduce the cost of maintenance, which can be very expensive due to renting a cable maintenance ship, raising the fiber from the ocean floor, and repairing it.
• Wide Dynamic Range – A typical dynamic range of >18 dB enables submarine cable fault detection and troubleshooting of repeaters at intervals of 80 km or more.
• Faster Measurements – Certain C-OTDRs (figure 4) can take approximately 8 samples per second, with each sample consisting of up to 1.2 million data points. These samples
are then averaged over time before the trace is displayed. This processing time reduction is due to being able to reduce the number of data points being averaged when a range setting of less than 12,000 km is selected. As a result, measurements can be completed on the order of tens of minutes, depending on configuration, compared to significantly longer durations for conventional approaches.
• Better Post-repair Verification – More precise fault localization and residual-loss measurement after repairs or shore-end works reduce repeat marine operations and mean time to repair (MTTR). As a result, a C-OTDR has become a key solution for subsea network validation, where conventional OTDR techniques may be limited in performance.
CONCLUSION
As networks scale both across and out, testing must evolve from sequential, link-based validation to more efficient and scalable approaches. Failure to do so may negatively impact network reliability, operational efficiency, and QoS.
C-OTDRs, driven by the stringent requirements of subsea networks, provide long-distance installation and maintenance efficiency for physical fault management. They incorporate a more reliable and precise technique than embedding OTDR technology within the cable itself. Dedicated MCF OTDRs play an integral role in enabling MCF-based capacity expansion through XT tests that can accurately measure
crosstalk between cores. By aligning test processes with these scaling approaches, operators and network providers can ensure efficient deployment, reliable operation, and sustained performance as network capacity continues to grow.
Mitsuhiro Usuba is a Marketing Manager at Anritsu Company, responsible for business development and technical marketing in optical networking and data center interconnect (DCI). He has over 20 years of experience in networking technologies, with expertise spanning business development, system engineering, and global collaboration with industry partners.
Shu Zhuang is a Senior Product Marketing Manager at Anritsu Company. She has over 20 years of experience across product marketing and planning, pre-sales, global network design, system design engineering, and system verification. She holds a Master of Science degree in Electrical Engineering and Computer Science from Stevens Institute of Technology.
WORLD’S ONLY UNDERSEA RESEARCH LAB IS RESHAPING THE FUTURE OF OCEAN SCIENCE
By JoAnn C. Adkins
Above the shimmering turquoise waters of the Florida Keys National Marine Sanctuary, the world feels familiar — sun-drenched, accessible and vast. Just 60 feet below, where the light becomes an ethereal sapphire hue, a pressurized cylinder tethered to the ocean floor comes into view. Its signature yellow paint dominates the landscape. Corals have be-
come fixtures, like beautiful décor, all around its metal exterior.
Unknown to many, this is Florida International University’s Aquarius Reef Base — the centerpiece of FIU’s Medina Aquarius Program. It is the world’s only underwater research laboratory.
For decades, Aquarius has been a temporary home for aquanauts
who spend days or even weeks living and working underwater. Its existence is a testament to human ingenuity, allowing scientists to bypass the crippling time limits of traditional scuba diving and immerse themselves in the mysteries of the ocean.
The story of Aquarius is set against a backdrop of sunken ambition.
Photos provided by Florida International University.
The 1960s ushered in a golden age of saturation diving, with more than 65 underwater habitats built and deployed across the world through the ’70s, ’80s and ’90s. But the ambition was fragile. One by one, those habitats were decommissioned, lost to budget cuts, technical failures or the logistical challenges of maintaining a pressurized structure underwater.
Aquarius is the exception — thriving and evolving in the 21st century. Now, FIU and technology startup Tekmara have teamed up to transform Aquarius and the future of underwater habitats. Aquarius will host Tekmara’s sensor technology, combining advanced artificial intelligence, integrated data solutions and marine robotics for intelligent, real-time environmental monitoring. The habitat’s continued, and now augmented, operation is a direct refutation of the notion that a permanent presence in the ocean is not possible. It is a testament to the idea that underwater habitats are viable, logical investments that can dramatically improve ocean research and restoration, technology innovation and extreme environment training for the Navy, astronauts and more.
Nuñez. “What scientists learn at the Medina Aquarius Program will prove pivotal for the future of Florida’s tourism and economy. FIU will continue to lead the way in marine conservation and research.”
The advanced systems support improved safety and security for aquanaut teams and for Aquarius itself, according to Tekmara founder Todd Kleperis. The innovations are also informing FIU’s planning for Aquarius 2, which is designed to expand the scope and scale of human activity in the oceans. Fundraising is underway for this next-generation habitat that will have a modular design to accommodate scientific study, proprietary research, advanced training and community engagement.
these new advances, our habitat is becoming more efficient and more equipped to support the amazing work being done by scientists and industry partners from around the world.”
Knowledge gained from the AI-enabled systems will help transform onsite training programs for scientists and astronauts that utilize the habitat’s extreme environment and even support the development of new technologies for ocean conservation.
“Once one of many underwater habitats built during the golden age of saturation diving, Aquarius now stands alone — evolving into an AI-enabled platform for ocean research, resilience, and exploration.”
The systems deployed by Tekmara are designed to autonomously detect anomalies like pollution sources or oxygen depletion, learn from the ocean environment, and provide real-time solutions. As the lead university research partner for the Florida Keys National Marine Sanctuary, this new insight will transform FIU’s research and help inform management of the protected region. The systems will largely be powered by renewable energy sources including solar and marine renewable energy, making the entire operation a model of sustainability.
JoAnn C. Adkins is the director of Communications for the College of Arts, Sciences & Education at Florida International University. Since joining the university in 2010, she has led communication campaigns including the reopening of the Aquarius Reef Base, as well as environment, forensic and biomolecular research initiatives. Prior to joining FIU, Adkins was the director of client services for a Miami-based public relations firm and began her career as a business and government reporter in West Virginia. She is a graduate of Marshall University.
“This project brings together two of FIU’s priorities to help grow ocean exploration: environmental research and technology,” said FIU President Jeanette M.
“Aquarius has long been a global asset for advancing scientific exploration, research and discovery,” said Mike Heithaus, FIU vice provost of environmental resilience. “With
SPATIAL DIVISION MULTIPLEXING IN POWER-CONSTRAINED SUBSEA CABLES
By Jose Chesnoy & Jean-Christophe Antona
SDM is a system-level optimization: constrained by cable limits on electrical power, and by nonlinear physics and Shannon’s capacity law per fibre, the most effective way to scale transoceanic capacity is to add spatial and frequency channels (more fibre pairs) and operate each channel at low optical power and OSNR. It enables to yield a higher total
capacity per cable and a lower cost per bit for long-haul links, with already a doubling of capacities across the Atlantic ocean.
WHY THE INDUSTRY MOVED FROM
“MORE POWER PER
FIBRE” TO
“MORE
FIBRES PER CABLE”
Submarine cables carry the vast majority of global Internet traffic. Over the last decade the dominant strategy for increasing cable capacity shifted from squeezing more bits into each fibre to multiplying the number of fibres inside a single cable with less bits per fibre, while consuming the same
flow of electrons and minimizing the cost per bit. That architectural change — Space Division Multiplexing (SDM) — is not an optical fad but the direct consequence of three hard physical limits: the electrical power a cable can safely carry, the nonlinear physics inside optical amplifiers and fibres, and the information-theory ceiling described by Shannon.
WHAT SDM ACTUALLY IS (IN PRACTICAL TERMS)
The SDM paradigms consists in optimizing the capacity and the cost of a multi-fibre cable under electrical powering constraints to meet the customer demand, rather than trying to extract every last bit from a single or a few fibres. To do so, new degrees of freedom are unfrozen such as fibre count and fibre type, along with a smart management of powering (with sharing of amplifier pump across multiple fibres, aka pump “farming” or “sharing”). This leads to
revisited designs with many more fibre pairs than older designs (for instance 12, 16, 24… fibre pairs instead of 2 to 6) and fewer repeaters operated at lower output power, resulting in increased total cable capacity with the same electrical power.
THE ELECTRICAL AND SHANNON WALLS THAT STARTED IT ALL
A submarine cable is an optical highway over an electrical power line: optical repeaters enable to amplify WDM (Wavelength Division Multiplexing) optical signals in parallel fibres every 50-80km; in return they require DC current delivered along the cable conductor. The maximum voltage that can be applied is limited by the conductor and insulator designs and cross-sections along the cable. Typically, 18mm-thick cables can support 15 to 18kV. Voltage is consumed by the cable itself, and by the repeaters (in order to feed the 980 nm laser diodes used to pump the optical amplifiers). In principle, to double the capacity of a cable with a doubling of fibre and amplifier count, one needs to double the pumps and then the voltage associated with repeaters. However, increasing cable voltage gets increasingly difficult, in terms of cable and repeater designs, but even more in terms of resilience of cable components to transient current surges arising when the high voltage conductor is in contact with the sea (shunt faults, or cable break).
For 20 years, since the
advent of optical amplification, electrical powering has been carefully handled over subsea cables able to support a same number of fibre pairs, between 4 and 8. Cable capacity increases mainly came from tremendous progresses in transponders (using Forward Error Correction, coherent detection, high-spectral efficiency modulations and tight channel packing) over traditional infrastructure (for instance leading to a 10x increase of the deployable capacity of Transatlantic Apollo cable from 2003 to 2015) or by using an infrastructure adapted to coherent transceivers. Amplifiers also converged to cost and power efficient bandwidth around 4.5-5 THz. Then, designs aimed to maximize capacity per fibre at trade-off powers between optical amplifier noise and Kerr-effect related fibre nonlinear impairments. Favoured designs involved few, high power repeaters, high OSNR lines requiring expensive low-nonlinearity fibres (150µm² effective area) or complex digital nonlinearity compensation schemes. This direction
was explored until the expected gains in terms of fibre capacity and cost per bit became marginal as transceiver and fibre links approached the Shannon limit.
SHANNON, NONLINEAR OPTICS, AND WHY EXTRA POWER STOPS HELPING
In the 1950s, the Shannon-Hartley theorem set the limits of the achievable information rate in a digital communication link experiencing noise. The famous theorem shows that the achievable spectral efficiency of a modulated signal is quasi-proportional to the logarithm of the signal to noise ratio SNR, assuming ideal transceiver implementation, Gaussian-like modulation and Forward Error Correction:
Transposed to the achievable cable capacity in an optical subsea cable, it becomes:
PUT EQUATION FROM DOCUMENT HERE AS PNG
In the logarithm term, SNRTOT is the total SNR inside the digital receiver including terminal and line
Fibre Capacity Limits (Transatlantic link)
related noise contributions (from fibres and amplifiers), while η is a gap-to Shannon value related to transceiver imperfections (for instance Error Correction), and M is the system margin for ageing and repairs (typically 1dB). To obtain the cable capacity, in bit per second, one needs to multiply this logarithm by the offered spectral and spatial bandwidth, namely the amplifier spectral bandwidth BW, multiplied by 2 (leveraging dual polarization modulations) and by the number of lit fibre pairs NFP.
Obviously, increasing cable capacity though an increase of SNR requires an exponential increase in powering while it requires only a linear increase in powering through more parallelism, in space (i.e. more fibres and or cores) or spectral bandwidth (i.e. C+L-bands, yet not beyond because of power efficiency issues). Without loss of generality we consider spatial parallelism next.
To better illustrate the stakes, let us consider a “Transatlantic-like” subsea link composed of 100 amplified spans using the best in class, weakly nonlinear fibre from pre-SDM era (with 150µm² effective area, as in Marea cable), 4.5THz wide optical amplifiers and realistic modems operating close to Shannon limits (SNR=18dB, 2dB gap to Shannon, as achievable with Probabilistic Constellation Shaping modulations). At nominal repeater power, the OSNR (amplifier noise) is equal to 12dB in channel bandwidth (or 19.8dB in 0.1nm for 75GHzspaced channels), and the total SNR is maximized, as a trade-off between amplifier and nonlinear noises.
Figure 1 depicts the evolution of
setting
Capacity Limits (Transatlantic link)
Pre-SDM setting
Total repeater output power (all fiber pairs) (dB...)
Total repeater output power (all fiber pairs) (dB...)
achievable fibre capacity if repeater output power or OSNR departs from that configuration. The blue solid line depicts the achievable capacity with the best in class fibre and realistic modem, with an optimum equal to 1x (in relative units) when relative power (or OSNR) is 0dB from the nominal setting. At the time of pre-SDM systems, this weakly nonlinear fibre was superior to more standard, yet cheaper, fibre (80µm² effective area), because fibre capacity could be increased by 20% (from red to blue curve), however at the cost of 2dB (+58%) more repeater power. Similar trends could be expected with advanced nonlinearity compensation schemes. Such systems are really close to theoretical Shannon capacity limits, only 55% higher at same power (see solid black or blue dotted lines). Beyond, increasing doubling power in a linear fibre would at best increase fibre capacity by 25%.
The road to Shannon and high fibre capacity is thus a dead-end to cope with the traffic increase.
At least more cable powering should be better used to feed more fibres.
HOW SDM EXPLOITS THE CONSTRAINTS TO INCREASE TOTAL CAPACITY
The SDM paradigm goes one step further: cable powering could first be better used to feed more fibres, resulting in lower power, lower OSNR and lower capacity per fibre, but higher cable capacity and a better cost per bit. And when the gains stemming from parallelism become marginal or less cost-effective, further cable powering solutions will enable to further increase the amount of parallelism and cable capacities.
To illustrate that statement, Figure 2 represents cable capacity versus total repeater output power (product of amplifier optical output power and fibre pair count, that roughly represents the electrical powering devoted to repeaters). The reference configuration (black solid line) is the same as in Fig. 1, using a given amount of 150µm² fibre at maximum fibre capacity for nominal
Figure 2: Achievable cable capacity limits in a Transatlantic-like link, for different total repeater output powers and fibre counts.
repeater power. Then the number of fibres is increased from 1x to 8x times the reference (from black to grey curves), and fibre type is changed (150µm² / 80µm² fibres in solid / dashed line). At nominal total repeater power, doubling the number of fibres leads to -3dB decrease in amplifier output power per fibre and -15% decrease in fibre capacity, as per Fig.1. Yet the overall cable capacity jumps to 1.7x. Even with a cheaper, more nonlinear 80µm² fibre, cable capacity rises to 1.6x, paving the way for design trade-offs offering extended capacity and cost efficiency. Benefits from spatial parallelism do not stop there, and multiplying fibre count by 4x or 8x (with the 80µm² fibre) enables to reach a cable capacity up to 2.7x before capacity saturates. In such regimes, fibre nonlinearities hardly matter, as well as the need for special fibres or compensation schemes. To further increase cable capacities, new powering solutions will then be necessary along with higher fibre / core count.
The SDM philosophy thus consists in best exploiting this high reservoir of cable capacity under powering constraints, to deliver higher capacities and maximize cost per bit.
require a minimum of pump / output power. With 18kW cable powering, up to 48 fibre pairs could be efficiently used over transatlantic distance, and way less beyond. One last limitation is technological: the amount of parallelism that can be brought in a cable, and the cost. In practice, the SDM design is tailored to each project, to
up to 4 pumps to feed 1 amplifier pair, a set of N power efficient pumps operated at high current can be combined/farmed to feed sets of M=1,2,3,4… amplifier pairs, depending on the project) ; electrical dimensioning (conductor size, allowable voltage) is co-designed with optical amplification to maximize bits per watt under the cable’s voltage limit.
“Space-division multiplexing is redefining submarine cable economics by increasing fibre counts and total throughput, delivering far greater capacity without relying on ever-higher power levels.”
deliver high capacity at the best price per bit in a power-efficient manner.
ENGINEERING CHOICES THAT MAKE SDM WORK
Fibre count and mechanical design: Cable must physically accommodate more fibre pairs while meeting mechanical requirements; manufacturers balance fibre count against cable
Optical fibers and optical design: Being less submitted to nonlinear effects, different technoeconomic trade-offs emerged with 110-125µm² effective area fibres. Similarly, favouring spatial diversity against SNR, repeater spacing increased to typically 70-80km.
REAL SYSTEMS AND MILESTONES
The transition to SDM is well illustrated by the evolution of recent Transatlantic cables deployed over the last decade along with an increase of fibre count, a decrease of fibre capacity, and
IS THERE AN OPTIMUM LEVEL OF PARALLELISM?
There are a few main limitations to parallelism. Two are fundamental: in a repeatered link, SNR should remain higher than 0dB in theory, 2-5 dB in practice, while power-efficient optical amplifiers
diameter and laying cost. So far, 200µm-diameter fibre is now being used to enable 24 fibre pairs per cable.
Repeater and pump architecture: SDM repeaters are engineered to efficiently distribute pump power across fibres (instead of using
more than a doubling of cable capacities, as detailed in Table 1. In 2018, Marea cable, the last preSDM cable, was operated with 8 fibre pairs (150µm²), high power amplifiers, leading to demonstrated fibre capacities as high as 28Tb/s, thus cable capacities
Table 1 : Demonstrated / design capacities per cable and fibre over recent Transatlantic cables
as high as 222 Tb/s. The first generation of SDM designs were proposed in 2016 by ASN, then NEC and Subcom, and were in service starting from 2021: Google’s Dunant offered 12 fibre pairs with lower demonstrated fibre capacity, yet corresponding to higher 307Tb/s cable capacity. Subsequently, 16-fiber pair cables were deployed with Grace Hopper (owned by Google) and Amitié (owned by Meta, Vodafone, Orange), with even lower demonstrated fibre capacity for Amitié, amounting to 400Tb/s cable capacity, with same powering limits as the Marea cable. Even more recently, Anjana cable, in service in 2025, offers a design capacity of 480 Tb/s with 24 fibre pairs. These deployments demonstrate SDM’s maturity from concept to production.
Several generations of SDM have already been laid, with first the introduction of new repeater, pump farming and cable designs to enable up to 16 fibre pairs, then the move to 24 fiber pairs designs with the 200µm instead of 250µm outer diameter fibre along with cable powering capabilities up to 18kW. Today, a third generation is being prepared with up to 48 equivalent fibre pairs so as to build 1Pb/s Transatlantic cables. Different options are still open for the different manufacturers: 48 fibre pairs, or 24 fibre pairs inside the cable using either bidirectional 2-core fibre technologies or C+L amplification. In any case, 48 amplifier pairs will fit in a repeater housing.
TRADEOFFS AND OPEN TECHNICAL QUESTIONS
Manufacturing and deployment cost vs. capacity. More fibres help increasing raw capacity but raise
cable manufacturing and laying complexity; the optimal fibre count depends on projected traffic growth and unit costs.
The “brute force” solution to increase the number of fibre pairs is to increase the diameter of the cable. But optimisation of the repeater and fibre technology evolution can open more elegant solutions. At medium term, multi-core fibres (MCF) and other spatial multiplexing approaches could further increase spatial density, but they introduce new mechanical, splicing and reliability challenges for submarine use, complicating in particular future cable repairs at sea. Up to 4 core fibres could be envisaged in the future, in the cable and optical amplifiers, while being compatible with more and more standardized, pluggable transceivers. Similarly, C+L band amplification could also enable to double the effective number of fibres/cores. Beyond, extremely low loss and high bandwidth Hollow Core Fiber could change the game yet requiring a totally new ecosystem.
In conclusion, SDM has been key to increase cable capacities in a cost-effective manner over the past few years, by extracting the most from the injected power into a submarine cable. It has led to a doubling of Transatlantic cable capacity. To cope with the future needs for capacities, innovative more parallel and compact solutions must be explored, along with solutions to increase the injected power into repeaters.
USEFUL REFERENCES
10. J. Chesnoy, J.-C. Antona, “Correlation between technology and market cycles,”, SubTel Forum, January 2026
11. J.-C. Antona and J. Chesnoy, “Undersea Fiber Communication Systems”, Edition 3,
12. S. Varughese, D. Lavery, M. Stephens, H. Sun and P. Mertz, “Trans-Atlantic Record Deployment Achieving 24 Tb/s Capacity Enabled Through Probabilistic Shaping and FEC Gain Sharing,” 2025 Optical Fiber Communications Conference and Exhibition (OFC), San Francisco, CA, USA, 2025, pp. 1-3. Dr Jean-Christophe ANTONA is co-editor of the third edition of Undersea Fiber Communication Systems (Elsevier). An Ecole Polytechnique MSc and Telecom Paris MSc and PhD, he has been an expert on terrestrial and submarine networks and transmission modelling for 27 years within Alcatel, Bell-Labs and ASN, where he is currently in charge of Research & Technology projects. He authored or coauthored more than 120 publications and 15 patent applications.
Dr. José Chesnoy is co-editor of the third edition of Undersea Fiber Communication Systems (Elsevier). An École Polytechnique MSc and PhD, he pioneered amplified submarine cables at Alcatel Research and spent 25 years at Alcatel Submarine Networks, serving as CTO until 2014. A Bell Labs Fellow, he co-founded Subsea Optica in 2019.
THE SOUTH CHINA SEA ROUTING TAX: THE
GEOPOLITICAL COST SHAPING
INDO-PACIFIC SUBSEA CABLE ECONOMICS
By Billy Buddell
Western-aligned cable operators are making individually rational routing decisions that are collectively reshaping the economy of Indo-Pacific connectivity.
The cumulative increased cost of these decisions is becoming a structural constraint on project viability.
New Western-aligned cable builds are consistently avoiding the South China Sea (SCS) in favour of longer routes through Indonesia and the Philippines. These alternative paths are shallower, operationally more complex, and more expensive. This shift reflects broader U.S.-China tech decoupling, in which cables are assessed as strategic infrastructure, rather than purely private commercial assets. This makes the more direct route between Southeast and Northeast Asia increasingly unattractive for Western-aligned consortia. Operators are therefore treating geopolitical risk as an engineering and economic restraint, rather than a background political con-
In practice, this means route planners are trading shorter geometry for lower geopolitical exposure, as seen in recent projects. Apricot was rerouted to avoid the SCS, running through Indonesia and the Philippines. Bifrost runs from Singapore to the U.S. West Coast via the Java Sea and Celebes Sea, a deliberate non-SCS path. Echo was rerouted through the Java Sea, landing in Indonesia, Guam, and Singapore rather than taking the more direct route. Each of these decisions is rationally consistent with Western-aligned geopolitical risk tolerance, but less efficient from an engineering and cost perspective. This routing logic applies specifically to Western-aligned consortia— cables backed by U.S. and allied hyperscalers, under frameworks like the Clean Network Initiative and structured to exclude Chinese vendors. Chinese-built cables continue to transit the SCS, as do some regionally focused systems with mixed consortium membership. The routing tax, therefore, is not an industry-wide cost, but the price of geopolitical alignment.
THE PRICE OF GEOPOLITICAL ALIGNMENT
The nine-dash line—China’s expansive maritime claim covering most of the SCS—creates two compounding costs for Western-aligned cable projects. Cables transiting waters China claims can face political exposure during construction, while future maintenance also risks delays or complications if repair vessels must operate in contested areas. The routing solution is therefore to skirt claimed waters, using Philippine and Indonesian waters instead. These routes are longer, the waters are shallower, and consequently installation becomes more complex.
Carnegie’s 2024 Southeast Asia cable study confirms the cost driver directly. Circumventing the SCS increases laying costs “because of the extra lengths of cable and additional sheathing required to better protect cables in the shallower waters near Borneo.” These detours can add hundreds of kilometres to routes of over 19,000 km (in the case of Bifrost, with its full trunk length measuring 19,888 km). TeleGeography puts the rough cost of
cables at $6,000-$20,000 per kilometre, with other sources claiming as high as $50,000. With wet plant costs running to tens of thousands per kilometre and SCS detours potentially adding hundreds of kilometres to route length, the additional cable cost alone would run to millions of dollars per project. This is before shallow-water armouring, increased burial requirements, and additional vessel time are factored in. This is the routing tax in practice: the dollar cost of a geopolitical decision, embedded in every kilometre of cable laid through Indonesia and Philippine waters rather than the SCS.
The routing tax does not impact an otherwise healthy industry. Cable laying vessels (CLVs) used for long haul subsea projects are commonly chartered for day rates in excess of $180,000. This is a significant structural constraint driven by limited global fleet capacity and surging demand from both telecoms and offshore energy projects competing for the same vessels. Shallower, more complex routes require more vessel time than deep-water laying. In this context, each additional week of vessel time required by SCS avoidance can add millions of dollars to project cost. The routing tax increases the vessel days required at a critical moment where securing those days is increasingly expensive and competitive. These are therefore not independent cost pressures. They compound each other on every project that reroutes to skirt the SCS.
structural constraints, individual operators are optimising for their own project’s routing cost. However, this often occurs at the expense of optimising for the collective consequence. There are 11 in-service international submarine cables connecting the Philippines, and another 6 transpacific and intra-Asia cables under construction. This reflects a pipeline of projects including Apricot, Asia Direct Cable, Candle, ALC-style consortia, and Luzon Bypass-fed routes landing via Luzon-side stations at Baler, Aurora and San Fernando, La Union, with existing landing infrastructure operated by incumbent providers such as PLDT. This concentration may reduce route risk
projects. For operators already managing the cost and schedule pressures of non-SCS routing, this regulatory environment adds additional timeline uncertainty and legal resource costs that compound the physical routing premium. These costs, while less visible, also affect feasibility at the margin—particularly for projects where the business case is already under pressure from routing and supply-side constraints.
“Geopolitical tensions in the South China Sea are reshaping Indo-Pacific cable economics, forcing Western-aligned operators to trade routing efficiency for strategic and regulatory security.”
at the project level but increases systemic vulnerability if a single regional shock—such as an earthquake, typhoon, or port disruption—affects multiple landings simultaneously.
THE SYSTEMIC COST OF CONVERGENCE
Faced with these significant
There is a further component of the routing tax driven convergence that is rarely captured explicitly: regulatory complexity at the landing point. The Philippines’ cable landing environment involves multiple authorities telecommunications regulators, environmental agencies, and local government units. A unified regulatory pathway is being developed, but there are still opportunities to reduce barriers to foreign investment via cable
Quantifying the total routing tax precisely is complicated because rerouting around the SCS increases cable length and requires more burial and armouring in shallower waters. These costs are non-linear depending on how sharply a route is bent and how much shallow-water work is required— Carnegie, TeleGeography, and adjacent research consistently describe a premium that is material and sensitive to these factors, but without a universal figure. The combination of premium day rates in a supply-constrained CLV market and TeleGeography’s estimated $6,000-$20,000 perkm cost band—alongside burial and armouring costs that come with shallower, more complicated routes—suggests that any substantial rerouting around the SCS can add a significant cost increase to a project-scale budget. For a system like Bifrost, with a total estimated cost of around $760 million and a trunk length of over 19,000 km, this routing-driven component likely pushes the premium into the tens of millions of dollars.
A LONG-TERM STRUCTURAL COST
The routing tax will remain a structural feature of Western-aligned
Indo-Pacific cable economics for as long as the nine-dash line defines the political geography of the SCS—which is to say, for the foreseeable future. This Western-aligned consortium logic drives both the exclusion of Chinese vendors and the avoidance of Chinese-claimed waters. Reported advances in deep-sea cable intervention capabilities—such as systems capable of operating at depths of around 3,500 metres—reinforce the framing of subsea infrastructure as a persistently contested domain, introducing an additional layer of uncertainty around repair risk and long-term asset security. Even without confirmed cases of deliberate cable sabotage, this uncertainty is incorporated into planning assumptions by governments and operators.
The routing tax also introduces
a competitive asymmetry. Chinese-aligned cable infrastructure does not face the same SCS routing constraints—SCS transit remains commercially and operationally available. While Chinese-aligned systems operate under a different set of geopolitical and commercial limitations, retaining access to shorter, lower-cost routes is a structural advantage. As demand for regional connectivity intensifies, driven by AI infrastructure requirements and hyperscaler expansion, more cables will need to be built. The structural cost burden of Western-aligned routing is substantial—subsequently some projects will be viable, and some will not. The geopolitical logic that drives SCS avoidance is rational, however its commercial consequences are cumulative and increasingly material at the margin. The key
concern will be whether they can be absorbed at scale, or whether they begin to materially constrain project selection, timing, and overall network buildout. Billy Buddell is a London-based analyst and writer focused on geopolitics, digital infrastructure, and subsea cable security. He holds an MSc in International Politics from SOAS, University of London, and writes on strategic risk, infrastructure resilience, and the commercial and geopolitical pressures shaping global connectivity.
NIS2’S EXTENDED SCOPE TAKES A DEEP DIVE: UNPACKING THE EU COMMISSION’S PROPOSED EXPANSION TO SUBMA-
RINE DATA TRANSMISSION INFRASTRUCTURE
By Mike Conradi, Nicholas De Lacy-Brown, Christian Keogh, Henry Kilding & Lola Stirling
NIS2, the EU’s second Network and Information Systems Directive, is not going anywhere.
While the swathe of organisations newly in scope of the EU’s hallmark cybersecurity directive may have hoped that the EU’s recent announcements on regulatory simplification (including the Digital Omnibus) might have reduced their compliance burden, in some cases the EU is actually proposing to expand the scope of NIS2 further.
In a set of proposed targeted amendments to the NIS2 Directive announced on 20 January 2026 (the “Proposal“), the European Commission has suggested a significant change to the organisations in scope of NIS2 that will be of particular note for entities that are operators of Submarine Data Transmission Infrastructure (SDTI). Under the Proposal, operators of SDTI would fall under the scope of NIS2 as a “sector of High Criticality” and as such, presuming they meet the relevant size criterion, will be “essential entities” triggering higher levels of regulatory supervision, proac-
tive audits, and accountability requirements (including personal liability considerations) all of which could require careful mapping, particularly in complex consortia models.
Building on our recent analysis of the Proposal, this article takes a closer look at the specific changes suggested to bring SDTI squarely into scope, and why SDTI stakeholders should track this closely over the coming months. To note, whilst some organisations operating infrastructure in this space may have already been in scope of NIS2 as providers of public electronic communications networks and services or cloud computing service providers, the Commission is now proposing to specifically target the SDTI sector more broadly. This development reflects the Commission’s intention to harmonise cybersecurity obligations across critical infrastructure and address growing geopolitical and cyber-related risks which it sees as particularly pertinent to undersea communications systems.
WHAT IS THE CHANGE?
As noted by the Commission in their proposals, SDTI has his-
torically been operated by entities already falling within NIS2’s scope (including public electronic communications networks / services or cloud service providers). However, not all SDTI operators fall neatly into these categories, and some entities may operate or lease SDTI without being captured by NIS2. For example:
operators of non-public electronic communications networks; and entities leasing or co-operating portions of infrastructure to public network providers.
The proposed inclusion of a specific new category of SDTI within the scope of NIS2 therefore seeks to capture all types of entities operating in submarine data transmission, recognising the increasing risks to submarine data transmission infrastructure and their resulting high criticality.
It is not surprising then that under the proposed amendments to NIS2, SDTI is defined broadly. It includes not only the subsea cables themselves but any infrastructure essential to their operation, such as landing stations and the terrestrial portions of the network (i.e. the “fronthaul” between
the beach manhole and the landing station segments).
The expanded definition recognises the complex and distributed architecture of SDTI and the essential role it plays in the resilience of the EU’s digital ecosystem. Harmonising the oversight of SDTI operators’ cybersecurity compliance under NIS2 is intended to bolster the resilience, redundancy planning and security of Europe’s digital backbone.
WHO COULD BE BROUGHT INTO SCOPE?
In the last several years, the submarine cable industry has seen rapid transformation and convergence, with “big tech” hyperscalers establishing and owning many of the major new submarine cable routes for their own internal capacity requirements, rather than being owned and operated by traditional telecom companies. On our reading of the amends, such large players in the industry would now appear to be caught under NIS2 in respect of any such use.
Another feature of the sector is the use of consortium-based arrangements for construction and operation of submarine cable systems. Here, each consortium member will own and operate an agreed number of fibre pairs on the cable system for their own purposes. Prior to the Commission’s Proposal, there was some uncertainty as to whether the use of one fibre pair on a cable as a public electronic communications network/ provision of a public electronic communications service would cause the full system to be subject to NIS2, especially in relation to shared infrastructure (such as repeaters, branching units, SLTE equipment and
cable landing infrastructure). The Commission’s Proposal simplifiers matters, as it makes it clear that all submarine cable system operators which will be caught. This is potentially a significant change for consortia cables.
Crucially, NIS2 applies to specific entities not to corporate groups as a whole. A corporate group that owns or co-owns cable infrastructure may therefore have a single SDTI-related entity that falls into scope and that entity must independently meet Annex I obligations.
There are however a number of questions which arise from the proposed amends which have not yet been unpacked by the Commission. For example, it is unclear how the territorial reach of NIS2 will apply to SDTIs and whether it will be a requirement for the relevant cable to physically land in the EU in order for it to be caught under NIS2, or whether a non-EU landing cable might be caught if the “customer” entity is EU. This might be the case where an organisation buys capacity on a US to UK cable, with terrestrial fibre up to a point, and then capacity on a UK to EU cable. It is currently unclear whether such arrangements would be covered, and it is likely that current jurisdictional rules applying under Article 26 of NIS2 may require specific amends in anticipation of this and similar scenarios.
ENHANCED COMPLIANCE BURDEN
If the proposals to include SDTI in the scope of NIS2 are realised, operators will face:
mandatory implementation of “appropriate and proportionate” cybersecurity measures includ-
ing supply chain security requirements.
Three-stage notification obligations upon the occurrence of a “significant incident” (where an “incident” is defined as an event compromising the availability, authenticity, integrity or confidentiality of stored, transmitted or processed data or of the services offered by, or accessible via, network and information systems, and the “significance” is based on availability of the service and impact – we do not therefore consider this would include incidents entailing physical damage to the cable), with an early-warning notification required within 24 hours, a follow up within 72 hours and a comprehensive report within 1 month of the organisation’s becoming aware of the incident.
Management-body accountability, including duties to approve and oversee cybersecurity measures and to receive mandatory cybersecurity training. Supervisory authorities are able to suspend management functions pending breach resolution and management bodies may be subject to personal liability for non-compliance.
Since the majority of SDTI providers are likely to surpass thresholds for small and medium-sized entities (which are made up of entities which employ fewer than 250 persons and have an annual turnover not exceeding EUR50 million/ balance sheet EUR43 million), they are likely to be classified as “essential” rather than important entities, and be subject to the additional burden or pro-active enforcement measures, including unplanned audits, temporary suspension of cybersecurity certifications and management
functions and financial penalties of up to €10 million or 2% of global annual turnover, whichever is higher.
GOVERNANCE ISSUES FOR CONSORTIA
As stated above, Submarine cable systems are frequently owned and operated by consortia and fibre-pairs might be allocated on a long-term basis (by contracts known as “IRUs”) to third parties. This raises structural questions regarding which entity is responsible for NIS2 compliance, for example:
Who is the operator?
Which party must ensure cybersecurity controls are implemented across shared infrastructure?
Which party should be deemed responsible for compliance with NIS2, or would a model of joint responsibility be required?
Who must meet the 24-hour incident reporting clock?
How should responsibilities be allocated contractually, especially where cable management is outsourced to a landing-party operator or a third-party system supplier?
In the absence of clear EU-wide guidance, these issues will need to be addressed contractually within relevant agreements such as joint build agreements, Construction & Maintenance Agreements (C&MAs) or landing party agreements.
WHEN IS THE PROPOSAL LIKELY TO BECOME LAW?
Given the significant delays already seen in NIS2 implementation, and the fact that the Proposal will have to go through trilogue, it is likely that the Proposal (wheth-
er or not unamended) will not become law until the very end of 2026, or more realistically, sometime in 2027, and then with an additional 12 months on top of that for its transposition into Member State laws. Accordingly, SDTI entities should anticipate varying timelines, supervisory expectations and registration requirements across Member States once the change is adopted.
WHAT TO DO NOW?
To get ahead of the Proposal coming into force (if it were to be in its current form), STDI stakeholders may want to consider the following actions:
run a targeted applicability assessment to identify SDTI entities that may newly fall within scope of NIS2;
perform a gap analysis against NIS2’s core requirements, focusing on incident reporting readiness and cybersecurity risk management measures;
map consortia and landing-party contracts, inserting clear NIS2 cybersecurity responsibility, and flow-downs, audit and notification provisions; and
identify current cybersecurity governance arrangements, testing their alignment to the management body requirements, and personal liability, under NIS2.
Mike Conradi is a Partner at DLA Piper LLP, co-chairing its international telecoms practice and leading digital infrastructure.
Ranked among the world’s top telecoms lawyers, he has advised on more than 100 submarine cable projects over 25 years and regularly
delivers legal masterclasses at SubOptic events.
Henry Kilding is an Associate in DLA Piper’s London office, specialising in cybersecurity, data protection and technology. He advises clients on cyber incident and data breach response, complex data protection issues, and data and technology centric transactions, and supports them in navigating emerging digital and AI regulation.
Nicholas de LacyBrown is a Legal Director in the IPT team at DLA Piper’s London office specialising in data, cyber and digital regulation as well as technology outsourcing. A significant portion of his practice is driven by the EU’s Network and Information Systems Directive (NIS2) and parallel NIS regime in the UK, helping clients to navigate the complex cybersecurity and associated governance requirements across a range of in-scope industries.
Christian Keogh is a Senior Associate in DLA Piper’s telecommunications practice, working on a variety of regulatory and commercial projects for clients in the Asia-Pacific, Middle East, Africa, Europe and the UK.
Lola Stirling is a trainee solicitor in DLA Piper’s London office, working in the Intellectual Property and Technology team. She has experience in supporting clients on international projects involving complex risk and infrastructure issues.
Helping submarine cable projects stay coordinated, compliant, and operational in the field.
Contact WFN Strategies today to
FROM MAXWELL’S EQUATIONS TO SUBSEA FIBRE OPTICS: OPTICAL FIBRES AS WAVEGUIDES [PART 2] – FROM TIR
AND MODE FIELD DIAMETER TO DISPERSION, THE
STORY OF THE WAVEGUIDE CONTINUES
By Anna Bridget Sheehan & Derek Cassidy
ABSTRACT
This paper traces the evolution of optical waveguides, from the foundational laws established by Newton, Huygens, and Maxwell to today’s cutting-edge submarine cable technologies.
It examines the progression of fibre optic science through key milestones, including Dense Wavelength Division Multiplexing (DWDM) and specialty fibres, while exploring emerging frontiers such as spatial division multiplexing, hollow-core, and multicore fibres. It is presented in three parts.
GUIDED BY TOTAL INTERNAL REFLECTION (MFD: MODE FIELD DIAMETER)
The preceding relations describe the propagation of electromagnetic waves across different waveguide structures. Despite their varied geometries, all share a common theoretical origin in Maxwell’s equations and their subsequent formulations. What changes from system to system
is not the governing physics, but the manner in which the field is confined and controlled.
Attention now turns to the specific mechanisms by which light propagates within optical fibre. Concepts such as mode field diameter (MFD), total internal reflection (TIR), and macrobending losses are not peripheral details; they determine how efficiently light remains guided within the fibre core over long distances. The principle underlying optical confinement can be traced to John Tyndall’s nineteenth-century demonstrations. In his wellknown experiment, a beam of light introduced into a stream of water remained visibly trapped within the flowing arc, illustrating that light could be guided within a transparent medium [40].
The effect observed is now formally described as total internal reflection: when light strikes an interface at an angle exceeding the critical angle, it is reflected entirely back into the higher-index medium rather than refracted outward. In optical fibre, this same principle ensures that light remains confined within the silica core, provided the conditions
Figure 6: John Tyndall’s experiment to explain total internal reflection of light in a transparent medium [41]
of incidence are satisfied. What appeared in Tyndall’s lecture theatre as a striking visual phenomenon has become the operational foundation of global fibre-optic communication.
To ensure that light remains confined within the fibre core, it must enter at an angle that satisfies the condition for total internal reflection. This angular limit defines the
cone of acceptance. As illustrated in Figure 7, the parameter governing this condition is the numerical aperture (NA). Equation (9) expresses this relationship by linking the refractive indices to the angle of incidence through the sine term, . It relates material properties and geometry directly. For practical analysis, equation (9) may be reformulated as equation (10), which provides a more convenient expression for calculation, as shown below.
tured with an 8° angled end-face. This angular offset directs reflected light away from the transmitting source, thereby minimising feedback into the laser. Such reduction of reflected power is particularly critical in systems including video transmission, Raman and EDFA amplification stages, dense wavelength division multiplexing (DWDM), and high-speed networks operating above 10 Gb/s [44]. The performance of a connector in this respect is quantified by its optical return loss (ORL), defined as the ratio of re-
N m = .5(πd/λ)2 (n02 – n12) [10]
In most single-mode optical systems, distributed feedback (DFB) lasers are employed as the primary transmission source due to their narrow spectral linewidth, typically measured in nanometres, and their stable, coherent output characteristics [42,43]. These sources are aligned axially so that light enters the fibre core at 0°, maximising coupling efficiency within the fibre’s numerical aperture. To reduce back reflections at fibre interfaces, angled physical contact (APC) connectors are widely used. Unlike standard flat-polish (0°) connectors, APC connectors are manufac-
flected optical power to incident optical power at the interface between two fibres. Because fibre end-faces cannot achieve perfect physical continuity, a microscopic gap or refractive index discontinuity exists at the interface. This discontinuity produces Fresnel reflections, as described in equation (11) [45]: [11]
back toward the source, analogous to viewing one’s reflection in a mirror aligned normal to the line of sight. By contrast, an 8° APC connector deflects reflected light into the cladding rather than back along the fibre axis, thereby reducing source perturbation. Optical return loss is typically expressed in decibels. Standard flat-polish connectors generally exhibit values in the range of 25–35 dB [46], whereas APC connectors commonly achieve 50–60 dB. Although these figures are reported as positive values, higher return loss corresponds to lower reflected optical power, indicating improved suppression of back-reflection. Having considered Fresnel reflections and numerical aperture, attention now turns to propagation within the optical fibre itself. Two principal concepts govern this behaviour: total internal reflection (TIR) and mode field diameter (MFD). As demonstrated in Tyndall’s experiments, light remains confined within a medium when it encounters an interface at an angle exceeding the critical angle. In optical fibres, confinement arises from the refractive index contrast between the core and the cladding. The core refractive index is approximately 1.467 (commonly denoted ), while the cladding has a slightly lower refractive index (n2)
This expression relates reflected power to the refractive index difference between adjoining media. When a connector endface is perpendicular (0°) to the fibre axis, a portion of the reflected light propagates directly
The condition for total internal reflection follows from Snell’s law and may be expressed as: sin(ɵc) = n2/n1 [12]
Here, n represents the refractive index of the medium through which the light propagates. When light travelling within the higher-index core strikes the core–cladding boundary at an angle greater than the critical angle an-
Figure 7: A sketch of the numerical aperture that a singlemode fibre will accept a laser before ant y refractions occur. [9]
gle θ c , it is entirely reflected back into the core rather than refracted into the cladding. This is the mechanism by which light continues to propagate along the fibre without escape. The cone of acceptance illustrated in Figure 7 is a direct geometric consequence of Snell’s law and is fully consistent with the condition for total internal reflection.
From Snell’s law, the relationship
the incident beam is reflected entirely back into the optically denser medium, allowing continued propagation along the fibre core. The angle of incidence equals the angle of reflection, consistent with the law of reflection. Equation (15) also relates to Brewster’s angle, which occurs when the reflected and refracted rays are orthogonal (90°) [47]. Under such circumstances, total internal reflection can arise when the refractive index contrast satisfies the required boundary
conditions. This behaviour is illustrated in the figures below. In the first case, an unclad fibre is considered, where n1=1(air) and n2=1.467 [4], demonstrating the role of refractive index contrast in determining whether refraction or total internal reflection occurs.
between refractive indices and angles of incidence and refraction is given by:
(n1 sinɵ1 = n2 sinɵ2) [13]
At the critical condition for total internal reflection, the refracted angle θ2 approaches 90°, meaning the refracted ray travels along the boundary interface. Under this condition, Snell’s law reduces to the critical angle relationship previously stated. Total internal reflection occurs when the angle of incidence exceeds the critical angle:
ɵi > ɵ c [14]
The angular relationship at the boundary also satisfies:
ɵ1 + ɵ2 = 90º [15]
When these conditions are met,
Figure 10 illustrates normal light propagation within a clad optical fibre. The cladding possesses a refractive index lower than that of the core, ensuring that light incident at angles exceeding the critical angle remains confined through total internal reflection. Any portion of the optical field that extends into the cladding experiences a slightly different propagation constant due to the refractive index contrast, resulting in guidance back toward the core region [48]. However, confinement within the core is not absolute. In single-mode transmission, the guided field ex-
Figure 8: A representation of TIR with regards to critical and incident angles.
Figure 9: An artistic impression of a fibre without cladding where the air is acting as the cladding and this helps total internal reflection and light propagation but being leaky.
Figure 10: An artistic impression of a fibre with cladding which is normal for optical fibre
Figure 11: Total internal reflection with light propagating along the core with leaking into cladding.
tends slightly beyond the physical core boundary. This behaviour is described by the mode field diameter (MFD). Because the propagating wavelength is comparable to the core dimensions, a fraction of the optical power resides in the inner region of the cladding as an evanescent field. The effective diameter of this optical mode is defined as the mode field diameter [49]. Equation (16) provides its numerical representation:
MFD may be understood as the effective optical footprint of the fundamental mode. It characterises the spatial distribution of optical intensity, including the evanescent component that penetrates into the cladding. Conventionally, the mode field diameter is defined at the 1/e2 intensity level, corresponding to approximately 13.5% of the peak optical power at the centre of the mode. Understanding MFD is essential for network performance. A smaller MFD typically reduces bend sensitivity in practical fibre installations, whereas a larger MFD increases susceptibility to macrobending losses, allowing more optical power to leak into
the cladding under curvature or mechanical stress [50]. Figure 11 and Figure 12 illustrate the relationship between core, cladding, and the modal intensity distribution, showing how the optical field extends slightly beyond the physical core boundary even under normal guidance conditions.
CUTOFF AND CAPACITY
Cutoff wavelength is a critical parameter in single-mode transmission. Denoted λ c, it represents the shortest wavelength at which an optical fibre supports only the fundamental mode, LP01. For wavelengths shorter than the cutoff, higher-order modes may propagate, and the fibre begins to exhibit multimode behaviour. Although light will still propagate under these conditions, performance is degraded due to increased bend sensitivity, higher attenuation, and modal dispersion effects. The cutoff condition is defined within the ITU-T G.652 specification for standard single-mode fibre [35]. Given that the typical core diameter of such fibre is approximately 9 µm, careful control of cutoff wavelength ensures that only a single optical mode propagates within the core [51,52]. The cutoff wavelength may be expressed as:
lengths below this value may support additional modes, while wavelengths above it ensure single-mode propagation. An equivalent expression for cutoff wavelength may also be written as:
λ c = πD√[(n0)2 – (n1)]2/2.4 [18]
Where Dis the core diameter and n0 and n1 are the refractive indices of the core and cladding respectively. This form is useful in determining the maximum allowable core diameter for single-mode operation at a given wavelength.
The capacity of an optical fibre is determined by the amount of information that can be reliably transmitted along it. In practical terms, capacity depends on available bandwidth and the achievable signal-to-noise ratio (SNR). It increases as either bandwidth expands or signal quality improves. For an individual optical channel, capacity is commonly described by the Shannon–Hartley theorem:
C = BLog2(1+S/N)
λ c = 2πa.NA/V c [17]
where a is the core radius, NA is the numerical aperture, and V c ≈2.405 is the cutoff value of the normalised frequency parameter (V-number) in optical waveguide theory. For standard G.652 fibre, the nominal cutoff wavelength is approximately 1260 nm [35]. Wave-
Where C is the channel capacity, B the bandwidth in hertz, S the signal power, and N the noise power. The ratio S/N represents the signal-to-noise ratio, typically expressed in decibels. This expression defines the theoretical maximum data rate that can be achieved without error under ideal conditions. In optical fibre systems, however, practical limits extend beyond the Shannon bound. Nonlinear and dispersive effects impose additional constraints. Chromatic dispersion, polarisation mode dispersion, Kerr nonlinearity, scattering phenomena, and excessive return loss all degrade signal integrity and restrict achievable throughput. As data rates increase, these
Figure 11 & 12: MFD as seen with respect to core and cladding.
impairments become increasingly significant.
To maximise spectral efficiency, the ITU-T established standards governing the frequency grid used in dense wavelength division multiplexing (DWDM) systems [53,54]. The fixed channel spacing defined by this grid ensures controlled spectral allocation and minimises inter-channel interference. Figure 12 illustrates the structured nature of this spectrum grid.
Recent advances in optical transmission have further increased fibre capacity through the introduction of higher data-rate channels within the optical spectrum. Channels operating at 100 Gb/s, 400 Gb/s, and now 800 Gb/s are routinely deployed within dense wavelength division multiplexing (DWDM) systems. Capacity growth is no longer achieved sole-
ly by increasing the number of fixed-grid channels, but also by optimising spectral efficiency. One significant development in this regard is the adoption of flexible grid (flexgrid) architectures. Unlike the fixed channel spacing defined in ITU-T G.694.1, flexgrid allows variable channel widths and adaptable spectral allocation, enabling multiple channels of differing data rates to coexist efficiently within the same optical band [55,56]. This approach permits more precise matching between modulation format, bandwidth requirement, and spectral occupancy. Figure 14 illustrates a flexgrid configuration in which channels of different bit rates occupy tailored spectral slots with corresponding channel spacing [57].
Figure 15 shows scalable channels implemented within an Optical Transport Network (OTN) interface, where multiple data streams of varying rates are aggregated and mapped onto configurable media channels. The flexible spectral grid enables these channels to be arranged
Figure 13: An example of a channel spectral grid between 193THz and 194THz
Figure 13: An example of a channel spectral grid showing multiple high data rate channels on same spectrum grid.
Figure 14: An OTNM network using flexgrid as its channel grid reference
without strict adherence to the legacy fixed-spacing structure of ITU-T G.694.1 [55]. Such architectural evolution represents not a departure from foundational theory, but its application at scale. The ability to engineer multichannel, high-capacity optical systems rests upon the electromagnetic principles established by Maxwell, the boundary conditions formalised by Snell, the demonstrations of Tyndall, and the mathematical frameworks advanced by Stokes and others. Contemporary optical networking, in its flexibility and scale, remains rooted in these foundational insights.
DISPERSION AND OTHER LIGHT-LIMITING EFFECTS
The work of Stokes, Raman, Rayleigh and others established that light propagating through a medium is influenced by that medium. The effects extend beyond simple optical attenuation and include a range of dispersive and nonlinear phenomena. Among the principal impairments are chromatic dispersion, phase dispersion (polarisation mode dispersion), four-wave mixing, and return loss, each of which constrains transmission performance.
Chromatic Dispersion
Chromatic dispersion was not attributed to a single discovery but emerged from accumulated research into wave propagation and material behaviour. In optical fibres, it became evident in the late twentieth century that light pulses broaden as they travel along the fibre, in a manner analogous to the separation of colours when white light passes through a prism. In this context, however, the effect occurs within the commonly used transmission band between 1530 nm and 1565
nm. Different wavelengths propagate at slightly different velocities within the optical core. For example, light at 1530 nm travels marginally faster than light at 1565 nm. Moreover, each transmitted pulse is not a single wavelength but a finite spectral band, and each spectral component follows the same principle: shorter wavelengths propagate at a slightly higher group velocity than longer wavelengths. Over distance, this differential propagation leads to temporal spreading of the pulse. Figure 16 illustrates the progressive broadening of optical pulses due to chromatic dispersion. As dispersion accumulates, adjacent pulses begin to overlap, reducing signal distinction and ultimately rendering the transmitted data indistinguishable from noise. Chromatic dispersion is therefore a nonlinear impairment that must be managed through fibre design and compensation techniques. Modern fibres are engineered with either positive or negative dispersion characteristics to mitigate its impact, yet dispersion remains an intrinsic property that must be controlled over long-
haul transmission. Wavelengths near 1309 nm experience minimal chromatic dispersion in standard optical fibres. This behaviour is associated with the material dispersion characteristics of silica, which differ from those at 1550 nm. At 1550 nm, although attenuation is lower and optical power transmission is more efficient, chromatic dispersion becomes more pronounced before compensation is applied [58]. For ITU-T G.652 fibres, chromatic dispersion is commonly described by:
D = S/4(λ-λ4/λ03)
where D is the dispersion parameter (ps/nm/km), S is the dispersion slope, λ is the operating wavelength, and λ0 3 is the zero-dispersion wavelength.
Applying equation (20) yields a dispersion value of approximately 17.08 ps/nm/km at 1550 nm, consistent with ITU-T G.652 recommendations. This value is characteristic of standard G.652 fibres, including commercial variants such as Corning SMF-28e. Other fibre types, such as G.654, exhibit different chromatic disper-
Figure 16: An example of wavelength spreading due to chromatic dispersion
sion coefficients due to variations in core composition and refractive index profile.
Polarisation Mode Dispersion
Polarisation mode dispersion (PMD) is another impairment that affects optical signal integrity. Unlike chromatic dispersion, PMD arises from physical asymmetries within the fibre and cannot be eliminated without replacing or redesigning the affected cable. It is therefore an intrinsic structural effect rather than a purely spectral one. Electromagnetic waves consist of orthogonal electric and magnetic field components. In an ideal, perfectly cylindrical fibre, these orthogonal polarisation states propagate identically. In practice, however, micro-
scopic imperfections, mechanical stress, and slight geometric asymmetries introduce birefringence within the core [59]. Even a slight ovality in the fibre cross-section alters the effective refractive index experienced by different polarisation states. As light propagates along the fibre, the two orthogonal polar-
isation components (commonly described in terms of transverse electric (TE) and transverse magnetic (TM) modes) travel at slightly different group velocities. This occurs because each polarisation state interacts differently with the core–cladding boundary, resulting in a differential propagation delay. Over distance, this small delay accumulates. A phase difference develops between the orthogonal components of the wave. When the full 180° (π radians) phase separation is reached, the two polarisation states are effectively out of alignment. At the receiver, this manifests as pulse broadening and distortion, increasing bit errors because the signal energy is distributed unevenly across the two polarisation states. Figures 18 and 19 illustrate the electromagnetic waveform and the separation of the TE and TM components. The differential group delay between these states may be expressed as:
Δt = Lnᶴ/c (nᶴ/nc – 1) [21]
where Δt represents the differential time delay, L is the fibre length, n is the refractive index, and and n x and n y represent the effective refractive indices for the orthogonal polarisation axes.
Polarisation mode dispersion therefore increases with transmission distance and becomes
Figure 17: Chromatic Dispersion increases as wavelengths gets larger
Figure 18: Chromatic Dispersion with reference to various fibre types
Figure 19: The two phases of an electromagnetic wavefront
Figure 20: An example showing the two phases 90º or π/2
particularly significant in high-data-rate systems, where even small temporal misalignments degrade signal integrity.
The cumulative effect is known as polarisation mode dispersion (PMD) and is commonly quantified using the expression below. PMD is also referred to as differential group delay (DGD) and may be written as equation (22):
Δτ = D ps /km√L [22]
Here, L represents the fibre length, D ps /km is the PMD coefficient specified in ITU-T and manufacturer technical documentation, and denotes the differential time delay between the two orthogonal polarisation states. The square-root dependence on length reflects the statistical nature of birefringence along the fibre.
For practical purposes, ITU-T recommendations often express PMD using a simplified parameter value, typically on the order of:
.2ps/√km [23]
To mitigate the effects of chromatic dispersion (CD) and PMD, and thereby increase transmission capacity, coherent detection and 100 Gb/s technologies were introduced. Coherent systems exploit both orthogonal polarisation states of the optical field as independent signal carriers, significantly improving spectral efficiency. This advancement enabled capacity scaling from 100 Gb/s to 400 Gb/s, 800 Gb/s, and emerging 1.6 Tb/s optical channels [61]. As illustrated in Figure 21, each polarisation component can be independently modulated for data transmission. This princi-
Figure 21: An example of a wavefront phase in a coherent designed system using phase shift keying to put signal onto one a single
pal mirrors techniques long used in radio and microwave communications, now applied at optical frequencies.
Other impairments such as macrobending, return loss (previously discussed), and four-wave mixing also influence signal integrity. These effects, however, are often mitigated through practical engineering intervention. Macrobending losses can be reduced by correcting excessive fibre curvature or repairing damaged sections of cable. Return loss can be improved by cleaning or replacing connectors, or by adopting APC connectors to minimise back-reflections. Four-wave mixing may be alleviated by increasing guard bands between channels or optimising channel spacing within the spectral grid. Macrobending and four-wave mixing are considered in greater detail in a subsequent paper.
REFERENCES
[40] Tyndall, J., “Light and Electricity: notes of two courses of lectures before the Royal Institution of Great Britain”, D. Appleton and Company, University of California Library, 1893.
[42] Al-Rubaiee, M., Sun, X., et al, “Dual feedback distributed feedback laser based on waveguides bragg grating microcavities”, Optica Letters, Vol.50., No. 23, 2025.
[43] Ramaswami, R., Sivarajan, N., Sasaki, G.,” Introduction to Optical Networks”, Optical Networks, 2010.
[44] Kihara, M., Nagasawa, S., Tanifugi, T.,” Design and performance of an angled physical contact type multifibre connector”, Journal of Lightwave Technology, Vol. 14, No. 4, 1996.
[45] Shah, F., “Fibre Optic Connector”, Nirma University Press, 2012.
[46] County, F., Benabid, F., Light, P., “Reduction of Fresnel back-reflection at splice interface between hollow core PCF and singlemode fibre”, IEEE Photonics Letters, Vol. 19, N0. 13, 2007.
[47] Azzam, R,, Goldstein, D., Chenault, D., “Fresnel’s interface reflection coefficients for the parallel and perpendicular polarisations”, SPIE, Polarisations Analysis and Measurement II” SPIE, Vol 2265, No. 120
[48] Gambling, W., “Cladding Refractive Index”, Encyclopedia of Physical Science and Technology, Ed. 3, 2003.
[49] Artiglia, M., Coppa, G., Di Vita, P., Potenza, M., Sharma, A.,” Mode Field Diameter Measurements in Singlemode Optical Fibres”, Journal of Lightwave Technology, IEEE, Vol. 7, No. 8, 1989.
[50] Hackert, M., Zainul, M., “Effective area measurement comparison between direct far field scan and variable aperture method in far field”, Corning Incorporated, 1996.
[51] Modi, A., Balanis, C., “PEC-PMC baffle inside circular cross section waveguide for reduction of cutoff frequency”, IEEE Microwave and Wireless Components Letters, Vol. 26, N0. 3, 2016.
[52] Girard, A.,” Fibre and guided wave optics-measuring fibre characteristics”, Encyclopedia of Modern Optics, 2005.
[60] Easton, R., “TAT-8: The first Transatlantic Optical System”, Fiber Optics Reliability-Benign and Adverse Environment, SPIE, Vol. 1174, 1989.
[61] Al-Rawi, M., “Erbium Doped Fibre Amplifier: Brief overview”, Journal of Physics and Electronics, Vol. 33, 2025.
Derek Cassidy is an optical engineering and submarine cable specialist with more than 30 years in telecommunications. A Chartered Engineer, he is pursuing a PhD at University College Dublin focused on optical engineering and submarine cable technology. He serves on multiple IEEE
and industry standards groups and is technical lead for the Valentia Transatlantic Cable Foundation.
Anna Bridget Sheehan is a BSc Physics (Honours) candidate at University College Cork with experience in network engineering and computational physics. A Microsoft Certified Specialist, she has worked on Vodafone Ireland’s GSM network and conducted research at Tyndall National Institute using AI and machine learning to study signal to noise limits in high speed networks. She also serves as a Physics Tutor at UCC.
Advertise in SubTel Forum publications used by decisionmakers across the entire industry:
• SubTel Forum Magazine
• Submarine Cable Almanac
• Submarine Telecoms Industry Report
• Submarine Cables of the World Wall Map
• Submarine Cables of the World Online Map
GEOPOLITICAL UPDATE MARCH - MAY 2026
by Kristian Nielsen
If the 2024 and 2025 cable story was about shock, spring 2026 is about systems.
The issue is no longer whether submarine cables can become geopolitical targets. That argument is over. The question now is whether owners, operators, and regulators can build an operating model that assumes persistent friction: ambiguous attribution, route concentration, permit delays, repair fleet scarcity, and increasingly militarized maritime behavior around civilian infrastructure. In other words, the cable business is entering the age of managed insecurity (European Commission, 2026a, 2026b; UK Government, 2026a; Ministry of Digital Affairs, 2026a).
That shift is becoming visible across multiple theaters simultaneously. In Europe, the response is becoming institutional, budgeted, and explicitly security oriented. Around Taiwan, resilience is becoming layered, as repeated incidents continue forcing governments and operators to treat backup systems, vessel oversight, and repair coordination as permanent requirements. In the Middle East, route diversification is becoming an architectural necessity as the Red Sea and Hormuz increasingly appear vulnerable to geopolitical instability (European Commission, 2026c; Ministry of Digital Affairs, 2026b, 2026c; Maccioni, 2026; Moss, 2026; Quigley, 2026).
The operational implications extend far beyond any single region. What is emerging instead is a globally interconnected resilience challenge in which cable security, repair logistics, route diversity, and state involvement are increasingly linked across Europe, the Indo-Pacific, the Middle East, and North America. Decisions made in one theater now directly influence redundancy planning, permitting assumptions, and restoration strategies elsewhere. The result is a submarine cable sector that is becoming more coordinated, more security-conscious, and more strategically important to national infrastructure planning worldwide.
EUROPE
Europe’s spring cable agenda is becoming tangible. On 17 March, the European Commission opened two CEF calls worth €200 million: €180 million for 13 Cable Projects of European Interest and €20 million for “smart cable” monitoring, situational awareness, and early warning. Brussels is now funding both new routes and better sensing on existing infrastructure (European Commission, 2026b).
Those calls fit the Commission’s broader February cable-security push, including the Cable Security Toolbox, CPEI framework, and an amended work program allocating €347 million to strategic cable projects, including repair-capacity modules at ports or shipyards. If the risk now includes sabotage and hybrid coercion, resilience cannot stop at laying more wet plant. It must include repair staging, monitoring, routing priorities, and rapid recovery (European Commission, 2026a).
Northern Europe reinforces that shift. NATO’s Baltic Sentry frames cable and pipeline protection as a multi-domain military problem, deploying frigates, maritime patrol aircraft, and naval drones. The UK added a harder edge on 9 April by disclosing that it had tracked a Russian Akula-class submarine and specialized GUGI units around critical undersea infrastructure, describing the behavior as covert and hostile (NATO SHAPE, n.d.; NATO SHAPE, 2026; UK Government, 2026a, 2026b).
Europe is also emphasizing geographically diverse southern and trans-Mediterranean corridors. Sparkle’s GreenMed project positions the Adriatic as a Central–Eastern Mediterranean corridor, while 4iG and Grid Telecom signed an MoU to explore a resilient Albania-Greece route extending through the Adriatic and Mediterranean toward Middle East-facing routes. Sparkle and Algérie Télécom’s Italy-Algeria initiative similarly points toward more politically supported cable projects and submarine systems as tools of economic diplomacy (TIM Group, 2025, 2026; 4iG Group, 2026).
For European operators and regulators, resilience will not be won simply by declaring cables “critical
Actor Measure
European Commission Cable Security Toolbox, CPEIs, and amended CEF Digital program
European Commission New CEF calls for backbone and smart-cable upgrades
European Commission Brussels high-level conference on submarine-cable resilience
€347 million, including a €20 million repair-capacity call
€180 million for backbone/CPEIs; €20 million for smart monitoring
Not specified
NATO Baltic Sentry maritime activity
Not publicly specified
Moves EU posture from risk mapping to funded resilience, repair staging, and priority corridors
Supports route upgrades, situational awareness, and early warning for critical infrastructure
Brought public authorities, operators, industry, and academia together around next-step implementation
Uses frigates, maritime patrol aircraft, and naval drones to protect critical undersea infrastructure and improve coordination with allies, partners, and industry
European Commission (2026a)
Taiwan MODA Cable-damage analysis and four-direction protection strategy
Public policy program; funding details not specified in release
U.S. House / CBO Strategic Subsea Cables Act of 2026
U.S. Senate Foreign Relations Committee Hearing on Baltic sabotage and Indo-Pacific lessons
Budget effect scored by CBO; public release emphasizes policy tools more than headline funding
Not applicable
Shifts Taiwan from reactive repair to proactive defense, stricter penalties, early warning, and more backups/new cables
Would strengthen
U.S. diplomatic engagement, sanctions tools, staffing, and interagency coordination for undersea infrastructure
Elevates subsea infrastructure into U.S. national-security oversight and ties Baltic and Taiwan vulnerabilities together
European Commission (2026b)
European Commission (2026c)
Ministry of Digital Affairs (2026a)
House Foreign Affairs Committee (2026); Congressional Budget Office (2026)
U.S. Senate Committee on Foreign Relations (2026a, 2026b, 2026c)
NATO SHAPE (n.d.)
FAULT LINES
infrastructure.” It will depend on repair-asset positioning, fast maritime response to anomalous vessel activity, and alternative corridors that can absorb traffic during disruption. Europe’s toolbox is best understood as the framework for a more explicitly strategic cable market (European Commission, 2026a, 2026b, 2026c).
INDO-PACIFIC AND TAIWAN
Taiwan remains a revealing cable-resilience case study because it combines geographic exposure, repeated incidents, and unusually transparent reporting. MODA’s 7 April analysis reframes Taiwan’s response from “passive repair” to “proactive defense” and “resilience building,” citing nearshore human interference, offshore natural disaster risks, stricter penalties, earlier warning, stronger physical protection, and backup systems (Ministry of Digital Affairs, 2026a).
io is not a single cut, but overlapping faults, mixed causes, and a maintenance environment where triage becomes as important as the initial event (Ministry of Digital Affairs, 2026c).
Taiwan’s resilience model is increasingly layered rather than binary. Dual wet routes are no longer enough. Microwave, non-geostationary satellite experiments, vessel monitoring, criminal penalties, pre-crisis repair coordination, permits, and new cable construction all matter. MODA’s approach reads less like a local policy note than a template other high-risk island and chokepoint markets may need to adopt (Ministry of Digital Affairs, 2026a, 2026b, 2026c).
“Cable resilience is no longer about having backup routes on paper — it depends on repair access, layered redundancy, vessel oversight, and infrastructure that can keep working under stress.”
That framing was tested almost immediately. On 30 March, the Taiwan-Matsu No. 3 cable suffered partial-core damage near Dongyin. On 1 April, Focus Taiwan reported that a Chinese-flagged work barge was suspected of damaging a subsea cable during salvage operations. On 29 April, the same TM3 segment was severed again, causing a complete outage on Beigan-Dongyin and affecting roughly 1,500 residents in Dongyin. Reuters reported that poor weather appeared to have shifted ship wreckage onto the cable. In both operator and ministry accounts, microwave backup became the immediate continuity mechanism (Focus Taiwan, 2026; Ministry of Digital Affairs, 2026b; Blanchard, 2026).
The larger issue is recovery congestion. As of 12 May, MODA’s fault-status page still listed active problems on EAC1, TDM2, TSE-1, EAC2, Apricot, and TM3, with repairs stretching into late May, June, and July. It also noted restoration of a full-fiber NCP outage caused by power-equipment abnormalities at Japan’s Maruyama cable station. The critical scenar-
MIDDLE EAST
The Middle East’s cable story is increasingly defined by route-risk escalation. On 28 April, Reuters warned that Iran had identified submarine cables in the Strait of Hormuz as a vulnerability for the region’s digital economy, highlighting dense systems such as AAE-1, FALCON, and Gulf Bridge. The report also underscored two operator realities: military activity raises the risk of accidental cable damage, while repairs and new deployments face delays from permits, insurance risk, and seabed re-surveys (Maccioni, 2026).
That warning has already become a commercial problem. DatacenterDynamics, citing Bloomberg, reports that 2Africa work in the Gulf has paused, with ASN issuing force-majeure notices and the Île de Batz stranded in Dammam. The affected segment would connect Oman, the UAE, Qatar, Bahrain, Kuwait, Iraq, Pakistan, India, and Saudi Arabia, following earlier Red Sea delays after Houthi attacks. The ASN source URL was not retrievable, so public reporting remains the main evidence trail (Moss, 2026; Solon & Prinsloo, 2026).
The strategic response is visible in hyperscaler route design. Google’s America-India Connect an-
nouncement, slightly outside the review window, remains relevant because it builds South Pacific alternatives that complement the Blue, Raman, and Sol corridor through the Red Sea to Mumbai. In practical terms, major investors are now building around Red Sea–Hormuz dependency rather than treating it as routine (Quigley, 2026).
For operators, the Middle East is no longer just a geographic passage. It is a capital-planning variable. Route modeling must now account for war risk, re-survey requirements, vessel access, and permitting latency. The old question — “Do we have enough diversity?” — is being replaced by: “Do we have diversity that remains usable under military and regulatory stress?” (Maccioni, 2026; Moss, 2026; Quigley, 2026).
NORTH AMERICA
North America’s role is less about a single maritime incident and more about strategic recognition. In March, House leaders introduced the Strategic Subsea Cables Act of 2026 to strengthen U.S. engagement around cable security, installation, maintenance, and repair. CBO’s Senate summary highlights sanctions for sabotage, additional State Department staffing, and an interagency resilience committee — statecraft entering a specialist infrastructure domain (House Foreign Affairs Committee, 2026; Congressional Budget Office, 2026).
tions around attribution and incident response (U.S. Senate Committee on Foreign Relations, 2026a, 2026b, 2026c).
Policy only matters if supply can respond. That is why the Cerberus/SubCom transaction deserves attention. Cerberus says its continuation vehicle secured about $2.3 billion for SubCom, the only U.S.based subsea cable systems provider, tying the investment to rising cloud, AI, and connectivity demand. In the current climate, financing the industrial base is resilience. A cable strategy without build, install, and maintain capacity is only a talking point (Cerberus Capital Management, 2026).
INDUSTRY OPERATIONS
“Taiwan and the Middle East show that cable resilience is no longer binary — operators need layered backups, repair coordination, vessel oversight, and routes that remain usable under geopolitical stress.”
The operating bottleneck behind regional resilience remains maintenance. TeleGeography’s work with Infra-Analytics clearly summarizes the issue: maintenance investment has lagged network expansion, roughly 65% of maintenance vessels will reach end of life within 15 years, and sustaining service levels through 2040 will require fifteen replacement ships, five additional ships in Asia, and about $3 billion in investment. The key insight is that cable resilience is only as credible as the repair ecosystem behind it (Bryan, 2025; TeleGeography Staff, 2025).
The 30 April Senate hearing sharpened the point. Chair Jim Risch described subsea infrastructure as foundational to the global economy, linked Baltic sabotage to Russian hybrid activity, and connected the issue to China and Taiwan. Ranking Member Jeanne Shaheen framed the Baltic cases as part of a broader pattern in which privately owned infrastructure is unevenly protected and repair capacity remains limited. Once U.S. policymakers define cable resilience as national security, operators should expect more diplomatic pressure, standards work, sanctions activity, and public-private expecta-
That pressure is no longer abstract. The April SEAME-WE-5 maintenance window in Bangladesh was publicly described as traffic-affecting and likely to cause slower internet or partial disruptions on routes toward Singapore. Planned maintenance is not sabotage, but it shows that in networks with concentrated routes and constrained repair resources, even scheduled work can become user-visible and politically sensitive (The Business Standard, 2026).
This is why sensing technologies are moving toward the center of the conversation. APTelecom and FiberSense said in April that distributed acoustic sensing can provide real-time monitoring of subsea
FAULT LINES
systems, improve threat and environmental visibility, and give operators more actionable awareness of system integrity. It does not eliminate the need for patrols, burial, or better permitting, but it changes the operating tempo. Owners combining DAS, AIS, route intelligence, and marine surveillance may intervene earlier, segment faults faster, and build stronger evidentiary records when intent is contested (APTelecom, 2026).
For operators, the spring 2026 checklist is clear. Resilience must be built into route architecture and contract strategy, not treated as a post-build addon. Operators need pre-negotiated restoration playbooks, diversified terrestrial and subsea capacity, and continuity tools for exposed island or remote segments. Regulators should focus less on declaratory criticality and more on permit speed, vessel oversight, repair access, and operational data-sharing.
design, maintenance planning, infrastructure investment, and government engagement. Operators are being forced to think simultaneously about physical redundancy, geopolitical exposure, repair logistics, and regulatory coordination in ways that would have seemed excessive only a few years ago.
The strategic map continues to evolve, but the operational questions are becoming universal. Can operators restore capacity quickly enough? Can governments coordinate effectively enough? Can the industry diversify intelligently enough to maintain confidence in the infrastructure underpinning the digital economy? By spring 2026, those questions had moved from hypothetical concerns to core operating realities for the global subsea sector.
“Cable resilience is only as strong as the ecosystem behind it — from policy and financing to repair vessels, sensing technologies, and coordinated public-private response.”
Collaboration is no longer a policy virtue. It is an operational requirement (European Commission, 2026c; Ministry of Digital Affairs, 2026a; APTelecom, 2026; Bryan, 2025).
CONCLUSION
The core lesson from mid-March to mid-May 2026 is that submarine cable geopolitics is becoming less episodic and more administrative. Budgets are being assigned. Toolboxes issued. Hearings held. Patrols institutionalized. Backup systems activated as standard practice. This is not a sign the problem is under control. It shows that governments and industry have accepted that vulnerability is chronic and resilience must be engineered around it (European Commission, 2026a, 2026b; NATO SHAPE, n.d.; U.S. Senate Committee on Foreign Relations, 2026a; Ministry of Digital Affairs, 2026a, 2026b).
For the global submarine cable sector, resilience is no longer a secondary engineering consideration. It is becoming the organizing principle behind route
REFERENCES
1. 4iG Group. (2026, April 29). 4iG Group and Grid Telecom sign memorandum of understanding to strengthen Balkan and Mediterranean connectivity. https://www.4ig. hu/
2. APTelecom. (2026, April 14). APTelecom and FiberSense advance subsea cable monitoring capabilities through distributed acoustic sensing technologies. https:// aptelecom.com/
3. Blanchard, B. (2026, April 29). Taiwan activates backup communications after Matsu cable disruption. Reuters. https://www.reuters.com/
4. Bryan, V. (2025). Submarine cable maintenance investment and fleet replacement outlook. Infra-Analytics.
5. Cerberus Capital Management. (2026, April 20). Cerberus closes $2.3 billion continuation vehicle supporting SubCom. https://www.cerberus.com/
6. Congressional Budget Office. (2026, March 3). Cost estimate for S. 3249, Strategic Subsea Cables Act of 2026. United States Congress. https://www.cbo.gov/
7. European Commission. (2026a, February). Cable Security Toolbox and amended work programme for strategic submarine cable resilience. European Union. https://digital-strategy.ec.europa.eu/
8. European Commission. (2026b, March 17). CEF Digital calls supporting submarine cable infrastructure and smart cable systems. European Union. https://digital-strategy.ec.europa.eu/
9. European Commission. (2026c, March 20). Joint communication on strengthening the security and resilience of submarine cables. European Union. https://digital-strategy.ec.europa.eu/
10. Focus Taiwan. (2026, April 1). Chinese-linked vessel investigated following Taiwan subsea cable damage incident. https://focustaiwan. tw/
11. House Foreign Affairs Committee. (2026, March 27). Introduction of the Strategic Subsea Cables Act of 2026. United States House of Representatives. https://foreignaffairs.house.gov/
12. Maccioni, T. (2026, April 28). Iran conflict highlights vulnerability of submarine cables in Strait of Hormuz. Reuters. https://www.reuters. com/
13. Ministry of Digital Affairs. (2026a, April 7). 2025 submarine cable damage analysis report. Government of Taiwan. https://moda.gov.tw/
14. Ministry of Digital Affairs. (2026b, April 29). Taiwan-Matsu No. 3 cable outage and restoration measures. Government of Taiwan. https:// moda.gov.tw/
15. Ministry of Digital Affairs. (2026c, May 12). Submarine cable fault status updates. Government of Taiwan. https://moda.gov.tw/
16. Moss, S. (2026, March 14). Conflict delays Gulf deployment work on Meta’s 2Africa cable. Data Center Dynamics. https://www.datacenterdynamics.com/
17. NATO SHAPE. (2026). Baltic Sentry operations overview. North Atlantic Treaty Organization. https://shape.nato.int/
18. NATO SHAPE. (n.d.). Allied maritime operations and infrastructure security. North Atlantic Treaty Organization. https://shape.nato.int/
19. Quigley, J. (2026, February). Google expands route diversity through America-India Connect initiative. Google Cloud Blog. https:// cloud.google.com/blog/
20. Solon, O., & Prinsloo, L. (2026, March). Middle East conflict disrupts Meta’s African subsea expansion plans. Bloomberg.
21. TeleGeography Staff. (2025). Current state and forecasts for submarine cable maintenance. TeleGeography. https://www.telegeography.com/
22. The Business Standard. (2026, April 9). SEA-ME-WE-5 maintenance expected to impact internet performance in Bangladesh. https:// www.tbsnews.net/
23. TIM Group. (2025, July). Sparkle and Algérie Télécom memorandum of understanding for Italy-Algeria submarine cable initiative. https://www.gruppotim.it/
24. TIM Group. (2026). GreenMed submarine cable project overview. https://www.gruppotim.it/
25. U.S. Senate Committee on Foreign Relations. (2026a, April 30). Hearing on subsea infrastructure security and resilience. United States Senate. https://www.foreign.senate.gov/
26. U.S. Senate Committee on Foreign Relations. (2026b, April 30). Opening statement by Chairman Jim Risch on undersea infrastructure security. United States Senate. https://www.foreign.senate.gov/
27. U.S. Senate Committee on Foreign Relations. (2026c, April 30). Opening statement by Ranking Member Jeanne Shaheen on subsea infrastructure resilience. United States Senate. https://www.foreign. senate.gov/
28. UK Government. (2026a, April 9). UK exposes covert Russian submarine operations near critical undersea infrastructure. Government of the United Kingdom. https://www.gov.uk/
29. UK Government. (2026b, April 9). Defence Secretary speech on
maritime and subsea infrastructure security. Government of the United Kingdom. https://www.gov.uk/
Kristian Nielsen is based in the main WFN Strategies office in Ashburn, Virginia USA. He has more than 18 years’ experience and knowledge in submarine cable systems, including Arctic and offshore Oil & Gas submarine fiber systems. As Chief Revenue Officer, he supports the Projects and Technical Directors, and reviews subcontracts and monitors the prime contractor, suppliers, and is astute with Change Order process and management. He is responsible for contract administration, as well as supports financial monitoring. He possesses Client Representative experience in submarine cable load-out, installation and landing stations, extensive project logistics and engineering support, extensive background in administrative and commercial support and is an expert in due diligence.
& REGULATORY MATTERS
RETHINKING SUBMARINE CABLE REPAIR PRIORITIES
by Andrés Fígoli
DESPITE SUBMARINE CABLE SYSTEMS BEING THE BACKBONE OF GLOBAL CONNECTIVITY, THEIR REPAIR AND MAINTENANCE REGIMES REMAIN ONE OF THE LEAST VISIBLE—AND MOST STRAINED—ELEMENTS OF THE DIGITAL ECOSYSTEM.
While the industry has historically managed cable repairs through market-based mechanisms and cooperative maintenance agreements, recent trends raise important questions about whether current models remain fit for purpose. Increasing cable density, regional imbalances in repair capacity, aging fleets, climate risks, few cable depots, and geopolitical constraints are converging to test the resilience of the global repair system.
This article explores a critical question that is gaining urgency: how should priorities be determined when multiple submarine cables are damaged simultaneously, and existing repair capacity is insufficient to respond quickly to all faults? Addressing this question requires a careful balance between regulatory intervention and market efficiency, informed by practical experience from industry, governments and international cooperation frameworks.
THE CURRENT MODEL: FIRST COME, FIRST SERVED
Today, it is well known that submarine cable repairs largely operate on a “first come, first served” basis. When a fault occurs, the cable owner activates the relevant consortium zone agreement and a cable repair vessel is dispatched when available. This approach has the advantage of simplicity and neutrality: no cable is deemed more important than another and no authority is required to rank priorities.
cur sporadically and that repair capacity is generally sufficient. That assumption is increasingly challenged. In certain regions, cable cuts are becoming more frequent and clusters of faults in the same geographic area are no longer exceptional. Events linked to fishing activity, anchoring incidents as in the Red Sea and seabed landslides like those that occurred in West Africa in March 2023 can combine to generate multiple faults within short timeframes, overwhelming local repair capacity.
In such scenarios, the question is no longer whether a vessel can be dispatched, but which cable should be repaired first—and who decides. In practice, cable owners with greater financial leverage may favour a second model based on private agreements, allowing them to negotiate tailored conditions for their cable systems, including faster response times. Both models—consortium-based maintenance agreements and private arrangements—currently account for a broadly similar share of global submarine cable kilometres under coverage1 .
WHEN MULTIPLE CABLES ARE CUT: A GOVERNANCE GAP
From time to time, reality delivers a stress test: several cables are cut in the same area, often affecting multiple operators, countries, or even entire regions. When this happens, the limitations of a purely sequential repair model become visible.
“Submarine cable repair is becoming a governance challenge, as simultaneous faults, limited vessel capacity, and geopolitical constraints expose the limits of first-come, first-served maintenance models.”
However, this current model assumes that faults oc-
One possible response is regulatory intervention. Governments could require maintenance agreement operators to coordinate more closely, or even mandate joint operational planning across different maintenance zones. Another, more controversial idea is the designation of a competent authority empowered to arbitrate repair priorities when capacity constraints arise.
1 Constable, M., Burdette, L, Mauldin, A., “The Future of Submarine Cable Maintenance: Trends, Challenges, and Strategies”, SubOptic 2025, Lisbon, Portugal.
Such an authority could, in theory, assess factors such as:
• The number of end-users affected
• The availability of alternative routes
• The criticality of the cable for public services or regional connectivity
• The impact on underserved or landlocked countries
Under this approach, not all cables would be treated identically in emergency scenarios. Instead, priorities would be determined based on broader public-interest, equity and fairness considerations.
“As submarine networks expand faster than repair capacity, the industry faces a growing challenge: balancing market-driven maintenance models with the need for coordinated, resilience-focused governance.”
al Repair Asset Optimization Framework (GRAOF) to encourage industry associations to map global repair coverage gaps, clarify where resource shortfalls exist and support investment decisions. In parallel, they advocate for longer-term maintenance contracts, joint vessel funding mechanisms, and public-private partnership (PPP) maintenance hubs, particularly in underserved regions2
Yet this idea immediately raises concerns.
MARKET EFFECTIVENESS AND THE RISK OF OVERREGULATION
Industry representatives caution against assuming that the current system is fundamentally broken. From their perspective, the market largely functions as intended and does not require external intervention to maintain the status quo.
As highlighted above, submarine cable may be organized through consortium zone agreements, where resources are pooled and geographically allocated to ensure global coverage. These arrangements are continuously adjusted to reflect changing risk patterns. For example, while fault rates in the Atlantic have declined in recent years, they have increased in parts of the Asia-Pacific region—prompting discussions about reallocating base ports and repair assets.
The Atlantic Ocean itself offers a striking illustration. Despite hosting a rapidly increasing number of submarine cables, it is still served by a limited number of maintenance agreements which cover regions far larger and more complex than those originally envisaged. Brazil, for instance, is geographically
Some voices have suggested developing a Glob2 International Advisory Body on Submarine Cable Resilience (ITU-ICPC), Recommendation 7, Working Group 1 (Timely Deployment & Repair), 2 February 2026. Available at: https://www.itu.int/digital-resilience/submarine-cables/events/iab-deliverable/
ASK THE EXPERT
Question for the author(s)? Click here!
larger than Europe and hosts more than 15 submarine cable systems landing on its shores, yet has no cable repair depots at all.
A critical operational reality must also be acknowledged: repair vessels and crews cannot sit idle. These are highly specialized assets, and crews require regular operational activity to maintain their skills. Long periods of inactivity risk skill degradation, yet excessive downtime remains common in some regions.
One potential solution lies in allowing maintenance vessels to perform outside works—such as surveys or other cable-related activities—currently restricted under some maintenance agreements. These activities can provide additional revenue for vessel operators while reducing the charges collected from cable owners.
AGING FLEETS AND INVESTMENT DISINCENTIVES
Another structural issue is the age of the global repair fleet. The average submarine cable maintenance vessel is approximately 20 years old. Replacing or modernizing these vessels is capital-intensive: a new cable ship can cost in the order of USD 100 million.
“Submarine cable repair can no longer rely on speed alone. As cable density rises and fleets age, the industry must modernize repair capacity, reduce avoidable faults, and align maintenance incentives with longterm resilience rather than shortterm economics.”
CAPACITY GAPS: NEW CABLES, OLD CONSTRAINTS
One of the clearest challenges facing the repair ecosystem is the mismatch between new cable construction and maintenance capacity. Over the past two years, a significant number of new submarine cables have entered service. However, these cables rely largely on the same maintenance vessels, depots and crews that existed before. In fact, in many regions, no additional repair capacity has been added, despite the doubling of cable density over the past decade.
This has tangible consequences:
• Transit times from port bases to locations of cable faults remain high
• Repair vessels must cover vast geographic areas
• Aging fleets struggle to meet growing demand
In some cases, vessels have been withdrawn from service because maintenance operations were no longer economically viable. In addition, it is well recognized that a major cable installer has quit the repair market because dedicating a vessel to a two-week repair operation often generates significantly lower returns than deploying the same asset for new cable installation projects.
This creates a paradox: as repair capacity becomes more critical, the business case for sustaining it weakens.
Some policy-relevant solutions arise:
• Extending the duration of maintenance agreements (typically around 3 years)
• Avoiding new taxes or regulatory burdens, such as restrictive cabotage rules
• Allowing vessels to perform outside works as further described above
• Exploring targeted public support or grants in regions with high strategic importance
Best practices already exist. Some countries, such as Australia, require notification rather than permits for cable repairs. Regional initiatives like the recently adopted ASEAN guidelines commit governments to streamlined repair approvals—often within 7–10
working days—and the designation of single points of contact3 .
REDUCING DEMAND: PROBLEM CABLES AND PREVENTIVE ACTION
An often-overlooked insight is that repair capacity is disproportionately consumed by a small number of cables. Estimates suggest that around 50% of global repair capacity is absorbed by only a handful of problematic systems, typically older, low-capacity cables.
Retiring or replacing these cables could dramatically reduce fault rates and free up repair resources. In parts of Europe, the retirement of such systems has already yielded measurable improvements. However, uncertainty remains in other regions, particularly in Asia, where many older systems remain in service —or where cables continue to operate along historically problematic routes that have experienced repeated incidents over the past decades.
Within some consortium maintenance agreements, it is not uncommon to hear debates about proportionality and fairness. Cable owners contributing only a marginal share of the overall maintenance budget—some-
3 Enhanced ASEAN Guidelines endorsed on 16 January 2026 at the 6th ASEAN Digital Ministers’ Meeting (ADGMIN) in Hanoi, Vietnam. Available at: https://asean.org/ wp-content/uploads/2026/01/Enhanced-ASEAN-Guidelines-for-SRand-Repair-of-Submarine.pdf
LEGAL & REGULATORY
times as little as 1%, an amount insufficient even to cover minimal vessel operating costs—may nevertheless account for 60% of time spent debating in internal meetings. This dynamic has led some operators to consider negotiating private maintenance agreements, often under market conditions distorted by limited supply and unequal bargaining power, raising potential competition and antitrust concerns that deserve a separate and careful analysis.
At the same time, consortium maintenance agreements frequently fail to differentiate between cable owners that have invested proactively in risk mitigation—such as adequate previous cable burial, detailed pre-installation surveys, route optimization to avoid rocky seabeds, or even regular cable awareness campaigns—and those that have not. Despite markedly different risk profiles and fault frequencies, both categories of systems often have identical financial contributions and receive similar treatment in repair prioritization, even though the latter group may consume repair vessel slots far more frequently. This highlights a critical point: resilience is not only about responding faster—it is also about reducing the need for repairs in the first place.
CONCLUSION: FROM FIRST COME TO FIT FOR PURPOSE?
The current “first come, first served” model has worked well for the submarine cable industry over the years. But changing conditions demand reflection. In rare but high-impact scenarios involving multiple simultaneous faults, some form of coordination or arbitration may become unavoidable.
Any evolution of the system must be cautious, evidence-based and proportionate. Heavy-handed regulation risks undermining a system that, in many respects, continues to function effectively. At the same time, ignoring clear structural stresses—aging fleets, regional imbalances and regulatory friction— would be equally irresponsible.
The way forward lies not in choosing between market or state, but in smart alignment: strengthening existing mechanisms, removing avoidable bottle-
necks, investing where the business case alone cannot, and preparing governments to act decisively when exceptional circumstances arise.
The true test of cable repair priorities will not be theoretical debate, but how the system performs when the next major disruption occurs.
Andrés Fígoli is the author of the two-volume book “Legal and Regulatory Aspects of Telecommunication Submarine Cables” and is the director of Fígoli Consulting, where he provides legal and regulatory advice on all aspects of subsea cable work. Mr. Fígoli graduated in 2002 from the Law School of the University of the Republic (Uruguay), holds a Master of Laws (LLM) from Northwestern University, and has worked on submarine cable cases for more than 20 years in a major wholesale telecommunication company. He also served as Director and Member of the Executive Committee of the International Cable Protection Committee (2015-2023).
EARLY TELEGRAPH CABLES AND IMAGE TRANSMISSION
by Philip Pilgrim
Back in the 1990’s, while working Teleglobe’s CANTAT3 cable system, we were involved in the world’s-first fibre optic transoceanic digital video transmission.
The video feed was a gall bladder operation. It was transmitted using ATM hardware technology. At that time, the internet, in its infancy, used a flavour of HTML that lacked the synchronization hooks needed for video. Having these, ATM was the better solution. It
Bain’s Fax Machine (1843)
Bakewell’s Fax Machine (1848)
Giovanni Caselli’s “Fax” 1865
Giovanni Caselli’s “Fax” 1865
was a success! (both the operation and the video feed). Unknown to most was the shunt fault on the cable and the repair ship waiting on station.
With respect to the repair, we were all set to start but were told to delay the repair a week due to the importance of the video. Explaining this to the cable ship captain was not fun. Murphy’s law came knocking when the video feed ended a week later, and we were about to reroute traffic over satellite restoration links, a storm caused the ship to depart the repair site. The repair was completed approximately 3 weeks later.
Let’s now have a high-level look at digital transmission of images over telegraph systems:
1843 Alexander Bain’s Facsimile Telegraph was a lab device that was never put into production. It utilized pendulums to
Bain’s Fax Machine (tarted-up)
Giovanni Caselli’s Networked Fax Machine
“scan” moving metal plates with elevated characters and lines. It was a “raster” scanner where the plate stepped with each sweep of the pendulum stylus. Each “contact” between the plate and the stylus closed a circuit which was transmitted to the receiver as a “dot”. The receiver also had a pendulum passing over a chemically infused paper developed by Bain. Every incoming electrical dot was transferred to the paper via a stylus. Each point of the electrochemical reaction darkened the spot.
1848 Frederick Bakewell’s Image Telegraph was also a lab device that was never put into production. It held a slight improvement over Bain’s in that the plate rotated as the stylus stepped. No pendulum was used.
1865 Giovanni Caselli’s “Pantelegraph” became the first commercially successful facsimile machine. It was designed back in 1855 and used many of Bain’s ideas, including the pendulum. It was deployed
throughout France and widely used from 1865 to 1870. Approximately 4,000 “faxes” were transmitted yearly.
Over the next ~40 years, additional devices were developed by Gaetano Bonelli (1860), Bernhard Meyer (1864), Lenoir (1866), Shelford Bidwell’s “tele-photography” (1881), Elisha Gray (1888) Ernest Hummel (1888), Hans Liebreich & John Francis (1900).
In 1902, Arthur Korn developed a superior system using photocells (this method was first implemented by Bidwell).
A similar system, the Bartlane, was developed by Clan Bartholomew and John MacFarlane in 1920. It transmitted the first image across the Atlantic over a submarine cable in 1921.
Here is a nice description from 1928 that covers the sinking of ship in Europe, its photograph, and the image transmission to America over a submarine telegraph cable.
First Image Transmitted Over a Transatlantic Telegraph Cable
Philip Pilgrim is Subsea Business Development Leader for Nokia’s North American region, marking 30 years in the subsea sector. Based in Nova Scotia, Canada, he brings deep industry experience alongside a personal passion for subsea archaeology, including researching and locating historic submarine cable and telegraph routes and related infrastructure.
TRACKING THE TALENT POWERING INDUSTRY CHANGE ON THE MOVE
SubTel Forum continues to track key leadership and career developments across the global subsea and telecommunications infrastructure community. The following professionals have recently taken on new roles, reflecting ongoing momentum and investment across network development, infrastructure deployment, and strategic consultancy.
Scott Tait has been appointed Chief Operating Officer at Lumetec, bringing extensive operational experience aligned with the company’s strategic direction. In this role, Tait will oversee operational execution and support Lumetec’s continued growth as it advances its capabilities and market presence. His appointment reflects Lumetec’s focus on strengthening leadership as the company scales its operations and expands its footprint in the evolving connectivity and technology landscape.
Shruti Nayak has joined Google as a Technical Program Manager, where she will contribute to the delivery and coordination of complex technical initiatives across the company’s global infrastructure and technology programs. With a background in data science and generative AI, and experience working across cross functional teams, Nayak brings a strong blend of technical and program management expertise. Her appointment reflects Google’s continued investment in talent to support the development and scaling of advanced digital and cloud infrastructure.
Kelvin Smith has started a new position as Consultant at TBH, where he will support project delivery and advisory services across infrastructure and engineering sectors. With academic credentials including a BEng (Hons) and MSc, Smith brings a strong technical foundation to his consult-
ing role. His appointment reflects continued demand for skilled professionals to support complex project execution and strategic advisory across the evolving infrastructure landscape.
Pranav Patil has started a new position as Senior Consultant at TBH, where he will support the delivery of advisory and project management services across infrastructure and capital projects. In this role, Patil will work with clients to enhance project performance, manage risk, and drive successful outcomes across complex programs. His appointment reflects TBH’s continued growth and the increasing demand for experienced consultants in the infrastructure and project delivery space.
Sophie Wright has joined Google’s Network Infrastructure Engineering team in Singapore, where she will lead and grow a team supporting subsea and network infrastructure initiatives. With a strong background in subsea telecommunications and experience managing complex marine and permitting projects, Wright brings deep industry expertise to her new role. Her move follows a successful career spanning major milestones in subsea telecoms, and reflects Google’s continued investment in leadership talent to advance its global infrastructure capabilities.
Jonas Hasselriis has started a new position as Chief Executive Officer at Tusass A/S, where he will lead the company’s strategic direction and operations in delivering telecommunications services across Greenland. In this role, Hasselriis will oversee continued development of critical connectivity infrastructure in one of the world’s most remote and challenging environments, supporting both regional resilience and international network integration.
Elisha Zahra has started a new position as Technical Program Manager at Google, where she will support the delivery of scalable technology and infrastructure initiatives. With a background in supply chain management, automation, and AI driven solutions, Zahra brings a multidisciplinary approach to program execution. Her appointment reflects Google’s continued focus on integrating advanced technologies and operational efficiency across its global infrastructure and platform development efforts.
Jerry Brown has started a new position as Associate at Cambridge Management Consulting where he will support advisory services and project delivery across a range of client engagements.
Howard Hoo has started a new position as Technical Program Manager at Google, where he will support the planning and execution of complex network and infrastructure initiatives. With a background in subsea networks, Hoo brings relevant industry expertise to his role, contributing to the development and delivery of large scale connectivity programs.
These appointments underscore the continued strength of the global subsea and telecommunications sector, with experienced professionals stepping into roles that will shape the planning, deployment, and operation of the infrastructure underpinning the world’s digital economy.
REPAIRS, BUILDS, AND DEALS ACCELERATE
News from March 13 2026 through May 15, 2026
March–May news focused on rising cable security risks and repair disruptions, alongside continued expansion through new systems, landings, data centers, and monitoring upgrades.
CABLE FAULTS & MAINTENANCE
UN Launches New Advisory Body to Protect Submarine Cables
Meta, Lightstorm Boost Bifrost Cable Capacity with Ciena
TURNING AD CLICKS INTO REAL CONVERSIONS
by Nicola Tate
It’s time for this month’s marketing tip! This month I want to focus on the importance of rotating or refreshing your creatives. Even the best-performing campaigns lose their impact over time. As audiences grow accustomed to seeing the same creative, engagement drops — a phenomenon known as “creative fatigue.” Knowing when (and how) to refresh your ads can extend your success.
Key Tips:
1. Watch for declining performance.
If your click-through rate or landing page visits drop steadily or impressions rise without results, it’s time to consider a refresh.
2. Change visuals, not your message. Keep your core value proposition intact but rotate in new images, colors, or headlines to re-capture attention.
3. Use A/B testing.
When engaging in digital campaigns run two variations at once and see which performs better. Small tweaks (like changing button text or background color) can revive engagement.
4. Refresh on a schedule.
Plan updates quarterly or seasonally, especially if you’re advertising around industry events or publication cycles.
If you’d like help developing a schedule for refreshing your creative or planning a long-term campaign, reach out. SubTel Forum properties can help you maintain consistent visibility without letting your message go stale.
Originally hailing from the UK, Nicola moved to the US when she was just four years old. Aside from helping companies create effective advertising campaigns Nicola enjoys running (completed the Chicago marathon in 2023, the Berlin marathon in 2024, and will be running the London marathon in 2025), hiking with her husband, watching her boys play soccer, cooking, and spending time with family.
CONNEC T INN O VATIVELY. EN GAGE GLOBALLY. GR O W EX P ONENTI AL LY.