WHERE IN THE WORLD ARE THOSE PESKY CABLESHIPS? BY REBECCA SPENCE
W
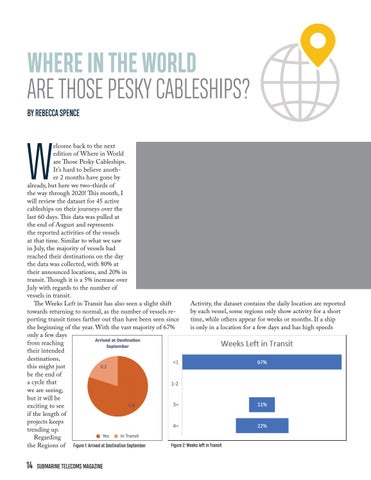
elcome back to the next edition of Where in World are Those Pesky Cableships. It’s hard to believe another 2 months have gone by already, but here we two-thirds of the way through 2020! This month, I will review the dataset for 45 active cableships on their journeys over the last 60 days. This data was pulled at the end of August and represents the reported activities of the vessels at that time. Similar to what we saw in July, the majority of vessels had reached their destinations on the day the data was collected, with 80% at their announced locations, and 20% in transit. Though it is a 5% increase over July with regards to the number of vessels in transit. Activity, the dataset contains the daily location are reported The Weeks Left in Transit has also seen a slight shift by each vessel, some regions only show activity for a short towards returning to normal, as the number of vessels retime, while others appear for weeks or months. If a ship porting transit times farther out than have been seen since is only in a location for a few days and has high speeds the beginning of the year. With the vast majority of 67% only a few days from reaching their intended destinations, this might just be the end of a cycle that we are seeing, but it will be exciting to see if the length of projects keeps trending up. Regarding Figure 2: Weeks left in Transit the Regions of Figure 1: Arrived at Destination September
14
SUBMARINE TELECOMS MAGAZINE