

EXORIDUM FROM THE PUBLISHER
WELCOME TO ISSUE 131, OUR REGIONAL NETWORKS AND SUBMARINE NETWORKS WORLD CONFERENCE PREVIEW EDITION!
Vive le Tour!
If it’s July it must be another amazing three weeks of the Tour de France.
This year’s tour is like something not seen in a while where two dominating, powerful riders seem to be fighting amongst themselves levels of capability about the rest. Two thirds through, all eyes are on the Dane and Slovak who are mere seconds apart in cumulative time. The question is will they fight it out to the end where one stands as victor, or will someone else come sweeping by and take it all from under them.
SUBMARINE NETWORKS WORLD CONFERENCE
I had the pleasure of attending Submarine Networks EMEA in London in May, which was well attended, informative and well worth the effort to attend. Looking forward, we are thrilled to be traveling to Singapore again in September and attending the Submarine Networks World Conference. The folks at Terrapinn provided some excellent content to this issue, and we expect their event to be another excellent opportunity to learn, as well as see industry friends.
WELCOME TO SYEDA HUMERA
Welcome to our Summer Intern, Syeda Humera, a graduate of my alma mater, Central Michigan University, where she earned a bachelor’s degree in Electronics and Communication Science and a master’s degree in computer science. She has practical experience as a Software Developer at ALM

Software Solutions, India, where she honed her skills in MLflow, JavaScript, GCP, Docker, DevOps, and more. Her expertise includes Data Visualization, Scikit-Learn, Databases, Ansible, Data Analytics, AI, and Programming. Having completed her master’s degree, Humera is now poised to apply her comprehensive skills and knowledge in the field of computer science. Like me, she is a Chippewa, and maroon and gold through and through –Fire Up Chips!
WELCOME ALSO TO BILL SPILMAN
Welcome also to our new Advertising Sales Representative, Bill Spilman, who is our primary liaison for all advertising across our diverse range of print and digital publications. With over 35 years of professional experience in the industry, he brings significant expertise to SubTel Forum. Bill is based in Oneida, Illinois, USA.

2 SUBMARINE TELECOMS FORUM MAGAZINE
ASK THE EXPERT BUTTON
In our last issue we added the “Ask the Expert” button to a number of department articles and are a little overwhelmed with the interest and response – Thanks –and please keep asking…
Do you have further questions on this topic?
ASK AN EXPERT
THANK YOU
Thanks for their support to this issue’s advertisers: Submarine Networks World, Fígoli Consulting, Southern Cross, and WFN Strategies. Thanks also to the many authors who continue to make our issues interesting and so far reaching. Of course, our ever popular and newly refashioned “where in the world are all those pesky cableships” is included as well.
Lastly, we hope that SubTel Forum continues to be your premier destination for news and analysis related to the submarine cable industry.
Good reading – Slava Ukraini STF

A Publication of Submarine Telecoms Forum, Inc. www.subtelforum.com | ISSN No. 1948-3031
PRESIDENT & PUBLISHER: Wayne Nielsen | wnielsen@subtelforum.com | [+1] (703) 444-2527
VICE PRESIDENT: Kristian Nielsen | knielsen@subtelforum.com | [+1] (703) 444-0845
PRODUCTION MANAGER: Hector Hernandez | hhernandez@wfnstrategies.com | [+1] (210) 338-5413
EDITOR: Stephen Nielsen | snielsen@subtelforum.com
ANALYTICS: Kieran Clark | kclark@subtelforum.com | [+1] (540) 533-6965
SALES: Bill Spilman | bspilman@subtelforum.com | [+1] (309) 483-6467
DESIGN & PRODUCTION: Weswen Design | wendy@weswendesign.com
DEPARTMENT WRITERS: Anne Pasek, Andrés Fígoli, Iago Bojczuk, George Ramirez, Kieran Clark, Nicholas R. Silcox, Philip Pilgrim, Syeda Humera, and Wayne Nielsen
FEATURE WRITERS: Adam Ball, Anders Tysdal, Cato Lammenes, Eduardo Cezar Grizendi, Javier Valdez, John Hibbard, Kristian Nielsen, Michael Stanton, Paul McCann, Steinar Bjørnstad, Wahab Jumrah and Diego Matas
NEXT ISSUE: SEPTEMBER 2023 – Offshore Energy

AUTHOR & ARTICLE INDEX: www.subtelforum.com/onlineindex

Submarine Telecoms Forum, Inc. www.subtelforum.com/corporate-information
BOARD OF DIRECTORS: Margaret Nielsen, Wayne Nielsen and Kristian Nielsen
SubTel Forum Continuing Education, Division of Submarine Telecoms Forum, Inc. www.subtelforum.com/education
CONTINUING EDUCATION DIRECTOR: Kristian Nielsen | knielsen@subtelforum.com | [+1] (703) 444-0845
Contributions are welcomed and should be forwarded to: pressroom@subtelforum.com.
Submarine Telecoms Forum magazine is published bimonthly by Submarine Telecoms Forum, Inc., and is an independent commercial publication, serving as a freely accessible forum for professionals in industries connected with submarine optical fiber technologies and techniques. Submarine Telecoms Forum may not be reproduced or transmitted in any form, in whole or in part, without the permission of the publishers. Liability: While every care is taken in preparation of this publication, the publishers cannot be held
Wayne Nielsen, Publisherresponsible for the accuracy of the information herein, or any errors which may occur in advertising or editorial content, or any consequence arising from any errors or omissions, and the editor reserves the right to edit any advertising or editorial material submitted for publication.
New Subscriptions, Enquiries and Changes of Address: 21495 Ridgetop Circle, Suite 201, Sterling, Virginia 20166, USA, or call [+1] (703) 444-0845, fax [+1] (703) 349-5562, or visit www.subtelforum.com. Copyright © 2023 Submarine Telecoms Forum, Inc.
FORUM IN THIS ISSUE
ISSUE 131 | JULY 2023
FEATURES
5 QUESTIONS WITH ADAM BALL
THE PACIFIC: SECURING THE FUTURE
 By John Hibbard and Paul McCann
WHY ATTEND SUBMARINE NETWORKS WORLD

22 32 26 36 28 42
THE MOST EXTREME PORTAL IN THE WORLD
By Javier ValdezASEAN HERITAGE PARKS AND LEGAL TOOLS FOR SUBMARINE CABLE PROTECTION

 By Wahab Jumrah
BUILDING AND OPERATING A SUBFLUVIAL FIBRE OPTIC COMMUNICATIONS NETWORK IN THE MAJOR RIVERS OF THE AMAZON BASIN IN BRAZIL
 By Eduardo C. Grizendi and Michael A. Stanton

4 SUBMARINE TELECOMS MAGAZINE
SUBMARINE TELECOMS


DEMYSTIFYING THE CONSULTANT’S ROLE IN SYSTEM IMPLEMENTATION AND COMMISSIONING By Kristian Nielsen INCREASING AVAILABILITY OF SUBSEA TELECOM INFRASTRUCTURE THROUGH MONITORING VIBRATIONS IN OPTICAL FIBRE SUBSEA CABLES By Steinar Bjørnstad, Anders Tysdal, and Cato Lammenes THE OLISIPO SUBMARINE CABLE SYSTEM By Diego Matas 46 50 54 EXORDIUM ........................................................... 2 SUBTELFORUM.COM ............................................. 6 CABLE MAP UPDATE 8 SUSTAINABLE SUBSEA 9 WHERE IN THE WORLD ........................................ 14 BACK REFLECTION .............................................. 60 LEGAL & REGULATORY MATTERS 66 ON THE MOVE 68 SUBMARINE CABLE NEWS NOW .......................... 69 STF ANALYTICS ................................................... 70 ADVERTISER CORNER 104 JULY 2023 | ISSUE 131 5 DEPARTMENTS
FREE RESOURCES FOR ALL OUR SUBTELFORUM.COM READERS
The most popular articles, Q&As of 2022. Find out what you missed!
TOP STORIES OF 2019
The most popular articles, Q&As of 2019. Find out what you missed!

NEWS NOW RSS FEED
a division of Submarine Telecoms Forum. This reference tool gives details on cable systems including a system map, landing points, system capacity, length, RFS year and other valuable data.
Keep on top of our world of coverage with our free News Now daily industry update. News Now is a daily RSS feed of news applicable to the submarine cable industry, highlighting Cable Faults & Maintenance, Conferences & Associations, Current Systems, Data Centers, Future Systems, Offshore Energy, State of the Industry and Technology & Upgrades.
NEWS NOW RSS FEED
Keep on top of our world of coverage with our free News Now daily industry update. News Now is a daily RSS feed of news applicable to the submarine cable industry, highlighting Cable Faults & Maintenance, Conferences & Associations, Current Systems, Data Centers, Future Systems, Offshore Energy, State of the Industry and Technology & Upgrades.


PUBLICATIONS
mapping efforts by the analysts at SubTel Forum Analytics, a division of Submarine Telecoms Forum. This reference tool gives details on cable systems including a system map, landing points, system capacity, length, RFS year and other valuable data.
Submarine Telecoms Industry Report is an annual free publication with analysis of data collected by the analysts of SubTel Forum Analytics, including system capacity analysis, as well as the actual productivity and outlook of current and planned systems and the companies that service them.
CABLE MAP
Submarine Telecoms Industry Report is an annual free publication with analysis of data collected by the analysts of SubTel Forum Analytics, including system capacity analysis, as well as the actual productivity and outlook of current and planned systems and the companies that service them.
CABLE MAP
PUBLICATIONS
Submarine Cable Almanac is a free quarterly publication made available through diligent data gathering and
Submarine Cable Almanac is a free quarterly publication made available through diligent data gathering and mapping efforts by the analysts at SubTel Forum Analytics,
The online SubTel Cable Map is built with the industry standard Esri ArcGIS platform and linked to the SubTel Forum Submarine Cable Database. It tracks the progress of
The online SubTel Cable Map is built with the industry standard Esri ArcGIS platform and linked to the SubTel Forum Submarine Cable Database. It tracks the progress of some 450+ current and planned cable systems, more than 1,200 landing points, over 1,700 data centers, 37 cable ships
6 SUBMARINE TELECOMS MAGAZINE
SubTelForum.com Visit SubTelForum.com to find links to the following resources FREE
FOR ALL OUR SUBTELFORUM.COM READERS SubTelForum.com Visit SubTelForum.com to find links to the following resources
RESOURCES
as well as mobile subscriptions and internet accessibility data for 254 countries. Systems are also linked to SubTel Forum's News Now Feed, allowing viewing of current and archived news details.
The printed Cable Map is an annual publication showcasing the world's submarine fiber systems beautifully drawn on a large format map and mailed to SubTel Forum Readership and/or distributed during Pacific Telecommunications Conference in January each year.
CONTINUING EDUCATION
SubTel Forum designs educational courses and master classes that can then appear at industry conferences around the world. Classes are presented on a variety of topics dealing with key industry technical, business, or commercial issues. See what classes SubTel Forum is accrediting in support of the next generation of leaders in our industry.
AUTHORS INDEX
The Authors Index is a reference source to help readers locate magazine articles and authors on various subjects.
SUBTEL FORUM BESPOKE REPORTS
SubTel Forum provides industry analyses focused on a variety of topics. Our individualized reporting can provide industry insight for a perspective sale, business expansion or simply to assist in making solid business decisions and industry projections. We strive to make reporting easy to understand and keep the industry jargon to a minimum as we know not everyone who will see them are experts in submarine telecoms.
In the past we have provided analyses pertaining to a number of topics and are not limited to those listed below. Reach out to info@subtelforum.com to learn more about our bespoke reports.
DATA CENTER & OTT PROVIDERS: Details the increasingly shrinking divide between the cable landing station and the backhaul to interconnection services in order to maximize network efficiency throughout, bringing once disparate infrastructure into a single facility.
If you are interested in the world of Data Centers and its impact on Submarine Cables, this reporting is for you.
GLOBAL CAPACITY PRICING: Details historic and current capacity pricing for regional routes (Transatlantic, Transpacific, Americas, Intra-Asia and EMEA), delivering a comprehensive look at the global capacity pricing status of the submarine fiber industry. Capacity pricing trends and forecasting simplified.
GLOBAL OUTLOOK: Dive into the health and wellness of the global submarine telecoms market, with regional analysis and forecasting. This reporting gives an overview of planned systems, CIF and project completion rates, state of supplier activity and potential disruptive factors facing the market.
OFFSHORE ENERGY: Provides a detailed overview of the offshore oil & gas sector of the submarine fiber industry and covers system owners, system suppliers and various market trends. This reporting details how the industry is focusing on trends and new technologies to increase efficiency and automation as a key strategy to reduce cost and maintain margins, and its impact on the demand for new offshore fiber systems.
REGIONAL SYSTEMS: Drill down into the Regional Systems market, including focused analysis on the Transatlantic, Transpacific, EMEA, AustralAsia, Indian Ocean Pan-East Asian and Arctic regions. This reporting details the impact of increasing capacity demands on regional routes and contrasts potential overbuild concerns with the rapid pace of system development and the factors driving development demand.
SUBMARINE CABLE DATASET: Details more than 450 fiber optic cable systems, including physical aspects, cost, owners, suppliers, landings, financiers, component manufacturers, marine contractors, etc. STF
JULY 2023 | ISSUE 131 7
SUBTEL CABLE MAP UPDATES
The SubTel Cable Map, built on the industry-leading Esri ArcGIS platform, offers a dynamic and engaging way to explore over 440 current and planned cable systems, 50+ cable ships, and more than 1,000 landing points. This interactive tool is linked to the SubTel Forum Submarine Cable Database, providing users with a comprehensive view of the industry.
Submarine cables play a pivotal role in global communications, acting as the backbone of the internet. They are responsible for transmitting over 99% of all international data, connecting continents and enabling global connectivity. Without these underwater highways, the speed and efficiency of global internet communication that we enjoy today would not be possible.
The Esri ArcGIS platform, upon which the SubTel Cable Map is built, is a powerful geographic information system (GIS) for working with maps and geographic information. It is used for creating and using maps, compiling geographic data, analyzing mapped information, sharing and discovering geographic information, and using maps and geographic information in a range of applications. Its robust capabilities make it an ideal platform for the SubTel Cable Map, allowing for dynamic, interactive exploration of complex data.
With systems connected to SubTel Forum’s News Now Feed, users can easily view current and archived news details related to each system. This interactive map is an ongoing effort, updated frequently with valuable data collected by SubTel Forum analysts and insightful feedback from our users. Our aim is to provide not only data from the Submarine Cable Almanac, but also to incorporate additional layers of system information for a comprehensive view of the industry.
We encourage you to explore the SubTel Cable Map to deepen your understanding of the industry and to educate others on the critical role that submarine cable systems play in global communications. All submarine cable data for the Online Cable Map is sourced from the public domain, and we’re committed to keeping the information as current as
possible. If you are the point of contact for a company or system that needs updating, please don’t hesitate to reach out to kclark@subtelforum.com.
Below is the full list of systems added and updated since the last issue of the magazine:
JULY 17, 2023
SYSTEMS ADDED:
• ANDROMEDA
SYSTEMS UPDATED:
• Equiano
• IRIS
• IONIAN
• Olisipo
• MEDUSA
We hope the SubTel Cable Map serves as a valuable resource to you and invites you to dive into the ever-evolving world of submarine cable systems. We invite you to start your exploration today and see firsthand the intricate network that powers our global communications. Happy exploring! STF
KIERAN CLARK is the Lead Analyst for SubTel Forum. He originally joined SubTel Forum in 2013 as a Broadcast Technician to provide support for live event video streaming. He has 6+ years of live production experience and has worked alongside some of the premier organizations in video web streaming. In 2014, Kieran was promoted to Analyst and is currently responsible for the research and maintenance that supports the Submarine Cable Database. In 2016, he was promoted to Lead Analyst and his analysis is featured in almost the entire array of Subtel Forum Publications.
Do you have further questions on this topic?

ASK AN EXPERT
8 SUBMARINE TELECOMS FORUM MAGAZINE
SUBTELFORUM.COM/CABLEMAP
CARBON OFFSETS VERSUS REMOVALS Tips for Avoiding Scandal and Building Credible Sustainability Practices
BY ANNE PASEK, NICHOLAS R. SILCOX, AND GEORGE RAMIREZHow do businesses mitigate carbon emissions while still maintaining profitability? One of the most popular strategies has been to purchase carbon offsets. These are financial arrangements in which a company purchases a credit equal to a given quantity of carbon equivalents from an organization whose activities either reduce or avoid emissions. These activities can take many forms--planting trees, restoring ecosystems, avoiding environmentally damaging development, or investing in renewable energy. In return, the purchaser can claim that they’ve reversed some of their own climate impacts. If the quantity of a company’s total emissions and offsets are equal, that company can claim that they are ‘carbon neutral.’ If a company reduces their internal emissions as much as possible, and then buys certificates to cover the remaining amount, they are understood to be ‘net zero.’
However, these simple equations conceal many complexities and even some potential harms. Offsetting has been critiqued by both environmental and corporate ESG advocates concerned about the possibilities for fraud or reputational risks in these marketplaces (and in the communities where offsetting projects are located). Many offsetting projects have failed spectacularly, and are now regarded as an embarrassing waste of money and a diversion from real climate action.
Multiple forms of offset standards and certificates have emerged in response, trying to improve the credibility and performance of their offerings. But there are still no overarching regulations to structure this marketplace. Carbon removals, a different strategy for carbon sequestration, has emerged alongside carbon offsets and is growing in popularity.
While many companies are interested in becoming carbon neutral, the decision of whether to invest in offsets or removals--and if so, which ones to choose--can be fraught. This article describes some of the challenges of this process and offers some tips for building credible sustainability practices.
EARLY OFFSET MARKETS: THE PROBLEMS WITH ADDITIONALITY
Carbon offsetting first became popular in the 2000s following the adoption of the Kyoto Protocol. This international treaty set carbon targets for many high-income countries. At the same time, it allowed for the sale of offsets to compensate for any emissions that exceeded a nation’s allotment. Carbon offsetting was also popularized in a series of regional cap-and-trade programs, including the European Union’s 2005 Emissions Trading Scheme and the U.S.’s 2009 American Clean Energy and Security Act. The private sector also began to embrace offsets in both regulatory
JULY 2023 | ISSUE 131 9 SUBSEA
compliance settings (where they were bound by caps and/or targets) and a booming voluntary market (where they were not). Individuals, too, got in on the action. In this period, the idea of carbon neutrality emerged as a concept, goal, and marketing tool for people and organizations invested in balancing their carbon budgets.
This approach hypothetically offers a lot of financial advantages. Organizations can sell offsets to support valuable conservation and economic development work in regions all around the world. When done well, offsets can save forests from logging, support green economies, and encourage renewable energy adoption. Buying offsets is also almost always more cost effective than avoiding or reducing carbon emissions in industrial contexts. Developing and middle-income countries tend to offer cost-effective
SUBSEA
“opportunities” for carbon emission reduction, which is financially attractive for higher-income countries. As a result, most buyers are based in the wealthier countries, and most projects are based in developing countries. Because our climate system is global, carbon actions across the world are perceived as equally viable and impactful in the offset marketplace.

The initial interest in offsets skewed heavily toward projects that avoided potential future carbon emissions, rather than reduced an existing emissions source. This kind of offset requires a special focus on what is called ‘additionality.’ If the sale of the offset is actually responsible for preventing emissions, it is additional. Additionality is the difference between, on one hand, using the sale of offsets to transform a timber forest into a conservation area, and on the other, selling
offsets from a forest that was already well protected from logging. In the first case, offsets generate additional carbon savings; in the second, they don’t. In practice, additionality can be very difficult to determine, especially when there’s an economic incentive to exaggerate causal connections. There’s also the problem of ‘leakage’--perhaps one forest was protected from logging in one region, but that simply pushed loggers into a different region. If the same number of trees were still cut down, there ultimately are no avoided emissions. Assessing the quality of offsetting projects requires weighing the hypothetical behavior of many interconnected actors in many distant parts of the world.
In the early years of offset markets, there were minimal regulations and protocols to ensure that these deliberations were made rigorously and consistently.
10 SUBMARINE TELECOMS MAGAZINE
This resulted in a glut of projects with low standards of additionality, produced with minimal effort on the part of sellers. Most, in hindsight, were effectively junk. As a result, offsets in the voluntary market traded for bargain prices--some as low as $1/ton. Meanwhile, cap and trade systems suffered from a similar surplus of dubious certificates, in addition to an overallocation of permits that effectively crashed many markets. These outcomes are harmful: companies were incentivized to buy relatively meaningless certificates, delaying reductions in their own emissions while continuing to contribute to climate change. Awareness of these failures and waning public attention to climate change all led to reduced personal and corporate participation in voluntary markets. As the 2010s began, it seemed that offsets were dead in the water.
THE CARBON OFFSET MARKET TODAY
Yet offsets, remarkably, are back. The 2015 Paris Agreement significantly re-energized global climate politics, and the Trump administration’s attempt to withdraw from the agreement shortly thereafter had the effect of increasing corporate ambitions for climate leadership. The Paris Agreement’s pledge to hold global heating to “well below 2°C” also had the effect of mainstreaming the concept of net-zero. For the world’s nations to stop the greenhouse gas effect before 2°C is reached--or to claw back the global thermostat if this limit is temporarily breached--they will need to both dramatically reduce carbon emissions and remove the emissions that are already in the atmosphere. As a result, the science behind the Paris Agreement targets include presumptions about dramatic carbon removals, all of which are needed to balance the
climate system while still allowing for some level of ‘hard to abate’ industrial emissions to continue. In other words, it’s no longer just a case of avoiding potential future emissions, it’s now a matter of being accountable for all present and future emissions--and subtracting them down to nothing.
This idea has been championed by an unexpectedly large number of corporations, with repercussions for the voluntary market. Today more than ⅓ of the world’s largest companies have a net-zero target. These come in various degrees of ambition and credibility, but they all rely on the promise of carbon certificates to zero-out their residual emissions. Offsets, accordingly, are booming. Revenue grew by 60% between 2020 and 2021 alone. The overall market is predicted to increase globally by a factor of 15 by the end of the decade.
This growth, however, has resulted in the repetition of many previous problems. Carbon offsets are still poorly regulated and difficult to verify, despite ongoing efforts by third party organizations and market platforms to improve their offerings. The story of Verra, a nonprofit that acts as the world’s leading offset certifier, is a case in point. Earlier this year, The Guardian and “Last Week Tonight with John Oliver” each reported on the sensational failure of its rainforest project carbon offset standards. More that 90% of all projects with that standard were found to be fraudulent--equivalent to little more than ‘phantom credits.’ Even worse, some of the projects were found to have human rights issues connected to them, including evictions and land use conflict with Indigenous groups. These offset projects had been purchased by many major corporations, including tech and media companies like Netflix, Meta, and Disney.
Climate change itself is a further and growing challenge to the credibility of nature-based offset projects. A recent news story on this problem concerns a Verra project in Kenya, in which Indigenous herding practices were framed as strengthening local plant life and soil. However, it was revealed that such herding was both poorly monitored and that shifting ecological conditions brought about by increased droughts (a consequence of climate change) rendered the project ineffective. Forest fires similarly threaten the integrity of offsets on a warming world. California’s 2022 fire season, for example, saw the destruction of 95% of the state’s forestry offset insurance buffer--meant to guarantee the permanence of forest carbon offsets for 100 years time. In future fires, perhaps even this year, carbon that was supposed to be offset from the atmosphere will almost surely go up in smoke.
The failures of Verra and the increased awareness of the inefficiencies and issues surrounding carbon offsets make it difficult to endorse these sorts of programs in broad strokes. The ambiguity around verification and certification and the misrepresentation of their efficacy suggest that there are clear reputational risks when investing in carbon offsets as a mitigation strategy. While effective carbon offset programs are still possible, it is difficult for buyers to be certain that any given project is legitimately producing a positive impact (and that their names won’t end up in the news with the latest offset scandal).
GROWING ALTERNATIVES TO CARBON OFFSETTING
What then should net-zero companies do? One potential answer lies in making a clearer distinction be-
MAY 2023 | ISSUE 130 11
SUBSEA
tween offsetting vs. removing climate emissions. Carbon dioxide removal (CDR) differs from offsets in that this work omits avoided emissions from consideration. Instead, removals only account for the physical subtraction of existing CO2 in the atmosphere to be stored in a durable sink. Carbon removals sometimes include the planting of new forests to create such a sink, though directions in the market generally focus more on technical means, such as sucking carbon dioxide out of the air and injecting it into rock. Ideally, measuring and verifying such projects is much simpler than assessing avoided emissions, since the emphasis is on demonstrably sequestered carbon rather than avoided, hypothetical futures.
However, not all carbon removals are alike. In addition to different methods of removing carbon from the air, there is also variability in the reliability and duration of storage. For example, changes in agricultural practices can store carbon in soil over the course of just a few years time. Reversing these practices, however, releases this carbon just as quickly. Furthermore, newly planted trees don’t sequester carbon forever, as mature forests reach an equilibrium state after some time. How long they stay in that state is a matter of fire and development risk, and so a question of indefinite maintenance rather than a permanent guarantee. In other words, carbon removals guarantee investors a time-based solution. As such, it’s increasingly common for these certificates to be sold not just by the ton, but also by the ton-year. This all amounts to more complexity and expense for the buyer. This is common enough to developing financial markets and emerging technologies, and carbon removal certificates
sit in the middle of these cross-roads. As a result, carbon removal projects are generally more expensive than offsets. Some of the most durable forms of removal can cost up to $600/ ton. As the market grows and as technologies mature, these eye-watering prices are likely to decrease as has already happened with renewable energy. Additional regulations could help build metrics and standards to increase trust and ease for buyers and ensure fairer competition among diverse sellers. Further, these removal projects and technologies are, like offsets, disproportionately available to wealthy countries and major corporations mostly concentrated in wealthier parts of the world. Removals are still new, but could face many of the same challenges that have been uncovered regarding offsets and global inequity.
For now, large tech companies have been among the most prominent investors and buyers in this market. Most rely on well-resourced internal research teams, who end up purchasing a mixture of expensive and
cheaper certificates across a spread of projects, diversifying their risk and rewards. Meta has invested in a number of carbon removal projects and reports that they have applied 90,000 tonnes of carbon removal credits to their overall carbon accounting. Google has established a Carbon Removal Research grant to fund research into carbon removal technologies and, along with Meta and Stripe, have pledged to spend $925 million on carbon removal purchases within the decade.
Microsoft has emerged as one of the leaders in carbon removals, particularly within the tech and telecommunications industries. Microsoft is spearheading one of the largest carbon removal projects through their endeavor to be carbon negative by 2030. They plan to deploy $1 billion of their capital in a Climate Innovation Fund for carbon reduction and removal technology. In 2022, Microsoft announced a partnership with CarbonCapture, a company developing Direct Air Capture (DAC) machinery, to support “Project Bison,” a

12 SUBMARINE TELECOMS FORUM MAGAZINE
new DAC project in Wyoming aimed at permanently removing and storing five million tons of CO2 from the atmosphere per year and is intended to be operational in 2023.
In addition, Microsoft invests in more standard removal projects focused on restoring ecological carbon sequestration and claims to have acquired “1.4 million tonnes of carbon removal” from various sources. Microsoft has announced an intention to have removed enough carbon by 2050 to account for all emissions from the company’s history. Carbon removals, paired with renewable, carbon free energy, are central to Microsoft’s efforts. Microsoft’s plan is ambitious and it is worth asking to what extent this proposal is possible, but this kind of commitment is only possible through investment in an approach that emphasizes reducing (and eventually eliminating) emissions released, alongside removing carbon already in the atmosphere.
OPPORTUNITIES AND STRATEGIES FOR SMALLER PLAYERS
Companies don’t need to be as large as Microsoft to participate in carbon removal projects. Shopify’s Sustainability Fund offers suggestions for purchase strategies that are simpler and less-time consuming. Their carbon removal buyer guide is a useful resource for learning how to get buy-in from internal stakeholders, construct a portfolio, and retire the credits that have been received. Broadly speaking, they recommend companies diversify purchases to mitigate the risks that come with these investments. Avoiding forestry projects and “nature-based” solutions in general is also preferred, particularly because they don’t offer many paths for permanence or certainty. In addi-
tion, carbon removal projects should find the appropriate combination of local impact and carbon credibility in order to maximize reliability. When sellers monitor these removals closely, the project remains lucrative for future buyers, which enables this practice to continue much more smoothly over time. Shopify offers a spreadsheet as a model for monitoring progress on purchases, a crucial component to ensuring the value of these projects.
As part of our research, the Sustainable Subsea Networks research team has not found carbon offsetting or carbon removal to be widespread practices across the subsea cable industry. However, there is growing interest by many companies as sustainability and climate emissions become a broader topic of conversation. We recommend that companies make the distinction between offsets and removals when setting carbon reduction goals and to internally research projects or work with independent ratings agencies prior to investing in credits.
Net-zero, in the end, remains an ambitious goal for both countries and companies. Despite the many challenges we’ve highlighted here, there is still considerable value to be found in its pursuit---the Paris Agreement and the prospects for a just and hospitable future demand nothing less. The long history of carbon offsets and the future of carbon removals reminds us to be wary of sustainability measures that seem too good to be true. In most cases, reducing internal emissions remains the most essential and credible course of action--truly the first and primary step. Investing in on-site renewable energy, increasing energy efficiency and reducing energy consumption are all more effective and stronger long-term options. But
beyond this work, there is also a growing set of organizations working to increase the scale, transparency, and accessibility of carbon removals that could also prove essential to keeping the climate stable. Any company that takes seriously addressing carbon emissions and climate concerns should consider contributing to their efforts. STF
NICOLE STAROSIELSKI is Associate Professor of Media, Culture, and Communication at NYU. Dr. Starosielski’s research focuses on the history of the cable industry and the social aspects of submarine cable construction and maintenance. She is author of The Undersea Network (2015), which examines the cultural and environmental dimensions of transoceanic cable systems, beginning with the telegraph cables that formed the first global communications network and extending to the fiber-optic infrastructure. Starosielski has published over forty essays and is author or editor of five books on media, communications technology, and the environment. She is co-convener of SubOptic’s Global Citizen Working Group and a principal investigator on the SubOptic Foundation’s Sustainable Subsea Networks research initiative

NICK SILCOX is a Ph.D. candidate in the department of English at New York University where he is working on a dissertation on sensing and sensor technologies and environmentality. Nick is also a research assistant on the Sustainable Subsea Networks project.

GEORGE N. RAMÍREZ is a PhD candidate in the Department of Media, Culture, and Communication at New York University, where his work focuses on sensation and perfor
Do you have further questions on this topic?
MAY 2023 | ISSUE 130 13
AN EXPERT
ASK
WHERE IN THE WORLD ARE THOSE PESKY CABLESHIPS?
BY SYEDA HUMERAINTRODUCTION AND CONTEXT: NAVIGATING GLOBAL CABLE SHIP ACTIVITY
In today’s interconnected world, cable ships play a crucial role in the maintenance and expansion of our telecommunication networks. These specialized vessels are responsible for installing and repairing submarine cables, which serve as the backbone of our global connectivity. From April 22 to June 22, a period of intense activity occurred, showcasing the vital importance of cable ships in powering global telecommunications.
Cable ships are essential for seamless data, voice, and video transmission across continents and under the world’s oceans. Without their expertise, our international communication, financial transactions, and information exchange would face significant disruptions. During the specified period, cable ships were actively involved in laying new cables, conducting repairs, and expanding networks to remote areas. Their advanced technology, skilled crew, and specialized equipment ensure uninterrupted data flow in our digital age.
The significance of cable ship activities lies in their direct contribution to global telecommunications. New cable installations expand network reach and capacity, enabling faster and more reliable communication. Maintenance and repair operations safeguard against disruptions caused by natural disasters, damage, or sabotage. Connecting remote regions provides economic opportunities, education, and improved access to services for isolated communities.
With the increasing reliance on cloud computing, IoT
devices, and emerging technologies, the demand for robust telecommunication networks continues to grow. The observed cable ship activity between April 22 and June 22 demonstrates the industry’s dedication to meeting this demand. These operations ensure the smooth functioning of our current digital landscape while setting the stage for future expansion and innovation.
Exploring global cable ship activity during this period allows us to appreciate the immense efforts undertaken by these vessels and their crews. They navigate challenging seas and employ intricate cable-laying machinery to maintain the lifelines that connect our world. Join us as we delve into their operations, understand their invaluable contributions, and gain insights into the dynamic realm of global telecommunications empowered by cable ships.
14 SUBMARINE TELECOMS FORUM MAGAZINE
EXPLANATION OF BAR GRAPH:
The bar graph represents the frequency of AIS status updates, providing insights into the activities and movements of vessels. AIS, or Automatic Identification System, is a tracking system used in the maritime industry to monitor and transmit vessel information, including position, speed, course, and status updates.
Axes: The x-axis of the bar graph displays the different AIS status categories (e.g., “Underway”, “At anchor”, “At port”), while the y-axis represents the frequency or count of status updates. The scale of the y-axis depends on the range of frequencies observed in the dataset.
Visual 1 of the report reveals significant disparities in the sum of AIS Entry values across different Navigational Status categories. Notably, category 5 which is Moored had the highest count, which was substantially greater (200,750.00%)than category 6 which is Aground, which had the lowest count of 2. This vast difference highlights the unequal distribution of Entry values among the categories.
Moreover, Moored accounted for 37.48% of the total count of AIS Entry across all six Navigational Status categories. This indicates that moored has a dominant presence in terms of the overall AIS Entry values recorded in the dataset.
NAVIGATION STATUS
The sum of AIS Entry varied significantly across the different Navigational Status categories, ranging from 2 to 4,017. This wide range demonstrates the diverse distribution of AIS Entry values and suggests the presence of various vessel activities and conditions within each Navigational Status category.
By examining Visual 1, readers can gain insights into the distribution and disparities in the count of AIS Entry values across the different Navigational Status categories. These findings can inform further analysis, decision-making, and strategic planning within the maritime domain.
Notable Patterns: The bar graph can highlight patterns that indicate certain activities or conditions. For example, if there is a high frequency of “At port” status updates, it suggests that vessels are spending a significant amount of time in port, possibly for maintenance, repairs, or loading/
unloading activities. This pattern could be indicative of a port’s importance as a hub for vessel operations or a significant repair/maintenance center.
Other patterns might include a high frequency of “Underway” status updates, indicating vessels actively navigating or moving between locations, or a notable number of “At anchor” updates, signifying vessels are stationary but not in a port or underway. These patterns can provide insights into vessel traffic, trade routes, and activities in different regions.
Analyzing the distribution and frequencies of AIS status updates through the bar graph can aid in understanding vessel operations, identifying patterns, and making informed decisions related to maritime activities. It offers a snapshot of the current state of vessels and their movements, providing valuable information for stakeholders in the maritime industry, including port authorities, vessel operators, and researchers.
Additionally, the analysis of the count of AIS Entry revealed significant disparities, with Moored having the highest and being substantially higher than Aground, which had the lowest. The distribution of AIS Entry across the different Navigational Status categories varied widely, ranging from 2 to 4,017.
EXPLANATION OF LINE GRAPH:
The line graph represents the Average Speed of the aggregated cable ship fleet over a two-month period. This graph allows for the observation of trends, fluctuations, and patterns in the fleet’s Average Speed, which can provide insights into the most prominent type of activity.
JULY 2023 | ISSUE 131 15
Power BI Desktop 0K 1K 2K 3K 4K AIS ENTRY NAVIGATION STATUS 4.0K 3.0K 2.8K 0.8K AIS.NAVSTAT 5 0 3 1 8 6 Moored Aground Restricted Manueverability Under Way Using Engine At Anchor Under Way Sailing A I S E n t r y ( T h o u s a n d s ) Power BI Desktop
3.0K 2.8K 0.8K AIS.NAVSTAT 5 0 3 1 8 6 Moored Aground Restricted Manueverability Under Way Using Engine At Anchor Under Way Sailing
Axes: The x-axis of the line graph represents the time period, typically displayed as days or dates. The y-axis represents the Average Speed of the fleet, indicating the aggregated speed at which it is moving during a specific period.
Line: The line connecting the data points represents the fleet’s Average Speed over time. The slope and direction of the line indicate the overall trend or pattern of speed variations during the two-month period.
Interpretation: The Average Speed of the fleet can provide clues about the type of activity it is involved in at any given time. Different activities, such as laying cables, performing maintenance, or traveling to a new location, often have distinct speed characteristics.
For example, during cable-laying operations, a ship’s speed may decrease significantly as it navigates carefully along a predetermined route. This can result in a relatively low Average Speed compared to other activities. On the other hand, when a ship is engaged in maintenance or repair work, its speed may vary depending on the nature of the tasks being performed, resulting in fluctuations in Average Speed over time.
When a ship is traveling to a new location or between ports, it typically maintains a more consistent and higher Average Speed. This steady speed is necessary for efficient transportation and adherence to schedules.
During the period from Sunday, April 22, 2023, to Saturday, June 22, Thursday, 2023, the Average Speed exhibited a notable upward trend, resulting in a substantial increase of 53.41%. This suggests a general acceleration in the speed of vessels throughout the fleet within the dataset during that timeframe.
The upward trend in Average Speed began on Sunday, January 1, 2023, and within a span of 10 days, experienced a significant rise of 61.12% (1.04). This indicates a rapid increase in the Average Speed of vessels during this initial phase of the observed period.
The steepest incline in the average of Average Speed occurred between Sunday, January 1, 2023, and Wednesday, January 11, 2023. During this interval, the average Speed surged from 1.71 to 2.75, representing a substantial leap
in vessel speed. This sharp increase suggests a concentrated period of heightened vessel activity or specific operational requirements that demanded faster speeds.
The observed trends and fluctuations in Average Speed provide insights into the dynamics of vessel movements and activities during the specified period. The upward trajectory indicates an overall increase in vessel speeds, potentially driven by factors such as favorable weather conditions, operational demands, or specific industry requirements.
These findings highlight the importance of monitoring and analyzing Average Speed trends, as they offer valuable information for stakeholders in the maritime industry. Understanding variations in vessel speed can aid in optimizing operations, evaluating efficiency, and identifying potential areas for improvement in maritime activities.
By monitoring these trends and fluctuations in Average Speed, stakeholders can gain insights into maritime activities and understand the patterns associated with different types of operations. This information can be valuable for planning, scheduling, and optimizing vessel activities, as well as providing insights into the efficiency and effectiveness of various operations.
Overall, the line graph of Average Speed offers a visual representation of the aggregated cable ship fleet’s speed variations over time, providing valuable information about the type of activity engaged in during the specified twomonth period.
COMPARISON OF LINE AND BAR GRAPH:
Both visuals contribute distinct perspectives on maritime activities. The line graph of average speed trend focuses on
16 SUBMARINE TELECOMS FORUM MAGAZINE
Power BI Desktop 1 2 3 4 5 DAYS A V E R A G E O F SP E E D 1 2 3 4 5 6 7 8 9 10 11 12 13 14 15 16 17 18 19 20 21 22 23 24 25 26 27 28 29 30 31 1.7 2.6 5.1 1.5 2.1 3.4 2.6 2.9 1.9 3.2 2.1 2.1 3.0 3.0 2.5 2.9 3.1 2.4 2.0 3.1 2.8 2.0 3.0 3.0 1.7 2.3 2.2 2.8 3.0 2.4 3.2
CABLESHIPS
vessel velocities, showcasing an overall upward trend and significant fluctuations during the analyzed period. It provides insights into vessel speed variations and potential factors driving these changes, such as weather conditions, operational demands, or industry requirements.
On the other hand, the bar graph of AIS status updates sheds light on vessel activities and their distribution across different categories. It highlights the dominance of Moored and the unequal distribution among the Navigational Status categories. This information aids in understanding vessel operations, identifying patterns, and making informed decisions related to maritime activities.
By combining the analysis of both the average speed trend and AIS status updates, stakeholders can gain comprehensive insights into maritime activities. The average speed trend informs about vessel velocities, potential acceleration, and factors influencing speed variations. Meanwhile, the AIS status updates provide valuable information on vessel activities, distribution, and patterns across different status categories. This holistic understanding supports optimized planning, scheduling, and decision-making in the maritime industry, ultimately enhancing efficiency and operational effectiveness.
SCATTER PLOT OF AVERAGE SPEED VS AVERAGE DRAUGHT :
The scatter plot represents the relationship between the Average Speed and average draught of ships. Before discussing the plot, it is essential to understand what draught is and why it matters in maritime operations.
Draught refers to the vertical distance between the waterline and the deepest point of a ship’s hull. It determines how deep a ship sits in the water, affecting its buoyancy, stability, and maneuverability. Draught is a critical consideration for ship operators as it influences various factors, including cargo capacity, navigational limitations, and fuel efficiency.
Axes: In the scatter plot, the x-axis represents the average draught values, while the y-axis represents the Average Speed values of the ships. The scales of the axes depend on the range of draught and speed values observed in the dataset.
Data Points: Each data point in the scatter plot represents a specific ship, indicating its average draught and Average Speed. The position of the data point on the graph reflects the relationship between these two variables.
Interpretation: The scatter plot allows for the examination of the correlation or relationship between Average Speed and average draught. Generally, a ship with a larger draught might be expected to have a slower speed due to increased water resistance and displacement. However, the scatter plot can reveal interesting correlations or outliers that deviate from this expectation.
Correlations: If the data points in the scatter plot exhibit a noticeable trend, such as a negative slope or clustering, it suggests a correlation between draught and speed. A negative slope would indicate that ships with higher draught tend to have lower speeds, conforming to the expectation. Conversely, a positive slope would suggest an unexpected relationship, where ships with larger draughts have higher speeds.
Outliers: The scatter plot also helps identify outliers, which are data points that deviate significantly from the general trend or pattern. For instance, if a ship has a large draught but exhibits a high speed, it suggests unique characteristics or operational considerations. There could be various reasons for this anomaly, such as the vessel’s design, propulsion system, cargo type, or specialized operations.
These outliers can be of particular interest as they may uncover interesting insights into ship operations, technological advancements, or industry-specific factors. They provide an opportunity for further investigation and understanding of the underlying reasons behind their unexpected performance. By analyzing the scatter plot of Average Speed versus
JULY 2023 | ISSUE 131 17
Power BI Desktop 2 3 4 5 6 7 8 9 AVERAGE OF SPEED A V E R A G E O F D R A U G H T 0 2 4 6 8
CABLESHIPS

18 SUBMARINE TELECOMS FORUM MAGAZINE

JULY 2023 | ISSUE 131 19
CABLESHIPS
average draught, stakeholders can gain insights into the relationship between these two variables for ships. It allows for the identification of correlations, patterns, and outliers that can provide valuable information for ship design, operational planning, and optimization of vessel performance.
Overall, the scatter plot offers a visual representation of the relationship between Average Speed and average draught, shedding light on expected trends and revealing intriguing outliers that can stimulate further exploration and investigation within the maritime domain.
On visual 3 of the analysis, two specific vessels stood out in terms of their average Average Speed and average Draught values. SEGERO recorded the highest average Average Speed of 8.94, indicating its exceptional speed compared to other vessels in the dataset. This suggests that SEGERO is a vessel capable of swift navigation and efficient movement.
On the other hand, ILE DE RE exhibited the highest average Draught of 8.68. A high draught value suggests that ILE DE RE sits deeper in the water, potentially indicating its suitability for transporting heavy cargo or operating in regions with deeper waterways.
These distinct characteristics of SEGERO and ILE DE RE highlight their unique capabilities and roles within the maritime domain. SEGERO’s high average Speed could be advantageous for time-sensitive operations or swift transport, while ILE DE RE’s high average Draught may be valuable for specific types of cargo or navigating deeper waters.
By identifying these vessels with exceptional average Speed and average Draught values, the analysis on page 5 provides insights into the diverse capabilities and functions of different vessels within the dataset. These observations can be valuable for stakeholders in the maritime industry, allowing them to understand the specific characteristics and potential applications of vessels like SEGERO and ILE DE RE.
NETWORK GRAPH OF DESTINATIONS:

The network graph showcasing the destinations of global cable ship activities provides a visual representation of the interconnectedness and relationships between various locations involved in submarine cable operations. This graph offers insights into the pat-
terns, connectivity, and factors influencing the popularity of certain destinations within global cable ship activities.
The graph demonstrates the interconnectedness of global cable ship activities by showcasing the links or edges between different destinations. Each node represents a specific destination, and the edges illustrate the connections between these destinations based on cable ship activities. The presence of multiple connections between nodes indicates the extent of cable ship operations and the interdependency of different regions within the global submarine cable network.
Several factors contribute to the popularity of certain destinations within global cable ship activities:
Geopolitical Considerations: Geopolitical factors play a significant role in determining the popularity of destinations for submarine cables. Countries or regions with high population densities, economic significance, or strategic importance tend to attract submarine cable investments. These destinations require robust connectivity to support various sectors, including commerce, finance, research, and communication. Geopolitical relationships and collaborations between countries also influence the selection of destinations and the development of shared cable systems.
Infrastructure and Connectivity: The availability of existing infrastructural frameworks and connectivity is crucial in determining popular destinations for submarine cables. Locations with well-established landing stations, data centers, and interconnection points are attractive for cable
20 SUBMARINE TELECOMS FORUM MAGAZINE
Power BI Desktop First AIS NAME by AIS NAME and AIS DESTINATION
CLICK THE IMAGE TO GO TO THE INTERACTIVE VERSION OF THE NETWORK GRAPH
ship activities. These destinations provide opportunities for connectivity expansions, redundancy, and improved international connectivity. Favorable marine conditions, suitable landing sites, and proximity to major network hubs also influence the selection of destinations.
Market Demand and Emerging Technologies: Market demand and emerging technologies influence the popularity of destinations within cable ship activities. Highgrowth regions, emerging markets, or areas with increasing demands for data and communication services become attractive destinations for submarine cable investments. Locations with a strong presence of data centers, cloud computing facilities, or technology-driven industries also drive the demand for improved connectivity and support cable ship activities.
International Collaboration and Partnerships: Collaborations and partnerships between countries, industry stakeholders, and cable operators influence the interconnectedness of global cable ship activities. Joint ventures, consortiums, and international agreements promote the development of shared cable systems that connect multiple regions and foster international cooperation. These collaborative efforts aim to enhance cross-border communication, strengthen economic ties, and improve global connectivity.
By examining the network graph of global cable ship destinations, stakeholders can visualize the interconnectedness of submarine cable activities and gain insights into the popularity of specific destinations. It helps identify the interdependencies, patterns, and connectivity within the global submarine cable network. Understanding the geopolitical, infrastructural, and market-driven factors that influence destination choices is crucial for policymakers, industry stakeholders, and researchers involved in the planning, expansion, and optimization of submarine cable networks.
CONCLUSION AND LOOKING FORWARD:
In conclusion, the analysis of global cable ship activities has provided several key findings and insights into the industry. Let’s summarize these findings and explore their implications for the future:
Increasing Average Speed: The data revealed an upward trend in the Average Speed over the specified period. This indicates an overall increase in vessel speeds, potentially driven by factors such as improved technology, optimized routes, or the need for faster data transmission. This trend suggests a commitment to enhancing efficiency and meeting the growing demands for faster connectivity.
Interconnectedness of Cable Ship Activities: The network graph showcased the interconnectedness of global cable ship activities, emphasizing the extensive network of submarine cables and the collaborative efforts between countries and regions. This interconnectedness highlights the importance of international collaboration and partnerships in expanding and maintaining global telecommunications infrastructure.
Looking forward, these trends suggest a continued focus on improving speed and efficiency within the cable ship industry. Advances in technology, such as faster cable-laying techniques or the adoption of new propulsion systems, may further contribute to the acceleration of vessel speeds. Additionally, the increasing demand for high-speed internet connectivity and the rise of emerging technologies like 5G and IoT are expected to drive the need for enhanced submarine cable networks and subsequent cable ship activities.
It is worth noting that upcoming events and developments can significantly impact cable ship activity. For instance, the deployment of new submarine cable systems linking previously underserved regions can create opportunities for increased cable ship operations and maintenance activities. Additionally, geopolitical factors, changes in regulations, or shifts in market demands may influence the prioritization of specific destinations for cable ship activities.
Furthermore, ongoing advancements in cable technology, such as higher-capacity fiber optic cables or the integration of renewable energy solutions into cable systems, may shape the future landscape of cable ship operations. These developments can contribute to more efficient and sustainable cable laying, maintenance, and repair processes.
In summary, the analysis of global cable ship activities has revealed an increasing emphasis on speed, connectivity, and collaboration within the industry. The trends observed indicate a commitment to meeting the growing demands for faster and more reliable telecommunications infrastructure. With the continuous advancements in technology and the evolving needs of the digital era, cable ship activities are poised to play a crucial role in expanding global connectivity and supporting the seamless transmission of data across regions. STF
SYEDA HUMERA, a graduate from JNTUH and Central Michigan University, holds a Bachelor’s degree in Electronics and Communication Science and a Master’s degree in Computer Science. She has practical experience as a Software Developer at ALM Software Solutions, India, where she honed her skills in MLflow, JavaScript, GCP, Docker, DevOps, and more. Her expertise includes Data Visualization, Scikit-Learn, Databases, Ansible, Data Analytics, AI, and Programming. Having completed her Master’s degree, Humera is now poised to apply her comprehensive skills and knowledge in the field of computer science.

JULY 2023 | ISSUE 131 21
5 QUESTIONS WITH ADAM BALL
Talking Network Industry With Submarine Networks World General Manager

1. WHO IS SUBMARINE NETWORKS WORLD AND WHAT IS THE EVENTS MISSION?

Submarine Networks World 2023 will be the 26th annual edition of the event. Taking place each year here in Singapore, it is the largest annual subsea communications event in the world. Each year, we recruit the most innovative and exciting speakers in the space from all corners of the globe, offer thought-provoking discussion sessions where moderators are not afraid to ask the tough questions, and in-turn extend the global reach of the event. Our mission is simple – to provide a platform for the best and brightest in the global subsea communications industry to share knowledge, do business and advance their mission of making communication easy and accessible for all.
2. HOW DOES SUBMARINE NETWORKS WORLD PARTICIPATE IN THE SUBMARINE CABLE MARKET?
We’re not selling cables or leading consortia! Rather, Submarine Networks World brings together the movers and shakers from the market in once place to drive the industry forward. In describing us, our attendees use phrases like ‘both ends of the cable’ or ‘all the people you want to meet with in one room’.
3. HOW IS TERRAPINN HELPING TO PROMOTE A MORE DIVERSE AND INCLUSIVE SUBSEA SECTOR?
We always approach speakers and participants from various genders, backgrounds and ethnicities. Of course, we can only bring together the people who accept our invitation, but we strive to increase the diversity of our speaker panel every year. We are also continuing our “Under 25” scheme that we launched for the 25th anniversary edition last year, whereby registered attendees can bring a junior colleague
22 SUBMARINE TELECOMS FORUM MAGAZINE
FEATURE
under the age of 25 to the event free-of-charge to ensure that the next generation can learn from the current leaders.
4. AS SUSTAINABILITY HAS BECOME A HOT BUTTON ISSUE IN OUR INDUSTRY, WHAT ARE SUBMARINE NETWORKS WORLD’S PLANS FOR SUSTAINABLE OPERATIONS GOING FORWARD?
Across all our events, we are always looking at how we can improve the sustainability of our operations. A few examples are that we have removed unnecessary single-use carpet from the event, the event venue employs sustainability practices in waste reduction, single plastic usage & electricity consumption and our event app has removed the need for multiple paper-based communications. We are also a member of Isla (Home - We are isla. Helping to accelerate the event industry to a sustainable future.), a global body helping to accelerate the sustainable future of events.
5. WHAT’S HAPPENING AT SUBMARINE NETWORKS WORLD IN 2023?
Following our record-breaking 25th anniversary edition of the event last year, we’re going to be even bigger this year. There’s only a handful of sponsorship opportunities remaining and attendee numbers will be even bigger. Aside from that, you can expect the same amazing networking and learning opportunities and a chance to spend time with the leaders who are really driving the industry forward. To find out more visit WEBSITE. STF
ADAM BALL is General Manager of Terrapinn responsible for the management of Submarine Networks World since 2018. He is an experienced sales leader with a proven track record in both London and Singapore. Coupling an affable nature with outstanding influencing and communication skills, he has directly formed and maintained long-term business relationships of integrity and success across a variety of high value/high profile products and services.
WHEN YOU HAVE THE NEED FOR SPEED
400GbE Connectivity between Australia and New Zealand to the USA.

SubTel_Ad_July 2023_Southern Cross Cable Network.pdf 1 30/06/2023 1:23:08 PM


WHY ATTEND SUBMARINE NETWORKS WORLD
With the demand for global submarine cable capacity growing at almost an exponential rate, the role of subsea networks has clearly evolved into mission critical infrastructure, facilitating all communications across the globe.
In line with the growing connectivity and appetite for greater bandwidth - lower latency, greater capacity and more diverse networks continues to escalate. Meeting these ongoing challenges will require agility, scalability and further innovation.

Submarine Networks World is established as the premier subsea communications conference - offering a dedicated setting to exchange knowledge, explore the latest projects, develop strategies, and form lucrative new partnerships to drive the industry forward.
In 2023, you will meet with more than 800 subsea influencers and decision-makers from every continent, over 120 top-tier speakers and more than 50 sponsors and exhibitors waiting to showcase what they can do to design, build, install, maintain, and manage your network.
Get ready for inspirational keynotes, lively and thought-provoking debates, alongside new ideas and new connections.
26 SUBMARINE TELECOMS FORUM MAGAZINE
Submarine Networks World 2023
Framework Agenda
Day 1: 27 September 2023
KEYNOTE PRESENTATIONS
STRATEGY TECHNOLOGY
Business Models
Open Cables 1
OPERATIONS & MAINTENANCE
Installation
Finance Testing & Measurement Maintenance
Day 1 Cocktail Reception
Day 2: 28 September 2023
KEYNOTE PRESENTATIONS
STRATEGY TECHNOLOGY
Permitting & Regulation
Open Cables 2
DATA CENTRES & CLS
DC Today
Cable Protection Cable Technology CLS
New Routes & Emerging Markets
New Network Design DC Tomorrow
Day 2 Cocktail Reception

JULY 2023 | ISSUE 131 27
ASEAN HERITAGE PARKS AND LEGAL TOOLS FOR SUBMARINE CABLE PROTECTION
BY WAHAB JUMRAHINTRODUCTION
The Association of Southeast Asian Nations (ASEAN) is a regional organization that was established in 1967 with the aim of promoting economic, political, and social cooperation among its ten member countries in Southeast Asia 1 Once in two years, ASEAN leaders will hold a summit to discuss and resolve current issues ranging from economy to socio-cultural development. As part of this summit, ASEAN leaders usually exchange MOUs, develop and declare several initiatives to promote its regional bloc. The recent ASEAN Summit 2023 was held successfully in Labuan
1 ASEAN. https://asean.org/about-asean (accessed in May 2023)

Bajo, Indonesia in May 2023 despite no progress with the current issue with Myanmar2 .
One of the lesser-known initiatives of ASEAN is the ASEAN Heritage Parks (AHP) program, which was launched in 2004 to promote the conservation of natural and cultural heritage sites in the region. This program has identified and designated parks across the ten member countries of ASEAN. In addition to promoting conservation, the AHP program also aims to promote sustainable tourism and development in the region.
28 SUBMARINE TELECOMS FORUM MAGAZINE
2 Lamb, K. (2023, May 11). ASEAN will not give up on Myanmar peace despite no progress – minister. Reuters. https://www.reuters.com/world/asia-pacific/ asean-must-show-unity-tackle-myanmars-escalating-crisis-indonesia-president-says-2023-05-11/.
FEATURE
Another critical initiative that is increasingly becoming important in the region is the protection of submarine cables. These cables play a vital role in facilitating international communication and trade, but they are also vulnerable to damage and disruption from human activity and natural disasters.3
Although AHP and submarine cable protection regime was not discussed during ASEAN Summit 2023, it is a high time to re-look at the connection between these two areas as ASEAN countries become more interconnected and reliant on these cables.4 Therefore, it is important to review the current ASEAN framework on AHP and its feasibility to be legal tools for the submarine cable protection and resilience.

ASEAN HERITAGE PARKS
ASEAN Heritage Parks are defined as protected areas of high conservation importance, preserving in total a complete spectrum of representative ecosystems of the ASEAN region.5 These areas are established to generate greater awareness, pride, appreciation, enjoyment and conservation
4 ABS-CBN News. (2022, Nov 8). Globe, DITO, Southeast Asian telcos ink deal for new subsea Asia Link Cable project. ABS-CBN News. https://news.abs-cbn.com/business/11/08/22/southeast-asian-telcos-ink-deal-for-new-subsea-cable-system.
5 ASEAN Centre for Biodiversity. ASEAN Heritage Parks. https://asean.chm-cbd.net/ asean-heritage-parks (accessed on May 2023)
of ASEAN’s rich natural heritage, through a regional network of representative protected areas, and to generate greater collaboration in preserving their shared natural heritage.6
The concept of heritage parks and reserves in ASEAN was introduced at the First Meeting of AEGE in 1978. The First Meeting of ASEAN Experts on Nature Conservation (ANC) in 1982 recommended the interim coordinator of the 5th Meeting of AEGE to coordinate the publication of the Draft Version of ASEAN Heritage Sites, and it was produced in October 1982 with assistance of IUCN and UNEP. The Draft of ASEAN Heritage Parks and Reserves was considered by the Sixth Meeting of AEGE in 1983. 7
The ASEAN Declaration on Heritage Parks and Reserves was adopted at the Second ASEAN Ministerial Meeting on the Environment on 29 November 1984 in Bangkok, Thailand and signed by the six member countries at that time, namely Brunei Darussalam, Indonesia, Malaysia, Philippines, Singapore and Thailand8. The Declaration was made in consideration of “the uniqueness, diversity and outstanding values of certain national parks and reserves of ASEAN member countries that deserve the highest recognition so that their importance as conservation areas could be appreciated regionally and internationally.
The AHP program was established in 2004 to recognize and protect natural and cultural heritage sites in the region. These sites are identified based on their unique biodiversity, cultural significance, and potential for sustainable tourism and development.
The ASEAN Centre for Biodiversity (ACB) currently serves as the Secretariat of the AHP programme and the AHP committee, with representatives from the 10 AMS
6 ASEAN Centre for Biodiversity. ASEAN Heritage Parks and Protected Areas: Enhancing Effective Management. https://asean.chm-cbd.net/sites/acb/files/2022-03/Policy%20Brief_AHP_FINAL.pdf (accessed on May 2023)
7 ASEAN. UNESCO. (1983). ASEAN Heritage Parks and Reserves
8 ASEAN. ASEAN Declaration on Heritage Parks. https://arc-agreement.asean.org/file/ doc/2015/02/asean-declaration-on-heritage-parks.pdf (accessed on May 2023).
JULY 2023 | ISSUE 131 29
3
The AHP program was established in 2004 to recognize and protect natural and cultural heritage sites in the region. These sites are identified based on their unique biodiversity, cultural significance, and potential for sustainable tourism and development.
FEATURE
serving as members. In the management of AHPs, the ASEAN Working Group on Nature Conservation and Biodiversity (AWGNCB) provides guidance and promotes regional coordination in the implementation of conventions and activities related to biodiversity conservation.
As Secretariat of the AHP program, ACB evaluates applications for new AHPs; conducts capacity development activities for AHP managers and staff; organizes AHP conferences; holds promotional activities for the AHP Programme; and facilitates coordination among AHP managers to strengthen the parks as a regional network of protected areas. ACB also conducts programmatic training courses for enhancing the management and conservation skills of protected area workers.
As to date, there are 55 sites that were declared as ASEAN Heritage Parks – consists of both land and marine parks. Notably, the establishment of ASEAN Heritage Parks are within the territorial waters of the member countries.9
SUBMARINE CABLE PROTECTION
There are more than 450 submarine cables in operation worldwide10 providing connectivity and stable communications. The number of cables is constantly growing provided that more cables are under construction or planned to be laid to connect new areas. Nearly two-thirds of the global population will have internet access by 2023. There will be 5.3 billion total internet users (66 percent of global population) by 2023, up from 3.9 billion (51 percent of global population) in 2018.11 In the ASEAN region, submarine cables play a critical role in facilitating communication and trade between member countries and with the rest of the world.
However, these cables are vulnerable to damage and disruption from a variety of sources, including human activity, natural disasters, and climate change12. Damage to submarine cables can result in significant economic and social impacts, including disrupted communication and trade, as well as environmental damage from cable ruptures13
There are several initiatives underway to protect submarine cables in the ASEAN region. These initiatives are aimed at ensuring the reliability and security of submarine cables, which are critical infrastructure for communication and information exchange between countries.
9 Ibid at 4
10 TeleGeography. (2023). Submarine Cable Map. http://www.submarinecablemap.com.
11 Cisco. (2020) Annual Internet Report 2018 – 2023 White Paper.
12 Ford-Ramsen, K., & Davenport, T. (2014) The Manufacture and Laying of Submarine Cables. Submarine Cables: The Handbook of Law and Policy., 123-125.
13 Schvets, D. (2020). The International Legal Regime of Submarine Cables: A Global Public Interest Regime [Doctoral dissertation, Universitat Pompeu Fabra Barcelona, Spain]. Tesisenred.net.
There are several initiatives underway to protect submarine cables in the ASEAN region. These initiatives are aimed at ensuring the reliability and security of submarine cables, which are critical infrastructure for communication and information exchange between countries.
The most important framework developed by ASEAN is ASEAN Guidelines for Strengthening Resilience and Repair of Submarine Cables (SRSC), which was adopted by the ASEAN Telecommunications and IT Ministers in 2019. 14 SRSC was developed as part of the bigger masterplan of ASEAN namely ASEAN ICT Masterplan 2020 (AIM2020) – now is ASEAN Digital Masterplan 2025 has identified the development of a set of guidelines among all ASEAN Member States, which will help cable operators to expedite repairs of submarine cables in the region by minimising permit requirements and cost.15
The framework provides guidelines and best practices for protecting submarine cables from damage and disruption. SRSC is a regional initiative aimed at strengthening the protection and resilience of submarine cables in Southeast Asia. The framework was developed by the ASEAN Telecommunications and Information Technology Senior Officials Meeting (TELSOM) Working Group on Submarine Cable Systems, in collaboration with the International Cable Protection Committee (ICPC) and other stakeholders 16 17 in response to the increasing importance of submarine cables as a critical infrastructure for the region’s economic growth and connectivity.18 SRSC framework have summarised four key objectives19 20:
1. Enhance the protection and resilience of submarine cables against natural and man-made disasters, including
14 ASEAN. (2019, October 25). The 19th ASEAN Telecommunications and Information Technology Ministers Meeting and Related Meetings. ASEAN Joint Media Statement in Vientiane, Laos.
15 AIM2020 Strategic Thrust 4, Action Point 4.1.2 calls for the development of a framework among all ASEAN member states to expedite repairs of submarine cables in their waters by minimising permit requirements and cost.
16 Hass, R. (2022). Invigorating Regional Efforts to Bolster Maritime Security in Asia. Foreign Policy at Brookings. pg 13.
17 See also for information - Asia-Pacific Economic Cooperation (APEC). (2012). Submarine Cable Information Sharing Project: Legislative and Points of Contact.
18 Vu, H.D. (2020) ASEAN Guidelines for Strengthening Resilience and Repair of Submarine Cables. The International Journal of Marine and Coastal Law. 36(1). pg 177-185.
19 ASEAN. ASEAN Guidelines for Strengthening Resilience and Repair of Submarine Cables.
20 ASEAN. ASEAN Digital Masterplan 2025.
30 SUBMARINE TELECOMS FORUM MAGAZINE
cyber threats.
2. Promote the development of best practices and standards for submarine cable protection and resilience.
3. Facilitate information sharing and cooperation among ASEAN Member States, industry stakeholders, and other relevant organizations.
4. Raise awareness and understanding of the importance of submarine cables and the need for their protection and resilience.
To achieve these objectives, SRSC laid several key strategies, including 21:
1. Developing and implementing national and regional plans for submarine cable protection and resilience.
2. Conducting risk assessments and vulnerability analyses to identify potential threats to submarine cables.
3. Establishing protocols and procedures for incident response and disaster recovery.
4. Encouraging the use of advanced technologies and innovative solutions to enhance submarine cable protection and resilience.
5. Promoting capacity building and training programs for relevant stakeholders.
The SRSC also emphasizes the importance of cooperation and collaboration among ASEAN Member States and industry stakeholders. It recognizes that submarine cable protection and resilience is a shared responsibility and that effective coordination is necessary to address the complex challenges associated with submarine cable protection and resilience22 . Overall, this initiative demonstrates the importance of protecting submarine cables in the ASEAN region and the commitment of regional organizations to work together to ensure their reliability and security.
WHETHER AHP CAN BE THE LEGAL TOOLS FOR SUBMARINE CABLE PROTECTION?
ASEAN Heritage Parks (AHP) is a legal tool that can be used for conservation and protection of natural resources, including submarine cables 23. However, it is not specifically designed for submarine cable protection.
AHPs can play an important role in protecting submarine cables because they have legal protections that restrict certain human activities within their boundaries24. For example, the
21 Ibid at 18 and 19.
22 Ibid at 18.
23 ASEAN Centre for Biodiversity. ASEAN Heritage Parks. https://asean.chm-cbd.net/ asean-heritage-parks (accessed on May 2023)
24 ASEAN Centre for Biodiversity. (2010). The ASEAN Heritage Parks: A Journey to the Natural Wonders of Southeast Asia. pg. 310.
ASEAN Declaration on Heritage Parks and Reserves prohibits activities such as mining, logging, and hunting within AHPs. These protections can extend to the waters surrounding AHPs, which can provide a buffer zone around submarine cables and limit the activities that could damage them25
In addition to legal protections, AHPs can also serve as sites for research and monitoring of submarine cables. By monitoring the health of the surrounding ecosystem, researchers can identify changes in water quality or marine life that could indicate damage to submarine cables26
AHPs can contribute to the protection of submarine cables by safeguarding the marine environment where the cables are located 27. By designating an area as an AHP, the ASEAN member countries commit to preserving the unique marine ecosystem in the area, including the habitats and species that live there. This can help prevent activities that could potentially damage the submarine cables, such as fishing, dredging, or oil and gas exploration 28 .
However, the protection of submarine cables requires a comprehensive approach that involves multiple stakeholders, including governments, cable operators, and the international community. AHPs can play a role in this approach by providing a framework for conservation and protection, but they are not a standalone solution.
CONCLUSION
Submarine cables are critical pieces of infrastructure that facilitate global communication, but they are also vulnerable to damage from human activities such as fishing, anchoring, and dredging. Damage to these cables can result in significant economic and social impacts, including the loss of communication and internet services, as well as the disruption of international trade.
Overall, while AHPs were not specifically designed as legal tools for submarine cable protection, their legal protections and conservation goals make them a useful tool29 for safeguarding critical submarine infrastructure. STF
WAHAB JUMRAH is a Manager, Permitting & Regulations (Legal) at OMS Group based in Kuala Lumpur, and specializes in international legal regulatory and permitting of marine subsea cable projects mainly in Southeast Asia and Japan jurisdiction.

JULY 2023 | ISSUE 131 31
25 ASEAN Centre for Biodiversity. (2017). ASEAN Biodiversity Outlook, Second Edition pg. 220.
26 Ibid at 18.
27 ASEAN Centre for Biodviersity. (2019). ASEAN Heritage Parks and Protected Areas: Enhancing Effective Management. Policy Brief Series.
28 Ibid at 24
29 ASEAN Centre for Biodiversity. (2023). ASEAN Biodiversity Outlook, Third Edition pg. 131.
THE PACIFIC: SECURING THE FUTURE
 BY JOHN HIBBARD AND PAUL MCCANN
Over the last five years, our focus on the Pacific Region Submarine Cable development has demonstrated enormous growth in the number of cables servicing the Pacific Island Countries (PIC), identifying “gaps” that exist and potential solutions or strategies that could be deployed to strengthen the region in terms of connectivity and resilience. For those of us lucky enough to be part of the Pacific Region Telecommunications Industry, it has been another amazing journey!
Today, as we approach the point where every PIC will have access to at least one international submarine cable, we would like to take another snapshot of the current status, and to take a look at the road ahead to see what else is needed in the Pacific by “Securing the Future.”
WE’VE DONE GOOD!
The tables below are provided to explain the status of connectivity via submarine cable in place or planned across the 22 PICs. The statistics demonstrate the solid focus that has taken place across the region to improve connectivity, and they also help us analyse future requirements and understand the gaps and opportunities that need to be considered for the future!
Kiribati and Nauru connectivity is currently under construction with the EMC (East Micronesia Cable) Project in full swing, using NEC as the supplier and targeting system in-service by the end of 2025. Tokelau
is currently connected to the SX NEXT Cable system but not carrying any traffic at this time, awaiting the completion of the Tokelau Domestic Cable (TDC) - expected to be ready for service in August 2023 - and the relocation of the Tokelau Domestic systems into new Office Buildings on all three atolls. This project in Tokelau can teach us a few lessons that will be relevant for the region in the future!
And again – Tuvalu is the only PIC that does not have firm plans in place for a submarine cable connection – but rest assured there are at least two options in play that could
32 SUBMARINE TELECOMS FORUM MAGAZINE
FEATURE Category PICs Percentage Well Connected American Samoa, CNMI, Fiji, Guam, Samoa, New Caledonia, French Polynesia 32% Reasonably Connected FSM, Palau, RMI, Tonga, Vanuatu, PNG, W&F, Cook Islands, Solomon Islands 41% Connections under Construction Kiribati, Niue, Tokelau, Nauru 18% Plans for Connection Tuvalu 5% No Plans for Connection Pitcairn Island 5%
Submarine Cables of the Pacific Nations
Micronesia: Route: Status:
HANTRU Majuro – Kwajalein – Pohnpei – Guam In Services, RFS 2010
SEA-US Philippines/Indonesia to Guam, Hawaii, USA In Service, RFS 2017
Palau Spur Palau to Guam In Service end 2017
Yap Spur Yap to Guam In Service 2018
Chuuk - Pohnpei Chuuk to Pohnpei (domestic) In Service May 2019
Atisa Saipan – Tinian - Rota – Guam In Service June 2017
EMC Kosrae – Pohnpei – Kiribati - Nauru
Melanesia:
Targeted 2025
Coral Sea Cable Honiara - Sydney, Port Moresby - Sydney In Service Dec 2019
Solomon Islands Domestic Auki – Honiara – Noro In Service Feb 2020
Kumul Many locations around PNG In Service 2019
APNG-2 Port Moresby – Sydney In Service 2006
PPC-1 Sydney – Madang – Guam In Service 2008
ICN1 Vanuatu – Fiji In Service 2014
Gondwana-1

New Caledonia to Sydney In Service 2011
Gondwana-2 & Picot 2 Noumea, Tadine, Vao, We, Yate, Mont-Dore, Suva In Service August 2022
Polynesia:
TCC1 (Tonga Cable) Tonga to Fiji In Service Aug 2013
TDCE (Tonga Domestic Cable) Neifu, Nuku’alofa, Pangai In Service Jan 2018
Tui-Samoa Cable Samoa to Fiji, Spurs for Wallis & Futuna In Service end 2017
Hawaiki Syd – NZ - American Samoa – Hawaii – USA In Service 2018
ASH Pago Pago to Hawaii Retired
SAS Apia to Pago Pago
Honotua Tahiti to Hawaii
In Service May 2009
In Service Sept 2010
Southern Cross Sydney, New Zealand, Fiji, Hawaii, USA In Service Nov 2000
Natitua French Polynesia Marquesas domestic In Service 2018
Natitua Sud Hitia’a, Rurutu, Tubuai
Targeted 2023
Tui Samoa Samoa (incl Savaii), Wallis & Futuna, Savusavu, Suva In Service 2018
Manatua Tahiti, Samoa, Cook Islands, Niue In Service Jul 2020
Tokelau Domestic Cable Nukunonu, Atafu and Fakaofo
Targeted 2023
SX NEXT SYD-LA, plus Samoa, Tokelau, Kiritimati, Fiji, NZL In Service 2022
JULY 2023 | ISSUE 131 33
FEATURE
satisfy this requirement!
And before we look into the future, the following table gives us an overview of ALL the cables in play across the region – some of course are aging gracefully – but most are young and have many years of service in front of them!
If you look closely, several systems are over a decade old and plans for replacement or augmentation would either exist today or be under consideration for the future. That said, most of the systems around the Pacific are only a few years old, and one could expect at least another 20 years of service for these systems!
All in all, right across the Pacific Region, we can be proud of our work – but we can’t stop now – in fact, the hard work is just about to begin!
SECURING THE FUTURE
Once Tuvalu has access to a submarine cable, and both Nauru and Tarawa are connected with EMC, then basically all the Pacific Nations will have their first submarine cable in place and as such they will be able to provide improved

With an ever-increasing reliance upon the availability of abundant and low-cost cable capacity, it does not take long before the Service Providers, and the Government, become concerned about the need for security of service and the avoidance of single points of failure - such as the one and only cable. Restoration Plans are essential for the future!
Satellite certainly provides one option for an alternative route to ensure essential services can be maintained in the event of a cable failure. But as traffic grows, satellite may not be a suitable option. Firstly, the satellite may not offer adequate capacity to restore ALL services required, and secondly, the ongoing operational costs associated with retaining or securing adequate satellite capacity may be prohibitive. As a result, it has been common practice for service providers to provide satellite backup for 10-15% of the services, the objective being to minimize satellite restoration costs and just enable the most essential services to be restored. This situation also helps us understand why more and more Pacific countries are looking for a second – and diverse - submarine cable.
Recognizing the need for submarine cable diversity can create a real challenge for a country. A second cable rarely generates any more traffic making it impossible to justify on the grounds of additional revenue. Additionally, all submarine cables incur an ongoing cost to operate after the cost of construction has been addressed. This would imply a rise in the wholesale price of capacity to customers which is an anathema. So, unless traffic can be substantially grown, there won’t be the revenues to cover the increased costs. So how does an island country secure its future?
service to their customers which include critical parties such as the banks, airlines, health, and the Government. Rapidly, the first cable becomes the umbilical cord for the country with the whole economy increasingly dependent on it. The reliance and benefit of cable connectivity are even greater when the country has significant e-commerce often enlarged by the tourism industry.
Satellite can provide in the short term, but such is not cheap. One particular attraction of satellite is that it can serve the remote and segregated areas of a country. A submarine cable typically lands at the largest city (usually the capital) and unless there is a developed national terrestrial network, much of the country won’t get the full benefit of the cable. So here satellite can service the remote areas and as such it is complementary rather than competitive with cable. Clearly a potential single point of failure is the cable station particularly if cables beyond the first cable land there - a passing ship dragging its anchor in a storm could take out more than one cable! As an example, Palau gave serious consideration to the need for security and diversity and avoiding
34 SUBMARINE TELECOMS FORUM MAGAZINE
single points of failure – their plan is adopting a second cable station around 20 kms from the first using a different natural inlet. On the other hand, Fiji has seven cables landing in its Suva cable station but is now seriously concerned about such and is actively looking to a diverse station.
USING THE CABLE
We have seen in virtually all PICs, that the availability of a submarine cable which has relatively steady ongoing operations costs irrespective of bandwidth deployed, leads to reduced unit prices for traffic the more the volume increases. This in turn can lead to lower retail prices, which in turn leads to more usage -- a truly virtuous cycle. Additionally, when the Government Regulations allow, the growth and stability of the market can be recognized which then provides the impetus for entry by new operators, particularly ISPs which provide increased competitive options, encouragement for reduced prices and hence more traffic. This cycle in turn further emphasizes the need to ensure security and resilience for all traffic.
Diversity and Resilience in a growing market goes beyond providing access to diverse submarine cable capacities. It requires avoidance of single points of failure across all major network elements – this means diverse cable landing points and diverse cable landing stations, and diverse self-healing terrestrial network allowing secure and open access to these facilities by all retail service providers.
And the Retail Service Providers will also need to step up! Having access to low-cost secure international connectivity can only really be realized if the domestic network and customer access networks are also developed accordingly. It is critical to ensure the domestic networks used by the Retail Service Providers grow and are dimensioned adequately to facilitate growth.
Having set up your network elements for success – that is a network that encourages growth and provides secure and high availability services – the growth of “applications” that can actually use the capacities then become critical and can flourish. The Government can feel secure to implement eGovernment, eHealth and eEducation services – and the Retail Service Providers can expand and enhance the services offered to end customers!
IN CLOSING
So, we have done good – but the above story did not even touch upon Cyber related issues, Geopolitics or Cable Sabotage, as such there is still a lot of work for us all to do across the Pacific Region to ensure the people of the Pacific Island Countries can enjoy the quality and diversity of services afforded to more developed nations! The people of the Pacific need us to all keep working together to – SECURE THE FUTURE!

JOHN HIBBARD is CEO of Hibbard Consulting Pty Ltd. John has worked in the telecommunications industry for over 40 years, and for more than 30 has been associated with submarine cables. An Engineer by qualification, John worked for much of his career at Telstra finishing as Managing Director of Global Wholesale. John was the inaugural Chairman of Australia Japan Cable which he guided to a successful implementation.
Since 2001, John has been an independent consultant in his own company, Hibbard Consulting, involved in strategic and commercial aspects associated with the development and/or implementation of many international submarine cable projects across the Pacific including French Polynesia, Samoa, American Samoa, Tonga, Vanuatu, Solomons, PNG, Palau, FSM, and CNMI. He was President of PTC from 2009 to 2012.

PAUL MCCANN is Managing Director of McCann Consulting International Pty Ltd. Paul has over 40 years network planning & development experience in telecommunications both in international and domestic arenas. Prior to returning to consulting in 2012, Paul spent over 8 years with Verizon in Asia Pacific, driving growth of Verizon’s network across Asia by developing & implementing plans delivering major operational cost reductions and improved service performance. Paul is now managing his own consulting business, specializing in development in the Pacific Region, where the core business focus is on “connectivity” with expertise spanning all aspects of planning and development for Satellite, Submarine cable and Domestic access technologies and business. Paul is well known for his personable nature, his rapport with customers and his ability to deliver on time.

JULY 2023 | ISSUE 131 35
STF
THE MOST EXTREME PORTAL IN THE WORLD
Submarine Optical Networks One Step Away From Connecting Antarctica
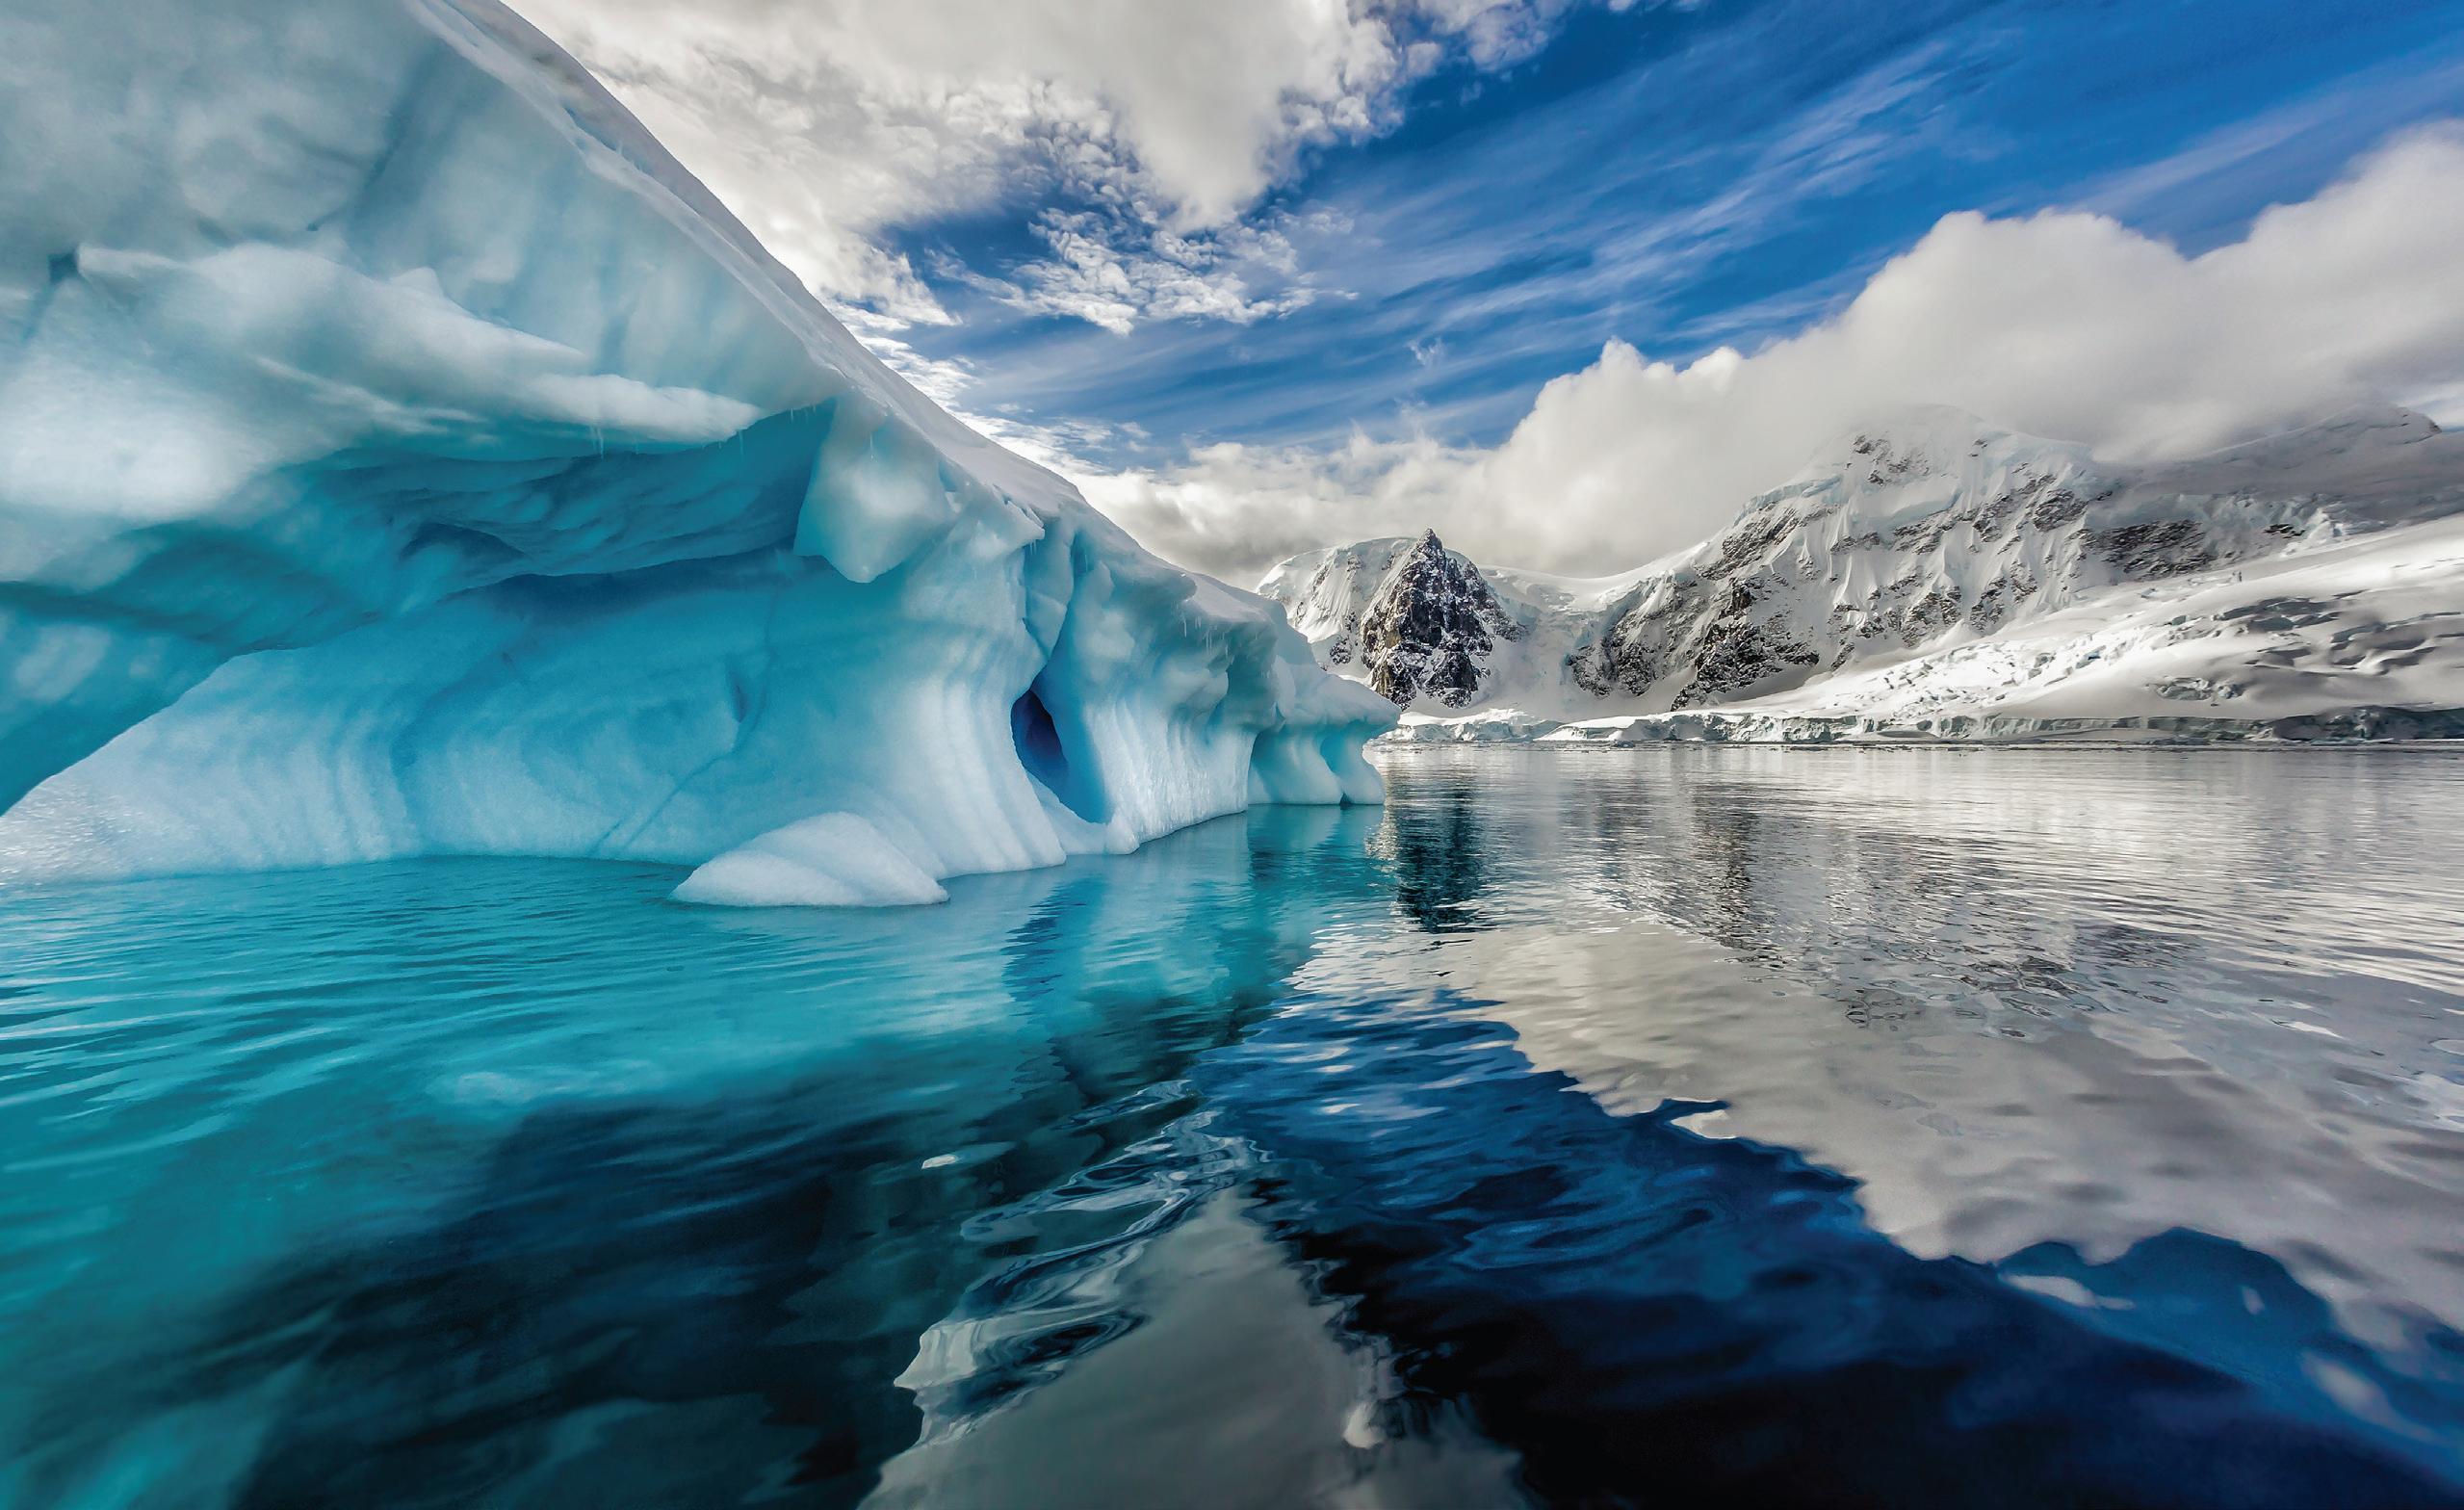 BY JAVIER VALDEZ
INTRODUCTION - THE IMPORTANCE OF CONNECTIVITY AT THE END OF THE WORLD
Connectivity is a fundamental need in the digital age in which we live. Communication networks play a crucial role in the transmission of information and in connecting people around the world. In this regard, the submarine connection between Ushuaia and Puerto Williams holds great strategic importance for the economic, social, and cultural development of the region.
The Island of Tierra del Fuego, Argentina, with its capital in Ushuaia, has an area of 987,168 km² and a population of 190,641 inhabitants, according to the 2022 Census. On the other hand, the Chilean side of the island has an area of 22,553 km² and a population of 8,354 inhabitants, as per data from 2017. Puerto Williams has a population of 2,874 inhabitants, according to the 2002 census.

REGIONAL OBJECTIVE AND STRATEGY
The Tierra del Fuego region, located in southern Patagonia, is rich in natural and tourist resources. Ushuaia, the southernmost city in the world, is a major tourist destination known for its spectacular landscapes and unique fauna and flora. Puerto Williams, on the other hand, is the capital of the commune of Cabo de Hornos, in the Magallanes and Chilean Antarctic region. This city serves as the Chilean Navy’s operations center in Antarctica and
is a starting point for expedition trips to Antarctica.
The submarine connection between Ushuaia and Puerto Williams would significantly improve the region’s connectivity. Currently, communication between these two cities is facilitated through satellite and terrestrial connections, which limit the speed and quality of communications. The submarine connection would allow for greater speed and data transmission capacity, thereby boosting the development of various activities in the region.
In economic terms, the submarine connection could stimulate the growth of the tourism, fishing, and mining sectors, among others. For instance, tourism is a key activity
36 SUBMARINE TELECOMS FORUM MAGAZINE
FEATURE
Figure 1: City of Ushuaia, Argentina
in the region, and the underwater connection would allow for greater promotion and visibility of local tourist destinations. Additionally, the submarine connection could also enhance the efficiency and safety of operations in the region’s ports and docks.
On the social front, the submarine connection would improve communication between local communities and authorities, allowing for better coordination in cases of emergencies and natural disasters. It would also enhance education and research by providing a stronger connection between educational and research institutions in the region.
SCENARIO AND AREA OF INFLUENCE
Figure 3 shows the points to connect with the submarine cable. Initially, considering a scenario of two landings, there is a landing that we could consider in Puerto Almanza, Argentina. This will depend on the degree of interest of the provincial and national authorities.
DESKTOP STUDY
In the Desktop Study (DTS), we performed it according to the recommendation of ICPC 9 (Minimum Technical Requirements for a desktop study). This was taken as a reference to carry out the marine part and survey for the cable installation.
The DTS of this project was a research exercise that defined the strip to install the first submarine fiber network that connected Chile and Argentina across the sea.
We carried out an analysis of the marine route that we could potentially undertake. The DTS results are preliminary since we will have to carry out the studies on site to verify and confirm that the study carried out can be built according to the studies conducted on site.
The cable route was proposed in the areas of greater protection and depths in the Beagle Channel, to reach the coasts as safely as possible. In the image, we can observe the CRS for stage 1.


The cable length for the wet plant is about 70 Km + 3

Km BU.
The study of the seabed profile and its depths show that this is sufficient for the cable route to be safe, finding some deformations or changes in the profile. In the following image, we will observe the profile. As for the depths, we can see them in Figures 4 and 5 for Ushuaia and Puerto Williams, respectively.
In addition, the project foresees, on the terrestrial part, the Argentine side, connecting to the REPROFO fiber optic network of the province of Tierra del Fuego. Through this, the connection to the continent is made. This network was built entirely underground, which makes it a safe network. It has a length of 400 km on land and then enters the sea, crossing the Strait of Magellan about 40 km to reach the mainland, Cabo Vírgenes in the province of Santa Cruz,
Argentina. From this point, the terrestrial network continues to the North of the country. This technical solution includes high-altitude fiber optic networks, considering the
JULY 2023 | ISSUE 131 37
Figure 2: City of Puerto Williams, Chile
Figure 3: CRS image from Google Earth Route cable
FEATURE
crossing of the Andes Mountain range, and great depth in the Beagle Channel.
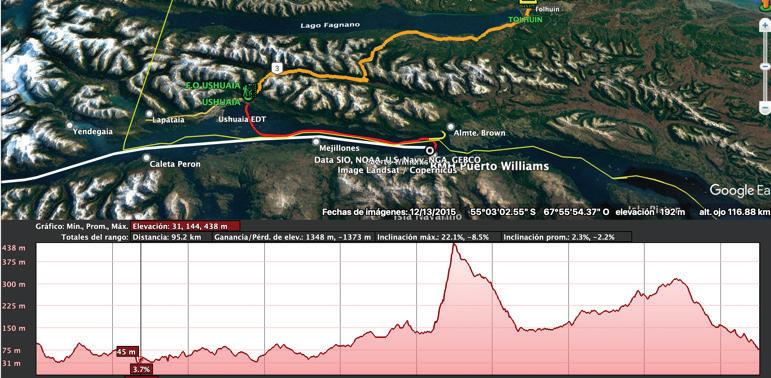


To connect the Chilean side, you could connect through the network of Fiber Optic on the Argentine side to San Sebastian, a border that we share with Chile, and from there cross to Chile through this border crossing. Then within the Chilean territory, transport services to the island side Chile and the mainland by the network of government or also through the networks of private companies.

At the Transmission level, different technologies can be used. Equipment with DWDM, SDN, Smart Grid technologies with the transmission capacity that can go from 1.2 Tb / s per pair of Fibers. This capacity, without making changes in the wet plant, can grow, integrating hardware to the system, with very low latency which will make the system of great capacity and speed. These capacities will emerge from the traffic needs that each country involved in the project needs. This will allow not only to bring connectivity to the region but also that the optical networks can be secured, have high availability systems, not only in the region / Island but also for the networks that are currently carrying traffic in the Argentine-Chilean continents. It would be very important to integrate this with the state and private companies that are interested in expanding their capabilities. Not only this, but also the most important thing is to consider that, if we have any contingency, damage or cut of the submarine cable on the Argentine or Chilean side, we know that in these cases, getting a repair ship for submarine cables to arrive in the short term is not possible. Depending on its location, it would take about 21 days at least to move from Curaçao, an island in the Caribbean, to Tierra del Fuego Island. With this solution, we can have restoration paths for optical networks, ensuring connectivity.
LANDING POINT
• Ushuaia, Argentina
• Puerto Williams, Chile
• Puerto Almanza, Argentina
The length of the total submarine cable is 73 km.
In the analysis, we will consider making a referral to Puerto Almanza Locality, Argentina, which currently has no connectivity.
PROPOSED CABLE TPI
The project proposes a URC-1 and URC-2 type cable,
38 SUBMARINE TELECOMS FORUM MAGAZINE
Figure 4: Ushuaia Coast (Argentina).
Figure 5: Coasts of Puerto Williams (Chile).
Figure 6: Maximum depth
Figure 7: Underground fiber optic network Island Tierra del Fuego, Argentina
according to Figure 4. The cable protections will be DA and SA, with their own considerations for both types. DA will be used for sections near the coasts, and SA for the deepest sections. The cable will have 24 optical fibers. This may change after the bathymetric study is performed locally.
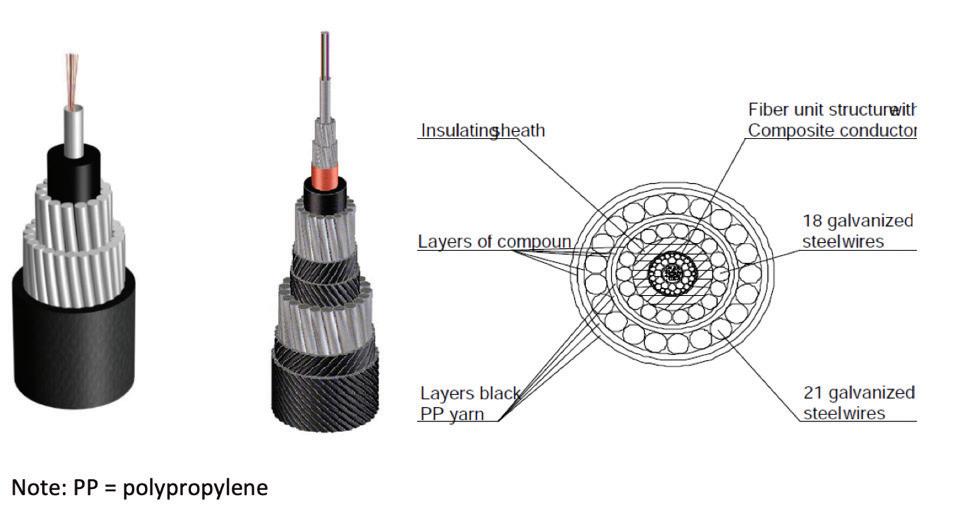

CONCLUSION
In conclusion, the connection through a Submarine Network between Ushuaia (Argentina) and Puerto Williams (Chile) is of great strategic importance for the Tierra del Fuego region. Both nation-states being important and necessary actors, these issues must be incorporated into their agendas and addressed for the future of both countries. The benefit would be direct for about 250,000 inhabitants and indirect for all those who want to connect to these mixed optical network solutions, both terrestrial and submarine. This would improve connectivity, promote economic and social development, education, research, medicine, tourism, security, and improve the quality of life of people in the region. It is necessary to take measures to carry out this project, which would be an investment in the future of the region and its inhabitants.

JAVIER VALDEZ is based in Capital Federal, Buenos Aires, Argentina. He is a member of the SubOptic Association, working in the Mentor & Mentee Committee for submarine programs. He is a consultant in terrestrial and submarine optical networks with 31 years’ experience in the telecommunications market. He has participated in numerous projects worldwide for terrestrial and submarine optical network projects, and is a Professor at the National Technological University, UTN-BA, as well as is also Professor of internships, in training courses at the UBA University of Buenos Aires, for young professionals. He is an active member of the Subcommittee of Fiber Optics, in the COPITEC Professional Council of Telecommunications, Electronics and Computer Engineering, and and has worked on the Operations Committee of FBA-LATAM Fiber Broadband LatAm since 2001. He is currently a consultant in Optical Networks, Telecommunications sector.Top of the form

References:
Province of Tierra del Fuego, Antarctica and South Atlantic Islands. (2020, April 16) Argentina.gob.ar. https://www.argentina.gob.ar/tierradelfuego
ISCPC Recommendations, https://www.iscpc.org/publications/recommendations/
JULY 2023 | ISSUE 131 39
Figure 8: Landing Points
Figure 9: Derivation Puerto Almanza Tierra del Fuego
Figure 4: Cables RUC-1 y URC-2 de ASN.
RESERVE YOUR AD SPACE NOW!
Why you should lock-in now!
• The Industry Report is downloaded roughly 500,000 times over the course of the year. That's a lot of eyes on your business!
• There are a limited number of advertising options available and opportunites are first-come, first serve.
• Prices will go up on 1 August, so be sure to lock-in your spot and rate now!
Topics will include:
• Global Overview
• Capacity
• Ownership Financing Analysis
• Supplier Analysis

• System Maintenance
• Cable Ships
• Market Drivers And Influencers
• Special Markets
• Regulatory Outlook
• Regional Analysis and Capacity Outlook
Click here to lock
2023 SUBMARINE TELECOMS
bird
IndustryReport202
rate with
TELECOMS INDUSTRY REPORT
lock in your earlywith promo code: IndustryReport202 3Rate
BUILDING AND OPERATING A SUBFLUVIAL FIBRE OPTIC COMMUNICATIONS NETWORK IN THE MAJOR RIVERS OF THE AMAZON BASIN
INBRAZIL
BY EDUARDO C. GRIZENDI AND MICHAEL A. STANTONABSTRACT
Since the end of the 19th Century, interest has grown in building communication systems based on underwater communications cable installations in the great rivers of the Amazon basin. The current preferred technology employs digital communication. This article describes the planning, deployment, and operation of subfluvial fibre optic communication cables in the Amazon Basin of Brazil, where the major rivers are long and navigable.1. Introduction
1. INTRODUCTION
The Amazon river basin in South America covers an area of 6.8 million km2 (2.4 million square miles), equivalent to 35.5% of the total area of South America. It includes parts of the following countries: Bolivia, Brazil, Colombia, Ecuador, Guyana, Peru, Suriname, and Venezuela, as well as the territory of French Guiana. The waters of the Amazon Basin flow into Brazil and the Atlantic Ocean as the Amazon River, providing about 20% of the freshwater input into the world’s oceans. Ocean-going shipping can travel far upstream, especially to Manaus. Many of the major Amazon rivers are navigable for up to thousands of kilometers, and highways and bridges are uncommon, with few exceptions.


Within Brazil, there are no road bridges crossing the main Amazon river. Until 2013, electricity was locally generated from fossil fuels. This changed with the construction of a high-voltage 2km aerial connection across the Amazon River, using 300-meter pylons to avoid interfering with shipping traffic. This brought reliable electrical energy to cities north of the Amazon River, especially to Manaus, the capital of the state of Amazonas and the major regional center in northwest Brazil.
Telecommunications have also been a challenge in much
42 SUBMARINE TELECOMS FORUM MAGAZINE
FEATURE
of the Brazilian Amazon. Fixed landlines are quite rare, so radiocommunication is the alternative. The most common solution currently in use is satellite radio, which is relatively expensive. Therefore, cheaper solutions are needed for both voice and data. Services like these are considered necessary today. Fortunately, the authors of this report began their studies on the use of underwater fibre optic cables to solve the problem of providing broadband connections between locations separated by water, often reported in special cases in the literature of that time.
Soon after, the authors began to examine the alternative of a festoon topology, typically following the course of a river, with landing points at convenient locations along the river where communication services could be made available. However, perhaps the greatest impact on our thinking was discovering that an extremely similar solution had already been implemented in 1895/6. This provided telegraph services during the heyday of what has come to be known as the Victorian Internet. This Victorian Internet, as titled in the 1996 book by Tom Standage, refers to the enormous worldwide expansion of electric telegraph communication, including the vast use of underwater cables for spanning the oceans. For the very first time, global communication could occur within a matter of minutes or hours, providing communication around the world.
It was during this period in the second half of the Nineteenth Century that a UK company created the Amazon Telegraph Company (ATC). Licensed by the Brazilian government, they operated telegraph services along the Amazon River and some of its tributaries between Belém and Manaus, a river distance of around 1650 km. The aim of the cable was to provide fast communications between Manaus, the center of an important region of rubber exploitation, and international commodity markets in Europe and the USA.
The resulting cable was installed by Siemens Brothers of London and operated until 1945 when the license expired. For a description of the conditions under which this cable was laid, we are indebted to Alexander Siemens, of Siemens Brothers Ltd of London, who was personally involved in the laying of the cable in 1895-96. Siemens’ account of this expedition may be found at https://atlantic-cable.com/Cables/ 1895ParaManaos/index.htm.
The company, ATC, existed for 50 years, although Bra-
zilian rubber became less important after the British began cultivating their own rubber plantations in the Far East, developed from Brazilian seeds. In addition, the emergence of wireless telegraphy to Manaus rendered the underwater cable route redundant.
2. PLANNING AND TESTING THE MODERN OPTICAL FIBRE NETWORK
Unlike the 1895 cable, where the laying of a standard ocean telegraph cable was conducted by a conventional cable-laying ship, in the 21st Century, with no prior experience of large-scale fibre optic (FO) cable-laying, the Brazilian engineers involved had to start from scratch.
One of the first activities was to identify potential rivers that could be used for laying cables. European colonists, mainly from Portugal and Spain, have had more than 500 years of contact with Amazonia, and its geography, especially its rivers, is well-known.
An initial proposal for the rivers potentially to be used is shown in the following map, which largely coincides with current intentions.
A. Belém – Macapa – Manaus: 2,030 km, (mostly) along the River Amazon (marked in red);
B. Manaus – Iauareté (border with Colombia), 1,384 km, along the River Negro, (green);

C. Panacarica – Pacaraíma (border with Venezuela), 744 km, along the River Branco (yellow);
D. Manaus – Tabatinga (border with Peru and Colombia), 1,696 km, along the River Solimões, (orange);
E. Itacoatiara – Porto Velho, 1,115 km, along the River Madeira (blue);
F. Macapá – Oiapoque (border with French Guiana), 815 km, along the Atlantic
JULY 2023 | ISSUE 131 43
The center of these activities was the city of Manaus, the capital of the state of Amazonas. It is home to the Army’s Communications Centre for western Amazonia and the newly created headquarters of the program, Connected Amazonia. The availability of subfluvial fiber optic cables could improve both public and private communications in the Brazilian Amazon, and potentially in neighboring countries.
Initial experimental studies were carried out by army engineers in the Negro River, which flows through Manaus. By 2014, preparations had been made to lay a 424 km connection between Manaus and Coari, upstream on the Solimões (or Upper Amazon) River. This was later extended a further 247 km upstream to Tefé by 2016. These initial steps were seen as positive for both the installation and use of subfluvial cables.
It’s noteworthy that different Amazon rivers have w aters of varying turbidity and colors, depending on the origin of their waters. The greatest volumes of water come from the Andean mountain ranges in Colombia, Ecuador, and Peru. This water is very turbid, making it difficult for divers to work easily underwater. Other Amazon tributaries originate to the east of the Andean mountain chain, where the water is transparent. The contrast is clearly seen at Manaus, where the turbulent yellow waters of the Solimões River meet and mingle with the bluish-black water of the Negro River.
3. PAIS: PROGRAMME FOR AN INTEGRATED AND SUSTAINABLE AMAZONIA
The Connected Amazon initiative was maintained until 2021 when a more ambitious program, PAIS: Programme for an Integrated and Sustainable Amazonia, was announced. This initiative aimed to build on the results of the Connected Amazonia initiative, also involving the military and government agencies such as the Ministry of Communications. The National Research and Education Network (RNP), which provides networking services for education and research and connects internationally to the global research and education network, was also included. Importantly, PAIS intended to set up a sustainable communication system for Amazonia, including providing both government and commercial services to its users. To provide these commercial services, private companies were invited
to participate in PAIS, providing network services to their users. The plan was to use subfluvial cables with 48 cores, of which 12 are reserved for government use.
4. THE TOPOLOGY OF THE PRODUCTION CABLE NETWORK
The topology has two main parts, as illustrated on the accompanying map:
• A tree structure rooted in Manaus, currently planned to have six branches, connecting traffic to all the rivers in the region.
• A linear connection from Manaus to the Atlantic Ocean at the mouth of the Amazon River, near Macapá, with a continuation to Belém, which is well connected to the national telecommunications network.
This map refers to the proposed set of routes:

1. PAC 01 and 02: showing the original routes developed in Connected Amazonia, where PAC 02 includes the more recent extension from Manaus to São Gabriel da Cachoeira.
2. New routes (infovias) included in the PAIS program, numbered from Infovia 0 to Infovia 6, and Infovia Production
(
Key to state abbreviations: AC = Acre, AM = Amazonas, AP = Amapá, RO = Rondônia, RR = Roraima )
All the routes and the corresponding endpoints, distances and rivers used.
44 SUBMARINE TELECOMS FORUM MAGAZINE
FEATURE
• PAC 01: Manaus, AM – Tefé, AM, 672 km, River Solimões
• PAC 02: Manaus, AM – São Gabriel da Cachoeira, AM, 1001 km, River Negro
• Infovia 00: Macapá, AP – Santarém, PA, 770 km, River Amazonas
• Infovia 01: Santarém, PA - Manaus, AM, 920 km, River Amazonas
• Infovia 02: Tefé, AM – Tabatinga, AM, 645 km, River Solimões
• Infovia 03 Macapá, AP – Belém, PA, 600 km, West side of Marajó Island
• Infovia 04 Moura, AM - Boa Vista, RR, 550 km, River Branco
• Infovia 05 Itacoatiara, AM – Porto Velho, RO, 1465 km, River Madeira
• Infovia 06 Manacaparu, AM – Rio Branco, AC, 2160 km, River Purus
• Infovia 08 Tabatinga, AM – Cruzeiro do Sul, AC, 2750 km, Rivers Solimões and Juruá
Total distance: 11,673 km
5. STRUCTURE AND OPERATION OF AN INFOVIA
• Each optical cable contains 48 fibers, distributed among four tubes, each containing 12 fibers.
• One tube (12 fibers) will be reserved for exclusive use by the Public Sector.
• PoPs (Points of Presence in containers) will be installed at each town or city served access point.
• Each PoP will provide an external cable connection for telecommunication service to the local service provider(s).
• DWDM systems ready for use with the possibility of up to 40 optical channels installed in one of the pairs of optical fiber reserved for public use.
6. A NEW APPROACH TO MANAGING TRAFFIC
MODEL FOR THE NEUTRAL OPERATOR OPEN CONSORTIUM
The Open Consortium of each Infovia will initially be formed by a minimum of three consortium members and is open to further participation by new consortium members at intervals of at least one year. RNP will initially grant to each consortium member one fiber pair (potentially increasing to two fiber pairs) for their own use and/or commercial exploitation by the consortium member, which will light up its fiber pair(s) and adhere to the Neutral Operator Open Consortium Open.
In return for the grant of Right of Use of the Optical Fiber Pair(s), the consortium member will be responsible and contribute, proportionally to their number of fiber
pairs, to the total cost of operation and maintenance of the Infovia (destined for both the Private and Public Sectors). Participation is welcome in the Neutral Operator Open Consortium, and members may be companies’ associations and foundations usually telecommunications service providers licensed by ANATEL by concession or authorization. Additionally, and exceptionally, it will also be permitted for companies to form alliances. This model was extensively discussed with interested participants.
CONCLUSION
We have described here an ongoing program of the Brazilian government to provide low-cost telecommunications infrastructure over a vast area of the country, using over 10,000 km of subfluvial telecom cables laid in the major rivers of the Amazon River basin within the country. To understand the significance of this, consider that this length of cable is nearly twice as long as the approximately 6,000 km of telecommunications cable recently installed between Brazil and Portugal, designed to provide modern communication between Europe and South America. Interestingly, both projects took about ten years from conception to offer of service.
One aspect of the opportunities created by the Brazilian project is the interconnection of subfluvial digital communications between neighboring countries that adopt this technology. For example, progress has been made in Peru to provide communications on rivers connecting Iquitos to the national digital grid, and also for linking mainland islands located in Lake Titicaca. Another region of possible interest is Ecuador. STF
EDUARDO GRIZENDI is Director of Engineering and Operations at RNP. He taught at National Institute of Telecommunications (Inatel, 1995 - 2015), in Santa Rita do Sapucaí, MG, Brazil, and holds Master of Science in Telecommunication Systems from Inatel, and MBA in Business from Fundação Getúlio Vargas (FGV). He graduated in Electronic Engineering at Instituto Tecnológico de Aeronáutica (ITA,1977). He has worked in the field of telecommunications since 1980’s, initially in R&D institutions, and afterwards, in telecommunications carriers and consulting services.

MICHAEL STANTON has been since 2002 seconded as Director of Innovatio at the Brazilian National Education and Research Network - RNP. After retirement from UFF, he continued as a director at RNP until 2018, when he assumed responsibility position of Network Researcher. He was awarded several prizes for his professional work in computer networks, including admission to the Internet Hall of Fame in 2019.

JULY 2023 | ISSUE 131 45
DEMYSTIFYING THE CONSULTANT’S ROLE IN SYSTEM IMPLEMENTATION AND COMMISSIONING
 BY KRISTIAN NIELSEN
Deploying a submarine fiber-optic cable system is more than just an impressive technological feat—it’s a grand venture that underpins our increasingly interconnected digital world, bridging continents and driving global communications. One of the most critical stages in this monumental undertaking is System Commissioning and Acceptance, a phase that is far from being a mere formality or a checkbox on a list. This stage represents the meticulous and rigorous verification process that ensures the system performs optimally and fulfills the precise commitments outlined in the project’s technical and commercial specifications.
OVERVIEW
Over the past year, we have journeyed through the intri-
cate labyrinth of system development, emphasizing the vital role of an experienced guide in your corner. In this exploration, we embark on a deep dive into the process of commissioning and acceptance—the grand culmination of years of careful planning and diligent execution. It’s here that the fruits of meticulous preparation become tangible, where abstract plans transform into concrete, operational systems.
At this critical juncture, the expertise of a seasoned consultant is indispensable. It is they who navigate the treacherous waters of technical documents, detailed specifications, and procedural complexities. It is they who ensure that every aspect of the system is examined, every potential issue is identified, and every necessary step is taken to ensure optimal performance and client satisfaction.
So how does this transformative process unfold? Picture
46 SUBMARINE TELECOMS FORUM MAGAZINE
FEATURE
this: our skilled consultant embarks on a journey, armed with deep knowledge and a keen eye for detail. They personally witness network system tests, meticulously scrutinizing every aspect of the installation to ensure it meets the highest standards. The fruit of their labor is a comprehensive “findings” report, a detailed account that verifies system performance and highlights any discrepancies needing the supplier’s attention.
But their work doesn’t end there. With the findings report in hand, the consultant meticulously crafts a System Acceptance Report, a document that clearly pinpoints any identified issues and details how they have been resolved to the client’s satisfaction. This report is more than a record—it is the embodiment of rigorous scrutiny, technical expertise, and a relentless commitment to quality and satisfaction.
From this vantage point, we delve into the intricate and
detailed work that goes into every successfully deployed submarine fiber-optic cable system. This is the underthe-hood view of a process that is often out of sight yet is integral to our digital world. It is the tale of precision, diligence, and expertise that brings these global communication links to life.
COMMISSIONING AND SYSTEM ACCEPTANCE
The heart of this phase begins with the commissioning of the network system. A consultant, or Quality Assurance (QA) Consultant, will travel to the site to witness network system tests, which are crucial in validating the installation. During these tests, the consultant verifies that the system performs as expected, under real-world conditions, and adheres to the agreed-upon technical and commercial specifications.
Any discrepancies identified are thoroughly documented in a “findings” report, which becomes the blueprint for any rectifications that need to be made by the Supplier. Once all identified issues are addressed and the system meets the satisfaction of the Client, a System Acceptance Report is produced, marking the successful close-out of this part of the process.
While it might seem like this could be done by any team, the reality is different. The process is complex and requires experienced personnel—specifically, the vendor’s in-field QA Consultant team. They bring the expertise and knowledge necessary to spot potential issues, understand their ramifications, and suggest appropriate solutions.

Following the initial System Acceptance, a Follow-Up System Report is typically conducted approximately six months after the system has been turned over to Operations. This report provides a comprehensive evaluation of the system’s performance over time and under a variety of operational conditions, ensuring that any latent issues are identified and addressed.
The Commissioning and System Acceptance phase is not just about turning on the switches and hoping for the best—it’s about meticulous testing, analysis, and refinement. The ultimate goal is to ensure that the system, whether stretching from Optical Distribution Frame (ODF) to ODF, or another fiber termination location if ODF to ODF facilities are not in place, operates reliably, efficiently, and up to the highest standards of performance. Only then can we confidently say that the system is ready to fuel the data transfer needs of our interconnected world.
As we navigate this process, we must keep in mind that it is not accomplished in a vacuum. A critical briefing meeting with the Client takes place, during which the detailed responsibilities of the QA Consultant are agreed upon. All relevant documentation required to fulfill these responsi-
JULY 2023 | ISSUE 131 47
bilities are provided at this meeting, setting the stage for a detailed review of all test plans and procedures for the Final System Testing and Acceptance. The journey is collaborative and transparent, aiming to keep all stakeholders informed, aligned, and satisfied at every step.
FOLLOW-UP AND CONTINUED SUPPORT
After the system has been commissioned and accepted, there’s still work to be done. The consultant plays a critical role in ensuring the system functions as designed and delivers the expected performance over time. This often involves regular follow-up and ongoing support.
About six months after the system is turned over to operations, the consultant may provide a Follow-Up System Report. This report is designed to assess the system’s performance over time, highlighting any observed discrepancies, performance deviations, or potential areas for improvement. The consultant’s objective is to ensure that the system’s performance remains consistent and aligned with the client’s expectations and requirements.
Furthermore, the consultant is responsible for overseeing and providing technical support during the period in which identified deficiencies are rectified, documentation delivered, and all supplier activities concluded. This usually takes place over a period of ninety days following the Ready For Service (RFS) status. In this phase, the consultant reviews the Final Monitor Acceptance Report detailing implementation issues and rectifications and forwards it to the client.
DETAILED REVIEWS AND DOCUMENTATION
The consultant’s work extends beyond the initial commissioning and follow-up support to include a comprehensive review of various elements of the system and its operations. These reviews are designed to ensure everything is running optimally and in accordance with the system’s specifications.
The consultant performs detailed reviews of the system’s test plans, procedures, and handbooks, focusing on submarine fiber optic cable systems. These reviews aim to identify deficiencies and ensure that the client’s system is up to par with industry standards and requirements.
This effort encompasses a review of System Test Plans and Procedures, Confidence Trial Test Report Review, As-Laid RPL And Charting Review Report, Operations and Maintenance Procedures Review Report, and Supplier Documentation and Training Review. The consultant verifies that all necessary parameters will be accurately tested, and the system meets all technical and commercial specifications.
The results of these reviews are documented and provided to the client, along with any necessary recommendations
for improvements or rectifications. This thorough documentation ensures that all parties have a clear understanding of the system’s status and any necessary steps moving forward.
TRAINING, (MORE!) DOCUMENTATION, AND FINAL STEPS
Proper training is an essential part of the commissioning process. The consultant reviews the supplier’s training program and makes recommendations as necessary. This could range from proposing amendments to provisional drafts of Supplier’s documentation and training course materials to providing recommendations for approval of final drafts.
Another crucial part of this phase is the preparation and review of the Joint System Management Document (JSMD). The consultant provides support in reviewing this document, which outlines key operational and maintenance responsibilities, describes potential faults that may occur in the system, details regular maintenance requirements, and other critical information.
Moreover, there’s an emphasis on documenting everything, ensuring it’s stored and archived effectively. From the System Acceptance Test Certificate to the Backbone Trunk Cable Gap Register and the Operations and Maintenance Procedures Review Report, the consultant ensures that all necessary documentation is prepared, reviewed, and stored appropriately for easy retrieval in the future.
FINAL THOUGHTS
Commissioning a submarine fiber optic cable system is a complex process that requires expert oversight and diligent follow-up. A dedicated consultant plays a crucial role in ensuring that everything goes smoothly from initial system testing and commissioning through follow-up support, detailed system reviews, training, and documentation. The consultant acts as the client’s advocate, ensuring that the system meets the agreed-upon specifications, and that the client is satisfied with the system’s performance and operation. Through ongoing reviews and meticulous documentation, the consultant helps ensure a successful, efficient, and high-performing submarine fiber optic cable system. STF
KRISTIAN NIELSEN is based in the main office in Sterling, Virginia USA. He has more than 14 years’ experience and knowledge in submarine cable systems, including Arctic and offshore Oil & Gas submarine fiber systems. As Quality & Fulfilment Director, he supports the Projects and Technical Directors, and reviews subcontracts and monitors the prime contractor, supplier, and is astute with Change Order process and management. He is responsible for contract administration, as well as supports financial monitoring. He possesses Client Representative experience in submarine cable load-out, installation and landing stations, extensive project logistics and engineering support, extensive background in administrative and commercial support and is an expert in due diligence.

48 SUBMARINE TELECOMS FORUM MAGAZINE
FEATURE

JULY 2023 | ISSUE 131 49 wfnstrategies.com WFN Strategies is an accredited, industry-leading consultancy specializing in the planning, procurement, and implementation of submarine cable systems. We support commercial, governmental, and offshore energy companies throughout the world. We analyze and advocate renewable energy alternatives for clients’ submarine cables. Information Security Management ISO 27001 www.dekra-seal.com certified Environmental Management ISO 14001 www.dekra-seal.com certified Quality Management ISO 9001:2015 www.dekra-seal.com certified
INCREASING AVAILABILITY OF SUBSEA TELECOM INFRASTRUCTURE THROUGH MONITORING VIBRATIONS IN OPTICAL FIBRE SUBSEA CABLES
BY STEINAR BJØRNSTAD, ANDERS TYSDAL, AND CATO LAMMENESABSTRACT
Society’s reliance on telecommunication infrastructure continues to grow as both energy and telecommunications solutions share mutual dependencies. This dependency calls for increased monitoring of fibre networks and fibre optic subsea cables, which serve as the backbone of connectivity for all digital communications.
Distributed Acoustic Sensing (DAS) and State of Polarisation (SoP) monitoring provide real-time measurements of vibrations and potential mechanical interference which could impact the cable. Implementation of these sensing technologies mitigate risk to the infrastructure, preventing equipment failure and downtime. In particular, any unexpected movements caused by subsea activities such as passing trawlers, hooking of equipment on the seabed, and any geophysical phenomena can be traced so that appropriate action could be taken.
This article will explain the capability and benefits of the monitoring system and how Tampnet utilises this system for monitoring its vast subsea and terrestrial cable systems.
INTRODUCTION
Society is increasingly dependent on digitalization and the underlying communications network infrastructure. The fibre network is becoming increasingly important as it is being rolled out closer to the end-user and is now widely deployed in access networks. For the intercontinental network traffic, subsea fibre cables have been the main carrier for a long time, and are now carrying more than 99% of all traffic. A vital component of traditional offshore energy production infrastructure, subsea fibre cables are also
present in the offshore renewables space, with wind farms utilising combined power and fibre cables. In this design however, the “export cable” running from the wind farm to shore is a single point of failure. A break in this cable would require shutdown of the wind farm over several weeks until a cable ship was available to attend site and carry out repairs, resulting in a significant economic loss.
In recent years, cybersecurity has focussed on attacks at the IP-layer and above with little attention paid to physical layer communications. While a Denial of Service (DoS) attack may cause hours of downtime, a physical layer failure may result in an outage spanning days or weeks or leave users with poor service availability. A prime example of this is the recent outage at the Faroe Islands in October 2022. After a failure on one subsea cable, the second failover cable was cut by a fishing trawler, subsequently cutting the island off from the world for several days until repairs could be carried out.
Hence, redundancy at the physical layer through availability of several diverse physical paths is imperative. In the Tampnet North Sea fibre network, multiple subsea fibre cables enable redundancy through a mesh network with physically diverse paths.
Whilst redundancy is vital, avoiding cable failures is preferable to mitigate high repair costs, outage time, and potentially reduced service quality. This is especially true for facilities like offshore wind farms where redundant fibre paths may not be available.
The remainder of this article explains how the fibre itself can be used as a sensor to detect any mechanical interference and vibration caused by operations in the vicinity of

50 SUBMARINE TELECOMS FORUM MAGAZINE
FEATURE
the cable. These techniques can identify vessel and trawler movements and avoid potential damage caused by subsea activities through proactive response.
FIBRE SENSING TECHNIQUES
Sensor technology has become increasingly available for telecommunications cables. Research is underway to create so-called ‘smart cables’ where sensors are installed along the subsea cable to monitor environmental and climate-related parameters. As the sensors must be integrated with the cable during manufacture, this technology is only suitable for new cables to be deployed and adds additional complexity and cost to the cable infrastructure.
An alternative approach now being applied is based on using the fibre cable as a sensor. This solution allows the existing cable to be used without adding significant costs to the cable system. Implementation of this technique enables the cable to be used as a microphone, or an array of microphones, picking up weak sounds, vibrations and movements along its length.
Thus, the telecommunications cable can detect and monitor vessels on the surface, fishing activity, and anchoring. It can also detect temperature and geophysical events such as earthquakes and tsunamis. The two most popular techniques are Distributed Acoustic Sensing (DAS) and State of Polarization (SoP) sensing. The advantages and disadvantages of the two different techniques are explained below.
DISTRIBUTED ACOUSTIC SENSING (DAS)
The DAS technique is an advancement of the Optical Time Domain Reflectometer (OTDR) using back-reflected light in the fibre for detection. While the OTDR is detecting changes in the intensity of the back reflected light, the DAS detects changes in the phase. Any vibration will cause strain, resulting in a nanometer length change of the fibre, which again causes a phase-change.
Tampnet’s subsea fibre infrastructure consists of a large number of passive cables to offshore installations, making it highly suitable for DAS sensing of both environmental pa-

JULY 2023 | ISSUE 131 51
Figure 1, Tampnet’s optical subsea network offers redundant paths for ensuring availability even if any cables are accidentally or deliberately damaged.
rameters as well as subsea activity that may be threatening the cable. For example, the DAS allows Tampnet to detect a fishing trawler approaching the cable from a distance of one kilometre, allowing Tampnet to take proactive measures to avoid the trawler from hooking onto the cable and causing damage. In addition, the DAS data may be combined with AIS data, identifying and tracking a vessel approaching the cable.
Figure 3 illustrates how a trawler is tracked using AIS data (black circles), showing that the vessel is crossing the cable (solid blue line). The two narrow blue lines indicate a safety zone around the cable of approximately 500 m, where subsea activity like trawling should be avoided. The red line shows data from the DAS, illustrating how the position of the trawl dragging along the seafloor is tracked. From the plot it can be seen that the trawler is lifting its trawl when crossing the cable and that it has the trawl down only when operating outside of the safety zone.
A DAS instrument enables accurate vessel tracking and produces terabytes of data each day that must be interpreted. For this, algorithms for filtering the data to select only relevant data such as trawlers, large vessels, and anchoring activity, becomes important for efficient interpretation of the data. Also, installing a DAS is quite straightforward.
As shown in Figure 3, a separate fibre is typically used for the DAS, while optionally, the so-called ‘L-band’ of the optical spectrum can be used to enable DAS sensing


in the same fibre used for communication. The current state-of-the-art DAS sensing equipment allows sensing up to approximately 125 km from the DAS unit. With one unit located at each end of the cable, up to 250 km can be monitored. It is important to note that if this technology is applied to an amplified cable, sensing capabilities are only available in the length up to the first amplifier. The cost of the DAS equipment is in excess of € 100,000.
STATE OF POLARISATION (SOP)
SoP also enables detection of vibrations and movements of the cable. As can be seen in Figure 4 on the right side, if a patch cable is being moved in a node room, very strong SoP variations may be detected. To the left of the figure, a much more stable signal can be seen before the patch cable movements occur, hence separation of these types of events can be performed using threshold detection.
Some key advantages of SoP over DAS are that it works over longer cable distances and through optical amplifiers. SoP has been demonstrated to detect earthquakes on active cables thousands of km long, as well as on a 250 km single-span passive cable. Integration with a communication system is straightforward and there are several options for application. It can be used on a separate fibre, in a dedicated alien wavelength, or even using one of the wavelengths in the transmission system together with the hardware in the communication system. While the latter requires access to
52 SUBMARINE TELECOMS FORUM MAGAZINE FEATURE
Figure 2, Tracing trawlers working in the vicinity of the subsea cable.
Figure 3, Distributed Acoustic Sensing (DAS) typically uses a separate fibre, but may also be combined with a data transmission system if a separate wavelength band is applied for the DAS system.
SoP data from the coherent receiver and can typically only detect low frequency signals, the other two approaches enable vendor-independent detection of higher frequency signals. This allows for a more accurate signal separation and easier access to SoP data with fewer security concerns as the monitoring is physically and logically separated from the operation of the communication network.


While no additional hardware is required to collect SoP data from the transmission system, separate hardware for SoP detection comes at a cost of a few thousand Euro - two orders of magnitude less than a DAS system. This enables high scalability and mass-deployment.
On the other hand, while DAS provides accurate location information and has a high sensitivity for tracking subsea activity within a few kilometres’ range of the cable, SoP is more suitable for detecting cable movements and stronger vibrations. With SoP, accurate position information is not available, and sensitivity is lower, however, DAS may be saturated if the cable is moved or impacted from strong vibrations. SoP does not saturate, allowing differentiation between cable movements and strong vibrations. For example, it can pick up the signal of a trawler being dragged over the cable without hooking into the cable.
This comparison suggests that DAS systems should be installed on critical infrastructure where the need for protection is very high. Installing additional SoP monitoring can provide the added benefit of separating direct cable movements from strong indirect cable movements. Furthermore, the low cost and easy integration of SoP enables a mass deployment for monitoring of all cables and fibres used for communication, providing a complete picture of events that may impact availability and integrity of the physical fibre infrastructure. STF
STEINAR BJØRNSTAD is the Strategic Competence and Research Manager at Tampnet AS, Stavanger, Norway. He is also a Senior Research Scientist at Simula MET, Oslo - Norway. He holds a Ph.d. in Optical Communication from NTNU, Trondheim, Norway and has published more than 60 papers and patents within optical networking. His current focus is on sub-sea optical networking transmission, security and sensing.
ANDERS TYSDAL joined Tampnet as the Chief Technology Officer in 2007, when the company was in its infancy. Since then, he has led the strategic and technical development and international expansion of the subsea fibre, microwave and mobile network infrastructure in the North Sea and the Gulf of Mexico, as well as initiating business development efforts in several other territories. Anders also led the team who in 2013 successfully deployed the first commercial offshore 4G/ LTE network for the Oil & Gas industry in the world. He has been instrumental in developing the company from a small, local player to the world´s largest offshore telecommunications service provider. Anders has been a key part of initiating, executing, and closing several large acquisitions to grow the company, as well as making sure that Tampnet´s true value has been reflected in 3 major ownership transitions. Currently Anders is leading the work to maintain and expand Tampnet’s large offshore networks globally, and deploy modern and innovative offshore solutions and infrastructure in new regions of the world. He holds a Master’s degree in Telecommunications from the Norwegian University of Science and Techn ology in Trondheim.

CATO LAMMENES is Managing Partner for Tampnet’s Carrier business unit that owns and operates a unique fibre optical network with routes connecting over 40 key data centres and PoPs in 12 European and American cities and central hubs. Before joining Tampnet in 2015 Lammenes held several executive positions in companies like Aruba Networks, Alcom ASS and Intelecom Group AS, where he had a special focus on solutions for the offshore oil and gas industry.

JULY 2023 | ISSUE 131 53
Figure 5, SoP integrated on an alien wavelength in a transmission system. SoP works through optical amplifiers and has been proven to detect earthquakes using active cables of more than 10,000 km length.
Figure 4, Detection of movements of a patch-cable in the node room while monitoring a 300 km single-span passive subsea fibre cable.
FEATURE THE OLISIPO SUBMARINE CABLE SYSTEM
Enhancing Connectivity and Unlocking the Hub Potential of Sines
BY DIEGO MATASIn today’s interconnected world, reliable and efficient communication infrastructure is vital for economic growth and social development. The Olisipo submarine cable system, developed by EllaLink, is set to support the digital development of Portugal, particularly in the region of Sines enabling its transformation in to one of the hottest places in Europe for data centre construction and connectivity hub.
With Diego Matas, EllaLink COO, we will be guided in understanding how and why submarine cable systems play an important role in sustaining the connectivity ecosystem, while highlighting the myriad benefits it brings. In 2021, the EllaLink optic fibre submarine cable has made the task easier, by establishing a direct link between Europe and Latin America, and enabling faster and more reliable communication, fostering economic growth, and strengthening cultural ties between these regions.
Today Sines is already much more than subsea cables! The city is witnessing the development of an impressive hyperscale Data Centre campus of up to 495MW, a project with an ultimate investment size of up to €3.5 billion –
Start Campus is a name to remember and the first building of the campus with a total capacity of 15 MW, is set to open in September.
Seawater cooling system, use of existing industrial infrastructure to minimize environmental impact, strong capillarity in Portugal and connection with international high-capacity fibre optic cables, availability of 100% green electricity – the Start Campus project will take advantage of the strategic geographic location of Sines and Portugal on the European periphery with a the EllaLink submarine cable already in operation and other more cables already announced
With the complement of the Olisipo cable system, the connectivity infrastructure will play a crucial role in sustaining Portugal’s connectivity ecosystem, bridging Sines with the Lisbon Metro Area.

DATA CENTRE AND SUBSEA CABLE SYMBIOSIS
Data centres and submarine cables have a symbiotic relationship that is crucial for the functioning of the modern internet. This interdependency ensures seamless global con-
54 SUBMARINE TELECOMS FORUM MAGAZINE
Data centres and submarine cables have a symbiotic relationship that is crucial for the functioning of the modern internet.
nectivity, efficient data transmission, and reliable network infrastructure.
Data centres and cloud providers heavily rely on submarine cables to facilitate the transfer of data between several locations. Cables provide the necessary long-haul infrastructure for data centers to store, process, and distribute massive amounts of data generated by users. Depending on the type of site (content site or computing site) there is symbiotic relationship between Data centres and submarine cables that together creates the cornerstone of the digital ecosystem.
The symbiotic relationship between data centres and submarine cables also enhances the overall reliability of the global internet infrastructure. Redundant connections allow data centres to reroute traffic in the event of disruptions or cable damage, ensuring uninterrupted connectivity and data accessibility. Submarine cables offer diverse and redundant paths for data transmission, ensuring continuous operation and minimizing downtime for data centres. For instance, cloud providers count at least on 3 to 5 diverse routes to secure a POP location.
THE OLISIPO: SINES TO LISBON
The Olisipo submarine cable system planned to be RFS in Q12025, is an ambitious project that aims to pro -

vide enhanced connectivity between the new datacentre development area of Sines and the Lisbon metro area. It will allow not only to bear the massive data generated by the data centres towards the Lisbon metro area and the interconnection with other cables, but as well to provide a new secure and robust route in complement to existing and future terrestrial long-haul infrastructure. This new submarine cable connection will bring numerous benefits to the connectivity ecosystem as we go through the key technical features:
The Olisipo cable system will provide direct DC to DC Dark Fibre Connectivity, allowing for efficient and secure communication between the DCs, eliminating the need for additional routing and offering enhanced reliability and low latency.
With 96 unrepeated fibre pairs and an optimized optical design, the Olisipo cable system will offer ultra-high-capacity transmission capabilities, with an ultra-high capacity and optimized optical design.
• The Olisipo cable system will utilize armoured cable and will be a buried subsea and land cable configuration. This design ensures DC entry point diversity and provides protection through Horizontal Directional Drilling (HDD) in Sines, the landing point.
• The robust and diverse route design enhances the overall
JULY 2023 | ISSUE 131 55
FEATURE
reliability and resilience of the cable system.
• In addition to the Olisipo system, the EllaLink system already in operation brings another diverse low latency route connecting Sines to Latin America.

SINES: THE BEST NEXT INTERCONNECTION HUB IN EUROPE

“Sines and Lisbon together will be able to compete with major European Hubs as both cities are being seen as a preferable gateway to Europe already.”
Recognizing the potential of Sines, EllaLink has identified it as the ideal location for the next interconnection hub in Europe. Sines offers unique advantages that make it an attractive gateway to Europe. Its strategic location along the Portuguese coast provides a natural landing point for undersea cables, including the Olisipo system. The availability of land in Sines provides ample space for developing data centres and other related infrastructure. This generates opportunities for economic growth, job creation, and innovation in the region.
Sines, with its strategic location has the potential to become the next interconnection hub in Europe. The presence of the Start Campus and its commitment to developing green energy ecosystems, including establishing a giant green data centre, further strengthen the region’s position as a gateway to Europe. Sines is poised to unlock new opportunities for economic growth, innovation, and the development of sustainable digital infrastructure.
Sines, with its strategic location, available land, sustainable power sources, and water availability, has the potential to become the next interconnection hub in Europe. The presence of the Start Campus and its commitment to developing green energy ecosystems, including the establishment of a green giant data center, further strengthens the region’s position as a gateway to Europe. Sines is poised to unlock new opportunities for economic growth,
innovation, and the development of sustainable digital infrastructure.
Moreover, Sines benefits from sustainable power sources, including renewable energy. Portugal has made significant investments in renewable energy, such as wind and solar power, making it a leading country in the clean energy transition. Sines can leverage these sustainable power sources to meet the energy demands of data centres and other digital infrastructure. This aligns with the growing demand for environmentally friendly solutions and positions Sines as an attractive location for companies seeking to establish sustainable operations.
The proximity of Sines to the ocean ensures abundant water availability, which is essential for cooling data centres and other industrial operations. This proximity also enables the utilization of seawater for desalination, providing a potential solution to water scarcity issues that other regions may face. Additionally, the maritime connection of Sines opens possibilities for future underwater research, exploration, and marine-related industries.
Furthermore, the development of the Start Campus in Sines adds another layer of significance to the region. Start Campus is a company dedicated to developing 100% green energy ecosystems. It is responsible for establishing a green giant data centre in Sines, Portugal. This initiative aligns with the global shift towards sustainable practices and positions Sines as a pioneer in hosting environmentally friendly data centres. The Start Campus project further enhances the potential of Sines as a hub for innovation, research, and development in the digital realm. STF
56 SUBMARINE TELECOMS FORUM MAGAZINE
DIEGO MATTAS is COO of Ellalink and possesses over 25 years of experience in the international telecommunications infrastructure industry working for major players such as Interoute, Global Crossing, and Cable & Wireless in senior positions.
play for offshore wind.
Climate Change
While the telecom industry has been operating for quite some time and has made significant advances in our knowledge of benthic marine environments, climate change is one issue that we will have to face in conjunction with all offshore maritime industries and the wider world. The push for projects concerning environmental monitoring and communications is spreading throughout the industry, with a current focus on issues relating to marine megafauna and fisheries targets. Initiatives such as SMART cables and similar monitoring systems in offshore wind will go a long way towards narrowing existing knowledge gaps and ensuring that we have lengthy and reliable data records as our seas undergo this period of immense change.
As mentioned previously, interdisciplinary initiatives such as ROSA will be integral in encouraging data sharing and data tracking as some common fisheries and conservation target species exhibit spatial and temporal distribution shifts. By working together, industry and local stakeholders can broaden our collective knowledge of how the oceans around us will be impacted by climate change related phenomena. As such, we can hope to mitigate issues to the best of our abilities and focus on nurturing sustainable growth of both telecom and offshore wind industries, keeping the world connected and providing reliable sources of clean, renewable wind energy. Similarly, collective knowledge on natural system faults, both for subsea cables and offshore wind infrastructure, will contribute to our understanding of how best to shift future engineering and operation innovations to cope with an increase in strength and frequency of inclement weather events and other climatic factors.
Summary
Throughout both industries, a common theme is the importance of early and continued stakeholder engagement. “We stand by the idea that stakeholder engagement and outreach with other maritime users and operators is incredibly important,” Ryan Wopschall, ICPC GM states, “Raising awareness of subsea cables within the offshore renewable energy sector and encouraging developers and stakeholders to contact us in regard to new and ongoing projects will further facilitate safe and efficient use of marine resources and long-term protection of seabed infrastructure.” All marine users must be considered throughout project development, and these considerations, alongside
STAY CURRENT FOLLOW US ON SOCIAL MEDIA
those of public perceptions, will help to pave the way for community buy-in and long term success of these installations.
In the past century and a half, humans have come to understand a significant amount about our oceans and how they function. Through the course of hundreds of subsea cable installations, the telecom industry has been at the forefront of uncovering benthic knowledge. Our understanding of seafloor hydrology, shifting sediments, ecological interactions, and even earthquakes and tsunamis has greatly increased. By taking what we have learned and applying it to the burgeoning offshore wind industry, we can best position ourselves to reap the rewards of an extensive renewables network while mitigating social, environmental, and ecological impacts. We have extensive local fisheries and communities networks, professional guard vessels and crews, broad knowledge of the marine environmental and applicable requirements and legislation, and, above all, we have a vision for long-term, sustainable success in harnessing our renewable natural resources for clean energy. To our partners in the offshore wind industry— we are ready and willing to help you reach your goals.
Emma Martin is the Marine Systems Associate at Seagard. She has her BA in Biology from Boston University, USA and her MSc in Marine Systems and Policies from the University of Edinburgh, Scotland. She has performed marine field work around the world and looks forward to continuing to support maritime infrastructure developments.

JULY 2023 | ISSUE 131 57
@subtelforum @subtelforum SubTelForum subtel-forum
2023 SUBMARINE CABLES OF THE WORLD


Limited Number Available


LEGEND LANDINGS (1,099) DATA CENTER CLUSTERS IN-SERVICE (383) PLANNED (65) CABLE SYSTEMS
SUBMARINE CABLES OF THE WORLD MAP



144 78 67 54 44 36 33 26 23 18 15 13 12 12 12 9 9 5 4 3 3 2 2 Thanlyin Invercargill Christchurch Melbourne Buenavista Kochi Bazar Pyapon Satun Songkhla Penang Mersing Kuantan Sri Racha Sihanoukville Ketapang Bandjermasin Sangata Toweli Waingapu Kupang Sulawesi Papua City Miri Kota Kinabalu Da Nang Da Nang Nasugbu La Union Ballesteros Shantou Fangshan Fangshan Toucheng Chongming Qingdao Incheon Geoje Kitakyushu Shima Maruyama Ajigaura Naoetsu Nevelsk Mys Levashova Magadan Madang Port Moresby Perth Stanley Honiara Poindimie Suva Pohnpei Majuro Majuro Sasanlagu Ngwe Saung Anyer Daet Beach Bluff Taytay Coron Lingang Tanjung Pandan Kuakata Magachgil Quy Nhon Whenuapai Savusavu Fuzhou Port Hedland Christmas Sunshine Kamorta Vũng Tàu Rayong Sandy Point Little Andaman Mangawhai Great Nicobar Kwajalein Atoll Panipahan Wenchang Kuala Tungkal Tutuyan San Buenavista Palembang Tarakan Tanjung Selor Takesung (Keeling Anadyr Dikson Pevek Petropavlovsk-Kamchatsky Minicoy Takahagi Dill Tadine Kosrae Tarawa Daru Jayapura Kavieng Kerema Kimbe Kokopo Lae Lorengau Popondetta Vanimo Wewak Lingshui Balikpapan Zamboanga City Kalimantan Bajo Indonesia Japan Kyrgyzstan Cambodia South Korea Laos Myanmar Mongolia Malaysia Nepal New Zealand Philippines Papua New Guinea North Korea Russia Thailand Vietnam Australia Bangladesh India China RNAL PPC-1 AJC AAG TGNIntra-Asia APCN-2 APCN-2 SE -ME-WE4 TPE SJC SJC Faster FEA AA1 SEA-ME-WE 3 AAG AAG SEA-US SEA-US Hantru-1 ASE GOKI SEA-ME-WE 3 EAC-C2C BBG APG SouthernCrossNEXT I-ME-WE EAC-C2C Coral Sea NCP NCP GA S Hawaiki PPC-1 G dwan1 JGA North A C Tasman Global Access ASE ASC i2i SCAN Endeavour Japan-US Unity Indigo West Jupiter PC-1 Indigo Central Faster PLCN SouthernCross TGN Pacific TGN Pacific OAC OAC TPE H N Hawaiki Nui ACC-1 ALC SJC2 SAEXEast MIST IAX SEA-M -W 6 ADC E AH X HawaikiNui H2Cable H2 Cable TOPAZ Pol xp s IAX SIGMAR Apricot Eas M crone a Cable HawaikiNui SAEX East Echo JUNO Echo Ap i Apio ACC-1 ACC-1 ACC-1 Bifrost Bifrost Bifrost Express PolarExpress Polar Express xp s NTT WE MARINE 3 2 Kuwait City Bushehr Kharg Manama Doha Dubai Fujairah Al Seeb Chabahar Karachi Mumbai Al-Faw Bandar Abbas Al Ghaydah Island Khasab Jask Iran Oman Saudi Arabia Yemen Afghanistan United Arab Emirates India Pakistan Falcon TGNGu GB CS BBG TGN Gulf GBICS SEA-ME-WE3 SEA-ME-WE5 Falcon I-ME-WE SEA-ME-WE 4 EIG FEA FEA SEACOM OAC TEAMS AAE-1 TGNEurasia MENA 2Africa/PEARLS Raman Af a-1 IEX Raman SE -ME-WE 6 2Africa f RLS SEA-ME-WE 6 SING PEACE EMIC-1 Raman TEAS TEAS TEAS 7 6 3 2 Zaafarana Annaba Tartus Marmaris Palermo Bizerte Kélibia Catania Savona Bari Otranto Durres Bar Corfu Istanbul Mangalia Darna Mazara Vallo Monte Carlo Tripoli Dubrovnik Koropi Pozallo Toulon Tobruk El Quawef Balchik Said Ras Cagliari Civitavecchia Kerch Trapani Girne Samandag Preveza Collo Tympaki Heraklion Amman İğneada Haql Rome-Fiumicino Ajaccio Croatia Italy Libya Romania Serbia Syria Tunisia Turkey Bulgaria Bosnia and Herzegovina Algeria Egypt France Greece SEA-ME-WE4 TE North SEA-ME-WE 3 Alexandros MedNautilus AAE-1 Hawk LEV SEA-ME-WE5 I-ME-WE Athena AAE-1 MENA BIOS Jonah Arsinoe EA Minerva MEDUSA PEACE Blue Blue SEA-ME-WE 6 EACE TEAS IEX Africa-1 2Africa TEAS TEAS EMIC-1 EMIC12 8 4 City Camuri Punto Fijo Riohacha Barranquilla Cartagena Tolu Ustupo Bluefields Lempira Trujillo Cortes Tulum Cancun Naples Miami Vero Beach Rios Montego Bay Bay Puerto Plata San Juan Canefield Rock Sound Cat Island Crooked Island Providenciales Bonaire Marsh Harbour Morant Point Half-Moon Bay Tortola Bull Bay Port Castries Maiquetia Curaçao Ponce Sandy Point Saint John's San Pedro Toco Pigeon Point Grand Cayman Honduras Haiti Mexico Nicaragua Panama United States Venezuela Colombia Costa Rica Cuba Dominican Republic SCF PAN-AM MAC MAYA-1 SAM-1 PCCS CFX1 PCCS Monet AmericasINorth SAC Glob Net ALBA-1 SAM-1 Columbus III PAC AmericasII A M X1 Colu bus ColumbusII A s-1 Arcos-1 CSN-1 Firmina CX Thuwal Al Hudaydah Jeddah Port Sudan Djibouti City Djibouti City Yanbu Ras Duba Haql Saudi Arabia Somalia Yemen Egypt Eritrea Somaliland Sudan South Sudan Ethiopia Falcon MENA SEA-ME-WE 3 SEA-ME-WE5 TGN Eurasia FEA EIG EIG AAE-1MEWE SEAMWE EAS SEACOM PEACE Africa-1SaudiVision Cable AMEWE6 2Africa 2Africa Raman Raman IEX EMIC-1 TEAS 73 67 13 5 5 2 Mersing Sihanoukville Ketapang Pangkalanbun Bandjermasin Sangata Toweli Bintulu Miri Tungku Kota Kinabalu Da Nang Da Nang Nasugbu Cavite La Union Shantou Fangshan Taytay San Tanjung Pandan Quy Nhon Quy Nhon Vũng Tàu Vũng Tàu Wenchang Kuala Tungkal Kiamsam San Jose de Buenavista Muntok Palembang Tarakan Tanjung Selor Lingshui Balikpapan Balikpapan Pinamalayan Zamboanga City Indonesia Cambodia Laos Malaysia Philippines Thailand Vietnam China SEA-ME-WE 3 AAG APCN-2 SJC RNAL ASE APG AAE-1 APG EAC-C2C TGN Intra-Asia Jasuka SCAN ALC ADC SJC2 SEA-H2X SEA-H2X A CLOSER LOOK RED SEA SOUTHEAST ASIA MEDITERRANEAN GULF INDIAN OCEAN CARIBBEAN 0 500M 1B 1.5B 2B 2.5B 2022 2019 2018 2015 2014 (IN BILLIONS USD) SUBMARINE CABLE SYSTEM INVESTMENT, 2013-2022 87.2K KMS Transpacific Transatlantic Polar Indian Ocean EMEA AustralAsia Americas REGIONAL DISTRIBUTION OF NEW CABLE, 2013-2022 87.2K 71.4K KMS 51.9K KMS 148.6K KMS 3K KMS 500M 1B 1.5B 2B 2.5B 3B 3.5B 4B 2025 (IN BILLIONS USD) SUBMARINE CABLE SYSTEM INVESTMENT, 2013-2022 0 50 100 150 200 250 300 350 400 Telehouse CyrusOne Digital Realty Equinix CenturyLink TOP DATA CENTER PROVIDER FACILITY COUNT TRANSPACIFIC TRANSATLANTIC POLAR INDIAN OCEAN EMEA AUSTRALASIA AMERICAS REGIONAL DISTRIBUTION OF NEW CABLE, 2013-2022 115.9K KMS 37.7K KMS 85.4K KMS 129.4K KMS 88.2K KMS 32.1K KMS 32.9K KMS TRANSPACIFIC TRANSATLANTIC POLAR INDIAN OCEAN EMEA AUSTRALASIA AMERICAS REGIONAL DISTRIBUTION OF NEW CABLE, 2013-2022 115.9K KMS 37.7K KMS 129.4K KMS 88.2K KMS 32.1K KMS 32.9K KMS BY THE NUMBERS SUBMARINE CABLE SYSTEM INVESTMENT 2013-2022 REGIONAL DISTRIBUTION OF NEW CABLE 2013-2022 TOP DATA CENTER PROVIDER FACILITY COUNT CONTENT PROVIDER FACILITY COUNT SUBMARINE CABLE SYSTEM INVESTMENT 2023-2026 REGIONAL DISTRIBUTION OF NEW CABLE, 2023-2026 2023 WORLD MAP GET YOUR COPY TODAY $35 USD CLICK HERE TO BUY NOW
BACK REFLECTION
BACK REFLECTION: NEWFOUNDLAND TERRESTRIAL ROUTE CONSTRUCTION 1853-1856 (PART1)
BY PHILIP PILGRIMThe upcoming Back Reflections articles will focus on the construction of the Newfoundland Terrestrial Telegraph Line. This 400 mile route was needed to connect the eastern most point of North America to the North American telegraph network. Construction began in June 1853 and was completed in October 1856.
To break the ice, here is a light story with a little mischievous humor that predates child labour laws and under-age drinking laws. It was written in 1915 by Samuel Ruby. He was a young boy of 14 who signed up to construct the telegraph line in July 1854. A little research shows that his background is farming and agriculture, so his ability to identify animal tracks should be considered accurate.
Samuel’s story was published in The Newfoundland Quarterly magazine (Vol 15. No2, October 1915). At that time, he would have been 75 and mentions that he may be the only surviving member of the 360 man team that constructed the line.
BUILDING THE TRANSCONTINENTAL TELEGRAPH
BY SAMUEL RUBYWhen it was proposed to build an overland telegraph line from St. John’s to Port-aux Basque, the customary opposition to all great reforms showed itself. For years we had great difficulty in receiving news from the outside world. Letters were always scarce, because they were mostly brought by sailing vessel, and postage was expensive. Under such circumstances it can be
imagined that a good telegraph service would be an immense boon to the city. Old-fashioned people said it would not pay and it could not be built. But finally, men of pluck and foresight took the problem in hand, and getting concessions from the Government, commenced work and carried the line through. This work was done when the Hon. Charles Fox Bennett was
Premier, and the Parliamentary reports of the time will show how strenuously the proposition was opposed.
Frederic Newton Gisborne was the most active promoter of the transcontinental line. He was Engineer on construction for the company building the landlines in the Maritime Provinces of Canada in 1848—51. In the fall of 1851, he came to St. John’s and
60 SUBMARINE TELECOMS FORUM MAGAZINE
planned a line to connect with the Canadian system. His plan was to build a land line from St. John’s to Cape Ray and make connections with Sydney, Cape Breton, with carrier pigeons. He surveyed the route between September 1st and December 4th, 1851, and estimated the cost at £64,096. Later, he estimated a cable connection across the Straits, in place of the carrier pigeon service, could be made at an additional cost of the total cost of the system about £165,000. The Newfoundland Electric Telegraph Company was chartered by Parliament, in the Spring of 1852, and it was given the right to erect telegraphs in the Colony for thirty years. In December 1852, the Ellen Gisborne arrived in St. John’s to carry material and supplies for the men engaged in the work. The capital of the Company was subscribed in New York and construction was commenced.
In a petition presented to Parliament on May 29, 1854, by the Hon. P. F. Little, the advantages of the Telegraph was set forth as follows: The value of electric telegraphs are every day becoming more apparent and are practically tested in Great Britain, the sister colonies, and the United States; that the British Government is about constructing a submarine telegraph
communication between London and Galway; that there is already a line of telegraph from Halifax, Nova Scotia, through New Brunswick to Canada and the United States, and that it is proposed to extend the line from Halifax to Sydney, Cape Breton, within 50 miles of Cape North; and that there is a Bill before the Congress Of the United States for carrying the American line to San Francisco, California, which will probably be in operation in two years hence ; that if a line were established
message could easily be transmitted in one day; that, as there is no doubt that a fleet steamer would sail from Galway to this port in five or six days, a message by this route could be transmitted from London to California in seven days, and giving to St. John’s an advantage of thirty-six hours over any other port it must necessarily on the construction of such a telegraph line, become the port of call on this side of the Atlantic.”
The St. John’s Post, of April 4th, 1854, editorially commenting on the


from St. John’s to Cape Ray and connected with St. Paul’s Island with Cape North by submarine telegraph or by steamer from Cape Ray to Cape North, until a submarine telegraph should be laid, a communication would be established between St. John’s, the neighboring colonies and the United States, to California, to which latter place a
petition said: Bright prospects for Newfoundland stretch away in golden vistas over the future—but we will not up lift the veil, lest the yet to be realized visions which in prospective come crowding upon the view, be deemed as more than one present reality has been deemed before, but the misty shadows of a distempered mind, the dreamy
JULY 2023 | ISSUE 131 61
The Courier July 26, 1854
BACK REFLECTION
offspring of a poetical imagination. Mr. Gisborne’s estimates of the cost of the line were found to be too low and in the summer of 1853 his company defaulted. He went to New York and interested Cyrus W. Field, Prof. Morse, and others. in the scheme and it was taken over by the New York, Newfoundland and London Telegraph Company. This Company completed the line to Cape Ray on October 1856. In January 1857, it placed Alexander M. Mackay in charge of its work and from that time the business has been completely successful.
In the year 1854, just 61 years ago, the Wilfred Fisher, a fine American brig of 450 tons burthen, was hired by the Telegraph Company to take 360 men and land them at different places on the West Coast, to make the first start at putting up telegraph poles in Newfoundland. The Master, Captain
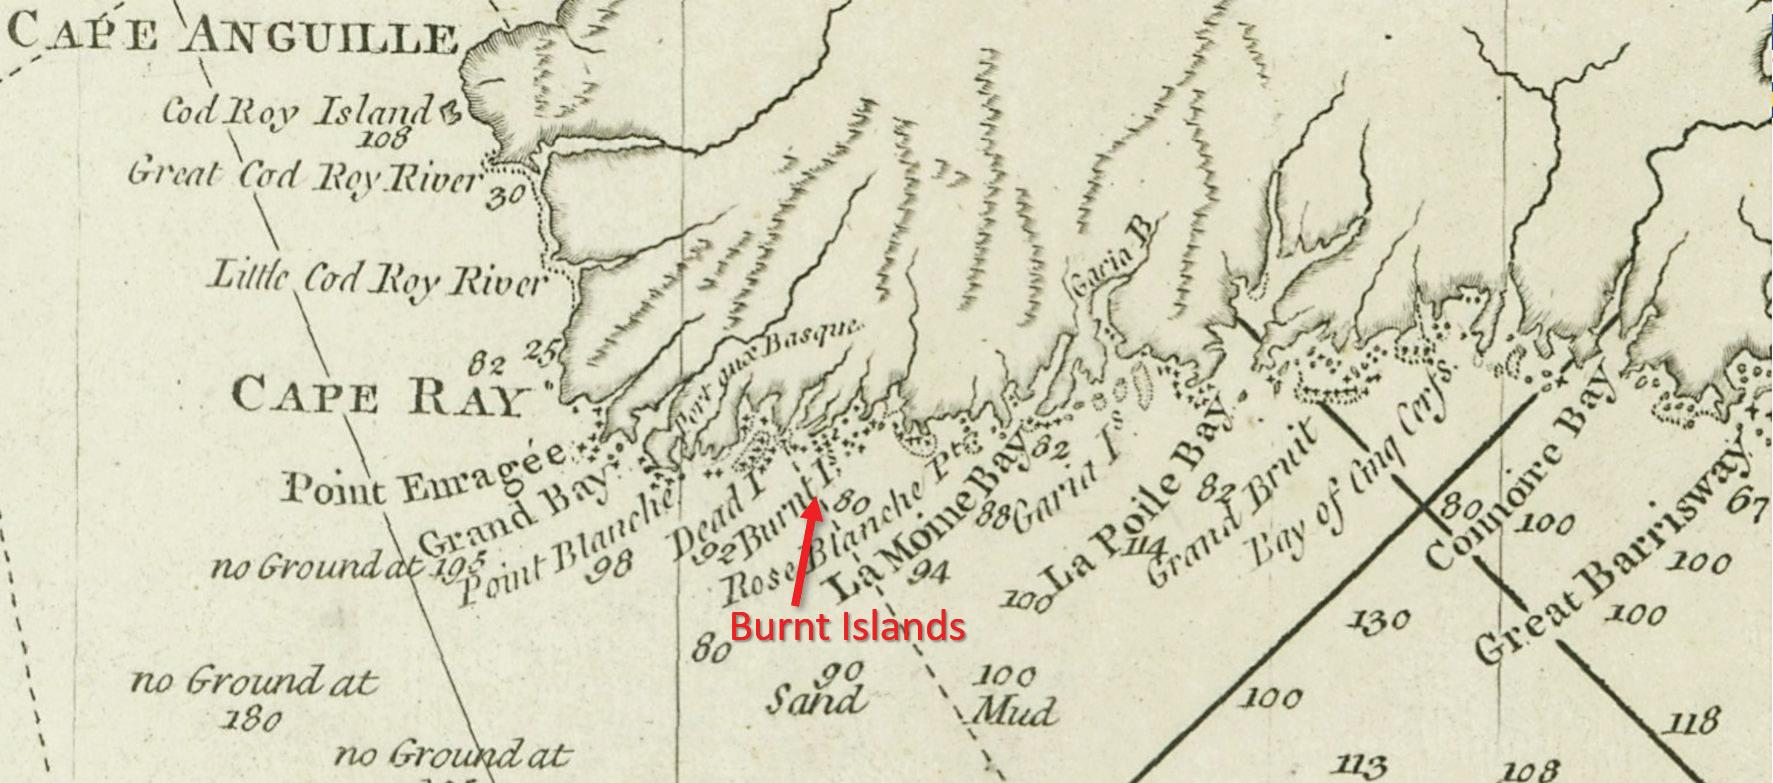
Slider, was asked how long it would take him to land the crew of men at the different places, selected by the Company, and his reply in vigorous language was that he would land them in four days. He kept his word.
We left St. John’s on July 8th, a day which 38 years later was a memorable one in the history of St. John’s. When we got outside the Narrows it became calm and the ship commenced rolling unpleasantly. I soon got seasick, it being my first trip to sea, and at that time I was only 14 years of age. The late Captain John Halley came looking after me. He had a bowl with about a noggin of brandy in it and a big chunk of cake. “ Here you young beggar, take this,” he said, and I drank the brandy, but I could not eat the cake.
About 5 o’clock in the morning of July 12th we were sailing along with every stitch of canvas set, going about
5 knots an hour. The pilot called out, “Haul her in a point.” Captain Sluyter replied, “Keep her off two points,” and in less than an hour we were on the rocks. We went in over a sunken rock and the jibboom landed on the cliff at Mistaken Point, near Cape Race *. It was very foggy at the time, and if we had struck a short distance farther on, we would all hands, have been lost as we should have struck a perpendicular cliff, and, as we had only one jolly boat aboard our chances would have been little better than nothing. The vessel was a total wreck, but we saved almost everything aboard.
Our pilot was the late Philip Jackman, a man with only one arm. He was the overseer on the St. John’s streets. Despite his disability he was the first to get ashore. I was the third. We knocked the heads in the barrels of pork and pitched the contents from
62 SUBMARINE TELECOMS FORUM MAGAZINE
Figure 1. Map Showing Burnt Islands Brook
one to the other, up over the cliff, and we were well greased that day, before we got our camps up and the cooks got to work.
That first day we had a ring fight with seconds and all the customary observances. I don’t think that there was a man aboard without a keg or a jar. Rum was then three cents a glass and half-glasses were not dreamed of in those days. We had three musicians, Sheehan was the fiddler and Flaherty played the flute. The name of the man with the tambourine, I forget. We would have music and dances every day. We used to put a nail in the end of a long stick and haul in all the fish we wanted, for the fish literally tumbled in on the rocks.
The men’s wages started when they left St. John’s, so they were all in good spirits and made a regular picnic of the accident. Altogether we were there
17 days, waiting for the little steamer Ellen Gisborne ** to take us to our destination.
Capt. John Halley and myself were landed at Burnt Island Brook (Figure 2). We went inland for several miles to look after provisions. The old captain could not eat hard bread, so we would have toutons for breakfast, sweet pudding for dinner and toutons again for supper, and I got so fat, the Captain was afraid that I would become blind. But I did not get blind and for I could kill all the partridge we wanted by throwing stones at them.

I believe I am the sole survivor of those 360 men. Being only a boy at the time I have outlived them all.
Partridge was very tame in those days. Sticks and stones were quite as useful as guns and powder. In the front of the camp was a large bake-apple marsh, the berries were ripe and a pic-
ture to look at. We had a large camp to keep the provisions in, and we slept in one end of it. Capt. Halley was very fond of reading, and he would stay up late in the night. No electric light was there, it is true, but we had a good stock of candles, so generally in use at that time.
One night the Captain stayed up. He never told us he did so; but we knew he did. He had spent his life at sea and camping in the unknown interior was a new experience for him, as it was for most of the men engaged on the construction. It was difficult to secure men. They were afraid of wild animals, scurvy, starvation and many other imaginary troubles. Special inducements in the way of bonuses in addition to their ordinary rates Of wages had to be given them and, when they were actually engaged in the work, they found their fears were
JULY 2023 | ISSUE 131 63
Figure 2. Burnt Islands Brook (Looking North from Landing)
BACK REFLECTION
groundless, and they enjoyed the camping and bush life. Captain Halley, however, always preferred the dangers of the seas to those of the land.
We all slept soundly the night the Captain stayed up in the tent and he never told us about the wild night he spent. We had to learn about it indirectly. It appeared that he took up a book after we had all turned in and read until past midnight. As he became sleepy, he heard strange noises outside the tent. He looked out; but it was dark and cloudy, and not even a star could be seen. He took up the book again and the noises returned. They appeared to be quite close to the tent and captain thought that Indians, or some terrible wild animals of the bush, had been attracted by the light in the tent and were preparing to raid it. The captain was barely able to breathe, as he expected to lose his life each moment. At the same time, he did not like his fear to be known to the men. The result was that he sat up in the tent all night with the lights burning suffering from all kinds of terrors. That was probably the most fearful night he spent in all his adventurous life.
He called us all much earlier than usual in the morning, and we knew there was something troubling him; because he looked wild and was in a worse mood than usual.

He hurried the cook with breakfast using stronger language than was customary for him and that is as much as saying it was extra—strong language. He said to me:
“You young beggar, you had like to get eat last night and I couldn’t wake you!”
I looked at him with astonishment,
and he returned my looks with an inquisitive stare.
“Why Captain?” I asked.

“Come outside and I will show you,” he said.
We went outside and he showed me some markings where a pig or other animal had been rooting. I followed up the tracks until I came to a patch of open earth and saw the traces of bears.
“It must have been a bear.” I said.
“Of course, it was.” said the captain. He came to make a meal of you, well knowing how fat you are; but I saved you. Be careful, however, not to sleep so soundly in a tent after this; because you never know what beasts prowl around these parts at night.”
That day a bullock team came for provisions for a camp some distance further inland where there were a number of men. The captain told us he thought he would shift his depot and we all started away with the bullocks and camped the next night with a numerous company. Captain Halley never told us why he moved the camp; but we knew that he always trembled
with fear when we talked around the campfires about bears and other wild animals. And he spent many sleepless nights whenever the men reported having seen bear tracks while walking to and from their work.
NOTES:
• Two more ships, The Philadelphia and the SS Arctic will also ground at this same location in 1854 and the New York, Newfoundland, & London Telegraph Company’s Steamer Victoria will be involved.
• The Ellen Gisborne departed Harbour Grace on August 5th bound for Boston and repairs. The rescue occured on July 27th,
The camp site today? Hmmmm I wonder.... just checked with Janet and she is up for the 2 mile hike up that river to find the old camp the next time we visit Newfoundland....just as long as we have bear spray! I’ll see if I can get a cousin to explore it in the meantime.
Samuel Ruby was born in May of 1840 in Abbotskerswell, Devon, England. He passed on May 16th, 1925, in St. John’s, Newfoundland. Samuel farmed his 50 acres in Goulds, Newfoundland. A road called “Ruby Line” commemorates his family name to this day. STF

64 SUBMARINE TELECOMS FORUM MAGAZINE
PHILIP PILGRIM is the Subsea Business Development Leader for Nokia's North American Region. 2021 marks his is 30th year working in the subse a sector. His hobbies include "Subsea Archaeology" and locating the long lost subsea cable and telegraph routes (and infrastructure). Philip is based in Nova Scotia, Canada.
Samuel Ruby
LEGAL & REGULATORY MATTERS
HOW TO BE ONBOARD IN A MARITIME SPATIAL PLANNING INITIATIVE?
By Andrés FígoliMaritime Spatial Planning or MSP initiatives may consist of a set of frameworks and processes used to manage and regulate human activities in the marine environment in a sustainable and coordinated way. Their aim is to balance the interests of the environment, society, and economy, promoting the sustainable development of the marine space by permitting or restricting specific actions in the sea and along the coast.
Typically, a coastal state consults any new MSP legal framework with seabed users and other stakeholders, including environmental groups and local communities, to harmonize their inquiries, reach a consensus, and issue the new regulation. Accordingly, all stakeholders are supposed to be actively involved in the development of the MSP consultation process through meetings and workshops. The purpose is to gather their input and feedback, leading to a final assessment before implementing new policies, plans, or regulations1.
Submarine cable owners with assets in their jurisdictional waters are usually invited to participate in workshops or roundtables. During these engagements, they must defend their current ground and anticipate potential issues and challenges associated with proposed regulations, bearing in mind new cable project scenarios in the upcoming years. Careful assessment
of the regulations’ application and consequences is crucial for these owners to maintain the reliability of their subsea infrastructure and mitigate additional risks to their assets. Failure to do so may even eliminate the possibility of future cable landings in their own cable stations.
and underwater surveillance drones.
While it is true that a forwardthinking marine spatial planning can make seabed impact more “manageable,” it is important to acknowledge that some of these changing factors are difficult to calculate or predict with our current technological constraints.
RISKS TO AVOID OR, AT LEAST, MINIMIZE
There is no doubt that multiple submarine cable outages in the past could have been reasonably prevented if fair regulations had been in place since the first decade of the 21st century. Unfortunately, lawmakers did not foresee the boom of the fiber optic subsea cable industry and that led to bottlenecks of several cables in the same zone. This situation increased the risk of multiple cable outages occurring simultaneously in the same day and area.
ALWAYS BE ONBOARD
“It is better to be at the table than on the table.” While there may not be immediate short-term benefits with this MPS consultations, the long-term outcomes are expected to be based on:
• the future development of incipient industries, such as integrated offshore wind and tidal energy
• the emergence of new technologies, such as buoys in open ocean aquaculture
• potential advancements in the cable industry, such as SMART cables,
However, it is fair to say that even with the best AIS/VMS monitoring system, a local navy may not be able to prevent a merchant ship from breaking three cables with its anchor to avoid sinking during a stormy night.
Moreover, it is indeed a good legal practice that many countries have already embraced the implementation of safety corridors for new projected cables within their maritime boundaries. The effectiveness of these corridors is directly related to the key participation of the fishing industry in MSP discussions and a debate centered on solid and transparent scientific data, such as fishing migration and captures.
This is an opportunity to build trust and credibility among the fishing and
66 SUBMARINE TELECOMS FORUM MAGAZINE
1 See Martínez, Mencía and Melo, Rita. “Recent Marine Spatial Planning Developments and its Impacts on Regulatory Approvals for Submarine Telecommunication Cables. A Study Case for Belgium, Cyprus and Greece.” SubTel Forum, Issue 129, March 2023.
Typically, a coastal state consults any new MSP legal framework with seabed users and other stakeholders, including environmental groups and local communities, to harmonize their inquiries, reach a consensus, and issue the new regulation.
subsea cable industries, considering that more than 70% of submarine cable failures are related to fishing activity.
GAIN MORE ALLIES THAN ENEMIES
The fishing industry associations should be considered as potential allies if a sane dialogue is established from the beginning between both sectors. Otherwise, a cable owner may be creating an unwanted time bomb against its network reliability during the 25year lifespan of its submarine cables.

Firstly, both industries should engage in dialogue and strive to reach an accord de concertation based on key points of mutual understanding. Previous cable awareness campaigns led by cable owners have proved to be crucial in establishing bridges where the perspectives of both sides are clearly understood through genuine dialogue during annual face-to-face meetings.
Of course, if consensus cannot be reached, the government or an agency mandated by it will be the ultimate responsible for the final decision on how the water area and space should be used.
WHO SHOULD PARTICIPATE?
Cable owners should carefully select their representatives for these regular face-to-face MSP workshops/meetings. It is crucial to select individuals who possess a strong technical and legal background. These representatives should also actively exercise one of the most valuable soft skills in such multi-stakeholders’ events: open-mindedness.
Every participant at the negotiation table should be ready to acquire some knowledge, even if not comprehensive, about other industries such as fishing, mining, military activities, wind farms, oil ducts prospection, and harbor construction. This understanding will
enable them to effectively communicate with representatives from these sectors and grasp their language and legitimate interests.
Subsequently, with a clear mind to find allies, such cable owner representatives should aim to seek swift consensus rather than relying on the imposition of future rules that may prove impractical in situations where continuous 24/7 surveillance of submarine cables is not feasible.
Furthermore, it is crucial for the representative to carefully strike a balance between drafting a bill that demonstrates a reasonable understanding of existing threats to telecom seabed infrastructure and ensuring flexibility to adapt to evolving environmental regulations. For instance, in certain maritime areas of the continental shelf, the usual fishing zones once extended to depths of 1,200 meters, but over the course of 20 years, these zones expanded to encompass waters up to 2,800 meters deep.
Lastly, it is important to acknowledge that the various stakeholders involved in the working groups may not necessarily share the same visions or even communicate in the same language. Thus, their ideas may not be easily understood by the other group members. This highlights the importance of fostering effective communication, practicing patience, and considering legal action as a last resort and not as a primary tool.
Despite this, usually a minority abandons the dialogue instances before these consultation processes reach completion and threatens to sabotage the entire process with massive mass-media campaigns, riots or even blocking legal actions before local courts. These inherent risks in every MSP consultation process do not undermine the need to initiate them with the required speed and form that each country deserves, nor should they diminish the importance of cable owners selecting individuals with the adequate profile for these tasks. STF
ANDRÉS FÍGOLI is the Director of Fígoli Consulting, where he provides legal and regulatory advice on all aspects of subsea cable work. His expertise includes contract drafting and negotiations under both civil and common law systems. Additionally, he has extensive experience as an international commercial dispute resolution lawyer. Mr. Fígoli graduated in 2002 from the Law School of the University of the Republic (Uruguay), holds a Master of Laws (LLM) from Northwestern University, and has worked on submarine cable cases for almost 21 years in a major wholesale telecommunication company. He also served as Director and Member of the Executive Committee of the International Cable Protection Committee (2015-2023).
Do you have further questions on this topic?
MAY 2023 | ISSUE 130 67
Every participant at the negotiation table should be ready to acquire some knowledge, even if not comprehensive, about other industries such as fishing, mining, military activities, wind farms, oil ducts prospection, and harbor construction.
ASK AN EXPERT
ON THE MOVE
DYNAMIC
STEVE GRUBB, previously leading the Global Optical Architecture at Meta, has decided to take some time off to reflect on his next journey. With over 15 subsea systems under his belt, he is considering select subsea consulting projects and is open to full-time opportunities.

RAJESH KHENY, who was instrumental in the Global Submarine Cable Program Management at Facebook/ Meta, is ready to explore challenging opportunities that will continue to grow his skills with leadership and team-building. He remains committed to nurturing the next generation in the subsea industry.
JAVIER LLORET has transitioned from his role as Senior Expert – Submarine Cables at Omantel to join Zain Omantel International as a Senior Submarine Expert.
TOM JANSSEN-MANNING has moved from his position as General Manager and Director at CWind Taiwan to join Google as Operations Program Manager, Submarine Networks APAC, where he will contribute to the ambitious plans for the region.

These transitions highlight the dynamic nature of the industry, with experienced professionals continually seeking new challenges and opportunities to make impactful contributions. We wish them all the best in their new roles.
HAVE A NEW HIRE YOU WANT TO HIGHLIGHT IN THE NEXT ISSUE OF SUBTEL FORUM MAGAZINE?
Feel free to send a direct message to Kieran Clark on LinkedIn or send the announcement to kclark@subtelforum.com.
68 SUBMARINE TELECOMS MAGAZINE
IN THE
WORLD OF CORPORATE TRANSITIONS, SEVERAL NOTABLE INDIVIDUALS HAVE RECENTLY MADE SIGNIFICANT CAREER MOVES.
SUBMARINE CABLE NEWS NOW
CABLE FAULTS & MAINTENANCE
Quintillion Updates on Arctic Cable Repairs
Vietnam’s APG Undersea Cable Malfunctions Post-Repair
Vietnam’s Undersea Cable Fix by June End
Ship Owners Charged for Coral Sea Cable Damage
Vietnam-Hong Kong Cable Connection Restored
Undersea Cables Repaired in Vietnam
Solomons Internet, Mobile Hit by Cable Damage
Vietnam’s Undersea Cables Fixed by End June
CURRENT SYSTEMS
Namibia’s Equiano Cable Boosts Connectivity
Kenya Eyes Djibouti’s Undersea Cable
Farice Activates IRIS Submarine Cable with Ciena
IONIAN Cable Connects Greece, Italy
EXA, EllaLink Diversify S. America-EU Capacity
DATA CENTERS
Adani Integrated Data Centre & Tech Park in India
Oman Data Centre Market to Hit $428mn by 2028
FUTURE SYSTEMS
Medusa Submarine Cable System Construction Begins
Japan, U.S., Australia Plan Undersea Cable
MTEL’s T3 Subsea Cable: A Game Changer
Singapore Submarine Cable Capacity Boost
NEC Submarine Cable Deal for Micronesia
DC BLOX 2nd Subsea Cable in Horry County
Center3, ASN to Build Subsea, Terrestrial Cables
Google’s TPU Subsea Cable Revealed
Tamares, Grid to Build ANDROMEDA Cable
EU Eyes Black Sea Cable for Internet Diversity
STATE OF THE INDUSTRY
Bermuda Restructuring Rescues Digicel Group
Aqua Comms, NYI Partner for U.S. Interconnection
Quad Leaders’ Summit Fact Sheet
Batelco’s Major Cable and Data Center Investment
C&W Rebrands as Liberty Networks
WIOCC Grows for Pan-Africa Expansion
TECHNOLOGY & UPGRADES
Kenya Internet Bandwidth Rises 20%
ASN New Cable Laying Ship Launched
JULY 2023 | ISSUE 131 69
REGIONAL SYSTEMS
A Snapshot Of Where We Are And Where We Are Headed
The submarine fiber market continues to grow through 2022 at a similar rate to that observed since 2016. Some regions have begun to slow their pace with fewer systems planned beyond 2022, while other regions are seeing a substantial increase to their overall system count through to 2025. There are some overbuild concerns considering the rapid pace of system development over the last few years, but many cable systems are reaching the end of their economic and technological lifespans and will need replacing. Business models around the world are changing, as more of the submarine fiber industry is driven by Hyperscaler infrastructure needs and the desire to connect data centers rather than population centers. The bulk of Hyperscaler infrastructure and major data center clusters are currently located in the United States, Europe, East Asia, and South America. As a result, the regions most affected by this trend are the Transatlantic, Transpacific, and Americas regions. (SubTel Forum Analytics Division of Submarine Telecoms Forum, Inc., 2020)
REGIONAL SNAPSHOT:
Current Systems: 19
Capacity: 970 Tbps
Planned Systems: 4
Planned Capacity: 782 Tbps
TRANSATLANTIC REGION
ANALYTICS
[Reprinted from SubTel Forum 2022/2023 Submarine Industry Report]
REGIONAL ANALYSIS AND CAPACITY OUTLOOK | TRANSATLANTIC REGION
9.1.1 CURRENT SYSTEMS
Growth on the Transatlantic route skyrocketed from the late 1990s through 2003. After a 12-year drought, the Transatlantic region added a new cable every year from 2015 to 2018. After a brief respite in 2019, the Transatlantic region is back to pushing forward with strong momentum. (Figure 79)
Two major causes of the development slowdown were a glut of capacity and the financial crash of the early 2000s which was brought on by overinvestment in the submarine cable industry. With investment on the rise again, and systems aging out in the Transatlantic route, new systems are beginning to come online. The MAREA system installed in 2017 tapped into the exploding demand from Hyperscalers, with one of the key selling points being massive bandwidth available — 200 Tbps potential — on a modern submarine fiber system on a route full of aging cables. Additionally, this cable – along with Dunant cable installed last year — provide an alternative path to increase route diversity, and more directly connect Europe to important data centers in Ashburn, Virginia. The SACS and SAIL cables installed in 2018 potentially indicated an increased desire to South America and Africa directly but this has not seen sustained momentum. Additionally, to further connect South America with other areas of the world, 2021 saw the addition of the EllaLink system that branches across other areas of the continent before traveling north to Europe.
Due to increasing capacity demands along the north Transatlantic between New York and Europe and the desire for new connections to the Mid-Atlantic of the
United States and across the South Atlantic, the Transatlantic route has enjoyed steady growth with two Hyperscaler systems – Grace Hopper and Amitié – entering service this year.
9.1.2 FUTURE SYSTEMS
During the initial boom of Transatlantic system development, the average system length was 12,000 kilometers with most systems taking similar routes between Europe and the US. Overall, this average has gone down significantly with the average length of Transatlantic planned systems now as low as 8,000 kilometers. This has been due to the new Hyperscaler systems that seek to provide more direct routes between their data center facilities rather than worrying about connecting to a major city first.
RFS YEAR SYSTEM CAPACITY (TBPS) LENGTH (KMS) 2015 EXA Express 53 4600 2016 AEC-1 78 5536 2017 MAREA 209.6 6600 2018 SACS 32 6000 2018 SAIL 40 6209 2020 HAVFRUE/AEC-2 108 7300 2021 EllaLink 72 9300 2021 Dunant 250 6600 10 15 20 25 2025 2024 2023 2022 2021 2020 2019 2018 2017 2016 2015 2014 2013 2012
TABLE 5: TRANSATLANTIC SYSTEMS, 2012-PRESENT
FIGURE 79: IN SERVICE & PLANNED TRANSATLANTIC SYSTEMS 2012-2025
REGIONAL ANALYSIS AND CAPACITY OUTLOOK | TRANSATLANTIC REGION
Figure 79: In-Service & Planned Transatlantic Systems, 2012-2025
While there was a notable rise in demand for routes away from the traditional New York-London, the Amitié and Grace Hopper cables created additional connections along this route, highlighting its continued importance. (Figure 80) The change in customer requirements from purely bandwidth to bandwidth and low latency has driven developers to plan routes averaging 18 percent shorter than previous systems from the early 2000s. New systems in the Transatlantic boast significant capacity increases with both systems entering service this year adding a combined 670 Tbps – increasing the existing Transatlantic capacity by nearly 70 percent.
There are currently four planned systems set to be ready for service for the period 2022 to 2025 in the Transatlantic region. Two of these systems follow the traditional route between Europe and the United States, showing that this connection still has great importance despite changing network trends. Another planned system stretches from Virginia Beach, Virginia in the United States all the way to South Africa. The last planned system for the Transatlantic connects Northern Canada to Norway, blazing an entirely new trail.
Three of the four planned Transatlantic systems have achieved the all-important CIF milestone. (Figure 81) This indicates growth in this region continues to remain strong. Considering the amount of data that travels between Europe and North America, this is very unlikely to change moving forward.

RFS YEAR SYSTEM CAPACITY (TBPS) LENGTH (KMS) 2022 Grace Hopper 352 7191 2022 Amitie 322 7292 2023 SAEX West 108 14720 2024 Leif Erikson 4100 100,000 150,000 200,000 2025 2024 2023 2022 2021 2020 2019 2018 2017 2016 2015 2014 2013 2012
TABLE 6: TRANSATLANTIC PLANNED SYSTEMS
No Yes
FIGURE 80: TOTAL KMS IN SERVICE & PLANNED TRANSATLANTIC SYSTEMS 2012-2025
75% 25%
FIGURE 81: CONTRACT IN FORCE - TRANSATLANTIC 2022-2025
Figure 80: Total KMs In-Service & Planned – Transatlantic, 2012-2025
Figure 81: Contract in Force – Transatlantic, 2022-2025
The Transpacific market had historically been like that of the Transatlantic, showing little growth year-upon-year. Just like the Transatlantic, however, the Transpacific region has seen a noticeable uptick in activity recently. Hyperscalers and those seeking route diversity have been the primary drivers behind new system growth in this region.
REGIONAL SNAPSHOT:
Current Systems: 15
Capacity: 742 Tbps
Planned Systems: 9
Planned Capacity: 1112 Tbps
TRANSPACIFIC REGION
REGIONAL ANALYSIS AND CAPACITY OUTLOOK | TRANSPACIFIC REGION
9.2.1 CURRENT SYSTEMS
From 2002 to 2016, only four systems were added to the region. (Figure 82) The industry crash of the early 2000s certainly played a large part in this limited growth, but the fact that there had been no new systems on the Transpacific routes from 2010 to 2016 is largely due to existing systems being able to upgrade their capacity for relatively little cost and push potential competitors out of the market.
As with the Transatlantic market, until very recently the Transpacific has been almost fully saturated, with little room for growth other than route diversity and cutting down on existing latency. Lately, however, new systems are being explored in a similar manner to the Transatlantic with the region seeing at least one new cable every year since 2016, with a similar pause in 2019 and an additional pause in 2021. Demand from Hyperscalers, desire for route diversity and replacement of aging infrastructure are the primary drivers behind these newer Transpacific systems. As a result, several new systems are planned through to 2025.
9.2.2 FUTURE SYSTEMS
No systems were added at all to this region from 2010 to 2016. Since then, the region has experienced steady growth with at least one system added each year for the period 2016 to 2019 and nine systems planned through 2025.
The amount of cable in the region increased by 79 percent during this period of growth - adding over 120,000 kilometers of cable between 2016 and 2020. (Figure 83)
Average system length in the region is just over 15,400 kilometers, owing to the Transpacific region having some of the longest routes in the world. Between the massive systems required to span the region, and the easy availability of cheap capacity upgrades, the historically static nature of the region comes as no surprise. Recently, however, there has been a noticeable uptick in system activity driven by the large increase in bandwidth demand brought about by Hyperscalers and the continued adoption of cloud services.
There are currently nine planned systems set to be ready for service for the period 2022 to 2025 and 44 percent of them have achieved the CIF milestone – down only slightly from last year’s 50 percent. (Figure 84) Nearly all these systems are trying to bring large capacity increases along their respective routes, but many of them
TABLE 7: TRANSPACIFIC SYSTEMS, 2012-PRESENT
Figure 82: In-Service & Planned Systems – Transpacific, 2012-2025RFS YEAR SYSTEM CAPACITY (TBPS) LENGTH (KMS) 2016 Faster 60 11629 2017 SEA-US 35 14500 2018 Hawaiki 85 15000 2018 NCP 70 13618 2020 PLCN 144 12900 2022 Jupiter 60 14577 2022 Southern Cross NEXT 72 15840 5 10 15 20 25 2025 2024 2023 2022 2021 2020 2019 2018 2017 2016 2015 2014 2013 2012
REGIONAL ANALYSIS AND CAPACITY OUTLOOK | TRANSPACIFIC REGION
FIGURE 82: IN SERVICE & PLANNED TRANSPACIFIC SYSTEMS 2012-2025
are directly competing along the same or similar routes. With the average system length of all planned systems for the Transpacific market at just over 13,850 kilometers shorter route lengths and lower latency are also important factors for new systems.
These new systems provide a bonus of increased route diversity – especially along the southern part of the region. A few of the systems that are not yet CIF are backed by Hyperscalers. This takes them out of direct competition with other planned systems and removes some of the financial risk from having to sign on outside investors. As development in the Transpacific has seen renewed interest brought on by increased bandwidth demand from cloud services, expect this region to see similarly high rates of growth as the Transatlantic.
TABLE
 Figure 83: Total KMs In-Service & Planned – Transpacific 2012-2025
Figure 84: Contract in Force – Transpacific, 2022-2025
Figure 83: Total KMs In-Service & Planned – Transpacific 2012-2025
Figure 84: Contract in Force – Transpacific, 2022-2025
RFS YEAR SYSTEM CAPACITY (TBPS) LENGTH (KMS) 2022 H2 Cable 20 10500 2022 CAP-1 108 11806 2023 Echo 144 17184 2023 TOPAZ 240 7000 2023 ACC-1 - 18000 2024 HCS - 13180 2024 Bifrost - 15000 2024 JUNO 360 10000 2025 Hawaiki Nui 240 22000 150,000 200,000 250,000 300,000 350,000 400,000 2025 2024 2023 2022 2021 2020 2019 2018 2017 2016 2015 2014 2013 2012
8: TRANSPACIFIC PLANNED SYSTEMS
No Yes
FIGURE 83: TOTAL KMS IN SERVICE & PLANNED TRANSPACIFIC SYSTEMS 2012-2025
44% 56%
FIGURE 84: CONTRACT IN FORCE - TRANSPACIFIC 2022-2025
REGIONAL SNAPSHOT:
Current Systems: 83
Capacity: 1109 Tbps
Planned Systems: 14
Planned Capacity: 1112 Tbps
AMERICAS REGION
REGIONAL ANALYSIS AND CAPACITY OUTLOOK | AMERICAS REGION
9.3.1 CURRENT SYSTEMS

Characterized by steady growth since the early 1990s, the Americas region has continued to enjoy frequent additions over the last 10 years – going from 53 cables in 2012 to 83 cables in 2022.
After 10 years of steady growth, with an average of about two systems being ready for service per year, the region is currently undergoing another boom in development with seven systems implemented in 2019, four in 2020, four in 2021, and three additional systems to be ready for service by the end of 2022. (Figure 85)
9.3.2 FUTURE SYSTEMS
Unlike most of the other markets, the Americas region has consistently observed medium to high levels of growth.
Since 2005, new cable development has consistently added an average of 5 percent more kilometers per year. Departing from this trend, there was a 7 percent increase in 2009, a 10 percent increase in 2014, an 11.7 percent increase in 2017 and a 6 percent increase in 2019. The region has seen steady growth until 2017 when an unprecedented 11.7 percent growth rate was observed. Since 2019, average kilometers added has remained at around 5 percent growth annually and there is no indication this will change significantly. (Figure 86)
There are currently 14 systems planned through to 2025 and 64 percent of those cables have achieved their CIF milestone. (Figure 87) This indicates there is continued potential for steady growth in this region. However, with increasing economic and political instability throughout the Americas, there is a possibility – though small – that some planned systems may come across additional difficulties as they progress through their development process.
REGIONAL ANALYSIS AND CAPACITY OUTLOOK | AMERICAS REGION 5 10 15 20 25 2025 2024 2023 2022 2021 2020 2019 2018 2017 2016 2015 2014 2013 2012
150,000 200,000 250,000 300,000 2025 2024 2023 2022 2021 2020 2019 2018 2017 2016 2015 2014 2013 2012
FIGURE 82: IN SERVICE & PLANNED TRANSPACIFIC SYSTEMS 2012-2025
No Yes 36% 64%
FIGURE 86: TOTAL KMS IN SERVICE & PLANNED AMERICAS SYSTEMS 2012-2025
FIGURE 87: CONTRACT IN FORCE - AMERICAS 2022-2025
Figure 85: In-Service & Planned Systems – Americas, 2012-2025
Figure 86: Total KMS In-Service & Planned – Americas, 2012-2025
Figure 87: Contract in Force – Americas, 2022-2025
TABLE 9: AMERICAS SYSTEMS, 2012-PRESENT
RFS YEAR SYSTEM CAPACITY (TBPS) LENGTH (KMS) 2012 Estrecho de Magallanes 1.8 37 2012 AUTA - 53 2012 TERRA SW -2012 TT-1 - 48 2013 ALBA-1 5.12 1600 2013 LCMSSCS - 322 2013 Saint Thomas - Saint Croix System - 183 2014 AMX-1 50 17800 2015 PCCS 45 6000 2015 FOS Quellon-Chacabuco - 350 2015 Segunda FOS Canal de Chacao - 40 2016 Guantanamo Bay Cable - 1500 2016 Lynn Canal Fiber - 138 2016 Sea2Shore - 32 2017 Monet 60 10556 2017 Tannat 90 2000 2017 Junior - 390 2017 Seabras-1 72 10750 2017 SEUL - 24 2018 BRUSA 160 11000 2018 Saint Pierre and Miquelon Cable - 200 2019 Curie 72 10476 2019 Crosslake Fibre 2400 62 2019 Guantanamo Bay Cable 2 - 1200 2019 Kanawa 10 1746 2019 CARCIP - 225 2019 RedeIlhabela-1 - 3 2019 X-Link Submarine Cable - 775 2020 Tannat Extension 902020 FOA 16 2900 2020 KetchCan1 23.04 167 2020 GCIS - 118 2021 Malbec 108 2600 2021 SPSC/Mistral 132 7300 2021 Curie Panama Extension 72 1073 2021 Prat 9.6 3550
REGIONAL ANALYSIS AND CAPACITY OUTLOOK | AMERICAS REGION
TABLE 10: AMERICAS PLANNED SYSTEMS
RFS YEAR SYSTEM CAPACITY (TBPS) LENGTH (KMS) 2022 WALL-LI - 125 2022 GigNet-1 - 1200 2022 SeaLink - 214 2023 Galapagos Subsea System 20 1280 2023 Connected Coast - 3400 2023 AU-Aleutian - 860 2023 Boriken Submarine Cable System 670 2023 Confluence-1 500 2571 2023 Firmina -2023 Cuba to Martinique - 2470 2023 SednaLink - 1904 2023 CSN-1 - 4500 2024 CX 20 3472 2024 Deep Blue One 12 2000
UNLIKE MOST OF THE OTHER MARKETS, THE AMERICAS REGION HAS CONSISTENTLY OBSERVED MEDIUM TO HIGH LEVELS OF GROWTH.
REGIONAL SNAPSHOT:
Current Systems: 105
Capacity: 1161 Tbps
Planned Systems: 19
Planned Capacity: 1039 Tbps
AUSTRALASIA REGION
REGIONAL ANALYSIS AND CAPACITY OUTLOOK | AUSTRALASIA REGION 84 SUBMARINE TELECOMS INDUSTRY REPORT REGIONAL ANALYSIS AND CAPACITY OUTLOOK | AUSTRALASIA REGION
9.4.1 CURRENT SYSTEMS
The AustralAsia market has been characterized by a massive amount of growth in a relatively short amount of time. Since 2008, it has been one of the busiest regions in the entire world – only seeing three years with reduced expansion, from 2010 to 2012.
Growth from 2001 to 2005 was negligible, and while there was a moderate amount of activity in 2006, the real growth spurt occurred from 2008 to 2009. (Figure 88) The biggest factor contributing to growth in the region is emerging markets in Southeast Asia, with countries such as Indonesia, Singapore, and Hong Kong being the recipients of new data center growth as mentioned in section 1.4 of this report.
The industry crash of the early 2000s certainly influenced the later timing of the region’s boom, but the rising markets of Southeast Asia and their ardent desire for international connectivity overrode such concerns. The widespread adoption of mobile and cloud services throughout the region combined with the recent surge of Hyperscaler driven systems promises to sustain growth in the region for the foreseeable future.
9.4.2 FUTURE SYSTEMS
After the huge growth spurt from 2008 to 2009, the AustralAsia market has seen a steady amount of growth in the amount of cable added per year.
Since 2012, the region has seen an average of 17,000
TABLE 11: AUSTRALASIA SYSTEMS, 2012-PRESENT
RFS YEAR SYSTEM CAPACITY (TBPS) LENGTH (KMS) 2012 Tonga-Fiji - 827 2012 Cross Straits Cable Network - 21 2012 B3JS - 1031 2013 TPKM-3 -2013 ASE 15.36 7200 2013 SJC 28 8986 2013 GOKI 0.08 4200 2013 TSE-1 6.4 270 2013 BPSCS 19.2 332 2013 JBCS - 40 2014 Western Visayas-Palawan - 300 2014 ICN1 0.32 1259 2014 JIBA - 267 2014 Palawa-Iloilo Cable System - 300 2014 PNG LNG - 200 2014 SBCS - 57 2014 TSCS - 83 2015 BLAST - 250
REGIONAL ANALYSIS AND CAPACITY OUTLOOK | AUSTRALASIA REGION 30 60 90 120 150 2025 2024 2023 2022 2021 2020 2019 2018 2017 2016 2015 2014 2013 2012
Figure 88: In-Service & Planned Systems - AustralAsia 2012-2025
FIGURE 88: IN SERVICE & PLANNED AUSTRALASIA SYSTEMS 2012-2025
2015 SMPCS 40 2000 2015 Far East 1.6 1844 2015 LTCS - 446 2016 APG 54 10400 2016 BALOK - 50 2016 NWCS 12 2100 2016 SEA-ME-WE 5 38 20000 2017 MCT 30 1425 2017 ATISA 7.2 280 2017 Tasman Global Access 20 2300 2017 SKR1M 6 3500 2017 Palapa W - 1725 2017 LBC 9.6 52 2018 Tui Samoa 17.6 1410 2018 SEAX-1 - 250 2018 ASC 60 4600 2018 NATITUA 10 2500 2018 Palapa E - 6878 2018 Palapa M - 2100 2018 SUSP - 127 2018 SSSFOIP 307.2 21 2018 IGG - 5300 2018 JAYABAYA - 915 2018 TDCE 40 390 2019 Indigo West 36 4600 2019 Indigo Central 36 4850 2019 Coral Sea 20 4700 2019 Chuuk-Pohnpei Cable - 1200 2019 PASULI - 40 2019 Tanjun Pandan-Sungai Kakap Cable - 348 2020 JGA North 28.8 2700 2020 Okinawa Cellular Cable 80 760 2020 Manatua One 10 3634 2020 JGA South 36 7000 2020 DAMAI Cable System - 575 2021 MSC 0.1 840 2021 CDSCN 0.8 1824 2021 H2HE 300 675 2021 SKKL LABUAN BAJO-RABA - 152 2022 KSCN - 5457 2022 BaSIC 2 762 2022 BALOM - 146
REGIONAL ANALYSIS AND CAPACITY OUTLOOK | AUSTRALASIA REGION
kilometers added per year, with an average system length of 2,830 kilometers. As submarine cable systems typically require a two-year development cycle from the time they are announced, it is unlikely many systems will be announced for 2024 by the end of this year, and any further system development will occur in 2025 or later.
There are currently 19 planned systems set to be ready for service for the period 2022 to 2025. As is normally the

case with the AustralAsia region, several of these systems are smaller in scope connecting island nations to major hubs while the other cables span large swathes of the region or are backed by Hyperscalers. Of these planned systems, 53 percent are considered CIF – a noticeable increase from last year’s 42 percent. (Figure 90) With more than half of the 19 systems planned through 2025 already CIF, this indicates that the region can still support increased growth.

100,000 200,000 300,000 400,000 500,000 2025 2024 2023 2022 2021 2020 2019 2018 2017 2016 2015 2014 2013 2012 FIGURE
TOTAL
2012-2025 No Yes 47% 53%
89:
KMS IN SERVICE & PLANNED AUSTRALASIA SYSTEMS
FIGURE 90: CONTRACT IN FORCE - AUSTRALASIA 2022-2025
Figure 89: Total KMs In-Service & Planned - AustralAsia 2012-2025
Figure 90: Contract in Force – AustralAsia, 2022-2025
RFS YEAR SYSTEM CAPACITY (TBPS) LENGTH (KMS) 2022 PEACE 192 25000 2022 OAC 39 9800 2022 HK-G 48 3700 2022 SJC2 144 10500 2022 SIGMAR - 2200 2022 Tokelau Domestic Submarine Cable 20 250 2022 PC2 - 110 2022 TLSSC -2022 Gondwana 2 and Picot 2 - 1515 2023 Project Koete 60 800 2023 ADC 140 9800 2023 DJSC 40 1000 2023 PDSCN - 2500 2024 Apricot 190 12000 2024 VCS - 3400 2024 SEA-H2X 160 5000 2025 SEA-ME-WE 6 6 19200
TABLE 12: AUSTRALASIA PLANNED SYSTEMS
THE AUSTRALASIA MARKET HAS BEEN CHARACTERIZED BY A MASSIVE AMOUNT OF GROWTH IN A RELATIVELY SHORT AMOUNT OF TIME. SINCE 2008, IT HAS BEEN ONE OF THE BUSIEST REGIONS IN THE ENTIRE WORLD.
REGIONAL SNAPSHOT:
Current Systems: 199
Capacity: 1920 Tbps
Planned Systems: 23
Planned Capacity: 2348 Tbps
EMEA REGION
90 SUBMARINE TELECOMS INDUSTRY REPORT REGIONAL ANALYSIS AND CAPACITY OUTLOOK | EMEA REGION
9.5.1 CURRENT SYSTEMS
Characterized by steady growth since the early 1990s, Europe, the Middle East and Africa have all seen an increase in development over recent years. This has been one of the most consistent growth regions in the world, owing to its size as well as the important “crossroads” of the Mediterranean Sea and the Suez Canal.
While system count has remained steady – with an average of five systems ready for service every year since 2002 – with 2011 seeing the largest surge of 14 new systems – the actual lengths of these systems can vary. (Figure 91) The primary factor behind these growth spurts are the SEA-ME-WE systems, as well as large coastal systems ringing Africa. In actual number of systems accomplished, the EMEA region is the most consistent region in the world. It has a growth pattern that is seemingly immune to the industry’s boom and bust pattern seen over the past 15 years.
The EMEA region sees a consistent, annual addition of smaller regional systems. These complement the large, multi-region projects like SEA-ME-WE, ACE, EIG, and WACS to name a few. These large projects span multiple regions of the world, rather than smaller, inter-country routes and are the biggest projects the industry tackles. Each system of this kind comes in at well over 10,000 kilometers per route — sometimes beyond 20,000 and 25,000 kilometers. Despite the steady system
count, inter-regional projects like this cause a huge surge in kilometers installed with 2010 to 2012 seeing the most recent growth spurt for the region.
9.5.2 FUTURE SYSTEMS
As mentioned previously, the EMEA region is uniquely characterized as a region of steady activity, with bursts of highly ambitious, region-spanning systems every few years.
The rate of kilometers added per year shows an average increase of 4.1 percent annually since 2012. Recent bursts of eighter percent, nine percent, and 12 percent have been observed in 2016, 2017, and 2012, respectively. However, a significant reduction in growth was seen between
RFS YEAR SYSTEM CAPACITY (TBPS) LENGTH (KMS) 2012 ACE 20 17000 2012 Alasia 25.6 350 2012 Silphium 1.2 426 2012 Solas 0.005 140 2012 WACS 14.5 14350 2012 Emerald Bridge Fibres - 120 2012 Geo-Eirgrid - 187 2012 Libreville-Port Gentil Cable - 198 2012 POI - 400 2012 Tamares North - 345 2012 Loukkos 1.28 187 2013 Scotland-Orkney-Shetland - 400 150 200 250 2025 2024 2023 2022 2021 2020 2019 2018 2017 2016 2015 2014 2013 2012
TABLE 13: EMEA SYSTEMS, 2010-PRESENT
FIGURE 91: IN SERVICE & PLANNED EMEA SYSTEMS 2012-2025
REGIONAL ANALYSIS AND CAPACITY OUTLOOK | EMEA REGION
Figure 91: In-Service & Planned Systems - EMEA 2012-2025
2013 Europa - 0 2013 OMRAN/EPEG Cable System - 600 2014 MENA 57.6 8800 2014 Didon 18 173 2014 FCSS 24 633 2014 BT Highlands and Islands - 402 2014 Isles of Scilly Cable -2014 Kerch Strait Cable - 46 2014 Skagerrak 4 - 137 2001 Tampnet 8 2400 2015 NCSCS 12.8 1100 2015 Malta-Italy Interconnector - 95 2016 C-Lion 1 144 1172 2016 Avassa 16 260 2016 Bodo-Rost Cable - 109 2016 SEA-ME-WE 5 38 20000 2016 NordBalt - 400 2017 AAE-1 80 25000 2017 Ceiba-2 24 290 2017 Greenland Connect North (GCN) 4.8 673 2017 G2A 12 1500 2019 Eastern Light - 420 2019 MainOne Expansion 4 1100 2019 COBRACable - 326 2019 Rockabill - 221 2020 ALVAL/ORVAL 40 800 2020 SkagenFiber 1920 173 2020 BKK Digitek - 195 2020 Dos Continentes 460.8 105 2020 Malta-Gozo Cable - 21 2020 Mandji Fiber Optic Cable - 50 2020 Ultramar GE - 263 2021 NO-UK 216 670 2021 DARE-1 36 4854 2021 CrossChannel Fibre 2400 149 2021 HAVSIL - 120 2021 West Africa Cable - 8300 2021 Scylla - 211 2022 Havhingsten-NSC - 650 2022 Havhingsten-CC-2 300 940 2022 ZEUS 0.6 200 2022 Arsinoe - 3750
the years of 2018 and 2020 at a mere 0.4 percent average increase annually. (Figure 92) The EMEA region is not looking at a considerable drop-off in system activity from 2022 through to 2025, indicating that growth will remain steady for the foreseeable future.
In fact, with a renewed focus from Hyperscalers on countries like Nigeria and South Africa who are booming technologically, large systems like 2Africa from Facebook and Equiano from Google could bring about a new surge in activity to Africa as a whole. As these large Hyperscalers begin to set up hyperscale infrastructure, it will naturally attract other business and more demand for bandwidth between key data center regions like North America and Europe. Both new cable systems promise more than 140 Tbps of bandwidth and will be a huge boon to the west coast of Africa which currently has an average of about 8 Tbps per submarine cable.
There are currently twenty-three systems planned to be ready for service for the period 2022-2025. Currently, 65 percent of these systems have achieved the CIF milestone. (Figure 93) With more half of these systems being considered viable now, the initial impression is positive. Unfortunately, the EMEA region continues to be rife with economic uncertainty and political instability, casting a cloud over any prospective projects – especially in the wake of COVID-19.

Yes No 65% 35%
FIGURE 93: CONTRACT IN FORCE - EMEA 2022-2025
Figure 92: Total KMs In-Service & Planned - EMEA 2012-2025
200,000 300,000 400,000 500,000 2025 2024 2023 2022 2021 2020 2019 2018 2017 2016 2015 2014 2013 2012
Figure 93: Contract in Force – EMEA, 2022-2025
REGIONAL ANALYSIS AND CAPACITY OUTLOOK | EMEA REGION
FIGURE 92: TOTAL KMS IN SERVICE & PLANNED EMEA SYSTEMS 2012-2025
TABLE 14: EMEA PLANNED SYSTEMS
RFS YEAR SYSTEM CAPACITY (TBPS) LENGTH (KMS) 2025 SEA-ME-WE 6 6 19200 2022 PEACE 192 25000 2022 BlueMed 100 1000 2022 Celtic Norse 160 2100 2022 N0R5KE VIKING - 810 2022 HAVTOR 1440 165 2022 SHARE 16 720 2022 IONIAN 360 320 2022 Scotland-Northern Ireland 3 - 42 2022 Scotland-Northern Ireland 4 - 85 2023 2Africa 180 32767 2023 IRIS 18 1750 2023 Africa-1 192 10000 2023 HARP -2023 2Africa Canary Islands Extension -2024 Blue -2024 PISCES - 2971 2024 Raman -2024 MEDUSA 480 8760 2022 Equiano 1442022 Orient Express - 1300 2023 TEAS 300 19000 2024 IEX 2002024 EMIC-1 - 30000
REGIONAL SNAPSHOT:
Current Systems: 34
Capacity: 387 Tbps
Planned Systems: 8
Planned Capacity: 1441 Tbps
INDIAN OCEAN REGION
96 SUBMARINE TELECOMS INDUSTRY REPORT
REGIONAL ANALYSIS AND CAPACITY OUTLOOK | INDIAN OCEAN REGION
9.6.1 CURRENT SYSTEMS
The Indian Ocean region has been on a steady path of development since the boom following the submarine cable industry downturn in the early 2000’s. It has enjoyed mostly consistent growth since 2003 despite its small size, due to it being an important crossroads region between the busier EMEA and AustralAsia regions. The region has experienced periods of rapid development, followed by a brief period of dormancy. The years of growth have been driven by trans-regional systems such as SEA-ME-WE 3, 4 and 5, FLAG, Falcon, and AAE-1 to name a few. This has resulted in three distinct development spikes in 2006-2007, 2009, and 2015-2017. (Figure 94) Local development is largely small systems linking India east to Indonesia or west to the Middle East and beyond, providing new connections for the countries that ring the Indian Ocean.
9.6.2 FUTURE SYSTEMS
With three new systems added in 2017, none in 2018,
two in 2019, two in 2020, and nine systems planned through 2024, new system development will continue at a sporadic pace. This continues to follow the feast-or-famine style of system development that is the historical norm. There have been 1-2 systems added each year since 2019, and the 11 systems planned for the period 2022 to
TABLE 15: INDIAN OCEAN SYSTEMS, 2012-PRESENT
RFS YEAR SYSTEM CAPACITY (TBPS) LENGTH (KMS) 2012 LION-2 1.28 3000 2012 Dhiraagu Cable Network - 1253 2012 SEAS 0.02 1930 2016 BBG 55 8040 2016 Avassa 16 260 2016 SEA-ME-WE 5 38 20000 2017 AAE-1 80 25000 2017 NaSCOM 3.2 1086 2019 MARS 16 700 2019 FLY-LION3 4 400 2020 CANI-SMC 25.6 2300 2021 METISS 24 3215 2021 Macho-3 - 606 20 30 40 50 2025 2024 2023 2022 2021 2020 2019 2018 2017 2016 2015 2014 2013 2012
FIGURE 94: IN SERVICE & PLANNED INDIAN OCEAN SYSTEMS 2012-2025
REGIONAL ANALYSIS AND CAPACITY OUTLOOK | INDIAN OCEAN REGION
Figure 94: In-Service & Planned Systems – Indian Ocean 2012-2025
2025 potentially add over 114,000 kilometers of cable. (Figure 95) With Australia looking for more route diversity from its western coast and an increasing desire for connectivity between Asia and Europe, this steady growth could continue beyond 2025. Additionally, Hyperscalers are exploring routes from the United States to India and will potentially bring more system development to the region.
Of the 11 systems planned through 2025 in this region, 36 percent have achieved the CIF milestone. (Fig-
ure 96) The majority of these systems are “passthroughs” looking to connect East Asia to the Middle East and Europe. Business cases for these systems may be difficult to prove given the ongoing political and economic instability in Europe and the Middle East, hampering efforts to secure funding. While these systems would expand route diversity in the region, several are competing, and it is very likely at least some of these systems will not hit their target RFS date.

RFS YEAR SYSTEM CAPACITY (TBPS) LENGTH (KMS) 2022 PEACE 192 25000 2022 OAC 39 9800 2022 Equiano 1442022 Orient Express - 1300 2023 TEAS 300 19000 2024 IEX 2002024 EMIC-1 - 30000 2023 MIST 240 8100 2023 IAX 2002023 SING 18 9000 2023 KLI - 1900 2024 SAEX East 108 11749 No Yes
TABLE 16: INDIAN OCEAN PLANNED SYSTEMS
67% 33%
FIGURE 96: CONTRACT IN FORCEINDIAN OCEAN 2022-2025
150,000 200,000 250,000 300,000 350,000 2025 2024 2023 2022 2021 2020 2019 2018 2017 2016 2015 2014 2013 2012
Figure 96: Contract in Force - Indian Ocean, 2022-2025
FIGURE 95: TOTAL KMS IN SERVICE & PLANNED INDIAN OCEAN SYSTEMS 2012-2025
Figure 95: Total KMs In-Service & Planned - Indian Ocean 2012-2025
REGIONAL SNAPSHOT:
Current Systems: 3
Capacity: 60 Tbps
Planned Systems: 3
Planned Capacity: Not Announced
POLAR REGION
REGIONAL ANALYSIS AND CAPACITY OUTLOOK | POLAR REGION
9.7.1 CURRENT SYSTEMS
The first true Polar submarine fiber system in industry history was installed in 2017. Previous systems, such as Svalbard, had only ever brushed the Polar region. At 1,200 kilometers over six landing points, Quintillion Subsea marked the first successful and fully Polar submarine fiber system in the world.
Interest in Polar projects has been at an all-time high the past few years, as cable developers are looking to take advantage of the dramatically shorter routes between Europe, North America and Asia that can be achieved through the Polar Circle. The Quintillion Subsea system has proven that a fully Polar system can be done for future systems that look to tackle this particularly difficult region. (Figure 97)
Polar systems have particular challenges to overcome during their development cycle, and only have small windows of time throughout the year during which work can be accomplished. This both extends the development timeline and increases the cost.
9.7.2 FUTURE SYSTEMS
These systems are focused on routes in the far north of Canada, linking up local communities or bridging the gap between Europe and Asia. Far North Fiber is an attempt to link Europe to Japan and points in between by going over the top of Russia.
One of the main goals for Polar systems connecting Europe to Asia is to dramatically reduce existing latency. Currently, data must either go through the United States, or through the Suez Canal an d Indian Ocean. This has required systems totaling at least 20,000 kilometers in the past. However, future Europe to Asia Polar routes is planned for about 14,000 kilometers — poten-
tially cutting latency by almost half. Additionally, systems exploring Polar routes avoid the troubled Middle East region and circumvent potential privacy concerns in the United States. (Figure 98)
TABLE 17: POLAR 2010-PRESENT
RFS YEAR SYSTEM CAPACITY (TBPS) LENGTH (KMS) 2017 Quintillion Subsea 30 1200 2022 EAUFON 30 1800 REGIONAL ANALYSIS AND CAPACITY OUTLOOK | POLAR REGION 0 1 2 3 4 5 6 2025 2024 2023 2022 2021 2020 2019 2018 2017 2016 2015 2014 2013 2012
0 5,000 10,000 15,000 20,000 25,000 2025 2024 2023 2022 2021 2020 2019 2018 2017 2016 2015 2014 2013 2012
FIGURE 97: IN SERVICE & PLANNED POLAR SYSTEMS 2012-2025
FIGURE 98: TOTAL KMS IN SERVICE & PLANNED POLAR SYSTEMS 2012-2025
Figure 97: In-Service & Planned Systems - Polar 2012-2025
Figure 98: Total KMs In-Service & Planned - Polar 2012-2025
Of the three systems planned for the Polar region through 2025, none have achieved the CIF milestone. This speaks to the difficulty of Polar projects in general, and the inherently risky and more costly investment opportunities they represent. As this region is still largely being explored in general, there is hope that continued efforts can finally break the ice so to speak and allow for a consistent way to implement projects throughout the Polar region.
Looking beyond 2025, there is a project in the very early exploration stage that looks to connect South America or New Zealand to research bases in Antarctica. As this will more than likely be a government backed infrastructure project, it should have a much better chance of succeeding as commercial viability concerns do not apply. Connecting Antarctic research stations to high capacity, low latency fiber telecoms would be a huge boon to ongoing scientific efforts in the area and allow for much better collaboration and information sharing.
TABLE 18: POLAR PLANNED SYSTEMS

RFS YEAR SYSTEM CAPACITY (TBPS) LENGTH (KMS) 2024 Katittuq Nunavut - 2400 2025 Chile Antartica -2025 Far North Fiber - 14000 2026 Polar Express 104 12650 2027 McMurdo Cable - -
No Yes
100%
FIGURE 99: CONTRACT IN FORCE - POLAR 2022-2025
Figure 99: Contract in Force – Polar 2022-2025
ADVERTISER CORNER
Greetings! I am excited to introduce myself as your new Advertising Sales Representative at SubTel Forum. My name is Bill Spilman, and I will be your primary liaison for all advertising needs, assisting you with ad purchases and placements across our diverse range of print and digital publications.

With over 35 years of professional experience in the industry, I am eager to bring my expertise to serve your advertising needs. As you prepare your marketing strategies for the latter half of 2023, I encourage you to consider the unique advertising opportunity in our upcoming issues of SubTel Forum Magazine. Each issue reaches over 250,000 downloads from the global submarine cable community. More than half of our readers are Middle to Senior Management professionals from 85+ countries, and 60% of them have significant purchasing power within their organizations.
I am ready to provide you with our 2023 media kit, which includes an editorial calendar, advertising rates, upcoming deadlines, and details on ad artwork. I am also available to answer any queries you may have and guide you through the ad space reservation process.
SubTel Forum is the premier digital platform for insights into the submarine cable industry, serving over 150,000 users across 125 countries. By advertising with us, your brand will gain exposure to the industry's movers and shakers. ADVERTISING

104 SUBMARINE TELECOMS FORUM MAGAZINE
REPRESENTATIVE
SALES
Partnership AND Success 2023 SPONSORSHIP OPPORTUNITIES
BILL SPILMAN +1 309.483.6467 BSPILMAN@SUBTELFORUM.COM
SUBTEL FORUM BI-MONTHLY MAGAZINE

The premier publication for the submarine telecoms industry. Each issue is built around a central theme, discussing that specific aspect of the submarine fiber market.
• Over 100,000 downloads per issue
• Two months exposure
SPONSORSHIP BENEFITS:
• Complimentary tile Web Banner on SubTel news feed
• Optional :30 Embedded Video (Full-Page and Two-Page Spread ads only)
• Social Media acknowledgment (LinkedIn, Facebook & Twitter)
• Acknowledgment in announcement Press Release and Mailer
2023 TOPICS & ARTWORK DEADLINES:
January Global Outlook | Art due Jan 2
March Finance & Legal | Art due Mar 6
May Global Capacity | Art due May 1
July Regional Systems | Art due July 3
September Offshore Energy | Art due Sept 4
November Data Centers/New Technology | Art due Nov 6
ART & VIDEO REQUIREMENTS
• Full Page: 8.5” W x 11” H | Half Page: 8.5” W x 5.5” H
• 300 dpi, High-Resolution PDF or JPG with crop marks
• Optional Video: Include blank box in ad design for video over-lay (size: no restrictions)
• Optional Video - 30 seconds
• 1280 × 720 or 1920 × 1080 resolution – mp4 Video File
JULY 2023 | ISSUE 131 105
SUBTEL FORUM IS EXCITED TO PARTNER WITH YOUR BUSINESS ON THE FOLLOWING SPONSORSHIP OPPORTUNITY
INVESTMENT PRICE PER INSERTION 1 Issue 2 Issues 3 Issues 4 Issues 5 Issues 6 Issues 1/2 Page $1,750 $1,700 $1,650 $1,600 $1,550 $1,500 Full Page $3,500 $3,450 $3,400 $3,350 $3,300 $3,250 2 Page Spread $5,000 $4,950 $4,900 $4,850 $4,800 $4,750 1 HALF PAGE AD FULL PAGE AD 2 PAGE SPREAD AD EXAMPLES 8.5” x 5.5” 8.5” x 11” 11” x 17”
SUBTEL FORUM IS EXCITED TO PARTNER WITH YOUR BUSINESS ON THE FOLLOWING SPONSORSHIP OPPORTUNITY
SUBTEL FORUM ALMANAC
Released quarterly and serves as a reference tool for anyone interested in the submarine cable industry. The Almanac features each major international system on its own page, along with a system map, landing points, system capacity, length, RFS year and other valuable data.

• Over 525,000 downloads per issue
• Three months EXCLUSIVE Sponsorship
QUARTERLY INVESTMENT: $5,000
EXCLUSIVE 3-MONTH SPONSORSHIP BENEFITS:
• Full-Page Ad (optional :30 embedded Video) near front of document
• Logo/Link on Cover and acknowledgment on Publication Webpage
• Complimentary tile Web Banner on SubTel news feed
• Social Media acknowledgment (LinkedIn, Facebook & Twitter)
• Acknowledgment in announcement Press Release and Mailer
ART & VIDEO REQUIREMENTS
• Full Page: 8.5” W x 11” H
• Add an additional .125” all the way around if you’d like your ad to bleed
• 300 dpi, High-Resolution PDF or JPG with crop marks
• Optional Video: Include blank box in ad design for video over-lay (size: no restrictions)
• Optional Video - 30 seconds
• 1280 × 720 or 1920 × 1080 resolution – mp4 Video File
ARTWORK DEADLINES:
February/March/April Issue Art due Feb 6
May/June/July Issue Art due May 8
August/September/October Issue Art due Aug 7
November/December/January Issue Art due Nov 13
106 SUBMARINE TELECOMS FORUM MAGAZINE
SUBMARINE
ISSUE 43 AUGUST 2022 2
CABLE ALMANAC
SUBTEL FORUM IS EXCITED TO PARTNER WITH YOUR BUSINESS ON THE FOLLOWING SPONSORSHIP OPPORTUNITY
SUBTEL FORUM INDUSTRY REPORT 3

Updated annually, the Report provides the most accurate, comprehensive data on the submarine fiber market. The analysis of data includes system capacity analysis as well as the actual productivity and outlook of current and planned systems and the companies that service them.
• Over 560,000 downloads per issue
• One-year exposure
YEARLY INVESTMENT: $4,250
SPONSORSHIP BENEFITS:
• Two-page Spread Ad
• Complimentary Tile Web Banner on SubTel news feed
• Social Media acknowledgment (LinkedIn, Facebook & Twitter)
• Acknowledgment in announcement Press Release and Mailer
ART & VIDEO REQUIREMENTS
• Full Page: 8.5” W x 11” H | Art due Oct 2
• Add an additional .125” all the way around if you’d like your ad to bleed
• 300 dpi, High-Resolution PDF or JPG with crop marks
• Optional Video: Include blank box in ad design for video over-lay (size: no restrictions)
LOCK IN NOW FOR 2023!
Sponsors can lock into a specific category below. First come-first served!
• Global Overview
• History of Submarine Telecoms
• System Growth
• Out of Service Systems
• Evolution of System Ownership and Customer Base
• Capacity Ownership
• Financing Analysis
• Historic Financing Perspective
• Regional Distribution of Financing
• Current Financing
• Supplier Analysis
• System Suppliers
• Installers
• Surveyors
• Recent Mergers, Acquisitions, and Industry Activities
• System Maintenance
• Publicity
• Reporting Trends & Repair Times
• Club Versus Private Agreements
• Cable Ships
Note: Subtel Forum reserves the right to change categories
• Current Cable Ships
• Shore-End Activity
• Market Drivers and Influence
• Hyperscalers
• Data Centers
• Special Markets
• Offshore Energy
• Unrepeatered Systems
• Sustainability
• Regional Market Analysis and Capacity Outlook
• Transatlantic Regional Market
• Transpacific Regional Market
• Americas Regional Market
• AustralAsia Regional Market
• EMA Regional Market
• Indian Ocean Pan-East Asian Regional Market
• Polar Regional Market
JULY 2023 | ISSUE 131 107
SUBTEL FORUM IS EXCITED TO PARTNER WITH YOUR BUSINESS ON THE FOLLOWING SPONSORSHIP OPPORTUNITY



SUBTEL FORUM PRINT CABLE MAP
Add your Logo to this beautiful, large format print map which showcases every major international submarine cable system, and we are proud to say, hangs in many offices in our industry.
• Only 22 spaces available!
• Over 3,500 distributed
• PTC '24 and SNW '24 Conferences Distribution
• Art Deadline| November 3
YEARLY INVESTMENT: $4,500
SPONSORSHIP BENEFITS:
• Complimentary tile Web Banner on SubTel news feed

• Social Media acknowledgment (LinkedIn, Facebook & Twitter)
• Acknowledgment in announcement Press Release and Mailer
• 25 Complimentary copies for Sponsor
108 SUBMARINE TELECOMS FORUM MAGAZINE
4
78 32 23 20 16 15 13 2 Myanmar Niger Nigeria Papua New Angola of Congo Germany Algeria Ethiopia Unity Faster PPC-1 WACSSEA-ME-WE ManatuaOne SAM-1 SAM-1 Intra-Asia APCN-2 Falcon SAT-3 SAT-3-FEA WACS WACS Atlantis-2 Atlantis-2 Atlantis-2SEA-ME-WE SEA-ME-WE EllaLink EASSySEACOM MainOne MainOne HawkSEA-ME-WESEA-US Hantru-1 MAYA-1 GOKI SouthernCrossNEXT SouthernCrossNEXT SEA-ME-WE EllaLink DARE-1 EAC-C2C Southern NEXTNorth/South SPSC/Mistral I-ME-WE SAFE ACE Americas GLO-1 GLO-1 GLO-1 EAC-C2C LION-2 TGNEurasia AAE-1 MENA ACE PAN-AM Hawaiki I-ME-WE AlaskaUnitedWest Hawaiki Northstar PPC-1Americas North PCCS ASE BRUSA BRUSA Arsinoe GlobeNet SAM-1 Endeavour AKORN Endeavour Japan-US ASH GlobeNet Svalbard Indigo West TEAMS Southern Cross SouthernCross SACS Columbus NCP SouthernCross EXA GreenlandConnect PAC Jupiter TGN Pacific Arcos-1 Columbus Columbus OAC AMX-1 AMX-1 Curie Curie SAM-1Monet Monet Monet Seabras-1 SAC MedNautilus Polar Express SINGSJC2 SAEXEast MIST-ADC Firmina Firmina Firmina CelticNorsePEACE SEA-ME-WE PEACE CSN-1 HawaikiNui Equiano Equiano Equiano H2Cable HopperIAXSIGMAR 2Africa HawaikiNui EMIC-1 2Africa IRIS East 2Africa SAEXWest SAEXWest SAEXWest 2Africa2Africa 2Africa 2Africa EchoTOPAZ Hopper Bifrost Echo 2Africa Hawaiki Hawaiki ACC-1 ACC-1 TEAS TEAS TEAS Polar Express Polar Express NTT WE MARINE India Falcon BBG TGN Gulf GBICS SEA-ME-WE SEA-ME-WE Falcon SEA-ME-WE FEA SEACOM OAC TEAMS Eurasia MENA 2Africa/PEARLS RamanRaman- SEA-ME-WE SING PEACE EMIC-1 TEAS Italy Libya Syria Turkey Herzegovina Egypt SEA-ME-WE North Alexandros MedNautilus AAE-1 HawkI-ME-WE BIOS Jonah Arsinoe PEACE Blue Blue Africa-1 EMIC-1Republic PAN-AM MAYA-1 SAM-1 PCCSPCCS Monet Americas North SAC ALBA-1 SAM-1 Columbus PAC AmericasColumbusArcos-1 CSN-1 Firmina Falcon MENA SEA-ME-WE SEA-ME-WE TGN Eurasia FEA EIG-EACO PEACE Africa-1SaudiVision Cable2Af 2Africa Raman Raman EMIC-1 TEAS 73 China SEA-ME-WE AAGSJC RNAL ASE APG AAE-1 APG EAC-C2C TGN Intra-Asia Jasuka SCAN ALC ADC SJC2 SEA-H2X SEA-H2X A CLOSER LOOK RED SEA SOUTHEAST ASIA MEDITERRANEAN GULF INDIAN OCEAN CARIBBEAN SUBMARINE CABLES OF THE WORLD Indian Ocean TOP DATA CENTER PROVIDER FACILITY COUNT POLAR BY THE NUMBERS SUBMARINE CABLE SYSTEM INVESTMENT 2013-2022 REGIONAL DISTRIBUTION SUBMARINE CABLE SYSTEM INVESTMENT 2023-2026 REGIONAL DISTRIBUTION OF NEW CABLE, 2023-2026 2023 MAP LEGEND LANDINGS (1,099) DATA CENTER CLUSTERS IN-SERVICE (383) PLANNED (65)
SUBTEL FORUM IS EXCITED TO PARTNER WITH YOUR BUSINESS ON THE FOLLOWING SPONSORSHIP OPPORTUNITY
SUBTEL FORUM ONLINE CABLE MAP
Built with the industrystandard Esri ArcGIS platform and linked to the SubTel Forum Submarine Cable Database, the Subtel Forum Online Cable Map tracks the progress of:

• 550 Current & Planned Cable Systems
• 1,500+ Landing Points
• 1,700+ Data Centers
• 53 Cable Ships
• Systems are also linked to SubTel Forum’s News Now Feed, allowing viewing of current and archived news details
• If you haven’t had the chance, use this link to the Online Cable Map to explore our many features
12-MONTH EXCLUSIVE SPONSORSHIP INVESTMENT: $35,000
SPONSORSHIP BENEFITS:
• 12-Month Exclusive Sponsorship of the Online Map
• Your Logo/Link on every page
• 75-word Company Description of company Announcement
• Complimentary tile web banner (visible on SubTel news feed)
• Social media acknowledgment (LinkedIn, Facebook & Twitter)
• Acknowledgment in announcement Press Release and mailer
JULY 2023 | ISSUE 131 109
5

110 SUBMARINE TELECOMS FORUM MAGAZINE FEATURE MARCH 2021 | ISSUE 117 110 COMING NEXT ISSUE! YOU CAN BE A PART OF OUR NEXT ISSUE! SUBMIT AN ARTICLE contact editor@subtelforum.com SPONSOR AN ADVERTISEMENT contact sales@subtelforum.com