SUBMARINE TELECOMS
FORUM ISSUE 106 | MAY 2019
GLOBAL CAPACITY
EXORDIUM FROM THE PUBLISHER
WELCOME TO ISSUE 106, OUR GLOBAL CAPACITY/ POST SUBOPTIC 2019 WRAP-UP EDITION! WHAT A SHOW…
S
ubOptic 2019 was the tenth in the industry defining submarine telecoms conference series and it was held in New Orleans USA on 8-11 April 2019 at the New Orleans Marriott in New Orleans, Louisiana USA. A triennial Conference, SubOptic is the longest running and most comprehensive conference series in the
2 SUBMARINE TELECOMS MAGAZINE
world for the submarine fiber industry. Ciena was the Host Sponsor for the conference and the new SubOptic Association developed an outstanding world-class program. Attendance at SubOptic 2019 surpassed that of the five previous SubOptic conferences, namely SubOptic 2004 in Monaco, SubOptic 2007 in Baltimore, SubOptic 2010 in Yokohama, SubOptic 2013 in Paris and SubOptic 2016 in Dubai. With a record-breaking attendance of 908 representatives from 283 organizations and some 50 countries – a 46% growth since 2016 in Dubai – SubOptic 2019 has solidified the Association’s position in our submarine cable industry going forward. This year’s theme “To the Beach and Beyond – Rethinking Global Networks” represented the industry challenges of data driven bandwidth and the associated explosion of data centers dislocated from the traditional telco PoPs and their impact on the limits of the physical infrastructure, and the consequences of the shift from telephony to data and the rapid repositioning of PoPs in both a physical and global sense. With over 120 world-class presenters, the program provided valuable learning opportunities to the audience. Overall feedback was very positive, with most commending the quality and range of attendees, excellence of both speakers and content, and unparalleled networking opportunities. SubOptic 2019 utilized three-track format in the conference agenda, with new topics introduced, such as Oil & Gas and Special Markets. The format was well-received, attracting new industry players and providing options for continual engagement throughout the four days.
A Publication of Submarine Telecoms Forum, Inc. www.subtelforum.com ISSN No. 1948-3031 PRESIDENT & PUBLISHER: Wayne Nielsen | wnielsen@subtelforum.com
Response to this year’s pre-conference activities was excellent with record-breaking attendance for the six Masterclasses – “Advancements in Marine Installation and Maintenance,” “Legal and Regulatory Developments,” “Open Submarine Networks,” “Principles of Offshore Oil & Gas Submarine Telecoms,” “Updates to Transmission Technology,” and “Wet Plant Design and Qualification.” SubTel Forum Continuing Education Certificates were forwarded to some 1,200 Masterclass participants. Attendees also enjoyed an unforgettable evening marching in a New Orleans-style jazz parade and attending the Mardi Gras Gala at the world-famous Antoine’s Restaurant. For the first time ever, all the Technical Sessions, Masterclasses and Keynotes are available online and on demand. Whether you missed a session you wanted to see or could not attend SubOptic at all, you can now see practically everything from this amazing, content packed conference. SubTel Forum’s sister company, STF Events, was committed to providing an effective platform for the industry and as such, strove to deliver a truly memorable SubOptic 2019 reminiscent of the 1993 Versailles conference. We hope you’ll agree that we succeeded in doing so. As usual, we also have some excellent articles on a wide range of ideas in this edition, including our three SubTel Forum Excellence in Innovation Awardee papers and poster from SubOptic 2019. STF Good reading,
Wayne Nielsen Publisher
VICE PRESIDENT: Kristian Nielsen | knielsen@subtelforum.com SALES: Teri Jones | tjones@subtelforum.com | [+1] (703) 471-4902 EDITOR: Stephen Nielsen | snielsen@subtelforum.com DESIGN & PRODUCTION: Weswen Design | wendy@weswendesign.com DEPARTMENT WRITERS: Christopher Noyes, Stephen Nielsen, Kieran Clark, Kristian Nielsen, Stuart Barnes and Wayne Nielsen FEATURE WRITERS: Andrzej Borowiec, Charles Laperle, David Walters, Diana Hernandez, Eric Handa, Henry Lancaster, Ian Watson, John Tibbles, Jonathan Liss, Kylie Wansink, Laurie Miller, Leo Foulger, Michael Reimer, Mohamed Ahmed, Olivier Courtois, Pascal Pecci, Peter Worthington, Priyanth Mehta, Richard Kram, Sandra Feldman and Shreya Gautam NEXT ISSUE: JULY 2019 – Regional Systems
Submarine Telecoms Forum, Inc. www.stf-inc.com BOARD OF DIRECTORS: Margaret Nielsen, Wayne Nielsen and Kristian Nielsen
STF Events, Inc. www.stfevents.com CONFERENCE DIRECTOR: Christopher Noyes | cnoyes@stfevents.com | [+1] (703) 468-0554
STF Analytics, Division of SubTel Forum, Inc. www.stfanalytics.com LEAD ANALYST: Kieran Clark | kclark@subtelforum.com | [+1] (703) 468-1382
Contributions are welcomed and should be forwarded to: pressroom@subtelforum.com. Submarine Telecoms Forum magazine is published bimonthly by Submarine Telecoms Forum, Inc., and is an independent commercial publication, serving as a freely accessible forum for professionals in industries connected with submarine optical fiber technologies and techniques. Submarine Telecoms Forum may not be reproduced or transmitted in any form, in whole or in part, without the permission of the publishers. Liability: While every care is taken in preparation of this publication, the publishers cannot be held
responsible for the accuracy of the information herein, or any errors which may occur in advertising or editorial content, or any consequence arising from any errors or omissions, and the editor reserves the right to edit any advertising or editorial material submitted for publication. New Subscriptions, Enquiries and Changes of Address 21495 Ridgetop Circle, Suite 201, Sterling, Virginia 20166, USA, or call [+1] (703) 444-0845, fax [+1] (703) 349-5562, or visit www.subtelforum.com. Copyright © 2019 Submarine Telecoms Forum, Inc.
V O I C E O F T H E I N D U S T RY
SUBMARINE TELECOMS
FORUM ISSUE 106 | MAY 2019
CONTEN TS features
12
A GLOBAL RISE IN SUBMARINE CABLES By Kylie Wansink and Henry Lancaster
15
13 QUESTIONS WITH AMBER CASE
20
DARE1 SUBSEA CABLE By Mohamed Ahmed
24
FORECASTING DEMAND FOR SUBSEA CAPACITY By John Tibbles
4 SUBMARINE TELECOMS MAGAZINE
30
PARTNERSHIPS AND PROACTIVITY ARE THE KEYS TO ENDURING SUCCESS By Laurie Miller
36
TRANS-PACIFIC MARKET CAPACITY By Eric Handa
38
SDM: A REVOLUTION FOR THE SUBMARINE INDUSTRY
42
SUBOPTIC 2019 RECAP!
BEHIND THE LENS OF SUBOPTIC 2019 By Diana Hernandez
50
EXCELLENCE AWARD WINNERS
50 56 61
Excellence in Industry Best Poster Award Winner:
EVALUATION AND OPTIMISATION OF THERMAL MANAGEMENT IN HIGH-POWER
Excellence in Industry Best Paper Award Winner:
VALIDATING EMERGING TRANSMISSION TECHNOLOGIES ON SUBMARINE CABLE SYSTEMS
Excellence in Industry Best Newcomer Award Winner
APPLICATION INTERFACES FOR THE RECONFIGURABLE WET PLANT
By Pascal Pecci and Olivier Courtois
departments EXORDIUM........................................................ 2 STF ANALYTICS ................................................. 6 FROM THE PROGRAMME COMMITTEE............... 68
FROM THE CONFERENCE DIRECTOR.................. 72 SUBMARINE CABLE NEWS NOW ...................... 78 ADVERTISER CORNER...................................... 80 MAY 2019 | ISSUE 106
5
ANALYTICS
BY KIERAN CLARK
KEEPING UP THE PACE
B
(in Tbps)
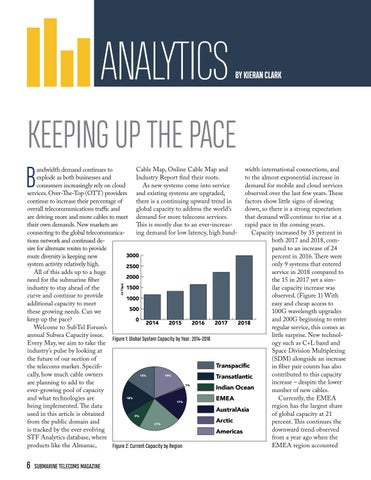
width international connections, and Cable Map, Online Cable Map and andwidth demand continues to to the almost exponential increase in Industry Report find their roots. explode as both businesses and demand for mobile and cloud services As new systems come into service consumers increasingly rely on cloud observed over the last few years. These services. Over-The-Top (OTT) providers and existing systems are upgraded, factors show little signs of slowing there is a continuing upward trend in continue to increase their percentage of down, so there is a strong expectation global capacity to address the world’s overall telecommunications traffic and that demand will continue to rise at a are driving more and more cables to meet demand for more telecoms services. rapid pace in the coming years. This is mostly due to an ever-increastheir own demands. New markets are Capacity increased by 35 percent in ing demand for low latency, high bandconnecting to the global telecommunicaboth 2017 and 2018, comtions network and continued depared to an increase of 24 sire for alternate routes to provide 3000 percent in 2016. There were route diversity is keeping new only 9 systems that entered system activity relatively high. 2500 service in 2018 compared to All of this adds up to a huge 2000 the 15 in 2017 yet a simneed for the submarine fiber 1500 ilar capacity increase was industry to stay ahead of the observed. (Figure 1) With curve and continue to provide 1000 easy and cheap access to additional capacity to meet 500 100G wavelength upgrades these growing needs. Can we and 200G beginning to enter keep up the pace? 0 2014 2015 2016 2017 2018 regular service, this comes as Welcome to SubTel Forum’s little surprise. New technolannual Subsea Capacity issue. Figure 1: Global System Capacity by Year, 2014-2018 ogy such as C+L band and Every May, we aim to take the Space Division Multiplexing industry’s pulse by looking at (SDM) alongside an increase the future of our section of Transpacific in fiber pair counts has also the telecoms market. Specificontributed to this capacity cally, how much cable owners 15% 19% Transatlantic increase – despite the lower are planning to add to the 1% Indian Ocean number of new cables. ever-growing pool of capacity 18% Currently, the EMEA and what technologies are EMEA 17% region has the largest share being implemented. The data AustralAsia of global capacity at 21 used in this article is obtained 9% Arctic percent. This continues the from the public domain and 21% downward trend observed is tracked by the ever evolving Americas from a year ago when the STF Analytics database, where EMEA region accounted products like the Almanac, Figure 2: Current Capacity by Region
6
SUBMARINE TELECOMS MAGAZINE
taking advantage of the shortest paths Transatlantic and Transpacific regions. for 26 percent of total. In previous on the planet. Routes in these regions connect the years, the EMEA region has accountThe AustralAsia and EMEA rethree biggest tech markets in the world ed for a third or more of all global – The Americas, Europe and East Asia. gions should stay relatively the same, capacity. Growth in this region has seeing no surge of new projects nor a As providers like Google, Facebook, slowed down in recent years, while sudden drop in activity. These regions regions like the Americas (19 percent) Microsoft, Amazon, etc. continue to should now be considered stable from work towards directly connecting their and Transatlantic (18 percent) have a capacity growth perspective. data centers, expect any region where been implementing high capacity The Indian Ocean Pan-East Asian these companies have a presence to systems driven by OTT providers. continue to increase bandwidth growth. region will continue see a moderate However, these two regions did not increase in both system activity and While the Transpacific has been grow as much as in 2017 – the Amercapacity growth over the next several relatively quiet for many years, seven icas region only gained 1 percent on years. This region suffers greatly from the global total while the Transatlantic new, high capacity systems are planned being a “passthrough” region, and genthrough 2020. Some of these systems region came down 3 percent. erally only benefits every time a huge are already well underway, and most of The AustralAsia region – historically one of the fastest growing regions – has the others are backed by OTT providers SEA-ME-WE or AAE type system comes through. Even with continued its muted growth the surging economic and pace from one year ago. This technological advancement of region now accounts for 17 Transpacific India, there has not seemed to percent of total, compared to 12% Transatlantic 22% be enough demand to warrant 16 percent at this time last 4% many more cable systems in year. While the rapid growth Indian Ocean this region – though more of the region in previous years 13% EMEA systems are planned for this had been spurred on by conregion over the next several necting various Pacific island AustralAsia 23% years than compared to a year nations, most of these are now 19% Arctic ago. (Figure 3) connected and future projects 7% Activity in the Transatacross the Pacific are shifting Americas lantic will surge, and the focus to the US to East Asia/ Americas region should Australia routes. Figure 3: Planned Capacity by Region, 2019-2021 drop off only slightly despite The Indian Ocean Panthe high amount of activity East Asia region has fallen already observed over the last couor an existing customer base. With an by 2 percent from a year ago while the average system capacity over 75 terabits ple of years. Long term expectations Transpacific region has taken a huge remain positive, as connecting North per second (Tbps) this should result leap forward and now accounts for 15 and South America, and the Americas in the Transpacific region exploding in percent of the global total – up from 7 to Europe and Africa will continue to bandwidth over the next several years. percent last year. (Figure 2) be key parts of any data center infraThe Arctic – which is relatively new With more and more systems being territory only truly explored for the first structure plans. Additionally, cables announced, the STF Analytics realong in these regions – especially time in 2017 – should also experience search team takes note of each region those along the northern Transatlantic a healthy increase in activity. Now that the new systems will touch. routes – will be made with cutting the ability to implement an Arctic The new normal of content and edge technology in mind and allow system has been proven, more eyes are service provider driven cables will confor extremely high capacity cable turning north to conquer latency by tinue to push growth in the Americas, MAY 2019 | ISSUE 106
7
ANALYTICS
BY KIERAN CLARK
(in Tbps)
(in Tbps)
systems. With an average more fiber pairs, this average system capacity of over 110 should continue to increase at 6000 Tbps this region alone will a steady rate. (Figure 5) 5000 add 562 Tbps through 2021. At the end of the day, it Like the Transpacific region, appears that the submarine 4000 many of these cable projects fiber industry will be able to 3000 are already underway and/or keep up with demand. Even 2000 backed by an OTT provider. accounting for some planned With continual technology systems dying off and others 1000 improvements, new systems getting delayed there will 0 2018 2019 2020 2021 can provide ever increasing still be 1,500-2,000 Tbps of amounts of bandwidth over capacity added to the global a single cable. In some cases, Figure 4: Projected Global Capacity by Year, 2018-2021 network by the end of 2021 a single planned system is – a 50 percent increase in a projected to nearly douworst-case scenario. Addi100 ble the entire capacity of a tionally, new technology that region. When combined with is now being made available 80 upgrades to existing systems, allows for some truly masglobal capacity is expected to sive amounts of capacity 60 skyrocket over the next three – over 200 Tbps on a single years. As new wavelength cable in some cases. While technologies like 150G systems typically announce 40 and 200G continue to see 18-24 months out from their commercial implementation RFS date and even though 20 2015 2016 2017 2018 2019 2020 2021 and with 400G about to enter 2019 is almost half over active use, this capacity exthere is still time for addiFigure 5: Average System Capacity by Year, 2015-2021 plosion should continue well tional systems targeting 2021 beyond the immediate future. to be announced. technology in mind, so expect an Based on reported data, global So, if people continue using more and even more drastic increase as new capacity is estimated to increase 69 more bandwidth, the submarine fiber wavelength technologies begin to see percent by the end of 2020. Multiple industry has the capability to keep up. STF widespread commercial use. systems slated for the next several KIERAN CLARK is the Lead Analyst A further sign of evidence the years will have design capacities of for STF Analytics, a division of submarine fiber industry is up to the more than 100 terabits per second, Submarine Telecoms Forum, Inc. He originally joined SubTel task of meeting global capacity dewith many others boasting bandwidth Forum in 2013 as a Broadcast between 40 and 80 terabits per second. mands is that the average new system Technician to provide support for One system across the Atlantic is even capacity over the last 5 years has risen live event video streaming. He has 6+ years of live production at a steady pace. Averaging at just being designed for an astounding 250 experience and has worked alongside some of the over 30 Tbps in 2015, new systems Tbps. Looking ahead even further, premier organizations in video web streaming. In now average at well over 60 Tbps and 2021 shows only a modest increase 2014, Kieran was promoted to Analyst and is currently responsible for the research and mainteshould start hitting an average of 80by comparison with only a handful of nance that supports the STF Analytics Submarine 100 Tbps by 2020. With future systems Cable Database. In 2016, he was promoted to Lead systems announced. (Figure 4) Analyst and put in charge of the newly created STF being able to take advantage of higher All systems currently planned are Analytics. His analysis is featured in almost the wavelength capacities and potentially being designed with at least 100G entire array of SubTel Forum publications.
8
SUBMARINE TELECOMS MAGAZINE
OUT NOW! THE THIRD IN A NEW SERIES OF BI-MONTHLY REPORTS FROM STF ANALYTICS Submarine Telecoms Market Sector Report: Finance and Legal
Featuring exclusive data and analysis from STF Analytics – • Backed by industry-leading Submarine Cable Database • Overview of system financing and Contract in Force rates • In-depth look at the changing regulatory landscape • Signature analysis • Priced for every budget
BUY YOURS TODAY!
STFANALYTICS.COM/FINANCE-LEGAL-REPORT
ISO 9001:2015 certified designer and imp for commercial, governmen
10
THROUGHOUT
SUBMARINE TELECOMS MAGAZINE
plementer of submarine fiber cable systems ntal and oil & gas companies
T THE WORLD.
MARCH 2019 | ISSUE 104
11
FEATURE
BY KYLIE WANSINK AND HENRY LANCASTER
A GLOBAL RISE IN SUBMARINE CABLES 12
SUBMARINE TELECOMS MAGAZINE
M
any leading global organizations have now publicly acknowledged the enormous importance of well-developed broadband infrastructure for a sustainable future in terms of the economy, society and environment. As a result, there is massive government encouragement to build and improve upon fixed and mobile broadband infrastructure in many parts of the world. This is also leading to an increasingly competitive environment with governments, cable operators, incumbents, mobile operators and alternative players all vying for a slice of the market.
Submarine infrastructure continues to be developed for international communications as it can carry more data and provide faster connection speeds than the other alternative, satellites. It is estimated around 95% of international traffic is carried by undersea networks. Starting in around 2016, we have witnessed quite an explosion in submarine cable buildouts, and this continues today with at least 60 new submarine cables expected to be launched in the next three years. In 1988 the first transatlantic cable based on fibre-optics was installed, via the TAT-8 system. Now, in 2019, more than one million kilometers of submarine cable transverse between the continents (except Antarctica), supplying the means for international communication. While governments and telecom operators have traditionally banded together to build submarine cables; in recent years we have seen the rise of content-providers privately investing in such infrastructure. Facebook and Microsoft, for instance, have demonstrated considerable interest in submarine cable ownership via the MAREA cable between Spain and the US East Coast, and industry heavy-weight Google also has two private intercontinental undersea cables in the pipeline. Facebook recognizes the potential of the African market and is reported to be considering building a cable system linking a number of ocean-facing countries (with terrestrial connectivity to land-locked interior nations) to provide a direct link to the company’s data centers in Europe and Asia. The rise of cloud technology and data centers globally, along with an increasing number of internet users and internet traffic coming from developing markets like Africa, the Middle East, Latin America and Asia-Pacific, is driving the demand for bandwidth and the resulting growth in the number of submarine cables. There are many submarine cable build-outs occurring in these regions: in Asia, for example, there is a consortium developing the Southeast Asia–Japan 2 (SJC2) submarine cable system which will link a number of countries across Asia. Looking at the Pacific region, access to internet connectivity is a serious problem for the many islands dispersed over vast oceanic spaces. Submarine fibre-optic networks are expensive to build and maintain, with capital costs that are prohibitive for small island communities. Some countries must rely solely on geostationary satellites. As a result, bandwidth is limited, and broadband prices are extremely high. Internet access in Papua New Guinea (PNG), for example, is still extremely expensive and far beyond the financial reach of most of the population. While there is existing submarine cable infrastructure in place, it is considered to be no longer adequate and internet services are slow. International communications are provided only by satellite in The Solomon Islands. MAY 2019 | ISSUE 106
13
FEATURE However, this situation is expected to change with the build-out of a new submarine cable known as the Coral Sea Cable System which will link PNG to the Solomon Islands, with a connecting cable to the Australian (Sydney) landing station. It will provide increased capacity, speed and reliability as well as reduce internet costs for consumers. Turning our attention to the Middle East, Oman has been identified as a potential key location for data centers. It is well positioned in the Middle East as it is located between Asia, Africa and Europe and has access to several submarine cable systems via landing stations located close to the capital, Muscat. Equinix, one of the largest data center operators in the world, selected to partner with Omantel in mid-2018 and agreed to build a new data center in Oman. BuddeComm notes that Israel will soon benefit from a new submarine cable. While the launch of two new submarine cables in 2012 helped to increase international bandwidth in Israel - this will be further supported with a new cable launch expected in 2020. Quantam Cable agreed to build the system, which will link Israel to Spain. The sub-sea cable is expected to cost around US $200 million to build and will offer 40 times the capacity of other available systems. Africa has become a focus for the submarine cable sector and much activity and investment is anticipated in this region in coming years. A key stimulus for this activity is the ambition of governments to develop telecom infrastructure as a necessary prop to spur economic growth and job creation. With infrastructure in place, governments are also keen to create ICT hubs servicing regional economies. To this end new data centers are coming online and being commissioned (so reducing latency and bandwidth costs for end-users), terrestrial fibre projects are being extended (such as the second phase of Nigeria’s NIPTI program affecting areas in the south of the country) and regional alliances are being forged to facilitate cross-border cable projects. The Trans-Saharan Backbone is a key example of such co-operative developments. These ambitions ultimately rely on improved submarine connectivity. While Djibouti has long been a hub for international cables in the Horn of Africa region, more activity is now being seen in North Africa with upgrades to cables linking to Europe, as well as East Africa and connections to India and the Far East. Angola has become a cable hub for southern Africa. The country is a landing point for the SAT-3/WASC/ SAFE submarine cable system connecting South Africa to Europe and the Far East, and also other systems including the WACS, WASACE and SACS. The country’s connections to international fibre cables are managed by Angola Cables, set up as a public-private partnership. Progress has
14
SUBMARINE TELECOMS MAGAZINE
been steady, with the recent completion of the data center at Fortaleza in Brazil. This will channel traffic on the SACS and Monet cables between southern Africa, Latin America and the US. The successful deployment of cables in the continent in recent years has pushed Africa from the periphery to the top table. For consumers in a region largely dependent on mobile broadband for connectivity, the improved bandwidth and lower cost of services resulting from these developments will continue to encourage entrepreneurial activity and develop economic growth. The developing markets are certainly benefitting from the intense interest in building submarine cables. Many projects are underway which will link either countries within regions or perhaps emerging markets to developed ones. While the developing countries may seek financial assistance to build the submarine cables, many of these countries will often retain ownership of the cable system. This is the case with the Coral Sea Cable System. While Australia will provide the majority of financial assistance, it will be majority owned by PNG and The Solomon Islands and they will retain all revenues generated. In conclusion, the global submarine cable market is in a growth phase again with a key focus on linking the developing economies. This will have a significant impact on many of these markets as they will finally be able to access many of the economic and social benefits that good quality high-speed internet access can provide. Services that depend on high quality broadband infrastructure include e-health, e-education, e-business, digital media, e-government and smart infrastructure. STF KYLIE WANSINK is a Senior Analyst at BuddeComm and has been involved in corporate research for over twenty years and has extensive experience in the telecommunications sector. Kylie applies her skills to the global portfolio of research for the BuddeComm Organisation as well as the Middle East and South Pacific regions. The expansive suite of BuddeComm research reports provides a wide-ranging insight into the worldwide telecom market and the key trends occurring across the industry. In particular, her work focuses on the emerging developments in Next Generation Telecoms. Prior to joining BuddeComm, Kylie was involved in business research work for in the management consulting sector and holds a degree in Information Management. HENRY LANCASTER has been a Senior Analyst at BuddeComm since 2005, overseeing markets across the Americas and the Caribbean, Europe and Africa. He provides detailed analyses on individual countries and market segments, incorporating mobile, broadband, digital media, regulations, M&A activity, and operator strategies. He assesses comparative international trends and also concentrates on more specific areas touching on technological developments, competition issues, and government ICT policies. Prior to joining BuddeComm, Henry was a Senior Research Fellow at the University of London.
FEATURE
13 QUESTIONS WITH AMBER CASE Talking Technology Trends with TED Talk Author and Cyber Anthropologist
A
mber Case studies the interaction between humans and computers and how our relationship with information is changing the way cultures think, act, and understand their worlds. Case is currently a fellow at Harvard University’s Berkman Klein Center for Internet and Society and a visiting researcher at the MIT Center for Civic Media. In her work Case often declares that we are all cyborgs already, as a cyborg is simply a human who interacts with technology. According to Case the technology doesn’t necessarily need to be implanted: it can be a physical or mental extension. She argues that these days humans have two selves: one digital, one physical. Her main focus in recent years has been Calm technology, a type of information technology where the interaction between the technology and its user is designed to occur in the user’s periphery rather than constantly at the center of attention. Case is the author of Calm Technology, Design for the Next Generation of Devices. She spoke about the future of the interface for SXSW 2012’s keynote address, and her TED talk, “We are all cyborgs now,” has been viewed over a million times. Named one of National Geographic’s Emerging Explorers, she’s been listed among Inc. Maga-
zine’s 30 under 30 and featured among Fast Company’s Most Influential Women in Technology. She was the co-founder and former CEO of Geoloqi, a location-based software company acquired by Esri in 2012. In 2008, Case founded CyborgCamp, an unconference on the future of humans and computers. Born in about 1987, Case graduated with a sociology major from Lewis & Clark College in 2008, having written a thesis about cell phones. In 2008, she co-founded CyborgCamp, an unconference on the future of humans and computers. Case currently lives in Cambridge, Massachusetts and Portland, Oregon. Amber Case, a Cyborg Anthropologist and author of “Calm Technology: Designing for the Next Generation of Devices,” served as SubOptic 2019’s second keynote speaker, giving members of the submarine telecoms industry her unique perspective on the development of technology and it’s role in society and culture, both good and bad. According to Case, the anthropological definition of a cyborg is any living thing that uses technology to adapt to their environment. This explains the opening remark of her speech, “We’re all cyborgs.” After her speech concluded, Case allowed me to ask her a few questions about her work and the way if reflects on MAY 2019 | ISSUE 106
15
FEATURE the telecoms industry and the many other technology industries around the world.
1.
Cyborg Anthropologist. And this is an official area of study? You said it was officially recognized in 1992. How did you get involved? When I was a kid, I really liked math and science and technology. I started learning to program Basic on my dad’s computer. I had a really great time. I took the Lockheed Martin engineering program at my high school. It was kind of an underfunded high school, so Lockheed Martin came in and trained us in engineering, and they said “you don’t need to get a degree. We’ll just hire you out of high school.” That was really cool. But then I felt a little bit weird. I was like “do I really want to do this?” I got a little bit depressed. I’d learned drafting analogue, and then I’d started doing everything digital. And while it was very fast, and I could do all this cool material science things, I was like “hmm, I’m missing something.” So, I called my mom’s best friend, who was a math professor, and I asked, “what should I do?” She said, “well, you like math and science and engineering, and you’re really good at it. You should get a degree in something you suck at… And maybe you should rethink Lockheed Martin, because maybe they’ll have layoffs or something.” They ended up having layoffs. So, she says “go to a private liberal arts college. Learn how to think. Because the world is going to be different from what you think it is right now, and you want to have choices.” So, I found a school… they gave me a nice scholarship. Took a bus up there. Joined, from Cheyenne, Wyoming, and within five days I found that there was a subject on anthropology and declared my major as anthropology. The end of the year, I found there was this philosophy curriculum, and the very last speaker spoke on cyborg anthropology, and I said “that’s it. That blends my understanding of tech along with the human element.” I learned about Lucy Suchman and Xerox park, who created that green printer button. None of the engineers could solve how to make people have a good time using the printers, but this one, single anthropologist came in and
16
SUBMARINE TELECOMS MAGAZINE
understood humans, and that revolutionized the printer. I thought, “I could be one anthropologist who changes lots of things and that would be really crucial.” So, I started learning these things. I decided I would take this cyborg anthropology class. I ended up graduating early. I wrote my thesis on cell phones, because I didn’t have money to go to another country to do traditional anthropology. I said, “what can I study here?” And my professor said, “well, just study what’s around you.” Cell phones. I had a good time. I went down to Silicon Valley, because I was pitching a startup at the time and just watched people on their phones. So, I wrote this thesis, then later I made a whole startup based on that thesis. That’s kind of how I got into it. Then I found out about calm technology through there. I kept expecting people to be like “wow, calm technology. Amazing!” Yeah, nobody did. Nobody cared. Because I was looking at Xerox Park. Graphic user interface came out of here; all this Apple technology, ethernet. What hasn’t come out of Xerox Park? I was digging through the archives asking, “what else has come out of Xerox Park and has been forgotten?” I eventually wrote a book on it. I started giving talks on Calm Tech in 2014. It was very poorly rated because nobody had been overwhelmed by it.
2.
Why do you give this talk? People need to be given a different perspective. I give this talk in India and people are like “woah, we didn’t think we could do this in a different way.” They’re making western technology and doing automation for that, but what would technology that you built look like as an extension of your culture. You have this elegant, beautiful culture that’s decorative and full of ritual. What would happen if you made technology that looked like that? Felt like that? It would be totally different. My problem is we’re locked into a certain idea of technology, and it’s one size fits all. Social networks always look a certain way, and book sites always look a certain way. Early on, things looked way different. We’ve decided “This is what tech looks like.” This is totally not what tech looks like.
3.
Where do you think technology started getting away from us? For social networks, it was 2006. The RSS Atom wars. The founders of these e-reader subscriptions that got mad at each other and then everybody left and started social networks that combined updates inside a site so you could subscribe to people. Everybody had their own websites before and you could subscribe to them with RSS. But then Facebook and Twitter and Friendfeed and all these things came up and they just combined that status updates to one site. That made it so that you’re not in control of your own website anymore. There’s someone else who’s making you into a template. You put your profile in and you can only interact with the site in a certain way. The kind of Web 2.0 type stuff. Anything from film where we kind of got infected by the idea that technology should speak to us. A lot of big tech companies saying “wow, we sold so many more chips with a mobile phone. How can we exponentially grow the amount of chips we sell? Let’s make everything smart!” The quote that I forgot to say from Mark Weiser on stage was “We don’t need smarter devices. We need smarter humans.” How do we make technologies that empower us and give us the information we need to make better decisions? Not do everything for us. When we flatten culture in the way that we have done, life becomes boring. What do we have to look forward to if all of our free moments are filled up with technology and every single thing, we do at a day job is repairing stuff and freaking out at something failing? And if you’re doing moon-shot tech like Bell Labs does, it’s about how do you reduce the amount of repeaters you need? How do you upgrade a fiberoptic cable? All these larger things.
I would propose a middle future. So many people think it’s either one or the other, really pushed by journalism, page clicks and science fiction. That it needs to be super sci-fi and, in your face, or it needs to be totally analogue. I’m right in the middle. Have the best of tech and the best of humans. Still make sure some of these technology processes are analogue, with the joy and the pride that a craftsman might have with woodworking. Have that be part of the maintenance ritual. A maintenance ritual for technology.
4.
Why do you think that’s necessary? Because that’s human culture and humans need ownership and pride in what they do, or they don’t want to work in a place and the turnover’s really high or they make mistakes and are bored.
5.
You told a great story about your mom and her job automating over time. What do you feel like is the end result of jobs becoming maintaining automated systems? Depression. Anxiety. Mistakes. Not understanding the systems that have been automated. Not being able to update them. A kind of dystopia where we think of a system as a kind of magic. We don’t actually know how it works and we’re just maintaining it. Superstition. Middle management. Lack of originality, high turnover. Catastrophic failure.
6.
You look at the current standing of culture, where it is now, and you have to wonder how much this is related to where we are in the digital age. Absolutely. Really, I have a lot of respect for the Navy – for the military. The reason why is that you have something where you’re doing a lot of little things. You’re maintaining an airplane, but there’s a ritual behind it; there’s a pride; there’s a uniform; there’s comradery; there’s leveling up; there’s a path for people. You talk about people on military submarines. The screens, they understood, that they needed to be orange so that you don’t fatigue your eyes when you look at them at night. And yet, in our cars that we’re driving in all the time, we have blue screens that hurt our eyes and give us night blindness. We haven’t taken all of that research out. The MAY 2019 | ISSUE 106
17
FEATURE whole point of learning from the military is that’s a twenty-fourhour uptime system. You can have things fail. There’s pride in maintenance. You can’t— Especially in the Manhattan Project, you couldn’t just go to the computer company and go, “Hey, could you repair these computers? We’re working on making nuclear weapons.” No, they had to learn to maintain them themselves. And people were very innovative, at their own scale, to maintain these products. I think it’s very important to take that ownership and that pride back, because then it gives somebody something to look forward to and something to pass on to the next generation.
7.
I just have one more question. How do you feel the submarine telecoms industry falls into this? What could we be doing better from your perspective? What are we doing on our side of things that’s either helping or hurting this situation? The most important thing is moonshot innovation and partnering with Bell Labs [and organizations like it]. It’s communication networks, and that’s it, so we need to know what we can do to reduce the costs. But there’s the other industry thing where everybody is trying to make more bandwidth. It’s kind of the issue that if you put an escalator in front of a gym, people will take the escalator on the way to the gym. We expand our appetite for data base on how much is available. And that’s kind of an issue, you know? I feel like there should be “low data rate” stuff. Already, telecom companies are rate limiting people. I’ve been grandfathered in on T-Mobile for fifteen years, so I have unlimited data globally with no cost. That’s great, but not everybody has that, so I can just hoard all the data I want, and I don’t respect it because of that. So, I think that if you had a low bandwidth version of the web (which I would love), that just gives you the data, that would be awesome. We wouldn’t need to be ad-sponsored as much; it wouldn’t be as expensive to support. I feel like bandwidth is going to be one of those things like, “Oh, we have less bandwidth today.” You look at it and you try to make a call in the morning when there’s more
18
SUBMARINE TELECOMS MAGAZINE
bandwidth, but towards the middle of the day it fills up. If we had better compression models for data, if we had decentralized computing; it’s gotta be hand in hand. Also, backup systems. This is where automation really could help. As in, an automated bot that does in and fixes stuff. That’s remote controlled by someone else.
8.
But again, you have the human controlling it. You’re not talking true automation. That’s true. And that’s the thing. You’re giving somebody something to do. Like I said on stage, the original cake mix that said, “Just add water!” Nobody wanted to do it!
9.
Then they added eggs. Now you have ownership of it. And it’s been proven that if you put work into something, then you like it more. If you’re a kid and you just get a toy immediately, you don’t care. But if you save up for six months, then you’re going to take care of that toy. If you don’t have as much, you feel better.
10.
I think the general philosophy around technology right now is that, if you can take away human involvement, you should. Yeah, and it’s the level of human involvement. If you can take away a boring task, sure. But remember, people did a factory job for forty or fifty years in a repetitive way, eight hours a day, and they were happy. Because, there was a culture around it. There were vacations. They had a home.
They had a family. People are okay doing repetitive tasks as long as there’s a culture around it. What you have to realize is that some of these things are better done by humans, and some of these things are better done by machines but give people something to do so that they have ownerships. Because, if you automate everything, the failure rate is nasty. The first-generation automation in a factory is fine, because the people still remember the original process that it falls back to. Just like how every airplane pilot must train in gliding first, because a plane defaults to a glider. But second-generation automation is an abstraction. And this abstraction is what’s causing a lot of depression and anxiety right now. You’re not connected to anything right now. None of these second-generation people actually know the original process, because they weren’t trained on it. They just know how to fix the software. Because there’s no ownership, no depth, it’s quite depressing. And I think that’s the same way for a lot of these industries. Just learning, recently, about the depth of sound [in technology design] has alleviated a lot of my depression, because I have depth now. I’m going to write a book on this! Three years learning about sound and frequencies, but now I see through all these things. The whole world has become multi-layered and interesting again. Now it’s fine if I do a tedious task.
11.
I loved what you were talking about with the Roomba, actually. That you have personality in a beep, and you actually have no personality with a voice communication, which is very ironic. I think it’s really important with a Roomba is it’s not perfect, so you’re helping it. A human that helps a machine— you actually get bonded with something that you have to help. I think that’s why the Tamagotchi was so popular, because you have to feed it and help maintain it. Even though it’s fake, you form real bonds with it. There’s a Tamagotchi graveyard in Japan where you can bury them. So, this becomes very interesting, because you have to think the biggest issue is that right now there are many engineers that love the idea of automating everything. They’d prefer to have their head in a box and upload their mind into a computer and not have the fleshy issues, like needing to use the restroom or getting hungry. There’s plenty of people like that. That’s what I was like when I was a kid. I wanted that too. But, those type of people should not be making decisions for the rest of the world. Because not everybody wants that, and the whole point of having freedom is the choice of what way you want to live. You shouldn’t be considered a luddite if you actually want to
have an olive farm in Italy, and that you want to farm until you’re eighty-five.
12.
It’s really interesting to me that when people usually talk about the dangers of automation, they’re talking about machines replacing humans. But you’re not. You’re talking about people still having their jobs and the machines doing almost all of the work. I’m talking about machines assisting humans, and humans assisting machines. So, if somebody wants to work longer in the workforce and their sixty-five, but their arm starts to hurt: give them an exoskeleton arm so they’re super powered.
13.
Yes, but I mean people’s jobs now become just staring at a screen and they have no personal involvement. It’s not the right kind of automation. The right kind of automation is allowing people to maintain all the things. It embodied. It’s interesting. It’s purposeful. Also, those people are never going to make an upgrade to the system. If you have ownership of the system, and you know how it works, you can improve the system. So, people are missing out on really smart people in their companies that are staring at screens that could actually improve systems. If you empower your factory workers, they’ll actually make something more clever. You can go in with top-level management and make a two-million-dollar detector that detects whether something is bad or good, or you can have the factory worker put a fan on that will blow away [the product] that is too light. This is factory-level innovation, which is way stronger than the space program’s two-million-dollar pen project. We’re over-engineering. It’s not necessary, and now we have to support all these crazy, abstract systems. There’s a lot of innovation that’s simple and we forget about that. The post-it note was invented by that banjo-playing guy, and it was a mistake. If you look at Bell Labs, where do the innovations come from? Hiring weird people who do weird stuff, who are basically children playing around. Real innovation is child-like. You don’t know what you can do or not, but you’re playing. And you’re playing for twenty hours some days. But it’s because you have a bunch of misfits in a room, who don’t fit in anywhere else. In fact, a lot of innovation is, “Oh, this system didn’t work for me, so I made it work for me.” Well turns out that system sucked to begin with, but making it work for you made it work for everyone else Amber, thank you so much for taking some time with me today. And thanks again for coming to speak at SubOptic 2019. STF MAY 2019 | ISSUE 106
19
FEATURE
BY MOHAMED AHMED
DARE1 SUBSEA CABLE:
Project Enters into Cable and Material Manufacturing Stage
M
arine survey for the Djibouti Africa Regional Express 1 (DARE1) submarine cable system has been completed and the cable route finalized. The project is progressing on schedule with the marine survey completed on January 21, 2019. Manufacturing of the undersea cables and repeaters will begin in April 2019 and the system will be ready for commercial traffic in June 2020. The DARE1 cable system is the first step in a planned expansion into eastern Africa, which will connect Djibouti (Djibouti), Bosaso (Somalia), Mogadishu (Somalia) and Mombasa (Kenya). With a finalized route length of 4,747km, DARE1 will deliver up to 36 Tbps of capacity to East Africa. The cable will facilitate connectivity from Mombasa to Djibouti. it’s claimed that it will create the shortest route from east Africa to Europe via Djibouti. According to Djibouti telecom, this network topology “substantially improve
20
SUBMARINE TELECOMS MAGAZINE
the Network Latency and will provide a “cost-effective”, diverse route between Kenya and Europe. Djibouti Telecom believe in DARE1’s open access and carrier neutral data centers will have a “big impact” in the countries connected to the cable system. DARE1 is a consortium comprised of Djibouti Telecom, Somtel group and Telkom Kenya, as a Landing Party in Kenya and a strategic Partner for Connectivity within eastern African landlocked countries. Djibouti Africa Regional Express (DARE1) is a repeatered submarine cable system providing connectivity between Djibouti (Djibouti) and Mombasa (Kenya), with stubbed branches to Bosaso (Somalia), and Mogadishu (Somalia). The solution presented and designed by TE SubCom includes a combination of equipment and technologies to meet the overall objectives for DARE1. This new cable will also allow Djibouti telecom to be
a regional Hub for the operators of its neighboring countries like Somalia, Kenya, Ethiopia. It comes just at the right time because it will allow modernizing the infrastructures of telecommunications of the concerned countries. In terms of emerging technologies, 4G, he Internet of Things (IOT) and globalized enterprises DATA ,will definitely fill the Networks tubes in terms of the access and Metro Networks. The Republic of Djibouti, on the Horn of Africa, is 23,000 kilometers square with a population of fewer than a million citizens. Djibouti’s privileged geographical position at the crossroads of Africa, Asia, the Middle East and Europe give it immense significance as a vital hub on the global communications superhighway. Taking full advantage of the country’s historically important location, incumbent carrier Djibouti Telecom has been able to position itself as one of the most important East African telecoms players, able to connect a range of wholesale and enterprise customers to diverse areas of the globe. The carrier’s fully resilient international network backs up a complete portfolio of voice, data/IP and capacity services. Djibouti Telecom review the price continuously in order to meet Customers Target. Djibouti Telecom has now augmented this status by putting in Service in a new generation of international infrastructures in the form of the Asia-Africa- Europe-1 (AAE-1) and South East Asia-Middle East-Western Europe 5 (Sea-Me-We 5) systems, adding to the multitude of submarine connectivity options in which it already has a stake. Demand between Europe and Asia looks set to grow further as Asia’s emerging markets keep investing to make internet connections faster and more accessible for the benefit of both fixed and mobile users. It is not all about capacity though, with network diversity being another major priority in network planning today. In order to have a continuity of services, for security and efficiency, it is vital that a multitude of route options, such as Djibouti Telecom offers, can be supplied. The company’s diverse portfolio of services includes IP
Transit, which is now faster and more reliable than ever for the benefit of customers in areas like content delivery, fixed and mobile telecoms. With a network footprint covering the major locations in Europe and Asia, Djibouti Telecom makes IP transit and backhaul connections quick and efficient through direct connectivity with all the major Internet carriers, in Marseille, UAE, Singapore, London and Nairobi. Djibouti Telecom’s ambition is to continue to fulfil its role as a unique gateway for millions of customers in the region and beyond, meeting their fast-growing demand for international bandwidth now and in the future. Djibouti Telecom is also connected to Interxion in Marseille, Epsilon in London, Datamena and SmartHub in the Gulf, Global Switch and Equinix in Singapore, Djibouti Data Center in Djibouti and the East Africa Data Center in Nairobi. STF MOHAMED AHMED has been International Business Director of Djibouti Telecom since 2010. He has participated to all key development of Djibouti Telecom main International Networks and was in charge of Fiber Terrestrial Networks towards Neighboring countries, Ethiopia from 2005 to 2010, as well as in charge of all Subsea Cable Project landing in Djibouti, namely EASSY, EIG, SMW5, AAE-1, from 2010 to 2016. Since 2017, he has been Chairman of Management Committee of DARE1 Subsea Cable, a regional project connecting Djibouti, Somalia and Kenya. His academic background includes the paper, Communications Engineer from French Engineer School and Master on Management on Optical Data Communications.
MAY 2019 | ISSUE 106
21
BACK REFLECTION
BY JOSÉ CHESNOY
RISE ABOVE
SUBTELFO 22
SUBMARINE TELECOMS MAGAZINE
ELEVATE YOUR COMPANY. ADVERTISE IN SUBTEL FORUM SubTel Forum publications are read and used by decision makers across the entire submarine cable industry.
ORUM.COM MARCH 2019 | ISSUE 104
23
FEATURE
BY JOHN TIBBLES
FORECASTING DEMAND FOR SUBSEA CAPACITY
“P
rediction is very difficult, especially if it’s about the future.” So said Nils Bohr, famous Danish Nobel Laureate in Physics, and he was certainly right about that, as anyone reading this article or having had experience with demand forecasting will know. However, as this issue of Sub Tel forum is focused on ‘Capacity’ we should reflect on how it got there and how we can, or indeed can’t, forecast how much capacity will be around in the future. Many would also sympathize with the view of a much respected, now retired colleague, made outside a back-street bar in Hong Kong back in apparently simpler times. His view was, “Telecoms demand forecasts are always right. It’s just the X axis that is wrong.” That was a good while ago, but it has stuck with me ever since. As well as being a witty observation, it has a lot of truth in it. The Dotcom bust situation with network overbuilds and duplication came too early for the widespread adoption of the internet it sought to serve and what we have been seeing in the last few years is in response to the scaling
24
SUBMARINE TELECOMS MAGAZINE
back on network investment that followed that unhappy time in our industry; initially a bust followed by a boom. So, with so many projects recently completed and many more in the development stage, just how do you forecast the demand for subsea cables? One could say just build the largest capacity available and if you can afford it there is not much wrong with that approach. Or is there? There is always the awkward question: “where is the money coming from if you are seeking to finance a new build.” Who will buy, how much will they buy, when will they buy and how will they buy, lease, IRU or something between the two?
ONCE UPON A TIME
Once upon a time there were no fibre optic cables, but there were submarine cables. Back in the telegraph days the answer was simple: you had copper wires instead of optical fibres and you could transmit very, very, very slow speed signals, enough for telegraphic communications. No high-tech
plastic or optics back then, so you built the biggest cable you could, and its capacity was measured in bits per second. When Coaxial telephone cables came along capacity increased dramatically — laughably so in today’s terms — but it was that or frequently unintelligible HF radio. So, until Intelsat appeared in the 1970s, those cables were the only realistic option. Making and laying the actual cable was, as it is today, a complex and expensive process. Individual transoceanic cables had capacities ranging from around 100 voice grade channels to perhaps 400 and that meant each channel was very, very precious. Satellites communications themselves needed forecasts. For those who can remember, Intelsat ran an event called the Global Traffic Meeting held every year in Washington, where carriers met, discussed and agreed on short term and long term route forecasts — a very necessary activity since launching new satellites was not a short term option and an extremely costly venture at that. So, while there was a structure for forecasting the satellite demand, and a pretty good one, where did the underlying demand come from. Telephone minutes was the answer of course and satellite comms really made truly global direct dialing realistic. calls were not cheap but, along with fax, they were a vital tool for international business. Demand for telephone circuits could be predicted with a reasonable degree of accuracy. — there were proven statistical ways of converting your minutes into circuits. Only telephone circuits mattered because the rest — telex bearers and leased lines — only amounted to about 10 percent of the voice demand. The first global fibre optics arrived — TAT8,TAT 9 , PTAT etc. — arrived at the same time competition began to emerge in telecoms., fax, just as voice channel was displacing telex, but it made no difference to circuit forecasting and large private networks were still the province of the military, Nasa, global banks airlines and the like. They were still essentially telephone circuits and cable capacity were often expressed as how many simultaneous telephone calls it could carry. Try doing that sum on say Unity or Marea (a quick back of the envelope calculation for such a system is 1.6Bn phone calls. It takes two people for a call so almost half the worlds could use it at the same time). New technology but at that point no new uses so forecasts would carry on as before and because technological limitations were recognized one came back to the build the biggest cable you can solution.
THE INTERNET - WHAT’S THAT?
“Some things are so unexpected that no one is prepared for them.” —Leo Rosten, American academic and humourist in Rome Wasn’t Burned in a Day
At some point, in the early to mid-1990s, the internet ap-
peared. And that’s pretty much what happened as far as telecoms carriers were concerned it just appeared. It wasn’t very big and didn’t require much capacity and it was all to do with Universities and the Military so just some higher speed lease lines, and that’s good because these new cables can carry much faster leased lines and we have got quite a bit of spare capacity available, meaning even more telephone calls could be carried as well. However, with prices falling and falling one began to wonder just how many calls at 5c or 10c per minute were needed to pay for the increasingly complex DWDM multi landing point loops systems of that time. So, as the decade — the last one of the 20th century — came to a close, enormous progress had been made in reach and capacity for subsea cables. It was becoming apparent, however, that there was more capacity than phone calls needed, indeed there were more cables than needed, and capacity had got way out ahead of demand, and we all know what happened then. Contrastingly, however the internet was beginning to invade all our lives, with 56Kbs dial up modems and AOL, Netscape etc., allied to much higher speed private data circuits for global corporate use. This happened just as excess supply pushed prices down (the impact of demand from mobile phones got swallowed up in the decline in voice revenues) leaving many carriers with a lot of unused but paid for capacity on their hands. Carriers faced recession, something that had not happened in living memory because more phones were installed every year, even more with mobiles. More calls were made, more international calls were made and so life was only ever going to get better……. but it didn’t. Reeling from a completely unknown scenario, the carriers unknowingly and unwittingly committed a form of longterm corporate suicide. We can recover some of these losses if we sell off all this unused capacity to these data services and internet companies, and because there was so much unused capacity and cable developers were facing or in bankruptcy, capacity costs plummeted. That meant a huge drop in the cost base for digital service providers and they became global. Many of them failed or merged or picked the wrong operating system or just had bad ideas, but some didn’t, and some were called by odd names like Google or Facebook. They operated on a scale completely unseen or unimagined by the carriers because they wanted a whole fibre pair in some of the few new systems which were being developed in the middle of the last decade and they wasted little time in moving on to wanting whole cables. Put simplistically, they followed the “build or buy the biggest available and it will all get used some day” model. They didn’t have financiers because they had market value in the multibillions and cash to burn. Because of the downturn in new projects, the system suppliers fell over themselves to give them good deals pushing down capacity costs even further. And that perhaps is where we are today.
FEATURE HAS ANYONE EVER GOT FORECASTING RIGHT?
“It is often said there are two types of forecasts... lucky or wrong!” —Control. The magazine of the Institute of Operational Management Back in the carrier consortium heyday, there was relative stability despite competition to build follow on cables to the last one in the water. The early optical cables had large capacity compared to the coaxial systems but as DWDM became established the first DWDM cables had so much capacity that “Restoration” (remember that) using satellite or older systems was impossible so guess what you had to have self-restoring loops and so suddenly the need for one cable became the need for two – how do you account for that in a forecast done say 3 years earlier. Around this time the first “Private” cables appeared, basically breaking the stranglehold of the big consortium incumbents. But some were in the right place at the right time or were really built to serve the needs of their owners who were new carriers being blocked from access to consortium systems I was directly involved with some of these systems, but I don’t recall much in the way of really detailed statistical based forecasting, a lot of financial analysis based on some very approximate speculation about growth due to the Internet and therefore revenue but no great master plan. Where it was done it was a high-level approach and, in my view, looking back most of these fell into that category, much derided called ‘strategic investments. But some strategic investments work out well, TNZ Southern Cross being one example although it had a lot of owner support. A short section, which perhaps is not a coincidence.
FORECASTING TRENDS
“If you can investigate the seeds of time and say which grain will grow and which will not, speak then unto me.” —William Shakespeare
The English language is wonderfully adaptable as it is also has the ability to confuse and so, am I talking about forecasting the trends of traffic growth or am I discussing how to forecast the trends themselves? Well the answer is both and by that, I mean both meanings of the above phrase and the need for some statistical data (forecasts) to support conclusions arising from visionary predictions I am sure that the big data companies have a decent amount of data on how their networks perform, the loadings on them and the changes from year to year. That can
26
SUBMARINE TELECOMS MAGAZINE
be very useful, and no doubt has supported some of the investments they have made in recent years growing from whole fibre pairs, to owning their own cables. On the other hand we could discus trends in forecasting because for all the information Google has about how its network operates today and how its organic businesses might grow, perhaps they even have an algorithm that links each dollar of adverting revenue to so many megabits on its cables That in itself was one of the dilemma around the dotcom era where the was no apparent link between telco revenues, voice or their emerging ISP services and subsea cable needs and many corporate finance departments took the view that cables were best left to others. However, while I am sure Google has some visionary people, do they really know, I mean really know, terms of numbers what 5G mobile and the Internet of Things will really do to traffic on their networks? I suspect they don’t, but they can probably make a good and well-argued guestimate that is enough to determine if the need a new cable or two inside the planning horizon for building them. But the private system developer has limited data to work with, they control none of the content, they have no way of linking cable capacity prices to retail revenues and so they must make a case not based on mountains of statistics. but reasoned argument based on factors like the following: • Is the market the system addresses underserved? • Can new project bring true geographic diversity at reasonable latency from major paths? • Is there potential for big data operators to use it? • Does it link growing economies and populations? • Is it readily accessible to third party users? That’s fine in building a vision , and maybe very realistic but then you run up against the banks who want to see assured revenues and that is the real challenge for a forecaster today, at some point you need numbers with a dollar sign in front of them . So, to my mind, and that’s just one view of course, is that in today’s world forecasting in the statistical modelling sense relying on past trends and data to predict the future does not work. What does work in an understanding of sea change issues, big users looking at minimum investments of a fibre pair or half the spectrum on a pair. What 5G will do the market, are networks sufficiently secure and resilient, what pollical and regulatory shifts could happen (say the EU decided to adopt the view of China-you can be a content provider/search engine or a carrier but you cannot be both) Will Google or Fb have to divest themselves of some parts of their networks . Networks they built not because they knew precisely what they wanted but they knew what they didn’t want which was having to go cap in hand to incumbent carriers every time they needed a capacity uplift. That was a strategic not statistics-based decision.
So, time for another quote, appropriate to this conclusion. “It is far better to foresee even without certainty than not to foresee at all.” —Henri Poincare - The Foundations of Science.
LOOKING TO THE FUTURE FORECASTS OR PREDICTIONS
“It is said that the present is pregnant with the future.” —Voltaire
However much one can gaze into a crystal ball and make sensible and even accurate decisions about when and how new services or market forces impact demand for subsea capacity. Unless you have a huge amount of free cashflow you will have to finance your project and that means numbers. No phone minutes anymore and the people who have accurate data are unlikely to share it. So what might be a source of firmly based statistical data looking forward? Data centers in one form or another of course have been around for decades, but they were called telephone exchanges or central offices. But, while modern data centers invite and attract users into their buildings, these older versions were run by people who wanted to keep everybody out. The big data companies of course have data centers, and they too want to keep everyone else out but there are plenty of ‘public’ data centers ranging from huge constellations like Equinix or relatively small district level ones and twos. Data centers industry metrics we see every day – it has a million square feet, consumes impressive numbers of megawatts, needs vast amounts of air conditioning capacity and has space for so many thousand racks. But one metric is missing and its vital to the whole data center concept: how many gigabits go in and out every day and where do they go? I have yet to see anyone state that their data center handles X thousand gigabits of data transfers per day and that 20 percent ,30 percent whatever of this goes overseas. If these can be captured and can be shared, then perhaps there is a way to predict cable capacity requirements in a rather more statistically scientific way than we have today. The really big users have their own cables and probably do not want to share that information but in the case of a neutral data center it’s all aggregated data and has no visibility back to end users and it is of as much value to the developer as electricity. So, are data center metrics the phone minutes of the future?? “An unsophisticated forecaster uses statistics as a drunken man uses lamp-posts - for support rather than for illumination.” —Andrew Lang (a 19th century Scottish writer and academic, who also collected fairy tales)
CONCLUSION
Without future private cable developments, control rests with a tiny group of global corporations almost exclusively US centric. Where does that leave the rest of the world that needs its own views of demand, diversity, security and political preferences to be addressed when building out the invisible network on which so much of today’s world totally depends upon, but which for the most part remains out of site and out of mind. Although an excellent business case can be made for many projects based on soft or strategic issues, private systems need revenue predications to get financed. That is not easy with limited statistical data, so it will be a struggle for private developers until they can provide some data to support their vision. Possibly the proliferation of data centers globally will produce data about their communications requirements that can be input to statistical forecasting methods alongside the inevitable step changes that the digital world has either yet to foresee or at least implement. So, perhaps there is some hope that meaningful statistics will once again emerge to forecast volumes which can then be related to equated to capacity costs. However, for now it is a question of vision, predictions if you like, which for now still adds up to a 21st century version of the so called “Field of Dreams-if you build it, they will come” ventures of almost 20 years ago. Thus, to get the balance between forecasting with numbers and prediction, the big events, leaves you needing a finger on the pulse of technology and politics and hoping for some relevant data to emerge, something of a choice between: “If you have to forecast, forecast often.” Edgar R. Fiedler in The Three Rs of Economic Forecasting-Irrational, Irrelevant and Irreverent Or, perhaps going to the other extreme “Our world is increasingly complex, often chaotic, and always fast-flowing. This makes forecasting something between tremendously difficult and actually impossible, with a strong shift toward the latter as timescales get longer.” —Andrew McAfee, Machine, Platform, Crowd: Harnessing Our Digital Future STF JOHN TIBBLES has worked most subsea cable issues relating to strategy business development for private and consortium systems and numerous aspects of intercarrier business at a senior level for several l large carriers, Cable and Wireless, WorldCom, Reach and Telstra before retiring 6 years ago. During his career he has participated as speaker, panellist and executive committee member on SubOptic, PTC, ICPC and Submarine Network world events. He retains an active interest in the industry consulting on subsea cable projects and wider international telecommunications matters including acting as an expert witness and mediator in inter carrier disputes.
MAY 2019 | ISSUE 106
27
POWERFUL ANALYTICS
CUSTOMIZED REPORTING Delivered in 10 business days SPECIAL MARKETS — Oils & Gas, Cableships, Upgrades and more From REGIONAL TO GLOBAL Market Reports
ORDER YOURS TODAY
STF ANALYTICS CUSTOM REPORTING
WWW.STFANALYTICS.COM
FEATURE
BY LAURIE MILLER
PARTNERSHIPS AND PROACTIVITY ARE THE KEYS TO ENDURING SUCCESS Southern Cross Cables owns a major telecommunications cable network between Australia, New Zealand, Fiji and across the South Pacific to the United States of America that is estimated to provide more than 60% of all internet connectivity out of Australia and New Zealand. Southern Cross has recently embarked on the Southern Cross NEXT project. On taking up the role of Southern Cross CEO, Laurie Miller shares with us his thoughts on the market and key components of Southern Cross’ success.
30
SUBMARINE TELECOMS MAGAZINE
G
lobal communities depend on technology. Perhaps this has never been truer than in the modern age. As peoples lives and societies move ever more into a digital landscape, technology’s importance only becomes ever more critical. After all, people all over the world fundamentally rely on ‘connectivity’, and with that growing demand, comes a need to establish robust infrastructure to support it now and moving forward into the future. This is not a journey you can do alone. The recent outage in Tonga (Daniel Victor, 2019) made
it clear how easily a nation that has come to depend on internet connectivity could be cut off. The underwater fibre-optic cable that connects Tongans to high-speed internet was severed in January this year, plunging roughly 100,000 residents into digital darkness. Internet connections to the country’s more than 170 islands were lost. In Australasia, Southern Cross is able to differentiate itself in an incredibly proactive market. We provide Layer 1 and Layer 2 capacity connectivity services to a range of customers across the region including telecommunication companies, ISPs, enterprises, and content providers. Southern Cross specialises in SDH, OTN, and Ethernet international connectivity, and in particular, protected services that leverage the diverse and loop nature of our underlying system design. This has, ultimately, been a key differentiator between Southern Cross and single strand cable systems around the world, and a major failsafe against events like those experienced by Tonga. While having a great network is good, there are many aspects which help any company, particularly a small one like Southern Cross, to be successful. Without appearing to simplify, the key to success has been in our partnerships – with customers, with our suppliers, with the industry and of course with our staff. Southern Cross Cables built its current figure eight cable to provide a strong and robust connection at a time when capacity was scarce, as the growth of internet traffic was in its infancy. Our initial lit capacity (between Australasia and the United States of America) was only 20Gb at the time – equivalent to what would be twenty high speed household connections today. In the intervening years, we have continued to invest in upgrades of the equipment at the ends of the cables to provide greater capacity. As technology has also developed
Southern Cross Cables has commissioned new upgrades that have progressively increased the systems potential capacity to almost 600 times the original potential.
IMPORTANCE OF SUPPLIER PARTNERSHIPS
This is not something you can successfully do without strong partnerships and relationships with your suppliers. Large complex projects, such as the original Southern Cross, our current Southern Cross NEXT and ongoing capacity expansion projects, always involve managing and controlling aspects of construction, financial, legal, regulatory and commercial matters even before you get to operate and deliver services. As experienced as the team is, we freely acknowledge that we do not know it all, and so working with our supplier partners is key to ensuring every project has the greatest likelihood of successfully delivering the agreed outcomes on time and in full. Proactivity and innovation define the future of this industry. As technology continues to evolve, and new products are put onto the market, paradigm shifts look inevitable. As such, the key to enduring success hinges on an ability to adapt, improve and evolve – become better. The industry (like everything) is evolving over time. Content Provider requirements grow and are projected to become larger than traditional telco providers within the next ten years, and the effect of the Internet of Things (IoT) and 5G is forecast to continue increasing as the technology becomes more pervasive. On the supply side, developments such as Space Division Multiplexing (SDM), as planned for the Dunant system (SubCom, 2019), ‘Liquid Spectrum’ technologies as being developed by Ciena (Ciena, 2019), and developments in new Low Earth Orbit (LEO) satellite technologies like those planned by SpaceX (McCormick, 2017) and Project Kuiper (Boyle, 2019), amongst many others, all have the potential to change the landscape as we currently know it. Exactly where it will lead us is unknown, much like the impact of the smartphone would have been very difficult to predict when it was introduced only twelve years ago. Southern Cross when it was originally built had a potential capacity of 240Gbs, based on 16 wavelengths per fibre pair each running at 2.5Gbs, across our three fibre pairs on two cables. Southern Cross today has a lit capacity of around 10 Terabits/second, and potential of double that, ignoring the 72+ Terabits per second of capacity to come online with Southern Cross NEXT. While these seem like just numbers, it’s easy to lose context. This 20Tbs effectively represents about 42 ‘original’ Southern Cross systems! Back at the beginning of the MAY 2019 | ISSUE 106
31
FEATURE be careful that the unrelenting drive for minimum costs doesn’t undermine this. Again, coming in new it seems obvious, but Southern Cross is a good case study. The original system represented a USD1.3bn investment, and quite clearly the relatively small, by global standards (Telegeography, 2018), Oceania market would not have been able to support USD55bn in submarine cable investment in the last 15 years, if 42 submarine cables were needed to be built. Data has grown, but the ability to cost-effectively meet the data growth is due to the efforts of researchers and vendors to bring new technologies, such as coherent optical transmission (Ciena, 2019) to market. The investment in research by others has not only paid dividends for them as a supplier but has enabled our region to grow and meet increasing demand in a way which would not have been sustainable based on the available technology of 15 years ago.
project, we needed to convince the backers (our Sponsors) that there was, in fact, a need for one Southern Cross! If we had tried to convince them that they would effectively need an additional 41 cable systems within 15 years to meet demand, they would have thrown us out of the Board room in a fit of laughter and slammed the door. And yet, here we are … and demand is still growing. A recent APNIC article (Mathi, 2019), states that 2.5 million terabytes of data is being created every day and is growing at an exponential rate. It’s imperative that vendors and research institutions continue to investigate and develop solutions for increasing and changing requirements. These research hubs are trying to find solutions mathematically today which will result in new products in seven to ten years’ time. It only takes a quick look at the financial reports of some of these major vendors to appreciate that investment by these companies in research is significant, and as an industry, we need to
Southern Cross Cable Station
Hillsboro
SOUTHERN CROSS CABLE NETWORK
United States
Southern Cross Access Point San Jose – 55 SOUTH MARKET
Southern Cross Cable Station
Morro Bay
NORTH PACIFIC OCEAN
EX
N ss
Southern Cross Cable Station Hawaii – KAHE POINT
SOUTH CHINA SEA
er
th
Hawaii
u So
n
o Cr
T
Southern Cross Cable Station
Los Angeles
Southern Cross Cable Station Hawaii – SPENCER BEACH
Kiribati Tokelau
Southern Cross Cable Station
Suva
SOUTH PACIFIC OCEAN
Fiji Australia Southern Cross Cable Station Sydney – BROOKVALE
New Zealand Southern Cross Cable Station Sydney – ALEXANDRIA
32
SUBMARINE TELECOMS MAGAZINE
Southern Cross Cable Station Auckland – WHENUAPAI
Southern Cross Cable Station Auckland – TAKAPUNA
Channelling a bit of Bernard of Chartres (Wikipedia, 2019) and Isaac Newton, we achieve great things on the backs of the efforts and developments of others.
IMPORTANCE OF CUSTOMER AND INDUSTRY PARTNERSHIPS
Yet, not surprisingly, success is more than just simply providing technology, network or products. It is highly dependent on a strong focus on customer partnership and satisfaction. As the international capacity market is not a “mass market” type environment, it allows companies such as Southern Cross to focus and forge strong partnerships with customers and industry. Technology ultimately has a purpose. Customers (and their customers, and so on) do something with the capacity. Trying to understand what it is, and how you can help them achieve their ultimate goals is important. And some truly spectacular things are done at the end of the chain using technology, and the capacity the industry provides. Using ourselves as a case study of the industry once more, a great example is our partnership with AARNet (Australian Academic Research Network) formed in 2003 for the creation of the Southern Cross Trans-Pacific Optical Research Testbed (SXTransPORT). SXTransPORT is a high capacity optical network linking AARNet (and its customers) to research and education networks around the world. This, in turn, has allowed Australian researchers and scientists an opportunity to collaborate in research areas such as particle physics, climate science, life science, astronomy, and food and medical research. AARNet released an excellent publication, ‘21st Century Trailblazers’, outlining some of the research activities that the technology supports (AARNet, 2016). A highly recommended read. A prime example is the Australian Research Council Centre of Excellence for Particle Physics (CoEPP) based at the University of Melbourne. CoEPP is Australia’s leading research centre in high-energy physics. The Centre is a collaborative research venture between the University of Melbourne, the University of Adelaide, the University of Sydney and Monash University. Through its work on the ATLAS experiment at the Large Hadron Collider (LHC) in CERN (European Organisation for Nuclear Research), CoEPP researchers contributed to the Higgs boson discovery in 2012 and provided valuable, and essential, resources to the Worldwide LHC Computing Grid (WLCG). The WLCG consists of 170 computing centres in 42 countries, linking up national and international grid infrastructures. The mission of the WLCG project is to provide global computing resources to store, distribute and analyse the ~30 Petabytes (30 million Gigabytes) of data annually generated
by the LHC. The CoEPP research computing team provides grid-connected storage and computing resources via its ATLAS Tier 2 grid site. The site’s high availability and reliability have been achieved as a direct consequence of the underpinning network connectivity between the AARNet and a corresponding WLCG Tier 1 site at TRIUMF (Canada’s national laboratory for particle and nuclear physics) across the AARNet trans-Pacific SXTransPORT links. As CoEPP continues to achieve international recognition for Australia in the field of high-energy physics, its collaborative capacity and contribution to worldwide projects rely on the capabilities of the networking infrastructure connecting Australian researchers and resources to the world. This customer focus is only more critical when you have a relatively small team, as Southern Cross does. We are a team of only 20 people, so our staff play a crucial role in the success of Southern Cross, from initial engagements through to the quality and operation of the service, and the accessibility and proactive attitude to resolve any issues on the rare occasion that something goes wrong. There are only so many touch points between you and the customer, and it’s important get each of these as effective and positive as they can be. For Southern Cross, our Operations team are one of the key touchpoints to building that relationship of trust with our customers. Every year we hold a Customer Forum attended by our direct customers,in which we openly share what has occurred on the network in the last 12 months and the plans for the coming year. We also invite our supplier representatives and encourage an open and informal manner for discussion and feedback, not just to Southern Cross but between our customers and suppliers also. It provides a great mechanism for customers to get a view MAY 2019 | ISSUE 106
33
FEATURE of what industry developments are coming that may tie into their own strategic plans, or those of their customers, and hence what new services Southern Cross should introduce that may be useful. Similarly, it provides our suppliers a great insight into the challenges not just facing Southern Cross, but those of our customers, along with their current concerns and drivers. It brings together the strong partnerships we have formed with our suppliers, with those we have with our customers, to try and help complete the holistic view. It doesn’t stop there, of course. Associations such as the International Cable Protection Committee (ICPC), which has over 175 members from 60 countries, and of which Southern Cross is an active member, is all about industry partnership. “To be the international submarine cable authority providing leadership and guidance on issues related to submarine cable security and reliability”, (ICPC, 2019). Through activities such as publications, education, working groups, and other affiliate programs, it allows industry members such as Southern Cross, to promote awareness, produce recommendations and tackle emerging issues such as seabed mining (The Economist, 2017).
WHAT’S NEXT?
The challenge, not only for Southern Cross but for other providers in the industry, is to try and be adaptable and continue to grow and transform to meet changing requirements. Southern Cross is in the process of building a new submarine cable, Southern Cross NEXT, which will further augment the capacity and resiliency of international connectivity between Australia, New Zealand, Fiji and other Pacific Islands and the United States of America. This is a significant infrastructure investment in the region. The Southern Cross NEXT cable will also provide connections into Tokelau and Kiritimati, providing their first cable links to the world. Southern Cross NEXT will also provide a third high capacity low latency route integrating into the existing Southern Cross eco-system. The marine route survey and several other project milestones have been completed (such as Sydney landing facilities), and the project is due for completion by end-2021. Again, these could not have been completed without our strong project partnerships such as Pioneer for technical consultancy, EGS for marine surveys, and many others. To succeed in this industry, you need to believe in yourself, and get the best people and partners around you, to deliver the business outcomes you have committed to. Equally, the main reason you’re in business is to fulfil the needs of customers. We recognise efficient service delivery, and no
34
SUBMARINE TELECOMS MAGAZINE
service interruptions are key to the services our customers provide to their retail customers throughout the Asia-Pacific region, and we are committed to doing our part. The team is currently looking to achieve the successful implementation of the Southern Cross NEXT project, meaning Oceania industry and communication users should continue to benefit from Southern Cross for another 30 years or more. STF
REFERENCES
AARNet. (2016). Publications. Retrieved from AARNet: https://www.aarnet. edu.au/images/uploads/main/21stCenturyTrailblazers-Final.pdf Boyle, A. (2019, April 4). Amazon Project Kuiper broadband satellite. Retrieved from GeekWire: https://www.geekwire.com/2019/amazon-project-kuiper-broadband-satellite/ Ciena. (2019). Liquid Spectrum. Retrieved from Ciena: https://www.ciena. com/products/liquid-spectrum/ Ciena. (2019). What is coherent optics. Retrieved from Ciena: https://www. ciena.com/insights/what-is/What-Is-Coherent-Optics.html Daniel Victor. (2019, 1 31). Could You Last 11 Days Without the Internet? Tonga Finds Out the Hard Way. Retrieved from New York Times: https:// www.nytimes.com/2019/01/31/world/asia/tonga-internet-blackout.html ICPC. (2019). About the ICPC. Retrieved from ICPC: https://www.iscpc. org/about-the-icpc/ Mathi, S. (2019, April 3). The future of undersea Internet cables: Are big tech companies forming a cartel? Retrieved from APNIC Website: https://blog. apnic.net/2019/04/03/the-future-of-undersea-internet-cables-are-big-techcompanies-forming-a-cartel/ McCormick, R. (2017, May 4). SpaceX satellite internet launch 2019. Retrieved from The Verge: https://www.theverge.com/2017/5/4/15539934/ spacex-satellite-internet-launch-2019 SubCom. (2019, April 8). Subcom to deliver HFC SDM for Google’s Dunant system. Retrieved from Submarine Telecoms Forum: https://subtelforum.com/ subcom-to-deliver-hfc-sdm-for-googles-dunant-cable/ Telegeography. (2018). Global Internet Map 2018. Retrieved from Telegeography: https://global-internet-map-2018.telegeography.com/ The Economist. (2017, April 25). Deep-sea mining could transform the globe. Retrieved from YouTube: https://www.youtube.com/watch?v=IYKaKeJv2dQ Wikipedia. (2019). Bernard of Chartres. Retrieved from Wikipedia: https:// en.wikipedia.org/wiki/Bernard_of_Chartres
LAURIE MILLER was appointed to the position of President and Chief Executive Officer for Southern Cross Cable Network in February 2019. Prior to his role as President and CEO of Southern Cross, Laurie held key roles as Head of Wholesale and Interconnect in 2degrees Limited and as President and Country Manager in Sparks’ former US operation, Telecom New Zealand USA Limited, in California. Laurie has an extensive background in management and sales and over a 27-year career in the International Telecommunications Industry starting with Telecom New Zealand in 1991.
SOUTHERN CROSS CABLE NETWORK What’s
NEXT?
THREE systems ONE integrated eco-system
Sydney - Auckland - Los Angeles Fiji - Tokelau - Kiribati
affordability The Southern Cross NEXT project is adding a direct Sydney-Auckland-Los Angeles route to the existing dependability Southern Cross fully redundant eco-system allowing customers tolatency take advantage of cost effective, lowest latency, highest capacity, and resilient submarine cable capacity solutions between Australia, New Zealand, resilience the Pacific Islands and the US West Coast. flexibiity Want to know more about ‘What’s NEXT’? www.southerncrosscables.com MAY 2019 | ISSUE 106
35
FEATURE
TRANS-PACIFIC MARKET CAPACITY:
Innovating and Adapting in the Face of Challenges
A
PTelecom sees the Trans-Pacific market changing dramatically over the next twenty-four months. In excess of 40 new fiber pairs will come into service on at least 6 new cable systems, adding over 800 Tb of capacity across the Pacific given new builds underway from HKA, PLCN, B2B, RTI, and other systems not yet announced publicly. From a routing perspective, the majority of this new capacity is planned between Hong Kong and California, yet we are now seeing the development of routes opening up directly connecting Singapore to California. The aim here it seems to be, is to address the risks associated with the Luzon Strait and the South China Seas. In the background, India has a desperate need to replace antiquated infrastructure and these new systems planned to directly connect Singapore to the United States may well provide the answer at what appears to be the right time, given the recent announcements of new builds between India and Singapore. An interesting point to consider, is with the amount of capacity coming into service Trans Pac will be massively disproportionate to the amount of Inter Asia-Capacity between Singapore, Hong Kong and Japan. This should spur on additional investment in new systems on the thickest routes in Asia, being the ‘triangle’ between Singapore, Hong Kong
36
SUBMARINE TELECOMS MAGAZINE
BY ERIC HANDA
and Japan. SJC2 will simply not be enough, especially if we layer on top of current Asia – US forecast demand the current moves being made by Chinese content players reaching into South East Asia to grow their businesses, intra-Asia is a long way from being over-serviced with capacity. APTelecom anticipates Trans-Pacific pricing coming close to parity when compared to the North Atlantic in the midterm and for the first time, the North Pacific - Asia connectivity and North Atlantic connectivity will have similar pricing scenarios, yet very different demand profiles will continue to prevail. Asia - US will continue to outstrip EU - US demand due to the ever-increasing tele-density rates and need for streaming and the delivery of content in emerging markets. Our view of current pricing in the Pacific in 2019: Japan – USA: Lease 100G = US$15,000 (monthly) Japan – USA: IRU 100G = US$600,000 (IRU) Some views: • Trans Pac will see greater price decline than what has been a very consistent negative CAGR of 17.5% per annum. It could reach close to 30% or more 2021 onwards or even sooner • Traditional Trans Pac buyers are largely in a ‘wait mode’ to see what happens to price points as this new capacity
comes into the market. This is creating opportunity and demand for one- and two-year leases to bridge the timing gap between now and the targeted RFS dates of the new Trans Pac systems • Swapping by non-traditional players is becoming more of a currency and this trend should gather additional momentum as these new systems come into service • Ownership economics and a cost + model continue to be sought after on new builds for quarter pair spectrum buyers and above • Diversity remains key, yet finding diverse landings are proving more challenging in particular in locations that are small in land mass - i.e. Singapore. Other parts of Asia may fill this void as concerns remain over SPOF (single points of failure). There is certainly potential for Malaysia and Thailand to act as a bypass to Singapore on routes from India destined for Hong Kong and Japan • Entitlements such as upgrade rights are becoming more important • Many pairs may not be utilized initially, and this offers unique challenges in meeting capital recovery targets and O&M obligations over the life of the planned new systems coming into service Trans Pacific • APTelecom sees a migration to 400G and 1Tb Super Channels within 3-5 years or less. This will also add to compound capital recovery targets for system developers • Myanmar, Vietnam, Thailand, Indonesia, and PNG remain in need of new and diverse supply and are currently underserved • Future demand of IoT, M2M, and in particular AI (Artificial Intelligence) and eGames will drive consumption • 5G impacts are going to be felt in 2020 and beyond in the Asia Pacific region and will serve to also drive demand intra-Asia and across the Pacific immensely The long-term challenge in the Pacific will ultimately be build cost economics. Once we reach a point where the price points of capacity cannot justify the cost of building, something will have to give. Either the cost of systems will have to re-align with the cost of capacity or indeed, the price of capacity will need to stabilize. The Atlantic is just about there now. For quick comparison, let’s consider the two routes: New York - London 100Gb IRU $280,000 ~5,500km $50 p/km Hong Kong - Los Angeles 100Gb IRU $1,300,000 ~11,600km $112 p/km It’s a large delta, but not for long. The actual build costs across the Pacific look something like ~$300,000 per 100Gb depending on fiber count and technology deployed, so it’s easy to argue that there is room for accelerated price
decline. However, the flaw in this assumption is that it assumes 100% utilization of every system, and as we all know, this simply never occurs. This coupled with the sheer amount of fiber being deployed further compounds the build cost economics conundrum. Further down the eco-chain, let’s take a quick look at wholesale capacity sellers. Are the days of wholesale arbitrage over? APTelecom doesn’t believe so. There will always be new entrants looking to obtain SDH style services. We will see the emergence of more gaming and movie platforms tailored to specific markets and we are also fielding requests for SDH capacity from large enterprise that would traditionally buy layer 3 services from carriers. As the market becomes savvier and less dependent on carriers muxing services, these ’new players’ will most likely replace the old guard. Software defined Networks (SDN) technology and cloud-based services are enabling new market entrants and lowering the barriers to entry for competing in a highly complex eco-system. In summary, the future for the trans-Pacific appear set to shift to an over-supply and depressed pricing cycle. But, how many of us thought that when we saw the step-change from DS3’s to 10Gb wavelengths? The industry will continue to innovate and adapt in the face of challenges like those outlined above and that, I would suggest is why we all enjoy being part of it. STF As Co-Founder and CEO, ERIC R. HANDA has built APTelecom (www.aptelecom.com) into a globally recognized leader in telecom consulting. Since launching in 2009, Handa has grown APTelecom from a start-up business to an award-winning global organization which has generated over US $315 million in sales for clients and has been named the Sales Team of the Year by the Global Customer Sales and Service Awards, as well as a Silver Award winner of the 2014 Fastest Growing Company EMEA by the Best in Business Awards. Telecom Review Magazine awarded APTelecom the Best VAS Consulting Company in 2016 and 2017. APTelecom has pioneered financing options for new submarine cables with off-take pre-sale agreements, IRU options with economies of scales (upgrade rights) and fixing distressed assets for existing submarine cable systems. Handa has been instrumental in helping APTelecom achieve scale on a global level, client reach now covers every continent on the globe, and along with other APTelecom executives, Handa has made in-country visits in more than 50 countries to support clients across the world. Handa is an experienced telecommunications executive with expertise spanning global management, sales, and leadership roles. Prior to founding APTelecom, Handa worked for AT&T, Tyco Electronics, Tata, and Bharti Airtel in a number of senior operations, research, and sales assignments. Handa has covered, and resided (fourteen years overseas Hong Kong, Singapore, London) in a multitude of primary and emerging. He is an expert contributor to Wired.com’s “Innovation Insights” section and is regularly quoted by the most prestigious global media outlets in the world on the topic of telecom in emerging markets, including Entrepreneur Radio, Bloomberg, BusinessWeek, Telecom Review North America, SubTel Forum, CommsDay, and Fierce Telecom. Handa is a Pacific Telecom Council (PTC.org) innovation awards judge. APTelecom has also developed a culture of giving back and established its signature “State of Subsea” series, which is a 501c charity. APTelecom has donated more than 10% of its profit annually since inception (www.stateofsubsea.com). Handa is an avid supporter and volunteer of Habit for Humanity and Bloom Again Foundation.
MAY 2019 | ISSUE 106
37
FEATURE
SDM: A REVOLUTION FOR THE SUBMARINE INDUSTRY BY PASCAL PECCI AND OLIVIER COURTOIS
W
e need more capacity! Demand keeps on increasing…. You have probably heard this a thousand times, and this message, regularly justified by Moore’s law, is more than ever a reality in 2019 and for years to come. Indeed, several new technologies around the corner such as virtual reality, 4K on smartphones and the Internet of Things (IoT), will lead to a hugely increased demand for bandwidth capacity worldwide, with a strong impact specifically for the submarine cables industry that transports almost 100% of the Internet traffic. Let’s not forget as well traffic resulting from machine-to-machine (M2M) interaction that is now overtaking human-related traffic. This article explains the evolution of the submarine industry during the last 10 years, that recently led to the emergence of the SDM solution. SDM Capacity vs OSNR (Optical Signal to Noise Ratio) (Spatial Division Multi-
38
SUBMARINE TELECOMS MAGAZINE
plexing) was introduced for the first time by ASN as a product in 2017, and has been since picked up on many recent projects. Indeed, the submarine industry had not seen such a wave of change for a long time, but something is definitely happening with SDM now becoming the reference in the subsea cable world. Those 3 letters were on everyone’s lips during SubOptic 2019 last April in New Orleans, proving this is not just one more buzzword, but a real game changer for the whole industry.
FLASHBACK TO 2010-2017
2010 was the beginning of the coherent era in research and very quickly became a product, leading to a quick evolution of the capacity per wavelength. In some cases, it was multiplied by 10 (from 10G to 100G), 15 (from 10G to 150G) and even for some happy customers by 20 (from 10G to 200G). The modulation
formats today known as the classical ones were: BPSK, QPSK, 8QAM and 16QAM. In 2020, they will all be replaced by modulation formats based on probabilistic constellation shaping (PCS) that can get closer to the Shannon limit, allowing the customers to extract the best capacity from the cables. Capacity vs OSNR (Optical Signal to Noise Ratio) In order to cope with the growing needs for capacity, the wet plant optimization was first done by optimizing the design on a per-FP (fiber pair) basis, where the typical design relied on operating the optical repeaters roughly 1dB below the optimum power ( the optimum being a compromise between maximizing signalto-noise ratio and non-linear effects). There was no need to go to the optimum of the bell curves, since only a few Gigabits would be gained and the power consumption
should be increased by 20%. The second step to reach the requested cable capacity was to increase the number of FPs into the cable, from 2 to 4 FPs or more.In 2017, the average number of FPs into a cable was about 6. As the request for capacity continued to grow,thanks to the introduction of coherent transponders that can compensate for line fiber chromatic dispersion, submarine cables with only +D fiber started to be built. This allowed to simplify the management of the line fiber (no more +D/-D or NZDSF fibers) and also to improve the performance in combination with coherent 100G to achieve higher capacity. The effective area of the fiber gradually increased from 110µm² to 130µm², getting close to the multimode limit with 150µm² fibers. This effective area increase automati-
MAY 2019 | ISSUE 106
39
FEATURE cally induces capacity increase, which is also facilitated by reducing the attenuation of the fiber, from 0.180dB/km to 0.144dB/km. In order to fully benefit from these nonlinearity-tolerant fibers, the TOP (Total Output Power) of the repeaters should be increased beyond +20dBm. Finally, ongoing improvements on the transponders side, where we can foresee efficient compensation of nonlinear effects becoming available in the years 2020+, lead to designing systems to operate beyond the optimum at the beginning of life (BOL) of the system. As a summary, up to 2018, standard designs to answer the demand for higher capacity in the submarine industry were based on a per-FP optimization using: • Average number of 6 FPs in the cable • Effective area of 150µm² • Attenuation of the bare fiber around 0.15 dB/km • Very high power repeaters: > +20dBm • Optimization beyond the BOL optimum
THE SDM NEW PARADIGM
As capacity demand keeps increasing, the first solution proposed to the market was based on expanding the WDM (Wavelength Division Multiplexing) technology introduced in the late nineties with the addition of the “L” transmission band, so that the so-called “C+L” systems would provide twice the optical spectrum. This solution was interesting as it leverages the linear part of the Shannon formula (BW ) to increase the capacity, which is better than the SNR part. Nevertheless, the introduction of mux and demux devices, required to add the L band, leads to additional losses, thus reducing the efficiency of the solution. Additionally, going to C+L means that a FP will transport around 40 to 50Tb/s. In practical terms, such a big pipe would be split between 2, 4 or even 10 customers in order to offer 4Tb/s capacity for each customer. The old discussion of who will have the best portion of the fiber (C or L spectral band) would naturally resurface, as well as delicate discussions about one’s traffic potentially impacted by the other’s traffic. ASN chose another approach, which is to also use the linear part of the Shannon formula, but multiplying the number of FPs into the cable. Indeed, the basic underlying concepts of SDM were introduced three years ago, during SubOptic 2016, where we proposed a disruptive design approach: putting 16 fiber pairs in a 17mm submarine repeatered cable. During the following years, several major players were looking for high-capacity and cost-optimized systems, requiring new system designs and stepping stones towards what would become SDM a few months later. SDM was explicitly un-
40
SUBMARINE TELECOMS MAGAZINE
veiled in February 2018, and subsequently shared and discussed with the whole submarine community in submarine industry events that year.. So what are the key elements of the SDM solution?
THE SDM SOLUTION: BUILT UPON 3 PILLARS
The SDM solution is based upon 3 pillars. The first pillar is the number of fibers pairs within the cable. In 2018, the average number of fiber pairs within installed cable was 6. In 2019, a 16FP system will be available for new systems, which is fully in line with the SDM solution. Essentially more FPs within the cable will bring greater capacity to customers at a lower price. The second pillar is the line optical fiber and to be more specific, the type of fiber. In addition to the high effective area fibers that can handle higher optical power and can transmit high capacity per fiber, we are proposing to use new fibers that will improve the cost per bit, and the number of fibers that can be cabled, to have “the right fiber type for the right fiber capacity”. The third pillar of the SDM solution is the repeater. Essentially an innovative architecture based on optical cross-connection allows us to implement pump farming to a bundle of FPs, efficiently delivering the power required: “the right power to the right fiber”. These 3 pillars contribute to a stable and reliable solution where SDM allows to offer the right cable with the right amount of power for each fiber with a lower cost per bit. The SDM paradigm: impact on the industry SDM really is a revolution for the submarine industry, impacting several key components: optical line fiber, repeaters, branching units and SLTE (Submarine Line Transponder Equipment). On the optical fiber front, moving away from 150µm² premium fiber, the volume demand for fibers with lower effective area (80-110µm²) has more than doubled when switching from 6 to 16 FPs. On the SLTE front, since the system design optimization is set 1 or even 2dB before the optimum, the nonlinear effect (NLE) compensation feature is not mandatory anymore. Additionally, the spectral efficiency has been divided by a factor of 2 going from ~5 b/s/Hz to 2.5-3 b/s/Hz. Finally, since the targeted OSNR is lower (12-15dB/0.1nm for 120 channels), the achievable distance is now well above 15,000km. Considering the branching units usually associated to WSS ROADM (Wavelength Selective Switch Reconfigurable Optical Add and Drop Multiplexer) units, for which granularity is at the wavelength level, we can slowly see a shift to fiber-level granularity with the introduction of FP-switching branching units, where a FP can be switched
from the trunk to the branch and vice-versa. It sounds logical since from a business point of view, it is easier for customers to swap FPs and also to sell FPs, since the FPs have lower capacity than with the standard (non-SDM) design. FP management also brings independence with respect to the other FPs. Finally, operating with lower OSNR in SDM designs compared to the standard designs minimizes impact on the optical line when an optically transparent extension of to the PoP is requested. Indeed, the noise brought by the extra terrestrial kilometers generate a smaller penalty with SDM design compared to the conventional approach.
THE FUTURE
As the capacity transported around the world keeps increasing, what’s in store for future submarine cables? We expect a second step for SDM with more FPs within the cable , and then in the longer term, a third step with the introduction of multicore fibers. Multicore fiber will bring the benefit of limiting the outer diameter of the cable, which otherwise could make it very expensive. In order to reach these future SDM steps, more electrical power should be launched into the cable, by increasing the voltage or by using lower resistivity cable. These steps will be necessary to achieve 500 Terabit/s cables, or even 1 Petabit/s cables.
CONCLUSION
The SDM solution is revolutionizing the traditional submarine network design paradigm. It is a disruptive solution, where an innovative design approach allows to optimize the cost per bit. SDM offers higher capacity to the customers, and extends the capability of networks with more flexibility owing to switching granularity at the FP level. SDM enables an efficient optical and electrical design, bringing the transmission performance very close to the Shannon limit. SDM is an efficient and scalable solution with a 10-year evolution path, leading to continuously growing number of fiber pairs and additional features to further improve the networks efficiency. STF
DR PASCAL PECCI is Technical Products Manager for Alcatel Submarine Networks. After his PhD in 2000, Pascal Pecci started working for Alcatel Research and Innovation on 40G transmission in optical fibre and had 2 world records transmission. After 9 years in R&D he joined the Product Line Management team to become a PLM of the Alcatel Lucent design tools for terrestrial networks. In 2013, Pascal Pecci joined the Submarine division of Alcatel-Lucent, where he defined the design rules for submarine and designed many advanced networks on Atlantic and Pacific oceans. He wrote a chapter entitled “ULH submarine transmission” in “Undersea Fiber communication systems” book edited by José Chesnoy and had articles in recent Suboptic, OFC and ECOC.In 2018, he joined the submarine PLM team of ASN to promote technically the ASN products. OLIVIER COURTOIS is Director of Product Strategy, Management and Marketing for Alcatel Submarine Network. He graduated from French engineering school “Ecole Supérieure d’Optique” in 1995 where he specialized in Optics. In 1998, he joined Alcatel-Lucent and led system design activities for WDM product development from 10 to 100Gbs/s & ILA/ ROADM technologies during almost 10 years. He joined the submarine division in 2007 as product line manager for transoceanic systems. He is working on telecom solutions to introduce more fiber pairs, pump farming, aluminium conductor cable, ROADM, probabilistic constellation shaping, X00G/1T, POP to POP and SDM solution. He published ~15 patents in Europe and US on WDM, presented different papers for international conferences and is Distinguished Member of Technical Staff (DMTS)
MAY 2019 | ISSUE 106
41
FEATURE
BEHIND THE LENS AT SUBOPTIC 2019 BY DIANA HERNANDEZ
REGISTRATION & WELCOMING CEREMONY
From registration, to networking, panels and finally the entertaining Welcome Reception; the first day of SubOptic 2019 set the pace for the rest of the conference.
42
SUBMARINE TELECOMS MAGAZINE
MONDAY
MAY 2019 | ISSUE 106
43
FEATURE
BEHIND THE LENS AT SUBOPTIC 2019 OPENING CEREMONY, PANELS, POSTER RECEPTION
The Opening Ceremony was very well attended; the energy was electric and the speaker Gary Smith of Ciena was dynamic and engaging. The ceremony was followed by the Exhibit Hall Opening, panels and the Poster Reception.
44
SUBMARINE TELECOMS MAGAZINE
TUESDAY
MAY 2019 | ISSUE 106
45
FEATURE
BEHIND THE LENS AT SUBOPTIC 2019 KEYNOTE SPEAKERS, ROUNDTABLES, MARDI GRAS PARADE AND GALA
Wednesday proved to be a day to remember. It was the pinnacle of SubOptic 2019, the events of the day everyone was looking forward to! Beginning with the keynote speakers Amber Case, The MythBusters, panels, roundtable discussions followed by an experience that could only be found in NOLA -The Mardi Gras Parade and Gala Dinner hosted at the historic Antoine’s.
46
SUBMARINE TELECOMS MAGAZINE
WEDNESDAY
MAY 2019 | ISSUE 106
47
FEATURE
BEHIND THE LENS AT SUBOPTIC 2019 KEYNOTE SPEAKER, CLOSING CEREMONY
Thursday resonated with stories of fun had by all at the previous nights Mardi Gras Parade and Gala Dinner. SubOptic 2019 wrapped up with a day of panels, keynote speaker Vinton Cerf, the small business networking reception and the Closing Ceremony. All in all, the entire week proved to be a resounding success. The good times definitely did roll!
48
SUBMARINE TELECOMS MAGAZINE
THURSDAY
DIANA HERNANDEZ of ddk Photography and her team accomplished photography and video streaming at SubOptic 2019 in New Orleans, Louisiana. She is a member of the Professional Photographers of America and her focus the past fifteen years has been Portrait and Event photography. “For me, photography is about building relationships, it’s not just another photoshoot. I’m not just freezing time; I’m creating a memory and telling a story. I love what I do, and I hope it comes through in my images. I love connecting with people and getting to know them; which I find is the easily done behind the lens!”
MAY 2019 | ISSUE 106
49
FEATURE
Excellence in Industry Best Poster Award Winner:
EVALUATION AND OPTIMISATION OF THERMAL MANAGEMENT IN HIGHPOWER REPEATERS
BY IAN WATSON, LEO FOULGER, DAVID WALTERS AND PETER WORTHINGTON
A
been good agreement between the analytical model and the bstract: The current trend towards high capacity and results from practical trials, so that accurate temperature high fibre count systems is driving the demand for rise predictions can now be made for a given set of repeater high-power repeaters dissipating an electrical power housing materials and dimensions, and burial conditions. of 80W or more. The inevitable rise in temperature of the pump lasers and other key components that will result from this increase in power needs to be understood and quantiTHERMAL FLOW FROM A BURIED REPEATER fied in order to ensure that the high reliability required for The heat produced in a repeater buried in sediment will submerged plant can be maintained. For a buried repeater, flow into the infinite heat-sink of the seabed. one of the most significant thermal interfaces is the heat Physically, the repeater is a horizontal metal cylinder flow out of the seacase and into the seabed through the of known dimensions (length L and diameter d), buried burial sediment. This can result in one of the largest rises in in sediment at a depth H below the seabed. The thermal temperature and is generally the conductivity C of the sediment least well-defined and understood will be more than an order of of all the thermal flow-paths from magnitude lower than that of any the critical components to seabed metal repeater seacase material. ambient. Work has been done The ends of the cylinder will on theoretical modelling and be attached to cables via metal direct practical measurements, couplings. Some heat will flow including a full-scale land-based though those couplings but most repeater burial trial, to obtain a will flow into the sediment from much better understanding of this the curved surface of the repeater. key thermal interface. There has The total electrical power in Fig. 1: Thermal Flow from a Buried Repeater
50
SUBMARINE TELECOMS MAGAZINE
Copyright © SubOptic 2019
watts divided by the temperature difference between the seabed and the outside of the repeater seacase gives the thermal conductance Cth (measured in watts per degree) from the repeater to the sea. For a given set of repeater dimensions, burial depths and sediment conductivities, Cth can be calculated theoretically by treating the seacase as an isothermal surface and solving Poisson’s equation for those conditions. This calculation could be done by finite- element or other numerical techniques, but a clearer mathematic model of the physical system can be obtained by an analytical approach.
ANALTYICAL MODELS OF THERMAL FLOW
For a model in which the sediment is considered as a medium which does not significantly absorb heat itself, but simply conducts it to the infinite heat-sink of the seabed, the solution of Poisson’s equation gives the following expression for the thermal conductance: Cth = 2πC.L/COSH-1(2H/d) (1)
heatsink of the seabed. Cth = W/T (3) In an experiment or trial in a material of known thermal conductivity, W can be set and T can be measured, to enable Cth to be found from equation (3). A value of ‘Sphere diameter’ D can then be calculated from equation (2), and this is referred to as the ‘Equivalent Thermal Diameter’, ETD, of the repeater. ETD = Cth/(2πC) (4) The ETD is the diameter of a sphere that would have the same thermal conductance to the seabed as that of the repeater, when buried in sediment with the same uniform conductivity C. The repeater is of course a cylinder rather than a sphere, so it will not transmit heat as uniformly into the sediment as a perfect sphere would. But nevertheless, it would seem to be reasonable to calculate the diameter of a sphere that would have the same geometrical surface area as the cylindrical repeater and this should provide a reasonable (though slightly high) estimate, Dgeom of the value of the ETD as given by equation (4). From simple geometry:
This formula is the thermal equivalent of the electrical analogue for the capacitance of a cylinder of length L and diameter d at a distance H from an infinite conducting plane. Equation (1) is the correct one to use for the situation of shallow burial, where the burial depth is (Dgeom)2 = d.(L + d/2) (5) comparable to or less than the repeater diameter. But for depths If this analytical approach is greater than that, which would broadly correct, then Dgeom and always be the case for deliberate reETD should be close to each othpeater burial, it will give pessimistic er, certainly to within much better (i.e. too low) figures for conducthan an order of magnitude. tance because in that situation the It was considered prudent to heat flow into the sediment in all test the validity of this analytical directions needs to be considered, theoretical approach by a smalland the sediment will be absorbing scale experiment before embarking the heat as well as conducting it, Fig. 2: Radial Heat Flow from a Sphere on a full-size repeater burial trial. eventually, to the seabed. For a sphere with diameter D feeding heat into an effectively infinite uniform medium INITIAL SMALL-SCALE TEST with thermal conductivity C, simple integration gives a therA 1/10-scale metal housing was machined, with a sealed mal conductance to infinity of: central cavity that contained electrical resistors that could be powered up to about 11 watts. Four-wire electrical conCth = 2πD.C (2) nections were made to the resistor and a thermocouple was attached to the outside centre of the housing. The housing was buried in a tank of wet sand, as shown THE CONCEPT OF ‘EQUIVALENT THERMAL DIAMETER’, ETD in fig. 4. The thermal conductance Cth is simply the total electrical power W divided by the temperature difference T between the outer surface of the repeater and the infinite MAY 2019 | ISSUE 106
51
FEATURE The temperature at the housing surface rose as soon as the electrical power was applied, and after approximately 90 minutes it had settled to a ‘reasonably asymptotic’ level, at around 1.6°C per Fig. 3: One Tenth-Scale Housing watt of power. The results from a number of these small- scale tests gave figures consistent with the theory described in sections 2 and 3, for sand with a thermal conductivity of around 2.5W/m/K and for the value of ETD comparable to that of Dgeom. This gave confidence that a full-scale burial trial under controlled conditions would be a useful exercise to confirm the key factors affecting repeater temperature rise in service, and to enable meaningful predictions of temperature rise to be made.
LAND-BASED BURIAL TRIAL
It was decided to bury an experimental repeater, with thermocouples monitoring key locations inside and outside the repeater, in a large tank that was available as part of a test facility. Fig. 5 shows the repeater lying 1m above the bottom of the tank prior to the operation of completion of the filling of the tank with a total of approximately 35 cubic metres of builders’ sand. A water bath maintained at a constant temperature was then placed over the burial arrangement to simulate the seabed heatsink. It was of course necessary to know the thermal conductivity of the sand surrounding the repeater, and the positions of 8 sensors to enable that to be done are shown in the following diagram. The principle used for these conductivity sensors, which also acted as temperature sensors during the repeater powering trials, is described in the following section.
Fig. 4: Small-Scale Burial Test
Fig. 5: Construction of Full-Scale Burial Trial
MEASUREMENT PRINCIPLE FOR THERMAL CONDUCTIVITY
The 8 conductivity sensors were 30mmdiameter metal spheres containing electri-
52
SUBMARINE TELECOMS MAGAZINE
Fig. 6: Constant-Temperature Water Bath, Prior to Covering
cal resistors to be used as heaters, with thermocouples mounted on the surface of the sphere. A typical sphere is shown in the following photograph. Four-wire electrical connections were made to the resistors so that measurements of current and voltage could be made, and this gave an accurate figure for power dissipation, which was adjusted to be close to 6W. Each k-type thermocouple was connected to a channel in a multi-channel data logger, which also monitored all other temperatures and voltages of interest throughout these trials. Graph 1 shows the temperature-rise characteristic of two of the conductivity- measuring sensor spheres. The thermal conductivity of the burial material in the vicinity of each of the sensor spheres was measured by powering the sensors one at a time, with no power applied to any of the other sensors or to the repeater. As can be seen in the graph, the temperature at the surface of the spheres rose rapidly at first and then after some hours it settled to a point where a steady-state asymptote could be deduced. This characteristic is what would be expected from a solution of the diffusion equation in a system with 3-D spherical symmetry. From equation (3), dividing the power dissipated by the rise in temperature of the sphere gives its thermal conductance Cth to infinity. The conductivity of the medium in its vicinity can then be found using equation (2) since in this case the sphere diameter D is known accurately to be 30mm. It was found quite consistently that the rise in temperature of any buried sphere, 40 minutes after application of the power, had reached around 88% of its final ‘Asymptotic’ value. This enabled the thermal conductance measurements to be made in a reasonably short time, so that the conductivity in the vicinity of all 8 spheres could be measured in one day.
Copyright © SubOptic 2019
Sand conductivities measured using these spheres in the burial tank gave an average figure of around 1.8W/m/K, with some significant variations depending on water content and compaction, and these factors varied to some extent with time as might be expected. But the 1-day conductivity measurements could be done before and after each repeater-powering trial to give a figure for the effective conductivity of the burial medium with adequate accuracy.
COMPARISON WITH A CALIBRATED THERMAL CONDUCTIVITY PROBE
Fig. 7: Positions of Thermal Conductivity Sensor Spheres
regions of the burial pit close to the measurement spheres, and although there was quite a spread in results from individual measurements with the probe, the means of these results were remarkably close to the results from the sphere method. As an example, the displayed probe result in the photograph shows a mean of 1.75W/m/K in a region close to a sphere which gave a result of 1.79W/m/K from the 40-minute measurement method. This cross-calibration check confirmed that the 40-minute measurements on each sphere gave an accurate indication of the thermal conductivity of the burial material in its vicinity. The spheres could therefore be used to give reliable figures for conductivity in the regions surrounding the repeater, and measurements using these spheres before and after repeater powering trials would enable the thermal performance of the repeater to be accurately quantified.
The method described in the last section for measuring the thermal conductivity of the burial medium was repeatable and Fig. 8: Thermal Conductivity Sensor Sphere consistent, and gave plausible results. But because it was not a formally standardised measurement method it was necessary to compare the results obtained by this method with those made using a calibrated instrument which used a recognised standardised technique. REPEATER TEMPERATURE A system using a thermal needle RISE RESULTS probe to measure conductivity by The buried repeater described the transient line source method in in section 5 was powered with a accordance with ASTM D5334 (ref. current of 0.65A, resulting in a 1) was hired, to compare its results voltage drop across it of 127V and Graph 1: Temperature Rises on Powering of 2 of the Sensor Spheres with those measured by the hence a power dissipation sphere technique. of 82.55W. Temperatures at This transient technique several key locations inside has the advantage that the and outside the repeater measurement time is of the were all monitored by the order of a few minutes rather logging system. than the significantly longer After 6 days of powering, time needed for the sphere all of the thermocouples method, a number of separate showed that ‘steady-state’ measurements are made asymptotic temperatures had automatically with the been reached. probe, and the mean and The build-ups of temperastandard deviation calculated. tures at the seacase centre Several measurements bottom and at the end bulkFig. 9: Calibrated Conductivity Probe in Fig. 10: Display of Measured Thermal were made with the probe in heads are shown in graph 2. the Burial Sand Conductivity MAY 2019 | ISSUE 106
53
FEATURE The derived ETD, at The maximum tempera91.5% of Dgeom, therefore ture rises recorded at each corresponds remarkably of the locations of interest well to the qualitative are displayed in Chart 1. prediction made in section It can be seen from chart 3, and this confirms the 1 that the bottom of the validity and accuracy of repeater reached a slightly the analytical approach higher temperature than adopted. the top, and this was due primarily to the variation of sand conductivity around EXTENSION TO OTHER REthe repeater. PEATER DIMENSIONS It can also be seen that AND POWERS there was a quite signifiThe outside centre cant temperature difference of the trialled repeater Graph 2: Temperatures at Seacase Bottom and Bulkheads between the inside and seacase rose in temperaoutside of the repeater. ture by ~16°C above That is due mainly to the ambient when powered low thermal conductivity at 82.6Watts and burtypical of polyethylene HV ied in a medium with a insulating liners, hence the thermal conductivity of desirability of qualifying a 1.83W/m/K. Because new material for this apof the good agreement plication (ref. 2). It should between the analytical be noted that an insulatpredictions and measured ing material on the outresults, it is now possible side of the seacase would to predict temperature also result in a rise in the rises for different repeater temperature of the repeater dimensions, powers and internals. The seacase used sediments conductivities. in these trials was This can be done simply Chart 1: Maximum Temperatures Reached After 6 days Powering titanium, which like all by making the reasonable metals has a relatively high assumption that, for a thermal conductivity compared to insulating materials and cylindrical repeater, the ETD will be close to around 90% burial sediment. of Dgeom in all practical cases. Results of some of these predictions are shown in the following graph. Graph 3 shows the predicted temperature rises against ETD OF THE TRIALLED REPEATER The repeater top rose in temperature by 15.9°C, giving length for three different central seacase diameters, for a 150W repeater buried in sediment with a conductivity of a conductance figure from equation 3 of 5.19W/K. Cor1W/m/K. responding figures for the repeater bottom were 18.0°C It needs to be remembered that these predicted temand 4.59W/K. Conductivity measurements directly above perature rises are for a buried metal seacase alone. All other and directly below the repeater were 1.83 and 1.61, and significant thermal paths, such as the insulating liner (ref. applying equation 4 to these figures gives an ETD of 2) or an additional coating on the outside of the repeater, 0.452m in each case. The trialled repeater had a total surface area of 0.767m2, would result in further temperature rises additional to those shown in the graph. taking into account the variation in outer diameter over its length. This gives a geometrical sphere-equivalent diameter Dgeom of 0.494m, compared with the deduced ETD of 0.452m.
54
SUBMARINE TELECOMS MAGAZINE
Copyright © SubOptic 2019
SEDIMENT CONDUCTIVITY IN PRACTICE
which shows the temperature rise of the repeater to be independent of depth and related to the surface area of the repeater. It is clear from these trials and analyses that thermal design of the repeater, and the thermal effect of repeater burial, are important factors to take into account as repeater electrical powers increase. The rise in temperature of a 150W repeater simply resulting from the burial of the metal seacase alone is likely to be 40°C or more, and other interfaces, such as the internal insulating liner or any coating on the outer surface of the seacase, will increase this temperature rise. The physical design of the repeater and the qualification of critical components will always need to take into account these temperature increases. STF
The major uncertainty in any estimation of the rise in temperature due to burial of a repeater under working conditions is very likely to be the figure for the thermal conductivity of the burial sediment. Ocean sediment is generally regarded as having a conductivity of 1W/m/K or Graph 3: Seacase Temperature Rise Predictions for Different Repeater Dimenmore, and this is consistent sion Options with the measurements made during these burial trials, though figures down to 0.8W/m/K have been reported (ref. 3). Thermal conductivity has generally been considered to be strongly dependent on water content, and so some measurements using the small-scale tank described in section 4 were carried out to test this, using one of the sphere sensors in sand at varying degrees Graph 4: Variation of Thermal Conductivity with Water Content of saturation. The result obtained are shown in the REFERENCES ASTM Standard D5334 Standard Test Method for Determination of Thermal following graph. Conductivity of Soil and Soft Rock by Thermal Needle Probe Procedure. It is clear from this that at the levels measured there is a linear relationship between water content and sand con- I Watson, D Walters and P Worthington, ‘A New High-Voltage Interfacing Liner to Improve Repeater Thermal Performance’, SubOptic 2019. ductivity. However, to know accurately the thermal conT Newson and P Brunning, ‘Thermal Conductivity of Deepwater Offshore ductivity of a medium in which a particular repeater was Sediments’, International Journal of Offshore and Polar Engineering, vol.14 buried, it would of course be necessary either to measure issue 04, December 2004. 04-13-4-310 that directly by some means or to know the water content of the actual sediment surrounding the repeater. Ian Watson is a Chartered Engineer and Fellow of the Institute of Mechanical In the absence of a definite figure, a value of 1W/m/K Engineering and has worked for the last 34 years within Submarine systems should be assumed, as was done for the graph in section 10. R&D. His career covers the STL research laboratories in Harlow, ASN and
CONCLUSIONS AND COMMENTS
Full-scale repeater burial trials and thermal conductivity measurements have been carried out to quantify the effect of repeater burial on the temperatures of critical components in repeaters operating at a high electrical power The trials have shown excellent agreement between the measured results and an analytical model for deep burial
Xtera. Ian is now Mechanical Engineering Manager for Huawei Marine Networks where he leads a multi-disciplinary cross-cultural team developing innovative solutions for the physical design of submerged plant.
MAY 2019 | ISSUE 106
55
FEATURE
Excellence in Industry Best Paper Award Winner:
VALIDATING EMERGING TRANSMISSION TECHNOLOGIES ON SUBMARINE CABLE SYSTEMS
BY PRIYANTH MEHTA, ANDRZEJ BOROWIEC, CHARLES LAPERLE, SANDRA FELDMAN, AND MICHAEL REIMER
A
BSTRACT: Transponder technologies are continually being developed with enhanced feature sets from multi-dimensional modulations to sub-carrier multiplexed probabilistically shaped constellations. In the transition between generations of product development, an extensive simulation and experimental study is completed to determine the performance impact for a new ASIC feature. Experimental validations are typically performed offline using capture-and- compute hardware in the lab or in the field on in-service cable systems. The simulators are ideally used to drive the transmit DAC waveforms and perform recovery on the waveforms captured by the ADCs in the receiver. However, the type of hardware and simulators employed can have dramatic effects on the results that aren’t necessarily demonstrated to the same degree in real-time technologies. This paper describes
the accuracy of offline technologies compared to real-time product performance. Finally, capture-and-compute systems are used in the field to demonstrate near term ASIC features improving system capacity through dry technology enhancements.
INTRODUCTION
Figure 1. Real-time coherent transmitter.
56
SUBMARINE TELECOMS MAGAZINE
Real-time coherent transmission technologies require a digital backend and analogue frontend. The digital component is driven by the ASIC, whereas the analogue components consist of DACs, ADCs, and electro-optic devices. Figure 1 and Figure 2 are high-level examples of coherent transmitters and receivers. In these examples, the electro-optic components stay relatively static in design and typically mature for higher bandwidth requirements. The ASICs however encompass a large array of features responsible for the
Copyright Š SubOptic 2019
multiplexers, adders, flip-flops, or basic logic functions [2] to form the ASIC. Recovery of the captured waveforms through floating point or fixed point simulators yields Figure 2. Real-time coherent receiver. an SNR. The margin is determined by the difference between this SNR and the Required SNR (RSNR) of the line rate or modulation format of interest. RSNRs are typically calculated through independent FEC simulators that produce a bit error rate threshold. The type of FEC simulated can have a wide array of METHOD net coding gains [3]; only FEC Figure 3 is an example of an offline designs that are implementable transmitter where the ASIC is replaced in the near term are considby a PC or offline DSP and the DACs Figure 3. Offline transmitter. ered. The BER is attained by a are provided by an arbitrary Monte-Carlo simulation of the waveform generator (AWG). The transmission format with a PRBS offline DSP generates an anasequence. A pre-defined amount logue waveform with the symbols of noise is added to degrade the encoded using the designed DSP SNR of the PRBS. Hard defeature set. The waveform is loadcision detection is used on the ed into the AWG which drives noise loaded PRBS to identify bit the electro-optical modulator to errors, forming a relationship begenerate an optical signal. tween SNR and BER. The RSNR Figure 4 is an example of of the system is the SNR due to an offline receiver. The optical Figure 4. Offline receiver. ASE noise (SNRase) required to signal from the coherent mixer is received by a real-time sampling achieve the FEC BER limit. oscilloscope which replaces the ADCs of Figure 2. The PC Capture and compute activities begin in the lab. An captures the waveform from the sampling scope, and proattempt is made to achieve system implementation and cessing of the field occurs in the DSP simulator. distortion penalties which align as closely as possible to the In the very early stages of transceiver development, the intended product specification. The penalties are measured simulator used to generate and process the transmit and through a process of optical noise loading. The ASE and receive waveforms uses high precision floating point calcurecovered receive SNR are used in a fit to: lations. The calculations may not necessarily perform blind recovery on the received symbols, but carrier recovery can RESULTS AND DISCUSSION be assisted by cross-correlation of the received symbols with the transmit symbols. This can often result in optimistic TECHNOLOGY VALIDATION performance. Furthermore, real-time ASICs are limited by finite-length digital time domain filters and are constrained to fixed point arithmetic [1]. For this reason, signal processing algorithms and error correction logic are specified with bit exact models in high level languages such as C and then converted to a register transfer language (RTL). The RTL description is broken down into smaller logic entities, as digital signal processing (DSP) of the generated and sampled optical fields. Advancements in CMOS feature sizes support larger and more complex DSP computations that can be integrated in the ASIC. Before CMOS integration can be achieved, DSP features are simulated over distributed computing resources to evaluate feature performance. Offline capture-and-compute systems are a simplified means for testing these ASIC features experimentally.
MAY 2019 | ISSUE 106
57
FEATURE A 400G geometrically shaped modulation is used to generate a high cardinality format to stress the capture and compute system. The Where � is the distortion and SNRm is the implementation SNR. Many factors such as amplitude response, phase response, DAC and ADC dynamic range, etc can affect � and SNRm. In the absence of straight line testbeds, field cable systems are an ideal environment particularly in the presence of foreign waves. The capture and compute system generate an optical field that is highly correlated with its real-time equivalent thereby introducing a comparable nonlinear noise. Back-to-back and field propagated performance is evaluated for next generation transceivers under both floating point and fixed point arithmetic. The digital recovery process of the received optical signal is shown in Figure 5. It is important to note that fixed point C- based simulators can take hours to evaluate an SNR through blind recovery whereas floating point recovery can be significantly faster. Floating point calculations are therefore used as an indicator of signal quality which Figure 5. Block diagram of receiver recovery. determine the valid waveforms to be used in more accurate product simulators. Signal is processed as described in Figure 6 where the difference between the local oscillator (LO) and the transmit laser frequency known as the intermediate frequency (IF) is established. Finally, the receive symbols are decoded and shown in Figure 8. Since the transmit symbols is known, an accurate SNR is determined by subtracting the receive constellation from the transmit to calculate the noise power. From the SNR, the BER is extracted using the aforementioned Monte- Carlo results. Both floating and fixed point recovery simulators are used to determine the Q margin as a function of OSNR for the 400G signal. The two simulators yield largely different results as seen in Figure 9. It is typically expected that floating point precision would yield significantly better performance
58
SUBMARINE TELECOMS MAGAZINE
as it isn’t subject to finite filter lengths, DSP taps, fixed point algorithmic noise, and quantization noise. For complex experiments such as tolerance to neighbouring channel cross-talk, three 400G waves were arranged in a back-to-back configuration using offline transmitters. The grid spacing was varied from 56 GHz to 75 GHz and a received Q factor was determined. The recovery was processed with a C-based ASIC simulator that formed the RTL of the real-time WaveLogic AI product. Figure 10 shows the result of the offline capture and compute crosstalk experiment, along with the same measurement repeated with a Ciena WaveLogic AI modem. The two data sets demonstrate good agreement with a slightly optimistic performance in the offline system. This difference can be attributed to nonidealities in the product’s analogue
Figure 6. Intermediate frequency estimation for carrier recovery.
Figure 7 shows the IF, followed by a 2x2 multiple input, multiple output (MIMO) filter for polarization recovery.
Figure 8. Decoded 400G constellation.
Figure 9. Comparison of offline simulators.
Copyright Š SubOptic 2019
response functions or environmental factors such as thermal and vibrational effects which aren’t considered in the simulator.
EMERGING TECHNOLOGIES
The emergence of higher RF bandwidth drivers, DACs, and ADCs provides a base to explore higher baud transmission technologies. After the offline capture and compute system has achieved a desirable backto-back performance, field testing of next generation ASIC features can be conducted. In the prototype, advanced technology features were field tested over two dispersion uncompensated cable systems. 16QAM and 64QAM probabilistic shaped constellations (PCS) at 71.3GBd were generated. The client rates varied from 200G to 600G over four frequency division multiplexed (FDM) carriers. An FDM approach helps mitigate the laser frequency noise associated with very high dispersion systems [4]. When the waveform is generated and uploaded to the transmit DAC, the transmit spectrum and constellation in Figure 11 is produced. An 8,400km trans-Pacific cable system was tested across 4.5THz of spectrum for performance of the 71.3GBd signal on a 75GHz grid spacing. The system specifications are shown in Table 1. Waveform captures were taken at the end of the link and processed. The processing of all field results use a full ASIC simulator. The results of the typical Q margin across the band for each client rate is shown in Figure 12. The results demonstrate 400G running with positive margin and a spectral efficiency of 5.33b/s/Hz. This indicates that over the 4.5THz of optical bandwidth, the 8,400km link has a potential of 24Tbps per fibre. In another instance with the same transmitter features, a 20,300km cable
Figure 10. Product vs fixed point offline recovery.
Figure 11. Four FDM transmit spectrum encoded with PCS.
system without optical to electrical regeneration was tested at an 87.5GHz grid spacing. The specifications of the field system are shown in Table 1. Description of field system parameters. The results of the 20,300km are shown in Figure 13 where 300G operates with ~0.5dBQ of margin, yielding a spectral efficiency of 3.43b/s/Hz. The spectral efficiency distance product of 3.43 x 20300 = 68,600b/s/Hz-km beats all previous records [5]. A Kakkar, J R Navarro, R Schatz, X Pang, O Ozolins, A Udalcovs, H Louchet, and S Popov, G Jacobsen, Laser Frequency Noise in Coherent Optical Systems: Spectral Regimes and Impairments, Scientific Reports, vol 7, no. 844, Apr. 2017. V Kamalov, L Jovanovski, V Vusirikala, S Zhang, F Yaman, K Nakamura, T Inoue, E Mateo, and Y Inada, Evolution from 8QAM live traffic to PS 64-QAM with Neural- Network Based Nonlinearity Compensation on 11000 km Open Subsea Cable,
CONCLUSION
Figure 12. Q Margin over an 8,400km field cable system.
Table 1. Description of field system parameters.
Capture and compute systems can be variable in performance speculations depending on the simulators used. Fixed point simulators provide the best match as a real-time performance indicator. The simulators used were also tested in the field on different reach cable systems. In all cases, the generated waveforms were captured over the respective links and performance predictions demonstrate PCS and FDM as promising candidates for next generation transmission technologies. STF
REFERENCES T Sherborne, B Banks, D Semrau, R I Killey, P Bayvel and D
MAY 2019 | ISSUE 106
59
FEATURE Copyright Š SubOptic 2019
Lavery, On the Impact of Fixed Point Hardware for Optical Fiber Nonlinearity Compensation Algorithms, J. Lightwave Technology, Vol 36, No 20, 2018. A Leven, and L Schmalen, Implementation Aspects of Coherent Transmit and Receive Functions in Application-Specific Integrated Circuits, OFT VI, Vol A, 6th edition. K Roberts, Q Zhuge, I Monga, S Gareau, and C Laperle, Beyond 100 Gb/s: Capacity, Flexibility and Network Optimization, J. Opt. Commun. Netw., vol. 9, no. 4, pp. C12-C24, Apr. 2017. OFC/NFOEC 2018, Th4D.5.
DR. PRIYANTH MEHTA is a hardware engineer for
Figure 13. Q Margin over a 20,300km field cable system.
the optical systems performance team at Ciena in Ottawa, Canada. He received his B.Sc. (Hons) (2007) and M.Sc. (Hons) (2009) in Optical Physics from the University of Auckland, New Zealand. He then obtained a PhD in the nonlinear properties of semiconductor optical fibers from the Optoelectronics Research Centre, University of Southampton, in 2013. In the past 6 years, Priyanth's primary fields of research at Ciena are focused on improving transmission capacity, reach, and user operability through modem and line terminal enhancements. Priyanth also serves as a contributing delegate and editor in standardization on the International Telecommunication Union (ITU) for Optical Transport and Access.
STAY CURRENT
FOLLOW US ON SOCIAL MEDIA
SUBTEL-FORUM
@SUBTELFORUM
@SUBTELFORUM
SUBTELFORUM
FEATURE
Excellence in Industry Best Newcomer Award Winner
APPLICATION INTERFACES FOR THE RECONFIGURABLE WET PLANT
BY SHREYA GAUTAM, RICHARD KRAM AND JONATHAN LISS
A
BSTRACT: As the Subsea Optical Transmission Cable industry continues in the direction of a vendor-neutral Open Cable model, Software Defined Network (SDN) based management solutions allowing customers to interface to all components of a system at the data/control orchestration layer become valuable. These minimize the need for multiple, vendor-specific Graphical User Interfaces (GUIs) for element management. In this paper, we provide an overview of the architecture and methods used to address this need. Application Programming Interfaces (APIs) use web technology and web services to support SDN orchestration for alarms, inventory, performance data view and control operations in a secure environment. The APIs manage functions and monitor the undersea cables and repeaters. Smart Undersea Network Elements (NEs), such as Wavelength Selective Switched (WSS) Reconfigurable Optical Add Drop Multiplexers (ROADMs) and optical switching branching units adapt to the transport needs through API controls. These Representational State Transfer (ReST) based APIs together with WebSocket alarms and notifications allow Operations Support Systems (OSS) management of the broader network, replacing manual operations. The APIs include ReST operations such as PUT, GET, POST and
DELETE for control of the reconfigurable wet plant. These capabilities are especially important in open cable systems, where shared cables and multiple land network elements and vendors need to be orchestrated on several continents and multiple countries. APIs are essential for abstracted management of complex submarine cables. The server-based APIs may be hosted on public or private clouds, on physical computers, or on shelf mounted circuit packs. Local Element Management System (EMS) functionality is achieved in addition to API controls via the data communications network and internet/VPN. Customer partitioning, policy enforcement and certificate security from external locations are critical elements to enabling the overall architecture and managing the undersea plant from cloud or the station via APIs, and will also be discussed in this paper.
INTRODUCTION
Undersea cable management systems traditionally have used GUIs for network management operations. The need to move to an SDN orchestrator-based model has become imperative with the transition to open cable systems, which provide better machine to machine communication and reduce the need for manual intervention. ReST based MAY 2019 | ISSUE 106
61
FEATURE APIs, along with Websockets, have been utilized for such an SDN based network management solution. Since these systems utilize web technology, they can be hosted on public or private clouds or on shelf mounted embedded processor units. The implementation utilizes microservices for improved availability. For a monolithic GUI based design, existing systems experiencing one failure can cause the entire application to crash and disrupt management functions. APIs provide health checks for each component of the service to facilitate the availability of all the components, circumventing the effects of a single failure. Customer GUI clients can easily be built using ReST APIs and Websockets, providing a flexible base and the ability to host such services on the web.
ing of requests to underlying ReST services, so as to not overwhelm them. When an underlying ReST service is not able to handle incoming requests, a “Circuit Breaker” functionality will stop forwarding requests to that service until it recovers. Client-side load-balancing capabilities in the API Gateway assess where to route a request to instances of a particular ReST service based on load feedback from those instances. Figure 2 shows two instances of API Gateway for redundancy. Each instance can receive ReST requests from clients, apply routing logic and forward them to underlying NE services. Each Gateway registers with all underlying NE services to receive Webockets and forward them to the customer client applications that registered for receiving WebSocket messages.
IMPLEMENTATION ARCHITECTURE
To provide an interface at the data level to the customers’ Operations Support System (OSS)/Network Management System (NMS) client, two components are needed: ReST APIs and Websockets. Figure 1 shows the overall architecture of the system. The APIs follow a microservices architecture with each NE having its own service. An API Gateway sits on top of these services to provide seamless and abstracted operations to the client. To reduce customer complexity, a single point of access is provided. Client applications send ReST requests to the API Gateway, which routes them to the appropriate underlying ReST Services based on runtime configurable routing logic. Clients can also connect to the Gateway to receive WebSocket messages, notifications and events from any of the underlying ReST Services. For systems equipped with multiple gateways for redundancy, a recommended priority list of Uniform Resource Locators (URLs) is provided. Additionally, the API Gateway handles contingency situations for a variety of failure modes. If the rate of ReST requests of a particular type reaches a configured threshold, the gateway is able to throttle the forward-
62
SUBMARINE TELECOMS MAGAZINE
Figure 1: Architecture for API Control of Wet Plant
Figure 2: API Gateway Design
Copyright Š SubOptic 2019
REST APIS
ReST APIs provide control of the reconfigurable wet plant, including wavelength provisioning, recovery, inventory management, performance data view and measurements. ReST APIs can be divided into categories for better accessibility as per the example in Figure 3. For instance, they can be divided into wet plant, dry plant and cable system including fiber pair filtering, with further drill down and details as required. Such a division allows each part to be accessed by its specific URL.
WEBSOCKETS
Websockets provide support for real time alarms and event management. Websockets for each NE are divided into categories, each of which can be subscribed to. There are common categories like alarms and Attribute Value Change (AVC) events along with specific categories for individual NEs. To subscribe to the AVC events in the wet plant, the corresponding topic can be subscribed to after registering to the wet plant API URL. It is also possible to subscribe to all the Websockets.
using a single ReST server could authenticate to the shared server with their own set of certificates. This is facilitated by the server providing individual port numbers to each customer secured with the corresponding set of certificates. This allows the customer to replace the default certificates provided with the system with those that are trusted for their domain.
PARTITIONING AND SESSION MANAGEMENT
After successful authentication, the JWT is used to perform secure ReST operations and to subscribe to Websockets. When such requests are received by the server, clients
BACKWARDS COMPATABILITY
Backwards compatibility is essential to minimize client disruption when updates to APIs are brought on line. API URLs Figure 3: Division of ReST API Calls can be specified with a version number or can default to the latest, thus maintaining client integrity. In this way, clients can access any API are only able to view/control the resources they are auversion at run time. thorized to access. This is known as partitioning. Thus, the ReST APIs filter responses to provide a partitioned view, not only for different customers sharing the cable system, CLIENT-SIDE CODE EASE FROM DOCUMENTATION The detailed documentation for each call in the APIs and but also (if desired) for different users for each customer. This facility is provided by the ReST APIs and Websockets all Websocket subscriptions is in industry standard Swagthrough interactions with a RADIUS authentication server ger. It allows for the creation of skeleton code from the requirements, making it easier for client-side code develop- containing user and domain information. Session management is also important in a system with ment. The specifications are also available via a ReST call multiple users, with and without partitioning. This becomes for the specific NE. even more imperative in a remote SDN environment, as simultaneous collisions can disrupt traffic leading to major SECURITY CONSIDERATIONS The ReST APIs and Websockets are secured with mutual downtimes. ReST APIs pose a greater challenge, as they are stateless and thus persistency or sessions cannot be authentication via certificates. JSON Web Token ( JWT), maintained at the user end. Necessary checks validate the where JSON stands for JavaScript Object Notation, is sessions held for individual NEs with corresponding JWTs, provided to the client after a successful authentication, thus performing session management operations. which is used until the token expires. Multiple customers MAY 2019 | ISSUE 106
63
FEATURE Copyright © SubOptic 2019
SYSTEM HEALTH
In addition, it is also essential that the customer is notified of the health of the system either periodically or on demand. Websockets provide notifications of a valid open connection through a keep-alive ping- pong message protocol. Additionally, ReST APIs provide the status of the health of each of the microservices running on the server, one per individual NE, when a call is made to /api/health.
API PROVISIONS
The microservices-based architecture allows provision of APIs accessing NEs and functions at any cable station without the need for a traditional computer server. This embedded solution also allows clients to add their own functionalities, if desired. Alternatively, the APIs can be hosted on many platforms, like traditional computer servers or a cloud. Some APIs/Websockets are NE specific and some are system related, such as Line Monitoring System (LMS) and Wet Plant access. The former provides direct control to the NEs while the latter requires proprietary topological algorithms or telemetry gateways to manage the functions. The microservices approach allows for an abstraction of some system-wide algorithms enabling an embedded solution and providing the clients with direct access to the hardware APIs.
web services. They can be deployed anywhere from physical servers to private or public clouds, or even on shelf-mounted circuit packs, and do not have to be collocated with the actual NEs (like cable stations, for example.) For customers desiring element management, the NE-centric structure of the APIs provides individual NEs access as needed. Microservices architecture allows all running services to be available independent from services that may be down. In monolithic applications, one failure can result in the loss of the entire application. In addition, microservices enable quicker installation and updates for the software, minimizing potential management down time. APIs make it easy for customer OSS’ to control these services as they desire. Client- side agents can be incorporated as easily as building client-side GUIs. In open cable systems, APIs provide an easy integration with other OSS’/NMS’, thus providing customers with a “single pane of glass” view. The combination of ReST and Websockets allows a customer OSS to orchestrate network management on any platform without manual intervention and with significant flexibility.
By utilizing central managers, APIs provide control of the entire cable system, eliminating the need for using local EMS.
SIMULATION AND TESTING
These API/Websocket solutions naturally enable a simulation environment with software-based tools. This “development environment,” or test bench, could be used during client testing phases, mitigating the need for access to “real systems” and “real hardware” during the client developmentphase. A simple plugin of NE software simulators creates instances of API/Websocket simulation environments that may be hosted in public clouds or delivered to client developer locations, thus reducing the client development lifecycle, costs and time to market.
BENEFITS
The move to SDN driven management with ReST based APIs and Websockets has many benefits. APIs are platform independent since ReST APIs and Websockets are technology agnostic, as they are ubiquitous
64
SUBMARINE TELECOMS MAGAZINE
CONCLUSION
This paper discussed a new flexible approach to providing the undersea cable industry with access to network management tools at the data layer secured with transport layer security mechanisms and mutual authentication with certificates. It discussed key components of the architecture along with benefits of moving to this approach, especially for open cable systems. STF SHREYA GAUTAM is lead Network Management Systems (NMS) Engineer with specific expertise in next generation of undersea network management solutions. She has been working with SubCom for 2 years after receiving a Master of Science in Electrical Engineering from Columbia University, N.Y., and a Bachelor of Technology in Electronics and Communications Engineering from Jaypee Institute of Information Technology, Noida, India. While working at SubCom, she led the Representational State Transfer (ReST) Application Program Interfaces (APIs) development, have implemented wet system component APIs and has generated NMS requirements for the Ocean Control product line.
OUT NOW! THE FIRST IN A NEW SERIES OF BI-MONTHLY REPORTS FROM STF ANALYTICS Submarine Telecoms Market Sector Report: Offshore Oil & Gas Edition
Featuring exclusive data and analysis from STF Analytics – • 80+ Systems represented • Exclusive data collected direct from owners and suppliers • State of the market and trends • Signature analysis • Priced for every budget
BUY YOURS TODAY!
HTTPS://STFANALYTICS.COM/OIL-GAS-REPORT MAY 2019 | ISSUE 106
65
Undersea Fiber Commu r Communication Undersea Systems, Fiber 2eComm This comprehensive book provides both a
high-level overview of submarine Edited by: José Independent T nt submarine Edited Telecom by: Chesnoy José Expert, Chesnoy former Independent CTOsystems ofsubmarine Alcatel-Luc submar and theNetworks detailed specialist technical Submarine data Submari for N Submarine the design, installation, repair, and all other aspects of this field.
Undersea Fiber Communi ea Fiber Communication Systems, 2e both Undersea Fiber Com This comprehen This comprehensive book provides a high-level This overvie compr
Edited by:Edited José Chesnoy submarinesubm Tele y Independent submarine Telecom Expert, former CTO of Alcatel-Lucent by: JoséIndependent Chesnoy Independent SubmarineSubm Netw Submarine Networks
the and the detailed specialist technical data forand design, anddetailed installat the det aspects of this field This comprehensive book provides both a high-level overview of submarine systems and the detailed specialist technical data for design, installation, repair, and all other aspects of this field
This comprehensiv This com and the detailed and thesp
Undersea Fiber KEY FEATURES KEY FEATURES Co Communication Systems, 2e KEY FEATURES KEY FEATUR
Y FEATURES KEY FEATURES new co Features new content on: by: José Chesnoy • Features • • Features n Features cont • Features new content on:Edited • new Feature Ultra-long Ultra-long haul submarine transmission technologies for telecommunications Independent Submarine Telecom Expert, Ultra-lo Ultra-long haul submarine transmission technologies for Alternativ Alternative submarine cable applications, such as scientific or oil and gas U form former CTOof of Alcatel-Lucent Submarine deve • Addresses the development high-speed networks for multiplying Internet Networks and broadband • Addresses • the Addres Alterna services Alternative submarine cable applications, such as scientif AW With cont with: With with:contributions of authors from key suppliers acting in the domain, services service such Coherent such Coherent optical technologyCiena, for 100Gbit/s or above asAs as Alcatel-Lucent, NEC, channels TE-Subcom, Xtera, from consultant • Addresses the Addresses the development of high-speed networks • for Addresses multiplyin and Wetopera plant and Wetoperators plant opticalsuch networking and configurability da as Axiom, OSI, Orange, and from University and overo • Provides a full overview references of the evolutionsuch of the as fieldTelecomParisTech, conveys the strategic importance of large • Provides • a full Provide organizat organization and Suboptic, services with: services with: services w undersea projects undersea projects with: unders treatin treating the field in a broad, thorough and un-biased approach. Technical Technical and organizational life cycle of a submarine network Cohere Coherent optical technology for 100Gbit/s channels or ab Upgrades Upgrades of amplified submarine cables by coherent technology C KEY FE KEYplant FEATURES K Wet Wet optical networking and configurability pla W DESCRIPTION DESCRIPTION DESCRIPTIO •SinceFeatu • Features new content Since publication of the• Since publication of the 1st edition in 2002,on: there has been a radical evolution of the global public • Provides a full o Provides a full overview of the evolution of the field • conveys Provides the as •networ U communication •network with the haul entry submarine of submarine transmission cables in the Terabit era. Thanksfor to optical communication communica Ultra-long technologies te telecommunications technologies, the trans technologies, the transmission on a single fiber can achieve 1 billion simultaneous phone calls technologie undersea projec undersea projects with: undersea ISBN: 9780128042694 ISBN: 9780128042694 across the ocean! across EISBN: 9780128043950 EISBN: • theAlo • Alternative submarine cable applications, such as9780128043950 scientific or oilacross the ocean! Technic Technical and organizational life cycle of a submarine net T an and gas PREVIOUS EDITION ISBN: : PREVIOUS EDITION ISBN: Modern submarine Modern submarine optical cables are fueling the global internet backbone,9780121714086 surpassing by far all Modernopt sub 9780121714086 • Addre • Addresses of the development of high-speed networks for multiplying Upgrad Upgrades amplified submarine cables by coherent tech U• alternative techniques. alternative techniques. This new edition of Undersea Fiber Communication Systems provides a alternative
15
Intern PUB DATE:2015 December 2015 Internet and broadband services with:PUB DATE: December detailed explanation of detailed explanation of all technical aspects of undersea communications systems, with an detailed exp LIST PRICE: $195.00/ LIST PRICE: $195.00/ optical technology for 100Gbit/s channels orThis above emphasis onemphasis the•mostC emphasis on the•mostCoherent recent breakthroughs of optical submarine cable technologies. fully or £120.00/€140.00 £120.00/€140.00 updated new edition is updated new edition is theplant best resource demystifying enabling optical technologies, updated • ne W • Wet optical for networking and configurability FORMAT: Paperback FORMAT: Paperback operations equipment, operations, up to marine installations, and is an essential reference for those in contactequipment, equipment, • Provid• • Provides a full overview of the evolution of the field conveys the PAGES: 702PAGES: 702 with this field. with this field. with this fie strate strategic importance of large undersea projects with: AUDIENCE: AUDIENCE:
DESCRIPTION ESCRIPTION DESCRIPTION publication ofev nce publication of the 1st edition in 2002, there Since has been Since a radical publicati
Undersea Fiber Communication Systems, 2e EDITED BY JOSÉ CHESNOY
Independent Submarine Telecom Expert, former CTO of Alcatel-Luvent Submarine Networks With contributions of authors from key suppliers acting in the domain, such as Alcatel-Lucent, Ciena, NEC, TE-Subcom, Xtera, from consultant and operators such as Axiom, OSI, Orange, and from University and organization references such as TelecomParisTech and SubOptic, treating the field in a broad, thorough and un-biased approach.
KEY FEATURES
Features new content on: • Ultra-long haul submarine transmission technologies for telecommunications • Alternative submarine cable applications such as scientific or oil and gas Addresses the development of high-speed networks for multiplying Internet and broadband services with: • Coherent optical technology for 100Gbit/s channels or above
• Wet plant optical networking and configurability Provides a full overview of the evolution of the field conveys the strategic importance of large undersea projects with: • Technical and organizational life cycle of a submarine network • Upgrades of amplified submarine cables by coherent technology
For more information, or to order visit: store.elsevier.com/9780128042694 Enter EGIN318 for up to 30% off and free shipping!
FROM THE
PROGRAMME COMMITTEE
RECORDS BROKEN IN NEW ORLEANS BY STUART BARNES
Stuart Barnes Programme Chair
2019 IN NUMBERS; OVER 900 ATTENDEES, MORE THAN 50% FROM OVERSEAS, NEARLY 100 ORAL PRESENTATIONS AND 50 POSTERS, BUT SUBOPTIC IS NOT JUST ABOUT RECORDS. THIS IS OUR CONFERENCE, WHICH IS DIFFERENTIATED BY ITS ENRICHED TECHNICAL CONTRIBUTION, PRODUCED FOR AND BY MANY OF THE ATTENDEES, NOW READ ON.
A
s a result of two and a half years of intensive planning SubOptic 2019 was held in New Orleans from April 8-11. Stuart Barnes, Programme Chair, takes you through the main highlights below as he hands over the baton to a new Chairperson for SubOptic 2022 in Macau.
DAY 1
The event kicked off with a bang as 70% of all attendees had registered by 11am on the first day surprising us all and causing a massive rethink regarding more mundane issues; how do we cater for this and how do we reconfigure the rooms on day 2 to cater for the now anticipated higher interest in many of the topics? It was standing room only for the first Working Group starting at 9am and this fantastic interest continued to the very last day. Elizabeth’s stellar group gave a clear account of the work on Open Systems and its progress towards standardisation. It also bore testimony to the Sub-
68
SUBMARINE TELECOMS MAGAZINE
Optic Association’s wish to make the Association more relevant to its members between Conferences (more about this later). This was followed later by a Lunch and Learn session on the second Working Group on Professional Development, Diversity and Inclusion given by the indomitable Amy Marks, who successfully battled through quite a few AV issues to describe progress on this essential topic.
All the subsequent Masterclasses were jam packed with an average of just over 200 per class! Over 1200 Certificates of Attendance have now been sent out and the videos of the Masterclasses will shortly be available for all registered attendees to view or review at their leisure. Needless to say, we are extremely grateful to all the contributors to both the Working Groups and the Master-
classes who gave up their own time to prepare and deliver these presentations. This is “pro bono”! I would also like to thank Lynsey Thomas for curating the Masterclasses. Well done all. The day was capped off with the Opening of the Exhibition and the SubOptic 2019 Welcome Reception accompanied by the highly entertaining Marching Band.
DAY 2
After an exciting first day, day 2 was kicked off by an equally rousing Keynote from the CEO of Ciena, host to SubOptic 2019 and Platinum Sponsor. Gary Smith took us through the main drivers to the growth in traffic in recent years, which gives us all hope for the state of OUR industry leading up to the forthcoming 2022 Conference. This was preceded by a very engaging presentation by the CIO of the City of New Orleans, Kim Walker LaGrue, who welcomed us all to the Conference. The next three days were underpinned by the Papers and Posters sessions expertly put together by the hard-working Marc-Richard Fortin and Stephen Dawe. These were divided into three parallel sessions. Not ideal, but a necessary evil with so many relevant submissions. And with just under 90 posters and papers coming from overseas this nicely synchronised with the Global theme chosen by the Committee alongside that of Diversity and Inclusion. Day 2 also contained the first of two panels, on the Business of Submarine Cable Infrastructure chaired by Ed McCormack of Ciena, who was joined by Funke Opeke (MainOne), Nigel Bayliff (Aqua Comms), Dave Coughlan (SubCom), Ekaterina Golovchen-
ko (IPG Photonics) and Ricardo Orcero (Facebook) and Elaine Stafford (DRG), who both stepped in for Bevan Slattery, who couldn’t make it. Again, this lively discussion was “Standing Room Only”, and for those who couldn’t make it, there will be a chance to see at leisure on the post conference videos. But that wasn’t the end of second day. The Poster Session bookended the day, along with the usual food and drink to lubricate and revive the guests! Talking about Calm Technology, Amber Case (a self declared Cyborg and celebrated TED Speaker) opened Day 3 and addressed the interaction between humans and computers with a stimulating and engaging presentation on the interaction between humans and computers, good bad and risible! This was followed up by by SubOptic’s very answer to Dan Ackroyd and Bill Murray, Alan Mauldin and Tim Stronge, with their highly entertaining Mythbuster Presentation. I truly hope we can encourage them back to present a fourth part to the trilogy! After yet another excellent two papers sessions we were treated to one of my personal highlights, the Round Table event. Expertly put together by Alice Shelton, these were not in-
tended to be just an informative chat with peers. As I mentioned earlier it is the intention of the Association to translate some of these into Working Groups, adding to the the two currently ongoing. So, in addition to the “Run of the Mill” discussion we expect to post a one page summary of the discussion and “Press Gang” some of the Contributors into establishing a Working Group on the subject matter. Watch this space! I would like to personally thank all 17 chairs who made it such an enjoyable and lively experience. And talking about lively, and everyone was the day ended with the most amazing Gala. Justifying our heavily debated decision to move the Gala forward to encourage more people to partake we were somewhat blindsided by the staggering (perhaps not the best JANIUARY 2019 | ISSUE 104
69
FROM THE
PROGRAMME COMMITTEE
choice of word!) turnout. Drinks in the garage were followed by a memorable parade to Antoine’s by way of the French Quarter. It is no exaggeration to say that STF, the event organisers had to react admirably to arrange more food and drink to cope with the almost double the expected turnout. And who can forget Yves Ruggeri leading events in his personalised sash and the sheer enjoyment shown by Vint Cerf (Father of the Internet) on the float! And finally, on to day 4 we could see the finishing post looming! Despite the fact that we pushed the Keynote back to the afternoon to allow the partygoers to recover, there was a satisfying glow in the well attended final 6 papers sessions. I applaud you all for staying the course! Straight after lunch we were treated to a magnificent final session kicked off with an awesome address from Vint Cerf. It was a truly memorable and inspiring talk from one of the industry’s great minds and will live in my memory for ever. It was a great thrill that he was happy to answer questions first from the stage and then from the floor, well after the second panel concluded. Which leads me neatly to Panel 2 where we were treated to a thought-provoking discussion on future changes to the Law of the Sea. The panel was put together by our friends at the ICPC (including SubOptics very own Graeme Evans) and expertly chaired by Keith Schofield. The panel consisted of experts on both sides of the argument, who despite this put over their points courteously and eloquently. We thank them all as our industry stands at a crossroads on this issue. And finally, after a brief refresh-
70
SUBMARINE TELECOMS MAGAZINE
ment interlude to enjoy the Small Business Networking Reception we returned to the Mardi Gras Ballroom to attend a jampacked Closing Ceremony. I would like to personally thank the recipients of the awards for Best Oral Presentation, Best Poster and Best Newcomer (Priyanth Mehta, Ian Watson and Shreya Gautam for their outstanding efforts. Then with news of the venue and host for SubOptic 2022 we lowered the curtain on SubOptic 2019. My time as Chair of the Program Committee is almost over and this gives me opportunity to look back on the period running up to New Orleans and beyond that in many ways. I have been in the submarine business for most of my 41 working years and it has always been fascinating, with never a dull moment. It was for this reason that I accepted the offer to be Programme Chair as I felt I owed something back, in fact a lot. From a personal point of it was also important that when looking for themes, topics and particularly Round Tables that we helped the Association realise their wish to have more continuity between conferences, thus making “our” Association more relevant to “our” business. I hope we have achieved this and this is where you come in. Please volunteer to join one of the forthcoming working groups and help the Association continue along its growth trajectory. We are in exciting times.
So, before I sign off, I would like to thank the Program Committee. The aforementioned Lynsey, Alice, Marc and Steve and finally Ian Clarke, who was outstanding in his support. And finally, our Advisors Ron Rapp and Shota Masada, as well as our Regional Ambassadors. We must continue to develop global participation so the Association truly reflects the global nature of our industry. I hope you all had a wonderful time in New Orleans, and we all look forward to seeing you in Macau. STF STUART BARNES gained an Honours Degree and PhD from London University. He has been an engineer and manager with 40 years experience in telecommunications, of which 30 years has been in submarine systems. His career spans the last years of analogue technology through to the latest coherent optical systems. He has been actively involved with all 3 phases of ownership starting with PTT ’s, through Carriers Carrier through to today’s OTT era. Starting as a research engineer, he was privileged to be involved in the first regenerative optical systems in both cable and repeater design. Then as Technical Director of STC he led the development of ASN’s new repeater and PFE (both in use today) and first WDM SLTE. In subsequent years he has been was involved in both new SLTE developments with Azea Networks and repeater developments with Xtera Communications Inc. He has attended the majority of SubOptic events since the inception, both authoring and sponsoring many publications. He was Chair of the Papers Committee when SubOptic was held in San Francisco and was an active participant in Dubai, helping Elaine Stafford prepare the closing ceremony. He was Visiting Professor of Electrical Engineering at Southampton University and Advisor to the School of Photonics at Aston University.
OUT NOW! THE SECOND IN A NEW SERIES OF BI-MONTHLY REPORTS FROM STF ANALYTICS Submarine Telecoms Market Sector Report: Data Center & OTT Provider Edition
Featuring exclusive data and analysis from STF Analytics – • Exclusive data and insights from industry experts • State of the market and changing trends • Impact on cable system development • Signature Analysis • Priced for every budget
BUY YOURS TODAY!
STFANALYTICS.COM/DATA-CENTER-OTT-REPORT MARCH 2019 | ISSUE 104 71
FROM THE
CONFERENCE DIRECTOR
LEAVING AN INDELIBLE IMPRESSION ON THE INDUSTRY BY CHRIS NOYES
Chris Noyes Conference Director STF Events
W
ow! What an experience we had in New Orleans. We had all heard that the buzz for SubOptic2019 was high and everyone proved it. With record breaking attendance, SubOptic2019 was a huge success. The conference kicked off on Monday with the majority of everyone in attendance. This made the Master Classes well attended and set the atmosphere for the conference for the week. Monday evening, we had the Opening Reception which was kicked off with the Kinfolk Brass band They opened the reception with procession of attendees through the exhibit hall. We had a Grand Marshall, Yves Ruggeri, to help kick off the evening, as well opening the exhibit floor. Accompanying the band and Grand Marshall, SubOptic2019 had their very own King and Queen to help with the Opening Reception. The evening wouldn’t have been an opening in New Orleans without the fresh shrimp and oysters. The opening reception had food, drinks, fresh seafood and the excitement that everyone had to be at SubOptic2019. Tuesday saw the beginning of the first full day of the conference with the
72
SUBMARINE TELECOMS MAGAZINE
Opening Ceremony by the SubOptic Association. Stuart Barns, Chairman of Xtera, and SubOptic2019 Program Chair opened the conference and expressed his surprise at attendance on Monday’s opening events. Next Yves Ruggeri, President of the SubOptic Association, welcomed the new Association Executive Committee members and all the attendees. Yves spoke of the significance holding the conference in the United States and as well as encouraged attendees to not only enjoy the conference’s official content, but to go out and explore the music, food, architecture and other culture of this historical city, celebrating its tricentennial this year. Stuart next introduced Kimberly LaGrue, Chief Information Officer of New Orleans, who was representing the mayor’s office. Kimberly sated that city was thankful that SubOptic2019 was being held in New Orleans. She joked that New Orleans was a city below sea level and a port city itself. It truly understands the importance of living with water. Ian Clarke, Vice President of Global Submarine Solutions of Ciena, host
of SubOptic 2019, was introduced by Stuart and spoke briefly about Ciena and then introduced the key note speaker, Gary Smith, President and CEO of Ciena. Gray Smith’s key note focused on the “Digital Revolution” and how advancements can be disruptive, and we should embrace the disruption and face the continual change. The day continued with seven oral presentations and the Business of Submarine Cable Infrastructure panels session. The day was capped off with the poster session and reception. During the poster session and reception, you might have noticed a painter on the stage a the far end of the room where the posters were located. The painter was Alex Harvey was there to capture the evening on canvas. Wednesday started with Amber Case, Cyborg Anthropologist and author of the book “Calm Technology.” She started with asking everyone in the room to hold up their phones, and then said, “I want to tell you, you are all cyborgs.” Amber stated that according to the proper definition a cyborg is any living thing that uses
external technology to adapt to their environment. Following Amber were the Mythbusters: Tim Stronge and Alan Mauldin from TeleGeography. They took on challenging questions from previous SubOptic audiences, including “will bandwidth demand growth last forever, or do the five human senses provide a practical limit on throughput?” By applying facts, figures and precision violence to our industry’s cherished maxims, the presentation attempted to blast away the shroud of mystery that surrounds the undersea cable industry. The day included six Oral Presentations and a Round table session with 15 topics. The round table session was attended by over 300 people. The evening was capped off with the Mardi Gras Gala Celebration, because it was more than just a Gala dinner. The festivities started with a reception at the Marriott to gather everyone for the Mardi Gras Parade. We had a traditional Mardi Gras Parade from the Marriott to the Antione’s Restaurant. The Parade featured a high school marching band, Mardi Gras stilt walkers, Mardi Gras Big Heads, Casa Samba Dancers and a Mardi Gras Float. Yves Ruggeri (President SubOptic Association) served as the Grand Marshal. The parade took everyone down Canal St. to the world-famous Bourbon
St., then we made a left on Toulouse St. and then a Right on Royal St. and a right on St Louis St. The parade route concluded at Antione’s Restaurant and has the distinction of being one of the oldest family-run restaurants in the United States. The Gala at Antione’s featured the Smoking Time Jazz Club band in the Large Annex room. They played though out the evening. In the Mystery room everyone had their chance to get their picture in the photo booth, the back drop for the photo was Bourbon St. in the evening. Rooming the
restaurant were two magicians preforming tricks and illusions. For those that wanted to see their future there was a Tarot Card Reader in the Escargot room on the first floor. Additionally, a bourbon and whiskey tasting bar was in the Dungeon on the first floor. The second floor had additional seating and featured a Voodoo Priestess in the Twelfth Night Revelers Suite. The Priestess was demonstrating how to make Voodoo Dolls and Gris Gris bags. The Maison Verte room featured a Cubs Street Poet, Cubs created short poems for anyone who wanted one and they serve as a marker of time in self-reflection and the practice of being intimate in a social setting. Lastly on the second floor in the stately décor of the Capital Room was a cigar roller hand rolling cigars, and an additional whiskey and bourbon bar. The Capital Room allowed guest to exit on to the balcony and enjoy their cigars if they chose. The Gala saw the majority of attend with over 750+ in attendance at the evening festivities. Thursday marked the last day of the conference and the morning started with the oral presentations. This was followed with a general session where Vinton Cerf, Vice President and Chief Internet Evangelist of Google, spoke. He is also Co-designer of the TCP/IP protocols and the architecture of the internet. He’s JANIUARY 2019 | ISSUE 104
73
FROM THE
CONFERENCE DIRECTOR
widely known as one of the “fathers of the internet.” Vint started his talk about the history and diagram of the First-ThreeNetwork internet, created in 1977 by the Defense Advanced Research Projects Agency (DARPA). This was developed into ARPANET, an experimental network which, while limited, still shared packets thousands of miles and spanned over the Atlantic. The National Science Foundation (NSF) made another groundbreaking step towards today’s internet with the creation of NSFNET, which connected roughly 3,000 research universities in 1986. Vint mentioned that one of the surprises that came with the internet was the amount of and demand for undersea cable. He closed with a picture of a digital age that leads far into the future and will create even more miracles than Cerf has seen in his wide view of the history of the internet. Following the keynote was the UNCLOS BBNJ — A Joint SubOptic & ICPC Panel Session which addressed the treatment of submarine cables under a new oceans law treaty —the BBNJ instrument. The session included potential limitation of existing
UNCLOS freedoms, environmental impact assessments for installation and repair on the high seas, transit restrictions in marine protected areas beyond national jurisdiction, and the role of submarine cables in promoting sustainable development. The Small Business Networking Reception was held on the Exhibition Hall floor. The reception gave a spotlight on the small and emerging businesses in the submarine cable industry. The conference closed out with final remarks from Stuart Barnes who
thanked everyone who had served on the SubOptic2019 Program Committee — for their dedicated work in making the program a success. Yves Ruggeri then thanked Ciena for hosting SubOptic2019.. A huge thank you to the industry for making the conference a success, to all the individuals that submitted papers and then presented in an oral presentation or crafted your paper to be presented as a poster, you helped make the conference what it was. Here are the conference Demographics and Statistics: STF
CONFERENCE DEMOGRAPHICS AND STATISTICS 900+ ATTENDEES 52%
C-LEVEL/MIDDLE MANAGEMENT
63%
REPEAT ATTENDEES
74
SUBMARINE TELECOMS MAGAZINE
100+ SPEAKERS 66%
FINAL DECISION MAKER/INFLUENCER
56%
CAME TO NETWORK
75+ NATIONALITIES 58%
16+ YEARS OF EXPERIENCE
62%
MASTER’S DEGREE OR HIGHER
MAY 2019 | ISSUE 106
75
THE BIG SHOW ON T SubOptic 2019 is over, but that doesn’t mean it’s done! For the first time ever, all of the Technical Sessions, Masterclasses and Keynotes are being made available online and on demand. Whether you missed a session you wanted to see, or weren’t able to attend SubOptic at all, we’ve got you covered.
MASTERCLASSES, TECHNICAL SESSIONS, KEYNOTES All 6 Masterclasses, 19 Technical Sessions, 3 Keynotes and General Sessions can be viewed now.
THE SMALL SCREEN
• Pre-Conference Masterclasses • General Sessions (Keynotes and Big Stage Sessions) • Networks of the Future • Oil & Gas and Special Markets
• • • • •
Marine Advancements Global Citizen Regulatory Legal & Security Wet Technology Dry Technology
SUBMARINE CABLE
NEWS
SUBOPTIC
SubOptic, Tulane Bring Expertise to the next Generation SubOptic 2019 To Feature Small Business Offerings SubOptic 2019 Exhibition Hall Sold Out SubOptic 2019 Conference to Reach Over 700 Attendees
NOW DATA CENTERS
Angola Cables Data Center in Brazil Is Now Live
FUTURE SYSTEMS
Amazon, Bulk Infrastructure Reach Agreement on HAVFRUE
SubOptic 2019 – Day 1 Wrap-Up Video
DARE1 Marine Survey Complete, New CLS Added
SubOptic 2019 Opening Ceremony and Keynote
Google Signs Deal with Cuba to Boost Internet Services
SubOptic 2019 – Day 2 Wrap-Up Video
EllaLink, EMACOM to Bring Connectivity to Madeira
SubOptic 2019 Day 3 Keynote
Kativik Govt Announces EAUFON Request for Tenders
STF Events, InterGlobix Announce SubOptic 2019 Media Partnership
Fintel Secures Landing of Sub-sea Cable Gondwana-2
SubOptic 2019 – Day 3 Wrap-Up Video
Southern Cross, ASN Sign Deal for NEXT
SubOptic 2019 Day 4 Keynote
SubCom to Deliver HFC, SDM for Google’s Dunant Cable
SubOptic 2019 – Day 4 Wrap-Up Video
Japan-Guam-Australia South Cable System Ready for Subsea Installation
SubOptic 2019 Conference Archive Now Available
Quinault Nation Positioned to Join the Technology Industry
SUBTEL FORUM
H2 Cable and SubCom Announce Signing of H2 Submarine Cable Contract at SubOptic 2019
Submarine Cable Almanac – Issue 30 Now Available!
Sparkle to Invest in BlueMed Cable Connecting Palermo, Genoa, Milan
CABLE FAULTS & MAINTENANCE
Google Completes Subsea Cable to Chile
Slow Internet Likely in Bangladesh as Storm Delays Work
EllaLink Announces Start of Marine Route Survey
Tele Greenland to Start Repairs in Early May
Solomon Islands Undersea Cable Project Underway Telecom Egypt Signs Landing Agreement for PEACE Cable
Tele Greenland Announces Cable Breach Repair in North
Survey Work Starts on Manatua Cable Project
CURRENT SYSTEMS
OFFSHORE ENERGY
SEACOM to Connect Kenya Businesses to South Africa Hawaiki Broadens Its Network in the US with New PoP in Seattle, Wa MainOne to Extend Submarine Cable in Cote d’Ivoire by October Trustpower Selects Hawaiki Cable as Connectivity Partner
78
SUBMARINE TELECOMS MAGAZINE
GTT Sets up Oil and Gas “Big Data” Unit
STATE OF THE INDUSTRY
WFN Strategies Nominated for Federal Award Bermuda to Promote Tech Cable Corridor at SubOptic 2019
OUT NOW! THE THIRD IN A NEW SERIES OF BI-MONTHLY REPORTS FROM STF ANALYTICS Submarine Telecoms Market Sector Report: Global Outlook
Featuring exclusive data and analysis from STF Analytics – • Backed by industry-leading Submarine Cable Database • State of the global market and changing trends • Overview of new & disruptive technology • Signature analysis • Priced for every budget
BUY YOURS TODAY!
STFANALYTICS.COM/GLOBAL-OUTLOOK-REPORT
ADVERTISER CORNER Kristian Nielsen Vice President Dear Readers, In this section, I’ve typically written about the changes you’ve seen in SubTel over the years – the updates to products, the changes to the website and even changes to our staff. This month, I’d like to look back in time four weeks and speak the name that’s been on the industry’s mind: SubOptic. Many of you already know that STF Events, our sister events company, organized the event. What many of you might NOT know is that the preparation for the show started during SubOptic 2016 in Dubai. For two and a half years, STF Events worked together with the SubOptic Programme Committee to provide the world class technical program that you saw in New Orleans. For two and a half years, we marketed SubOptic harder than it had ever been marketed before. For two and a half years, our conference management team worked tirelessly with local vendors, entertainers and venues to provide a singularly unique experience in The Big Easy. To put on a show of SubOptic’s caliber, that’s what it takes, folks. Two and a half years. Now that it’s done, and we’re in the process of organizing data and sending out our post-event reports to exhibitors and interested parties, I have to say it feels a bit like a dream. For two and a half years we were stressing about meeting sponsor revenue goals, attendee numbers and even making sure we aren’t subject to attrition with the hotel. That was a new term for me, by the way. When an event rents out a hotel and purchases a room block, they
80 SUBMARINE TELECOMS MAGAZINE
have certain minimums to fill. If you can’t meet those room rental minimums, you pay for those rooms. So not only were we worried about typical sales figures, but we were worried about filling the hotel. It seemed like if any one leg fell out, the entire table would come down with it. Well, folks, if you were there, you already know this: SubOptic 2019 in New Orleans was an unparalleled success! A few quick and rough stats for you to illustrate my point: • Roughly 28% more attendees than the most attended show in recent history (Paris 2013) • 30% more sponsors and exhibitors than the last show. • 25% more exhibition space and exhibitors than the last show. • But what about the attendees themselves, what do we know about them? • 52% come from C-Level/Middle Management • 66% were the final decision maker/ purchasing influencer • 58% have over 16 years’ experience in the industry • 63% were repeat attendees • 56% Came to Network • 62% held a master’s degree or higher If those statistics don’t speak to the extraordinary quality of the folks that attend SubOptic, I don’t know what will. None of the success that we had with SubOptic 2019 would have been possible without the crack team of managers, designers and salespeople that we brought together. Without naming names, if you had ANY hand on the development of the
program, management of the organizing or the sales of SubOptic 2019: THANK YOU. Switching gears quickly, I would be remiss if I didn’t introduce our new salesperson who has just recently joined SubTel Forum. Terri Jones is a name you will certainly recognize from the sales and management of exhibitors and sponsors at SubOptic 2019. Her exemplary work has now dovetailed into the exciting world of magazine advertising sales! As you are organizing you budget throughout the rest of the year, remember SubTel Forum and please visit our recently revamped STF Analytics and STF Inc websites. Each has been updated for the coming year, designed to better serve our readers’ high expectations! www.stfanalytics.com www.stf-inc.com Advertising Sales Contact: Terri Jones tjones@subtelforum.com +1 703-471-4902 If you have any questions about advertising or being featured in any of the SubTel Forum publications, please feel free to reach out to us at any time. STF Loyally yours,
Kristian Nielsen Vice President
ADVERTISE WITH US!
FOR 2019 MEDIA INFORMATION VISIT: WWW.SUBTELFORUM.COM
THE VOICE OF THE SUBMARINE CABLE INDUSTRY
SUBMARINE CABLE ALMANAC SUBOPTIC 2019 COMMEMORATIVE EDITION The Submarine Cable Almanac contains details on every international submarine cable system in the world. Data is collected from the public domain, and is the most accurate, comprehensive, and centralized source of information in the industry. About this special print edition: This 8.5" x 11", full color and perfect bound book commemorates the SubOptic 2019 conference.
Buy your copy today for a beautiful and informative addition to your bookshelf!