Q3 2026
U.S. Energy Storage Market Outlook Published: September 1, 2026
seia.org | benchmarkminerals.com
Disclaimer
Q3 2026 US Energy Storage Market Outlook
All information, pricing and production data within this publication has been obtained directly by Benchmark Mineral Intelligence Ltd in accordance with Benchmark’s internal methodologies which can be viewed on Benchmark’s website. Secondary data has been obtained from various sources which are believed to be reliable and have been referenced accordingly. Estimations and forecasts have been highlighted where appropriate. The content provided is the independent opinion of Benchmark Mineral Intelligence Ltd and has been supplied solely for education and information purposes. Benchmark Mineral Intelligence Ltd is not an investment advisor, financial advisor or securities broker and subsequently withholds any liability for losses or damages incurred either directly or indirectly. The information provided herein is 'as is' and the authors/company make no warranties, express or implied, regarding its accuracy, completeness, or fitness for a particular purpose. All data reported in GWh/GW, MWh/MW, all prices reported in U.S. Dollars (USD) unless otherwise stated. To purchase the full report, please visit Benchmark's website here.
seia.org
|
benchmarkminerals.com
© Benchmark Mineral Intelligence 2026
2
Introduction to the Report Table of Contents Section 1
Executive Summary
4
Section 2
Utility-scale
11
Section 3
Residential
23
Section 4
Commercial & Industrial and Uninterruptible Power Supply
27
Section 5
Supply Chain, Trade, & Manufacturing
32
Section 6
Alternative Chemistries & LDES
39
Section 7
Forecasts
42
Key terms & glossary
54
Q3 2026 US Energy Storage Market Outlook
Benchmark BESS analyst team
SEIA Research and Storage Team
Iola Hughes, Head of Research
Emily Burlinghaus, Director of Energy Storage Manufacturing & Supply Chain
Shan Tomouk, BESS & Energy Research Lead
Joan White, Senior Director of Storage & Interconnection Policy
Pete Tillotson, Senior Analyst – BESS
Forrest Levy, Senior Solar and Storage Analyst
Calvin Xu, Analyst – BESS
Colin Smith, Director of Research
Varnika Agrawal – Senior Battery Analyst
Justin Baca, Vice President of Markets & Research
Media contacts Benchmark press@benchmarkminerals.com
seia.org
|
benchmarkminerals.com
SEIA rskaar@seia.org
© Benchmark Mineral Intelligence 2026
3
Q3 2026 US Energy Storage Market Outlook
SECTION
Executive Summary
seia.org
|
benchmarkminerals.com
© Benchmark Mineral Intelligence 2026
4
BESS market update and outlook In the first half of 2026, just under 31 GWh/10.3 GW of battery energy storage systems (BESS) entered operation across the utility-scale and behind-the-meter (BTM) markets, a y-o-y increase of 23% (GWh). The utility-scale market continued to underpin growth with 26 GWh/8.1 GW installed, with ten states bringing more than 500 MWh of new capacity online. In Q2, the U.S. added an all-time record of 20.2 GWh/ 6.7 GW. Of that, 18 GWh came from the utility space, largely supported by seven gigawatt-scale projects. In the BTM space, residential storage added 657 MWh and commercial and industrial (C&I) added 1.8 GWh. The Federal Energy Regulatory Commission (FERC) issued show cause orders under Section 206 to all six major U.S. Regional Transmission Organizations and Independent System Operators (RTOs/ISOs). The directive requires regional operators to justify or reform their existing rules concerning large-load interconnection tariffs within 60 days. This edition covers the directive, along with the responses that have been issued to date. The full Energy Storage Market Outlook report covers analysis of large load legislative updates, inverter supply chains, system pricing dynamics and developments in alternative chemistries within the manufacturing spotlight.
Q3 2026 US Energy Storage Market Outlook
U.S. BESS annual installed capacity outlook by market segment, GWh GWh 80
70
|
benchmarkminerals.com
BTM
71 +30% 59
60
+69%
50
45
40 30
27
20 10 0
seia.org
+20%
Utility-scale
2023
2024
2025
2026F
© Benchmark Mineral Intelligence 2026
5
Quarterly market snapshot – Utility-scale & behind the meter
Q3 2026 US Energy Storage Market Outlook
Q2 2026 saw BESS deployments of 20 GWh, up 11% compared to Q2 2025. The utility-scale market alone added 18.0 GWh of capacity, with Arizona, California, Utah, and Texas each deploying over 2.5 GWh. Across the quarter, seven gigawatt-scale projects came online – four in Arizona, two in California and one in Utah.
Quarterly deployments by market segment, GWh
Q2 utility-scale capacity additions by paired resource by GWh
GWh 30
Standalone
Solar
56%
44%
Grid BTM +104%
20
20
18
18
Q2 number of utility-scale projects installed by capacity
15
52 7 10
10
seia.org
|
benchmarkminerals.com
Q2 26
Q1 26
Q4 25
Q3 25
Q2 25
Q1 25
Q4 24
Q3 24
Q2 24
Q1 24
Q4 23
Q3 23
Q2 23
14
Q1 23
0
6
18
7
0-49
50-199
200-499
500-999
1,000+
Total
MWh © Benchmark Mineral Intelligence 2026
6
Residential BESS still faces headwinds
Q3 2026 US Energy Storage Market Outlook
Residential BESS deployments in Q2 2026 remained under pressure, with 657 MWh of additions, a 27% decrease y-o-y. This sharper decrease is indicative of both the decrease in installations as a result of the removal of 25D, but also the surge in installations last year as capacity was pulled forward ahead of the incentive change. The removal of 25D, while damaging in the short term, does not eliminate the underlying case for residential storage. Higher electricity costs, changes to net-metering, increased outage concerns, and increased support from states through virtual power plants and demand response schemes should help to support the industry in the long term. Increased backlash towards data center growth may also incentivize residential BESS, as private ratepayers look to shift risk away from increased electricity costs as a result of large load growth.
Quarterly residential BESS deployments, U.S.
Annual Residential BESS installations, 2023-2026F
MWh
MWh
1,000
+56%
3,500 894 794
800 578
600
400
330
387
444
413
3,000
791 641
619
-16% 3,215
599
657
2,687 +44%
2,500
2,063
2,000
454
1,500
1,433
1,000
200
500 0
Q2
Q3 2023
seia.org
|
Q4
Q1
Q2
Q3
2024
benchmarkminerals.com
Q4
Q1
Q2
Q3
2025
Q4
Q1
Q2 2026
0
2023
2024
2025
2026F
© Benchmark Mineral Intelligence 2026
7
C&I to be driven by data centers
Q3 2026 US Energy Storage Market Outlook
U.S. C&I BESS demand continues to be shaped by the rapid expansion of data centers and the growing difficulty of securing sufficient grid capacity. As a result, “bring your own generation” is becoming an increasingly important development theme, with developers combining BESS with on-site or colocated solar and wind generation to increase energy independence, manage intermittency, and reduce exposure to grid constraints. Batteries can shift renewable output, manage rapid changes in data center demand, and provide short-duration backup, while high-power uninterruptible power supply (UPS) systems continue to address power quality requirements within facilities. Natural gas generation is also being paired with storage in some hybrid configurations where dispatchable capacity is required, to provide rapid ramping for integration of NG generators, or while permanent grid connections are being developed. However, these facilities have opened up data center developers to increased criticism and pushback due to environmental impact.
Quarterly C&I and UPS BESS deployments, U.S.
BTM BESS installations – C&I and UPS applications, 2024-2026F
MWh 2,400
GWh
2,200 2,000
1,845
1,800 1,535
1,600 1,400
1,212
1,200
973
1,000 800
34.46
GW
2,337
723
698
761
782
899
980
960
1,103 9.47
600
6.85 4.64
400 200 0
Q2
Q3 2023
seia.org
|
Q4
Q1
Q2
Q3
2024
benchmarkminerals.com
Q4
Q1
Q2
Q3
2025
Q4
Q1
Q2
C&I
UPS
2026 © Benchmark Mineral Intelligence 2026
8
BESS manufacturing & technology trends
Q3 2026 US Energy Storage Market Outlook
BESS outlook by battery type
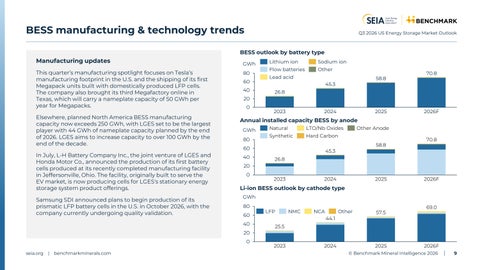
Manufacturing updates This quarter’s manufacturing spotlight focuses on Tesla’s manufacturing footprint in the U.S. and the shipping of its first Megapack units built with domestically produced LFP cells. The company also brought its third Megafactory online in Texas, which will carry a nameplate capacity of 50 GWh per year for Megapacks. Elsewhere, planned North America BESS manufacturing capacity now exceeds 250 GWh, with LGES set to be the largest player with 44 GWh of nameplate capacity planned by the end of 2026. LGES aims to increase capacity to over 100 GWh by the end of the decade. In July, L-H Battery Company Inc., the joint venture of LGES and Honda Motor Co., announced the production of its first battery cells produced at its recently completed manufacturing facility in Jeffersonville, Ohio. The facility, originally built to serve the EV market, is now producing cells for LGES's stationary energy storage system product offerings. Samsung SDI announced plans to begin production of its prismatic LFP battery cells in the U.S. in October 2026, with the company currently undergoing quality validation.
GWh 80 60 40
Lithium ion
Sodium ion
Flow batteries
Other
Lead acid
58.8
45.3
70.8
26.8
20 0
2023
2024
2025
2026F
Annual installed capacity BESS by anode GWh 80
Natural
LTO/Nb Oxides
Synthetic
Hard Carbon
60 40
Other Anode 58.8
45.3
70.8
26.8
20
0
2023
2024
2025
2026F
Li-ion BESS outlook by cathode type GWh 80 60 40
LFP
NMC
NCA
Other 44.1
57.5
69.0
25.5
20
0 seia.org
|
benchmarkminerals.com
2023
2024
2025
2026F
© Benchmark Mineral Intelligence 2026
9
Key policy updates
Q3 2026 US Energy Storage Market Outlook
FERC issued orders directing all six RTOs to justify or reform large-load interconnection tariffs - data centers specifically, but with direct implications for co-located/hybrid storage.
July
Nebraska advanced bill LB1010 establishing a clearer framework through which energy storage development can take place.
June
Illinois enacted the Clean and Reliable Grid Affordability (CRGA) Act, which aims to deploy 3 GW of energy storage by 2030.
March
January
The U.S. policy landscape for BESS since the start of 2026 has been a balancing act between domestic manufacturing ambitions, immediate grid needs, and energy security. Though there remains no final guidance regarding the precise methodology for Material Assistance Cost Ratio (MACR) calculations, we have seen a plethora of announcements from states to codify the importance of energy storage by announcing targets and incentive structures. Given the expected load growth across U.S. grids being driven by industries such as AI, we expect more of these announcements in future.
FCC announced a ban on foreign-made inverters. The ban only pertains to future models of inverters. Previouslyapproved models will be permitted, as well as those that meet domestic content requirements.
China Section 301 tariff increase, IEEPA ruled unlawful, subsequent Section 122 tariffs (now expired) and new Section 301 investigations From January 1, 2026, China's Section 301 tariff on non-EV lithium-ion batteries rose from 7.5% to 25%, stacking on the existing 23.4% base. In February, the Supreme Court ruled IEEPA tariffs unlawful, triggering reimbursements; a 10% Section 122 tariff followed for 150 days. Two new Section 301 investigations (forced labor, excess capacity) launched in March. In July, Section 122 tariffs expired as the forced-labor Section 301 action took effect (10–12.5%); the excess-capacity probe remains ongoing.
seia.org
|
benchmarkminerals.com
April
January - Aug
2026
Virginia passed procurement requirements of over 20 GW for utilities, including strong mandates for long-duration and distributed storage.
Federal policy State policy/target Tariffs
© Benchmark Mineral Intelligence 2026
10
For any queries, please contact us. Solar Energy Industries Association (SEIA) 1425 K St NW #1000, Washington, DC, 20005
•
For media inquiries, reach out to rskaar@seia.org
For2025 questions about report access, reach out to Q4 •
membership@seia.org
U.S. Energy Storage Market Outlook Benchmark
2-4 Idol Lane, London, EC3R 5DD
•
For media enquiries, reach out to press@benchmarkminerals.com
•
email@benchmarkminerals.com
seia.org | benchmarkminerals.com
Key terms & glossary Energy:
BESS - Battery Energy Stationary Storage RES - Renewable Energy Source VRE - Variable Renewable Energy DSR - Demand Side Response DSM - Demand Side Management LCOE – The Levelized Cost of Energy/Electricity BTM – Behind the meter
Battery:
LTO - Lithium–Titanate LFP - Lithium Iron Phosphate LMNO – Lithium Manganese Nickel Oxide LMO - Lithium Manganese Oxide NMC/NCM - Lithium Nickel Manganese Cobalt Oxide NCA - Lithium Nickel Cobalt Aluminum Oxide LCO - Lithium Cobalt Oxide VRFB - Vanadium Redox Flow Battery Na-ion – Sodium ion
Other Storage types:
CAESS - Compressed Air Energy Storage System FESS - Flywheel Energy Storage System PHSS - Pumped Hydro Storage System TESS - Thermal Energy Storage System
General:
RHS – Right hand side LHS – Left hand side YTD – Year-to-date y-o-y – Year-over-Year seia.org
|
benchmarkminerals.com
Q3 2026 US Energy Storage Market Outlook
Terminology:
Rated Power Capacity [GW/MW] - how much power can flow in/out a battery at a given time Energy Storage Capacity [GWh/MWh] - how much energy can be stored Storage Duration [hour] - amount of time storage can discharge at its power capacity before depleting its energy capacity Round-trip efficiency [%] - the quantity of electricity which can be recovered as a percentage of the electricity used to charge and discharge the device.
Notes on battery chemistry classifications:
The chemistry classifications used in this report are designed to provide representative coverage of the total market, while still being broad enough to facilitate a useful comparative analysis between categories. It should be noted that within categories there is significant variation in the actual chemistry and material mix. In addition, different chemistry cathodes are often blended in order to achieve certain performance or cost parameters for a given projects. The classifications used in this report are below, along with subcategories included in each broader grouping. These groupings are open to review as new chemistries become more dominant.
Cathode:
LFP, LMO, NCA, NMC111, NMC523, NMC622 (includes NMC613, NMC712), NMC811 (includes NMCA), Other (includes Lithium Sulphur, Metal Air and other early stage technologies)
See here for our disclaimer and sources
© Benchmark Mineral Intelligence 2026
12
Key terms & glossary
Q3 2026 US Energy Storage Market Outlook
Energy storage: The capture of energy produced at one time for use at a later time. Storage involves the conversion of energy from a form that is difficult to store to a form that is more convenient or economical to store for a longer period of time. Storage technologies can be the following:
Batteries
Rechargeable batteries range in size from button cells to MW grid-scale, and store energy in an electrochemical cell. Battery chemistries include lithium-ion, lead acid, sodium based and nickel based. Flow batteries operate by passing a solution over a membrane where ions exchange to charge or discharge the cell.
Hydropower
The oldest form of energy storage, it currently accounts for over 90% of the global energy storage capacity. Stores energy by using off-peak electricity to pump water from a lower reservoir to an upper reservoir, and recovers energy at peak times by turbine generation when the water flows back to the lower reservoir.
Flywheel
Stores energy in the form of rotational kinetic by accelerating a rotor/flywheel to a very high speed, added energy increases the speed, extracted energy decreases the speed.
Compressed Air
Stores energy in an underground structure or an above-ground system, by running an electric motor to compress air at times of low demand and then releasing it through a turbine to generate energy at times of high-energy demand.
Sensible heat
The temporary storage of energy in the form of heat, utilizing the sensible heat of a material, materials can be stored in contained aquifers, geological features like bedrock or old mines with the heat or cold from the material used months to years later.
Latent heat
Latent heat storage works by the transfer of heat to or from a material to change its phase, e.g. a steam accumulator utilizing the phase change of water from liquid to gas.
Chemical
Hydrogen
Stored hydrogen is a form of energy, it can be used to produce electricity via a hydrogen fuel cell through the process of electrolysis. Hydrogen can either be produced in situ or produced elsewhere and delivered.
Other
Other
There are many other technologies in use, being explored and developed, including capacitors. chemical storage, superconducting magnets, solid mass-gravitational storage, cryogenic thermal and biological storage
Electro chemical
Mechanical
Thermal
seia.org
|
benchmarkminerals.com
© Benchmark Mineral Intelligence 2026
13
Key terms & glossary
Q3 2026 US Energy Storage Market Outlook
Utility-scale and BTM ESS • Energy Stationary Storage (ESS) applications can be split into two broad categories, with the BTM market further classified into two broad markets: • Utility-Scale, storage connected to distribution or transmission networks, or in connection with electricity generation. • Front-of-the-meter distribution connected (Middle Market), systems 1-20 MW (2-4 MWhs) connected to the distribution grid used for peak shaving, renewable integration, avoided distribution grid upgrades, and grid support. • Behind the meter (BTM), storage interconnected behind the utility meter of commercial, industrial or residential customers, primarily aiming at electricity bill savings, and energy resiliency.
ESS Utility-scale
Standalone
Distribution networks
Transmission networks
Renewable / generation paired
BTM
Residential
Commercial & Industrial
Generation pairing
Generation pairing
Back-up power,
Back-up power
Microgrids EV DC fast charging UPS for Telecoms & Data centers
seia.org
|
benchmarkminerals.com
© Benchmark Mineral Intelligence 2026
14