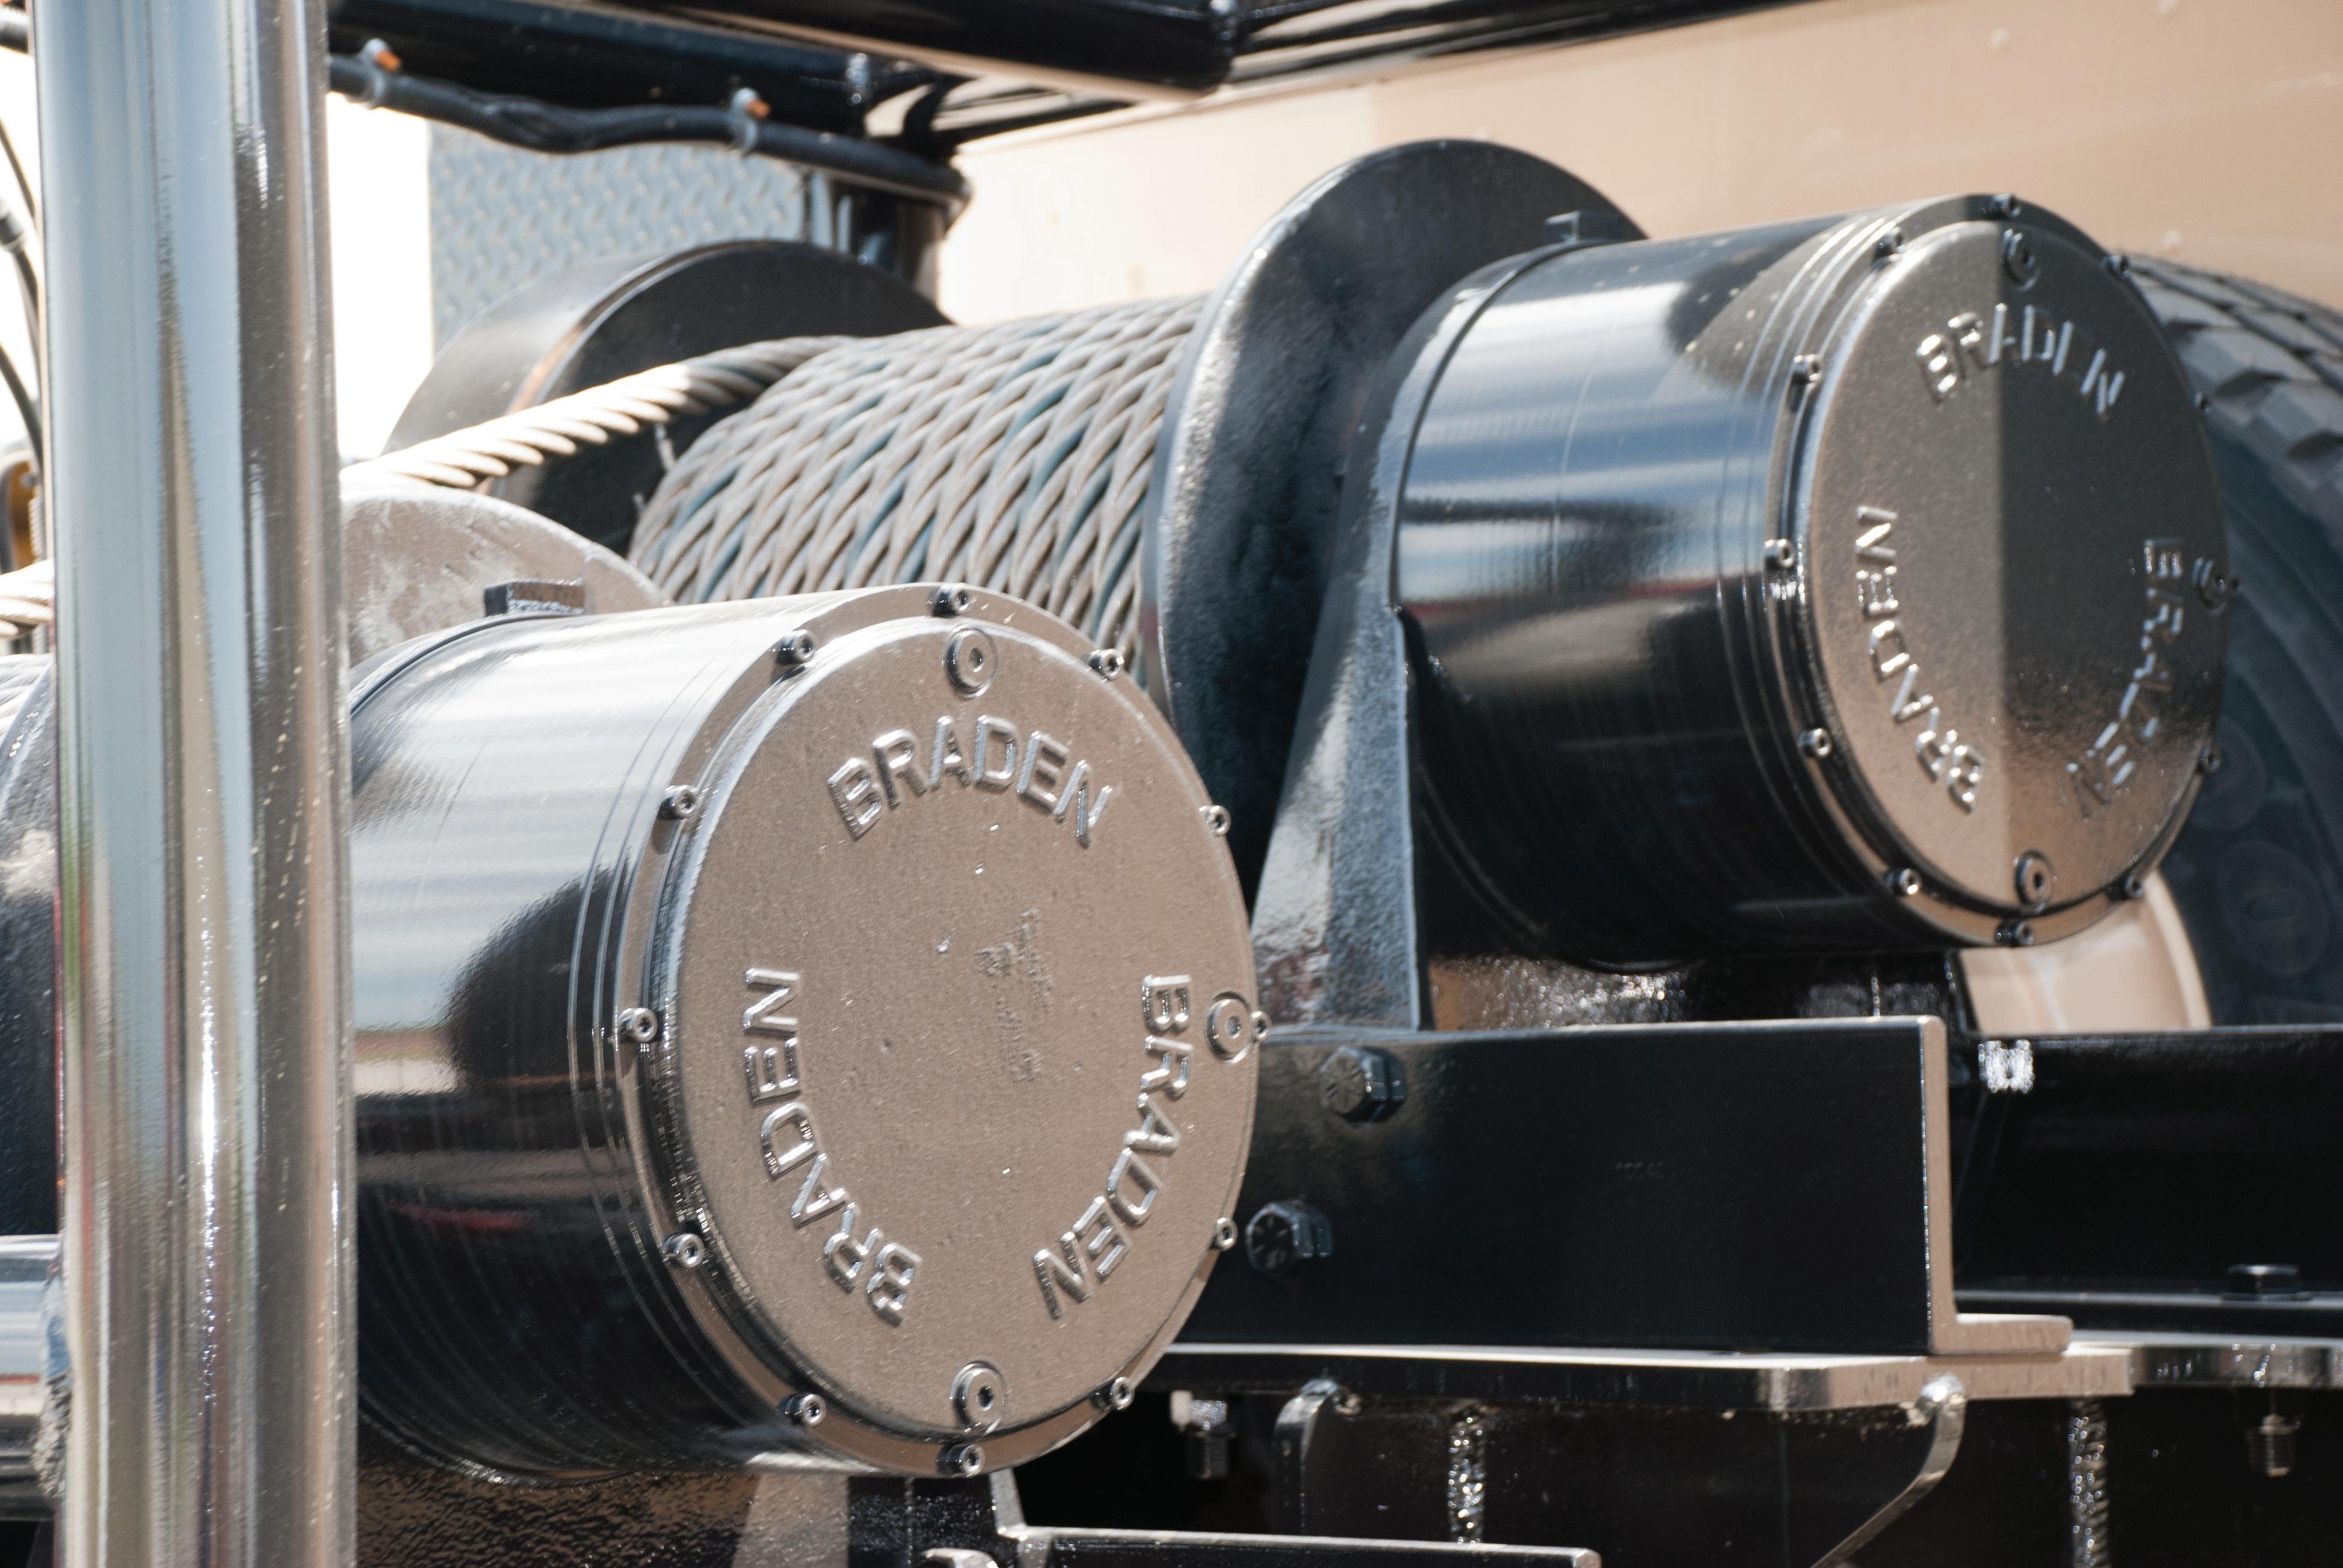
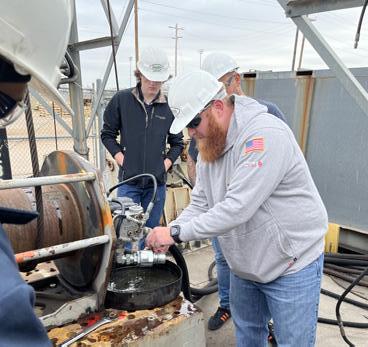
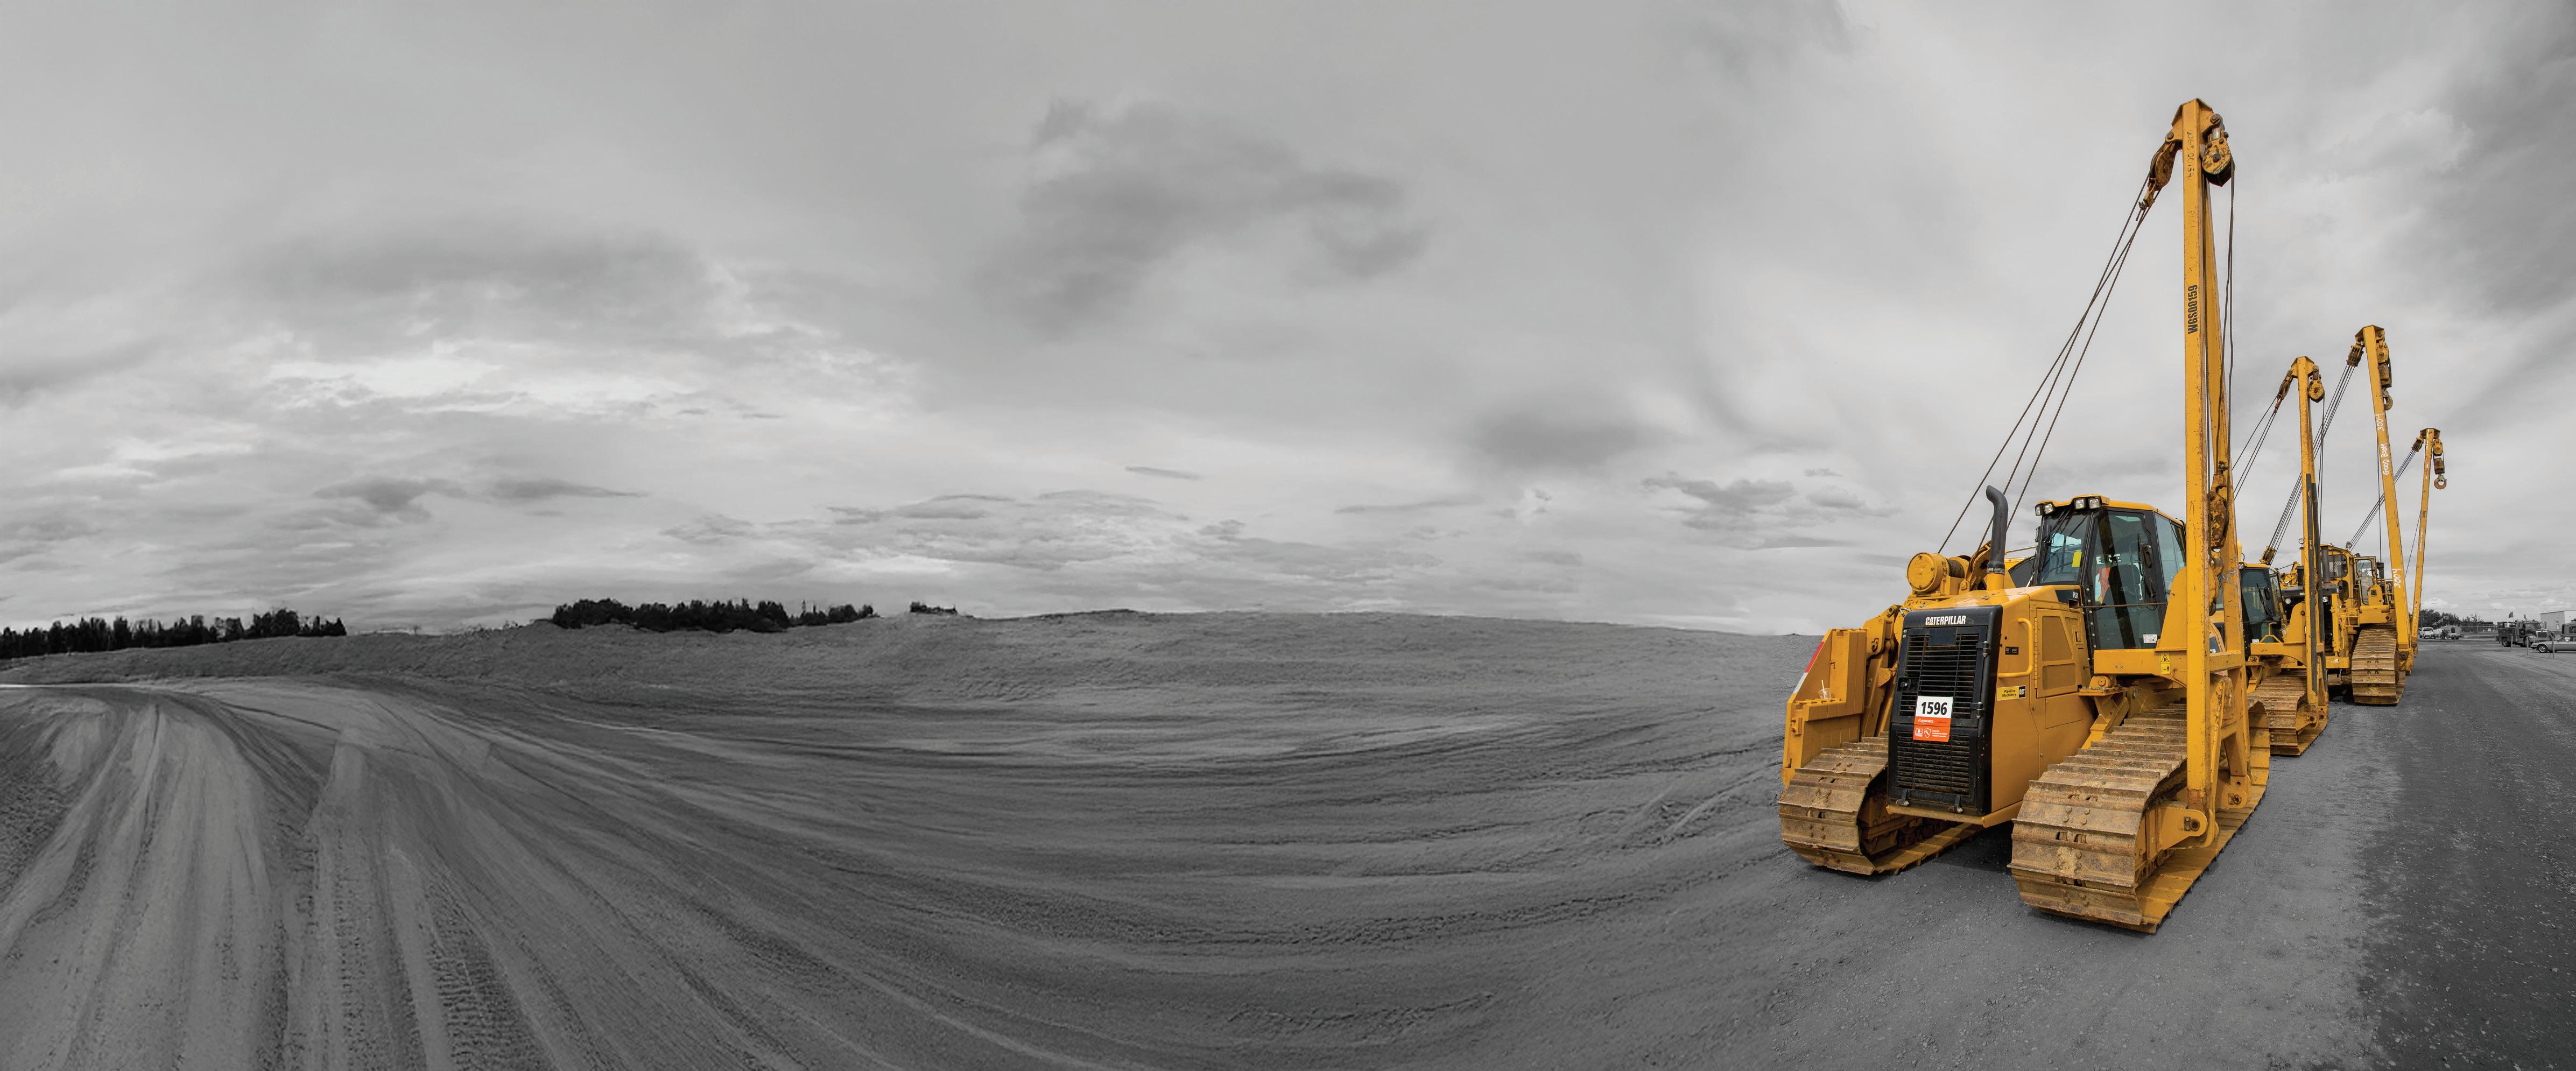
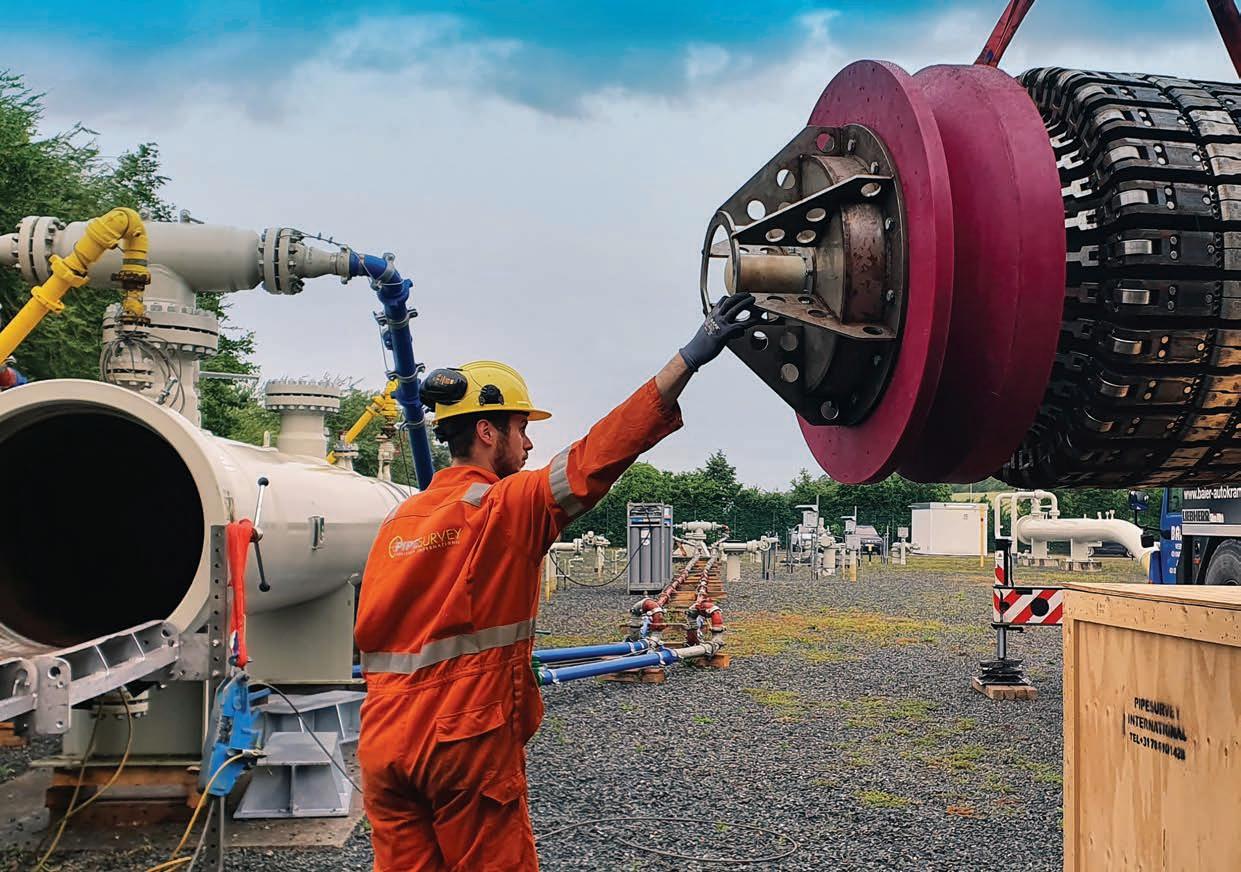
Since 1924, BRADEN has conquered recovery challenges in the oil eld with products that are simple to install, use and service. Engineered to deliver unmatched durability and power, BRADEN winches are the preferred choice for equipment manufacturers and operators who demand performance under the toughest conditions.
C O NTENTS
03. Editor's comment
05. Pipeline news
The latest oil and gas pipeline news from around the world. MANAGEMENT AND MONITORING
09. Hydrogen in the bloodstream
Ivan Antochiw, Sr. Product Manager, Emerson’s Aspen Technology business, USA.
13. Beyond capture and storage
Garry Hanmer, Principal Simulation Consultant, Atmos International, UK.
LAWS AND REGULATIONS
16. FERC’s retroactive rate fix: remedy or overreach?
Igor de Souza Tostes, Senior Legal Counsel and Local Compliance Officer.
OPERATING IN EXTREMES
21. Revealing the risk
Dawna Fretwell, Programme Director, Technical Services for Asset Integrity and Reliability at ABS Consulting.
COVER STORY
26. Maintaining the flow
Darran Pledger, STATS Group.
PIPELINE MACHINERY FOCUS
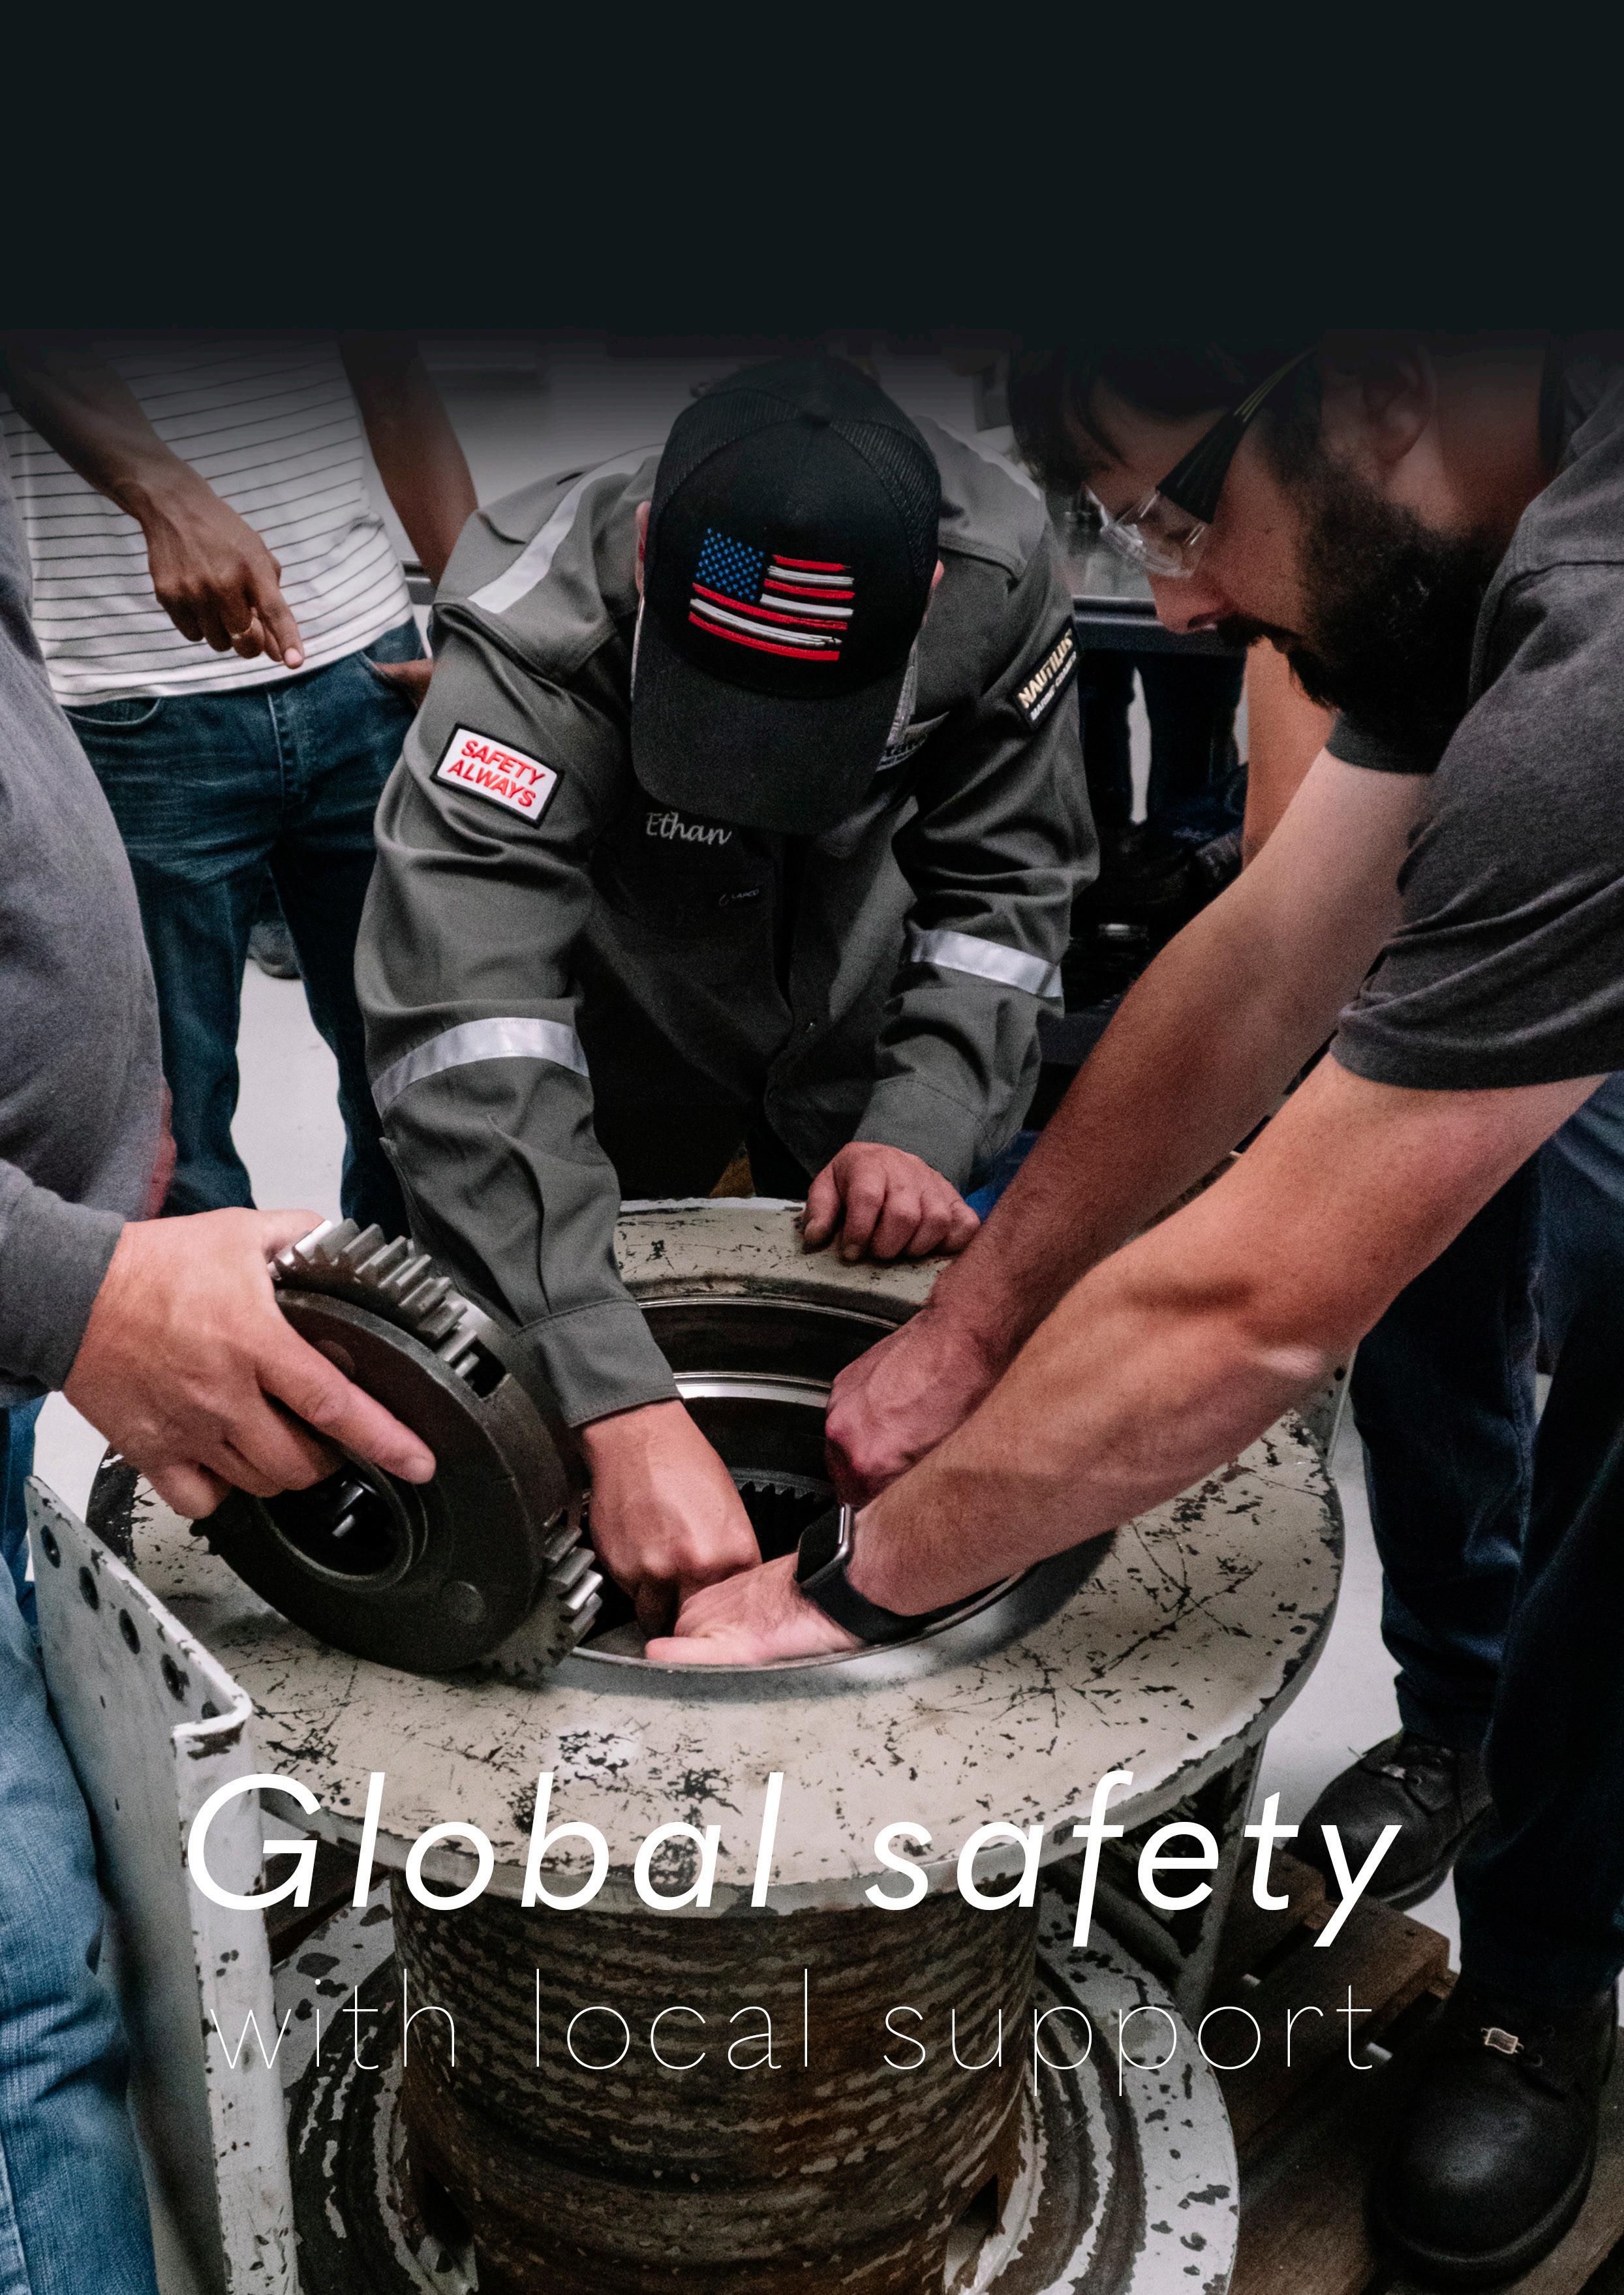
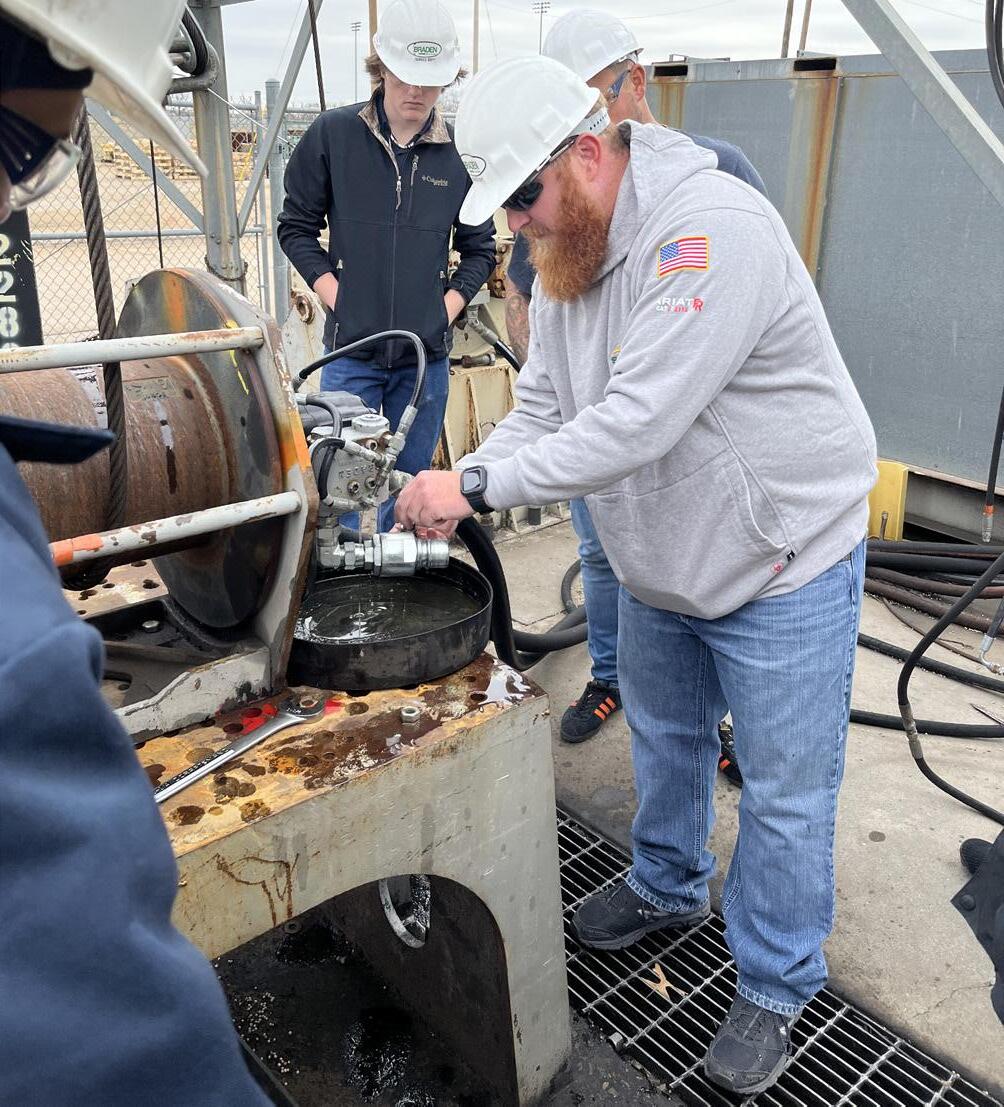
33. Global safety with local support
Todd Razor, Arrowhead Winch and Altrad Sparrows.
FIELD JOINT COATINGS
37. Why simplicity matters
John Thomson, Director – SeaShield, and Chiara Sorrentino, Technical Director, Winn & Coales (Denso) Ltd.
PIPELINE STEELS AND FABRICATION
41. Rehabilitating ageing infrastructure
Cindy Trahan, Technical Communications Lead, FlexSteel Pipeline Technologies, LLC, USA.
WELDING
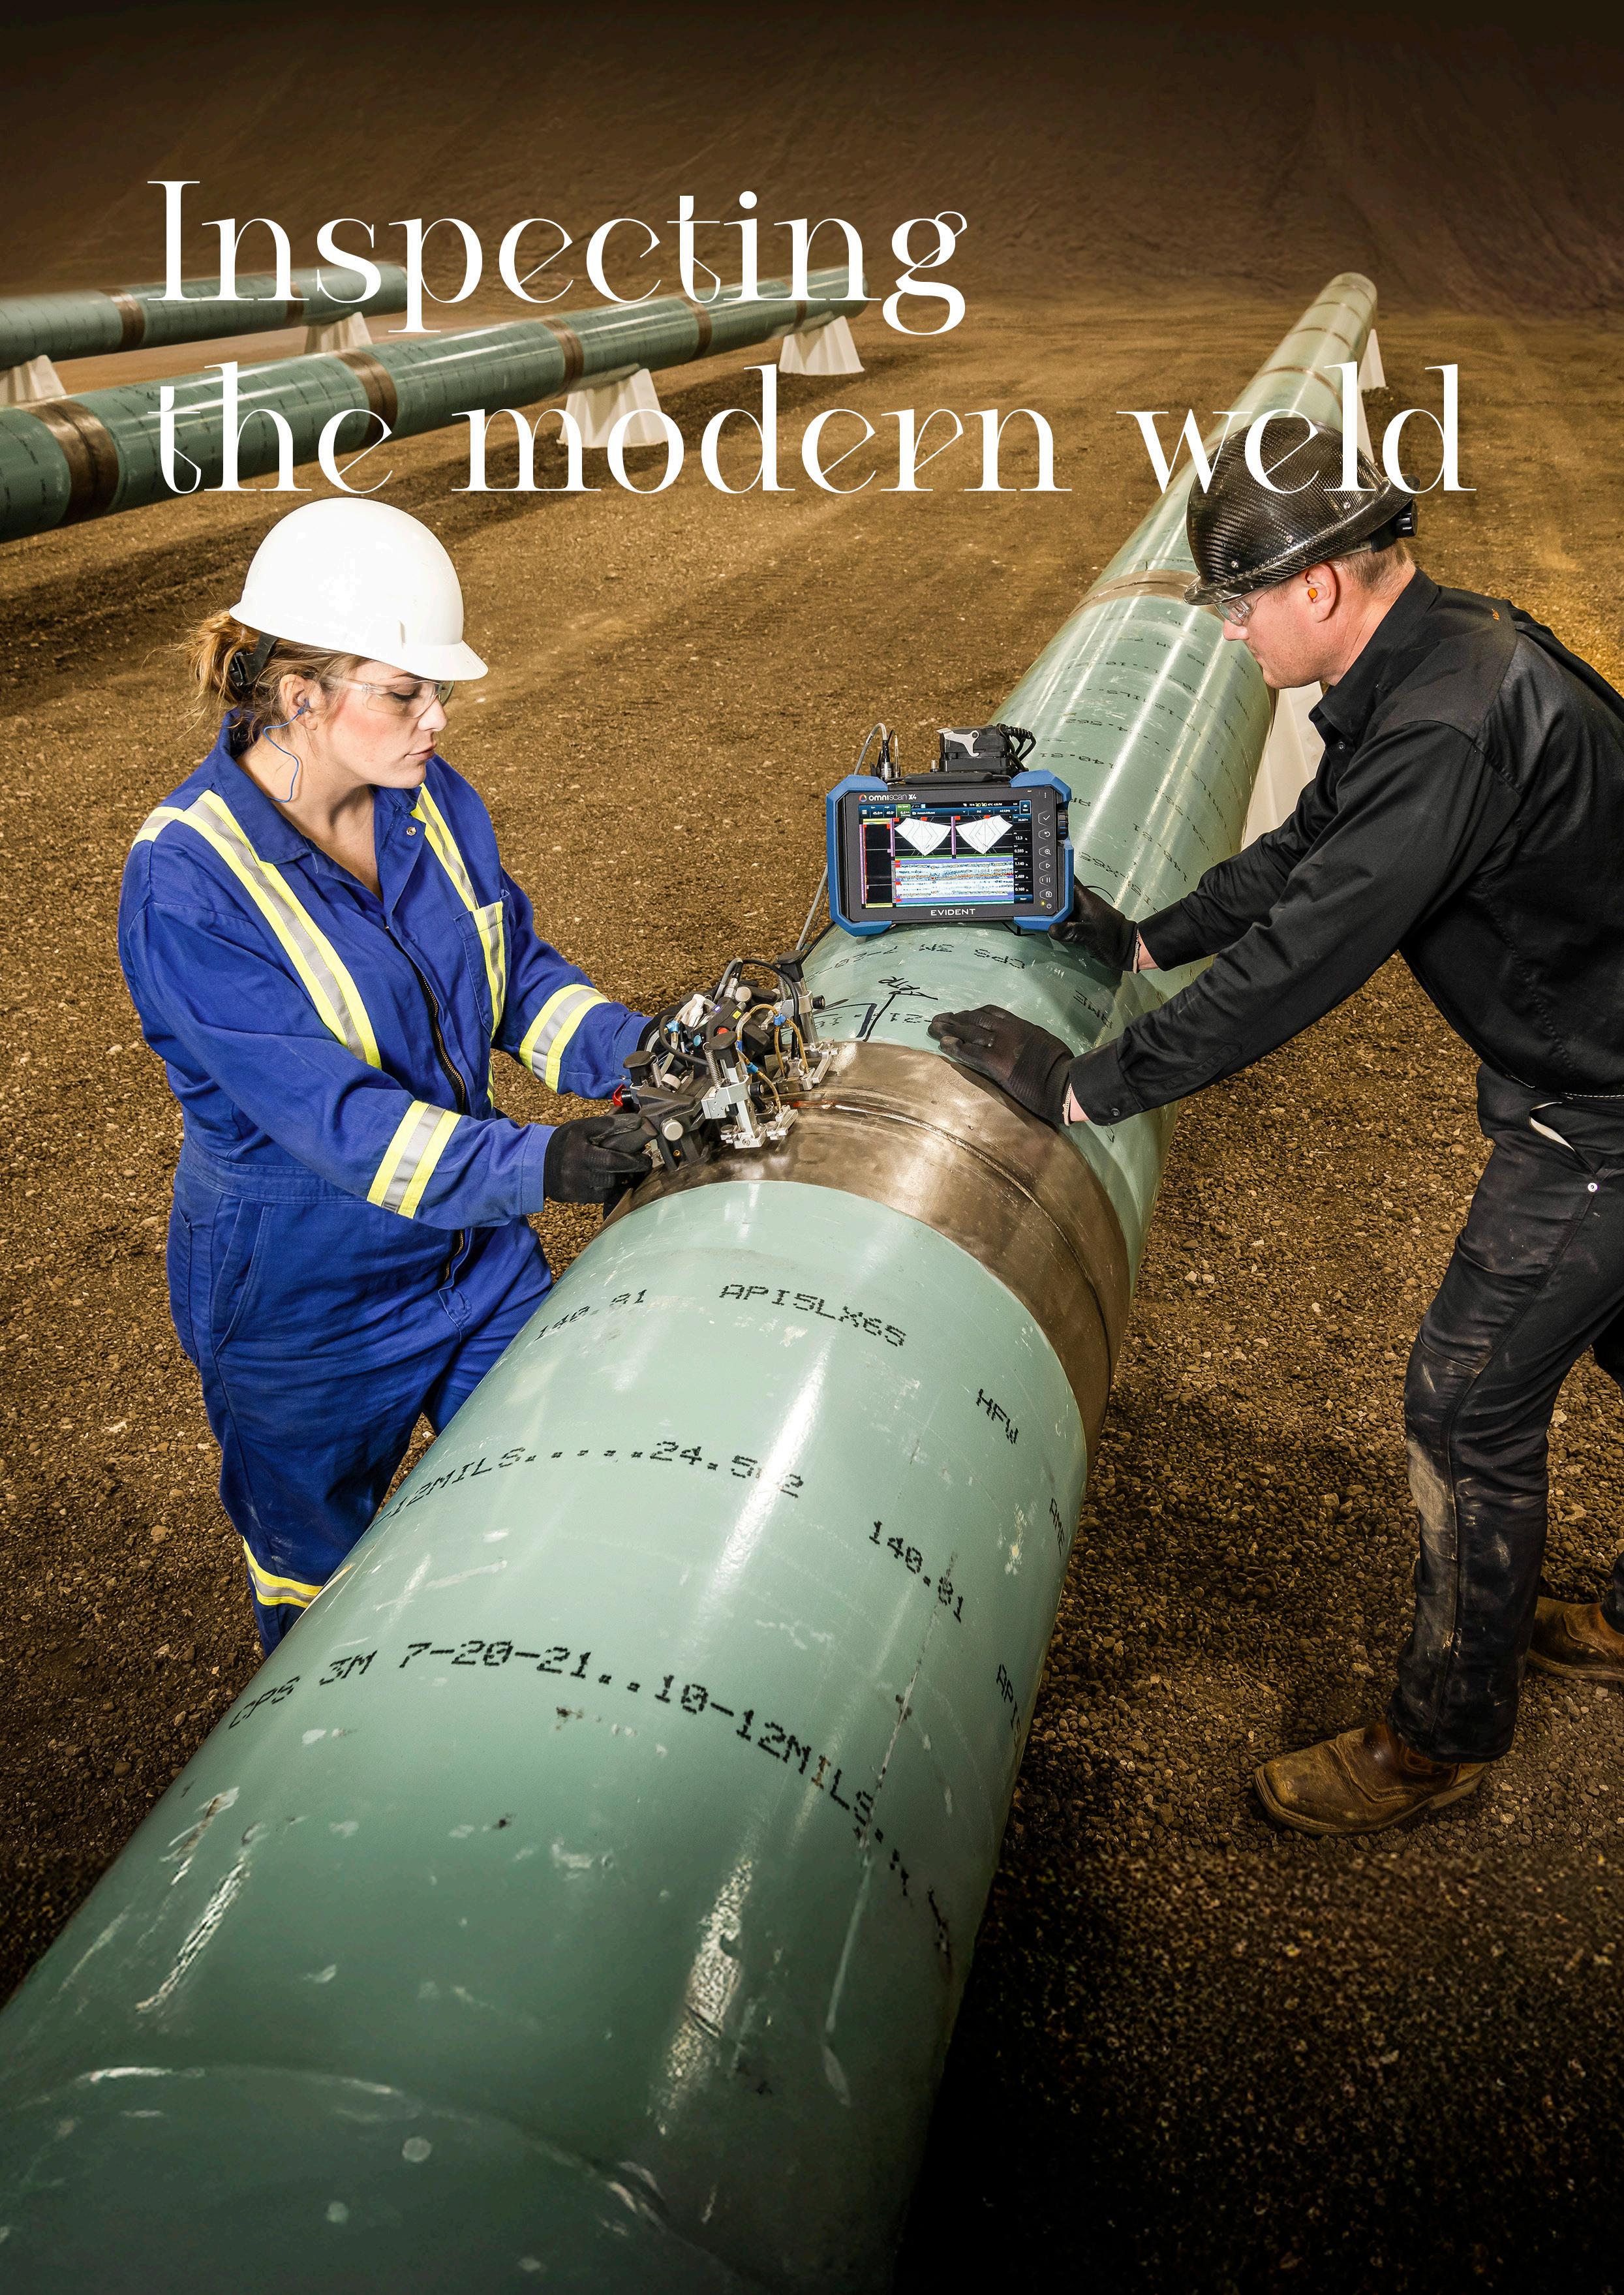
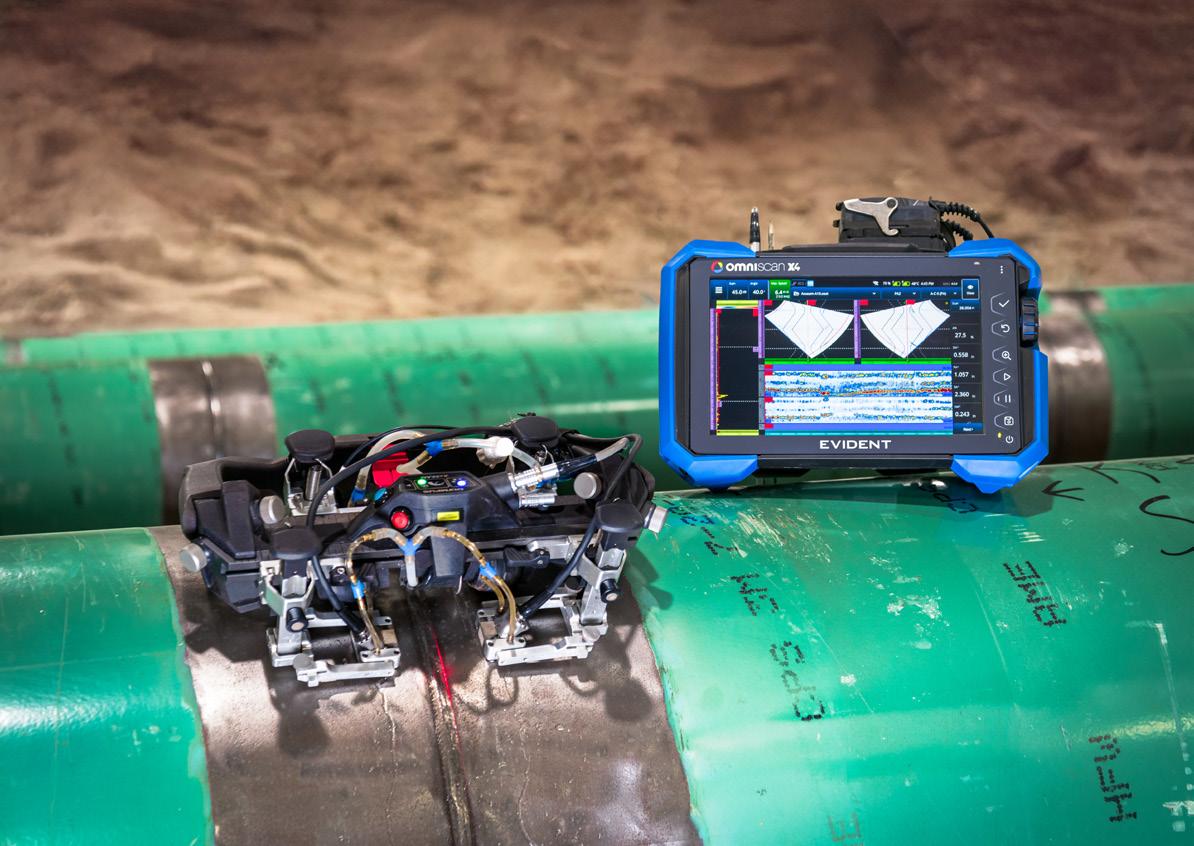
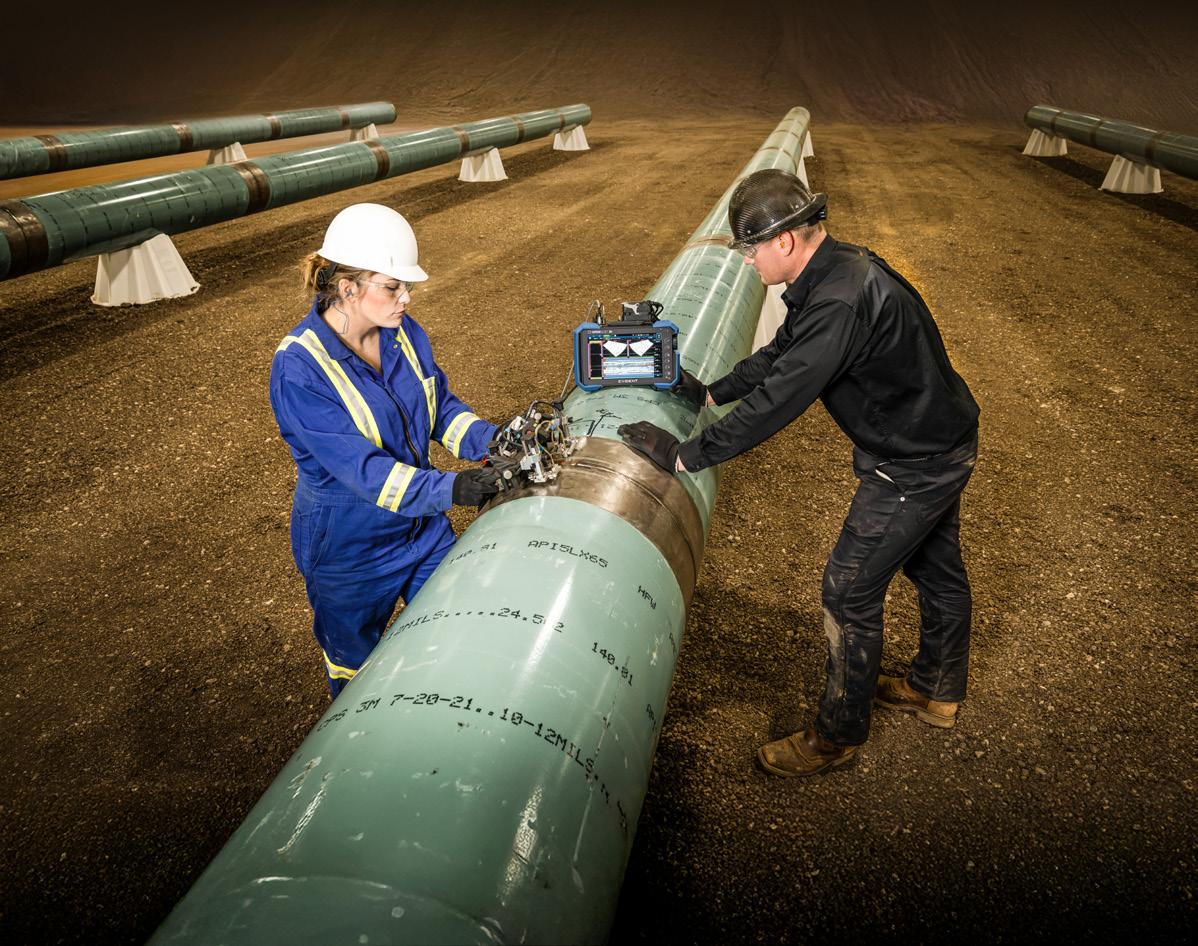
47. Inspecting the modern weld A Q&A with Angélique Raude, Global Director NDT Application & Market Development, Evident.
SYSTEM OPERATION
51. System optimisation of gas transmission pipelines Michael Kasch, ILF Consulting Engineers Germany GmbH.
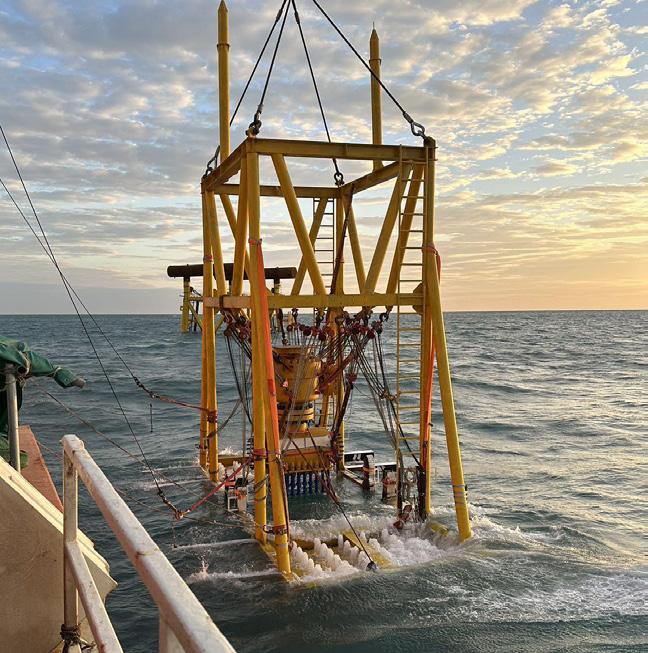
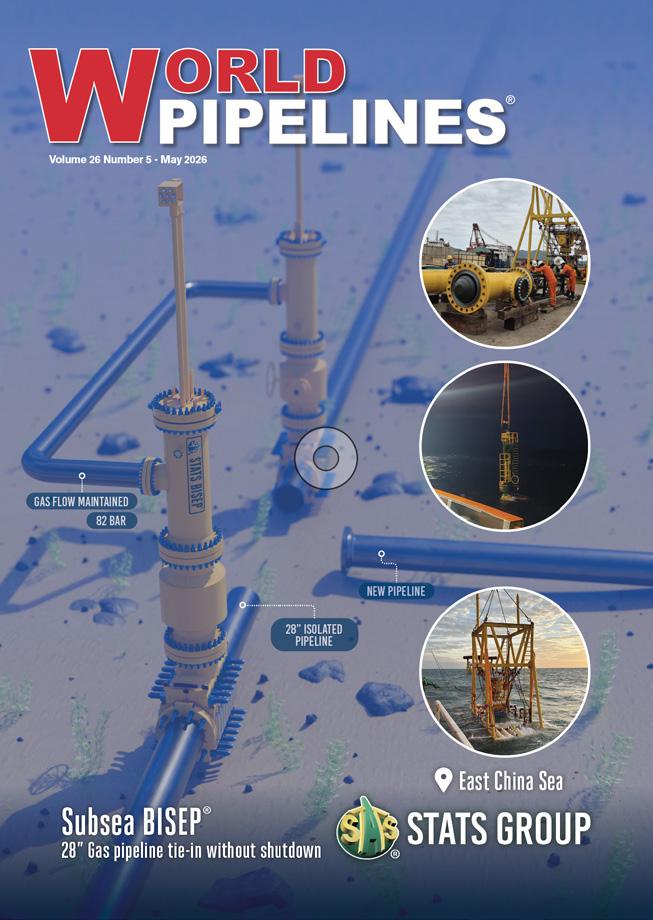
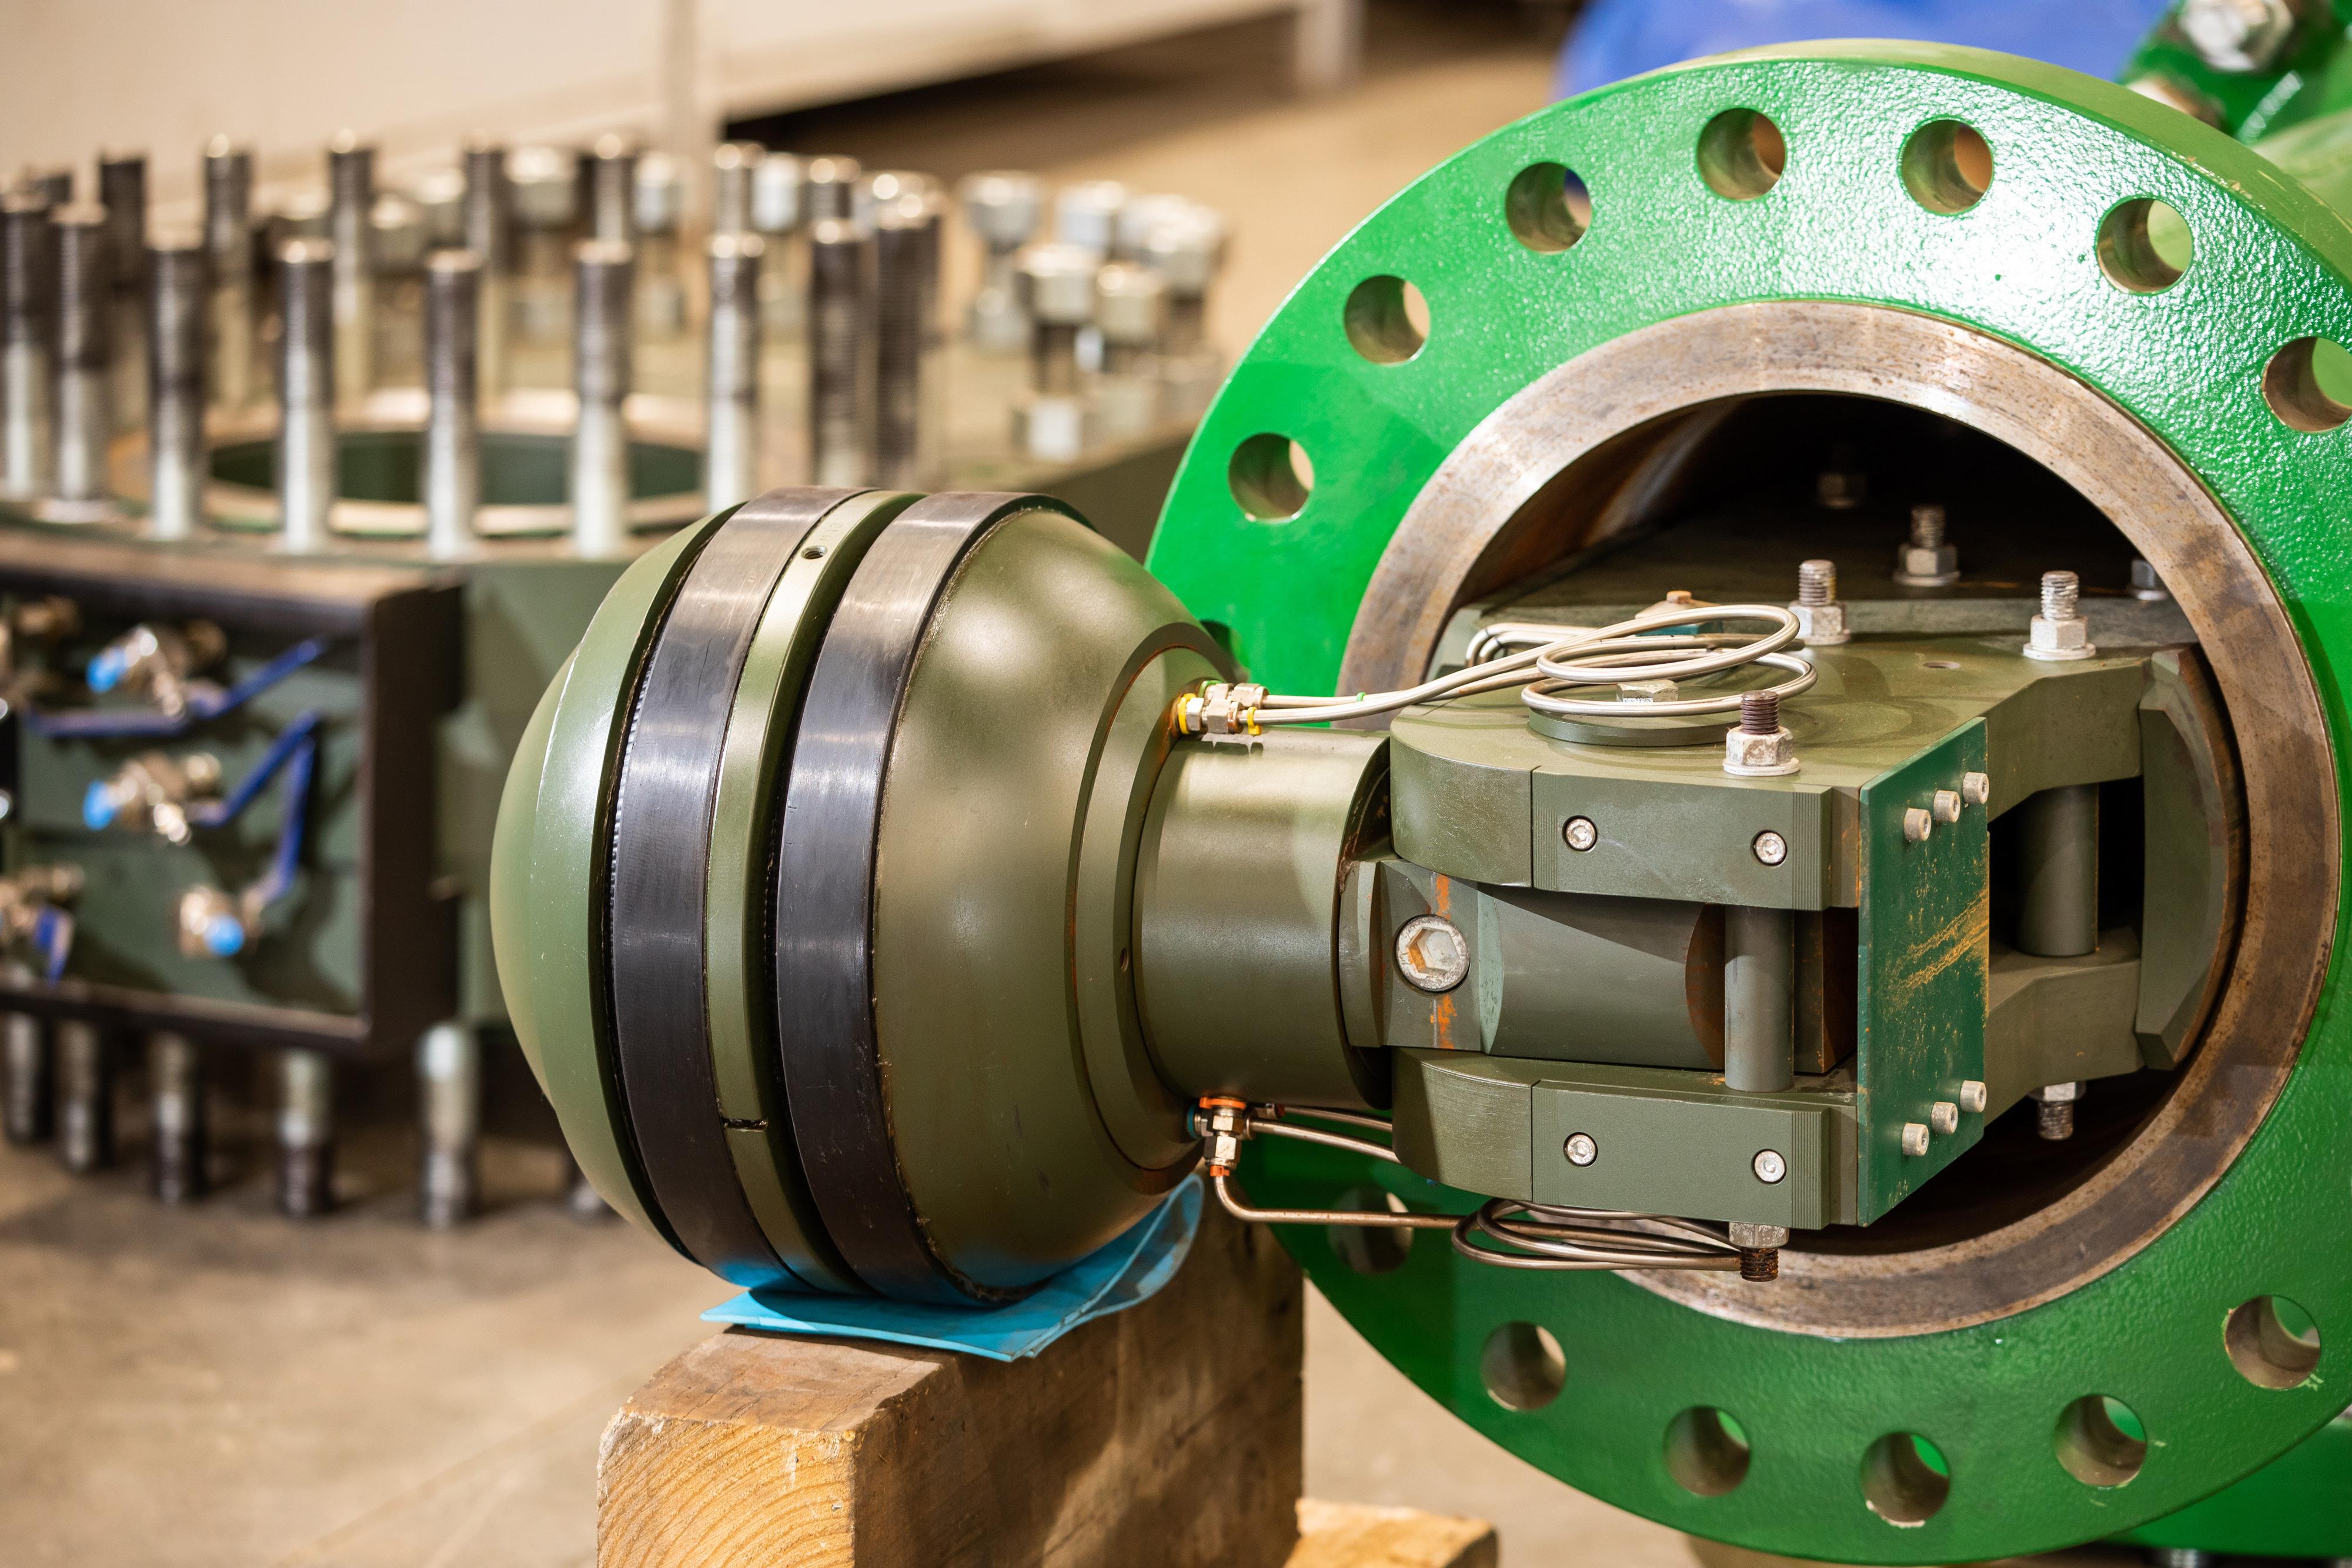
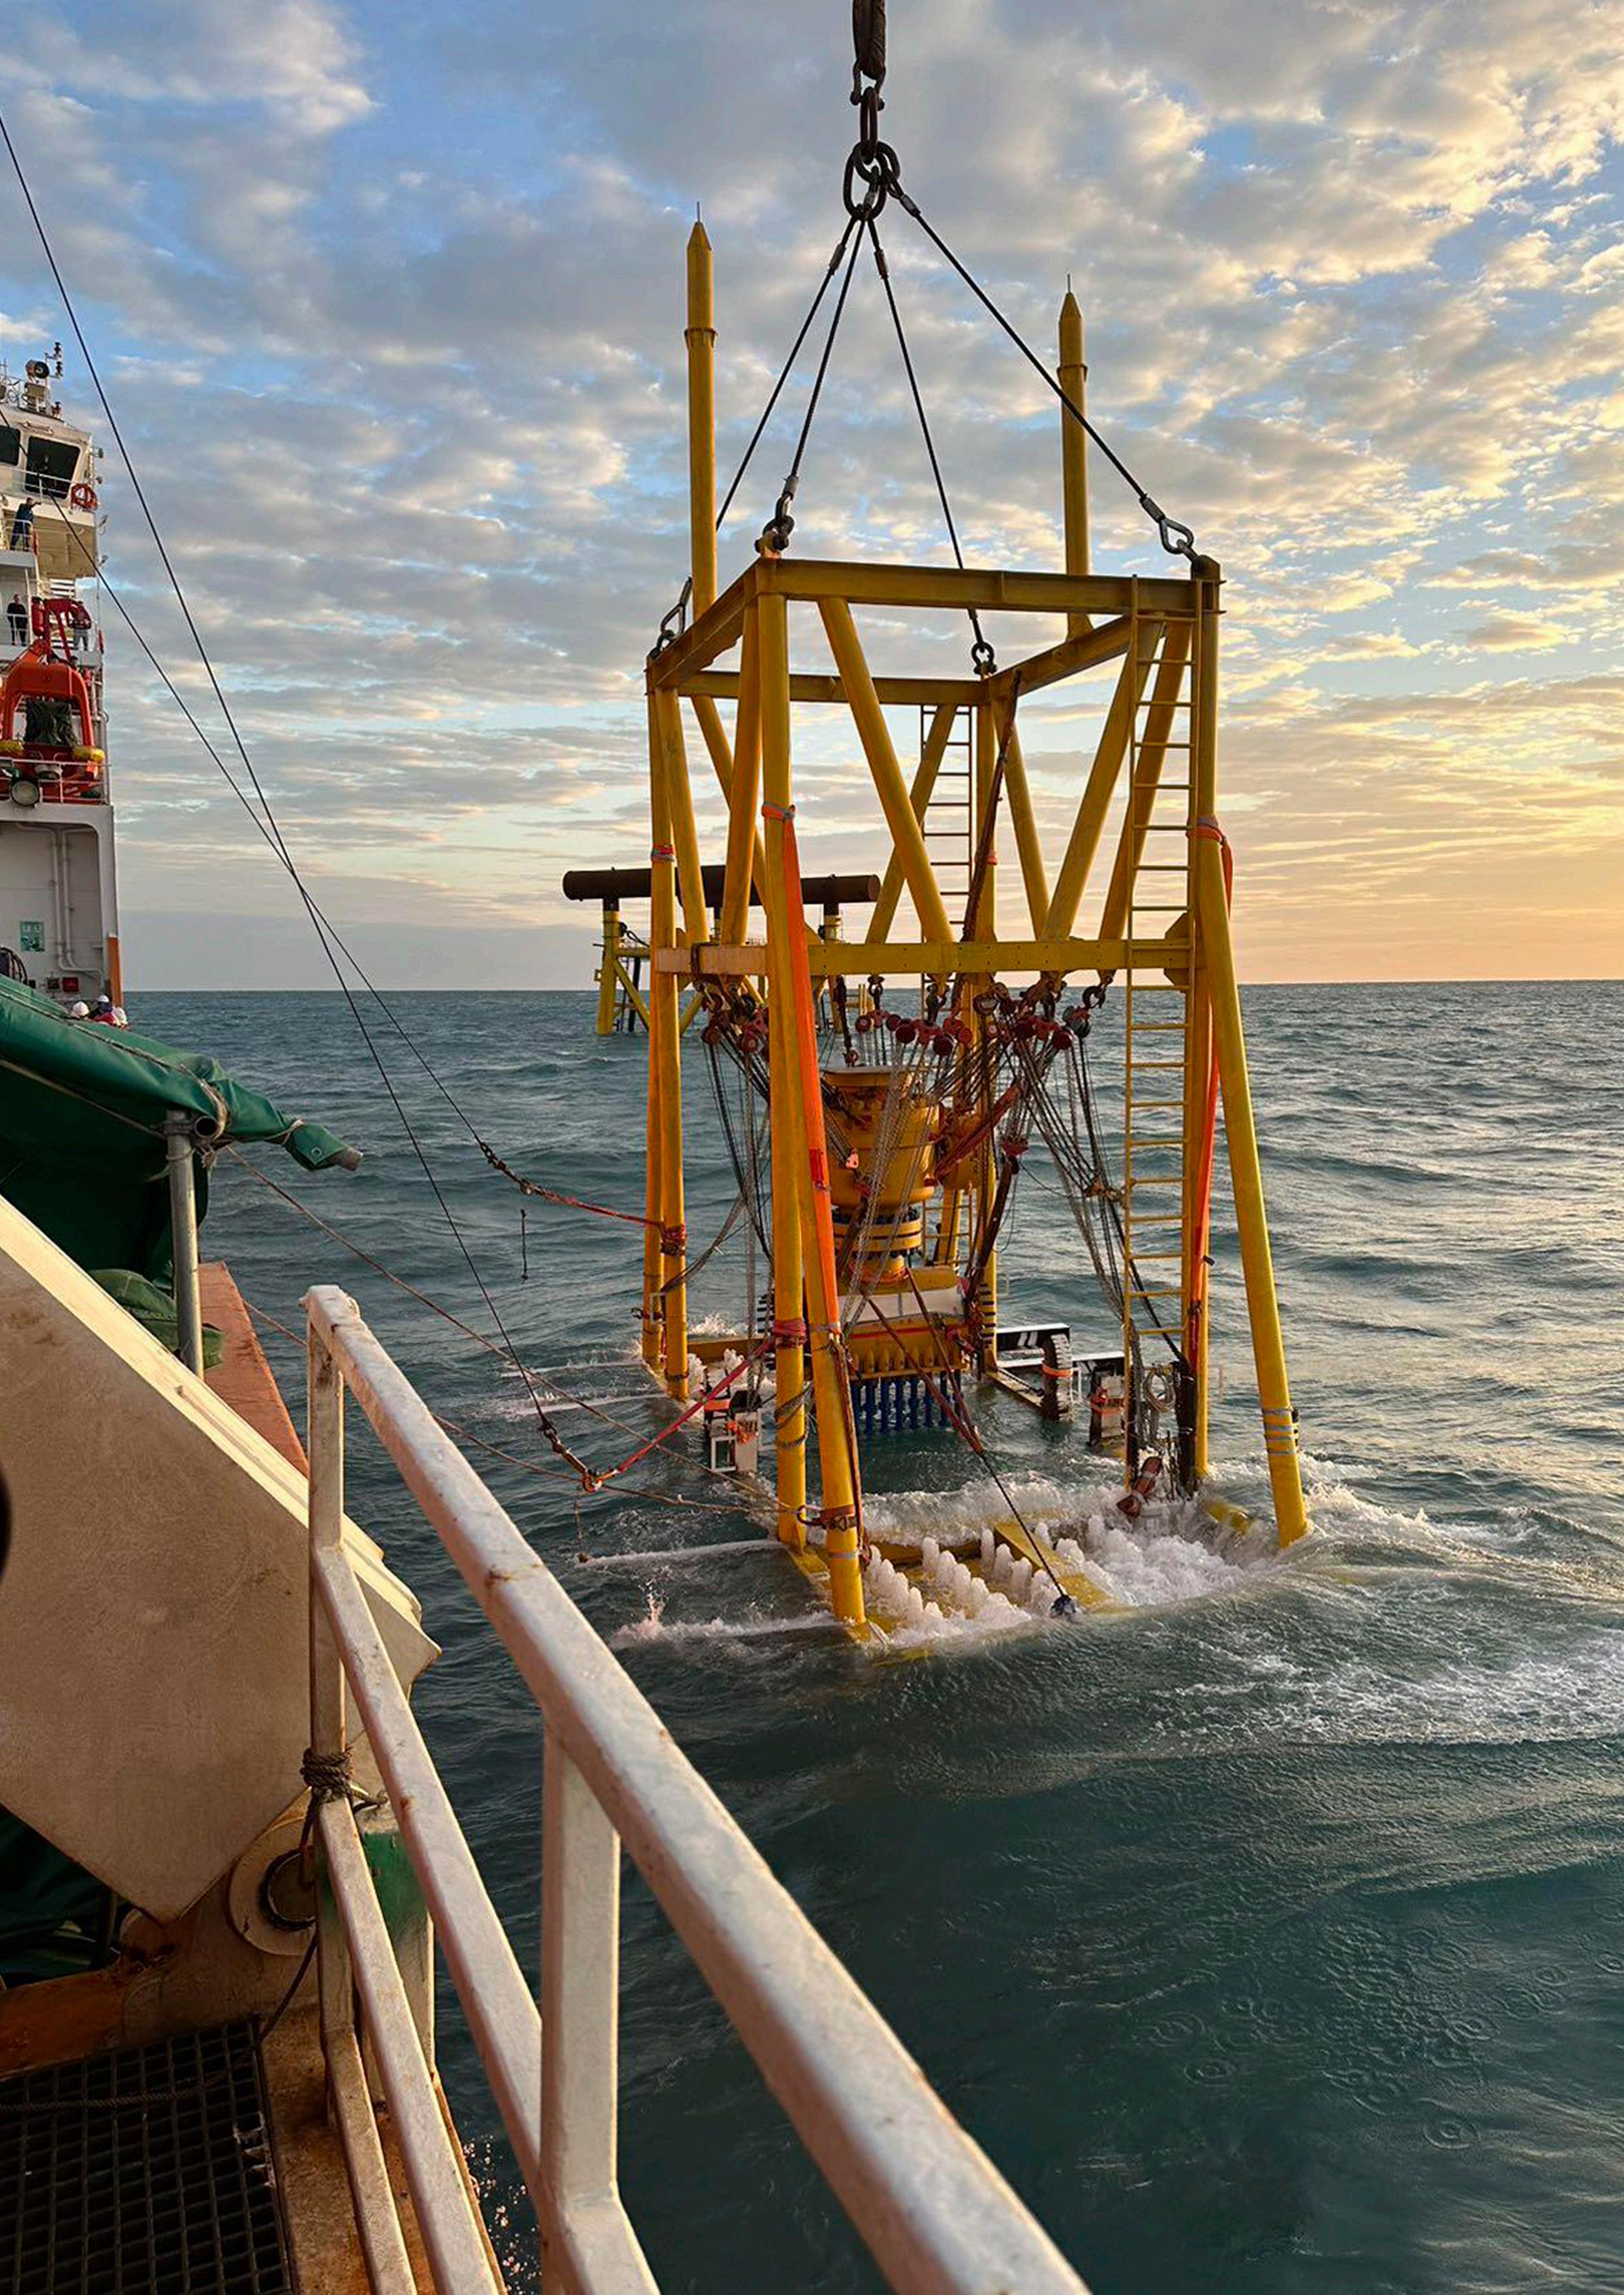
a 28 in. gas pipeline in the East China Sea. Production was maintained at 82 bar with no interruption to flow. This IMCA compliant, leak -tight dual seal isolation allowed a new field to be tied into existing subsea infrastructure. www.statsgroup.com
EDITOR’S COMMENT
CONTACT INFORMATION
MANAGING EDITOR
James Little james.little@worldpipelines.com
ASSISTANT EDITOR
Emilie Grant emilie.grant@worldpipelines.com
SALES DIRECTOR
Rod Hardy rod.hardy@worldpipelines.com
SALES MANAGER
Chris Lethbridge chris.lethbridge@worldpipelines.com
Annual subscription £60 UK including postage/£75 overseas (postage airmail). Special two year discounted rate: £96 UK including postage/£120 overseas (postage airmail). Claims for non receipt of issues must be made within three months of publication of the issue or they will not be honoured without charge. Applicable only to USA & Canada: World Pipelines (ISSN No: 1472-7390, USPS No: 020-988) is published monthly by Palladian Publications Ltd, GBR and distributed in the USA by Asendia USA, 701C Ashland Avenue, Folcroft, PA 19032. Periodicals postage paid at Philadelphia, PA & additional mailing offices. POSTMASTER: send address changes to World Pipelines, 701C Ashland Avenue, Folcroft, PA 19032.
SENIOR EDITOR Elizabeth Corner elizabeth.corner@worldpipelines.com
Tanker traffic through the Strait of Hormiz has collapsed since mid February, and pressure on oil and gas markets continues to mount. In peacetime, 20% of the world’s oil and gas is shipped from producers in the Gulf through the Strait, including 20 million bpd of oil. Over some time periods in the past two months, we have seen effectively zero ships transiting the strait, and hopes for a meaningful, long-term cessation of hostilities are increasingly in jeopardy.
London-based Shipbroker, Clarksons, recently spoke to Reuters about the prospects for a ceasefire: “Recent weeks have brought several false starts and, although some form of resolution is likely at some point, the timing of any durable breakthrough remains highly uncertain”.1
Even when partially open, traffic is down about 90%, and highly erratic. A weekend escalation in mid April saw Iran firing what appeared to be warning shots at vessels, and the US military seizing an Iranian cargo ship. A total of three ships passed through the Straits in a 12 hour period (compared to about 130 per day in normal circumstances). Ships continue to cluster outside the corridor, and operators are weighing war risk as much as commercial logic.
A renewed interest in pipeline alternatives is not surprising amid this landscape. Saudi Arabia is currently pumping as much crude as it can through its pipeline to the Red Sea port of Yanbu. The East-West pipeline (also known as Petroline) was built in the early 1980s, when the Iran-Iraq War threatened shipping in the Persian Gulf. It now has new importance in the world economy: Aramco is transporting 7 million bpd of oil through the 746 mile pipeline, which offers a direct route to global markets without passing through Hormuz.
The UAE’s Habshan–Fujairah pipeline (also called the Abu Dhabi Crude Oil Pipeline or ADCOP) is performing a similar function, moving approximately 1.7 million bpd to the Gulf of Oman port of Fujairah, which sits beyond the Strait.
Another option is the Kirkuk-Ceyhan pipeline (also known as the Iraq-Türkiye Crude Oil Pipeline), which connects northern Iraq to the Mediterranean coast at Ceyhan, with a nominal capacity of around 1.6 million bpd, although in practice, flows have been far lower. Operations have been repeatedly disrupted, and recent reports suggest intermittent throughput amid ongoing repair efforts and political negotiations.
These systems were not designed for this exact moment, but they are stepping in to help save the day. However, even at full utilisation, existing bypass pipelines cannot compensate for the scale of disruption currently being seen in the Strait. Nor can they fully replicate the flexibility of maritime transport, which allows cargoes to be rerouted, delayed, or redirected in response to shifting market signals.
The East-West pipeline was conceived in response to a different conflict, in a different era, but is serving today’s geo-political circumstances, albeit amid recent threats from the Houthis to target Red Sea assets. Land-based pipelines are, of course, just as vulnerable to attack as ships sailing through a strait (arguably more so, since they are static assets). This fact will not stop Middle Eastern countries from pursuing new pipeline infrastructure in the wake of 2026’s Hormuz turmoil. Türkiye, in particular, is positioning itself as a strategic alternative corridor between the Gulf and European markets, with renewed discussion around pipelines that could bypass Hormuz entirely and redraw regional energy flows. At the same time, analysts suggest that the current disruption will accelerate investment in additional Middle Eastern export pipelines, from expanded Red Sea capacity to new links across Iraq and beyond.
Wood Mackenzie: Europe and Asia’s response to Middle East crude export collapse
Middle East crude exports collapsed nearly 60% between early February and early March 2026, falling from 18.7 million bpd to 5.9 million bpd as the Strait of Hormuz faced paralysis, according to Wood Mackenzie’s VesselTracker. This disruption has triggered an unprecedented global energy realignment, with Europe importing record North American crude and refined products while simultaneously exporting surplus gasoline and fuel oil (FO) to Asia.
“This is not a temporary disruption but a structural shift in global energy flows,” said Javier Solis, Analyst at Wood Mackenzie – Maritime Team. “Europe’s diesel deficit and gasoline surplus, combined with Asia’s role as the balancing valve, represent a moving landscape in which pricing and flows remain tightly linked to political decisions rather than purely commercial signals.”
The Strait of Hormuz exhibited near-total paralysis for crude flows, with Middle East exports declining more than 60% over five weeks based on loading programmes and sailing confirmations. By contrast, traffic through Bab al Mandab and the Suez Canal adjusted rather than shut down. East-to-west clean petroleum product (CPP) flows partially redistributed between Suez and the Cape of Good Hope, with Suez remaining the dominant corridor despite clear month-over-month transit declines.
Saudi Arabia rapidly reconfigured export routes in response. Loadings at Yanbu surged from roughly 735 000 bpd pre-conflict to over 3.0 million bpd, reflecting a deliberate reduction in Hormuz exposure. The Red Sea remains navigable for risk-tolerant operators, but these structural reroutings signal deeper concerns over corridor reliability rather than immediate closure.
With Middle East Gulf (MEG) flows constrained, Europe has backfilled lost supply with long-haul North American crude and
finished products. US crude imports reached 1.41 million bpd in the closing week of March, while Canadian crude loadings rose 16% to 1.019 million bpd, with growing flows into Germany and Ireland. These volumes have allowed European refineries to maintain throughput, particularly for gasoline and fuel oil, despite persistent diesel tightness.
Asia has emerged as the global release valve, absorbing Europe’s excess gasoline and fuel oil alongside record volumes of North American crude. US crude flows to Asia matched Europe’s intake at 1.41 million bpd over the same period, with India and East Asia dominating receipts. East Asia emerged as the largest destination for Canadian West Coast crude exports. Asian markets retain regional distillates internally, consolidating MEG and Indian gasoil eastward rather than allowing traditional westbound flows.
Wood Mackenzie expects European diesel premiums to remain elevated through H2 2026, sustained by structural supply constraints. European refiners face ongoing margin pressure on gasoline, with oversupply likely to persist. Crude flows are being redrawn in real time, requiring cargo-level tracking to manage exposure accurately.
Chokepoint risk has evolved from an isolated variable into a portfolio-wide concern. Energy buyers and traders must model dual-disruption scenarios, and multi-regional analysis. “What began as an expanding conflict tied to Iran has evolved into a dual-corridor disruption, with the Red Sea and the Strait of Hormuz jointly constraining global trade flows – a shift clearly visible in AIS traffic patterns and real-time physical movements that has transformed a regional risk into a global supply chain crisis”, said Christopher Aversano, Maritime Research Director.
Gulf states to revisit pipelines to bypass Hormuz: Mayer Brown commentary
Following news reports on Gulf states revisiting pipeline projects to bypass the Strait of Hormuz, Richard Nelson, Partner in the Global Energy Practice at Mayer Brown, said:
“Markets are shifting from dislocation to rebalancing and structural response. The focus is now understandably on optionality and diversification, reflecting how exposed existing supply routes are.
“The constraint is that the alternatives are not straightforward. Existing pipeline infrastructure is often single-commodity and still reliant on onward shipping, so it reduces pressure in one part of the system while leaving exposure elsewhere. Replicating that at scale, particularly across borders, is significantly more complex.
“Cross-border pipelines have historically been difficult to deliver in practice. They require alignment across multiple jurisdictions and regulatory frameworks, clarity over how gas
inventory flows are managed, and guaranteed long-term volumes to support what are typically very high-cost, long-dated investments. They offer less destination flexibility than LNG and are hence more exposed to particular market or demand-side risk. Pipeline projects of this nature also depend on coordination between national stakeholders with differing priorities, which has often proven difficult to sustain.
“That tension is now feeding into capital allocation. The paradigm is that there is a growing premium on delivery flexibility and execution certainty, but also more caution around large-scale, capital-intensive infrastructure projects. What this highlights is that existing oil and gas supply structures are less resilient than assumed and changing that is considerably harder than recognising the need.”
H2NorthEast signs MoU with Northern Gas Networks for hydrogen in North East England
H2NorthEast, a leading carbon capture-enabled hydrogen production facility being developed in the heart of industrial Teesside, has signed a Memorandum of Understanding (MoU) with Northern Gas Networks (NGN), the gas distributor for the North of England, to pursue opportunities to provide low carbon hydrogen to industrial end users across North East England.
The agreement comes as H2NorthEast submits its application for Phase 1 of the project into the East Coast Cluster Teesside
selection process. Launched by the Department for Energy Security and Net Zero (DESNZ) in February 2026, this is a process to identify projects that could connect to and utilise CO2 storage capacity in the planned Northern Endurance Partnership transportation and storage infrastructure by 2032, crucial to achieving net zero in Teesside, one of the UK’s most carbon intensive industrial regions.
CONTRACT NEWS
Corinth Pipeworks and ArcelorMittal reconfirm collaboration on low carbon steel
WEBINAR – Advancing hot tap completion: Dual Seal Plug technology for safer, more efficient operations
Online Webinar, UK
https://www.statsgroup.com
14 - 17 September 2026
Gastech 2026
Bangkok, Thailand
https://www.gastechevent.com
15 - 16 September 2026
Subsea Pipeline Technology Congress (SPT 2026) London, UK
https://sptcongress.com/
21 - 24 September 2026
ROG.e 2026
Rio de Janeiro, Brazil
https://roge.energy/en
22 - 24 September 2026
International Pipeline Conference and Expo 2026
Calgary, Canada
https://www.ipceyyc.com/
2 - 5 November 2026
ADIPEC 2026
Abu Dhabi, UAE
https://www.adipec.com/
Corinth Pipeworks has further strengthened its long-standing collaboration with ArcelorMittal, reinforcing a shared commitment to delivering sustainable, highperformance steel solutions for the evolving needs of the energy sector. For the first time, Corinth Pipeworks is using XCarb® recycled and renewably produced steel, a low carbonemissions steel, in its production of energy pipes.
The collaboration reflects the joint ambition of both companies to actively contribute to the energy transition by enabling the development of resilient, lowcarbon infrastructure. By combining Corinth Pipeworks’ advanced manufacturing capabilities with ArcelorMittal’s leadership in low carbon-emissions steel production, the partnership supports the delivery of pipeline solutions with a significantly reduced environmental footprint, suitable for both conventional and emerging energy applications, including hydrogen transportation.
Baker Hughes to supply three gas compression units for major natural gas pipeline in Argentina
Baker Hughes has announced that it has secured a strategic order from San Matias Pipeline S.A. to supply three gas compression units for a major natural gas pipeline project in Argentina.
The order consists of three NovaLT™16 gas turbines equipped with three centrifugal compressors, along with commissioning services, spare parts, special tools, and remote monitoring and diagnostic capabilities. This equipment will be installed at a gas compressor station near Allen, Río Negro, to support the transportation of natural gas from the Vaca Muerta formation to the Gulf of San Matias through a dedicated pipeline, providing feed gas to Southern Energy’s two floating LNG vessels.
The project also marks the first utilisation of Baker Hughes’ NovaLT™ gas turbine technology in South America, reflecting growing demand for high-efficiency, loweremissions turbomachinery with competitive delivery timelines. The NovaLT™16 platform was selected for its performance, efficiency, delivery advantages, and suitability for midstream gas compression applications supporting LNG value chains.
XCarb® recycled and renewably produced steel is a low carbon-emissions steel made in an Electric Arc Furnace (EAF) with minimum 75% scrap content and with 100% renewable electricity. This production process reduces CO2 emissions by 65% compared with the traditional steelmaking route in a blast furnace. XCarb recycled and renewably produced steel also supports customers in lowering indirect (Scope 3) emissions and reinforces a low-carbon, circular economy.
“ArcelorMittal is proud to contribute to the transition to low-emissions energy systems by supplying our reduced-emissions steel, produced with our Electric Arc Furnace (EAF) technology. Leveraging high recycledscrap input and tightly controlled metallurgical processes, we provide highperformance steels that are immediately available to support the decarbonisation of tomorrow’s energy infrastructure,” commented Gonzalo Delgado, CMO Industry Region South at ArcelorMittal Europe – Flat Products.
• BEL Valves secures first CCUS contract
• Wood Mackenzie: six-country international shale priority list for energy security as Middle East conflict drives supply diversification
• DNV and Equinor introduce the Event Learning Taxonomy CLUE to improve incident understanding for industry
• STATS Group acquires pipeline intelligence firm Pipelines 2 Data (P2D)
Follow us on LinkedIn to read more linkedin.com/showcase/worldpipelines
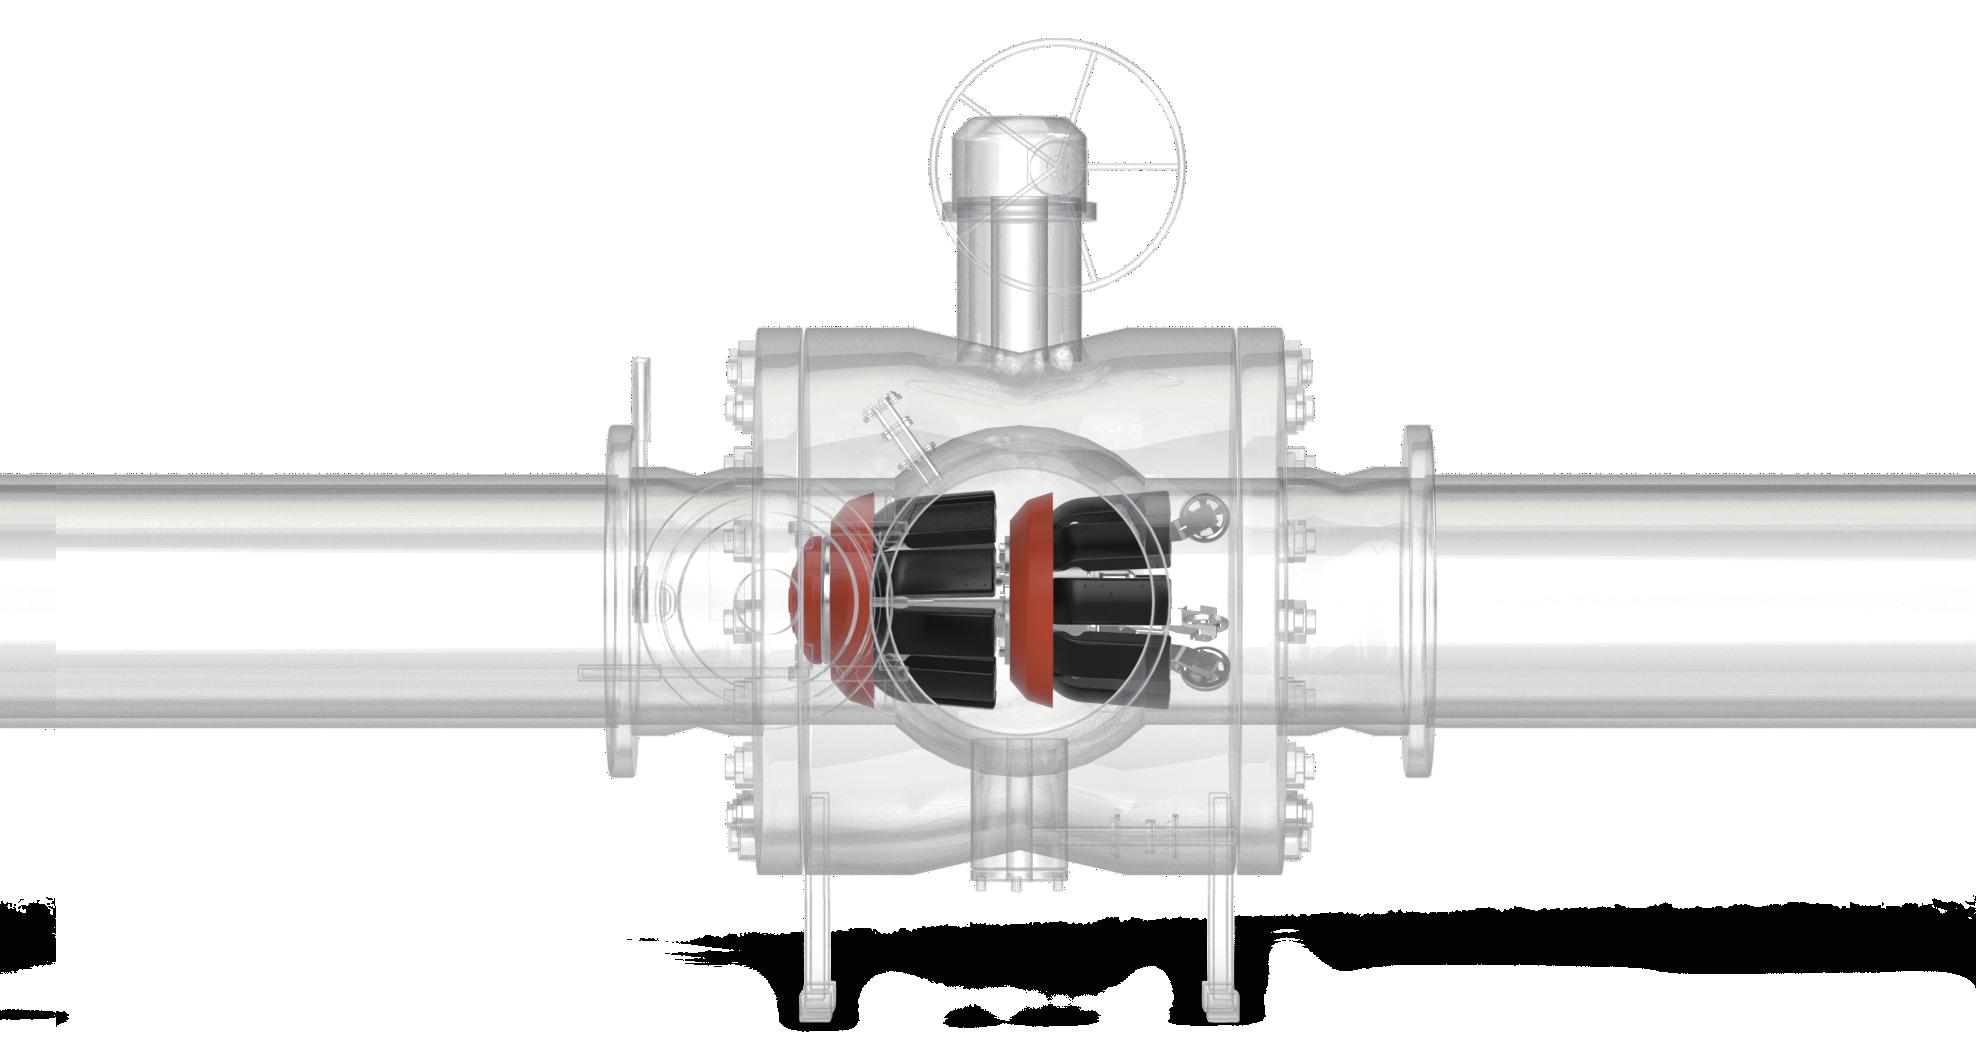
The BISEP® has an extensive track record and provides pioneering double block and bleed isolation while maintaining pipeline ow. Fail-safe hydraulically activated dual seals provide tested, proven and fully monitored leak-tight isolation, every time, any pressure.
size range: 3” - 56” max pressure: 153bar / 2220psi type approved
Ivan Antochiw, Sr. Product Manager, Emerson’s Aspen Technology business, USA, considers how pipelines are evolving and pipeline management systems are catching up.
Running beneath our farmland, rivers, and city streets, natural gas pipelines carry our energy with a steady pulse and quiet intent. More than just steel and valves, these lines act as a critical part of the circulatory system for our modern energy infrastructure.
Natural gas is a fuel that flows seamlessly, hour after hour, year after year, powering homes, industries, and electric grids without interruption.
Now a new force is on the horizon.
The global push for decarbonisation has brought hydrogen into focus. Hydrogen is the lightest molecule known in the universe, and its clean burn is promising to reshape how we produce, store, transport and consume energy. The question is no longer if hydrogen will enter the energy mix, but how fast, and through what infrastructure. Of course, the most tempting answer is: just use the pipelines we already have. And it’s not a far-fetched idea. Repurposing existing natural gas infrastructure promises to be one of the most cost-effective, immediate ways to scale hydrogen delivery, but it also introduces a series of technical challenges.
New fuel, new rules
Hydrogen behaves significantly differently than methane. Its unique physical properties change pipeline behaviour at every stage. Its smaller molecule size means it can permeate seals and gaskets that were engineered for methane. Its lower volumetric energy density requires increased flow rates to deliver equivalent heating value. These factors, together with a wider flammability range and a tendency to accelerate material fatigue through embrittlement, demand a reassessment of compressor performance, inventory calculations, integrity management protocols, and other factors.
But here’s the kicker: repurposing existing pipelines for hydrogen costs just 10 - 35% of building new ones. In regions with dense gas infrastructure, up to 80% of future hydrogen pipelines could be repurposed rather than built from scratch. The savings are not only financial, but also temporal and environmental.
The quiet work is already happening
The scale of natural gas infrastructure is immense. In North America alone, more than 1.7 million miles of transmission
and distribution pipelines carry trillions of cubic feet of gas annually. Even a blend with 10 - 20% hydrogen could displace tens of millions of metric tons of CO2 emissions, without major infrastructure overhauls. Pilot projects are already validating the technical and economic viability of this technique as a strategic bridge to pure hydrogen pipelines, especially for industrial and residential sectors not yet ready for broader adoption.
Europe and the US are facing this transition through different regulatory challenges. While European operators need to comply with a number of national mandates and decarbonisation targets, US operators are working under evolving federal guidance, with a stronger focus on safety and gradual adoption. These divergent views are shaping how the different pieces are being developed, deployed, and scaled.
In the US, organisations like Southwest Research Institute (SwRI) have upgraded their facilities to test hydrogen-natural gas blends under real-world conditions. Their mobile flow loop simulates leaks and flow dynamics for various hydrogen concentrations to validate sensors, flow meters, and leak detection systems originally designed for methane.
Across the Atlantic, The Trans Adriatic Pipeline (TAP) consortium – which includes gas transmission companies Snam, Fluxys, Enagás, and bp – are carrying out a gap analysis on some of their infrastructure to assess its suitability for hydrogen blending. They are also evaluating hydrogen
readiness for its 878 km import route, with plans to double capacity and potentially inject hydrogen by 2027.
By 2030, hydrogen blending is expected to become more widespread, especially in regions with mature gas infrastructure. Regulatory frameworks, safety standards, and commercial tools are predicted to be in place to support readiness at a global level.
Hydrogen readiness is as much about software as it is about pipelines
Realising the full potential of hydrogen blending depends on more than retrofitting physical infrastructure; it requires digital transformation in parallel. Pipeline management systems must evolve beyond traditional supervisory control and data acquisition (SCADA) platforms to become intelligent and adaptive operational technology (OT).
These systems need to sense, simulate, and respond to the unique properties of hydrogen, which behaves differently than methane in terms of flow dynamics, energy content, and its interaction with pipeline equipment.
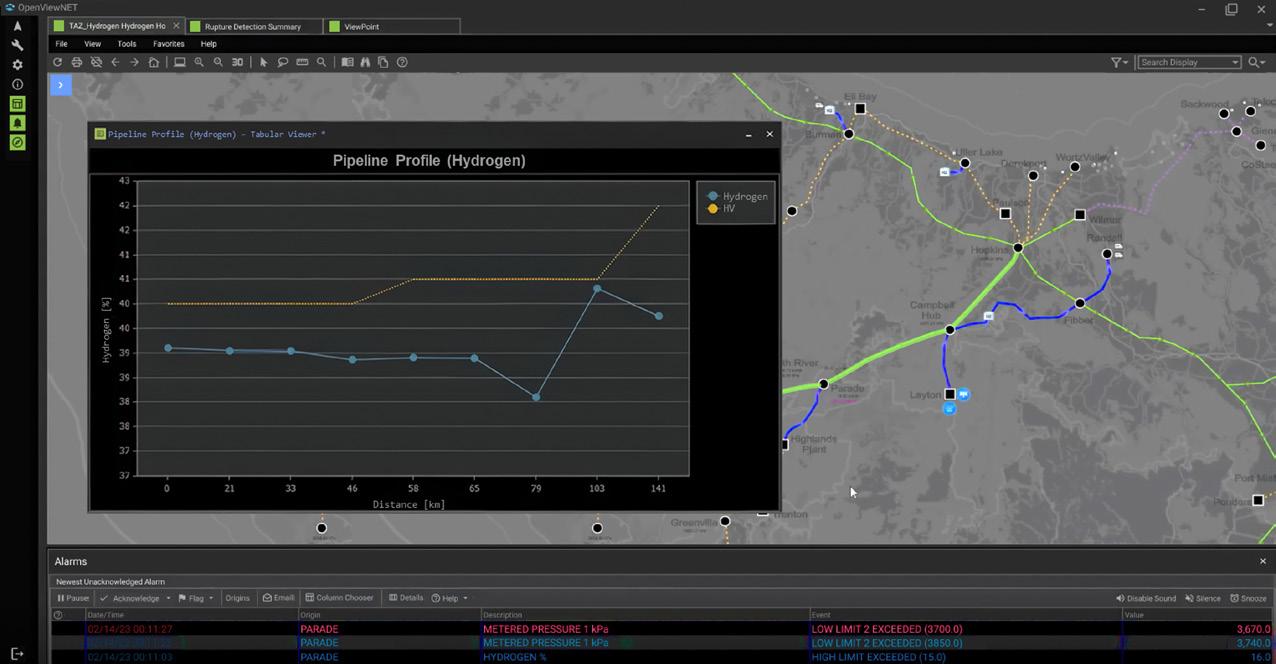
SCADA has long served as the nervous system of pipeline operations, reliably monitoring pressure, temperature, and flow across vast networks designed for natural gas. However, hydrogen introduces new variables that demand expanded capabilities. From tracking variable blend ratios (Figure 1) and forecasting energy delivery to adjusting alarm logic and compressor behaviour, operators now require integrated platforms that combine real-time monitoring with predictive analytics and simulation. This shift marks a fundamental change in how pipelines are managed, requiring the alignment of digital intelligence with the evolving chemistry of the energy transition.
In this new paradigm, real-time monitoring of gas composition with gas chromatographs (GCs) and other instruments becomes essential to track energy content and maintain combustion performance. Control logic must accommodate variable compressibility and density. Advanced analytics and predictive algorithms must detect anomalies linked to variable blend ratios. Operators need software that integrates simulation models, forecasting engines, and GC data to manage these new variables.
In the control room, dispatchers and engineers will face data streams that include gas quality parameters alongside volume and pressure. Scheduling teams will rely on blend forecasts to adjust nominations and anticipate delivery discrepancies. Compliance departments will require accurate, time-stamped records of hydrogen concentration at custody transfer points to satisfy evolving regulations and fulfill contractual obligations.
Executives will need dashboard summaries of energy throughput by blend type to measure progress toward decarbonisation targets and guide infrastructure investments.
Figure 1. Pipeline profile showing the arrival of hydrogen peaks.
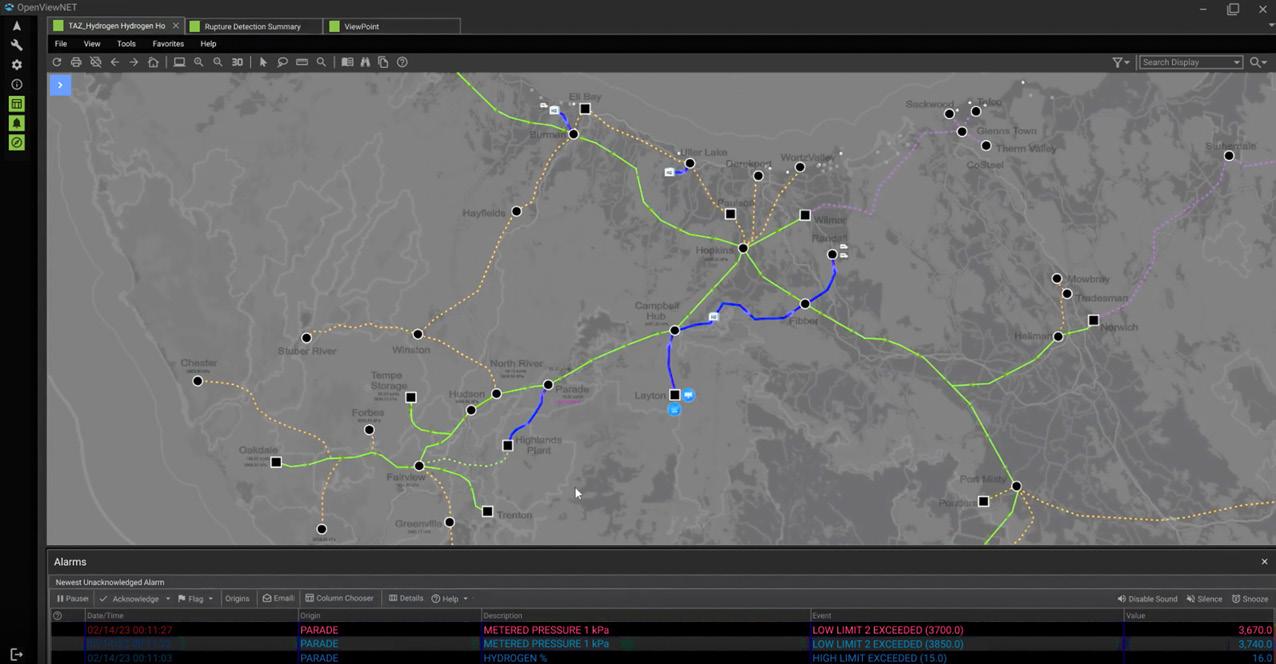
Figure 2. Pipelines coloured by their hydrogen content in an overview map.
Gas quality tracking is no longer a back-office function
Hydrogen blending affects everything from burner performance and tariff compliance to energy calculations, leak detection, and odorant retention. Without accurate, realtime insight into the movement of the different hydrogen concentrations, dispatchers risk misallocating energy, triggering false alarms, and/or violating delivery specs.
That’s why gas quality tracking is taking the front seat in pipeline operations. Tracking how blends migrate across the network becomes essential, not just for safety and compliance, but for operational clarity and decision-making.
At the software level, developers are extending equations of state to accurately model multi-component gas mixtures, including hydrogen-rich blends. Simulation platforms and realtime transient modelling (RTTM) tools are closing this critical gap by offering deeper insight into how hydrogen behaves in real-world conditions.
By simulating dispersion, pressure changes, and thermodynamic behaviour, these simulation and RTTM tools help control rooms visualise how energy content varies over time and space, and anticipate when a blend will reach a tariff boundary, trigger an alarm, and/or affect downstream combustion systems.
Simulation provides predictive tools to help visualise blend concentrations, with pressure dynamics and flow behaviour included, across complex pipeline networks. Inventory management applications leverage real-time simulation to calculate linepack and blend ratios with greater granularity. Meanwhile, gas quality forecasting applications help track hydrogen movement and reconstruct composition profiles between GCs, supporting both billing accuracy and regulatory compliance.
But as these capabilities evolve, so does the need for integration. The future of pipeline operations lies in unified environments that combine embedded simulation with SCADA, advanced applications, and artificial intelligence into a single, cohesive user interface. Rather than relying on fragmented tools from multiple vendors, each with its own data model, update cycle, and user experience, companies are shifting toward platforms that offer seamless interoperability, situational awareness, and real-time decision support.
Integrated environments reduce latency between systems and eliminate manual data reconciliation, providing intelligence and augmenting the control room with a holistic view of pipeline behaviour. These integrated environments empower operators to correlate alarms with blend forecasts, use embedded analytics to validate measurements at custody transfer points, and simulate operational scenarios from a single interface (Figure 2). In a hydrogen-ready world, where gas composition, energy content, and safety thresholds are constantly moving, this level of integration is no longer a luxury, it’s a necessity.
By integrating advanced monitoring, analytics, and simulation, operators can maintain safe, reliable gas delivery, while advancing toward a lower-carbon future. Success will require collaboration among pipeline companies, research institutes, and software vendors to develop standardised
solutions that scale globally. In the coming decade, the ability of control rooms to adapt their systems and processes will determine how effectively existing pipelines can carry the next generation of energy.
What comes next?
As hydrogen integration gains momentum, the shift toward integrated digital environments is no longer optional. Building these unified platforms raises a new set of strategic and technical questions that the industry must address collectively:
) Can pipeline management systems evolve quickly enough to unify SCADA with real-time gas quality tracking, predictive analytics, and regulatory compliance, while also achieving the level of integration needed within performance and reliability expectations?
) What standards and collaborative frameworks will be required to harmonise measurement, reporting, and compliance across regions and vendors – especially as integrated environments begin to support crossfunctional decision-making from control room operations to executive strategy?
) How can emerging technologies like artificial intelligence help bridge gaps between siloed systems, enabling smarter anomaly detection, blend forecasting, and operational insight, while also addressing cybersecurity risks that arise when consolidating multiple operational layers into a single, connected interface?
These questions go beyond software architecture. They touch on organisational alignment, regulatory foresight, and long-term infrastructure planning. As hydrogen blending reshapes pipeline operations, the answers will define not just how we manage gas quality and flow, but how we use technology to build smarter, more adaptive energy systems for the decades ahead.
About the author
Ivan Antochiw leads product management for advanced applications at Emerson’s Aspen Technology business. His work focuses on Gas Measurement, Pipeline Safety, and Control Room Operations, driving the evolution of intelligent, user-centric solutions for the energy sector. With over two decades of experience in natural gas transmission and distribution, Ivan has held key roles at major infrastructure operators and global technology firms, where he helped shape the future of pipeline operations through digital transformation and operational excellence. Ivan is a recognised thought leader in pipeline automation and control room innovation. He is a frequent contributor at conferences such as AGA and Enlit Europe, where he has presented on critical topics including hydrogen, cyber-security, AI, rupture detection, and alarm management. His insights aim to bridge the gap between regulatory expectations and practical implementation, offering operators actionable strategies for modernising their systems while maintaining safety and reliability.
Garry Hanmer, Principal Simulation Consultant, Atmos International, UK, considers why ISO 27913 makes pipelines the critical link in CCUS.
Carbon capture and storage (CCS) is widely recognised as a key technology for reducing CO2 emissions to the atmosphere. Yet while capture and storage often dominate the conversation, the latest version of ISO 27913 (second edition, corrected version September 2025) makes something clear. Pipelines are likely to be the primary means of transporting CO2 from capture sites to storage or utilisation points.
Transport is not simply a connecting step; it allows carbon capture, utilisation, and storage (CCUS) to function as an integrated value chain. Without reliable, compliant pipeline transportation, captured CO2 cannot reach its destination safely or at scale.
ISO 27913 exists because transporting CO2 at scale is not the same as transporting hydrocarbons. There is significantly less industry experience in CO2 service than in natural gas service, and CO2 presents specific technical issues that must be managed to ensure safe and reliable operation.
A standard that supplements, not replaces ISO 27913 is not a standalone pipeline code. It supplements existing standards such as ISO 13623, ASME B31.4, ASME B31.8, and EN 1594. Its purpose is to address CO2-specific issues that are not adequately covered elsewhere, including fracture arrest and internal corrosion protection.
The scope of the standard is broad. It applies to rigid metallic pipelines, onshore and offshore systems, conversion
of existing pipelines to CO2 service, and transportation in both gaseous and dense phases. It also includes CO2 stream quality assurance, converging streams from multiple sources, and health, safety and environmental aspects specific to CO2 transport and monitoring.
The system boundary is clearly defined. Transportation begins at the pipeline inlet valve where composition, temperature, and pressure meet the specified requirements, and ends where the CO2 leaves the transportation infrastructure and enters storage or utilisation facilities.
This clarity reinforces the role of transport as a distinct and accountable segment of the CCUS value chain.
CO2 is not just another fluid
Pure CO2 does not cause internal corrosion. However, transported CO2 is rarely pure.
Impurities can alter thermodynamic behaviour and bubble point pressure. They can also react to form acidic aqueous phases, leading to corrosion or solid deposition.
The standard requires a clear CO2 stream specification agreed between producer, transport entity and storage or utilisation operator. Industry practice is recognised as greater than 95 mol% CO2, with combined non-condensables less than 5 mol%.
The process design must ensure that hydrates or aqueous phases are never present during any operational scenario, including transient operations such as depressurisation or restart. For dense phase transport, minimum operating pressure must remain above the bubble point pressure within the operating envelope.
These requirements elevate transport from a mechanical exercise to a fluid behaviour management challenge.
Managing corrosion and hydrates
Dehydration is identified as the primary control against internal corrosion. The maximum water content must be selected so that aqueous phase formation, hydrate formation and corrosion do not occur within design margins.
Continuous monitoring is required. Pressure, temperature, and water content should be measured continuously, with valid
calibration certificates and calibration that reflects the specific CO2 composition.
Measurement goes further. CO2 mass flow and composition must be measured in single phase conditions to avoid significant uncertainty. Monitoring data should be available to both producer and pipeline operator, with records retained for trend analysis and auditing.
Transport integrity is therefore inseparable from measurement integrity.
Reliability, safety, and integrity
ISO 27913 requires that reliability and availability be considered across the entire process from production to storage. Components are interdependent, and redundancy or diversity may be needed to maximise operational availability and avoid deferred injection.
Safety philosophy may be risk-based or deterministic depending on jurisdiction, but designers are directed to existing pipeline standards for risk assessment and hazard identification. Incident data from hydrocarbon pipelines may not accurately reflect CO2 service and should be used with caution.
For internal failure mechanisms such as corrosion, failure statistics should only be applied where adequate control prevents the formation of aqueous phases.
The message is consistent. CO2 transport demands its own integrity framework.
Converting existing pipelines
The standard also addresses re-qualification of existing pipelines for CO2 service. Conversion is permitted only if the pipeline is re-qualified in accordance with the document or other recognised standards.
Re-qualification should include safety reassessment, management of change, verification of materials suitability, wall thickness and fracture arrest considerations, venting and block valve arrangements, and pressure safeguarding systems.
Repurposing infrastructure can accelerate deployment. ISO 27913 ensures it is done with technical rigor and a clear understanding of CO2-specific risks.
Transport as the enabling link
The latest version of ISO 27913 was developed to ensure safe and reliable design, construction and operation of CO2 pipelines at large scale. It recognises that future CCUS deployment will require larger pipeline systems, potentially in densely populated areas and offshore environments.
Capture technology attracts attention and geological storage anchors long-term climate goals. Between them lies a transport system that must manage phase behaviour, impurities, corrosion, fracture control, depressurisation, measurement accuracy and system reliability.
ISO 27913 makes it clear that pipelines are not a passive conduit. They are a technically demanding, safety-critical link in the CCUS chain.
Without compliant, reliable transport, capture, and storage cannot function as an integrated system. As deployment scales, that enabling link becomes decisive.
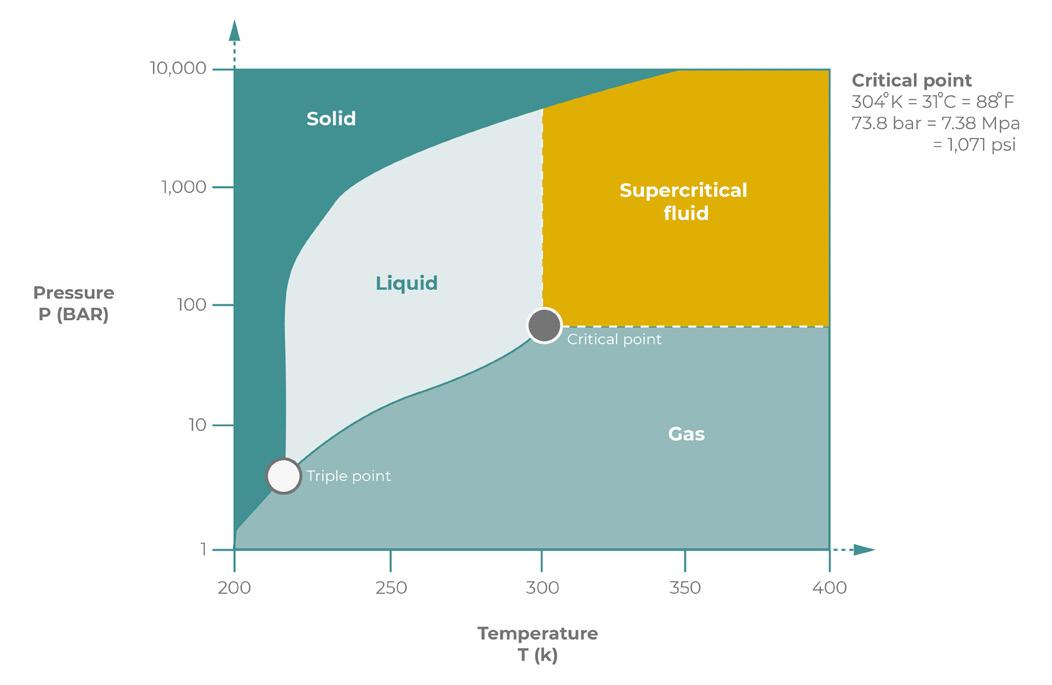
Figure 1. The phase diagram illustrates how the state of CO2 changes with variations in temperature and pressure.
Turning standards into operational assurance
The latest version of ISO 27913 defines what safe and reliable CO2 pipeline transportation should look like. It sets expectations around stream specification, dehydration, impurity control, fracture management, depressurisation, monitoring and integrity management. However, compliance does not happen on paper.
Operating above bubble point pressure in dense phase transport requires continuous awareness of pressure and temperature behaviour across the network. Avoiding hydrate formation depends on verified dehydration and real-time monitoring. Managing impurities requires accurate measurement and shared visibility between stakeholders. Controlling depressurisation requires understanding transient thermal effects over time.
As CCUS networks scale, particularly where multiple sources converge into shared infrastructure, operational complexity increases. Phase behaviour, compositional variation, and interdependent equipment performance must all be managed dynamically.
This is where advanced monitoring, transient simulation and leak detection systems become part of the integrity framework.
Real-time pipeline monitoring supports early detection of anomalies. Hydraulic simulation enables operators to test operating envelopes before implementation. Transient modelling helps assess depressurisation strategies and phase
stability. Data validation strengthens measurement confidence and regulatory reporting.
A real-time pipeline simulation system such as Atmos SIM helps operate a CO2 pipeline safely by continuously modelling pressure, temperature, flow rate, and fluid phase along the entire line and comparing predicted behaviour with live field data. Because CO2 is often transported in a dense or supercritical phase (see Figure 1), small deviations in pressure or temperature can trigger phase change, rapid decompression, or fracture propagation. A real-time model can detect these conditions early and alert operators before safety limits are breached. The system supports real-time leak detection by identifying subtle hydraulic imbalances, predicts the consequences of operational actions such as start-ups, shutdowns, or rate changes, and ensures the pipeline remains within its defined operating envelope. By providing early warning, real-time simulation reduces the risk of loss of containment and enables safer, more controlled operation of CO2 pipelines.
In this context, ISO 27913 does more than define technical requirements. It elevates transport to a performance discipline that must be continuously managed.
Capture enables decarbonisation. Storage delivers permanence. But it is transport, supported by robust monitoring and integrity systems, that ensures captured CO2 moves safely, reliably and at scale.
Igor de Souza Tostes, Senior Legal Counsel and Local Compliance Officer, considers whether oil pipelines regulated by the Federal Energy Regulatory Commission (FERC) can bill shippers retroactively for higher rates after a court vacates an earlier FERC order that had lowered allowable rate ceilings.
Courts’ vacatur of a prior FERC indexing order has raised a wellknown regulatory remediation issue: may pipelines bill shippers for the price differential that would have applied all along? Properly framed, yes –this is restoration of the status quo ante, not classic retroactive ratemaking. Recent developments at the Federal Energy Regulatory Commission (FERC) have revived a classic tension in US administrative and energy law: when, if ever, may a regulated pipeline bill shippers ex post facto for amounts it could have charged during an earlier period but did not, because an intervening agency order suppressed the tariff ceiling and was later vacated on judicial review?
This is one of the questions raised by the recent remedial orders by FERC, which authorised certain oil pipelines to assess and invoice shippers for the difference between rates previously charged under a lower index and the higher index that would have applied following judicial review, across a defined ‘locked-in’ period (and provided
other eligibility conditions requirements were met).¹
For background, FERC sets the maximum rates, over a five year period, that an oil and products pipeline may lawfully charge its customers under its tariff, and this index cap is based on the sum of the Producer Price Index (PPI) and a percentage multiplier (so the index cap may look like, for example, Producer Price Index plus 0.75%). Pipelines are required to file their initial rates with the Commission, but “pipelines may increase their rates without seeking the Commission’s approval, so long as the increase does not exceed the annual limit, computed using the index.”²
Thus, a higher index ceiling translates to higher permissible tariff ceilings, and conversely, a lower index constrains rate increases.
In December 2020, FERC set the index level for the five year period from 1 July 2021 to 30 June 2026. However, a later change to lower that index was overturned by a federal court (in Liquid Energy Pipeline Association vs Fed. Energy Regulatory Comm’n.) and the Commission reinstated the December 2020 index in September 2024.2
In order to correct the index after the vacatur, the Commission allowed pipelines to recover, ex post, the gap between the maximum rates charged under the lower (now-unlawful) index and the maximum rates that would have been permissible under the higher (lawful) index during the locked-in
period (provided the carrier actually charged at the maximum allowable rate at the time).
In other words, the remedial orders sought to put parties in the position they would have been had the previous order not been issued.
This factual posture frames the central legal question: is such post-period invoicing pursuant to the remedial orders an impermissible retroactive charge, or a permissible status quo ante remedy?
Governing principles: filed rate doctrine and the prohibition on retroactive ratemaking
As a general rule, regulated rates applicable to essential facilities cannot be changed retroactively.
The filed rate doctrine requires carriers to charge only the rates on file with, and approved or accepted by, the regulator, and it bars courts and agencies from ordering relief that would have the effect of imposing a rate other than the filed rate for past periods.³ Closely related is the prohibition on retroactive ratemaking, which prevents agencies from adjusting rates after the fact to allow recovery of past shortfalls or to refund perceived over-recoveries, absent statutory authorisation or a procedurally valid mechanism.4 The main goal of these legal doctrines is to confer predictability to participants when transacting in regulated markets.
Under the Interstate Commerce Act (ICA) regime applicable to oil pipelines, these principles have particular force: carriers must adhere to their filed tariffs, shippers are deemed to have constructive notice of those tariffs, and equitable defences cannot override the filed rate.5 FERC’s modern application of the ICA to oil pipelines incorporates those core constraints while allowing rate changes through defined procedures, including indexing, cost-of-service filings, and settlement rates.6
As FERC noted in the past: “an inadequately supported rule, however, need not necessarily be vacated. The decision whether to vacate depends on the seriousness of the order’s deficiencies (and thus the extent of doubt whether the agency chose correctly) and the disruptive consequences of an interim change that may itself be changed.” (Allied-Signal, Inc. vs US Nuclear Regul. Comm’n). However, once an order dictating maximum rates is vacated, the assessment of the applicable relief to reinstate past rates takes place.3
The nuance here: judicial vacatur and status quo ante remedial authority
The posture here is not about FERC enacting a post-facto order allowing for retroactive charges of higher rates. Rather, the issue arises when the agency needs to predicate a relief in response to a court’s vacatur of a current and valid order that established a lower index. In these cases, vacatur nullifies the agency action and ordinarily restores the legal status quo ante, as if the vacated action had never been in effect – unless the reviewing court limits the remedy.7
Against that backdrop, FERC characterises post-period recovery of the index differential not as classic retroactive ratemaking, but as a remedial step to restore parties to the positions they would have occupied had the vacated order never issued. Put differently, the court’s vacatur supplies the
legal predicate that allows post-facto billing for the differential without offending the filed rate doctrine because the invoices align with the rate ceiling that would have governed ab initio.8 To police windfalls, FERC can allow recovery to shipments actually billed at the maximum permissible rate during the locked-in period and to the precise difference between the vacated index cap and the lawful index cap.
In this sense, FERC is treating the court’s vacatur and the resulting remedial order as permitting the recovery of the differential as a remedial matter rather than as classic retroactive ratemaking. That framing aligns with the restoredbaseline logic of vacatur and the limited, ceiling-constrained nature of the amounts at issue.
Implications for shippers: scope of carriers’ postperiod invoicing rights
On the face of such a remedial order and consistent with FERC’s indexing precedents, carriers may arguably invoice shippers after the fact for the differential between the rates actually charged and the higher rates that would have been chargeable under the lawful index during the locked-in period, subject to important constraints. First, only movements actually billed at the maximum permissible rate during the relevant period would qualify. Second, recovery is limited to the arithmetical difference between the vacated index and the lawful index. Third, ordinary refund/recoupment prohibitions continue to apply outside the remedial construct tied to vacatur. In regulatory terms, this is not a reopening of past rates to impose a newly devised surcharge, but a post hoc reconciliation to the ceiling that lawfully should have governed.
Another practical implication for shippers and carriers is that billing scope is limited to movements that were actually at the maximum rate during the period and the obligation of shippers to pay carriers is likely due absent a stay. Furthermore, the remedial recovery is confined to the arithmetic PPI differential that would have applied all along.4
Process considerations: rehearing, appeals, and the practicality of deferring payment
Pipelines have been attempting to invoice shippers as they are allowed to within 90 days of the issuance of the order (i.e. by 18 February 2026). Parties aggrieved by a FERC order may ordinarily seek rehearing within 30 days of the order, and judicial review is typically sought within 60 days after the agency’s order on rehearing.9 Therefore, Market participants may consider whether to defer payment briefly to see if affected shippers seek rehearing or appeal.
As a practical matter, however, deferral is often a dead end. Agency orders are operative unless stayed; carriers can demand payment pending review; and stays are extraordinary relief.10 Both FERC and the D.C. Circuit apply a stringent stay standard that weighs likelihood of success, irreparable harm, harm to others, and the public interest.11 Absent a stay, pipelines are typically entitled to implement and collect amounts due under the operative order, and courts have repeatedly underscored that post-hoc relief (e.g., refunds or surcharges) is tightly constrained by the filed rate doctrine and retroactive ratemaking prohibitions.12
Conclusion: remedial restoration, not classic retroactive ratemaking-with a contract analogy
Properly understood, this approach does not involve retroactive ratemaking in the classic sense. It involves the post-facto application of the rate ceiling that would have governed in the first instance but for the nowvacated FERC order. Vacatur restores the lawful baseline; the remedial order then permits recovery only of the differential that aligns with that baseline for the period in question, constrained to movements actually billed at the prior maximum. That framework mitigates windfall risks while respecting the filed rate doctrine’s demand for rate certainty.
A useful analogy arises from expectation damages in private contract law: courts aim to place the aggrieved party in the position it would have occupied had the contract been performed, not to confer a windfall. So too here, the remedy seeks to place the regulated entity in the position it would have occupied had the lawful index applied all along, without re-pricing the past on a novel theory.13
Affected stakeholders should, of course, consider preserving their rights within the procedural timelines –30 days for rehearing and 60 days for petitions for review; however, they should also recognise that, absent a stay, payment demands under such a remedial order are likely to be enforceable while any challenge proceeds.
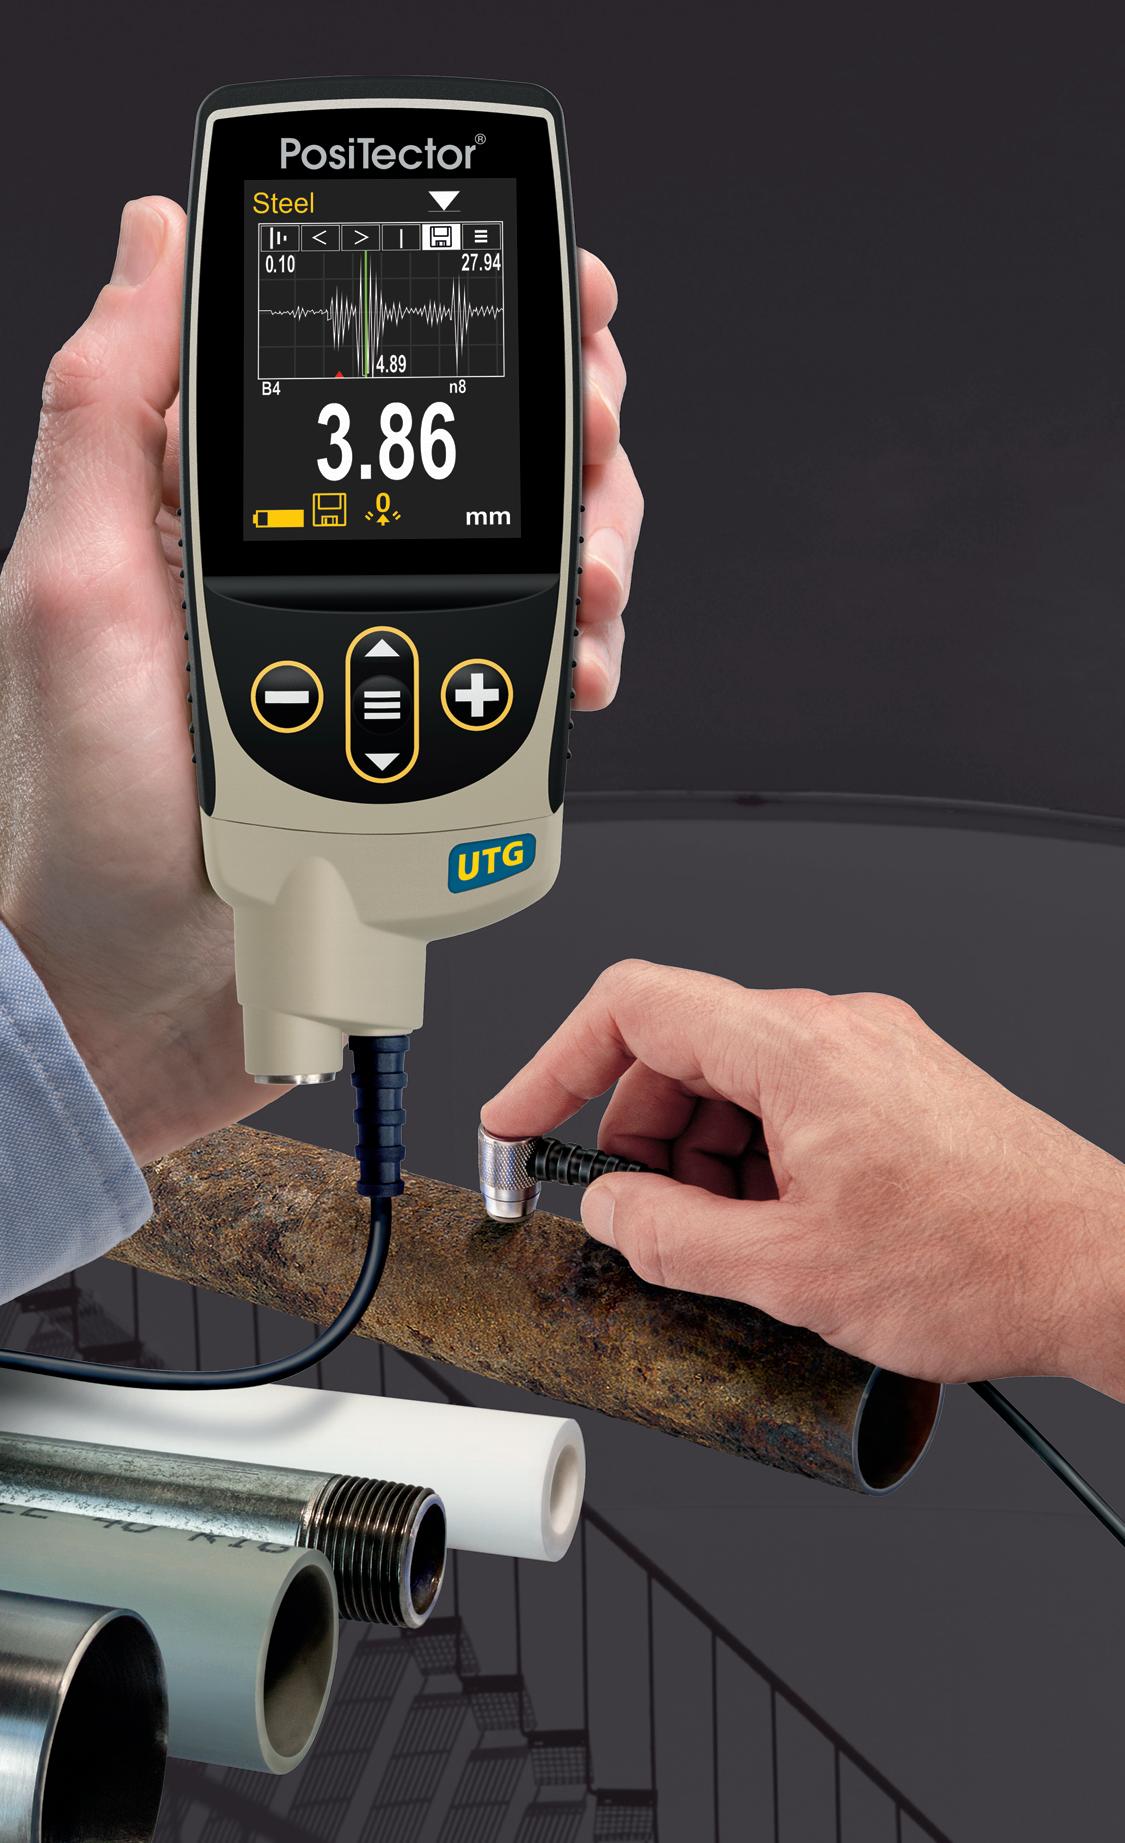
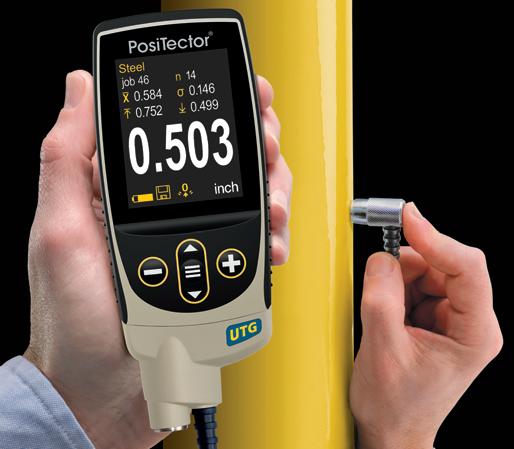
Ultrasonic Thickness Gauges
Ideal for measuring the remaining wall thickness and the effects of corrosion or erosion on tanks, pipes, or any structure
n 6 Models available including Corrosion, Xtreme, Multiple-Echo, Low Frequency, and Precision
n All models include Min Scan mode, memory, statistics, and USB
n Advanced models include: A-Scan, B-Scan, Bluetooth, and WiFi
n Weatherproof, dustproof, and waterresistant—IP65-rated enclosure
UTG C3
Advanced model in A-Scan mode
Scan here to learn more
PosiTector UTG M features Thru-Paint capability to quickly and accurately measure the metal thickness of a painted structure without removing the coating.
Award Winning Probe Interchangeability
PosiTector gauge body accepts ALL ultrasonic wall thickness, coating thickness, surface profile, environmental, soluble salt, gloss, and hardness probes manufactured since 2012.
+1-315-393-4450 n 1-800-448-3835 techsale@defelsko.com n www.defelsko.com
About the author
Igor de Souza Tostes is a Senior Legal Counsel and Local Compliance Officer at Equinor.
References
1. 18 C.F.R. pt. 342; Order No. 561, Revisions to Oil Pipeline Regs. Pursuant to the Energy Policy Act of 1992, FERC Stats. & Regs.
2. Association of Oil Pipe Lines v. FERC (AOPL), 281 F.3d 239, 241 - 45 (D.C. Cir. 2002).
3. VAHEESAN, S., Market Power in Power Markets: The Filed-Rate Doctrine and Competition in Electricity, 46 U. MICH. J.L. REFORM 921, 931 - 32 (2013). See also, Montana-Dakota Utils. Co. v. Nw. Pub. Serv. Co., 341 US 246, 251 - 52 (1951); Ark. La. Gas Co. v. Hall, 453 US 571, 577 - 82 (1981).
4. Natural Gas Clearinghouse v. FERC, 965 F.2d 1066, 1075 - 77 (D.C. Cir. 1992); Towns of Concord v. FERC, 955 F.2d 67, 71-76 (D.C. Cir. 1992); Columbia Gas Transmission Corp. v. FERC, 895 F.2d 791, 795 - 98 (D.C. Cir. 1990).
5. INDUS, M., US, Inc. v. Primary Steel, Inc., 497 US 116, 127 - 35 (1990).
6. 18 C.F.R. pt. 342; Richard J. Pierce, Jr., Administrative Law Treatise § 9.6 (6th ed. 2023) (discussing filed rate doctrine and retroactive ratemaking constraints).
7. Allied-Signal, Inc. v. US Nuclear Regul. Comm’n, 988 F.2d 146, 150 - 51 (D.C. Cir. 1993).
8. See, e.g. Verizon Commc’ns Inc. v. FCC, 535 US 467, 524 - 25 (2002) (discussing retroactivity concerns and distinguishing remedial adjustments that restore lawful baselines).
9. 18 C.F.R. § 385.713(b)(1); 16 U.S.C. § 825l(a)-(b) (FPA § 313); 28 U.S.C. § 2344 (Hobbs Act) (oil pipelines proceed under the ICA; rehearing follows FERC’s Rules of Practice and Procedure; judicial review runs under the Hobbs Act).
10. Nken v. Holder, 556 US 418, 427 - 34 (2009).
11. Va. Petroleum Jobbers Ass’n v. Fed. Power Comm’n, 259 F.2d 921, 925 (D.C. Cir. 1958); Wash. Metro. Area Transit Comm’n v. Holiday Tours, Inc., 559 F.2d 841, 843 - 44 (D.C. Cir. 1977); see also 18 C.F.R. § 385.212; id. § 385.713(d).
12. Montana-Dakota, 341 US at 251-52; Ark. La. Gas, 453 US at 577 - 82; Natural Gas Clearinghouse, 965 F.2d at 1075 - 77.
13. Restatement (Second) of Contracts § 344(a) (1981).
14. All analysis and legal conclusions are the author’s own and the views and opinions expressed are those of the author exclusively. The content of this article is for general informational purposes only, not a substitute for consulting a qualified attorney, and no attorney-client relationship is formed.
Dawna Fretwell, Programme Director, Technical Services for Asset Integrity and Reliability at ABS Consulting, discusses what PHMSA data reveals about pipeline risk.
More than just statistics, Pipeline and Hazardous Materials Safety Administration (PHMSA) data are a signal of how pipeline risk is evolving. Pipelines remain one of the safest ways to move energy, and PHMSA’s long-term data generally supports that. But whether one is an executive, integrity manager, operator, regulator, or community stakeholder, the real story sits beneath the headline numbers.
Comparing PHMSA incident records with industry investigations and risk assessments, the same patterns appear. Leaks, ruptures, and near misses are often tied to corrosion, equipment, and material issues, operating missteps and damage from outside activities. Those cause codes look straightforward in a table, but each one reflects deeper decisions about how assets are designed, operated, and managed over time.
Early warning signals
A useful starting point is to view PHMSA data less as a compliance report card and more as an early warning system. When corrosion, incorrect operation or third-party damage consistently appear as leading causes of reported pipeline incidents, it suggests the challenges are not only technical. They also involve how organisations manage risk, change, and knowledge.
Corrosion is a clear example. It consistently ranks among the top reported causes. On the surface, it is a technical issue: coatings, cathodic protection, and inspection tools. Yet warning signs are often visible long before the failure. Protection readings had been drifting in the wrong direction. Coating damage had been noted but not treated as urgent. Inspection intervals were extended to fit budget or resource limits. Operating conditions changed without a fresh look at the underlying risk assumptions. Across operators, similar improvement themes emerge: clarify when trends trigger action, make sure corrosion data informs risk evaluations, and connect field observations to planning. It’s no longer a question of whether there’s corrosion, but rather, “How do we respond when early indicators appear?”
Similar trends appear with equipment and material failures, especially in ageing systems. Many pipelines still in service were built decades ago under different design standards and expectations. PHMSA data includes incidents involving vintage
pipe and weld types with known limitations. What often stands out is not that older equipment failed, but that the organisation did not have a complete, shared picture of what was actually in the ground. Asset records may be spread across multiple systems, drawings may not reflect later modifications, and field changes made under time pressure may never have been captured centrally.
When incident histories are overlaid with asset information, uncertainty about materials and past repairs appears repeatedly. That is fundamentally an information and governance issue: Do we know what we own? Do we understand its history? And where are we relying on assumptions rather than verified data?
Systemic causes of incorrect operation
“Incorrect operation” is another recurring PHMSA category that can sound like simple human error. In documentation, it often points to one person or one shift. Walking through these events in detail, the picture is usually broader.
Procedures that are technically correct are hard to apply in real operating conditions, including training that has not kept up with system changes and control rooms facing more alarms than people can meaningfully process. Changing processes may focus on hardware or software, but leave people and procedures only partially updated.
Over time, temporary workarounds can become the standard way of working, and roles during abnormal situations may not be clearly defined. In those environments, people are often doing their best in conditions that make good decisions harder. Focusing only on individual performance misses the systemic contributors. More durable improvements tend to come from simplifying tasks, clarifying responsibilities, and aligning written procedures with how the work is actually done.
Third-party damage
Third-party damage follows a similar pattern. Most operators have callbefore-you-dig programmes, contractor outreach and coordination with local authorities, yet PHMSA data show excavation damage still causes incidents.
Closer review often reveals rapid development near rights of way, outdated or incomplete maps, split responsibilities, and assumptions that someone else informed the contractor. Lessons from one event do not always carry across the organisation.
Results improve when public awareness and stakeholder engagement are addressed as ongoing relationships and when operators regularly challenge the accuracy and reliability of their mapping and records.
Workforce transition
Alongside operational and external factors, organisational and human
Figure 1. Data analytics and better management of process safety data provide a solution for pipeline operators to improve management of pipeline integrity and comply with US Department of Transportation Pipeline and Hazardous Materials Safety Administration (PHMSA) regulations.
With over 40 years of exceptional products and service, we’re ready for what’s next.
Dairyland Electrical Industries engineers and manufactures rugged and reliable decoupling products that keep workers and valuable assets safe from AC faults, lightning, and induced AC voltage, all while optimizing CP systems. Proven through decades of continuous operation and verified by third-party certification to global standards, Dairyland products are trusted to perform where reliability matters most.
Backed by more than 40 years of excellence, Dairyland has solidified a reputation as an industry leader in both product performance and technical support.
As we look ahead, we remain committed to understanding our customers’ needs and advancing our solutions and expertise to meet the challenges of tomorrow.
resource trends also shape incident outcomes. One of the most important themes does not appear as a PHMSA cause category: workforce transition.
Across the pipeline sector, many experienced engineers, technicians and controllers are retiring or moving into new roles. New staff are stepping into positions that involve more digital systems, tighter regulatory expectations, and more public scrutiny. Evidence of this shift includes procedures interpreted differently by different groups, uncertainty about operating limits, and decisions made without awareness of past issues on the same assets.
If workforce change is viewed solely as a staffing gap to fill, the deeper risk can be overlooked. A great deal of pipeline safety depends on practical experience; for example, which segments are sensitive, how unusual conditions behaved in the past, and where undocumented changes were made. If that experience is not captured and shared, organisations slowly lose their institutional memory.
PHMSA may record a later event as corrosion or incorrect operation, but the path often began with gradual loss of knowledge that was never fully addressed.
Digitalisation and risk models
Digitalisation cuts across all of these themes. Operators now hold large volumes of data from inline inspection tools, supervisory control and data acquisition (SCADA) systems, maintenance and work management systems, and geographic information systems (GIS). When these data sources are reliable and connected, they can significantly improve how risk is understood and prioritised. Challenges also arise when they are not.
In many events, underlying data issues play a role such as differing versions of asset data in separate systems, delays in updating records after field work and teams using different “truths” about the same pipeline segment. Sometimes the physical problem was corrected, but the digital record was never updated, leaving risk models out of sync with reality.
A simple diagnostic is to follow one segment across key systems and ask whether the information matches and whether different groups would make the same decision based on what they see. Often the answer is no, which explains why confusion or delay can emerge during abnormal situations. In that context, the key question to ask is not only “Do we collect enough data?”, but also “Is it accurate, consistent, and accessible enough to support confident decisions?”
Cyber risk
Cyber risk adds another layer. As control, monitoring, and business systems become more connected, digital disruptions can have direct consequences for physical safety and reliability.
A cyber incident that affects alarm visibility, controller displays, or remote valve operations will not appear in PHMSA data under a cyber label. It will show up as a delayed response, a failure to isolate, or an unexpected release.
In workshops and exercises ABS Consulting supports, common gaps include unclear responsibilities between operations and information technology teams, limited practice with manual, or degraded modes and assumptions that local control will always function as expected. These are the kinds of issues that benefit from joint planning and testing before an event rather than during one.
Repurposing pipelines
Repurposing pipelines for new services is another important trend that will increasingly influence what PHMSA records. As the energy system evolves, many operators are exploring whether existing lines can be used for products such as hydrogen or carbon dioxide. On the surface this can seem like a practical way to maximise existing assets, but it requires careful technical and operational review. Different products can change corrosion mechanisms, affect crack growth, and alter how a release behaves in the environment. When safety, risk, and compliance consultants support repurposed assessments, recurring topics include the completeness of material records, how historical loads and pressures have varied, and whether inspection and monitoring practices are appropriate for the new service. These questions go to the heart of whether a pipeline will perform as expected in a different role.
Consistent lessons
Taken together, PHMSA data point to a few consistent observations. Major incidents rarely stem from a single, isolated failure. They usually arise when several factors align: an aging component, incomplete, or outdated information, a procedure that no longer fits current operations, a warning in the data that was missed or not acted on, and a handoff that was not clear. The final cause code may say corrosion or incorrect operation, but many decisions led there.
Improvement also depends as much on everyday behaviour as on formal systems. How early concerns, small events, and near misses are handled matters. Where they are used as opportunities to learn and adjust, similar events tend to decline. Where they are closed quickly without reflection, the same patterns often return.
Long-term perspective
Finally, the core themes behind PHMSA’s statistics of aging infrastructure, workforce change, digital complexity, and repurposing these are not temporary. They will shape pipeline risk for years. That suggests that responses should be steady and long-term: maintaining and improving asset information, investing in data quality and integration, planning for knowledge transfer, and revisiting risk understanding when systems or services change.
PHMSA data reinforces a simple idea: pipelines are not static. Design and construction set the starting point, but what happens in the years and decades that follow – how organisations listen to their data, learn from experience, and adjust decisions – ultimately determines what shows up in the incident record.
Tolga Timirci, Head of Global CCUS Projects at Heidelberg Materials
Rachel Sutton, Interim CEO of Peak Cluster
Tom Redfern, Head of Sustainability at Holcim UK
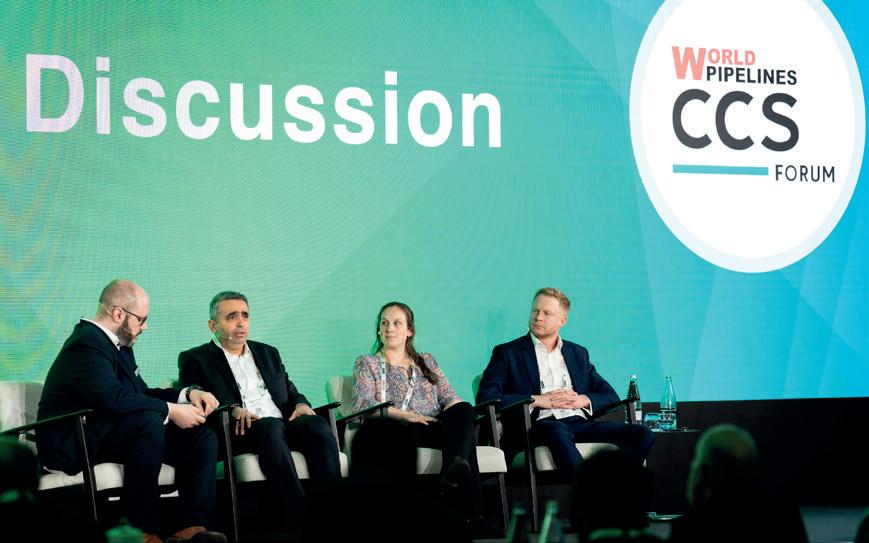
CCS Forum 2026: CCUS Panel Discussion Pt. 1
This episode of the World Pipelines Podcast is the first of a two-part series on CCUS in the cement sector, and what that means for CCS pipelines in the UK. Featuring the CCUS panel discussion shared by delegates at the World Pipelines CCS Forum 2026 and World Cement’s EnviroTech 2026.
The CCUS panel discussion placed a special focus on projects taking place in the UK, such as Hynet and Peak Cluster.
Coming soon: part two, in which we take questions from the EnviroTech and World Pipelines CCS Forum audiences.
LISTEN NOW
CATCH UP ON RECENT EPISODES
YPI
Hunton Andrews Kurth LLP
Greene Tweed
Listen and subscribe here
Darran Pledger, STATS Group, considers utilising hot tapping and BISEP line stopping to maintain flow during subsea pipeline tie-in.
Subsea pipelines form the backbone of global offshore energy infrastructure, acting as critical arteries that transport hydrocarbons from remote production fields to onshore processing facilities and end users. As energy demand continues to rise and supply security becomes increasingly critical, operators are under growing pressure to maximise asset uptime while expanding and adapting existing infrastructure.
Traditionally, integrating new developments, such as tying in a new gas field to an existing pipeline, would necessitate a full or partial shutdown of operations. However, in today’s energy environment, such interruptions are often commercially and operationally unacceptable. Lost production, deferred revenue, and potential supply shortages, particularly in gas networks serving large populations, emphasise the need for alternative solutions.
Subsea hot tapping and line stopping technologies have emerged as key enablers in this regard. By allowing operators to modify, repair, or expand pipeline systems while they remain fully operational, these techniques minimise disruption and preserve continuity of supply. A recent milestone project delivered by STATS Group involved isolating a subsea pipeline operating at 82 bar, while production was maintained, highlighting how advanced technologies are redefining what is possible in live pipeline intervention.
The strategic importance of subsea tie-ins and pipeline reconfiguration
To enable the connection of new fields, the most cost-effective solution may require a tie-in or connection into existing subsea pipeline infrastructure. When no pre-installed tie-in point exists,
it is necessary to install a new tie-in connection into the pipeline. Ideally the new tie-in connection can be done by disconnecting a flanged spool and replacing it with a flanged tee or wye. However, in some cases a suitable removable spool is not available at the required location and a tie-in connection must be retrofitted, either by fitting a mechanical tie-in clamp and performing a hot tap or by temporary isolating and removing a section of the pipeline and installing a new tee. Tie-in connections are among the most common and strategically important applications of hot tapping and line stopping. They enable operators to:
) Integrate new fields into existing infrastructure.
) Optimise capital expenditure by avoiding new export lines.
) Extend the operational life of pipeline systems.
) Re-route or extend pipeline infrastructure.
) Maintain uninterrupted production.
Subsea pipelines are often single-point transport links, as such any shutdown can have significant consequences, including contractual penalties and supply shortages. In the case of gas pipelines, interruptions can directly impact power generation and domestic supply, elevating the importance of maintaining continuous operation during modification or upgrade activities.
In parallel, subsea assets are ageing, and operators increasingly face challenges related to corrosion, mechanical damage, and evolving field configurations. Whether driven by integrity management, decommissioning, or expansion, the need to safely isolate and modify live pipelines has never been greater.
Subsea isolation: the foundation of safe intervention
The implementation of double block and bleed (DBB) in relation to isolation of pressurised systems is widely regarded as best practice for ensuring zero leakage and maximum safety to personnel, asset, and environment, during intervention activities. This philosophy involves two independent barriers with a monitored zero-energy zone between them, allowing verification of isolation integrity. For subsea breaking of containment activities IMCA diver safety requirements mandate double block and bleed barriers for all subsea intervention work.
Advanced line stopping technology build upon this principle, enabling the creation of a temporary isolation point within a live pipeline. When combined with an integrated bypass, operators can maintain product flow while safely isolating a specific section of pipeline for modification, tie-in or repair.
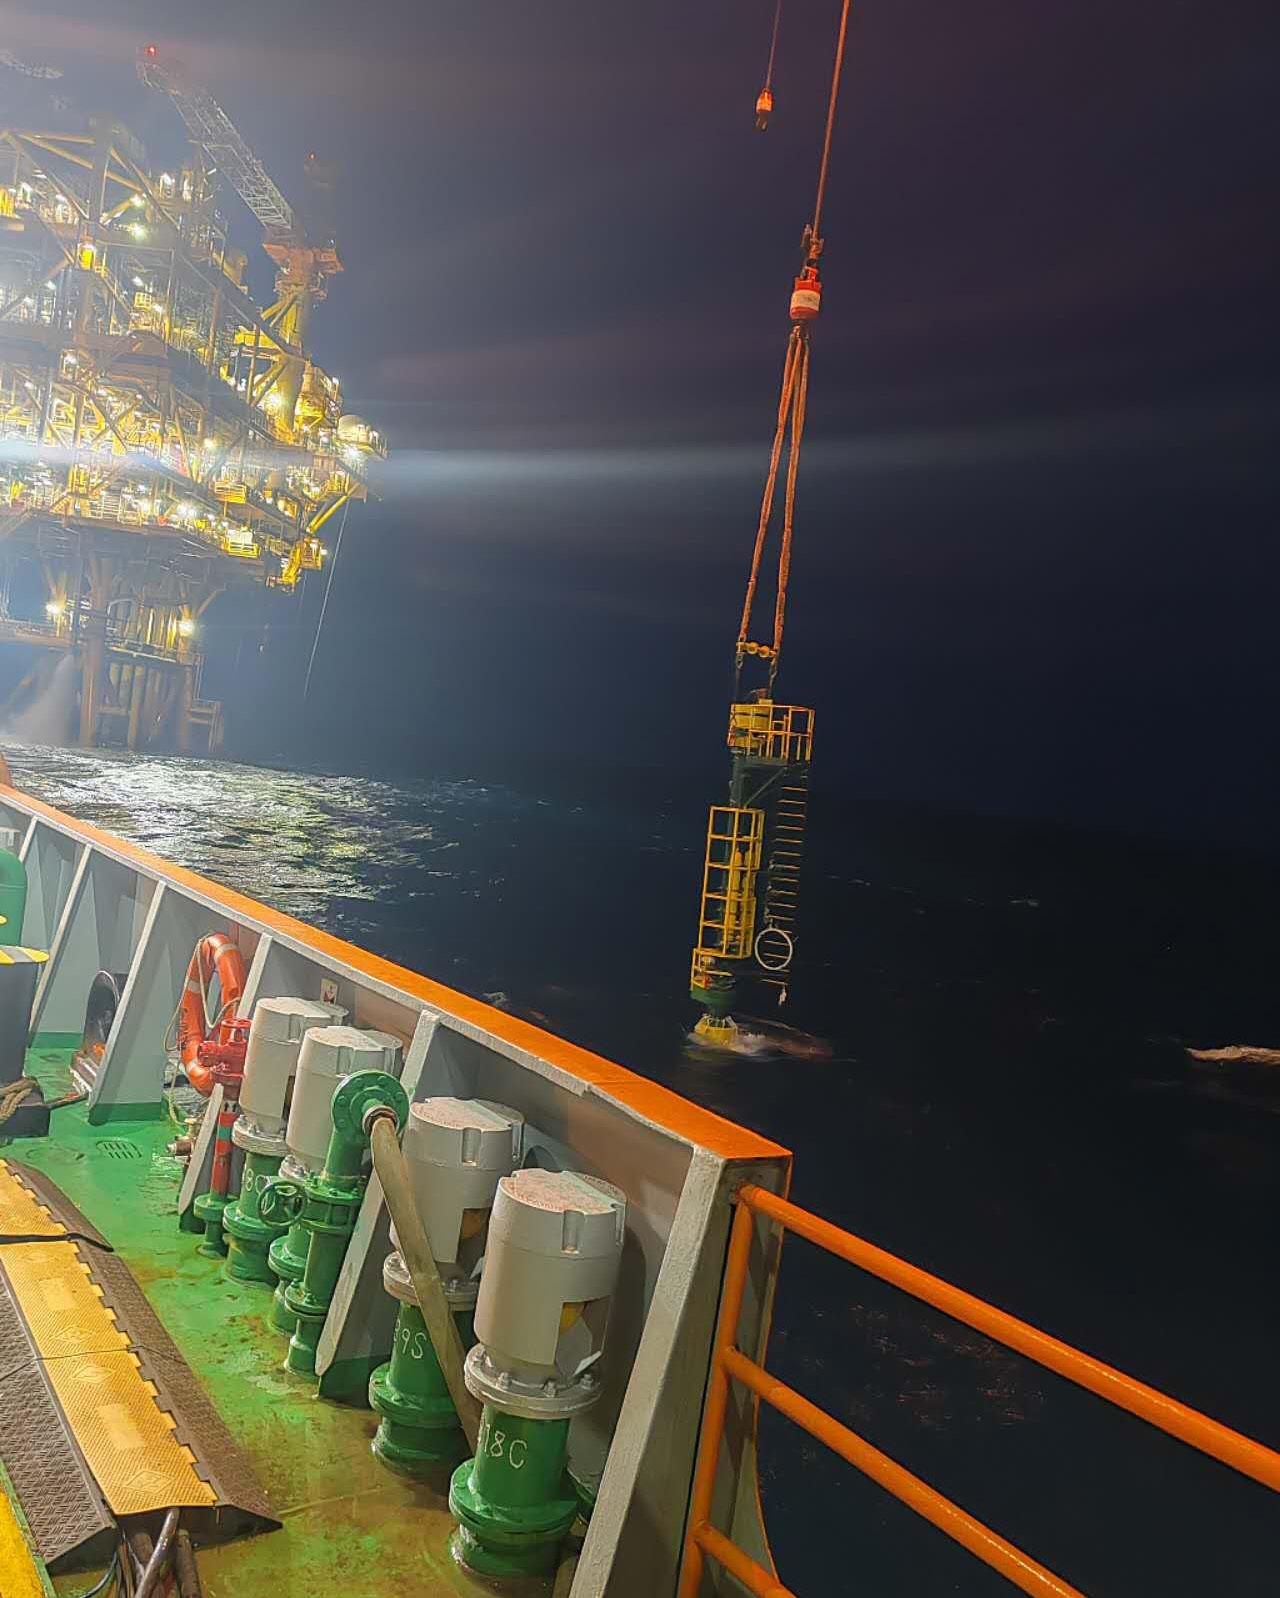
Case study: the first subsea BISEP deployment with integrated bypass in Asia Pacific STATS Group was engaged by a major Chinese engineering contractor to deliver double block and bleed isolation on a high-pressure 28 in. subsea gas pipeline, enabling the safe tie-in of a new offshore platform. Due to the criticality of ongoing gas supply, a full pipeline shutdown was not a viable option.
To address this challenge, STATS deployed its subsea SureTap® hot tapping systems in conjunction with its BISEP® line stopping technology, providing a robust and field-proven solution for live pipeline intervention. This integrated approach enabled the subsea tie-in to be completed safely and efficiently, without the need to depressurise the entire 28 in. pipeline operating at 82 bar.
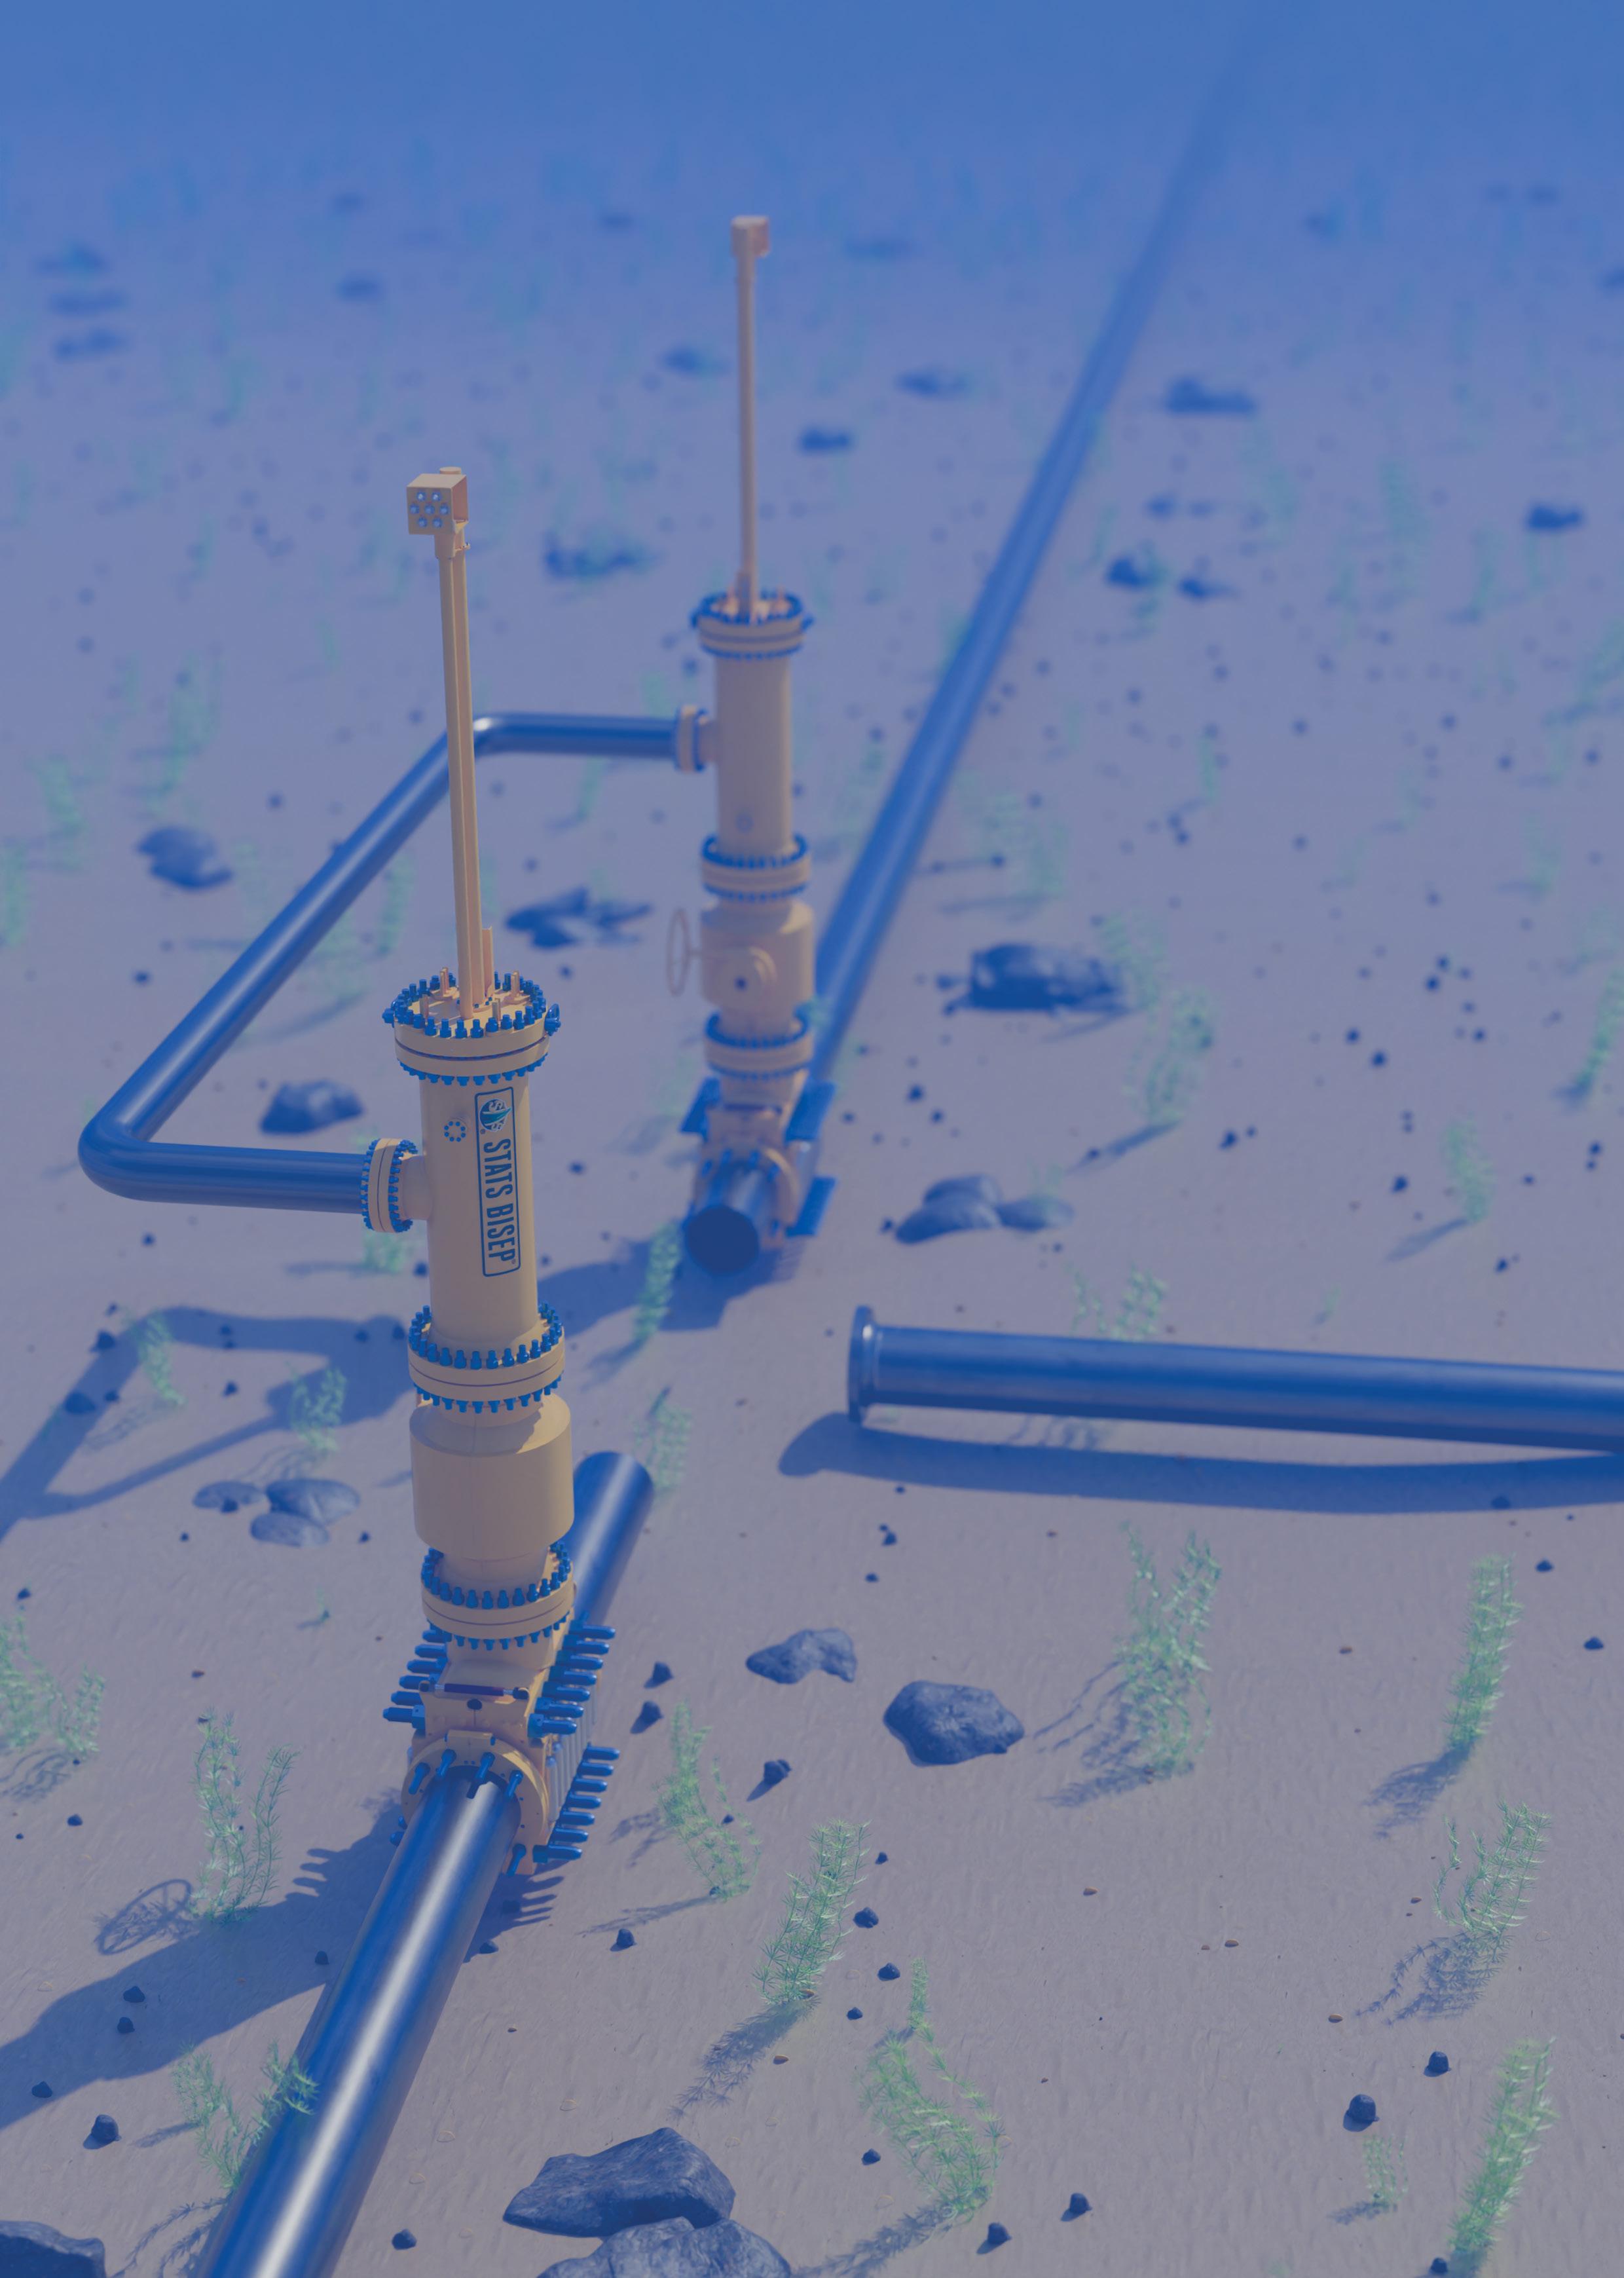
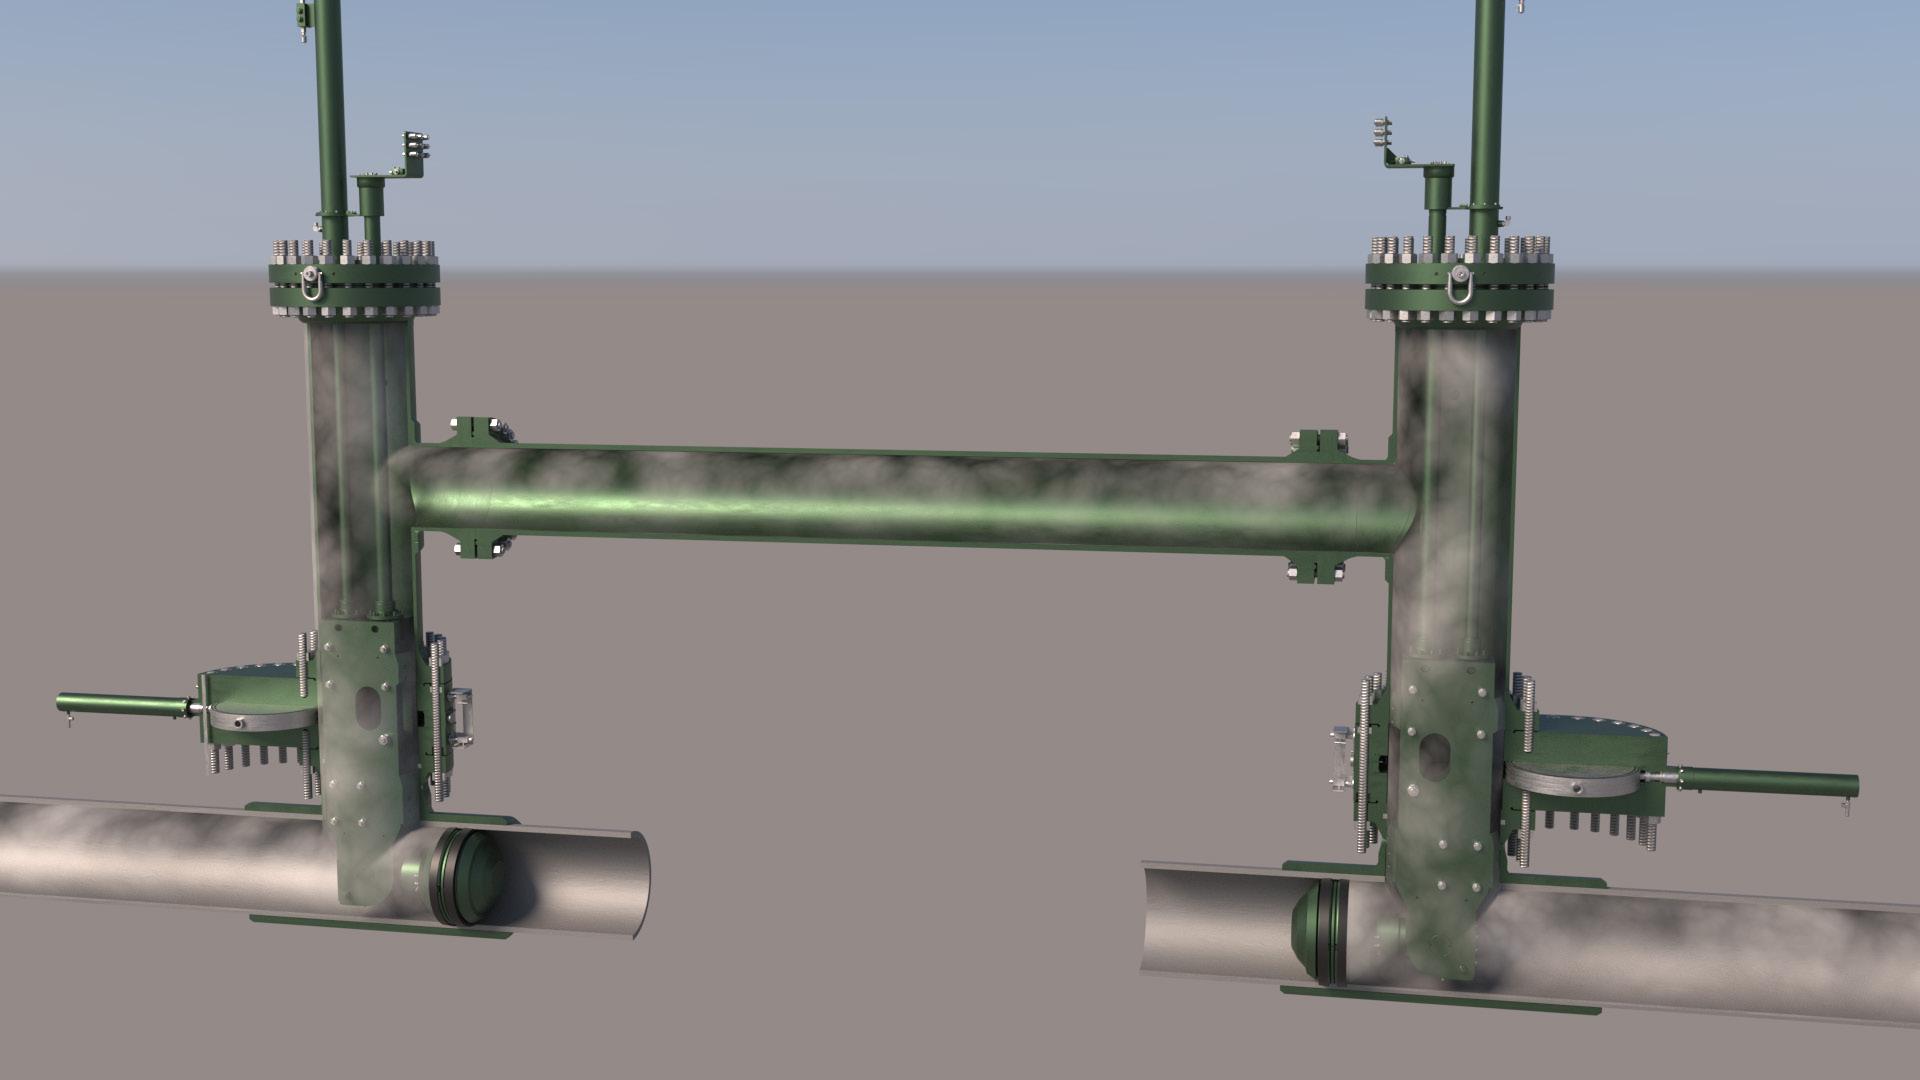
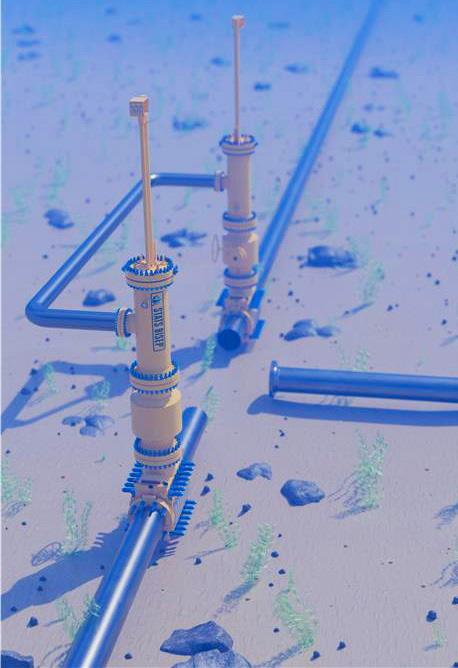
The installation of two BISEP line stop tools, positioned 74 m apart, established a fully verified double block and bleed isolation of the targeted pipeline section. The BISEPs were connected by an integrated bypass system, allowing continuous gas flow to be maintained throughout the operation. This configuration eliminated the need for additional hot tap branches, simplifying subsea intervention activities while enhancing overall safety.
The client supplied mechanical hot tap clamps and full bore valves, typically hot tapping is conducted through low profile slab valves to reduce the distance required to hot tap into the pipeline. To address this challenge STATS used its proprietary SureTap ST1530-90 XL hot tapping machine, with an
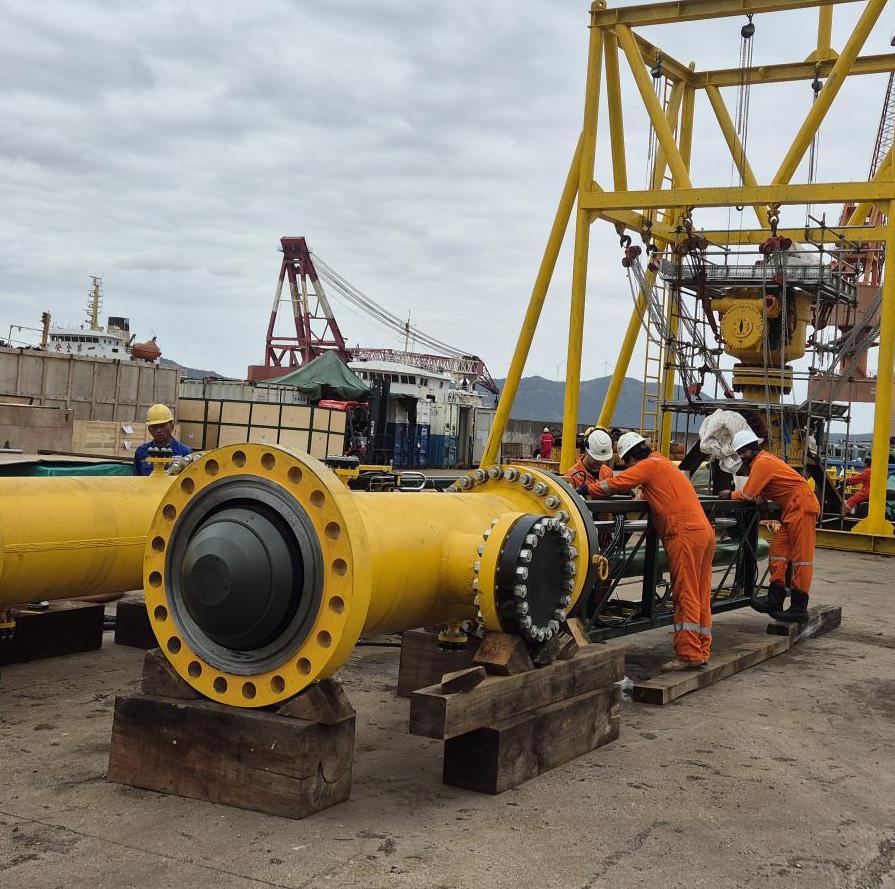
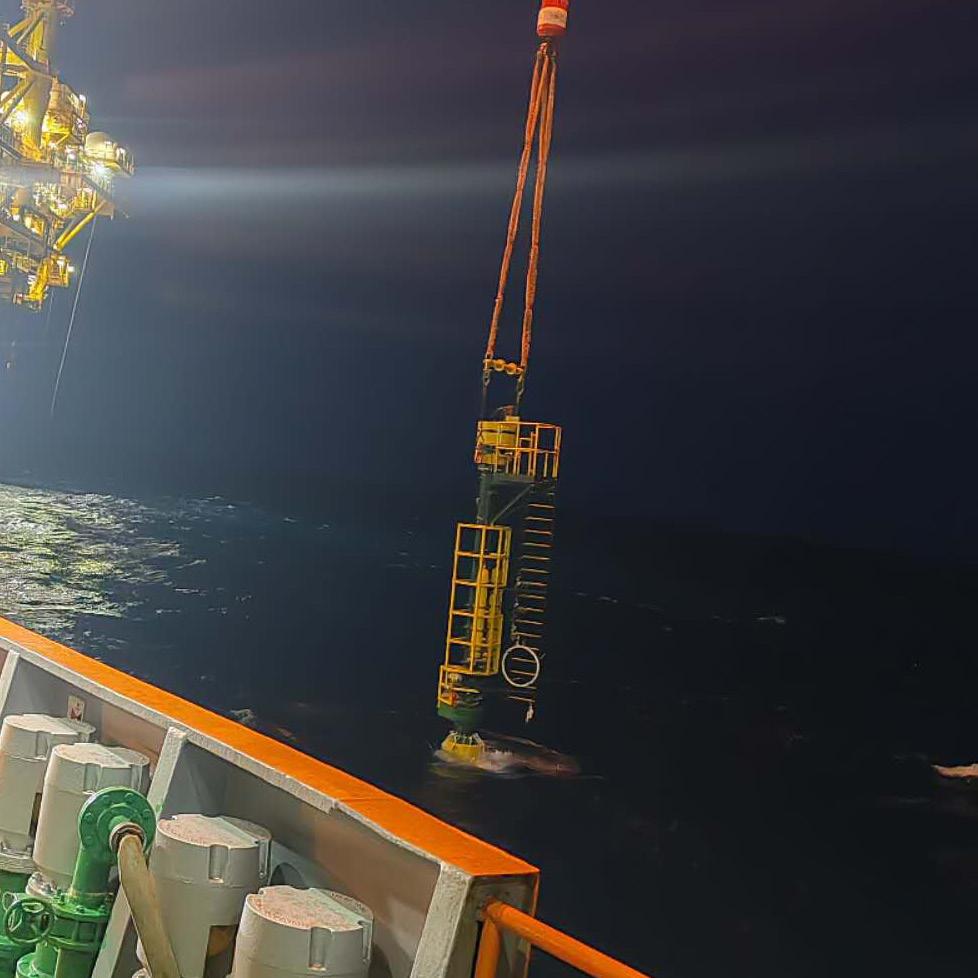
Figure 1. 28 in. subsea BISEP awaiting deployment.
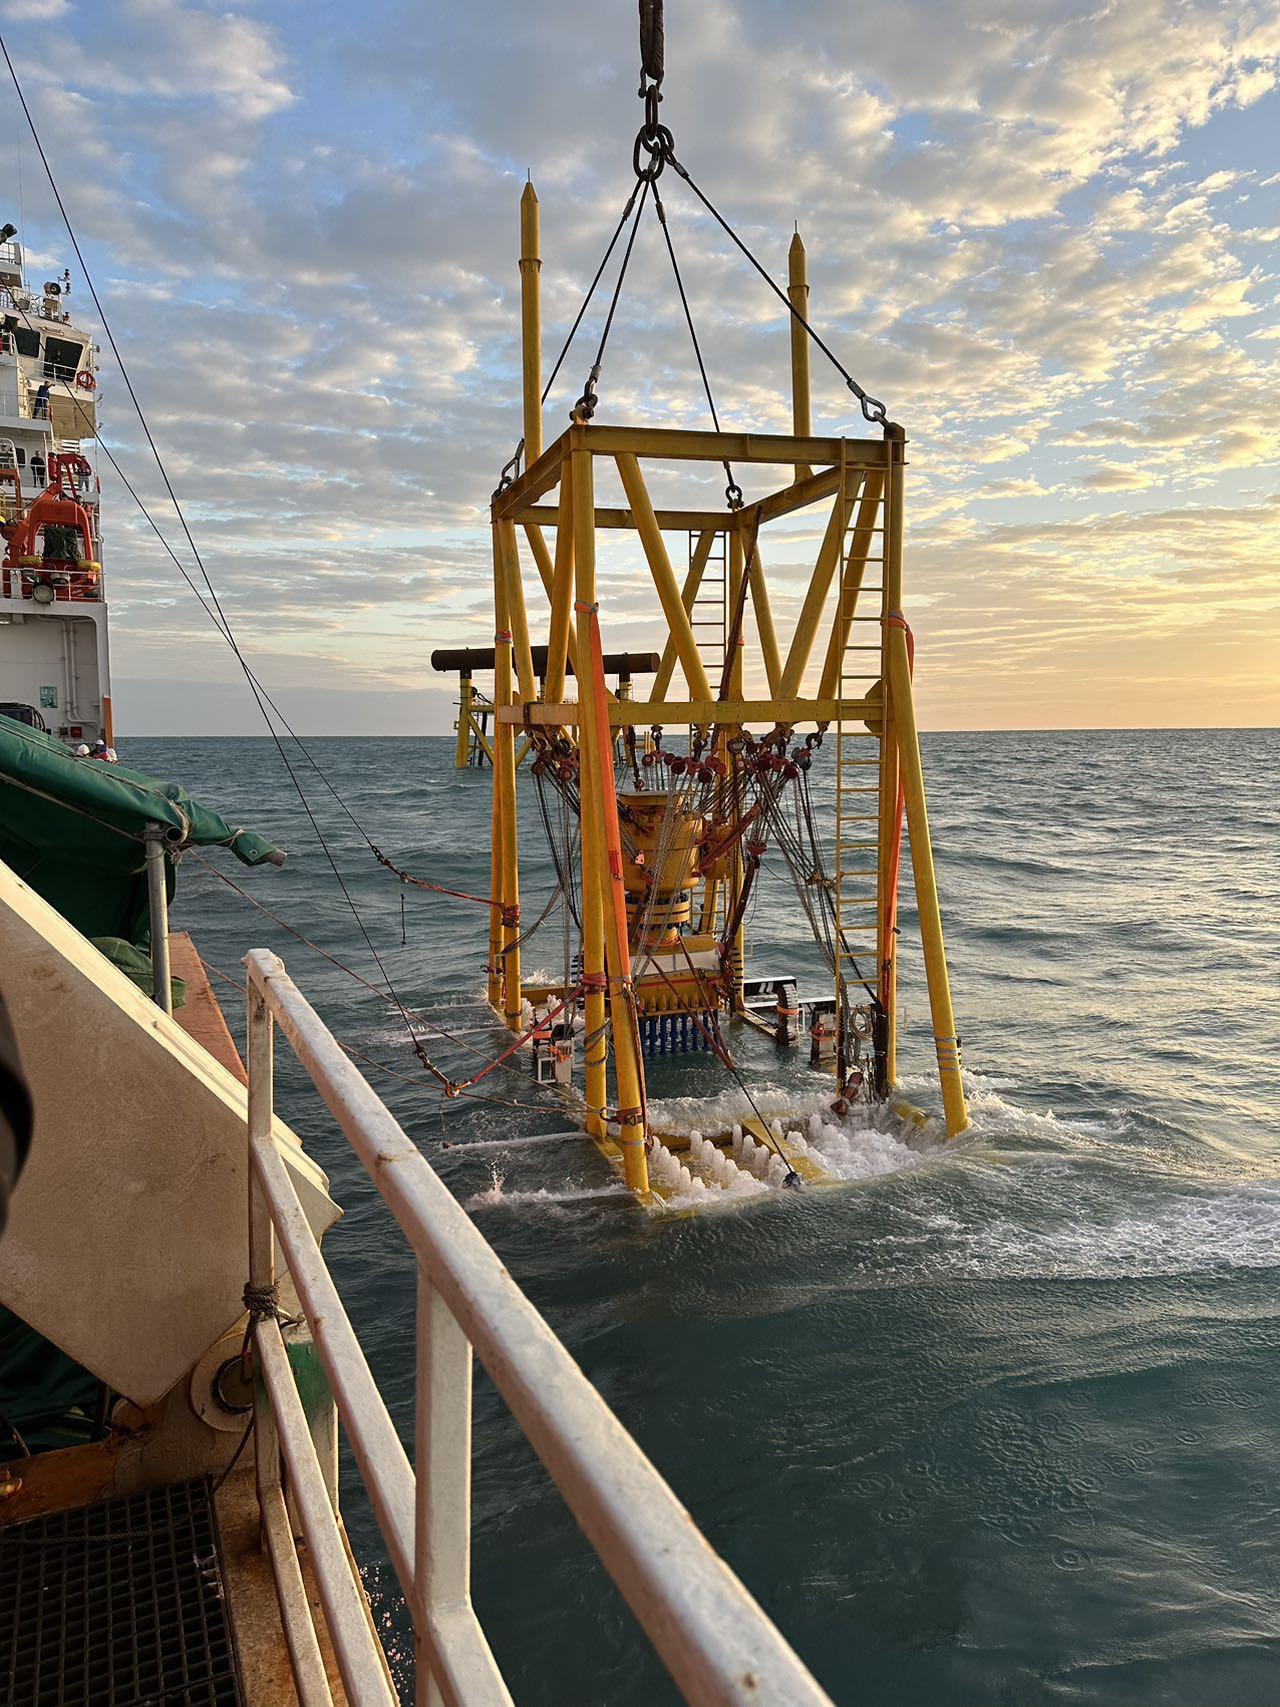
Figure 2. Mechanical clamp and full bore valve being lowered to the seabed.
National Consortium Partners
National Consortium Supporters In Partnership with
Hosted by
extended stroke distance of 180 in. to ensure the hot tap could be conducted and the pipe coupons recovered.
Seal verification sequence
With hot tapping completed the BISEPs were deployed into the flowing pipeline and hydraulically activated compressing the plugging head and energising the dual elastomer seals. This causes the seals to radially expand against the pipe wall, providing leak-tight isolation. The hydraulic activation allows the seals to be manipulated to improve performance when sealing in pipes with issues such as pitting, ovality or weld seams ensuring robust isolation even in challenging piping conditions.
As the seals are energised the trapped pipeline content in the annulus (cavity) between the seals is compressed due to the seal compression reducing the annulus volume. This increases the annulus pressure to higher than pipeline pressure, monitoring this pressure to prove no pressure loss is an initial indication that the seals are isolating. The annulus pressure is continually monitored and the pipeline pressure inboard (section of the pipeline to be isolated) is vented generating a differential pressure across the plugging head. Once inboard pressure is fully vented the BISEP secondary seal is tested in-situ to above the pipeline pressure, in the correct direction. This proves the integrity of the secondary seal. The annulus is then vented to a safe area and locked-in. This allows the primary seal to be tested to the full differential pressure and in the direction of the pressure threat.
Fail-safe isolation
The BISEP provides a fail-safe isolation as the seals are activated and maintained by two independent mechanisms; hydraulic activation and pressure differential across the seals provided by the pipeline pressure. The differential pressure maintains selfenergisation of the seals ensuring isolation integrity independent of the hydraulic control circuit.
The BISEP is the only hot tap installed isolation tool that satisfies the design criteria for DNV Type Approval for Pipeline Isolation Plugs. The design criteria satisfies the requirements for Pipeline Isolation Plugs to provide dual seal and isolation in accordance with Offshore Standards: DNV-OS-F101 (Submarine Pipeline Systems) and recommended Practices: DNV-RP-F113 (Subsea Pipeline Repair) and is code compliant with: ASME BPVC Section VIII, Division 2.
Breaking of containment
With the BISEPs deployed and seal testing completed, an isolation certificate was issued by STATS to the client, enabling the isolated section of pipeline to be safely depressurised and prepared for breaking of containment and tie-in activities.
STATS supplied two lightweight strap clamps to provide mechanical connection points to the isolated pipe spool, these were hot tapped with STATS SureTap ST150 creating 2 in. ports to facilitate venting and purging of the isolated section. The pipeline was then cut to remove the pipe spool and provide access for the new field tie-in.
Integrated bypass – maintaining production
The BISEP was configured with an integrated bypass through the launcher, this ensured no interruption to flow, maintaining
Figure 3. Subsea BISEP and integrated bypass.
Figure 4. SureTap ST1530-90 XL deployment.
Peter van Beugen Managing Director
production throughout the tie-in activities. The BISEP is installed into the pipeline unset allowing deployment into a flowing pipeline, diverting flow through the integrated bypass, resulting in no interruption to production and reduces hot tapping activities and the number of mechanical hot tap clamps required, significantly reducing project complexity and diver intervention.
As a result, the project was executed with zero disruption to production, reduced offshore scope, and a compressed schedule, delivering significant cost efficiencies and operational benefits to the pipeline operator.
A milestone in subsea pipeline technology
Following 28 days of leak-tight isolation and successful completion of the pipeline tie-in, the BISEPs were recovered and the bypass pipework decommissioned and removed. The full-bore valves were then closed, enabling safe recovery of the BISEPs. Using the SureTap hot tap system, completion plugs were installed into the branches of the hot tap clamps. This operation allowed the removal of the full-bore valves, after which blind flanges were fitted to the hot tap clamp branches.
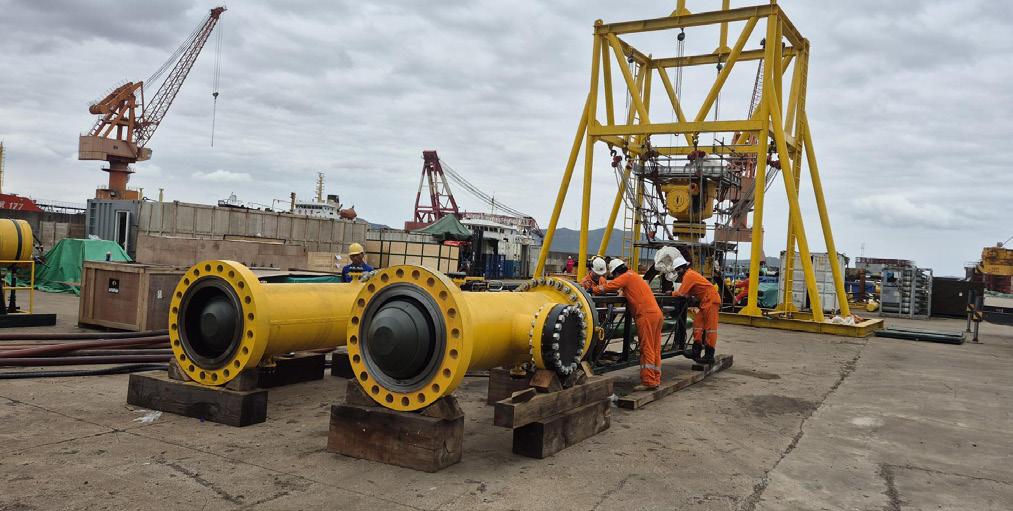
The successful execution of this complex subsea intervention, delivered without incident or delay, was driven by precise planning, engineering validation, and disciplined execution. A comprehensive System Integration Testing (SIT) in China ensured full system readiness ahead of offshore deployment and supported strong collaboration across all stakeholders.
This achievement underlines the value of combining innovative technology with robust engineering and disciplined
operational delivery. For operators, the benefits are clear: enhanced safety, uninterrupted production, reduced costs, and increased flexibility in asset management.
Commenting on the milestone project, Alasdair Arthur, Project Manager based in Kuala Lumpur, Malaysia, said: “This was both a challenging and highly rewarding project, and I am extremely proud to have been part of the team that successfully delivered the first subsea BISEP project featuring an integrated bypass system.
“The success of this operation reflects STATS Group’s broader capability in executing complex subsea pipeline intervention solutions. We have now established extensive experience and a proven track record across subsea pipeline diameters ranging from 8 in. to 48 in., supporting projects throughout Asia Pacific, the Middle East, and the Gulf of Mexico.”
Beyond a single project milestone, this execution reflects a broader shift in how the industry approaches pipeline intervention. Operators are increasingly moving away from shutdown-dependent strategies toward live intervention techniques that maintain production and reduce operational risk.
By enabling continuous operation of critical infrastructure, these solutions play an important role in supporting energy security. As offshore developments evolve through new field tie-ins, decommissioning activities, and asset repurposing, the ability to safely modify live pipelines is becoming a key enabler of long-term asset value.
Todd Razor, Arrowhead Winch and Altrad Sparrows, discuss how Authorised Service Centres (ASCs) support offshore crane hoist safety, reliability, and performance through factory-trained technicians, standardised maintenance, and global collaboration.
Arrowhead Winch recently held an inaugural forum with representatives from their network of Authorised Service Centres (ASCs) around the world attending the first Advisory Council meeting. The Council has been established as a collaboration among ASC partners, primarily
Figure 1. Level 1 training provides foundational knowledge and hands-on experience with hydraulic planetary hoists.
supporting the offshore crane market, to exchange perspectives on customer needs, operational standards for BRADEN and Gearmatic equipment, and industry trends.
Offshore crane hoists: the importance of making the right choice for service and maintenance
With a mandate tied to operational safety and compliance, regulatory bodies like API and BSEE require that all hoisting equipment be serviced and maintained according to manufacturer standards.
The need for factory-trained technician experience, purposebuilt testing facilities, faster service, and less downtime have never been greater in the offshore energy sector with its focus on prioritising performance and efficiency.
Performance and safety culture
In dynamic offshore environments, crane hoist operations and maintenance are anything but ‘routine’.
The crane, vessel, and load are constantly moving relative to each other. Potential for shock loading, pendulum swing, visibility issues, and salt air threatening to accelerate corrosion, all compound the challenges.
Best practices and regulatory bodies emphasise taking every step to mitigate risk, especially when personnel transport is involved. Choosing who services your lifting equipment becomes a critical performance and safety decision.
Reliability and safety should never be left to chance offshore.
Three advantages of working with an ASC
Arrowhead Winch ASC locations are the front line of support as highly trained service providers, operating under strict alignment
with manufacturer standards for BRADEN and Gearmatic hydraulic planetary hoists.
Each ASC location is considered an extension of Arrowhead Winch regarding quality repair, warranty and campaign service work, bringing OEM processes and factory-trained technician expertise directly to offshore operations and providing local support for energy markets around the world.
Here are three key factors to consider when selecting a service partner:
Safety and compliance at the core
ASCs are structured around clearly documented maintenance and repair procedures, stringent reporting and a commitment to the highest safety measures. They undergo regular factory evaluations confirming service procedures, repair practices, record-keeping, and testing capabilities.
Each location is equipped with a test stand and instrumentation to validate hoist performance, as well as a minimum of two factory-trained technicians.
From inspections, overhauls, and testing routines to maintenance intervals, component replacements, and audit and inspection procedures, every task performed adheres to API rules and offshore regulatory expectations.
This ensures compliance with API RP 2D, BSEE, and manufacturer-specific service requirements, with documentation and traceability built into every job.
A typical maintenance file will include inspection dates and findings; details of any wear, defects or leaks observed; parts replaced and repair steps completed; load test or functional test results; technician name and sign-off.
Factory training, documented processes
The ASC training programme is designed for people working with planetary hoist products, from service technicians and service managers to crane operators and inspectors, support staff and field service personnel.
They attend specialised service schools to gain the knowledge required to perform advanced service work on BRADEN and Gearmatic hoists utilised in offshore applications.
Curriculum includes overviews of relevant products, applications, theory of operation, maintenance best practices and comprehensive service instruction, including hands-on repair and troubleshooting exercises.
With focus on inspections and diagnostics for gear train, braking systems, hydraulic performance and control response, and how to quickly recognise signs of seal wear, corrosion or other issues, instruction doesn’t just focus on a “fast fix”.
Technicians learn where to find the most accurate and timely information in service manuals and technical documentation. Plans for routine service and maintenance to full teardowns are implemented based on hours and duty cycle per manufacturer guidelines.
Support directly from Arrowhead Winch is available when needed to accelerate any troubleshooting, helping remove guesswork and reinforcing every location’s ability to present solutions that keep crane hoists in service.
“We make a component, they put it in the actual crane and provide us with feedback,” says Clint Ross, Training and Product
Figure 3. ASC training provides hands-on experience working with common hoist models while learning directly from Arrowhead Winch factory experts.
4thConference & Expo
Genoa, Italy, 9-12 June 2026
Gain insights into current and emerging challenges in corrosion management Register here: https://www.studiobc.it/AMPP2026_iscrizio ne1.asp?IDCongresso=62
50+ exhibitors
160+ presentations
For info and details, visit https://www.amppitaly.org
Information Manager. “We are bridging the gap between what looks good on paper vs a real-world situation.”
“We maintain strict criteria to ensure that ASCs holding a contract to service BRADEN equipment in the offshore sector are thoroughly trained and committed to our high standards,” says Ross. “Our training aligns and coincides with API rules and regulations and the BSEE offshore oil and gas inspection programme.”
Genuine parts, supply chain partnerships
Unplanned downtime is expensive. Swapping in non-OEM parts or improvising processes can change how a hoist performs under load.
ASCs use genuine BRADEN and Gearmatic parts, follow approved maintenance and repair processes, verify their work through documented test procedures, and confirm equipment meets rated performance after servicing.
By stocking commonly used parts and having quick access to parts through Arrowhead Winch when needed, ASCs can react quickly to service needs. Concentrated expertise translates into quicker turnaround and less potential for disruption to crane operation.
“The industry dictates we have a requirement to maintain inventory, so lead times don’t go through the roof,” says Brandon Sharpe, a shop foreman with Altrad Sparrows.
He commented on a “need it now, get it done’’ mentality that supports eliminating logistical headaches, and helps mitigate inconsistencies companies often face when dealing with multiple service providers.
“We stick to the plan and keep high-demand parts stocked,” says Sharpe. “We feel like we are making the right choices for safety and reliability, by streamlining operations and ensuring uniform quality.”
How ASC partnerships look in practice
Offshore hoists do not operate in a static environment, and neither should the people who service them. As recognised partners, ASCs maintain open communication channels with one another and the manufacturer’s sales and engineering teams, a connection working in all directions.
They receive the latest information and product updates from Arrowhead Winch. At the same time, feedback on operating conditions or any suggestions for improvement is relayed back to the factory from ASCs in the field and can inform future training, technical materials, and product development.
While uniform service standards are applied from one region to another, local teams can incorporate any regional considerations pertaining to lifting operations and maintenance needs.
Lessons learned from the broader network integrate into best practices and continuous improvement collectively and at the individual ASC level. For platform builders, crane owners and operators, this means their hoists benefit from a global pool of experience that goes beyond one shop.
It is a dedicated network delivering the same level of safety and reliability, anywhere in the world.
Gaining the advantage
ASCs take performance-engineered solutions off the page and specialise in overcoming challenges associated with realworld crane hoist operations.
Each location is identified based on its ability to meet strict criteria for training, equipment, inventory, quality systems, and documented actions.
According to Ross, “Our ASCs go through regular audits to ensure they are complying with our requirements. Our involvement in shaping and developing industry standards underscores our commitment to excellence in offshore operations.”
Figure 4. ASC personnel learn how to diagnose common service issues and perform repairs.
Figure 5. Each ASC is equipped with test stands to ensure every hoist leaves the shop tested, validated, and ready for immediate deployment.
John Thomson, Director – SeaShield, and Chiara Sorrentino, Technical Director, Winn & Coales (Denso) Ltd, consider why simplicity is key when it comes to the practicality of plant and field joint coating compatibility.
The ideal pipeline coating system is often described as a single, continuous barrier, applied seamlessly along the entire pipeline length and tailored precisely to its service environment. In theory, such a system would eliminate joints and other perceived weak points, reducing opportunities for moisture ingress and corrosion. In practice, however, pipeline construction is inherently modular. Pipes are manufactured, coated, transported, welded, and commissioned in stages, often across multiple locations. As a result, the reality of pipeline protection is not a single coating, but a system composed of plant-applied coatings and field-applied joint coatings working together.
This reality has given rise to a commonly held assumption: that field joint coatings should closely ‘match’ the plant coating to maintain continuity of performance. While the logic behind this view is understandable, it risks oversimplifying a far more complex challenge. Compatibility is not defined solely by chemical similarity or structural replication. It is equally shaped by application conditions, logistics, human factors, and the practical constraints of the construction environment.
A more effective approach is to move away from the pursuit of sameness and towards a holistic assessment of suitability.
Plant coatings and the controlled environment
Plant-applied pipeline coatings are developed for application under tightly controlled factory conditions. Temperature, humidity, surface preparation quality, and application parameters can all be managed with a high degree of consistency. This enables complex coating systems to be applied reliably and repeatably.
A typical example is a three-layer polyethylene (3LPE) system, comprising a fusion bonded epoxy (FBE) primer, an intermediate adhesive layer, and an outer polyethylene jacket. During application in a coating plant:
The pipe section is first abrasively blasted to achieve a clean surface and also to provide an anchor profile for the fusion bonded epoxy to adhere to. This level of surface preparation must be tightly controlled to ensure a successful application.
The fusion bonded epoxy powder is then electrostatically applied onto the pipe section where the pipe section has
been preheated to the required temperature so that the fusion bonded epoxy powder melts and chemical cross-linking occurs. The temperature of the pipe and epoxy powder must be precisely controlled to ensure adhesion.
An intermediate co-polymer adhesive layer is then applied which provides a chemical bond between the fusion bonded
epoxy and the polyethylene outer layer. This adhesive layer must be applied to the fusion bonded epoxy while the fusion bonded epoxy is still warm to allow the two layers to bond using strong covalent bonds.
The polyethylene layer can then be applied, again at elevated temperatures so that its polymer chains intermix and bond with the intermediate layer and then after cooling form a combination of tightly bonded, well adhered layers.
Each layer is applied in sequence and the control of the elevated temperatures as well as other process factors, is key to achieving the strong chemical and mechanical bonds required for system performance. The result is a durable, welladhered coating system that provides excellent resistance to moisture ingress, oxygen diffusion, and cathodic disbondment.
However, because this performance is achieved through specialised equipment, significant energy input, and carefully controlled conditions, these same factors make direct replication of the plant coating process in the field impractical in many cases.
The realities of field joint application
Field joint coatings must be applied at the pipeline construction site, where conditions are inherently less predictable (Figure 1). Weather, access, logistics, workforce skill levels, and programme pressures all influence the quality and consistency of application. Even when mitigation measures are put in place, such as temporary shelters or environmental controls, field conditions rarely approach the stability of a coating plant.
Systems such as epoxy heat shrink sleeves (Figure 2). are designed to bridge this gap. By combining a thin epoxy layer, a bonding adhesive, and a heat-shrinkable polyethylene outer layer, they aim to replicate the functional elements of a multilayer plant coating. Yet they still require surface preparation, preheating, and controlled application to perform as intended. Many of the same sensitivities therefore remain.
Experience across the industry consistently shows that coating failures are far more likely to arise from inadequate surface preparation or application error than from fundamental material defects. This is particularly true for field-applied coatings, where complexity increases the opportunity for variability. From a risk perspective, simplicity matters.
Application suitability as a design parameter
If field joint coatings were selected in isolation, without reference to the plant coating, the primary considerations would be service performance and ease of application. Coatings that tolerate wider temperature and humidity ranges, require less onerous surface preparation, and rely on minimal specialist equipment are inherently more forgiving (Figure 3 and Figure 4). They reduce dependence on ideal conditions and lower the likelihood that minor deviations during application will translate into long-term performance issues. This does not imply that compatibility with the plant coating is unimportant. Rather, it suggests that compatibility should be understood in functional terms: the ability of the combined system to perform reliably over the pipeline’s
Figure 1. A liquid coating application in low temperature conditions.
Figure 2. An epoxy heat shrink sleeve applied over 3LPE.
Figure 3. Denso Protal 7200 liquid epoxy coating roller applied in the field, with minimal equipment.
design life, not simply the degree to which one coating resembles another.
A field joint coating that performs exceptionally well in service but proves difficult to apply consistently under site conditions may ultimately present a higher risk than a system that is marginally different in composition but robust in application.
Environmental and logistical constraints
Environmental sensitivity is a critical factor that is sometimes underestimated. A coating system that performs well under controlled conditions may be ill-suited to application in a tropical climate during the rainy season, or in desert or arctic environments where temperature extremes dominate. While protective measures can be introduced, they add cost, complexity, and time, and may themselves introduce new risks.
Logistics also play a significant role. Some field joint coating systems rely on heavy or specialist equipment to achieve the desired performance (Figure 5). Deploying such equipment in remote locations requires energy, transport infrastructure, and additional personnel. In urban or residential settings, noise, disruption, and working-hour restrictions may further complicate matters.
The skill of personnel required for the application of the field joint coating may be a constraining factor. Highly skilled personnel are a valuable asset, but if the success of a project relies on their abilities, there is vulnerability of disruption if they leave the project for any reason. How quickly and easily can they be replaced to enable continuation of the project? If the project is in a remote location, can a local workforce be successfully and quickly trained in the application of a simple field joint coating system? Is this a more practical approach than relying on a highly skilled but potentially scarce workforce?
These considerations extend beyond technical performance. They influence health and safety exposure, environmental impact, and the social footprint of a project. Increasingly, these factors are becoming integral to project decision-making rather than secondary concerns.
Rethinking ‘best practice’
Standards such as ISO 21809 provide essential guidance by defining minimum performance requirements and compatibility criteria for both plant and field joint coatings. They form a necessary foundation for coating selection and qualification. However, compliance with standards alone does not guarantee success in the field.
A more comprehensive evaluation considers multiple dimensions simultaneously:
) Design and service performance, including long-term durability and compatibility with the plant coating.
) Application robustness, taking into account environmental conditions, surface preparation methods, and workforce variability.
) Efficiency of installation, including not only coating application time but also preparation, equipment movement, and weather-related delays.
) Health, safety, environmental, and social impact, encompassing risk elimination, waste generation, energy consumption, and community disruption.
Viewed through this lens, the concept of a ‘matching’ field joint coating becomes less absolute. The question shifts from “Does this coating replicate the plant coating?” to “Does this coating enable the overall system to perform reliably under real project conditions?”
Figure 4. Denso Viscotaq Systems provide effective protection with minimal equipment.
Figure 5. Heavy-duty specialist equipment being used to apply fusion bonded epoxy in the field.
A pragmatic definition of compatibility
The industry’s traditional emphasis on continuity and uniformity has delivered many successful pipeline projects, and the underlying principles remain sound. A continuous barrier is still the objective, and compatibility between coatings remains essential. What is changing is the recognition that continuity does not require identicality.
Plant coatings and field joint coatings serve different purposes and operate under different constraints. Expecting them to behave as interchangeable components can lead to unrealistic expectations and, in some cases, unintended risk.
In practice, the most effective field joint coating is often not the one that most closely mirrors the plant coating in chemistry or structure, but the one that delivers consistent,
repeatable performance when applied by real people, in real conditions, on real projects.
Conclusion
As pipeline projects become more geographically diverse, environmentally scrutinised, and schedule-driven, the ability to balance technical performance with practical execution becomes increasingly important. Field joint coating selection sits at the intersection of these demands.
A shift towards holistic evaluation, grounded in realism rather than idealisation, allows coating systems to be selected not just for how they perform in theory, but for how they perform in practice. In doing so, the industry can move beyond the narrow goal of ‘matching’ the composition of the field joint and mainline coating, towards the recognition that selection of field joint coating application must be informed by performance and installation considerations. Before embarking on a complex process of selecting a field joint coating ask yourself, “is there a simpler solution?”. Sometimes simplicity matters.
For more than 70 years, SPY® Holiday Detectors have operated in extreme temperatures around the globe doing all types of coating inspection jobs. SPY® sets the standard for having the toughest, most reliable and accurate coating inspection equipment in the field, in the manufacturing facility or anywhere else coating inspection jobs need to be done!
About the authors
John Thomson, Director –SeaShield
John Thomson has a degree in mechanical engineering from Exeter University. He has worked for Winn & Coales (Denso) Ltd for over 15 years managing a range of engineering projects as well as contributing to research and development, marketing and sales. He has extensive experience of all Denso corrosion prevention products and oversees the SeaShield range of systems, which are used for the protection of marine assets around the world.
Chiara Sorrentino, Technical Director
Chiara Sorrentino completed a master’s degree in chemistry at the University of Siena (Italy) in 2014 before joining Winn & Coales (Denso) Ltd in 2015. In the intervening decade, she has progressed through multiple roles in Quality Assurance and Research and Development and became a member of the Royal Society of Chemistry. From 2023, she fulfilled the role of Technical Manager for the company, before her appointment to Technical Director in May 2025.
Cindy Trahan, Technical Communications Lead, FlexSteel Pipeline Technologies, LLC, USA, considers the benefits of using flexible steel pipe to rehabilitate ageing infrastructure.
The oil and gas industry is increasingly concerned about aging steel pipelines that can no longer perform as designed. These pipelines often develop anomalies that must be addressed to prevent leaks or structural failures, which can cause significant environmental and societal damage while also harming the public image of the pipeline community. Such catastrophic events erode public trust and confidence while triggering stringent regulatory corrective actions.
Repairing and replacing ageing oil and gas infrastructure is both costly and disruptive. Pull-in liners have been used for over 30 years as an economical means to restore pipeline integrity. However, many of these liners rely on the mechanical properties of the carrier pipeline and cannot independently withstand the stresses associated with typical pipeline pressures. When corrosion leads to significant metal loss,
traditional liners may be insufficient to allow a pipeline to be put back into service, even at reduced pressures. In such cases, standalone flexible steel pipe is often the most viable and economical solution.
Standalone flexible steel pipe can be installed in long sections, sometimes exceeding two miles, requiring fewer excavations. Its long package lengths, high tensile capabilities, and unbonded, flexible design allow it to be pulled through existing pipelines with minimal disruption to the infrastructure. Flexible steel pipe relies on its inherent strength rather than the integrity of the host pipe, using the existing infrastructure merely as a conduit. Although the new pipe has a smaller diameter than the original, the smooth polyethylene liner of the flexible steel pipe compensates for the slight reduction in internal diameter, maintaining efficient flow characteristics. In many cases, the flexible steel pipe will have a higher allowable pressure rating than the host pipe, further offsetting a reduction in flow area.
This method ensures the continued functionality of pipelines while minimising environmental impact and
operational disruptions. By implementing standalone flexible steel pipe, companies can effectively rehabilitate aging infrastructure, uphold safety standards, and protect the environment, thus preserving public trust and avoiding costly regulatory penalties.
Since the early 1970s, tens of thousands of miles of flexible steel pipe have been successfully installed both onshore and offshore. These installations offer several key advantages:1, 2, 3
) Easier and faster installation compared to traditional steel pipes.
) Corrosion-resistant thermoplastic liner and shield.
) Multilayer pressure monitoring for integrity management. ) Successful service records in DOT-regulated applications (192 and 195).
) Suitability for various applications, including hydrocarbon, carbon dioxide (CO2), hydrogen (H2), fuels, and renewable natural gas (RNG).
Steel-reinforced flexible pipe technology
Flexible steel pipe is designed to be installed from roadtransportable reels or coils and incorporates three functional layers in an unbonded structure (Figure 1):
Liner
The innermost layer is made of extruded thermoplastic, highdensity polyethylene (HDPE). This layer provides the primary seal for the conveyed fluid, offering resistance to corrosive mechanisms and ensuring low friction flow environments.
Steel reinforcement
The reinforcement layer consists of four layers of helically wrapped steel strips. Positioned between the inner and outer thermoplastic layers, this layer is protected from the fluid being transported and the external environment. The steel reinforcement optimises internal pressure containment and provides axial strength for pulling the pipe through existing corroded steel pipelines.
Shield
The outermost layer is an extruded HDPE shield designed to protect the underlying layers of the pipe from mechanical damage and corrosive external environments.
This design ensures robust performance and durability, making flexible steel pipe a reliable choice for pipeline rehabilitation projects.
Fittings (connectors) are attached to ends of the pipe through a swaging process, which applies uniform compressive loads to the thermoplastic layers of the pipe. This creates a fluid seal against both the internal and external environments and securely anchors the steel reinforcement layer of the pipe. A midline fitting (Figure 2) joins two lengths of flexible steel pipe without the need for intermediate flanged or traditional welded joints, ensuring a continuous and reliable pipeline system.
Compression-style fittings are qualified per API SPEC 15S and are installed through an engineered, repeatable process that eliminates hot
Figure 2. Midline fitting (external and cross-sectional views).
Figure 3. Schematic of pipe-in-pipe installation.
Figure 4. Pipe pull-through equipment.
work and the associated time and capital-intensive inspection methods (e.g., x-ray) post installation.5, 6 The fitting material is selected for compatibility with the conveyed fluid and operating environment. The most commonly specified material is 316L stainless steel, though alternative corrosion-resistant alloys (CRAs) are also used to ensure optimal performance in various conditions.
Using flexible steel pipe for pipeline rehabilitation
Flexible steel pipe is an ideal candidate for pipeline rehabilitation due to its ability to provide a quick, full structural repair. It can be pulled through an existing pipeline of a slightly larger diameter (Figure 3). Flexible steel pipe may also be installed in place of deteriorated pipes of the same or similar diameter using pipe bursting or pipe splitting techniques. Single pulls of up to 2 miles (9500 ft) have been successfully completed. The primary limitation is the length of the wireline that can be pushed through the existing carrier pipeline to pull the flexible steel pipe into place. Longer pipelines can be installed in several segments with conveniently located bell holes at intervals within the capacity of the wireline equipment.
The overall steps for rehabilitating a pipeline using flexible steel pipe are:
Determining the clearance within the carrier pipe
Flexible steel pipe and fittings can accommodate one nominal size step between the host and insert (e.g. a 12 in. carrier pipe would use 10 in. flexible steel pipe). In some cases, multiple flexible steel lines may be pulled through a single carrier pipe.
Evaluating host pipe design
An initial evaluation of the host pipe geometry, including lengths, bends, and surface obstacles, is conducted using construction alignment sheets or alternative routing information. Tight spots or bends beyond the specified minimum operating bend radius (MBR) of the flexible steel pipe may necessitate cutting out that section of the carrier pipe to assist the pull-through.
Analysing maximum loads
Loads applied during installation cannot exceed the limits specified for the flexible steel pipe. Using capstan tensile load evaluation techniques and friction factors based on empirical data, product tension is estimated and compared with allowable pipe design limitations.
Finalising construction drawings and confirming viability
Once quantitative evaluation efforts have been completed, a Final Issue for Construction (IFC) drawing is created and confirmed via site walk.
Site preparation and product installation
Bell holes are created at the selected entry and exit points. Then, a wireline unit meant for horizontal installation is connected to the host pipe. The pulling rope is propelled
down the host pipe and attached to the flexible steel pipe. Specialised pull heads and mechanical equipment (e.g., centring rollers) help guide the flexible steel pipe into the carrier pipe and/or around inflection points (Figure 4).
This structured approach ensures a comprehensive and efficient rehabilitation process, leveraging the strengths of flexible steel pipe to restore pipeline integrity with minimal disruption.
Pipeline integrity assessment
Due to its unbonded nature, a gap exists between the helical steel reinforcements of flexible steel pipe. This free (‘annular’) space can be uniquely leveraged for post-installation integrity
Figure 6. Bell hole utilisation for pipe-in-pipe rehabilitation.
Figure 7. Midline fitting installation to connect pipeline sections.
confirmation. After inserting flexible steel pipe into the host pipe, an inert gas is injected into the annular space of the flexible steel pipe structure to confirm the integrity of its shield. This test is conducted after each individual pull and again for the entire system once installation is complete. A successful test confirms the flexible steel pipe shield has full integrity and the steel reinforcement is not exposed to corrosive external environments (Figure 4). Coupled with a commissioning hydrotest, the operator confirms the flexible steel pipe is fit for service both inside and out.
For ongoing pipeline integrity management, the annular space of the flexible steel pipe may also be utilised for realtime pressure monitoring during the operation of the pipeline. Continuous pressure in the annulus confirms integrity of the HDPE shield. Any incursion into this layer is identified in realtime via pressure response and can be remediated before longterm pipeline integrity is threatened (Figure 5).
Case study: the Netherlands
In 2016, 8 in. 1500 psi flexible steel pipe was selected for a pipeline rehabilitation project in the Netherlands. The flexible steel pipe was pulled through an existing 18 in. carbon steel pipeline that was transporting produced water. The old 45 km line had been shut down due to a leak caused
by microbiologically induced corrosion (MIC). This incident reduced the operator’s capacity to treat produced oil from the field by 25%, equating to approximately 15 000 bpd of oil. Smart pigging revealed that not only was the pipe wall thickness insufficient to sustain pressure at the location of the leak, but there were also thousands of similar defects across the entire length of the pipeline.
The pipeline was installed under farmland and through canals, and due to environmental concerns from local landowners, the project’s success depended on minimal disruption to the land. The installation involved excavating 67 bell holes and pulling an equal number of individual sections of flexible steel pipe (Figure 6). Hydrotests and annulus pressure tests were conducted on each section before they were joined together by midline fittings (Figure 7).
During the installation process, two of the 67 sections did not pass annulus tests, indicating that the new flexible steel pipe had sustained shield damage while being pulled through the carrier pipeline. To locate the damage within the carrier pipeline, polyurethane foam was used to isolate each section. Small holes were then drilled in each section of the carrier pipeline so a sniffer could be inserted. The sniffers accurately identified the leak locations once the flexible steel pipe was flooded with methane. The damage was found and repaired, and the pipeline successfully passed a final hydrotest.
The installation was completed in only four months, well ahead of schedule, restoring processing capacity with minimal impact on the local community and environment. The installation time was reduced by selecting a pipeline product that was installed at an average rate of 26.25 ft (8 m) per minute despite multiple bends in the carrier pipeline. Furthermore, with the newly recommissioned water injection pipeline system relying on flexible steel pipe, it is now substantially more resistant to MIC.
This case demonstrates how flexible steel pipe can offer a fast, efficient, and environmentally friendly solution to rehabilitating aging pipeline infrastructure, ensuring continued functionality and reliability in challenging conditions.
Case study: US Gulf Coast
In 2022, a 4.4 mile, 1960s era 12 in. steel pipeline was rehabilitated in southern Louisiana. Due to excessive wall loss, the operator considered replacing the existing infrastructure for regulated (49 CFR 195) crude-gathering midstream service. In most areas, congested surface conditions rendered full replacement uneconomical. Because the existing line traversed a high-traffic Intracoastal Waterway, permitting a new line would have been extremely challenging (and expensive) due to regulatory constraints.
Working with the flexible steel pipe manufacturer, a rehabilitation plan was developed using 6 in., 1500 psi flexible steel pipe (Figure 8). This plan entailed six pull sections along the 4.4 miles, isolation valves at the river crossing, and threelayer real-time pressure monitoring on the newly installed system. A special permit was requested and granted by the Louisiana Department of Natural Resources (LDNR) and the US Department of Transportation’s Pipeline and Hazardous Materials Safety Administration (PHMSA).
Figure 8. New pipe pulled through existing crude pipeline.
Figure 9. Northeast US pipeline rehabilitation project.
The entire system was rehabilitated, integrity tested, and hydrotested in two weeks. After one year of service, a sample was removed from the line for full scale mechanical and material testing. The results of this test showed no degradation and fully met or exceeded manufacturer specifications. The line is currently in full operation, with daily pressure monitoring that provides real-time data to confirm pipeline integrity.
Case study: US Appalachia
In 2016, a natural gas operator in the Marcellus Shale basin identified a 5.8 mile section of 12 in., 1950s era bare steel pipeline with significant external corrosion. While the flowing media (processed natural gas) did not present concerning internal corrosion conditions, the bare pipeline naturally began to show signs of excessive external corrosion. After numerous integrity digs and material assessments, the operator determined traditional repair methods would be uneconomical. The system repair was further complicated by the location of the pipeline: Class 1 and 2 areas with pipeline located under state forest (49 CFR 192).
The operator selected 6 in. 1500 psi flexible steel pipe to rehabilitate this system (Figure 9). A special permit was reviewed and approved by the Pennsylvania Public Utilities Commission (PAPUC) and PHMSA. The system was quickly rehabilitated, returning gas service to the region. The operator has since completed a second rehabilitation phase (14.6 miles) of the same system and plans to continue this effort to the termination point of the line near Baytown, Texas (USA).
Conclusion
Pulling flexible steel pipe through aged and corroded pipelines offers an efficient alternative to new construction. This method is fast and non-invasive, leveraging the tension capabilities of flexible steel pipe to enable long pulls. The inserted pipe’s inherent pressure-retaining capability does not rely on the structural integrity of the carrier pipe.
Pipelines rehabilitated with flexible steel pipe can operate at higher pressures due to the robust construction of the pipe, which experiences minimal pressure loss compared to the original system. This rehabilitation technique can prevent the permanent shutdown and abandonment of failed pipelines in environmentally sensitive areas. Pipelines currently in operation that have been rehabilitated with flexible steel pipe continue to perform to original specifications without the need for de-rating over time.
References
1. OUT. J. M. M., KRONEMEIJER, D. A., VAN DE LOO P. J., and STERKE A., “The Integrity of Flexible Pipe: Search for an Inspection Strategy,” Engineering Structures, Volume 17, No. 4, 1995, p. 305.
2. SAUNDERS, C., and O’SULLIVAN, T., “Integrity Management and Life Extrusion of Flexible Pipe,” Society of Petroleum Engineers, SPE 108982, p. 7.
3. DODDS, N., SOUTHERN, A., LEYLAND, J., ETHRIDGE, A., CASE, M., and SHELDRAKE, T., “Steel Reinforced Flexible Thermoplastic Pipe: Design and Applications,” 12th MECC, 2008.
4. FlexSteel Pipeline Technologies Company Literature and Website, 31 June 2021.
5. API RP 17B, “Recommended Practice for Flexible Pipe,” 5th Edition, American Petroleum Institute, 2014.
6. API SPEC 15S “Spoolable Reinforced Plastic Line Pipe,” 2nd Edition, American Petroleum Institute, 2016.
LNG Industry magazine
A Q&A with Angélique Raude, Global Director NDT Application & Market Development, Evident, on the evolution of weld inspection – from conventional radiography to advanced ultrasonic techniques – and what it means for pipeline integrity.
World Pipelines (WP): What are the most common weld defects you see in pipeline projects today?
Angélique Raude (AR) : Defects in welded pipelines are usually linked to material and welding process. The most common manufacturing defects in welded pipeline are lack of fusion (LOF), lack of penetration (LOP), porosity, slag inclusions, and solidification cracking. Planar defects such as LOF are among
the most critical type of defect, as they can propagate under stress compromising the asset’s structural integrity. In modern pipeline projects, tighter tolerances, higher productivity welding processes, and increasingly demanding materials have made detection of these defects more important.
WP: What are the biggest shifts you’ve seen in how pipeline welds are inspected (both in the AR: The most significant shift has been the transition from traditional/conventional techniques such as film-based radiography testing (RT) and ultrasonic testing (UT) toward full digital and advanced inspection techniques. These include digital radiography and advanced UT particularly phased array ultrasonic testing (PAUT) and, more recently, FMC/TFM techniques. In field applications, radiography can be challenging to deploy due to radiation protection
requirements and associated operational constraints. In contrast, advanced UT techniques can be more easily adapted to specific inspection needs, which drove a rapid adoption of PAUT and TFM.
Automated and semi-automated UT systems now allow for faster data acquisition, real-time analysis, and reduced delays compared to traditional techniques. In addition, PAUT and TFM generate rich, high-resolution datasets rather than static images, facilitating more accurate analysis and seamless integration into broader risk-based inspection (RBI) strategies.
WP: For operators still relying heavily on radiography, what are the technical or operational drivers pushing them toward ultrasonic alternatives?
AR: Several key technical and operational drivers are accelerating the shift away from radiography:
) Environment and safety: radiography involves radiation, requiring exclusion zones and strict safety protocols that can disrupt operations and require complete shutdown.
) Productivity: ultrasonic methods can be performed without stopping nearby work, significantly improving workflow efficiency.
) Detection capability: advanced UT techniques are more sensitive to planar defects, which are critical in pipeline integrity.
These factors make PAUT not just a technical alternative, but a more operationally efficient solution since it is more easily adapted to different weld geometries, materials, and inspection requirements in both field and fabrication environments.
WP: Phased array and FMC/TFM techniques are increasingly discussed in pipeline weld inspection. What advantages do these techniques offer over conventional UT or radiography?
AR: PAUT and FMC/TFM techniques enable comprehensive coverage of the entire weld volume with minimal probe repositioning or setup adjustments. Compared to conventional methods, they provide real-time, high-resolution imaging that allows defective areas to be quickly identified. Because the ultrasonic beam can be electronically steered, complex weld geometries can be inspected from multiple angles using a single probe position, significantly improving the probability of detection (PoD), particularly for critical planar defects.
As fully digital solutions, these techniques also ensure complete traceability and support long-term asset management. In addition, recent developments in open data formats allow operators to retain full ownership of their
Figure 2. Evident solutions are designed to deliver precise, reliable inspection results across a wide range of applications.
inspection data, enabling easier data integration, reanalysis, and future re-analysis of inspection records.
WP: How can modern weld inspection technologies help reduce repair rates and keep projects on schedule?
AR: By providing quicker, more accurate defect characterisation (both nature and location), PAUT and TFM contribute to lower repair rates in several ways:
) Early detection, with real-time feedback allows welding issues to be identified and corrected quickly.
) Reduced false calls and ultimately unnecessary repairs.
) Automated and encoded systems reduce operator variability.
By minimising both missed defects and overcalls, advanced UT helps maintain weld quality while avoiding costly rework and delays: critical factors in large-scale pipeline projects.
WP: In challenging environments (offshore, remote terrain, extreme temperatures) what are the key considerations for reliable weld inspection?
AR: Modern PAUT/TFM inspection solutions are designed to offer reliable inspection even in harsh environments. In those conditions the factors considered are:
) Equipment robustness: systems must withstand temperature extremes, moisture, dust, and mechanical stress.
) Portability and ease of deployment: lightweight, field-ready solutions are essential in remote locations, confined spaces, work at height, etc.
) Power and data management: battery life, data storage, and connectivity can be limiting factors in remote areas.
) Operator usability: intuitive interfaces and simplified workflows reduce the risk of human error under difficult conditions.
) Operator dependency: consistent results must be achievable, and pre-defined setup and user interface.
WP: With the growth of CO2 and hydrogen pipeline projects, are there new inspection challenges emerging?
AR: H2 is a much smaller molecule than methane which means more rigid acceptability criteria and smaller flaws that need to be detected. The additional challenges for inspecting H2 pipelines will be derived from the need for higher sensitivity, smaller, higher frequency PA probes and techniques that allow enhanced detection and characterisation of flaws like focused Phased Array, TFM or PCI.
Showcase your expertise to a global midstream audience
Position your company as a thought leader with a technical webinar hosted on World Pipelines.
A podcast series for professionals in the downstream refining, petrochemical, and gas processing industries
LISTEN NOW
Sponsored by
TSCA: a critical turning point
Rob Benedict, Vice President for Petrochemicals and Midstream at American Fuel & Petrochemical Manufacturers (AFPM), guides us on the latest developments with the Toxic Substances Control Act (TSCA).
SAF: ready to take flight
Maurits van Tol, CEO of Catalyst Technologies, Johnson Matthey, explores the role of sustainable aviation fuel (SAF) in reducing emissions, and outlines the most promising pathways and innovations in the sector.
Natural gas: an unexpected bridge fuel
Simon Lack, Managing Partner at SL Advisors LLC, looks at natural gas’ emerging role as an unexpected bridge fuel for both AI data centres and LNG exports.
Innovations within industrial insulation
Jack Blundell, Sales Director, ROCKWOOL Technical Insulation, outlines game-changing innovations in industrial insulation that can help tackle the critical topic of corrosion.
Listen and subscribe here
Michael Kasch, ILF Consulting Engineers Germany GmbH, presents a two-step approach for gas pipeline optimisation, applied to hydrogen.
Due to the many parameters that determine the costs of constructing and later operating a pipeline system for typically decades, optimising such infrastructure is a complex task. It is not only a question of the number of parameters, but also of their mutual dependencies and individual influence on the overall costs. The primary requirement for the design of a pipeline system is the intended transport capacity, that must be achieved at minimum costs for planning, construction (CAPEX) and long-term operation over the entire service life (OPEX), i.e. at minimal levelised costs. The optimal system configuration is a smart balance between the physical key-figures of the constructed infrastructure and the most efficient mode of operation, mainly the pressure range. Key-figures of the system configuration are the optimal pipe diameter and the number, location, and capacity of compressor stations. The most efficient operating mode is inextricably linked to the system configuration of the pipeline system and vice versa. The optimum in terms of minimal levelised costs includes all system parameters of the transmission system.
This article presents a two-step approach for gas pipeline optimisation, applied to hydrogen. In the first step, a simplified spreadsheet calculation is used to approximate the optimal set of system parameters. Finally, in the second step, the optimal system configuration and operating modes are refined and confirmed by detailed model-based simulations using the complete formalism of fluid mechanics and thermodynamics.
Every optimisation process requires a defined target function based on the complete list of optimisation criteria and a solid cost model. The intended transport capacity shall be made available at minimal costs for planning, construction (CAPEX) and long-term operation over the entire service life (OPEX). The parameters to be optimised can be divided into two groups: ‘system configuration’ on the one hand and ‘operational process conditions’ on the other. There are many mutual dependencies between the parameters of both groups.
A solid cost model is essential since every change of a technical parameter like diameter, wall thickness, pressure range, compression capacity and alike has significant impact on
the total CAPEX and OPEX. This article presents a twostep approach with focus on optimising the diameter and the operational conditions for long-distance transmission pipelines carrying hydrogen.
Qualitatively, it is quite easy to judge the consequences of changing one of the parameters. But quantitatively it is hard to find the optimum in the parameter space without a strictly mathematical optimisation approach. The complexity of the optimisation process is caused by the multiple mutual dependencies between all the parameters of the system configuration and operating conditions. And not all parameters have the same magnitude of impact on the total costs.
Optimisation approach
Basic considerations
One of the main parameters to be optimised is the pipe diameter. Although in principle, the diameter is a continuous variable, in practice it is a discreate parameter due to the available standard sizes of pipes on the market. Also, the number of compressor stations is obviously a discrete parameter. All other system parameters are continuous variables like compression ratio, transmission pressure range etc.
Operational requirements and boundary conditions of a transmission line are:
) Intake pressure at the first station of the pipeline.
) Minimum and/or maximum delivery pressure at the terminal station of the pipeline.
) Maximum flow rate, i.e. the annual throughput divided by the utilisation factor.
Throughout this article, the maximum flow rate is expressed in terms of mass flow rate in kg/sec., but can also be expressed as norm volume flow rate in m³/h or transmitted energy per time in GWh/h with e.g. a lower calorific value (LCV) of 33.33 kWh/kg).
System configuration and operational parameters to be optimised are:
) Distance and elevation profile along the pipeline route.
) Internal diameter of the pipe (D > D min) and roughness.
) Number, locations and compression capacities of the compressor stations along the pipeline, which implies determination of the minimum pressure level within each pipeline section, not necessarily identical with the delivery pressure.
) Intended service life (typically at least three decades).
The minimum required diameter is a good starting point for the optimisation procedure. It is determined based on the maximum allowable flow velocity to limit erosional issues that could be caused by advection of liquid droplets and solid particles in the gas stream. Flow velocity limits may be requested by the codes and standards to be applied for the particular project:
Maximum
Annual
Costs of one compressor station 58 Mio€ base
Plus 2.3 Mio€/MW
Intake pressure 20 bar(g)
Costs of pipeline + stations See Figure 3 ← Linear part of the pipeline system includes pipes and coatings, pig launcher/receiver, block valve stations as well as pipeline construction and commissioning
Delivery pressure Step 1: open Step 2: 30 bar(g)
€/MWh
Total
In case of hydrogen, let us assume a maximum acceptable flow velocity of 20 m/sec. Hydrogen at 12°C has a density of approximately ρ = 4.2 kg/m³ at 50 bar(g), the delivery pressure assumed in this example. For a mass flow rate of 70 kg/sec. (8.4 GWh/h), the minimum required internal diameter would be approximately 1030 mm. The next larger standard pipe diameter is 42 in. If the delivery pressure was only 30 bar(g), the pipe diameter would already require slightly more than 48 in. to keep the flow velocity at the delivery point of the pipeline below 20 m/sec. The flow velocity assumes its maximum at the delivery point. Another case: If the maximum flow velocity was 40 m/sec., the minimum diameter at delivery
Figure 1. Long-distance pipeline with source pressure lower than minimum transmission pressure.
Table 1. Parameters used in the example calculations
pressure of 50 bar(g) would be 32 in., and 40 in. at 30 bar(g). These simple examples already show that these two parameters alone – delivery pressure and maximum flow velocity – have a major influence on the overall system design.
For long-distance gas pipelines, an appropriate choice of the transmission pressure range is the second essential parameter in the optimisation procedure. Increasing the transmission pressure can reduce the number of required compressor stations at the expense of increased costs for larger required wall thickness (CAPEX), higher equipment class as well as the required additional compression capacity and thus power consumption (OPEX).
The determination of the optimal diameter is a first goal. Starting at the minimum diameter, it then needs to be analysed whether the next larger pipe sizes would lead to lower total costs to build the pipeline system and operate it over its entire service life.
Simplified optimisation approach – step 1
The aim of this section is to present the technical background and a way to determine the levelised cost per energy transmitted and per distance, here per MWh and 100 km. Compression power is one of the major cost drivers as it is needed during the entire service life, usually at least two to three decades. The specific compression power (w) of a compressor is proportional to the natural logarithm of the compression ratio (Π = discharge pressure divided by suction pressure) and a factor formed by the real-gas compressibility factor (K) multiplied by the absolute temperature (T) averaged over the compression process (indicated by the horizontal line on top, see below). The specific gas constant (RN) equals atmospheric pressure (pN) divided by norm density (ρN) and norm temperature (TN). The power consumption of the compressor drive (Pdr) is proportional to the specific compression power, the mass flow rate and the inverse efficiencies of the drive and the in general polytropic compression process.
That means, a compression ratio of e.g. 1.5 would require almost the same power consumption compressing the gas stream from suction pressure 30 bar(g) to discharge pressure 45.5 bar(g) as from 50 bar(g) to 75.5 bar(g), the latter with significantly greater reach (L), i.e. the distance until the next compressor station downstream would be required.
In a long-distance pipeline, the minimum transmission pressure is the suction pressure for the compressor stations
as shown on Figure 1. The total power consumption for compression is the sum of the power required to lift the intake pressure (p0) up to the minimum transmission pressure (psuc) and further up to discharge pressure (pdis), plus the power of all compressor stations further down the line.
Compared to the compression power, the other consumers of electricity like gas coolers and utilities, are small and typically contribute only by a few percent to the total power consumption of the entire pipeline system.
The relationship between the operating pressure range, flow rate, diameter and reach can be expressed as follows:
The dimension-less friction factor (λ) is calculated e.g. after Colebrook-White. The pointed brackets indicate the average over the length (L) of the pipeline section, see Figure 1. The function that yields the total costs per length depends, amongst others, on Π, psuc, and D. These three variables determine the reach of a compressor station and ultimately the required number and capacity of the compressor stations.
It is worth to mention that these two simple formulas are sufficient to create a spreadsheet that can approximately and thus preliminarily localise the costs minimum in the parameter space. Detailed thermodynamic and fluid-dynamic calculations are carried out in a second step to precisely localise the optimum.
Annual cost increase percentages (z) over the years of service life (y) are incorporated by a factor that is to be multiplied by the annual OPEX in the first year of operation. If the cost increases are assumed constant over the years, the factor simplifies to:
Figure 2. Parameters in the Π-psuc-plane for pinpointing the cost minimum (44 in. diameter).
The formulas presented here, are applied to hydrogen and implemented on a spreadsheet to calculate CAPEX and OPEX per 100 km for the entire service life of the pipeline system. The total costs divided by the total energy transmitted during the entire service life yields the levelised costs per MWh and per 100 km. The calculations were carried out for the parameters and constraints:
For very long pipelines and finally aiming at levelised costs per 100 km, the number of compressor stations may be treated as a floating-point variable, n = 100 km/L. Calculations were carried out for each pair of parameters Π and psuc and for a sequence of standard diameters to find the preliminary optimal diameter for the given conditions (cf. Table 1). Figure 2 shows the results for that diameter with the lowest levelised costs –here 44 in., as shown in Figure 3.
Green coloured cells on the spreadsheet (Figure 2) indicate low costs in the parameter plane and thus potential candidates for the optimum whilst red, orange and yellow cells show nonoptimal areas. The white figure indicates the minimum levelised costs. Colourless cells are excluded from the optimisation because for these combinations of suction pressure (or lower transmission pressure) and compression ratio the maximum allowable operating pressure of 100 bar(g) would be exceeded.
With 25 years of service life, as used in this example, OPEX dominates the total costs, driven by power consumption
approximately 0.29 €/MWh/100 km (green curve, see Step 2).
for compression. Longer service life periods would even increase this tendency. From the operating cost perspective, it is advantageous to keep the compression ratio low and at the same time operate the pipeline at high pressure to take advantage of the greater reach.
The absolute minimum of levelised costs found here at 80 bar(g) and Π = 1.2 (44 in.) only indicates the ‘neighbourhood’ of the optimum in the parameter plane, because:
) The spacings used in compression ratio and lower transmission pressure on the spreadsheet are too wide to localise the absolute optimum precisely.
) For practical reasons, there were some simplifications used in the spreadsheet calculations which are not as accurate as the methods used in Step 2 with complete model-based simulation including detailed fluid mechanics and real-gas thermodynamics.
The concluded optimum diameter of 44 in. and levelised costs of slightly less than 0.3 €/MWh/100 km are therefore only approximate and preliminary at this stage (blue curve on Figure 3).
The impact of the intake pressure on the levelised costs is related to the total length of the pipeline system. Relative to the total costs, the contribution of CAPEX and OPEX to raise the intake pressure up to the lower transmission pressure (or suction pressure) becomes smaller the longer the pipeline system is.
With this approach (Step 1), the delivery pressure for each parameter set is at the same time the lower transmission pressure. Defined boundary conditions regarding delivery pressure are considered in the detailed approach of Step 2. It is worth to note that the simplified optimisation approach was implemented on a standard spreadsheet tool and that only the three formulas described above were used. The two average values therein were approximated as follows:
With κ = 1.4 (reciprocating compressors assumed) and a constant average.
With this simple spreadsheet calculation tool, the preliminary optimisation can be carried out conveniently. Changing a parameter shows directly the consequences of that measure. The approximate optimal parameter set can be localised very fast. It only needs to be finally double-checked against the complete fluid-dynamic and thermodynamic calculation – see Step 2. The green curve between 42 in. and 48 in. on Figure 3 shows the good matching of results.
Detailed optimisation approach – Step 2
The achievement of the simplified optimisation approach (Step 1) is the convenient determination of the most suitable diameter for the pipeline system and the two operating parameters – suction pressure, which is here identical to the
Figure 4. Double-checking and confirmation of the optimal diameter and operating parameters.
Figure 3. Optimal diameter 44 in. at cost minimum of
lower transmission pressure, and the compression ratio of the compressor stations along the pipeline – see Figure 1.
A detailed model-based calculation (including temperature model, discharge coolers, etc.) confirmed the predictions of the simplified approach Step 1. As shown on Figure 4, also the detailed calculation identifies the 44 in. pipe diameter to be optimal regarding minimum levelised costs.
The 44 in. pipeline is obviously the optimal choice within the given boundary conditions and constraints of this example.
The optimal lower transmission pressure at 84 bar(g) yields the minimum levelised costs. With the compression ratio 1.185 the discharge pressure remains slightly below 100 bar(g). If there was no restriction on the maximum operating pressure, a 42 in. pipeline would even lead to slightly lower levelised costs but at correspondingly higher pressure. The 48 in. line has the minimum levelised costs at a lower transmission pressure of 70 bar(g) but above 0.3 €/MWh/100 km.
In real pipeline systems, there are usually additional restrictions and specific requirements that must be considered and complied with. And the number of compressor stations is an integer. Such a requirement is e.g. the minimum and/or maximum delivery pressure that can be lower than the lower transmission pressure as shown on Figure 5. If the delivery pressure is not only an upper limit but shall be met exactly, then at least the last pipeline segment requires a different treatment compared to the other upstream segments. There are several ways to deal with this constraint:
) Choose the lower transmission pressure equals the delivery pressure (Case A on Figure 6).
) Accept that the excess pressure at the delivery point is simply throttled down to the set point there (Case G on Figure 6).
) Keep the transmission pressure high and reduce the compression ratio only at the last compressor station as sketched on Figure 5 (Case B on Figure 6).
) Cascaded transmission pressure, i.e. reduce the compression ratio at the last and the penultimate compressor stations, and so forth (Case C/D/E/F on Figure 6).
) Apply the distance limitation (here 500 km) only for the last pipeline section and add another station upstream (here 5 x 400 km + 1 x 500 km).
Starting the discussion on the last option: although when adding one compressor station so that all the compressor stations would require less capacity, the levelised costs turn out to be higher than the other presented cases on Figure 6, except for the worst Case A. This leads to the first general conclusion: It is advantageous to utilise the maximum permissible distance between two consecutive compressor stations to keep the number of compressor stations as low as possible.
Case A and Case G on Figure 6 are the two scenarios with ‘flat’ lower transmission pressure, Case A at 30 bar(g) and Case G at 84 bar(g). Case G is the scenario with minimum levelised costs determined by the simplified approach (Step 1).
Case B – Case F are here called ‘cascaded’ as they utilise high transmission pressures at pipeline entry and stepwise lower pressure for the line sections toward the end of the
pipeline to meet the boundary condition for the delivery pressure there, at 30 bar(g) in this example.
Case A is obviously by far the worst with 35.8% higher levelised costs compared to the best Case F, see the bottom bar on the inserted chart on Figure 6 in comparison to the green coloured bar.
Case B has a lower transmission pressure of 50 bar(g) and a reduced compression ratio only at the last compressor station. Case C has a lower transmission pressure of 60 bar(g) and reduced compression ratios at the last two compressor stations. Case D starts at a lower transmission pressure of 70 bar(g) in the first two pipeline sections and successively steps down to the delivery pressure in the last three sections. The last two cascaded scenarios – Case E and Case F – start at lower transmission pressures of 80 bar(g) and 84 bar(g), respectively. Both scenarios further reduce the levelised costs. Case F is the overall optimum. We cannot go another step up because then the upper pressure constraint (pdis < 100 bar(g)) would be violated.
In a pure transmission pipeline without entry/exit branches underway it would obviously be advantageous to apply a cascaded pressure profile along the pipeline system, like e.g. Case F on Figure 6. However, there may be reasons why such operation would not be suitable. Case C – Case G are all below 0.3€/MWh/100 km; Case D, Case E and Case F are even below 0.29€/MWh/100 km. Thus, there are options close to the overall optimum.
Remark: Case A, with levelised costs of 0.387€/ MWh/100km, corresponds to the first column on the spreadsheet, Figure 2. The levelised costs calculated with
Figure 6. Cascaded vs flat transmission pressure.
Figure 5. Scenario with delivery pressure lower than transmission pressure.
ADVERTISERS’ DIRECTORY
the simplified approach at 30 bar(g) and Π = 2 are 0.390€/MWh/100 km, fully in line with the detailed simulation results. This good agreement is due to the fact that the example model uses a flat elevation profile and a constant ground temperature. The formulas used in the simplified method (Step 1) only represent this situation. Realistic temperature models are typically more complex. Gravity effects in steep sections of the pipeline also lead to deviations from the simple approach, even for the light hydrogen. These details can only be worked out using a full-fledged simulation programme.
Conclusion
Two simple technical formulas plus a factor to take long-term cost increases into account were used to set up the target function for pipeline system optimisation. The simplified optimisation approach was implemented as Step 1 on a standard spreadsheet to calculate the levelised costs for a large number of parameter sets. This spreadsheet enabled us to efficiently narrow down the range in the parameter space in which the optimum is located. Detailed calculations based on a simulation model that takes fluid mechanics and thermodynamics into account were carried out in Step 2 to determine the levelised costs accurately. Compression capacity was calculated with full polytropic approach. Since the approximate location of the optimum was already known from Step 1, only a few of these more complex calculations needed to be done to finally localise the optimum.
Due to the specific conditions that apply to each pipeline system, optimisation is a highly individual task. Real pipeline systems contain more complexity, elevation profiles, no free choice for locations of compressor stations and alike. Such details may cause deviations from the idealised system configuration (as per Step 1) but will not change the main parameters much. Nevertheless, some general conclusions can be drawn.
The simplified approach of Step 1 is efficient and can determine the approximate location of the optimal system configuration in the parameter space very well. It can be used for sensitivity analysis, i.e. to identify those system parameters that need special attention.
The optimal system configuration favours high transmission pressure to take advantage of the greater reach of each compressor station. Only the head compressor station requires high capacity, with higher investment costs for construction and correspondingly higher operating costs. For long-distance pipelines with typical delivery pressure, the lowest levelised costs are achieved when the pressure profile is cascaded from high to low pressure, as shown on Figure 6.
The discussion about the maximum permissible flow velocity appears less critical, as the optimal scenarios result in 30 m/sec. at the delivery point or less at delivery pressure of 30 bar(g).