of West Virginia often set single storm snowfall records as a result of these storms. The Piedmont region averages less than one major coastal snowstorm each year.
Clim ate statistics for O ak Spring based on regional data Annual Precipitation
43 inches
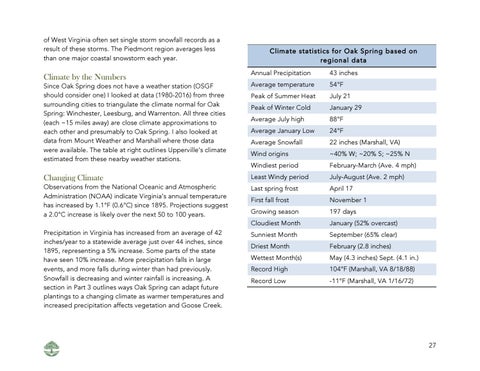
Since Oak Spring does not have a weather station (OSGF should consider one) I looked at data (1980-2016) from three surrounding cities to triangulate the climate normal for Oak Spring: Winchester, Leesburg, and Warrenton. All three cities (each ~15 miles away) are close climate approximations to each other and presumably to Oak Spring. I also looked at data from Mount Weather and Marshall where those data were available. The table at right outlines Upperville’s climate estimated from these nearby weather stations.
Average temperature
54°F
Peak of Summer Heat
July 21
Peak of Winter Cold
January 29
Average July high
88°F
Average January Low
24°F
Average Snowfall
22 inches (Marshall, VA)
Wind origins
~40% W; ~20% S; ~25% N
Windiest period
February-March (Ave. 4 mph)
Changing Climate
Least Windy period
July-August (Ave. 2 mph)
Observations from the National Oceanic and Atmospheric Administration (NOAA) indicate Virginia’s annual temperature has increased by 1.1°F (0.6°C) since 1895. Projections suggest a 2.0°C increase is likely over the next 50 to 100 years.
Last spring frost
April 17
First fall frost
November 1
Growing season
197 days
Cloudiest Month
January (52% overcast)
Precipitation in Virginia has increased from an average of 42 inches/year to a statewide average just over 44 inches, since 1895, representing a 5% increase. Some parts of the state have seen 10% increase. More precipitation falls in large events, and more falls during winter than had previously. Snowfall is decreasing and winter rainfall is increasing. A section in Part 3 outlines ways Oak Spring can adapt future plantings to a changing climate as warmer temperatures and increased precipitation affects vegetation and Goose Creek.
Sunniest Month
September (65% clear)
Driest Month
February (2.8 inches)
Wettest Month(s)
May (4.3 inches) Sept. (4.1 in.)
Record High
104°F (Marshall, VA 8/18/88)
Record Low
-11°F (Marshall, VA 1/16/72)
Climate by the Numbers
27