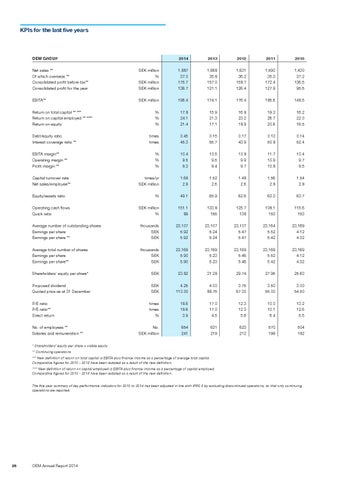
KPIs for the last five years
OEM GROUP
2014
2013
2012
2011
2010
Net sales ** Of which overseas ** Consolidated profit before tax** Consolidated profit for the year
SEK million % SEK million SEK million
1,887 37.0 175.7 136.7
1,668 35.8 157.0 121.1
1,631 36.2 158.7 126.4
1,590 35.3 172.4 127.9
1,430 37.2 136.5 95.5
EBITA**
SEK million
196.4
174.1
176.4
185.6
148.5
% % %
17.8 24.1 21.4
15.9 21.3 17.1
16.8 23.2 18.9
19.3 26.7 20.6
16.2 22.0 16.5
times times
0.45 45.3
0.15 55.7
0.17 43.9
0.13 50.8
0.14 52.4
% % %
10.4 9.5 9.3
10.5 9.5 9.4
10.8 9.9 9.7
11.7 10.9 10.8
10.4 9.7 9.5
times/yr SEK million
1.68 2.9
1.52 2.6
1.48 2.6
1.56 2.8
1.54 2.8
%
49.1
65.9
62.6
63.3
63.7
SEK million %
151.1 89
133.8 155
125.7 138
108.1 153
115.6 153
Average number of outstanding shares Earnings per share Earnings per share **
thousands SEK SEK
23,107 5.92 5.92
23,107 5.24 5.24
23,107 5.47 5.47
23,164 5.52 5.42
23,169 4.12 4.32
Average total number of shares Earnings per share Earnings per share**
thousands SEK SEK
23,169 5.90 5.90
23,169 5.23 5.23
23,169 5.46 5.46
23,169 5.52 5.42
23,169 4.12 4.32
Shareholders’ equity per share*
SEK
23.82
31.28
29.74
27.95
25.63
Proposed dividend Quoted price as at 31 December
SEK SEK
4.25 110.00
4.00 88.75
3.75 67.00
3.50 55.00
3.00 54.50
times times %
18.6 18.6 3.9
17.0 17.0 4.5
12.3 12.3 5.6
10.0 10.1 6.4
13.2 12.6 5.5
No. SEK million
654 241
631 219
623 212
570 199
504 182
Return on total capital ** *** Return on capital employed ** **** Return on equity Debt/equity ratio Interest coverage ratio ** EBITA margin** Operating margin ** Profit margin ** Capital turnover rate Net sales/employee** Equity/assets ratio Operating cash flows Quick ratio
P/E ratio P/E ratio** Direct return No. of employees ** Salaries and remuneration ** * Shareholders’ equity per share = visible equity ** Continuing operations
*** New definition of return on total capital is EBITA plus finance income as a percentage of average total capital. Comparative figures for 2010 - 2013 have been restated as a result of the new definition. **** New definition of return on capital employed is EBITA plus finance income as a percentage of capital employed. Comparative figures for 2010 - 2013 have been restated as a result of the new definition. The five-year summary of key performance indicators for 2010 to 2014 has been adjusted in line with IFRS 5 by excluding discontinued operations, so that only continuing operations are reported.
28
OEM Annual Report 2014