Brought to you by
The Manufacturing & Business Podcast Network
O U R
P O D C A S T S :
MFGTALKRADIO.COM
L I S T E N TO O U R P O D C A S T S AT:
www.jacketmediaco.com
COVER STORY
Breaking the Failure Cycle to Drive Continuous Quality Improvement
PAGE 8
MANUFACTURING OUTLOOK PAGE 6
MANUFACTURING TIDBITS PAGE 10
FILMMAKERS ARE MANUFACTURERS PAGE 12
[
MIAMI IS THE MOST IMMIGRANT-DENSE U.S. METRO AREA, WITH 42% OF THE CITY’S POPULATION BORN ABROAD
JULY ISM PMI: 59.5%
Released August 2nd -The Full Executive Summary Report On Business - Page 20
PAGE 16
THE CASS TRANSPORTATION INDEX PAGE 18
ISO9001:2015 SINCE 1994 AND AS9100D SINCE 1998 NIST SP 800-171
(COMPLIANCE UNDER DEVELOPMENT)
*
2
Manufacturing Outlook / August 2021
*Toll free within the U.S.
TABLE OF CONTENTS Publisher LEWIS A WEISS Editor in Chief TIM GRADY Creative Director CRAIG ROVERE Contributing Writers ROYCE LOWE NORBERT ORE CHRIS KUEHL THOMAS R. CUTLER AMELIA ROY JEANNE-MARIE LOWRIE JOCELYN BRIGHT CHRIS ANDERSON LAWRENCE MAKAGON ROBIN FLEMING Production Manager LINDA HOPLER Advertising ADVERTISE@MFGTALKRADIO.COM Editorial Office JACKET MEDIA CO. 75 LANE ROAD FAIRFIELD, NJ 07004 (973) 808-8300
5
26
PUBLISHER’S STATEMENT
by Jeanne-Marie Lowrie
6
27
MANUFACTURING OUTLOOK
ASIA OUTLOOK
Global Manufacturing Still Strong, Not Enough Chips
by Chris Anderson
28
8 COVER STORY: BREAKING THE FAILURE CYCLE TO DRIVE CONTINUOUS QUALITY IMPROVEMENT by Robin Fleming
MANUFACTURING TIDBITS
Insights from inside manufacturing in action
10 COVID: SPURS FOR FOOD MANUFACTURING FACILITIES by TR Cutler
29 GLOBAL PMI OUTLOOK by Norbert Ore
34 THE CREDIT MANAGER’S OUTLOOK by Dr. Chris Kuehl
38
FILMMAKERS ARE MANUFACTURERS
METALS OUTLOOK
by Jacob Kyle Young
16 MIAMI IS THE MOST IMMIGRANT-DENSE U.S. METRO AREA, WITH 42% OF THE CITY’S POPULATION BORN ABROAD by TR Cutler
18 CASS INDEX
Cass Transportation Systems
ISM MANUFACTURING REPORT ON BUSINESS PMI Hold Strong at 59.9%
© 2021 Jacket Media Co. No part of this publication may be reproduced or used in any form without the prior written permission of the publisher. Manufacturing Outlook is a registered trademark of Jacket Media Co.
EUROZONE OUTLOOK by Chris Anderson
12
20 Text “RADIO” to 66866 for comments, suggestions and ideas and guest requests for MFGTALKRADIO.COM podcast.
SOUTH AMERICA OUTLOOK
The Good News Isn’t All Bad
24 NORTH AMERICA OUTLOOK by Amelia Roy
Open call for...
Contributing Writers for new and existing content. Let’s start a conversation – Contact us at info@jacketmediaco.com or visit mfgtalkradio.com/writer for more information.
Nickel and Copper.
40 AEROSPACE OUTLOOK A Better Boeing??
42 ENERGY OUTLOOK Battery Man
44 AUTOMOTIVE OUTLOOK The Mustang’s New Guise
46 ISSUES OUTLOOK People and Productivity
PUBLISHERS STATEMENT Publisher’s Statement
The Good News Isn’t All Bad It is interesting that the good news manufacturing is experiencing in 2021 is sometimes bad for a podcast host and commentator (ManufacturingTalkRadio.com). Oddly, it is harder to talk about good news than bad news. With bad news, you can try to brighten it up, make it less depressing, or hunt for the silver lining. With good news, all those elements are there. So, what is the interviewer to do – hunt for the dark clouds on the horizon and make it depressing? Across the hundreds of podcasts I have done for Manufacturing Talk Radio on manufacturing, bad news has been easier to develop a conversation around. Fortunately, the same does not hold true for Manufacturing Outlook (manufacturingoutlook.com), where good news weaves through stories of new developments which raise the trajectory of industry success. That has never been more apparent than 2021, as both the Manufacturing and Services sectors lift themselves out of the pandemic. Many sectors in manufacturing we declared essential and kept operating; albeit, in a modified form with social distancing functions. Now, as manufacturing gets back to the business at hand, the suggested automation improvements have, like manufacturing itself, become essential. All across America, almost 6 million jobs remain unfilled. Government stimulus checks resulted in people staying home to collect them as long as possible including the folks who legitimately didn’t have a job, and not returning to the workforce. Some employees have also pondered their future, and many are making different career choices. Thus, employment, as manufacturers knew it before the pandemic, likely will not be the same ever again. Work from home will remain some portion of every employers workforce. Automation, robots, and cobots will become more commonplace throughout the industry, from source to store. A wave of new acronyms are being added to the old acronyms and flood the lexicon of manufacturing, such as AI, VR, AR, GSV, ARV, AGV, AMR, ALM, API, BPI, KPI, DFM, DFQ, ETO, HMI, HOP, and on and on. What once appeared to be a methodically plodding industry where evolution was decades long or decades away, has become the forefront of rapid change in the economy, almost every economy, anywhere in the world. Manufacturing has entered the leading edge of innovation, not just in what it makes, but how it is made, where it is made, when it is made, and who makes it. And, as a reaction to the pandemic, ‘who makes it’ has become a strategic subject. Offshoring has lost much of its luster, not just in lower labor rates and U.S. tariffs, but also in consumer appeal. The shifting impression is that if it is needed at home, it should be made at home, and manufacturers with long, diverse, and perhaps fragile supply chains will look harder at the true costs and benefits of the 20th Century global supply, not from just price and quality, but from perception, as well. In every adversity, there is opportunity, and nowhere is that becoming more apparent than in manufacturing, which is good news, even though it was borne out of bad news. Learn more in the articles in this issue of Manufacturing Outlook. n Have a Special Day Lewis A. Weiss, Publisher Contact laweiss@mfgtalkradio.com or text “RADIO” to 66866 for comments, suggestions and ideas and guest requests for MFGTALKRADIO.COM podcast. FOLLOW US:
Manufacturing Outlook / August 2021
5
MANUFACTURING OUTLOOK
AUGUST 2021
MANUFACTURING OUTLOOK GLOBAL MANUFACTURING STILL STRONG. SUPPLY CHAINS STILL A MAJOR ISSUE; RAW MATERIALS STILL SCARCE AND EXPENSIVE. STEEL PRICES RELENTLESS. INFLATIONARY PRESSURES WORSENING. U.S. AND OTHERS SEEING A SERIOUS MANUFACTURING LABOR SHORTAGE. NOT ENOUGH CHIPS. by ROYCE LOWE The ISM PMI figure for U.S. manufacturing continued in record territory for 59.5 in July, (50.0 = expansion) compared to 60.6 in June. The overall economy continued with the fourteenth month of expansion. The Bureau of Economic Analysis says the Real Gross Domestic Product increased at an annual rate of 6.5 percent in the second quarter of 2021, according to the Bureau’s “advance” estimate. The real GDP increase in the first quarter of 2021 was 6.3 percent. IHS Markit’s remarks on U.S. manufacturing for July show their PMI figure at 63.4 up from June’s 62.1. IHS states that July saw sharper expansions in production, new orders and employment. There were heavy cost pressures due to record shortages and efforts to build stocks. Backlogs increased at a near-record pace.
There were unprecedented supplier shortages and delivery delays, leading to upward pressure on input costs and hindering firms’ ability to process incoming new work. The cost burdens were up at a recordbreaking rate and backlog accumulation accelerated. July saw an unprecedented deterioration in supplier performance stemming from transportation issues and severe raw material shortages. Workforce numbers expanded at the strongest pace for three months, but some firms continued to note difficulties filling skill gaps. Confidence regarding the coming year is still high.
July saw the most substantial improvement in operating conditions across the U.S. manufacturing sector on record. There were stronger expansions in production and new orders, with the latter increasing at the secondfastest pace since data collection began in May 2007. continued
6
Manufacturing Outlook / August 2021
MANUFACTURING OUTLOOK The U.S. Senate voted to put through a bipartisan $1.2 trillion infrastructure agreement. This would add some $550 billion in spending over eight years in addition to other projected infrastructure investments. There would be $110 billion for roads and bridges and other similar projects, $73 billion for electric grid, $65 billion for universal broadband access, $55 billion for clean drinking water, $42 billion for ports and airports, and $7.5 billion for a national network of charging stations for electric vehicles. The bill’s passage is very good news for the U.S. steel and cement industries. GLOBAL CRUDE STEEL PRODUCTION WAS UP BY 11.6 PERCENT YEAR-OVER-YEAR IN THE MONTH OF JUNE for the 64 reporting countries – which represent 99 percent of world crude steel production – to 167.9 million tons (MT). U.S. crude steel production for June was 7.1 MT, up 44.4 percent year-over-year. For January through June, the U.S. produced 42.0 MT, up 15.5 percent yearover-year. In the January through June period, China produced 563.3 MT, up 11.8 percent year-over-year; India 57.9 MT, up 31.3 percent; Japan 48.1 MT, up 13.8 percent; Russia 38.2 MT, up 8.5 percent; South Korea 35.2 MT, up 8.3 percent; Germany 20.6 MT, up 18.1 percent, and Brazil 18.1 MT, up 24.0 percent. The EU (27 countries) produced 77.8 MT, up 18.4 percent. Primary Global Aluminum Production in June was reported at 5.549 million tons, with production in China at 3.245 million tons, representing 58 percent of world total. Production was 472,000 tons in GCC; 370,000 tons in the rest of Asia; 270,000 tons in Western Europe; 318,000 tons in North America and 340,000 tons in Eastern and Central Europe. The JP MORGAN GLOBAL MANUFACTURING PMI – a composite index produced by JPMorgan and IHS Markit in association with ISM and IFPSM (International Federation of Purchasing and Supply Management) – was nearly identical month-to-month, with 55.5 in June and 55.4 in July. These numbers represent expansion in the manufacturing industry.
input costs. There was easing in both production and new orders. Confidence fell to a nine-month low. There were raw material shortages, logistic issues and shipping delays. Backlogs of work were up, thus further jobs growth, but some markets reported skill and labor shortages developing. THE ECONOMIST magazine, in its latest weekly report on world economies, highlights changes in Gross Domestic Product (GDP), Consumer Prices, and Unemployment Rates for what it considers the world’s major economies. These data are not necessarily good to the present day, but are mostly applicable to at latest the past two months, and show definite trends in the world economy. The figures are qualified as being the latest available, and with reference to a given quarter or month. The figures for GDP represent the % change on the previous quarter, or annual rate. The consumer price increases represent year-over-year changes. The unemployment figures, %, are for the month as noted. n
Author profile: Royce Lowe, Manufacturing Talk Radio, UK and EU International Correspondent, Contributing Writer, Manufacturing Outlook.
Supply chain constraints hindered the growth of the global manufacturing sector in July and led to increased Manufacturing Outlook / August 2021
7
COVER STORY
Breaking the Failure Cycle to Drive Continuous Quality Improvement by ROBIN FLEMING Industry 4.0 is upon us, and companies are at a pivotal moment as more industry leaders lean into these digital solutions. Over the past year, 85% of global industry executives have invested in Connected Worker solutions, a trend that will only continue to experience future growth. However, despite these investments, less than half of manufacturing companies have deployed digital, wearable, mobile, or sensor technologies in their operations that their frontline workers will and want to use. While companies can reap countless benefits by leveraging digital solutions, these investments must be made with frontline workers in mind. Far too often, companies implement technology that is not designed for frontline workers, causing a fracture in the continuous improvement process and losing out on opportunities to improve quality. Since nearly 60% of the workforce is disengaged with their work, it’s never been more critical for manufacturing leadership to explore digital solutions that frontline workers and supervisors will actually use. Implementing these solutions allow frontline workers to become quality leaders themselves, driving improvements in quality and process compliance in addition to worker engagement.
The Problem Frontline workers tend to abandon overly cumbersome technology, which then bypasses data collection. The most critical step in continuous learning and improvement. Without engaging Connected Worker platforms, the opportunity for data collection and capturing quality defects is lost at the point that matters most. As a result, there is no way for frontline workers to identify and report compliance issues, or for management to give instant feedback and in-the-moment guidance, resulting in data collection and synthesis delays. Aside from unreliable data due to unused processes and tools, disengaged workers may also go through the motions of “pencil whipping” and provide only the minimum data required, if that. Others may use technology that often digitizes paper forms, but the data still remains hidden and makes it harder for supervisors to get the data when needed. No matter what, a static form, even if it’s electronic, can’t provide the necessary insight. Without the opportunity for immediate validation or situational prompts, a communication breakdown occurs between frontline workers and managers. When this happens, the continuous improvement cycle fails: at the point where work occurs. continued
8
Manufacturing Outlook / August 2021
COVER STORY The Solution Leaders must adopt strategies and tools that engage the end-user with technology they will actually use to achieve successful continuous improvement and meet safety, quality, and operational goals. The right tools lead to increased engagement, which ultimately allows companies to unlock data and determine what’s happening on the factory floor in real-time. This includes identifying patterns and trends while also acting quickly on information to ensure process compliance and support supplier quality control. Using Connected Worker Solutions like Anvl, which routinely sees over 90% engagement and 100% of the required data captured, workers and supervisors become more of a team. The logicbased, data-driven workflows provide up-to-theminute data about processes, while workers can trigger alerts if they see something that needs immediate attention. This helps companies stop problems earlier and earlier, often preventing them in the first place. As a result, companies can propel their digital transformation to break the failure cycle and improve quality control. Conclusion Manufacturing companies have the opportunity to break the failure cycle. However, this can only be accomplished once organizations invest in
technology that empowers workers to capture data at the point that matters most. The right digital transformation solution can connect workers and supervisors to critical, incoming data in ways that help find new opportunities for continuous improvement each day. By adopting Industry 4.0 Connected Worker solutions, organizations can foster a safer, more dynamic work environment and, at the same time, produce a higher quality product. n About Robin Fleming Robin Fleming is an entrepreneur and leader focused on developing innovative software technology solutions. Having previously served in leadership roles for brands such as Angie’s List (now ANGI Home Services) and Match.com, Robin is now applying her expertise to workplace innovation for the millions of “deskless” workers with connective mobile solutions. In 2018, she co-founded Anvl, a software company creating connected teams by capturing real-time data to help businesses improve product quality, safety and productivity with innovative connective technology. Anvl won the 2020 Mira Innovation Award for Automated Offlinecapable hazard identification capabilities and was recognized as nominees and finalists in several other innovation awards.
Manufacturing Outlook / August 2021
9
MANUFACTURING TIDBITS
COVID:
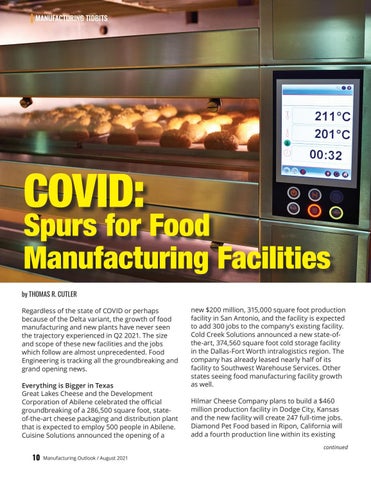
Spurs for Food Manufacturing Facilities by THOMAS R. CUTLER Regardless of the state of COVID or perhaps because of the Delta variant, the growth of food manufacturing and new plants have never seen the trajectory experienced in Q2 2021. The size and scope of these new facilities and the jobs which follow are almost unprecedented. Food Engineering is tracking all the groundbreaking and grand opening news. Everything is Bigger in Texas Great Lakes Cheese and the Development Corporation of Abilene celebrated the official groundbreaking of a 286,500 square foot, stateof-the-art cheese packaging and distribution plant that is expected to employ 500 people in Abilene. Cuisine Solutions announced the opening of a
new $200 million, 315,000 square foot production facility in San Antonio, and the facility is expected to add 300 jobs to the company’s existing facility. Cold Creek Solutions announced a new state-ofthe-art, 374,560 square foot cold storage facility in the Dallas-Fort Worth intralogistics region. The company has already leased nearly half of its facility to Southwest Warehouse Services. Other states seeing food manufacturing facility growth as well. Hilmar Cheese Company plans to build a $460 million production facility in Dodge City, Kansas and the new facility will create 247 full-time jobs. Diamond Pet Food based in Ripon, California will add a fourth production line within its existing continued
10
Manufacturing Outlook / August 2021
MANUFACTURING TIDBITS building, expanding production from 780 tons of kibble per day to 1,040 tons per day. New Food Plants 2022 and Beyond Monogram Foods started construction on a new 135,000 square foot production facility in Haverhill, Massachusetts. This is Monogram’s third Massachusetts location and will feature 109,000 square foot multi-temperature warehouse space plus a 26,000 square foot sandwich assembly area. The facility is expected to be completed by mid-2022. Frito-Lay is investing $235 million to expand its manufacturing site in Killingly, Connecticut, creating 120 jobs. Beginning in 2022, the project is expected to be complete in 2024. House Foods America plans to build a tofu production plant in Louisville, Kentucky which will create more than a hundred jobs. Work is expected to begin in 2022 and be completed by 2025.
Cereal Ingredients Inc. plans to build a new 80,000 square foot manufacturing facility in St. Joseph, Missouri. The $24 million facility is expected to open first quarter of 2022 with nearly 50 employees. n Author Profile:
Thomas R. Cutler is the President and CEO of Fort Lauderdale, Florida-based, TR Cutler, Inc., celebrating its 23rd year. Cutler is the founder of the Manufacturing Media Consortium including more than 8000 journalists, editors, and economists writing about trends in manufacturing, industry, material handling, and process improvement. TR Cutler, Inc. recently launched two new divisions focusing on Gen Z and the increasing role of Africa in the manufacturing sector. Cutler authors more than 1000 feature articles annually regarding the manufacturing sector. Nearly 5000 industry leaders follow Cutler on Twitter daily at @ThomasRCutler. Contact Cutler at trcutler@trcutlerinc.com.
Manufacturing Outlook / August 2021
11
MANUFACTURING TIDBITS
FILMMAKERS ARE MANUFACTURERS 12
by JACOB KYLE YOUNG
Manufacturing Outlook / August 2021
MANUFACTURING TIDBITS A great indicator of recognizing filmmakers as manufacturers is the new division of the Manufacturing Media Consortium specifically focusing on the critical role of the entertainment industry. Thomas R. Cutler, the founder of the new division and frequent contributor to Manufacturing Outlook suggested, “While filmmaking has rarely been expressed in industrial terminology, it is in fact one of the most progressive sectors devising new tools, equipment, and innovative technologies. The new division is designed to profile and honor accomplished manufacturing professionals.”
Though there are many ways to cut costs, any business professional will agree to go with the options that bring down the budget the most. Just as dog is man’s best friend, here are three reasons why manufacturers have become the same for a filmmaker by saving money and time for every type of production.
Jacob Kyle Young (left) founder of Post Modern Entertainment and Thomas R. Cutler (right) founder of the Entertainment Manufacturing Division of the Manufacturing Media Consortium
Filmmaking is manufacturing. To date, no one has made the direct correlation between the two. As many entertainment professionals know, the budget gap between indie productions and big studio blockbusters continues to grow. The day of mid-budget, independent (indie) movies is disappearing as fast as the middle class in the American economy. According to newbiefilmschool, the average budget is barely at $2 million for these pictures and producers have been forced to adapt by discovering creative ways to decrease costs, while maintaining a high production values for a sophisticated audience with high expectations.
Film Equipment Manufacturers No longer may a film lack quality in picture, sound, and bad acting. Once acceptable, these older movies were produced with the technology and film equipment constraints from limited funding. Film equipment manufacturers of cameras, sound equipment, and computers are producing gear that costs less to achieve high production values. Film equipment companies face increasing competition, which has driven down the purchase price. Better equipment with significant technology improvements has reframed the indie film industry with high-level sound and image capture quality. The transition of cameras from film to digital was a notable shift for manufacturers. Many industryinsiders believe that digital is free, and film is expensive, but there is more to that manufacturing construct. Digital cameras, when compared to film cameras in the same market price bracket, are much more expensive than analog counterparts. It is true that film costs money and is single-use. continued Manufacturing Outlook / August 2021
13
MANUFACTURING TIDBITS
Digital memory cards are relatively expensive and can be reused. Film also needs to be developed and there is a cost associated with that production cost. There are other ways in which digital modalities save filmmakers. Automation Across all industries, efficiency always wins. Innovative manufacturers have developed machines to make numerous jobs easier for everyone. Machines have been assisting filmmakers since the invention of the camera. AI (artificial intelligence) is poised to change film even more and continues to augment human creativity. Storytellers work with computers during every process of creating a motion picture which has sped up the time it takes to complete each step in film making. Automating pre-production processes, such as creating a budget and writing a script, is analogous
to ERP (enterprise resource planning) software for a traditional manufacturing operation. The Movie Magic budgeting software by Entertainment Partners has made creating a budget more efficient and accurate. Screenwriter programs vary from the downloadable Final Draft to the purely cloud based, Celtx, and are the reasons automated scriptwriting is the norm. These programs also automatically format writing to industry standards, facilitating the creative process. Automation in post-production is equally advanced through editing software for video, sound, effects, and colors all the way to distribution and promotional content. Editing footage from digital rather than film saves time and money. Industry favorites include Adobe Premiere Pro and Apple’s exclusive Final Cut Pro that are used on almost all well-known movies and TV shows. continued
14
Manufacturing Outlook / August 2021
MANUFACTURING TIDBITS The Impacts of COVID-19 on Entertainment Manufacturers Without question, the pandemic has affected every industry by creating an unanticipated production standstill. Entertainment manufacturers have sacrificed countless productions, lost billions of dollars, and major talent agencies have furloughed hundreds of employees. This negative impact is not just difficult for indie filmmakers; big studios are suffering just as much with production delays and cancellations still happening as this article goes to press. A new necessity for productions to safely reopen includes epidemiologists and other public health specialists. They provide detailed strategies dealing with large crews who work in cramped spaces, makeup artists who get face-to-face with actors who kiss, hug, and fight on set. These COVID-19 consultants rely on the manufacturing industry for PPE supplies and carry out regular PCR tests. Face coverings and hand sanitizing stations are now commonplace, just like most other manufacturing operations.
Filmmakers are Manufacturers In the final analysis, filmmakers are producing a product that is consumable through the viewers eyes and ears. The production line isn’t much different than a manufacturer except the product is predominantly digital versus physical, although vast numbers of hours are used to make the sets, record the ‘action’ and produce the sound effects and music that goes into any production. n Author Profile Jacob Kyle Young is the founder of Post Modern Entertainment – a full service production company. The company has a diverse slate of projects, one recently released is the Amazon Prime feature film, Dead Voices. Young has over thirty roles listed on the IMDb and currently has a recurring role on Fear the Walking Dead season seven. He is in pre-production for another feature film he wrote and will star. Email Jacob at jacob@ jacobkyleyoung.com.
‘MADE IN NEW JERSEY’ MANUFACTURING DAY 2021 OCTOBER 1 | THE MARIGOLD | SOMERSET NJ | 8AM - 3PM After a virtual year in 2020, MFG Day 2021 is back in-person with an additional virtual element. Whether you want to attend in-person or follow along online, there’s an option for you.
Attendees will experience... • KEYNOTE SPEECHES BY INDUSTRY LEADERS • INFORMATIVE INDUSTRY-FOCUSED BREAKOUT SESSIONS
REGISTRATION OPEN! NJMEP.ORG/MFGDAY21
• SPONSORED COCKTAIL HOUR • AN EXQUISITE BREAKFAST BUFFET AND LUNCH • NETWORKING WITH HUNDREDS OF MANUFACTURING PROFESSIONALS
973.998.9801 | WWW.NJMEP.ORG | INFO@NJMEP.ORG
Manufacturing Outlook / August 2021
15
MANUFACTURING TIDBITS
MIAMI IS THE MOST IMMIGRANT-DENSE U.S. METRO AREA, WITH 42% OF THE CITY’S POPULATION BORN ABROAD by TR CUTLER
Recently the New American Economy (NAE), a bipartisan immigration research and advocacy organization, launched Map the Impact, an interactive map and report that quantifies immigrant economic contributions to America’s 100 largest metropolitan areas.
Key Findings for Metro Miami Include: There are 2,570,043 immigrant residents in the Miami metro area, which represents 41.7% of the population. Their household income totals $79.8 billion.
NAE’s new report finds that Miami is the most immigrant-dense metro area in the U.S., with almost 42% of the city’s population born abroad. The report also shows that immigrants are truly driving economic growth – in the Miami metro area, there are 247,795 immigrant entrepreneurs. Immigrants are also major consumers who help power Miami’s businesses; in 2019, Miami immigrants held $60.6 billion in spending power and paid $19.1 billion in taxes.
Immigrants are significant contributors to the Miami metro area housing market. In 2019, there were 571,992 immigrant homeowners. Immigrants are critical job creators. In the Miami metro area, immigrants are almost 38 percent more likely to be entrepreneurs when compared to U.S.-born residents, and in 2019, there were 247,795 immigrant entrepreneurs.
San Jose follows closely in second place with more than 40 percent of the population being immigrants, followed by Los Angeles with 33 percent, San Francisco with almost 31 percent, and New York City with almost 30 percent.
Immigrants work in crucial industries. In the Miami metro area, the industries with the highest share of foreign-born workers are: Agriculture, Forestry, Fishing & Hunting (76%); General Services (63.5%); Construction (61.8%); Transportation & Warehousing (59.6%); Manufacturing (58.2%). continued
16
Manufacturing Outlook / August 2021
MANUFACTURING TIDBITS “Immigrants have always brought vitality and dynamism to American cities, and this new data shows the significant impact they have as entrepreneurs, workers, and taxpayers in communities across the country,” said Andrew Lim, Director of Quantitative Research at New American Economy. “Whether they live in large metro areas like Miami, New York and Los Angeles or newer immigrant destinations like Memphis, McAllen and Jackson, immigrants will clearly be essential to the recovery and longevity of our cities and suburban areas.” As communities across the country continue to recover from the COVID-19 pandemic and recession, this new data illustrates the many ways in which immigrants contribute to counties across every corner of the United States. At a time when there are millions of job openings, there is little doubt that hard-working tax-paying immigrants can be a huge part of the solution facing employers today. n
Author Profile: Thomas R. Cutler is the President and CEO of Fort Lauderdale, Florida-based, TR Cutler, Inc., celebrating its 23rd year. Cutler is the founder of the Manufacturing Media Consortium including more than 8000 journalists, editors, and economists writing about trends in manufacturing, industry, material handling, and process improvement. TR Cutler, Inc. recently launched two new divisions focusing on Gen Z and the increasing role of Africa in the manufacturing sector. Cutler authors more than 1000 feature articles annually regarding the manufacturing sector. Nearly 5000 industry leaders follow Cutler on Twitter daily at @ThomasRCutler. Contact Cutler at trcutler@trcutlerinc.com.
Manufacturing Outlook / August 2021
17
CASS INDEX OUTLOOK
CASS TRANSPORTATION INDEX REPORT
by CASS INFORMATION SYSTEMS, INC.
Cass Freight Index - Shipments The shipments component of the Cass Freight Index® grew 15.6% y/y in July, decelerated from the 26.8% y/y increase in June. On a seasonally adjusted (SA) basis, the shipments index declined by 3.1% m/m in July, after a 4.2% m/m drop in June. The two-year stacked change slowed from 4.2% in June to 0.5% in July. The short-term skid is consistent with recent slowdowns in rail and LTL volumes, much of which is attributable to equipment and driver capacity constraints. Shipment volumes remain limited to no small extent by the capacity of the freight network, as the 121 containerships anchored off North American ports on August 10th attest to. Equipment. A chassis shortage has impacted intermodal capacity; trailer shortages have hit TL and LTL; and constraints on Class 8 tractor supply chains are impacting all of these modes, which comprise the vast majority of the Cass shipments index.
18
Manufacturing Outlook / August 2021
Drivers. Though the BLS trucking employment data continued to improve in July and the ACT Research For-Hire Driver Availability Index showed improvement recently (see below), driver capacity is still tight. Better-paid drivers taking a bit more vacation were likely a factor in the volume slowdown as well. Fading federal stimulus was also likely a contributor, though the elevated U.S. savings rate and tight inventories mitigate this risk. The ACT Freight Forecast from ACT Research report forecasts the Cass Truckload Linehaul Index and the Cass shipments index through 2023. Freight Expenditures The expenditures component of the Cass Freight Index measures the total amount spent on freight. This index slowed from its fastest-ever increase on a y/y basis. After rising 56.4% y/y in June, the index slowed to 43.1% y/y growth in July. After a 9.4% month-to-month surge on an SA basis in June, July expenditures fell back 4.8% m/m as a result of both lower volumes and rates. continued
This CASS INDEX has been posted with the permission of Cass Information Systems, Inc.
CASS INDEX OUTLOOK On a two-year stacked basis, the Cass expenditures index was up 22.7% in July, almost entirely driven by higher rates. Tougher comparisons in the coming months will naturally slow these y/y increases further, but extraordinary growth rates will continue in the near-term, driven by increases in both shipment volumes and freight rates. Inferred Freight Rates A simple calculation of the Cass Freight Index data (expenditures divided by shipments) produces a data set of inferred freight rates that explains the overall movement in rates. The freight rates embedded in the two components of the Cass Freight Index were 23.8% higher y/y in July, slightly faster than the 23.4% y/y increase in June. Inferred rates fell 2.3% m/m on a seasonally adjusted basis in July, reversing a small part of the 12.3% m/m increase in June. Similar to two months ago, July’s data set had a higher-than-normal percentage of smaller, lower cost LTL. This mix shift pressed total embedded rates lower again in July, so the downtick is more likely due to mix than a change in the upward rate trend. Outside of mix shifts impacting the m/m data patterns, this data series shows broad and material increases in freight rates across modes. The data set is diversified among all modes, with truckload representing more than half of the dollars, followed by rail, LTL, parcel, and so on. Truckload Linehaul Index The Cass Truckload Linehaul Index® value of 147.2 in July fell 0.8% from 148.4 in June and decelerated to a 13.4% y/y increase from 14.5% in June. This was the second straight decline after eleven straight increases, but we would caution shippers not to get too excited and carriers not to worry too much, as this appears to be due to mix rather than a trend change. The length of haul rose considerably again this month, and rates tend to fall on a per mile basis as mileage lengthens, so this intramodal mix shift pressed down on the index a little. This shift in freight patterns is more symptomatic of the rail network stretched to capacity, which is resulting in more transloading of longer-haul import shipments from the West Coast ports to the Midwest via truck. By contrast, the public truckload carriers saw length of haul continue to decline in their recently reported Q2 results, and their rates, in revenue per mile, net fuel, showed a 17.6% y/y increase.
From our perspective, the mix-neutral truckload market rate increase was somewhere between this and the 13.6% y/y increase in the Cass Truckload Linehaul Index in Q2. The still-tight supply/demand balance will continue to buoy the trend of the Cass Truckload Linehaul Index, and when rail network fluidity recovers and truckload length of haul reverts, it will also put mix-related upward pressure on this index. But although truck, trailer, and chassis production are still limited by parts and labor shortages, capacity is beginning to return as drivers respond to higher pay and parts constraints begin to ease. These will gradually change the trajectory of truckload rates. Freight Expectations Class I railroad trends had a rough June and July, lagging seasonal trends due in part to worsening chassis shortages. ACT Research chassis production forecasts have been cut sharply as a specific tariff issue has sharply limited new chassis availability. Auto and truck production have been hit hard again by chip shortages, which do not seem likely to be fully resolved for quite some time. Normal seasonality would suggest high-singledigit growth in rail volumes in Q3, down from the 23% y/y increase in Q2, but momentum slowed over the past two months as network fluidity has suffered and chip shortages have worsened. If these issues persist, there is a risk of rail volumes slipping to y/y declines. Though the TL and LTL sectors aren’t subject to quite the same capacity constraints, this suggests a bit slower near-term freight volume outlook. With 121 containerships anchored off North American ports as of August 10th, the outlook for this peak season is clearly strong, but supply chains remain stretched. Freight demand fundamentals remain strong, based on a cash-flush U.S. consumer balance sheet, tight inventories, and an industrial sector struggling to grow into record orders with fiscal stimulus likely on the way. But the dynamics of tight supply and exceptionally strong demand which have characterized the past year or so will not last indefinitely, and several of the indicators we monitor are auguring new trajectories. In particular, though the truck driver market remains very tight and the recent early signs of momentum in hiring could be interrupted by new COVID-19 variants, there are increasing signs that drivers are starting to come back in greater numbers. The data from ACT Research’s monthly for-hire carrier survey suggest that although the market remains tight, the trend is changing. n Manufacturing Outlook / August 2021
19
ISM REPORT OUTLOOK
THE INSTITUTE FOR SUPPLY MANAGEMENT’S MANUFACTURING REPORT ON ® BUSINESS BREAKING NEWS
ISM PMI at 59.5% for July 2021 Released August 2nd
ISM PMI for the past 5 years
JULY 2021 59.5%
Expanding Contracting
20
Manufacturing Outlook / August 2021
ISM REPORT OUTLOOK INSTITUTE FOR SUPPLY MANAGEMENT®
Analysis by
reportonbusiness Economic activity in the manufacturing sector grew in July, with the overall economy notching a 14th consecutive month of growth, say the nation’s supply executives in the latest Manufacturing ISM® Report On Business®. The July Manufacturing PMI® registered 59.5 percent. The New Orders Index registered 64.9 percent, decreasing 1.1 percentage points from the June reading of 66 percent. The Production Index registered 58.4 percent, a decrease of 2.4 percentage points compared to the June reading of 60.8 percent. The Prices Index registered 85.7 percent, down 6.4 percentage points compared to the June figure of 92.1 percent, which was the index’s highest reading since July 1979 (93.1 percent). The Backlog of Orders Index registered 65 percent, 0.5 percentage point higher than the June reading of 64.5 percent. The Employment Index registered 52.9 percent, 3 percentage points higher compared to the June reading of 49.9 percent. Seventeen of 18 manufacturing industries reported growth in July, in the following order: Furniture & Related Products; Printing & Related Support Activities; Apparel, Leather & Allied Products; Miscellaneous Manufacturing‡; Computer & Electronic Products; Nonmetallic Mineral Products; Machinery; Fabricated Metal Products; Paper Products; Chemical Products; Food, Beverage & Tobacco Products; Primary Metals; Plastics & Rubber Products; Transportation Equipment; Electrical Equipment, Appliances & Components; Wood Products; and Petroleum & Coal Products. ISM ‡Miscellaneous Manufacturing (products such as medical equipment and supplies, jewelry, sporting goods, toys and office supplies).
12
ISMWORLD.ORG
Timothy R. Fiore, CPSM, C.P.M.
MANUFACTURING
Chair of the Institute for Supply Management® Manufacturing Business Survey Committee • Watch the video interview on Manufacturing Talk Radio https://jacketmediaco.com/episodes/episode-569-institute-forsupply-managements-report-on-business-series-for-july-2021/
PMI at 59.5% ®
PMI
Manufacturing grew in July, as the Manufacturing PMI® registered 59.5 percent. Four out of five subindexes that directly factor into the Manufacturing PMI® were in growth territory. All of the six biggest manufacturing industries expanded, in the following order: Computer & Electronic Products; Fabricated Metal Products; Chemical Products; Food, Beverage & Tobacco Products; Transportation Equipment; and Petroleum & Coal Products.
2019
2020
2021
59.5% Expanding Contracting
50% = Manufacturing Economy Breakeven Line 43.1% = Overall Economy Breakeven Line
Manufacturing at a Glance Jul Index
INDEX
Jun Index
% Point Change
Direction
Rate of Change
Trend* (months)
Manufacturing PMI®
59.5
60.6
-1.1
Growing
Slower
14
New Orders
64.9
66.0
-1.1
Growing
Slower
14
Production
58.4
60.8
-2.4
Growing
Slower
14
Employment
52.9
49.9
+3.0
Growing
From Contracting
1
Supplier Deliveries
72.5
75.1
-2.6
Slowing
Slower
65
Inventories
48.9
51.1
-2.2
Contracting
From Growing
1
Customers’ Inventories
25.0
30.8
-5.8
Too Low
Faster
58
Prices
85.7
92.1
-6.4
Increasing
Slower
14
Backlog of Orders
65.0
64.5
+0.5
Growing
Faster
13
New Export Orders
55.7
56.2
-0.5
Growing
Slower
13
Imports
53.7
61.0
-7.3
Growing
Slower
13
Overall Economy
Growing
Slower
14
Manufacturing Sector
Growing
Slower
14
*Number of months moving in current direction. Manufacturing ISM® Report On Business® data is seasonally adjusted for the New Orders, Production, Employment and Inventories indexes.
Commodities Reported
Note: The number of consecutive months the commodity is listed is indicated after each item.
Commodities Up in Price: Adhesives; Aluminum (14); Aluminum Products (4); Ammonia; Cable & Harnesses; Capacitors; Caustic Soda (2); Coatings (4); Copper (14); Corrugate (10); Corrugated Packaging (9); Crude Oil (2); Diesel Fuel (7); Electrical Components (8); Electrical Motors; Electronic Components (8); Ethylene; Freight (9); High-Density Polyethylene (HDPE) (7); Hydraulic Components; Labor — Temporary (3); Lumber* (13); Medium-Density Fiberboard (MDF); Natural Gas; Ocean Freight (8); Packaging Film; Packaging Supplies (8); Pallets; Paper Products; Phosphates; Plastic Resins (11); Polyethylene (6); Polyols; Polypropylene (13); Polyvinyl Chloride (PVC) Products (2); Printed Circuit Board Assemblies (PCBAs); Propylene; Resin-Based Products (6); Resins; Resistors; Semiconductors (6); Shipping Containers; Solvents; Steel (12); Steel — Carbon (8); Steel — Hot Rolled (11); Steel — Scrap (3); Steel — Stainless (9); Steel Products (11); Steel Wire; Sulfuric Acid; Totes; Wood (2); and Wood Products (2).
Note: To view the full list, visit the ISM website at ismworld.org.
Manufacturing Outlook / August 2021
continued
21
ISM REPORT OUTLOOK
ISM Report On Business ®
®
Manufacturing PMI® New Orders (Manufacturing) 2019
July 2021 Analysis by Timothy R. Fiore, CPSM, C.P.M., Chair of the Institute for Supply Management ® Manufacturing Business Survey Committee
20
2020
New Orders
2021
ISM’s New Orders Index registered 64.9 percent. Of the 18 manufacturing industries, the 15 that reported growth in new orders in July — in the following order — are: Furniture & Related Products; Computer & Electronic Products; Printing & Related Support Activities; Machinery; Miscellaneous Manufacturing‡; Paper Products; Electrical Equipment, Appliances & Components; Chemical Products; Food, Beverage & Tobacco Products; Transportation Equipment; Fabricated Metal Products; Petroleum & Coal Products; Nonmetallic Mineral Products; Plastics & Rubber Products; and Primary Metals.
64.9%
52.8% = Census Bureau Mfg. Breakeven Line
Production (Manufacturing) 2019
2020
Production
2021
58.4%
70
52.1% = Federal Reserve Board Industrial Production Breakeven Line
The Production Index registered 58.4 percent. The 16 industries reporting growth in production during the month of July — listed in order — are: Printing & Related Support Activities; Chemical Products; Wood Products; Furniture & Related Products; Primary Metals; Miscellaneous Manufacturing‡; Petroleum & Coal Products; Computer & Electronic Products; Nonmetallic Mineral Products; Transportation Equipment; Paper Products; Electrical Equipment, Appliances & Components; Food, Beverage & Tobacco Products; Fabricated Metal Products; Machinery; and Plastics & Rubber Products.
Employment (Manufacturing) 2019
2020
Employment
2021
52.9% 50.6% = B.L.S. Mfg. Employment Breakeven Line
20
Supplier Deliveries (Manufacturing) 53.1% 2019
2020
2021
72.5%
80
Inventories (Manufacturing) 2019
2020
2021
48.9% 44.5% = B.E.A. Overall Mfg. Inventories Breakeven Line
‡Miscellaneous
Supplier Deliveries The delivery performance of suppliers to manufacturing organizations was slower in July, as the Supplier Deliveries Index registered 72.5 percent. All 18 industries reported slower supplier deliveries in July, in the following order: Apparel, Leather & Allied Products; Furniture & Related Products; Paper Products; Plastics & Rubber Products; Nonmetallic Mineral Products; Fabricated Metal Products; Computer & Electronic Products; Machinery; Miscellaneous Manufacturing‡; Printing & Related Support Activities; Food, Beverage & Tobacco Products; Transportation Equipment; Chemical Products; Textile Mills; Wood Products; Electrical Equipment, Appliances & Components; Primary Metals; and Petroleum & Coal Products.
Inventories The Inventories Index registered 48.9 percent. The 10 industries reporting higher inventories in July — in the following order — are: Apparel, Leather & Allied Products; Textile Mills; Furniture & Related Products; Printing & Related Support Activities; Nonmetallic Mineral Products; Fabricated Metal Products; Miscellaneous Manufacturing‡; Plastics & Rubber Products; Computer & Electronic Products; and Chemical Products.
Manufacturing (products such as medical equipment and
supplies, jewelry, sporting goods, toys and office supplies).
22
ISM’s Employment Index registered 52.9 percent. Of the 18 manufacturing industries, the 11 industries reporting employment growth in July — in the following order — are: Furniture & Related Products; Printing & Related Support Activities; Miscellaneous Manufacturing‡; Machinery; Nonmetallic Mineral Products; Computer & Electronic Products; Electrical Equipment, Appliances & Components; Fabricated Metal Products; Primary Metals; Transportation Equipment; and Food, Beverage & Tobacco Products.
Manufacturing Outlook / August 2021
continued
ISM REPORT OUTLOOK
ISM Report On Business ®
®
Manufacturing PMI®
July 2021 Analysis by Timothy R. Fiore, CPSM, C.P.M., Chair of the Institute for Supply Management ® Manufacturing Business Survey Committee
Customer Inventories (Manufacturing) 2019
2020
2021
25%
Customers’ Inventories ISM’s Customers’ Inventories Index registered 25 percent. The only industry reporting higher customers’ inventories in July is Apparel, Leather & Allied Products. The 15 industries reporting customers’ inventories as too low during July — listed in order — are: Petroleum & Coal Products; Primary Metals; Paper Products; Wood Products; Transportation Equipment; Fabricated Metal Products; Textile Mills; Computer & Electronic Products; Machinery; Miscellaneous Manufacturing‡; Plastics & Rubber Products; Electrical Equipment, Appliances & Components; Chemical Products; Furniture & Related Products; and Food, Beverage & Tobacco Products.
Prices (Manufacturing) 2019
2020
2021
85.7%
52.7% = B.L.S. Producer Prices Index for Intermediate Materials Breakeven Line
Backlog of Orders (Manufacturing) 2019
2020
2021
Prices The ISM Prices Index registered 85.7 percent. In July, all 18 industries reported paying increased prices for raw materials, in the following order: Apparel, Leather & Allied Products; Paper Products; Printing & Related Support Activities; Nonmetallic Mineral Products; Plastics & Rubber Products; Furniture & Related Products; Fabricated Metal Products; Miscellaneous Manufacturing‡; Petroleum & Coal Products; Electrical Equipment, Appliances & Components; Machinery; Primary Metals; Transportation Equipment; Computer & Electronic Products; Textile Mills; Chemical Products; Food, Beverage & Tobacco Products; and Wood Products.
Backlog of Orders
65%
ISM’s Backlog of Orders Index registered 65 percent. The 15 industries reporting growth in order backlogs in July, in the following order, are: Apparel, Leather & Allied Products; Furniture & Related Products; Plastics & Rubber Products; Paper Products; Computer & Electronic Products; Transportation Equipment; Machinery; Fabricated Metal Products; Textile Mills; Electrical Equipment, Appliances & Components; Miscellaneous Manufacturing‡; Nonmetallic Mineral Products; Chemical Products; Primary Metals; and Food, Beverage & Tobacco Products.
2021
New Export Orders
New Export Orders (Manufacturing) 2019
2020
55.7%
ISM’s New Export Orders Index registered 55.7 percent. The 11 industries reporting growth in new export orders in July — in the following order — are: Furniture & Related Products; Nonmetallic Mineral Products; Primary Metals; Miscellaneous Manufacturing‡; Paper Products; Transportation Equipment; Computer & Electronic Products; Machinery; Chemical Products; Fabricated Metal Products; and Food, Beverage & Tobacco Products.
Imports (Manufacturing) 2019
2020
2021
53.7%
‡Miscellaneous
Imports ISM’s Imports Index registered 53.7 percent. The seven industries reporting growth in imports in July — in the following order — are: Nonmetallic Mineral Products; Paper Products; Machinery; Computer & Electronic Products; Chemical Products; Transportation Equipment; and Food, Beverage & Tobacco Products. The three industries reporting a decrease in imports in July are: Furniture & Related Products; Fabricated Metal Products; and Electrical Equipment, Appliances & Components. n
Manufacturing (products such as medical equipment and
supplies, jewelry, sporting goods, toys and office supplies).
Manufacturing Outlook / August 2021
23
NORTH AMERICAN OUTLOOK
AUGUST 2021
NORTH AMERICAN OUTLOOK by AMELIA ROY
The Institute of Supply Management PMI figure showed continued expansion in near-record territory from 60.6 in June to 59.5 in July 2021. New orders, production, and employment are growing ; supplier deliveries are slowing at a slower rate; backlogs are growing; raw materials inventories are contracting; customer inventories are too low; prices are increasing, and exports and imports are growing. All of the six biggest manufacturing industries — Computer & Electronic Products; Fabricated Metal Products; Chemical Products; Food, Beverage & Tobacco Products; Transportation Equipment; and Petroleum & Coal Products, in that order — registered moderate to strong growth in July. Seventeen of 18 manufacturing industries reported growth in July, in the following order: Furniture & Related Products; Printing & Related Support Activities; Apparel, Leather & Allied Products; Miscellaneous Manufacturing; Computer & Electronic Products; Nonmetallic Mineral Products; Machinery; Fabricated Metal Products; Paper Products; Chemical Products; Food, Beverage & Tobacco Products; Primary Metals; Plastics & Rubber Products; Transportation Equipment; Electrical Equipment, Appliances & Components; Wood Products; and Petroleum
& Coal Products. The only industry reporting a decrease in July compared to June was Textile Mills. Comments from the industry stress the two major concerns of obtaining raw materials on time, and at a reasonable cost. A very important concern, however, is finding skilled labor. Even unskilled labor has resisted a return to work or accepting employment with stimulus checks in their bank accounts. This has slowed production output temporarily and is expected to abate when stimulus checks stop arriving but robots get delivered in greater numbers. The prophecy of machines replacing humans has been accelerated in manufacturing, in part as a reaction to Covid past and similar events in the future as long as the electric grid isn’t hit with a cyber attack. Car sales in the U.S. in the second quarter totaled 4,700,326 units; a 42.9 percent increase on 2020. U.S. brands, at 1.845 million units, were up 33.6 percent. Japanese brands, at 1.765 million units, were up 45.3 percent. Korean brands, at 626,000 units, were up 53.2 percent. European brands, at 463,000 units, were up 62.15 percent. However, microprocessor chips still remain in short supply to the automotive industry and some in-vehicle features may be absent on 2020 and 2021 models; perhaps 2022 models, as well. continued
24
Manufacturing Outlook / August 2021
NORTH AMERICAN OUTLOOK CANADA’s PMI remained strong at 56.5 in June and 56.2 in July, with a slight improvement in the supply situation. There was a near-record increase in backlogs and staff shortages. Selling price inflation increased to the second-sharpest in the PMI series history. Price increases may not abate, especially on raw materials and component parts from China where container costs have increased 10-fold over the last 24 months amid ship shortages. In ports, containers in Canada are not being unloaded at the 2019 pace due to labor shortages, so these units are not being returned to China. Similar conditions exist worldwide although container price increases have not been as dramatic, and port operations are in better shape. Demand improved in July, and with a rate of new order growth that was slightly quicker than that in June. Virus-related restrictions eased further across the regions allowing continued re-opening of businesses. Improvements in global economic conditions led to higher export sales, mainly to the U.S. and China. There were problems with port congestions, and increases in freight, steel, and
aluminum costs. There was optimism regarding prospects for production growth over the coming year. Light vehicle sales in Q2 in Canada were up 52 percent year-over-year to 478,717 units. Light trucks were up 53.5 percent to 380,682 units, and passenger cars up 45.5 percent to 98,035 units. Total light vehicle sales were up 3.9 percent in June to 162,501 but this was still down 12.4 percent from the pre-pandemic June 2019 total of 185,496 units. MEXICO saw slower declines in new orders, production, and employment in July. Input cost inflation hit a three-year high, and there were tentative signs of a recovery. The PMI value at 49.6 for July was up from June’s 48.8, and the highest value in the 17-month contraction sequence. Business optimism for the next twelve months is more optimistic, and the overall degree of confidence the strongest in 18 months. n Amelia Roy, Staff Writer
NEW EPISODES EVERY TUESDAY AT MFGTALKRADIO.COM
Manufacturing Outlook / August 2021
25
SOUTH AMERICAN OUTLOOK
GLOBAL OUTLOOK
SOUTH AMERICA by JEANNE-MARIE LOWRIE
South America simply cannot get a unified act togehter. Mercosur, the fractious trade bloc or Argentina, Brazil, Paraguay, Uruguay, and Venezuela is crippled by the weakness of Venezuela, and longtime rivalries, including that between Argentina and Brazil. Political machismo and language differences remains at the core of Mercosur’s failure to live up to its ambitions. Farming continues to destroy rainforests, which may lead to a Brazilian dust bowl but a global economic disaster. Trade deals between the UK, Australia, and potentially Brazil, may lead to accelerated forest clearing of the Amazon. However, unlike farmland recovery with improved crop techniques, the diversity and uniqueness of the Amazon cannot be recreated. Similar to the destruction of redwood forests in the Pacific Northwest that took thousands of years to grow, the Amazon encompasses both time and forest diversity. Nonetheless, the Brazilian government, desperate for economic growth – literally at any cost – is willing to play some kind of a balancing act with the Amazon, only converting a portion of it into poor farmland and only fair cattle grazing fields. What is a ‘portion’ – whatever it takes in the short term to try to become an economic powerhouse ; the long-run be damned. Ignored is that burned Amazon forest land has a very thin topsoil that cannot sustain crops in any rotation for human or cattle consumption. It only maintains the rainforest through a process of growth, seasonal changes that drop leaves to the forest floor, and decay that is drawn back up to
26
Manufacturing Outlook / August 2021
support the forest itself. Where the Great Plains in the U.S. can have two feet of topsoil, the Amazon has less than 6 inches. Any commercial use of the forest floor land is unsustainable, and once converted and depleted, the forest cannot be reestablished on it. This blind conversion of forest to commercial use will not result in any increased manufacturing, sustainable crops, or suscessful grasslands for cattle grazing. The only way it has been accomplished is by convert land which is abandoned in a few years for further penetration into the forest. South American countries lack the resources: human, financial, and technological, to burst out of their agrarian roots into industrial powerhouse countries. Only Brazil’s sheer size, with the greatest portion of the Amazon within its borders, shows some limited industrial interest. Brazil is rebuilding post-production inventories. Growth in production quickens with faster upturn in new orders. Stocks of purchases expand at record rates. Brazil is continuing with hiring efforts. The PMI for July was at 56.7, up from June’s 53.4. Most sales were domestic. There is still optimism for the year ahead that it will growth out of its Covid crisis, but it will still continue its wonton destruction of the Amazon in a self-destructive economic attempt that will create nothing out of something – at a Jeanne-Marie Lowrie, global cost to the world. n Staff Writer
ASIA OUTLOOK
GLOBAL OUTLOOK
ASIA OUTLOOK
by CHRIS ANDERSON
CHINA’s manufacturing sector saw a slower improvement in operating conditions in July, with production expanding at the slowest rate for 16 months, and overall new orders falling slightly for the first time since May 2020. There was a very slight increase in export sales. Inflationary pressures eased, but so did the PMI, from 51.3 in June to 50.3 in July. Supply chain delays continued in July, with average delivery times for inputs increasing significantly. There is still optimism for production for the next year, but also concerns regarding the global pandemic. The China Association of Automobile Manufacturers reports a 27 percent year-overyear increase in vehicle sales for the first half of 2021, but sales are still below pre-pandemic levels. Production and sales fell in June due to the global shortage of chips. Sales of SUVs, sedans and minivans from January to June were up to 10 million units. Total vehicle sales, including trucks and buses, were up 25.6 percent year-over-year to 12.9 million units. JAPAN’s PMI gained a little from 52.4 in June to 53.0 in July. Japan saw a stronger expansion in manufacturing in July, with production and new orders rising at faster rates. There was a sharp rise in cost burdens due to supply chain disruptions. There was softer optimism regarding future production. There were improved orders in key manufacturing industries, particularly automotive and semiconductors. New export orders increased at a slower pace, with external demand concentrated in key Asian economies, including Taiwan and Mainland China. Employment was up
for the fourth consecutive month, and backlogs of work increased. Inflation translated to increased selling prices. Japan continues to be in an age transition, where the over 35 age group is larger than the younger generations. As older Japanese retire or expire, the next generation is both insufficient in size to replace the lost workers, far less interested in manufacturing than their parents, and not interested in large families, preferring material posession and that lifestyle over children. Other Asian countries are in a similar bind and even incentives to rear a larger family are not bearing fruit. The Earth’s population globally is aging, birth rates are slowing, and several countries are entering or have seen more deaths than births over the last decade. INDIA saw its production increase through recovery in new orders, including renewed growth in new export orders. Employment was up for the first time in 16 months. There was a softer, but still sharp, increase in input costs. Raw material scarcity was a key factor causing longer supplier delivery times. Firms see production growth in the year ahead, but again there is concern regarding the pandemic variants. The PMI for July at 55.3 was up from June’s 48.1.
Chris Anderson, Staff Writer
Instability between India and China has the region on edge. Manufacturing does not like uncertainty, so between ChinaIndia skirmishes and virus variants, manufacturing strength remains delicate. n Manufacturing Outlook / August 2021
27
EUROZONE OUTLOOK
GLOBAL OUTLOOK
EUROZONE by CHRIS ANDERSON
IHS Markit’s Eurozone Manufacturing Composite Purchasing Managers’ Index (PMI), continued with expansion will above the 50 benchmark, with July at 62.8 from June’s record 63.4. Production and new orders growth rates slowed, but employment was up at a record pace. Inflation rates were at new highs, coincident with continuing supply chain disruptions. There were sharp expansions in consumer, intermediate and investment goods, with investment strongest, and consumer goods performing well. The rate of growth of new business was close to March’s survey record. New export orders were up at a sharp rate. There was a significant increase in backlogs of work at euro area goods producers. Response to this was additional staff at a rate unseen in 24 years of data collection. Job creation was particularly marked in Germany and Austria. There were material shortages and poor transport availability, pushing up manufacturing input prices at survey-record rates. Selling prices were
increased accordingly, as they have been for the past ten months. There was continuing optimism regarding the next twelve months. The UK PMI continued its above 50 expansion with 63.9 in June and 60.4 in July. Stretched supply chains and staff shortages were constraints preventing faster growth of output and employment. Production and new order growth were at four-month lows. Stretched supply chains led to sharp increases in costs. Growth slowed at consumer, intermediate and investment goods industries. July saw further increases in new export orders, particularly in the investment goods sector. Companies reported increased demand from the U.S., the EU, China, Russia and the Middle-East. Some noted that Brexit issues constrained exports to the EU. Raw materials and shortages of staff and skilled labor held back production growth. Price increases were noted in chemicals, commodities, cardboard, electronics, food stuffs, metals, packaging and timber products. Two-thirds of respondents are forecasting increased production in the coming year. The auto market in Western Europe, although improving, has still some way to go. The annual selling rate for the first half of 2021, at 11.0 million, is way below the 14.29 million vehicles sold in 2019. The rate for the month of June shows improvement, at 11.9 million. The UK’s rate was 2.0 million, Spain 904,000, France 1.8 million, Germany 2.9 million and Italy Chris Anderson, Staff Writer 1.6 million. n
28
Manufacturing Outlook / August 2021
GLOBAL PMI OUTLOOK
GLOBAL PMI OUTLOOK
Global Survey Insights Fri. Aug 6, 2021
by NORBERT ORE, DIRECTOR, HEAD OF INDUSTRIAL Strategas Securities, LLC SURVEYS, STRATEGAS RESEARCH(404) PARTNERS Norbert Ore 488-7380 Erica H. Comp, CBE
(646) 292-7951
nore@strategasrp.com ecomp@strategasrp.com
Norbert Ore, Director, Head Of Industrial Surveys, Strategas Research Partners
ACTIVITY RISING – EMPLOYMENT LAGS JULY 2021 BUSINESS SURVEY INSIGHTS Manufacturers continue to be challenged to meet their customer’s requirements in a volatile pricing environment. Our scatterplot shows 17 of the 18 surveys that we closely follow were expansionary in July. Seven PMIs experienced accelerating growth while the other 10 experienced decelerating growth. Notable strength came from globally diverse economies: Germany (65.9), Australia (60.8), Texas Mfg (59.2), and Brazil (56.7). Prices for inputs continue to rise at an inflationary rate. The Eurozone, the UK, Germany, and the U.S. are significant beneficiaries of the upsurge in global trade with record, or 20-year highs, dominating. The ISM U.S. Services PMI registered a new high at 64.1.
continued Manufacturing Outlook / August 2021
PLEASE DO NOT REDISTRIBUTE
29
GLOBAL PMI OUTLOOK
08/06/21
ACTIVITY RISING – EMPLOYMENT LAGS Global Manufacturing Summary
Emerging Markets
Developed Markets
Most Recent Data Americas Canada United States Europe Austria Denmark France Germany Ireland Italy Netherlands Norway Spain Switzerland United Kingdom Pacific Australia Japan New Zealand Singapore Americas Brazil Mexico Europe Czech Republic Greece Hungary Poland Russia Asia China (CLFP) China (Caixin) India Indonesia Korea Malaysia Philippines Taiwan (Markit) Thailand
Current Reading vs.
Period
Current Reading
Prior Reading
6 Mo Avg.
12 Mo Avg.
Jul-21 Jul-21
56.2 59.5
56.5 60.6
-0.5 -1.8
0.0 0.0
Jul-21 Jul-21 Jul-21 Jul-21 Jul-21 Jul-21 Jul-21 Jul-21 Jul-21 Jul-21 Jul-21
63.9 69.8 58.0 65.9 63.3 60.3 67.4 63.3 59.0 71.1 60.4
67.0 65.5 59.0 65.1 64.0 62.2 68.8 61.3 60.4 66.7 63.9
0.0 6.6 -0.4 1.1 3.1 -0.1 1.2 3.2 1.3 3.6 -0.4
5.6 13.2 3.4 5.2 7.0 3.5 7.1 7.3 4.9 10.0 2.5
Jul-21 Jul-21 Jun-21 Jul-21
60.8 53.0 60.7 51.0
63.2 52.4 58.6 50.8
-0.2 0.3 1.9 0.2
4.0 2.2 4.7 0.4
Jul-21 Jul-21
56.7 49.6
56.4 48.8
1.7 2.2
-2.3 4.6
Jul-21 Jul-21 Jul-21 Jul-21 Jul-21
62.0 57.4 55.6 57.6 47.5
62.7 58.6 55.0 59.4 49.2
2.0 2.4 3.2 1.6 -2.8
5.4 6.0 3.8 4.0 -2.1
Jul-21 Jul-21 Jul-21 Jul-21 Jul-21 Jul-21 Jul-21 Jul-21 Jul-21
50.4 50.3 55.3 40.1 53.0 40.1 50.4 59.7 48.7
50.9 51.3 48.1 53.5 53.9 39.9 50.8 57.6 49.5
-0.6 -0.9 1.6 -11.2 -1.3 -7.1 -0.4 -0.8 -0.1
-0.9 -1.9 0.3 -10.5 0.2 -7.9 0.2 1.2 -0.8 continued
30
Manufacturing Outlook / August 2021
PLEASE DO NOT REDISTRIBUTE
2
GLOBAL PMI OUTLOOK
08/06/21
ISM U.S. Manufacturing PMI™ Conditions are improving for U.S. manufacturing. The PMI has averaged 58.6 for the past 14 months, New Orders averaged 64.4, and Production posted 61.6 for the period. While there are still holes in supply chains that need to be plugged, the sector has done an extraordinary job of managing the production and logistics involved. Manufacturing should benefit from the improved situation in the Services sector as it begins a stronger path of recovery.
Drivers: While the July PMI (59.5, -1.1) is weaker than the June PMI (60.6, -0.6), this amounts to a minor deceleration in a strong expansion cycle. The July PMI received strong support from the New Orders Index (64.9, -1.1) and the Production Index (58.4, -2.4). July’s Employment Index (52.9, +3.0) took a positive bounce, but has averaged only 53.6 for the first seven months of the year. The remaining five months will require strong support from Employment as Supplier Deliveries peaked at 78.8 in May and settled at 72.5 in July and our expectation is that it will continue to lose momentum as supply chains continue to recover. New Orders Minus Inventories: This key relationship reversed a three-month measured improvement as it rose to 16.0 from 14.9, indicating the New Orders vs Inventories gap widened. Compared to the average gap (+7.2) since 2011, inventory availability continues to present challenges in returning to balanced inventory levels. Customers’ Inventories: The index (25.0, -5.8) for raw materials, components, and finished goods were “too low” for the 58th consecutive month. The index set a new low in July and has been under 40 percent for the past 12 months. Prices: The Manufacturing Prices Index established a new high in June at 92.1 and fell to 85.7 in July. Historically, longer lead-times as indicated by the Supplier Deliveries Index continued
Manufacturing Outlook / August 2021
PLEASE DO NOT REDISTRIBUTE
31
3
GLOBAL PMI OUTLOOK
08/06/21
support higher prices and buyers can expect the price issue challenge until many of the bottlenecks are resolved. 4/30/2021 60.7 64.3 62.5 55.1 75.0 46.5 17.8 28.4 89.6 68.2 54.9 52.3
ISM Mfg PMI (SA) New Orders (SA) Production (SA) Employment (SA) Supplier Deliveries (SA) Inventories (SA) New Orders - Inv Customers' Inventories (NSA) Prices (NSA) Backlogs (NSA) New Export Orders (NSA) Imports (NSA)
5/31/2021 61.2 67.0 58.5 50.9 78.8 50.8 16.2 28.0 88.0 70.6 55.4 54.0
6/30/2021 60.6 66.0 60.8 49.9 75.1 51.1 14.9 30.8 92.1 64.5 56.3 61.0
7/31/2021 59.5 64.9 58.4 52.9 72.5 48.9 16.0 25.0 85.7 65.0 55.7 53.7
A Quick Word on Capacity Fourteen industries are still operating below their pre-pandemic capacity utilization levels in the U.S., contributing to output limitations. Looking at the relative importance, these fourteen groups comprise ~66% of industrial production. % of Capacity Apparel and Leather Goods Capacity Util: Aerospace/Misc Transportation Eqpt Primary Metals Chemicals Computer and Electronic Products Machinery Miscellaneous Durable Goods Capacity Util: Electrical Eqpt, Appliances, and Components Sum Textiles and Products Wood Products Petroleum and Coal Products Food, Beverages, and Tobacco Electric and Gas Utilities Other Manufacturing Fabricated Metal Products Plastics and Rubber Products Capacity Util: Printing/Related Support Activities Furniture and Related Products Paper Nonmetallic Mineral Products Mining Motor Vehicles and Parts Sum
02/20 73.4 64.6 68.7 73.3 73.8 77.5 77.9 76.3
06/21 79.2 69.6 72.2 76.7 76.6 80.2 80.1 76.7
Chg 7.9% 7.7% 5.1% 4.7% 3.8% 3.5% 2.8% 0.6%
70.6 79.4 79.2 76.9 75.7 69.6 78.7 84.5 78.7 84.5 87.2 72.5 82.6 75.2
70.4 79.1 78.3 75.7 74.5 68.1 76.2 81.6 75.3 80.2 82.1 68.1 76.7 64.4
-0.3% -0.3% -1.1% -1.6% -1.6% -2.1% -3.2% -3.4% -4.4% -5.2% -5.8% -6.0% -7.2% -14.4%
Source: Federal Reserve
32
Manufacturing Outlook / August 2021
Relative Importance (Share %) 06/21 0.2 5.0 2.6 11.6 4.6 5.4 2.9 1.7 33.9 0.6 1.8 4.0 11.5 11.6 1.9 5.7 3.4 1.3 1.1 2.2 2.0 14.2 4.6 66.1 continued
PLEASE DO NOT REDISTRIBUTE
4
GLOBAL PMI OUTLOOK
08/06/21
ISM U.S. Services PMI™ (formerly ISM Non-Manufacturing PMI)
The ISM U.S. Services PMI (64.1, +4.0) gained momentum in July leaping ahead of the Manufacturing sector (59.5, -1.1). The historic average for the Services PMI is typically two percentage points greater than the Manufacturing PMI. This reverses our concern in the June report that the Services sector lacked the robustness required for strong economic growth. One interpretation would be that the sector is recovering, but is not replacing lost jobs at an equivalent rate to the expansion of services.
Drivers: In July, the Services PMI indicated a strong expansion driven by Business Activity (67.0. +6.6), New Orders (63.7, +1.6), and Supplier Deliveries (72.0, +3.5) Prices: The Prices Index (82.3, +2.8) reflected continuing pricing power favoring sellers as buyers continue to see inconsistent and extended deliveries. n ISM NMfg PMI (SA) Business Activity (SA) New Orders Employment (SA) Supplier Deliveries (SA) Prices (SA) Inventory Change (NSA) Inventory Sentiment (NSA) Backlogs (NSA) New Export Orders (NSA) Imports (NSA)
4/30/2021 62.7 62.7 63.2 58.8 66.1 76.8 49.1 46.8 55.7 58.6 55.7
5/31/2021 64.0 66.2 63.9 55.3 70.4 80.6 51.5 40.5 61.1 60.0 50.4
6/30/2021 60.1 60.4 62.1 49.3 68.5 79.5 49.9 37.2 65.8 50.7 58.2
7/31/2021 64.1 67.0 63.7 53.8 72.0 82.3 49.2 40.3 63.5 65.8 51.6
Manufacturing Outlook / August 2021
PLEASE DO NOT REDISTRIBUTE
33
5
CREDIT MANAGER’S OUTLOOK
CREDIT MANAGERS’ OUTLOOK by DR. CHRISTOPHER KUEHL MANAGING DIRECTOR OF ARMADA CORPORATE INTELLIGENCE THIS REPORT REPRINTED COURTESY OF THE NATIONAL ASSOCIATION OF CREDIT MANAGERS (NACM.ORG) WHERE MORE IN-DEPTH INFORMATION CAN BE FOUND.
Combined Sectors Can we all agree on one thing these days – this has been one crazy and unpredictable year and it has come on top of an even crazier and unpredictable 2020. These last two years will be nearly impossible to compare to much of anything as one featured a catastrophic recession that rivals that of the 1930s and now this year, we are seeing unprecedented growth numbers (9.3% in the second quarter). The estimate thus far is that this unusual spike in demand will start to calm down by the end of the year and that promises to usher in a somewhat more normal and predictable 2022. The pattern that tends to make the credit managers nervous is that more businesses tend to fail during the recovery from a recession than fail during the recession itself. The reason for this is that many businesses face a real dilemma in terms of reacting to the growth. Option one is to try to meet the surge in demand by expanding capacity, buying new machines and adding inventory and hiring more people. They do not want to leave money on the table or lose market share to a competitor and that leads them to ask for more and more credit to get production levels up. Option two is to limit this investment and anticipate a return to normal levels of business. That means they disappoint customers and see competitors erode their market share. If the ones that expanded guessed right, they will see higher revenue and profits but if they guess wrong, they are saddled with too much inventory, machines underutilized and workers they need to now lay off while the cautious ones saved all that expense and are poised to handle the market post-crisis. The credit manager gets stuck trying to figure out which direction their client and customers are headed.
After a couple of months of decline (but still firmly in expansion territory) the CMI drifted back up again. The combined score climbed from 57.5 to 58.4. That is still short of where it was the month prior but heading back in the right direction. The index of favorable factors also climbed back to previous heights with a reading of 67.0 as compared to 64.8 last month. These readings are back to levels seen in March and April. The index of unfavorable factors remained stable at 52.7 and that is certainly better than sinking. The details were also instructive. The sales numbers jumped back into the 70s with a reading of 73.3 and that is very close to the high of 74.7 noted in April. The new credit applications numbers also leaped back to 69.8 after falling to 63.1 last month. This is the highest reading seen yet and signals there is a lot of credit activity planned as the recovery continues. The dollar collections data also improved but not quite as dramatically with a reading of 63.8 as compared to last month’s 61.1. The amount of credit extended data showed a pretty substantial drop however – from last month’s 67.4 to 61.1. Granted this category is still in the 60s but this was a surprise to a degree and seems to suggest that credit managers are being a bit more cautious. The rejections of credit applications did not change much at all as it moved from 52.3 to 52.2. Given the jump in credit applications it is good news that the numbers of rejections remained stable. The accounts placed for collection slipped a bit from 53.2 to 52.0 but this shift is not alarming at this stage. This category has been pretty stable for months with only minor fluctuations. The disputes category slipped under 50 with a reading continued
34
Manufacturing Outlook / August 2021
CREDIT MANAGER’S OUTLOOK
of 49.4 as compared to the 50.4 notched last year. Last month it was noted that when there was an increase in slow pays there is usually an increase in disputes as well and that seems to have been the case with this month’s data. The dollar amount beyond terms data recovered a little from last month and escaped the contraction zone as
disputes fell back in. The reading was 49.5 in June and is now at 52.4. The dollar amount of customer deductions stayed stable with a reading of 52.2 as compared to 52.6 last month. The filings for bankruptcies also remained very stable with a reading this month of 58.2 in contrast to 58.3 in June. continued Manufacturing Outlook / August 2021
35
CREDIT MANAGER’S OUTLOOK Manufacturing Sector The manufacturing sector has been in more turmoil than would have been expected during such a dramatic growth period. It has been a classic tale of too much good piled on too much bad. The good news is that demand has been spiking as consumers shake off the rust of the last year but the bad news is that this demand has overwhelmed the producers. This has led to shortages, bottlenecks and inflation and these issues have been accelerated by the renewed fears regarding the pandemic. Manufacturers were already anticipating a slump of some kind as consumer returned to spending on services and now shortages and collapsed supply chains add to the unease. The combined score this month improved a bit from 57.2 to 58.1 and there was a solid improvement as far as the favorable factors as well. The reading last month was 64.5 and this month it went back towards the higher numbers seen earlier in the year with a reading of 66.6. The index of unfavorable factors remained very steady with a reading of 53.5 compared to 53.4 in June. The sales data returned to the numbers that had been seen earlier in the year with a reading of 74.7
(June was at 68.2 and May at 71.3). The new credit applications jumped into the 70s for the first time as well and that bodes very well for future activity (but also some concern on whether there is too much asking for credit). The dollar collections numbers also improved from 62.5 to 65.5 and that is a good sign as far as rebound is concerned. The amount of credit extended slipped quite a bit from 67.3 to 54.3 and this signals that even as companies are asking for a lot of credit there is some trepidation on the part of credit managers. The rejections of credit applications stayed very stable so there still seems to be willingness to extend credit but perhaps not in the amounts that have been requested. The accounts placed for collection fell slightly but not to emergency levels as they slipped from 53.4 to 51.6 and still in expansion territory. The disputes numbers have become a bit more worrisome as they have now been in contraction territory for two months – last month at 48.7 and this month even lower at 47.3. The dollar amount beyond terms numbers returned to the expansion zone with a reading of 54.2 compared to the 48.5 notched last month. The dollar amount of customer deductions slipped dangerously close to contraction with a reading of 50.6 contrasted with the 52.4 noted last month. The filings for bankruptcies data remained very stable with a reading of 57.5 after June’s 57.8. continued
36
Manufacturing Outlook / August 2021
CREDIT MANAGER’S OUTLOOK
Author profile Dr. Christopher Kuehl (PhD) is a Managing Director of Armada Corporate Intelligence and one of the co-founders of the company in 1999. He has been Armada’s economic analyst and has worked with a wide variety of private clients and professional associations in the last ten years. He is the Chief Economist for the National Association for Credit Management and is on the Board of Advisors for their global division – Finance, Credit and International Business. He prepares NACM’s monthly Credit Managers Index. He is the Economic Analyst for the Fabricators and Manufacturers Association and writes their bi-weekly publication, Fabrinomics, which details the impact of economic trends on the manufacturer. Chris is the chief editor for the Business Intelligence Briefs, distributed all over the world by business organizations and he is one of the primary writers (with Keith Prather) for the Executive Intelligence Briefs. He also makes close to a hundred presentations each year to business and industry associations in the US and overseas. He is on the Board of the Business Information Industry Association in Hong Kong and serves as a resource for the media and for many trade publications. n
Manufacturing Outlook / August 2021
37
METALS OUTLOOK
AUGUST 2021
METALS OUTLOOK
by ROYCE LOWE
NICKEL AND COPPER. BHP is an Anglo-Australian resources company, whose business is the extraction and processing of minerals and oil and gas, primarily in Australia and the Americas. It is often referred to as the world’s biggest miner. BHP recently reached a deal with Tesla to supply nickel - a metal used in the production of high-powered batteries for electric vehicles. At present, some 70 percent of nickel production is destined for the manufacture of 300 series stainless steels. Tesla will lock in supplies from a mine in Western Australia, one of the world’s largest sources. The demand for nickel is projected to explode over the next decade, along with the projected growth of electric vehicles. BHP is looking at a growth rate of 500 percent in demand over this time, in large part due to Tesla’s use of it in batteries.
38
BHP recently agreed to buy Noront Resources Ltd., to add a nickel project in Canada, beating out an Australian mining magnate, Andrew Forrest. The world’s biggest miner is pushing hard to get into metals that might benefit from the move to green energy. The company is tending more towards commodities of the future, is in the process of leaving behind the thermal coal business, and is considering getting out of oil and gas. It is putting greater emphasis on metals such as nickel and copper that are needed to support green energy. Noront’s main asset is the Eagle’s Nest nickel and copper deposit in Canada’s Ring of Fire region, not far south of Hudson’s Bay. Elon Musk had previously expressed concern regarding the possibility of future nickel shortages continued
Manufacturing Outlook / August 2021
METALS OUTLOOK in his production, and their adverse effects on the efficiency and storage capacity of batteries, in addition to making them more expensive to produce. Tesla recently signed a deal with the Goro nickel mine in New Caledonia, in which Tesla will be a partner, will have no stake, but will act as an industrial partner to help with the production and sustainability standards, as well as taking some supply for its own battery division. Tesla also has an agreement with the Swiss mining company Glencore for cobalt supply, another metal used in batteries. Copper, nickel’s next-door buddy in the periodic table, was the first metal worked by human beings. They hammered it into jewelry and ornaments some 11,000 years ago. Today the world goes through some 20 million tons of copper in a year, much of it in buildings and electrical infrastructure. Much more will be needed in coming decades, to meet the needs of lower-carbon economies. Copper is an essential part of batteries, motors and charging equipment. Solar and wind installations use more copper than
rocks nearer the surface to form copper sulphide. If things continue to go as they seem to be going, the future demand for nickel and copper will continue to rise. Steel’s relentless price rise continues, with hotrolled coil in the U.S. up by a further $130 per ton during the month of July to around $1875 per ton. A similar increase in cold-rolled coil saw its price at around $2100. The European price for hot-rolled saw a slight drop in July to 1165 euros per ton. S.E. Asian hot-rolled was falling slightly but recovered to $920 per ton. Prices in Canada followed the same pattern as in the U.S. Further, the gap in steel prices between Eastern and Western countries has reached an all-time high. Import volumes into the U.S. have been steadily rising throughout 2021, but not enough to keep up with the rapid growth in demand from many steel-consuming industries. Domestic availability is limited, with many buyers on allocation. As such, inventory levels throughout the supply chain remain depleted. This all adds up to the price increases we have been seeing. China is considering imposing more tariffs on steel exports as it looks to both cap domestic production and to keep prices from running out of sight. Potential rates being discussed range from 10 to 25 percent and products include hot-rolled coil, according to two people familiar with the matter. They asked not to be identified because they are not authorized to speak to the media. Officials are seeking to implement the levies in the third quarter, though they are still subject to final approval, one of the people said.
their fossil-fuel counterparts, and electric vehicles contain four times more copper than do cars with combustion engines. All this has prompted searches for new sources of the metal, most of which comes at the moment from open-cast mining, where rocks are ground and processed to produce the contained copper, which is around one percent of the mass of the rocks. An Oxford professor is even looking into the possibility of sucking the stuff from under volcanoes, where sulfur-rich gases combine with
Non-ferrous metal prices, in July, saw aluminum effectively unchanged at $1.13 per pound; copper up from $4.20 to $4.32; nickel up from $8.30 to $8.75 and zinc effectively unchanged at $1.35. n Author profile: Royce Lowe, Manufacturing Talk Radio, UK and EU International Correspondent, Contributing Writer, Manufacturing Outlook. Manufacturing Outlook / August 2021
39
AEROSPACE OUTLOOK
AUGUST 2021
AEROSPACE OUTLOOK
by ROYCE LOWE
A BETTER BOEING? Boeing just reported its first quarterly profit since 2019, reporting a profit of $587 million, compared to a loss of $2.4 billion in the same quarter last year. The company resumed deliveries of its 737 MAX aircraft. It also stated it will keep its workforce at 140,000 instead of cutting it to 130,000. Boeing will, however, temporarily reduce production of its 787 Dreamliner following identification of a new issue during inspections. The company said it is “reprioritizing production resources for a few weeks” after it “identified
additional rework that will be required on undelivered 787s.” Boeing has been working with the FAA on a system of 787 inspections following earlier production problems on the plane. The FAA described the problem as a “manufacturing quality issue near the nose on certain 787 Dreamliners in the company’s inventory of undelivered airplanes.” There is no immediate threat to flight safety, but Boeing has committed to fix these planes before resuming deliveries. Based on findings, the FAA will determine whether similar work should be carried out on 787s already in service. continued
40
Manufacturing Outlook / August 2021
AEROSPACE OUTLOOK Beijing needs the U.S. and Europe as much as the U.S. and the E.U. need the Chinese market. COMAC’s new single-aisle C919 jet, which is China’s best bet at competing against Boeing and Airbus in the near term, depends on components from more than a dozen foreign suppliers. It owes its engines to a joint venture between GE and France’s Safran, its landing gear to Germany’s Liebherr-Aerospace, and its flight-control systems to Honeywell. So for the time being, China is tied to suppliers from the U.S. and Europe to help build its planes. The U.S. and Europe want Beijing to limit government support for development of COMAC planes, but would also like to see Chinese Boeing says that new 787 deliveries are halted while it negotiates inspection methods. The company now expects to deliver fewer than half the hundred or so 787s in inventory this year. It is evident that the FAA is keeping a very close eye on Boeing, and particularly on its quality control and inspection methods. Following the criticism it received on the heels of the two fatal 737 MAX crashes, this extra tightness in procedures should do nothing but good for the future performance of the American aircraft industry. Meanwhile, the country with the world’s largest aircraft market, China, is looking to expand the fabrication aspect of its business. China’s state-owned COMAC, the Commercial Aircraft Corporation of China, took its first jet to market in 2015, a regional plane with 90 seats. In 2017, it tested a larger jet designed to rival the Boeing 737 and the Airbus 320, with delivery potentially at the end of 2021. Airbus’s CEO predicts that COMAC could be a “legitimate rival” by the end of this decade. China is the world’s most important aviation market, and Boeing predicted in 2020 that this market will drive global aircraft demand over the next 20 years. Boeing’s figures forecast 8,600 planes worth $1.4 trillion during that period.
state-owned carriers buy more American and European jets. China, in its turn, wants to take market share from those two companies, but it needs American and European parts to do it. It appears that the American, European and Chinese aircraft companies will be inter-dependent for quite some time to come. Meanwhile, a Chinese-Russian joint venture, CRIAC, (COMAC and RUSSIAN UNITED AIRCRAFT CORPORATION) is developing the CR929 double-aisle jet, a 250-320 seat aircraft with a fuselage made from composite materials. The aim is inter-continental flight and competition for Airbus and Boeing for that huge aircraft market. But no deliveries pre-2029 are forecast. Hot on the heels of Branson, Bezos just went up into space and back. Where’s the excitement anymore? A ticket for Branson’s Virgin will cost you a mere $250,000. n
Author profile: Royce Lowe, Manufacturing Talk Radio, UK and EU International Correspondent, Contributing Writer, Manufacturing Outlook. Manufacturing Outlook / August 2021
41
ENERGY OUTLOOK
AUGUST 2021
ENERGY OUTLOOK
by JOCELYN BRIGHT
BATTERY MAN CATL, the Chinese company that makes batteries for Tesla, keeps a low profile. It doesn’t shout its achievements from rooftops, and its founder, Zeng Yuqun, doesn’t like to give interviews. The company was founded in 2011 as Contemporary Amperex Technology Ltd, and in 2017 jumped from being the world’s third-largest battery maker to its biggest. It has since reached a market value of $200 billion, more than the second, third and fourth producers - South Korea’s LG Chem, Japan’s Panasonic, and China’s BYD - combined. CATL is about to move beyond the Chinese mainland, the world’s biggest EV market, where it accounts for about half of China’s lithium-ionbattery sales, to Europe, Indonesia and possibly America. It is more profitable than other global manufacturers, and its technology at least as good. CATL is coming out with a nw sodium-ion battery that can be mixed and matched with lithium-ion in the same system. Mr Zeng created the company in Ningde, a subtropical city in China’s Fujian province. In 1999, he founded Amperex Technology Ltd (ATL), a maker of lithium-ion batteries for portable devices, which he sold to Japan’s TDK, in 2005. He counted Apple among his bigger clients.
The company later availed itself of subsidies offered in China to favor domestically produced batteries for electric cars and buses, giving it an advantage over South Korea’s LG and Samsung. BYD, China’s other major battery producer, makes cars as well as batteries, and as such, rivals carmakers in China, and foreigners such as Tesla and BMW, ignored BYD and turned to CATL. When subsidies ended, CATL turned to production of high-nickel batteries, superior to the cheaper lithium-ion type. The company is very profitable, and with its bias to experimentation and expansion, is expected, by U.S. analysts, to quadruple to 500 GWh of battery cells a year by 2025. This is an amount similar to what is promised from all the world’s gigafactories today. Most of CATL’s expansion will come in China, where its export business is growing. The end of this year should see production start at its first offshore factory, with a capacity of 14 GWh in Erfurt, Germany, from where it will supply carmakers such as BMW, Volkswagen and Daimler. There are already fears in the West that CATL’s profitability in China will allow it to offer cut-price products abroad, as a reminder of China’s flooding the world with continued
42
Manufacturing Outlook / August 2021
ENERGY OUTLOOK subsidized solar panels in the 2010s. Europe and America are offering big incentives for locally made batteries as part of a supply chain to catch up with China. They feel vulnerable in over-reliance on a Chinese supplier. CATL already does more business with global carmakers than any other battery firm. It will need to stress the importance of cheap batteries, for both EVs and clean-electricity grids, in the fight against climate change. CATL seems to have set the pace in the battery race. Strong Winds Germany has pre-selected, for its first subsidy-free wind farm, a huge Vestas wind turbine. In February, the Danish wind turbine manufacturer announced the launch of its new offshore wind turbine, the V236 - 15.0 MW, and stole the title from GE’s 14MW Haliade-X to become the producer of the world’s largest offshore wind turbine. The German energy company EnBW, has preselected the turbine for He Dreiht, a 900 MW subsidy-free offshore wind farm in the German North Sea. This would be the first commercial deployment of the Vestas 15MW wind turbine if
an unconditional order results. A single V23615.0 MW can produce 80GWh per year, depending on site-specific conditions. The rotor diameter is 236 meters (774 feet). One turbine will sweep an area of 470,835 square feet (43,743 square meters) and will have the capacity to power 20,000 households. Installation is due to begin in the second quarter of 2025, with commissioning for the fourth Jocelyn Bright, quarter of 2025. n Staff Writer
Manufacturing Outlook / August 2021
43
AUTOMOTIVE OUTLOOK
AUGUST 2021
AUTOMOTIVE OUTLOOK
by LAWRENCE MAKAGON
THE MUSTANG’S NEW GUISE The 2021 Ford Mach-E is an electric crossover SUV that seems to out-Mustang the Detroit icon. This model can accelerate from 0 to 60 mph in just 3 seconds, gets a battery range of 210 miles, can be charged at home, and offers a comfortable ride. If this sounds great, well, it may get even better. MotorTrend Magazine describes it thus: “An advanced driver-facing infrared camera tracks the driver’s eyes and head position in Hands-Free mode, as well as when Hands-On Lane Centering mode is engaged, which works on any road with lane lines.” So is this really too good to be true? Some think so, some don’t. In January this year, Ford announced that it was holding back the release of Mustang Mach-E EVs in order to complete additional quality checks. All Mach-Es are assembled at a Ford plant in Mexico, and as of January, very few had been delivered to any dealers. Ford knew all eyes were on the Mach-E, it being the first original EV to come from Ford, and also the first Mustang
44
variant. Ford issued a statement at the time to the effect that it was conducting additional quality checks on several hundred Mach-E models built before shipments started in December 2020. Ford notified affected customers - several hundred in the U.S. and Canada - that there may be a delay in delivery. In April this year, Ford stated it was aware that a small number of Mustang Mach-E owners had had their 12V battery reach a low voltage condition. They further stated that they had proactively worked with early owners experiencing this issue to identify the root cause and a solution. Ford notified customers that in the rare instances where this still occurred, customers could now contact their local EV-certified Ford dealer to have the matter resolved. Six Ford Mustang Mach-E cars were recently found to be pushed for maximum regenerative braking to gain battery charge, in Norway. On a steep location the cars experienced too much continued
Manufacturing Outlook / August 2021
AUTOMOTIVE OUTLOOK regenerative braking, and the engine was getting too hot. To avoid the engine getting too hot, the car shut down on its own. Ford says this is a software problem and has taken steps to fix it. In May this year, Ford Mustang Mach-E was the best-selling EV in Norway, and May was the month when Ford made its EV debut there. It is said to be a good thing that it only takes 30-45 minutes to fix the braking problem. More than 1500 Ford Mustang Mach-Es are currently on Norwegian roads. Every car will need to be fixed. Ford plans to be among the top best-selling EVs in Norway. Ford really needs to fix this problem. The Mustang, in whatever guise, is a popular automobile in Europe, vroom vroom or no vroom vroom. The semiconductor shortage is hitting home hard on auto manufacturers’ production, and to an overall loss in production of over a million vehicles. Detroit’s Big Three collectively stand to lose 855,000 units combined, with Ford to lose 325,000 units, GM 278,000 units, and Stellantis 252,000. Other manufacturers have announced potential losses, with Subaru at 45,000; VW at 45,000; Honda at 43,000; Nissan at 42,000; Toyota at 30,000; Hyundai and Volvo at less than 3,000 each. GM’s CEO said the shortages could cost the company up to $2 billion in lost earnings. Cars today are built with 500 to 1,500 different chips. It’s going to take a while to fix this shortage, but nobody can say how long. The 2021 J. D. Power Automotive Brand Loyalty Study showed GM brands performing poorly in the study. This is an attempt to rank brands based on how many returning customers they attract. For this study, J.D. Power used its ‘Power Information Network’ data to calculate the percentage of vehicle owners that choose the same brand when trading in or purchasing their next vehicle. It then sorted the data by brand, ranking luxury and mass-market automakers based on how many owners purchased a vehicle from that brand after trading in an existing vehicle for a new vehicle.
The Manufacturing & Business Podcast Network
O U R
P O D C A S T S :
MFGTALKRADIO.COM
L I S T E N TO O U R P O D C A S T S AT:
Of the three mass-market GM brands, Chevy performed the best, with 49.2 percent of owners trading in their current Chevy vehicle for a new one. This placed Chevy in the middle of the pack among massmarket brands. GMC and Buick fared worse, with customer retention of 39.0 and 32.3 percent respectively. Subaru was at the top of the table with 61.8 percent customer retention, followed by Toyota at 61.1 percent, and Honda at 59.3 percent. Chrysler had the lowest customer retention at 14.6 percent.
www.jacketmediaco.com
In the luxury category, Lexus was top with 51.6 percent, Porsche with 50.2 percent, and Mercedes with 47.0 percent. Cadillac came in at 37.8 percent, Lincoln at 36.0 percent.
Lawrence Makagon, Staff Writer
The study suggested that due to the pandemic, many customers were not willing, or able, to spend time visiting many dealerships, preferring to stick with their present dealer. n Manufacturing Outlook / August 2021
45
ISSUES OUTLOOK
AUGUST 2021
ISSUES OUTLOOK
by ROYCE LOWE
PEOPLE AND PRODUCTIVITY A think tank, the Information Technology and Innovation Foundation, has recently carried out a study on productivity in U.S. manufacturing. Based on data from the Bureau of Labor Statistics, labor productivity growth fell between 2010 and 2019. For the first time since the BLS started measuring in 1988, and likely for the first time in American history, manufacturing productivity not only didn’t grow over ten years, but actually declined. Simply put, more workers were needed for the same output. This happened over most industries. Of 19 major sectors, only five saw increased productivity, and apart from Apparel and Leather Products, increases were minimal. The other 14 sectors showed a decline: Primary metals were 6 percent less, Chemical Products 12 percent less. In the ten years from 2001 to 2010, manufacturing productivity increased 41 percent. From 2010 to 2019 it contracted by minus 4 percent. If we compare the two time periods, 2000-2009 and 2010-2019, we find Motor Vehicles, Bodies, Trailers and Parts at 59.5 vs 0.0; Primary Metals at 50.9 vs -5.7, and Machinery at 31.9 vs -5.4. Lower wages go to lower-skilled workers, and hence lower productivity. Higher productivity would allow for higher wages, and lower wages would provide less motivation to raise it. It’s also likely that the density of industrial robots may play a part in productivity. As a measure of industrial robots per
46
Manufacturing Outlook / August 2021
10,000 employees, the U.S. comes a fair way down the table, as per the following 2019 data: South Korea 855; Japan 364; Germany 346; Sweden 277; U.S. 228; China 187. When all is considered, we are coming back to the skills-gap debate, and the absolute necessity to make a determined effort to fix this. At one point, the U.S. was the world’s greatest manufacturing economy. The Workforce Institute at UKG (Ultimate Kronos Group) is a think tank that helps organizations drive performance by addressing human capital management issues that affect both hourly and salaried employees. The organization carried out a recent study, involving the participation of 300 hiring decision makers, a mix of U.S.- only manufacturers (65 percent) and multinational manufacturers with strong U.S. presence. The study brought to light that before the pandemic, 38 percent of manufacturers had trouble finding employees with appropriate skills, and today 54 percent. Problems in the workplace included employees calling out of scheduled shifts with short, in some cases zero, notice. From January to March 2021, 68 percent of firms let employees go because of poor attendance, and 13 percent said managers had to adjust labor schedules every day to account for unplanned absences. The reasons were pandemicrelated obligations such as childcare, and remote schooling. But attendance issues were common in continued
ISSUES OUTLOOK manufacturing even before the pandemic. A survey in March 2020 showed that over half said employee lateness (61%), short-staffed shifts (58%) and lastminute call-outs (55%) were all regular occurrences in the twelve months prior to COVID. There are then attendance issues due to the labor shortage. In this respect, one third said it was difficult to compete with other manufacturers, and a quarter competing with employers outside the industry. And stagnant wages in manufacturing. There is thus intense competition for the skilled talent workforce. The skills shortage goes back a good number of years. Some 54 percent of manufacturers say that negative industry perceptions are impacting their ability to recruit Millennial and GenZ talent. Hence manufacturers must try their hardest to hold onto the people working for them today and to provide skills internally; in other words, develop their existing workforce. The survey said that 63 percent are taking steps to re-skill employees and another 60 percent are cross-training their people. In short, manufacturers need to make things more interesting and challenging, and to look at other industries that successfully attract young workers. There again, some companies hire special-needs people, retirees or second-chance workers. Where additional training is required, it must be considered both essential and a worthwhile investment.
case scenario of overworked, under appreciated employees, who will look for greener pastures. This is a situation that has been discussed at great length. The solution seems to be relatively simple. A shortage of skilled labor requires skilled training. There again, not all manufacturing jobs require special skills, so candidates can be allocated accordingly. Those employees who show a willingness for advancement and learning should be trained accordingly, and according to their suitability for certain jobs. This is not rocket science, but it does require a willingness on the part of management to take it seriously. There would seem to be little doubt that productivity and the availability of skilled labor are related. There would also be little doubt that many U.S. companies have taken the necessary steps to ensure appropriate skill levels for the various functions in their production cycles. So it can be done; hence, the questions are why isn’t it done more often, and why isn’t the training process started earlier in the candidates’ career. It should be noted that the U.S. is not alone in experiencing skill shortages. There have been recent concerns from both Canada and the UK regarding this issue, but no quick solutions have been suggested. Regardless of how many countries recognize the problem, what could be better for productivity than skilled, contented people? n
Labor shortages and absenteeism lead to some employees working unreasonable amounts of overtime, which may lead to burnout, or a worst-
Author profile: Royce Lowe, Manufacturing Talk Radio, UK and EU International Correspondent, Contributing Writer, Manufacturing Outlook.
nn
200” Max O.D. 6” Min O.D. To 80,000 lbs.
ISO9001:2015 SINCE 1994 AND AS9100D SINCE 1998 - NIST SP 800-171 (COMPLIANCE UNDER DEVELOPMENT)
TOLL FREE IN THE U.S. 800.600.9290 - 973.276.5000 - CANADA: 416.363.2244 - INFO@STEELFORGE.COM - STEELFORGE.COM
Manufacturing Outlook / August 2021
47
ISSUES OUTLOOK
U.S. 48TOLL FREE 800.600.9290 - IN CANADA: 416.363.2244 Manufacturing Outlook / August 2021
ISO9001:2015 SINCE 1994 AND AS9100D SINCE 1998 NIST SP 800-171
(COMPLIANCE UNDER DEVELOPMENT)
*
*Toll free within the U.S.