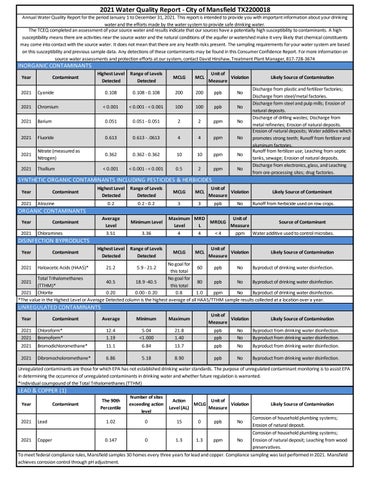
2021 Water Quality Report - City of Mansfield TX2200018
Annual Water Quality Report for the period January 1 to December 31, 2021. This report is intended to provide you with important information about your drinking water and the efforts made by the water system to provide safe drinking water. The TCEQ completed an assessment of your source water and results indicate that our sources have a potentially high susceptibility to contaminants. A high susceptibility means there are activities near the source water and the natural conditions of the aquifer or watershed make it very likely that chemical constituents may come into contact with the source water. It does not mean that there are any health risks present. The sampling requirements for your water system are based on this susceptibility and previous sample data. Any detections of these contaminants may be found in this Consumer Confidence Report. For more information on source water assessments and protection efforts at our system, contact David Hinshaw, Treatment Plant Manager, 817-728-3674
INORGANIC CONTAMINANTS Year
Contaminant
Highest Level Detected
Range of Levels Detected
MCLG
MCL
Unit of Violation Measure
0.108
0.108 - 0.108
200
200
ppb
No
< 0.001
< 0.001 - < 0.001
100
100
ppb
No
2021
Cyanide
2021
Chromium
2021
Barium
0.051
0.051 - 0.051
2
2
ppm
No
2021
Fluoride
0.613
0.613 - .0613
4
4
ppm
No
2021
Nitrate (measured as Nitrogen)
0.362
0.362 - 0.362
10
10
ppm
No
2021
Thallium
< 0.001
< 0.001 - < 0.001
0.5
2
ppm
No
SYNTHETIC ORGANIC CONTAMINANTS INCLUDING PESTICIDES & HERBICIDES Year 2021
Contaminant
Highest Level Detected
Range of Levels Detected
MCLG
MCL
0.2
0.2 - 0.2
3
3
Atrazine
ORGANIC CONTAMINANTS Year 2021
Average Level 3.51
Contaminant Chloramines
DISINFECTION BYPRODUCTS Year
Contaminant
Highest Level Detected
Minimum Level 3.36 Range of Levels Detected
Unit of Violation Measure ppb
No
Likely Source of Contamination Discharge from plastic and fertilizer factories; Discharge from steel/metal factories. Discharge form steel and pulp mills; Erosion of natural deposits. Discharge of drilling wastes; Discharge from metal refineries; Erosion of natural deposits. Erosion of natural deposits; Water additive which promotes strong teeth; Runoff from fertilizer and aluminum factories. Runoff from fertilizer use; Leaching from septic tanks, sewage; Erosion of natural deposits. Discharge from electronics, glass, and Leaching from ore-processing sites; drug factories. Likely Source of Contaminant Runoff from herbicide used on row crops.
Maximum MRD Unit of MRDLG Source of Contaminant Level L Measure 4 4 <4 ppm Water additive used to control microbes. MCLG
MCL
Unit of Violation Measure
Likely Source of Contamination
No goal for 60 ppb No Byproduct of drinking water disinfection. this total Total Trihalomethanes No goal for 40.5 18.9 -40.5 80 ppb No Byproduct of drinking water disinfection. 2021 (TTHM)* this total 2021 Chlorite 0.20 0.00 - 0.20 0.8 1.0 ppm No Byproduct of drinking water disinfection. *The value in the Highest Level or Average Detected column is the highest average of all HAA5/TTHM sample results collected at a location over a year. 2021
Haloacetic Acids (HAA5)*
21.2
5.9 - 21.2
Average
Minimum
Maximum
UNREGULATED CONTAMINANTS Year
Contaminant
Unit of Violation Measure
Likely Source of Contamination
2021 2021
Chloroform* Bromoform*
12.4 1.19
5.04 <1.000
21.8 1.40
ppb ppb
No No
Byproduct from drinking water disinfection. Byproduct from drinking water disinfection.
2021
Bromodichloromethane*
11.1
6.84
13.7
ppb
No
Byproduct from drinking water disinfection.
2021
Dibromocholoromethane*
6.86
5.18
8.90
ppb
No
Byproduct from drinking water disinfection.
Unregulated contaminants are those for which EPA has not established drinking water standards. The purpose of unregulated contaminant monitoring is to assist EPA in determining the occurrence of unregulated contaminants in drinking water and whether future regulation is warranted. *Individual coumpound of the Total Trihalomethanes (TTHM)
LEAD & COPPER (1) Year
Contaminant
The 90th Percentile
Number of sites exceeding action level
Action Unit of MCLG Violation Level (AL) Measure
Likely Source of Contamination
Corrosion of household plumbing systems; Erosion of natural deposit. Corrosion of household plumbing systems; Erosion of natural deposit; Leaching from wood 2021 Copper 0.147 0 1.3 1.3 ppm No preservatives. To meet federal compliance rules, Mansfield samples 30 homes every three years for lead and copper. Compliance sampling was last performed in 2021. Mansfield achieves corrosion control through pH adjustment. 2021
Lead
1.02
0
15
0
ppb
No