6
A Story of Ratios®
Ratios and Rates TEACH ▸ Ratios, Rates, and Percents
Module 1
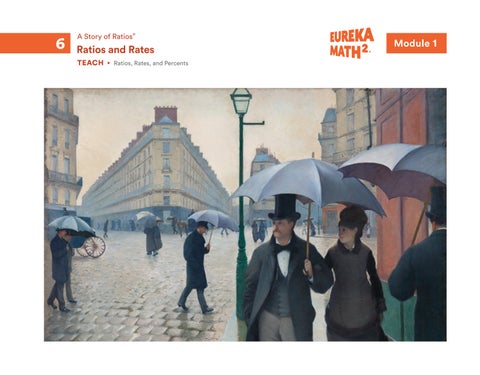
What does this painting have to do with math? An intersection in Paris on a gray, rainy day is the subject of this atmospheric Impressionist painting. Gustave Caillebotte creates depth in this scene by using perspective and proportion in a variety of ways, including by placing large figures in the foreground and smaller ones in the distance. Imagine there is a coordinate grid on the building in the background. How might you determine the distance from the front of the building to the back by using the coordinate plane? On the cover Paris Street; Rainy Day, 1877 Gustave Caillebotte, French, 1848–1894 Oil on canvas The Art Institute of Chicago, Chicago, IL, USA Gustave Caillebotte (1848–1894). Paris Street; Rainy Day, 1877. Oil on canvas, 212.2 x 276.2 cm (83 1/2 x 108 3/4 in). Charles H. and Mary F. S. Worcester Collection (1964.336). The Art Institute of Chicago, Chicago, IL, USA. Photo Credit: The Art Institute of Chicago/Art Resource, NY
Great Minds® is the creator of Eureka Math®, Wit & Wisdom®, Alexandria Plan™, and PhD Science®. Published by Great Minds PBC. greatminds.org © 2021 Great Minds PBC. All rights reserved. No part of this work may be reproduced or used in any form or by any means—graphic, electronic, or mechanical, including photocopying or information storage and retrieval systems—without written permission from the copyright holder. Where expressly indicated, teachers may copy pages solely for use by students in their classrooms. Printed in the USA C-Print 1 2 3 4 5 6 7 8 9 10 XXX 25 24 23 22 21 ISBN 978-1-64497-185-7
A Story of Ratios®
Ratios and Rates ▸ 6 TEACH Module
Module
Module
Module
Module
Module
1 2 3 4 5 6
Ratios, Rates, and Percents
Operations with Fractions and Multi-Digit Numbers
Rational Numbers
Expressions and One-Step Equations
Area, Surface Area, and Volume
Statistics
Before This Module
Overview
Grade 4 Module 2
Ratios, Rates, and Percents
Grade 5 Module 6 In grade 4, students solve problems involving multiplicative comparisons, such as Blake has 4 times as many stickers as Adesh. This prior work provides a foundation for students’ understanding of ratios as multiplicative comparisons of two numbers. In grade 5, students work with the first quadrant of the coordinate plane as they plot points to represent ordered pairs of numbers.
Topic A Ratios This topic introduces students to ratios and ratio notation. Students use tape diagrams to model ratios and solve problems. They explore different ways to group and compare objects to develop an understanding of equivalent ratios by the end of the topic. Number of Roses Number of Daisies
Topic B Collections of Equivalent Ratios Topic B defines sets of all ratios that are equivalent ratios as ratio relationships. Students represent ratio relationships by using ratio tables, double number lines, and points in the coordinate plane. They use these models and the addition and multiplication patterns in the ratio relationship to solve for unknown quantities. 0
1
2
3
4
5
0
4
8
12
16
20
Number of Packets of Sugar Number of Grams of Sugar
2
© Great Minds PBC
EUREKA MATH2 6 ▸ M1
Topic C
After This Module
Comparing Ratio Relationships In this topic, students compare ratio relationships in context by using ratios to answer questions such as Which lemonade should have a stronger lemon flavor? Students use a variety of strategies to compare ratio relationships, including making direct comparisons by using a ratio table, by creating equivalent ratios, and by calculating the value of the ratio.
Topic D Rates In topic D, students develop an understanding of the rates associated with ratio relationships. They calculate unit rates and use them to solve problems involving speed, unit pricing, measurement conversions, and other real-world rate applications.
Grade 7 Modules 1 and 5 In grade 7 module 1, students extend their understanding of ratios and rates to proportional relationships. They recognize the constant of proportionality as the unit rate of a relationship. They identify, compare, and solve problems involving proportional relationships represented in graphs, tables, equations, and verbal descriptions. In grade 7 module 5, students apply their foundational understanding of percents to a variety of other real-world contexts, including percent increase and decrease, percent error, discounts, tax, and commission.
Topic E Percents This topic introduces percents. Students understand a percent as a fraction with a denominator of 100, and they apply their ratio and rate reasoning from previous topics to solve percent problems. Students use double number lines, mental math, and other computational strategies to solve for the unknown percent, part, or whole.
© Great Minds PBC
3
Contents Ratios, Rates, and Percents Why. . . . . . . . . . . . . . . . . . . . . . . . . . . . . . . . . . . . . . . . . . . . . . . . . . . . . . . . 7 Achievement Descriptors: Overview. . . . . . . . . . . . . . . . . . . . . 10 Topic A . . . . . . . . . . . . . . . . . . . . . . . . . . . . . . . . . . . . . . . . . . . . . . . . . . . 12 Ratios Lesson 1 . . . . . . . . . . . . . . . . . . . . . . . . . . . . . . . . . . . . . . . . . . . . . . . . . . . . 14 Jars of Jelly Beans • Use multiplicative reasoning to estimate the solution to a real-world problem.
Lesson 2. . . . . . . . . . . . . . . . . . . . . . . . . . . . . . . . . . . . . . . . . . . . . . . . . . . . 26 Introduction to Ratios
Topic B. . . . . . . . . . . . . . . . . . . . . . . . . . . . . . . . . . . . . . . . . . . . . . . . . . . 104 Collections of Equivalent Ratios Lesson 6. . . . . . . . . . . . . . . . . . . . . . . . . . . . . . . . . . . . . . . . . . . . . . . . . . . 106 Ratio Tables and Double Number Lines • Represent equivalent ratios by using ratio tables and double number lines. • Use representations of ratio relationships to solve problems.
Lesson 7. . . . . . . . . . . . . . . . . . . . . . . . . . . . . . . . . . . . . . . . . . . . . . . . . . . 128 Graphs of Ratio Relationships • Plot points in the coordinate plane that each represent a ratio. • Identify characteristics of graphs, tables, and double number lines representing ratio relationships.
• Write ratios that relate two quantities as an ordered pair of numbers. • Use ratio language to compare two quantities.
Lesson 8. . . . . . . . . . . . . . . . . . . . . . . . . . . . . . . . . . . . . . . . . . . . . . . . . . . 152
Lesson 3. . . . . . . . . . . . . . . . . . . . . . . . . . . . . . . . . . . . . . . . . . . . . . . . . . . . 44
• Use addition patterns in tables and graphs of equivalent ratios to describe ratio relationships and find unknown quantities.
Ratios and Tape Diagrams
Addition Patterns in Ratio Relationships
• Write multiple ratios to describe the same situation. • Represent ratios with tape diagrams.
Lesson 9. . . . . . . . . . . . . . . . . . . . . . . . . . . . . . . . . . . . . . . . . . . . . . . . . . . 172
Lesson 4. . . . . . . . . . . . . . . . . . . . . . . . . . . . . . . . . . . . . . . . . . . . . . . . . . . . 62
• Use graphs and tables to explore multiplication patterns in ratio relationships. • Use multiplication to complete ratio tables.
Exploring Ratios by Making Batches • Create ratios by making batches of different quantities. • Use tape diagrams to determine unknown quantities in ratios.
Multiplication Patterns in Ratio Relationships
Lesson 10. . . . . . . . . . . . . . . . . . . . . . . . . . . . . . . . . . . . . . . . . . . . . . . . . . 192 Multiplicative Reasoning in Ratio Relationships
Lesson 5. . . . . . . . . . . . . . . . . . . . . . . . . . . . . . . . . . . . . . . . . . . . . . . . . . . . 84
• Write and use equivalent ratios when one of the numbers in the ratio is 1.
Equivalent Ratios
Lesson 11 . . . . . . . . . . . . . . . . . . . . . . . . . . . . . . . . . . . . . . . . . . . . . . . . . . 212
• Find equivalent ratios by multiplying both numbers in a given ratio by the same nonzero number. • Use equivalent ratios to find unknown quantities.
4
Applications of Ratio Reasoning • Solve multi-step ratio problems by reasoning about equivalent ratios.
© Great Minds PBC
EUREKA MATH2 6 ▸ M1
Topic C . . . . . . . . . . . . . . . . . . . . . . . . . . . . . . . . . . . . . . . . . . . . . . . . . . 234 Comparing Ratio Relationships Lesson 12 . . . . . . . . . . . . . . . . . . . . . . . . . . . . . . . . . . . . . . . . . . . . . . . . . . 236 Multiple Ratio Relationships
Lesson 20. . . . . . . . . . . . . . . . . . . . . . . . . . . . . . . . . . . . . . . . . . . . . . . . . . 382 Solving Rate Problems • Apply rate reasoning to solve real-world ratio problems involving speed, unit pricing, and unit conversions. • Find an unknown quantity when given a rate and a known quantity.
• Compare ratio relationships by using graphs, tables, and double number lines.
Lesson 21 . . . . . . . . . . . . . . . . . . . . . . . . . . . . . . . . . . . . . . . . . . . . . . . . . . 398
Lesson 13 . . . . . . . . . . . . . . . . . . . . . . . . . . . . . . . . . . . . . . . . . . . . . . . . . . 258
Solving Multi-Step Rate Problems
Comparing Ratio Relationships, Part 1 • Compare ratio relationships by using ratio tables.
Lesson 14. . . . . . . . . . . . . . . . . . . . . . . . . . . . . . . . . . . . . . . . . . . . . . . . . . 278 Comparing Ratio Relationships, Part 2 • Compare ratio relationships by creating equivalent ratios.
Lesson 15 . . . . . . . . . . . . . . . . . . . . . . . . . . . . . . . . . . . . . . . . . . . . . . . . . . 294 The Value of the Ratio • Compare ratio relationships by using the value of the ratio.
Topic D . . . . . . . . . . . . . . . . . . . . . . . . . . . . . . . . . . . . . . . . . . . . . . . . . . 308 Rates Lesson 16. . . . . . . . . . . . . . . . . . . . . . . . . . . . . . . . . . . . . . . . . . . . . . . . . . 310 Speed • Find distance and time corresponding to a given speed. • Identify real-world examples of rates and interpret their meanings in context.
Lesson 17 . . . . . . . . . . . . . . . . . . . . . . . . . . . . . . . . . . . . . . . . . . . . . . . . . . 328 Rates • Identify rates and unit rates. • Calculate one quantity when given another quantity and a constant rate.
Lesson 18. . . . . . . . . . . . . . . . . . . . . . . . . . . . . . . . . . . . . . . . . . . . . . . . . . 350 Comparing Rates • Compare rates with like units of measurement by using unit rate.
• Solve problems involving multiple constant rates.
Topic E. . . . . . . . . . . . . . . . . . . . . . . . . . . . . . . . . . . . . . . . . . . . . . . . . . . 412 Percents Lesson 22. . . . . . . . . . . . . . . . . . . . . . . . . . . . . . . . . . . . . . . . . . . . . . . . . . 414 Introduction to Percents • Relate percents to a part-to-whole relationship where the whole is 100. • Model percents and write percents in fraction and decimal forms.
Lesson 23. . . . . . . . . . . . . . . . . . . . . . . . . . . . . . . . . . . . . . . . . . . . . . . . . . 442 Finding the Percent • Calculate a percent when given a part and the whole. • Discover that if multiple parts make a whole, then the percents representing the parts should total 100%.
Lesson 24. . . . . . . . . . . . . . . . . . . . . . . . . . . . . . . . . . . . . . . . . . . . . . . . . . 466 Finding a Part • Calculate a part when given the whole and a percent.
Lesson 25. . . . . . . . . . . . . . . . . . . . . . . . . . . . . . . . . . . . . . . . . . . . . . . . . . 486 Finding the Whole • Calculate the whole when given a part and a percent.
Lesson 26. . . . . . . . . . . . . . . . . . . . . . . . . . . . . . . . . . . . . . . . . . . . . . . . . . 502 Solving Percent Problems • Solve multi-step percent problems.
Lesson 19. . . . . . . . . . . . . . . . . . . . . . . . . . . . . . . . . . . . . . . . . . . . . . . . . . 364 Using Rates to Convert Units • Convert units of measurement by applying rate reasoning.
© Great Minds PBC
5
6 ▸ M1
EUREKA MATH2
Resources Standards. . . . . . . . . . . . . . . . . . . . . . . . . . . . . . . . . . . . . . . . . . . . . . . . . . 520 Achievement Descriptors: Proficiency Indicators. . . . . . . . . . . . . . . . 522 Terminology. . . . . . . . . . . . . . . . . . . . . . . . . . . . . . . . . . . . . . . . . . . . . . . . 530 Math Past . . . . . . . . . . . . . . . . . . . . . . . . . . . . . . . . . . . . . . . . . . . . . . . 532 Materials . . . . . . . . . . . . . . . . . . . . . . . . . . . . . . . . . . . . . . . . . . . . . . . . . . 534 Fluency. . . . . . . . . . . . . . . . . . . . . . . . . . . . . . . . . . . . . . . . . . . . . . . . . . . . 536 Mixed Practice Solutions. . . . . . . . . . . . . . . . . . . . . . . . . . . . . . . . . . . . . 552 Works Cited. . . . . . . . . . . . . . . . . . . . . . . . . . . . . . . . . . . . . . . . . . . . . . . . 555 Credits. . . . . . . . . . . . . . . . . . . . . . . . . . . . . . . . . . . . . . . . . . . . . . . . . . . . 556 Acknowledgments. . . . . . . . . . . . . . . . . . . . . . . . . . . . . . . . . . . . . . . . . . 557
6
© Great Minds PBC
Why Ratios, Rates, and Percents Ratios are shown as A : B and A to B. Why not BA ?
Blue
Red
In this module, a ratio is defined as an ordered pair of numbers that are not both zero. Because a ratio is a pair of numbers, not a single quantity, it should only be written by using the notation A : B or A to B, which indicates this pair of numbers. In addition, writing a ratio as a single rational number BA may give students the misconception that they can do arithmetic with ratios. However, computation with ratios and rational numbers is not the same. For example, if the ratio of the number of parts red paint to the number of parts blue paint in a mixture is 1 : 1, and it is combined with a different mixture in which the corresponding quantities are in a ratio of 1 : 2, what is the ratio of the new mixture? It is potentially 2 : 3, but it could be 3 : 4, 4 : 5, or another ratio, depending on the quantities used in each initial mixture. If students write the original ratios as 1 and 12 , however, they may be tempted to find the sum and assume that the new ratio 1
Consider the collection of shapes. a. There are 2 times as many blue circles as red circles. b. A ratio that relates the number of blue circles to the number of red circles is 4 : 2 . c. For every 4 blue circles, there are 2 red circles.
is 23 , or 3 : 2. Writing ratios as ordered pairs of numbers in the forms A : B and A to B makes it less likely that students will be confused about the properties of ratios.
The fraction BA can be used to denote the value of the ratio, which is the first number in the ratio when the second number is 1.
Why are there so many different representations in this module? The pictorial representations in this module help students visualize the relationships between quantities in ratios, rates, and percents. These representations include tape diagrams, double number lines, tables, and graphs—all familiar tools that students continue to work with in future grades. By becoming proficient with these representations, students have multiple strategies to approach and represent a problem.
© Great Minds PBC
Number of Peaches Number of Kiwis
7
EUREKA MATH2
6 ▸ M1
• Lesson 2 introduces tape diagrams as tools for representing ratios with quantities that have the same units and showing the multiplicative relationship between those quantities. The diagrams have two tapes with equal-size units. They serve as an important tool for writing and understanding equivalent ratios, determining unknown quantities in a ratio relationship, and solving problems involving changing ratio relationships.
Number of Inches of Water
Number of Inches of Snow
1
10
2
20
3
30
• Lesson 6 introduces double number lines as tools for representing ratio relationships. These diagrams are useful for modeling situations involving different units such as distance and time. • Lesson 6 also introduces ratio tables as tools to represent sets of equivalent ratios. This builds on prior work with tables such as measurement conversion tables in elementary grades. Students use the addition and multiplication patterns from ratio tables to write equivalent ratios, solve problems, and compare ratio relationships in context.
Number of Slices of Cheese
• Lesson 7 introduces graphs in the coordinate plane as tools to represent ratio relationships. Students make the informal observation that points representing a ratio relationship lie on the same line that passes through the origin. This learning provides a useful review of graphing in the coordinate plane before students encounter it again in module 4.
Grilled Cheese Sandwiches
y 11 10 9 8 7 6 5 4 3 2 1 0
1
2
3
4
5
6
7
8
9 10 11
x
Number of Slices of Bread
8
© Great Minds PBC
EUREKA MATH2 6 ▸ M1
Why aren’t students writing equations in this module? Because module 1 is the first time that students are introduced to ratios and rates, the lessons focus on the relationships between quantities in a set of equivalent ratios. Although students do create tables and graphs, they are not asked to abstract these relationships by identifying the variables or writing an equation. This choice is intentional to preserve the focus on ratio and rate reasoning and intuitive observation of patterns rather than on the mechanics of writing an equation and substituting values into a formula. In addition, because of this module’s focus on relationships between quantities, the rate lessons in topic D avoid expressing rates by using derived units, such as 60 miles , or as hour
fractions, such as 60 miles . Rather, grade 6 students write this rate as 60 miles per hour and 1 hour
Number of Bracelets
Total Cost (dollars)
4
64
1
16
7
112
×1 4
×1 4
× 16
interpret it to mean that an object travels 60 miles in 1 hour. Over several examples, students observe that the units of rates are composed of two different types of quantities, such as miles and hours, and the learning focuses on understanding the meaning of rates and their units. Derived units are not necessary for students to demonstrate mastery of the grade 6 standards involving rates. Derived units are introduced in high school, when students are better prepared to understand and compute with rates as single quantities. In module 4, after students work with single-variable equations and their solutions, students revisit ratio relationships in tables and in the coordinate plane. They define independent variable and dependent variable and explore how to write equations to model ratio relationships when given a table or a graph. This sequencing allows for the major work of grade 6—ratios and equations—to be thoughtfully spaced out and revisited throughout the school year.
© Great Minds PBC
9
Achievement Descriptors: Overview Ratios, Rates, and Percents Achievement Descriptors (ADs) are standards-aligned descriptions that detail what students should know and be able to do based on the instruction. ADs are written by using portions of various standards to form a clear, concise description of the work covered in each module.
6.Mod1.AD1 Write and explain ratios that describe
relationships between two quantities.
6.Mod1.AD2 Write and explain the unit rate that describes a
relationship between two quantities.
Each module has its own set of ADs, and the number of ADs varies by module. Taken together, the sets of module-level ADs describe what students should accomplish by the end of the year.
6.Mod1.AD3 Solve real-world and mathematical
ADs and their proficiency indicators support teachers with interpreting student work on
6.Mod1.AD4 Represent ratio relationships by using
• informal classroom observations, • data from other lesson-embedded formative assessments, • Exit Tickets, • Topic Quizzes, and • Module Assessments. This module contains the nine ADs listed.
6.RP.A.1
problems by using ratio reasoning.
tables and the coordinate plane.
6.RP.A.2
6.RP.A.3
6.RP.A.3.a
6.Mod1.AD5 Compare ratio relationships by using
various representations.
6.RP.A.3.a
6.Mod1.AD6 Solve real-world problems by using
unit rates.
6.RP.A.3.b
6.Mod1.AD7 Model and explain percents and
problems involving percents.
6.RP.A.3.c
6.Mod1.AD8 Solve problems that involve finding the
part, whole, or percent.
6.RP.A.3.c
6.Mod1.AD9 Convert among units by using ratio
reasoning to solve problems.
10
6.RP.A.3.d
© Great Minds PBC
EUREKA MATH2 6 ▸ M1
The first page of each lesson identifies the ADs aligned with that lesson. Each AD may have up to three indicators, each aligned to a proficiency category (i.e., Partially Proficient, Proficient, Highly Proficient). While every AD has an indicator to describe Proficient performance, only select ADs have an indicator for Partially 2 Proficient and/or Highly Proficient performance. EUREKA MATH
ADs have the following parts: • AD Code: The code indicates the grade level and the module number and then lists the ADs in no particular order. For example, the first AD for grade 6 module 1 is coded as 6.Mod1.AD1. • AD Language: The language is crafted from standards and 6 ▸ M1 concisely describes what will be assessed.
An example of one of these ADs, along with its proficiency • AD Indicators: The indicators describe the precise expectations indicators, is shown here for reference. The complete set whole, of this or percent. 6.Mod1.AD8 Solve problems that involve finding the part, of the AD for the given proficiency category. module’s ADs with proficiency indicators can be found in the RELATED CCSSM • Related Standard: This identifies the standard or parts of standards Achievement Descriptors: Proficiency Indicators resource. 6.RP.A.3.c Find a percent of a quantity as a rate per 100 (e.g., 30% of a quantity means times the quantity); solve problems involving finding the whole, given a part from the Common Core State Standards that the AD addresses. and the percent. 30 100
Partially Proficient
AD Code: Grade.Mod#.AD#
Proficient Solve problems that involve finding the part, whole, or percent. Sana has 7 mystery novels. She says that 35% of her novels are mystery novels. What is the total number of novels Sana has?
Highly Proficient
AD Language
6.Mod1.AD9 Convert among units by using ratio reasoning to solve problems.
Related Standard
RELATED CCSSM
6.RP.A.3.d Use ratio reasoning to convert measurement units; manipulate and transform units appropriately when multiplying or dividing quantities.
Partially Proficient
Proficient
Highly Proficient
Convert among nonmixed units by using ratio reasoning.
Convert among units, including mixed units such as 4 feet 3 inches, to solve problems.
Solve problems involving conversion of units within ratios and rates.
Convert.
Lisa’s height is 5 feet 8 inches. What is Lisa’s height in centimeters?
Yuna runs 750 meters in 5 minutes. What is Yuna’s speed in kilometers per hour?
10 in =
cm
AD Indicators
(1 in = 2.54 cm)
11
© Great Minds PBC © Great Minds PBC
503
Topic A Ratios Topic A introduces students to ratios. In the elementary grades, students learn to recognize number patterns, make equal groups, write multiplicative comparisons, and work with fractions. Students apply these skills in grade 6 as they recognize part-to-part and part-to-whole relationships, write ratios, and explain the meaning of ratios. Lesson 1 presents a modeling task where students may use a variety of strategies to estimate the number of jelly beans in different-size jars. This task prepares students for many of the ideas presented in module 1, including multiplicative relationships, ratios, rates, and measurement conversions. In the next lesson, students explore situations where multiplicative comparison language, such as “The girl has 7 times as many 5 tokens as the boy,” is not efficient or practical for describing the relationship between two quantities. Students develop an understanding of ratio language, such as “For every 7 tokens the girl has, the boy has 5 tokens,” and learn the formal definition of ratio. Students use precise ratio notation and ratio language to describe situations represented pictorially and verbally. Students use a familiar tool, the tape diagram, to represent ratios. As the topic progresses, students recognize that when the ratio of the number of roses to the number of daisies is 6 : 9, there are 2 roses for every 3 daisies. They identify patterns between equivalent ratios and tape diagrams that represent equivalent ratios. At the end of the topic, the term equivalent ratios is formally defined, and students use equivalent ratio reasoning and tape diagrams to determine unknown quantities.
3
3
3
3
3
Number of Roses Number of Daisies
Students apply what they learn about ratio language and equivalent ratios in topic A to a variety of situations throughout the remainder of the module. In topic B, students represent collections of equivalent ratios in ratio tables, double number lines, and graphs and use these representations to solve problems. Later in the module, students use ratio reasoning to compare ratio relationships and solve rate and percent problems.
12
© Great Minds PBC
EUREKA MATH2 6 ▸ M1 ▸ TA
Progression of Lessons Lesson 1
Jars of Jelly Beans
Lesson 2
Introduction to Ratios
Lesson 3
Ratios and Tape Diagrams
Lesson 4
Exploring Ratios by Making Batches
Lesson 5
Equivalent Ratios
© Great Minds PBC
13
1
LESSON 1
Jars of Jelly Beans Use multiplicative reasoning to estimate the solution to a real-world problem.
EUREKA MATH2
Name
6 ▸ M1 ▸ TA ▸ Lesson 1
Date
EXIT TICKET
1
How did your estimate for the number of jelly beans that could fit in each jar compare to the actual number of jelly beans that could fit in each jar? Explain why your estimate was different from the actual number.
Lesson at a Glance This lesson is an open-ended modeling exploration. Students watch a video showing jars of jelly beans and create a class list of questions about the video. Students work in groups and apply multiplicative reasoning to estimate the number of jelly beans in jars. Groups of students present their solution strategies to the class. This lesson is designed as a formative assessment for several Standards for Mathematical Practice. There is an optional extension to challenge students.
Key Question • How can we use multiplicative reasoning to model situations and solve real-world problems?
Achievement Descriptor 6.Mod1.AD3 Solve real-world and mathematical problems by using
ratio reasoning. (6.RP.A.3)
© Great Minds PBC
9
© Great Minds PBC
EUREKA MATH2 6 ▸ M1 ▸ TA ▸ Lesson 1
Agenda
Materials
Fluency
Teacher
Launch 5 min
• Computer with internet access*
Learn 30 min • Explore • Cost of Jelly Beans (Optional)
Land 10 min
• Projection device* • Teach book* Also recommended: • Classroom sound capabilities (i.e., speakers)* • Interactive whiteboard or document camera*
Students • Pencil* • Learn book* • Personal whiteboard, dry-erase marker, and eraser*
Lesson Preparation • None * These materials are only listed in lesson 1. Ready these materials for every lesson in this module.
© Great Minds PBC
15
EUREKA MATH2
6 ▸ M1 ▸ TA ▸ Lesson 1
Fluency Applying Multiplicative Reasoning
Teacher Note
Students use multiplicative reasoning and customary unit conversions to prepare for modeling a real-world problem. Directions: Determine the value that makes each statement true.
16
1.
ne pint is equivalent to 2 cups. One pint is O as large as 1 cup.
2.
ne quart is equivalent to 4 cups. One quart is O as large as 1 cup.
3.
ne gallon is equivalent to 16 cups. One gallon is O as large as 1 cup.
4.
One quart is
times as large as 1 pint.
2
5.
One gallon is
times as large as 1 pint.
8
6.
One gallon is
times as large as 1 quart.
4
times
2
times
times
Fluency activities are short sets of sequenced practice problems that students work on in the first 3–5 minutes of class. Administer a fluency activity as a bell ringer or adapt the activity as a teacher-led Whiteboard Exchange or choral response. Directions for administration can be found in the Fluency resource.
4 16
© Great Minds PBC
EUREKA MATH2 6 ▸ M1 ▸ TA ▸ Lesson 1
Launch
5
Students generate questions about a video. Play part 1 of the video, which shows a jar full of jelly beans and several larger jars of different sizes. What questions do you have? Resist the urge to answer students’ questions. Instead, use this time to encourage student curiosity. Record each question, one at a time, and display it for the class. Then ask the class who else has that same question. Record the number of students who have the same question by placing check marks, plus signs, or other counting marks next to each question. If students do not question the number of jelly beans that could fit in each jar, offer that as your wondering. Ask how many students also find that question interesting. We won’t be able to explore all of these questions today. Let’s first explore how to estimate the number of jelly beans that could fit in each jar. Direct students to record the focus question.
© Great Minds PBC
UDL: Engagement The jars of jelly beans video provides an interesting and familiar context for students to apply multiplicative reasoning. To make real-world connections, have students share whether they have ever estimated the number of items, such as jelly beans, in a jar. Promote relevance by asking them if they used any sort of strategies to make their guesses.
Teacher Note The dialogue shown provides suggested questions and sample responses. To maximize every student’s participation, facilitate discussion by using tools and strategies that encourage student-to-student discourse. For example, make flexible use of the Talking Tool, turn and talk, think–pair–share, and the Always Sometimes Never routine.
17
EUREKA MATH2
6 ▸ M1 ▸ TA ▸ Lesson 1
Learn Explore Students develop, apply, and share their strategies to estimate the number of jelly beans in each jar. Ask the following questions and have several students share their thinking. How many jelly beans do you think could fit in the jars? What is an unreasonable guess? What is too high or too low? If students disagree about whether a guess is unreasonable, have them explain their thinking. Divide the class into groups of four. Allow time for groups to brainstorm the information they need to answer the question. Circulate as groups discuss to monitor progress. Expect students to generate a list similar to the following: • We need to know the number of jelly beans in one layer. • We need to know the weight of the jelly beans and the weights of the jars.
Language Support Consider using strategic, flexible grouping throughout the module. • Pair students who have different levels of mathematical proficiency. • Pair students who have different levels of English language proficiency. • Join pairs to form small groups of four. As applicable, complement any of these groupings by pairing students who speak the same native language.
• We need to know the volume of each jar. • We need to know the size of the smallest jar. • We need to know the sizes of the bigger jars. Invite groups to share their lists with the class. After groups share, tell them you will provide the sizes of the jars. Then display the jars’ labels. After students identify the information they think they need to engage with the focus question, use the following prompt to help them develop a plan. Work with your group to make a plan to answer our focus question. Be prepared to share your solution strategy with the class.
18
© Great Minds PBC
EUREKA MATH2 6 ▸ M1 ▸ TA ▸ Lesson 1
As students work in their groups to explore the focus question, monitor their progress. Play part 1 of the video again and display the label information for students to gather data as needed. If possible, provide access to tools such as calculators or a customary unit conversion table to facilitate student plans. As needed, move groups forward by asking any or all of the following questions: • What do the labels on the jars mean? • How are the sizes of the jars related? • How can we convert between ounces, quarts, and liters?
Differentiation: Support Rather than having students calculate the number of jelly beans in all the jars, consider assigning jars to groups or allowing groups to choose one jar based on the complexity of the unit conversions and calculations.
Differentiation: Challenge
• What assumptions are we making? When groups finish, invite them to display their solution strategies or discuss their strategies with the class. As each group shares, ask the following questions: • Are the answers you found reasonable? How do you know? • What assumptions did you make? How did those assumptions affect your solution?
Consider allowing students who finish early to calculate the total number of jelly beans in all the jars, or have them continue to the Cost of Jelly Beans segment. Direct them to move on while other groups finish.
• What information did you research? How did you use that information? After each group shares, prompt the class to discuss the following question: • How are our solution strategies similar? How are they different? If time permits, continue on to the optional Cost of Jelly Beans segment. However, if only a few minutes remain, play part 2 of the video to reveal to students the number of jelly beans in each jar. Have students discuss in their groups the following questions: • Was our prediction close? • Did we assume anything that was not true? • If we had a similar problem, would we solve the problem differently?
Promoting the Standards for Mathematical Practice When students determine their estimates and assumptions for the jars of jelly beans problem, as well as listen to and analyze their peers’ strategies, they are constructing viable arguments and critiquing the reasoning of others (MP3). Ask the following questions to promote MP3: • Why does your strategy work? Convince the class. • What questions can you ask this group to make sure you understand their strategy? • How would you change your strategy or assumptions to make your estimate more accurate?
© Great Minds PBC
19
6 ▸ M1 ▸ TA ▸ Lesson 1
EUREKA MATH2
Cost of Jelly Beans (Optional) Students estimate the cost to fill the jars with jelly beans. If time permits, display the picture of the bag of jelly beans and follow the question-generating process that was used in Launch. Record the questions that students generated after seeing the picture. Record the number of students who had the same question by placing check marks, plus signs, or other counting marks next to each question. If students did not question the cost to fill each jar with jelly beans, offer that as your wondering. Ask how many students also find that question interesting. Let us focus on finding the cost to fill each jar with jelly beans. Direct students to record the focus question. Allow time for groups to brainstorm the information they need to answer the question. Circulate as groups discuss to monitor progress. Expect students to generate a list similar to the following: • We need to know the number of jelly beans in the bag. • We need to know how much the bag of jelly beans costs. • We need to know how much the bag of jelly beans weighs. • We need to know the number of bags of jelly beans it would take to fill the jars. • We need to know the cost of 1 jelly bean.
20
© Great Minds PBC
EUREKA MATH2 6 ▸ M1 ▸ TA ▸ Lesson 1
Invite groups to share their lists with the class. After groups share, display the picture of the bag of jelly beans that shows the weight and cost. Then display the nutrition label for the bag of jelly beans.
After students identify the information they think they need to engage with the focus question, use the following prompt to direct them to develop a plan. Work with your group to make a plan to answer our new question. Be prepared to share your solution strategy with the class. As students work in their groups to explore the focus question, monitor their progress. Display the pictures for students to gather data as needed. If possible, provide access to tools such as calculators or a customary unit conversion table to facilitate student plans. © Great Minds PBC
21
6 ▸ M1 ▸ TA ▸ Lesson 1
EUREKA MATH2
As needed, move groups forward by asking any or all of the following questions: • What does the serving size on the nutrition label mean? • Can we determine how much the jelly beans in the jars weigh? How? • Can we estimate the number of jelly beans in the bag? How? • What assumptions are we making? When groups finish, invite them to display their solution strategies or discuss their strategies with the class. After all groups have shared, engage students in a discussion by asking the following questions: • Are the answers we found reasonable? • What assumptions did we make? How did those assumptions affect your solution? • What information did you research? How did you use that information? • How are our solution strategies similar? How are they different? Reveal that the cost to fill the small jar with jelly beans is about $1.86. Then ask the following question. Were you surprised by the result? Sample: There are 93 jelly beans in an 8-ounce jar. One serving of 14 jelly beans weighs 41 grams. The bag of jelly beans weighs 425 grams and costs $3.40. Number of servings in bag: 425 ¸ 41 » 10.4 Number of jelly beans in bag: 10.4 ´ 14 = 145.6 Cost for 1 jelly bean: 3.40 ¸ 145.6 » 0.02 Cost for 93 jelly beans: 0.02 ´ 93 = 1.86 It costs about $1.86 to fill an 8-ounce jar.
22
© Great Minds PBC
EUREKA MATH2 6 ▸ M1 ▸ TA ▸ Lesson 1
Land Debrief 5 min Objective: Use multiplicative reasoning to estimate the solution to a real-world problem. Use the following question to help students recognize where they used multiplicative reasoning to answer the focus question from the Explore segment. Encourage students to add to their classmates’ responses. How did your group use what you know about multiplication and unit conversions to find the number of jelly beans in each jar? Select from the following questions to debrief the lesson: • Where did your group run into difficulties? • How did your group overcome obstacles? • What would your group do differently given a problem similar to this one? • What was most helpful?
Exit Ticket 5 min Provide up to 5 minutes for students to complete the Exit Ticket. It is possible to gather formative data even if some students do not complete every problem.
© Great Minds PBC
Teacher Note Assign the Practice problems for completion outside of class or use them in class if time remains after the lesson.
23
EUREKA MATH2
6 ▸ M1 ▸ TA ▸ Lesson 1
Sample Solutions Expect to see varied solution paths. Accept accurate responses, reasonable explanations, and equivalent answers for all student work.
EUREKA MATH2
6 ▸ M1 ▸ TA ▸ Lesson 1
PRACTICE Name
Date
1
EUREKA MATH2
6 ▸ M1 ▸ TA ▸ Lesson 1
Remember For problems 3–5, multiply.
1. How did you use mathematical tools to estimate the number of jelly beans in each jar?
3. 471 × 3
4. 809 × 4
Sample: I used division to calculate about how many jelly beans there are in 1 ounce. Then I used multiplication to find the number of jelly beans in each jar.
1,413
3,236
I used a table to record my calculations and estimates. 5. 975 × 5
4,875
2. You want to estimate how long it will take a hose to fill a 5-gallon bucket with water. a. What information do you need to answer your question? I need to know how fast water flows out of the hose, such as the time it takes to put 1 gallon of water in the bucket.
6. Convert 24 yards to feet.
b. What assumptions might you need to make to answer your question?
72 feet
I would assume that water always flows from the hose at the same rate, with no air bubbles or interruptions. I would assume that the bucket is exactly 5 gallons. c. You use a stopwatch to record the time it takes the hose to fill an 8-ounce jar. You find that it takes 2.5 seconds. With this information, what is a reasonable estimate for how long it will take the hose to fill the 5-gallon bucket? Explain your reasoning.
7. Which statements correctly describe the equation 12 × 15 = 180? Choose all that apply. A. 180 is 15 more than 12.
1 gallon = 128 ounces
B. 180 equals 15 times as many as 12.
128 ¸ 8 = 16
C. 180 equals 12 times as many as 15.
16 × 2.5 = 40
D. 180 is 12 more than 15.
It will take the hose about 40 seconds to put 1 gallon of water in the bucket.
E. 180 represents 12 groups of 15.
40 × 5 = 200 It will take the hose about 200 seconds to fill the 5-gallon bucket.
© Great Minds PBC
24
11
12
P R ACT I C E
© Great Minds PBC
© Great Minds PBC
2
LESSON 2
Introduction to Ratios Write ratios that relate two quantities as an ordered pair of numbers. Use ratio language to compare two quantities.
EUREKA MATH2
6 ▸ M1 ▸ TA ▸ Lesson 2
Name
EXIT TICKET
Date
2
Consider the cans of blue paint and the cans of red paint.
Blue
Blue
Blue
Blue
Blue
Red
Red
Red
Red
Lesson at a Glance In this lesson, students discuss their reactions to a video, which introduces the need to use new language to compare two quantities. After discussing a few examples, students realize that there are situations in which comparing quantities by using multiplicative comparison language is impractical or does not make sense. Through teacher-led instruction and peer discussion, students learn how to write ratios and how to use ratio language to describe the relationship between two quantities. This lesson introduces the term ratio.
Key Questions
For parts (a)–(d), fill in the blank. a. A ratio that relates the number of cans of blue paint to the number of cans of red paint is
5:4 .
• What is a ratio?
b. A ratio that relates the number of cans of red paint to the number of cans of blue paint is
4:5 .
• When is it more practical to use ratio language instead of multiplicative comparison language?
c. There are
5 4
times as many cans of blue paint as cans of red paint.
d. For every
5
cans of blue paint, there are
4
cans of red paint.
Achievement Descriptor 6.Mod1.AD1 Write and explain ratios that describe relationships
between two quantities. (6.RP.A.1)
© Great Minds PBC
15
© Great Minds PBC
EUREKA MATH2 6 ▸ M1 ▸ TA ▸ Lesson 2
Agenda
Materials
Fluency
Teacher
Launch 5 min
• None
Learn 30 min
Students
• A New Language
• None
• From Tokens to Tea
Lesson Preparation
Land 10 min
• None
© Great Minds PBC
27
EUREKA MATH2
6 ▸ M1 ▸ TA ▸ Lesson 2
Fluency Multiplicative Comparisons Students multiply or divide by using multiplicative comparisons to prepare for working with ratio relationships. Directions: Answer each question.
28
1.
What number is twice as large as 10?
20
2.
10 is twice as large as what number?
5
3.
What number is 4 times as large as 7?
28
4.
40 is 4 times as large as what number?
10
5.
What number is 6 times as large as 11?
66
6.
600 is 6 times as large as what number?
100
7.
What number is 10 times as large as 12 ?
5
8.
1 is 10 times as large as what number?
1 10
© Great Minds PBC
EUREKA MATH2 6 ▸ M1 ▸ TA ▸ Lesson 2
Launch
5
Students use multiplicative comparison language to describe the relationship between quantities. Play part 1 of the Unfair Tokens video, which shows an adult giving two children different numbers of carnival tokens. Then facilitate a class discussion to elicit students’ reactions to the video. What is the video about? The video is about an adult giving cups of tokens to two children at a carnival. The girl gets 2 cups of tokens, and the boy gets only 1 cup of tokens. The boy is sad because the girl gets more tokens. What might the boy be thinking? It’s not fair that the girl gets more tokens than he gets. It’s not fair that the girl gets twice as many tokens as he gets. It’s not fair that he gets half as many tokens as the girl gets. If students do not use multiplicative comparison language such as “twice as many” or “two times as many,” use the following prompt. How can we compare the number of tokens the girl receives to the number of tokens the boy receives? The girl receives twice as many tokens as the boy. The boy receives half as many tokens as the girl. Play part 2 of the Unfair Tokens video, which shows the adult giving more tokens to the boy but still results in the children receiving different numbers of tokens. Then ask the following questions.
Teacher Note In grade 5, students used multiplicative comparison language to describe relationships between numbers. For example, 2 yards is 3 twice as much as 1 yard, and 4 yards is 3 3 4 times as much as 1 yard. 3
Why is the boy still sad? He is still sad because the girl still has more tokens than he does.
© Great Minds PBC
29
6 ▸ M1 ▸ TA ▸ Lesson 2
EUREKA MATH2
In the first part of the video, the girl receives twice as many tokens as the boy. How can we compare the number of tokens the girl receives to the number of tokens the boy receives in the second part of the video? The girl receives about 1 3 cups of tokens, and the boy receives about 1 1 cups of tokens. 4 4 The girl doesn’t get twice as many tokens as the boy, but she still gets more tokens than the boy. Help students recall that after watching the first part of the video, they used multiplicative language to compare the number of tokens each child receives when the girl gets twice as many tokens as the boy. Ask students whether they can use multiplicative language to compare the numbers of tokens the girl and boy receive in the second part of the video. Anticipate that most students will not give an answer or will find it difficult to express a comparison of the numbers by using multiplicative language. Today, we will learn new language that we can use, instead of multiplicative comparison language, to compare quantities.
Learn A New Language Students write ratios and use multiplicative comparison language and ratio language to describe relationships between quantities. Have students think back to part 1 of the Unfair Tokens video. Display the picture of three cups.
UDL: Action and Expression To support students in expressing learning in flexible ways, consider providing students with access to manipulatives, such as cups with marbles or coins, to help them visualize the relationship between the numbers of tokens the girl and boy get.
30
© Great Minds PBC
EUREKA MATH2 6 ▸ M1 ▸ TA ▸ Lesson 2
Ask the following question. Suppose each cup has 8 tokens in it. How many tokens would each child have? The girl would have 16 tokens, and the boy would have 8 tokens.
Ask students to choose a different number of tokens that a cup might hold. Then have them determine the number of tokens each child would have. Have students write their examples on a personal whiteboard and hold it up for you to see. Write the word ratios on the board and record several students’ answers by using ratio notation as shown.
ratios 16 : 8 20 : 10 12 : 6 These pairs of numbers are called ratios. They relate the number of tokens the girl receives to the number of tokens the boy receives. Point to the ratio 16 : 8. We say this ratio as “16 to 8.” We can write a ratio by using a colon between the numbers or the word to. What can we multiply the second number in each ratio by to get the first number in each ratio? Why?
Teacher Note Avoid using fraction notation such as A to B represent ratios because computations for ratios and fractions are not the same. For example, consider a batch of green paint that is 1 part yellow paint and 3 parts blue paint. The ratio of the number of parts yellow paint to the number of parts blue paint is 1 to 3. In two batches of green paint, the ratio of the number of parts yellow paint to the number of parts blue paint is 2 to 6. Using fraction notation, students might conclude that 2 is 6 twice as large as 1 . 3
We can multiply the second number in each ratio by 2 to get the first number in each ratio because the first number in each ratio is twice as much as the second number in each ratio.
© Great Minds PBC
31
EUREKA MATH2
6 ▸ M1 ▸ TA ▸ Lesson 2
Next, have students think back to part 2 of the Unfair Tokens video. Display the picture of a cup that has 8 tokens in it.
Language Support Have students think–pair–share about the following question. If necessary, replay part 2 of the video. Suppose that each cup has 8 tokens in it. How many tokens would each child have if the girl receives 1 3 cups of tokens and the boy receives 1 1 cups of tokens? 4
4
The girl would have 14 tokens, and the boy would have 10 tokens.
Ask students to choose a different number of tokens that a cup might hold. Then have them determine the number of tokens each child would have if the girl still has 1 3 cups of tokens 4 and the boy still has 1 1 cups of tokens. Have students write their examples as ratios on a 4 personal whiteboard and hold it up for you to see. Write the word ratios on the board and record several students’ answers by using ratio notation as shown.
ratios 14 : 10 21 : 15 7:5
To support understanding of multiplicative comparison language, ratio language, and the word ratio, consider making an anchor chart showing a visual of sorted shapes, paired with the following color-coded sentence frames.
Blue
• There are as red circles.
Red
times as many blue circles
• A ratio that relates the number of blue circles to the number of red circles is : . • For every blue circles, there are red circles. The term ratio is formally defined at the end of Learn.
What patterns do you notice about the first numbers in the ratios? What patterns do you notice about the second numbers in the ratios? The first numbers are multiples of 7, and the second numbers are multiples of 5.
32
© Great Minds PBC
EUREKA MATH2 6 ▸ M1 ▸ TA ▸ Lesson 2
Have students think–pair–share about the following question. When we discussed the situation where the girl gets twice as many tokens as the boy, we said we could multiply the second number in each ratio by 2 to get the first number in each ratio. In this example, what can we multiply the second number in each ratio by to get the first number in each ratio? We can multiply the second number in each ratio by 7 to get the first number 5 in each ratio. If students do not say that they can multiply the second number in each ratio by 7 to get 5 the first number in each ratio, suggest that they try it. Then ask them whether that worked and use the following prompts to guide the discussion. When we multiply the second number in each ratio by 2 to get the first number in each ratio, we can compare the numbers by saying that the first number in each ratio is 2 times, or twice, as much as the second number in each ratio.
Differentiation: Support To support students with multiplying fractions, consider modeling the multiplication for one of the ratios as shown. Have students do the multiplication for the other ratios.
10 ×
7 10 7 = × 5 1 5 70 = 5
= 14
We can multiply the second number in each ratio by 7 to get the first number in each 5 ratio. So how can we compare the numbers by using multiplicative language? The first number in each ratio is 7 times as much as the second number in each ratio. 5
How can we use multiplicative language to compare the number of tokens the girl receives to the number of tokens the boy receives in the second part of the video? The girl receives 7 times as many tokens as the boy. 5
Point out that it is difficult, but not impossible, to talk about fractional multiplicative comparisons. Then ask the following question. Can we use better language to describe the relationship between the numbers of tokens the children receive? Turn and talk to your partner. Invite students to share their suggestions. If no students use ratio language to describe the ratios, use the following prompt. Finish this sentence: For every 7 tokens the girl receives,
.
the boy receives 5 tokens
© Great Minds PBC
33
EUREKA MATH2
6 ▸ M1 ▸ TA ▸ Lesson 2
For every 7 tokens the girl receives, the boy receives 5 tokens. We call this ratio language. Why do you think we call it that?
Teacher Note
We call it that because it describes a ratio. Ratio language describes the relationship between the quantities in a ratio. The phrase “7 tokens” is an example of a quantity, because it includes both a number, 7, and a unit, tokens. A ratio only includes numbers, which is why it is written as 7 : 5 and not as 7 tokens : 5 tokens. Can you use ratio language to describe the relationship between the quantities when the girl receives twice as many tokens as the boy? How? Yes. For every 2 tokens the girl receives, the boy receives 1 token. Direct students to problem 1. Allow them to work on the problem individually or in pairs. 1. Lisa has 9 tokens. Toby has 13 tokens. Which statements describe the relationship between the two quantities? Choose all that apply.
A ratio A : B is an ordered pair of numbers that relates two quantities. A ratio, such as 3 : 2, only tells us two numbers. It does not tell us which two quantities the ratio relates. A quantity can be a discrete count of objects, such as the number of apples, or a measurement of an object, such as the measure in inches of a segment. In other words, “3” is a number, but “3 apples” or “3 inches” is a quantity. Examples of a quantity include a length, a volume, a weight, and a length of time. Model with students the precise use of the terms number and quantity.
A. Lisa has 9 as many tokens as Toby. 13
B. Lisa has 13 times as many tokens as Toby. 9
C. A ratio that relates the number of tokens Lisa has to the number of tokens Toby has is 9 : 13. D. A ratio that relates the number of tokens Lisa has to the number of tokens Toby has is 13 : 9. E. For every 9 tokens Lisa has, Toby has 13 tokens. F. For every 9 tokens Toby has, Lisa has 13 tokens.
Promoting the Standards for Mathematical Practice When students use ratios to accurately describe a real-world context, they are reasoning quantitatively and abstractly (MP2). Ask the following questions to promote MP2: • What does the ratio 9 : 13 mean in the context of tokens? • What real-world situations are modeled by ratios?
34
© Great Minds PBC
EUREKA MATH2 6 ▸ M1 ▸ TA ▸ Lesson 2
When most students have finished, display problem 1 and its answer choices. Discuss each answer choice one at a time. Ask students whether they think the answer choice does or does not describe the relationship between the two quantities and why. Use the following reasoning to supplement students’ understanding: • A is correct. We can multiply the number of tokens Toby has, 13, by 9 to get 9, the number 13 of tokens Lisa has. • B is incorrect. If we multiply the number of tokens Toby has, 13, by 13 , we do not get the 9 number of tokens Lisa has.
UDL: Representation
• C is correct because Lisa has 9 tokens and Toby has 13 tokens.
Consider presenting the information in another format by providing students with real objects for reference. For the tea situation, show students an actual packet of sugar and an 8-ounce cup or pictures of a packet of sugar and an 8-ounce cup.
• D is incorrect because the numbers in the ratio are written in the wrong order. Lisa does not have 13 tokens, and Toby does not have 9 tokens. • E is correct because Lisa has 9 tokens and Toby has 13 tokens. • F is incorrect because Toby does not have 9 tokens and Lisa does not have 13 tokens.
From Tokens to Tea Students write ratios and use ratio language to describe the relationship between two quantities. Display the following sentence. • Jada always puts 2 packets of sugar in her 8-ounce cup of tea. Facilitate a discussion by using the following prompts. What is a ratio that relates the number of ounces of tea to the number of packets of sugar? A ratio that relates the number of ounces of tea to the number of packets of sugar is 8 : 2. If Jada makes a 16-ounce cup of tea, how many packets of sugar do you expect her to put in her tea? Why? I expect Jada to put 4 packets of sugar in a 16-ounce cup of tea. Because 16 ounces is twice as much as 8 ounces, she will need twice as much sugar. Pause the discussion and allow students to debate the answer to the following question.
© Great Minds PBC
Differentiation: Challenge Challenge students by asking the following questions about the tea situation. Have them explain their reasoning. • If Jada makes a 1-ounce cup of tea, how many packets of sugar do you expect her to put in her tea? I expect Jada to put 1 packet of sugar in 4 1 ounce of tea. • If Jada makes a 20-ounce cup of tea, how many packets of sugar do you expect her to put in her tea? I expect Jada to put 5 packets of sugar in 20 ounces of tea.
35
6 ▸ M1 ▸ TA ▸ Lesson 2
EUREKA MATH2
Can you use multiplicative comparison language to describe the relationship between the number of ounces of tea and the number of packets of sugar? If so, how? Turn and talk to your partner. After students finish their discussion, pose the following question. Is there 4 times as much tea as sugar? Explain. No. The tea is measured in ounces and the sugar is measured in packets. We cannot compare tea and sugar with multiplicative language because they do not have the same units. Have students think–pair–share about the following questions. What makes the tea situation different from the token situation? In other words, why can we use times as many, or multiplicative language, to compare the numbers of tokens the children receive? Why can’t we use multiplicative language to compare the number of ounces of tea and the number of packets of sugar in Jada’s tea? In the token situation, we compared the same units, tokens. In the tea situation, the units are different, ounces and packets. The units in the tea situation, ounces and packets, are different. What could you say to describe the relationship between these quantities that would make sense? For every 8 ounces of tea, Jada uses 2 packets of sugar. How many packets of sugar do you expect Jada to put in a 4-ounce cup of tea? Explain. I expect Jada to put 1 packet of sugar in a 4-ounce cup of tea. Because 4 ounces is half as much as 8 ounces, she will need half as much sugar. How many packets of sugar do you expect Jada to put in a 12-ounce cup of tea? Explain. I expect Jada to put 3 packets of sugar in a 12-ounce cup of tea. For every 4 ounces of tea, Jada uses 1 packet of sugar.
36
© Great Minds PBC
EUREKA MATH2 6 ▸ M1 ▸ TA ▸ Lesson 2
Invite students to think of other situations where they would use ratios or for every comparison language. Use the following sequence of questions to elicit students’ ideas: • What is interesting about the comparisons made in the token videos? • So it’s interesting when something seems out of balance or unfair. Any other times? • Can you imagine a time when it would be important to express the relationship between quantities like we did when comparing the amounts of tea and sugar? For each situation that students share, ask whether the quantities in the situation have common units or different units. Then direct students to problems 2 and 3. Have them complete the problems individually or in pairs. 2. A recipe for lemonade calls for 2 lemons and 5 cups of water. Which statements describe the relationship between the two quantities? Choose all that apply. A. A ratio that relates the number of lemons to the number of cups of water is 2 to 5. B. A ratio that relates the number of cups of water to the number of lemons is 5 to 2. C. A ratio that relates the number of cups of water to the number of lemons is 2 to 5. D. For every 5 cups of water, there are 2 lemons. E. For every 2 cups of water, there are 5 lemons. F. There is 2 12 times as much water as lemons. 3. To make light blue paint, Ryan mixes 2 ounces of white paint with 6 ounces of blue paint. For parts (a)–(e), fill in the blanks. a. A ratio that relates the number of ounces of white paint to the number of ounces of blue paint is 2 : 6 . b. A ratio that relates the number of ounces of blue paint to the number of ounces of white paint is 6 : 2 . c. For every
2
ounces of white paint, Ryan mixes 6 ounces of blue paint.
d. For every 1 ounce of white paint, Ryan mixes e. Ryan uses
© Great Minds PBC
3
3
ounces of blue paint.
times as much blue paint as white paint.
37
EUREKA MATH2
6 ▸ M1 ▸ TA ▸ Lesson 2
After a few minutes or once most students are finished, select students to share their answers and explain their reasoning. As students share, ask them whether the quantities in the situation have common units or different units. Then use the following prompts to guide discussion about the definition of a ratio. In the tea situation, for every 8 ounces of tea, Jada uses 2 packets of sugar. We wrote the ratio 8 : 2 to relate the number of ounces of tea to the number of packets of sugar in Jada’s tea.
Teacher Note If students ask why the numbers in a ratio both cannot be zero, ask them whether it makes sense to compare quantities that have numbers in a ratio of 0 to 0. This part of the definition is revisited in lesson 5.
Suppose that we wrote a ratio to relate the number of ounces of tea to the number of packets of sugar in Jada’s tea as 2 : 8. Does that change the meaning? Yes. That means for every 2 ounces of tea, Jada uses 8 packets of sugar. How would you define the word ratio? Turn and talk to your partner. A ratio is an ordered pair of numbers that are not both zero. Why do you think the definition includes the word ordered? It includes the word ordered because the order in which the quantities are described tells us the order of the numbers in the ratio. Have students look around the classroom. Ask them to correctly use ratios to describe objects they see.
38
© Great Minds PBC
EUREKA MATH2 6 ▸ M1 ▸ TA ▸ Lesson 2
Land Debrief 5 min Objectives: Write ratios that relate two quantities as an ordered pair of numbers. Use ratio language to compare two quantities. Use the following prompts to guide a discussion about ratios and ratio language. Encourage students to restate or build upon one another’s responses. When is it more practical to use ratio language instead of multiplicative comparison language? Give an example of a relationship between two quantities by using ratio language. It is more practical to use ratio language when the two quantities have different units, like ounces of tea and packets of sugar. For every 8 ounces of tea, there are 2 packets of sugar. It is also more practical to use ratio language when the multiplicative relationship isn’t easily calculated, like when the girl had 7 times as many tokens 5 as the boy. Describe the meaning of ratio in your own words. A ratio is an ordered pair of numbers that describes the relationship between two quantities. What are two quantities that you would love to have in a ratio of 5 : 2 but would not like to have in a ratio of 2 : 5? Sample: I would love to have the ratio of the number of hours I spend hanging out with friends to the number of hours I spend doing homework be 5 : 2.
Exit Ticket 5 min Provide up to 5 minutes for students to complete the Exit Ticket. It is possible to gather formative data even if some students do not complete every problem.
© Great Minds PBC
Teacher Note Assign the Practice problems for completion outside of class or use them in class if time remains after the lesson. Refer students to the Recap for support.
39
EUREKA MATH2
6 ▸ M1 ▸ TA ▸ Lesson 2
Recap
EUREKA MATH2
6 ▸ M1 ▸ TA ▸ Lesson 2
RECAP Name
Date
2
2. There are 12 students who take orchestra class. There are 4 times as many students who take band class as students who take orchestra class. a. Write a ratio that relates the number of students who take orchestra class to the number of students who take band class.
Introduction to Ratios In this lesson, we
A ratio that relates the number of students who take orchestra class to the number of students who take band class is 12 : 48.
Terminology
•
wrote ratios to relate two quantities.
•
used multiplicative comparison language to compare two quantities.
A ratio is an ordered pair of numbers that are not both zero.
•
used ratio language to compare two quantities.
A ratio can be written as A to B or A : B.
Yes. Scott is correct because there are 4 times as many students who take band class as students who take orchestra class and 1 ´ 4 = 4.
1. Consider the collection of shapes shown. Which statements correctly describe the collection of shapes? Choose all that apply. The order in which the quantities are described tells us the order of the numbers in the ratio.
1
There are 4 as many students who take orchestra class as students who take band class.
So the ratio of the number of orange rectangles to the number of blue pentagons is 4 : 5, not 5 : 4.
A. A ratio that relates the number of orange rectangles to the number of blue pentagons is 5 : 4.
C. For every 1 circle, there are 2 rectangles. D. There are 1 as many orange 2 rectangles as yellow circles.
© Great Minds PBC
40
The number of students who take band class is 48 because 4 ´ 12 = 48.
b. Scott uses ratio language to describe the ratio from part (a). He says that for every 1 student who takes orchestra class, there are 4 students who take band class. Is Scott correct? Why?
Examples
B. There are 2 12 times as many pentagons as circles.
EUREKA MATH2
6 ▸ M1 ▸ TA ▸ Lesson 2
A ratio that relates the number of pentagons to the number of circles is 5 : 2. That means there are 25 , or 2 12 , times as many pentagons as circles.
For every 2 circles, there are 4 rectangles. That means there are twice as many rectangles as circles. So for every 1 circle, there are 2 rectangles.
For every 4 orange shapes, there are 2 yellow shapes. That means there are 2 times as many orange rectangles as yellow circles, not 12 as many.
17
18
© Great Minds PBC
© Great Minds PBC
EUREKA MATH2 6 ▸ M1 ▸ TA ▸ Lesson 2
Sample Solutions Expect to see varied solution paths. Accept accurate responses, reasonable explanations, and equivalent answers for all student work.
EUREKA MATH2
6 ▸ M1 ▸ TA ▸ Lesson 2
PRACTICE Name
Date
2
EUREKA MATH2
6 ▸ M1 ▸ TA ▸ Lesson 2
3. Sasha says there are 1 12 times as many circles as triangles in the picture in problem 2. Is she correct? Explain. Sasha is correct because there is 1 triangle for every 1 12 circles.
1. A smoothie recipe calls for bananas and strawberries in the ratio represented by the picture.
4. At an animal shelter, 9 dogs and 15 cats are ready for adoption. Fill in the blanks to make the statements true. a. For every
B. There are
7 2
times as many strawberries as bananas.
C. For every
2
bananas, there are 7 strawberries.
D. There are
2 7
times as many bananas as strawberries.
dogs, there are 15 cats.
b. For every 3 dogs, there are
For parts (a)–(d), fill in the blanks. A. A ratio that relates the number of strawberries to the number of bananas is
9
7:2 .
c. There are
5
3
5
cats.
times as many cats as dogs.
5. Students at a middle school take an elective during the last hour of the school day. There are 11 students who take an art class. There are 3 times as many students who take a music class as students who take an art class. a. What is a ratio that relates the number of students who take a music class to the number of students who take an art class? A ratio that relates the number of students who take a music class to the number of students who take an art class is 33 : 11.
2. Consider the collection of shapes shown. Which statements correctly describe the collection of shapes? Choose all that apply.
b. Kayla uses ratio language to describe the ratio from part (a). She says that for every 3 students who take a music class, there is 1 student who takes an art class. Is Kayla correct? Why? Yes. Kayla is correct because there are 3 times as many students who take a music class as students who take an art class.
A. A ratio that relates the number of red squares to the number of blue circles is 4 : 3.
Remember
B. There are 2 times as many triangles as squares.
For problems 6–8, multiply.
C. There are 12 as many triangles as squares.
6. 1,312 ´ 3
3,936
D. For every 1 triangle, there are 2 squares.
7. 2,214 ´ 4
8,856
8. 5,631 ´ 5
28,155
E. A ratio that relates the number of squares to the number of circles is 3 : 4.
© Great Minds PBC
© Great Minds PBC
19
20
P R ACT I C E
© Great Minds PBC
41
EUREKA MATH2
6 ▸ M1 ▸ TA ▸ Lesson 2
EUREKA MATH2
6 ▸ M1 ▸ TA ▸ Lesson 2
9. Convert 5 hours to minutes.
300 minutes
10. Each model is divided into equal sections. Which models have a shaded portion that represents the fraction 12 ? Choose all that apply.
A.
B.
C.
D.
E.
F.
© Great Minds PBC
42
P R ACT I C E
21
© Great Minds PBC
3
LESSON 3
Ratios and Tape Diagrams Write multiple ratios to describe the same situation. Represent ratios with tape diagrams.
EUREKA MATH2
Name
6 ▸ M1 ▸ TA ▸ Lesson 3
Date
EXIT TICKET
3
Tyler has 24 quarters and 6 dimes. a.
Write and explain the meaning of two ratios that could represent this situation. Sample: The ratio of the number of quarters to the number of dimes is 24 : 6.
Lesson at a Glance In this lesson, students write and compare different ratios to represent people sitting at tables in a restaurant. They write both part-to-part and part-to-whole ratios. Then they group the people in different ways and use ratio language to describe the groupings. Through teacher-led facilitation and partner interaction, students represent ratios with tape diagrams.
The ratio of the number of dimes to the total number of coins is 6 : 30.
Key Questions b.
• How can multiple ratios describe one situation?
Tyler puts all the coins in bags. Every bag has the same number of quarters and the same number of dimes. How many bags of coins can Tyler make? How many quarters and how many dimes are in each bag?
• What are the important characteristics of tape diagrams that represent ratios?
Sample: He can make 6 bags, each with 4 quarters and 1 dime.
Achievement Descriptors c.
Use ratio language to describe the relationship between the number of quarters and the number of dimes in each bag from part (b). Sample: For every 4 quarters, there is 1 dime.
6.Mod1.AD1 Write and explain ratios that describe relationships
between two quantities. (6.RP.A.1) 6.Mod1.AD3 Solve real-world and mathematical problems by using
ratio reasoning. (6.RP.A.3)
© Great Minds PBC
27
© Great Minds PBC
EUREKA MATH2 6 ▸ M1 ▸ TA ▸ Lesson 3
Agenda
Materials
Fluency
Teacher
Launch 5 min
• None
Learn 30 min
Students
• Shirts and Seating Arrangements
• None
• Using Tape Diagrams to Represent Ratios
Lesson Preparation • None
Land 10 min
© Great Minds PBC
45
EUREKA MATH2
6 ▸ M1 ▸ TA ▸ Lesson 3
Fluency Grouping Objects Students sort objects into equal groups to prepare for writing multiple ratios that represent the same situation. Directions: Use the collection of 24 spiders to complete each sentence. For problems 5 and 6, choose combinations of numbers that were not used in problems 1–4. 1.
24 spiders can be sorted into 4 groups of
2.
24 spiders can be sorted into of 4 spiders.
3.
24 spiders can be sorted into 12 groups of
groups
spiders.
4.
24 spiders can be sorted into of 12 spiders.
groups
5.
24 spiders can be sorted into
groups
24 spiders can be sorted into
groups
of
6.
of
46
spiders.
spiders.
spiders.
6 6 2 2 8, 3 or 3, 8 3, 8 or 8, 3
© Great Minds PBC
EUREKA MATH2 6 ▸ M1 ▸ TA ▸ Lesson 3
Launch
5
Students use multiple ratios to describe a situation. Display the picture of people sitting in a restaurant. Facilitate a discussion by using the following prompts.
Red
Red
Red
Red
Red
Red
Blue
Blue
Blue
Blue
Red
Red
Red
Red
Red
Red
Blue
Blue
Blue
Blue
Imagine that you walk into a restaurant and see these 20 people. What do you notice? Everyone is wearing red or blue shirts. The people wearing red shirts are sitting together, and the people wearing blue shirts are sitting together. There are exactly 2 people at each table. What do you wonder? I wonder why people are only wearing red or blue shirts. I wonder why so many people are wearing red shirts. I wonder if people are wearing red or blue to support a sports team. I wonder why there are exactly 2 people at each table. Why might you be surprised if you walked into this restaurant? It’s unlikely that everyone in one restaurant at the same time would be wearing only two colors. It’s unlikely that every table in a restaurant would seat exactly 2 people. Is it likely that you would see this exact ratio of shirt colors if you walked into a different restaurant? Explain. No. It’s highly unlikely that in another restaurant with 20 people, 12 would be wearing red shirts and 8 would be wearing blue shirts. © Great Minds PBC
47
6 ▸ M1 ▸ TA ▸ Lesson 3
EUREKA MATH2
Ask students to think–pair–share about the following prompt. Write a ratio that represents this situation. Sample: The ratio of the number of red shirts to the number of blue shirts is 12 : 8. If students all share the same ratio, provide additional possibilities, such as the ratio of the number of blue shirts to the number of red shirts or the number of red shirts to the total number of shirts. We have heard more than one ratio. Who is correct? Explain. Sample: Everyone is correct because there is more than one ratio to represent this situation. Today, we will learn to write multiple ratios that describe the same situation.
Learn Shirts and Seating Arrangements Students write and explain multiple ratios to describe a situation. Display the following sentences. A. The ratio is 12 red shirts : 8 blue shirts. B. The ratio of the number of red shirts to the number of blue shirts is 8 : 12. C. The ratio of the number of red shirts to the number of blue shirts is 12 : 8. D. The ratio of red shirts to blue shirts is 12 : 8. Ask the students to think–pair–share about the following prompt. Only one of the sentences is correct. Which one? Be prepared to explain your choice. C is correct. Both the description of the ratio and the numbers in the ratio are in the correct order. Choice C uses precise ratio language and the ratio does not include units.
48
Promoting the Standards for Mathematical Practice Students attend to precision (MP6) when they consider the order of the numbers in ratios and use correct ratio language and notation to describe the relationship between quantities. Ask the following questions to promote MP6: • Where is it easy to make mistakes when writing ratios? • Is it exactly right to say that the ratio of pens to pencils is 3 to 6? What can we add or change to be more precise? • Is it exactly right to say that the ratio is 3 pens to 6 pencils? What can we add or change to be more precise?
© Great Minds PBC
EUREKA MATH2 6 ▸ M1 ▸ TA ▸ Lesson 3
Display the Launch picture of people sitting in a restaurant. Use the following questions to lead a discussion about additional ratios that are represented in the picture. What could the ratio 8 : 12 represent? Sample: The ratio 8 : 12 could represent the ratio of the number of blue shirts to the number of red shirts. The ratio 8 : 12 could represent the ratio of the number of people wearing blue shirts to the number of people wearing red shirts.
UDL: Representation Consider asking students to use personal whiteboards to answer the questions you ask in the class discussion about the people in the restaurant. With a personal whiteboard, students can process the information in another format and show their thinking.
What could the ratio 8 : 20 represent?
The ratio 8 : 20 could represent the ratio of the number of blue shirts to the total number of shirts. 3
Is it accurate to say that there are 2 times as many red shirts as blue shirts? Explain. Yes. There are 12 red shirts and 8 blue shirts and 12 = 3 . 8
2
Imagine that the 20 people wearing red or blue shirts sit at tables with 10 seats each. Each table should have the same ratio of the number of red shirts to the number of blue shirts. How many people wearing red shirts and how many people wearing blue shirts should be seated at each table? Each table should have 6 people wearing red shirts and 4 people wearing blue shirts. Display the seating arrangement diagram of people sitting at tables of 10.
R
B
R
R
B
R
B
R
B
R
B
R
B
R
© Great Minds PBC
R
R
B
R
R
B
49
EUREKA MATH2
6 ▸ M1 ▸ TA ▸ Lesson 3
Based on this diagram, what could the ratio 6 : 4 represent?
The ratio 6 : 4 could represent the ratio of the number of red shirts to the number of blue shirts at each table. Display again the Launch picture of people sitting in a restaurant. Imagine that the 20 people wearing red or blue shirts sit at tables with 5 seats each. Each table should have the same ratio of the number of red shirts to the number of blue shirts. How many people wearing red shirts and how many people wearing blue shirts should be seated at each table? Each table should have 3 people wearing red shirts and 2 people wearing blue shirts. Display the seating arrangement diagram of people sitting at tables of 5. B
B
R
B
R
R
B
R
B
R
R
B
R
B
R
R
R
B
R
R
Based on this diagram, what could the ratio 3 : 2 represent?
The ratio 3 : 2 could represent the ratio of the number of red shirts to the number of blue shirts at each table. Use ratio language to describe the relationship between the number of red shirts and the number of blue shirts at each table. For every 3 red shirts, there are 2 blue shirts.
50
© Great Minds PBC
EUREKA MATH2 6 ▸ M1 ▸ TA ▸ Lesson 3
Display again the Launch picture of people sitting in a restaurant. Imagine that the people in this restaurant sit at 5 tables with 4 seats each. Suppose the people wearing red shirts sit together and the people wearing blue shirts sit together. Describe how the seating arrangement could look. There could be 4 people wearing red shirts at each of 3 tables and 4 people wearing blue shirts at each of 2 tables. Display the seating arrangement diagram of people sitting at tables of 4. R
R
R
R
R
R
B
B
B
B
R
R
R
R
R
R
B
B
B
B
Based on this diagram, what could the ratio 3 : 2 represent?
The ratio 3 : 2 could represent the ratio of the number of tables with people wearing red shirts to the number of tables with people wearing blue shirts. Use ratio language to describe the relationship between the number of tables with people wearing red shirts and the number of tables with people wearing blue shirts. For every 3 tables with people wearing red shirts, there are 2 tables with people wearing blue shirts.
© Great Minds PBC
51
EUREKA MATH2
6 ▸ M1 ▸ TA ▸ Lesson 3
Display the picture showing all the different seating arrangements at the restaurant.
Red
Red
Red
Red
Red
Red
Blue
Blue
Blue
Blue
Red
Red
Red
Red
Red
Red
Blue
Blue
Blue
Blue
R
R
B
R
R R R B
R
B
R
B
R
B
R
B
B
R
B
R
R
B
B
R
R
B B
B
R
R
B
R
B
R
R
R
R
B
R
R
R
R
R
R
R
R
B
B
B
B
R
R
R
R
R
R
B
B
B
B
Ask students to think–pair–share about the following question. We have looked at several ways this group of 20 people could be seated at the restaurant. Do you think the ratios 6 : 4 and 3 : 2 accurately represent the same situation as the ratio 12 : 8? Allow students to share their thoughts with the class. Anticipate some debate among students. Validate a range of ideas but highlight responses that include ratio language to justify why all three ratios represent the same situation. Anticipate that some students will say, “For every 3 red shirts, there are 2 blue shirts.” Emphasize this thinking as an efficient way of explaining why all three ratios accurately describe the same situation. Have students work with a partner to complete problem 1. Circulate as students work, ensuring that students attend to precision when they write ratios and use ratio language. 52
© Great Minds PBC
EUREKA MATH2 6 ▸ M1 ▸ TA ▸ Lesson 3
1. In the flower case at the supermarket, there are 5 bouquets of red roses and 4 bouquets of pink roses. Each bouquet is half a dozen roses. a. Write and explain the meaning of two ratios that could represent this situation. Sample: The ratio of the number of bouquets of red roses to the number of bouquets of pink roses is 5 : 4. The ratio of the total number of red roses to the total number of pink roses is 30 : 24. b. A florist uses all the roses to make new bouquets. Each bouquet is an identical mixture of red roses and pink roses. How many bouquets can he make? How many red roses and how many pink roses are in each bouquet? Sample: He makes 6 new bouquets, each with 5 red roses and 4 pink roses. c. Use ratio language to describe the relationship between the number of red roses and the number of pink roses in each bouquet in part (b). For every 5 red roses, there are 4 pink roses. When most students are finished, bring the class together and confirm their responses if needed.
© Great Minds PBC
53
EUREKA MATH2
6 ▸ M1 ▸ TA ▸ Lesson 3
Using Tape Diagrams to Represent Ratios Students draw tape diagrams to represent ratios. Display the picture of the school photo. Facilitate a discussion by using the following prompts.
5 cm
7 cm
A school photography company offers printed photos that have a width of 5 centimeters and a height of 7 centimeters. What is the ratio of the width of the photo to the height of the photo? The ratio of the width of the photo to the height of the photo is 5 : 7. Read the following statements aloud to students or consider displaying them for students to read. • The ratio of the width of the photo to the height of the photo is 5 to 7. • The ratio of the width of the photo to the height of the photo is 5 centimeters to 7 centimeters. Which statement is correct? Why? The first statement is correct because ratios do not include units.
54
© Great Minds PBC
EUREKA MATH2 6 ▸ M1 ▸ TA ▸ Lesson 3
Display the tape diagram that represents the ratio of the width of the photo to the height of the photo. Help students see that diagrams can be used to model the relationship between two numbers in a ratio and that one type of diagram often used is a tape diagram.
Teacher Note
Width
Tape diagrams are used frequently in module 1 for modeling ratio relationships and in problem solving with ratios, rates, and percents.
Height
What does each unit in the tape diagram represent? Each unit in the tape diagram represents 1 centimeter. Allow students a couple of minutes to complete problems 2 and 3 with a partner. Circulate as partners work and look for correct ratios written with proper notation.
Each section in a tape diagram is called a unit. Units are the same size and represent the same quantity. For example, in the tape diagram representing the ratio of the width of the photo to the height of the photo, each unit represents 1 centimeter. Encourage students to attend to precision when drawing tape diagrams.
2. The company also offers printed photos that have a width of 5 inches and a height of 7 inches.
5 in
a. Draw a tape diagram to represent the ratio of the width of the photo to the height of the photo.
Width Height
7 in
b. What does 1 unit in the tape diagram represent? One unit in the tape diagram represents 1 inch. c. What is the ratio of the width of the photo to the height of the photo? The ratio of the width of the photo to the height of the photo is 5 : 7.
© Great Minds PBC
55
EUREKA MATH2
6 ▸ M1 ▸ TA ▸ Lesson 3
d. What is the ratio of the height of the photo to the width of the photo? The ratio of the height of the photo to the width of the photo is 7 : 5. e. The height of the photo is
7 5
times as much as the width of the photo.
f. What is the ratio of the width of the photo to the perimeter of the photo? The ratio of the width of the photo to the perimeter of the photo is 5 : 24. 3. Many older televisions have the ratio of width to height that is represented in the tape diagram. TV Width TV Height a. What is the ratio of the width of the television to the height of the television? Sample: The ratio of the width of the television to the height of the television is 4 : 3. b. According to the tape diagram, what could be a possible width and height of an older television? Sample: An older television could be 40 inches wide and 30 inches high. When most students are finished, use the following prompts to debrief problem 2. We examined a photo with a width of 5 centimeters and a height of 7 centimeters. We also examined a photo with a width of 5 inches and a height of 7 inches. Was the ratio of the width of the photo to the height of the photo the same in both cases? Explain. Yes. In both cases, the ratio of the width of the photo to the height of the photo was 5 : 7 because ratios do not have units. Is the height 7 times as much as the width for both photos? Explain. 5
Yes. 7 inches is 7 times as much as 5 inches, and 7 centimeters is 7 times as much 5 5 as 5 centimeters. Invite students to share responses to part (b) of problem 3. Acknowledge all correct answers.
56
© Great Minds PBC
EUREKA MATH2 6 ▸ M1 ▸ TA ▸ Lesson 3
Land Debrief 5 min Objectives: Write multiple ratios to describe the same situation. Represent ratios with tape diagrams. Use the following questions to initiate a class discussion about writing and representing ratios. Encourage students to add to one another’s responses. Can multiple ratios describe one situation? Give an example. Sample: Yes. We used the ratios 12 : 8, 6 : 4, and 3 : 2 to represent the shirt situation, even though the numbers of each color of shirt and the total number of shirts didn’t change. What are the important characteristics of tape diagrams that represent ratios? Tape diagrams that represent ratios have two tapes, one for each quantity in the ratio. Each unit in the tape diagram is the same size and represents the same quantity, such as 1 shirt or 1 inch.
Exit Ticket 5 min Provide up to 5 minutes for students to complete the Exit Ticket. It is possible to gather formative data even if some students do not complete every problem.
Teacher Note Assign the Practice problems for completion outside of class or use them in class if time remains after the lesson. Refer students to the Recap for support.
© Great Minds PBC
57
EUREKA MATH2
6 ▸ M1 ▸ TA ▸ Lesson 3
Recap
EUREKA MATH2
6 ▸ M1 ▸ TA ▸ Lesson 3
RECAP Name
Date
3
6 ▸ M1 ▸ TA ▸ Lesson 3
EUREKA MATH2
2. Lisa has 12 boxes of raisins and 18 bags of popcorn to use in gift baskets. a. Write a ratio that relates the number of boxes of raisins to the number of bags of popcorn. A ratio that relates the number of boxes of raisins to the number of bags of popcorn is 12 : 18.
Ratios and Tape Diagrams In this lesson, we
b. Lisa creates 6 identical gift baskets. How many boxes of raisins and how many bags of popcorn are in each gift basket?
•
wrote multiple ratios to represent the same situation.
•
used ratio language to explain how multiple ratios can be used to describe the same situation.
•
used tape diagrams to represent ratios.
She can create 6 gift baskets that each have 2 boxes of raisins and 3 bags of popcorn.
Each of the 6 groups represents a gift basket. Each group has 2 boxes of raisins and 3 bags of popcorn. There are a total of 12 boxes of raisins and a total of 18 bags of popcorn.
Examples 1. A local charity collects toys to donate to a children’s hospital. The charity has 5 boxes of dolls and 8 boxes of bears. Box of Dolls
Box of Dolls
Box of Dolls
Box of Dolls
Box of Dolls
Box of Bears
Box of Bears
Box of Bears
Box of Bears
Box of Bears
Box of Bears
Box of Bears
Box of Bears
a. Write a ratio that relates the number of boxes of dolls to the number of boxes of bears.
5:8 b. Each box has 7 toys. Write a ratio that relates the total number of dolls to the total number of bears.
c. Write a ratio that relates the number of boxes of raisins to the number of bags of popcorn in each gift basket.
35 : 56 Because there are 5 boxes of 7 dolls each, there are a total of 35 dolls. Because there are 8 boxes of 7 bears each, there are a total of 56 bears. The ratios 5 : 8 and 35 : 56 both represent this situation.
© Great Minds PBC
58
The ratio of the number of boxes of raisins to the number of bags of popcorn in each gift basket is 2 : 3.
29
30
RECAP
© Great Minds PBC
© Great Minds PBC
EUREKA MATH2 6 ▸ M1 ▸ TA ▸ Lesson 3
EUREKA MATH2
6 ▸ M1 ▸ TA ▸ Lesson 3
d. Use ratio language to describe the relationship between the number of boxes of raisins and the number of bags of popcorn. Sample: For every 2 boxes of raisins, there are 3 bags of popcorn. e. Draw a tape diagram that represents the ratio of the number of boxes of raisins to the number of bags of popcorn in one gift basket. Number of Boxes of Raisins Number of Bags of Popcorn
Each tape is labeled with the quantity it represents. The top tape represents the first quantity in the ratio 2 : 3. The bottom tape represents the second quantity in the ratio 2 : 3.
© Great Minds PBC
© Great Minds PBC
The tape diagram has two tapes. One tape has 2 units to represent the number of boxes of raisins. The other tape has 3 units to represent the number of bags of popcorn.
RECAP
31
59
EUREKA MATH2
6 ▸ M1 ▸ TA ▸ Lesson 3
Sample Solutions Expect to see varied solution paths. Accept accurate responses, reasonable explanations, and equivalent answers for all student work.
EUREKA MATH2
6 ▸ M1 ▸ TA ▸ Lesson 3
PRACTICE Name
Date
EUREKA MATH2
6 ▸ M1 ▸ TA ▸ Lesson 3
3
c. Use ratio language to describe the relationship between the number of stickers and the number of crayons in each party favor bag. Sample: For every 2 stickers, there are 3 crayons.
1. The local animal shelter has 8 bags of dog toys and 10 bags of cat toys. a. Write a ratio that relates the number of bags of dog toys to the number of bags of cat toys.
d. Draw a tape diagram to represent the ratio of the number of stickers to the number of crayons in each party favor bag.
8 : 10
Number of Stickers
b. What could the ratio 10 : 18 represent?
Number of Crayons
The ratio 10 : 18 could represent the number of bags of cat toys to the total number of bags of pet toys.
3. A pet store has 10 cockatiels and 15 parakeets. c. There are 6 toys in each bag of pet toys. What is the ratio of the total number of dog toys to the total number of cat toys?
a. Write a ratio that relates the number of cockatiels to the number of parakeets.
10 : 15
48 : 60
b. The pet store owner wants to group the birds so that cockatiels and parakeets are not placed together in a cage. He wants each cage to have the same number of birds. How can the pet store owner group the birds?
d. Explain how the ratios you wrote in part (a) and part (c) represent the same situation. The ratio in part (a) represents the ratio of the number of bags of dog toys to the number of bags of cat toys. The ratio in part (c) represents the ratio of the total number of dog toys to the total number of cat toys in those bags.
The owner can make 2 groups of 5 cockatiels each and 3 groups of 5 parakeets each. c. Use the groups from part (b) to write the ratio of the number of groups of cockatiels to the number of groups of parakeets.
2. Sana prepares party favor bags. She has 16 stickers and 24 crayons to put in the bags.
2:3
a. Write a ratio that relates the number of stickers to the number of crayons.
16 : 24
d. Use ratio language to describe the relationship between the number of cockatiels and the number of parakeets. Sample: For every 2 cockatiels, there are 3 parakeets.
b. Sana prepares 8 party favor bags. The ratio of the number of stickers to the number of crayons in each bag is the same. How many stickers are in each bag? How many crayons are in each bag?
e. Explain how the ratios you wrote in part (a) and part (c) represent the same situation.
There are 2 stickers and 3 crayons in each party favor bag.
© Great Minds PBC
60
The ratio in part (a) represents the ratio of the total number of cockatiels to the total number of parakeets. The ratio in part (c) represents the ratio of the number of groups of cockatiels to the number of groups of parakeets.
33
34
P R ACT I C E
© Great Minds PBC
© Great Minds PBC
EUREKA MATH2 6 ▸ M1 ▸ TA ▸ Lesson 3
EUREKA MATH2
6 ▸ M1 ▸ TA ▸ Lesson 3
EUREKA MATH2
6 ▸ M1 ▸ TA ▸ Lesson 3
9. Use the given rule and starting number to complete each numerical pattern.
4. Of the students who help clean a park, 12 are basketball players and 18 are band members. Which statements are correct? Choose all that apply.
a. Add 12 , starting with 0.
A. There are 1 12 times as many band members as basketball players.
0,
B. The ratio of the number of band members to the number of basketball players is 12 : 18. C. The ratio of the number of basketball players to the total number of students is 12 : 30.
1 2
,
1
,
11
2
,
2
,
3
,
4
,
21
2
b. Add 1, starting with 0.
D. Six groups of students could each have 2 basketball players and 3 band members.
0,
E. Two groups of basketball players and 3 groups of band members could each have 6 people.
1
,
2
,
5
10. Lacy rides her bicycle 15 miles on Sunday. This distance is 5 times as far as she rode on Saturday. Which number sentence shows how to find the number of miles Lacy rode her bicycle on Saturday?
F. There are 2 basketball players for every 3 band members.
A. 15 + 5 = 20 B. 15 - 5 = 10
5. The tape diagram represents the ratio of the number of carnations to the number of daisies in a flower bouquet.
C. 15 ´ 5 = 75
Number of Carnations
D. 15 ¸ 5 = 3
Number of Daisies
Use ratio language to describe the ratio that is represented in the tape diagram. Sample: There are 3 carnations for every 5 daisies.
Remember For problems 6–8, multiply. 6. 3,132 × 3
9,396
© Great Minds PBC
© Great Minds PBC
7. 2,416 × 4
9,664
8. 7,921 × 5
39,605
P R ACT I C E
35
36
P R ACT I C E
© Great Minds PBC
61
4
LESSON 4
Exploring Ratios by Making Batches Create ratios by making batches of different quantities. Use tape diagrams to determine unknown quantities in ratios.
EUREKA MATH2
6 ▸ M1 ▸ TA ▸ Lesson 4
Name
Date
EXIT TICKET
4
Mrs. Chan makes punch for a party. A ratio that relates the number of cups of club soda to the number of cups of juice in 1 batch of her punch is 2 : 5. Number of Cups of Club Soda Number of Cups of Juice
Lesson at a Glance In this lesson, students use multiple geometric tiles to understand batches of quantities in the same ratio. Students model ratios by using multiple tape diagrams and notice patterns in repeating groups of quantities. Students then use these observations to solve contextual problems.
Key Question
a. Mrs. Chan makes 2 batches of punch. How many cups of club soda and how many cups of juice does she use? Use tape diagrams to show your thinking.
• How can we use tape diagrams to determine unknown values in ratio relationships?
Number of Cups of Club Soda Number of Cups of Juice
Achievement Descriptors
She uses 4 cups of club soda and 10 cups of juice.
6.Mod1.AD1 Write and explain ratios that describe relationships
between two quantities. (6.RP.A.1) b. If Mrs. Chan uses 15 cups of juice to make punch, how many cups of club soda does she use? Use tape diagrams to show your thinking.
6.Mod1.AD3 Solve real-world and mathematical problems by using
ratio reasoning. (6.RP.A.3)
Number of Cups of Club Soda Number of Cups of Juice
She uses 6 cups of club soda.
© Great Minds PBC
39
© Great Minds PBC
EUREKA MATH2 6 ▸ M1 ▸ TA ▸ Lesson 4
Agenda
Materials
Fluency
Teacher
Launch 5 min
• None
Learn 30 min
Students
• Tiling
• None
• Batches of Paint
Lesson Preparation
Land 10 min
• None
© Great Minds PBC
63
EUREKA MATH2
6 ▸ M1 ▸ TA ▸ Lesson 4
Fluency Identify Equivalent Fractions Students identify equivalent fractions to prepare for identifying equivalent ratios. Directions: Answer each question. 1.
hich fractions are equivalent to _ W 1 ? 4 Choose all that apply.
_ __ __ __ __ __
4 , 3 , 10 , 11 , 7 , 9 7 12 40 14 28 32
2.
hich fractions are equivalent to _ W 6 ? 9 Choose all that apply.
_ _ _ __ __ __
2 , 4 , 5 , 7 , 24 , 16 3 6 8 10 36 19
64
__ __ __
3 , 10 , 7 12 40 28
_ _ __
2 , 4 , 24 3 6 36
© Great Minds PBC
EUREKA MATH2 6 ▸ M1 ▸ TA ▸ Lesson 4
Launch
5
Students notice repeated patterns in geometric tiles. Display the repeating tiles of lizards and rhombuses.
Select a few students to share their thinking about the following questions. What do you notice and wonder about the pieces of art? I notice there are a bunch of repeating images or tiles. Some look like lizards, and some look like rhombuses. The tiles are rotated, and they all fit together with no gaps. I wonder if the lizards are all the same. I wonder how many lizards there are in total. I wonder how the artist created the edge of the tiling. What do these pieces of art remind you of? Where have you seen similar designs? These remind me of the tiles in my kitchen that are repeating squares. © Great Minds PBC
65
EUREKA MATH2
6 ▸ M1 ▸ TA ▸ Lesson 4
What mathematical questions can you ask about these pieces of art? How many tiles do you need to cover a floor? What is the area of each lizard tile? Tell students that geometric tiles can often be seen in the work of artist M. C. Escher. Display the image of M. C. Escher’s artwork Reptiles.
Teacher Note Have students think about ceramic tile patterns that they might have seen on interiors or exteriors of buildings, and have students describe the patterns. Discuss that many countries have used tiles for millennia as decorative elements, but these patterns also reflect the countries’ rich culture and heritage. Consider having students independently research traditional tile designs found around the world. Connect their research to their understanding of ratios by looking for ratio relationships and repeating patterns in tessellations like those found in the work of M. C. Escher.
Escher was known for creating tessellations in his artwork. Tessellations are arrangements of shapes in repeating patterns without gaps or overlaps. In this lesson, we will create and analyze a simple tiling pattern to explore ratios. Display the hexagonal tile.
66
© Great Minds PBC
EUREKA MATH2 6 ▸ M1 ▸ TA ▸ Lesson 4
How can you use ratio language to describe the numbers of shaded and dotted rhombuses in 1 hexagonal tile? Sample: For every 6 dotted rhombuses, there are 6 shaded rhombuses. For every 6 shaded rhombuses, there is a total of 1 2 rhombuses. Display the pattern with repeating tiles.
How was the pattern of 3 hexagonal tiles created? In 1 hexagonal tile, there are 6dotted and 6 shaded rhombuses. Two more identical hexagonal tiles were added to the original tile to create the pattern. Today, we will write ratios by using multiple geometric tiles and use tape diagrams to help us find unknown information.
© Great Minds PBC
67
EUREKA MATH2
6 ▸ M1 ▸ TA ▸ Lesson 4
Learn Tiling Students write ratios to represent multiple tiles. Display Kelly’s tile and prompt students to describe the ratio relationships in the pattern.
Use ratio language to describe the numbers of rhombuses in Kelly’s tile. Sample: For every 5dotted rhombuses, there are 7 shaded rhombuses. For every 7shaded rhombuses, there is a total of 1 2 rhombuses. What is a ratio that relates the numbers of rhombuses in Kelly’s tile? Sample:
Teacher Note
7 : 5 5 : 7 5 : 12 7 : 12 Why can the ratios 5 : 7and 7 : 12both represent Kelly’s tile?
When studying Kelly’s tile, prompt students to consider both part-to-part and part-towhole ratio relationships. Expect students to write different ratios that do not include context, such as 5 : 7, 7 : 5, 5 : 12, 1 2 : 5, 7 : 12, and 1 2 : 7.
There are different numbers of rhombuses that can be compared in this tile. The ratio depends on which numbers are being compared. The ratio 5 : 7relates the number of dotted rhombuses to the number of shaded rhombuses. The ratio 7 : 12relates the number of shaded rhombuses to the total number of rhombuses.
68
© Great Minds PBC
EUREKA MATH2 6 ▸ M1 ▸ TA ▸ Lesson 4
Direct students to problem 1 and have them complete the first row of the table. Display the two tiles.
How many rhombuses of each type do you think we need to make two of Kelly’s tiles? How do you know? To make two tiles, I think we need 1 0dotted rhombuses and 1 4shaded rhombuses. There are 5 dotted rhombuses and 7 shaded rhombuses in 1 tile, so I added 5 more dotted rhombuses and 7 more shaded rhombuses to find how many rhombuses of each type we need for 2 tiles. Display the pattern with two of Kelly’s tiles.
Teacher Note Before displaying the pattern with four of Kelly’s tiles, consider asking students about the following incorrect rhombus combinations. • 14 dotted rhombuses and 20 shaded rhombuses • 20 dotted rhombuses and 25 shaded rhombuses
Have students complete the second row of the table in problem 1.
© Great Minds PBC
Invite students to explain why the incorrect combinations result in fewer or more rhombuses than the numbers needed to make 3 tiles. Relate student responses to the ratios found in the table by using repeated addition patterns.
69
6 ▸ M1 ▸ TA ▸ Lesson 4
EUREKA MATH2
Display the three tiles.
Have students consider what may happen with extra rhombuses. What do you think will happen if we try to make 3 of Kelly’s tiles by using 17 dotted rhombuses and 21 shaded rhombuses? Why? I think we will have dotted rhombuses left over. For 3tiles, the ratio that relates the number of dotted rhombuses to the number of shaded rhombuses should be 1 5 : 21. If we try to make 3 tiles with 17dotted rhombuses, there will be 2 extra rhombuses. Display the pattern with three of Kelly’s tiles and 2 extra rhombuses.
70
© Great Minds PBC
EUREKA MATH2 6 ▸ M1 ▸ TA ▸ Lesson 4
Was your prediction correct? Why? Yes. The ratio that relates the number of dotted rhombuses to the number of tiles is 5 : 1. So 3 tiles will have 1 5dotted rhombuses because 5 times 3 is 1 5. There are 2extra dotted rhombuses because 1 7is 2 more than the 1 5dotted rhombuses that are needed. Have students predict the numbers of dotted rhombuses and shaded rhombuses in a pattern with four of Kelly’s tiles. Then display the pattern with four of Kelly’s tiles.
Have students complete the last two rows of the table in problem 1.
Differentiation: Support
1. Complete the table. Number of Tiles
Number of Dotted Rhombuses
Number of Shaded Rhombuses
Total Number of Rhombuses
Ratio of the Number of Dotted Rhombuses to the Number of Shaded Rhombuses
1
5
7
12
5:7
2
10
14
24
10 : 14
3 4
© Great Minds PBC
15 20
21 28
36 48
15 : 21 20 : 28
A focus of this lesson is determining ratio relationships. Consider highlighting the additive relationship between rows of the table by using arrows and addition expressions. Number of Tiles
Number of Dotted Rhombuses
1
5
2
10
3
15
4
20
+5 +5 +5
Number of Shaded Rhombuses
7 14 21 28
+7 +7 +7
Total Number of Rhombuses
12 24 36 48
+12 +12 +12
71
EUREKA MATH2
6 ▸ M1 ▸ TA ▸ Lesson 4
Display the completed table. What patterns do you notice in the table? Every time a tile is added, the number of dotted rhombuses increases by 5, the number of shaded rhombuses increases by 7, and the total number of rhombuses increases by 1 2. Imagine extending the table to include two more rows. How can you determine the numbers of dotted rhombuses and shaded rhombuses in 5 and 6 tiles? I can continue the patterns in the table. I already have the numbers of dotted rhombuses and shaded rhombuses in 4 tiles. To find the numbers of rhombuses in 5 and 6 tiles, I would add 5 to the number of dotted rhombuses and add 7 to the number of shaded rhombuses for each additional tile. Display Kelly’s tile and the tape diagram.
Number of Dotted Rhombuses Number of Shaded Rhombuses
What do you notice about Kelly’s tile and the tape diagram? Every unit in the tape diagram represents one of the rhombuses in Kelly’s tile. Display the pattern with two of Kelly’s tiles and the tape diagrams. Number of Dotted Rhombuses
Differentiation: Challenge Challenge students to reason about 1 : 1 relationships by using the tiling pattern example. Ask the following questions: • What would the tile pattern look like if the ratio of the number of dotted rhombuses to the number of shaded rhombuses was 1 : 1? • What would the tape diagram look like if the ratio of the number of shaded rhombuses to the number of dotted rhombuses was 1 : 1? • What does a ratio of 1 : 1mean in other situations?
Number of Shaded Rhombuses Number of Dotted Rhombuses Number of Shaded Rhombuses
72
© Great Minds PBC
EUREKA MATH2 6 ▸ M1 ▸ TA ▸ Lesson 4
Have students think–pair–share about the tape diagram and tiling pattern by asking the following question. What do you notice about the tape diagram that represents the second tile? I notice the tape diagram for the second tile looks exactly like the tape diagram for the first tile. I notice the tape diagrams represent the same ratio of the number of dotted rhombuses to the number of shaded rhombuses. Display the patterns with three of Kelly’s tiles and then four of Kelly’s tiles. Will the tape diagrams always be the same for the repeating tiles? Why? Yes. The tape diagrams will represent the same ratio relationship between the number of dotted rhombuses and the number of shaded rhombuses because the pattern repeats. How can you use addition or multiplication to find out how many shaded rhombuses would be in 7 tiles? The tape diagram for 1 tile has 5 units for the number of dotted rhombuses and 7 units for the number of shaded rhombuses, which means the ratio of the number of dotted rhombuses to the number of shaded rhombuses in 1 tile is 5 : 7. To find the number of shaded rhombuses in 7 tiles, I can multiply 7by 7 . There will be 4 9shaded rhombuses in 7 tiles. There are 2 8shaded rhombuses in 4 tiles. To find the number of shaded rhombuses in 7 tiles, I can start with 2 8and add 7 three times. Since 2 8 + 7 + 7 + 7 = 49, there will be 49shaded rhombuses in 7 tiles.
Batches of Paint Students use tape diagrams to determine unknown parts in ratios. Play the first part of the Batches of Paint video. What happened in the video? A boy was caught drawing on a wall. A man painted over the drawings, but he had difficulty matching the shade of the purple paint to the wall color. He tried different ratios of the number of cups of red paint to the number of cups of blue paint, but they didn’t match the purple paint on the wall. © Great Minds PBC
73
EUREKA MATH2
6 ▸ M1 ▸ TA ▸ Lesson 4
Invite students to make predictions about the number of cups of red paint and the number of cups of blue paint in the mixture that matches the purple paint on the wall. Then play the second part of the Batches of Paint video. In the paint mixture that matches the purple wall color, what is the ratio of the number of cups of red paint to the number of cups of blue paint? The ratio of the number of cups of red paint to the number of cups of blue paint is 3 : 4. Display the tape diagram. Number of Cups of Red Paint Number of Cups of Blue Paint How does the tape diagram represent the ratio of the number of cups of red paint to the number of cups of blue paint in the mixture? In the tape diagram, there are 3 red units for every 4 blue units. We need more paint than we thought. How can we make more than 1 batch? Explain your reasoning. Every time we make another batch, add 3 cups of red paint and 4 cups of blue paint. For example, 2 batches will have 6 cups of red paint and 8 cups of blue paint. To make 3batches, we will need 9 cups of red paint and 1 2cups of blue paint. The pattern continues for any number of batches. Display the tape diagrams that represent two batches of paint. Invite students to share what they notice about the tape diagrams.
74
© Great Minds PBC
EUREKA MATH2 6 ▸ M1 ▸ TA ▸ Lesson 4
Number of Cups of Red Paint Number of Cups of Blue Paint Number of Cups of Red Paint
Number of Cups of Red Paint
2
2
2
Number of Cups of Blue Paint
Number of Cups of Blue Paint
2
2
2
2
Ask students to describe what the tape diagrams would look like for three batches of paint and then four batches of paint. Display the tape diagrams to confirm their answers. Number of Cups of Red Paint
3
3
3
Number of Cups of Blue Paint
3
3
3
3
4
4
4
Number of Cups of Blue Paint
4
4
4
Number of Cups of Red Paint
4
Have students work individually to complete problem 2. Circulate as students work to ensure that their tape diagrams use the ratio 3 : 4to relate the number of cups of red paint to the number of cups of blue paint. Consider asking the following questions to connect the ways that ratio relationships are used in the tiling pattern and in the batches of paint activities. • How is creating multiple batches of paint like adding tiles to a pattern? • Earlier in the lesson, what happened to the ratio of the number of dotted rhombuses to the number of shaded rhombuses when a tile was added to the pattern? When you create more batches of paint, what will happen to the ratio of the number of cups of red paint to the number of cups of blue paint?
Promoting the Standards for Mathematical Practice When students observe the repeated addition patterns in the numbers of tiles and batches of paint, they are looking for and expressing regularity in repeated reasoning (MP8). Ask the following questions to promote MP8: • What patterns did you notice when tiles were added to the design? • Did anything repeat when larger batches of paint were created? How could noticing repetition help you solve ratio problems more efficiently?
• How can you apply what you learned from the patterns found in tiling to a problem about multiple batches of paint?
© Great Minds PBC
75
6 ▸ M1 ▸ TA ▸ Lesson 4
EUREKA MATH2
2. Consider the mixture of red paint and blue paint that matches the purple paint on the wall. a. Draw tape diagrams to represent the ratio of the number of cups of red paint to the number of cups of blue paint in 5 batches of purple paint. Number of Cups of Red Paint Number of Cups of Blue Paint
b. Write the ratio that relates the number of cups of red paint to the number of cups of blue paint in 5 batches of purple paint. 15 : 20 c. How did you determine the ratio of the number of cups of red paint to the number of cups of blue paint in 5 batches of purple paint? There are 3 cups of red paint for every 4 cups of blue paint. To find the number of cups of red paint in 5 batches of purple paint, I calculated 3 + 3 + 3 + 3 + 3. To find the number of cups of blue paint in 5 batches, I calculated 4 + 4 + 4 + 4 + 4. So the ratio of the number of cups of red paint to the number of cups of blue paint in 5 batches of purple paint is 15 : 20. After a few minutes, have students think–pair–share about the following questions. How could you find the ratio of the number of cups of red paint to the number of cups of blue paint in 10 batches of purple paint? I could add 3 ten times and add 4 ten times because there are 3 cups of red paint and 4 cups of blue paint in each batch of purple paint. I could multiply the number of cups of red paint and the number of cups of blue paint in 1batch of purple paint each by 1 0. What is the ratio of the number of cups of red paint to the number of cups of blue paint in 10 batches of purple paint? The ratio of the number of cups of red paint to the number of cups of blue paint in 1 0batches of purple paint is 3 0 : 40.
76
© Great Minds PBC
EUREKA MATH2 6 ▸ M1 ▸ TA ▸ Lesson 4
Which strategy is more efficient? Why? Multiplying 3 by 1 0and 4 by 1 0is much faster than adding 3 ten times and adding 4 ten times. Complete problems 3–5 as a class. Encourage students to use tape diagrams as a strategy if needed. Consider the paint mixture from the Batches of Paint video to complete problems 3–5. 3. A bucket has 1 2cups of red paint in it. How many cups of blue paint do you need to add to the bucket to create the correct shade of purple paint? Draw a tape diagram to show your thinking.
12 4
4
4
4
4
4
4
? I need to add 1 6cups of blue paint to the bucket of red paint to create the correct shade of purple paint. 4. A bucket has 2 4cups of blue paint in it. How many cups of red paint do you need to add to the bucket to create the correct shade of purple paint? I need to add 1 8cups of red paint to the bucket of blue paint to create the correct shade of purple paint. 5. A barrel holds 4 2cups of paint. How many cups of red paint and how many cups of blue paint do you need to create 4 2cups of the correct shade of purple paint? I need 18cups of red paint and 24cups of blue paint to create 42cups of the correct shade of purple paint.
© Great Minds PBC
77
EUREKA MATH2
6 ▸ M1 ▸ TA ▸ Lesson 4
Ask students the following questions. In problem 3, what do the numbers in each unit of the tape diagram represent? The numbers in each unit of the tape diagram represent the number of batches of purple paint. As batches of paint are added, another identical tape diagram is also added. If there are 4 batches of paint, then there are 4 tape diagrams. The 4 in each unit shows that there are 4 tape diagrams without having to draw them all. Suppose you make 100 batches of purple paint and need to make a tape diagram to represent your work. Describe what your tape diagram would look like.
Teacher Note This lesson previews the learning about equivalent ratios and problem solving with tape diagrams that students will encounter in lesson 5. Students should not be expected to fully master how to create tape diagrams with different sizes of units to represent ratios in this lesson.
Because I don’t want to have to draw 1 00tape diagrams, I would just draw 1 tape diagram that represents the ratio of 3 cups of red paint for every 4 cups of blue paint. Then I would put 1 00in each unit to represent the 1 00batches of purple paint.
Land Debrief 5 min Objectives: Create ratios by making batches of different quantities. Use tape diagrams to determine unknown quantities in ratios. Initiate a class discussion by using the following prompts. Encourage students to add on to their classmates’ responses. How did a tape diagram help us represent the number of cups of red paint and the number of cups of blue paint needed for the given shade of purple? The number of units in the tape diagram represents the number of cups of red paint and the number of cups of blue paint in 1 batch. The value of each unit tells us how many batches of paint are made. If there are 3 cups of red paint in 1 batch, then there are 6 cups of red paint in 2 batches.
78
© Great Minds PBC
EUREKA MATH2 6 ▸ M1 ▸ TA ▸ Lesson 4
If you have a tile with 3 red triangles and 4 purple squares, how do you find the total number of red triangles and the total number of purple squares in 8 tiles? As the number of tiles increases by 1, the number of red triangles increases by 3 and the number of purple squares increases by 4 . If there are 8tiles, then we add 3 eight times to find that the total number of red triangles is 2 4. Then we add 4 eight times to find that the total number of purple squares is 3 2.
Exit Ticket 5 min Provide up to 5 minutes for students to complete the Exit Ticket. It is possible to gather formative data even if some students do not complete every problem.
© Great Minds PBC
Teacher Note Assign the Practice problems for completion outside of class or use them in class if time remains after the lesson. Refer students to the Recap for support.
79
EUREKA MATH2
6 ▸ M1 ▸ TA ▸ Lesson 4
Recap
EUREKA MATH2
6 ▸ M1 ▸ TA ▸ Lesson 4
RECAP Name
Date
EUREKA MATH2
6 ▸ M1 ▸ TA ▸ Lesson 4
4
c. How many peaches and how many kiwis are in 2 batches of Lacy’s fruit salad? There are 8 peaches and 6 kiwis in 2 batches of Lacy’s fruit salad.
Exploring Ratios by Making Batches Because 1 batch of Lacy’s fruit salad has 4 peaches and 3 kiwis, 2 batches of her
In this lesson, we •
created ratios by making batches of quantities in a given ratio.
•
used tape diagrams to determine unknown quantities in ratios.
fruit salad have 8 peaches and 6 kiwis.
d. How does the total number of peaches change every time Lacy makes an additional batch of fruit salad? How does the total number of kiwis change?
Examples
The total number of peaches increases by 4 and the total number of kiwis increases by 3 every time Lacy makes an additional batch of fruit salad.
1. One batch of Lacy’s fruit salad has 4 peaches and 3 kiwis. Number of Kiwis
Number of Peaches
e. If Lacy uses 9 kiwis in the fruit salad, how many peaches does she need? Draw a tape diagram to show your thinking. Lacy needs 12 peaches.
a. Draw a tape diagram to represent the ratio of the number of peaches to the number of kiwis in 1 batch of Lacy’s fruit salad.
Number of Peaches
Number of Peaches
Number of Kiwis
Number of Kiwis
b. Draw a tape diagram to represent the ratio of the number of peaches to the number of kiwis in 2 batches of Lacy’s fruit salad.
One batch of Lacy’s fruit salad has 4 peaches and 3 kiwis. Three batches of her fruit salad have 9 kiwis. Creating three fruit salad tape diagrams shows that there are 12 peaches.
Number of Peaches Number of Kiwis Because there are 2 batches of fruit salad, another way to represent this situation is to draw one tape diagram and give each unit a value of 2.
© Great Minds PBC
80
Number of Peaches
2
2
2
Number of Kiwis
2
2
2
2
41
42
RECAP
© Great Minds PBC
© Great Minds PBC
EUREKA MATH2 6 ▸ M1 ▸ TA ▸ Lesson 4
Sample Solutions Expect to see varied solution paths. Accept accurate responses, reasonable explanations, and equivalent answers for all student work.
EUREKA MATH2
6 ▸ M1 ▸ TA ▸ Lesson 4
PRACTICE Name
Date
EUREKA MATH2
6 ▸ M1 ▸ TA ▸ Lesson 4
4
e. Draw a tape diagram to represent the total numbers of triangles and hexagons that Tyler needs to create 3 suns. Sample:
1. Tyler uses 6 triangles and 1 hexagon to create the sun shown.
Number of Triangles Number of Hexagons
2. Riley’s recipe for salad dressing calls for 2 tablespoons of vinegar for every 3 tablespoons of olive oil. Number of Tablespoons of Vinegar
a. Draw a tape diagram to represent the ratio of the number of triangles to the number of hexagons in Tyler’s sun.
Number of Tablespoons of Olive Oil
Number of Triangles Number of Hexagons
a. Draw a tape diagram to represent the ratio of the number of tablespoons of vinegar to the number of tablespoons of olive oil.
b. Write a ratio that relates the number of triangles to the number of hexagons in Tyler’s sun. A ratio that relates the number of triangles to the number of hexagons is 6 : 1.
Number of Tablespoons of Vinegar Number of Tablespoons of Olive Oil
c. Write a ratio that relates the number of hexagons to the total number of shapes in Tyler’s sun. A ratio that relates the number of hexagons to the total number of shapes is 1 : 7.
b. If Riley uses 4 tablespoons of vinegar, how many tablespoons of olive oil does she need? Draw a tape diagram to show your thinking.
d. Draw a tape diagram to represent the total numbers of triangles and hexagons that Tyler needs to create 2 suns. Sample:
Number of Tablespoons of Vinegar
Number of Triangles
Number of Tablespoons of Olive Oil
Number of Hexagons
Riley needs 6 tablespoons of olive oil. © Great Minds PBC
© Great Minds PBC
43
44
P R ACT I C E
© Great Minds PBC
81
EUREKA MATH2
6 ▸ M1 ▸ TA ▸ Lesson 4
EUREKA MATH2
6 ▸ M1 ▸ TA ▸ Lesson 4
EUREKA MATH2
6 ▸ M1 ▸ TA ▸ Lesson 4
b. If the company uses 20 chocolate bars in gift baskets, how many bottles of maple syrup does it use?
c. If Riley uses 9 tablespoons of olive oil, how many tablespoons of vinegar does she need? Draw a tape diagram to show your thinking.
The company uses 8 bottles of maple syrup.
Number of Tablespoons of Vinegar Number of Tablespoons of Olive Oil
Riley needs 6 tablespoons of vinegar.
4. Sasha mixes 4 tablespoons of white paint with 5 tablespoons of red paint to create pink paint. Number of Tablespoons of White Paint
3. A company makes gift baskets that each include 2 bottles of maple syrup and 5 chocolate bars.
Number of Tablespoons of Red Paint
Which mixtures create the same shade of pink paint? Choose all that apply. A. 4 cups of white paint and 5 cups of red paint B. 3 cups of white paint and 4 cups of red paint C. 6 tablespoons of white paint and 7 tablespoons of red paint D. 8 tablespoons of white paint and 10 tablespoons of red paint E. 2 tablespoons of white paint and 2 12 tablespoons of red paint
Remember For problems 5–7, multiply. a. How many bottles of maple syrup and how many chocolate bars does the company need to make 6 baskets?
5. 24 × 14
6. 33 × 25
7. 42 × 36
336
825
1,512
The company needs 12 bottles of maple syrup and 30 chocolate bars.
© Great Minds PBC
82
P R ACT I C E
45
46
P R ACT I C E
© Great Minds PBC
© Great Minds PBC
EUREKA MATH2 6 ▸ M1 ▸ TA ▸ Lesson 4
EUREKA MATH2
6 ▸ M1 ▸ TA ▸ Lesson 4
8. Write two ratios that relate the number of blue ovals and the number of red triangles. Explain the meaning of each ratio.
3:7 The ratio of the number of blue ovals to the number of red triangles is 3 : 7.
7:3 The ratio of the number of red triangles to the number of blue ovals is 7 : 3.
9. Choose the true statement. A. All rectangles are squares because all rectangles have four equal sides. B. All rhombuses are squares because all rhombuses have four right angles. C. All parallelograms are quadrilaterals because all parallelograms have four sides. D. All trapezoids are parallelograms because all trapezoids have two pairs of parallel sides.
© Great Minds PBC
© Great Minds PBC
P R ACT I C E
47
83
5
LESSON 5
Equivalent Ratios Find equivalent ratios by multiplying both numbers in a given ratio by the same nonzero number. Use equivalent ratios to find unknown quantities.
EUREKA MATH2
6 ▸ M1 ▸ TA ▸ Lesson 5
Name
EXIT TICKET
Date
5
1. Show that the ratio 5 : 6 is equivalent to the ratio 35 : 42. Sample:
7
7
7
7
7
7
7
7
7
7
7
Lesson at a Glance This lesson formalizes a concept that students experienced in previous lessons: equivalent ratios. Students learn strategies to identify equivalent ratios and represent them by using tape diagrams. Through small group activities, students write equivalent ratios and use them to solve real-world problems. This lesson introduces the term equivalent ratios.
Key Questions
2. There are 3 red markers for every 4 blue markers in an art set. The total number of red markers and blue markers in the art set is 84. a. Represent this situation by using a tape diagram. Number of Red Markers
• For any two ratios, how do we know whether they are equivalent? • Why is it helpful to find equivalent ratios?
Achievement Descriptors
84 Number of Blue Markers
6.Mod1.AD1 Write and explain ratios that describe relationships
between two quantities. (6.RP.A.1)
b. How many red markers are in the art set?
7 units = 84
6.Mod1.AD3 Solve real-world and mathematical problems by using
1 unit = 84 ¸ 7 = 12
ratio reasoning. (6.RP.A.3)
3 × 12 = 36 There are 36 red markers in the art set.
c. How many blue markers are in the art set?
4 × 12 = 48 There are 48 blue markers in the art set.
© Great Minds PBC
53
© Great Minds PBC
EUREKA MATH2 6 ▸ M1 ▸ TA ▸ Lesson 5
Agenda
Materials
Fluency
Teacher
Launch 5 min
• None
Learn 30 min
Students
• Identifying and Writing Equivalent Ratios
• None
• Using Equivalent Ratios to Solve Problems
• Print and cut out the Solve and Seek cards and post them around the room.
Lesson Preparation
Land 10 min
© Great Minds PBC
85
EUREKA MATH2
6 ▸ M1 ▸ TA ▸ Lesson 5
Fluency Complete the Tape Diagram Students determine unknown values in tape diagrams to prepare for solving ratio problems with tape diagrams. Directions: Each tape diagram has equal-size units. Determine the unknown value.
1.
3 3 3 3
12
?
2.
? ? ?
4
12
3.
? 5 5 5 5 25
4.
7
14
? 2
5.
? 86
5
10
© Great Minds PBC
EUREKA MATH2 6 ▸ M1 ▸ TA ▸ Lesson 5
Launch
5
Students reason about a ratio problem. Display problem 1. Have students read the problem silently. 1. A bouquet of roses and daisies has a total of 105 flowers. For every 2 roses, there are 3 daisies.
How many roses are in the bouquet? How many daisies are in the bouquet? There are 42 roses and 63 daisies in the bouquet. Invite students to think independently about how they could solve the problem. After about 1 minute, have them discuss their thinking with a partner. To further students’ thinking, consider using the following prompts: • Give an answer you know is not correct. Explain why it is not correct. • Could there be 50 roses and 55 daisies in the bouquet? Why? Although it is not necessary that all students be able to solve the problem at this point, allow students to share strategies they used or think they could use to solve the problem. Today, we will learn how to solve problems similar to the bouquet problem. We will determine how to find unknown quantities when we know a ratio that relates two quantities and a total.
© Great Minds PBC
87
EUREKA MATH2
6 ▸ M1 ▸ TA ▸ Lesson 5
Learn Identifying and Writing Equivalent Ratios Students identify and write equivalent ratios by using tape diagrams. Display the table. Tell students that the table shows the number of roses and the number of daisies in four different bouquets.
2:3
4:6
6:9
8 : 12
What quantities do the ratios in the table relate? The ratios in the table relate the number of roses in each bouquet to the number of daisies in each bouquet.
88
© Great Minds PBC
EUREKA MATH2 6 ▸ M1 ▸ TA ▸ Lesson 5
What patterns do you notice? I notice the number of roses increases by 2 each time and the number of daisies increases by 3 each time. I notice the numbers of roses are all multiples of 2. I notice the numbers of daisies are all multiples of 3. Choose questions from the following sequence. Consider choosing one question that all students can answer correctly and proceeding to one that might be more challenging for students to answer. Have students think–pair–share and explain their reasoning. If we extend the table to show the numbers of flowers in the 5th bouquet, how many roses will be in the 5th bouquet? How many daisies will be in the 5th bouquet? There will be 10 roses and 15 daisies in the 5th bouquet. If we extend the table to show the numbers of flowers in the 10th bouquet, how many roses will be in the 10th bouquet? How many daisies will be in the 10th bouquet?
Differentiation: Support To support students in finding the number of roses and the number of daisies in other bouquets, offer students a choice of which bouquet to consider.
There will be 20 roses and 30 daisies in the 10th bouquet. If we extend the table to show the numbers of flowers in the 100th bouquet, how many roses will be in the 100th bouquet? How many daisies will be in the 100th bouquet? There will be 200 roses and 300 daisies in the 100th bouquet. If we extend the table to show the numbers of flowers in the 25th bouquet, how many roses will be in the 25th bouquet? How many daisies will be in the 25th bouquet? There will be 50 roses and 75 daisies in the 25th bouquet. Expect students to use different strategies to determine the answers. For example, some students might continue to add 2 more roses to the number of roses and add 3 more daisies to the number of daisies for each additional bouquet. Other students may multiply to find their answers or reason visually by thinking about the numbers of roses and daisies arranged in columns. If a question generates conflicting answers, pause and facilitate a discussion by using questions such as the following:
Differentiation: Challenge To challenge students, have them find the number of roses and number of daisies in the 57th bouquet. There will be 114 roses and 171 daisies in the 57th bouquet.
• Who thinks they have an answer? • Do you agree with that answer? Why? • Did anyone use a different strategy? • Can we find the answer by using multiplication? How? • Can anyone add on to that explanation? © Great Minds PBC
89
EUREKA MATH2
6 ▸ M1 ▸ TA ▸ Lesson 5
Continue by having students think–pair–share about the following three prompts. Encourage students to explain their reasoning. Riley says that if there are 2 roses for every 3 daisies, then one of the bouquets will have 100 roses and 150 daisies. Which bouquet will have 100 roses and 150 daisies? The 50th bouquet will have 100 roses and 150 daisies.
Kelly says that if there are 2 roses for every 3 daisies, then one of the bouquets will have 30 roses and 40 daisies. Which bouquet will have that number of roses and that number of daisies? There is no bouquet with 2 roses for every 3 daisies that would have 30 roses and 40 daisies. The ratio 100 : 150 is equivalent to the ratio 2 : 3, but the ratio 30 : 40 is not equivalent to the ratio 2 : 3. What do you think it means for ratios to be equivalent? It means that you must be able to multiply each number in the first ratio by the same number to get the numbers in the other ratio. So for any ratio, A : B, how could we find an equivalent ratio? Turn and talk to your partner.
Differentiation: Support To support students answering the question of how they could make an equivalent ratio, provide the following scaffolds: • Would the ratio 2A : 2B be equivalent to the ratio A : B? • Would the ratio 3A : 3B be equivalent to the ratio A : B? • What other ratios would be equivalent to the ratio A : B?
Choose several students to share their thinking. Then display the table showing ratios of the number of roses to the number of daisies in the four bouquets and the corresponding tape diagrams.
2:3 1 1
4:6
1 1
2 1
2
6:9
2 2
3 2
3
8 : 12
3 3
4 3
4
UDL: Representation
4 4
4
Do the tape diagrams show that the ratios 4 : 6, 6 : 9, and 8 : 12 are equivalent to the ratio 2 : 3? How?
Yes. Each tape diagram represents the ratio 2 : 3 because there are 2 units for roses and 3 units for daisies. The numbers in the units of the tape diagrams are the numbers we can multiply by 2 and 3 to get equivalent ratios. 90
When identifying and writing equivalent ratios, highlight the multiplicative relationship between equivalent ratios. Support students’ understanding by providing a diagram like the one shown.
×?
2:3 6:9
×?
© Great Minds PBC
EUREKA MATH2 6 ▸ M1 ▸ TA ▸ Lesson 5
Can we use a tape diagram to show that the ratio 100 : 150 is equivalent to the ratio 2 : 3? If so, how?
Language Support
Yes. We can draw a tape diagram representing the ratio 2 : 3 and give each unit a value of 50.
Consider starting the provided Frayer model to support the term equivalent ratios. The term equivalent ratios will be formalized at the end of Learn. Encourage students to complete the Picture, Example, and Nonexample quadrants as follows.
Direct students to problem 2. Have them complete the problem independently or in pairs. 2. Write two ratios: one that is equivalent to 3 : 5 and one that is not equivalent to 3 : 5. Justify your reasoning. A ratio that is equivalent to 3 : 5 is 30 : 50 because 10 ´ 3 is 30 and 10 ´ 5 is 50.
• Picture: Have students add a tape diagram with each unit showing the same value.
A ratio that is not equivalent to 3 : 5 is 18 : 35 because 6 ´ 3 is 18 but 6 ´ 5 is not 35. After most students have finished, choose several to share their answers. Consider choosing students who can justify their reasoning by using multiplication and students who can justify their reasoning by using tape diagrams. As students share, make two lists on the board. One list shows ratios equivalent to the ratio 3 : 5 and the other list shows ratios not equivalent to the ratio 3 : 5.
Using Equivalent Ratios to Solve Problems
• Example: Have students add an example they understand the most from the lesson. • Nonexample: Have students add a pair of ratios that are not equivalent (like those from problem 2). • Once the definition is presented to students, direct them to complete the Definition quadrant.
Students find unknown quantities by creating equivalent ratios. Return to the example about the bouquets of roses and daisies. Display the tape diagrams with the three unknown totals. Use the following questions to discuss how to represent the total number of flowers in each bouquet.
1
1
1
1
1
5
2
2
2
2
2
?
3
3
3
3
3
?
4
4
4
4
4
The first bouquet has 2 roses and 3 daisies for a total of 5 flowers. What are the total numbers of flowers in the 2nd, 3rd, and 4th bouquets? The total numbers of flowers are 10, 15, and 20. © Great Minds PBC
?
Differentiation: Challenge To offer students another challenge, have them consider the following pairs of ratios. Ask them what the unknown number in the ratio must be for each pair of ratios to be equivalent. • 2 : 3 and 8 : D • 5 : 6 and C : 30 • 4 : B and 12 : 21 • A : 10 and 5 : 5
12, 25, 7, 10
91
EUREKA MATH2
6 ▸ M1 ▸ TA ▸ Lesson 5
There are five units in each tape diagram: two for the number of roses and three for the number of daisies. What do you notice about the number 5 and the total number of flowers?
Teacher Note
We can multiply 5 by the value of one unit of the tape diagram to get the total number of flowers in each bouquet. When we divide the total number of flowers by 5, we get the value of each unit in the tape diagram.
Encourage students to ask themselves questions like the following when they use tape diagrams to solve ratio problems:
Direct students to problems 3 and 4. Consider working the problems as a class or have students complete the problems in pairs. Circulate as students work. Ask the following questions as necessary to support their understanding of how to use tape diagrams to reason about ratio problems. • In problem 3, how many units of the tape diagram represent the 16 roses in the bouquet? • In problem 4, how many units of the tape diagram represent the total of 105 flowers? • Knowing that each unit of the tape diagram has the same value, how can we determine the number of roses in each bouquet? How can we determine the number of daisies in each bouquet? • Can we use the total number of units in the tape diagrams and the value of each unit to determine the total number of flowers in each bouquet? If so, how? For problems 3 and 4, the bouquets have 2 roses for every 3 daisies. Label and use the tape diagrams to answer the questions. 3. If a bouquet has 16 roses, how many daisies are in the bouquet? What is the total number of flowers in the bouquet?
16 Number of Roses
8
• How can I use the numbers given in the problem to label any units of the tape diagram or to label the total? • How can I use the total number of units to find the value of one unit? • How can I use the value of some of the units to find the value of one unit? • How can I use the value of one unit to find the value of more than one unit?
Promoting the Standards for Mathematical Practice When students solve real-world problems by using ratio reasoning, they are reasoning abstractly and quantitatively (MP2). Ask the following questions to promote MP2:
8
• What does the problem ask you to do? • How do ratios represent this situation?
Number of Daisies
8
8
8
• Does your solution make sense mathematically?
2 units = 16 1 unit = 16 ¸ 2 = 8
92
© Great Minds PBC
EUREKA MATH2 6 ▸ M1 ▸ TA ▸ Lesson 5
3 units = 8 ´ 3 = 24
UDL: Action and Expression
5 units = 8 ´ 5 = 40 If a bouquet has 16 roses, then there are 24 daisies and a total of 40 flowers in the bouquet. 4. If a bouquet has a total of 105 flowers, how many roses are in the bouquet? How many daisies are in the bouquet? Number of Roses
21
• Solve the problem on the card and record the solution in your book.
21 105
Number of Daisies
21
21
21
5 units = 105 1 unit = 105 ¸ 5 = 21 2 units = 21 ´ 2 = 42 3 units = 21 ´ 3 = 63 If a bouquet has a total of 105 flowers, then there are 42 roses and 63 daisies in the bouquet. After several minutes, choose students to share their solutions. Next, divide students into pairs or small groups. Direct each group to a different Solve and Seek card. Each Solve and Seek card shows one of the problems 5–10 and an answer to another one of the problems 5–10. Share the following directions with students before they begin: • Groups solve the problem on the card. Then they search around the room for another card that shows the value of their answer. For example, if the solution to the problem on the card is 15 ounces, they find another card that shows the answer 15. • Once they find the card that shows the value of their answer, they solve the problem on that card. Then the group searches around the room again for another card that shows the answer. • The process continues until each group returns to a card that has the ratio problem they first solved or until time is up.
© Great Minds PBC
Consider providing written directions for students to refer to during the Solve and Seek activity.
• Find the value of your answer on another card, and then solve the problem on that card. • Repeat the process.
Teacher Note Consider printing enough copies of each Solve and Seek card to avoid groups having to share cards. The problems and answers on the Solve and Seek cards are structured so that students work each of three problem types in the time allowed. Problems 5–10 are the same as those on the Solve and Seek cards, giving students space to record their solutions to the problems they complete. If students cannot move around the classroom, have them work the problems at their desks. To guarantee that students work all three problem types, assign them to work at least one of each of the following problems: • Problem 5 or 6 • Problem 7 or 8 • Problem 9 or 10
93
6 ▸ M1 ▸ TA ▸ Lesson 5
EUREKA MATH2
Direct students to aim to complete at least three of the problems; however, encourage students to complete as many problems as they can in 10 minutes. Circulate as students work to provide support as needed by asking the following questions: • What tape diagram can you draw to represent this situation? How can you label it? • What quantities do you know? • What quantities do you need to find? 5. A board game includes tiles. Each tile is labeled with a letter. There are 3 tiles labeled A for every 4 tiles labeled E. If there are 9 tiles labeled A, how many tiles are labeled E? There are 12 tiles labeled E. 6. A recipe to make bubbles consists of water and dishwashing soap. A ratio that relates the number of cups of water to the number of cups of dishwashing soap is 6 : 1. If a bubble mixture has 4 cups of dishwashing soap, how many cups of water does it have? It has 24 cups of water. 7. Sasha and Julie sell water bottles to raise money for their school. A ratio that relates the number of water bottles Sasha sells to the number of water bottles Julie sells is 5 : 2. Together, they sell 63 water bottles. How many water bottles does Julie sell? Julie sells 18 water bottles. 8. The mixture in a container of hummingbird food consists of sugar and water. There are 2 ounces of sugar for every 8 ounces of water. How many ounces of sugar are in a 50-ounce container of hummingbird food? There are 10 ounces of sugar. 9. An amusement park has kiddie rides and thrill rides. For every 2 kiddie rides, there is 1 thrill ride. If the amusement park has 11 thrill rides, what is the total number of rides at the amusement park? There is a total of 33 rides at the amusement park.
94
© Great Minds PBC
EUREKA MATH2 6 ▸ M1 ▸ TA ▸ Lesson 5
10. A test has multiple-choice questions and essay questions. A ratio that relates the number of multiple-choice questions on the test to the number of essay questions on the test is 4 : 1. The test has 32 multiple-choice questions. What is the total number of questions on the test? There is a total of 40 questions on the test. Choose several students to share one of the problems they solved and their solution strategy. Point out when students mention using equivalent ratios in their strategy. We have been using equivalent ratios to find unknown quantities. Let’s formalize the meaning of the term equivalent ratios. Display the definition of equivalent ratios. Have students follow along as you read it aloud. Two ratios A : B and C : D are equivalent ratios if there is a nonzero number c such that C = c ´ A and D = c ´ B. How can you use the definition of equivalent ratios to show that the ratio 200 : 300 is equivalent to the ratio 2 : 3? The ratio 200 : 300 is equivalent to the ratio 2 : 3 because 100 ´ 2 is 200 and 100 ´ 3 is 300.
© Great Minds PBC
Teacher Note In lesson 2, students learned that because A : B is a ratio, A and B cannot both be 0. If students ask why A and B cannot both be 0, or if they ask why c cannot be 0 when determining whether ratios are equivalent, consider sharing the following explanations: • If A and B are both 0, then C : D is also 0 : 0 because c ´ A and c ´ B both equal 0. That means that the ratio A : B would not be equivalent to any other ratio except 0 : 0. • If c is 0, then C : D is 0 : 0 because 0 ´ A and 0 ´ B both equal 0. This means 0 : 0 would be equivalent to any ratio A : B.
95
EUREKA MATH2
6 ▸ M1 ▸ TA ▸ Lesson 5
Land Debrief 5 min Objectives: Find equivalent ratios by multiplying both numbers in a given ratio by the same nonzero number. Use equivalent ratios to find unknown quantities. Initiate a class discussion by using the following prompts. Encourage students to add to their classmates’ responses. For any two ratios, how do we know whether they are equivalent? If we can draw tape diagrams for each ratio that have the same number of equal-size units for the first and second numbers in the ratios, then the ratios are equivalent. If we can multiply the first and second numbers in one ratio by the same number to get the first and second numbers in the other ratio, then the ratios are equivalent. Why is it helpful to find equivalent ratios? Give an example. It is helpful because we can use equivalent ratios to find unknown quantities. In the bouquet example, there were 2 roses for every 3 daisies. So we could use an equivalent ratio to find the number of daisies in a bouquet when there are 16 roses in the bouquet.
Exit Ticket 5 min Provide up to 5 minutes for students to complete the Exit Ticket. It is possible to gather formative data even if some students do not complete every problem.
Teacher Note Assign the Practice problems for completion outside of class or use them in class if time remains after the lesson. Refer students to the Recap for support.
96
© Great Minds PBC
EUREKA MATH2 6 ▸ M1 ▸ TA ▸ Lesson 5
Recap
EUREKA MATH2
6 ▸ M1 ▸ TA ▸ Lesson 5
RECAP Name
Date
5
b. A mixture of craft clay has 28 ounces of cornstarch. How many ounces of water does the mixture have? Use your tape diagram from part (a) to support your answer.
28
Equivalent Ratios In this lesson, we
Terminology
•
identified and wrote equivalent ratios.
•
represented equivalent ratios with tape diagrams.
•
determined unknown quantities by using equivalent ratios.
Two ratios A : B and C : D are equivalent ratios if there is a nonzero number c such that C = c × A and D = c × B.
4
4
4
4
4
×4
5:2 20 : 8
×4
7
7
Number of Ounces of Water
7
7
7
7
cornstarch, so each unit of the tape diagram represents 28 ¸ 4,
or 7 ounces.
7 Because each unit represents 7 ounces, there are 35 ounces of water in the mixture.
Number of Ounces of Cornstarch
5
Number of Ounces of Water
5
5
5
5
The mixture has a total of
45 5
5
5
5
To make a total of 45 ounces of craft clay, 20 ounces of cornstarch and 25 ounces of water must be mixed.
2. A recipe for craft clay calls for 4 ounces of cornstarch for every 5 ounces of water.
The tape diagram has 4 units that represent the number of ounces of cornstarch and 5 units that represent the number of ounces of water.
Number of Ounces of Cornstarch
3
Number of Ounces of Water
3
3
3
3 27
3
3
3
3
15 There is a total of 27 ounces of craft clay in this mixture.
© Great Minds PBC
© Great Minds PBC
45 ounces, and the tape diagram has a total of 9 units. So each unit of the tape diagram represents 5 ounces.
d. A mixture of craft clay has 15 ounces of water. What is the total number of ounces of craft clay in this mixture?
a. Draw a tape diagram that represents the ratio of the number of ounces of cornstarch to the number of ounces of water.
Number of Ounces of Water
7
There are 35 ounces of water in the mixture.
The ratio 5 : 2 is equivalent to the ratio 20 : 8 because we can multiply 4 by 5 to get 20 and multiply 4 by 2 to get 8.
Number of Ounces of Cornstarch
7
c. To make a total of 45 ounces of craft clay, how many ounces of cornstarch and how many ounces of water must be mixed?
1. Show that the ratio 5 : 2 is equivalent to the ratio 20 : 8.
4
The mixture has 28 ounces of
Number of Ounces of Cornstarch
35
Examples
4
EUREKA MATH2
6 ▸ M1 ▸ TA ▸ Lesson 5
55
56
RECAP
The mixture has 15 ounces of water, so each unit of the tape diagram represents 15 ¸ 5, or 3 ounces. Because the tape diagram has a total of 9 units, there is a total of 27 ounces of craft clay in this mixture.
© Great Minds PBC
97
EUREKA MATH2
6 ▸ M1 ▸ TA ▸ Lesson 5
Sample Solutions Expect to see varied solution paths. Accept accurate responses, reasonable explanations, and equivalent answers for all student work.
98
© Great Minds PBC
PRACTICE Name
Date
5
1. In a rice recipe, a ratio that relates the number of cups of water to the number of cups of rice is 2 : 1.
The ratios 2 : 3 and 10 : 18 are not equivalent ratios because 10 = 5 × 2 but 18 does not equal 5 × 3.
a. Draw a tape diagram to represent this ratio. Number of Cups of Water Number of Cups of Rice
b. How many cups of water should be mixed with 4 cups of rice? There should be 8 cups of water mixed with 4 cups of rice.
This page may be reproduced for classroom use only.
1
Example
Equivalent Ratios
6 ▸ M1 ▸ TA ▸ Lesson 5
2. The tape diagram shows that the ratio 4 : 3 is equivalent to the ratio 8 : 6.
The ratios 2 : 3 and 8 : 12 are equivalent ratios because 8 = 4 × 2 and 12 = 4 × 3.
4 4
4 that C = c × A and D = c × B.
Two ratios A : B and C : D are equivalent ratios if there is a nonzero number c such
Definition
6 ▸ M1 ▸ TA ▸ Lesson 5 ▸ Equivalent Ratios Frayer Model Sample Student Responses
×4
4
2:3
8 : 12
4
×4
Nonexample
Picture
EUREKA MATH2
EUREKA MATH2
2
2
2
2
2
2
2
a. Draw a tape diagram to show that the ratio 4 : 3 is equivalent to the ratio 20 : 15.
5
5
5
5
5
5
5
b. Yuna thinks that the ratio 4 : 3 is equivalent to the ratio 10 : 9 because 6 + 4 = 10 and 6 + 3 = 9. What is Yuna’s mistake? What can she do to find an equivalent ratio? Yuna’s mistake is that she adds 6 to 4 and adds 6 to 3. She can multiply 6 by 4 and multiply 6 by 3 to find an equivalent ratio.
© Great Minds PBC
57
© Great Minds PBC
EUREKA MATH2 6 ▸ M1 ▸ TA ▸ Lesson 5
EUREKA MATH2
6 ▸ M1 ▸ TA ▸ Lesson 5
3. Consider the ratios 3 : 5 and 21 : D. What must c and D be for the ratios to be equivalent? For the ratios to be equivalent, c must be 7 and D must be 35.
EUREKA MATH2
6 ▸ M1 ▸ TA ▸ Lesson 5
b. How many ounces of cornstarch and how many ounces of baking soda are in a total of 32 ounces of sidewalk chalk? There are 8 ounces of cornstarch and 24 ounces of baking soda in a total of 32 ounces of sidewalk chalk.
4. The tape diagram represents the ratio of the number of free throws made to the number of free throws missed at a basketball game. Number of Free Throws Made
c. A mixture of sidewalk chalk has 15 ounces of baking soda. What is the total number of ounces of sidewalk chalk in the mixture? The total number of ounces of sidewalk chalk in the mixture is 20.
Number of Free Throws Missed
a. If this pattern continues and 12 free throws are made, what is the total number of free throw attempts in the game? The total number of free throw attempts in the game is 22.
6. For every 4 laps that Leo runs, Tyler walks 2 laps. How many laps does Leo run if Tyler walks 10 laps? Leo runs 20 laps.
b. If this pattern continues and there are a total of 33 free throw attempts in the game, how many free throws are made? How many free throws are missed? There are 18 free throws made and 15 free throws missed.
7. A ratio that relates the number of ounces of cream cheese to the number of ounces of yogurt in a fruit dip recipe is 1 : 1. How many ounces of cream cheese and how many ounces of yogurt are in 16 ounces of fruit dip? There are 8 ounces of cream cheese and 8 ounces of yogurt in 16 ounces of fruit dip.
5. A sidewalk chalk recipe calls for 1 ounce of cornstarch for every 3 ounces of baking soda. a. Draw a tape diagram that represents the ratio of the number of ounces of cornstarch to the number of ounces of baking soda.
8. Adults and children attend a circus. For every 2 adults at the circus, there are 3 children. If 275 people attend the circus, how many of them are children? There are 165 children at the circus.
Number of Ounces of Cornstarch Number of Ounces of Baking Soda
58
P R ACT I C E
© Great Minds PBC
© Great Minds PBC
© Great Minds PBC
P R ACT I C E
59
99
EUREKA MATH2
6 ▸ M1 ▸ TA ▸ Lesson 5
EUREKA MATH2
6 ▸ M1 ▸ TA ▸ Lesson 5
8 8 8
A ratio that relates the number of baseball cards to the number of football cards on display is 20 : 10. The ratio 2 : 1 is equivalent to the ratio 20 : 10 since we can multiply 10 by 2 to get 20 and multiply 10 by 1 to get 10. The ratio 4 : 2 is equivalent to the ratio 20 : 10 since we can multiply 5 by 4 to get 20 and multiply 5 by 2 to get 10.
8 8
5 to 15
2:3
1:1
6 ▸ M1 ▸ TA ▸ Lesson 5
13. There are 20 baseball cards and 10 football cards on display at a sports museum. Noah says that the ratio of the number of baseball cards to the number of football cards is 2 : 1. Sana says that the ratio of the number of baseball cards to the number of football cards is 4 : 2. How can they both be right?
9. Draw a line from the left column to the right column to connect representations of equivalent ratios.
8 to 4
EUREKA MATH2
40 14. Toby uses 3 cups of milk to make 4 batches of pancakes. How many cups of milk does he need to make 1 batch of pancakes?
6:4
Toby needs 43 cups of milk to make 1 batch of pancakes.
Remember For problems 10–12, multiply. 10. 37 ´ 24
11. 52 ´ 46
12. 73 ´ 32
888
2,392
2,336
60
100
P R ACT I C E
© Great Minds PBC
© Great Minds PBC
P R ACT I C E
61
© Great Minds PBC
EUREKA MATH2 6 ▸ M1 ▸ TA ▸ Lesson 5 ▸ Equivalent Ratios Frayer Model
Definition
Picture
Equivalent Ratios
Example
© Great Minds PBC
Nonexample
This page may be reproduced for classroom use only.
101
102
6. A recipe to make bubbles consists of water and dishwashing soap. A ratio that relates the number of cups of water to the number of cups of dishwashing soap is 6 : 1. If a bubble mixture has 4 cups of dishwashing soap, how many cups of water does it have?
24 8. The mixture in a container of hummingbird food consists of sugar and water. There are 2 ounces of sugar for every 8 ounces of water. How many ounces of sugar are in a 50-ounce container of hummingbird food?
10 10. A test has multiple-choice questions and essay questions. A ratio that relates the number of multiple-choice questions on the test to the number of essay questions on the test is 4 : 1. The test has 32 multiple-choice questions. What is the total number of questions on the test?
12 7. Sasha and Julie sell water bottles to raise money for their school. A ratio that relates the number of water bottles Sasha sells to the number of water bottles Julie sells is 5 : 2. Together, they sell 63 water bottles. How many water bottles does Julie sell?
18 9. An amusement park has kiddie rides and thrill rides. For every 2 kiddie rides, there is 1 thrill ride. If the amusement park has 11 thrill rides, what is the total number of rides at the amusement park?
33
5. A board game includes tiles. Each tile is labeled with a letter. There are 3 tiles labeled A for every 4 tiles labeled E. If there are 9 tiles labeled A, how many tiles are labeled E?
40
6 ▸ M1 ▸ TA ▸ Lesson 5 ▸ Solve and Seek Cards EUREKA MATH2
This page may be reproduced for classroom use only. © Great Minds PBC
Topic B Collections of Equivalent Ratios
In topic B, students learn that the set of all ratios that are equivalent ratios is a ratio relationship, and they use new tools to model and understand these relationships. To begin, students build on their experiences with unit conversion in previous grades as they organize collections of equivalent ratios into ratio tables. Students convert a ratio table into a new representation, the double number line, to allow for comparing quantities with unlike units. This foundational work with double number lines is essential for future problem solving with rates and percents. Students transform double number lines into graphs and recognize that all the points on the graph of a ratio relationship lie on a line that begins at the origin.
8
After developing fluency with representing ratio relationships in multiple ways, students examine patterns in these relationships. Students use repeated addition to create equivalent ratios 0 from pairs of numbers in ratio tables, and then Number of Packets of Sugar they connect these addition patterns to graphs. Progressing to multiplicative relationships, students Number of Grams of Sugar first apply multiplication as a strategy to create sets of equivalent ratios in both ratio tables and 0
104
Batches of Citrus Punch
y
Number of Cups of Pineapple Juice
In topic A, students develop an understanding of equivalent ratios through pictorial representations and tape diagrams. In topic B, students build on their learning from topic A by creating and interpreting collections of equivalent ratios. As students work with real-world scenarios, they attend to precision with ratio language. They use a variety of tools to explore the addition and multiplication patterns that exist in all ratio relationships, laying a foundation for comparing ratio relationships in topic C.
7
6
+2
5
+3
4
+2
3
+3
2
+2
1
+3 0
1
2
3
4
5
6
7
8
9
10
x
Number of Cups of Orange Juice
1
2
3
4
5
4
8
12
16
20
© Great Minds PBC
EUREKA MATH2 6 ▸ M1 ▸ TB
graphs. Next, students identify the multiplicative relationship that exists between the first and second numbers in any ratio. They write equivalent ratios that have a first or second number of 1 and use these ratios to solve problems. As the topic closes, students revisit tape diagrams. They apply their understanding of tape diagrams to represent multi-step ratio problems in a new way. By interpreting the change between the diagrams, students solve for unknown quantities.
Number of Julie’s Gold Coins
After
Number of Yuna’s Gold Coins
90
Number of Julie’s Gold Coins Number of Yuna’s Gold Coins
Number of Kilograms of Cement
3
4
6
8
9
12
12
16
15
20
60
80
×4
In topic C, students use graphs, double number lines, ratio tables, and verbal descriptions to compare ratio relationships. Topics D and E revisit collections of equivalent ratios when students convert units, determine unit rates, and solve percent problems. Before
Number of Kilograms of Sand
×4
90
Progression of Lessons Lesson 6
Ratio Tables and Double Number Lines
Lesson 7
Graphs of Ratio Relationships
Lesson 8
Addition Patterns in Ratio Relationships
Lesson 9
Multiplication Patterns in Ratio Relationships
Lesson 10 Multiplicative Reasoning in Ratio Relationships Lesson 11 Applications of Ratio Reasoning
© Great Minds PBC
105
6
LESSON 6
Ratio Tables and Double Number Lines Represent equivalent ratios by using ratio tables and double number lines. Use representations of ratio relationships to solve problems.
EUREKA MATH2
6 ▸ M1 ▸ TB ▸ Lesson 6
Name
EXIT TICKET
Date
6
There are 7 grams of protein in every 2 tablespoons of peanut butter. 1. Create a double number line to show the ratio relationship between the number of grams of protein and the number of tablespoons of peanut butter. 0
7
14
21
28
35
42
0
2
4
6
8
10
12
Number of Grams of Protein Number of Tablespoons of Peanut Butter
Lesson at a Glance This lesson establishes two new tools to represent sets of equivalent ratios: a ratio table and a double number line. Students use these tools when they work in pairs to find unknown quantities such as the amount of sugar in different amounts of soda. Students create and improve their representations of sets of equivalent ratios to help them solve a sequence of problems. This lesson introduces the term ratio relationship.
Key Questions • What are the advantages of using a ratio table to represent equivalent ratios? • What are the advantages of using a double number line to represent equivalent ratios?
2. How many grams of protein are in 12 tablespoons of peanut butter? There are 42 grams of protein in 12 tablespoons of peanut butter.
Achievement Descriptors 6.Mod1.AD3 Solve real-world and mathematical problems by using
ratio reasoning. (6.RP.A.3) 6.Mod1.AD4 Represent ratio relationships by using tables and the
coordinate plane. (6.RP.A.3.a)
© Great Minds PBC
71
© Great Minds PBC
EUREKA MATH2 6 ▸ M1 ▸ TB ▸ Lesson 6
Agenda
Materials
Fluency
Teacher
Launch 5 min
• None
Learn 30 min
Students
• Organizing Equivalent Ratios
• None
• Using Ratio Tables and Double Number Lines to Solve Problems
Lesson Preparation • None
Land 10 min
© Great Minds PBC
107
EUREKA MATH2
6 ▸ M1 ▸ TB ▸ Lesson 6
Fluency
Teacher Note
Determine Values on a Number Line
Students may use the Number Lines removable.
Students complete number lines to prepare for using double number lines. Directions: Complete each number line by filling in the unknown values.
1.
2.
3.
4.
5.
6.
108
0
1
2
3
4
5
0
5
10
15
20
25
0
0.3
0.6
0.9
0
1.3
2.6
3.9
5.2
6.5
0
1 3
2 3
1
4 3
5 3
0
2 5
4 5
6 5
8 5
2
1.2
1.5
© Great Minds PBC
EUREKA MATH2 6 ▸ M1 ▸ TB ▸ Lesson 6
Launch
5
Students analyze diagrams showing two different units of measurement.
Teacher Note
Display the first table showing the ruler diagram and the three statements. Tell students that two of the statements about the diagram are true, but one is false. Give them silent think time to determine which statement is false. Have students give a silent signal to indicate they are finished. Choose students to share their thinking and defend their reasoning.
Consider extending the activity in Launch with the following additional statements about the diagram with the pig. Two of the statements are true, and one of the statements is false.
Repeat this process for the next two tables.
CM
1. The length of the orange rectangle is about 5 centimeters.
0
1
2
3
4
5
6
7
8
9
2. The length of the orange rectangle is about 2 inches.
10 11 12
0 ¼ ½ ¾ 1 ¼ ½ ¾ 2 ¼ ½ ¾ 3 ¼ ½ ¾ 4 ¼ ½ ¾ IN Tons
Pounds
• The ratio of the number of pounds the pig weighs to the number of tons the pig weighs is 500 : 1 . 4
• The ratio of the number of tons two pigs weigh to the number of pounds two pigs weigh is 1,000 : 1 . 2
• There are 2,000 pounds in every 1 ton.
3. The length of the orange rectangle is about 5 inches.
Tons to Pounds Conversion Scale
0
0.255 250 0
© Great Minds PBC
500
0.5 750
1,000
1
0.75 1,250
1,500
1,750 2,000
1. The pig shown weighs 14 ton. 2. Two pigs would weigh 1,000 tons. 3. There is 1 ton for every 2,000 pounds.
109
EUREKA MATH2
6 ▸ M1 ▸ TB ▸ Lesson 6
16 oz 14 oz 12 oz 10 oz 8 oz 6 oz 4 oz 2 oz
2 CUPS
¾ ½ ¼
1 CUP
¾ ½ ¼
1. There are 2 cups of water in the measuring cup. 2. There are 16 ounces of water for every 1 cup of water. 3. There are 12 ounces of water in 1 12 cups of water.
Use the following prompts to facilitate a class discussion. Consider the measuring cup diagram. Use this diagram to provide an example of an equivalent ratio of quantities with different units. The ratio of the number of ounces of water to the number of cups of water is 8 : 1 or 16 : 2. What tool have we used to represent equivalent ratios? We have drawn tape diagrams to represent equivalent ratios. In a tape diagram, each unit is the same size because each unit represents the same amount. Are 1 ounce of water and 1 cup of water the same amount of water? No. So is a tape diagram with same-size units the best tool to represent the equivalent ratios of the number of ounces to the number of cups? Why? No. A tape diagram with same-size units is not the best tool because ounces and cups are different units and different amounts. Today, we will learn about two tools that help us organize equivalent ratios of quantities with the same units or with different units. We will use the new tools to help us solve ratio problems.
110
© Great Minds PBC
EUREKA MATH2 6 ▸ M1 ▸ TB ▸ Lesson 6
Learn Organizing Equivalent Ratios Students represent ratio relationships by using ratio tables and double number lines. Direct students to problem 1. Display the nutrition facts for a packet of sugar. How many grams of sugar are in 1 packet?
UDL: Representation Consider presenting the information in another format by providing students with real objects for reference. For problem 1, show students an actual packet of sugar or a picture of a packet of sugar. For problem 2, show students an actual 12-ounce can of soda or a picture of a 12-ounce can of soda.
There are 4 grams of sugar in 1 packet.
If necessary, point to where the label shows that 1 packet of sugar contains 4 grams of sugar. Then allow students to complete problem 1 individually or in pairs. 1. Consider the nutrition facts for 1 packet of sugar. Complete the table.
© Great Minds PBC
111
EUREKA MATH2
6 ▸ M1 ▸ TB ▸ Lesson 6
Number of Packets of Sugar
Number of Grams of Sugar
1
4
2
8
3
12
4
16
5
20
After a couple of minutes or once most have finished, invite students to share the numbers in their completed tables. Ask them how they determined the numbers in the table. Encourage them to use proper ratio language such as “The ratio of the number of packets of sugar to the number of grams of sugar is 1 : 4” or “For every 1 packet of sugar, there are 4 grams of sugar.” Then continue the class discussion by using the following prompt. Do the numbers in the table represent numbers in equivalent ratios? How do you know? Yes, they represent numbers in equivalent ratios. We know because we can multiply 1 and 4 each by 2 to get 2 and 8, by 3 to get 3 and 12, by 4 to get 4 and 16, and by 5 to get 5 and 20. Explain that a ratio table, like the one they completed in problem 1, is a tool that allows them to organize a set of equivalent ratios. We can see from the ratio table in problem 1 that for every 1 packet of sugar, there are 4 grams of sugar. This describes a ratio relationship. A ratio relationship is the set of all ratios that are equivalent ratios.
112
Teacher Note Because each unit of a tape diagram is equally sized and has the same value, it is typically best to use tape diagrams when two quantities in a ratio relationship have the same units. Conversely, it is best to use double number lines when the two quantities in a ratio relationship have different units. For example, a double number line that represents the relationship between 2 cups of sugar and 3 cups of flour in a recipe will show intervals on each number line that are the same length but that refer to two different quantities, 2 cups and 3 cups.
Teacher Note Consider having students refer to the definition of equivalent ratios from lesson 5 to show that these ratios are equivalent ratios.
Language Support To support students’ understanding of the new term ratio relationship, direct students to write the following statement in their books next to the table in problem 1: “There is a ratio relationship between the number of packets of sugar and the number of grams of sugar.”
© Great Minds PBC
EUREKA MATH2 6 ▸ M1 ▸ TB ▸ Lesson 6
Display the ratio table in figure 6.1, which shows the same ratio relationship but has two rows rather than two columns. Number of Packets of Sugar
Number of Grams of Sugar
1
2
3
4
5
4
8
12
16
20
Figure 6.1 Does this ratio table show the same ratio relationship as the table in problem 1? What is the ratio relationship? Yes, they are the same set of equivalent ratios as in problem 1. For every 1 packet of sugar, there are 4 grams of sugar. Display the ratio table without borders in figure 6.2. Ask students what they notice about the figure. They should notice that it shows the same information as the table in figure 6.1 but that there are no borders. 1
2
3
4
5
4
8
12
16
20
Number of Packets of Sugar Number of Grams of Sugar Figure 6.2 Display the number lines in figure 6.3. Explain that the number lines represent the number of packets of sugar and the number of grams of sugar. 1
2
3
4
5
4
8
12
16
20
Number of Packets of Sugar Number of Grams of Sugar Figure 6.3 © Great Minds PBC
113
EUREKA MATH2
6 ▸ M1 ▸ TB ▸ Lesson 6
Display the completed double number line in figure 6.4. Ask students what they notice. Students should notice that each tick mark corresponds to the two numbers in each ratio of the ratio relationship. 0
1
2
3
4
5
0
4
8
12
16
20
Number of Packets of Sugar Number of Grams of Sugar Figure 6.4 Explain that this figure shows another tool that represents a ratio relationship. Why are there two number lines? We need a number line for the number of packets of sugar and another number line for the number of grams of sugar.
Teacher Note Each number line in the double number lines shown in this topic start at a value of zero. However, according to the definition of a ratio, the pair of numbers in a ratio cannot both be zero. If students point out the zeros on the number lines, explain how the zeros make sense in the situation. For example, if there are 0 packets of sugar, then there are 0 grams of sugar. However, avoid stating that there is a ratio relating 0 packets of sugar and 0 grams of sugar.
Differentiation: Support
Why do you think the tick marks are drawn from one number line to the other? Every tick mark on the top number line shows 1 more packet of sugar. Every tick mark on the bottom number line shows 4 more grams of sugar. The two numbers in each ratio of the number of packets of sugar to the number of grams of sugar should line up at a tick mark. What do you think we can call this tool that has two number lines? Invite students to share their ideas about a name for this new representation. Then reveal that it is called a double number line. Allow students a couple of minutes to copy the double number line shown in figure 6.4 in their books after the ratio table in problem 1. Next, show students how they can extend both number lines. Write the number 6 on the number line representing the number of packets of sugar. Then draw a tick mark from the number 6 to the number line representing the number of grams of sugar. Have students think–pair–share about the following questions. If there are 6 packets of sugar, how many grams of sugar are there? If there are 6 packets of sugar, there are 24 grams of sugar.
114
To support students in understanding that the number line representing the number of grams of sugar counts by 4 for every 1 packet of sugar, consider physically marking the number line with all the tick marks between 0 and 4, between 4 and 8, and so on.
Differentiation: Challenge Consider challenging students with questions that involve reasoning about values that are between tick marks. For example, draw a tick mark from halfway between 0 and 1 packet of sugar to halfway between 0 and 4 grams of sugar. Then ask, “What ratio does this tick mark represent and why?”
© Great Minds PBC
EUREKA MATH2 6 ▸ M1 ▸ TB ▸ Lesson 6
Suppose we extend both number lines much farther to the right. What is another equivalent ratio of the number of packets of sugar to the number of grams of sugar we could find? Sample: Another equivalent ratio of the number of packets of sugar to the number of grams of sugar is 10 : 40.
Using Ratio Tables and Double Number Lines to Solve Problems Students solve problems about quantities in equivalent ratios by using ratio tables and double number lines. Allow students to turn and talk about the following question. How many packets of sugar would be in a 12-ounce can of soda? Then display the nutrition facts for a can of soda.
© Great Minds PBC
115
EUREKA MATH2
6 ▸ M1 ▸ TB ▸ Lesson 6
According to the nutrition facts, how many grams of sugar are in one 12-ounce can of this soda?
Differentiation: Challenge
The label shows that there are 40 grams of sugar in one 12-ounce can of this soda. Have students think–pair–share about the next question. Choose several students to share the strategies they used to determine the number of packets of sugar that would be in one 12-ounce can of this soda. Because 1 packet of sugar has 4 grams of sugar, how many packets of sugar would be in one 12-ounce can of this soda? How do you know?
If time allows, have students create a ratio table and double number line showing the ratio relationship between the number of packets of sugar and the number of ounces of this soda.
Because 40 grams of sugar is 10 times the number of grams of sugar in 1 packet, there would be 10 packets of sugar in one 12-ounce can of this soda. Continue the discussion to focus students’ attention on the ratio of the number of ounces of this soda to the number of grams of sugar. What is a ratio that relates the number of ounces of this soda to the number of grams of sugar? A ratio that relates the number of ounces of this soda to the number of grams of sugar is 12 : 40. So for every 12 ounces of this soda, there are 40 grams of sugar. Can we create a ratio equivalent to the ratio 12 : 40? How? Yes, we can multiply 12 and 40 each by the same number to create an equivalent ratio.
116
© Great Minds PBC
EUREKA MATH2 6 ▸ M1 ▸ TB ▸ Lesson 6
Allow students several minutes to complete problem 2 in pairs. 2. For every 12 ounces of soda, there are 40 grams of sugar.
Promoting the Standards for Mathematical Practice
a. Complete the ratio table. Number of Ounces of Soda
Number of Grams of Sugar
12
40
24
80
36
120
48
160
Students look for and make use of structure (MP7) when they include additional values in ratio tables and double number lines to find equivalent ratios. Ask the following questions to promote MP7: • What is another way you can improve the ratio table and double number line that will help you represent the soda problem? • How can you break the double number line into smaller intervals to make solving problems easier when the number of ounces of soda is not a multiple of 12?
b. Use the completed ratio table from part (a) to create a double number line. 0
12
24
36
48
0
40
80
120
160
Number of Ounces of Soda Number of Grams of Sugar
c. How many grams of sugar are in three 12-ounce cans of this soda? How do you know? There are 120 grams of sugar in three 12-ounce cans of this soda. One 12-ounce can of this soda contains 40 grams of sugar. If we multiply 12 and 40 each by 3, we get the equivalent ratio 36 :120. There is a tick mark from 36 ounces of soda to 120 grams of sugar.
© Great Minds PBC
117
EUREKA MATH2
6 ▸ M1 ▸ TB ▸ Lesson 6
d. How many grams of sugar are in half of a 12-ounce can of this soda? How do you know? There are 20 grams of sugar in half of a 12-ounce can of this soda. If we multiply 12 and 40 each by 1 , we get the equivalent ratio 6 : 20. We can draw a tick mark from 2 halfway between 0 and 12 ounces of soda to halfway between 0 and 40 grams of sugar to show that there are 20 grams of sugar in 6 ounces of this soda. Choose several students to share their strategies for finding the answers to parts (c) and (d). If they have not already done so, have students draw the tick mark and write the numbers for the ratio 6 : 20 from part (d) on the double number line. Invite students to think–pair–share about the following question. How many grams of sugar are in 3 ounces of this soda? Explain how you know.
There are 10 grams of sugar in 3 ounces of this soda. We can multiply 6 and 20 each by 12 or multiply 12 and 40 each by 14 to get 3 and 10.
We can draw a tick mark halfway between 0 and 6 ounces of soda and halfway between 0 and 20 grams of sugar on the double number line to show there are 10 grams of sugar in 3 ounces of this soda. Have students draw a tick mark and write the numbers for the ratio 3 : 10 on the double number line. Then have them think–pair–share about the following question. What is an equivalent ratio that we can find on the double number line between the tick marks that represent the ratios 6 : 20 and 12 : 40? How do you know? The ratio 9 : 30 is an equivalent ratio because 43 of 12 is 9 and 43 of 40 is 30.
We can draw a tick mark halfway between 6 and 12 ounces of soda and halfway between 20 and 40 grams of sugar on the double number line to show that 9 : 30 is an equivalent ratio.
Teacher Note When students determine an equivalent ratio, some may add a number to both 6 and 20 and state an incorrect ratio such as 7 : 21. If students make this mistake, ask them whether the ratio they find is in the same ratio relationship as 6 : 20 and 12 : 40. Have them try to multiply 7 and 21 by the same number to get either 6 : 20 or 12 : 40 so they realize that the ratio 7 : 21 is not an equivalent ratio.
Have students draw a tick mark and write the numbers for the ratio 9 : 30 on the double number line. Then direct students to complete problems 3–5 in pairs.
118
© Great Minds PBC
EUREKA MATH2 6 ▸ M1 ▸ TB ▸ Lesson 6
3. The graphic shows some of the different sizes of cups used to serve soda at fast food restaurants from 1955 to today. Some cups are labeled with the number of ounces of soda the cups can hold. Other cups are labeled with the number of grams of sugar in the soda the cups can hold. Use the double number line from problem 2 to complete the ratio table. 30 oz of soda
6 oz of soda 40 g of sugar
Size served in 1955
© Great Minds PBC
140 g of sugar
72 oz of soda
400 g of sugar
Size served today
119
EUREKA MATH2
6 ▸ M1 ▸ TB ▸ Lesson 6
Number of Ounces of Soda
Number of Grams of Sugar
6
20
12
40
30
100
42
140
72
240
120
400
4. The ratio table shows the relationship between the number of cups of pretzels and the number of ounces of cereal in a snack mix recipe. Number of Cups of Pretzels
Number of Ounces of Cereal
4
6
6
9
8
12
a. Jada says that for every 3 cups of pretzels, there are 2 ounces of cereal. Lacy says that for every 2 cups of pretzels, there are 3 ounces of cereal. Who is correct? Explain. Lacy is correct. The ratios of the numbers of cups of pretzels to the numbers of ounces of cereal are equivalent to the ratio 2 : 3. 120
© Great Minds PBC
EUREKA MATH2 6 ▸ M1 ▸ TB ▸ Lesson 6
b. Complete the double number line to show the relationship between the number of cups of pretzels and the number of ounces of cereal. 0 2 4 6 8 Number of Cups of Pretzels Number of Ounces of Cereal 0
3
6
9
12
5. Leo buys fabric at a craft store. Every 2 yards of fabric costs $7.00. a. Create a double number line to show the relationship between possible amounts of fabric in yards and the total cost in dollars. 0
2
4
6
8
10
0
7
14
21
28
35
Amount of Fabric (yards) Total Cost (dollars)
b. If the total cost of the fabric is $21.00, how many yards of fabric does Leo buy? Leo buys 6 yards of fabric. c. If Leo buys 1 yard of fabric, what is the total cost of the fabric? The total cost of the fabric is $3.50. When most students have finished, discuss problems 3–5 by asking any or all of the following questions: • How did you use the double number line from problem 2 to complete problem 3? • How did you use the given ratio table in problem 4 to write the unknown values on the double number line in problem 4? • How did you determine the total cost of 1 yard of fabric in problem 5? • Could you determine the amount of fabric in yards Leo can buy for $1.00? How? © Great Minds PBC
121
EUREKA MATH2
6 ▸ M1 ▸ TB ▸ Lesson 6
Land Debrief 5 min Objectives: Represent equivalent ratios by using ratio tables and double number lines. Use representations of ratio relationships to solve problems. Use the following prompts to guide discussion about ratio tables and double number lines. What are the advantages of using a ratio table to represent equivalent ratios? A ratio table allows us to organize sets of equivalent ratios in tables. The columns of a ratio table show the two quantities we are comparing in a ratio. The pairs of numbers in the rows of a ratio table form equivalent ratios. Once the numbers from ratios are organized into a ratio table, we can notice and identify multiplication patterns and addition patterns between columns and rows. What are the advantages of using a double number line to represent equivalent ratios? A double number line also organizes sets of equivalent ratios. The number lines in a double number line show the two quantities we are comparing in a ratio. The pairs of numbers on the tick marks form equivalent ratios. We can add tick marks to the double number line to write more equivalent ratios. We used both ratio tables and double number lines to represent ratio relationships. Did you find that one representation was better than the other for solving problems? Explain why. Sample: Yes, it is easier to solve problems by using a double number line than by using a ratio table. We can draw another tick mark on a double number line to find another equivalent ratio.
Exit Ticket 5 min Provide up to 5 minutes for students to complete the Exit Ticket. It is possible to gather formative data even if some students do not complete every problem. 122
Teacher Note Assign the Practice problems for completion outside of class or use them in class if time remains after the lesson. Refer students to the Recap for support.
© Great Minds PBC
EUREKA MATH2 6 ▸ M1 ▸ TB ▸ Lesson 6
Recap
EUREKA MATH2
6 ▸ M1 ▸ TB ▸ Lesson 6
RECAP Name
Date
6
EUREKA MATH2
6 ▸ M1 ▸ TB ▸ Lesson 6
2. Kelly does 50 jumping jacks in 1 minute. The top number line shows the number of jumping jacks Kelly does, and the bottom number line shows the number of minutes she does them.
Ratio Tables and Double Number Lines In this lesson, we •
represented ratio relationships by using ratio tables and double number lines.
•
used ratio tables and double number lines to solve problems.
A ratio relationship is the set of all ratios that are equivalent ratios.
Number of Jumping Jacks Number of Minutes
1. For every 10 minutes that Lacy practices her saxophone, Noah practices his saxophone for 5 minutes.
10
5
20
10
30
15
40
20
Each row represents a ratio that relates the number of minutes Lacy practices to the number of minutes Noah practices.
b. If Lacy practices for 60 minutes, for how many minutes does Noah practice? Noah practices for 30 minutes. c. If Noah practices for 45 minutes, for how many minutes does Lacy practice? Lacy practices for 90 minutes.
© Great Minds PBC
© Great Minds PBC
0
50
0
1
a. If Kelly continues to do jumping jacks at the same pace, how many jumping jacks does she do in 5 minutes? Use the double number line to support your answer.
a. Complete the ratio table to show the number of minutes that Lacy and Noah each practice saxophone. Number of Minutes Noah Practices
is represented by the second tick mark.
Terminology
Examples
Number of Minutes Lacy Practices
The ratio that relates the number of jumping jacks Kelly does to the number of minutes she does them is 50 :1. This ratio
The tick marks on the double number line show Kelly does 50 more jumping jacks for
Create tick marks that represent equivalent ratios to show 250 jumping
every 1 more minute.
Each ratio is equivalent to the ratio 10 : 5. For
Number of Jumping Jacks
example, the ratio 20 : 10 is
equivalent to the ratio 10 : 5 because 20 = 2 × 10 and
Number of Minutes
10 = 2 × 5.
jacks in 5 minutes.
0
50
100
150
200
250
0
1
2
3
4
5
Kelly does 250 jumping jacks in 5 minutes. b. If Kelly continues to do jumping jacks at the same pace, how many minutes does it take her to do 300 jumping jacks? Lacy practices twice as long as Noah does, so Noah practices half as long as Lacy does.
Number of Jumping Jacks Number of Minutes
The ratio 90 : 45 is equivalent to the ratio 10 : 5. If Noah practices for 9 × 5, or 45, minutes, then Lacy practices for
0
50
100
150
200
250
Create another tick mark to show 300 jumping
0
1
2
3
4
5
It takes Kelly 6 minutes to do 300 jumping jacks.
9 × 10, or 90, minutes.
73
74
RECAP
300
6
jacks in 6 minutes. The ratios 50 :1 and 300 : 6
are equivalent because
300 = 6 × 50 and 6 = 6 × 1.
© Great Minds PBC
123
EUREKA MATH2
6 ▸ M1 ▸ TB ▸ Lesson 6
Sample Solutions Expect to see varied solution paths. Accept accurate responses, reasonable explanations, and equivalent answers for all student work.
EUREKA MATH2
6 ▸ M1 ▸ TB ▸ Lesson 6
PRACTICE Name
Date
6
3. Blake practices piano 3 times as long as Tara does. a. Complete the ratio table to show possible numbers of minutes that Blake and Tara each practice piano.
1. Kelly makes bracelets by using green beads and blue beads. The tape diagram represents the ratio of the number of green beads to the number of blue beads. Number of Green Beads
Number of Minutes Blake Practices Piano
Number of Minutes Tara Practices Piano
15
5
30
10
45
15
60
20
Number of Blue Beads
Use the tape diagram to complete the ratio table. Number of Green Beads
Number of Blue Beads
3
5
6
10
9
15
12
20
15
25
EUREKA MATH2
6 ▸ M1 ▸ TB ▸ Lesson 6
b. If Blake practices piano for 18 minutes, for how many minutes does Tara practice? Tara practices for 6 minutes.
2. A recipe calls for 8 cups of water for every 16 ounces of macaroni. Complete the double number line. 0
4
8
12
c. If Tara practices piano for 30 minutes, for how many minutes does Blake practice?
16
Number of Cups of Water
Blake practices for 90 minutes.
Number of Ounces of Macaroni 0
© Great Minds PBC
124
8
16
24
32
75
76
P R ACT I C E
© Great Minds PBC
© Great Minds PBC
EUREKA MATH2 6 ▸ M1 ▸ TB ▸ Lesson 6
EUREKA MATH2
6 ▸ M1 ▸ TB ▸ Lesson 6
5. A recipe for a homemade modeling clay calls for 4 cups of baking soda for every 3 cups of water.
4. Ryan runs 2 laps around the track in 4 minutes.
a. According to this recipe, how many cups of baking soda must be mixed with 15 cups of water? Complete the ratio table to support your answer.
a. Complete the double number line. 0
1
2
3
4
5
6
Number of Laps
Number of Cups of Baking Soda
Number of Cups of Water
4
3
8
6
12
9
16
12
20
15
Number of Minutes 0
2
4
EUREKA MATH2
6 ▸ M1 ▸ TB ▸ Lesson 6
6
8
10
12
b. If Ryan continues to run at the same pace, how many laps does he run in 10 minutes? Ryan runs 5 laps in 10 minutes.
The recipe calls for 20 cups of baking soda to be mixed with 15 cups of water.
b. According to this recipe, how many cups of water must be mixed with 6 cups of baking soda? Create a double number line to support your answer. c. If Ryan continues to run at the same pace, how many minutes does it take him to run 7 laps?
0
4
6
8
12
16
20
24
0
3
4 12
6
9
12
15
18
Number of Cups of Baking Soda
It takes Ryan 14 minutes to run 7 laps.
Number of Cups of Water
The recipe calls for 4 12 cups of water to be mixed with 6 cups of baking soda.
© Great Minds PBC
© Great Minds PBC
P R ACT I C E
77
78
P R ACT I C E
© Great Minds PBC
125
EUREKA MATH2
6 ▸ M1 ▸ TB ▸ Lesson 6
EUREKA MATH2
6 ▸ M1 ▸ TB ▸ Lesson 6
6. The Snow Ratio reports the amount of water in a given amount of snow. The ratio table shows the relationship between the number of inches of water and the number of inches of snow. Number of Inches of Water
Number of Inches of Snow
1
10
2
20
3
30
•
Tyler says that for every 10 inches of water, there is 1 inch of snow.
•
Yuna says that for every 10 inches of snow, there is 1 inch of water.
EUREKA MATH2
6 ▸ M1 ▸ TB ▸ Lesson 6
Remember For problems 8–10, multiply. 8. 1,531 × 20
9. 2,347 × 30
10. 5,162 × 40
30,620
70,410
206,480
11. The ratio of the number of ounces of blueberries to the number of ounces of raspberries in a recipe is 4 : 3. a. According to this recipe, how many ounces of raspberries are there if 8 ounces of blueberries are used? Create a tape diagram to explain your thinking.
Who is correct? Explain. Yuna is correct. The ratios of the number of inches of snow to the number of inches of water are all equivalent to 10 : 1. So for every 10 inches of snow, there is 1 inch of water. 7. The double number line represents the ratio relationship between the number of tablespoons of vinegar and the number of drops of dishwashing soap in a homemade bug spray. Which statements are true? Choose all that apply. 0
2
4
6
8
10
0
6
12
18
24
30
Number of Ounces of Blueberries
2
2
2
Number of Ounces of Raspberries
2
2
2
2
There are 6 ounces of raspberries.
Number of Tablespoons of Vinegar
Number of Drops of Dishwashing Soap
b. According to this recipe, how many ounces of raspberries are there if a total of 28 ounces of berries are used? Create a tape diagram to explain your thinking.
A. For every 2 tablespoons of vinegar, there are 6 drops of dishwashing soap. B. For every 6 tablespoons of vinegar, there are 2 drops of dishwashing soap. C. The ratio of the number of tablespoons of vinegar to the number of drops of dishwashing soap is 3 : 1. D. The ratio of the number of tablespoons of vinegar to the number of drops of dishwashing soap is 1: 3.
Number of Ounces of Blueberries
4
4
4
Number of Ounces of Raspberries
4
4
4
4 28
There are 12 ounces of raspberries.
E. There are 5 tablespoons of vinegar for every 15 drops of dishwashing soap.
© Great Minds PBC
126
P R ACT I C E
79
80
P R ACT I C E
© Great Minds PBC
© Great Minds PBC
EUREKA MATH2 6 ▸ M1 ▸ TB ▸ Lesson 6
EUREKA MATH2
6 ▸ M1 ▸ TB ▸ Lesson 6
For problems 12–14, the coordinate plane shows the locations of Riley’s and Leo’s houses. It also shows the route that Riley takes to Leo’s house. House Locations
y
N
8 W
Distance (kilometers)
7
E S
6 5
Adesh’s House
4 3
Leo’s House
2 1
Riley’s House
0
1
2
3
4
5
6
7
8
x
Distance (kilometers)
12. Write the ordered pair that represents the location of Riley’s house and the location of Leo’s house. Riley’s house: ( Leo’s house: (
0 3
0
, ,
2
) )
13. What is the total distance of the route in kilometers that Riley takes to Leo’s house? The total distance of the route that Riley takes to Leo’s house is 5 kilometers.
14. Adesh’s house is located 4 km east and 2 km north of Leo’s house. Mark the location of Adesh’s house on the given coordinate plane.
© Great Minds PBC
© Great Minds PBC
P R ACT I C E
81
127
7
LESSON 7
Graphs of Ratio Relationships Plot points in the coordinate plane that each represent a ratio. Identify characteristics of graphs, tables, and double number lines representing ratio relationships.
EUREKA MATH2
6 ▸ M1 ▸ TB ▸ Lesson 7
Name
Date
EXIT TICKET
7
EUREKA MATH2
6 ▸ M1 ▸ TB ▸ Lesson 7
b. Use the ordered pairs from the table in part (a) to plot points in the coordinate plane. Food a Gorilla Eats
y
A gorilla eats a diet of vegetables and fruits. The gorilla eats 4 vegetables for every 1 piece of fruit. a. Complete the table. Number of Pieces of Fruit
Ordered Pair
4
1
(4, 1)
8
2
(8, 2)
12
3
(12, 3)
16
4
(16, 4)
20
5
(20, 5)
5
4 Number of Pieces of Fruit
Number of Vegetables
3
2
1
0
4
8
12
16
20
x
Number of Vegetables
© Great Minds PBC
91
92
EXIT TICKET
© Great Minds PBC
© Great Minds PBC
EUREKA MATH2 6 ▸ M1 ▸ TB ▸ Lesson 7
Lesson at a Glance In this lesson, students explore different representations of a ratio relationship. In analyzing and comparing the costs to feed a variety of pets, students construct ratio tables, double number lines, and graphs of ratio relationships. Students discover that the set of ordered pairs that represent a ratio relationship lie on a line.
Key Question • What do you notice about the graph that represents a ratio relationship?
Achievement Descriptor 6.Mod1.AD4 Represent ratio relationships by using tables and the coordinate
plane. (6.RP.A.3.a)
© Great Minds PBC
129
EUREKA MATH2
6 ▸ M1 ▸ TB ▸ Lesson 7
Agenda
Materials
Fluency
Teacher
Launch 5 min
• None
Learn 30 min
Students
• Feeding a Cat
• None
• Comparing Costs
Lesson Preparation
• Decision Time
• None
Land 10 min
130
© Great Minds PBC
EUREKA MATH2 6 ▸ M1 ▸ TB ▸ Lesson 7
Fluency Graph Ordered Pairs Students plot points in the coordinate plane to prepare for graphing ratio relationships.
Teacher Note
Directions: Plot and label each point in the coordinate plane. 1.
A (0, 0)
Students may use the Quadrant I removable.
y 10
2.
B (2, 1)
9 8
3. 4.
C (1, 5) D (7, 3)
7 6
4 3
5.
E (4, 0)
C
5
D
F
2
B
1
6.
F (0, 3)
© Great Minds PBC
E
A 0
1
2
3
4
5
6
7
8
9
10
x
131
EUREKA MATH2
6 ▸ M1 ▸ TB ▸ Lesson 7
Launch
5
Students review how to plot points in the coordinate plane. Display the Cost to Feed a Pet graph.
y
Differentiation: Support The Launch activity activates students’ prior knowledge of points in the coordinate plane and the meaning of their ordered pairs in context. If needed, review the following terms with students:
Cost to Feed a Pet
Total Cost (dollars)
• coordinate plane • x-axis • y-axis • point • ordered pair
Number of Days
x
Some students may benefit from additional practice in using ordered pairs to plot points in the coordinate plane and labeling given points on the plane with their ordered pairs.
Tell students that Noah has two pets: a cat and a dog. What does the graph tell you about Noah’s pets? It costs more to feed Noah’s dog for fewer days than it costs to feed his cat. Can we tell from this graph exactly how much it costs to feed Noah’s dog or his cat for a given number of days? Why? No. There are no numbers on the axes. We don’t know the exact location of the dog or the cat on the graph. Invite students to complete problems 1 and 2 with a partner.
132
© Great Minds PBC
EUREKA MATH2 6 ▸ M1 ▸ TB ▸ Lesson 7
Use the graph to answer the following questions.
Cost to Feed a Pet
y 9
Total Cost (dollars)
8 7 6 5 4 3 2 1 0
1
2
3
4
5
6
7
8
9
x
Number of Days
1. Noah estimates that it costs $ 4.00every 6 days to feed his cat. What is the ordered pair of the point that represents this information? (6, 4)
2. What is the ordered pair of the point that represents the cost to feed Noah’s dog for 4 days? (4, 6)
Display the graph and ask students to share their responses and reasoning. Then ask the following questions. The points represent the cost to feed Noah’s cat and the cost to feed his dog for different numbers of days. How did you determine the ordered pairs of these points?
The point for the cat is 6 units to the right and 4 units up from (0, 0). So the ordered pair of the point that represents the total cost to feed the cat for 6 days is (6, 4). The point for the dog is 4 units to the right and 6 units up from (0, 0). So the ordered pair of the point that represents the total cost to feed the dog for 4 days is ( 4, 6). © Great Minds PBC
133
6 ▸ M1 ▸ TB ▸ Lesson 7
EUREKA MATH2
Compare the meanings of the points (6, 4)and ( 4, 6). Does the order of the numbers in the ordered pairs matter? Yes, the order of the numbers in the ordered pairs matters. The first number represents the number of days of feeding the pet. The second number represents the total cost in dollars to feed the pet. The ordered pair ( 6, 4)means that it costs $ 4.00to feed Noah’s cat for 6 days. The ordered pair ( 4, 6)means that it costs $ 6.00to feed Noah’s dog for 4 days. This graph helped us think about the total costs to feed different pets for given numbers of days. Today, we will use graphs, tables, and double number lines to compare the total costs to feed four different pets.
Learn Feeding a Cat Students represent a ratio relationship by using a ratio table, a double number line, and a graph. Use the following prompt to introduce problems 3 and 4. Sasha is hoping to get a pet. She researches the costs to feed different pets. The first pet Sasha researches is a cat. Invite students to complete problem 3 with a partner. Circulate as students work. Provide support by asking the following questions as needed: • What is the ratio of the number of days to the total cost in dollars? • What is the ratio of the total cost in dollars to the number of days? • How do you use ratios to help you complete the table? • Are the ratios in the table equivalent? How do you know?
134
© Great Minds PBC
EUREKA MATH2 6 ▸ M1 ▸ TB ▸ Lesson 7
3. For every 5 days, the total cost to feed a cat is $ 3.00. a. Complete the table. Number of Days
Total Cost (dollars)
5
3
10
6
15
9
20
12
25
15
30
18
b. Complete the double number line. 9
12 15 18
3
6
5
10 15 20 25 30
Total Cost (dollars) Number of Days
When students are finished, gather the class. Is the relationship between the total cost and the number of days a ratio relationship? How do you know? Yes. Every 5days the total cost increases by $ 3 . 00. Sample:
Yes. The ratios that relate a total cost to a number of days are equivalent ratios. © Great Minds PBC
135
EUREKA MATH2
6 ▸ M1 ▸ TB ▸ Lesson 7
What is similar about the table and the double number line? Both show the ratio of 5 to 3 . Both show the same pairs of numbers. Both show the same equivalent ratios. Show the Cost to Feed a Cat double number line and coordinate plane. Teacher Note
Cost to Feed a Cat
y
Total Cost (dollars)
18
Cost to Feed a Cat 3
6
9
12 15 18
15 12 9 6
Total Cost (dollars)
3
Number of Days
0 5
10 15 20 25 30
5
10
15
20
25
30
Number of Days
What do you notice about the double number line and the coordinate plane? The top number line has the same label and values as the y -axis. The bottom number line has the same label and values as the x -axis. Each point on the graph represents a pair of numbers from the double number line. The ordered pair of each point represents a ratio of the number of days to the total cost in dollars. All the points on the graph lie on the same line.
x
On a typical double number line, the top number line shows the independent variable, and the bottom number line shows the dependent variable. For this double number line, the dependent variable, the total cost in dollars, is represented by the top number line. The independent variable, the number of days, is represented by the bottom number line. The order is intentionally reversed for this example to reinforce the concept that there are multiple ways to represent a ratio relationship. The ratio relationship is represented by the double number line and the coordinate plane.
UDL: Representation Showing The Cost to Feed a Cat double number line and graph side by side aligns to the UDL principle of Representation. Comparing the two representations and noticing similarities between them helps students visualize ratios in multiple formats.
What do you wonder? Do the points on a graph always represent ratios? 136
© Great Minds PBC
EUREKA MATH2 6 ▸ M1 ▸ TB ▸ Lesson 7
How would the graph change if the number of days was on the y -axis and the total cost was on the x -axis? Do the pairs of numbers from a double number line always create points that form a line on a graph? What is the relationship among the pairs of numbers in the table, the pairs of numbers on the double number line, and the points on the graph? The pairs of numbers in the table are the same as the pairs of numbers on the double number line. These pairs of numbers make up the ordered pairs of the points on the graph. The pairs of numbers in the table and on the double number line have the same ratio relationship as the ordered pairs of the points on the graph. The ordered pairs of the points on the graph represent equivalent ratios of the number of days to the total cost in dollars to feed a cat. Suppose we draw a line through the plotted points. What would the line represent? The line would represent the total cost to feed a cat for any number of days, including decimal numbers. For example, a point on the line could represent the total cost to feed a cat for 1 .5 days. How could you estimate the total cost to feed a cat for 22 days? I could estimate where a point for 2 2days would be on the graph in between points for 2 0and 2 5days. I could then estimate the total cost for 2 2days by looking at the y -axis. Because 2 2is about halfway between 2 0 and 2 5, the total cost would be about halfway between $ 12.00and $ 15.00, which is $ 13.50.
Comparing Costs Students write equivalent ratios as ordered pairs and plot the points that represent each ordered pair in the coordinate plane. Use the following prompts to explain more about Sasha’s plan. When Sasha researched the cost to feed a cat, she found the total cost is $ 3.00 every 5days. Sasha plans to compare the cost to feed a cat to the costs to feed other pets, such as a dog, a parrot, and a rabbit. © Great Minds PBC
137
EUREKA MATH2
6 ▸ M1 ▸ TB ▸ Lesson 7
Regardless of the pet Sasha chooses, do you think the relationship between the total cost to feed the pet and the number of days of feeding the pet is a ratio relationship? Why? Yes. If the cost of food does not change and the amount of food the pet eats does not change, then the total costs to feed the pet for different numbers of days should form equivalent ratios. Display the pictures of the cat, dog, parrot, and rabbit.
Invite students to turn and talk about which of the four pets they think costs the least to feed for 30 days. Allow students several minutes to complete problems 4–6 with a partner. Circulate as students work, asking the following questions: • What is the relationship between the pairs of numbers on the double number line and the points on the graph? • Where do you see a ratio relationship? What is the ratio relationship? • What patterns do you see in the table? • What patterns do you see in the graph? • Choose a point on the graph. What does that point represent?
138
Promoting the Standards for Mathematical Practice Students reason quantitatively and abstractly (MP2) when they use double number lines, tables, and graphs to represent the total costs to feed different pets. Ask the following questions to promote MP2: • How does the graph represent the total cost to feed a pet for a given number of days? • What does the double number line tell you about the total cost to feed a pet for 30 days?
© Great Minds PBC
EUREKA MATH2 6 ▸ M1 ▸ TB ▸ Lesson 7
4. Sasha determines the total cost to feed a dog is $ 3.00every 4 days. a. Complete the double number line. 3
6
9
12
15
4
8
12
16
20
Total Cost (dollars) Number of Days
b. Use the double number line from part (a) to plot four more points on the graph.
Cost to Feed a Dog
y 22 20 18 Total Cost (dollars)
16 14 12 10 8 6 4 2 0
2
4
6
8
10
12
14
16
18
20
22
x
Number of Days
© Great Minds PBC
139
EUREKA MATH2
6 ▸ M1 ▸ TB ▸ Lesson 7
c. Use the graph from part (b) to record the ordered pairs of the points.
(4, 3), (8, 6), (12, 9), (16, 12), and (20, 15) 5. The graph shows the ratio relationship between the number of days and the total cost in dollars to feed a parrot. How much does it cost to feed a parrot? Cost to Feed a Parrot
y 28 26 24
Total Cost (dollars)
22 20 18 16 14 12 10 8 6 4 2 0
2
4
6
8 10 12 14 16 18 20 22 24 26 28
x
Number of Days
Sample: It costs $ 2.00every 9 days to feed a parrot.
140
© Great Minds PBC
EUREKA MATH2 6 ▸ M1 ▸ TB ▸ Lesson 7
6. It costs $ 4.00 every 10days to feed a rabbit. Circle all the points on the graph that show the total costs to feed a rabbit.
Cost to Feed a Rabbit
y 30 28 26
Total Cost (dollars)
24 22 20 18 16 14 12 10 8 6 4 2 0
2
4
6
8 10 12 14 16 18 20 22 24 26 28 30
x
Number of Days
When most students are finished, bring the class together. Use the following questions to discuss representations of ratio relationships. In problem 4, what is the relationship between the pairs of numbers on the double number line and the ordered pairs of the points on the graph? The pairs of numbers on the double number line represent ratios from a ratio relationship. The ordered pairs of the points on the graph represent ratios from the same ratio relationship.
© Great Minds PBC
141
6 ▸ M1 ▸ TB ▸ Lesson 7
EUREKA MATH2
In problem 4, how can you determine a ratio of the total cost in dollars to the number of days by looking at the graph? For any point on the graph, I can write a ratio by using the ordered pair of the point. A ratio of the total cost in dollars to the number of days is the ratio of the y -coordinate to the x -coordinate. When completing problem 5, one partner says it costs $2.00 every 9 days to feed a parrot, and another partner says it costs $4.00 every 18 days to feed a parrot. Who is correct? How do you know? Both partners are correct. The ratios 2 : 9and 4 : 18are equivalent.
In problem 6, it costs $4.00 every 10 days to feed a rabbit. How did you know which points on the graph to circle? I looked for a point that is 1 0units to the right and 4 units up from (0, 0), which is ( 10, 4). Then I went another 10units to the right and another 4 units up, which took me to ( 20, 8). I looked for other points on the graph that would lie on the same line as these two points.
In problem 6, it costs $ 4.00every 1 0days to feed a rabbit. The point ( 4, 10)means every 4days it would cost $ 10.00to feed a rabbit instead of $4.00every 1 0 days. Why wouldn’t you circle the point ( 4, 10)when completing problem 6?
The point (5, 2)represents a total cost of $ 2.00to feed a rabbit for 5 days. The ratio 5 : 2 is equivalent to 1 0 : 4because 5 × 2 = 10and 2 × 2 = 4, which means that the point ( 5, 2) should also be on the graph of this ratio relationship. How did you know to circle the point (5, 2) in problem 6?
Decision Time Students analyze tables and graphs that represent ratio relationships. Use the following statement to introduce problem 7. Sasha decides to get the pet that costs the least to feed per month. Invite students to complete problem 7 with a partner.
142
© Great Minds PBC
EUREKA MATH2 6 ▸ M1 ▸ TB ▸ Lesson 7
7. Consider the cost to feed each pet. Cat: $ 3.00 every 5 days Dog: $ 3.00 every 4 days Parrot: $ 2.00 every 9days
Rabbit: $4.00 every 10 days
a. Each symbol on the graph represents the location of a point for the total cost to feed a pet for a given number of days. Each pet is shown with a different symbol. Plot another point for each pet on the graph. Label each symbol you draw with the name of the pet: cat, dog, parrot, or rabbit. Cost to Feed a Pet
y 28 26 24
Total Cost (dollars)
22
Dog
20
× Cat
18 16
×
14
×
12 10
×
8
2 0
Parrot
×
6 4
Rabbit
× 2 4 6 8 10 12 14 16 18 20 22 24 26 28 30 32 34 36
x
Number of Days
b. What is the total cost to feed a cat in a 3 0-day month? 3 × 6 = 18
The total cost to feed a cat in a 3 0-day month is $ 18.00. c. What is the total cost to feed a dog in a 3 0-day month? 3 ÷ 2 = 1.50
© Great Minds PBC
143
EUREKA MATH2
6 ▸ M1 ▸ TB ▸ Lesson 7
The cost to feed a dog for 2 days is $ 1.50.
1.50 × 15 = 22.50
The total cost to feed a dog in a 3 0-day month is $ 22.50. d. What is the total cost to feed a parrot in a 3 0-day month? 2 ÷ 9 ≈ 0.22
The cost to feed a parrot for 1 day is about $ 0.22.
0.22 × 30 = 6.6
The total cost to feed a parrot in a 3 0-day month is about $ 6.60. e. What is the total cost to feed a rabbit in a 3 0-day month? 4 × 3 = 12
The total cost to feed a rabbit in a 3 0-day month is $ 12.00. When students are finished, bring the class together to discuss which pet Sasha should choose. Based on the total costs you calculated, which pet should Sasha choose? Why? Sasha should choose the parrot because the total cost to feed a parrot in a 3 0-day month is less than the total cost to feed a cat, a dog, or a rabbit in a 3 0-day month. How did you determine the monthly cost to feed each pet? Sample: I extended the lines on the graph to determine where the points with an x -coordinate of 30would be and estimated the total cost to feed each pet. I determined the cost to feed each pet for 1day and multiplied that amount by 3 0. I used the ratio of the total cost in dollars to the number of days and wrote an equivalent ratio with a second number of 30. In real life, do you think feeding a cat would cost exactly $18.00 every 30 days? Why? Sample: No. This ratio assumes that a cat will eat the same amount of food every day, which is not true in real life.
144
© Great Minds PBC
EUREKA MATH2 6 ▸ M1 ▸ TB ▸ Lesson 7
No. The cost of cat food may change over time. Yes. If I give my cat a certain amount of food each day and the cat eats all the food, then the cat eats the same amount of food every day and the cost should remain the same.
Land Debrief 5 min Objectives: Plot points in the coordinate plane that each represent a ratio. Identify characteristics of graphs, tables, and double number lines representing ratio relationships. Initiate a class discussion by using the following questions. Encourage students to add on to their classmates’ responses. What do you notice about the graph that represents a ratio relationship? I notice that the ordered pair of each point represents a ratio, and the points will all lie on a straight line. Suppose it costs $5.00 every 6 days to feed a hamster. How do you find the ordered pairs to plot points on a graph?
I can label the x -axis Number of Days and the y -axis Total Cost (dollars). I can then use the ordered pair ( 6, 5) to plot a point on the graph. The ordered pairs of other points on the graph would represent ratios equivalent to 6 : 5. For example, the ordered pair ( 12, 10) is a point on the graph and represents the ratio 1 2 : 10.
Exit Ticket 5 min Provide up to 5 minutes for students to complete the Exit Ticket. It is possible to gather formative data even if some students do not complete every problem.
© Great Minds PBC
Teacher Note Assign the Practice problems for completion outside of class or use them in class if time remains after the lesson. Refer students to the Recap for support.
145
EUREKA MATH2
6 ▸ M1 ▸ TB ▸ Lesson 7
Recap
EUREKA MATH2
6 ▸ M1 ▸ TB ▸ Lesson 7
RECAP Name
Date
7
b. Use the ordered pairs from part (a) to plot points in the coordinate plane.
•
used double number lines and ratio tables to create sets of ordered pairs that represent equivalent ratios.
•
plotted points in the coordinate plane to represent a ratio relationship and observed that the points lie on the same line.
Examples
the points on the graph represent equivalent
11
ratios of the number
9
of tablespoons of vinegar to the number of tablespoons of oil in different-size batches of salad dressing.
1. In a salad dressing recipe, there are 3 tablespoons of oil for every 1 tablespoon of vinegar.
© Great Minds PBC
146
Number of Tablespoons of Oil
Ordered Pair
1
3
(1, 3)
2
6
(2, 6)
3
9
(3, 9)
(3, 9)
8 7
To plot the point (1, 3), start at the origin, (0, 0). Move 1 unit to the right. Then move
(2, 6)
6 5 4
(1, 3)
3
3 units up.
2
a. Complete the ratio table. Then determine the ordered pairs. Number of Tablespoons of Vinegar
10 Number of Tablespoons of Oil
In this lesson, we
Amounts of Oil and Vinegar
y
The ordered pairs for
Graphs of Ratio Relationships
Because there is 3 times as much oil as vinegar in this recipe, multiply the number of tablespoons of vinegar by 3 to determine the number of tablespoons of oil.
EUREKA MATH2
6 ▸ M1 ▸ TB ▸ Lesson 7
1 0
The first number in each ordered pair represents the number of tablespoons of vinegar. The second number in each ordered pair represents the number of tablespoons of oil.
93
1
2
3
4
5
6
7
8
9
10 11
x
Number of Tablespoons of Vinegar
94
RECAP
© Great Minds PBC
© Great Minds PBC
EUREKA MATH2 6 ▸ M1 ▸ TB ▸ Lesson 7
EUREKA MATH2
6 ▸ M1 ▸ TB ▸ Lesson 7
2. The graph shows the ratio relationship between the number of fiction books and the number of nonfiction books in a book collection. y
The ordered pairs for the points on the graph represent the
20 Number of Nonfiction Books
ratios 25 : 4, 50 : 8,
and 100 : 16. These are equivalent ratios.
Fiction and Nonfiction Books
16
12
8
4
0
25
50
75
x
100
Number of Fiction Books
a. Describe the ratio relationship between the number of fiction books and the number of nonfiction books in the collection. For every 25 fiction books, there are 4 nonfiction books. b. Use the graph to determine the number of nonfiction books in the collection if there are 75 fiction books in the collection. If there are 75 fiction books in the collection, there are 12 nonfiction books in the collection because the point (75, 12) lies on a line with the other points.
The ratio 25 : 4 is equivalent to the ratio 75 : 12 because 75 = 3 ´ 25 and 12 = 3 ´ 4.
c. How many fiction books are in the collection if there are 20 nonfiction books in the collection? If there are 20 nonfiction books in the collection, there are 125 fiction books in the collection. The ratio 25 : 4 is equivalent to the ratio 125 : 20 because 125 = 5 ´ 25 and 20 = 5 ´ 4. © Great Minds PBC
© Great Minds PBC
The point (125, 20) lies on a line with the other points.
RECAP
95
147
EUREKA MATH2
6 ▸ M1 ▸ TB ▸ Lesson 7
Sample Solutions Expect to see varied solution paths. Accept accurate responses, reasonable explanations, and equivalent answers for all student work.
EUREKA MATH2
6 ▸ M1 ▸ TB ▸ Lesson 7
PRACTICE Name
Date
EUREKA MATH2
6 ▸ M1 ▸ TB ▸ Lesson 7
7
c. Use the ordered pairs from part (b) to plot the points in the coordinate plane. y
1. On a television channel, there is 1 minute of commercials for every 5 minutes of television shows. Number of Minutes of Television Shows
a. Represent the ratio with a tape diagram. Number of Minutes of Commercials Number of Minutes of Television Shows
b. Use the tape diagram from part (a) to complete the table. Number of Minutes of Commercials
Number of Minutes of Television Shows
Ordered Pair
1
5
(1, 5)
2
10
(2, 10)
3
15
(3, 15)
4
20
(4, 20)
5
25
(5, 25)
© Great Minds PBC
148
25 24 23 22 21 20 19 18 17 16 15 14 13 12 11 10 9 8 7 6 5 4 3 2 1 0
1 2 3 4 5 6 7 8 9 10 11 12 13 14 15 16 17 18 19 20 21 22 23 24 25
x
Number of Minutes of Commercials
97
98
P R ACT I C E
© Great Minds PBC
© Great Minds PBC
EUREKA MATH2 6 ▸ M1 ▸ TB ▸ Lesson 7
EUREKA MATH2
6 ▸ M1 ▸ TB ▸ Lesson 7
b. What is the ratio of the number of tablespoons of white vinegar to the number of drops of essential oil?
2. The graph shows the ratio relationship between the number of tablespoons of white vinegar and the number of drops of essential oil in a recipe for a homemade cleaner.
The ratio of the number of tablespoons of white vinegar to the number of drops of essential oil is 2 : 3.
Homemade Cleaner
y 12
c. How many drops of essential oil are needed for 16 tablespoons of white vinegar?
11 Number of Drops of Essential Oil
EUREKA MATH2
6 ▸ M1 ▸ TB ▸ Lesson 7
For 16 tablespoons of white vinegar, 24 drops of essential oil are needed.
10 9
d. How many tablespoons of white vinegar are needed for 18 drops of essential oil?
8
For 18 drops of essential oil, 12 tablespoons of white vinegar are needed.
7 6
3. On a baseball team, there are 2 coaches for every 9 players. Use ordered pairs from this ratio relationship to plot at least three points in the coordinate plane.
5 4 3
Baseball Team
y
2 1 0
27 1
2
3
4
5
6
7
8
9
10 11 12
x
24
Number of Tablespoons of White Vinegar
21
© Great Minds PBC
© Great Minds PBC
Number of Tablespoons of White Vinegar
Number of Drops of Essential Oil
2
3
4
6
6
9
8
12
10
15
Number of Players
a. Use the graph to complete the ratio table.
18 15 12 9 6 3 0
1
2
3
4
5
6
7
8
9
x
Number of Coaches
P R ACT I C E
99
100
P R ACT I C E
© Great Minds PBC
149
EUREKA MATH2
6 ▸ M1 ▸ TB ▸ Lesson 7
EUREKA MATH2
6 ▸ M1 ▸ TB ▸ Lesson 7
EUREKA MATH2
6 ▸ M1 ▸ TB ▸ Lesson 7
5. Leo makes grilled cheese sandwiches for his friends. For every 2 slices of bread, he needs 1 slice of cheese. Which graph represents this ratio relationship? Explain.
4. The graph shows the ratio relationship between the number of fluid ounces and the number of tablespoons. Choose all the statements that appear to be true. y
3
0
Number of Slices of Cheese
11 10 9 8 7 6 5
2
1
2
4
5
6
7
8
9 10 11
x
Number of Slices of Bread
1 0
3
1
2
3
4
5
6
7
8
9
x
Graph B
y
Number of Slices of Cheese
4
11 10 9 8 7 6 5 4 3 2 1
13 12 Number of Tablespoons
Graph A
y
14
11 10 9 8 7 6 5 4 3 2 1 0
1
2
3
4
5
6
7
8
9 10 11
x
Number of Slices of Bread
Graph A represents this ratio relationship because it shows that for every 2 slices of bread, there is 1 slice of cheese. Each ordered pair in graph A represents a ratio that is equivalent to the ratio 2 :1. Although graph B has the ordered pair (2, 1) that represents the ratio 2 :1, none of the other ordered pairs on graph B represent ratios equivalent to the ratio 2 :1.
Number of Fluid Ounces
A. There are 6 fluid ounces for every 12 tablespoons. B. There is 1 tablespoon for every 2 fluid ounces. C. There are 5 tablespoons for every 2 1 fluid ounces. 2
D. There are 5 1 fluid ounces for every 11 tablespoons. 2
Remember
E. There are 10 tablespoons for every 20 fluid ounces.
For problems 6–8, multiply.
© Great Minds PBC
150
P R ACT I C E
101
6. 3,443 ´ 20
7. 5,165 ´ 50
8. 4,725 ´ 70
68,860
258,250
330,750
102
P R ACT I C E
© Great Minds PBC
© Great Minds PBC
EUREKA MATH2 6 ▸ M1 ▸ TB ▸ Lesson 7
EUREKA MATH2
6 ▸ M1 ▸ TB ▸ Lesson 7
9. Julie uses green leaves and yellow leaves to make an autumn project. a. Complete the ratio table. Number of Green Leaves
Number of Yellow Leaves
10
6
15
9
20
12
25
15
b. What is the ratio of the number of green leaves Julie uses to the number of yellow leaves she uses?
5:3
10. Jada and Tyler attend the same middle school. Jada lives 4 miles from the school. 5 Tyler lives 3 miles from the school. Choose the number sentence that correctly 4 compares the two distances. A. B. C. D.
4 5 4 5 3 4 3 4
miles < miles > miles = miles >
© Great Minds PBC
© Great Minds PBC
3 4 3 4 4 5 4 5
miles miles miles miles
P R ACT I C E
103
151
8
LESSON 8
Addition Patterns in Ratio Relationships Use addition patterns in tables and graphs of equivalent ratios to describe ratio relationships and find unknown quantities.
EUREKA MATH2
6 ▸ M1 ▸ TB ▸ Lesson 8
Name
EXIT TICKET
Date
8
Kayla uses green ribbon and yellow ribbon to tie bows on gifts. Use the ratio table shown to answer parts (a)–(c). Number of Inches of Green Ribbon
Number of Inches of Yellow Ribbon
8
10
16
20
24
30
32
40
Lesson at a Glance In this lesson, students first recognize addition patterns in a ratio table. Through a class discussion, they connect these addition patterns to the horizontal and vertical increases between points on the corresponding graph. Students compare tables that have addition patterns and identify which table represents a ratio relationship and why. Working in pairs, students use addition patterns in tables and graphs to find unknown quantities in real-world situations.
Key Questions • What addition patterns exist in ratio tables and graphs of ratio relationships?
a. Complete the ratio table.
• How can we use addition patterns to find unknown quantities?
b. What is a ratio of the number of inches of green ribbon Kayla uses to the number of inches of yellow ribbon she uses?
8 : 10
Achievement Descriptors 6.Mod1.AD1 Write and explain ratios that describe relationships
between two quantities. (6.RP.A.1) c. Fill in the blanks to make a true statement.
8 more inches of green ribbon Kayla uses, she uses For every of yellow ribbon.
10
6.Mod1.AD3 Solve real-world and mathematical problems by using
more inches
ratio reasoning. (6.RP.A.3) 6.Mod1.AD4 Represent ratio relationships by using tables and the
coordinate plane. (6.RP.A.3.a)
© Great Minds PBC
111
© Great Minds PBC
EUREKA MATH2 6 ▸ M1 ▸ TB ▸ Lesson 8
Agenda
Materials
Fluency
Teacher
Launch 5 min
• None
Learn 30 min
Students
• Addition Patterns in Ratio Tables and Graphs
• None
• Using Addition Patterns to Solve Problems
• None
Lesson Preparation
Land 10 min
© Great Minds PBC
153
EUREKA MATH2
6 ▸ M1 ▸ TB ▸ Lesson 8
Fluency Addition Number Patterns Students generate a pattern that follows a given rule to prepare for using addition patterns in ratio relationships. Directions: Use the rule to find the first four numbers of each pattern. 1.
Add 2 with a starting number of 5.
5, 7, 9, 11
2.
Add 12 with a starting number of 7.
7, 19, 31, 43
3.
Add 3 with a starting number of 5.7.
5.7, 8.7, 11.7, 14.7
4.
Add 3.5 with a starting number of 2.
2, 5.5, 9, 12.5
5.
Add 3 with a starting number of 5.
6.
Add 2.3 with a starting number of 5.2.
154
2
5, 5 23 , 6 13 , 7 5.2, 7.5, 9.8, 12.1
© Great Minds PBC
EUREKA MATH2 6 ▸ M1 ▸ TB ▸ Lesson 8
Launch
5
Students determine patterns in visual sequences in preparation for recognizing addition patterns in tables and graphs of ratio relationships. Display the five picture patterns. Allow students about 2 minutes to analyze the patterns silently. Encourage them to determine the next picture in each pattern.
A
© Great Minds PBC
B
C
D
E
155
6 ▸ M1 ▸ TB ▸ Lesson 8
EUREKA MATH2
Choose different students to describe one of the patterns and share what the next picture is. As students share, highlight responses that describe each pattern as an addition pattern, a multiplication pattern, neither, or both. How would you describe each pattern? Describe the next picture if the pattern continues. Pattern A adds 2 butterflies each time. The next picture in pattern A is 8 butterflies. Pattern B adds 3 suns each time. The next picture in pattern B is 12 suns.
Pattern C adds 1 12 Earths each time. The next picture in pattern C is 6 Earths.
Pattern D multiplies the number of fish by 3 each time. The next picture in pattern D is 27 fish. Pattern E adds 0 trees or multiplies the number of trees by 1 each time. The next picture in pattern E is 1 tree. Once students have described each of the five patterns and identified the next picture in the pattern, have them turn and talk about the following question. How could we figure out what the one hundredth picture would be if each pattern continues? Circulate and listen for student reasoning about how to determine the one hundredth picture. Some students may realize that repeating the addition or multiplication pattern one hundred times is not the most efficient strategy. Today, we will use addition patterns to describe ratio relationships and use them to find unknown quantities.
156
© Great Minds PBC
EUREKA MATH2 6 ▸ M1 ▸ TB ▸ Lesson 8
Learn Addition Patterns in Ratio Tables and Graphs Students examine addition patterns in tables and graphs of ratio relationships. Direct students to problem 1. Allow them about 1 minute to complete the problem individually or in pairs. 1. The graph represents the ratio relationship between the number of cups of orange juice and the number of cups of pineapple juice in batches of a citrus punch. Use the graph to complete the ratio table.
Teacher Note When students use the graph to complete the ratio table, they count horizontally and vertically to identify the coordinates of each ordered pair. They may recognize that they count 3 more units to the right and 2 more units up each time.
Batches of Citrus Punch
y
Number of Cups of Pineapple Juice
8
7
6
5
4
3
2
1
0
1
2
3
4
5
6
7
8
9
10
x
Number of Cups of Orange Juice © Great Minds PBC
157
EUREKA MATH2
6 ▸ M1 ▸ TB ▸ Lesson 8
Number of Cups of Orange Juice
Number of Cups of Pineapple Juice
3
2
6
4
9
6
After students check their answers, continue with a class discussion using the following prompts. Do you think the citrus punch has a stronger pineapple taste or a stronger orange taste? Why? I think it has a stronger orange taste because the points on the graph show that there is more orange juice than pineapple juice in each batch of citrus punch. Describe the ratio relationship between the number of cups of orange juice and the number of cups of pineapple juice.
UDL: Action and Expression Consider providing a sentence frame or sentence starter to support students in describing a ratio relationship precisely. For example, say “For every cups of orange juice, there are cups of pineapple juice” and have students fill in the blanks. Or say “For every 3 cups of orange juice, there are ” and have students complete the sentence. Post the sample sentence frames and, as needed, encourage students to refer to the examples as they describe ratio relationships throughout the lesson.
Promoting the Standards for Mathematical Practice
For every 3 cups of orange juice, there are 2 cups of pineapple juice. Look at the ratio table you completed in problem 1. What addition patterns do you notice in the ratio table? Is there more than one addition pattern? There is an addition pattern of adding 3 each time for the number of cups of orange juice. There is an addition pattern of adding 2 each time for the number of cups of pineapple juice. Display the ratio table showing the addition patterns.
Number of Cups of Orange Juice
Number of Cups of Pineapple Juice
3
2
6
4
9
6
+3 +3
158
+2 +2
Students look for and make use of structure (MP7) when they recognize addition patterns in ratio tables and graphs of ratio relationships and use them to find equivalent ratios. Ask the following questions to promote MP7: • How are the ratio table and graph of the ratio relationship related? How can that help you find equivalent ratios? • What is another way you can complete a ratio table to help you find equivalent ratios? • How can what you know about equivalent ratios help you find points on the graph of a ratio relationship?
© Great Minds PBC
EUREKA MATH2 6 ▸ M1 ▸ TB ▸ Lesson 8
Can we use the addition patterns to create another row of the ratio table? How? Yes. We can add 3 more cups of orange juice and 2 more cups of pineapple juice to create another row of the ratio table. Have students create two more rows of the ratio table using the addition patterns. Then display the graph that shows a line that passes through the points.
Batches of Citrus Punch
y
Number of Cups of Pineapple Juice
8
7
6
5
Teacher Note Avoid using the words discrete or continuous when discussing graphs. Instead, discuss what it means to draw a line through the points on the graph of a ratio relationship. If time permits, consider comparing situations when it makes sense to draw a line through points and when it does not. For example, if graphing the ratio relationship between the number of ounces of soda and the number of grams of sugar, it makes sense to draw a line through the points. It does not make sense to draw a line through the points if graphing the ratio relationship between the number of dogs and the number of cats in an animal shelter.
4
3
2
1
0
1
2
3
4
5
6
7
8
9
10
x
Number of Cups of Orange Juice
Briefly discuss that because we can have fractions of cups of orange juice and fractions of cups of pineapple juice, we can draw a line that starts at the origin and passes through the points for this situation. Consider labeling the points on the graph (3, 2), (6, 4), and (9, 6). Encourage students to study the graph and think about whether it shows addition patterns like those they saw in the ratio table. © Great Minds PBC
159
EUREKA MATH2
6 ▸ M1 ▸ TB ▸ Lesson 8
Does the graph show the same addition patterns we saw in the ratio table? How? Yes. From one point to the next point, the graph increases by 3 horizontally and increases by 2 vertically. This is like the add 3 pattern in the first column of the ratio table and the add 2 pattern in the second column. Display the graph that shows the horizontal and vertical increases between points.
Batches of Citrus Punch
y
Teacher Note A common misconception for students is that they try to count diagonally along the line rather than counting horizontally and vertically. Remind them that when we plot a point like (3, 2), we move horizontally and then vertically from the origin. When we move from one point to the next, we also move horizontally and vertically.
Number of Cups of Pineapple Juice
8
7
6
+2
5
+3
4
+2
3
+3
2
+2
1
Language Support
+3 0
1
2
3
4
5
6
7
8
9
10
x
Number of Cups of Orange Juice
Do the horizontal and vertical increases show that the graph represents the same ratio relationship we found in the table? How? Yes. There are horizontal increases of 3 and vertical increases of 2. The graph shows that for every 3 more cups of orange juice, there are 2 more cups of pineapple juice. 160
To support students with connecting the patterns in the table with the patterns in the graph, have students say specific values in a row of the ratio table. Gesture the positive horizontal and positive vertical movement to the corresponding point on the graph. Consider supporting the terms horizontal and vertical by gesturing their movements to the class while saying the terms.
© Great Minds PBC
EUREKA MATH2 6 ▸ M1 ▸ TB ▸ Lesson 8
Allow students a couple of minutes to complete problem 2 in pairs. 2. Use the addition patterns in the graph to identify three more ordered pairs that lie on a line with the given points. Explain what the ordered pairs represent in the ratio relationship.
Batches of Citrus Punch
y 17 16
Number of Cups of Pineapple Juice
15 14 13 12 11 10 9 8 7 6 5 4 3 2 1 0
1
2
3
4
5
6
7
8
9
10
11
12
13
14
15
16
17
18
19
x
Number of Cups of Orange Juice
(12, 8) represents 12 cups of orange juice and 8 cups of pineapple juice. (15, 10) represents 15 cups of orange juice and 10 cups of pineapple juice. (18, 12) represents 18 cups of orange juice and 12 cups of pineapple juice. Select several students to share an ordered pair and what it represents. Then display the side-by-side tables, one that shows a ratio relationship between the number of cups of orange juice and the number of cups of pineapple juice and one that does not show a ratio relationship between these quantities. © Great Minds PBC
161
EUREKA MATH2
6 ▸ M1 ▸ TB ▸ Lesson 8
Number of Cups of Orange Juice
Number of Cups of Pineapple Juice
Number of Cups of Orange Juice
Number of Cups of Pineapple Juice
3
2
7
4
6
4
10
6
9
6
13
8
What addition patterns do you see in these tables? Both tables have an add 3 pattern in the first column and an add 2 pattern in the second column. We already know the first table represents a ratio relationship. Does the second table represent a ratio relationship? Explain. No. The pairs of numbers in the second table do not form equivalent ratios. We cannot multiply 7 and 4 each by the same number to get 10 and 6, and we cannot multiply 7 and 4 each by the same number to get 13 and 8. So, although there are addition patterns in the second table, it is not a ratio table. It does not represent a ratio relationship because the pairs of numbers do not form equivalent ratios. To ensure student understanding about addition patterns in ratio tables, have students think–pair–share about the following prompt. If the ratio that relates one quantity to another quantity is 7 : 4, how can we use addition patterns to complete a ratio table? How can we use addition patterns to draw a graph of the ratio relationship?
Teacher Note This analysis helps students understand three key points about addition patterns in ratio tables: • The presence of addition patterns in a table does not necessarily mean the table represents a ratio relationship. • The absence of addition patterns in a table does not necessarily mean the table does not represent a ratio relationship. • If the first quantity in a ratio relationship has an add A pattern and the second quantity has an add B pattern, then all pairs of numbers in the rows of the table form ratios equivalent to the ratio A : B.
We can start with a row that shows 7 in the first column and 4 in the second column. Then we can continue adding 7 to each number in the first column and adding 4 to each number in the second column to create more rows of the ratio table. We can start by plotting the point (7, 4). Then we use an add 7 pattern and an add 4 pattern from each point to plot more points. 162
© Great Minds PBC
EUREKA MATH2 6 ▸ M1 ▸ TB ▸ Lesson 8
Display the side-by-side tables showing amounts of two quantities. Have students think–pair–share about the following prompt.
Amount of the First Quantity
Amount of the Second Quantity
Amount of the First Quantity
Amount of the Second Quantity
7
4
35
20
21
12
42
24
28
16
49
28
Adesh says the first table represents a ratio relationship. Tara disagrees because she does not see an addition pattern in the first table. What do you think? Adesh is correct. If we start with 7 in the first column and add 7 twice, we get 21. If we start with 4 in the second column and add 4 twice, we get 12. Also, if we start with 7 in the first column and add 7 three times, we get 28. If we start with 4 in the second column and add 4 three times, we get 16. Yes. Adesh is correct because the pairs of numbers in each row form equivalent ratios. They follow the same addition pattern. Have students think–pair–share about the following prompt. Adesh says the second table represents the same ratio relationship. Tara disagrees because she does not see a row with the numbers 7 and 4 in the table. What do you think? Adesh is correct. All the ratios represented by pairs of numbers in the table are equivalent to the ratio 7 : 4. Yes, Adesh is correct because even though there is not a row with the numbers 7 and 4 in the table, all the ratios represented by pairs of numbers in the table are equivalent to the ratio 7 : 4.
© Great Minds PBC
163
EUREKA MATH2
6 ▸ M1 ▸ TB ▸ Lesson 8
Using Addition Patterns to Solve Problems Students describe ratio relationships and determine unknown quantities by using addition in tables and graphs. Transition students to problems 3–5. Allow them to complete the problems in pairs. Circulate as they work and ask the following questions to support their thinking: • What addition patterns do you see in the ratio table or graph of the ratio relationship? • How can you use addition patterns to create another row in the ratio table? How can you use addition patterns to plot another point on the graph of the ratio relationship? • What values are given for each quantity that can help you find an addition pattern? • How can you tell whether the ratios are equivalent? 3. Whole milk is used to produce butter. It takes about 22 cups of whole milk to produce 1 pound of butter. a. Complete the ratio table. Number of Cups of Whole Milk
Number of Pounds of Butter
22
1
44
2
66
3
88
4
110
5
Teacher Note If students question why problem 3 says it takes about 22 cups of milk to produce 1 pound of butter, explain that sometimes the amounts in a ratio relationship must be approximated to make the computations easier.
b. What is a ratio of the number of cups of whole milk used to the number of pounds of butter produced? Sample: 22 : 1 164
© Great Minds PBC
EUREKA MATH2 6 ▸ M1 ▸ TB ▸ Lesson 8
c. Use the addition patterns in the table to fill in the blanks to describe the ratio relationship. For every 22 more cups of whole milk used, there is/are of butter produced.
1
more pound(s)
4. The graph shows the ratio relationship between the number of pounds of grapes and the total cost of the grapes at a store.
Cost of Grapes
y 22
To further challenge students, have them complete the following problem. • A carpenter covers a tabletop with tiles. One tile is made up of 5 squares and 8 triangles. Use addition patterns to complete a ratio table. Show that if there are 35 squares, then there are 56 triangles. Ask students how many tiles are represented by each row of their ratio table. For example, the first row represents the number of squares and the number of triangles in one tile, the second row represents the number of squares and the number of triangles in two tiles, and so on.
21 20 19 18 17 16
Total Cost (dollars)
Differentiation: Challenge
15 14
Then have students continue the addition patterns to find the number of squares and the number of triangles in the tiles needed to cover a 3-tile by 3-tile area.
13 12 11 10 9 8 7 6 5 4 3 2 1 0
1
2
3
4
5
6
7
8
9
10
11
x
Number of Pounds of Grapes
a. Describe the ratio relationship by using the addition patterns in the graph. For every 2 more pounds of grapes, the cost is $5 more.
© Great Minds PBC
165
EUREKA MATH2
6 ▸ M1 ▸ TB ▸ Lesson 8
b. What is the total cost of 6 pounds of grapes? Use the graph to explain your answer. The point (6, 15) lies on a line with the three given points, so the cost of 6 pounds of grapes is $15. c. How many pounds of grapes can someone buy with exactly $25? Use the graph to explain your answer. The point (10, 25) lies on a line with the three given points, so someone can buy 10 pounds of grapes with exactly $25. 5. A scientist studies a group of left-handed people. In the study, there are 10 left-handed males for every 8 left-handed females. a. Complete the ratio table. Number of Left-Handed Males
10
15
20
25
30
Number of Left-Handed Females
8
12
16
20
24
b. Describe the ratio relationship by using the addition patterns in the table. For every 5 more left-handed males, there are 4 more left-handed females. c. If there are 40 left-handed males in the study, how many left-handed females are there? There are 32 left-handed females. Once most students have finished, choose several students to share their answers. Use the following questions to discuss any strategies and the reasoning students used to complete each problem: • Could you have given a different ratio in problem 3? If so, what? • How did you know the point (6, 15) lies on a line with the given three points in problem 4? • How did you figure out the addition patterns in problem 5?
166
© Great Minds PBC
EUREKA MATH2 6 ▸ M1 ▸ TB ▸ Lesson 8
Land Debrief 5 min Objective: Use addition patterns in tables and graphs of equivalent ratios to describe ratio relationships and find unknown quantities. Use the following prompts to guide discussion about addition patterns in ratio tables and graphs of ratio relationships. Look back at the ratio relationship between the number of cups of orange juice and the number of cups of pineapple juice in problem 1. What addition patterns exist in the ratio table and the graph of this ratio relationship? The ratio table has an add 3 pattern for the number of cups of orange juice and an add 2 pattern for the number of cups of pineapple juice. On the graph, there is a horizontal increase of 3 for the number of cups of orange juice and a vertical increase of 2 for the number of cups of pineapple juice. How did we use addition patterns to solve problems? We identified the addition patterns in a given ratio table or graph of a ratio relationship and used them to create more rows of the table or plot more points on the graph. That helped us find unknown quantities. Look back at problem 1. Do you see other patterns in the ratio table? I see that in the column for the number of cups of orange juice and the column for the number of cups of pineapple juice, there is a pattern of multiply by 1, multiply by 2, multiply by 3, and so on.
Exit Ticket 5 min Provide up to 5 minutes for students to complete the Exit Ticket. It is possible to gather formative data even if some students do not complete every problem.
© Great Minds PBC
Teacher Note Assign the Practice problems for completion outside of class or use them in class if time remains after the lesson. Refer students to the Recap for support.
167
EUREKA MATH2
6 ▸ M1 ▸ TB ▸ Lesson 8
Recap
EUREKA MATH2
6 ▸ M1 ▸ TB ▸ Lesson 8
RECAP Name
Date
EUREKA MATH2
6 ▸ M1 ▸ TB ▸ Lesson 8
8
a. Fill in each blank to make the statement true.
3 For every of corn starch.
Addition Patterns in Ratio Relationships
more tablespoons of dish soap, there are
If there are 12 tablespoons of dish soap, there are 16 tablespoons of corn starch.
•
observed addition patterns in tables and graphs of ratio relationships.
•
used addition patterns to find equivalent ratios and to calculate unknown quantities.
If we continue the addition patterns, the next point on the graph would be (12, 16). The ratio 3 : 4 is equivalent to the ratio 12 : 16.
Examples 1. The graph shows the ratio relationship between the number of tablespoons of dish soap and the number of tablespoons of corn starch in a homemade toy putty recipe.
c. Use addition patterns to complete the ratio table. The numbers in the left column increase by 3.
Toy Putty Recipe
Number of Tablespoons of Dish Soap
Number of Tablespoons of Corn Starch
15
20
18
24
21
28
24
32
27
36
17
+3
16 15
+3
Number of Tablespoons of Corn Starch
14 13
The ratio represented in each row is equivalent to the ratio 3 : 4.
12 11 10
The horizontal increase of 3 and vertical increase of 4 between points
+4
9
+3
8 7 6
3 2
+4 +4 +4
The numbers in the right column increase by 4.
If the addition patterns continue, the numbers in the next row of the table represent the ratio 30 : 40. The ratio 30 : 40 is equivalent to the ratio 3 : 4.
+4
1 0
+3
If there are 40 tablespoons of corn starch, then there are 30 tablespoons of dish soap.
ratio relationship.
+3
4
+3
+4
d. If there are 40 tablespoons of corn starch, how many tablespoons of dish soap are there?
show the addition patterns in the
+4
5
more tablespoons
b. If there are 12 tablespoons of dish soap, how many tablespoons of corn starch are there?
In this lesson, we
y
4
+3 1
2
3
4
5
6
7
8
9
10
11
12
13
14
15
16
17
x
Number of Tablespoons of Dish Soap © Great Minds PBC
168
113
114
RECAP
© Great Minds PBC
© Great Minds PBC
EUREKA MATH2 6 ▸ M1 ▸ TB ▸ Lesson 8
Sample Solutions Expect to see varied solution paths. Accept accurate responses, reasonable explanations, and equivalent answers for all student work.
EUREKA MATH2
6 ▸ M1 ▸ TB ▸ Lesson 8
PRACTICE Name
Date
8
EUREKA MATH2
6 ▸ M1 ▸ TB ▸ Lesson 8
2. A school has a fundraiser. Students earn prize points based on the number of items they sell. The graph shows the ratio relationship between the number of items a student sells and the number of prize points the student earns.
1. A bag of frozen pastries includes microwave instructions. There is a ratio relationship between the number of frozen pastries and the number of seconds it takes to microwave them. 20
Number of Frozen Pastries
Number of Seconds
19
6
60
17
9
90
Number of Prize Points a Student Earns
18
a. Fill in the blank to make a true statement. For every 6 frozen pastries, it takes
60
seconds to microwave them.
b. Fill in the blanks to make a true statement. For every
3
more frozen pastries, it takes
30
School Fundraiser
y
more seconds to microwave them.
c. How many seconds does it take to microwave 12 frozen pastries?
16 15 14 13 12 11 10 9 8 7 6 5 4
It takes 120 seconds to microwave 12 frozen pastries.
3 2 1 0
1 2 3 4 5 6 7 8 9 10 11 12 13 14 15 16 17 18 19 20 21 22 23 24 25 26 27 28 29 30
x
Number of Items a Student Sells
a. Fill in the blanks to make a true statement. For every
7
more items a student sells, the student earns
4
more prize points.
b. How many prize points does a student earn if he sells 35 items? If a student sells 35 items, the student earns 20 points. c. The top seller earned 24 prize points. How many items did she sell? The top seller sold 42 items.
© Great Minds PBC
© Great Minds PBC
115
116
P R ACT I C E
© Great Minds PBC
169
EUREKA MATH2
6 ▸ M1 ▸ TB ▸ Lesson 8
EUREKA MATH2
6 ▸ M1 ▸ TB ▸ Lesson 8
3. A homemade modeling clay recipe calls for salt and flour.
EUREKA MATH2
6 ▸ M1 ▸ TB ▸ Lesson 8
4. Consider the graph of the ratio relationship between the amount of money in dollars Tara saves and the amount of money in dollars Tara spends.
a. Use addition patterns to complete the ratio table. Number of Cups of Salt
Number of Cups of Flour
10
6
15
9
20
12
25
15
30
18
Tara’s Money
y 18 17
Amount of Money Tara Spends (dollars)
16
b. What is a ratio of the number of cups of salt to the number of cups of flour?
5:3
15 14 13 12 11 10 9 8 7 6 5 4 3 2 1 0
1
2
3
4
5
6
7
8
9
10
11
12
13
14
15
x
Amount of Money Tara Saves (dollars)
a. Fill in the blank to make a true statement. The point (6,
c. Describe the ratio relationship by using the addition patterns in the ratio table. For every 5 more cups of salt, there are 3 more cups of flour.
9
) lies on a line with the three given points.
b. Write the ordered pairs of two other points that lie on a line with the three given points. Sample:
(8, 12) and (12, 18) c. Describe the ratio relationship by using the addition patterns in the graph. For every $3.00 Tara spends, she saves $2.00.
© Great Minds PBC
170
P R ACT I C E
117
118
P R ACT I C E
© Great Minds PBC
© Great Minds PBC
EUREKA MATH2 6 ▸ M1 ▸ TB ▸ Lesson 8
EUREKA MATH2
6 ▸ M1 ▸ TB ▸ Lesson 8
5. The double number line shows the conversions between the number of cups and the number of quarts. 8
4
0
12
Remember For problems 7 and 8, multiply.
16
Number of Cups
7. 1,536 ´ 42
8. 2,347 ´ 56
64,512
131,432
Number of Quarts 0
2
1
3
4
9. Show that the ratio 2 : 5 is equivalent to the ratio 14 : 35.
a. Fill in the blank to make a true statement. There are
4
Sample:
more cups for every 1 more quart.
b. Fill in the blank to make a true statement. There are 8 more cups for every
2
Number of Cups of Yellow Paint
Number of Cups of Blue Paint
3
2
6
4
9
6
12
8
15
10
© Great Minds PBC
7
7
7
7
more quarts.
6. The table shows the ratio relationship between the number of cups of yellow paint and the number of cups of blue paint needed to make batches of green paint. Complete the ratio table.
© Great Minds PBC
EUREKA MATH2
6 ▸ M1 ▸ TB ▸ Lesson 8
7
7
10. Blake, Kayla, and Lacy form a relay team. They run equal distances in a 13-mile course. What distance in miles does each person run in the course? Choose all that apply. A. B.
3
D. E. F.
119
120
miles
13 13 3
miles
1
C. 4
P R ACT I C E
7
miles
3 41 3 4
13
4
miles miles
1
13
miles
P R ACT I C E
© Great Minds PBC
171
9
LESSON 9
Multiplication Patterns in Ratio Relationships Use graphs and tables to explore multiplication patterns in ratio relationships. Use multiplication to complete ratio tables.
EUREKA MATH2
6 ▸ M1 ▸ TB ▸ Lesson 9
Name
EXIT TICKET
Date
9
A set of children’s books has 5 pages of text for every 2 pages of illustrations. The table shows this ratio relationship. a. Complete the ratio table. Number of Pages of Text
Number of Pages of Illustrations
5
2
10
4
15
6
30
12
55
22
Lesson at a Glance Students begin this lesson by examining addition and multiplication patterns in the graph of a ratio relationship. They work in pairs to solve problems that encourage the use of multiplication patterns. Students make connections between multiplication patterns in ratio tables, graphs, and double number lines. They then use multiplication strategies to solve for unknown quantities in ratio relationships.
Key Question • How can we use multiplication patterns to find unknown quantities?
Achievement Descriptors 6.Mod1.AD3 Solve real-world and mathematical problems by using
ratio reasoning. (6.RP.A.3)
b. When there are 25 pages of text, how many pages of illustrations are there? There are 10 pages of illustrations.
6.Mod1.AD4 Represent ratio relationships by using tables and the
coordinate plane. (6.RP.A.3.a)
c. Explain how you used a multiplication pattern to find the solution to part (b). I multiplied the 5 pages of text and the 2 pages of illustrations each by 5 to determine that there are 25 pages of text for every 10 pages of illustrations.
© Great Minds PBC
125
© Great Minds PBC
EUREKA MATH2 6 ▸ M1 ▸ TB ▸ Lesson 9
Agenda
Materials
Fluency
Teacher
Launch 5 min
• None
Learn 30 min
Students
• Making Concrete
• None
• Making Birdseed
Lesson Preparation
• Making Sculptures
• None
Land 10 min
© Great Minds PBC
173
EUREKA MATH2
6 ▸ M1 ▸ TB ▸ Lesson 9
Fluency Write Equivalent Ratios Students write equivalent ratios to prepare for determining unknown quantities in ratio relationships. Directions: Write three ratios that are equivalent to the given ratio.
174
1.
5:1
Sample: 10 : 2, 15 : 3, 50 : 10
2.
2:7
Sample: 4 : 14, 6 : 21, 8 : 28
3.
12 : 28
Sample: 6 : 14, 3 : 7, 24 : 56
4.
60 : 108
Sample: 30 : 54, 15 : 27, 5 : 9
© Great Minds PBC
EUREKA MATH2 6 ▸ M1 ▸ TB ▸ Lesson 9
Launch
UDL: Representation
5
Students examine patterns in graphs of ratio relationships. Display the three graphs. Consider informally introducing the terms base and height as they refer to the sides of a triangle. These three graphs represent the same ratio relationship. What do you notice about them? What do you wonder? A B C y
y
22 20 18 16 14 12 10 8 6 4 2 0
1
2 3 4
5
6
7
8 9 10 11
x
y
22 20 18 16 14 12 10 8 6 4 2 0
1
2
3 4 5
6
7
8
9 10 11
x
22 20 18 16 14 12 10 8 6 4 2 0
1 2
3 4
5
6
7
8 9 10 11
Consider beginning this lesson by reviewing the addition patterns that students explored in the previous lesson. For example, show a ratio table that represents the ordered pairs from graph A. Demonstrate to students how the addition patterns in the ratio table can be seen in the base and height of each triangle shown in graph A.
x
Ask students to share their thoughts with the class. Consider discussing some or all of the following observations if students do not point them out: • Graph A shows the same kind of addition pattern that was shown in the previous lesson. All the triangles in graph A have the same base and the same height. Each triangle has a base of 1 unit and a height of 2 units. • Graph B shows triangles of three different sizes. The height of the medium triangle is two times the height of the smallest triangle. The height of the largest triangle is three times the height of the smallest triangle. • In graph C, the small triangle is nested inside the large triangle. We could include additional nested triangles. • For all the triangles, the height is always twice the base. After discussing what students notice and wonder, ask them to predict where they could place another triangle on each graph that fits the pattern of the other triangles on that graph. Ask a couple of students to show on the graph where they would place their triangles. © Great Minds PBC
175
EUREKA MATH2
6 ▸ M1 ▸ TB ▸ Lesson 9
In the last lesson, we looked at addition patterns in ratio relationships. Today, we will examine other patterns in ratio relationships.
Language Support Consider supporting the contexts of the problems in this lesson by previewing a context before students read about it. Provide visual support in the form of pictures, realia, or a short video. For example, for problem 1, show a picture of mixed concrete and the three main ingredients next to it.
Learn Making Concrete Students explore multiplication patterns in graphs and tables of ratio relationships. Read problem 1 aloud to students. Allow partners several minutes to complete parts (a)–(c). 1. Concrete is made by mixing sand, cement, and water. The graph shows the ratio relationship between the number of kilograms of sand and the number of kilograms of cement in a concrete recipe. y
Number of Kilograms of Cement
20
15
10
5
0
2
4
6
8
10
12
14
16
18
x
Number of Kilograms of Sand
176
© Great Minds PBC
EUREKA MATH2 6 ▸ M1 ▸ TB ▸ Lesson 9
a. Write an ordered pair that represents one of the points plotted on the graph. Explain the meaning of the ordered pair in this situation. Sample: (3, 4) For every 3 kilograms of sand, there are 4 kilograms of cement. b. Write an ordered pair that belongs to this ratio relationship but does not represent a point plotted on the graph.
Differentiation: Challenge Ask students who quickly finish parts (a)–(c) to determine the coordinates of additional points that represent this ratio relationship but are not plotted on this graph.
Sample: (12, 16) c. Complete the ratio table. Include the numbers from the ordered pair you wrote in part (b) in the blank row. Sample:
© Great Minds PBC
Number of Kilograms of Sand
Number of Kilograms of Cement
3
4
6
8
9
12
12
16
177
EUREKA MATH2
6 ▸ M1 ▸ TB ▸ Lesson 9
Bring the class together to discuss any or all of parts (a)–(c). Does it make sense to draw a line through the points on this graph? Why? Yes. The quantities of sand and cement can be any positive number, including decimal values between the whole numbers. Consider providing a counterexample for students. For example, if a graph shows a ratio relationship between the number of girls and the number of boys, we cannot connect the points with a line because the numbers of girls and boys must be whole numbers. Let students work with a partner on part (d) for a couple of minutes. Move around the room to listen to students’ strategies. Notice which students use addition strategies and which students use multiplication strategies. d. Scott has 60 kilograms of sand to use for making concrete. How many kilograms of cement should he use? Number of Kilograms of Sand
Number of Kilograms of Cement
3
4
6
8
9
12
60
80
Scott should use 80 kilograms of cement.
178
© Great Minds PBC
EUREKA MATH2 6 ▸ M1 ▸ TB ▸ Lesson 9
Ask students to share their answer. Use the following prompts to discuss the multiplicative reasoning in part (d). Display the ratio table with the numbers of kilograms of sand and kilograms of cement showing ´ 20 on both sides of the table.
Number of Kilograms of Sand
Number of Kilograms of Cement
3
4
6
8
9
12
60
80
× 20
× 20
We may have continued to add 3 kilograms of sand and 4 kilograms of cement until we determined the solution. But multiplication is much more efficient than addition. Why is multiplication by 20 shown on both sides of the table?
We know that Scott will use 60 kilograms of sand, and 60 is 20 times as much as 3. If he multiplies 3 by 20, he must also multiply the other number in the ratio, 4, by 20. What is another way that we could have used multiplication to solve part (d) without multiplying by 20? We could have started with the second row of the table and multiplied each number in the ratio by 10. Is the ratio 60 : 80 equivalent to 3 : 4? Explain.
Yes. If I multiply 3 and 4 each by 20, I get 60 and 80, so the ratios 3 : 4 and 60 : 80 are equivalent.
© Great Minds PBC
179
EUREKA MATH2
6 ▸ M1 ▸ TB ▸ Lesson 9
Have students think–pair–share about the following question. Why is multiplication a more efficient strategy than addition in this situation? We can get to the answer faster when we multiply each number in the ratio by 20. If we use addition, we would have to add a lot of rows to the table and that would take longer. Transition students to the following question. Use the same table. How many kilograms of cement does Scott need to make concrete with 12 kilograms of sand?
Scott needs 16 kilograms of cement to make concrete with 12 kilograms of sand. Display the ratio table with the numbers of kilograms of sand and kilograms of cement showing ´ 4 on both sides of the table.
Number of Kilograms of Sand
Number of Kilograms of Cement
3
4
6
8
9
12
12
16
15
20
60
80
×4
×4
Review the multiplication strategy shown in the table, which students can use to determine the number of kilograms of cement that Scott needs to make concrete with 12 kilograms of sand.
180
© Great Minds PBC
EUREKA MATH2 6 ▸ M1 ▸ TB ▸ Lesson 9
Display the ratio table and the graph that shows horizontal and vertical arrows. Number of Kilograms of Sand
Number of Kilograms of Cement
3
4
6
8
9
12
12
16
15
20
60
80
×4
×4
Number of Kilograms of Cement
y 20
15
10
5
0
2
4
6
8
10
12
14
16
18
x
Number of Kilograms of Sand
Use the following questions to help students make connections between the ratio table and the graph. The graph shows two triangles. What are the base and the height of each triangle?
Differentiation: Support To support students with counting the distance between points on the coordinate plane, consider reviewing this skill by using the projected graph.
The small triangle has a base of 3 units and a height of 4 units. The large triangle has a base of 12 units and a height of 16 units. How are the triangle bases and heights related to the pairs of numbers in the ratio table? The ratios of the number of kilograms of sand to the number of kilograms of cement are equivalent to the ratios of the base to the height for each triangle.
© Great Minds PBC
181
EUREKA MATH2
6 ▸ M1 ▸ TB ▸ Lesson 9
Display the table and graph with the arrows indicating the multiplication strategy.
×4
Number of Kilograms of Sand
Number of Kilograms of Cement
3
4
6
8
9
12
12
16
15
20
60
80
×4
Number of Kilograms of Cement
y 20 16 15
×4 10
5
4
×4 3 0
2
4
12 6
8
10
12
14
16
18
x
Number of Kilograms of Sand
How do the base and height of the large triangle compare to the base and height of the small triangle? The base and height of the large triangle are each 4 times as long as the base and height of the small triangle. In both the table and the graph, we see the same multiplication pattern of multiplying each quantity by 4.
Making Birdseed Students determine unknown values in ratio tables and double number lines by using multiplication. Tell students that they are going to use multiplication strategies to solve for unknown quantities in a ratio relationship. Allow partners several minutes to work on problems 2 and 3.
182
© Great Minds PBC
EUREKA MATH2 6 ▸ M1 ▸ TB ▸ Lesson 9
2. Different mixes of birdseed attract different types of birds. Yuna’s birdseed recipe calls for sunflower seeds and pumpkin seeds. a. Complete the table. Number of Cups of Sunflower Seeds
Number of Cups of Pumpkin Seeds
3
2
Promoting the Standards for Mathematical Practice Students look for and make use of structure (MP7) when they use multiplication patterns in ratio relationships to determine unknown quantities. Ask the following questions to promote MP7:
6
4
9
6
18
12
• What is another way you can use multiplication to solve this problem?
54
36
• How can what you know about equivalent ratios help you with determining unknown values in ratio tables?
b. Use ratio language to describe the relationship between the number of cups of sunflower seeds and the number of cups of pumpkin seeds.
• How can using what you know about addition patterns help you use multiplication patterns when working with ratio tables?
Sample: For every 3 cups of sunflower seeds, there are 2 cups of pumpkin seeds.
© Great Minds PBC
183
EUREKA MATH2
6 ▸ M1 ▸ TB ▸ Lesson 9
3. Blake’s birdseed recipe calls for sunflower seeds and cracked corn. The double number line represents the relationship between the number of cups of sunflower seeds and the number of cups of cracked corn in his recipe. Use the double number line to determine the number of cups of cracked corn that Blake should use with 16 cups of sunflower seeds. Number of Cups of Sunflower Seeds Number of Cups of Cracked Corn
0
6
16
0
15
?
Birdseed with 16 cups of sunflower seeds requires 40 cups of cracked corn. When most students are finished, direct their attention to problem 2. How did you determine the number of cups of pumpkin seeds to use with 3 cups of sunflower seeds? Sample: I multiplied 6 by 13 to get 2 because I know that 9 × 13 = 3 . I divided 6 by 3 to get 2 because I know that 9 ¸ 3 = 3.
Differentiation: Challenge If students are ready for a challenge, provide the following problem: Ryan claims that doubling the number of cups of sunflower seeds and the number of cups of pumpkin seeds will double the total number of cups of birdseed. Sana says doing so will quadruple the total number of cups of birdseed. Who is correct? Explain. Ryan is correct. Doubling the number of cups of both ingredients will double the total number of cups of birdseed. For example, one batch of birdseed has 3 cups of sunflower seeds and 2 cups of pumpkin seeds for 5 total cups of seeds. Two batches of birdseed have 6 cups of sunflower seeds and 4 cups of pumpkin seeds for 10 total cups of seeds. The total amount of birdseed doubles from 5 cups to 10 cups.
When given the ratio 9 : 6, we can create an equivalent ratio by multiplying each number in the ratio by 13 to get 3 : 2. We can produce the same result of 3 : 2 by dividing each number in the ratio 9 : 6 by 3.
184
© Great Minds PBC
EUREKA MATH2 6 ▸ M1 ▸ TB ▸ Lesson 9
Display the double number line that shows multiplication by 13 and by 8.
×8
× Number of Cups of Sunflower Seeds Number of Cups of Cracked Corn
0
2
0
5
×
1 3
6
16
15
?
1 3
×8 A double number line is like a ratio table, so we can use the same multiplication strategy that we have been using with ratio tables. Given the ratio 6 : 15, we can multiply each number by 13 to create the equivalent ratio 2 : 5. Then we can multiply each number in the ratio 2 : 5 by 8 to create the equivalent ratio 16 : 40. Note that students may choose to divide 6 and 15 each by 3 rather than multiplying each by 13 . Point out that dividing by 3 produces the same result as multiplying by 13 .
Making Sculptures Students solve ratio problems by using verbal descriptions. Tell students that they will continue to solve ratio problems but without the aid of a ratio table. Have students complete problem 4 and, if time allows, problem 5.
© Great Minds PBC
185
EUREKA MATH2
6 ▸ M1 ▸ TB ▸ Lesson 9
4. Eddie is making a sculpture of a person. He uses pipe cleaners for the arms and legs. The ratio of the sculpture’s leg length in centimeters to its arm length in centimeters is 7 : 5. a. If Eddie’s sculpture has arms that are each 20 centimeters long, what is the length of each leg in centimeters? The length of each leg is 28 centimeters.
Differentiation: Support To support students with the verbal problems, consider providing tables with headings for problems 4 and 5.
b. If Eddie’s sculpture has legs that are each 63 centimeters long, what is the length of each arm in centimeters? The length of each arm is 45 centimeters. 5. Jada is making a sculpture of a person. The ratio of her sculpture’s leg length in inches to its arm length in inches is 8 : 6. If the sculpture’s arms are each 9 inches long, what is the length of each leg in inches? The length of each leg is 12 inches. Invite students to share their solutions for problems 4 and 5.
Land Debrief 5 min Objectives: Use graphs and tables to explore multiplication patterns in ratio relationships. Use multiplication to complete ratio tables. Use the following questions to facilitate a discussion about multiplication patterns in ratio relationships. Consider displaying a ratio table from the lesson during the discussion. Explain how to use multiplication to determine unknown quantities in a ratio relationship. I can multiply each number in any ratio by the same number to determine another ratio in the relationship. 186
© Great Minds PBC
EUREKA MATH2 6 ▸ M1 ▸ TB ▸ Lesson 9
In the previous lesson, we used addition to determine unknown values in a ratio table. How is using multiplication to determine unknown values in a ratio table similar to using addition? How is it different? Using multiplication is similar to using addition because we are looking for number patterns and using those patterns to create equivalent ratios among pairs of numbers in the table. When we add, we might be adding different numbers to each number in the ratio. When we multiply, we multiply each number in the ratio by the same number. Using multiplication is more efficient. Rather than only being able to determine the numbers in the next row in the table, we can determine the numbers in rows much farther down in the table. If time allows, use the following question to prompt students’ thinking about changing ratios in context to prepare for upcoming lessons. What happens to the flavor of punch if the ratio of the number of cups of seltzer water to the number of cups of cranberry juice changes from 3 : 2 to 5 : 2? The flavor of the punch may change to have a weaker cranberry flavor.
Exit Ticket 5 min Provide up to 5 minutes for students to complete the Exit Ticket. It is possible to gather formative data even if some students do not complete every problem.
© Great Minds PBC
Teacher Note Assign the Practice problems for completion outside of class or use them in class if time remains after the lesson. Refer students to the Recap for support.
187
EUREKA MATH2
6 ▸ M1 ▸ TB ▸ Lesson 9
Recap
EUREKA MATH2
6 ▸ M1 ▸ TB ▸ Lesson 9
RECAP Name
Date
9
EUREKA MATH2
6 ▸ M1 ▸ TB ▸ Lesson 9
2. Julie mixes 4 cups of milk with 6 ounces of chopped chocolate to make hot chocolate. How many cups of milk does Julie need if she uses 15 ounces of chopped chocolate? Explain or use a diagram to show your thinking.
Multiplication Patterns in Ratio Relationships First, multiply each number
In this lesson, we
Then multiply each number in the ratio 2 : 3 by 5 to calculate the equivalent ratio 10 : 15.
in the ratio 4 : 6 by 12 to
•
used multiplication patterns to complete ratio tables.
•
used multiplication patterns to solve for unknown quantities in ratio relationships.
calculate the equivalent ratio 2 : 3.
×5
Examples ×
1. The ratio table shows the relationship between the number of weeks that have passed since a bank account was opened and the number of dollars in the account.
Number of Cups of Milk
a. Complete the ratio table. Number of Weeks
Number of Ounces of Chopped Chocolate
Number of Dollars in Account
3
360
4
480 ×6
×6
8
960
18
2,160
0
2
0
3 ×
Because this is a ratio table, the ratios represented in each row are equivalent. If the number of weeks is multiplied by 6, then the number of dollars in the account is also multiplied by 6.
1 2
1 2
4
10
6
15
×5 Julie needs 10 cups of milk if she uses 15 ounces of chopped chocolate.
b. Explain how you determined the number of dollars in the account after 18 weeks. Because 18 weeks is 6 times as many weeks as 3 weeks, I multiplied the number of dollars in the account at 3 weeks by 6 to get $2,160.
© Great Minds PBC
188
127
128
RECAP
© Great Minds PBC
© Great Minds PBC
EUREKA MATH2 6 ▸ M1 ▸ TB ▸ Lesson 9
Sample Solutions Expect to see varied solution paths. Accept accurate responses, reasonable explanations, and equivalent answers for all student work.
EUREKA MATH2
6 ▸ M1 ▸ TB ▸ Lesson 9
PRACTICE Name
Date
9
2. A cook uses a recipe that calls for 10 cups of basil to make 5 jars of pesto. a. Which ratio table correctly shows the relationship between the number of cups of basil and number of jars of pesto?
1. Blake uses red beads and white beads to make key chains. He wants to know how many white beads he needs when he uses 21 red beads. Blake thinks he needs 70 white beads because 3 ´ 7 = 21 and 10 ´ 7 = 70.
×7
Number of Red Beads
Number of White Beads
3
10
6
20
12
40
21
70
39
?
A.
C.
Yes. Blake is correct. Multiplying each value in a ratio by the same number creates an equivalent ratio.
Number of Jars of Pesto
1 5
2
1
2
1
4
2
10
5
10
5
Number of Cups of Basil
Number of Jars of Pesto
Number of Cups of Basil
Number of Jars of Pesto
8
3
1
1 5
9
4
5
1
10
5
10
5
Number of Jars of Pesto
1
b. How many white beads does Blake need if he uses 39 red beads?
130
© Great Minds PBC
B.
Number of Cups of Basil
Number of Cups of Basil
×7
a. Is Blake correct? Explain.
© Great Minds PBC
EUREKA MATH2
6 ▸ M1 ▸ TB ▸ Lesson 9
129
130
P R ACT I C E
D.
© Great Minds PBC
189
EUREKA MATH2
6 ▸ M1 ▸ TB ▸ Lesson 9
EUREKA MATH2
6 ▸ M1 ▸ TB ▸ Lesson 9
3. Riley saves money in a bank account to buy a used car. The ratio table shows the relationship between the number of weeks that have passed since Riley opened a bank account and the number of dollars in the account. Determine the unknown values in the table.
b. In the coordinate plane provided, plot at least three points that each represent a possible ratio in this relationship. y
Number of Jars of Pesto
EUREKA MATH2
6 ▸ M1 ▸ TB ▸ Lesson 9
8
Number of Weeks
Number of Dollars in Account
6
2
350
4
700
10
1,750
30
5,250
4
2
0
2
4
6
8
10
12
14
4. An artist makes a gray wood stain. The stain requires 5 milliliters of black stain for every 3 milliliters of white paint. How many milliliters of black stain should the artist mix with 27 milliliters of white paint to create the same shade of gray wood stain? Use the double number line.
x
Number of Cups of Basil
c. Use the graph to determine the number of cups of basil the cook needs to make 4 jars of pesto. Use your solution to plot another point on the graph.
Number of Milliliters of Black Stain
The cook needs 8 cups of basil to make 4 jars of pesto.
Number of Milliliters of White Paint
0
5
?
0
3
27
45 milliliters of black stain
© Great Minds PBC
190
P R ACT I C E
131
132
P R ACT I C E
© Great Minds PBC
© Great Minds PBC
EUREKA MATH2 6 ▸ M1 ▸ TB ▸ Lesson 9
EUREKA MATH2
6 ▸ M1 ▸ TB ▸ Lesson 9
EUREKA MATH2
6 ▸ M1 ▸ TB ▸ Lesson 9
10. The table shows the ratio relationship between the number of minutes per day that Yuna reads and the number of minutes she spends doing math homework. Complete the ratio table.
5. Scott pays $12 for 8 pounds of apples. What is the greatest number of pounds of apples Scott can buy with $60? Explain. Scott can buy 40 pounds of apples. The ratio of the number of dollars to the number of pounds of apples is 12 : 8. We can multiply each number in the ratio 12 : 8 by 5 to create the equivalent ratio of 60 : 40.
6. Kayla uses 4 pounds of shredded carrots and the juice of 2 lemons for a salad. How many lemons does Kayla need if she uses 6 pounds of carrots? Explain. Kayla needs 3 lemons. The ratio of the number of pounds of shredded carrots to the number of lemons is 4 : 2, or 2 : 1. We can multiply each number in the ratio 2 : 1 by 3 to create the equivalent ratio of 6 : 3.
Number of Minutes Yuna Reads
Number of Minutes Yuna Does Math Homework
18
6
27
9
36
12
45
15
11. A restaurant has 1 gallon of chicken soup and 3 quarts of vegetable soup. What is the total number of one-cup containers that this soup can fill? 7. A taco spice recipe calls for 12 teaspoons of chili powder and 9 teaspoons of garlic salt. How many teaspoons of chili powder are needed to mix with 6 teaspoons of garlic salt? Explain.
The restaurant can serve a total of 28 cups of soup.
Eight teaspoons of chili powder are needed to mix with 6 teaspoons of garlic salt. The ratio of the number of teaspoons of chili powder to the number of teaspoons of garlic salt is 12 : 9. The ratio 12 : 9 is equivalent to the ratio 4 : 3. We can multiply each number in the ratio 4 : 3 by 2 to create the equivalent ratio of 8 : 6.
Remember For problems 8 and 9, multiply. 8. 1,773 ´ 54
9. 3,519 ´ 26
95,742
91,494
© Great Minds PBC
© Great Minds PBC
P R ACT I C E
133
134
P R ACT I C E
© Great Minds PBC
191
10
LESSON 10
Multiplicative Reasoning in Ratio Relationships Write and use equivalent ratios when one of the numbers in the ratio is 1.
EUREKA MATH2
6 ▸ M1 ▸ TB ▸ Lesson 10
Name
EXIT TICKET
Date
10
Mr. Evans uses a ratio table to keep track of the numbers of cups of water and juice he drinks. He drinks 5 cups of water for every 2 cups of juice. Complete the ratio table. Number of Cups of Water
5
10
15
1
5 2
Number of Cups of Juice
2
4
6
2 5
1
• How can we write an equivalent ratio so that one number in the ratio is 1?
For every 1 cup of water that Mr. Evans drinks, he drinks 2 cups of juice.
• Why would we write an equivalent ratio so that one number in the ratio is 1?
5
b. How many cups of water does Mr. Evans drink for every 1 cup of juice he drinks? 5 2
In this lesson, students use ratio tables to write a ratio A : B in the form A :1 and 1 : BA . Students explain the meaning of BA and BA in context. B Through teacher-led discussion, students explore multiplication patterns between the two numbers in a ratio. In a problem-solving stations activity, students apply the multiplication strategies they learn in the lesson.
Key Questions
a. How many cups of juice does Mr. Evans drink for every 1 cup of water he drinks?
For every 1 cup of juice that Mr. Evans drinks, he drinks
Lesson at a Glance
cups of water.
Achievement Descriptors 6.Mod1.AD1 Write and explain ratios that describe relationships
between two quantities. (6.RP.A.1) 6.Mod1.AD3 Solve real-world and mathematical problems by using
ratio reasoning. (6.RP.A.3) 6.Mod1.AD4 Represent ratio relationships by using tables and the
coordinate plane. (6.RP.A.3.a)
© Great Minds PBC
139
© Great Minds PBC
EUREKA MATH2 6 ▸ M1 ▸ TB ▸ Lesson 10
Agenda
Materials
Fluency
Teacher
Launch 5 min
• None
Learn 30 min
Students
• Following Recipes
• Ratio Stations cards
• Ratio Stations
Lesson Preparation
Land 10 min
• Copy and cut four of each Ratio Stations card. Set up four stations. Place one group of cards at each station.
© Great Minds PBC
193
EUREKA MATH2
6 ▸ M1 ▸ TB ▸ Lesson 10
Fluency Multiply by a Fraction Students multiply a whole number by a fraction to prepare for using multiplication to create equivalent ratios. Directions: Evaluate.
194
1.
2× 2
3
4 3
5.
2× 3
3
2.
3× 2
2
6.
3× 3 2
9 2
3.
6× 2
4
7.
6× 3
9
4.
21 × 2
14
8.
21 × 3
3
3
3
2
2
2
63 2
© Great Minds PBC
EUREKA MATH2 6 ▸ M1 ▸ TB ▸ Lesson 10
Launch
Teacher Note
5
Students use a ratio in which the second number is 1 to solve a problem. Display the white and blue containers. Allow students 1–2 minutes to work with a partner to solve the problem.
The ratio of the number of parts sugar to the number of parts water in hummingbird food is 2 : 1. 5
This lesson introduces the language of parts to describe quantities without specific units that are combined in a ratio, such as “the number of parts sugar to the number of parts water” in Launch. As needed, explain this language to students and provide examples of how it is seen in the real world, such as in recipes and directions for crafts and hobbies. Support students’ understanding by reminding them of the previous learning that ratios are pairs of numbers and do not have units. For example, a mixture of 5 cups of red paint and 3 cups of white paint and a mixture of 5 gallons of red paint and 3 gallons of white paint are both in a ratio of 5 : 3. Another way to communicate this is “5 parts red paint and 3 parts white paint.”
2 parts sugar 5
1 part water
How many cups of sugar should be mixed with 4 cups of water? What does a ratio of 25 : 1 mean in this situation? There are 2 parts sugar for every 1 part water. 5
What other ratios can you identify that are equivalent to 25 : 1? Sample: 2 : 5, 1 : 25 , 4 : 10, 85 : 4
© Great Minds PBC
195
EUREKA MATH2
6 ▸ M1 ▸ TB ▸ Lesson 10
Ask a couple of students to share their solutions to the hummingbird food question and their methods for solving. In particular, draw attention to a solution that shows multiplying each number in the ratio by 4. Why can we multiply each number in the ratio by 4?
Multiplying each number in the ratio by 4 creates the equivalent ratio 85 : 4. 2
The ratio 2 : 5 is equivalent to the ratio 5 : 1 . Would it have been easier to solve this 2 problem if you had been given the ratio 2 : 5 rather than 5 : 1 ? Why?
It would not have been easier to solve this problem by using the ratio 2 : 5. For the ratio 2 :1 5 , I can multiply each number by 4 to determine the number of cups of sugar that are needed for 4 cups of water. It is not as easy to multiply 5 by a number to get 4 as it is to multiply 1 by a number to get 4. Today, we will explore situations in which one of the numbers in our ratio is 1.
Learn Following Recipes Students write equivalent ratios in which one number is 1 and interpret the meaning of the equivalent ratios. Direct students to problem 1. Allow them several minutes to complete problem 1 with a partner. Circulate as students work and look for students who apply the addition patterns or multiplication patterns from previous lessons to complete the ratio table. Note that students will likely need to use multiplication rather than addition to complete the second row of the table. Make sure that students correctly complete the table before they move to parts (b)–(e).
196
Differentiation: Support To support students completing the first two rows of the ratio table, consider discussing any patterns they see in the last two rows of the ratio table before they begin. Possible examples include the following: • The number of cups of white flour is 3 times the number of cups of whole wheat flour. • I can multiply the number of cups of whole wheat flour by 3 to determine the number of cups of white flour. • I can divide the number of cups of white flour by 3 to determine the number of cups of whole wheat flour.
© Great Minds PBC
EUREKA MATH2 6 ▸ M1 ▸ TB ▸ Lesson 10
1. A bread recipe calls for 2 cups of whole wheat flour for every 6 cups of white flour. a. Complete the ratio table. Number of Cups of Whole Wheat Flour
Number of Cups of White Flour
1
3
1 3
1
2
6
4
12
b. Complete the following statements. For every 1 cup of white flour, the recipe calls for
1 3
For every 1 cup of whole wheat flour, the recipe calls for
Language Support Consider explaining to students the difference between white flour and whole wheat flour or consider showing them photos of white bread and whole wheat bread to illustrate the difference.
cup of whole wheat flour.
3
cups of white flour.
c. How are the first two rows of the table similar? One of the numbers in each row is 1. d. How are the first two rows of the table different? In the first row, the number of cups of whole wheat flour is 1. In the second row, 1 the number of cups of white flour is 1. In the numbers 3 and , the numerators and 3 denominators are reversed.
© Great Minds PBC
197
EUREKA MATH2
6 ▸ M1 ▸ TB ▸ Lesson 10
e. The number of cups of white flour is always whole wheat flour.
3
f. The number of cups of whole wheat flour is always of white flour.
times the number of cups of 1 3
times the number of cups
After about 5 minutes, or when most students have finished, bring the class together. Choose two or three students who used different methods to share how they completed the table. Clarify any student explanations as needed and answer any questions. Suppose we follow this recipe to make bread. For every 1 cup of whole wheat flour, we use 3 cups of white flour. Explain how we use this times 3 pattern. We multiply each number in the left column by 3 to get the corresponding numbers in the right column.
For this recipe, we know that the number of cups of white flour is always 3 times the number of cups of whole wheat flour. Display the table showing the number of cups of whole wheat flour and the number of cups of white flour with arrows pointing from the left to the right to show the multiplication by 3.
Number of Cups of Whole Wheat Flour
Number of Cups of White Flour
1 1 3
×3
2
×3
4
198
3
UDL: Representation Consider presenting a nonexample of a ratio table to emphasize that this multiplicative relationship is a unique characteristic of ratio relationships.
1 6 12
© Great Minds PBC
EUREKA MATH2 6 ▸ M1 ▸ TB ▸ Lesson 10
Ask the following questions to check for students’ understanding. Following this recipe, we use 10 cups of whole wheat flour. How many cups of white flour do we use? We use 30 cups of white flour. Following this recipe, we use 22 cups of whole wheat flour. How many cups of white flour do we use? We use 66 cups of white flour. Can we multiply each number in the left column by 3 to get the corresponding numbers in the right column? Does this strategy work in every row? Explain. Yes. This strategy works in every row because 1 ´ 3 = 3, 1 × 3 = 1, 2 ´ 3 = 6, and 4 ´ 3 = 12. 3
Following this recipe, for every 1 cup of white flour, we use 1 cup of whole wheat flour. 3 Explain how we use this times 1 pattern. 3
1
We multiply each number in the right column by 3 to get the corresponding numbers in the left column. 1
For this recipe, we know that the number of cups of whole wheat flour is always 3 the number of cups of white flour. Display the table showing the number of cups of whole wheat flour and the number of cups of white flour with arrows pointing from the right to the left to show the multiplication by 1 . 3
Number of Cups of Whole Wheat Flour
Number of Cups of White Flour
1
3 1
1
6
×
2
× 3
4 © Great Minds PBC
1 3
1 3
12 199
6 ▸ M1 ▸ TB ▸ Lesson 10
EUREKA MATH2
Ask the following questions to check for students’ understanding. Following this recipe, we use 9 cups of white flour. How many cups of whole wheat flour do we use? We use 3 cups of whole wheat flour. Can we multiply each number in the right column by 1 to get the corresponding 3 numbers in the left column? Does this strategy work in every row? Yes. Given the ratio 1 : 3, how do we write an equivalent ratio so that the second number in the ratio is 1? Sample: We multiply each number in the ratio by 1 or divide each number by 3 to get 3 1 the equivalent ratio 3 : 1 . Multiplying by 1 produces the same result as dividing by 3, so we can use 3 either strategy.
Given the ratio 4 : 5, how do we write an equivalent ratio so that the first number in the ratio is 1?
Sample: We multiply each number in the ratio by 1 or divide each number by 4 to get 4 the equivalent ratio 1 : 45 .
200
© Great Minds PBC
EUREKA MATH2 6 ▸ M1 ▸ TB ▸ Lesson 10
Allow students about 10 minutes to complete problems 2–5 with a partner. 2. The ratio table shows the number of cups of brown sugar and the number of cups of ketchup in a recipe for a homemade sauce. Number of Cups of Brown Sugar
Number of Cups of Ketchup
2 3
1
1
3 2
2
3
4
6
6
9
Promoting the Standards for Mathematical Practice When students repeatedly complete ratio tables that have a 1 in each column to recognize multiplication patterns in ratio tables, they are looking for and expressing regularity in repeated reasoning (MP8). Ask the following questions to promote MP8: • What patterns do you notice when you complete the ratio tables that have a 1 in each column? • What is the same about each row in a ratio table?
a. Complete the ratio table. b. Describe the relationship between the number of cups of brown sugar and the number of cups of ketchup. There are 2 cups of brown sugar for every 1 cup of ketchup. 3
c. The number of cups of ketchup is always brown sugar.
3 2
times the number of cups of
d. How many cups of ketchup need to be mixed with 10 cups of brown sugar to make the homemade sauce? Fifteen cups of ketchup need to be mixed with 10 cups of brown sugar.
© Great Minds PBC
201
EUREKA MATH2
6 ▸ M1 ▸ TB ▸ Lesson 10
For problems 3–5, use the given ratio to complete the sentences. 3. Sana uses shaving cream and glue to make slime. The ratio of the number of tablespoons of shaving cream to the number of tablespoons of glue is 2 to 1. For every 1 tablespoon of 2 glue Sana uses, she uses tablespoon(s) of shaving cream. For every 1 tablespoon 1 2
of shaving cream Sana uses, she uses
tablespoon(s) of glue.
4. Tyler fills fruit baskets with apples and bananas. The ratio of the number of apples to the number of bananas in each basket is 12 to 3. For every 1 apple in the basket, the basket has
1 4
banana(s). For every 1 banana in the basket, the basket has
4
apple(s).
5. In a recipe for trail mix, the ratio of the number of cups of cashews to the number of cups of almonds is 2 to 3. There are cashews. There are
2 3
3 2
times as many cups of almonds as cups of
times as many cups of cashews as cups of almonds.
Discuss problem 5 with students. Why is it useful to know that there are 3 times as many cups of almonds as cups 2 of cashews? Why is it useful to know that there are 2 as many cups of cashews as cups 3 of almonds? If we know that there are 3 times as many cups of almonds as cups of cashews, then 2 we know that we can always find the number of cups of almonds by multiplying the number of cups of cashews by 3 . 2
If we know that there are 23 as many cups of cashews as cups of almonds, then we know that we can always find the number of cups of cashews by multiplying the number of cups of almonds by 23 .
202
© Great Minds PBC
EUREKA MATH2 6 ▸ M1 ▸ TB ▸ Lesson 10
Ratio Stations Students write equivalent ratios in which one number is 1 and use the equivalent ratios to solve problems. Read aloud the Ratio Stations directions with students. Have students stay in pairs to complete the Ratio Stations. Partners may complete the stations in any order. Every pair should finish at least two of the four problems in the remaining class time. Directions: Complete as many stations as you can in the time allotted. Create a ratio table or other diagram to explain your solution to the problem at each station. Station 1
Teacher Note Students may use any method to solve the Ratio Stations problems. If you prefer that students do not get up and move around the room to stations, revise the activity by directing pairs of students to pass the Ratio Stations cards from one pair to another.
Station 2 Differentiation: Support To support students’ understanding of the contexts in this activity, consider explaining what proteins and carbohydrates are, or show students pictures of carbohydrateand protein-rich foods before they start this activity.
Station 3
Station 4
To implement differentiation, consider telling students which stations to visit. Problem 3 is challenging because it involves a currency conversion between American dollars and Brazilian reais. The Brazilian real is the currency of Brazil. Reais is the plural form of real. Problem 4 is the most challenging due to the complexity of the scenario. Consider providing calculators at station 4.
Call the class back together to debrief the Ratio Stations activity. © Great Minds PBC
203
EUREKA MATH2
6 ▸ M1 ▸ TB ▸ Lesson 10
Land Debrief 5 min Objective: Write and use equivalent ratios when one of the numbers in the ratio is 1. Use the following questions to lead a class discussion about problem solving when one number in the ratio is 1. Given the ratio 5 : 2, how can we write an equivalent ratio so that the first number in the ratio is 1?
We can multiply each number in the ratio by 1 or divide each number by 5 to get the 5 equivalent ratio 1 : 2 . 5
Why would we write an equivalent ratio so that one number in the ratio is 1?
Writing a ratio whose first or second number is 1 can make it easier to solve problems. In an animal shelter, the ratio of the number of cats to the number of dogs is 7 : 4. Would it make sense to say that for every cat, there are 74 dogs? Why?
No. It would not make sense to say that for every cat there are 4 dogs because there 7 cannot be a fraction of a dog.
Exit Ticket 5 min Provide up to 5 minutes for students to complete the Exit Ticket. It is possible to gather formative data even if some students do not complete every problem.
204
Teacher Note Assign the Practice problems for completion outside of class or use them in class if time remains after the lesson. Refer students to the Recap for support.
© Great Minds PBC
EUREKA MATH2 6 ▸ M1 ▸ TB ▸ Lesson 10
Recap
EUREKA MATH2
6 ▸ M1 ▸ TB ▸ Lesson 10
10
RECAP Name
Date
EUREKA MATH2
6 ▸ M1 ▸ TB ▸ Lesson 10
3. To make homemade clay, Yuna uses 3 cups of salt for every 8 cups of flour. a. How many cups of flour does Yuna use for every 1 cup of salt she uses? Yuna uses 83 cups of flour for every 1 cup of salt she uses.
Multiplicative Reasoning in Ratio Relationships
b. How many cups of salt does Yuna use for every 1 cup of flour she uses? The number of cups of salt is 83 the number of cups of flour. The number Yuna uses 3 cups of salt for every 1 cup of flour 8 of cups of flour is 83 times the number she uses.
In this lesson, we •
wrote equivalent ratios in which one value was 1.
•
used ratios in which one value was 1 to solve problems.
c. If Yuna uses 9 cups of flour, how many cups of salt should she use?
Examples
If Yuna uses 9 cups of flour, she should use 27 , or 3 83 , cups of salt. 8
1. The ratio table shows the number of parts yellow paint and the number of parts red paint in a mixture. Complete the ratio table. Number of Parts Yellow Paint
By multiplying each number in the ratio 3 : 5 by 1 , we create the equivalent 5 ratio 3 : 1. The number of parts 5 yellow paint is 3 the number 5 of parts red paint.
Number of Parts Red Paint
3 5
1
1
5 3
3
5
12
20
Because Yuna uses 3 cups of salt for every 1 cup 8 of flour she uses, she needs 83 × 9, or 3 83 , cups of salt.
of cups of salt.
Number of Cups Number of Cups of Salt of Flour 3 8
1
1
×3 8
8 3
3
×8
8
27 8
3
9
There are 5 times as many 3 parts red paint as parts yellow paint.
2. Toby’s granola bar recipe calls for 4 ounces of peanut butter for every 3 ounces of honey. Fill in the blank to make the statement true. a. Toby uses 1 ounce of peanut butter for every ounces of honey.
3 4 4 3
times The number of ounces of peanut butter is the number of ounces of honey in Toby’s granola bar recipe.
Multiplying each number in the ratio 4 : 3 by 1 produces 4 the same result as dividing each number in the ratio by 4. In either case, the result is the equivalent ratio 1 : 3 . 4
© Great Minds PBC
© Great Minds PBC
141
142
RECAP
© Great Minds PBC
205
EUREKA MATH2
6 ▸ M1 ▸ TB ▸ Lesson 10
Sample Solutions Expect to see varied solution paths. Accept accurate responses, reasonable explanations, and equivalent answers for all student work.
Tara eats 3 grams of protein for every 4 grams of carbohydrates that she eats.
a. Write a ratio to show the relationship between the number of cups of flour and the number of pancakes.
The number of cups of flour is times the number of pancakes.
she eats
4 3
grams of
carbohydrates.
2 : 10 b. Complete the two statements. 5 The number of pancakes is times the number of cups of flour.
a. Complete the two statements. For every 1 gram of protein Tara eats,
For every 1 gram of carbohydrates
1 5
c. If Toby makes 70 pancakes, how many cups of flour will he use?
14 cups
Tara eats, she eats of protein.
3 4
grams
b. Calculate the number of grams of protein Tara eats if she eats 64 grams of carbohydrates.
Station 3
Station 4
Lisa is visiting family in Brazil and needs to convert her American dollars to Brazilian reais. For every 1 dollar that Lisa converts, she receives 4 reais.
Assume 1 liter of helium can lift 1 gram. One standard 15-inch party balloon holds 25 liters of helium.
a. Complete the statement. The ratio of dollars to reais is
1 4
: 1.
b. Calculate the number of reais she should receive for 20 dollars.
80 reais
a. A 100-pound doghouse weighs about 45,000 grams. How many liters of helium are needed to lift 45,000 grams?
45,000 liters of helium b. How many standard 15-inch party balloons filled with helium would be required to lift a 100-pound doghouse?
6 ▸ M1 ▸ TB ▸ Lesson 10 ▸ Ratio Stations Answer Key
Toby uses a pancake recipe to make pancakes for his family reunion. The pancake recipe requires 2 cups of flour for every 10 pancakes.
This page may be reproduced for classroom use only.
Station 2
2
Station 1
EUREKA MATH2
© Great Minds PBC
Ratio Stations Answer Key
1,800 balloons
48 grams
d. If Toby uses 5 cups of flour, how many pancakes will he make?
25 pancakes
EUREKA MATH2
© Great Minds PBC
1
6 ▸ M1 ▸ TB ▸ Lesson 10 ▸ Ratio Stations Answer Key
This page may be reproduced for classroom use only.
206
© Great Minds PBC
EUREKA MATH2 6 ▸ M1 ▸ TB ▸ Lesson 10
EUREKA MATH2
6 ▸ M1 ▸ TB ▸ Lesson 10
PRACTICE Name
Date
10
For problems 3–6, complete the ratio table. 3.
1. Yuna pays $64 for 4 bracelets. She creates the ratio table shown to determine the total cost she would pay for 7 bracelets. Number of Bracelets
Total Cost (dollars)
4
64
1
16
7
112
×1 4
EUREKA MATH2
6 ▸ M1 ▸ TB ▸ Lesson 10
×1
Number of Parts Blue Paint
Number of Parts White Paint
1 2
4.
Number of Parts Red Paint
Number of Parts White Paint
1
1 3
1
1
2
1
3
2
4
3
9
Number of Parts Blue Paint
Number of Parts Yellow Paint
Number of Parts Orange Paint
Number of Parts Yellow Paint
4
1
4 3
1
1
1 4
1
3 4
8
2
4
3
4
× 16
a. Why does Yuna multiply each number in the first row of the table by 14 ? She multiplies by 14 to determine the cost of 1 bracelet.
5.
b. Why does Yuna multiply 7 by 16 in the bottom row? Each bracelet costs $16. She multiplies the number of bracelets by the cost of 1 bracelet to determine the total cost. c. What would be the total cost of 12 bracelets?
$192 2. Lacy makes lemonade with 5 scoops of lemonade powder for every 2 quarts of water. Complete the following sentences. The number of scoops of lemonade powder is
5 2
For every 4 scoops of lemonade powder, Lacy uses
© Great Minds PBC
© Great Minds PBC
6.
times the number of quarts of water. 8 5
quarts of water.
143
144
P R ACT I C E
© Great Minds PBC
207
EUREKA MATH2
6 ▸ M1 ▸ TB ▸ Lesson 10
EUREKA MATH2
6 ▸ M1 ▸ TB ▸ Lesson 10
7. Leo needs plaster to create masks for a costume party. To make the plaster, he mixes 2 cups of flour with 7 cups of water.
EUREKA MATH2
6 ▸ M1 ▸ TB ▸ Lesson 10
8. Sasha makes coffee using 3 parts water with 2 parts espresso. Which table correctly shows the ratio relationship between the number of parts water and the number of parts espresso that Sasha uses?
a. How many cups of water does Leo use for every 1 cup of flour that he uses?
A.
7 2
Number of Parts Water
Number of Parts Espresso
1
B.
Number of Parts Water
Number of Parts Espresso
3 2
1
2 3
2 3
1
3 2
1
2
3
3
2
Number of Parts Water
Number of Parts Espresso
Number of Parts Water
Number of Parts Espresso
1
2 3
1
3 2
3 2
1
2 3
1
2
3
3
2
b. How many cups of flour does Leo use for every 1 cup of water that he uses? 2 7
c. If Leo uses 9 cups of flour, how many cups of water should he use?
31 1
2
© Great Minds PBC
208
C.
P R ACT I C E
145
146
P R ACT I C E
D.
© Great Minds PBC
© Great Minds PBC
EUREKA MATH2 6 ▸ M1 ▸ TB ▸ Lesson 10
EUREKA MATH2
6 ▸ M1 ▸ TB ▸ Lesson 10
EUREKA MATH2
6 ▸ M1 ▸ TB ▸ Lesson 10
9. Noah is making a shade of orange paint. He mixes 1 gallon of red paint with every 3 gallons of yellow paint. Based on this ratio, which statements are true? Choose all that apply.
b. Label the axes on the coordinate grid. Then use the ordered pairs from the table to graph the ratio relationship.
A. Noah mixes 1 gallon of yellow paint with every 13 gallon of red paint.
y
B. Noah mixes 2 gallons of red paint with every 6 gallons of yellow paint.
9
C. There is 1 gallon of red paint in a 4-gallon mix of orange paint.
8
E. F.
Number of Minutes Ryan Walks
D. There are 2 gallons of yellow paint in an 8-gallon mix of orange paint. A 4-gallon mix of orange paint would be 43 red paint. A 4-gallon mix of orange paint would be 43 yellow paint.
Remember 10. Multiply.
14,925 ´ 36
5 4 3
1
11. Ryan runs and walks every day. For every 4 minutes that he runs, he walks for 1 minute.
0
a. Complete the ratio table.
2
4
6
8
10
12
14
16
x
Number of Minutes Ryan Runs
Number of Minutes Ryan Runs
Number of Minutes Ryan Walks
Ratio
Ordered Pair
4
1
4:1
(4, 1)
8
2
8:2
(8, 2)
12
3
12 : 3
(12, 3)
16
4
16 : 4
(16, 4)
© Great Minds PBC
6
2
537,300
© Great Minds PBC
7
P R ACT I C E
12. Lisa wants to outline her rectangular poster with duct tape. She needs two pieces of duct tape that each measure 54 centimeters and two pieces that each measure 72 centimeters. Lisa has 2.5 meters of duct tape. Does she have enough duct tape to outline the poster? No. Lisa does not have enough duct tape to outline the poster. She needs 2.52 meters, and she only has 2.5 meters of duct tape.
147
148
P R ACT I C E
© Great Minds PBC
209
210 This page may be reproduced for classroom use only.
b. Calculate the number of reais she should receive for 20 dollars.
a. Complete the statement. The ratio of dollars to reais is : 1.
Lisa is visiting family in Brazil and needs to convert her American dollars to Brazilian reais. For every 1 dollar that Lisa converts, she receives 4 reais.
Station 3
d. If Toby uses 5 cups of flour, how many pancakes will he make?
c. If Toby makes 70 pancakes, how many cups of flour will he use?
The number of cups of flour is times the number of pancakes.
The number of pancakes is times the number of cups of flour.
b. Complete the two statements.
a. Write a ratio to show the relationship between the number of cups of flour and the number of pancakes.
Toby uses a pancake recipe to make pancakes for his family reunion. The pancake recipe requires 2 cups of flour for every 10 pancakes.
Station 1
Ratio Stations Cards
b. How many standard 15-inch party balloons filled with helium would be required to lift a 100-pound doghouse?
a. A 100-pound doghouse weighs about 45,000 grams. How many liters of helium are needed to lift 45,000 grams?
Assume 1 liter of helium can lift 1 gram. One standard 15-inch party balloon holds 25 liters of helium.
Station 4
b. Calculate the number of grams of protein Tara eats if she eats 64 grams of carbohydrates.
For every 1 gram of carbohydrates Tara eats, she eats grams of protein.
For every 1 gram of protein Tara eats, she eats grams of carbohydrates.
a. Complete the two statements.
Tara eats 3 grams of protein for every 4 grams of carbohydrates that she eats.
Station 2
6 ▸ M1 ▸ TB ▸ Lesson 10 ▸ Ratio Stations Cards EUREKA MATH2
© Great Minds PBC
11
LESSON 11
Applications of Ratio Reasoning Solve multi-step ratio problems by reasoning about equivalent ratios.
EUREKA MATH2
Name
6 ▸ M1 ▸ TB ▸ Lesson 11
EXIT TICKET
Date
11
Adesh mixes 5 parts red paint with 4 parts blue paint to make purple paint. He then adds 6 cups of blue paint. His purple mixture is now 5 parts red paint and 7 parts blue paint. a. Draw a tape diagram to represent this situation. Number of Parts Red Paint Number of Parts Blue Paint
Lesson at a Glance This lesson introduces the concept of a changing ratio through a pictorial scenario. Students begin the lesson by solving problems involving multiple ratios. Through a teacher-led example, students explore how to use tape diagrams to model changing ratios. A stations activity allows students to work through problems with changing ratios at varied difficulty levels.
Key Question 6 cups
• What strategies can we use to solve multi-step ratio problems?
Achievement Descriptors b. How many cups of red paint did Adesh use before adding more blue paint?
6.Mod1.AD1 Write and explain ratios that describe relationships
He used 10 cups of red paint before adding more blue paint.
between two quantities. (6.RP.A.1) 6.Mod1.AD3 Solve real-world and mathematical problems by using
ratio reasoning. (6.RP.A.3) c. How many cups of blue paint did Adesh use before adding more blue paint?
6.Mod1.AD4 Represent ratio relationships by using tables and the
He used 8 cups of blue paint before adding more blue paint.
© Great Minds PBC
coordinate plane. (6.RP.A.3.a)
153
© Great Minds PBC
EUREKA MATH2 6 ▸ M1 ▸ TB ▸ Lesson 11
Agenda
Materials
Fluency
Teacher
Launch 5 min
• None
Learn 30 min
Students
• Multiple Ratios and Changing Ratios
• Changing Ratios Stations cards
• Changing Ratios Stations Activity
Lesson Preparation
Land 10 min
• Copy and cut four of each Changing Ratios Stations card. Set up six stations. Place one group of four cards at each station.
© Great Minds PBC
213
EUREKA MATH2
6 ▸ M1 ▸ TB ▸ Lesson 11
Fluency Complete a Ratio Table Students complete a ratio table to prepare for solving multi-step ratio problems. Directions: The tape diagram represents the same relationship shown in the ratio table. Complete the ratio table. Quantity A Quantity B
214
Quantity A
Quantity B
1
5
1 5
1
4
20
6
30
11
55
© Great Minds PBC
EUREKA MATH2 6 ▸ M1 ▸ TB ▸ Lesson 11
Launch
5
UDL: Representation
Students consider a problem with a changing ratio. Display the Before and After tape diagrams of Julie’s and Yuna’s gold coins. Read the problem aloud to students. Give students 1 minute to work on the problem with a partner or a group. As students work, keep the text of the problem displayed for them to reference. Yuna and Julie are playing a game that uses toy gold coins. During the game, Yuna gives some of her gold coins to Julie. The Before tape diagram shows the ratio of the number of Julie’s gold coins to the number of Yuna’s gold coins before Yuna gives the coins. The After tape diagram shows the ratio of the number of Julie’s gold coins to the number of Yuna’s gold coins after Yuna gives the coins. How many gold coins does Yuna give to Julie? Before
Consider providing a handout of the tape diagrams and questions in Launch if students will benefit from being able to draw on the diagrams to solve the problem.
After
Number of Julie’s Gold Coins
Number of Julie’s Gold Coins
Number of Yuna’s Gold Coins
Number of Yuna’s Gold Coins
Ask a couple of students to share their responses. Students may say that Yuna gives Julie two gold coins, or that they do not know how many gold coins Yuna gives Julie because they do not know the total number of gold coins the two girls have. Encourage students to debate the correct answer to the question by using their understanding of ratios and tape diagrams. Leave the question temporarily unanswered.
Language Support To support students in the class discussion, direct them to use the Agree or Disagree section of the Talking Tool during the discussion.
Then display the Before and After tape diagrams of gold coins with the number 90 on each diagram.
© Great Minds PBC
215
EUREKA MATH2
6 ▸ M1 ▸ TB ▸ Lesson 11
Now that we have more information, take 1 minute to work with your partner to answer the question. After
Before Number of Julie’s Gold Coins Number of Yuna’s Gold Coins
90
Number of Julie’s Gold Coins Number of Yuna’s Gold Coins
90
After 1 minute of student work time, facilitate a class discussion by using the following prompts. How many gold coins does Yuna give to Julie? Yuna gives Julie 18 gold coins. What new information is shown in these tape diagrams? We know that the total number of gold coins is 90. How did you use these tape diagrams to determine exactly how many gold coins Yuna gives to Julie? We determined that each unit of the tape diagram represents 9 gold coins. Because two units were added to the tape diagram for Julie’s gold coins, that means Yuna gives Julie 18 gold coins. In this example, the ratio of the number of Yuna’s gold coins to the number of Julie’s gold coins changes. Today, we will work with multiple ratios at once and explore situations where ratios change.
216
© Great Minds PBC
EUREKA MATH2 6 ▸ M1 ▸ TB ▸ Lesson 11
Learn Multiple Ratios and Changing Ratios Students use tape diagrams to model and solve problems with multiple ratios. Let students know that in problems 1–3 they will solve problems involving more than one ratio. Encourage them to work with only one ratio at a time and to draw pictures and diagrams. Give students several minutes to work on problems 1–3 independently or with a partner. Check answers to problems 1 and 2 as you circulate. Only problem 3 will be discussed with the entire class. 1. Kelly has two gardens that each have an area of 40 square feet. He plants tomato seeds in one garden and green bean seeds in the other. He plants 1 tomato seed for every 8 square feet of garden area. He plants 1 green bean seed for every 2 square feet of garden area. Kelly plants the greatest number of seeds he can in each garden.
Differentiation: Support Provide additional tools to support students as they solve problems involving multiple ratios. For problem 1, provide an 8 by 5 rectangular grid. For problems 1 and 2, provide partially completed ratio tables.
a. What is the total number of tomato seeds Kelly plants? Kelly plants 5 tomato seeds.
Differentiation: Challenge
b. What is the total number of green bean seeds Kelly plants? Kelly plants 20 green bean seeds. c. What is the ratio of the total number of tomato seeds to the total number of green bean seeds Kelly plants? The ratio of the total number of tomato seeds to the total number of green bean seeds Kelly plants is 5 : 20. 2. The art teacher’s favorite paint color is a mixture of yellow, blue, and white paints. The mixture has 2 parts yellow paint for every 3 parts blue paint. It has 3 parts blue paint for every 5 parts white paint. If the teacher uses 8 jars of yellow paint, how many jars of white paint does he use? The teacher uses 20 jars of white paint.
© Great Minds PBC
Consider providing the following problem to students who finish problems 1 and 2 quickly. Leo puts markers, glow sticks, and stickers into party favor bags. The ratio of the number of markers to the number of glow sticks is 1 : 2. The ratio of the number of glow sticks to the number of stickers is 3 : 4. What is the ratio of the number of markers to the number of stickers? The ratio of the number of markers to the number of stickers is 3 : 8.
217
EUREKA MATH2
6 ▸ M1 ▸ TB ▸ Lesson 11
3. The ratio of the number of stickers in bag A to the number of stickers in bag B is 4 : 3. Half of the stickers in bag A are moved to bag B. What is the new ratio of the number of stickers in bag A to the number of stickers in bag B?
2:5 Call the class back together to discuss problem 3. Display the solution to problem 3 to demonstrate to students how to use two tape diagrams to show a changing ratio.
Before
After
Bag A
Bag A
Bag B
Bag B
Give students 1 minute to discuss the following question with a partner. Circulate as students talk. Choose one or two groups to share their thinking with the class. Does the answer to problem 3 depend on how many stickers were originally in bags A and B? Why? No, the answer does not depend on how many stickers were originally in the bags. The units in the tape diagrams could represent any number of stickers. For example, if bag A has 8 stickers and bag B has 6 stickers, then after half of the stickers are moved bag A has 4 and bag B has 10. The ratio 4 : 10 is equivalent to the ratio 2 : 5. Direct student attention to problem 4. Read the problem out loud. Use the facilitation that follows to guide students through problem 4 or skip the facilitation and give partners several minutes to work on the problem. Encourage productive struggle and experimentation with different strategies. When most students have finished problem 4 or the struggle is no longer productive, consider facilitating a class discussion to share strategies.
218
© Great Minds PBC
EUREKA MATH2 6 ▸ M1 ▸ TB ▸ Lesson 11
4. Noah mixes 7 parts yellow paint for every 3 parts blue paint to make green paint. He adds 12 pints of blue paint to the mixture. Now the number of parts yellow paint is equal to the number of parts blue paint. How many pints of green paint did Noah have before adding more blue paint? Original paint mixture: Number of Parts Yellow Paint Number of Parts Blue Paint Paint mixture after addition of blue paint: Number of Parts Yellow Paint Number of Parts Blue Paint
12 pints Labeling of tape diagram representing original paint mixture: Number of Parts Yellow Paint
3
3
3
Number of Parts Blue Paint
3
3
3
3
3
3
3
Noah had 30 pints of green paint.
© Great Minds PBC
219
6 ▸ M1 ▸ TB ▸ Lesson 11
EUREKA MATH2
Draw a tape diagram to represent Noah’s original paint mixture. When most students have finished, display the yellow and blue tape diagrams with 7 yellow units and 3 blue units. Number of Parts Yellow Paint Number of Parts Blue Paint Have students think–pair–share about the following question. How can we represent the addition of 12 pints of blue paint on the tape diagram? We know that after the blue paint is added, the number of parts yellow paint is equal to the number of parts blue paint. So we need to add 4 units to the blue tape diagram. Display the yellow and blue tape diagrams with 7 yellow units and 7 blue units. Ask students to draw in their books this tape diagram showing the addition of the blue paint. Number of Parts Yellow Paint Number of Parts Blue Paint We know that the 4 units added to the blue tape diagram represent 12 pints of blue paint.
220
© Great Minds PBC
EUREKA MATH2 6 ▸ M1 ▸ TB ▸ Lesson 11
Display the yellow and blue tape diagrams with 7 yellow units and 7 blue units with a bracket labeled “12 pints” underneath the blue tape diagram. Number of Parts Yellow Paint Number of Parts Blue Paint
12 pints Have students think–pair–share about the following question. What quantity does each unit on the tape diagram represent? Each unit in the tape diagram must represent 3 pints of blue paint. Let us revisit our original tape diagram of 7 parts yellow paint and 3 parts blue paint. Label each unit in the tape diagram. Display the yellow and blue tape diagrams with 7 yellow units and 3 blue units with a bracket labeled to show a total of 30. Number of Parts Yellow Paint
3
3
3
Number of Parts Blue Paint
3
3
3
3
3
3
3
30
How many pints of green paint did Noah have before adding more blue paint? How do you know? Noah had a total of 30 pints of green paint before he added more blue paint. Each unit in the tape diagram represents 3 pints, so 10 units represents 30 pints.
© Great Minds PBC
221
6 ▸ M1 ▸ TB ▸ Lesson 11
Changing Ratios Stations Activity Students choose strategies and reason about equivalent ratios to solve changing ratio problems. Tell students that they will complete a series of problems like problem 4 at stations. Allow students to work with a partner. Partners may choose to create tape diagrams or use other tools. There are six possible stations, but students are likely to complete only three. The stations progress in difficulty. Assign students to start at an appropriate station. Assign students who need the most scaffolding to start at station 1. Assign students who need the least scaffolding to start at station 4. Have students complete the problems in order, beginning at the station they were assigned. Allow students to work until 10 minutes of class time remains. As students work, circulate and listen to their strategies. Look for efficient use of mathematical tools, such as tape diagrams, ratio tables, or double number lines.
EUREKA MATH2
Promoting the Standards for Mathematical Practice As students solve multi-step ratio problems by finding entry points, monitoring their own progress, and questioning whether the values they calculate make sense, they are making sense of problems and persevering in solving them (MP1). Ask the following questions to promote MP1: • What are some strategies you can try to start solving the problem? • What can you figure out about this problem by drawing a diagram? • Does your answer make sense? Why?
222
© Great Minds PBC
EUREKA MATH2 6 ▸ M1 ▸ TB ▸ Lesson 11
Start at the station indicated by your teacher. Move in order of station number. Your goal is to complete at least three stations in the time allotted. Draw diagrams or tables to support your thinking. Station 1
Station 2
Language Support Support students’ comprehension of the problems in the stations activity by having them read or listen to the text multiple times. For example, direct students to first read the problem silently, then take turns reading every other sentence with their partner, and then summarize the problem in their own words. Between reads, encourage students to ask questions to support their understanding of the problem. This could range from asking questions about specific words to asking questions to support comprehension.
Teacher Note If, after reading through the stations, you anticipate that your students will likely be at about the same level, consider printing additional Changing Ratios Stations cards to avoid overcrowding.
Station 3
© Great Minds PBC
223
EUREKA MATH2
6 ▸ M1 ▸ TB ▸ Lesson 11
Station 4
Station 5
Station 6
Call the class back together to debrief, even if not all groups have finished. 224
© Great Minds PBC
EUREKA MATH2 6 ▸ M1 ▸ TB ▸ Lesson 11
Land Debrief 5 min Objective: Solve multi-step ratio problems by reasoning about equivalent ratios. To summarize solving problems in which ratios are changing, initiate a class discussion by using the following prompts. What was different about the ratio problems we solved today compared to other ratio problems that we have worked on? Today the ratios were changing. Instead of using one tape diagram, I had to use two tape diagrams to show two different ratios. What strategies can we use to solve multi-step ratio problems? Give an example of when you used a specific tool, such as a tape diagram or a table, for solving a problem today. We can use diagrams, such as tape diagrams. At station 3, I used a tape diagram to determine how much punch Tara had. Which tool did you find the most helpful for problem solving today? Explain. Tape diagrams were the most helpful tool for problem solving. They helped me see how a ratio changed so I could figure out how to answer the question being asked.
Exit Ticket 5 min Provide up to 5 minutes for students to complete the Exit Ticket. It is possible to gather formative data even if some students do not complete every problem.
© Great Minds PBC
Teacher Note Assign the Practice problems for completion outside of class or use them in class if time remains after the lesson. Refer students to the Recap for support.
225
EUREKA MATH2
6 ▸ M1 ▸ TB ▸ Lesson 11
Recap
EUREKA MATH2
6 ▸ M1 ▸ TB ▸ Lesson 11
RECAP Name
Date
11
Tara can make a double batch of the granola recipe. One batch of granola has 5 parts oats and 3 parts pumpkin seeds. Two batches of granola have 10 parts oats and 6 parts pumpkin seeds. If Tara adds 7 parts oats and 1 part pumpkin seeds to her mixture, she will end up with 10 parts oats and 6 parts pumpkin seeds.
Applications of Ratio Reasoning In this lesson, we •
solved multi-step ratio problems.
•
solved problems in which ratios change.
•
modeled changing ratios with tape diagrams.
EUREKA MATH2
6 ▸ M1 ▸ TB ▸ Lesson 11
2. Sana mixes 2 parts red paint with 5 parts yellow paint to make orange paint. When she adds 9 tablespoons of red paint, the new mixture has equal parts red paint and yellow paint. What is the total number of tablespoons of orange paint in Sana’s new mixture? Draw tape diagrams to show your thinking. Create two tape diagrams, one to show the original ratio and one to show the new ratio.
Examples 1. One batch of Tara’s granola recipe calls for 5 parts oats for every 3 parts pumpkin seeds. She accidentally mixes 3 parts oats and 5 parts pumpkin seeds. Tara wants to add to her mixture so that the ratio of the number of parts oats to the number of parts pumpkin seeds is equivalent to the ratio in the recipe.
9
How many parts oats and how many parts pumpkin seeds should Tara add to her mixture? Explain, or draw tape diagrams to show your thinking. Tara should add 7 parts oats and 1 part pumpkin seeds to her mixture. One Batch of Granola
Number of Parts Oats Number of Parts Pumpkin Seeds
Two Batches of Granola
Sana’s New Paint Mixture
Sana’s Original Paint Mixture
Number of Parts Red Paint
Number of Parts Red Paint
Number of Parts Yellow Paint
Number of Parts Yellow Paint
Sana’s new mixture has a total of 30 tablespoons of orange paint.
Tara has used too many pumpkin seeds for a single batch of her recipe. To create a double batch that follows the original recipe, Tara needs to add 7 parts oats and 1 part pumpkin seeds.
Because 3 units represent 9 tablespoons of paint, 1 unit represents 3 tablespoons of paint. Therefore, Sana has 10 ´ 3, or 30, tablespoons of orange paint.
Number of Parts Oats Number of Parts Pumpkin Seeds
Tara’s Granola Number of Parts Oats Number of Parts Pumpkin Seeds © Great Minds PBC
226
155
156
RECAP
© Great Minds PBC
© Great Minds PBC
EUREKA MATH2 6 ▸ M1 ▸ TB ▸ Lesson 11
Sample Solutions Expect to see varied solution paths. Accept accurate responses, reasonable explanations, and equivalent answers for all student work.
There are 44 sixth graders in the drama club. b. Six more sixth graders join the drama club. What is the new ratio of the number of sixth graders to the number of seventh graders in the drama club? The new ratio of the number of sixth graders to the number of seventh graders in the drama club is 10 : 11. Station 2 Scott makes light green paint for the art teacher. He is supposed to use 1 tablespoon of white paint for every 3 tablespoons of green paint. He accidentally mixes 1 tablespoon of white paint with 5 tablespoons of green paint.
Number of Tablespoons of Green Paint
c. How can Scott fix his mistake so that he makes the correct shade of light green paint for the art teacher? Draw a tape diagram to support your thinking.
Number of Tablespoons of Green Paint
Number of Cups of Juice
Number of Cups of Juice
6
Number of Seventh Graders
Number of Seventh Graders
Number of Eighth Graders
Number of Eighth Graders
8
8
Station 5
Jada has $18.00, and Kelly has $15.00. We can represent the number of dollars that Kelly gives Jada by moving 2 units from Kelly’s tape to Jada’s tape. The 2 units represent a total of $6.00, so each unit on the tape diagram represents $3.00. Number of Dollars Jada Has
Number of Dollars Jada Has
Number of Dollars Kelly Has
Number of Dollars Kelly Has
3
3
EUREKA MATH2
Number of Tablespoons of White Paint
Number of Cups of Seltzer Water
The ratio of the number of dollars Jada has to the number of dollars Kelly has is 4 : 7. Kelly gives Jada $6.00. The ratio of the number of dollars Jada has to the number of dollars Kelly has changes to 6 : 5. How many dollars do Jada and Kelly each have now?
© Great Minds PBC
1
© Great Minds PBC
Scott can add 1 tablespoon of white paint and 1 tablespoon of green paint.
Number of Cups of Seltzer Water
There are currently 32 students in the club. Changing the ratio to 1 : 1 adds 2 more units to the tape diagram. Therefore, each unit in the tape diagram must represent 8 students. There are currently 4 units in the tape diagram, for a total of 32 students. 6 ▸ M1 ▸ TB ▸ Lesson 11 ▸ Changing Ratios Stations Answer Key
This page may be reproduced for classroom use only.
Number of Tablespoons of White Paint
The ratio of the number of cups of seltzer water to the number of cups of juice in Tara’s punch is originally 3 : 5 and then changes to 4 : 5. One unit is added to the top tape in the tape diagram. This additional unit represents the 6 cups of seltzer water that Tara added to her punch. If each unit in the tape diagram represents 6 cups, then Tara has a total of 54 cups of punch.
A club has 1 seventh grader for every 3 eighth graders. To reach its desired seventh grader to eighth grader ratio of 1 : 1, the club needs 16 more seventh graders. What is the total number of students in the club?
Number of Tablespoons of White Paint
b. Draw a tape diagram to show the ratio of the number of tablespoons of white paint to the number of tablespoons of green paint in the paint that Scott accidentally makes.
Tara makes punch by mixing 3 cups of seltzer water with every 5 cups of juice. She tastes it and decides it has too much juice. So she adds 6 more cups of seltzer water. The ratio of the number of cups of seltzer water to the number of cups of juice is now 4 : 5. What is the total number of cups of punch Tara makes after she adds the extra seltzer water?
Station 4
a. Draw a tape diagram to show the ratio of the number of tablespoons of white paint to the number of tablespoons of green paint in the teacher’s light green paint.
Number of Tablespoons of Green Paint
6 ▸ M1 ▸ TB ▸ Lesson 11 ▸ Changing Ratios Stations Answer Key
a. How many sixth graders are in the drama club?
Station 3 This page may be reproduced for classroom use only.
The ratio of the number of sixth graders to the number of seventh graders in the drama club is 4 : 5. There are 55 seventh graders in the drama club.
2
Station 1
EUREKA MATH2
© Great Minds PBC
Changing Ratios Stations Answer Key
227
EUREKA MATH2
6 ▸ M1 ▸ TB ▸ Lesson 11
Blake and Kayla have the same amount of money. Blake spends $12.00, and Kayla spends $20.00. The ratio of the amount of Blake’s money in dollars to the amount of Kayla’s money in dollars is now 3 : 2. How much money do Blake and Kayla each have now?
EUREKA MATH2
© Great Minds PBC
Station 6
Blake has $24.00, and Kayla has $16.00. The difference between what Blake and Kayla spend is $8.00. That difference is represented by the shaded unit in the upper tape diagram. Therefore, each unit on the tape diagram represents $8.00. Amount of Blake’s Money in Dollars
Amount of Blake’s Money in Dollars
Amount of Kayla’s Money in Dollars
Amount of Kayla’s Money in Dollars
12 20
d. e.
3
6 ▸ M1 ▸ TB ▸ Lesson 11 ▸ Changing Ratios Stations Answer Key
This page may be reproduced for classroom use only.
228
© Great Minds PBC
EUREKA MATH2 6 ▸ M1 ▸ TB ▸ Lesson 11
EUREKA MATH2
6 ▸ M1 ▸ TB ▸ Lesson 11
PRACTICE Name
Date
11
b. There are 8 students who wear glasses. What is the total number of students in the class? There is a total of 28 students in the class.
1. The ratio of the number of Sana’s marbles to the number of Tyler’s marbles is 1 : 8. After Tyler gives 9 marbles to Sana, the ratio of the number of Sana’s marbles to the number of Tyler’s marbles is 4 : 5. Number of Sana’s Marbles
3
Number of Tyler’s Marbles
3
3
3
3
3
3
3
3
Number of Sana’s Marbles
3
3
3
3
Number of Tyler’s Marbles
3
3
3
3
EUREKA MATH2
6 ▸ M1 ▸ TB ▸ Lesson 11
c. Two students in the class who did not wear glasses now wear glasses. What is the new ratio of the number of students who wear glasses to the number of students who do not wear glasses?
3
a. What is the total number of marbles that are represented by the three shaded units on the tape diagram? The three shaded units represent 9 marbles. b. What does each unit of the tape diagrams represent? Complete the tape diagrams by filling in the value of each unit in both tape diagrams.
The new ratio of the number of students who wear glasses to the number of students who do not wear glasses is 10 : 18, or 5 : 9. 3. An animal shelter with only cats and dogs has 40 animals. The ratio of the number of cats to the number of dogs at the shelter is 3 : 5. If 5 more dogs arrive at the shelter, what is the new ratio of the number of cats to the number of dogs at the shelter? Explain. The new ratio of the number of cats to the number of dogs is 1 : 2. The shelter originally has 15 cats and 25 dogs. After 5 more dogs arrive at the shelter, there are 15 cats and 30 dogs.
Each unit represents 3 marbles. c. What is the total number of marbles Sana and Tyler have? Sana and Tyler have a total of 27 marbles.
4. Ryan mixes 3 parts white paint with 8 parts blue paint to make light blue paint. He adds a total of 10 tablespoons of white paint. His mixture is now equal parts white and blue paint. After adding the 10 tablespoons of white paint, what is the total number of tablespoons of paint Ryan has? Draw tape diagrams to show your thinking.
2. In an art class, the ratio of the number of students who wear glasses to the total number of students is 2 : 7.
Ryan has a total of 32 tablespoons of paint.
a. What is the ratio of the number of students who wear glasses to the number of students who do not wear glasses?
10 tablespoons
The ratio of the number of students who wear glasses to the number of students who do not wear glasses is 2 : 5.
Number of Parts White Paint
Number of Parts Blue Paint
© Great Minds PBC
© Great Minds PBC
157
158
P R ACT I C E
Number of Parts White Paint Number of Parts Blue Paint
© Great Minds PBC
229
EUREKA MATH2
6 ▸ M1 ▸ TB ▸ Lesson 11
EUREKA MATH2
6 ▸ M1 ▸ TB ▸ Lesson 11
5. The sixth grade has two classrooms. Classroom A has 28 students. The ratio of the number of right-handed students to the number of left-handed students in classroom A is 5 : 2. Classroom B has 27 students. The ratio of the number of right-handed students to the number of left-handed students in classroom B is 8 : 1. What is the ratio of the total number of right-handed students to the total number of left-handed students? Explain.
EUREKA MATH2
6 ▸ M1 ▸ TB ▸ Lesson 11
Remember 8. Multiply.
23,374 ´ 58
The ratio of the total number of right-handed students to the total number of left-handed students is 44 : 11, or 4 : 1. In classroom A, there are 20 right-handed students and 8 left-handed students. In classroom B, there are 24 right-handed students and 3 left-handed students.
1,355,692 9. Jada uses beads to make necklaces. The ratio table shows the relationship between the number of red beads and the number of silver beads that Jada uses. a. Complete the ratio table.
6. Blake makes slime using glue and laundry soap. His recipe calls for 5 ounces of glue for every 2 ounces of laundry soap. Blake accidentally mixes 2 ounces of glue with 5 ounces of laundry soap. How many ounces of glue and how many ounces of laundry soap does Blake need to add so that his slime follows the original recipe? Explain. Blake needs to add 13 ounces of glue and 1 ounce of laundry soap. One batch of his slime has 5 ounces of glue and 2 ounces of laundry soap. Two batches have 10 ounces of glue and 4 ounces of laundry soap. Three batches have 15 ounces of glue and 6 ounces of laundry soap. Blake could turn his mixture into a triple batch by adding 13 ounces of glue and 1 ounce of laundry soap.
7. A florist has two bouquets that each have the same number of flowers. She moves 4 flowers from bouquet A to bouquet B. The ratio of the number of flowers in bouquet A to the number of flowers in bouquet B is now 1 : 3. How many flowers are now in each bouquet? Explain, or draw a tape diagram to show your thinking.
4
Number of Flowers in Bouquet A Number of Flowers in Bouquet B
4 4
4
Number of Silver Beads
2
3
4
6
6
9
16
24
30
45
b. Describe a multiplication pattern in the ratio table. Sample: I multiplied the number of red beads and the number of silver beads in the first row each by 2 to create the numbers in the second row and multiplied each by 3 to create the numbers in the third row.
After the florist moves the flowers, there are 4 flowers in bouquet A and 12 flowers in bouquet B. Number of Flowers in Bouquet A Number of Flowers in Bouquet B
Number of Red Beads
10. Find the quotient.
4
4,872 ¸ 12 A. 46 B. 406 C. 460 D. 4,006
© Great Minds PBC
230
P R ACT I C E
159
160
P R ACT I C E
© Great Minds PBC
© Great Minds PBC
© Great Minds PBC
Station 1
Tara makes punch by mixing 3 cups of seltzer water with every 5 cups of juice. She tastes it and decides it has too much juice. So she adds 6 more cups of seltzer water. The ratio of the number of cups of seltzer water to the number of cups of juice is now 4 : 5. What is the total number of cups of punch that Tara makes after she adds the extra seltzer water?
Station 3
c. How can Scott fix his mistake so that he makes the correct shade of light green paint for the art teacher? Draw a tape diagram to support your thinking.
b. Draw a tape diagram to show the ratio of the number of tablespoons of white paint to the number of tablespoons of green paint in the paint that Scott accidentally makes.
a. Draw a tape diagram to show the ratio of the number of tablespoons of white paint to the number of tablespoons of green paint in the teacher’s light green paint.
Scott makes light green paint for the art teacher. He is supposed to use 1 tablespoon of white paint for every 3 tablespoons of green paint. He accidentally mixes 1 tablespoon of white paint with 5 tablespoons of green paint.
Station 2
b. Six more sixth graders join the drama club. What is the new ratio of the number of sixth graders to the number of seventh graders in the drama club?
a. How many sixth graders are in the drama club?
The ratio of the number of sixth graders to the number of seventh graders in the drama club is 4 : 5. There are 55 seventh graders in the drama club.
Changing Ratios Stations Cards
EUREKA MATH2 6 ▸ M1 ▸ TB ▸ Lesson 11 ▸ Changing Ratios Stations Cards
This page may be reproduced for classroom use only.
231
232 This page may be reproduced for classroom use only.
Blake and Kayla have the same amount of money. Blake spends $12.00, and Kayla spends $20.00. The ratio of the amount of Blake’s money in dollars to the amount of Kayla’s money in dollars is now 3 : 2. How much money do Blake and Kayla each have now?
Station 6
The ratio of the number of dollars Jada has to the number of dollars Kelly has is 4 : 7. Kelly gives Jada $6.00. The ratio of the number of dollars Jada has to the number of dollars Kelly has changes to 6 : 5. How many dollars do Jada and Kelly each have now?
Station 5
A club has 1 seventh grader for every 3 eighth graders. To reach its desired seventh grader to eighth grader ratio of 1 : 1, the club needs 16 more seventh graders. What is the total number of students in the club?
Station 4
6 ▸ M1 ▸ TB ▸ Lesson 11 ▸ Changing Ratios Stations Cards EUREKA MATH2
© Great Minds PBC
Topic C Comparing Ratio Relationships
In the opening lesson, students build on their work from topic B by creating ratio tables, double number lines, and graphs to use for comparisons. With these tools, students examine different representations of ratio relationships to determine whether they represent the same ratio relationship. Students have opportunities to choose representations for making comparisons. They answer the question, Are the colors the same shade of purple?
Smoothies
y Number of Cups of Strawberries
In topics A and B, students describe ratios with precise language and notation and use a variety of tools to represent collections of equivalent ratios. They explore and explain addition and multiplication patterns in ratio relationships and solve problems by using equivalent ratio reasoning. In topic C, students extend their understanding of equivalent ratios when they compare real-world contexts by using ratio relationships.
Smoothie A
12 10 8
Smoothie B
6 4 2
0
1
2
After determining whether various representations describe the same ratio relationship, students progress to writing more detailed and precise comparative statements. They apply their understanding of equivalent ratios to manipulate ratio tables and make direct comparisons. They use ratios to justify statements such as “Leo’s salsa should be spicier than Ryan’s salsa” and “Mixture B should appear more yellow than mixture A.” After comparing two ratio relationships in a real-world context, students apply the same strategies to compare three ratio relationships.
3
4
5
6
7
8
9
10
11
12
13
14
x
Number of Cups of Bananas
In topic B, students write equivalent ratios in which the first or second number is 1. When given that the ratio of the number of cups of water to the number of cups of flour is 3 : 4, 3 students craft statements such as “There are cups of water for every 1 cup of flour.” In 4 3 topic C, students build upon this understanding and identify as the value of the ratio. 4 Students calculate and interpret the value of the ratio and use it to compare real-world
234
© Great Minds PBC
EUREKA MATH2 6 ▸ M1 ▸ TC
situations. Students also realize the usefulness of the value of the ratio for efficiently comparing ratio relationships. As students apply their understanding of the value of the ratio while continuing to compare ratio relationships in topic C, they develop skills that are essential for work they do in topic D. That work includes calculating unit rates, converting units, comparing rates, and solving rate problems.
Progression of Lessons Lesson 12
Multiple Ratio Relationships
Lesson 13
Comparing Ratio Relationships, Part 1
Lesson 14
Comparing Ratio Relationships, Part 2
Lesson 15
The Value of the Ratio
© Great Minds PBC
235
12
LESSON 12
Multiple Ratio Relationships Compare ratio relationships by using graphs, tables, and double number lines.
EUREKA MATH2
6 ▸ M1 ▸ TC ▸ Lesson 12
EXIT TICKET Name
Date
12
The table shows the total cost of apples at store A. The graph shows the total cost of apples at store B. Do the table and the graph represent the same ratio relationship? Explain how you know. Store A
Store B
y
Number of Pounds of Apples
Total Cost (dollars)
3
5
6
10
9
15
12
20
15
25
In this lesson, students explore what it means for two sets of equivalent ratios to belong to the same ratio relationship. They model and compare ratio relationships by using graphs, tables, and double number lines. Students discuss their preferred representation for comparing ratio relationships.
13
Key Questions
12 11
Total Cost (dollars)
10
• What features of graphs, tables, and double number lines help us to determine whether sets of ratios belong to the same ratio relationship?
9 8 7 6
• What does it mean for two ratio relationships to be different?
5 4 3 2
Achievement Descriptors
1 0
1
2
3
4
5
6
7
8
x
9 10 11 12 13 14 15
Number of Pounds of Apples
The graph and the table do not represent the same ratio relationship. The table shows that the total cost of 6 pounds of apples is $10.00 at store A, and the graph shows that the total cost of 6 pounds of apples is $9.00 at store B.
© Great Minds PBC
Lesson at a Glance
6.Mod1.AD4 Represent ratio relationships by using tables and the
coordinate plane. (6.RP.A.3.a) 6.Mod1.AD5 Compare ratio relationships by using various
representations. (6.RP.A.3.a)
167
© Great Minds PBC
EUREKA MATH2 6 ▸ M1 ▸ TC ▸ Lesson 12
Agenda
Materials
Fluency
Teacher
Launch 10 min
• Paper (3 sheets)
Learn 25 min
• Tape
• Are They the Same Shade?
Students
• Take a Stand
• Colored pencils
Land 10 min
Lesson Preparation • Use the paper to prepare three signs. Hang the signs around the room. Label the signs as follows: • Graphs • Tables • Double Number Lines
© Great Minds PBC
237
EUREKA MATH2
6 ▸ M1 ▸ TC ▸ Lesson 12
Fluency Identify Equivalent Ratios Students identify equivalent ratios to prepare for comparing ratio relationships. Directions: Determine which ratios in the middle column are equivalent to the ratio in the left column.
6 : 8 15 : 20 1.
3 : 4
2 : 3 300 : 400
_
1 : 4 3 0.75 : 1
6 : 8 15 : 20 300 : 400 1 : _4 3
0.75 : 1
29 : 11
2.
30 : 12
20 : 8
20 : 8
5 : 2
5 : 2
2 1 : _ 5
_
2 : 1 5
1 : _2 5 2.5 : 1
2.5 : 1
238
© Great Minds PBC
EUREKA MATH2 6 ▸ M1 ▸ TC ▸ Lesson 12
Launch
10
Students compare shades of paint by using ratios. Display the purple rectangles with the black line segment between them.
Differentiation: Support To support students as they determine whether the shades of purple are the same, consider inviting students to move to another location in the room.
Language Support The word shade has several meanings. Consider highlighting that in this lesson, shade refers to a color. Point out different shades of the same color within your classroom.
Tell students that there are two purple rectangles, one on either side of the black line segment. Ask students whether the two rectangles are the same shade of purple. After the class has reached a consensus, display the rectangles with the black line segment moved away from the rectangles and ask the class whether they still agree with their answer.
© Great Minds PBC
239
EUREKA MATH2
6 ▸ M1 ▸ TC ▸ Lesson 12
Lighter
Darker
Teacher Note
Invite students to turn and talk about how different shades and different batches of paint are created. Then call the class back together and read the directions for problem 1 aloud. Invite students to help you create paint mixtures by choosing the number of parts blue paint and the number of parts red paint in each mixture.
Sample responses for mixtures 1, 2, 3, and 4 are shown and used in problems 1–6. While sample responses are provided, the use of student-generated numbers is encouraged throughout the lesson.
1. Mixture 1 and mixture 2 are the same shade of purple but use different numbers of parts blue paint and red paint. Mixture 1
Mixture 2
Number of Parts Blue
2
4
Number of Parts Red
3
6
a. Record the number of parts blue paint and the number of parts red paint in mixture 1. b. Create mixture 2 by using blue paint and red paint. Make mixture 2 the same shade as mixture 1 but with a greater total amount of paint than mixture 1. Record the number of parts blue paint and the number of parts red paint in mixture 2. 240
© Great Minds PBC
EUREKA MATH2 6 ▸ M1 ▸ TC ▸ Lesson 12
Facilitate a class discussion by using the following prompt. How can we use the numbers in the table to show that mixtures 1 and 2 are the same shade? We can use the numbers in the table to write ratios of the number of parts blue paint to the number of parts red paint in each mixture. Because the ratios 2 : 3and 4 : 6 are equivalent, the mixtures are the same shade. Making two mixtures that each have 2 parts blue paint and 3 parts red paint is the same as making one mixture that has 4 parts blue paint and 6 parts red paint. Read the directions for problem 2 aloud. Invite students to help you create paint mixtures by choosing the number of parts blue paint and the number of parts red paint in each mixture. 2. Create two new mixtures with the same number of parts red paint but different numbers of parts blue paint. Complete the table to show the numbers of parts blue paint and red paint in each mixture. Mixture 3
Mixture 4
Number of Parts Blue
2
3
Number of Parts Red
5
5
© Great Minds PBC
241
6 ▸ M1 ▸ TC ▸ Lesson 12
EUREKA MATH2
Facilitate a class discussion by using the following prompts. Are these two mixtures the same shade? How do you know? No. The shades are different because the mixtures have the same number of parts red paint but different numbers of parts blue paint. So the ratios of the number of parts blue paint to the number of parts red paint in the two mixtures are not equivalent. In real-world situations, when might you need to make sure that paint mixtures are the same shade? If I were painting a room but needed more than one can of paint, then I would need to know that the paint mixtures were the same shade so that the paint would match. Today, we will compare relationships shown in graphs, tables, and double number lines to determine whether they represent the same ratio relationship.
242
© Great Minds PBC
EUREKA MATH2 6 ▸ M1 ▸ TC ▸ Lesson 12
Learn
25
Are They the Same Shade? 20 min Students compare ratio relationships by using graphs, tables, and double number lines. Have students recall the ratios of the number of parts blue paint to the number of parts red paint for mixtures 1 and 2. In mixture 1, the ratio of the number of parts blue paint to the number of parts red paint is 2 : 3. In mixture 2, the ratio of the number of parts blue paint to the number of parts red paint is 4 : 6. Direct students to the tables for mixtures 1 and 2 in problem 3. Have them record the number of parts blue paint and the number of parts red paint in the first row of each table. Then ask students to complete problems 3 and 4 with a partner.
UDL: Representation When determining whether the ratio relationships shown in the two tables are the same, highlight or circle rows that contain the same number of parts blue paint or parts red paint. If both numbers in the rows are the same, then the ratio relationships are the same. If both numbers in the rows are not the same, then the ratio relationships are different.
3. Complete the ratio tables for mixtures 1 and 2. Mixture 1
Mixture 2
Number of Parts Blue
Number of Parts Red
Number of Parts Blue
Number of Parts Red
2
3
4
6
4
6
8
12
6
9
12
18
8
12
16
24
© Great Minds PBC
243
EUREKA MATH2
6 ▸ M1 ▸ TC ▸ Lesson 12
4. Graph the ratio relationship for mixture 1 in one color. Graph the ratio relationship for mixture 2 in another color. Use the ratio tables from problem 3. y 28 26
Mixture 2
24 Number of Parts Red
22 20 18 16 14 12 10 8 6 4 2 0
Mixture 1 2
4
6
8 10 12 14 16 18 20 22 24 26 28
x
Number of Parts Blue
When most students have finished, lead a class discussion about mixtures 1 and 2. What do you notice about the tables for mixtures 1 and 2? There are some pairs of numbers that appear in both tables. In both tables, the number of parts red paint is 1 .5times as much as the number of parts blue paint. The tables represent the same ratio relationship.
244
© Great Minds PBC
EUREKA MATH2 6 ▸ M1 ▸ TC ▸ Lesson 12
What do you notice about the graph for mixtures 1 and 2? What do you wonder? I notice that the sets of points for both paint mixtures lie on the same line. I wonder whether all graphs that represent a ratio relationship have points that lie on the same line. When we graph ordered pairs that are part of a ratio relationship, then all the points lie on the same line. Have students recall the ratios of the number of parts blue paint to the number of parts red paint for mixtures 3 and 4. In mixture 3, the ratio of the number of parts blue paint to the number of parts red paint is 2 : 5. In mixture 4, the ratio of the number of parts blue paint to the number of parts red paint is 3 : 5. Direct students to the tables for mixtures 3 and 4 in problem 5. Have them record the number of parts blue paint and the number of parts red paint in the first row of each table. Then have students complete problems 5 and 6 with a partner. 5. Complete the ratio tables for mixtures 3 and 4. Mixture 3
Mixture 4
Number of Parts Blue
Number of Parts Red
Number of Parts Blue
Number of Parts Red
2
5
3
5
4
10
6
10
6
15
9
15
8
20
12
20
© Great Minds PBC
245
EUREKA MATH2
6 ▸ M1 ▸ TC ▸ Lesson 12
6. Graph the ratio relationship for mixture 3 in one color. Graph the ratio relationship for mixture 4 in another color. Use the ratio tables from problem 5. y 28 26 24 Number of Parts Red
22
Mixture 3
20
Mixture 4
18 16 14 12 10 8 6 4 2 0
2
4
6
8 10 12 14 16 18 20 22 24 26 28
x
Number of Parts Blue
When most students have finished, lead a class discussion about mixtures 3 and 4. What do you notice about the tables for mixtures 3 and 4? There are no pairs of numbers that appear in both tables. What do you notice about the graph for mixtures 3 and 4? What do you wonder? I notice that the sets of points for the two paint mixtures lie on different lines. I wonder whether sets of points that represent different ratio relationships will always lie on different lines on the graph.
246
© Great Minds PBC
EUREKA MATH2 6 ▸ M1 ▸ TC ▸ Lesson 12
When a graph represents two different ratio relationships, then the sets of points for the ratio relationships will lie on different lines. Ask students to look at their tables for mixtures 3 and 4 in problem 5. Have students think–pair–share about the following question. We know that the sets of points that represent two different ratio relationships do not lie on the same line. Examine the tables for mixtures 3 and 4 in problem 5. How can you tell that these mixtures do not represent the same ratio relationship? In each table, there is a row in which the number of parts blue paint is the same. But the corresponding number of parts red paint is not the same, so the pairs of numbers do not represent equivalent ratios. Therefore, the tables represent different ratio relationships. Display the graph for mixture 5 and the table for mixture 6.
Mixture 5
Mixture 6
y 20 Number of Parts Red
18 16 14 12 10 8 6 4
Number of Parts Blue
Number of Parts Red
3
4
6
8
9
12
12
16
2 0
2
4
6
8 10 12 14 16 18 20
Number of Parts Blue
© Great Minds PBC
x
247
EUREKA MATH2
6 ▸ M1 ▸ TC ▸ Lesson 12
Invite students to think–pair–share about the following question. As needed, have students gesture to the graph or the table as they explain their thinking. Are mixtures 5 and 6 the same shade? How do you know? No. When mixture 5 has 6 parts blue paint, it has 9 parts red paint. When mixture 6 has 6parts blue paint, it only has 8 parts red paint. No. When mixture 5 has 1 2parts red paint, it has 8 parts blue paint. When mixture 6 has 12parts red paint, it has 9 parts blue paint. No. When mixture 5 has 1 2parts blue paint, it has 1 8parts red paint. When mixture 6 has 1 2parts blue paint, it only has 1 6parts red paint. In addition to using tables and graphs to compare ratio relationships, we can use double number lines. Display the double number lines for mixtures 7 and 8.
Mixture 7 3
6
9
12
15
18
21
24
27
7
14
21
28
35
42
49
56
63
Number of Parts Blue Number of Parts Red
Mixture 8 4
8
12
16
20
24
28
32
36
9
18
27
36
45
54
63
72
81
Number of Parts Blue Number of Parts Red
248
© Great Minds PBC
EUREKA MATH2 6 ▸ M1 ▸ TC ▸ Lesson 12
Do both double number lines represent the same ratio relationship? How do you know? No. When mixture 7 has 1 2parts blue paint, it has 2 8parts red paint. When mixture 8 has 1 2parts blue paint, it only has 2 7parts red paint. Gesture to the double number lines to highlight the ratios 1 2 : 28and 1 2 : 27. Invite students to complete problem 7. 7. Julie and Ryan both make purple paint. a. In Julie’s paint, the ratio of the number of parts blue paint to the number of parts red paint is 8 : 10. Complete the table to show the ratio relationship between the number of parts blue paint and the number of parts red paint. Julie’s Paint
© Great Minds PBC
Number of Parts Blue
Number of Parts Red
8
10
16
20
24
30
32
40
249
EUREKA MATH2
6 ▸ M1 ▸ TC ▸ Lesson 12
b. In Ryan’s paint, the ratio of the number of parts blue paint to the number of parts red paint is 1 2 : 15. Complete the double number line to show the ratio relationship between the number of parts blue paint and the number of parts red paint.
Ryan’s Paint 0
12
24
36
48
0
15
30
45
60
Number of Parts Blue Number of Parts Red
c. Do Julie and Ryan make the same shade of purple paint? How do you know? Yes. The ratios of the number of parts blue paint to the number of parts red paint in both shades represent the same ratio relationship. Julie’s paint and Ryan’s paint both have 2 4parts blue paint for 3 0parts red paint. When most students have finished, ask the following question. How do you know whether a table and a double number line represent the same ratio relationship? I know that a table and a double number line represent the same ratio relationship when all the ratios in both representations are equivalent. When a tick mark on a double number line has the same pair of numbers as a row in the table, then I know that the double number line and the table represent the same ratio relationship.
250
© Great Minds PBC
EUREKA MATH2 6 ▸ M1 ▸ TC ▸ Lesson 12
Take a Stand Students discuss which representations are most useful for comparing ratio relationships. Introduce the Take a Stand routine to the class. Draw students’ attention to the signs hanging in the classroom: Graphs, Tables, and Double Number Lines. Present the following question to the class. Which representation is most helpful for comparing ratio relationships: graphs, tables, or double number lines? Invite students to stand beside the sign that best describes their thinking. When all students are standing near a sign, allow 2 minutes for groups to discuss the reasons why they chose that sign. Then call on each group to share reasons for their selection. Invite students who change their minds during the discussion to join a different group.
Promoting the Standards for Mathematical Practice Students learn to use appropriate tools strategically (MP5) when they compare the effectiveness of graphs, tables, and double number lines for determining whether two paint mixtures are the same shade. Ask the following questions to promote MP5: • What tools could help you compare two paint mixtures? • Which tool would be the most efficient for determining whether two paint mixtures are the same shade?
Have students return to their seats.
© Great Minds PBC
251
EUREKA MATH2
6 ▸ M1 ▸ TC ▸ Lesson 12
Land Debrief 5 min Objective: Compare ratio relationships by using graphs, tables, and double number lines. Initiate a class discussion by using the following prompts. Encourage students to add to their classmates’ responses. What features of graphs, tables, and double number lines help us to determine whether sets of ratios belong to the same ratio relationship? For graphs, sets of ratios in the same ratio relationship are represented by sets of points that appear to lie on the same line. Different ratio relationships are represented by sets of points that appear to lie on different lines. For tables and double number lines, sets of ratios in the same relationship are represented by pairs of numbers that appear in each table and in each double number line. When mixing paint, what does it mean for two ratio relationships to be different? If the two ratio relationships are different, it means that the paints are two different shades. The sets of ratios used to make the two shades of paint are not equivalent. For example, one paint mixture might have 3 parts blue paint and 4 parts red paint. That will be a different shade than a paint mixture that has 3 parts blue paint and 5 parts red paint.
Exit Ticket 5 min Provide up to 5 minutes for students to complete the Exit Ticket. It is possible to gather formative data even if some students do not complete every problem.
Teacher Note Assign the Practice problems for completion outside of class or use them in class if time remains after the lesson. Refer students to the Recap for support.
252
© Great Minds PBC
EUREKA MATH2 6 ▸ M1 ▸ TC ▸ Lesson 12
Recap
EUREKA MATH2
6 ▸ M1 ▸ TC ▸ Lesson 12
RECAP Name
Date
12
Multiple Ratio Relationships
2. Julie and Yuna each have one bag that has red cubes and yellow cubes in it. The table shows the ratio relationship between the number of red cubes and the number of yellow cubes in Julie’s bag. The double number line shows the ratio relationship between the number of red cubes and the number of yellow cubes in Yuna’s bag. Is the ratio relationship shown in the table the same as the ratio relationship shown in the double number line? Explain how you know.
In this lesson, we •
used graphs, tables, and double number lines to compare ratio relationships.
•
determined whether two ratio relationships were the same.
Julie’s Cubes
Examples 1. Ice cream shop A and ice cream shop B both sell chocolate ice cream. The graph shows the ratio relationship between the number of cups of cream and the number of ounces of cocoa in each store’s chocolate ice cream recipe. The sets of points for ice cream shops A and B lie on different lines. So the ratio relationships are not the same.
Chocolate Ice Cream Recipes
y
Ice Cream Shop A
Number of Ounces of Cocoa
1.5
1.25
1
0.5
0.25
0
1
2
3
4
5
6
7
8
9
10
Number of Yellow Cubes
6
8
12
16
18
24
24
32
x
Number of Red Cubes Number of Yellow Cubes
0
9
18
27
0
12
24
36
Look for matching quantities between the two representations, such as 18 red cubes or 24 yellow cubes, to make a comparison. In this case, both representations show 18 red cubes for every 24 yellow cubes. Every ratio represented in the table is equivalent to 18 : 24. Every ratio represented on the double number
line is equivalent to 18 : 24.
Both points in the box have a coordinate that represents 0.5 ounces of cocoa.
0.75
Yuna’s Cubes
Number of Red Cubes
To make a comparison, use points that have common coordinates.
Ice Cream Shop B
EUREKA MATH2
6 ▸ M1 ▸ TC ▸ Lesson 12
Yes. The ratio relationships are the same. All of the ratios represented in the table are equivalent to all of the ratios represented on the double number line. If both bags have 18 red cubes, then both bags have 24 yellow cubes.
Both points in the oval have a coordinate that represents 6 cups of cream.
Number of Cups of Cream
Should the chocolate ice creams have the same flavor? Explain. No. The chocolate ice creams should not have the same flavor. The set of points for ice cream shop A and the set of points for ice cream shop B lie on different lines and therefore represent different ratio relationships.
© Great Minds PBC
© Great Minds PBC
169
170
RECAP
© Great Minds PBC
253
EUREKA MATH2
6 ▸ M1 ▸ TC ▸ Lesson 12
Sample Solutions Expect to see varied solution paths. Accept accurate responses, reasonable explanations, and equivalent answers for all student work.
6 ▸ M1 ▸ TC ▸ Lesson 12
PRACTICE Name
Date
12
1. Smoothie store A and smoothie store B both make strawberry-banana smoothies. The graph shows the ratio relationship between the number of cups of strawberries and the number of bananas in each store’s strawberry-banana smoothie.
2. Miss Baker gives each student in her class a bag that has red marbles and blue marbles in it. She asks each student to represent the ratio relationship between the number of red marbles and the number of blue marbles in their bag by using either a table or a graph. Is the ratio of the number of red marbles to the number of blue marbles in Julie’s bag equivalent to the ratio of the number of red marbles to the number of blue marbles in Tara’s bag? Explain how you know. Julie’s Marbles
Number of Cups of Strawberries
y
Smoothie Store A
12 10
Smoothie Store B
8 6 4
1
2
3
4
5
6
7
8
9
10
Number of Red Marbles
Number of Blue Marbles
3
7
6
14
9
21
12
28
25
20
15
10
5
0
x
2
4
6
8
10
12
14
x
Number of Red Marbles
Number of Bananas
No. The ratio of the number of red marbles to the number of blue marbles in Julie’s bag is not equivalent to the ratio of the number of red marbles to the number of blue marbles in Tara’s bag. Julie has 12 red marbles for every 28 blue marbles. Tara has 12 red marbles for every 27 blue marbles.
Should the smoothies have the same flavor? Explain. No. The smoothies should not have the same flavor. The set of points for smoothie store A and the set of points for smoothie store B are not on the same line, and therefore they do not belong to the same ratio relationship.
254
Tara’s Marbles
y
2
0
© Great Minds PBC
EUREKA MATH2
6 ▸ M1 ▸ TC ▸ Lesson 12
Number of Blue Marbles
EUREKA MATH2
171
172
P R ACT I C E
© Great Minds PBC
© Great Minds PBC
EUREKA MATH2 6 ▸ M1 ▸ TC ▸ Lesson 12
EUREKA MATH2
6 ▸ M1 ▸ TC ▸ Lesson 12
3. Scott and Yuna are mixing fabric dyes. They each create their favorite shade of red dye by mixing scarlet red dye and cherry red dye. Do Scott and Yuna create the same shade of red dye? If yes, what is the ratio of the number of ounces of scarlet red dye to the number of ounces of cherry red dye they both use? If not, what are the ratios that each person uses?
4. The sixth grade art class makes candles. Students use 3 tablespoons of vanilla oil for every 2 pounds of wax to make the candles. Which representations correctly show the ratio relationship between the number of tablespoons of vanilla oil and the number of pounds of wax? Choose all that apply.
Scott’s Red Dye Number of Ounces of Scarlet Red Dye Number of Ounces of Cherry Red Dye
0
5
10
15
20
25
30
35
40
45
50
55
EUREKA MATH2
6 ▸ M1 ▸ TC ▸ Lesson 12
A.
60
0
Number of Tablespoons of Vanilla Oil
2
4
6
8
10
12
14
16
18
20
22
6
9 12 15 18
B. Number of Tablespoons of Vanilla Oil
Number of Pounds of Wax
Number of Pounds of Wax 0
3
0
24
4
2
6
5
5
5
5
5
8 10 12
Yuna’s Red Dye
0
9
40
18
60
27
80
36
100
C.
45
No. They do not create the same shade of red dye. The ratio of the number of ounces of scarlet red dye to the number of ounces of cherry red dye in Scott’s red dye is 20 : 8. The ratio of the number of ounces of scarlet red dye to the number of ounces of cherry red dye in Yuna’s red dye is 20 : 9.
© Great Minds PBC
P R ACT I C E
173
D.
6
Number of Tablespoons of Vanilla Oil
Number of Pounds of Wax
3
2
4
3
5
4
4 2
0
2
4
6
8
10
x
Number of Tablespoons of Vanilla Oil
E.
© Great Minds PBC
y
174
Number of Tablespoons of Vanilla Oil
Number of Pounds of Wax
6
4
12
8
18
12
P R ACT I C E
F.
y
Number of Pounds of Wax
Number of Ounces of Cherry Red Dye
20
Number of Pounds of Wax
Number of Ounces of Scarlet Red Dye
0
6 4 2
0
2
4
6
8
10
x
Number of Tablespoons of Vanilla Oil
© Great Minds PBC
255
EUREKA MATH2
6 ▸ M1 ▸ TC ▸ Lesson 12
EUREKA MATH2
6 ▸ M1 ▸ TC ▸ Lesson 12
5. Adesh’s recipe for tea calls for 4 tablespoons of milk in 3 cups of tea. Kelly’s recipe for tea calls for 7 tablespoons of milk in 5 cups of tea.
Remember For problems 6 and 7, divide.
a. Show the ratio relationship between the number of tablespoons of milk and the number of cups of tea in Adesh’s recipe. Create a graph, double number line, or table.
6. 8,448 ¸ 2
7. 1,272 ¸ 3
4,224
424
Sample: Number of Tablespoons of Milk Number of Cups of Tea
0
4
8
12
16
20
0
3
6
9
12
15
EUREKA MATH2
6 ▸ M1 ▸ TC ▸ Lesson 12
8. The table shows the ratio relationship between the number of ounces of raisins and the number of ounces of nuts in a trail mix recipe. ā. Complete the table.
b. Show the ratio relationship between the number of tablespoons of milk and the number of cups of tea in Kelly’s recipe. Create a graph, double number line, or table.
Number of Ounces of Raisins
Number of Ounces of Nuts
3
2
6
4
9
6
1
2 3
3 2
1
Sample: Number of Tablespoons of Milk
Number of Cups of Tea
7
5
14
10
21
15
c. Do Adesh’s recipe and Kelly’s recipe use the same ratio relationship between the number of tablespoons of milk and the number of cups of tea? Explain. No. The ratio of the number of tablespoons of milk to the number of cups of tea in Adesh’s recipe is not equivalent to the ratio of the number of tablespoons of milk to the number of cups of tea in Kelly’s recipe. Adesh uses 20 tablespoons of milk for 15 cups of tea. Kelly uses 21 tablespoons of milk for 15 cups of tea.
b. How many ounces of raisins are needed for every 1 ounce of nuts? For every 1 ounce of nuts, 3 ounces of raisins are needed. 2
c. How many ounces of nuts are needed for every 1 ounce of raisins? For every 1 ounce of raisins, 2 ounces of nuts are needed. 3
© Great Minds PBC
256
P R ACT I C E
175
176
P R ACT I C E
© Great Minds PBC
© Great Minds PBC
EUREKA MATH2 6 ▸ M1 ▸ TC ▸ Lesson 12
EUREKA MATH2
6 ▸ M1 ▸ TC ▸ Lesson 12
9. Which pair of statements accurately describes the ratio relationship shown in the table? Number of Cups of Flour
Number of Cups of Water
3
1
6
2
9
3
12
4
A. The ratio of the number of cups of flour to the number of cups of water is 1 : 2. For every 1 cup of flour, there are 2 cups of water. B. The ratio of the number of cups of flour to the number of cups of water is 1 : 3. For every 1 cup of flour, there are 3 cups of water. C. The ratio of the number of cups of flour to the number of cups of water is 3 : 1. For every 3 cups of flour, there is 1 cup of water. D. The ratio of the number of cups of flour to the number of cups of water is 3 : 6. For every 3 cups of flour, there are 6 cups of water.
© Great Minds PBC
© Great Minds PBC
P R ACT I C E
177
257
13
LESSON 13
Comparing Ratio Relationships, Part 1 Compare ratio relationships by using ratio tables.
EUREKA MATH2
6 ▸ M1 ▸ TC ▸ Lesson 13
EXIT TICKET Name
Date
13
Leo and Ryan each make salsa. The ratio tables show the relationship between the number of cups of tomatoes and the number of cups of spicy peppers in each of their salsas. Ryan’s Salsa
Leo’s Salsa
Lesson at a Glance In this lesson, students begin their comparisons of real-world ratio relationships by using a variety of visual tools, including pictorial representations and graphs. Next, students transition to making direct comparisons by using ratio tables. Students interpret and explain the real-world meaning of the comparisons.
Number of Cups of Tomatoes
Number of Cups of Spicy Peppers
Number of Cups of Tomatoes
Number of Cups of Spicy Peppers
9
2
20
4
• Why do we want to compare ratio relationships?
18
4
25
5
• What strategies can we use to compare ratio relationships?
27
6
30
6
36
8
35
7
Key Questions
Achievement Descriptor 6.Mod1.AD5 Compare ratio relationships by using various
Based on the tables, whose salsa should be spicier? Explain how you know. Based on the tables, Leo’s salsa should be spicier than Ryan’s salsa. Leo’s salsa has 18 cups of tomatoes for every 4 cups of spicy peppers. Ryan’s salsa has 20 cups of tomatoes for every 4 cups of spicy peppers. Leo’s salsa has fewer cups of tomatoes for every 4 cups of spicy peppers than Ryan’s salsa.
© Great Minds PBC
representations. (6.RP.A.3.a)
185
© Great Minds PBC
EUREKA MATH2 6 ▸ M1 ▸ TC ▸ Lesson 13
Agenda
Materials
Fluency
Teacher
Launch 5 min
• None
Learn 30 min
Students
• Comparing Smoothies
• None
• Using Ratio Tables to Compare Two Ratio Relationships
Lesson Preparation • None
• Using Parts and Wholes to Compare Two Ratio Relationships • Using Ratio Tables to Compare Three Ratio Relationships
Land 10 min
© Great Minds PBC
259
EUREKA MATH2
6 ▸ M1 ▸ TC ▸ Lesson 13
Fluency Compare Fractions Students compare fractions to prepare for identifying equivalent ratios. Directions: Compare the fractions by using <, >, or =. 1.
2.
3.
4.
1 5
3 5
1 3
1 5
1 4 2 5
< >
1 3
<
2 3
<
5.
6.
7.
8.
2 5
4 10
2 4
3 6
3 5 3 4
2 4 4 5
=
Teacher Note Instead of this lesson’s Fluency, consider administering the Compare Fractions Sprint. Directions for administration can be found in the Fluency resource.
A
= > <
Number Correct:
Compare the fractions by using <, >, or =. 1.
1 2
1 8
19.
2 9
2 3
2.
1 2
1 6
20.
2 9
2 5
3.
1 2
1 4
21.
2 9
2 7
4.
1 6
1 4
22.
2 9
2 10
5.
1 8
1 4
23.
6.
1 8
1 6
24.
7.
1 2
10
25.
8.
1 2
4 10
26.
9.
1 2
5
10
10.
1 2
10
11.
1 2
10
12.
1 3
13. 14.
3
7
27. 28.
8
9
8
8
13 8
9
11
8
10
9
8
9
6
11 5
6
5
9
6
6
4 6
9
29.
9
3
2 6
9
30.
4 9
1 3
1 3
4 9
31.
12
5
1 3
1 3
32.
5
9
12
2 3
15.
1 3
2 9
33.
12
7
2 3
16.
1 3
3
12
17.
1 3
4 12
18.
1 3
12
406
Launch
EUREKA MATH2
6 ▸ M1 ▸ Sprint ▸ Compare Fractions
9
8
3
6
34. 35. 36.
7
18 7
18 10
18
2 3 5
6
5
12
© Great Minds PBC
5
Students compare flavors of smoothies from a diagram. Display the four red, yellow, and blue smoothies. Tell students that each smoothie is made from strawberries, mangoes, and blueberries. Introduce the Which One Doesn’t Belong? routine. Present the four smoothies and invite students to study them. Give students 1 minute to find a category in which three of the smoothies belong, but a fourth smoothie does not. When time is up, invite students to explain their chosen categories and to justify why one item does not fit. 260
© Great Minds PBC
EUREKA MATH2 6 ▸ M1 ▸ TC ▸ Lesson 13
A.
B.
S
C.
S M
M B
D.
B
S S M
M
B
B
Sample: Smoothie A doesn’t belong because the amount of strawberries and the amount of mangoes appear to be the same. Smoothie B doesn’t belong because there appear to be equal amounts of strawberries, mangoes, and blueberries. Smoothie C doesn’t belong because the amount of strawberries and the amount of blueberries appear to be the same. Smoothie D doesn’t belong because the amount of strawberries appears to be greater than the amount of other fruit. Highlight students’ responses that emphasize reasoning with ratios. As students explain their solutions, look for opportunities to probe students’ thinking by using ratio terminology. Consider using the following prompts: • Which smoothies appear to have about 1 part strawberries for every 1 part mangoes? • Estimate the number of parts strawberries for every 1 part mangoes in smoothie C. • In which smoothie is the ratio of the amount of mangoes to the amount of blueberries approximately 2 : 1? While we can informally compare the ratios of the quantities of ingredients in the smoothies by using the diagram, we need more quantitative information to make precise and valid comparisons.
© Great Minds PBC
261
EUREKA MATH2
6 ▸ M1 ▸ TC ▸ Lesson 13
Today, we will look at how ratio tables can be used when comparing ratio relationships and answering questions such as “Which smoothie should have the strongest strawberry flavor?”
Learn Comparing Smoothies Students compare ratio relationships by using graphs. Display the graph that shows the ratio relationship between the number of cups of strawberries and the number of cups of bananas in smoothie A and smoothie B. Use the questions that follow to facilitate a discussion to compare smoothie A and smoothie B.
Smoothies
Number of Cups of Strawberries
y
Smoothie A
12 10 8
Smoothie B
6 4 2
0
1
2
3
4
5
6
7
8
9
10
11
12
13
14
x
Number of Cups of Bananas
Which smoothie would you choose to drink? Why? Sample: I would choose to drink smoothie B because it has more cups of bananas than smoothie A. So it should have a stronger banana flavor. 262
© Great Minds PBC
EUREKA MATH2 6 ▸ M1 ▸ TC ▸ Lesson 13
What is a ratio of the number of cups of strawberries to the number of cups of bananas in smoothie A? A ratio of the number of cups of strawberries to the number of cups of bananas in smoothie A is 3 : 2. What is a ratio of the number of cups of strawberries to the number of cups of bananas in smoothie B? A ratio of the number of cups of strawberries to the number of cups of bananas in smoothie B is 3 : 4. Ryan is making a smoothie with 1.5 cups of strawberries and 2 cups of bananas. Is he making smoothie A, smoothie B, or neither? Explain. Ryan is making smoothie B. The ratio of the number of cups of strawberries to the number of cups of bananas in Ryan’s smoothie is 1.5 : 2, which is equivalent to the ratio 3 : 4. Display the tables without numbers for smoothie A and smoothie B. Ask students the following question to transition from analyzing graphs to analyzing tables.
Smoothie A Number of Cups of Strawberries
Number of Cups of Bananas
Smoothie B Number of Cups of Strawberries
Number of Cups of Bananas
Would you expect any pair of numbers in the table for smoothie A to exactly match any pair of numbers in the table for smoothie B? No. I would not expect any pairs of numbers between the tables to match exactly because smoothies A and B use different ratios of the number of cups of strawberries to the number of cups of bananas. Tables that represent different ratio relationships do not have any pairs of numbers in common.
© Great Minds PBC
263
EUREKA MATH2
6 ▸ M1 ▸ TC ▸ Lesson 13
Using Ratio Tables to Compare Two Ratio Relationships Students compare two ratio relationships by using ratio tables. Let students know that they will now transition to comparing ratio relationships by using tables. Allow students several minutes to complete problems 1–3 in small groups. Circulate as students work, asking them which pairs of numbers in the tables are most useful for the question they are trying to answer and why. 1. Yuna and Tyler make lemonade. The tables show the ratio relationship between the number of cups of water and the number of tablespoons of lemon juice concentrate in each recipe. Yuna’s Recipe
Promoting the Standards for Mathematical Practice Students look for and make use of structure (MP7) when they compare lemonade recipes by comparing ratios represented in ratio tables. Ask the following questions to promote MP7:
Tyler’s Recipe
Number of Cups of Water
Number of Tablespoons of Lemon Juice Concentrate
Number of Cups of Water
Number of Tablespoons of Lemon Juice Concentrate
2
6
1
4
3
9
2
8
5
15
4
16
7
21
10
40
• How can you use what the two ratio tables have in common to help you compare the lemonade recipes? • How are the numbers of cups of water in the first table and the numbers of cups of water in the second table related? How can that help you compare the flavors of lemonade?
a. What is a ratio of the number of cups of water to the number of tablespoons of lemon juice concentrate in Yuna’s recipe? A ratio of the number of cups of water to the number of tablespoons of lemon juice concentrate in Yuna’s recipe is 2 : 6.
264
© Great Minds PBC
EUREKA MATH2 6 ▸ M1 ▸ TC ▸ Lesson 13
b. What is a ratio of the number of cups of water to the number of tablespoons of lemon juice concentrate in Tyler’s recipe? A ratio of the number of cups of water to the number of tablespoons of lemon juice concentrate in Tyler’s recipe is 1 : 4. c. Based on the tables, whose lemonade should have a stronger lemon flavor? How do you know? Tyler’s lemonade should have a stronger lemon flavor than Yuna’s lemonade. I know because Yuna’s lemonade has 6 tablespoons of lemon juice concentrate in 2 cups of water while Tyler’s lemonade has 8 tablespoons of lemon juice concentrate in 2 cups of water. 2. Store A and store B both sell oranges. The tables show the total cost in dollars and the number of pounds of oranges at each store. Store A
Store B
Number of Pounds of Oranges
Total Cost (dollars)
Number of Pounds of Oranges
Total Cost (dollars)
4
6
5
9
8
12
10
18
12
18
15
27
16
24
20
36
a. Does the table for store A represent a ratio relationship? Explain. Yes. The ratios 4 : 6, 8 : 12, 12 : 18, and 16 : 24 are all equivalent.
© Great Minds PBC
265
EUREKA MATH2
6 ▸ M1 ▸ TC ▸ Lesson 13
b. Does the table for store B represent a ratio relationship? Explain. Yes. The ratios 5 : 9, 10 : 18, 15 : 27, and 20 : 36 are all equivalent. c. Do the two tables represent the same ratio relationship? Explain. No. The relationship represented in the table for store A includes the ratio 12 : 18. The table for store B includes the ratio 10 : 18. Those are not equivalent ratios, so the tables do not represent the same ratio relationship. d. Which store charges more per 1 pound of oranges? Explain. Store B charges more per 1 pound of oranges. Store A charges $18.00 for 12 pounds of oranges and store B charges $18.00 for 10 pounds of oranges. 3. Lisa and Tara run laps at soccer practice. Both girls record the number of minutes they run laps in ratio tables.
Lisa
Tara
Number of Minutes
4
12
20
28
Number of Laps
2
6
10
14
Number of Minutes
2
8
14
20
Number of Laps
1
4
7
10
Who runs faster? Explain. Lisa and Tara run at the same speed. They both run 10 laps in 20 minutes. When most small groups have finished, bring students together. Direct students’ attention to problem 2. Ask a student to share their answers to parts (c) and (d). Use the student response to part (d) to discuss the meaning of a direct comparison.
266
Teacher Note Students may answer part (d) by using unit rate, but that thinking is not expected from students until later in the module.
Language Support Consider displaying a table from problem 1, 2, or 3 and highlighting rows or columns to show students how to use tables to make direct comparisons.
© Great Minds PBC
EUREKA MATH2 6 ▸ M1 ▸ TC ▸ Lesson 13
To determine which store charges more per pound of oranges, we make a direct comparison. To make a direct comparison, we find a number that is the same in either the left column or the right column of both tables. In this case, that number is 18, which is in the right column. At store A, you can buy 12 pounds of oranges for $18.00. At store B, you can only buy 10 pounds of oranges for $18.00. Select one or two students to share their solutions to problem 3. If possible, choose one student who used the common number of minutes to make a direct comparison and another student who used the common number of laps to make a direct comparison. Does it matter which pairs of numbers we use to make the direct comparison? Explain.
UDL: Representation After students share their solutions to problem 3, consider using a think-aloud to reinforce the decisions involved in making the direct comparison. Additionally, highlight 20 in each Number of Minutes row and 10 in each Number of Laps row. Follow a similar process for problem 2(d) if students would benefit from an additional think-aloud.
No. It does not matter which pairs of numbers we use. We can compare the speed of Lisa and Tara when they have both run for 20 minutes or when they have both run 10 laps.
Using Parts and Wholes to Compare Two Ratio Relationships Students compare two ratio relationships by using parts and wholes. Direct students’ attention to problem 4. Allow students a couple of minutes to complete the problem with a partner. As partners work, circulate to determine which pairs use the number of parts yellow dye to compare, which pairs use the number of parts red dye to compare, and which pairs use the total number of parts to compare. Be prepared to highlight each of these three solution methods when the class comes back together.
© Great Minds PBC
Differentiation: Support To support students’ understanding of how to use the tables to compare the ratio relationships, consider directing their attention to one of the columns to start.
267
EUREKA MATH2
6 ▸ M1 ▸ TC ▸ Lesson 13
4. Mr. Sharma’s class mixes dye to make tie-dye shirts. The class mixes yellow dye and red dye to make two different mixtures of orange dye. Which mixture should appear more yellow? Use the information in the tables to support your answer. Circle the table rows used to determine your answer.
Mixture A
Mixture B
Number of Parts Yellow Dye
Number of Parts Red Dye
Total Number of Parts
Number of Parts Yellow Dye
Number of Parts Red Dye
Total Number of Parts
3
5
8
5
7
12
6
10
16
10
14
24
9
15
24
15
21
36
12
20
32
20
28
48
15
25
40
25
35
60
18
30
48
30
42
72
21
35
56
35
49
84
Sample: Mixture B should appear more yellow than mixture A. In the tables, I can see that when both dyes have 35 parts red dye, mixture A only has 21 parts yellow dye while mixture B has 25 parts yellow dye.
268
© Great Minds PBC
EUREKA MATH2 6 ▸ M1 ▸ TC ▸ Lesson 13
When most pairs have finished, bring the class together. Display the tables for the mixtures from problem 4. Mixture A
Mixture B
Number of Parts Yellow Dye
Number of Parts Red Dye
Total Number of Parts
Number of Parts Yellow Dye
Number of Parts Red Dye
Total Number of Parts
3
5
8
5
7
12
6
10
16
10
14
24
9
15
24
15
21
36
12
20
32
20
28
48
15
25
40
25
35
60
18
30
48
30
42
72
21
35
56
35
49
84
Invite students who used different strategies to share their responses and their reasoning. Ask students to annotate the displayed tables by circling or highlighting the rows they used. Prompt them to explain why they used those rows. If students do not present all three solution methods, consider using one or more of the following questions: • What if the number of parts yellow dye is the same in both mixtures? Which rows in the tables show the same number of parts yellow dye? • What if the number of parts red dye is the same in both mixtures? Which rows in the tables show the same number of parts red dye? • What if the total number of parts is the same in both mixtures? Which rows in the tables show the same total number of parts? © Great Minds PBC
269
6 ▸ M1 ▸ TC ▸ Lesson 13
EUREKA MATH2
Summarize the orange dye problem by asking students to think–pair–share about the following questions. How are these tables different from the tables in problems 1 through 3? These tables have a third column that shows the total number of parts. Do we always have to use the first column or the first row of each table to make comparisons? Explain. No. We do not have to use the first column or the first row to make comparisons. There may be common numbers in the first column or the first row, but we can also look in other columns or rows to find common numbers. What are we looking for in tables when we compare two ratio relationships? Why is that a valid strategy for comparison? We’re looking for common numbers in each table, such as the same number of parts yellow dye in this problem or the same number of pounds of oranges in problem 2. That strategy is valid because if both numbers in the pairs of values are the same, then we can use them to write equivalent ratios. If only one number in the pairs of values is the same, like 15 : 25 and 15 : 21, then we cannot use them to write equivalent ratios. They are not part of the same ratio relationship.
Using Ratio Tables to Compare Three Ratio Relationships Students compare three ratio relationships by using ratio tables. Tell students that they will now compare three ratio relationships. Allow students to work on problem 5 in pairs or small groups. 5. Lacy, Riley, and Adesh each make orange and vanilla ice pops by using the same two ingredients. The tables show the number of cups of orange juice and the number of cups of vanilla yogurt used by each person.
270
© Great Minds PBC
EUREKA MATH2 6 ▸ M1 ▸ TC ▸ Lesson 13
Lacy’s Ice Pops
Riley’s Ice Pops
Adesh’s Ice Pops
Number of Cups of Orange Juice
Number of Cups of Vanilla Yogurt
Number of Cups of Orange Juice
Number of Cups of Vanilla Yogurt
Number of Cups of Orange Juice
Number of Cups of Vanilla Yogurt
10
12
4
6
3
4
20
24
8
12
6
8
30
36
12
18
9
12
Differentiation: Challenge For students who finish the problems early, consider providing the following problem. Julie uses 12 cups of orange juice and 18 cups of vanilla yogurt to make ice pops. When she rereads her recipe, she discovers that the ingredients are supposed to be mixed in a ratio of 3 cups of orange juice to 5 cups of vanilla yogurt. How many cups of vanilla yogurt should Julie add so that the ingredients are in the correct ratio?
Based on the tables, order the ice pops from the one that should have the strongest orange flavor to the one that should have the weakest orange flavor. Explain how you used the numbers in the tables to determine the order. Lacy, Adesh, Riley. For 12 cups of vanilla yogurt, Lacy’s ice pops have 10 cups of orange juice, Adesh’s ice pops have 9 cups of orange juice, and Riley’s ice pops have 8 cups of orange juice.
Land Debrief 5 min Objective: Compare ratio relationships by using ratio tables. Direct students’ attention to the tables in problem 2. Facilitate a class discussion by asking the following questions and encouraging students to build on or restate one another’s thoughts.
© Great Minds PBC
271
EUREKA MATH2
6 ▸ M1 ▸ TC ▸ Lesson 13
Why do we want to compare ratio relationships? Comparing ratio relationships can be useful when trying to decide which recipe’s ingredients create a stronger flavor or which paint mixture is a darker shade. Use an example from today’s lesson to describe the strategy we used to compare ratio relationships. Sample: We made a direct comparison when comparing the cost of oranges at store A and store B. Store A charges $18.00 for 12 pounds of oranges, while store B charges $18.00 for 10 pounds of oranges. When using ratio tables to compare two ratio relationships, do you think we will always be able to make a direct comparison? Sample: No, I do not think we will always be able to make a direct comparison. If there are no common numbers in corresponding rows or columns of the tables, we cannot make a direct comparison. Pose the following question to prompt students’ thinking about the learning in the next lesson, where the ratio tables they compare will not have common numbers to make a direct comparison. Note that students may not yet be able to answer this question, but it is useful for them to consider it. If you are not able to make a direct comparison, what could you try? We could try extending the tables until we are able to make a direct comparison. We could use multiplication or division as necessary to find additional pairs of numbers that allow us to make a direct comparison. We could find an additional pair of numbers in each table in which one number is 1 and compare the ratios of those pairs of numbers.
Exit Ticket 5 min Provide up to 5 minutes for students to complete the Exit Ticket. It is possible to gather formative data even if some students do not complete every problem.
272
Teacher Note Assign the Practice problems for completion outside of class or use them in class if time remains after the lesson. Refer students to the Recap for support.
© Great Minds PBC
EUREKA MATH2 6 ▸ M1 ▸ TC ▸ Lesson 13
Recap
EUREKA MATH2
6 ▸ M1 ▸ TC ▸ Lesson 13
RECAP Name
Date
13
EUREKA MATH2
6 ▸ M1 ▸ TC ▸ Lesson 13
2. Tyler and Eddie each make homemade raspberry jam by mixing raspberries with sugar. Tyler’s Jam
Eddie’s Jam
Number of Ounces of Raspberries
Number of Ounces of Sugar
Number of Ounces of Raspberries
Number of Ounces of Sugar
8
3
4
2
Examples
16
6
10
5
1. Riley and Noah each make their own slime by using glue and shaving cream. Shaving cream makes slime puffy, and glue makes slime sticky. The graph shows the ratio relationship between the number of cups of glue and the number of cups of shaving cream in Riley’s slime. The table shows the ratio relationship between the number of cups of glue and the number of cups of shaving cream in Noah’s slime.
24
9
12
6
Comparing Ratio Relationships, Part 1 In this lesson, we •
made direct comparisons between graphs and ratio tables to compare ratio relationships.
Both tables have a row that shows the number of ounces of raspberries mixed with 6 ounces of sugar. Tyler’s jam has more ounces of raspberries than Eddie’s jam for the same number of ounces of sugar.
Whose slime should be puffier? Explain.
Number of Cups of Shaving Cream
Noah’s Slime
Riley’s Slime
y 14
Number of Cups of Glue
Number of Cups of Shaving Cream
12
3
7
10
6
14
8
9
21
a. Describe the ratio relationship between the number of ounces of raspberries and the number of ounces of sugar in Tyler’s jam. Tyler’s jam has 8 ounces of raspberries for every 3 ounces of sugar.
b. Describe the ratio relationship between the number of ounces of raspberries and the number of ounces of sugar in Eddie’s jam. Eddie’s jam has 4 ounces of raspberries for every 2 ounces of sugar.
6 4 2
0
2
4
6
8
x
c. Based on the tables, whose jam should have a stronger raspberry flavor? Explain.
Look for a common quantity, such as 6 cups of glue, that you can use to make a direct comparison.
Tyler’s jam should have a stronger raspberry flavor than Eddie’s jam. Tyler’s jam has 16 ounces of raspberries for every 6 ounces of sugar while Eddie’s jam only has 12 ounces of raspberries for every 6 ounces of sugar.
Number of Cups of Glue
Riley’s slime should be puffier than Noah’s slime. Riley’s slime has 15 cups of shaving cream for 6 cups of glue while Noah’s slime has 14 cups of shaving cream for 6 cups of glue. © Great Minds PBC
© Great Minds PBC
187
188
RECAP
© Great Minds PBC
273
EUREKA MATH2
6 ▸ M1 ▸ TC ▸ Lesson 13
Sample Solutions Expect to see varied solution paths. Accept accurate responses, reasonable explanations, and equivalent answers for all student work.
EUREKA MATH2
6 ▸ M1 ▸ TC ▸ Lesson 13
PRACTICE Name
Date
13
1. The graph shows the ratio relationship between the number of lemons and the number of cups of water in the recipe for lemonade A. The recipe for lemonade B calls for 1 lemon for every 2 1 cups of water. 2
b. Based on the graph and the table, should one lemonade have a stronger lemon flavor than the other? Explain how you know. No. Both lemonades should have the same flavor. In each recipe, the ratio of the number of lemons to the number of cups of water is 2 : 5. 2. Tara and Noah each make strawberry yogurt by mixing plain yogurt with strawberry jam.
Lemonade A
y
Tara’s Strawberry Yogurt
Number of Cups of Water
14 12 10 8 6 4 2 0
2
4
6
8
10
12
x
Number of Lemons
a. Complete the ratio table for lemonade B.
274
Noah’s Strawberry Yogurt
Number of Tablespoons of Jam
Number of Cups of Plain Yogurt
Number of Tablespoons of Jam
Number of Cups of Plain Yogurt
4
2
5
3
8
4
10
6
12
6
15
9
16
8
20
12
20
10
25
15
a. Describe the ratio relationship between the number of tablespoons of jam and the number of cups of plain yogurt in Tara’s strawberry yogurt.
Lemonade B
© Great Minds PBC
EUREKA MATH2
6 ▸ M1 ▸ TC ▸ Lesson 13
Number of Lemons
Number of Cups of Water
1
2 12
2
5
3
7 12
4
10
Tara’s strawberry yogurt has 2 tablespoons of jam for every 1 cup of plain yogurt. b. Describe the ratio relationship between the number of tablespoons of jam and the number of cups of plain yogurt in Noah’s strawberry yogurt. Noah’s strawberry yogurt has 5 tablespoons of jam for every 3 cups of plain yogurt. c. Based on the tables, whose strawberry yogurt should have a stronger strawberry flavor? Explain. Tara’s strawberry yogurt should have a stronger strawberry flavor than Noah’s strawberry yogurt. Tara’s yogurt uses 10 cups of plain yogurt for every 20 tablespoons of jam. Noah’s yogurt uses 12 cups of plain yogurt for every 20 tablespoons of jam.
189
190
P R ACT I C E
© Great Minds PBC
© Great Minds PBC
EUREKA MATH2 6 ▸ M1 ▸ TC ▸ Lesson 13
EUREKA MATH2
6 ▸ M1 ▸ TC ▸ Lesson 13
3. Cans A and B are filled with pink paint. The ratio tables show the relationship between the number of parts white paint and the number of parts red paint in each can.
4. The ratio tables show the relationship between the number of ounces of coconut oil and the number of ounces of olive oil in two different soaps. a. Complete both ratio tables.
Can B
Can A
EUREKA MATH2
6 ▸ M1 ▸ TC ▸ Lesson 13
Number of Parts White Paint
Number of Parts Red Paint
Number of Parts White Paint
Number of Parts Red Paint
7
4
8
5
14
8
16
10
21
12
24
28
16
35
20
Soap 1
Soap 2
Number of Ounces of Coconut Oil
Number of Ounces of Olive Oil
Total Number of Ounces of Oil
Number of Ounces of Coconut Oil
Number of Ounces of Olive Oil
Total Number of Ounces of Oil
15
3
4
7
4
6
10
32
20
9
12
21
8
12
20
40
25
12
16
28
12
18
30
30
40
70
28
42
70
Based on the ratio tables, which can is filled with paint that should look redder? Explain. The paint in can B should look redder than the paint in can A. Can A has 35 parts white paint for every 20 parts red paint. Can B only has 32 parts white paint for every 20 parts red paint.
b. What is the ratio of the number of ounces of coconut oil to the number of ounces of olive oil in soap 1? The ratio of the number of ounces of coconut oil to the number of ounces of olive oil in soap 1 is 3 : 4. c. What is the ratio of the number of ounces of coconut oil to the number of ounces of olive oil in soap 2? The ratio of the number of ounces of coconut oil to the number of ounces of olive oil in soap 2 is 4 : 6. d. Coconut oil produces more bubbles in soap than olive oil. Based on the ratio tables, which soap should have more bubbles? Explain. Soap 1 should have more bubbles than soap 2. For a total of 70 ounces of oil, soap 1 has 30 ounces of coconut oil, and soap 2 only has 28 ounces of coconut oil.
© Great Minds PBC
© Great Minds PBC
P R ACT I C E
191
192
P R ACT I C E
© Great Minds PBC
275
EUREKA MATH2
6 ▸ M1 ▸ TC ▸ Lesson 13
EUREKA MATH2
6 ▸ M1 ▸ TC ▸ Lesson 13
e. Adesh reasons that soap 1 should have more bubbles than soap 2. For every 12 ounces of olive oil, soap 1 has 9 ounces of coconut oil while soap 2 only has 8 ounces of coconut oil. Sana reasons that soap 1 should have more bubbles than soap 2. For every 70 ounces of oil, soap 1 has 30 ounces of coconut oil while soap 2 only has 28 ounces of coconut oil. Which statement is true? A. Only Adesh’s reasoning is correct. B. Only Sana’s reasoning is correct. C. Both Adesh’s and Sana’s reasoning are correct. D. Neither Adesh’s nor Sana’s reasoning is correct.
Remember For problems 5 and 6, divide.
5. 2,405 ¸ 5
6. 9,642 ¸ 3
481
3,214
7. Kayla and Yuna have the same amount of money. After Kayla spends $24.00, the ratio of the amount of money in dollars Kayla has to the amount of money in dollars Yuna has is 5 : 8. How much money does Kayla have now?
$40.00 For problems 8 and 9, complete the tables by converting each measurement to the given unit. 8.
Number of Inches
480
2
24
600
8
96
Number of Seconds
8 10
© Great Minds PBC
276
Number of Feet
Number of Minutes
9.
P R ACT I C E
193
© Great Minds PBC
14
LESSON 14
Comparing Ratio Relationships, Part 2 Compare ratio relationships by creating equivalent ratios.
EUREKA MATH2
6 ▸ M1 ▸ TC ▸ Lesson 14
Name
Date
EXIT TICKET
14
Café A and café B each have a hot cocoa recipe. The ratio tables show the relationship between the number of tablespoons of cocoa powder and the number of ounces of milk in each café’s recipe. Café A
Café B
Number of Tablespoons of Cocoa Powder
Number of Ounces of Milk
Number of Tablespoons of Cocoa Powder
Number of Ounces of Milk
2
9
3
11
4
18
9
33
6
27
15
55
In this lesson, students encounter ratio tables that do not allow for direct comparison. In pairs, they explore how to identify common factors and multiples to find ratios that allow for direct comparison. Students conclude by participating in a Take a Stand routine, where they examine ratio tables that share no common factors or multiples. Students use familiar tools and strategies to compare the ratio relationships and justify their reasoning.
Key Question • When we cannot make a direct comparison between two ratios, what strategies can we use to compare ratio relationships?
Based on the tables, which café’s hot cocoa should have a stronger cocoa flavor? How did you determine your answer? Café B’s hot cocoa should have a stronger cocoa flavor than café A’s hot cocoa. I can use addition patterns in the table to find that café B uses 6 tablespoons of cocoa powder with 22 ounces of milk. Café A uses 6 tablespoons of cocoa powder with 27 ounces of milk. So café B’s hot cocoa should have a stronger cocoa flavor than café A’s hot cocoa.
© Great Minds PBC
Lesson at a Glance
Achievement Descriptor 6.Mod1.AD5 Compare ratio relationships by using various
representations. (6.RP.A.3.a)
199
© Great Minds PBC
EUREKA MATH2 6 ▸ M1 ▸ TC ▸ Lesson 14
Agenda
Materials
Fluency
Teacher
Launch 5 min
• Paper (3 sheets)
Learn 30 min
• Tape
• Flour Mixtures
Students
• Tiles
• None
Land 10 min
Lesson Preparation • Use the paper to prepare three signs. Hang the signs around the room. Label the signs as follows: • Floor design A is bluer. • Floor design B is bluer. • Floor designs A and B are the same.
© Great Minds PBC
279
EUREKA MATH2
6 ▸ M1 ▸ TC ▸ Lesson 14
Fluency Compare Ratios Students compare ratio relationships by using direct comparison of ratio tables to prepare for comparing ratio relationships by using other methods. Directions: For each pair of tables shown, determine which lemonade should have a stronger lemon flavor. Lemonade A
Lemonade B
Number of Cups of Water
Number of Lemons
Number of Cups of Water
Number of Lemons
1
3
1
5
Lemonade A
Lemonade B
Number of Cups of Water
Number of Lemons
Number of Cups of Water
Number of Lemons
5
7
6
7
Lemonade A
Lemonade A
Lemonade B
Number of Cups of Water
Number of Lemons
Number of Cups of Water
Number of Lemons
1 3
2
1 4
2
280
Lemonade B
Lemonade B
© Great Minds PBC
EUREKA MATH2 6 ▸ M1 ▸ TC ▸ Lesson 14
Launch
5
Students compare ticket prices and debate who pays less.
AD O MI NE T
Display the following situation and read it aloud to students.
T MI EIT DD M AA N O NE O
IT ADM E ON
$30.00
$50.00
Dylan purchases 3 theater tickets for a total of $30.00. A week later, Sana purchases 6 theater tickets for the same performance for a total of $50.00. Who pays less for the theater tickets? Explain. This prompt is intentionally structured to invite debate. Some students may claim that Dylan pays less than Sana because $30.00 is less than $50.00. Others may notice that 3 tickets would cost Sana only $25.00. Therefore, she pays less than Dylan. Allow students to freely share their thoughts, and do not indicate any correct answer. Today, we will use familiar tools and strategies to compare ratios that are represented in ratio tables.
Learn Flour Mixtures Students generate an equivalent ratio to compare ratio relationships. Direct students’ attention to problem 1. Read the prompt aloud, and then ask students to think–pair–share about the following questions. © Great Minds PBC
281
EUREKA MATH2
6 ▸ M1 ▸ TC ▸ Lesson 14
How are these ratio tables different from the ratio tables we looked at in the last lesson? The first columns of the ratio tables don’t have any numbers in common. The second columns of the ratio tables don’t have any numbers in common either. So I can’t make a direct comparison between ratios in each recipe. How can we find additional ratios in each relationship? We can multiply or divide each number in a row by the same number to create equivalent ratios. Consider what equivalent ratios might be useful as you extend one or both of the tables to find a ratio that you can use to compare the relationships. Allow students to work in pairs on problem 1. As partners work, circulate and look for a variety of equivalent ratios that students generate to compare the flour mixtures. 1. Two restaurants use different flour mixtures in their pancake batter recipes. The ratio tables show the relationship between the number of cups of flour and the number of tablespoons of salt in the mixtures. Restaurant A
Restaurant B
Number of Cups of Flour
Number of Tablespoons of Salt
Number of Cups of Flour
Number of Tablespoons of Salt
27
18
22
11
30
20
24
12
33
22
26
13
Which restaurant’s flour mixture is saltier? Explain. Sample: Restaurant A’s flour mixture is saltier than restaurant B’s flour mixture because for 22 tablespoons of salt, there are 33 cups of flour. At restaurant B, for 22 tablespoons of salt, there are 44 cups of flour. 282
© Great Minds PBC
EUREKA MATH2 6 ▸ M1 ▸ TC ▸ Lesson 14
Once most students have finished, invite several pairs of students to respond to the following prompts. Which restaurant has the saltier flour mixture? Restaurant A’s flour mixture is saltier than restaurant B’s flour mixture. What is a ratio of the number of cups of flour to the number of tablespoons of salt in restaurant A’s flour mixture? In restaurant B’s flour mixture? In restaurant A’s flour mixture, the ratio of the number of cups of flour to the number of tablespoons of salt is 27 : 18. In restaurant B’s flour mixture, the ratio of the number of cups of flour to the number of tablespoons of salt is 22 : 11. How did you and your partner determine that restaurant A’s flour mixture is saltier than restaurant B’s flour mixture? We created the equivalent ratio 44 : 22 from the first pair of numbers in the table for restaurant B’s flour mixture. Then we compared that ratio with the ratio 33 : 22, which is represented by the third pair of numbers in the table for restaurant A’s flour mixture. We determined that restaurant A’s flour mixture is saltier than restaurant B’s flour mixture because it has fewer cups of flour for 22 tablespoons of salt than restaurant B’s flour mixture.
Teacher Note One common error students make is comparing entries that have the same numeric value but that do not represent the same quantity. In this case, students may attempt to compare the entry of 22 tablespoons of salt from the table for restaurant A to the entry of 22 cups of flour from the table for restaurant B. Be sure to correct this misconception as it arises. Explain to students that the matching entry they choose to compare must represent the same quantity.
We created the equivalent ratio 6 : 4 from the second pair of numbers in the table for restaurant A’s flour mixture. Then we compared that ratio with the ratio 6 : 3, which is represented by the second pair of numbers in the table for restaurant B’s flour mixture. Then we compared the number of tablespoons of salt to determine that restaurant A’s flour mixture is saltier than restaurant B’s flour mixture. We created the equivalent ratio 90 : 60 from the second pair of numbers in the table for restaurant A’s flour mixture, and we created the equivalent ratio 120 : 60 from the second pair of numbers in the table for restaurant B’s flour mixture. Then we compared the numbers of cups of flour to determine that restaurant A’s flour mixture is saltier than restaurant B’s flour mixture. Tell students to complete problem 2 independently. Circulate as students work, and encourage them to look for efficient ways to compare the two relationships.
© Great Minds PBC
283
EUREKA MATH2
6 ▸ M1 ▸ TC ▸ Lesson 14
2. Beekeepers add sugar water to the diet of honeybees. In the spring, the sugar water mixture helps promote colony growth. In the fall, the sugar water mixture helps the bees survive. The ratio tables show the number of cups of water and the number of cups of sugar in the spring sugar water mixture and in the fall sugar water mixture. Spring Sugar Water Mixture
Fall Sugar Water Mixture
Number of Cups of Sugar
Number of Cups of Water
Number of Cups of Sugar
Number of Cups of Water
15
10
14
7
UDL: Engagement As students work, offer feedback that focuses attention on students’ effort and strategy use. For example, recognize students for • multiplying or dividing each number in a row by the same number to create a new ratio, • extending one or both of the tables to find a ratio that can be used to compare the relationships, • finding common factors, or
18
12
32
16
• using a multiple.
27
18
42
21
If students are not applying strategies, ask questions to prompt their use:
Based on the tables, which sugar water mixture is sweeter? Explain. Sample: The fall sugar water mixture is sweeter than the spring sugar water mixture. I used the ratios of the numbers from the first row of each table to find equivalent ratios that both use 70 cups of water. For 70 cups of water, the spring sugar water mixture uses 105 cups of sugar and the fall sugar water mixture uses 140 cups of sugar. Once most students are finished, lead a class debrief by using the following prompt. How did you determine which sugar water mixture is sweeter? I created an equivalent ratio from the first pair of numbers in each table to compare matching quantities. I found the ratio 105 : 70 for the spring sugar water mixture and the ratio 140 : 70 for the fall sugar water mixture. Because the fall sugar water mixture uses more sugar than the spring sugar water mixture for the same amount of water, the fall sugar water mixture is sweeter. I created the equivalent ratio 6 : 4 from the second pair of numbers in the table for the spring sugar water mixture. I created the equivalent ratio 6 : 3 from the third pair of numbers in the table for the fall sugar water mixture. Because the fall sugar water 284
• Does this problem look similar to other problems we have solved so far? • How did we solve those problems?
Teacher Note Some students may have found the number of cups of sugar for 1 cup of water. They will explore that strategy further in lesson 15 and learn the term value of the ratio to describe A the value B for the ratio A : B. Accept any valid reasoning that students use to compare ratio relationships, including finding the value of the ratio. However, anticipate that many students may need time to gain familiarity with the strategy of comparing one matching quantity between two ratio relationships before being prepared to move on to more efficient methods.
© Great Minds PBC
EUREKA MATH2 6 ▸ M1 ▸ TC ▸ Lesson 14
mixture uses less water than the spring sugar water mixture for the same amount of sugar, the fall sugar water mixture is sweeter.
Tiles Students generate equivalent ratios from a pair of numbers in each ratio table to compare ratio relationships. Introduce the Take a Stand routine to the class. Draw students’ attention to the signs hanging in the classroom: Floor design A is bluer, Floor design B is bluer, Floor designs A and B are the same. Present problem 3 and invite students to stand beside the sign that best describes their thinking. 3. A flooring company offers two different designs that each use white square tiles and blue square tiles. All of the tiles are the same size. The ratio tables show the number of white tiles and the number of blue tiles needed for each design. Floor Design A
Floor Design B
Number of White Tiles
Number of Blue Tiles
Number of White Tiles
Number of Blue Tiles
20
30
15
35
40
60
45
105
Differentiation: Support As needed, consider encouraging students to use familiar strategies and tools such as double number lines or extending one table to find a quantity that is not included.
Based on the tables, which floor design should appear bluer? Explain. Sample: Floor design B should appear bluer than floor design A. I can make an equivalent ratio for each relationship that uses 60 white tiles. I discover that floor design A uses 90 blue tiles for 60 white tiles and that floor design B uses 140 blue tiles for 60 white tiles. Because floor design B will have more blue tiles than floor design A for the same number of white tiles, floor design B should appear bluer than floor design A. © Great Minds PBC
285
EUREKA MATH2
6 ▸ M1 ▸ TC ▸ Lesson 14
When all students are standing near a sign, allow 1 minute for groups to discuss the reasons why they chose that sign. Then call on each group to share reasons for their selection. Invite students who change their minds during the discussion to join a different group. Have students return to their seats. As a class, reflect on the efficiency of the methods shared. Have students complete problem 4 independently. As they work, circulate and observe strategies that students use. Look for students who find the number of black squares that are used for every 1 gold square. 4. The same flooring company offers two different designs that each use gold square tiles and black square tiles. All of the tiles are the same size. The ratio tables show the number of gold tiles and number of black tiles needed for each design. Floor Design Y
Promoting the Standards for Mathematical Practice When students take a stand and decide which floor design appears bluer, and then listen to their classmates justify why they made their choice, they are constructing viable arguments and critiquing the reasoning of others (MP3). Ask the following questions to promote MP3: • Why does your strategy work? Convince classmates who made a different choice than you. • What questions can you ask a classmate who made a different choice to make sure you understand the classmate’s reasoning?
Floor Design Z
Number of Gold Tiles
Number of Black Tiles
Number of Gold Tiles
Number of Black Tiles
13
52
16
48
18
72
20
60
Based on the tables, which floor design should appear more gold? Explain. Sample: Floor design Z should appear more gold than floor design Y. I can make an equivalent ratio for each relationship that uses 1 gold tile. The ratio of the number of gold tiles to the number of black tiles for floor design Z is 1 : 3, and the ratio of the number of gold tiles to the number of black tiles for floor design Y is 1 : 4. Because floor design Z will have fewer black tiles than floor design Y for the same number of gold tiles, floor design Z should appear more gold than floor design Y.
286
© Great Minds PBC
EUREKA MATH2 6 ▸ M1 ▸ TC ▸ Lesson 14
As students finish, encourage them to turn and talk to a partner about their work and solution. Use any or all of the following questions to engage students in a whole class discussion. • How did you determine which floor design should appear more gold? • Did you try a new or different strategy this time? • How can we determine the number of black tiles used for every 1 gold tile? • Is it helpful to know the number of black tiles used for every 1 gold tile? How? • Which strategy might you try for the next problem like this?
Land Debrief 5 min Objective: Compare ratio relationships by creating equivalent ratios. Facilitate a class discussion by using the following prompts. Encourage students to turn and talk or build upon one another’s responses. How did we use equivalent ratios to compare ratio relationships today? We created an equivalent ratio for each ratio relationship. We made one of the quantities in those ratios match so that we could compare the ratio relationships. Describe another way we compared ratio relationships today. We created an equivalent ratio for each ratio relationship where one number in each of those ratios was 1. In this case, the matching quantity in each ratio is 1 unit, and we compared the other quantities in the ratios. Reflect on problem 4. How is finding the number of black tiles for every 1 gold tile the same as finding matching quantities to compare? When finding the number of black tiles for every 1 gold tile, we are making it very easy to compare the ratio relationships because we know the ratio that uses the quantity
© Great Minds PBC
287
EUREKA MATH2
6 ▸ M1 ▸ TC ▸ Lesson 14
of 1 gold tile for each relationship. Sometimes, doing this is easier than using factors or multiples, which may be hard to find.
Exit Ticket 5 min Provide up to 5 minutes for students to complete the Exit Ticket. It is possible to gather formative data even if some students do not complete every problem.
288
Teacher Note Assign the Practice problems for completion outside of class or use them in class if time remains after the lesson. Refer students to the Recap for support.
© Great Minds PBC
EUREKA MATH2 6 ▸ M1 ▸ TC ▸ Lesson 14
Recap
EUREKA MATH2
6 ▸ M1 ▸ TC ▸ Lesson 14
RECAP Name
Date
6 ▸ M1 ▸ TC ▸ Lesson 14
14
b. Julie’s recipe for orange juice calls for 1 cup of orange concentrate for every 2 cups of water. Whose orange juice should have the strongest orange flavor: Sana’s, Ryan’s, or Julie’s? How do you know? To compare ratios, we need the ratios to have Sana’s orange juice should have the a matching quantity. For Julie’s recipe, multiply strongest orange flavor. For Julie’s recipe, each number in the ratio 1 : 2 by 12 to create I can multiply each number in the ratio the equivalent ratio 12 : 24. This way, all three 1 : 2 by 12 to find that for 12 cups of ratios have a matching quantity of 12 cups orange concentrate, Julie uses 24 cups of water. For 12 cups of orange concentrate, of orange concentrate. Ryan uses 30 cups of water, Sana uses 18 cups of water, and Julie uses 24 cups of water. Sana uses the fewest cups of water for 12 cups of orange concentrate, so her orange juice has the strongest orange flavor.
Comparing Ratio Relationships, Part 2 In this lesson, we •
created equivalent ratios to compare ratio relationships.
Example The tables show the ratio relationship between the number of cups of orange concentrate and the number of cups of water for Ryan’s and Sana’s orange juice recipes. Ryan’s Recipe
EUREKA MATH2
Sana’s Recipe
Number of Cups of Orange Concentrate
Number of Cups of Water
Number of Cups of Orange Concentrate
Number of Cups of Water
5
12.5
4
6
6
15
8
12
7
17.5
9
13.5
a. Based on the tables, whose orange juice should have a stronger orange flavor? Explain how you know. Sana’s orange juice should have a stronger orange flavor than Ryan’s orange juice.
When the ratios represented in the tables have no matching quantities to compare, create equivalent ratios for one or both ratio tables. In this case, the 6 cups of orange concentrate in Ryan’s recipe and the 4 cups of orange concentrate in Sana’s recipe can each be multiplied by a number to create a matching quantity of 12 cups of orange concentrate.
For Ryan’s recipe, I can multiply each number in the ratio 6 : 15 by 2 to find that for 12 cups of orange concentrate, Ryan uses 30 cups of water. For Sana’s recipe, I can multiply each number in the ratio 4 : 6 by 3 to find that for 12 cups of orange concentrate, Sana uses 18 cups of water. Because Sana uses fewer cups of water for 12 cups of orange concentrate, her orange juice should have the stronger orange flavor. © Great Minds PBC
© Great Minds PBC
201
202
RECAP
© Great Minds PBC
289
EUREKA MATH2
6 ▸ M1 ▸ TC ▸ Lesson 14
Sample Solutions Expect to see varied solution paths. Accept accurate responses, reasonable explanations, and equivalent answers for all student work.
EUREKA MATH2
6 ▸ M1 ▸ TC ▸ Lesson 14
PRACTICE Name
Date
14
2. On a long trip, two bus drivers keep track of the number of miles they travel and the number of hours they travel. Bus Driver A
1. Blake and Jada each keep track of the total amount of money they earn for mowing lawns. Blake Number of Lawns Mowed
Jada Total Amount Earned
Number of Lawns Mowed
2
$50.00
3
$90.00
4
$100.00
5
$150.00
6
$150.00
7
$210.00
8
$200.00
9
$270.00
EUREKA MATH2
6 ▸ M1 ▸ TC ▸ Lesson 14
Total Amount Earned
Bus Driver B
Number of Miles
Number of Hours
Number of Miles
Number of Hours
310
5
390
6
434
7
520
8
558
9
650
10
a. Based on the table, how many miles can bus driver A travel in 10 hours? Explain how you know. Bus driver A can travel 620 miles. I can multiply each number in the ratio 310 : 5 by 2 to find the equivalent ratio of 620 : 10. So bus driver A can travel 620 miles in 10 hours.
a. How much money does Jada earn for mowing 6 lawns? Explain how you know. Jada earns $180.00 for mowing 6 lawns. I can multiply each number in the ratio 3 : 90 by 2 to find that Jada earns $180.00 for mowing 6 lawns.
b. Which bus driver travels more miles each hour? Explain how you know. Bus driver B travels more miles each hour than bus driver A. Bus driver B travels 650 miles in 10 hours, but bus driver A only drives 620 miles in 10 hours.
b. Who earns more money for each lawn mowed? Explain how you know. Jada earns more money for each lawn mowed than Blake. Jada earns $180.00 for mowing 6 lawns, and Blake only earns $150.00 for mowing 6 lawns.
© Great Minds PBC
290
203
204
P R ACT I C E
© Great Minds PBC
© Great Minds PBC
EUREKA MATH2 6 ▸ M1 ▸ TC ▸ Lesson 14
EUREKA MATH2
6 ▸ M1 ▸ TC ▸ Lesson 14
3. The tables show the ratio relationship between the number of cups of sugar and the number of lemons for Lisa’s and Yuna’s lemonade recipes. Lisa’s Recipe
EUREKA MATH2
6 ▸ M1 ▸ TC ▸ Lesson 14
4. Riley mixes paint to paint pumpkins. The ratio table shows the number of drops of blue paint and the number of drops of white paint that Riley mixes.
Yuna’s Recipe
Riley’s Pumpkin Paint
Number of Cups of Sugar
Number of Lemons
Number of Cups of Sugar
Number of Lemons
Number of Drops of Blue Paint
Number of Drops of White Paint
1
2
4
5
15
3
2
4
5
6.25
60
12
3
6
6
7.5
75
15
a. Based on the tables, whose lemonade should have a stronger lemon flavor? Explain how you know.
a. If Riley uses 1 drop of white paint, how many drops of blue paint does she use?
5
Lisa’s lemonade should have a stronger lemon flavor than Yuna’s lemonade. I can create an equivalent ratio of 6 : 12 by multiplying each number in the third row of the table for Lisa’s recipe by 2. Lisa’s recipe uses 6 cups of sugar with 12 lemons. Yuna’s recipe uses 6 cups of sugar with 7.5 lemons. Lisa’s recipe uses more lemons for the same amount of sugar. So Lisa’s lemonade should have a stronger lemon flavor than Yuna’s lemonade.
b. Write a ratio of the number of drops of blue paint to the number of drops of white paint that would make a darker shade of blue than Riley’s paint. Sample: 20 : 3 c. Write a ratio of the number of drops of blue paint to the number of drops of white paint that would make a lighter shade of blue than Riley’s paint. Sample: 50 : 12
b. Each girl has exactly 3 lemons to make lemonade. How many cups of sugar does each girl need?
Remember
1
Lisa needs 1 cups of sugar for exactly 3 lemons. Yuna needs 2 2 cups of sugar for 5 2 exactly 3 lemons.
© Great Minds PBC
© Great Minds PBC
P R ACT I C E
For problems 5 and 6, divide.
205
5. 3,744 ¸ 6
6. 7,389 ¸ 9
624
821
206
P R ACT I C E
© Great Minds PBC
291
EUREKA MATH2
6 ▸ M1 ▸ TC ▸ Lesson 14
EUREKA MATH2
6 ▸ M1 ▸ TC ▸ Lesson 14
7. The table shows the number of minutes and the number of miles that Toby rides his bike. The graph shows the number of minutes and the number of miles that Kelly rides his bike. Do the table and the graph represent the same ratio relationship? Explain how you know. Toby’s Bike Ride Number of Miles
15
3
30
6
60
12
90
18
10
8 Number of Miles
Number of Minutes
Kelly’s Bike Ride y
6
4
2
0
10
20
30
40
50
x
Number of Minutes
The ratio relationships are the same. The table shows that Toby rides his bike 6 miles in 30 minutes. The point at (30, 6) on the graph represents that Kelly rides his bike 6 miles in 30 minutes. 8. Find the area of Tyler’s rectangular garden in square yards. (1 yard = 3 feet)
282 ft 93 ft
The area of Tyler’s garden is 2,914 square yards.
© Great Minds PBC
292
P R ACT I C E
207
© Great Minds PBC
15
LESSON 15
The Value of the Ratio Compare ratio relationships by using the value of the ratio.
EUREKA MATH2
Name
6 ▸ M1 ▸ TC ▸ Lesson 15
Date
EXIT TICKET
15
Lacy and Sasha make apple pies. Lacy uses 15 cups of apples for every 2 pies. Sasha uses 18 cups of apples for every 3 pies. Who uses fewer cups of apples per pie? How do you know? Sasha uses fewer cups of apples per pie than Lacy. The value of the ratio of the number of cups of apples to the number of pies for Lacy’s pies is 7.5, which means that Lacy uses 7.5 cups of apples per pie. The value of the ratio of the number of cups of apples to the number of pies for Sasha’s pies is 6, which means that Sasha uses 6 cups of apples per pie.
Lesson at a Glance Students build on the prior lesson by working with a partner to create equivalent ratios in which one quantity is 1 unit. They learn that this method uses the value of the ratio to compare. Students practice finding the value of the ratio with teacher guidance and then they work independently by using the value of the ratio to compare ratio relationships given as verbal descriptions. This lesson introduces the term value of the ratio.
Key Questions • How can we use the value of the ratio to compare ratio relationships? • When comparing ratio relationships, what strategy is the most efficient?
Achievement Descriptors 6.Mod1.AD2 Write and explain the unit rate that describes
a relationship between two quantities. (6.RP.A.2) 6.Mod1.AD5 Compare ratio relationships by using various
representations. (6.RP.A.3.a)
© Great Minds PBC
213
© Great Minds PBC
EUREKA MATH2 6 ▸ M1 ▸ TC ▸ Lesson 15
Agenda
Materials
Fluency
Teacher
Launch 5 min
• None
Learn 30 min
Students
• Cereal
• None
• Favorite Blue
Lesson Preparation
Land 10 min
• None
© Great Minds PBC
295
EUREKA MATH2
6 ▸ M1 ▸ TC ▸ Lesson 15
Fluency Unknown Values in Equivalent Ratios Students determine unknown values in equivalent ratios to prepare for using the value of the ratio to compare ratio relationships. Directions: Determine the unknown value in each pair of equivalent ratios. 1.
4 : 2 and
2.
4 : 2 and 1 :
3.
3 : 12 and
4.
3 : 12 and 1 :
Launch
:1
:1
2
5.
1 : 4 and
1 2
6.
4 : 1 and 1 :
1 4
7.
3 : 5 and
4
8.
3 : 5 and 1 :
:1
1 4 1 4
:1
3 5 5 3
5
Students create equivalent ratios in which one quantity in the ratio relationship is 1 unit and then discuss which of those ratios is easier to compare. Present problem 1 to students. Have students work with a partner to determine an answer. As students work, circulate and look for pairs of students who use a variety of strategies. Take note to highlight those strategies when debriefing the class.
296
© Great Minds PBC
EUREKA MATH2 6 ▸ M1 ▸ TC ▸ Lesson 15
1. Both cereal A and cereal B are made with marshmallows and oats. The recipe for one batch of cereal A calls for 12 pounds of marshmallows and 48 pounds of oats. The recipe for one batch of cereal B calls for 16 pounds of marshmallows and 80 pounds of oats. a. Complete the ratio tables. Cereal A
Cereal B
Number of Pounds of Marshmallows
Number of Pounds of Oats
Number of Pounds of Marshmallows
Number of Pounds of Oats
1
4
1
5
1 4
1
1 5
1
12
48
16
80
b. If you prefer more marshmallows in your cereal, which cereal would you choose? Explain. I would choose cereal A because it has more marshmallows than cereal B. For every 1 pound of marshmallows in the cereal A recipe, there are only 4 pounds of oats. But in the cereal B recipe, there are 5 pounds of oats for every 1 pound of marshmallows. When most students have finished, have them turn and talk about how they compared the cereals. Facilitate students’ conversation by asking the following questions. • Which ratios represented in the tables were the easiest to use when determining which cereal has more marshmallows? • What do you notice about the top two rows in each ratio table? Today, we will consider efficient ways to compare ratio relationships. © Great Minds PBC
297
EUREKA MATH2
6 ▸ M1 ▸ TC ▸ Lesson 15
Learn Cereal Students determine the value of the ratio and explain its meaning in context. Display problems 2 and 3. Read problem 2 aloud while students follow along. Once you finish reading, tell them to fill in the blank with the correct number. For problems 2 and 3, fill in the blank with the correct value. 2. For the cereal A recipe, the number of pounds of marshmallows is number of pounds of oats.
1 4
times the
Invite students to share their answers. Ask a few students to explain how they knew which number to write in the blank.
UDL: Representation
Then introduce the term value of the ratio.
Consider using the information for cereal A to create a chart for students’ reference for the term value of the ratio. Include the cereal A table and list the following statements under the table:
The answer we just found is the value of the ratio. That is, the value of a ratio A: B is the quotient BA as long as B is not zero. For cereal A, the ratio of the number of pounds of marshmallows to the number of pounds of oats is 1 : 4, so the value of the ratio is the quotient 1 . 4
Read problem 3 aloud while students follow along. Tell them to fill in the blank with the correct number. 3. For the cereal B recipe, the number of pounds of marshmallows is number of pounds of oats.
298
1 5
times the
• The ratio of the number of pounds of marshmallows to the number of pounds of oats is 1 : 4. • The number of pounds of marshmallows is 1 4 the number of pounds of oats. • There is 1 pound of marshmallows for every 4 1 pound of oats.
© Great Minds PBC
EUREKA MATH2 6 ▸ M1 ▸ TC ▸ Lesson 15
Continue the class conversation by using the following question. How does the value of the ratio help you determine which cereal should have more marshmallows in one bowl? I can compare the values of the ratios just as I would compare fractions. For every 1 pound of oats, 1 pound of marshmallows is more than 1 pound of marshmallows. 5
4
Display problems 4 and 5. Read problem 4 aloud while students follow along. Once you finish reading, use the following prompts to engage students in a class discussion. What is different about this statement from the last one we read about the cereal A recipe? The order of the quantities is reversed. What is a ratio that relates the number of pounds of oats to the number of pounds of marshmallows in the cereal A recipe?
4:1 For problems 4 and 5, fill in the blank with the correct value. 4. For the cereal A recipe, the number of pounds of oats is pounds of marshmallows.
4 1
times the number of
Look at problems 2 and 4. Describe what the value of each ratio represents in this situation. The value of the ratio that describes the number of pounds of marshmallows for every 1 pound of oats in the cereal A recipe is 14 . The value of the ratio that describes the number of pounds of oats for every 1 pound of marshmallows in the cereal A recipe is 4 , or 4. 1
Differentiation: Support To support students seeing the multiplicative relationship between the numbers in the ratio relationship, consider displaying an annotated table to show the number of pounds of marshmallows in each row multiplied by 4. Consider adding more pairs of numbers to the table that represent equivalent ratios and demonstrating that the multiplicative relationship remains consistent. An example is given.
Cereal A Number of Pounds of Marshmallows
Number of Pounds of Oats
1 4
1
1 12
×4 ×4
4 48
×4
© Great Minds PBC
299
EUREKA MATH2
6 ▸ M1 ▸ TC ▸ Lesson 15
Read problem 5 aloud and ask students to fill in the blank with the value of the ratio. 5. For the cereal B recipe, the number of pounds of oats is pounds of marshmallows.
5 1
times the number of
Debrief the class by using the following questions. Look at problems 3 and 5. Describe what the value of each ratio represents in this situation. The value of the ratio that describes the number of pounds of marshmallows for every 1 pound of oats in the cereal B recipe is 1 . 5
The value of the ratio that describes the number of pounds of oats for every 1 pound of marshmallows in the cereal B recipe is 5 , or 5. 1
Favorite Blue Students determine the value of the ratio for two different ratios and then produce a new ratio whose value is greater than both.
Promoting the Standards for Mathematical Practice When students determine the value of the ratio and recognize its meaning in context to compare situations involving ratios, they are attending to precision (MP6). Ask the following questions to promote MP6: • What details are important to think about when determining the meaning of the value of the ratio? • How are you using the value of the ratio to compare situations involving ratios? • What does the value of the ratio mean in the cereal problem?
Allow students to complete problems 6 and 7 independently. 6. Toby and Tara each paint their rooms their favorite shade of blue. Toby uses a paint mixture of 1 pint of blue paint for every 7 pints of white paint. Tara uses a paint mixture of 2 pints of blue paint for every 12 pints of white paint. a. What is a ratio of the number of pints of blue paint to the number of pints of white paint that Toby uses?
1:7 b. What is the value of the ratio that compares the number of pints of blue paint to the number of pints of white paint in Toby’s paint mixture? 1 7
300
Teacher Note This lesson focuses on teaching students to interpret the value of the ratio and on using that ratio to draw conclusions, rather than simply how to compute the value of the ratio. With this in mind, once students develop an understanding of how to find the value of the ratio and what it means in a situation, consider allowing them to use calculators as necessary during the lesson and Practice problems.
© Great Minds PBC
EUREKA MATH2 6 ▸ M1 ▸ TC ▸ Lesson 15
c. Describe what the value of the ratio in part (b) represents in this situation. The value of the ratio in this situation represents that there is 17 pint of blue paint for every 1 pint of white paint in Toby’s paint mixture. d. What is a ratio of the number of pints of blue paint to the number of pints of white paint that Tara uses?
2 : 12 e. What is the ratio of the number of pints of blue paint to the number of pints of white paint that Tara uses when the number of pints of blue paint is 1?
1:6 f. What is the value of the ratio that compares the number of pints of blue paint to the number of pints of white paint in Tara’s paint mixture? 1 6
g. Describe what the value of the ratio in part (e) represents in this situation. The value of the ratio in this situation represents that there is 1 pint of blue paint for 6 every 1 pint of white paint in Tara’s paint mixture. h. Whose shade of blue is lighter? Explain.
Toby’s shade of blue is lighter than Tara’s shade of blue because 17 is less than 16 .
i. Yuna also paints her room her favorite shade of blue. Yuna claims that her paint mixture is a darker shade of blue than both Toby’s and Tara’s paint mixtures. Write a ratio of the number of pints of blue paint to the number of pints of white paint that could represent Yuna’s paint mixture. Explain. Sample: 1 : 5, because the value of the ratio would be 1 and this is greater than the 5 value of the ratio of the number of pints of blue paint to the number of pints of white paint for both Toby’s and Tara’s paint mixtures. © Great Minds PBC
301
EUREKA MATH2
6 ▸ M1 ▸ TC ▸ Lesson 15
7. The table shows ratios that each compare the number of pints of blue paint to the number of pints of white paint in different paint mixtures. Decide whether each ratio represents a paint mixture that is a lighter or darker shade of blue than Toby’s paint mixture. Ratio of Number of Pints Blue Paint to Number of Pints White Paint
Lighter than Toby’s Paint
1:2 1:8
X X
2 : 10 2 : 20 3 : 15
Darker than Toby’s Paint
X X X
When most students have finished, have them compare and discuss their answers with a partner. Debrief the class by using the following questions. How did you determine whether each paint mixture is a lighter or darker shade of blue than Toby’s paint mixture? First, I found the value of the ratio of the number of pints of blue paint to the number of pints of white paint. Once I knew that, I compared it to the value of the ratio of the number of pints of blue paint to the number of pints of white paint in Toby’s paint mixture, 1 . 7
If the value of the ratio was less than 1 , I knew that there were fewer pints of blue paint 7 for every 1 pint of white paint, so the paint mixture is a lighter shade of blue than Toby’s paint mixture. If the value of the ratio was greater than 1 , I knew that there were more 7 pints of blue paint for every 1 pint of white paint, so the paint mixture is a darker shade of blue than Toby’s paint mixture.
302
© Great Minds PBC
EUREKA MATH2 6 ▸ M1 ▸ TC ▸ Lesson 15
Have students think–pair–share about the following question. Do you think finding the value of the ratio is a more efficient method than directly comparing ratios in the previous lesson? Why? Select students to share their thoughts with the class. Consider prompting students to give examples of when using direct comparison is an efficient method and when finding the value of the ratio is an efficient method.
Land Debrief 5 min Objective: Compare ratio relationships by using the value of the ratio. Have students think–pair–share about the following questions. How can we use the value of the ratio to compare ratio relationships? Finding the value of the ratio allows us to find out how much of one quantity there is for every 1 unit of another quantity. If we know the value of each ratio of the two ratio relationships, we can just compare those numbers to decide which is less than or which is greater than the other. Reflect on problem 6(i). How did you decide on a ratio of the number of pints of blue paint to the number of pints of white paint in Yuna’s paint mixture that would create a darker shade of blue than both Toby’s and Tara’s paint mixtures? The values of the ratios for Toby’s and Tara’s paint mixtures are 1 and 1 . I knew I needed 6 7 a fraction that was greater than both of those. That fraction shows that Yuna’s paint mixture has more pints of blue paint for every 1 pint of white paint than both Toby’s and Tara’s paint mixtures.
Exit Ticket 5 min Provide up to 5 minutes for students to complete the Exit Ticket. It is possible to gather formative data even if some students do not complete every problem. © Great Minds PBC
Teacher Note Assign the Practice problems for completion outside of class or use them in class if time remains after the lesson. Refer students to the Recap for support.
303
EUREKA MATH2
6 ▸ M1 ▸ TC ▸ Lesson 15
Recap
EUREKA MATH2
6 ▸ M1 ▸ TC ▸ Lesson 15
RECAP Name
Date
15
2. Yuna babysits for 5 hours and earns a total of $60.00. Noah babysits for 3 hours and earns a total of $30.00. a. Yuna earns
The Value of the Ratio Terminology
compared ratio relationships by using the value of the ratio.
b. Noah earns that he babysits.
For a ratio A : B, the value of the ratio is the quotient BA as long as B is not zero.
Examples
The value of the ratio is 7 . 5
b. What does the value of the ratio you found in part (a) represent? There are 7 gallons of vinegar for every 5 1 gallon of water in the spray.
5
Number of Number of Gallons of Vinegar Gallons of Water
7
c. What is the ratio of the number of gallons of water to the number of gallons of vinegar? The ratio of the number of gallons of water to the number of gallons of vinegar is 5 : 7. d. What is the value of the ratio you found in part (c)? What does it represent? The value of the ratio is 57 . There are 5 gallons of water for every 1 gallon 7 of vinegar in the spray.
© Great Minds PBC
304
7 5
5 7
babysits.
The value of the ratio can be used to determine how much money Yuna and Noah each earn if they babysit for 8 hours.
3. Tara’s chocolate chip cookie recipe calls for 6 parts chocolate chips for every 16 parts batter. Kayla’s chocolate chip cookie recipe calls for 9 parts chocolate chips for every 20 parts batter. Whose recipe should make cookies that have a stronger chocolate flavor? Explain how you know. Kayla’s recipe should make cookies that have a stronger chocolate flavor than Tara’s recipe. The value of the ratio that relates the number of parts chocolate chips to the number of parts batter 6 . The value of the ratio that relates the number of parts chocolate chips to the in Tara’s recipe is 16 number of parts batter in Kayla’s recipe is 9 . Kayla’s recipe calls for more parts chocolate chips 20 per 1 part batter than Tara’s recipe.
5 ÷5
1
If you need to, write the value of the ratio in decimal form to compare. 9 = 0.45 20
Number of Number of Gallons of Water Gallons of Vinegar
5
for every 1 hour
Yuna will earn more money than Noah. If Yuna babysits for 8 hours, she will earn $96.00. If Noah babysits for 8 hours, he will earn $80.00.
This table shows that the value of the ratio that relates the number of gallons of water to the number of gallons of vinegar is 57 .
÷7
5
12. It represents that Yuna earns $12.00 for each hour she
c. If Yuna and Noah each babysit for 8 hours this weekend, who will earn more money? Explain how you know.
Create a ratio table to organize your work. This table shows that the value of the ratio that relates the number of gallons of vinegar to the number of gallons of water is 7 .
÷5
The value of the ratio is 60 , or
$10.00
1. For a homemade cleaning spray, the ratio of the number of gallons of vinegar to the number of gallons of water is 7 : 5. a. What is the value of the ratio 7 : 5?
for every 1 hour that she babysits.
$12.00
In this lesson, we •
EUREKA MATH2
6 ▸ M1 ▸ TC ▸ Lesson 15
6 = 0.375 16
7
Because 9 is greater than 6 , Kayla’s recipe calls 16 20 for more parts chocolate chips per 1 part batter than Tara’s recipe.
÷7
1
215
216
RECAP
© Great Minds PBC
© Great Minds PBC
EUREKA MATH2 6 ▸ M1 ▸ TC ▸ Lesson 15
Sample Solutions Expect to see varied solution paths. Accept accurate responses, reasonable explanations, and equivalent answers for all student work.
EUREKA MATH2
6 ▸ M1 ▸ TC ▸ Lesson 15
PRACTICE Name
Date
6 ▸ M1 ▸ TC ▸ Lesson 15
15
d. What is the value of the ratio that describes the amount of money in dollars Yuna pays for 1 concert ticket? 21 1
1. Blake works 4 hours and earns a total of $44.00. Leo works 7 hours and earns a total of $84.00. a. Blake earns
b. Leo earns
$11.00
$12.00
EUREKA MATH2
for every 1 hour that he works.
e. Julie and Yuna each want to purchase 2 more concert tickets at the same price per ticket they paid before. Who will pay less for 2 more concert tickets? Yuna will pay less than Julie because 2 tickets will cost Yuna $42.00, but 2 tickets will cost Julie $44.00.
for every 1 hour that he works.
3. Noah’s snow cone recipe calls for 6 tablespoons of syrup for every 12 ounces of crushed ice. Kayla’s snow cone recipe calls for 8 tablespoons of syrup for every 24 ounces of crushed ice.
c. Leo and Blake each work one 8-hour shift this weekend. Who earns more money? Explain how you know. Leo earns more money than Blake because Leo earns $96.00 for one 8-hour shift and Blake earns $88.00 for one 8-hour shift.
a. Write a ratio that relates the number of tablespoons of syrup to the number of ounces of crushed ice in Noah’s snow cone recipe.
6 : 12 2. Julie buys 5 tickets to a concert for a total of $110.00. Yuna buys 4 tickets to a different concert for a total of $84.00.
b. What is the value of the ratio that you wrote in part (a)? 1 2
a. What is a ratio that relates the amount of money in dollars Julie pays to the number of concert tickets she buys?
110 : 5
c. Describe what the value of the ratio from part (b) represents in this situation. The value of the ratio from part (b) represents that 1 tablespoon of syrup is used for every 2 1 ounce of crushed ice in Noah’s snow cone recipe.
b. What is the value of the ratio that you wrote in part (a)? 22 1
d. What is the value of the ratio that describes the number of tablespoons of syrup used for every 1 ounce of crushed ice in Kayla’s snow cone recipe? 1 3
c. Describe what the value of the ratio from part (b) represents in this situation. The value of the ratio from part (b) represents the amount of money in dollars Julie pays for 1 concert ticket.
e. Whose snow cone recipe makes a snow cone with a stronger flavor? Explain. Noah’s recipe makes a snow cone with a stronger flavor than Kayla’s recipe because there is more syrup used for every 1 ounce of crushed ice.
© Great Minds PBC
© Great Minds PBC
217
218
P R ACT I C E
© Great Minds PBC
305
EUREKA MATH2
6 ▸ M1 ▸ TC ▸ Lesson 15
EUREKA MATH2
6 ▸ M1 ▸ TC ▸ Lesson 15
4. Toby runs 5 laps in 10 minutes during track practice. Ryan runs 4 laps in 6 minutes.
8. The ratio tables show the relationship between the number of cups of blueberries and the number of cups of yogurt in two different smoothies. Which smoothie should have a stronger blueberry flavor? Explain how you know.
a. Write a ratio that relates the number of minutes Toby runs to the number of laps he runs.
10 : 5
Smoothie 1
b. Write a ratio that relates the number of minutes Ryan runs to the number of laps he runs.
6:4
c. Who runs at a faster pace? Use the value of the ratio to explain how you know. Ryan runs at a faster pace than Toby. I found the value of the ratio that describes the number of minutes it takes each boy to run 1 lap. Ryan runs 1 lap in 1.5 minutes. Toby runs 1 lap in 2 minutes. Ryan runs at a faster pace than Toby because it takes Ryan fewer minutes to run 1 lap.
5. Blake and Eddie each make strawberry lemonade. Blake uses 19 strawberries and makes 5 glasses of lemonade. Eddie uses 18 strawberries and makes 4 glasses of lemonade. Who uses more strawberries per glass of lemonade? Use the value of the ratio to explain how you know.
Number of Cups of Yogurt
Number of Cups of Blueberries
Number of Cups of Yogurt
2
5
3
6
4
10
6
12
6
15
9
18
Smoothie 2 should have a stronger blueberry flavor than smoothie 1. Smoothie 1 has 15 cups of yogurt when there are 6 cups of blueberries. Smoothie 2 only has 12 cups of yogurt when there are 6 cups of blueberries. When comparing 6 cups of blueberries in each smoothie, there are fewer cups of yogurt in smoothie 2 than in smoothie 1. For problems 9 and 10, complete the table by converting each measurement to the given unit. 9.
5
10.
Remember For problems 6 and 7, divide.
6. 3,010 ¸ 7
7. 5,184 ¸ 6
430
864
306
P R ACT I C E
219
Smoothie 2
Number of Cups of Blueberries
Eddie uses more strawberries per glass of lemonade than Blake. The value of the ratio of the number of strawberries to the number of glasses of lemonade that Blake makes is 19 , or 3 4 . 5 5 The value of the ratio of the number of strawberries to the number of glasses of lemonade that 18 1 Eddie makes is , or 4 1 . Eddie uses 4 strawberries per glass of lemonade, but Blake only uses 4 2 2 3 4 strawberries per glass of lemonade.
© Great Minds PBC
EUREKA MATH2
6 ▸ M1 ▸ TC ▸ Lesson 15
220
P R ACT I C E
Number of Meters
Number of Centimeters
7
700
10
1,000
4.5
450
Number of Feet
Number of Yards
12
4
9
3
2
2 3 © Great Minds PBC
© Great Minds PBC
Topic D Rates In topic A, students develop an understanding of ratios and use equivalent ratio reasoning to solve problems. In topics B and C, they use multiple tools to represent collections of equivalent ratios and compare ratio relationships. In topic D, students discover the rates and unit rates that correspond to ratio relationships. Then they apply rate reasoning to convert units and solve multi-step real-world problems. Students first explore rates through speed contexts. They represent ratio relationships between distance and time by using ratio tables, double number lines, and graphs. They use these tools to identify a speed and interpret its meaning. Students understand that if something travels at a constant speed of 30 miles per hour, then it travels 30 miles in 1 hour, 60 miles in 2 hours, 90 miles in 3 hours, and so on. Students then extend their understanding of rates to contexts other than speed. They discover the importance of the order of quantities for rates in a given context, such as pages per minute and minutes per page. Students write rates per 1 unit and identify the numerical part of a rate as the unit rate. They observe that the unit rate is equivalent to the value of the ratio that is associated with a rate. Students then use their understanding of rates and unit rate to find unknown quantities and solve problems. In one lesson, students use multiple senses to analyze the tempo of music and compare rates. By tapping along and listening to musical beats, students internalize how to use the unit rate to reason about real-world problems.
0
30
60
90
120
0
1
2
3
4
Number of Miles Number of Hours
In earlier grades, students performed basic unit conversions within the same measurement system. In topic D, students build on this knowledge when they use unit rates to convert rates in the same measurement system and in different measurement systems. For example, students express a rate given in miles per hour as equivalent rates in feet per hour and kilometers per hour. Students apply this reasoning to solve multi-step rate problems and perform multi-step unit conversions. For example, students express a rate given in miles per hour as an equivalent rate in feet per second. Students finish the topic by using the problem-solving routine Read–Represent–Solve–Summarize to determine how long
308
© Great Minds PBC
EUREKA MATH2 6 ▸ M1 ▸ TD
it would take to travel to the moon. This routine lays a foundation for the modeling cycle that students will use in later grades. In topic D, students learn that a rate is a quantity that describes a ratio relationship between two types of quantities, such as dollars per hour, and they apply this understanding to interpret and solve problems. In topic E, students extend their understanding of ratios and rates to percents, and they use tools established throughout the module to make sense of different types of percent problems.
Progression of Lessons Lesson 16 Speed Lesson 17 Rates Lesson 18 Comparing Rates Lesson 19 Using Rates to Convert Units Lesson 20 Solving Rate Problems Lesson 21 Solving Multi-Step Rate Problems
© Great Minds PBC
309
16
LESSON 16
Speed Find distance and time corresponding to a given speed. Identify real-world examples of rates and interpret their meanings in context.
EUREKA MATH2
6 ▸ M1 ▸ TD ▸ Lesson 16
Name
EXIT TICKET
Date
16
Riley runs at a constant speed of 6 miles per hour. a. Interpret the meaning of Riley’s speed. For every hour Riley runs, he travels 6 miles.
b. Create a double number line to determine the number of miles Riley runs in 2 hours at this speed. 0
6
Lesson at a Glance In this lesson, students use their intuition to reason about the speeds various animals travel. Students then apply prior knowledge of speed to think about which animals would win races. Through this context, students explore the relationship between distance and time to understand the concept of a rate (speed). Given a rate, pairs of students apply ratio reasoning to answer questions about distance and time different animals travel, as well as other real-world contexts. This lesson introduces the term rate.
Key Questions • What does speed tell us?
12
Number of Miles
• What are the differences between ratios and rates?
Number of Hours 0
1
2
Achievement Descriptors
In 2 hours, Riley runs 12 miles. c. What amount of time does it take Riley to run 3 miles at this speed?
6.Mod1.AD2 Write and explain the unit rate that describes
Number of miles: 6 ¸ 2 = 3
a relationship between two quantities. (6.RP.A.2)
Number of hours: 1 ¸ 2 = 0.5 It takes Riley 0.5 hours, or 30 minutes, to run 3 miles.
6.Mod1.AD4 Represent ratio relationships by using tables and the
coordinate plane. (6.RP.A.3.a) 6.Mod1.AD6 Solve real-world problems by using unit rates. (6.RP.A.3.b)
© Great Minds PBC
229
© Great Minds PBC
EUREKA MATH2 6 ▸ M1 ▸ TD ▸ Lesson 16
Agenda
Materials
Fluency
Teacher
Launch 5 min
• None
Learn 30 min
Students
• Interpreting Speed
• None
• Speed, Distance, and Time
Lesson Preparation
• Comparing Ratios and Rates
• None
Land 10 min
© Great Minds PBC
311
EUREKA MATH2
6 ▸ M1 ▸ TD ▸ Lesson 16
Fluency Interpret Double Number Lines Students interpret double number lines to prepare for using double number lines to reason about speed. Directions: Use each double number line to complete the sentences.
Teacher Note Direct students to complete the Fluency activity by listing the values that belong in each blank on their personal whiteboards.
1. One package of gum costs $0.75. With $2.25, you can buy packages of gum. Four packages of gum cost $ . With $3.75, you can buy packages of gum. Number of Packages of Gum
0
1
0
0.75
3, 3.00, 5
Total Cost (dollars)
2. A car that travels 90 miles uses 3 gallons of gasoline. The car travels miles for every 1 gallon of gasoline. The car travels miles for every 0.5 gallons of gasoline. The car travels 75 miles for every gallons of gasoline. 0
90
0
3
Number of Miles Number of Gallons of Gasoline
312
30, 15, 2.5
© Great Minds PBC
EUREKA MATH2 6 ▸ M1 ▸ TD ▸ Lesson 16
Launch
5
Students reason about the speeds different animals travel. Direct students to problem 1. For each pair of animals in the bracket, decide which one you think is faster and would win a race. Write that animal’s name in the box to the right. Continue for all pairs until you get one winner. Allow students about 1 minute to use prior knowledge and intuition about the speeds different animals travel to fill in the boxes of the bracket and show which animal they think would win each race. Note that the solution bracket shows the animal that wins each race based on their fastest recorded speed. For the purposes of this activity, however, accept any student answers and reasoning. 1. Fill in the boxes of the bracket to show which animal wins each race. Squirrel House Mouse Cheetah Lion Hummingbird Horsefly Golden Eagle Peregrine Falcon
© Great Minds PBC
Squirrel Cheetah Cheetah Peregrine Falcon Horsefly Peregrine Falcon Peregrine Falcon
313
EUREKA MATH2
6 ▸ M1 ▸ TD ▸ Lesson 16
Bring the class together and consider giving students 1 minute to compare their completed brackets with a partner. Then, one at a time, display the following clues about the speeds the animals travel. Invite students to make changes to their brackets as you reveal each clue. • The cheetah runs 25 miles per hour faster than the lion.
• The house mouse runs 4 miles per hour slower than the squirrel.
UDL: Representation
• The speed a hummingbird flies is 23 the speed a horsefly flies.
• The speed a golden eagle flies is 3 times the speed a lion runs.
• The peregrine falcon flies more than 4 times as fast as the hummingbird. • The animal that travels at the greatest speed is not a mammal. Before telling the winners of each head-to-head race, poll students about which animal they think is the final winner. Then choose a few students to share which animal they think wins each head-to-head race and their reasoning. Highlight student responses that use the comparative and multiplicative language in the clues to determine which animal wins, such as “I know the cheetah wins the race against the lion because the cheetah runs 25 miles per hour faster than the lion” or “The hummingbird is slower than the horsefly because the speed a hummingbird flies is 23 the speed a horsefly flies; so I know the horsefly wins that race.”
Review prior understanding and experiences to build connections to the new information. Activate students’ knowledge about distance, time, and speed by asking them what they know about miles per hour and speed limits. Invite them to share their experiences of being in a car on different kinds of roads, city streets, and highways. In addition, have the class brainstorm examples of objects that are about a mile, a foot, and a meter in length while showing them a meter stick and a ruler.
After a few students share their reasoning, reveal that the peregrine falcon is the final winner. Then ask the following questions. How many minutes ahead of the other animals will the peregrine falcon finish the race? Turn and talk to your partner. Were you and your partner able to answer the question? No. Why? We don’t know the length of the race. We don’t know how long it takes any of the animals to complete the race. We don’t know an exact speed for the peregrine falcon or for any of the other animals. Today, we will explore the relationship between distance and time to understand speed. We can use this knowledge to predict the answer to questions like Which animal will win the race? 314
© Great Minds PBC
EUREKA MATH2 6 ▸ M1 ▸ TD ▸ Lesson 16
Learn Interpreting Speed Students find and interpret the meaning of speed by using representations of ratio relationships. Begin by telling students that the speed a squirrel runs is 12 miles per hour. Then ask students the following questions so they can make predictions about the speeds other animals travel. At this point, their estimates are likely based only on their intuition and prior knowledge of speed. • A house mouse runs slower than a squirrel. What is a reasonable estimate for the speed a house mouse runs? • A peregrine falcon flies faster than a squirrel runs. What is a reasonable estimate for the speed a peregrine falcon flies? The speed a house mouse runs is less than 12 miles per hour. The speed a peregrine falcon flies is more than 12 miles per hour. Let’s interpret the meaning of 12 miles per hour. Have students complete problem 2 individually. 2. A squirrel runs at a speed of 12 miles per hour. Complete the table that shows the number of hours and the number of miles the squirrel runs at that speed.
© Great Minds PBC
Number of Hours
Number of Miles
1
12
2
24
3
36
4
48
Language Support Consider previewing the meaning of the word interpret before students encounter it during this lesson. Highlight a synonym for interpret that students can use in conjunction with the word, such as explain or describe.
Teacher Note In the discussion following problem 2, students will explore the idea of constant speed and what it represents. Consider holding this discussion earlier if students have questions while completing problem 2 about whether a squirrel can run at this speed for 4 consecutive hours.
315
6 ▸ M1 ▸ TD ▸ Lesson 16
Invite students to share their answers. Then use the following prompts. Interpret what it means for a squirrel to run 12 miles per hour. It means a squirrel runs 12 miles each hour.
It means a squirrel runs 12 miles for every 1 hour. It means a squirrel runs 12 miles in 1 hour. Clarify that speed tells us a count or measure of something happening per one unit of time, such as miles traveled per hour or pages typed per minute. The number of miles a squirrel runs can also be stated as the distance it runs in miles. Does the distance the squirrel runs change as the time increases? How?
EUREKA MATH2
Promoting the Standards for Mathematical Practice When students reason about speed and use representations like ratio tables and double number lines to interpret its meaning, they are reasoning abstractly and quantitatively (MP2). Ask the following questions to promote MP2:
Yes. As the time increases, the distance the squirrel runs increases.
• What does this representation tell you about the speed the animal travels?
How did you use the squirrel’s running speed of 12 miles per hour to find the distance it runs in more than 1 hour?
• How do the units involved in a given speed help you think about this problem?
Because we know the squirrel runs 12 miles in 1 hour, we doubled 12 to figure out the distance it runs in 2 hours, we tripled 12 to figure out the distance it runs in 3 hours, and so on.
• Does your solution make sense mathematically?
Does the table represent a ratio relationship? How do you know? Yes. The table represents a ratio relationship because all the ratios of pairs of numbers in the table are equivalent ratios. Use the following prompts to briefly discuss what it means to travel at a constant speed. Because the squirrel runs 12 miles for every 1 hour, the squirrel runs at a constant speed. Constant speed means that the speed stays the same over time. Do you think a squirrel can actually run at that speed for 4 hours straight? Why? No. I don’t think a squirrel can run at that speed for that long because it would get tired. In the real world, almost nothing travels at a constant speed. However, we often assume constant speed because it allows us to make predictions about the distance and time something travels. If the squirrel runs at a constant speed of 12 miles per hour, how many miles does it run in half an hour? What about in 15 minutes? Turn and talk to a partner.
316
© Great Minds PBC
EUREKA MATH2 6 ▸ M1 ▸ TD ▸ Lesson 16
Invite a few pairs to share their ideas with the class. Then have students work with a partner to complete problems 3–5. Circulate as students work. If students are unsure about the speed a sloth crawls in problem 5, move them forward by suggesting they draw more tick marks on the double number line to determine the number of meters a sloth crawls in 1 minute. 3. A house mouse runs at a constant speed. It runs 4 miles per hour slower than the speed a squirrel runs. a. Determine the speed the house mouse runs in miles per hour. Use the speed the squirrel runs from problem 2.
12 – 4 = 8 The speed the house mouse runs is 8 miles per hour. b. Interpret the meaning of the speed the house mouse runs. The house mouse runs 8 miles for every 1 hour. 4. When a peregrine falcon dives to catch its prey, it is the fastest animal in the world. The ratio table shows the number of seconds and the number of meters the peregrine falcon dives at a constant speed. a. Complete the ratio table. Number of Seconds
Number of Meters
1
88
2
176
3
264
Teacher Note Ratios relate two quantities, and ratios have associated rates. Rates, such as speed, differ from ratios in how they describe ratio relationships: Rates are quantities and have the properties of quantities. Rates of the same type can be added or subtracted to get a new rate. For example, to find the speed a house mouse runs in problem 3, we subtract 4 miles per hour from 12 miles per hour to get 8 miles per hour. Ratios are ordered pairs of numbers and not quantities. The ratios of the number of miles to the number of hours associated with this situation, 12 : 1 and 4 : 1, cannot be added or subtracted in the same way that rates can.
b. What is the speed the peregrine falcon dives in meters per second? The speed the peregrine falcon dives is 88 meters per second. c. Interpret the meaning of the speed the peregrine falcon dives. The peregrine falcon dives 88 meters for every 1 second. © Great Minds PBC
317
EUREKA MATH2
6 ▸ M1 ▸ TD ▸ Lesson 16
5. The slowest animal in the world is a sloth. The double number line shows the number of meters and number of minutes a sloth crawls at a constant speed. 0
16
32
48
64
80
0
4
8
12
16
20
Number of Meters Number of Minutes
a. Determine the speed the sloth crawls in meters per minute. 0 Number of Meters Number of Minutes 0
4 8 12
1 2 3
16
32
48
64
80
4
8
12
16
20
The speed the sloth crawls is 4 meters per minute. b. Interpret the meaning of the speed the sloth crawls. The sloth crawls 4 meters for every 1 minute. After several minutes, have students share their answers. Use the following prompts to discuss strategies for finding the speed each animal travels. In problem 3, why did you subtract 4 from 12 to find the speed the house mouse runs? I subtracted because slower means less. In problem 4, did you use one of the ratios represented in the table to determine the speed the peregrine falcon dives? How? Yes. I knew that if the peregrine falcon dives 176 meters in 2 seconds, then it dives 88 meters in 1 second because 176 ¸ 2 = 88 and 2 ¸ 2 = 1. In problem 5, did you use one of the ratios represented on the double number line to determine the speed the sloth crawls? How?
UDL: Representation Consider highlighting the relationship described in problem 4 by annotating the table. For example, after students share responses, reiterate that for every second, the number of meters increases by 88. Illustrate the increases on the table as you reiterate.
Number of Seconds
Number of Meters
1
88
2
176
3
264
+1 +1
+88 +88
Yes. I knew that if the sloth crawls 16 meters in 4 minutes, then it crawls 4 meters in 1 minute because 16 ¸ 4 = 4 and 4 ¸ 4 = 1. 318
© Great Minds PBC
EUREKA MATH2 6 ▸ M1 ▸ TD ▸ Lesson 16
Speed, Distance, and Time Students reason about ratio relationships to find speed, distance, and time. Begin by using the following prompt. The ratio table and double number line in problems 4 and 5 show that the peregrine falcon and the sloth move at constant speeds. What are some other examples of animals, people, or objects that might travel at constant speeds? Sample: Cars on cruise control, trains, planes, a carousel, a person walking Display the double number line from problem 6, which shows the distance and the time a hummingbird flies. Does the double number line in problem 6 represent a ratio relationship? How do you know? Yes. It represents a ratio relationship because the pairs of numbers form equivalent ratios. Describe the ratio relationship between the number of miles and number of hours the hummingbird flies. The hummingbird flies 30 miles for every hour. The double number line shows that the hummingbird flies at a constant speed because for each hour, it flies 30 miles. What is the speed the hummingbird flies in miles per hour?
Teacher Note This topic intentionally avoids giving students the formula d = rt because students write and solve equations in module 4. Rather than substituting values into a formula, students solve problems by using ratio reasoning and observation of patterns in ratio tables and double number lines. This deepens their understanding of the relationships among equivalent ratios. Consider discussing the different representations used in the lesson. Remind students that ratio tables and double number lines are appropriate because the units, like miles and hours, are different. Encourage students to consider which representation makes more sense to them or which one they find easiest to use as a problem-solving strategy.
The speed the hummingbird flies is 30 miles per hour. Allow students to complete problems 6 and 7 in pairs. Circulate as partners work and ask the following questions to further their thinking:
Differentiation: Support
• How do you know when ratios are equivalent?
For problems 7–9, consider providing premade double number lines or ratio tables that students can complete as necessary to aid in their problem solving.
• Can you draw more tick marks on the double number lines to determine other equivalent ratios? • How many minutes are in 1 hour?
© Great Minds PBC
319
EUREKA MATH2
6 ▸ M1 ▸ TD ▸ Lesson 16
6. The double number line shows the number of miles and the number of hours a hummingbird flies. 30
0
90
60
120
Number of Miles
To further challenge students, ask them to complete the following problem. A lion runs 80 meters in 4 seconds at a constant speed.
Number of Hours 1
0
2
4
3
a. How many miles does the hummingbird fly in 5 hours? The hummingbird flies 150 miles in 5 hours. b. How many hours does it take the hummingbird to fly 45 miles? It takes the hummingbird 1 12 hours to fly 45 miles.
c. How many miles does the hummingbird fly in 30 minutes, or half an hour? The hummingbird flies 15 miles in 30 minutes. d. How many miles does the hummingbird fly in 1 minute, or 1 of an hour? 60
The hummingbird flies 12 mile in 1 minute.
7. A horsefly flies 70 kilometers in 30 minutes at a constant speed. a. Create a double number line to determine the number of kilometers the horsefly flies in 150 minutes at this speed. 0
70
140 210 280 350
0
30
60
Number of Kilometers Number of Minutes 90
The horsefly flies 350 kilometers in 150 minutes.
320
Differentiation: Challenge
120 150
• What is the speed the lion runs in meters per second? The speed the lion runs is 20 meters per second. • How many meters does the lion run in 60 seconds? The lion runs 1,200 meters in 60 seconds. • What is the speed the lion runs in meters per minute? The speed the lion runs is 1,200 meters per minute. • What is the speed the lion runs in meters per hour? The speed the lion runs is 72,000 meters per hour.
Teacher Note In previous topics, students described situations by using ratio language such as “I walk 4 meters for every 2 seconds.” Students recognized that they can write the equivalent ratios 4 : 2, 8 : 4, etc. to describe this situation. Students should recognize that language like “4 meters for every 2 seconds” also describes a rate. In the next lesson, students learn that by describing a situation in which a rate is written so that the second of the two quantities is 1 unit, such as 42 meters per second or 2 meters per second, they can identify the numerical part of the rate, the unit rate, as 2.
© Great Minds PBC
EUREKA MATH2 6 ▸ M1 ▸ TD ▸ Lesson 16
b. How many kilometers does the horsefly fly in 1 hour? The horsefly flies 140 kilometers in 1 hour. c. What is the speed the horsefly flies in kilometers per hour?
Language Support
The speed the horsefly flies is 140 kilometers per hour. d. What is the speed the horsefly flies in kilometers per minute? Justify your reasoning. Number of minutes: 30 ¸ 30 = 1
Consider creating an anchor chart with students. Then post it as an example to help students distinguish between ratios and rates.
Number of kilometers: 70 ÷ 30 = 2 1
3
Because the horsefly flies 70 kilometers in 30 minutes, it flies 2 13 kilometers in
1 minute. The speed it flies is 2 13 kilometers per minute.
Confirm answers. Then invite several students to share their strategies for determining the speeds, distances, and times on each problem.
Situation It costs $10.00 for every 2 tickets to a soccer game. Representation of the Ratio Relationship
Number of Dollars
Comparing Ratios and Rates Students identify ratios and rates for a given ratio relationship. Continue to display the double number line from problem 6. Then use the following prompts to define rate.
Number of Tickets
0
5
10
15
20
0
1
2
3
4
Ratios of the Number of Dollars to the Number of Tickets
The speed a hummingbird flies is 30 miles per hour, which means for every hour it flies 30 miles. Speed, such as 30 miles per hour, is an example of a rate. A rate is a quantity that describes a ratio relationship between two quantities.
5 : 1, 10 : 2, 15 : 3, 20 : 4, etc.
What are the two types of quantities in the ratio relationship associated with 30 miles per hour?
$5.00 per ticket, $10.00 per 2 tickets, $15.00 per 3 tickets, $20.00 per 4 tickets, etc.
Rates
The two types of quantities are miles and hours. Another rate that describes the ratio relationship between the number of miles and the number of hours the hummingbird flies is 60 miles per 2 hours. Name some other rates that describe this ratio relationship. Sample: 90 miles per 3 hours, 120 miles per 4 hours, 15 miles per 1 hour 2
© Great Minds PBC
321
EUREKA MATH2
6 ▸ M1 ▸ TD ▸ Lesson 16
Tell students that ratios have associated rates and we will see different types of rates throughout the topic. Have students think–pair–share about the following prompt. Some other examples of rates are 8 hours of sleep per night and 40 miles driven per 2 gallons of gas. Name some more examples of rates. Sample: $10.00 per hour, 3 pages per 2 minutes, $2.00 per pound, 7 days per week Allow students to complete problems 8 and 9 in pairs. 8. Ryan goes to a movie with his friends. He spends $24.00 to buy 4 buckets of popcorn. a. What is a ratio that relates the number of dollars Ryan spends to the number of buckets of popcorn he buys? A ratio that relates the number of dollars Ryan spends to the number of buckets of popcorn he buys is 24 : 4. b. What is the rate in dollars per bucket? Number of buckets: 4 ¸ 4 = 1 Number of dollars: 24 ¸ 4 = 6 If Ryan spends $24.00 to buy 4 buckets of popcorn, then he spends $6.00 to buy 1 bucket of popcorn. The rate is $6.00 per bucket.
Differentiation: Challenge
9. Lisa checks the nutrition facts on a bag of granola. a. There are 2 grams of protein for every 1 serving of granola. What is the rate in grams of protein per serving? The rate is 2 grams of protein per serving. b. The ratio of the number of grams of protein to the number of cups of granola is 32 : 4. What is the rate in grams of protein per cup? Number of cups of granola: 4 ¸ 4 = 1 Number of grams of protein: 32 ¸ 4 = 8 The rate is 8 grams of protein per cup. When most students have completed the problems, allow students to share their answers and reasoning.
322
To further challenge students, ask them the following questions after they complete problem 9. • If 1 bag of granola has 32 grams of protein, how many cups of granola are in 1 bag? There are 4 cups of granola in 1 bag. • If 1 bag of granola has 32 grams of protein, how many servings of granola are in 1 bag? There are 16 servings in 1 bag. • What is the rate in cups of granola per serving? The rate is 14 cup of granola per serving.
© Great Minds PBC
EUREKA MATH2 6 ▸ M1 ▸ TD ▸ Lesson 16
Land Debrief 5 min Objectives: Find distance and time corresponding to a given speed. Identify real-world examples of rates and interpret their meanings in context. Facilitate a class discussion by using the following prompts. Encourage students to add on to their classmates’ responses. The speed a squirrel runs is 12 miles per hour. What does this tell us? How is speed an example of a rate? Because the speed a squirrel runs is 12 miles per hour, we know it runs 12 miles in 1 hour. We can write equivalent ratios to find that the squirrel runs 24 miles in 2 hours, 36 miles in 3 hours, and so on. Because speed describes a ratio relationship between two types of quantities like miles and hours, it is an example of a rate. What are the differences between ratios and rates? Ratios and rates both describe ratio relationships, but ratios relate two numbers like 3 : 2 or 15 : 22. A rate has units and gives information about how the two numbers are related, like 12 miles per hour. The ratio for that rate is 12 : 1. If students are ready, pose the next question to preview future learning. Allow students time to think–pair–share. Many runners give their running rate by saying they run 10 minutes per mile instead of saying they run 6 miles per hour. What is different about the two rates? Do they both describe the same speed? One rate gives time per unit of distance and the other gives distance per unit of time. If a person runs 10 minutes per mile, then the person runs 1 mile in 10 minutes. This means the person runs 6 miles in 60 minutes or 6 miles per hour. So both rates describe the same speed.
Exit Ticket 5 min Provide up to 5 minutes for students to complete the Exit Ticket. It is possible to gather formative data even if some students do not complete every problem. © Great Minds PBC
Teacher Note Assign the Practice problems for completion outside of class or use them in class if time remains after the lesson. Refer students to the Recap for support.
323
EUREKA MATH2
6 ▸ M1 ▸ TD ▸ Lesson 16
Recap
EUREKA MATH2
6 ▸ M1 ▸ TD ▸ Lesson 16
RECAP Name
Date
EUREKA MATH2
6 ▸ M1 ▸ TD ▸ Lesson 16
16
b. At this rate, how many feet does the wolf sprint in 7 seconds?
The wolf sprints 36 feet
in 1 second. Multiply 36 and 1 each by 7 to calculate the
The wolf sprints 252 feet in 7 seconds.
Speed In this lesson, we •
interpreted the meaning of speed by using ratio tables and double number lines.
•
calculated speed, distance, and time.
•
identified ratios and rates for a ratio relationship.
Terminology
It takes 10 seconds for the wolf to sprint 360 feet.
A rate is a quantity that describes a ratio relationship between two quantities.
2. A 6-ounce can of almonds has 960 calories. a. Write a ratio that relates the number of calories to the number of ounces in this can of almonds.
Examples
A ratio that relates the number of calories to the number of ounces in this can of almonds is 960 : 6.
1. The ratio table shows the number of seconds and the number of feet a wolf sprints. Number of Seconds
Number of Feet
3
108
6
216
9
324
12
432
Number of Feet
0
0
1
2
36 72
b. What is the rate in calories per ounce?
Speed is an example of a rate. For the rate 108 feet per 3 seconds, the two types of quantities being compared are feet and seconds.
Number of Seconds
Number of Feet
1
36
10
360
×10
×10
An equivalent ratio that relates the number of calories to the number of ounces is 160 : 1.
The rate is 160 calories per ounce. There are 960 calories in 6 ounces. Divide 960 and 6 each by 6 to calculate the number of calories in 1 ounce.
Feet per second means the number of feet the wolf sprints per 1 second. The wolf sprints 108 feet in 3 seconds. Divide 108 and 3 each by 3 to calculate the number of feet the wolf sprints in 1 second.
a. Determine the speed the wolf sprints in feet per second. Interpret the meaning of the speed the wolf sprints. Number of Seconds
number of feet the wolf sprints in 7 seconds.
c. At this rate, how many seconds does it take the wolf to sprint 360 feet?
3
6
9
12
108
216
324
432
The speed the wolf sprints is 36 feet per second. This means that for every 1 second, the wolf sprints 36 feet. © Great Minds PBC
324
231
232
RECAP
© Great Minds PBC
© Great Minds PBC
EUREKA MATH2 6 ▸ M1 ▸ TD ▸ Lesson 16
Sample Solutions Expect to see varied solution paths. Accept accurate responses, reasonable explanations, and equivalent answers for all student work.
EUREKA MATH2
6 ▸ M1 ▸ TD ▸ Lesson 16
PRACTICE Name
Date
16
EUREKA MATH2
6 ▸ M1 ▸ TD ▸ Lesson 16
2. The ratio table shows the number of minutes and the number of meters a Galápagos tortoise walks.
1. Karl Benz drove the first car in Mannheim, Germany, in 1886. The car traveled at a top speed of 10 miles per hour. Assume the car kept that constant speed.
Number of Minutes
Number of Meters
3
15
6
30
9
45
a. Interpret the meaning of the car’s speed. For every hour, the car traveled 10 miles.
b. Use your answer from part (a) to complete the ratio table. Sample:
a. Determine the speed the tortoise walks in meters per minute. Number of Hours
Number of Miles
1
10
2
20
3
30
4
40
The speed the tortoise walks is 5 meters per minute. b. At this speed, how many minutes does it take the tortoise to walk 25 meters? It takes the tortoise 5 minutes to walk 25 meters. c. At this speed, how many meters can the tortoise walk in 15 minutes? The tortoise can walk 75 meters in 15 minutes. 3. A satellite in space travels at a constant rate. The double number line shows the number of kilometers and the number of hours a satellite travels.
c. Create a double number line to represent this situation. Sample: 0
1
2
3
0
36,000
72,000
108,000
144,000
0
3
6
9
12
Number of Kilometers
4
Number of Hours
Number of Hours
Number of Miles 0
10
20
30
40
a. At this rate, how many kilometers does the satellite travel in 3 hours? The satellite travels 36,000 kilometers in 3 hours. b. At this rate, how many kilometers does the satellite travel in 1 hour? The satellite travels 12,000 kilometers in 1 hour.
© Great Minds PBC
© Great Minds PBC
233
234
P R ACT I C E
© Great Minds PBC
325
EUREKA MATH2
6 ▸ M1 ▸ TD ▸ Lesson 16
EUREKA MATH2
6 ▸ M1 ▸ TD ▸ Lesson 16
6. Toby completes 10 homework problems in 5 minutes. Assume that Toby completes homework problems at a constant rate.
c. At this rate, how many kilometers does the satellite travel in half an hour? The satellite travels 6,000 kilometers in half an hour.
a. What is a ratio that relates the number of homework problems Toby completes to the number of minutes?
d. At what speed does the satellite travel in kilometers per hour? The satellite travels at a speed of 12,000 kilometers per hour.
A ratio that relates the number of homework problems Toby completes to the number of minutes is 10 : 5.
e. At this rate, how many hours does it take the satellite to travel 60,000 kilometers?
b. What is the rate in homework problems completed per minute?
It takes the satellite 5 hours to travel 60,000 kilometers.
The rate is 2 homework problems completed per minute.
4. A bird named Zac the Macaw holds the world record for the most canned drinks opened in 1 minute by a parrot. Zac the Macaw opened 35 canned drinks in 1 minute.1
7. One pint of frozen yogurt has 440 calories for 4 servings. a. What is a ratio that relates the number of calories to the number of servings in this pint of frozen yogurt?
a. Ryan says that at this rate, Zac the Macaw can open more than 100 canned drinks in 3 minutes. Do you agree with Ryan? Draw a double number line to support your answer. 0
1
2
A ratio that relates the number of calories to the number of servings is 440 : 4.
3
Number of Minutes Number of Canned Drinks Opened
EUREKA MATH2
6 ▸ M1 ▸ TD ▸ Lesson 16
b. What is the rate in calories per serving? 0
The rate is 110 calories per serving. 35
70
105
Yes. I agree with Ryan. Zac the Macaw can open more than 100 canned drinks in 3 minutes at this rate.
8. Jada rakes leaves to earn extra money. The ratio of the number of hours she rakes leaves to the number of dollars she earns is 4 : 30. What is Jada’s rate in dollars per hour? Jada’s rate is $7.50 per hour.
b. At this rate, how many canned drinks can Zac the Macaw open in 10 minutes? At this rate, Zac the Macaw can open 350 canned drinks in 10 minutes.
Remember
5. The ratio of the number of syllables Lisa speaks to the number of seconds she speaks is 40 : 10. Assume that Lisa speaks at a constant rate.
For problems 9 and 10, divide. Write the quotient and the remainder on separate lines.
9. 2,561 ¸ 3 Quotient:
a. At what rate in syllables per second does Lisa speak? Lisa speaks at a rate of 4 syllables per second.
10. 5,218 ¸ 4 853
Remainder:
2
Quotient: 1,304 Remainder:
2
b. At this rate, how many syllables does Lisa speak in 30 seconds? At this rate, Lisa speaks 120 syllables in 30 seconds. 1 Guinness Book of World Records, “Most Canned Drinks Opened by a Parrot in One Minute.”
© Great Minds PBC
326
P R ACT I C E
235
236
P R ACT I C E
© Great Minds PBC
© Great Minds PBC
EUREKA MATH2 6 ▸ M1 ▸ TD ▸ Lesson 16
EUREKA MATH2
6 ▸ M1 ▸ TD ▸ Lesson 16
11. Yuna and Scott use the same powdered lemonade mix to make lemonade. The tables show the ratio relationship between the number of tablespoons of lemonade mix and the number of ounces of water they each use. Based on the tables, whose lemonade should have a weaker lemon flavor? Explain how you know. Yuna’s Lemonade
Scott’s Lemonade
Number of Tablespoons of Lemonade Mix
Number of Ounces of Water
Number of Tablespoons of Lemonade Mix
Number of Ounces of Water
2
12
3
15
6
36
5
25
12
72
10
50
Yuna’s lemonade should have a weaker lemon flavor because it has more ounces of water for every 1 tablespoon of lemonade mix than Scott’s lemonade. Yuna uses 36 ounces of water with 6 tablespoons of lemonade mix. Scott only uses 30 ounces of water with 6 tablespoons of lemonade mix. For problems 12–16, round the number to the nearest tenth.
12. 23.38 23.4 13. 23.451 23.5 14. 23.309 23.3 15. 23.055 23.1 16. 22.962 23.0
© Great Minds PBC
© Great Minds PBC
P R ACT I C E
237
327
17
LESSON 17
Rates Identify rates and unit rates. Calculate one quantity when given another quantity and a constant rate.
EUREKA MATH2
6 ▸ M1 ▸ TD ▸ Lesson 17
Name
Date
EXIT TICKET
17
Sasha swims 4 laps in 2 minutes. a. What is Sasha’s rate in laps per minute? What is the unit rate?
4¸2=2 Sasha’s rate is 2 laps per minute. The unit rate is 2. b. What is Sasha’s rate in minutes per lap? What is the unit rate?
2÷4 = 1
2
Lesson at a Glance In this lesson, students apply and extend their understanding of rates. They reason about an opening question that asks how long it would take one of the world’s fastest sports cars to travel the same distance that a bicycle travels in 12 hours. Students find unit rates for different rates and use the unit rates in calculations and in comparisons. Working in pairs, students analyze multiple representations of ratio relationships, such as ratio tables, double number lines, and graphs, to make sense of rate problems and ultimately answer the opening question. This lesson introduces the term unit rate.
Sasha’s rate is 12 minute per lap. The unit rate is 12 .
Key Questions • Why can any pair of quantities be described by two different unit rates? • How does knowing the unit rate help us find unknown quantities?
Achievement Descriptors 6.Mod1.AD2 Write and explain the unit rate that describes
a relationship between two quantities. (6.RP.A.2) 6.Mod1.AD6 Solve real-world problems by using unit rates. (6.RP.A.3.b)
© Great Minds PBC
247
© Great Minds PBC
EUREKA MATH2 6 ▸ M1 ▸ TD ▸ Lesson 17
Agenda
Materials
Fluency
Teacher
Launch 5 min
• Paper (4 sheets)
Learn 30 min
• Tape
• The Unit Rate
Students
• Another Unit Rate
• Sticky note
• Rates and the Coordinate Plane
Lesson Preparation
Land 10 min
• Use the paper to prepare four signs. Hang the signs around the room. Label the signs as follows: • A. 0.75 hours • B. 1.5 hours • C. 3.75 hours • D. 12 hours
© Great Minds PBC
329
EUREKA MATH2
6 ▸ M1 ▸ TD ▸ Lesson 17
Fluency Complete Ratio Tables Students complete ratio tables to prepare for calculating unit rates. Directions: Complete each ratio table. 1.
2.
330
Number of Cups of Bananas
Number of Cups of Grapes
1
3
1 3
1
2
6
Number of Cups
Number of Ounces
1
8
1 8
1
2
16
© Great Minds PBC
EUREKA MATH2 6 ▸ M1 ▸ TD ▸ Lesson 17
3.
Number of Miles
Number of Hours
1
1 40
40
1
240
6
© Great Minds PBC
331
EUREKA MATH2
6 ▸ M1 ▸ TD ▸ Lesson 17
Launch
5
Students reason about what information they need to solve a rate problem. Introduce the Take a Stand routine to the class. Draw students’ attention to the signs hanging in the classroom: A. 0.75 hours, B. 1.5 hours, C. 3.75 hours, D. 12 hours. Display the table showing the bike, the sports car, and the question. Invite students to stand beside the sign that best describes their thinking. Suppose you ride your bike from 8:00 a.m. to 8:00 p.m. at a constant speed. About how long would it take one of the world’s fastest sports cars to travel the same distance?
A. 0.75 hours B. 1.5 hours C. 3.75 hours D. 12 hours When all students are standing near a sign, allow about 1 minute for groups to discuss the reasons why they chose that sign. Next, call on each group to share reasons for their selection. Invite students who change their minds during the discussion to join a different group. Then ask students to write the letter of their choice on a sticky note. Use the sticky notes to create a class bar graph on the wall as shown to refer to later in the lesson. Have students return to their seats. As a class, reflect and consider what information they need to answer the question more accurately by using the following prompt. Encourage them to add on to their classmates’ responses. 332
C C A
C
A
B
C
A
B
C
B
C
B
C
A
B
C
D
A
B
C
D
A A
© Great Minds PBC
EUREKA MATH2 6 ▸ M1 ▸ TD ▸ Lesson 17
What do we need to know to answer this question? We need to know the speed of the bike. We need to know the speed of the sports car. We need to know how far we can ride a bike in 12 hours. Today, we will learn more about rates and explore strategies to help us answer the question about the bike and the sports car.
Learn The Unit Rate Students determine the rate for a ratio relationship and use the unit rate to find unknown quantities. Direct students to problem 1 and have them complete the problem in pairs. Circulate and ask the following questions as needed to prompt students’ thinking: • Where would you draw tick marks to represent 1 hour? 2 hours? 5 hours? • Can drawing more tick marks on the double number line help you find the number of miles that Blake rides his bike in 1 hour? 2 hours? 5 hours? If so, how? • Can you use Blake’s speed and what you know about equivalent ratios to determine the number of hours it takes him to ride his bike 30 miles? How? 1. The double number line represents the ratio relationship between the number of miles and the number of hours that Blake rides his bike.
Blake’s Bike Rides 0
45
90
135
180
0
3
6
9
12
Number of Miles Number of Hours
© Great Minds PBC
UDL: Representation Several problems throughout the lesson review prior understanding. Students write ratios and find rates by using multiple representations of ratio relationships. These problems build connections to the new learning about rates and unit rates.
333
EUREKA MATH2
6 ▸ M1 ▸ TD ▸ Lesson 17
a. What is Blake’s speed in miles per hour? Interpret its meaning.
Blake’s Bike Rides 0 Number of Miles Number of Hours 0
15 30
1
2
45
90
135
180
3
6
9
12
Blake’s speed is 15 miles per hour. For every hour that Blake rides his bike, he rides 15 miles. b. At this speed, how many hours does it take Blake to ride 30 miles? It takes Blake 2 hours to ride 30 miles. c. At this speed, how many miles does Blake ride if he rides his bike for 5 hours?
Blake’s Bike Rides 0 Number of Miles Number of Hours 0
15 30
1
2
45
3
60 75
4
5
90
135
180
6
9
12
Blake rides 75 miles in 5 hours. After several minutes, select students to share their answers and strategies. Continue the discussion by using the following prompt. How did finding Blake’s speed of 15 miles per hour help you find the answers to parts (b) and (c) of problem 1? We used Blake’s speed of 15 miles per hour to find that he rides his bike 15 miles in 1 hour, 30 miles in 2 hours, 45 miles in 3 hours, and so on. We were able to draw more tick marks on the double number line to find more equivalent ratios. 334
© Great Minds PBC
EUREKA MATH2 6 ▸ M1 ▸ TD ▸ Lesson 17
Display the ratio table from problem 2. Have students work the problem individually. 2. The ratio table represents the relationship between the number of miles and the number of hours that Kelly rides her bike. Who rides faster, Kelly or Blake? Explain. Kelly’s Bike Rides Number of Miles
Number of Hours
64
4
128
8
192
12
Number of hours: 4 ¸ 4 = 1 Number of miles: 64 ¸ 4 = 16 Kelly’s speed is 16 miles per hour. Because Blake’s speed is 15 miles per hour, Kelly rides faster. Have students compare their answers with a partner. Then select several students to share who they think rides their bike faster and why. Some students may find that Blake rides 60 miles in 4 hours and compare that to Kelly, who rides 64 miles in 4 hours. Others may extend the ratio table or draw a double number line to find Kelly’s speed in miles per hour. Encourage students to recognize that multiple strategies can confirm that Kelly rides faster than Blake. Use the following prompts to remind students that speed is an example of a rate and then to define unit rate. Speed is an example of a rate. In the last lesson, we learned the meaning of the term rate. A rate is a quantity that describes a ratio relationship between two types of quantities, such as miles and hours.
© Great Minds PBC
335
EUREKA MATH2
6 ▸ M1 ▸ TD ▸ Lesson 17
Some students found Kelly’s rate in miles per hour and compared that to Blake’s rate in miles per hour. The numbers they compared are called unit rates. When a rate is written so that the second of the two quantities is 1 unit, such as 16 miles per hour, the unit rate is the numerical part of the rate. For a rate of 16 miles per hour, the unit rate is 16. If the rate is 15 miles per hour, what is the unit rate? The unit rate is 15. Display the table showing the two rates for bike rentals. Bike Rentals
Language Support Consider adding the unit rate to the anchor chart from the last lesson.
$96.00 for every 8 hours
$72.00 for every 6 hours
Rate in dollars per hour:
Rate in dollars per hour:
It costs $10.00 for every 2 tickets to a soccer game.
Unit rate:
Unit rate:
Representation of the Ratio Relationship
What are the two types of quantities in the ratio relationships? The two types of quantities are dollars and hours. Are these rates written so that the second quantity is 1 hour? No. Assign the rate in the first column of the table to half the class and the rate in the second column of the table to the other half. Instruct students to find the rate in dollars per hour and the unit rate of the rate assigned to them. When students have finished, ask students from each half of the class to answer the following two questions. How did you find the rate in dollars per hour? Why did you do that? I divided 96 and 8 each by 8 so that the second quantity would be 1 hour. I divided 72 and 6 each by 6 so that the second quantity would be 1 hour.
336
Situation
Number of Dollars Number of Tickets
0
5
10
15
20
0
1
2
3
4
Ratios of the Number of Dollars to the Number of Tickets
5 : 1, 10 : 2, 15 : 3, 20 : 4, etc. Rates
$5.00 per ticket, $10.00 per 2 tickets, $15.00 per 3 tickets, $20.00 per 4 tickets, etc. Unit Rate
5
© Great Minds PBC
EUREKA MATH2 6 ▸ M1 ▸ TD ▸ Lesson 17
What is the rate in dollars per hour? What is the unit rate? The rate is $12.00 per hour. The unit rate is 12. After students realize that both rates given in the table are equivalent to the rate of $12.00 per hour, use the following prompts to relate the unit rate to the value of the ratio. The ratios of the number of dollars to the number of hours are 96 : 8 and 72 : 6. What is the value of each ratio? What do you notice? The value of each ratio is 12. I notice that it is the same as the unit rate. Yes. The value of the ratio and the unit rate are the same number. When given a rate, how can you identify the unit rate? Turn and talk to your partner. Allow several students to share their ideas. Then have students complete problem 3 in pairs. 3. The double number line represents the ratio relationship between the total cost in dollars and the number of gallons of gasoline. 0
13.50 27.00 40.50 54.00
Total Cost (dollars) Number of Gallons 0
5
10
15
20
a. What is the rate in dollars per gallon? Interpret its meaning. Number of gallons: 10 ¸ 10 = 1 Number of dollars: 27.00 ¸ 10 = 2.70 The rate is $2.70 per gallon. The cost is $2.70 for every 1 gallon of gasoline. b. What is the unit rate?
Teacher Note When students answer a question such as What is the rate in dollars per gallon? they should use the word dollars or the symbol $, but not both. Writing $2.70 dollars per gallon is equivalent to writing 2.70 dollars dollars per gallon, which is incorrect.
The unit rate is 2.7. c. At this rate, what is the total cost to fill a 26-gallon tank with gasoline if it is empty?
2.70 ´ 26 = 70.20 The total cost to fill a 26-gallon tank with gasoline is $70.20. © Great Minds PBC
337
EUREKA MATH2
6 ▸ M1 ▸ TD ▸ Lesson 17
d. A driver spends a total of $24.30 on gasoline. At this rate, how many gallons of gasoline does the driver buy?
24.30 ¸ 2.70 = 9 The driver buys 9 gallons of gasoline. Select a few students to share their solutions. For part (b), make sure students record that the unit rate is 2.7 and not $2.70. If necessary, rewrite $2.70 per gallon as 2.70 dollars per gallon. Remind students that when a rate is written as 15 miles per hour, the unit rate is the numerical part of the rate, or 15. So when the rate is 2.70 dollars per gallon, the unit rate is 2.70, which we write as 2.7.
Another Unit Rate Students find two rates for a given pair of quantities and use unit rates to solve problems. Present problem 4. Have students think–pair–share about the following questions. Problem 4 states that Yuna types at a constant rate of 2 minutes per page. Her teacher, Miss Song, types at a constant rate of 2 pages per minute. Do you think this means they type at the same rate? Why? Yes. Both have a unit rate of 2, so I think they must type at the same rate. No. Yuna’s rate is in minutes per page and Miss Song’s rate is in pages per minute, so I do not think they type at the same rate. Let’s consider the phrases: 2 minutes per page and 2 pages per minute. How are the phrases similar? How are the phrases different? Both have the number 2. They are both rates. Both involve pages and minutes.
Teacher Note When comparing rates, the quantities of the rates must be the same and in the same order. For example, the rates 2 miles per hour and 2 feet per hour do not compare the same quantities, even though both have a unit rate of 2. Similarly, even though the rates 2 pages per minute and 2 minutes per page both have a unit rate of 2, they do not compare the same quantities in the same order.
Minutes and pages are in different orders. Minutes per page is the number of minutes it takes to type 1 page. Pages per minute is the number of pages that can be typed in 1 minute. If students do not make the distinction, state that minutes per page is the number of minutes it takes to type 1 page, while pages per minute is the number of pages that can be typed in 1 minute. Then allow them to complete problem 4 in pairs. 338
© Great Minds PBC
EUREKA MATH2 6 ▸ M1 ▸ TD ▸ Lesson 17
4. Yuna types at a constant rate of 2 minutes per page. Her computer teacher, Miss Song, types at a constant rate of 2 pages per minute. a. Complete the ratio tables. Sample: Yuna’s Typing
Miss Song’s Typing
Number of Pages
Number of Minutes
Number of Pages
Number of Minutes
1
2
2
1
2
4
4
2
3
6
6
3
4
8
8
4
b. How many pages can Yuna type in 50 minutes? 100 minutes? Yuna can type 25 pages in 50 minutes. Yuna can type 50 pages in 100 minutes. c. What is Yuna’s rate in pages per minute? What is the unit rate? Yuna’s rate is 12 page per minute. The unit rate is 12 .
d. How many minutes does it take Miss Song to type 50 pages? 100 pages? It takes Miss Song 25 minutes to type 50 pages. It takes Miss Song 50 minutes to type 100 pages. e. What is Miss Song’s rate in minutes per page? What is the unit rate? Miss Song’s rate is 12 minute per page. The unit rate is 12 .
© Great Minds PBC
Teacher Note Some students may point out that not all pages have the same number of words or paragraphs, so it could take longer to type certain pages. Validate their observation and tell them that most rates in the real world are not constant. However, we can often assume constant rates to simplify our calculations and allow us to make predictions.
Differentiation: Challenge Consider deepening comprehension by asking the following questions after students complete problem 4. • How many times as fast as Yuna does Miss Song type? Miss Song types 4 times as fast as Yuna. • Another student, Scott, types faster than Yuna but slower than Miss Song. What could be Scott’s rate in pages per minute? What could be Scott’s rate in minutes per page? Sample: Scott could type 1 page per minute or 1 minute per page.
339
6 ▸ M1 ▸ TD ▸ Lesson 17
EUREKA MATH2
After a few minutes, select several students to share their answers and reasoning. Continue the discussion by having students think–pair–share about the following prompt. Ideally, students will share different strategies to explain how they know that Miss Song types faster. Who types faster, Yuna or Miss Song? How do you know? Miss Song types faster. It takes Yuna 100 minutes to type 50 pages, which is a rate of 2 minutes per page. It takes Miss Song 25 minutes to type 50 pages, which is a rate of 12 minute per page. So Miss Song types faster than Yuna.
Rates and the Coordinate Plane Students use the graph of a ratio relationship to find rates and solve problems. Display the graph from problem 5. Before allowing students to complete the problem, label the points on the graph. Ask students about the meaning of each ordered pair. For example, the ordered pair (5, 2) represents that 5 cans of peas have a total cost of $2.00. Consider plotting another point that represents 8 cans of peas and asking students to estimate the total cost. Then allow students to complete the problem in pairs. Encourage students to use the graph to check that their answers make sense.
340
© Great Minds PBC
EUREKA MATH2 6 ▸ M1 ▸ TD ▸ Lesson 17
5. The graph represents the ratio relationship between the number of cans of peas and the total cost in dollars of the cans of peas. y
Total Cost of Cans of Peas
Differentiation: Support To solve problems 5 and 6, suggest that students create a different tool to organize the ratios represented on the graphs, such as a ratio table or a double number line.
Total Cost (dollars)
4
3
2
1
0
5
10
x
Number of Cans of Peas
a. Write a ratio that relates the number of cans of peas to the total cost in dollars. What is the rate in cans of peas per dollar? What is the unit rate? A ratio that relates the number of cans of peas to the total cost in dollars is 5 : 2. Number of dollars: 2 ¸ 2 = 1 Number of cans: 5 ¸ 2 = 2.5 The rate is 2.5 cans of peas per dollar. The unit rate is 2.5.
© Great Minds PBC
341
EUREKA MATH2
6 ▸ M1 ▸ TD ▸ Lesson 17
b. Write a ratio that relates the total cost in dollars to the number of cans of peas. What is the rate in dollars per can of peas? What is the unit rate? A ratio that relates the total cost in dollars to the number of cans of peas is 2 : 5. Number of cans: 5 ¸ 5 = 1 Number of dollars: 2 ¸ 5 = 0.4 The rate is $0.40 per can. The unit rate is 0.4. c. What is the total cost of 8 cans of peas?
0.40 ´ 8 = 3.20 The total cost of 8 cans of peas is $3.20. d. How many cans of peas can someone buy for $8.00?
2.5 ´ 8 = 20 Someone can buy 20 cans of peas for $8.00. After several minutes, review answers with students. Then debrief the problem by asking the following questions. The ratio 15 : 6 is equivalent to the ratio 5 : 2. Without doing any calculations, how do you know the rate of 15 cans of peas for every $6.00 has the same unit rate as the rate in part (a)? Because the ratios are equivalent ratios, they are part of the same ratio relationship. So the values of the ratios are the same. Because the values of the ratios are the same, they have the same unit rate. Did you find one unit rate more helpful than the other to determine the total cost of 8 cans of peas in part (c)? Explain.
Yes. The rate of $0.40 per can was more helpful because I only had to do one step, multiply by 8. Because I knew that the total cost was $0.40 for 1 can of peas, I multiplied 0.40 and 1 each by 8 to get a total cost of $3.20 for 8 cans.
342
© Great Minds PBC
EUREKA MATH2 6 ▸ M1 ▸ TD ▸ Lesson 17
Did you find one unit rate more helpful than the other to determine the number of cans of peas someone can buy for a total cost of $8.00 in part (d)? Explain.
Yes. The rate of 2.5 cans per dollar was more helpful because I only had to do one step, multiply by 8. Because I knew that 2.5 cans had a total cost of $1.00, I multiplied 2.5 and 1 each by 8 to get 20 cans of peas for a total cost of $8.00. Have students use the remaining time to complete problem 6 in pairs. If time is limited, present students with the solutions instead. 6. Suppose that a professional auto racer drives one of the world’s fastest sports cars at its top speed. The graph represents the ratio relationship between the number of hours and the number of miles the auto racer drives the sports car. Assume that the auto racer drives the sports car at a constant rate.
Sports Car
y 900 800
Number of Miles
700 600 500 400 300 200 100
0
0.5
1
1.5
2
2.5
3
3.5
4
x
Number of Hours
© Great Minds PBC
343
EUREKA MATH2
6 ▸ M1 ▸ TD ▸ Lesson 17
a. Based on the graph, what is the rate the auto racer drives the sports car in miles per hour? What is the unit rate? The rate the auto racer drives the sports car is 300 miles per hour. The unit rate is 300. b. Based on the graph, what is the rate the auto racer drives the sports car in hours per mile? What is the unit rate? Number of miles: 300 ¸ 300 = 1 Number of hours: 1 ÷ 300 =
1 300 100
The rate the auto racer drives the sports car is
Promoting the Standards for Mathematical Practice Students reason quantitatively and abstractly (MP2) when they use unit rates to reason about the speed of a bike and a sports car. Ask the following questions to promote MP2:
1 300
hour per mile. The unit rate is
c. Suppose you could ride your bike for 12 hours at a constant speed of 15 miles per hour. How many hours would it take the auto racer to drive the sports car the same distance?
1 . 300
• What does the problem ask you to do? • What does the unit rate tell you about the speed of a bike? • What does the unit rate of 300 mean in the context of the sports car?
If I ride my bike 15 miles in 1 hour, then I ride 180 miles in 12 hours because 15 ´ 12 = 180. 1 If it takes the auto racer 300 hour to drive the sports car 1 mile, then it would take 1 0.6 hours to drive 180 miles because 300 ×180 = 0.6.
It would take the auto racer 0.6 hours to drive the sports car the same distance that I ride my bike in 12 hours. Discuss the answers and have students share their strategies for part (c). Compare the correct answer to part (c) to the class bar graph made at the beginning of the lesson.
344
© Great Minds PBC
EUREKA MATH2 6 ▸ M1 ▸ TD ▸ Lesson 17
Land Debrief 5 min Objectives: Identify rates and unit rates. Calculate one quantity when given another quantity and a constant rate. Facilitate a class discussion by using the following prompts. Encourage students to add on to their classmates’ responses. In your own words, describe what a unit rate is. Then give an example. The unit rate is the number in a rate when the second quantity has a value of 1. The unit rate is the same as the value of the ratio. If the rate is 15 miles per hour, then the unit rate is 15. Why can any pair of quantities be described by two different unit rates? Give an example from the lesson where we wrote two different unit rates for a pair of quantities. We can write any pair of quantities as the amount of the first quantity per 1 unit of the second quantity and as the amount of the second quantity per 1 unit of the first quantity. For example, we found the rates 2.5 cans of peas per dollar and $0.40 per can of peas. The unit rates are 2.5 and 0.4. How does knowing the unit rate help us find unknown quantities? Give an example from the lesson where you used the unit rate to find an unknown quantity. We can use the unit rate in calculations. We found the rate the auto racer drives the 1 1 sports car in hours per mile, 300 hour per 1 mile. Then we multiplied 300 by 180 to find the number of hours it would take the auto racer to drive the sports car 180 miles.
Exit Ticket 5 min Provide up to 5 minutes for students to complete the Exit Ticket. It is possible to gather formative data even if some students do not complete every problem.
© Great Minds PBC
Teacher Note Assign the Practice problems for completion outside of class or use them in class if time remains after the lesson. Refer students to the Recap for support.
345
EUREKA MATH2
6 ▸ M1 ▸ TD ▸ Lesson 17
Recap
EUREKA MATH2
6 ▸ M1 ▸ TD ▸ Lesson 17
RECAP Name
Date
17
Terminology
In this lesson, we
When a rate is written so that
wrote rates to describe real-world situations.
•
calculated unit rates.
•
used unit rates to find unknown quantities.
a. What is Sana’s jogging rate in steps per minute? Sana’s jogging rate is 170 steps per minute. b. When the rate is expressed in steps per minute, what is the unit rate?
Rates •
the second of the two quantities is 1 unit, the unit rate is the
c. At this rate, how many steps does Sana take in 7 minutes? Sana takes 1,190 steps in 7 minutes.
a. What is the rate in oranges per dollar? The rate is 4 oranges per dollar.
1,785
b. What is the rate in dollars per orange?
1,530
The rate is $0.25 per orange.
1,275
c. What is the price of 20 oranges? The price of 20 oranges is $5.00.
The ordered pair (3, 510) shows that
1,020 765
d. Mrs. Chan has $9.00. What is the greatest number of oranges she can buy?
Sana takes
She can buy 36 oranges with $9.00.
510 steps in 3 minutes.
510
1
170
3
510
÷3
Sana takes 170 steps in 1 minute. Multiply 170 and 1 each by 7 to calculate the number of steps she takes in 7 minutes.
2. A grocery store sells 12 oranges for $3.00.
Sana’s Jog
y
Number of Steps Sana Takes
The rate is 170 steps per minute. The numerical part of the rate is 170.
numerical part of the rate.
1. Sana’s fitness tracker counts the number of steps she takes. The graph shows the ratio relationship between the number of steps Sana takes and the number of minutes she jogs.
Number of Minutes
÷3
The unit rate is 170.
Examples
Number of Steps Sana Takes
EUREKA MATH2
6 ▸ M1 ▸ TD ▸ Lesson 17
Number of Oranges
Number of Dollars
4
1
12
3
Number of Oranges
Number of Dollars
1
0.25
12
3
÷3
÷12
÷3
÷12
255
0
1
2
3
4
5
6
7
8
9
10
x
Because the rate is 4 oranges per dollar, the unit rate is 4. Multiply the unit rate by 9 to find the greatest number of oranges Mrs. Chan can buy with $9.00.
Number of Minutes
© Great Minds PBC
346
249
250
RECAP
Because the rate is $0.25 per orange, the unit rate is 0.25. Multiply the unit rate by 20 to find the price of 20 oranges.
© Great Minds PBC
© Great Minds PBC
EUREKA MATH2 6 ▸ M1 ▸ TD ▸ Lesson 17
Sample Solutions Expect to see varied solution paths. Accept accurate responses, reasonable explanations, and equivalent answers for all student work.
EUREKA MATH2
6 ▸ M1 ▸ TD ▸ Lesson 17
PRACTICE Name
Date
17
EUREKA MATH2
6 ▸ M1 ▸ TD ▸ Lesson 17
2. Adesh is jumping rope. The double number line represents the number of minutes and the number of jumps Adesh does.
1. Lacy earns a rate of $20.00 per hour tutoring.
0
2
4
6
0
110
220
330
Number of Minutes
a. What is the unit rate?
Number of Jumps
The unit rate is 20. b. Complete the ratio table to show the number of hours Lacy tutors and the total amount of money she earns. Number of Hours
Total Amount Earned
1
$20.00
2
$40.00
3
$60.00
4
$80.00
5
$100.00
a. What is Adesh’s jumping rate in jumps per minute? Adesh’s jumping rate is 55 jumps per minute. b. What is the unit rate? The unit rate is 55. c. At this rate, how many jumps can Adesh do in 5 minutes? Adesh can do 275 jumps in 5 minutes. 3. Blake fills 10 water balloons in 4 minutes. a. What is this rate in water balloons filled per minute? What is the unit rate? The rate is 25 water balloons filled per minute. The unit rate is 25 .
c. At this rate, how much money does Lacy earn if she tutors for 8 hours? Lacy earns $160.00 if she tutors for 8 hours.
b. What is this rate in minutes per water balloon filled? What is the unit rate? The rate is 25 minutes per water balloon filled. The unit rate is 25 .
d. At this rate, how many hours must Lacy tutor to earn $200.00? Lacy must tutor for 10 hours to earn $200.00.
© Great Minds PBC
© Great Minds PBC
251
252
P R ACT I C E
© Great Minds PBC
347
EUREKA MATH2
6 ▸ M1 ▸ TD ▸ Lesson 17
EUREKA MATH2
6 ▸ M1 ▸ TD ▸ Lesson 17
4. A grocery store sells 5 cans of soup for $2.50.
EUREKA MATH2
6 ▸ M1 ▸ TD ▸ Lesson 17
6. Noah earns $30.00 for dog sitting for 4 days. Noah determines his rate in dollars per day and thinks the unit rate is 30. Do you agree or disagree with Noah? Justify your reasoning.
a. What is the rate in cans per dollar? The rate is 2 cans per dollar.
300 280 260
Number of days: 4 ¸ 4 = 1 Number of dollars: 30 ¸ 4 = 7.50
The rate is $0.50 per can.
I disagree with Noah. He earns a rate of $7.50 per day, so the unit rate is 7.5.
c. What is the price of 10 cans of soup? The price of 10 cans of soup is $5.00.
7. The graph shows the ratio relationship between the number of miles a school bus travels and the number of gallons of fuel the school bus uses. Which statements appear to be true? Choose all that apply.
d. Miss Baker has $15.00. What is the greatest number of cans of soup she can buy? She can buy 30 cans of soup.
Number of Minutes
2
3
1
1.5
2 3
1
220 200 180 160 140 120 100 80 60 40 20 0
10
20
30
40
50
60
70
80
90
x
Number of Gallons of Fuel
A. The bus travels 4 miles per gallon of fuel.
5. Eddie runs 2 laps around the gym every 3 minutes. Ryan says that Eddie runs at a rate of 1.5 laps per minute. Do you agree or disagree with Ryan? Use a ratio table or double number line to justify your reasoning. Number of Laps
240
Number of Miles
b. What is the rate in dollars per can?
School Bus
y
B. The bus uses 4 gallons of fuel per mile. C. The bus uses 40 gallons of fuel for every 160 miles. D. The bus travels 14 mile per gallon of fuel. E. The bus uses 14 gallon of fuel per mile.
I disagree with Ryan. Eddie runs at a rate of 23 laps per minute or 1.5 minutes per lap.
© Great Minds PBC
348
P R ACT I C E
253
254
P R ACT I C E
© Great Minds PBC
© Great Minds PBC
EUREKA MATH2 6 ▸ M1 ▸ TD ▸ Lesson 17
EUREKA MATH2
6 ▸ M1 ▸ TD ▸ Lesson 17
Remember For problems 8 and 9, divide. Write the quotient and the remainder on separate lines.
8. 6,245 ¸ 7 Quotient:
9. 9,371 ¸ 4 892
Remainder:
1
Quotient: 2,342 Remainder:
3
10. Sasha and Julie make applesauce. Sasha uses 15 apples for every 3 pints of applesauce she makes. Julie uses 24 apples for every 6 pints of applesauce she makes. Who uses more apples per pint of applesauce? How do you know? Sasha uses more apples per pint of applesauce than Julie. The value of the ratio of the number of apples to the number of pints of applesauce for Sasha is 5, which means Sasha uses 5 apples per pint. The value of the ratio of the number of apples to the number of pints of applesauce for Julie is 4, which means Julie uses 4 apples per pint.
11. Round 152.096 to the indicated place value. a. hundredth
152.10 b. tenth
152.1 c. one
152 d. ten
150
© Great Minds PBC
© Great Minds PBC
P R ACT I C E
255
349
18
LESSON 18
Comparing Rates Compare rates with like units of measurement by using unit rate.
EUREKA MATH2
6 ▸ M1 ▸ TD ▸ Lesson 18
Name
Date
EXIT TICKET
18
A museum website sells 30 tickets for $480.00. The museum office sells each ticket for $15.00. Which method for buying tickets costs less per ticket? Explain how you know. The cost per ticket from the museum website is $16.00. The cost per ticket from the museum office is $15.00. Buying tickets from the museum office costs less per ticket than buying tickets from the museum website. Cost of Tickets from Museum Website Number of Tickets
Number of Tickets
Total Cost (dollars)
1
16
1
15
15
240
15
225
30
480
30
450
In this lesson, students tap to the beat of two songs and record the number of beats in a given number of seconds. Students find the number of beats per minute, and then use this rate to identify the unit rate. Students use unit rates to compare tempos of songs and determine how their walking tempos compare to other tempos.
Key Question
Cost of Tickets from Museum Office
Total Cost (dollars)
Lesson at a Glance
• How can we use unit rates to compare two situations?
Achievement Descriptors 6.Mod1.AD2 Write and explain the unit rate that describes
a relationship between two quantities. (6.RP.A.2) 6.Mod1.AD5 Compare ratio relationships by using various
representations. (6.RP.A.3.a) 6.Mod1.AD6 Solve real-world problems by using unit rates. (6.RP.A.3.b)
© Great Minds PBC
261
© Great Minds PBC
EUREKA MATH2 6 ▸ M1 ▸ TD ▸ Lesson 18
Agenda
Materials
Fluency
Teacher
Launch 5 min
• Stopwatch
Learn 30 min
Students
• Drumming to the Beat
• Stopwatch (1 per student group)
• Which Is Faster?
Lesson Preparation
• The Perfect Tempo
• None
Land 10 min
© Great Minds PBC
351
EUREKA MATH2
6 ▸ M1 ▸ TD ▸ Lesson 18
Fluency Calculate Rates Students calculate rates to prepare for comparing rates. Directions: Determine the value that belongs in each blank to make the sentence true. 1.
Running 3miles in 2 4minutes is the same rate as running miles per minute.
1_ 8
2.
Traveling 1 10miles in 2 hours is the same rate as traveling miles per hour.
55
3.
Earning $ 44.00for 4 hours of work is the same rate as earning $ per hour.
11.00
4.
Charging $ 6.00for 1 2pounds of apples is the same rate as charging $ per pound.
0.50
5.
Charging $ 5.00for 4 pounds of carrots is the same rate as charging $ per pound.
1.25
6.
Using 2 cups of lemonade mix for 3liters of water is the same rate as using cups of lemonade mix per liter.
2 3
352
_
© Great Minds PBC
EUREKA MATH2 6 ▸ M1 ▸ TD ▸ Lesson 18
Launch
5
Students make estimations about the number of beats per minute in songs. Play Song 1 and invite the class to clap or tap to the beat of the song. What is your estimate for the rate in beats per minute? Sample: 5 0beats per minute Once the class feels comfortable with clapping or tapping to the beat, set a timer for 10 seconds. As students clap or tap to the beat, start the timer and use tally marks to count the number of beats for 10 seconds.
UDL: Engagement This lesson promotes engagement by connecting rate reasoning to music tempos. Consider playing other songs that are more relevant to your students’ unique interests and cultures.
Play Song 2 and invite the class to clap or tap to the beat of that song. What is your estimate for the rate in beats per minute? Sample: 1 00beats per minute Once the class feels comfortable with clapping or tapping to the beat, set a timer for 20 seconds. As students clap or tap to the beat, start the timer and use tally marks to count the number of beats for 20 seconds. The speed at which a piece of music is played is called tempo. Which song do you think has a faster tempo? Why?
Language Support
I think song 2 has a faster tempo. I was tapping faster to song 2 than to song 1. Use the following question to guide students to understand that to they need a way to quantify the tempos to compare tempos precisely. Sometimes we can tell which song has a faster tempo based on a feeling after listening to the songs. How can we determine whether our feeling is right?
To help students understand the meaning of the word tempo, consider asking student volunteers to jump, dance, or clap at a slow tempo and then at a fast tempo.
We can compare the number of beats each song has during the same amount of time. Today, we will compare tempos of different songs in beats per minute to determine which song has a faster tempo.
© Great Minds PBC
353
EUREKA MATH2
6 ▸ M1 ▸ TD ▸ Lesson 18
Learn Drumming to the Beat Students interpret two rates in context and compare them. Introduce problem 1 by using the following prompt. Tempo is usually given in beats per minute or beats per 60seconds. Use what you know about rates to find the number of beats per minute for each song. Display the tables in problem 1. Invite students to work with a partner to complete the tables. Circulate as students work, and observe how they find the number of beats per minute. 1. Use what you know about rates to find the number of beats per minute for each song. Sample:
Students reason abstractly and quantitatively (MP2) when they explore the relationship between the unit rate in beats per minute and the tempo of different songs. Ask the following questions to promote MP2: • What does the unit rate tell you about the tempo of a song? • How do the units involved in the tempo help you think about this problem?
Song 1 Number of Beats
Number of Seconds
20
10
120
60
Sample: Song 2
354
Promoting the Standards for Mathematical Practice
Number of Beats
Number of Seconds
50
20
150
60
• How does a graph represent the tempo of a song?
Teacher Note Some students may wonder why they are using beats per minute instead of beats per second. Explain that the standard in music is to use beats per minute and that some values could be difficult to understand if students used beats per second. For example, 129 beats per minute is easier to understand than 2.15beats per second.
© Great Minds PBC
EUREKA MATH2 6 ▸ M1 ▸ TD ▸ Lesson 18
Bring the class back together and ask one or two students to share the number of beats per minute for each song. How did you find the number of beats per minute for each song?
If students need additional support determining the number of beats in 60seconds, consider asking the following questions:
If there are 20beats in 1 0seconds, then there must be 6 times as many beats in 1 minute as in 1 0seconds. So the number of beats per minute for song 1 is 1 20. If there are 5 0beats in 2 0seconds, then there must be 3 times as many beats in 1 minute as in 20seconds. So the number of beats per minute for song 2 is 1 50.
• How many groups of 10 seconds are in 1 minute?
The number of beats per minute, or the tempo, for each song is a unit rate. Based on the unit rates in your tables, which song has a faster tempo? How do you know?
• If there are 6 groups of 10 seconds in 1minute, how do you find the number of beats in 1 minute?
Song 2 has a faster tempo. It has more beats per minute. y
Reveal that the actual tempos are 1 20beats per minute for song 1 and 1 50beats per minute for song 2. Then display the graph that shows the number of beats per second for each song.
Yes. The points that represent the song with the faster tempo are higher on the graph than the points that represent the song with the slower tempo. A song with a faster tempo has more beats per second. Why did we calculate both rates in beats per minute? We calculated both rates in beats per minute to compare the rates by using the same amount of time.
© Great Minds PBC
• If there are 3 groups of 20 seconds in 1minute, how do you find the number of beats in 1 minute?
20
Number of Beats
Can we tell which song has the faster tempo by looking at the graph? How?
• How many groups of 20 seconds are in 1minute?
25
Ask the following questions.
Differentiation: Support
Differentiation: Challenge
15
For students who need an additional challenge, consider using the following prompt:
10
Suppose the tempo for a third song is
175 beats per minute. How would the graph that represents the tempo of the third song compare to the graph that represents the tempos for songs 1 and 2?
Song 1
5
Song 2
0
5
10
15
x
Number of Seconds
355
EUREKA MATH2
6 ▸ M1 ▸ TD ▸ Lesson 18
Which Is Faster? Students convert and compare rates when one unit of measurement must be converted to compare. Display problem 2. Invite students to complete the problem by circling the song with a faster tempo. 2. Consider the graph that represents the tempos of song A and song B. Which song has a faster tempo? Song A Song B
Number of Beats
y
Song A Song B
x
Number of Minutes
356
© Great Minds PBC
EUREKA MATH2 6 ▸ M1 ▸ TD ▸ Lesson 18
Confirm the answer. How did you determine which song has a faster tempo? I looked for the points that are higher on the graph. What additional information would be helpful if you wanted to know how much faster the tempo for one song is than the other? Knowing the number of beats per minute for each song would be helpful. Have students work in pairs to complete problem 3. 3. The table shows the number of beats in a given number of minutes for songs A, B, C, and D. Song
Number of Beats
Number of Minutes
Unit Rate
A
300
6
50
B
600
5
120
C
1,200
12
100
D
560
7
80
a. Complete the table by determining the unit rate in beats per minute for each song. b. Order the songs from the slowest tempo to the fastest tempo. A, D, C, B When students are finished, bring the class together. Invite students to share the unit rates they found. Consider displaying the table and adding the unit rates as students share.
© Great Minds PBC
357
6 ▸ M1 ▸ TD ▸ Lesson 18
EUREKA MATH2
How did you determine the unit rate in beats per minute for each song? I divided the number of beats by the number of minutes. What is the order of the songs from the slowest tempo to the fastest tempo? A, D, C, B
The Perfect Tempo Students calculate a rate and compare it to given rates. Introduce problems 4 and 5 by using the following prompt. We often choose music based on the activity we are doing. For example, songs that are good for dancing typically have a faster tempo than songs that are good to study by. Imagine that we want to find a song with a good walking tempo so that each step lands exactly on one beat of the song. We first need to determine our walking tempos. Divide students into groups of three and distribute a stopwatch to each group. Explain that one student will walk around the classroom, another student will time the first student for 10 seconds, and the third student will count the number of steps the first student takes during that time. When students are finished, have them complete problems 4 and 5. 4. Suppose one step is equivalent to one beat. Complete the following sentence. My group’s walking tempo is _____ beats in 1 0 seconds. Sample: 2 4 5. Tempos for a song that is good for dancing and a song that is good to study by are shown. Is your group’s walking tempo faster or slower than the tempos of the dancing song and the studying song? How do you know? Dancing song: 7 20 beats in 4 minutes Studying song: 7 20 beats in 8 minutes 720beats in 4 minutes is equivalent to 1 80beats per minute because 7 20 ÷ 4 = 180. Sample:
358
© Great Minds PBC
EUREKA MATH2 6 ▸ M1 ▸ TD ▸ Lesson 18
720beats in 8 minutes is equivalent to 9 0beats per minute because 7 20 ÷ 8 = 90.
24beats in 1 0seconds is equivalent to 1 44beats per minute because 2 4 × 6 = 144.
Because 1 44 > 90and 1 44 < 180, my group’s walking tempo is faster than the tempo of the studying song but slower than the tempo of the dancing song. As students finish problem 5, invite each group to share their walking tempo. Then debrief problems 4 and 5 by using the following questions. How do you know your group’s walking tempo is between the tempos that are good for dancing and good for studying? I found the number of beats per minute for the dancing song, the studying song, and my group’s walking tempo. The number of beats per minute for my group’s walking tempo is less than the number of beats per minute for the dancing song but greater than the number of beats per minute for the studying song.
Teacher Note Consider having each group use a sticky note to record their walking tempo in number of beats per minute. Then use the sticky notes to create a class line plot. Expect students to notice that although the walking tempos are different, they are all between the tempos for the studying song and the dancing song.
How would points on a graph that represent your group’s walking tempo compare to points on a graph that represent tempos that are good for dancing and for studying? The points that represent the walking tempo would be higher on the graph than the points that represent the tempo for studying but lower on the graph than the points that represent the tempo for dancing.
© Great Minds PBC
359
EUREKA MATH2
6 ▸ M1 ▸ TD ▸ Lesson 18
Land Debrief 5 min Objective: Compare rates with like units of measurement by using unit rate. Use the following prompts to guide a discussion about comparing rates. How did we find the tempo of a song in beats per minute in today’s activity? What does this unit rate represent? We divided the number of beats by the number of minutes to find the tempo. This unit rate represents the number of beats in 1 minute for a song. How can we use unit rates to compare two situations such as the tempos of two different songs? We can find the unit rate by finding the number of beats per minute. When we know the unit rates in beats per minute for two songs, we can compare the two numbers to determine which song has a faster tempo.
Exit Ticket 5 min Provide up to 5 minutes for students to complete the Exit Ticket. It is possible to gather formative data even if some students do not complete every problem.
Teacher Note Assign the Practice problems for completion outside of class or use them in class if time remains after the lesson. Refer students to the Recap for support.
360
© Great Minds PBC
EUREKA MATH2 6 ▸ M1 ▸ TD ▸ Lesson 18
Recap
EUREKA MATH2
6 ▸ M1 ▸ TD ▸ Lesson 18
RECAP Name
Date
18
Comparing Rates
2. Kelly’s printer can print 20 pages per minute. Adesh’s printer can print 1 page per second. Whose printer is faster? 2 Explain your reasoning. Adesh’s printer is faster than Kelly’s printer because Adesh’s printer can print 30 pages in 60 seconds, which is 30 pages per minute. Kelly’s printer can only print 20 pages per minute.
In this lesson, we •
compared rates that had the same types of quantities.
•
converted units of time to compare two different rates.
Examples
To compare rates, make sure both rates have the same
1. Flower City sells marigold plants for $0.90 each. Garden Center sells 3 marigold plants for $3.15. Which store has the lower price per marigold plant? Explain your reasoning.
unit. Find the rate Adesh’s printer can print in pages
1
2
Adesh’s Printer Number of Pages
Number of Seconds
1 2
1
30
60
× 60
× 60
per minute by multiplying 12
Garden Center 0
EUREKA MATH2
6 ▸ M1 ▸ TD ▸ Lesson 18
and 1 each by 60.
3
Number of Marigold Plants Another strategy is to compare the rate of each printer in pages per second. Kelly’s printer can print 20 pages in 1 minute, or 60 seconds.
Price (dollars) 0
1.05
2.10
To compare the rates as pages per second, divide 20 and 60 each by 60 to find the rate Kelly’s printer can print in pages per second.
3.15
Kelly’s Printer
At Garden Center, the price of 3 marigold plants
is $3.15. To find the price of 1 marigold plant, divide 3.15 by 3. The price of each marigold
Number of Pages
Number of Seconds
20
60
1 3
1
plant at Garden Center is $1.05.
÷ 60
At Flower City, the price of 1 marigold plant is $0.90. At Garden Center, the price of 1 marigold plant is $1.05. So Flower City has a lower price per marigold plant than Garden Center. At Flower City, the price of 1 marigold plant is $0.90. So the price of 3 marigold plants is $2.70 because
This confirms that Adesh’s printer is faster than Kelly’s printer, because 1 page per second is faster than 13 page per second. 2
0.9 × 3 = 2.7. Flower City also has a lower price per 3 marigold plants than Garden Center.
© Great Minds PBC
© Great Minds PBC
÷ 60
263
264
RECAP
© Great Minds PBC
361
EUREKA MATH2
6 ▸ M1 ▸ TD ▸ Lesson 18
Sample Solutions Expect to see varied solution paths. Accept accurate responses, reasonable explanations, and equivalent answers for all student work.
EUREKA MATH2
6 ▸ M1 ▸ TD ▸ Lesson 18
PRACTICE Name
Date
18
3. Bus A travels 10 miles in 15 minutes. Bus B travels 8 miles in 10 minutes. Both buses start traveling at the same time. At these rates, which bus travels 50 miles first? Create two tables to show how you know.
1. The tables represent Kayla’s and Toby’s text messaging rates. Who sends more text messages per week? Explain.
Bus A
Toby
Kayla Number of Weeks
Number of Text Messages Sent
Number of Weeks
Number of Text Messages Sent
1
750
2
1,250
3
2,250
4
2,500
2. The tables show the number of ounces of blueberries used to make different numbers of muffins at Happy Muffin Shop and Sunny Muffin Shop. Lisa likes muffins with a lot of blueberries. Which muffin shop would you recommend to Lisa? Explain.
Number of Ounces of Blueberries
Bus B
Number of Miles
Number of Minutes
Number of Miles
Number of Minutes
10
15
8
10
50
75
50
62.5
Bus B travels 50 miles first. It takes bus A 75 minutes to travel 50 miles, but it takes bus B 62.5 minutes to travel 50 miles.
Kayla sends more text messages per week than Toby. Kayla sends 750 text messages per week, and Toby sends 625 text messages per week.
Happy Muffin Shop
EUREKA MATH2
6 ▸ M1 ▸ TD ▸ Lesson 18
Sunny Muffin Shop
4. Yuna earns $266.00 grooming 14 poodles. Tyler earns $180.00 grooming 9 poodles. Who earns less per poodle? Explain your reasoning. Yuna earns less per poodle than Tyler because Yuna earns $19.00 per poodle and Tyler earns
$20.00 per poodle.
5. Car wash A washes 5 cars in 1 hour. Car wash B washes 1 car in 15 minutes. Which company washes cars at a faster rate? Complete the double number lines to support your answer.
Number of Muffins
Number of Ounces of Blueberries
Number of Muffins
12
24
60
80
Number of Cars Washed
24
48
90
120
Number of Minutes
Car Wash A
Happy Muffin Shop: 12 ÷ 24 = 12
Car Wash B
0
1
2
3
4
5
0
12
24
36
48
60
Number of Cars Washed Number of Minutes
0
1
2
3
4
0
15
30
45
60
Car wash A washes cars at a faster rate than car wash B. Car wash A washes 1 car in 12 minutes, but car wash B washes 1 car in 15 minutes.
Sunny Muffin Shop: 60 ÷ 80 = 43 I would recommend Sunny Muffin Shop to Lisa because Sunny Muffin Shop uses more ounces of blueberries per muffin than Happy Muffin Shop. At Happy Muffin Shop, there is 12 ounce of blueberries per muffin. At Sunny Muffin Shop, there are 43 ounces of blueberries per muffin.
© Great Minds PBC
362
265
266
P R ACT I C E
© Great Minds PBC
© Great Minds PBC
EUREKA MATH2 6 ▸ M1 ▸ TD ▸ Lesson 18
EUREKA MATH2
6 ▸ M1 ▸ TD ▸ Lesson 18
9. A hot air balloon travels at a constant speed of 15 miles per hour.
6. Sana makes 4 sandwiches in 8 minutes. Kelly says Sana’s rate is 0.5 sandwiches per minute. Ryan says Sana’s rate is 2 sandwiches per minute. Who is correct? Create two tables to show how you know. Number of Sandwiches
Number of Minutes
4
8
0.5
1
EUREKA MATH2
6 ▸ M1 ▸ TD ▸ Lesson 18
a. Interpret the meaning of 15 miles per hour in this situation. For every hour, the hot air balloon travels 15 miles. b. Complete the ratio table. Number of Hours
Number of Miles
1
15
Number of sandwiches: 4 ¸ 8 = 0.5
2
30
Kelly is correct. Because Sana makes 4 sandwiches in 8 minutes, she makes 0.5 sandwiches per minute.
3
45
4
60
Number of minutes: 8 ¸ 8 = 1
Remember c. Use the ratio table from part (b) to create a double number line that models this situation.
For problems 7 and 8, divide. Write the quotient and the remainder on separate lines.
7. 6,874 ¸ 3
8. 10,580 ¸ 6
Quotient: 2,291 Remainder:
1
Quotient: 1,763 Remainder:
0
1
2
3
4
0
15
30
45
60
Number of Hours Number of Miles
2
10. Which pairs of fractions and decimals are equivalent? Choose all that apply.
A. 102 and 0.2
© Great Minds PBC
© Great Minds PBC
P R ACT I C E
267
268
B.
7 10
and 0.07
C.
3 100
and 0.3
D.
6 100
and 0.06
E.
19 100
and 0.19
P R ACT I C E
© Great Minds PBC
363
19
LESSON 19
Using Rates to Convert Units Convert units of measurement by applying rate reasoning.
EUREKA MATH2
6 ▸ M1 ▸ TD ▸ Lesson 19
Name
Date
EXIT TICKET
19
Water flows from a faucet at a rate of 1.7 gallons per minute. a. At what rate does the water flow from the faucet in liters per minute? Use 1 gallon » 3.79 liters. Round your answer to the nearest tenth.
1.7 ´ 3.79 = 6.443 The water flows at a rate of about 6.4 liters per minute. b. At this rate, about how long would it take to fill a 500-liter fish tank? Round your answer to the nearest minute.
500 ¸ 6.4 = 78.125
Lesson at a Glance Students begin this lesson by applying their understanding of rates and unit rate to perform familiar unit conversions. Students work independently and in pairs to perform unit conversions within the same measurement system and in different measurement systems. In pairs, students solve multi-step word problems requiring unit conversions. Students conclude this lesson with a discussion on how rates can help when converting units of measurement and how this applies to solving real-world problems.
Key Questions
It would take about 78 minutes to fill the fish tank.
• Why are unit conversions examples of rates? • How do unit rates help when converting units of measurement?
Achievement Descriptors 6.Mod1.AD2 Write and explain the unit rate that describes
a relationship between two quantities. (6.RP.A.2) 6.Mod1.AD6 Solve real-world problems by using unit rates. (6.RP.A.3.b) 6.Mod1.AD9 Convert among units by using ratio reasoning to solve
problems. (6.RP.A.3.d)
© Great Minds PBC
277
© Great Minds PBC
EUREKA MATH2 6 ▸ M1 ▸ TD ▸ Lesson 19
Agenda
Materials
Fluency
Teacher
Launch 5 min
• None
Learn 30 min
Students
• Unit Conversions as Rates
• Measurement Conversions Reference Table
• Using Rates to Convert Across Measurement Systems • Using Rates to Solve MultiStep Problems
Lesson Preparation • None
Land 10 min
© Great Minds PBC
365
EUREKA MATH2
6 ▸ M1 ▸ TD ▸ Lesson 19
Fluency Convert Metric Units Students convert metric and time units to prepare for using rates to convert units. Directions: Convert between the measurement units. 1.
1 kilometer =
2.
1 meter =
3. 4. 5. 6.
1 kilogram = 1 week = 1 day = 1 hour =
meters
1,000
centimeters
100
grams days hours minutes
1,000 7 24 60
Teacher Note Instead of this lesson’s Fluency, consider administering the Metric Conversions Sprint. Directions for administration can be found in the Fluency resource.
A
Number Correct:
Convert each measurement to the given unit. 1.
1 km =
m
23.
6 km =
m
2.
2 km =
m
24.
6.5 km =
m
3.
3 km =
m
25.
6.35 km =
m
4.
7 km =
m
26.
6.125 km =
m
5.
5 km =
m
27.
9.054 km =
6.
1m =
cm
28.
7m =
cm
7.
2m =
cm
29.
7.5 m =
cm
8.
m
3m =
cm
30.
7.48 m =
cm
9.
9m =
cm
31.
7.03 m =
cm
10.
6m =
cm
32.
7.035 m =
cm
11.
12 m =
cm
33.
500 cm =
m
12.
1,000 m =
km
34.
515 cm =
m
13.
9,000 m =
km
35.
510 cm =
m
14.
8,000 m =
km
36.
523.4 cm =
15.
5,000 m =
km
37.
100 cm =
m
16.
500 m =
km
38.
50 cm =
m
17.
100 cm =
m
39.
75 cm =
m
18.
200 cm =
m
40.
25 cm =
m
19.
300 cm =
m
41.
125 cm =
m
20.
900 cm =
m
42.
125 m =
km
21.
1,000 cm =
m
43.
125 km =
m
22.
10 cm =
m
44.
12.5 m =
cm
426
366
EUREKA MATH2
6 ▸ M1 ▸ Sprint ▸ Metric Conversion
m
© Great Minds PBC
© Great Minds PBC
EUREKA MATH2 6 ▸ M1 ▸ TD ▸ Lesson 19
Launch
5
Students convert familiar units of measurement. Direct students to the table of pictures in their books. Tell students to work with a partner to complete as many of the conversions as possible. They should use the blank rows in the table to list as many other unit conversions as they can. Consider making this activity into a game by providing a time limit such as 1 or 2 minutes. After a few moments, or when the time limit is up, invite each pair to share their answers with other pairs of students. During this time, encourage students to make necessary changes to their list.
12
eggs per dozen
100
pennies per dollar
1
1
$ 1
© Great Minds PBC
1
367
6 ▸ M1 ▸ TD ▸ Lesson 19
4
EUREKA MATH2
quarts per gallon
1,000 meters per kilometer
Sample: 100 centimeters per meter Sample: 1,000 milliliters per liter Sample: 60 seconds per minute Sample: 60 minutes per hour
368
© Great Minds PBC
EUREKA MATH2 6 ▸ M1 ▸ TD ▸ Lesson 19
Once pairs have shared with one another, debrief the class by using the following prompt. What did you notice? Allow students to share anything they noticed from this activity. Students may notice that there are the same number of minutes in an hour as there are seconds in a minute. Some may notice that all of the conversions involving meters or liters apply powers of 10. Display this equivalence statement: • The value of 1,000 dollars is equal to the value of
pennies.
Allow students a moment to consider this question with a partner. Then select a few students to share their responses. Consider the second entry in the table. If the value of 1 dollar is equal to the value of 100 pennies, then the value of 1,000 dollars is equal to the value of how many pennies? If the value of 1 dollar is equal to the value of 100 pennies, then the value of 1,000 dollars is equal to the value of 100,000 pennies. Today, we will use what we have learned about rates to convert units of measurement.
Learn Unit Conversions as Rates Students use rate reasoning to convert units of measurement within the same measurement system. Present problem 1. Prompt students to think about the rate language in Launch. The table of unit conversions that we created in the previous activity states that there are 100 pennies per dollar. This is a rate. What is the unit rate in this situation?
100
© Great Minds PBC
369
EUREKA MATH2
6 ▸ M1 ▸ TD ▸ Lesson 19
Have students use their responses from the activity in Launch to complete problem 1. 1. Select three rates from the table of unit conversions. State the unit rate for each. Sample: There are 12 eggs per dozen, so the unit rate is 12. There are 1,000 meters per kilometer, so the unit rate is 1,000. There are 4 quarts per gallon, so the unit rate is 4. Select a few students to share their answers with the class.
Using Rates to Convert Across Measurement Systems Students use rate reasoning to convert units of measurement within different measurement systems. Present problem 2. Allow students to complete part (a) and share their answers to confirm that the perimeter of Miss Baker’s bulletin board is 264 inches. 2. Miss Baker wants to put a border around her class bulletin board. She measures the bulletin board in inches and finds that it measures 60 inches by 72 inches.
60 in
UDL: Action & Expression To support students in planning before working on problem 2, consider providing questions that guide planning. For example, post the following for students to refer to as they work independently: • What do I recall about calculating perimeter? • How can I use a ratio table or another representation to support my understanding of this problem?
72 in
a. What is the perimeter of Miss Baker’s bulletin board in inches?
264 inches
370
© Great Minds PBC
EUREKA MATH2 6 ▸ M1 ▸ TD ▸ Lesson 19
Read parts (b) and (c) aloud while students follow along. Then engage the class in a discussion about parts (b) and (c) by using the following prompts: In the activity at the beginning of the lesson, we wrote some unit conversions by using rate language. We can use a similar strategy to answer parts (b) and (c). What rates would be helpful to know to answer these questions? We need to know how many centimeters are in 1 inch. We need to know how many ounces are in 1 pound. Direct students’ attention to the Measurement Conversions Reference Table in their books. Tell students they may use this resource to find measurement conversions and approximate conversions throughout this lesson. Point out the conversion 1 inch = 2.54 centimeters. One inch is equal to 2.54 centimeters. How can we describe this by using rate language?
Language Support In the Measurement Conversions Reference Table, students may notice the approximately equal to symbol (») in conversions such as 1 kilogram » 2.2 pounds. Ask students to recall where they have seen this symbol before and what it means. If needed, remind them that they have used this symbol when rounding, and the phrase can be read as “1 kilogram is about 2.2 pounds.” Throughout the rest of the lesson, remind students to use this symbol whenever they work with unit conversions that are not exact.
There are 2.54 centimeters per inch. In this example, what is the unit rate?
2.54 Which rate will be useful to solve the problem in part (c)? There are 16 ounces per pound. Direct students to finish parts (b) and (c) with a partner. As they work, circulate to observe the representations that students use. Select a few pairs to share their solutions during the debrief of this segment.
© Great Minds PBC
Differentiation: Challenge If students seem to quickly apply understanding of the rate that describes the number of centimeters per inch, challenge them by asking for the rate that describes the number of inches per centimeter. Time permitting, have students share their answer with a partner to verify that there are approximately 0.394 inches per centimeter.
371
EUREKA MATH2
6 ▸ M1 ▸ TD ▸ Lesson 19
b. Miss Baker arrives at the teacher supply store only to find that the border for sale is measured in centimeters. How many centimeters of border does Miss Baker need so she has enough to put around her bulletin board? Create a ratio table or another representation to support your answer.
×264
Number of Inches
Number of Centimeters
1
2.54
264
670.56
×264
2.54 ´ 264 = 670.56
Teacher Note Consider having a conversation with students about whether this answer makes sense in the real world. Use the following questions to probe students’ thinking: • Would Miss Baker be able to buy exactly 670.56 centimeters of border? • In this case, would we need to round up or down to find the amount she should buy? • Would 670 centimeters of border be enough?
Miss Baker needs 670.56 centimeters of border to put around her bulletin board. c. Miss Baker also needs to buy sand for a science project. The project requires at least 5 pounds of sand. The store sells 40-ounce bags of sand. Is one 40-ounce bag of sand enough for the project? If not, how many 40-ounce bags of sand does Miss Baker need? Create a ratio table or another representation to support your answer.
Number of Ounces
Number of Pounds
16
1
40
÷ 16
2.5
÷ 16
40 ¸ 16 = 2.5 40 ounces = 2.5 pounds One 40-ounce bag will not be enough sand because 40 ounces is only 2.5 pounds. Miss Baker will need two 40-ounce bags. 372
© Great Minds PBC
EUREKA MATH2 6 ▸ M1 ▸ TD ▸ Lesson 19
Once most pairs of students have completed parts (b) and (c), invite selected students to share their thinking. As students share, consider asking the following questions to facilitate thinking about unit rates and unit conversions. How did we use unit rates to find solutions in part (b) and part (c) of this problem? In part (b), we multiplied 264 inches by the unit rate, 2.54. In part (c), we divided 40 ounces by the unit rate, 16. Invite students to think–pair–share about the following prompts. Another student solves the problem in part (c) by multiplying the unit rate, 16, by the number of ounces in each bag of sand, 40. He claims that each 40-ounce bag of sand has 640 pounds of sand. What was this student’s mistake?
UDL: Representation Consider encouraging students to make sense of the unit conversion being described in each problem before computing it. For example, invite students to sketch pictures or visualize the units of measurement they are being asked to convert. Model this on the board by sketching a line that represents 1 inch and indicate on the sketched line that it also represents 2.54 centimeters.
This student multiplied by 16 instead of dividing by 16.
How can we tell in a problem situation whether to multiply or divide by the unit rate? Explain. We need to pay attention to the units of the rate and the units of the quantity that we know. For example, when we know the number of pounds, we can multiply by 16 to find the number of ounces because there are 16 ounces in every pound. When we know the number of ounces, we can divide by 16, or multiply by 1 , to find the number 16 1 of pounds because there is 16 of a pound in every ounce. We can also create a representation, such as a ratio table or double number line, to help us see how the quantities are related and know whether to multiply or divide. Earlier in this topic, we discussed how there are two unit rates for any given pair of quantities. What are the two unit rates related to 16 ounces in every pound? When the rate is expressed as ounces per pound, the unit rate is 16. When the rate 1 is expressed as pounds per ounce, the unit rate is 16 . Have students complete problem 3 independently. Remind them that they can use a familiar tool as needed to complete the problem. As students work, circulate and offer support as needed.
© Great Minds PBC
Promoting the Standards for Mathematical Practice When students choose whether to multiply or divide by the given unit rate to convert units of measurement, they are attending to precision (MP6). Ask the following questions to promote MP6: • What details are important to think about in this problem? • Where is it easy to make mistakes when doing unit conversions?
373
EUREKA MATH2
6 ▸ M1 ▸ TD ▸ Lesson 19
3. A typical cruising speed for an airplane is 900 kilometers per hour. One kilometer is about 0.62 miles. How many miles per hour is the typical cruising speed for an airplane? Create a double number line or another representation to support your answer.
×900 0
1
900
Number of Kilometers Number of Miles 0
558
0.62
×900 900 ´ 0.62 = 558 The typical cruising speed for an airplane is about 558 miles per hour. Once most students have finished, have them compare their work with a partner. Invite students to share their answers and methods with the class. Consider using the following questions to discuss this problem: • What representation did you create to understand how kilometers and miles are related? • What rate did you use? What unit rate? • How did you know whether to multiply or divide by the unit rate?
Teacher Note In problem 2, students are asked to create a ratio table or another representation to show their thinking. These models help students understand the relationships between the quantities and determine whether to multiply or divide by a given unit rate. The remaining problems in the lesson involve some multiplication and division of decimals to solve rate problems. Students explored these decimal operations by using models and place value thinking in grade 5. In this lesson, students are not expected to be fluent in operations with decimals, which they will study again in module 2. Rather, the focus is developing students’ understanding of unit rate and how to use it to solve rate problems. Depending on your students’ readiness for multiplication and division with decimals, consider taking time to review multiplication and division of decimals. Alternatively, allow students to use calculators for these computations and ask them to create a model for each problem to show how they know their calculations are accurate.
Using Rates to Solve Multi-Step Problems Students use rate reasoning to solve multi-step word problems. Present problem 4. Invite students to discuss the problem in pairs. Circulate and ask the following questions to support students’ thinking: • What rate is given in the problem? • What rate do we need to know to solve this problem? 374
© Great Minds PBC
EUREKA MATH2 6 ▸ M1 ▸ TD ▸ Lesson 19
Direct students to their Measurement Conversions Reference Table to find the conversion for gallons to liters. Tell students that, in this case, they may round further to 1 gallon » 3.8 liters. Then have students work in pairs to complete problem 4. 4. Water flows from a garden hose at a rate of 91.2 liters per minute. a. A pool holds 8,640 gallons of water. How many minutes will it take to fill the pool with the garden hose? Create a ratio table or another representation to support your answer. Use 1 gallon » 3.8 liters.
×8,640
Number of Gallons
Number of Liters
1
3.8
8,640
32,832
Number of Minutes
91.2
1
32,832 ÷ 91.2
360
×8,640
÷ 91.2 32, 832 = 360 91.2
It will take about 360 minutes to fill a pool that holds 8,640 gallons of water. b. How many hours will it take to fill the pool? 360 =6 60
It will take about 6 hours to fill the pool.
© Great Minds PBC
To support students’ understanding of and practice with unit conversions, consider providing extra problems in the following sequence. • Conversions within the same measurement system: 3 quarts is how many cups? • Conversions across measurement systems: 50 pounds is how many kilograms?
3.8 ´ 8,640 = 32,832 Number of Liters
Differentiation: Support
• Conversions of a single quantity in a rate: 5 meters per minute is how many inches per minute? • Conversions of both quantities in a rate: 5 meters per minute is how many inches per second?
Teacher Note The Measurement Conversions Reference Table resource in student books is similar to the reference sheet that students may have available to use during the curriculum’s assessments. However, because students have not yet completed module 2, which includes decimal operations, some suggestions are made in this lesson about rounding given unit conversions to fewer decimal places. For example, allow students to use 1 gallon » 3.8 liters instead of 1 gallon » 3.79 liters.
375
EUREKA MATH2
6 ▸ M1 ▸ TD ▸ Lesson 19
Once most students have finished, have students think–pair–share by using the following questions.
Differentiation: Challenge
Describe how you and your partner used unit rate when finding an answer to part (a). We multiplied the unit rate of the number of liters per gallon by the number of gallons of water the pool holds. This told us how many liters of water the pool holds. Then we divided this by the unit rate that tells the flow rate of the hose. What unit rate did you use in part (b)? Explain. We used 60 because there are 60 minutes per hour. Assign problem 5. Consider having students work on this problem independently. Circulate and encourage students who finish early to compare their solution with that of a partner. 5. A restaurant cooks 10 pounds of roast beef to serve in sandwiches. Each sandwich has 100 grams of roast beef. Each pound is about 450 grams. How many sandwiches can the restaurant prepare with 10 pounds of roast beef?
If students are ready, consider eliminating parts (a) and (b) in problem 4 and posing the problem as follows: • Water flows from a garden hose at a rate of 91.2 liters per minute. A pool holds 8,640 gallons of water. How many hours will it take to fill the pool with the garden hose? Challenge students to think about each unit conversion they will need to make to solve.
×10 0
1
10
0
450
4,500
Number of Pounds Number of Grams
×10 450 × 10 = 4,500
376
© Great Minds PBC
EUREKA MATH2 6 ▸ M1 ▸ TD ▸ Lesson 19
0
1
Number of Sandwiches Number of Grams of Roast Beef
45
÷100 0
÷ 100 4,500
100 4, 500 = 45 100
The restaurant can prepare about 45 sandwiches with 10 pounds of roast beef. Once most students are finished, continue a conversation with the class by using the following prompts. What unit rates did you use when finding a solution? I used 450, which is the number of grams per pound, and 100, which is the number of grams per sandwich. How is this problem different from the bulletin board problem? The bulletin board problem only required us to use one rate, 2.54 centimeters per inch. In this problem, we had to use two rates.
© Great Minds PBC
377
EUREKA MATH2
6 ▸ M1 ▸ TD ▸ Lesson 19
Land Debrief 5 min Objective: Convert units of measurement by applying rate reasoning. Encourage students to consider all of the situations they worked on during the lesson. Have students think–pair–share about the following questions before inviting students to share their thoughts. Why are unit conversions examples of rates? Unit conversions are examples of rates because when two measurements are equivalent, we can write them as a rate. For example, because 3.8 liters is approximately equal to 1 gallon, we can say that there are about 3.8 liters per gallon. How did we use unit rates to convert units of measurement in today’s lesson? The unit rate is the numerical part of a rate, such as 2.54 in 2.54 centimeters per inch. When we know the number of inches, we multiply it by the unit rate to get the number of centimeters. When we know the number of centimeters, we divide it by the unit rate to get the number of inches. We can also use the unit rate to set up a ratio table or double number line to find the answer. Problem 3 asked for the typical cruising speed of an airplane in miles per hour. Suppose you were asked to determine the typical cruising speed in miles per minute. Explain how you would approach this question. Once I know the number of miles per hour, I can convert to miles per minute by dividing by 60 because there are 60 minutes in 1 hour.
Exit Ticket 5 min Provide up to 5 minutes for students to complete the Exit Ticket. It is possible to gather formative data even if some students do not complete every problem.
378
Teacher Note Assign the Practice problems for completion outside of class or use them in class if time remains after the lesson. Refer students to the Recap for support.
© Great Minds PBC
EUREKA MATH2 6 ▸ M1 ▸ TD ▸ Lesson 19
Recap
EUREKA MATH2
6 ▸ M1 ▸ TD ▸ Lesson 19
RECAP Name
Date
EUREKA MATH2
6 ▸ M1 ▸ TD ▸ Lesson 19
19
c. At this same speed, how many miles can a cheetah run per minute?
40 ÷ 60 =
Using Rates to Convert Units
2 3
A cheetah can run about 40 miles per
60 minutes. Divide by 60 to determine the number of miles a cheetah can run per minute.
2
A cheetah can run about miles 3 per minute.
In this lesson, we •
used unit rates to convert units within the same measurement system.
•
used unit rates to convert units in different measurement systems.
d. At this same speed, how many miles can a cheetah run in 6 minutes?
A cheetah can run at a speed of 64 kilometers per hour. a. At this speed, how many meters per hour can a cheetah run? A cheetah can run 64,000 meters per hour. b. There are approximately 1,609 meters in 1 mile. At this same speed, how many miles can a cheetah run per hour? Round your answer to the nearest whole number.
64,000 ¸ 1,609 » 40 A cheetah can run about 40 miles per hour.
Number of Minutes
40
60
2 3
1
÷ 60
2 ×6=4 3
Examples
Number of Miles
÷ 60
A cheetah can run about 4 miles in 6 minutes.
Because there are 1,000 meters in 1 kilometer, multiply
64 by 1,000 to determine that there are 64,000 meters in 64 kilometers.
Because a cheetah can run about 2
2
miles in 1 minute, multiply and 1 3 3 each by 6 to determine the number of miles a cheetah can run in 6 minutes.
The rate in this situation is 1,609 meters in 1 mile. The unit
rate is 1,609. Set up a ratio table
to determine whether to multiply or divide by the unit rate to find the answer.
Number of Meters
Number of Miles
1,609
1
64,000 ÷ 1,609
40
÷ 1,609
© Great Minds PBC
© Great Minds PBC
279
280
RECAP
© Great Minds PBC
379
EUREKA MATH2
6 ▸ M1 ▸ TD ▸ Lesson 19
Sample Solutions Expect to see varied solution paths. Accept accurate responses, reasonable explanations, and equivalent answers for all student work.
EUREKA MATH2
6 ▸ M1 ▸ TD ▸ Lesson 19
PRACTICE Name
Date
19
EUREKA MATH2
6 ▸ M1 ▸ TD ▸ Lesson 19
13. A typical midsize car weighs 1.5 tons. It has a gas tank that holds 15 gallons of gas. a. How many quarts does the gas tank hold? The gas tank holds 60 quarts.
Use the grade 6 Measurement Conversions Reference Table. For problems 1–11, fill in the blank to complete the unit conversion. If necessary, round to the nearest hundredth. 1. 7 ft =
84
2. 100 yd =
b. How many pounds does the car weigh? The car weighs 3,000 pounds.
in 300
14. Ryan buys a 2-kilogram bag of trail mix for a hike. He wants to make 5-ounce bags to share with his hiking friends. There are approximately 35 ounces in 1 kilogram. How many 5-ounce bags can Ryan make?
ft
Ryan can make 14 of the 5-ounce bags of trail mix.
3. 25 m = 2,500 cm
15. A great white shark can swim at a top speed of 40 kilometers per hour.
4. 4.34 km » 2.70 mi 5. 96 oz =
6
a. How many meters per hour can the shark swim at its top speed?
lb
The shark can swim 40,000 meters per hour at its top speed.
6. 2 mi » 3.22 km 7. 3 in = 7.62
b. How many miles per hour can the shark swim at its top speed? Round your answer to the nearest whole number.
cm
The shark can swim about 25 miles per hour at its top speed.
8. 5 gal » 18.95 L 9. 15 L =
3.9
c. Use the rate you found in part (b) to find the number of miles the shark can swim in 12 minutes at its top speed. At that rate, the shark can swim 5 miles in 12 minutes at its top speed.
gal
d. How many miles per minute can the shark swim at its top speed?
10. 6 g = 6,000 mg 11. 22 lb »
10
5
The shark can swim 12 miles per minute at its top speed.
kg
12. Miss Baker can walk 1 mile in 20 minutes. At that rate, how many miles can she walk per hour? Miss Baker can walk 3 miles per hour.
© Great Minds PBC
380
281
282
P R ACT I C E
© Great Minds PBC
© Great Minds PBC
EUREKA MATH2 6 ▸ M1 ▸ TD ▸ Lesson 19
EUREKA MATH2
6 ▸ M1 ▸ TD ▸ Lesson 19
Remember For problems 16 and 17, divide.
16. 8,320 ¸ 40
17. 11,700 ¸ 50
208
234
18. Kayla texts 135 words in 3 minutes. What is the rate that she texts in words per minute? What is the unit rate? The rate Kayla texts is 45 words per minute. The unit rate is 45. 19. Toby has 7 meters of fabric. He uses the fabric to make 10 same-size pillowcases. How much fabric in meters does Toby use for each pillowcase? Toby uses
7 meters of fabric for each pillowcase. 10
© Great Minds PBC
© Great Minds PBC
P R ACT I C E
283
381
20
LESSON 20
Solving Rate Problems Apply rate reasoning to solve real-world ratio problems involving speed, unit pricing, and unit conversions. Find an unknown quantity when given a rate and a known quantity.
EUREKA MATH2
6 ▸ M1 ▸ TD ▸ Lesson 20
Name
Date
EXIT TICKET
20
Scott runs at a rate of 5 minutes per kilometer. His goal is to run a 50-kilometer race in under 4 hours. Will he meet his goal if he runs at his current rate? How do you know? Scott will not meet his goal if he runs at his current rate.
4 ´ 60 = 240 To meet his goal, he needs to run 50 kilometers in under 240 minutes.
5 ´ 50 = 250 It will take Scott 250 minutes to run 50 kilometers at his current rate. This is 10 minutes longer than his goal of 4 hours.
Lesson at a Glance In this lesson, students work in groups to complete differentiated practice problems that are organized as stations. In groups, students apply their understanding of rates and unit rates to solve a variety of real-world problems, including calculating speeds, comparing the price per unit of items, and converting between units. Students also apply rate reasoning to solve multi-step problems involving more than one rate in a situation.
Key Question • How can we use rate reasoning to solve real-world problems?
Achievement Descriptors 6.Mod1.AD2 Write and explain the unit rate that describes
a relationship between two quantities. (6.RP.A.2) 6.Mod1.AD6 Solve real-world problems by using unit rates. (6.RP.A.3.b) 6.Mod1.AD9 Convert among units by using ratio reasoning to solve
problems. (6.RP.A.3.d)
© Great Minds PBC
293
© Great Minds PBC
EUREKA MATH2 6 ▸ M1 ▸ TD ▸ Lesson 20
Agenda
Materials
Fluency
Teacher
Launch 5 min
• Station Answer Keys
Learn 30 min
Students
• Family Road Trips
• None
Land 10 min
Lesson Preparation • Post each Station Answer Key in a different place around the classroom.
© Great Minds PBC
383
6 ▸ M1 ▸ TD ▸ Lesson 20
EUREKA MATH2
Fluency Calculating Unit Rates Students calculate unit rates to prepare for solving rate problems. Directions: Determine the two rates for each situation. 1.
A cow eats 24 pounds of grass in 24 hours. a. What is the rate in pounds of grass per hour? 1 pound of grass per hour b. What is the rate in hours per pound of grass? 1 hour per pound of grass
2.
A bamboo plant grows 70 inches in 2 days. a. What is the rate in inches of growth per day? 35 inches per day b. What is the rate in days per inch of growth? 1 day per inch 35
384
© Great Minds PBC
EUREKA MATH2 6 ▸ M1 ▸ TD ▸ Lesson 20
Launch
5
Students reason about a real-world situation involving a price per unit. Display the prices for the can of coconut water and the jug of coconut water. Tell students that a supermarket has advertised the two prices.
C oconut Wate r
12-Ounce Can of Coconut Water $1.80
1-Gallon Jug of Coconut Water $12.80
Why might someone buy the 12-ounce can of coconut water? If someone goes on a short walk and wants to make sure they have something to drink, they might buy the 12-ounce can of coconut water. Why might someone buy the 1-gallon jug of coconut water? If someone goes on a long road trip and wants to make sure they have enough coconut water for themselves and a few others, they might buy the 1-gallon jug. Suppose you have a limited amount of money and want to buy at least 1 gallon of coconut water for the lowest price. Would you buy multiple 12-ounce cans of coconut water or the 1-gallon jug? Why? Provide time for students to turn and talk. As needed, tell students that there are 128 ounces in 1 gallon. If necessary, guide them to find the price per ounce. In this situation, the better deal is the 1-gallon jug for $12.80. © Great Minds PBC
385
EUREKA MATH2
6 ▸ M1 ▸ TD ▸ Lesson 20
When people ask about the best deal, what they really want to know is which item has the cheaper price per one unit, such as the price per 1 ounce of coconut water. In today’s lesson, we’ll get better at figuring out which deal is best given more than one option. We will also take a closer look at other problems where we apply rate reasoning to solve.
Learn Family Road Trips Students use unit rates to solve problems involving constant speed, pricing, and unit conversions. Arrange students in groups of three or four. Explain that in their groups, they will complete each of the five Family Road Trip station problems. Post each Station Answer Key in a different spot around the classroom or at the following station. Instruct students to check their work for each problem. As students work, circulate and offer support as necessary. If needed, refer students to the Measurement Conversions Reference Table from the previous lesson.
Teacher Note Although all the problems in this activity are located in students’ books, consider arranging the classroom so that students complete each station in a certain location and that they rotate every 5 to 6 minutes. This will keep students motivated and engaged throughout the activity. If you arrange the classroom this way, consider placing the answer key for a particular station at the station that follows. This will allow students to check their answers when they arrive at a new station before beginning work at that station.
The Evans family, the Perez family, and the Chan family are taking road trips. Use the information given to answer at least one question at each station.
Station 1 Determine the best deal by finding the lowest price per unit of the products each family purchases. a. The table shows the price each family pays for sunscreen. Evans Family
Perez Family
Chan Family
6-ounce bottle $12.00
Two 4.2-ounce bottles
10-ounce bottle $19.50
$15.96
Evans Family: 12 =2 6
386
UDL: Engagement Consider structuring peer interactions for success by assigning group roles such as notetaker, timekeeper, etc., and define responsibilities for each role. Review the activity goal, directions, and group norms before groups begin. Suggest a target completion time and project a visual timer.
© Great Minds PBC
EUREKA MATH2 6 ▸ M1 ▸ TD ▸ Lesson 20
The Evans family pays $2.00 per ounce of sunscreen.
Language Support
Perez Family:
4.2 ´ 2 = 8.4
As students work in their groups, consider directing English learners to use the Share your Thinking section of the Talking Tool to describe their strategies for solving the rate problems.
15.96 = 1.9 8.4
The Perez family pays $1.90 per ounce of sunscreen. Chan Family: 19.5 = 1.95 10
The Chan family pays $1.95 per ounce of sunscreen. The Perez family purchases the best deal, because $1.90 is less than $2.00 and less than $1.95. b. The table shows the price each family pays for bottled water. Evans Family
Perez Family
Chan Family
12-pack of 1-liter bottles $15.60
12-pack of 0.5-liter bottles $7.68
10-pack of
Evans Family: 15.6 = 1.3 12
The Evans family pays $1.30 per liter of water. Perez Family:
12 ´ 0.5 = 6 7.68 = 1.28 6
© Great Minds PBC
500-milliliter bottles $6.45
Differentiation: Support To support students in solving the rate problems at each station, consider modifying the assignment and selecting only one or two parts at each station for students to complete. Alternatively, provide prelabeled ratio tables or double number lines for students to use as they solve. Consider providing groups calculators for efficiency. Station 5 features multi-step problems involving rates. If needed, consider omitting this station for students and providing more time for the problems at other stations.
387
EUREKA MATH2
6 ▸ M1 ▸ TD ▸ Lesson 20
The Perez family pays $1.28 per liter of water. Chan Family:
500 milliliters = 0.5 liters 10 ´ 0.5 = 5 6.45 = 1.29 5
The Chan family pays $1.29 per liter of water. The Perez family purchases the best deal, because $1.28 is less than $1.29 and less than $1.30. Teacher Note
c. The table shows the price each family pays for trail mix. Evans Family
Perez Family
Chan Family
6-pack of 150-gram bags $18.00
One 1-kilogram bag
Two 1-pound bags
$15.00
Evans Family:
6 ´ 150 = 900 18 = 0.02 900
The Evans family pays $0.02 per gram of trail mix. Perez Family
1 kilogram = 1,000 grams 15 = 0.015 1, 000
388
$22.50
Consider having a conversation with students about comparing prices per unit when they come out to be a fraction of a cent. In this situation, the Perez family pays $0.015 per gram for their 1-kilogram bag of trail mix. It is beneficial for students to know that this does not mean that the family can actually purchase 1 gram of trail mix for $0.015 but that this price can be used for comparison purposes. Also consider mentioning to students that price tags at stores often include a price per unit. This price is printed on price tags of some items so that consumers can compare the prices per unit of those items. As needed, remind students that the unit rate in a rate like $0.015 per ounce is only the numerical part of the rate, 0.015.
© Great Minds PBC
EUREKA MATH2 6 ▸ M1 ▸ TD ▸ Lesson 20
The Perez family pays $0.015 per gram of trail mix. Chan Family:
1 pound » 0.45 kilogram 2 ´ 0.45 = 0.9 0.9 kilograms = 900 grams 22.5 = 0.025 900
The Chan family pays $0.025 per gram of trail mix. The Perez family purchases the best deal, because $0.015 is less than $0.02 and less than $0.025.
Station 2 Each part provides the number of miles and the number of minutes for the beginning of each family’s drive. a. The Evans family drives 21 miles in the first 20 minutes of their trip. What is their speed in miles per hour during this time? Create a representation to show your work. 0
21
42
63
0
20
40
60
Number of Miles Number of Minutes
Teacher Note This lesson is intentionally designed to avoid having students use the equation d = rt. As they develop an understanding of rate in this topic, the focus is on encouraging students to use intuition and observation of patterns in order to solve real-world problems that involve rate reasoning. When students engage in a deeper study of equations in module 4, the equation d = rt will be introduced.
The Evans family drives 63 miles per hour during this time.
© Great Minds PBC
389
EUREKA MATH2
6 ▸ M1 ▸ TD ▸ Lesson 20
b. The Perez family drives 16.5 miles in the first 15 minutes of their trip. What is their speed in miles per hour during this time? Create a representation to show your work. 0
16.5
33
49.5
66
0
15
30
45
60
Number of Miles Number of Minutes
The Perez family drives 66 miles per hour during this time. c. The Chan family drives 35 miles in the first 30 minutes of their trip. What is their speed in miles per hour during this time? Create a representation to show your work. 0
35
70
0
30
60
Number of Miles Number of Minutes
The Chan family drives 70 miles per hour during this time.
Station 3 Each part provides information about the gasoline each family buys. Use the given rate and the given quantity to determine the unknown quantity. a. The Evans family stops at a gas station that charges $3.00 per gallon of gasoline. How many gallons of gasoline does the Evans family buy if they spend a total of $27.00? 27 =9 3
The Evans family buys 9 gallons of gasoline. 390
© Great Minds PBC
EUREKA MATH2 6 ▸ M1 ▸ TD ▸ Lesson 20
b. The Perez family stops at a gas station and spends a total of $35.00 on 10 gallons of gasoline. How much does this gas station charge per gallon of gasoline? 35 = 3.50 10
This gas station charges $3.50 per gallon of gasoline. c. The Chan family stops at a gas station that charges $3.25 per gallon of gasoline. What is the total amount in dollars the Chan family spends if they buy 8 gallons of gasoline?
3.25 ´ 8 = 26 The Chan family spends a total of $26.00.
Station 4 Each part requires you to convert from one unit of measurement to another. Use the information to answer the following questions. a. The Evans children walk to the end of a fishing pier and back. The fishing pier is 1,320 feet in length. How many kilometers do the Evans children walk? Round to the nearest hundredth if necessary.
Promoting the Standards for Mathematical Practice
5,280 feet = 1 mile
As students solve multi-step rate problems by finding entry points, monitoring their own progress, and questioning whether the values they calculate make sense, they are making sense of problems and persevering in solving them (MP1).
2,640 ¸ 5,280 = 0.5
Ask the following questions to promote MP1:
1,320 ´ 2 = 2,640
1 mile » 1.61 kilometers 0.5 ´ 1.61 » 0.81 The Evans children walk about 0.81 kilometers. b. One of the Perez children sees a sand crab run 2 meters in 16 seconds. What rate in centimeters per second does the sand crab run?
• What steps can you take to start solving the problem? • How can you simplify the problem? • Does your answer make sense? Why?
1 meter = 100 centimeters 2 ´ 100 = 200
© Great Minds PBC
391
EUREKA MATH2
6 ▸ M1 ▸ TD ▸ Lesson 20
The sand crab runs at a rate of 200 centimeters in 16 seconds. 200 = 12.5 16
The sand crab runs at a rate of 12.5 centimeters per second. c. One of the Chan children sees a hermit crab crawl 12 inches in 10 seconds. What rate in meters per minute does the hermit crab crawl? Round to the nearest hundredth if necessary.
1 inch = 2.54 centimeters 12 ´ 2.54 = 30.48 The hermit crab crawls 30.48 centimeters in 10 seconds.
30.48 ´ 6 = 182.88 The hermit crab crawls at a rate of 182.88 centimeters per minute.
100 centimeters = 1 meter 182.88 ¸ 100 » 1.83 The hermit crab crawls at a rate of about 1.83 meters per minute.
Station 5 Each part provides rates in other situations on the road trips. Use the information to answer the following questions. a. Mrs. Evans buys 6 small beach towels at a rate of $5.00 per towel. She buys 3 large beach towels at a different rate. She spends a total of $54.00 on beach towels. What rate in dollars per towel does Mrs. Evans pay for the large beach towels?
Differentiation: Challenge To challenge students, consider replacing an earlier station with multi-step rate problems like those in station 5. Examples are shown. • The Chan family buys a 10-ounce bottle of sunscreen for $19.50 and a 16-ounce bottle of aloe vera gel. They spend a total of $32.30. Which has the higher price per ounce, the sunscreen or the aloe vera gel? How much more per ounce? • The Evans family buys 3 T-shirts at $11.00 each and 2 hats. If they spend a total of $49.50, what is the price of each hat?
6 ´ 5 = 30 54 - 30 = 24 24 ¸ 3 = 8 Mrs. Evans pays a rate of $8.00 per towel for the large beach towels. 392
© Great Minds PBC
EUREKA MATH2 6 ▸ M1 ▸ TD ▸ Lesson 20
b. Mr. Perez stops to buy 9 gallons of gasoline at a rate of $3.00 per gallon. He stops a second time and buys 10 gallons of gasoline at a different rate. He spends a total of $58.00 on gasoline. What rate in dollars per gallon does Mr. Perez pay for gasoline at the second stop?
9 ´ 3 = 27 58 - 27 = 31 31 ¸ 10 = 3.1 Mr. Perez pays a rate of $3.10 per gallon of gasoline at the second stop. c. For the first 3 nights of the Chan family’s stay, the hotel charges a rate of $125.00 per night. The hotel charges a different rate for the last 2 nights. The hotel charges a total of $585.00 for this 5-night stay. What rate in dollars per night does the hotel charge for the last 2 nights of the Chan family’s stay?
125 ´ 3 = 375 585 - 375 = 210 210 ¸ 2 = 105 The hotel charges a rate of $105.00 per night for the last 2 nights of the Chan family’s stay.
Land Debrief 5 min Objectives: Apply rate reasoning to solve real-world ratio problems involving speed, unit pricing, and unit conversions. Find an unknown quantity when given a rate and a known quantity. Before facilitating a discussion about the lesson, consider providing students 1 or 2 minutes to review their work from each station. Then encourage students to provide evidence as they respond to the following question: © Great Minds PBC
393
EUREKA MATH2
6 ▸ M1 ▸ TD ▸ Lesson 20
How did you use rate reasoning to solve the problems in today’s station activities? Give some examples. When we knew two quantities within a problem, like the number of ounces of sunscreen in a bottle and the price of the bottle, we determined the rate in dollars per ounce. Then we could compare these rates among the different families. In station 5, we knew a rate and another total, and we had to figure out a second rate. For example, we knew that Mr. Perez paid $3.00 per gallon for 9 gallons of gasoline. We knew he paid a total of $58.00 after buying 10 more gallons at a different rate. We had to work backward to figure out the rate for the last 10 gallons. Select students to share how they used rate reasoning in today’s activities. Encourage them to reflect on how unit rate was useful when they calculated answers to some of the problems. Have students think–pair–share by using the following question. Invite several students to share their examples with the class. What other examples of rates can you think of from your own family’s experiences or in your daily life? What kinds of problems could you solve by using those rates? Sample: When we planned our trip to Florida, we shopped for airplane tickets. The best price we found was $197.00 per ticket. We multiplied that by 3 to determine the total cost for plane tickets for our family. During our home repair, we picked new cabinet door handles that cost $2.08 each. We saw that they were also sold in packages of 10 for $19.97. We purchased the packages of 10 because those were less than $2.00 each.
Exit Ticket 5 min Provide up to 5 minutes for students to complete the Exit Ticket. It is possible to gather formative data even if some students do not complete every problem.
394
Teacher Note Assign the Practice problems for completion outside of class or use them in class if time remains after the lesson. Refer students to the Recap for support.
© Great Minds PBC
EUREKA MATH2 6 ▸ M1 ▸ TD ▸ Lesson 20
Recap
EUREKA MATH2
6 ▸ M1 ▸ TD ▸ Lesson 20
RECAP Name
Date
20
2. Tyler earns money by doing yard work. He rakes leaves for 3 hours at a rate of $12.00 per hour. He mows a lawn for 2 hours at a different rate. He earns a total of $56.00 for raking and mowing. How much money does Tyler earn per hour for mowing the lawn?
Solving Rate Problems
12 ´ 3 = 36
In this lesson, we • •
EUREKA MATH2
6 ▸ M1 ▸ TD ▸ Lesson 20
Tyler earns $36.00 raking leaves for 3 hours. Subtract $36.00
56 - 36 = 20
applied rate reasoning to solve real-world problems involving speed, unit pricing, and unit conversions.
from the total, $56.00, to find that he earns $20.00 for 2 hours of mowing the lawn. This is a rate of $10.00 per hour.
20 ¸ 2 = 10 Tyler earns $10.00 per hour for mowing the lawn.
solved multi-step problems involving more than one rate.
Examples 1. Almonds, pecans, and walnuts are on sale. •
The price of 1 pound of almonds is $3.00.
•
The price of 16 ounces of pecans is $12.00.
•
The price of walnuts is $0.50 per ounce.
2
When solving problems that involve multiple rates, consider which tools might help determine an answer. Consider using a tape diagram like the one shown.
Julie wants to buy the same amount of each type of nut. List the nuts from least expensive to most expensive if Julie buys the same amount of each type of nut. Show how you know. From least expensive to most expensive: almonds, walnuts, pecans The price of 16 ounces of almonds is $6.00 because 3 ´ 2 = 6. The price of 16 ounces of walnuts is $8.00 because 16 ´ 0.5 = 8. The price of 16 ounces of pecans is $12.00.
In some cases, it is more efficient to write the rate as price per ounce and find the unit rate to compare the prices of items. In this case, finding the price of 16 ounces of each type
Number of Hours Raking
12
12
Number of Hours Mowing
10
10
12
56
20
of nut is also an efficient method.
Use a ratio table if needed to determine the prices of different numbers of ounces of each type of nut.
Number of Ounces of Walnuts
Price (dollars)
1
0.5
16
÷2
8
Number of Ounces of Almonds
Price (dollars)
8
3
16
6
×2
×2
÷2
© Great Minds PBC
© Great Minds PBC
295
296
RECAP
© Great Minds PBC
395
EUREKA MATH2
6 ▸ M1 ▸ TD ▸ Lesson 20
Sample Solutions Expect to see varied solution paths. Accept accurate responses, reasonable explanations, and equivalent answers for all student work.
EUREKA MATH2
6 ▸ M1 ▸ TD ▸ Lesson 20
PRACTICE Name
Date
20
EUREKA MATH2
6 ▸ M1 ▸ TD ▸ Lesson 20
6. Store A sells a 1 -gallon size of juice for $2.65. This store sells the same juice in a 1-gallon size 2 for $5.50. a. Which size of juice at store A, the 1 -gallon size or the 1-gallon size, has the better price per 2 gallon? Explain.
1. Lisa types at a rate of 40 words per minute.
The 12 -gallon size has the better price per gallon because it is $5.30 per gallon.
a. At this rate, how many words can Lisa type per hour? Lisa can type 2,400 words per hour.
b. Store B sells the same juice in a 1-liter bottle for $1.50. Does the juice from store B have a better price per gallon than the juice from store A? Explain. Use 1 gallon » 3.79 liters.
b. At this rate, how many words can Lisa type per second? 2
No. The juice at store B is more expensive per gallon than both sizes of juice at store A because the price is about $5.69 per gallon.
Lisa can type 3 words per second. c. If Lisa types at this same rate, how many minutes will it take her to type 320 words?
7. The running times and distances of four runners are listed. Put the runners in order from the slowest speed to the fastest speed in minutes per mile. Use 1 kilometer » 0.62 miles.
It will take Lisa 8 minutes to type 320 words. 2. Scott is buying kale chips for his lunches. He can buy a pack of six 1 -ounce bags of kale chips for 2 $9.00, or he can buy one 5-ounce bag of kale chips for $12.50. Which option costs less per ounce of kale chips? Explain. The 5-ounce bag costs less per ounce of kale chips than the pack of six 1 -ounce bags. The 2 5-ounce bag costs $2.50 per ounce, and the pack of six 1 -ounce bags costs $3.00 per ounce.
•
Blake runs 2 miles in 17 minutes.
•
Kayla runs 3 miles in 27 minutes.
•
Noah runs 2.5 miles in 20 minutes.
•
Ryan runs 5 kilometers in 31 minutes.
In order from slowest speed to fastest speed, the list is Ryan, Kayla, Blake, Noah.
2
3. A high-speed train travels at a rate of 90 miles per hour. At this rate, how many miles does the high-speed train travel in 4 1 hours?
8. Jada tutors science for 4 hours at a rate of $15.00 per hour. She tutors math for 2 hours at a different rate. She earns a total of $100.00 for these hours to tutor science and math. What rate in dollars per hour does Jada charge to tutor math?
2
The high-speed train travels 405 miles in 4 1 hours. 2
Jada charges a rate of $20.00 per hour to tutor math.
4. The tank in a lawnmower holds 3 quarts of gasoline. If gasoline costs $3.00 per gallon, what is the total cost in dollars to fill the lawnmower’s empty tank?
9. At a bookfair, Riley buys 4 novels at a rate of $6.00 per book. She also buys 3 comic books at a different rate. Riley spends a total of $40.50 at the bookfair. What rate in dollars per book does she pay for the comic books?
The total cost to fill the lawnmower’s empty tank is $2.25.
Riley pays a rate of $5.50 per comic book.
5. Two trampoline parks charge different rates. Trampoline park A charges $4.00 for every 12 hour of jump time. Trampoline park B charges $20.00 for 3 hours of jump time. If you plan to visit for 3 hours, which trampoline park charges the better rate? Explain. If I visit for 3 hours, trampoline park B charges the better rate. Trampoline park B charges $20.00 for 3 hours, and trampoline park A charges $24.00 for 3 hours. © Great Minds PBC
396
297
298
P R ACT I C E
© Great Minds PBC
© Great Minds PBC
EUREKA MATH2 6 ▸ M1 ▸ TD ▸ Lesson 20
EUREKA MATH2
6 ▸ M1 ▸ TD ▸ Lesson 20
Remember For problems 10 and 11, divide. 11. 16,020 ¸ 30
10. 12,240 ¸ 20
534
612
12. Lacy and Tara bike to a campground 30 miles away. Lacy bikes 3 miles in 15 minutes. Tara bikes 5 miles in 20 minutes. Lacy and Tara leave at the same time and from the same location. At these rates, who reaches the campground first? Show how you know. Lacy
Tara
Number of Miles
Number of Minutes
Number of Miles
Number of Minutes
3
15
5
20
30
150
30
120
Tara reaches the campground first because it takes her 120 minutes to bike 30 miles. It takes Lacy 150 minutes to bike 30 miles. 13. Tyler has 5 same-size granola bars to share equally with Leo and Sasha. If each person gets the same amount, how many granola bars do Tyler, Leo, and Sasha each get? Each person gets 1 2 granola bars. 3
© Great Minds PBC
© Great Minds PBC
P R ACT I C E
299
397
21
LESSON 21
Solving Multi-Step Rate Problems Solve problems involving multiple constant rates.
EUREKA MATH2
Name
6 ▸ M1 ▸ TD ▸ Lesson 21
Date
EXIT TICKET
21
A horsefly flies at a rate of 90 miles per hour. The distance from Earth to the moon is about 238,855 miles. Kayla says, “At that rate, it would take a horsefly less than 16 weeks to fly to the moon.” Do you agree or disagree with Kayla? Justify your answer. Round to the nearest tenth if necessary. Number of hours: 238,855 ¸ 90 » 2,653.9 Number of days: 2,653.9 ¸ 24 » 110.6 Number of weeks: 110.6 ¸ 7 = 15.8 I agree with Kayla. It would take a horsefly about 15.8 weeks to fly to the moon at that rate, which is less than 16 weeks.
Lesson at a Glance Student first work in pairs and later in small groups to explore the time it takes to get from Earth to the moon. Students perform multiple unit conversions in which they must convert both the first and second quantities of a rate to different units of measurement. Then students choose a method of travel to the moon and use the problemsolving routine Read–Represent–Solve–Summarize to model and solve problems involving multiple rates and unit conversions.
Key Question • How can we use rates to solve problems?
Achievement Descriptors 6.Mod1.AD6 Solve real-world problems by using unit rates. (6.RP.A.3.b) 6.Mod1.AD9 Convert among units by using ratio reasoning to solve
problems. (6.RP.A.3.d)
© Great Minds PBC
307
© Great Minds PBC
EUREKA MATH2 6 ▸ M1 ▸ TD ▸ Lesson 21
Agenda
Materials
Fluency
Teacher
Launch 5 min
• None
Learn 30 min
Students
• A Horse, of Course
• Calculator
• Sending a Horse to the Moon
• Modeling in A Story of Ratios
• Your Turn
Lesson Preparation
Land 10 min
• None
© Great Minds PBC
399
EUREKA MATH2
6 ▸ M1 ▸ TD ▸ Lesson 21
Fluency
Teacher Note
Convert Customary Units Students convert customary units to prepare for converting units in a task involving speed, distance, and time.
Instead of this lesson’s Fluency, consider administering the Customary Conversion Sprint. Directions for administration can be found in the Fluency resource. EUREKA MATH2
6 ▸ M1 ▸ Sprint ▸ Customary Conversion
A
Directions: Fill in the blank to make the statement true. 1. 2. 3. 4. 5.
10 feet per day = 6 inches per second = 1 mile per minute = 2
70 miles per week = 60 feet per hour =
feet per week inches per minute miles per hour miles per day foot per minute
Number Correct:
Convert each measurement to the given unit.
70 360 30 10 1
1.
1 yd =
ft
23.
1 1 yd =
ft
2.
2 yd =
ft
24.
1 2 yd =
ft
3.
3 yd =
ft
25.
2 2 yd =
ft
4.
10 yd =
ft
26.
3 1 yd =
ft ft
30 miles per minute =
mile per second
3
3
5 yd =
ft
27.
6 2 yd = 3
6.
1 ft =
in
28.
1 1 ft =
in
7.
2 ft =
in
29.
3 1 ft =
in
8.
3 ft =
in
30.
4 1 ft =
9.
5 ft =
in
31.
4 ft =
in
10.
10 ft =
in
32.
5 1 ft =
in
11.
1 ft = 2
in
33.
36 in =
ft
12.
12 in =
ft
34.
42 in =
ft
13.
24 in =
ft
35.
48 in =
14.
48 in =
ft
36.
66 in =
ft
15.
6 in =
ft
37.
36 in =
yd
5.
2
2
4
3
4
3
in
ft
16.
36 in =
ft
38.
18 in =
yd
17.
36 in =
yd
39.
48 in =
yd
18.
72 in =
yd
40.
90 in =
yd
19.
18 in =
yd
41.
120 in =
yd
20.
1 yd =
in
42.
120 in =
ft in
21.
2 yd =
in
43.
4 1 yd = 2
22.
1 yd = 2
in
44.
4 1 yd =
410
6.
3
3
2
ft
© Great Minds PBC
1 2
Teacher Note
Launch
5
Students watch a video and think about what math questions could be asked about the scenario. Play the Earth to moon video. Have students write down what they notice and what they wonder. After 1 minute, initiate a class discussion. 400
Students may be interested in the following additional information about the first moon landing. Apollo 11 was the first manned mission to land on the moon. The American mission launched on July 16, 1969, from Kennedy Space Center in Florida. Commander Neil Armstrong and lunar module pilot Buzz Aldrin landed the Apollo lunar module Eagle on July 20, 1969.
© Great Minds PBC
EUREKA MATH2 6 ▸ M1 ▸ TD ▸ Lesson 21
What do you notice in the video? I notice it took several days to get to the moon. I notice a rocket flew to the moon. I notice it is a long way to the moon. I notice a person riding a horse. What do you wonder? I wonder if anyone else has gone to the moon. I wonder how fast the rocket flew to the moon. I wonder how long it would take a horse to travel to the moon. What math questions could be asked about this scenario? How long does it take a horse to get to the moon? How fast did the rocket fly to the moon? How much faster is a rocket than a horse? Today, we will identify which rates are useful for solving problems involving distance and time. We will use the rates to answer questions about traveling to the moon.
Learn A Horse, of Course Students convert both the first and second quantities of a rate to different units of measurement. Direct students to problem 1. Allow them several minutes to complete the problem in pairs. Circulate to listen for how students are describing their work. Identify students who reference finding a unit rate and then using the unit rate to calculate the answers to the questions. As needed, allow students to use calculators, and offer them support as they perform unit conversions with each rate. 1. A horse runs a 7,920-foot race in 150 seconds. a. What is the horse’s rate in feet per second?
7,920 ¸ 150 = 52.8 The horse’s rate is 52.8 feet per second. © Great Minds PBC
Differentiation: Support Consider providing premade double number lines or ratio tables that students can fill in and label as necessary to help them perform unit conversions of rates and solve problems.
401
EUREKA MATH2
6 ▸ M1 ▸ TD ▸ Lesson 21
b. What is the horse’s rate in feet per minute?
52.8 feet per second 60 seconds = 1 minute 52.8 ´ 60 = 3,168 The horse’s rate is 3,168 feet per minute. c. What is the horse’s rate in feet per hour?
3,168 feet per minute 60 minutes = 1 hour 3,168 ´ 60 = 190,080 The horse’s rate is 190,080 feet per hour. d. What is the horse’s rate in miles per hour?
190,080 feet per hour 5,280 feet = 1 mile 190,080 ¸ 5,280 = 36 The horse’s rate is 36 miles per hour. Select students to share their answers to each part of problem 1. Invite identified students to describe how they calculated their answers. When students are finished sharing, ask the following question. Why might we want to convert a rate that is in feet per second to a rate that is in miles per hour? We might want to know how many hours it takes to travel a distance that is given in miles. We know that horses and people cannot run at a constant rate for a long period of time without stopping or slowing. However, rates help us understand the relationship between time and distance. Rates also help us make estimations about time and distance. In this lesson, we will look at other rate situations that might not be physically possible but are interesting to calculate.
402
© Great Minds PBC
EUREKA MATH2 6 ▸ M1 ▸ TD ▸ Lesson 21
Sending a Horse to the Moon Students solve a rate problem by using the Read–Represent–Solve–Summarize problem-solving routine. Direct students to problem 2. Introduce the Read–Represent–Solve–Summarize routine as a process that leads to productive habits for problem solving. Ask students to read problem 2 silently as you read it aloud. A horse runs 36 miles per hour. The distance from Earth to the moon is about 238,855 miles. How many days would it take a horse to run from Earth to the moon? Assume the horse runs at a constant speed. Assume there is actually a road from Earth to the moon. Notice that the problem has us assume there is actually a road from Earth to the moon. At one time, people could not imagine ever traveling to the moon. So, for this problem, we get to imagine that a horse can run on a road to the moon.
Teacher Note This lesson includes references to an important resource: the problem-solving routine Read–Represent–Solve–Summarize. Modeling in A Story of Ratios® includes the routine Read–Represent–Solve–Summarize. This is an intermediate problem-solving routine that links the Read–Draw–Write (RDW) method from A Story of Units® to the formal mathematical modeling cycle used in A Story of Functions®.
Engage students in the Read portion of the problem-solving routine by having them think–pair–share about the following two questions. What does this problem ask us to find? The problem asks us to find the number of days it would take the horse to run from Earth to the moon. What do we know? We know the horse runs 36 miles per hour. So, for every 1 hour, the horse runs 36 miles. We know the distance to the moon is about 238,855 miles. Encourage students to read the problem as many times as needed to understand what is being asked. Then use the following prompt to invite students to estimate the number of days it would take the horse to run from Earth to the moon. Guess how many days it would take the horse to run from Earth to the moon. Consider having students share their guesses with the class to create a range for the number of days it would take the horse to run from Earth to the moon. Now that we have read and understood the problem, we can find a way to represent the relationship we read about. We can represent the horse’s speed by using a ratio table, a double number line, a graph, or any other model. © Great Minds PBC
403
EUREKA MATH2
6 ▸ M1 ▸ TD ▸ Lesson 21
Allow students to work in pairs to select a model to represent the horse’s speed. Circulate as students work. Take note of the various models students use. Ask the following questions to ensure that students have an accurate model, and encourage them to add to or revise their models as necessary:
Teacher Note
• Are the known and the unknown clear in the model?
The answers shown are rounded to the nearest tenth. Choose the level of precision you prefer for your students and tell them before they solve the problem.
Once students have a representation, choose several students to share why they chose their representation. When students are finished sharing, use the following prompt to point out the importance of using a model.
Differentiation: Challenge
• What labels should you use on the table, double number line, or graph?
Representing the relationship helps us move from simply reading the problem to solving it and summarizing our findings. Allow students to work with their partner to solve the problem. Some may calculate by using the unit rate. Others may use the multiplicative structure of their table or double number line. As students work, circulate and notice what strategies they use. 2. A horse runs 36 miles per hour. The distance from Earth to the moon is about 238,855 miles. How many days would it take a horse to run from Earth to the moon? Assume the horse runs at a constant speed. Assume there is actually a road from Earth to the moon. 0
36
238,855
0
1
?
To challenge students further, have them work the following problem after they work problem 2: The total trip to and from the moon takes the horse 700 days. What is the horse’s speed in miles per hour on the return trip? Assume the horse runs at a constant speed on the return trip. The horse’s speed on the return trip is about 23.5 miles per hour.
Number of Miles Number of Hours
Number of hours: 238,855 ¸ 36 » 6,634.9 Number of days: 6,634.9 ¸ 24 » 276.5 It would take the horse about 276.5 days to run from Earth to the moon. When most students have an answer, have them turn and talk about the following two questions: • Does my answer make sense? • Does my result answer the question? 404
© Great Minds PBC
EUREKA MATH2 6 ▸ M1 ▸ TD ▸ Lesson 21
If they answer no to either question, encourage students to try again and to use their new result to ask themselves these two questions. Then select several pairs of students who used different strategies to summarize their solutions and justify their reasoning. What is the solution to the problem? How did you complete the final steps? We found that it would take the horse about 6,634.9 hours to run from Earth to the moon. We divided 6,634.9 by 24 to determine that is about 276.5 days. So it would take the horse about 276.5 days to run from Earth to the moon. Have students return to the guesses they made initially. Ask students whether the solution surprised them based on their guesses.
Your Turn Students choose a rate problem to solve by using the Read–Represent–Solve–Summarize problem-solving routine. Divide students into groups of 3 or 4 students each. Direct them to problem 3. We learned that it took the Apollo 11 mission several days to get to the moon and found that it would take a horse running at a constant speed of 36 miles per hour almost 277 days to get to the moon. Now, it’s your turn to choose how you would want to get to the moon and how long it would take you to get there. Have groups work to solve problem 3. Circulate as students work, and observe the strategies groups use as they read, represent, solve, and summarize. Encourage students to return to problems 1 and 2 if necessary, and ask the following questions to advance their thinking: • What is the problem asking you to find? • What do you know that is given in the problem? What do you know based on your chosen method of travel? • What tool can you use to represent the problem? • Does your model show what is known and what is unknown? How can you improve your model? • What units do you need to consider in the problem? • Does your answer make sense?
UDL: Engagement Problem 3 provides students with choices of both method of travel and solution pathway. Students may choose based on their level of interest or based on the challenge level of the unit conversions they think are necessary to solve the problem. Consider adding other methods of travel to the list or allowing students to research and find their own method of travel.
• Does your result answer the question? © Great Minds PBC
405
EUREKA MATH2
6 ▸ M1 ▸ TD ▸ Lesson 21
3. Choose a method of travel from the list. The distance from Earth to the moon is about 238,855 miles. How many weeks would it take to travel from Earth to the moon? Assume the chosen traveler or mode of transportation moves at the given constant speed. As needed, assume there is actually a road from Earth to the moon. A person running
1 mile per minute 10
A scooter going 792 feet per minute
Teacher Note Provide students with the following unit conversions as necessary, or direct them to the Measurement Conversions Reference Table in lesson 19.
A sloth crawling 4 meters per minute
A train going 95,000 meters per hour
• 1 inch = 2.54 centimeters
A peregrine falcon diving 88 meters per second
A dirt bike going 3,800 centimeters per second
• 1 mile » 1.61 kilometers
A cheetah running 120 kilometers per hour
A fire truck going 55 feet per second
A Galápagos tortoise walking 984 feet per hour
Roller skates going 4,224 inches per minute
• 1 meter » 39.37 inches
Differentiation: Support It would take a person about 237 weeks to run from Earth to the moon. It would take a sloth about 9,478 weeks to crawl from Earth to the moon. It would take a peregrine falcon flying at diving speed about 7 weeks to fly from Earth to the moon. It would take a cheetah about 19 weeks to run from Earth to the moon. It would take a Galápagos tortoise about 7,483 weeks to walk from Earth to the moon. It would take a scooter about 158 weeks to get from Earth to the moon. It would take a train about 24 weeks to get from Earth to the moon. It would take a dirt bike about 17 weeks to get from Earth to the moon. It would take a fire truck about 38 weeks to get from Earth to the moon.
Consider offering other choices of methods of travel that require fewer unit conversions. • A bicycle traveling 15 miles per hour It would take a bicycle about 95 weeks to travel from Earth to the moon. • A golden eagle flying 120 miles per hour It would take a golden eagle about 12 weeks to fly from Earth to the moon. • A race car going 200 miles per hour It would take a race car about 7 weeks to get from Earth to the moon.
It would take roller skates about 355 weeks to get from Earth to the moon.
406
© Great Minds PBC
EUREKA MATH2 6 ▸ M1 ▸ TD ▸ Lesson 21
Sample:
Promoting the Standards for Mathematical Practice
A scooter’s speed is 792 feet per minute.
60 minutes = 1 hour 792 ´ 60 = 47,520 5,280 feet = 1 mile
Students model with mathematics (MP4) when they choose a mathematical model, evaluate how well it fits a context, and consider ways to improve it.
47,520 ¸ 5,280 = 9
Ask the following questions to promote MP4:
A scooter’s speed is 47,520 feet per hour.
A scooter’s speed is 9 miles per hour. 0 9
238,855
0 1
?
Number of Miles Number of Hours
• What math model can you draw to help you understand the moon problem? • What key ideas in the moon problem do you need to make sure you include in your model? • How can you improve your model to better represent the moon problem?
Number of hours: 238,855 ¸ 9 » 26,539.4 Number of days: 26,539.4 ¸ 24 » 1,105.8 Number of weeks: 1,105.8 ¸ 7 » 158 It would take a scooter about 158 weeks to get from Earth to the moon. When most students have solved the problem, select groups to share their solutions with the class. Encourage students to discuss their process for solving the problem, particularly their chosen method of travel and the units involved in finding their solution.
© Great Minds PBC
407
EUREKA MATH2
6 ▸ M1 ▸ TD ▸ Lesson 21
Land Debrief 5 min Objective: Solve problems involving multiple constant rates. Use the following prompts to guide discussion about how students used the Read–Represent–Solve–Summarize problem-solving routine to solve rate problems. Give an example of how you used rates to solve a problem today. We chose a method of travel that had a given rate. Because the distance to the moon was given in miles, we did some unit conversions to write the rate in miles per hour. Next, we divided the distance by the unit rate to find the number of hours to get to the moon. Then, we converted hours to days and days to weeks. Which part of the Read–Represent–Solve–Summarize problem-solving routine did you find most useful? Why? Sample: The Read and Represent steps helped us make a plan before just skipping ahead to solving. We thought about what we knew from the problem, what the question asked, and what tool we could use to represent the problem. How did asking questions like “Does my answer make sense?” and “Does my result answer the question?” help you with the accuracy of your answer? Asking those questions helped me rethink my calculations and made me realize I was not quite finished because I needed to convert units.
Exit Ticket 5 min Provide up to 5 minutes for students to complete the Exit Ticket. It is possible to gather formative data even if some students do not complete every problem.
408
Teacher Note Assign the Practice problems for completion outside of class or use them in class if time remains after the lesson. Refer students to the Recap for support.
© Great Minds PBC
EUREKA MATH2 6 ▸ M1 ▸ TD ▸ Lesson 21
Recap
EUREKA MATH2
6 ▸ M1 ▸ TD ▸ Lesson 21
RECAP Name
Date
EUREKA MATH2
6 ▸ M1 ▸ TD ▸ Lesson 21
21
d. What is the runner’s rate in feet per hour?
1,879.2 feet per minute 60 minutes = 1 hour
Solving Multi-Step Rate Problems
1,879.2 ´ 60 = 112,752
In this lesson, we •
converted both quantities of a rate to different units of measurement.
•
solved multi-step rate problems.
The runner’s rate is about 112,752 feet per hour.
A professional runner runs a 100-yard race in 9.58 seconds. For parts (a)–(f), round answers to the hundredths place if necessary. a. What is the runner’s rate in yards per second?
Number of Seconds
Number of Yards
1
10.44
9.58
100
100 ¸ 9.58 » 10.44 ÷ 9.58
1 yard = 3 feet 3 ´ 10.44 = 31.32
Number of Yards
Number of Feet
1
3
10.44
31.32
×10.44
c. What is the runner’s rate in feet per minute?
f.
© Great Minds PBC
× 60
Number of Miles
112,752 ¸ 5,280 » 21.35
5,280
1
÷ 9.58
Number of Miles
0 3
0 0.14
21.35
÷ 5,280
21.35
1
3 ¸ 21.35 » 0.14 It would take the runner about 0.14 hours to run a 3-mile race.
× 10.44
112,752 ÷ 5,280
Number of Miles
Number of Hours
21.35
1
3
÷ 21.35
0.14
÷ 21.35
Sometimes, it helps to convert units so that the answer makes more sense. Because there are 60 minutes
Number of Minutes
Number of Feet
1
31.32
60
1,879.2
× 60
© Great Minds PBC
112,752
If the runner could maintain this rate, how long would it take him to run a 3-mile race?
31.32 feet per second
The runner’s rate is about 1,879.2 feet per minute.
60
Number of Feet
Number of Hours
10.44 yards per second
31.32 ´ 60 = 1,879.2
1,879.2
5,280 feet = 1 mile The runner’s rate is about 21.35 miles per hour.
b. What is the runner’s rate in feet per second?
60 seconds = 1 minute
1
× 60
112,752 feet per hour
The runner’s rate is about 31.32 feet per second.
Number of Feet
e. What is the runner’s rate in miles per hour?
Example
The runner’s rate is about 10.44 yards per second.
Number of Minutes
in 1 hour, you can multiply 60 and 1 each by 0.14 to find that there are 8.4 minutes in 0.14 hours. This means it would take the runner about 8.4 minutes to run a
3-mile race at this rate. ×60
309
310
RECAP
© Great Minds PBC
409
EUREKA MATH2
6 ▸ M1 ▸ TD ▸ Lesson 21
Sample Solutions Expect to see varied solution paths. Accept accurate responses, reasonable explanations, and equivalent answers for all student work.
EUREKA MATH2
6 ▸ M1 ▸ TD ▸ Lesson 21
PRACTICE Name
Date
EUREKA MATH2
6 ▸ M1 ▸ TD ▸ Lesson 21
21
f.
Imagine that Leo could actually maintain this pace for a long time. How many hours would it take him to run the 277-mile length of the Grand Canyon? It would take Leo 16.39 hours to run the length of the Grand Canyon.
4
1. Rain falls at a rate of inches per hour during a storm. At this rate, how many inches of rain fall 5 in 10 hours? In 10 hours, 8 inches of rain fall.
4. Adesh competes in a triathlon. The race has three parts: a swim, a bike ride, and a run. a. Adesh swims at a rate of 50 meters per minute. He completes the swim part of the triathlon in 30 minutes. How far does he swim in kilometers?
2. A school bus leaves a middle school at 2:00 p.m.
Adesh swims 1.5 kilometers.
a. The bus takes the basketball team to a game 30 miles away. If the bus travels at a rate of 40 miles per hour, what time does the team arrive at the game?
b. Adesh bikes at a rate of 32 kilometers per hour. How many minutes does it take him to complete the 40-kilometer bike ride?
The team arrives at 2:45 p.m.
It takes Adesh 75 minutes to complete the bike ride. b. On the way back, the bus travels at a rate of 35 miles per hour. How far does the bus travel in 15 minutes?
c. There are two 10-minute transitions during the triathlon. One is between the swim and the bike ride. The other is between the bike ride and the run. Including the two 10-minute transitions, Adesh finishes the triathlon in 3 hours and 5 minutes. Find Adesh’s rate in kilometers per hour for the 10-kilometer run part of the triathlon.
The bus travels 8.75 miles in 15 minutes. 3. Leo runs the 40-yard dash in 4.84 seconds. Round answers to the nearest hundredth as necessary.
Adesh runs at a rate of 10 kilometers per hour.
a. What is Leo’s rate in yards per second?
Remember
Leo’s rate is 8.26 yards per second.
For problems 5 and 6, divide.
b. What is Leo’s rate in feet per second?
5. 25,060 ¸ 70
Leo’s rate is 24.78 feet per second.
6. 75,000 ¸ 60
358
c. What is Leo’s rate in feet per minute?
1,250
7. An antelope can run as fast as 60 miles per hour.
Leo’s rate is 1,486.8 feet per minute.
a. At that rate, how many miles can an antelope run in 15 minutes?
d. What is Leo’s rate in feet per hour?
At that rate, an antelope can run 15 miles in 15 minutes.
Leo’s rate is 89,208 feet per hour. b. At that rate, how many feet can an antelope run in 2 minutes?
e. What is Leo’s rate in miles per hour?
At that rate, an antelope can run 10,560 feet in 2 minutes.
Leo’s rate is 16.9 miles per hour. © Great Minds PBC
410
311
312
P R ACT I C E
© Great Minds PBC
© Great Minds PBC
EUREKA MATH2 6 ▸ M1 ▸ TD ▸ Lesson 21
EUREKA MATH2
6 ▸ M1 ▸ TD ▸ Lesson 21
8. When traveling to Mexico, Jada exchanged her 10 US dollars for 200 Mexican pesos. What is the exchange rate between US dollars and Mexican pesos? Choose all that apply. A. 20 dollars per peso
EUREKA MATH2
6 ▸ M1 ▸ TD ▸ Lesson 21 ▸ A Story of Ratios Modeling Cycle
Name
Date
Modeling in A Story of Ratios
B. 20 pesos per dollar C.
1 peso per dollar 20
Read
D.
1
Read the problem all the way through. Ask yourself:
20
dollar per peso
•
What is this problem asking me to find?
Then reread a chunk at a time. As you reread, ask yourself: •
What do I know?
Model the situation, possibly with tables, graphs, diagrams, and equations.
Represent Represent the problem by using your chosen model. Ask yourself: •
What labels do I use on the table, graph, or diagram?
•
How should I define the variables?
As you work, ask yourself: •
Are the known and the unknown clear in the model?
Add to or revise your model as necessary.
Solve Solve the problem. Determine whether your result appears to be a correct solution. Ask yourself: •
Does my answer make sense?
•
Does my result answer the question?
If not, revise your model or create a new one. Then ask yourself these questions again using your new result.
Summarize Summarize your result and be ready to justify your reasoning.
© Great Minds PBC
© Great Minds PBC
P R ACT I C E
313
© Great Minds PBC
305
411
Topic E Percents In topics A–C, students write, describe, manipulate, and compare ratios. In topic D, students solve real-world problems by reasoning about rates and unit conversions. In topic E, students extend their understanding of ratios and rates when they explore the meaning of percent. They use tools and strategies developed throughout the module to model percent problems and solve for unknown percents, parts, and wholes. In the opening lesson, students use 10 ´ 10 grids and the context of a cell phone battery’s charge to investigate and define percent. Students understand that a percent is a fraction with a denominator of 100, and they apply that understanding to write equivalent fractions and to convert fractions. For example, students 4 apply the definition of percent to express fractions such as 25 and 10 as 40%. Students clarify misconceptions about the differences between tenths and hundredths as they move among fraction, decimal, and percent forms. To explore the concept of percents greater than 100, students use the familiar context of dollars and cents. Over the course of three lessons, students build fluency with mental calculations involving benchmark percents such as 25%, 10%, and 1%. They apply ratio and rate reasoning and think of percents as rates per 100. Students first determine unknown percents when given the parts and wholes. Then they transition Yuna Scott to determining unknown parts and 45% 55% unknown wholes when given percents. Students progress from using pictorial models, such as double number lines, to applying abstract thinking, such as using 18 more votes 1% to determine any percent.
412
© Great Minds PBC
EUREKA MATH2 6 ▸ M1 ▸ TE
Number of Students
0
12
24
36
48
60
0%
20%
40%
60%
80%
100%
Percent
In the final lesson of the topic, students apply their understanding of percents in two multi-step problems. First, students reason about the greatest and least possible parts when given incomplete information. Then students plan a cafeteria menu given caloric requirements expressed as percents in an open-ended modeling task. Both problems give students opportunities to choose their solution strategies and decide whether they are solving for an unknown percent, part, or whole. In later modules, students use rates and percents to solve real-world problems. In grade 7, students will explore other types of percent problems, such as percent increase and decrease, tax, discount, commission, and percent error.
Progression of Lessons Lesson 22 Introduction to Percents Lesson 23 Finding the Percent Lesson 24 Finding a Part Lesson 25 Finding the Whole Lesson 26 Solving Percent Problems
© Great Minds PBC
413
22
LESSON 22
Introduction to Percents
Relate percents to a part-to-whole relationship where the whole is 100. Model percents and write percents in fraction and decimal forms.
EUREKA MATH2
Name
6 ▸ M1 ▸ TE ▸ Lesson 22
Date
EXIT TICKET
22
1. Shade the grid to represent 58%.
Lesson at a Glance In this lesson, students discover the meaning of a percent in the context of charging a cell phone battery. Students continue to use this context to explore percents and express percents in equivalent fraction and decimal forms. Finally, students match denominations of money to percents and explore percents greater than 1 00%. The term percent is introduced in this lesson.
Key Questions • What is a percent, and what does it represent? • What are the relationships between percents, fractions, and decimals? 2. Write 58% as a fraction. 58 100
Achievement Descriptor
3. Write 58% as a decimal.
6.Mod1.AD7 Model and explain percents and problems involving
0.58
© Great Minds PBC
percents. (6.RP.A.3.c)
323
© Great Minds PBC
EUREKA MATH2 6 ▸ M1 ▸ TE ▸ Lesson 22
Agenda
Materials
Fluency
Teacher
Launch 5 min
• None
Learn 30 min
Students
• Charging Batteries
• 4 Colored pencils
• What Is the Charge?
Lesson Preparation
• Greater Than 1 00%
• None
Land 10 min
© Great Minds PBC
415
EUREKA MATH2
6 ▸ M1 ▸ TE ▸ Lesson 22
Fluency Express Fractions as Decimals Students write equivalent fractions with denominators of 100 and express the fractions as decimals to prepare for expressing numbers in fraction, decimal, and percent forms. Directions: Write each fraction as an equivalent fraction with a denominator of 100and as a decimal. Problem
Fraction
Equivalent Fraction
Decimal
1.
1 2
_
___ 50
0.5
2. 3.
__
11 20
__
4.
13 10
5.
3 4
6.
416
_
3 5
_
7 __ 10
7.
2 __ 25
8.
__ 12 5
100
___ 60 100
55 ___
0.6
100
0.55
100
1.3
130 ___
___ 75 100
0.75
70 ___ 100
0.7
___ 8 100
0.08
___ 240
2.4
100
Teacher Note Instead of this lesson’s Fluency, consider administering the Equivalent Fractions with Denominators of 10 or 100 Sprint. Directions for administration can be found in the Fluency resource. EUREKA MATH2
6 ▸ M1 ▸ Sprint ▸ Equivalent Fractions with Denominators of 10 or 100
A
Number Correct:
Find the unknown numerator. 1.
1 = 5 10
19.
1 = 10 100
2.
2 = 5 10
20.
3 = 10 100
3.
3 = 5 10
21.
6 = 10 100
4.
4 = 5 10
22.
8 = 10 100
5.
1 = 2 10
23.
5 = 10 100
6.
10 = 20 10
24.
1 = 2 100
7.
12 = 20 10
25.
1 = 4 100
8.
14 = 20 10
26.
3 = 4 100
9.
16 = 20 10
27.
2 = 5 100
10.
18 = 20 10
28.
3 = 5 100
11.
8 = 20 10
29.
12 = 20 100
12.
6 = 20 10
30.
15 = 20 100
13.
6 = 30 10
31.
18 = 20 100
14.
5 = 50 10
32.
36 = 40 100
15.
10 = 50 10
33.
12 = 40 100
16.
20 = 50 10
34.
24 = 40 100
17.
30 = 50 10
35.
22 = 40 100
18.
40 = 50 10
36.
32 = 40 100
418
© Great Minds PBC
© Great Minds PBC
EUREKA MATH2 6 ▸ M1 ▸ TE ▸ Lesson 22
Launch
5
Students explore a real-world situation involving percents. Display the picture of two cell phones.
100%
5%
Teacher Note Have students think–pair–share about the following prompt. Circulate and listen for stories that include percent reasoning in the details about the different battery charges. Tell a story about the picture. Sample: My mom charged her cell phone overnight. I saw the 1 00%battery symbol and knew that the phone was fully charged when I grabbed it for her on our way out the door this morning. My mom must have used her phone all day because when I tried to play a game on it on the way home from school today, the battery symbol was red, almost empty, and said 5 %. The phone even turned off in the middle of my game. I told my mom she should charge it again. She told me that she thinks something is wrong with the battery because she must keep charging it. Invite a few students to share their stories with the class. After students have finished sharing their stories, have students consider how the real-world stories connect to percents.
© Great Minds PBC
Consider your students’ experience with percents and cell phones. Encourage students to use their life experiences to create a story, including thinking of other electronic devices they may have or devices available in the classroom that display battery charges in percents. Consider guiding students to notice details about the first cell phone battery being fully charged in the first picture and the cell phone battery being almost out of charge in the second picture. Then guide students to provide an initial description of what the percent symbol means in this context.
417
EUREKA MATH2
6 ▸ M1 ▸ TE ▸ Lesson 22
Imagine you had the cell phone with 5 %battery charge left. Do you think you would have a lot of power left? Why? When I look at the picture, only a small amount is shaded out of the whole battery. I think that means the battery would be almost out of power at 5 %. Where else have you seen the percent symbol? Sample: I have seen the percent symbol in stores, like when items are on sale for 3 0% off or 5 0%off. I have seen the percent symbol show my grade on tests and quizzes, such as 100%. I drink 1% milk. Today, we will discover the meaning of percent, use the percent symbol, and explore real-world situations by using percents.
Learn Charging Batteries Students determine the meaning of percent and its symbol, % . Display the image of the two cell phones.
100%
418
5%
© Great Minds PBC
EUREKA MATH2 6 ▸ M1 ▸ TE ▸ Lesson 22
Point to 1 00%and give the following information. The symbol at the end is called the percent symbol. We read this as “one hundred percent.” We’re going to explore the battery situation to figure out what this symbol means. Have students complete problems 1–4 in pairs. Circulate and observe how students shade their batteries and the percents they choose to represent the battery charge. Shade the battery to show the charge that matches each description. Fill in the blank with a percent that you think best matches the battery charge. 1. The battery is fully charged and has a charge of _____%.
Teacher Note The focus for this work and discussion is to activate students’ prior knowledge of percents in the context of battery charge on a cell phone. Because students continue to work with percents throughout the lesson, they may not shade the batteries exactly or have a complete understanding of percents at this point in the lesson. Encourage students to shade the battery charge using estimation and context clues. Consider prompting students with the following questions. • In problem 1, what does fully mean? What do you think it means if the battery is fully charged?
100 2. The battery hasn’t been charged since yesterday and has a charge of about _____%.
• For problem 2, if a battery has not been charged for a day, can you estimate how much battery charge is left? Would it be closer to full, half full, or empty? • For problem 3, how can you use what you know about fractions to approximate how much battery charge remains?
Sample: 9
3. The battery has _ 1of a full charge remaining and has a charge of _____%. 4
25 © Great Minds PBC
419
EUREKA MATH2
6 ▸ M1 ▸ TE ▸ Lesson 22
4. The battery has _ 1of a full charge remaining and has a charge of _____%. 2
50
After most students have finished, display the 1 0 × 10Grid interactive. 17 100
17%
Adjust the battery to different charges and ask the class to observe the relationship among the grid, fraction, and percent. What do you notice as the battery charge is changed? Sample: As the battery charge increases, more squares in the grid are shaded. The numerator of the fraction is the same as the number of shaded squares and the denominator is always 100. The numerator of the fraction and the percent are the same number. 420
© Great Minds PBC
EUREKA MATH2 6 ▸ M1 ▸ TE ▸ Lesson 22
Based on your observations, what do you think percents are? Sample: I think percents somehow relate to the number 100because there are 1 00squares in the grid. Percents might be related to the numerator in the fraction.
Language Support
If the battery charge is 43%, how many squares will be shaded?
This activity begins with students interacting with real-world examples of percents so that students can create an informal definition. Once the formal definition of percent is given, direct students to write and label an example of a percent in their books. Encourage students to think of a percent as a fraction with a denominator of 1 00and to write out the fraction form of the percent throughout the rest of the lesson.
43squares will be shaded. What is the total number of squares in the grid? 100 What fraction of the grid will be shaded? How do you know?
The fraction of the grid that will be shaded is ___ 43 because there are 43 shaded squares 100 out of a total of 100 squares in the grid. Adjust the battery charge on the interactive to 4 3%to confirm students’ answers. Direct students to continue working in pairs for problems 5–7. 5. Shade the grid to represent 1 7%.
© Great Minds PBC
421
EUREKA MATH2
6 ▸ M1 ▸ TE ▸ Lesson 22
6. Shade the grid to represent 5 0%.
7. Use the grids in problems 5 and 6 to complete the table.
Percent
Number of Shaded Squares
Total Number of Squares
17%
17
100
50%
50
100
Ratio of the Number of Shaded Squares to the Total Number of Squares 17 : 100 50 : 100
When students are finished, lead a discussion about problem 7 by asking the following questions. What do you notice about the numbers in the table? I notice that the number of shaded squares is the number in front of the percent symbol. The total number of squares is always 1 00because there are 1 00squares in the grid.
422
© Great Minds PBC
EUREKA MATH2 6 ▸ M1 ▸ TE ▸ Lesson 22
What do you notice about the fraction, the percent, and the number of shaded squares in the grid? I notice that the number of shaded squares is the same as the numerator of the fraction and the total number of squares, 1 00, is the denominator. The percent doesn’t include the 100but instead has the percent symbol. For example, 1 7%has the same value as ___ 17 . 100
What Is the Charge? Students write numbers in fraction form, in decimal form, and as percents. Display and introduce the definition of percent. A percent is a fraction with a denominator of 1 00. A number followed by the percent N ___ symbol, N %, indicates . 100
What is 1 1%as a fraction? 11%as a fraction is ___ 11 . 100
Direct students to complete problem 8 individually. If students have difficulty finding the percents, ask the following questions: • What relationship do you notice between the fraction and the percent in the first row of the table? • How can you use the definition of percent to help you rewrite the fraction as a percent? 8. Complete the table. Fraction 45 ___ 100 25 ___ 100 85 ___ 100
5 ___ 100
© Great Minds PBC
Percent 45% 25% 85% 5%
423
EUREKA MATH2
6 ▸ M1 ▸ TE ▸ Lesson 22
When most students have finished, confirm their responses. Display the grid and battery that represent 0 .04.
Differentiation: Support As necessary, remind students about decimal place values and the precise way to read decimals aloud, such as “four tenths and four hundredths.” Ask students how the decimal value can help them find the corresponding fraction.
Battery Level
As students complete the table in problem 9, look for students who may incorrectly interpret 0.4as 4 %. Encourage them to use place value reasoning to see the difference between 0.04 and 0 .4. Use the 1 0 × 10Grid interactive as needed to help students compare 4% and 40%.
What do you notice about the grid when the battery charge is 0 .04? 4squares are shaded. How can you write a fraction to represent the number of shaded squares? There is a total of 1 00squares in the grid. If 4out of the 1 00squares are shaded, I can write the fraction ___ 4 to represent the number of shaded squares. 100
How can you write ___ 4 as a percent? 4%
100
Direct students to fill in the first row of the table in problem 9 and then to work in pairs to complete the remaining rows of the table. Circulate as students work and look for accurate representations in the grid and in the percent and fraction forms.
424
© Great Minds PBC
EUREKA MATH2 6 ▸ M1 ▸ TE ▸ Lesson 22
9. Complete the table. Grid
Percent
4%
Decimal
0.04
Fraction
4 ___ 100
Supporting the Standards for Mathematical Practice Students repeatedly use a 10 × 10grid to notice that the number of shaded squares in the grid is the numerator when 100 is the denominator. They also see that the numerator represents the percent value in those fractions. When they do this, they are looking for and expressing regularity in repeating reasoning (MP8). Ask the following questions to promote MP8:
40%
0.4
40 ___ 100
• What patterns did you notice when you shaded different numbers of squares? • What is the same about each fraction? • Will the pattern of counting the number of shaded squares always work?
© Great Minds PBC
25%
0.25
25 ___ 100
80%
0.8
80 ___ 100
425
EUREKA MATH2
6 ▸ M1 ▸ TE ▸ Lesson 22
When most students have finished, confirm students’ responses and ask the following questions. Liam says 0.3is equivalent to 3 %. Is he correct? Why?
No. Liam is not correct. 0 .3is equivalent to the fraction ___ 30 and the percent 3 0%. 100
How are the percent, decimal, and fraction in each row of the table related? If I write the fraction with a denominator of 100, the numerator is the percent. The numerator is also the number of hundredths, so I can use it to write the decimal. The percent, decimal, and fraction all represent the same value. They are equivalent.
Display the square showing __ 1 . Then display the 1 0 × 10 grid showing __ 1 . 10
10
How can you use the 1 0 × 10 grid showing __ 1 to write an equivalent fraction with 10 a denominator of 1 00?
The grid has 1 00squares. I can count the number of shaded squares in the __ 1 section and 10
write an equivalent fraction out of 100. There are 10squares shaded, so __ 1 is equivalent to ___ 10 .
10
100
How can you write ___ 10 as a percent? How do you know?
100 ___ 10 is equivalent to 1 0%. A percent is a fraction with a denominator of 1 00, so I can use
Teacher Note If students give equivalent fractions that do not have a denominator of 100, validate their answers but ask them whether the fractions they gave are helpful for finding the decimal and percent forms of the number.
100
the numerator to write the percent because it has a denominator of 1 00.
426
© Great Minds PBC
EUREKA MATH2 6 ▸ M1 ▸ TE ▸ Lesson 22
How can you write ___ 10 as a decimal?
100 ___ 10 is equivalent to ten hundredths, so I can write ten hundredths as 0 .10, or 0 .1.
100
Have students complete the first row of the table in problem 10. What relationship do you see among the fractions, decimal, and percent in the first row of the table? They all represent the same value. 1 0%is another way to express the value of the
fractions __ 1 and ___ 10 . 1 0%also represents the value of 0.10because I can write the 10
100
percent as a decimal to the hundredths place. As a class, continue to model the fractions in the table by using the shaded squares and 10 × 10grids. Invite students to identify the equivalent fraction, decimal, and percent for each. Then have students complete the relevant row of the table. 10. Complete the table. Fraction
__
Equivalent Fraction
Equivalent Decimal
Equivalent Percent
1 10
10 100
___
0.10
10%
1 4
_
25 ___ 100
0.25
25%
3_ 5
60 ___ 100
0.60
60%
7 __ 20
35 ___ 100
0.35
35%
__
64 ___ 100
0.64
64%
16 25
© Great Minds PBC
Teacher Note If students quickly understand the relationship between fractions out of 100 and use those fractions to write an equivalent decimal and percent, consider having students finish the table in pairs without using the shaded squares and 10 × 10 grids.
427
6 ▸ M1 ▸ TE ▸ Lesson 22
EUREKA MATH2
After students complete the table, have them think–pair–share about the following question.
Suppose we did not have the shaded squares and 1 0 × 10grids. What other strategies could you use to find an equivalent fraction with a denominator of 1 00? I could multiply the numerator and denominator of the fraction each by the factor that makes the denominator equal to 1 00. For example, I could write _ 3as a fraction 4 with a denominator of 1 00by multiplying the numerator and denominator each by 25 because 4 × 25 = 100.
Display Scott’s grid.
Scott says that 3 6%of the grid is shaded. Is Scott correct? Explain. No. The number of shaded squares in the grid does not represent 36%of the grid. 3 6% represents 3 6out of 1 00. This grid only shows 3 6out of 5 0. Because 3 6is more than half of 50, the percent must be greater than 5 0%.
Greater Than 1 00% Students model and interpret percents greater than 100%.
Display the 1 0 × 10grid that is shaded to represent one quarter coin.
428
© Great Minds PBC
Quarter
Dime
Nickel
Penny
EUREKA MATH2 6 ▸ M1 ▸ TE ▸ Lesson 22
Each shape represents a different coin. Remember that one dollar is equal to 100 cents. This grid has 100 identical squares. What do you notice about the grid when it is shaded to represent one quarter coin?
There are 2 5shaded squares. The shaded area of the grid looks like one quarter, or _ 1 , 4 of the total area of the grid.
Display the 10 × 10grid that is shaded in a different way to represent one quarter coin.
Differentiation: Challenge Pose the following question to prompt critical thinking about the possible combinations of coins. • Is there a way to make exactly one dollar with 96 pennies and one additional coin? Explain.
© Great Minds PBC
Quarter
Dime
Nickel
Penny
No. If I used exactly 96 pennies, I still need $0.04to make one dollar, and I can’t do that with any single coin. The only way to make one dollar is with 4 more pennies.
429
EUREKA MATH2
6 ▸ M1 ▸ TE ▸ Lesson 22
How many squares are shaded? How does this number relate to one quarter coin? There are 2 5shaded squares. One quarter coin is equal to 2 5 cents. How does the number of shaded squares relate to one dollar, or 100 cents?
2 5out of 1 00squares are shaded to represent the quarter coin. This number of shaded squares relates to how one quarter coin represents 2 5out of 1 00cents in one dollar. Review the value of one dime, one nickel, and one penny by having students predict how many squares will be shaded to represent each coin. Then display the grids that are shaded to represent one dime, one nickel, and one penny. Have students think–pair–share about the following prompt. Suppose I wanted to fill the whole grid, with no overlaps or gaps, to represent 1 00cents. Which coins could I use? How many of each coin would I need to use? How do you know? Sample: You could use 3 quarters and 5 nickels to fill in the grid. 3 times 2 5cents is equal to 7 5cents, and 5 times 5 cents is equal to 2 5cents, which is 1 00cents altogether. After a few students share their ideas, choose a combination that is equal to 1 00 cents. Complete problem 11 as a class and have students use colored pencils to fill in the grid.
Teacher Note If students do not give coin combinations that equal 100 cents, consider sharing the following combinations. Ask students to think about why each combination equals 100cents. • 2 quarters, 5 dimes • 1 quarter, 6 dimes, 3 nickels • 3 quarters, 3 nickels, 10 pennies
11. Fill in the whole grid, with no overlaps or gaps, to represent 1 00cents. Complete the table by filling in the number of coins used, the percent of the grid that each coin represents, and the total dollar amount for each type of coin. Sample:
430
© Great Minds PBC
EUREKA MATH2 6 ▸ M1 ▸ TE ▸ Lesson 22
Coin
Number of Coins Used
Percent of Grid
Total Dollar Amount
Quarter
2
50%
$0.50
Dime
2
20%
$0.20
Nickel
3
15%
$0.15
Penny
15
15%
$0.15
Discuss the following questions. How can you tell what percent of the grid each coin represents? The grid has 1 00squares, so I can count the number of squares each coin represents to write the corresponding percent of the grid. For example, if there were 2 0 squares shaded for 2 dimes, the percent of the grid the dimes represented would be 2 0%. How can you determine the total dollar amount for each type of coin by looking at the grid? There are 1 00cents in one dollar and 1 00squares in the grid. I can write the dollar amount by counting the number of squares and writing that number as a decimal to the hundredths place with a dollar sign. For example, I can write 1 5pennies as $ 0.15. What do you notice about the sum of the percents in the table? I notice the percents in the table add up to 1 00%. Will the percents always add to 1 00%? Why? Yes. The percents should always add up to 1 00even if the filled grid is represented by different numbers of coins because the whole grid is shaded. One whole grid represents 1 00%.
© Great Minds PBC
431
EUREKA MATH2
6 ▸ M1 ▸ TE ▸ Lesson 22
As time allows, model and discuss other combinations of coins that equal 1 00 cents. After the last example, facilitate a class discussion by using the following questions. If you added one more quarter, how much money would that represent? $1.25 Where can you represent an additional quarter on the grid? Why? An additional quarter would not fit on the grid because there are only 100squares and they are already filled. Display the two grids and ask the following question.
Number of Pennies: 1 00
Pennies 0 –100
Pennies 1 01–200
Each grid represents 1 00%. If I add one more penny to the next grid, what percent do you think the pennies will represent? Why? I think the pennies will represent 101%because adding one more penny is the same as adding 1 %. Each square represents 1 %because there are 1 00squares in the grid and a percent is a fraction with a denominator of 100. 432
© Great Minds PBC
EUREKA MATH2 6 ▸ M1 ▸ TE ▸ Lesson 22
Display the two grids that are both filled with pennies.
Number of Pennies: 2 00
Pennies 0 –100
Pennies 1 01–200
Engage in a class discussion by using the following questions to confirm thinking about percents greater than 1 00%. What percent do you think is represented by the two grids filled with pennies? How do you know? I think the two grids filled with pennies represent 2 00%. One full grid represents 100%, so two full grids represent 200%. What is the fraction that represents 2 00%of one dollar? Explain.
The fraction that represents 200%of one dollar is ___ 200because you have 2 00pennies out 100 of 1 00 pennies. If one dollar represents 100%, how much money is 2 00%of one dollar? How do you know?
2 00%of one dollar is two dollars because there are 200pennies in two dollars out of 1 00 pennies in one dollar. © Great Minds PBC
433
EUREKA MATH2
6 ▸ M1 ▸ TE ▸ Lesson 22
How much money is 1 50%of one dollar? How do you know?
1 50%of one dollar is one dollar and fifty cents because that is 1 50pennies out of 1 00pennies in one dollar. What does a percent that is greater than 1 00%mean? Give an example. A percent that is greater than 1 00%means that you have more than 1 00parts when the whole is 1 00equal parts. For example, one dollar is 1 00pennies. If you have more than one dollar, then you have more than 1 00%because you have more than 1 00pennies. 125%is 1 25pennies out of 1 00pennies, or $ 1.25. When there are more than 1 00parts, and the whole is 1 00equal parts, we have a percent greater than 1 00%. For example, 1 80%of one dollar is 1 80pennies. 100pennies is one dollar, so we have a percent greater than 1 00%to represent 180 pennies. How much money is 2 50%of one dollar? $2.50 Where else have you seen examples of percents greater than 1 00%? Sample: When I have earned extra credit on a test, sometimes my score is greater than 1 00%.
434
Differentiation: Challenge Challenge students with the following question about the meaning of percents greater than 1 00%. • Adesh has two $1.00bills and one quarter. That is worth _%of $ 1.00. Explain.
225 Each dollar is 100 pennies and one quarter is 25 pennies. Altogether, there are 225 pennies out of 100 pennies in one dollar. So that is 2 25%.
© Great Minds PBC
EUREKA MATH2 6 ▸ M1 ▸ TE ▸ Lesson 22
Land Debrief 5 min Objectives: Relate percents to a part-to-whole relationship where the whole is 100. Model percents and write percents in fraction and decimal forms. Use the following prompts to facilitate a class discussion. Encourage students to add on to their classmates’ responses. What is a percent, and what does it represent? A percent is a fraction with a denominator of 100. A percent represents the number of parts you have if the whole is divided into 1 00equal parts. What are the relationships between percents, fractions, and decimals? Percents are another way to express the value of a fraction or a decimal. We can write fractions that are equivalent to a percent or write the percent as a decimal to the hundredths place. Imagine a grid with 4 parts out of 5 shaded. How could you use equivalent fractions to figure out what percent is shaded?
The fraction that is shaded is _ 4 . I know that the grid of 100squares can be divided into 5 5equal sections of 2 0squares each. Four of those sections would be 8 0 squares, so _ 4 5 is equivalent to ___ 80 , or 8 0%. 100
Exit Ticket 5 min Provide up to 5 minutes for students to complete the Exit Ticket. It is possible to gather formative data even if some students do not complete every problem.
Teacher Note Assign the Practice problems for completion outside of class or use them in class if time remains after the lesson. Refer students to the Recap for support.
© Great Minds PBC
435
EUREKA MATH2
6 ▸ M1 ▸ TE ▸ Lesson 22
Recap
EUREKA MATH2
6 ▸ M1 ▸ TE ▸ Lesson 22
RECAP Name
Date
22
EUREKA MATH2
6 ▸ M1 ▸ TE ▸ Lesson 22
3 2. Consider 20 .
a. Write an equivalent fraction with a denominator of 100. 15 100
Introduction to Percents In this lesson, we
b. Write 3 as a decimal.
Terminology
•
explored the meaning of percent.
•
wrote percents in fraction and decimal forms.
0.15
A percent is a fraction with a denominator of 100.
1. Consider the colored squares on a 10 ´ 10 grid.
20
c. Write 3 as a percent.
A number followed by the percent symbol, N%,
Examples
3 15 × 55 = 100 20
15%
N indicates 100 .
20
3 15 Because the fraction 20 is equivalent to 100 , 3 the fraction 20 can be written as 15%.
3. Consider the grids. One whole is a single 10 ´ 10 grid.
One 10 ´ 10 grid, or 100 squares, represents one whole. This model shows that more than 100% of the whole is shaded.
a. What is the ratio of the number of blue squares to the total number of squares?
39 : 100
a. Represent the shaded area as a fraction. 113 100
b. What fraction of the grid is blue? 39 100
c. What percent of the grid is blue?
39% d. What percent of the grid is not blue?
61%
© Great Minds PBC
436
b. Represent the shaded area as a decimal.
There are 39 blue squares out of a total of 100 squares. So 39%
1.13
of the squares are blue.
c. Represent the shaded area as a percent.
113%
The percent of squares that are blue and the percent of squares that are not blue must add to 100%. 325
326
RECAP
© Great Minds PBC
© Great Minds PBC
EUREKA MATH2 6 ▸ M1 ▸ TE ▸ Lesson 22
EUREKA MATH2
6 ▸ M1 ▸ TE ▸ Lesson 22
4. Sasha says that 24% of the diagram is shaded. Is Sasha correct? Explain.
Sasha is not correct. There are 24 shaded squares out of a total of 30 squares, which does not represent 24%. Counting squares to determine a percent only works if the diagram has a total of 100 squares. A diagram with 24 shaded squares out of a total of 100 squares represents 24%.
© Great Minds PBC
© Great Minds PBC
RECAP
327
437
EUREKA MATH2
6 ▸ M1 ▸ TE ▸ Lesson 22
Sample Solutions Expect to see varied solution paths. Accept accurate responses, reasonable explanations, and equivalent answers for all student work.
EUREKA MATH2
6 ▸ M1 ▸ TE ▸ Lesson 22
PRACTICE Name
Date
22
6 ▸ M1 ▸ TE ▸ Lesson 22
EUREKA MATH2
2. Consider 9%. a. Shade the grid to represent 9%.
1. The shaded squares in the grid show the occupied seats in a movie theater.
b. Write 9% as a fraction. 9 100
a. What is the ratio of the number of occupied seats to the total number of seats?
33 : 100
c. Write 9% as a decimal.
0.09
b. What fraction of the seats are occupied? 33 100
3. Consider 2 . 5
a. Write an equivalent fraction with a denominator of 100.
c. What percent of the seats are occupied?
40 100
33%
b. Write 25 as a decimal.
d. What percent of the seats are not occupied?
67%
0.40 c. Write 2 as a percent. 5
40%
© Great Minds PBC
438
329
330
P R ACT I C E
© Great Minds PBC
© Great Minds PBC
EUREKA MATH2 6 ▸ M1 ▸ TE ▸ Lesson 22
EUREKA MATH2
6 ▸ M1 ▸ TE ▸ Lesson 22
4. Complete the table. Grid
EUREKA MATH2
6 ▸ M1 ▸ TE ▸ Lesson 22
5. Consider the grids. One whole is a single 10 ´ 10 grid. Percent
Decimal
Fraction
45%
0.45
45 100
a. Represent the shaded area as a fraction.
1 75
100
17%
0.17
b. Represent the shaded area as a decimal.
17 100
1.75 c. Represent the shaded area as a percent.
175% 70%
0.7
70 100
6. Yuna says that 40% of the diagram is not shaded. Lacy says that 4% of the diagram is not shaded. Who is correct? Explain how you know.
Yuna is correct. Because 6 of the diagram is shaded, 4 of the diagram is not shaded. 10
10
The fraction 4 is equivalent to 40 . The fraction 40 is equal to 40%. 10
7%
0.07
7 100
100
100
7. Leo says that 11% of the diagram is shaded. Adesh says that 55% of the diagram is shaded. Who is correct? Explain how you know.
Adesh is correct. Because 11 of the diagram is shaded, 55 of the diagram is shaded. 20
The fraction 55 is equal to 55%.
100
100
© Great Minds PBC
© Great Minds PBC
P R ACT I C E
331
332
P R ACT I C E
© Great Minds PBC
439
EUREKA MATH2
6 ▸ M1 ▸ TE ▸ Lesson 22
EUREKA MATH2
6 ▸ M1 ▸ TE ▸ Lesson 22
Remember For problems 8 and 9, divide. Write the quotient and the remainder on separate lines. 8. 6,052 ¸ 20
9. 5,410 ¸ 30
Quotient: 302
Quotient: 180
Remainder: 12
Remainder: 10
10. Sasha types at a rate of 35 words per minute. a. At this rate, how many words does Sasha type in one half-hour? Sasha types 1,050 words in one half-hour. b. At this rate, how many words does Sasha type per second? Sasha types 7 words per second. 12
For problems 11 and 12, list all the factors for the number shown. 11. 12
1, 2, 3, 4, 6, 12 12. 40
1, 2, 4, 5, 8, 10, 20, 40
© Great Minds PBC
440
P R ACT I C E
333
© Great Minds PBC
23
LESSON 23
Finding the Percent Calculate a percent when given a part and the whole. Discover that if multiple parts make a whole, then the percents representing the parts should total 100%.
EUREKA MATH2
6 ▸ M1 ▸ TE ▸ Lesson 23
Name
EXIT TICKET
Date
23
Blake receives a gift of $80.00. He spends $60.00 on a new game and $8.00 on snacks. a. Draw a double number line to represent the percent of Blake’s gift money he spends. 0
8
16
24
32
40
48
56
64
0%
10%
20%
30%
40%
50%
60%
70%
80%
BIake’s Money Percent
68
85%
72
80
90%
100%
b. What percent of Blake’s gift money does he spend on a new game?
75%
Lesson at a Glance This lesson begins with a guided example that explores how to use a tape diagram to determine unknown percents. Through observation and discussion, students extend their understanding from the prior lesson, where they worked with percents on a 10 ´ 10 grid, to using tape diagrams to find unknown percents when the whole is not 100. In pairs, students discuss the connections between percents and equivalent ratios. Students then explore how to use double number lines to calculate percents, focusing on percents greater than 100%. The lesson concludes with a discussion about the strategies and tools students have used so far to determine unknown percents. Students also consider which strategies and tools are the most helpful in different situations.
Key Question • When given a part and the whole, what strategies can we use to determine the percent that the part represents?
c. What percent of Blake’s gift money does he spend on snacks?
10%
Achievement Descriptors 6.Mod1.AD7 Model and explain percents and problems involving
d. What percent of Blake’s gift money does he have remaining?
percents. (6.RP.A.3.c)
75 + 10 = 85 100 - 85 = 15
6.Mod1.AD8 Solve problems that involve finding the part, whole,
Blake has 15% of his gift money remaining.
© Great Minds PBC
or percent. (6.RP.A.3.c)
341
© Great Minds PBC
EUREKA MATH2 6 ▸ M1 ▸ TE ▸ Lesson 23
Agenda
Materials
Fluency
Teacher
Launch 10 min
• None
Learn 25 min
Students
• Using Tape Diagrams to Model Percents
• Calculator
• Using Double Number Lines to Model Percents
Lesson Preparation • None
Land 10 min
© Great Minds PBC
443
EUREKA MATH2
6 ▸ M1 ▸ TE ▸ Lesson 23
Fluency Fractions and Decimals That Total 1
Students complete number sentences with fractions and decimals that total 1 to prepare for calculating percents. Directions: Fill in the blank to make each number sentence true. 1.
1 + 5
=1
4 5
2.
3 + 4
=1
1 4
3.
7 + 10
=1
3 10
4.
11 + ———— = 1 20
9 20
5.
83 + 100
=1
17 100
6.
0.1 +
=1
0.9
7.
0.01 +
= 1
0.99
8.
0.16 +
=1
0.84
9.
0.66 +
=1
0.34
444
© Great Minds PBC
EUREKA MATH2 6 ▸ M1 ▸ TE ▸ Lesson 23
Launch
10
Students learn the history of the symbol for percent, %. Direct students to the historical information about the Roman Empire. Give students 2 to 3 minutes to read the prompt silently. Then have them complete problem 1 with a partner. About 2,000 years ago, the Roman Empire was a vast territory. To maintain the empire, taxes were collected from its citizens. Initially, the tax system was very unfair because it relied on people called tax farmers to collect taxes in an area called a province. These tax farmers prepaid the estimated taxes for their province and then kept any extra money they collected from the citizens. Tax farmers were able to get rich quickly this way. Roman emperor Augustus Caesar stopped the process of tax farming and taxed Roman citizens more fairly. Roman citizens earned income and paid taxes with silver coins called denarii.
Teacher Note If students need additional practice writing numbers in fraction, decimal, and percent forms, consider replacing this Launch activity with a sequence of problems reviewing the ideas from lesson 1. A sample sequence is shown. • Write 26% as a fraction and a decimal. • Write 145% as a fraction and a decimal. • Write 8% as a fraction and a decimal. • Write 65 as a percent. 100
• Write 12 as a percent. 50
• Write 3 as a percent. 4
• Write 19 as a percent. 20
• Write 7 as a percent. 5
1. Imagine that you are the emperor of Rome. You want to tax the citizens fairly. How much would you tax each of the following citizens? Explain your thinking. a. Citizen A earns 225 denarii per year. b. Citizen B earns 375 denarii per year. c. Citizen C earns 3,750 denarii per year. As students discuss, circulate and listen for various taxing strategies. Some students may choose to tax each citizen equal amounts. Other students might tax citizen C much more than citizen A or citizen B. Students may also tax based on a percent or a fraction. © Great Minds PBC
445
EUREKA MATH2
6 ▸ M1 ▸ TE ▸ Lesson 23
After several minutes, call the class back together. Select several pairs to share their taxation plan. Then use the following prompts to facilitate a discussion. What is fair about taxing each citizen the same amount? What is unfair? Taxing each citizen the same amount is fair because they would all have to pay the same amount. Taxing each citizen the same amount is unfair because citizen C earns much more than citizen A and citizen B, so citizen C would have a lot more money left over after paying taxes. What is fair about taxing each citizen 1 of their income? What is unfair about taxing 10 each citizen 1 of their income? 10
It is fair to tax each citizen 1 because then they all pay the same fraction of their income. 10
It is unfair to tax each citizen 1 because then citizen A only has to pay 22.5 denarii and 10
citizen C has to pay 375 denarii, which is much more than citizen A pays in taxes. Which citizens do you think would prefer that everyone pay the same amount? Explain your reasoning. I think that citizen C would prefer that everyone pay the same amount because then the amount would have to be lower so that most people could afford to pay it. As a result, citizen C would have the most income remaining after paying taxes. Which citizens do you think would prefer to be taxed a set percent of their income? Explain your reasoning. I think that citizens A and B would prefer to be taxed a set percent of their income. That way, they know they are paying the same part out of their whole earnings as everyone else. Citizen C might not prefer it, because even though he pays the same part out of his whole earnings, that amount is much higher for him. Augustus Caesar reformed the tax system by setting up a land tax system that taxed Roman citizens approximately one part out of one hundred. The Latin words per centum mean “per one hundred.” Over time, this became the simpler English term percent. Display the original symbol that was used to represent per centum.
p
446
© Great Minds PBC
EUREKA MATH2 6 ▸ M1 ▸ TE ▸ Lesson 23
This is the original symbol that was used to represent per centum. How is this similar to the percent symbol we use? How is it different? It is similar because it looks like two circles with a line between them. It is different because it seems much more difficult to draw and it has an extra p at the beginning. Display the drawing.
Teacher Note If students are interested in further study of Roman taxation and the origin of the percent symbol, consider incorporating the material provided in the Math Past resource.
Have students observe the presented drawing. Then have them think–pair–share about the following questions. If needed, prompt students’ thinking by pointing out that our modern percent symbol has two zeros in it, which indicates that it is per hundred. The symbol on the left is our percent symbol today. As we learned in the previous lesson, it means “per one hundred.” What do you think the second symbol means? What do you think the third symbol means? I think the second symbol means per thousand because it has an extra zero in it and one thousand has one more zero than one hundred. I think the third symbol means per ten thousand because it has two extra zeros. Confirm for students that the second symbol (permille) means “per thousand” and the third symbol (permyriad ) means “per ten thousand.” Then have students complete problem 2 in pairs. 2. The symbol ‰ is called permille. The symbol ‱ is called permyriad. How can 80% be expressed in permille? How can it be expressed in permyriad?
80% = 800‰ 80% = 8,000‱
© Great Minds PBC
447
EUREKA MATH2
6 ▸ M1 ▸ TE ▸ Lesson 23
When most students have finished or when the struggle is no longer productive, discuss as a class. Why do you think that the percent symbol is much more common than the symbol for permille and permyriad? It is easier to understand percent because it is out of 100. What do you notice about the rates 80 per 100, 800 per 1,000, and 8,000 per 10,000? All of the rates have the unit rate 4 . 5
Today, we will solve problems by identifying the part and the whole in a situation and by finding the percent of the whole that the part represents.
Learn
25
Using Tape Diagrams to Model Percents
Differentiation: Challenge If students determine how to express 80% in permille and permyriad, challenge them to express other percents in permille and permyriad. A sample set of problems is shown. Percent
Permille
Permyriad
(%)
(‰)
(‱)
14
140
1,400
6
60
600
250
2,500
25,000
50
500
5,000
450
4,500
45,000
Students use tape diagrams to determine what percent of a whole that a part represents. Display the picture of the cell phone showing the battery’s remaining charge.
448
© Great Minds PBC
EUREKA MATH2 6 ▸ M1 ▸ TE ▸ Lesson 23
Have students think–pair–share about the following question. What information about the cell phone battery can you determine from the picture? What information cannot yet be determined? I know that the battery is closer to being dead than being fully charged. I know that it is charged less than 100%, but I don’t know exactly what the percent is. I don’t know how long the battery’s charge will last. In the previous lesson, we used a 10 ´ 10 grid to model the percent that a battery is charged. Today, we will use a tape diagram to model this percent. Display the picture of the tape diagram without partitions. Then have students discuss the following questions.
0%
100%
This tape represents the cell phone battery’s remaining charge. Suppose that the whole tape represents a battery that has a whole charge. Estimate the battery’s remaining charge as a percent. How do you know? It looks a little less than half-charged. The line representing 50% would be exactly in the middle, and the green section ends before that. It could be about 45% charged. Estimate what part of the battery’s charge has already been used. Write that part as a percent. How do you know? It looks like slightly more than half, or about 55%, of the battery’s charge has already been used. The amount of charge used and the amount of remaining charge must add up to the whole charge, or 100%. How could you modify this tape diagram to get a more precise estimate of the battery’s charge? I could divide the tape into even units, like tenths or fifths, to see how many units are shaded and how many units are not shaded. When I can find the fractional amount that is shaded, I can write that number as a percent by converting it to a fraction with a denominator of 100.
© Great Minds PBC
449
EUREKA MATH2
6 ▸ M1 ▸ TE ▸ Lesson 23
Present problem 3 to students. If students need support in understanding the diagram in problem 3, have them turn and talk about how this diagram is different from the one shown earlier and what the equal units represent. Then direct students to complete problem 3. 3. The tape diagram represents the remaining charge of a cell phone’s battery.
0%
100%
a. What percent of the battery’s charge does each unit of the tape diagram represent? Explain. Each unit represents 20% of the battery’s charge. Five equal units of 20% totals the whole, 100%. b. What fraction represents the battery’s remaining charge? What fraction represents the battery’s charge that has been used? 2 of the battery’s charge remains. 5 3 of the battery’s charge has been used. 5
c. What percent of the battery’s charge remains? What percent of the battery’s charge has been used?
40% of the battery’s charge remains. 60% of the battery’s charge has been used. Review the solutions to problem 3. As needed to support student comprehension of the problem, invite students to turn and talk about the following questions:
Differentiation: Support
• How does your answer to part (c) compare to your estimate from earlier? • What do you notice about the amount of the battery charge remaining and the amount of battery charge that has been used in parts (b) and (c)? • How does 55 relate to 100%? How do you know? Divide students into pairs or small groups. Assign each group only one of the parts (a)–(d) of problem 4. Depending on the number of students in the class, more than one group may 450
If time allows, when assigning groups to complete parts of problem 4, have groups complete one problem from parts (a) and (b) and one problem from parts (c) and (d) so that groups are exposed to a variety of difficulty in problems.
© Great Minds PBC
EUREKA MATH2 6 ▸ M1 ▸ TE ▸ Lesson 23
be completing the same problem part. Give students several minutes to work in their groups to draw a tape diagram and answer the question in their problem part. As needed, allow students to use calculators to compute answers efficiently. 4. The following students estimate the number of hours their cell phone battery will last when it has a whole charge. a. Ryan’s phone battery lasts 10 hours. How many hours will Ryan’s phone last when the battery’s remaining charge is 40%? Draw a tape diagram to determine your answer.
4 2 0%
2 20%
2 40%
2 60%
2 80%
100%
Ryan’s phone battery will last 4 hours. b. Kayla’s phone battery lasts 15 hours. How many hours will Kayla’s phone last when the battery’s remaining charge is 40%? Draw a tape diagram to determine your answer.
6 3 0%
3 20%
3 40%
3 60%
3 80%
100%
Kayla’s phone battery will last 6 hours. c. Riley’s phone battery lasts 8 hours. How many hours will Riley’s phone last when the battery’s remaining charge is 40%? Draw a tape diagram to determine your answer.
3.2 1.6 0%
1.6 20%
1.6 40%
1.6 60%
1.6 80%
100%
Riley’s phone battery will last 3.2 or 16 hours. 5
© Great Minds PBC
451
EUREKA MATH2
6 ▸ M1 ▸ TE ▸ Lesson 23
d. Lacy’s phone battery lasts 6 hours. How many hours will Lacy’s phone last when the battery’s remaining charge is 40%? Draw a tape diagram to determine your answer.
2.4 1.2 0%
1.2 20%
1.2 40%
1.2 60%
1.2 80%
100%
Lacy’s phone battery will last 2.4 or 12 hours.
Language Support To support the relationship between the commonly used words in this topic of percent, part, and whole or total (used interchangeably), consider annotating the tape diagram in the decontextualized problem and answer for problem 3.
5
Whole Part
Select a student from each group to share their group’s tape diagram and solution. Give other groups time to record the tape diagrams and solutions for any parts that they did not complete.
0
1
2
3
4
5
Use the following prompts to clarify the meaning of the words part and whole to students in the context of percents.
0%
20%
40%
60%
80%
100%
In the previous lesson, we found a percent that represented the number of colored squares in a 10 ´ 10 grid, which was one whole. Often in the real world, we want to model situations by using percents where the whole is not exactly 100.
Percent
As the lessons in this topic progress, consider annotating problems in a similar manner.
In problem 4, the whole amount, or 100%, represents the number of hours the phone battery lasts on a whole charge, such as 10 hours or 15 hours. When 40% of the battery’s charge remains, the remaining amount of time in hours is only a part of that whole. Turn and talk with a partner about where you see the whole, the part, and the percent on each of these tape diagrams. When partners have finished talking, direct all students to complete problem 5 in their groups.
452
© Great Minds PBC
EUREKA MATH2 6 ▸ M1 ▸ TE ▸ Lesson 23
5. Complete the table with the numbers from parts (a)–(d) in problem 4. Remaining Amount of Battery’s Charge (hours)
Total Amount of Battery’s Charge (hours)
4
10
6
15
3.2
8
2.4
6
Facilitate a brief discussion. What do you notice about the pairs of numbers in the rows of the table? The pairs of numbers in the rows of the table form equivalent ratios. They all have the same value of the ratio, 2 , or 40 , which is equivalent to the remaining amount of the 5 100 battery’s charge, 40%. How would you describe the relationship between ratios and percents? A ratio can be made into a percent by finding its equivalent ratio in which the second number is 100. For instance, we can multiply each number in the ratio 2 : 5 by 20 to get the equivalent ratio 40 : 100. This means that 2 is 40% of 5. Parts and wholes that represent the same percent also have the same value of the ratio. For example, 2 : 5, 6 : 15, and 40 : 100 all have the same value of the ratio, which is 0.4. That is equivalent to 40%. Direct students’ attention to problems 6–9. What information do we know in this sequence of problems? What is unknown? We know the part and the whole. We don’t know the percent.
© Great Minds PBC
453
EUREKA MATH2
6 ▸ M1 ▸ TE ▸ Lesson 23
Direct students to complete problems 6–9 with a partner. Remind them that they may use any strategy to solve but that drawing a tape diagram might be useful to visualize the relationships between the numbers. As students work, circulate and look for students who use a variety of strategies, such as creating tape diagrams, converting to equivalent fractions with a denominator of 100, or reasoning about the sizes of the part and the whole. For example, students may reason that 18 is half of 36, so 18 represents 50%. For problems 6–9, solve by using any method. 6. 13 out of 20 is what percent?
65%
7. 18 out of 36 is what percent?
13 = 65 20 100
18 = 1 = 50 36 2 100
50%
8. What percent is 24 out of 80?
9. What percent is 17 out of 85?
24 = 3 = 30 80 10 100
30%
17 = 1 = 20 85 5 100
20%
Call the class back together and invite selected students to share their solutions and reasoning. If needed, use the following prompt to highlight mental math strategies that students could use to calculate unknown percents. Could you calculate any of these percents mentally? Explain your thinking. In problem 6, I broke apart 13 into 10 and 3. I know 10 is half, or 50%, of 20. I also figured that 1 out of 20 is equal to 5% so that means 3 out of 20 is 15%. Then I added 50% and 15% to get 65%. In problem 7, I know that 18 is half of 36. Therefore, it’s 50%. In problem 8, I know that 10% of 80 is 8, so 30% must be 3 times 8, or 24. If no student mentions the use of division, use the following question to prompt students’ thinking.
454
© Great Minds PBC
EUREKA MATH2 6 ▸ M1 ▸ TE ▸ Lesson 23
In problem 6, it is simple to write 13 out of 20 as an equivalent fraction with a denominator of 100 to calculate the percent. However, other problems are not so simple, like 17 out of 85 in problem 9. By using a calculator or by hand, divide 17 by 85. What is the quotient?
Promoting the Standards for Mathematical Practice
0.2
When students repeatedly find 40% of different whole amounts and then divide the part by the whole to notice the pattern
How do you express 0.2 as a percent?
20%
that the quotient
Direct students to use their calculators to divide the pairs of numbers in problems 7–9 and check that this division strategy works for those problems as well as problem 6. Then direct students to use their calculators to divide the four pairs of numbers in problem 4 to verify that the pairs of numbers all equal 40%. Invite students to think–pair–share about the following question. Will this division strategy always work to determine an unknown percent? Why? Yes. It will always work. When we divide the part by the whole, we are creating the decimal form of the percent that is represented by the part out of the whole. For example, 4 and 6 are both equivalent to 0.4, which is the fraction 40 , or 40%. 10
are looking for and expressing regularity in repeated reasoning (MP8). Ask the following questions to promote MP8: • When you divide the part by the whole in each of the problems, is anything repeating? How could that help you find the percent when given a part and a whole more efficiently? • Will the pattern of dividing the part by the whole to find the percent always work?
100
15
part N = 100 = N %, they whole
Using Double Number Lines to Model Percents Students use double number lines to determine percents greater than 100%. Display the tape diagram and double number line. 0
1
2
3
4
5
6
7
8
9
10
0% 10% 20% 30% 40% 50% 60% 70% 80% 90% 100%
© Great Minds PBC
0
1
2
3
4
5
6
7
8
9
10
0% 10% 20% 30% 40% 50% 60% 70% 80% 90% 100%
455
EUREKA MATH2
6 ▸ M1 ▸ TE ▸ Lesson 23
Invite students to turn and talk about the following questions. • What is similar about these two representations? What is different? • Suppose you wanted to find out the percent that 14 is out of 10. Which model would be most useful? Why? Double number lines are another useful representation to show the relationship between the part, whole, and percent. They are especially useful for finding percents greater than 100% because the number lines can be extended to the right. Direct students to complete problem 10 in pairs. 10. Noah sets a goal to eat at least 80 grams of protein each day. Today, he eats 92 grams. What percent of his goal does Noah eat today? Draw a double number line to show your thinking. Number of Grams of Protein
0
8
16
24
32
40
48
56
64
Percent 0%
10%
20%
30%
40%
50%
60%
70%
80%
72
80
88
92
96
115%
90% 100% 110% 120%
Noah eats 115% of his goal today.
Teacher Note When asking students to think about the percent that 14 is out of 10, consider showing them the following equations and having them explain how the equations relate to the double number line that goes with this problem. 14 10
4 = 10 + 10 10 10 10
= 100 100
4 10
40 = 100
14 10
= 140 100
If necessary, explain that when we add
10 4 we get 14 . We can show that this is + 10 10 10 100 40 equivalent to 140% by adding + 100 . 100
Select a student pair to share their double number line and solution. As necessary, use the following questions to walk students through the process of determining how to use their double number lines to find the percent that 92 is out of 80. How did you set up your double number line? I drew a line to represent the number of grams of protein that Noah eats and a line to represent the percent of his goal Noah reaches. I knew that 80 grams of protein represents 100% of Noah’s goal, so I created a tick mark for this pair of numbers. I drew a tick mark further to the right, or greater than 100%, to represent the 92 grams he eats today.
456
© Great Minds PBC
EUREKA MATH2 6 ▸ M1 ▸ TE ▸ Lesson 23
How did you decide the interval of the tick marks in your diagram? I noticed that 80 and 100 are both divisible by 10, so I created tick marks representing every 10% of Noah’s goal, which is 8 grams of protein. How did you use your double number line to determine the solution? Once I knew that every 8 grams of protein represents 10% of Noah’s goal, I found that 92 grams is halfway between 88 grams and 96 grams. I drew a tick mark in between them and determined that 92 grams of protein is 115% of Noah’s goal. Invite students who may have created their double number lines with different intervals to share their thinking. For example, students may have created intervals of 5% and 4 grams of protein. Some students may have started with larger intervals, such as 25% and 20 grams of protein, and then realized that they needed to be more precise in order to calculate the unknown percent. Does it make more sense to use a double number line or a tape diagram for this problem? Why? It makes more sense to use a double number line. With numbers so large, a tape diagram would have gotten long and difficult to keep up with. Once I knew that 96 was between 110% and 120%, I only had to draw one tick mark to find what percent it was. I didn’t have to divide every unit in a tape diagram in half to represent every 5%. Consider using the following prompts to further discuss this problem and how it might be approached without using a tool such as a double number line or tape diagram. Let’s use our division strategy from earlier and think of 92 out of 80 grams of protein as the fraction 92 . If we divide 92 by 80, what do you know about the quotient? 80
I know the quotient will be a decimal greater than 1 if we divide 92 by 80, because 92 is greater than 80. Use a calculator to divide 92 by 80. What answer do you get?
1.15
How does this answer relate to the answer you got when you calculated the percent by using a double number line?
1.15 is the decimal form of 115%. It is 115 hundredths.
© Great Minds PBC
457
EUREKA MATH2
6 ▸ M1 ▸ TE ▸ Lesson 23
Have students complete problems 11–14 independently. Consider encouraging them to check their work by dividing the part by the whole to see whether the result is the decimal form of the percent they determined. Circulate and observe the different strategies that students use to solve. For problems 11–14, solve by using any method. 11. 18 is what percent of 15? 18
120%
15
450
= 1.2
13. 21 out of 20 is what percent?
105%
12. 450 out of 150 is what percent?
21 = 1.05 20
300%
150
= 3
14. What percent is 675 out of 500? 675
135%
500
= 1.35
Students use appropriate tools strategically (MP5) when they choose among tape diagrams, double number lines, and other models in order to make sense of finding percents. Ask the following questions to promote MP5: • What tool would help you find an unknown percent? • Why did you use a tape diagram? Why did you use a double number line? Which was most helpful?
Differentiation: Challenge
Select a few students to share their solutions and strategies. As students share, ask them to respond to the following question. In reading these problems, how did you tell what number represented the part and what number represented the whole? I noticed that the question asks out of or of when referring to the whole. The part is the other number. To prepare students to think about mental math strategies to calculate percent problems in the next lesson, pose the following question. Highlight different pathways that students may have used for the same problem. Were there any problems that you could solve mentally? How? Explain your thinking. In problem 12, I knew that 450 is 3 times as much as 150, or 300% of 150. In problem 13, I knew that 1 out of 20 represents 5%, because 1 = 20
5 . I knew that 100
20 out of 20 represents the whole, or 100%. I mentally added 5% and 100% to get 105%.
458
Promoting the Standards for Mathematical Practice
Challenge students by posing the following error analysis questions after students have completed problems 11–14. • Another student solved problem 12 and claimed that the answer was 200%. What was this student’s mistake? This student may not have considered the first 150 as 100%. Instead, she may have been thinking that 450 is 300 more than 150 and 300 is two times 150. This may have led her to thinking the answer is 200%. • Another student solved problem 12 and claimed the answer was 33%. What was this student’s mistake? This student may have used 450 as the whole and 150 as the part.
© Great Minds PBC
EUREKA MATH2 6 ▸ M1 ▸ TE ▸ Lesson 23
Land Debrief 5 min Objectives: Calculate a percent when given a part and the whole. Discover that if multiple parts make a whole, then the percents representing the parts should total 100%. As students provide answers for the following questions, encourage them to share strategies they used for problems worked during class. When given a part and the whole, what strategies can we use to determine the percent that the part represents? We can use mental math to determine the relationship between the part and whole. For example, 18 is 50% of 36 because 18 is half of 36, or 2 is 40% of 5 because 25 is equivalent to 40 . 100
We can set up a tape diagram or a double number line to represent the whole as 100% and divide it into sections that represent smaller percents, such as 10% or 20% increments. We can divide the part by the whole and then write the quotient in percent form. For example, we divided 17 by 85 to find 0.2, which is 20%. Give an example of when these models or strategies are the most helpful. Using mental math strategies is easy when finding 50% or 10% of a number. A tape diagram is helpful when finding a percent for which the part and the whole are small numbers. A double number line is helpful when finding a percent for which the part and the whole are large numbers and also when the percent is greater than 100%. Does it make sense to say that 125% of the students at school have overdue library books? Why? No. Whatever the total number of students at school is, it represents 100% of the students. There can’t be more than the total number of students at the school who have overdue library books.
© Great Minds PBC
459
EUREKA MATH2
6 ▸ M1 ▸ TE ▸ Lesson 23
Give an example of when it would make sense to have 125% of something. Sample: The rainfall in April might be 125% of the rainfall in March.
The height of one mountain might be 125% of the height of another mountain.
Exit Ticket 5 min Provide up to 5 minutes for students to complete the Exit Ticket. It is possible to gather formative data even if some students do not complete every problem.
460
Teacher Note Assign the Practice problems for completion outside of class or use them in class if time remains after the lesson. Refer students to the Recap for support.
© Great Minds PBC
EUREKA MATH2 6 ▸ M1 ▸ TE ▸ Lesson 23
Recap
EUREKA MATH2
6 ▸ M1 ▸ TE ▸ Lesson 23
RECAP Name
Date
23
EUREKA MATH2
6 ▸ M1 ▸ TE ▸ Lesson 23
2. On June 1, Yuna does 4 push-ups. On June 8, Yuna does 14 push-ups. a. 14 is what percent of 4? Draw a diagram to show your thinking.
Finding the Percent
0
In this lesson, we
1
2
3
4
•
created tape diagrams and double number lines to model percents, parts, and wholes.
•
calculated a percent when given a part and the whole.
0% 25% 50% 75% 100%
350%
1. Tyler can drive his remote-control car for 75 minutes nonstop on a whole battery charge. He drives the remote-control car for 30 minutes nonstop. a. Draw a diagram to determine the percent of the battery’s charge Tyler has used.
75
14
200%
300%
350%
15
15
On June 8, Yuna did 350% of the number of push-ups she did on June 1.
diagram, divide 75 by 15 to get 5 equal-size units. Each Each unit also represents
15
15
0%
15 100%
40%
20% of the whole, because 20 ´ 5 = 100. Two units represent 30 minutes, or 40% of the battery’s whole
The number 4 represents the whole, so it is on the same tick mark as 100%.
b. What does your answer to part (a) represent in this situation?
Both 75 and 30 are multiples of 15. To create a tape
unit represents 15 minutes.
30
b. What percent of the battery’s charge remains?
100 - 40 = 60 60% of the battery’s charge remains.
85%
whole. Continue the double number line to reach 14 push-ups, or 350%.
One efficient way to calculate a percent when given a part and the whole is to divide the part by the whole. Then, write the decimal answer as a percent.
4. 285 is what percent of 75? 285 = 3.8 = 380% 75
380%
whole charge.
343
to 100% into 4 equal-size intervals to show that every push-up represents 25% of the
68 = 0.85 = 85% 80
charge used.
The percent of the battery’s charge that remains plus the percent of the battery’s charge that has been used adds up to 100%, or the battery’s
Divide the section from 0 to 4 and 0%
3. What percent is 68 out of 80?
Tyler has used 40% of the battery’s charge.
© Great Minds PBC
12
Percent
Examples
© Great Minds PBC
8
Number of Push-Ups
344
RECAP
380 Notice that 3.8 can be written as 100 . This can be expressed as 380%.
© Great Minds PBC
461
EUREKA MATH2
6 ▸ M1 ▸ TE ▸ Lesson 23
Sample Solutions Expect to see varied solution paths. Accept accurate responses, reasonable explanations, and equivalent answers for all student work
EUREKA MATH2
6 ▸ M1 ▸ TE ▸ Lesson 23
PRACTICE Name
Date
23
EUREKA MATH2
6 ▸ M1 ▸ TE ▸ Lesson 23
For problems 8–13, solve by using any method. 8. There are 25 students in Kayla’s math class. There are 32 students in her physical education class.
1. Riley has $200.00. She spends $60.00 on a video game.
a. 32 is what percent of 25?
a. What percent of her money does Riley spend? Draw a diagram to show your thinking. 0
20
40
60
80
100
120
140
160
180
200
0%
10%
20%
30%
40%
50%
60%
70%
80%
90%
100%
32 128 = 25 100
128%
Riley’s Money
b. What does the answer to part (a) represent in this situation?
Percent
The number of students in Kayla’s physical education class is 128% of the number of students in her math class.
Riley spends 30% of her money. c. 12 students from Kayla’s math class say that math is their favorite subject. What percent of the students in Kayla’s math class say that math is their favorite subject?
b. What percent of her money does Riley have remaining?
100 - 30 = 70
48 12 = 25 100
Riley has 70% of her money remaining.
48% of the students in Kayla’s math class say that math is their favorite subject. For problems 2–7, determine the unknown percent by using any method. 2. 15 out of 25 is what percent?
60% 4. What percent of 40 is 12?
d. 24 students in Kayla’s physical education class say that soccer is their favorite game. What percent of the students in Kayla’s physical education class say that soccer is their favorite game?
3. What percent is 9 out of 10?
90% 5. 45 is
75
percent of 60.
Number of Students in PE
30%
0
8
16
24
32
0%
25%
50%
75%
100%
Percent
6. What percent of 30 is 45?
150%
© Great Minds PBC
462
7. 250 is what percent of 125?
200%
75% of the students in Kayla’s physical education class say that soccer is their favorite game.
345
346
P R ACT I C E
© Great Minds PBC
© Great Minds PBC
EUREKA MATH2 6 ▸ M1 ▸ TE ▸ Lesson 23
EUREKA MATH2
6 ▸ M1 ▸ TE ▸ Lesson 23
9. Toby drives 170 miles of his 500-mile road trip.
EUREKA MATH2
6 ▸ M1 ▸ TE ▸ Lesson 23
12. Noah estimates that his maximum heart rate is 208 beats per minute. Noah’s teacher tells him that his target heart rate for physical activity is between 70% and 85% of his maximum heart rate. After running one mile, Noah’s heart rate is 156 beats per minute.
a. What percent of his road trip does Toby drive? 170 34 = 500 100
When Noah ran one mile, did he meet his target heart rate? Explain.
Toby drives 34% of his trip.
0
52
104
156
208
0%
25%
50%
75%
100%
Heart Rate
b. What percent of his road trip does Toby have left to drive?
Percent
100 - 34 = 66 Toby has 66% of his trip left to drive.
Noah did meet his target heart rate. His heart rate after running one mile was 75% of his maximum heart rate, which is in the range of 70% to 85%. 10. Animal clinic A has 4 cats out of a total of 10 animals. Animal clinic B has 12 cats out of a total of 25 animals. Which clinic has the greater percent of cats? 4 = 40 10 100
13. Scott earns $12.00 per hour at his after-school job. After a pay raise, Scott makes $15.00 per hour.
12 = 48 25 100
a. 15 is what percent of 12?
At animal clinic A, 40% of the animals are cats. At animal clinic B, 48% of the animals are cats. Therefore, animal clinic B has the greater percent of cats.
0
3
6
9
12
15
0%
25%
50%
75%
100%
125%
Scott’s Pay Percent
11. In her hometown, Yuna pays $0.80 in tax on a $10.00 purchase. When visiting a beach town, she pays $0.50 in tax on a $5.00 purchase. Which town charges the greater tax percent on purchases? 0.8 = 8 = 8% 10 100
15 is 125% of 12.
0.5 = 10 = 10% 5 100
b. What does your answer to part (a) represent in this situation?
The beach town charges the greater tax percent on purchases. The beach town charges Yuna 10% in taxes, and her hometown charges 8% in taxes.
© Great Minds PBC
© Great Minds PBC
P R ACT I C E
Scott makes 125% of his previous pay after the pay raise.
347
348
P R ACT I C E
© Great Minds PBC
463
EUREKA MATH2
6 ▸ M1 ▸ TE ▸ Lesson 23
EUREKA MATH2
6 ▸ M1 ▸ TE ▸ Lesson 23
Remember For problems 14 and 15, divide. Write the quotient and the remainder on separate lines. 14. 6,244 ¸ 40
15. 9,560 ¸ 50
Quotient: 156
Quotient: 191
Remainder: 4
Remainder: 10
16. On Saturday, Leo earns a total of $70.00 for mowing lawns and doing chores. He mows 3 lawns and earns $15.00 per lawn. He does chores for 2 hours. What rate in dollars per hour does Leo earn for doing chores? Leo earns $12.50 per hour for doing chores.
17. 25 is a multiple of which numbers? Choose all that apply. A. 1 B. 5 C. 10 D. 25 E. 50
© Great Minds PBC
464
P R ACT I C E
349
© Great Minds PBC
24
LESSON 24
Finding a Part Calculate a part when given the whole and a percent.
EUREKA MATH2
6 ▸ M1 ▸ TE ▸ Lesson 24
Name
Date
EXIT TICKET
24
A giant jellyfish weighs 440 pounds. If 95% of the jellyfish’s weight is water, how many pounds of the jellyfish’s weight is water? Justify your answer. If 95% of the jellyfish’s weight is water, then 5% of the jellyfish’s weight is not water.
10% of 440 pounds is 44 pounds. 5% of 440 pounds is 22 pounds. 440 - 22 = 418 418 pounds of the jellyfish’s weight is water.
Lesson at a Glance In this lesson, students first calculate percents by using double number lines. They develop fluency with mental calculations of benchmark percentages through a teacher-led Whiteboard Exchange. To calculate more challenging percentages that are not benchmark percentages, students explain and apply a variety of strategies. In a Would You Rather? game, students choose a method to determine the percent of a quantity.
Key Question • How do we determine a part when given the whole and a percent?
Achievement Descriptor 6.Mod1.AD8 Solve problems that involve finding the part, whole,
or percent. (6.RP.A.3.c)
© Great Minds PBC
359
© Great Minds PBC
EUREKA MATH2 6 ▸ M1 ▸ TE ▸ Lesson 24
Agenda
Materials
Fluency
Teacher
Launch 5 min
• None
Learn 30 min
Students
• Use Mental Math to Find Percents
• Double Number Line removable
• More Than One Way
Lesson Preparation
• Would You Rather?
• None
Land 10 min
© Great Minds PBC
467
EUREKA MATH2
6 ▸ M1 ▸ TE ▸ Lesson 24
Fluency Calculations with Unit Fractions Students compare fractions of whole numbers to prepare for calculating percents. Directions: Fill in each blank with <, >, or = to make a true statement. 1 of 60 3
1.
1 of 50 2
2.
1 of 9 3
3.
1 of 100 4
4.
1 of 30 5
1 of 80 10
<
5.
1 of 4 4
1 of 5 5
=
468
1 of 12 4 1 of 150 5
> = <
© Great Minds PBC
EUREKA MATH2 6 ▸ M1 ▸ TE ▸ Lesson 24
Launch
5
Students calculate percents of a quantity by using double number lines. Direct students’ attention to problem 1. Give students a few minutes to complete the problem in pairs or small groups. Students may not complete the double number lines as thoroughly as shown in the student solutions. Accept any work with a double number line that allows students to determine a correct solution. 1. A group of students want their school to start an art club. Jada, Tyler, Blake, and Lisa each gather data from a survey to determine the number of students at the school who support the creation of an art club. Use the double number lines provided to determine the number of students in each set of data who support the creation of an art club. Jada’s Data
75% of 76 students support the creation of an art club. 0
19
38
57
76
0%
25%
50%
75%
100%
Number of Students Percent
57 students from Jada’s data support the creation of an art club. Tyler’s Data
80% of 60 students support the creation of an art club. Number of Students
0
12
24
36
48
60
0%
20%
40%
60%
80%
100%
Percent
48 students from Tyler’s data support the creation of an art club. © Great Minds PBC
469
EUREKA MATH2
6 ▸ M1 ▸ TE ▸ Lesson 24
Blake’s Data
15% of 360 students support the creation of an art club. Number of Students
0
36
0%
10%
Percent
360
72
108
144
180
216
252
288
324
20%
30%
40%
50%
60%
70%
80%
90% 100%
54
15%
54 students from Blake’s data support the creation of an art club. Lisa’s Data
70% of 90 students support the creation of an art club. Number of Students
90
0
9
18
27
36
45
54
63
72
81
0%
10%
20%
30%
40%
50%
60%
70%
80%
90% 100%
Percent
63 students from Lisa’s data support the creation of an art club. Encourage students to use their double number lines to answer the following question. Allow students to debate possible cases for the strongest evidence. Which student’s data provides the strongest evidence in support of the creation of an art club? Explain. Sample: Tyler’s data provides the strongest evidence because it shows the greatest percent of students supporting the creation of the club. Blake’s data provides the strongest evidence because it shows responses from the greatest number of students. Lisa’s data provides the strongest evidence because it shows the greatest number of students supporting the creation of the club. 470
© Great Minds PBC
EUREKA MATH2 6 ▸ M1 ▸ TE ▸ Lesson 24
Display the four completed double number lines. Use the following prompts to discuss the data.
Jada’s Data
75% of 76 students support the creation of an art club. Number of Students
0
19
38
57
76
0%
25%
50%
75%
100%
80% of 60 students support the creation of an art club. Number of Students
0
12
24
36
48
60
0%
20%
40%
60%
80%
100%
Percent
Percent
Blake’s Data
15% of 360 students support the creation of an art club. Number of Students
Tyler’s Data
0
36
0%
10%
Percent
360
72
108
144
180
216
252
288
324
20%
30%
40%
50%
60%
70%
80%
90% 100%
54
15%
Lisa’s Data
70% of 90 students support the creation of an art club. Number of Students
90
0
9
18
27
36
45
54
63
72
81
0%
10%
20%
30%
40%
50%
60%
70%
80%
90% 100%
Percent
Why do the double number lines have different numbers of tick marks? In each case, we needed to determine a different percent. For example, one double number line is split into sections of 20% because we needed to determine 80%. Another double number line is split into sections of 10% because we needed to determine 70%.
Differentiation: Support
What do the circled values on each double number line represent? They represent the number and the percent of students who support the creation of an art club. The circled values represent the number and the percent of students who support the creation of an art club. The school principal agrees to approve the creation of an art club if at least 60 students support it. Whose data should the students show to the principal?
Double number lines are not used for the remainder of this lesson. However, some students may still need the support of a pictorial model to complete the percent calculations. Direct these students to use the Double Number Line removable and their personal whiteboards to sketch double number lines as needed.
The students should show Lisa’s data to the principal.
© Great Minds PBC
471
EUREKA MATH2
6 ▸ M1 ▸ TE ▸ Lesson 24
In the previous lesson, we used double number lines to find unknown percents when given parts and wholes. What is different about how we used double number lines in this problem compared to how we used them in the previous lesson? In this problem, we used double number lines to determine percents of numbers. Today, we will explore multiple strategies for calculating the percent of a number.
Learn Use Mental Math to Find Percents Students use mental math to calculate the percent of a number. Facilitate a Whiteboard Exchange. We are going to practice calculating percents mentally. I will ask a question and you will independently answer the question on your whiteboard. When you have an answer ready, hold up your board for me to see. Give immediate feedback to each student. If many students need support, go through the solution of that problem as a class before moving on to the next problem in the sequence. Ask one question at a time and check students’ answers after each question. Movement through these questions should be quick, as students will ideally need only a few seconds per question. What is 50% of 100?
50
Teacher Note This lesson uses the informal term benchmark percentages to describe percentages that are simple to calculate mentally, such as 50%, 25%, 10%, and 1%. This Whiteboard Exchange helps students understand these percentages conceptually before performing more challenging mental calculations. For example, students explore the fact that 100% is made up of two halves of 50%, which is why we can divide a number by 2 to find 50% of that number. Throughout topic E, continue to revisit these benchmark percentages to help students build fluency with mentally calculating percents.
What is 50% of 160?
80
What is 50% of 80?
40 472
© Great Minds PBC
EUREKA MATH2 6 ▸ M1 ▸ TE ▸ Lesson 24
Pause the Whiteboard Exchange and ask students how they can determine 50% of any number. Call on a couple of students to share their thinking with the class. If no student suggests dividing by 2 or taking half, consider sharing those strategies with the class. Resume the Whiteboard Exchange. What is 25% of 100?
25
What is 25% of 160?
40
What is 25% of 80?
20
Teacher Note Consider preparing an anchor chart that shows problems, solutions, and strategies. As the class progresses through the lesson, continue to add to the anchor chart. For example: Problem What is 25% of 160?
Solution Strategy
40
Rationale
divide in 25% is half half and of 50%, half again; which is divide by 4 half of 100%
Pause the Whiteboard Exchange and use the following prompts to discuss how to determine 25% of any number. How did you find 25% mentally? How do you know your strategy works?
I divided the whole in half and then in half again. It works because 25% is half of 50%, which is half of 100%, or the whole. I divided the whole by 4. It works because 25% is 1 fourth of 100%. Resume the Whiteboard Exchange. What is 10% of 100?
10
UDL: Representation Consider showing each of these benchmark percentages with a tape diagram so that students can make visual connections to how the division strategies work. Examples are shown.
What is 10% of 160?
16
What is 10% of 80?
0%
50%
100%
8
What is 10% of 16?
1.6
© Great Minds PBC
0%
20%
40%
60%
80%
100%
473
EUREKA MATH2
6 ▸ M1 ▸ TE ▸ Lesson 24
Pause the Whiteboard Exchange and use the following prompts to discuss how to determine 10% of any number. How did you find 10% mentally? How do you know your strategy works? I divided the whole by 10. It works because 10% is 1 tenth of 100%. Resume the Whiteboard Exchange. What is 5% of 100?
5
What is 5% of 160?
8
What is 5% of 80?
Differentiation: Support To support students, consider asking them to find 10% of more multiples of 10 before finding 10% of 16. • What is 10% of 50? • What is 10% of 110?
Differentiation: Challenge
4
To challenge students, consider asking them to find 10% of decimal numbers.
What is 5% of 20?
• What is 10% of 4.2?
1
• What is 10% of 0.8?
Pause the Whiteboard Exchange and use the following prompts to discuss how to determine 5% of any number. How did you find 5% mentally? How do you know your strategy works? I found 10% and divided by 2. It works because 5% is half of 10%.
I divided the whole by 20. It works because 5% is 1 twentieth of 100%. Resume the Whiteboard Exchange. What is 1% of 100?
1
What is 1% of 160?
1.6
474
© Great Minds PBC
EUREKA MATH2 6 ▸ M1 ▸ TE ▸ Lesson 24
What is 1% of 80?
0.8
What is 1% of 16?
0.16
Pause the Whiteboard Exchange and use the following prompts to discuss how to determine 1% of any number. How did you find 1% mentally? How do you know your strategy works? I divided the whole by 100. It works because 1% is 1 hundredth of 100%. Summarize the Whiteboard Exchange with students. We calculated 50%, 25%, 10%, 5%, and 1% of different numbers by using mental strategies. What other percents could we calculate mentally? How? We could calculate 20% by dividing the whole by 5 or by doubling the result of finding 10%. We could calculate 200% by doubling the whole.
More Than One Way Students use multiple strategies to calculate the percent of a number. Let students know that they are going to apply the mental math strategies from the Whiteboard Exchange in new ways. We learned how we can use mental math to find 50%, 25%, 10%, 5%, and 1% of numbers. Let’s extend these strategies to calculate 16% of 40. Direct students’ attention to problem 2. Allow students several minutes to work through problem 2 in pairs or small groups. Circulate as students work, listening for their understanding of the differences among the three methods.
© Great Minds PBC
475
EUREKA MATH2
6 ▸ M1 ▸ TE ▸ Lesson 24
2. Lisa, Julie, and Toby each calculated 16% of 40 but in different ways. Use their work to answer parts (a)–(g). Lisa’s Method
10% of 40 is 4. 5% of 40 is 2. 1% of 40 is 0.4.
Julie’s Method 16
100
× 40 =
640
100
= 6.4
16% of 40 is 6.4.
Toby’s Method
1% of 40 is 0.4. 16 ´ 0.4 = 6.4 So 16% of 40 is 6.4.
10% + 5% + 1% = 16% 4 + 2 + 0.4 = 6.4 16% of 40 is 6.4.
UDL: Action and Expression Consider supporting students as they practice by providing access to exemplars in the classroom. For example, create a chart that shows Lisa’s, Julie’s, and Toby’s methods for calculating. Regularly refer to the model examples throughout the topic and discuss why each is or is not efficient given different scenarios. Continue to add to the chart with student-generated examples.
a. Explain how Lisa calculated 16% of 40. Lisa calculated 10%, 5%, and 1% of 40 and added the results together to get 16% of 40. b. Use Lisa’s method to calculate 31% of 50.
10% + 10% + 10% + 1% = 31% 5 + 5 + 5 + 0.5 = 15.5 31% of 50 is 15.5. c. What is another percent of 40 you could calculate by using Lisa’s method? Calculate that percent. Sample: 2% of 40 is 0.4 + 0.4, or 0.8. d. Explain how Julie calculated 16% of 40. Julie wrote 16% as a fraction and multiplied by the whole, 40. e. Use Julie’s method to calculate 3% of 80. 3 × 80 = 240 = 2.4 100 100
3% of 80 is 2.4.
476
© Great Minds PBC
EUREKA MATH2 6 ▸ M1 ▸ TE ▸ Lesson 24
f. How are Lisa’s and Toby’s methods similar? How are they different? Both Lisa and Toby find 1% of 40. Lisa also calculates 5% of 40 and 10% of 40 and adds the results to determine her solution. Toby calculates 1% of 40 and then multiplies by 16. g. Use Toby’s method to calculate 8% of 5.
1% of 5 is 0.05. So 8% of 5 is 8 ´ 0.05, or 0.4. When most students are finished, bring the class together. Because the following discussion references the definition of percent often, consider posting the definition in a clear place for students to see. Display the table showing all three methods. Ask a couple of students to share their answers to parts (a)–(g), pausing as needed to provide additional explanation. Then have students think–pair–share about the following questions. In a previous lesson, we defined percent as a fraction with a denominator of 100. How can we use the definition of percent to show that 10% + 5% + 1% = 16%? If we write the percents in fraction form, we have 10 + 100
When students analyze methods for calculating percents and justify conclusions, they are constructing viable arguments and critiquing the reasoning of others (MP3). Ask the following questions to promote MP3: • What parts of Toby’s method do you question? • When do you think Lisa’s method works? • Can you find a situation other than 10% of 40 where Noah’s method in problem 3 works?
5 16 , or 16%. 1 + 100 = 100 100
Lisa calculated 16% of 40 by calculating 10% of 40, 5% of 40, and 1% of 40 and then adding the results. Could she use subtraction to calculate 16% of 40? How?
Yes. 10% + 10% - 1% - 1% - 1% - 1% = 16%. She could determine that 10% of 40 is 4 and 1% of 40 is 0.4, and calculate 4 + 4 - 0.4 - 0.4 - 0.4 - 0.4. How could we use Lisa’s method to calculate 39% of 40?
We could calculate 40% of 40 and 1% of 40. Then we could find the difference of the results. Note that students might choose the strategy of 10% + 10% + 10% + 5% + 1% + 1% + 1% + 1% = 39% to calculate 39% of 40. While this strategy is correct, it is not as efficient in this case as using subtraction. 16 × 40 . Julie wrote 16% of 40 as 16 × 40 . Explain why 16% of 40 is equivalent to 100 100
Promoting the Standards for Mathematical Practice
16 of 40 By our definition of percent, 16% is equivalent to 16 , and we determine 100 100 by multiplying 16 by 40.
Differentiation: Support To support students’ understanding of the three methods and why they work, consider providing additional problems so that students can practice by using each method. As students work, ask them to explain the steps they are taking and why. Possible problems include: • Use all three methods to determine 18% of 72. • Use the method of your choice to determine 54% of 90.
100
© Great Minds PBC
477
EUREKA MATH2
6 ▸ M1 ▸ TE ▸ Lesson 24
How could we use Julie’s method to calculate 12% of 65? We could write 12% as 12 and multiply 12 by 65. 100
100
In his work, Toby assumed that multiplying 16 by 1% of 40 would give him the same result as calculating 16% of 40. Is his assumption valid? Explain by using our definition of percent. 1 is finding 1 part when 40 is divided into Yes. His assumption is valid. Multiplying 40 by 100 100 equal parts. Therefore, we can multiply our result for 1% of 40 by 16 to find 16% of 40.
How could we use Toby’s method to calculate 14% of 80?
We could determine 1% of 80 and then multiply that result by 14. Whose strategy do you prefer to use? Why? I prefer to use Lisa’s strategy because I can use mental math to calculate percents like 50%, 25%, 10%, 5%, and 1% of a number. Then I can add or subtract to determine the percent I need. Direct students to problems 3 and 4. Allow them a couple of minutes to work with a partner or small group. Students can use any method of their choice. 3. Noah noticed that he can calculate 10% of 40 by dividing 40 by 10. To calculate 32% of 40, he divides 40 by 32. Does his method work? Explain. No. Noah’s method does not work. Noah can find 10% of 40 by dividing by 10 because 10% is equivalent to 1 tenth. However, 32% is not equivalent to 1 thirty-second. 4. The girls’ soccer team at a middle school has 25 players. a. Five of the players are seventh-grade students. Find the percent of seventh graders on the team. Explain or show your thinking.
Language Support To support English learners with decontextualizing the situations in problem 4, consider guiding students to create a problem similar to those encountered in the Whiteboard Exchange: • Is the problem asking you to find a percent? If yes, use the problem to fill in the blanks in this question: What percent of is ? • Is the problem asking for how many of something? If yes, use the problem to fill in the blanks in this question: What is % of ? • Is the problem asking for the whole or total amount? If yes, use the problem to fill in the blanks in this question: is % of what whole or total amount? Use these questions throughout the topic as applicable.
5 = 20 = 20% 25 100
20% of the team’s players are seventh graders.
478
© Great Minds PBC
EUREKA MATH2 6 ▸ M1 ▸ TE ▸ Lesson 24
b. Of the 25 girls on the team, 60% started playing soccer in elementary school. How many of the girls on the team started playing soccer in elementary school? Explain or show your thinking.
20% of 25 is 5, and 3 times that result is 60%. So 60% of 25 is 15. Fifteen girls started playing soccer in elementary school. c. The coach says that 15% of the players will miss an upcoming game. Why must this statement be false?
15% of 25 is 3.75. It’s not possible to have 3.75 players because you can’t have 0.75 of a player.
When most students have finished problems 3 and 4, bring the class together. Ask a couple of students to share their solutions and strategies for both problems 3 and 4. Why does Noah’s method work for calculating 10% of 40 but not for calculating 32% of 40?
10% of 40 is 1 tenth of 40 but 32% is not 1 thirty-second of 40.
If there are 25 girls on the team, why does it not make sense to refer to 15% of the players?
15% of 25 is not a whole number. There cannot be a fraction of a player on the team.
Would You Rather? Students calculate percents to determine which of two choices is the better option. Tell students that they are going to play a game called Would You Rather? with a partner. For each problem, students make a choice and justify their choice mathematically. Allow students to work on problems 5–10, completing as many problems as they can before the lesson debrief. As students work, listen for the use of a variety of strategies. Consider asking students why they choose one option over another.
© Great Minds PBC
479
EUREKA MATH2
6 ▸ M1 ▸ TE ▸ Lesson 24
For problems 5 –10, answer the question and justify your choice mathematically. 5. Would you rather have 10% of $6.00 or 80% of 90 cents?
10% of $6.00 is $0.60. 80% of 90 cents is 72 cents. I would rather have 80% of 90 cents. 6. Would you rather help 15% of 80 people or 75% of 20 people?
15% of 80 is 12. 75% of 20 is 15. I would rather help 75% of 20 people. 7. Would you rather eat 20% of 240 spicy peppers or 2% of 1,000 spicy peppers?
20% of 240 is 48. 2% of 1,000 is 20. I would rather eat 2% of 1,000 spicy peppers. 8. Would you rather eat 11% of 300 jelly beans or 90% of 40 jelly beans?
11% of 300 is 33. 90% of 40 is 36. I would rather eat 11% of 300 jelly beans because I don’t like jelly beans. 9. Would you rather clean 9% of 2,000 dishes or 14% of 1,500 dishes?
9% of 2,000 is 180. 14% of 1,500 is 210. I would rather clean 9% of 2,000 dishes. 10. Would you rather drink 24% of a 20-ounce smoothie or 41% of a 15-ounce smoothie?
24% of 20 ounces is 4.8 ounces. 41% of 15 ounces is 6.15 ounces. I would rather drink 41% of a 15-ounce smoothie.
480
Differentiation: Challenge To challenge students, consider providing the following Would You Rather? scenarios. • Would you rather have 160% of 240 days off school or 210% of 150 days off school? • Would you rather have 0.5% of $1,000.00 or 1.5% of $900.00?
© Great Minds PBC
EUREKA MATH2 6 ▸ M1 ▸ TE ▸ Lesson 24
Land Debrief 5 min Objective: Calculate a part when given the whole and a percent. Facilitate a class discussion by using the following prompts. Ask students to add on to their classmates’ responses. Describe how you would calculate 42% of a number.
Sample: I would find 1% of the number and multiply that result by 42. What strategies did we use today to determine the percent of a number? We used a double number line. We calculated percents of a whole such as 10%, 5%, and 1% and added or subtracted them. We wrote the percent as a fraction and then multiplied the fraction by the total. We calculated 1% of the total and then multiplied that result by the given percent number to get the percent we wanted. Did you use the same strategy for all the scenarios in Would You Rather? If not, how did you decide which strategy to use? No. I did not always use the same strategy. For percents that were multiples of 5 or 10, I used mental math to calculate 5% or 10% of the whole and worked from there. For percents that were not multiples of 5 or 10, I wrote the percent as a fraction and then multiplied the fraction by the total.
Exit Ticket 5 min Provide up to 5 minutes for students to complete the Exit Ticket. It is possible to gather formative data even if some students do not complete every problem.
© Great Minds PBC
Teacher Note Assign the Practice problems for completion outside of class or use them in class if time remains after the lesson. Refer students to the Recap for support.
481
EUREKA MATH2
6 ▸ M1 ▸ TE ▸ Lesson 24
Recap
EUREKA MATH2
6 ▸ M1 ▸ TE ▸ Lesson 24
RECAP Name
Date
24
Finding a Part
4. 20% of 80
5. 5% of 50
calculated a part when given a percent and the whole.
•
calculated benchmark percentages (such as 25% and 10%) of numbers by using mental math strategies.
•
calculated percents of numbers by using addition, subtraction, and multiplication methods.
6. Julie earns $22,000. She pays 14% of what she earns in taxes. How much money does Julie pay in taxes? Method 1
5% of $22,000 is $1,100.
14% of $22,000 is $2,200 + $1,100 - $220, or $3,080. Julie pays $3,080 in taxes.
10% of 80 is 101 of 80 because 10% is 101 of 100%. Every
10% represents 8 students in the cafeteria. So 60% represents 48 students, and 70% represents 56 students. 0
8
48
52
56
Method 2 80
0%
= $3,080
10%
60%
65%
70%
Method 3
100%
1% of $22,000 is $220.
52 students bring a lunch from home. For problems 2–5, use mental math to calculate the percent.
© Great Minds PBC
482
$308,000 14 × $ 22,000 = 100 100
Julie pays $3,080 in taxes.
Percent
7
Then subtract 1% of $22,000 from the sum.
1% of $22,000 is $220.
1. Of the 80 students in the cafeteria at lunchtime, 65% bring a lunch from home. Complete the double number line. Then determine the number of students who bring a lunch from home.
3. 10% of 70
One way to calculate 14% of $22,000 is to add 10% of $22,000 and 5% of $22,000.
10% of $22,000 is $2,200.
Examples
10
Calculate 10% of 50 and halve the result to calculate 5% of 50.
2.5
•
2. 25% of 40
Calculate 10% of 80 and double the result to calculate 20% of 80.
16
In this lesson, we
Number of Students
EUREKA MATH2
6 ▸ M1 ▸ TE ▸ Lesson 24
14 ´ $220 is $3,080.
65% is halfway between 60% and 70%, and 52 is halfway between 48 and 56.
Julie pays $3,080 in taxes.
One way to calculate
14% of $22,000 is to write 14% as a fraction. Then
multiply the fraction by $22,000.
One way to calculate 14% of $22,000 is to find 1%,
or 1 , of $22,000. Then 100
multiply the result by 14.
25% of 40 is 14 of 40 because 25% is 14 of 100%.
10% of 70 is 101 of 70.
361
362
RECAP
© Great Minds PBC
© Great Minds PBC
EUREKA MATH2 6 ▸ M1 ▸ TE ▸ Lesson 24
Sample Solutions Expect to see varied solution paths. Accept accurate responses, reasonable explanations, and equivalent answers for all student work.
EUREKA MATH2
6 ▸ M1 ▸ TE ▸ Lesson 24
PRACTICE Name
Date
24
EUREKA MATH2
6 ▸ M1 ▸ TE ▸ Lesson 24
9. There are 60 people in a room. If 65% of the people in the room have brown hair, how many people have brown hair? Use the double number line to support your answer.
1. How many pounds is 50% of 16 pounds?
Number of People
8 pounds
0
6
12
18
24
30
36
0%
10%
20%
30%
40%
50%
60%
Percent
2. How many miles is 25% of 44 miles?
11 miles
39
65%
42
48
54
60
70%
80%
90%
100%
39 people in the room have brown hair.
3. How many miles is 100% of 44 miles?
10. There are 45 marbles in a jar, and 80% of them are blue. How many blue marbles are in the jar?
44 miles
There are 36 blue marbles in the jar.
4. How many kilograms is 10% of 96 kilograms?
9.6 kilograms
11. Of the 32 students in a class, 75% participate in after-school activities. How many students in the class participate in after-school activities?
5. How many meters is 20% of 24 meters?
24 students participate in after-school activities.
4.8 meters
12. There are 300 people at a museum, and 18% of them are adults. How many adults are at the museum?
6. How many minutes is 5% of 60 minutes?
There are 54 adults at the museum.
3 minutes 7. How many dollars is 1% of $560.00?
13. Ryan receives a gift of $75.00. He donates 24% of this money to his favorite charity. How much money does he donate?
$5.60
He donates $18.00 to his favorite charity.
8. Which of the following statements are true? Choose all that apply. A. 50% of 346 is equal to 0.5 ´ 346.
14. Which amount is greater, 15% of 20 or 20% of 15? Explain.
B. 25% of 210 is equal to 210 ¸ 4.
Neither amount is greater. Both amounts are equal to 3.
C. 20% of 460 is equal to 460 ¸ 5. 1 × 642. D. 10% of 642 is equal to 10
E. 1% of 198 is equal to
© Great Minds PBC
© Great Minds PBC
1 ×198 . 1,000
363
364
P R ACT I C E
© Great Minds PBC
483
EUREKA MATH2
6 ▸ M1 ▸ TE ▸ Lesson 24
EUREKA MATH2
6 ▸ M1 ▸ TE ▸ Lesson 24
Remember For problems 15 and 16, divide. Write the quotient and the remainder on separate lines. 15. 4,725 ¸ 30
16. 1,565 ¸ 60
Quotient: 157
Quotient: 26
Remainder: 15
Remainder: 5
17. Consider 62%. a. Shade the grid to represent 62%.
b. Write 62% as a fraction. 62 100
c. Write 62% as a decimal.
0.62 18. Which numbers are multiples of 6? Choose all that apply. A. 6 B. 16 C. 18 D. 36 E. 40 F. 72
© Great Minds PBC
484
P R ACT I C E
365
© Great Minds PBC
25
LESSON 25
Finding the Whole Calculate the whole when given a part and a percent.
EUREKA MATH2
6 ▸ M1 ▸ TE ▸ Lesson 25
Name
Date
EXIT TICKET
25
A team has raised $300.00 for new uniforms, which is 60% of the total amount of money they need to raise. What is the total amount of money the team needs to raise? Justify your answer. 0
50 100 150 200 250 300 350 400 450 500
Money Raised (dollars)
Lesson at a Glance In this lesson, students solve percent problems by finding the whole when given a part and a percent. Before they begin to solve a problem, students ask themselves questions about what information is given in the problem and what the problem asks them to find. Students work in pairs, using double number lines and tape diagrams to make sense of multi-step percent problems, choose strategies, and persevere in solving.
Percent 0% 10% 20% 30% 40% 50% 60% 70% 80% 90% 100%
Key Question
The team needs to raise a total of $500.00.
• How does knowing a part and its percent of the whole help us find the whole?
Achievement Descriptor 6.Mod1.AD8 Solve problems that involve finding the part, whole,
or percent. (6.RP.A.3c)
© Great Minds PBC
371
© Great Minds PBC
EUREKA MATH2 6 ▸ M1 ▸ TE ▸ Lesson 25
Agenda
Materials
Fluency
Teacher
Launch 5 min
• None
Learn 30 min
Students
• What Is the Whole?
• None
• Solving Multi-Step Percent Problems
Lesson Preparation
Land 10 min
• None
© Great Minds PBC
487
EUREKA MATH2
6 ▸ M1 ▸ TE ▸ Lesson 25
Fluency Finding the Whole Students use unit fractions to prepare for finding the whole when given a part and a percent. Directions: Determine the unknown number. 1.
40 is 12 of what number?
2.
40 is 4 of what number?
160
3.
40 is 15 of what number?
200
4.
40 is 10 of what number?
400
5.
1 40 is 20 of what number?
800
6.
40 is 100 of what number?
488
1
1
1
80
4,000
© Great Minds PBC
EUREKA MATH2 6 ▸ M1 ▸ TE ▸ Lesson 25
Launch
5
Students reason about what the whole could be when given percents that total 100%. Display the table from problem 1 and invite students to read the problem silently. Have them work in pairs to complete the problem. Circulate as students work and ask the following questions to guide student thinking as needed. • If Sana has a total of 100 balloons, how many of each color does she have? • If Tara has a total of 100 balloons, how many of each color does she have? Consider asking similar questions, but for totals of 50, 10, and 5 balloons. 1. There are 4 colors of balloons. Sana and Tara each have a different total number of balloons. What is the least total number of balloons that each girl could have? Sana’s Balloons
Tara’s Balloons
Green
• Which color balloon do Sana and Tara have the greatest number of? How do you know?
Green, 40%
Yellow
?
Green, 45% Yellow, 35%
Yellow, 30%
Blue Red
• Why are the colored regions of the circle graphs different sizes?
• Which color balloon do Sana and Tara have the least number of? How do you know?
Blue, 15% Blue, 20%
Problem 1 promotes critical thinking about percents and wholes through the pictorial representation of a circle graph. If students are unfamiliar with this way of displaying data, support them by asking the following questions.
• What is the total percent shown for each circle graph?
Red, 5%
Red, 10%
Teacher Note
Green
Yellow
If the circle graphs impede student understanding of and engagement with this task, consider eliminating them and referencing only the tape diagrams.
Blue Red
?
The least total number of balloons that Sana could have is 10. The least total number of balloons that Tara could have is 20. © Great Minds PBC
489
EUREKA MATH2
6 ▸ M1 ▸ TE ▸ Lesson 25
After several minutes, have students share their answers and their reasoning. Encourage students with a variety of strategies to share. In the balloon problem, we knew some percents and reasoned about the least total number of balloons each girl could have, or the whole. Today, we will find the whole when we know both a percent and a part of the whole.
Differentiation: Challenge To challenge students further, have them determine the least number of balloons Julie could have. Consider drawing a circle graph as shown or giving students a list of Julie’s percents.
Julie’s Balloons
Learn
Red, 8%
What Is the Whole? Students reason about relationships between percents and use a part to find other parts and the whole.
Blue, 20%
Green, 40%
Continue to display the table from problem 1 and begin a brief discussion about Sana’s balloons by using the following prompts. Have students calculate their answers mentally. If Sana has a total of 40 balloons, how many red balloons does she have? How do you know?
Yellow, 32%
Sana has 4 red balloons because 10% of 40 is 4. If Sana has 4 red balloons, how many blue balloons does she have? How do you know? Sana has 8 blue balloons. She has twice as many blue balloons as red balloons because 20% is twice as much as 10%.
The least number of balloons that Julie could have is 25.
Next, display the tape diagram with 4 units.
25%
6 100%
490
© Great Minds PBC
EUREKA MATH2 6 ▸ M1 ▸ TE ▸ Lesson 25
Tyler has 6 red balloons. If 6 balloons is 25% of the total number of balloons he has, what is the total number of balloons Tyler has? How do you know? The total number of balloons Tyler has is 24. Because 6 balloons is 25% or 1 of the total 4 number of balloons Tyler has, I multiplied 6 by 4 to get 24. Write the number 6 in the remaining units of the tape diagram to confirm that if 25%, or 1 unit, represents 6 balloons, then 100%, or 4 units, represents 24 balloons. Then display the double number line showing a tick mark at 25%. 0
6
Teacher Note As in the previous lesson, this lesson uses the informal term benchmark percentages to describe percentages that are simple to calculate mentally, such as 50%, 25%, 10%, and 1%. Knowing a benchmark percent of a whole can help students calculate the whole by using multiplicative reasoning.
Number of Balloons
Differentiation: Support
Percent 0%
25%
Invite students to guide you in drawing tick marks on the double number line for 50%, 75%, and 100%. This will confirm that if 6 balloons is 25% of the total number of balloons, then 24 balloons is 100% of the total number of balloons. Then pose the following questions to ensure that students understand how to use multiplicative reasoning when working with benchmark percentages. Encourage students to visualize or draw a model if necessary. If 6 balloons is 10% of the total number of balloons, what is the total number of balloons? How do you know? The total number of balloons is 60. Because 6 balloons is 10% or 1 of the total number 10 of balloons, I multiplied 6 by 10 to get 60. If 6 balloons is 1% of the total number of balloons, what is the total number of balloons? How do you know? The total number of balloons is 600. Because 6 balloons is 1% or 1 of the total number 100 of balloons, I multiplied 6 by 100 to get 600.
© Great Minds PBC
Some students may benefit from additional practice using mental math to calculate the whole. Before students complete problem 2, consider doing a Whiteboard Exchange using the following sample sequence. • 30 is 50% of what number? • 30 is 25% of what number? • 30 is 20% of what number? • 30 is 10% of what number? • 30 is 5% of what number? • 30 is 1% of what number? After the Whiteboard Exchange, ask students to explain their strategies for calculating the whole, or 100%.
491
EUREKA MATH2
6 ▸ M1 ▸ TE ▸ Lesson 25
Direct students to problem 2 and have them complete it in pairs. Circulate as students work. Note whether students choose to draw a tape diagram or a double number line and help them label their models as needed. 2. If 6 balloons is 30% of the total number of balloons, what is the total number of balloons? Draw a tape diagram or a double number line to support your answer. The total number of balloons is 20.
Consider providing students with predrawn and possibly prelabeled tape diagrams or double number lines. This allows students to focus on the reasoning and facilitates their problem solving.
30%
2
2
2
2
2
2
2
2
2
UDL: Action & Expression
2
100% 3 units = 6 1 unit = 6 ¸ 3 = 2 10 units = 10 ´ 2 = 20 0
2
6
20
0% 10%
30%
100%
Number of Balloons Percent
Percent of balloons: 30 ¸ 3 = 10 and 10 ´ 10 = 100 Number of balloons: 6 ¸ 3 = 2 and 10 ´ 2 = 20 After several minutes, or when most students have finished, call the class together. Consider selecting two students, one who drew a tape diagram and another who drew a double number line, to describe their models and display them for the class. As students share, point out when they used a factor or multiple of both 30 and 100 to calculate their answer.
492
© Great Minds PBC
EUREKA MATH2 6 ▸ M1 ▸ TE ▸ Lesson 25
Highlight their reasoning for finding a different percent before finding the whole by asking questions such as the following: • What was different about finding the whole when you knew 30% of it compared to when you knew 25% or 10% of it? • How did you find the whole when you knew 30% of it? • Why did you find a different percent of the whole first? How did you use 30% of the whole to find a different percent of it? It is important to recognize that there are many valid strategies students could use to find the whole. Display the double number line with 30% labeled as 6 balloons for students to reference as they answer the next several questions. 0
6
Number of Balloons
Language Support Students learned about factors and multiples of a number in grade 4. They will learn about the greatest common factor and least common multiple of two numbers in grade 6 module 2. To remind them that factors are numbers that are multiplied to get a product, and multiples are the products of a given number and a whole number, consider posting a chart to list factors and multiples of 30 and 100. • Have students list the factor pairs of 30 and 100. Highlight factors of both 30 and 100. • Have students list multiples of 30 and 100. Circle multiples of both 30 and 100.
Percent 0%
30%
Some students divided 30 and 6 each by 3 to find 10% of the whole. Does finding 10% of the whole help you find 100% of it? How? Yes. If we know 10% of the whole, then we can multiply that number by 10 to get 100% of it.
The number 10 is a factor of both 30 and 100. What does it mean to be a factor?
It means 10 can be multiplied by a number to get 30, and 10 can be multiplied by a number to get 100. Factors are numbers that are multiplied to get a product. Another factor of both 30 and 100 is 5. Could finding 5% of the whole help you find 100% of it? How?
Factors of 30 1 2 3 5
30 15 10 6
Factors of 100 1 2 4 5 10
100 50 25 20 10
Multiples of 30 Multiples of 100 30, 60, 90, 120, 150, 180, 210, 240, 270, 300, 330, ...
100, 200, 300, 400, 500, ...
Yes. If we know 5% of the whole, then we can multiply that number by 20 to get 100% of it. Can you find 15% of the whole if you know 30% of it? How? Yes. We can divide by 2. © Great Minds PBC
493
6 ▸ M1 ▸ TE ▸ Lesson 25
EUREKA MATH2
Draw a tick mark to show that 15% of the whole is 3. Have students think–pair–share about the following prompt. Is finding 15% of the whole as helpful as finding 10% or 5% of it, when you want to know 100% of it? Explain.
No. If we count by 15% and draw more tick marks, we do not get to 100%. The number 15 is not a factor of 100. The number 15 is a factor of 30, but it is not a factor of 100. So, although we can find 15% of the whole, 15% is not as helpful. Have students think–pair–share about the following prompt. Can you use 30% of the whole to find 300% of it? Can finding 300% of the whole help you find 100% of it? How?
Yes. Because 6 is 30% of the whole, we can multiply 6 and 30 each by 10 to find that 60 is 300% of the whole. Then we can divide 60 and 300 each by 3 to find that 20 is 100% of the whole. A multiple is the product of a given number and a whole number. The number 300 is a multiple of both 30 and 100, and finding 300% of the whole could help you determine 100% of it. Have students remain in pairs to complete problem 3. Circulate as students work and support them as needed by asking the following questions: • Can you draw a tape diagram or a double number line to help you make sense of the problem? How? • Did you label your drawing? Where is 0%? Where is 100%? • What other information do you have? Can you use that information to improve your drawing? • Can you find a different percent to help you find the whole?
494
© Great Minds PBC
EUREKA MATH2 6 ▸ M1 ▸ TE ▸ Lesson 25
3. Kayla has 12 red balloons. If this is 3% of the total number of balloons she has, what is the total number of balloons Kayla has? Number of Balloons
0
Percent 0%
4
1%
12
400
3%
100%
Percent of balloons: 3 ¸ 3 = 1 and 1 ´ 100 = 100 Number of balloons: 12 ¸ 3 = 4 and 4 ´ 100 = 400 The total number of balloons Kayla has is 400.
Differentiation: Support For extra practice or to solidify understanding of finding a different percent before finding the whole, have students complete the following problem before they work problem 3. Kayla has 12 red balloons. If this is 75% of the total number of balloons she has, what is the total number of balloons Kayla has? The total number of balloons Kayla has is 16.
After several minutes, or when most students have finished, select several students to share their answers and the strategies they used. Point out that the only factor of both 3 and 100 is 1. Because two numbers always share 1 as a factor, finding 1% of the whole is a strategy that always works.
Solving Multi-Step Percent Problems Students solve multi-step percent problems by using various strategies. Transition students to problems 4–7. Have students work in pairs to complete the problems. As necessary, encourage students to draw a model and remind them that finding a factor of both the given percent and 100 can help them find the whole. Circulate as students work and ask the following questions to prompt their thinking: • What do you know? In other words, what information is given? • Can you use a model such as a double number line or a tape diagram to help make sense of the problem?
UDL: Action & Expression Prompt students to stop and think about what is given, what the question is asking, and what else they need to find before they begin solving each problem. Reinforce that successful learners take time to think and plan before beginning a task.
• What number is a factor of both the given percent and 100? • How is the question in problem 4 different from the question in problem 5? • In problem 6, if you know the percents of the money raised by the sixth and seventh grades, how can you find the percent of the money raised by the eighth grade? • In problem 7, if you know the percent of votes Yuna received, how can you find the percent of votes Scott received? © Great Minds PBC
495
EUREKA MATH2
6 ▸ M1 ▸ TE ▸ Lesson 25
4. Toby has raised $225.00 for his favorite charity. This is 60% of his goal. How much more money does Toby need to raise to meet his goal? 0
375
225
37.5
Money Raised (dollars) Percent 0% 10%
60%
100%
Promoting the Standards for Mathematical Practice When students figure out what information is given and what is being asked and then find an entry point to solve multi-step percent problems, they are making sense of problems and persevering in solving them (MP1).
Percent of goal: 60 ¸ 6 = 10 and 10 ´ 10 = 100
Ask the following questions to promote MP1:
Number of dollars raised: 225 ¸ 6 = 37.5 and 37.5 ´ 10 = 375
• What do you think the problem is asking?
Dollars left to raise: 375 - 225 = 150
• What steps can you take to start solving the problem?
Toby needs to raise $150.00 more to meet his goal. 5. Lisa has raised $750.00 for her favorite charity. This is 120% of her goal. How much extra money has Lisa raised so far? 0
125
250
375
500
625
750
0%
20%
40%
60%
80%
100%
120%
• What can you figure out about the whole by looking at a tape diagram or a double number line?
Money Raised (dollars) Percent
Percent of goal: 120 ¸ 6 = 20 and 20 ´ 5 = 100 Number of dollars raised: 750 ¸ 6 = 125 and 125 ´ 5 = 625 Extra money raised: 750 - 625 = 125 Lisa has raised an extra $125.00. 6. The sixth, seventh, and eighth grades each raised money for their middle school. The sixth grade raised 40% of the total amount raised. The seventh grade raised 22% of the total amount raised. The eighth grade raised the rest. If the eighth grade raised $1,368.00, what is the total amount of money raised by the three grades?
496
© Great Minds PBC
EUREKA MATH2 6 ▸ M1 ▸ TE ▸ Lesson 25
The eighth grade raised $1,368.00. This is 38% of the total because 100 - 40 - 22 = 38. 0 36
1,368
3,600
Money Raised (dollars) Percent 0% 1%
38%
100%
Differentiation: Support To support students in their understanding of how to represent the 18 more votes Scott received in problem 7, consider drawing a tape diagram with stacked tapes and units that represent 5%, or 9 votes, as shown.
45%
Percent of dollars raised: 38 ¸ 38 = 1 and 1 ´ 100 = 100 Number of dollars raised: 1,368 ¸ 38 = 36 and 36 ´ 100 = 3,600 The three grades raised a total amount of $3,600.00. 7. Yuna and Scott were the only two candidates who ran for sixth-grade class president. Yuna received 45% of the votes. Scott received 18 more votes than Yuna. How many votes did Scott receive? Scott received 18 more votes than Yuna. Scott received 55% of the votes because 100 - 45 = 55. Scott received 10% more votes than Yuna because 55 - 45 = 10.
Yuna 45%
Scott 55%
18 more votes 1 unit = 18 5 units = 18 ´ 5 = 90
Scott received 99 votes.
1 unit = 18 ¸ 2 = 9 2 5 1 units = 90 + 9 = 99 2
Yuna’s Votes
55%
100%
Scott’s Votes
18 more votes Differentiation: Challenge To further challenge students, have them work the following problem after they complete problem 7. A customer can save 25% by buying the 10-package bundle of balloons instead of buying 10 single packages of balloons. The 10-package bundle costs $12.00. How much does a single package of balloons cost? A single package of balloons costs $1.60.
When most students have completed the problems, or if their struggle is no longer productive, discuss each problem or finish solving as a class if necessary.
© Great Minds PBC
497
EUREKA MATH2
6 ▸ M1 ▸ TE ▸ Lesson 25
Land Debrief 5 min Objective: Calculate the whole when given a part and a percent. Facilitate a class discussion by using the following prompts. Encourage students to restate or build upon one another’s responses. How does knowing a part and its percent of the whole help us find the whole? If the percent of the whole is a factor of 100, we can multiply or draw more tick marks on a double number line to get the whole. If the percent of the whole is not a factor of 100, we can multiply or divide to find a number that is a factor or multiple of 100. Then we can multiply, divide, or draw more tick marks on a double number line to get the whole. Was there a particular strategy or model we used today that you preferred when finding the whole? Explain. I preferred using tape diagrams. They allow me to compare the size of each part to the whole. I preferred using double number lines. I can label the given part and its percent of the whole and use the same types of strategies I have used before with equivalent ratios and rates to find 100%. I did not use a model. I knew that I could always divide to find 1% and then multiply by 100 to find 100%. What are some questions you asked yourself to help you make sense of the problems? What is given in the problem? What is the question asking? Is there a model I can draw to represent the problem, such as a double number line or a tape diagram? What does the part represent in this problem? What does the whole represent in this problem?
Exit Ticket 5 min Provide up to 5 minutes for students to complete the Exit Ticket. It is possible to gather formative data even if some students do not complete every problem. 498
Teacher Note Assign the Practice problems for completion outside of class or use them in class if time remains after the lesson. Refer students to the Recap for support.
© Great Minds PBC
EUREKA MATH2 6 ▸ M1 ▸ TE ▸ Lesson 25
Recap
EUREKA MATH2
6 ▸ M1 ▸ TE ▸ Lesson 25
RECAP Name
Date
25
EUREKA MATH2
6 ▸ M1 ▸ TE ▸ Lesson 25
2. Yuna saves $70.00. This amount is 140% of her savings goal. How much extra money has Yuna saved?
Finding the Whole
Money Saved (dollars)
In this lesson, we
0
50
10
calculated the whole when given a part and a percent.
•
used double number lines and tape diagrams to represent percent problems.
•
solved multi-step percent problems.
0% 20%
100%
100% 4 units = 36
$36.00 is 40% of the
1 unit = 36 ¸ 4 = 9
Tara receives $90.00.
savings goal. Multiply 10 and 20 each by 5 to calculate that $50.00 is 100% of Yuna’s savings goal.
Extra money saved: 70 - 50 = 20 Yuna has saved an extra $20.00.
$36.00
4 units represent 40% of the whole. money Tara receives.
140%
The whole, or 100%, represents Yuna’s savings goal.
Examples 1. Tara receives money as a gift. She will spend 40% of the money on a pair of shoes. The pair of shoes costs $36.00. How much money does Tara receive as a gift?
Divide 70 and 140 each
by 7 to calculate that $10.00 is 20% of Yuna’s
Percent
•
The whole, or 100%, represents the amount of money Tara receives.
70
1 unit represents 10% of the whole.
3. A survey at a middle school reports that 44% of students prefer science fiction movies, 32% of students prefer adventure movies, and the remaining students prefer animated movies. If 18 students prefer animated movies, how many students prefer science fiction movies?
$9.00 is 10% of the money Tara receives.
24% of the students surveyed prefer animated movies because 100 - 44 - 32 = 24. So, the 18 students who prefer animated movies represent 24% of the total.
10 units = 9 ´ 10 = 90 10 units represent 100% of the whole.
Number of Students
$90.00 is 100% of the money Tara receives.
0 0.75
18
33
75
0% 1%
24%
44%
100%
Percent
Divide 18 and 24 each by 24 to calculate that 0.75 is 1% of the total.
Because 44% of the students surveyed prefer science fiction movies, multiply 0.75 and 1 each by 44 to calculate that 33 is 44% of the total.
33 students prefer science fiction movies. © Great Minds PBC
© Great Minds PBC
373
374
RECAP
© Great Minds PBC
499
EUREKA MATH2
6 ▸ M1 ▸ TE ▸ Lesson 25
Sample Solutions Expect to see varied solution paths. Accept accurate responses, reasonable explanations, and equivalent answers for all student work.
EUREKA MATH2
6 ▸ M1 ▸ TE ▸ Lesson 25
PRACTICE Name
Date
25
6. Toby and Sana see the following survey results. Toby says 555 people participated in the survey. Sana says 370 people participated in the survey. Based on the survey results shown, both could be correct. Why?
For problems 1–3, fill in the blank. 1. If 60 is 25% of the whole, then the whole is
2. 60 is 75% of
80
SURVEY RESULTS
240 .
Do you like watching baseball? YES or NO
.
3. If 60 is 120% of the whole, then
EUREKA MATH2
6 ▸ M1 ▸ TE ▸ Lesson 25
Red
50
is 100% of the whole.
Blue
4. A basketball team has played 21 games, which is 70% of the total number of games on the team’s schedule. What is the total number of games on the basketball team’s schedule?
222 people said YES!
There is a total of 30 games on the basketball team’s schedule.
The survey results don’t say which color means Yes, so it is not clear whether 60% or 40% of those surveyed said Yes. If 60% of those surveyed said Yes, then 370 people participated in the survey, which means Sana is correct. If 40% of those surveyed said Yes, then 555 people participated in the survey, which means Toby is correct.
5. Students have been in school for 63 days of the school year. There is 65% of the school year remaining. What is the total number of days in the school year? There is a total of 180 days in the school year.
© Great Minds PBC
500
375
376
P R ACT I C E
© Great Minds PBC
© Great Minds PBC
EUREKA MATH2 6 ▸ M1 ▸ TE ▸ Lesson 25
EUREKA MATH2
6 ▸ M1 ▸ TE ▸ Lesson 25
7. Lisa has saved $33.00. This amount is 55% of her savings goal. How much money does Lisa have left to save to reach her savings goal?
EUREKA MATH2
6 ▸ M1 ▸ TE ▸ Lesson 25
13. Noah has $200.00. He spends $120.00 on a new coat. a. What percent of his money does Noah spend on a new coat?
Lisa has $27.00 left to save to reach her savings goal.
Noah spends 60% of his money on a new coat.
b. What percent of his money does Noah have left?
8. Sasha has saved $40.00. This amount is 125% of her savings goal. How much extra money has Sasha saved?
Noah has 40% of his money left.
Sasha has saved an extra $8.00. 14. Use the double number line to determine which of the following statements are true. Choose all that apply. 9. A survey at a middle school reports that 48% of students prefer to read mysteries, 32% of students prefer to read science fiction, and the rest of the students prefer to read nonfiction. If 25 students prefer to read nonfiction, how many students prefer to read mysteries?
0
4
8
12
16
0
1
2
3
4
Number of Lessons Number of Quizzes
There are 60 students who prefer to read mysteries.
A. The ratio of the number of lessons to the number of quizzes is 4 : 1. B. For every 1 quiz, there are 4 lessons. C. The ratio of the number of quizzes to the number of lessons is 12 : 3.
10. At a company, 20% of the employees are part-time employees. There are 33 more full-time employees than part-time employees. What is the total number of employees at this company?
D. For every 8 lessons, there are 2 quizzes. E. For every 12 lessons, there are 4 quizzes.
There is a total of 55 employees at this company.
Remember For problems 11 and 12, divide. Write the quotient and the remainder on separate lines. 11. 4,831 ¸ 30
12. 9,510 ¸ 50
Quotient: 161
Quotient: 190
Remainder: 1
Remainder: 10
© Great Minds PBC
© Great Minds PBC
P R ACT I C E
377
378
P R ACT I C E
© Great Minds PBC
501
26
LESSON 26
Solving Percent Problems Solve multi-step percent problems.
EUREKA MATH2
6 ▸ M1 ▸ TE ▸ Lesson 26
Name
Date
EXIT TICKET
26
1. Blake uses 60% of the amount of his paycheck to pay bills. After paying all of his bills, Blake has $320.00 of his paycheck remaining. What is the amount of Blake’s paycheck? Justify your answer.
40% of the amount of Blake’s paycheck is $320.00 because 100 - 60 = 40. 40 ¸ 4 = 10 and 320 ¸ 4 = 80 10 ´ 10 = 100 and 80 ´ 10 = 800 The amount of Blake’s paycheck is $800.00 .
Lesson at a Glance In this lesson, students apply their understanding of percents to solve two multi-step percent problems. In the first problem, students work in pairs to calculate the greatest and least possible parts when given three different whole amounts and percents. Students notice patterns in their calculations and explore how to most efficiently organize their thinking. In the second problem, students work in groups to create a cafeteria menu from different food items. They calculate the percent of the total number of calories that come from different nutrients and adapt their solution to meet a variety of requirements.
Key Question • What strategies and tools can we use to model and solve percent problems?
2. Kayla has $8,836.00 in her savings account. The bank gives Kayla 5% of the amount of money in the account as a customer bonus. What amount of money does the bank give Kayla? Justify your answer.
Achievement Descriptors
5 × 8, 836 = 441.8 100
6.Mod1.AD7 Model and explain percents and problems involving
The bank gives Kayla $441.80.
percents. (6.RP.A.3.c) 6.Mod1.AD8 Solve problems that involve finding the part, whole,
or percent. (6.RP.A.3.c)
© Great Minds PBC
385
© Great Minds PBC
EUREKA MATH2 6 ▸ M1 ▸ TE ▸ Lesson 26
Agenda
Materials
Fluency
Teacher
Launch 5 min
• None
Learn 30 min
Students
• Mysterious Donations
• Calculator
• Cafeteria Calculations
Lesson Preparation
Land 10 min
• None
© Great Minds PBC
503
EUREKA MATH2
6 ▸ M1 ▸ TE ▸ Lesson 26
Fluency Benchmark Percentages Students calculate percents, parts, and wholes to prepare for solving multi-step percent problems. Directions: Determine the unknown number. 1.
20 is what percent of 25?
80%
2.
What is 20% of 25?
5
3.
20 is 25% of what number?
80
4.
11 is what percent of 20?
55%
5.
What is 11% of 20?
2.2
6.
11 is 20% of what number?
55
504
© Great Minds PBC
EUREKA MATH2 6 ▸ M1 ▸ TE ▸ Lesson 26
Launch
Teacher Note
5
Students model percents by using a double number line. Display the double number line. Have partners fill in each box on the double number line with one digit and then fill in the blanks to make a true statement about a percent of a number. 0
Some students may benefit from additional practice by using mental math to calculate the part, whole, or percent. In that case, consider replacing the double number line activity in Launch with a Whiteboard Exchange that reviews mixed types of percent problems. A sample sequence is shown. • Find 20% of 120. • 8 is 20% of
is
• Find 5% of 140.
100%
%
0%
% of
• 9 is 5% of
.
• 12 is 25% of
If time permits, invite students to create additional double number lines with the following directions:
• 15 is 75% of
• Make a true percent statement without using any digit 0 through 9 more than once. • Make a true percent statement where the percent is greater than 100%.
0
© Great Minds PBC
• Find 75% of 200. .
• 40 is what percent of 50? • 6 is what percent of 15?
%
100%
% of
.
Follow the Whiteboard Exchange by asking students to explain their mental math strategies. Highlight responses that show different pathways for calculating percents, parts, and wholes. For example, a student may find 75% of 200 by finding 75% of 100 and doubling the result, by finding 25% of 200 and subtracting the result from 200, or by finding 25% of 200 and tripling the result.
For a percent greater than 100%, use the following double number line.
is
.
• Find 25% of 160.
When most partners have created an accurate diagram and percent statement, select a few students to share their responses and reasoning.
0%
.
. 505
6 ▸ M1 ▸ TE ▸ Lesson 26
EUREKA MATH2
The double number line is one of the tools we have used in this topic to calculate percents, parts, and wholes. In today’s lesson, we will use the strategies from throughout this topic to solve multi-step percent problems.
Learn Mysterious Donations Students solve a multi-step percent problem. Present the Mysterious Donations problem. Allow students to work with a partner to solve the problem. 1. Mrs. A has $200.00. Mrs. B has $400.00. Mrs. C has $600.00. One of these women wants to donate 1% of her money to you. Another woman wants to donate 2% of her money to you. The last woman wants to donate 3% of her money to you. However, you do not know who wants to donate which percent.
506
© Great Minds PBC
EUREKA MATH2 6 ▸ M1 ▸ TE ▸ Lesson 26
a. What are all the possible total amounts of money you could receive? Show or explain why these are all possible total amounts of money. Sample: Amount of Money from Mrs. A
Amount of Money from Mrs. B
Amount of Money from Mrs. C
Total Amount of Money
1% of 200
2% of 400
3% of 600
2 + 8 + 18 = 28
1% of 200
3% of 400
2% of 600
2 + 12 + 12 = 26
2% of 200
1% of 400
3% of 600
4 + 4 + 18 = 26
2% of 200
3% of 400
1% of 600
4 + 12 + 6 = 22
3% of 200
1% of 400
2% of 600
6 + 4 + 12 = 22
3% of 200
2% of 400
1% of 600
6 + 8 + 6 = 20
The possible total amounts of money I could receive are $28.00, $26.00, $22.00, and $20.00. b. What is the greatest total amount of money you could receive? The greatest total amount of money I could receive is $28.00.
c. What is the least total amount of money you could receive? The least total amount of money I could receive is $20.00.
When most students have completed the problem, call the class together and select a few pairs to share their solutions and reasoning. Invite students to share any surprising patterns or results they observed. As needed, use the following discussion questions to prompt students’ thinking.
© Great Minds PBC
507
EUREKA MATH2
6 ▸ M1 ▸ TE ▸ Lesson 26
How did you organize your work to keep track of the possible total amounts of money that you could receive?
Teacher Note
Sample: We created a table with columns for the money from Mrs. A, Mrs. B, and Mrs. C. Then we created a row to represent each possible combination of percents and wholes. What strategies did you use to calculate these percents? Sample: We used mental math. We found 1% of each woman’s money by dividing the amount of money she has by 100. Then we doubled that value to find 2%, and we tripled that value to find 3%. We created a double number line to represent 1%, 2%, and 3% of each woman’s money. Then we wrote an addition sentence for all the different possible total amounts of money we could receive. What patterns do you notice among the possible total amounts of money you could receive? Sample: We noticed that the greatest total amount of money we could receive came from calculating 3% of $600.00, 2% of $400.00, and 1% of $200.00. We noticed that 3% of Mrs. A’s money is equivalent to 1% of Mrs. C’s money, and Mrs. C has three times as much money as Mrs. A. We noticed that 2% of Mrs. A’s money is equivalent to 1% of Mrs. B’s money, and Mrs. B has twice as much money as Mrs. A. We noticed that 3% of Mrs. B’s money is equivalent to 2% of Mrs. C’s money, which means that 3% of $400.00 is equivalent to 2% of $600.00.
Cafeteria Calculations Students model a real-world situation involving multiple percents. Present the Cafeteria Calculations problem and direct students to read it silently. To facilitate comprehension, consider asking students to describe to a partner what the problem is asking and what the solution will look like. 508
Some students may benefit from additional practice solving mixed types of percent problems. Consider having students solve a sequence of mixed types of percent problems in place of the Cafeteria Calculations problem. Sample problems are shown. 1. In the sixth grade, 48 out of 60 students play a musical instrument. a. What percent of sixth graders play an instrument?
80% of sixth graders play an instrument.
b. The percent of seventh graders who play an instrument is the same as the percent of sixth graders who play an instrument. How many of the 80 seventh graders play an instrument?
64 seventh graders play an instrument. 3. Tara saves 12% of the money she earns from her job each month. One month, she saves $24.00. a. How much does Tara earn from her job that month? Tara earns $200.00 that month. b. Tara earns $300.00 the following month. What is the total amount Tara saves in the two months? Tara saves $60.00 in the two months.
© Great Minds PBC
EUREKA MATH2 6 ▸ M1 ▸ TE ▸ Lesson 26
Divide students into groups of 3 or 4 to complete the task. Provide access to calculators. Direct students to round each percent to the nearest whole number as needed. As students work, circulate and use the following questions to prompt student thinking: • What do these requirements mean? Give an example of a lunch menu that would fail to meet one of these requirements. • How might you organize your work? • What is the total number of calories in your lunch menu? What is the total number of items? Does this meet the cafeteria’s requirements? • What are the total amounts in grams of carbohydrates, fat, and protein in your lunch menu? • If there are 4 calories in every gram of carbohydrates, how many calories in your lunch menu are from carbohydrates? What percent of the total number of calories is the number of calories from carbohydrates? • If there are 9 calories in every gram of fat, how many calories in your lunch menu are from fat? What percent of the total number of calories is the number of calories from fat? • If there are 4 calories in every gram of protein, how many calories in your lunch menu are from protein? What percent of the total number of calories is the number of calories from protein? • How might you need to change your lunch menu to meet the cafeteria’s requirements? 2. The school cafeteria manager asks your math class to help design a lunch menu. You can choose from the foods in the list provided. The manager gives you the following requirements: • The lunch menu should have a total number of calories that is no fewer than 600 and no more than 700. • The lunch menu should have one main dish, one or two sides, and one drink. • Between 45% and 65% of the total number of calories should come from carbohydrates.
© Great Minds PBC
Promoting the Standards for Mathematical Practice As students create and revise a lunch menu to meet the given requirements, they are making sense of problems and persevering in solving them (MP1). Ask the following questions to promote MP1: • What are some strategies you can try to start creating a lunch menu? • How can you explain the cafeteria’s requirements in your own words? • What is your plan to calculate the percent of calories from carbohydrates, fat, and protein?
509
EUREKA MATH2
6 ▸ M1 ▸ TE ▸ Lesson 26
• Between 20% and 35% of the total number of calories should come from fat. • Between 10% and 35% of the total number of calories should come from protein. There are 4 calories per gram of carbohydrates, 9 calories per gram of fat, and 4 calories per gram of protein. Sample: Spaghetti and meatballs, string cheese, apple, nonfat chocolate milk
UDL: Action & Expression Provide a table for students to organize their work as they compile lunch menu items and calculate the total amounts in grams of carbohydrates, fat, and protein. A sample table is shown.
Total number of calories: 672
Amount of Amount of Amount of Number of Carbohydrates Fat Protein Calories (grams) (grams) (grams)
Total amount of carbohydrates (grams): 91 Total amount of fat (grams): 17.2
Main dish
Total amount of protein (grams): 38.3
Side dish #1
Calories from carbohydrates: There are 364 calories from carbohydrates because 91 ´ 4 = 364. 364 672
≈ 54%
About 54% of the total number of calories are from carbohydrates.
Side dish #2 Drink Total
Calories from fat: There are 154.8 calories from fat, because 17.2 ´ 9 = 154.8. 154.8 ≈ 23% 672
About 23% of the total number of calories are from fat. Calories from protein: There are 153.2 calories from protein, because 38.3 ´ 4 = 153.2. 153.2 672
≈ 23%
About 23% of the total number of calories are from protein.
510
© Great Minds PBC
EUREKA MATH2 6 ▸ M1 ▸ TE ▸ Lesson 26
Nutrition Tables Main Dishes Number of Calories
Amount of Carbohydrates (grams)
Amount of Fat (grams)
Amount of Protein (grams)
Bean burrito
277
37
9
12
Spaghetti and meatballs
414
50
14
22
Chicken nuggets
227
16
11
16
Turkey hot dog
241
24
13
7
Beef nachos
412
40.5
20
17.5
Cheese pizza
351
36
15
18
Turkey and cheese sandwich
288
27.5
12
17.5
Cheeseburger
343
28
17
19.5
Food Item
© Great Minds PBC
511
EUREKA MATH2
6 ▸ M1 ▸ TE ▸ Lesson 26
Side Dishes Number of Calories
Amount of Carbohydrates (grams)
Amount of Fat (grams)
Amount of Protein (grams)
Apple
59
14
0.2
0.3
Carrot sticks
28
6
0
1
String cheese
59
1
3
7
Corn
85
17
1
2
Graham crackers
95
16
3
1
Brown rice
145
31
1
3
Cherry tomatoes
20
4
0
1
Mashed potatoes and gravy
207
19
7
17
Food Item
512
© Great Minds PBC
EUREKA MATH2 6 ▸ M1 ▸ TE ▸ Lesson 26
Drinks Number of Calories
Amount of Carbohydrates (grams)
Amount of Fat (grams)
Amount of Protein (grams)
Chocolate milk, nonfat
140
26
0
9
Milk, 1%
131
16
3
10
Water
0
0
0
0
Drink Item
Differentiation: Support
When most students have finished, select a few groups to share their lunch menus with the class. Use the following questions to help students reflect on the task. • What was difficult about this task? What was straightforward?
Consider selecting one menu item and demonstrating for students how to find the number of calories from each nutrient. Use the following to convert nutrients to calories: 4 calories per gram of carbohydrates, 9 calories per gram of fat, and 4 calories per gram of protein. Keep that work displayed for students to refer to as they complete the problem.
• What was interesting or surprising to you? • Explain the process you used to approach this task. How did you organize your work? • Did your first lunch menu idea meet all the requirements? If not, how did you adjust your menu to create one that met all the requirements? • Where did you notice ratios or rates in this task? Use the following questions to prompt students’ reasoning about percents in their solutions. What did you notice about the effect of carbohydrates, fat, and protein on the total number of calories in your lunch menu? Sample: I noticed that foods with a greater number of grams of fat, such as spaghetti and meatballs, added more calories to the lunch menu than foods with a greater number of grams of carbohydrates, such as brown rice.
© Great Minds PBC
Differentiation: Challenge Extend the Cafeteria Calculations problem by asking students to also create a breakfast menu. Tell students that the breakfast menu should have a total number of calories that is no fewer than 400 and no more than 550. Allow students to use internet access or information from their school cafeteria to look up the nutrition data on common breakfast foods.
513
EUREKA MATH2
6 ▸ M1 ▸ TE ▸ Lesson 26
Why do you think food labels give the numbers of grams of carbohydrates, fat, and protein instead of the percents? Sample: Some people might want to know the number of grams of each nutrient they are eating. When you say something like “35% of calories from fat,” the statement only tells you what part it represents of the total number of calories, or the whole. It does not tell you the number of grams of fat.
Land Debrief 5 min Objective: Solve multi-step percent problems. Use the following prompt to guide a discussion about the learning throughout module 1. If necessary, point out resources from earlier in the module, such as the Frayer model about equivalent ratios. In this module, we have studied and worked with ratios, rates, and percents. How do percents relate to ratios and rates? Give an example from today’s percent problems. A percent is similar to a ratio of a number to 100. But a ratio is a pair of numbers, and a percent is just one number, a fraction with a denominator of 100. In some situations, a percent is like a rate per 100 units. For example, when 50% of the calories in my lunch menu were from carbohydrates, that was a rate of 50 calories of carbohydrates per 100 total calories in the meal. We can use the same kind of thinking about multiplication and addition patterns to solve problems involving ratios, rates, or percents. We can model all of them by using tape diagrams and double number lines.
Exit Ticket 5 min Provide up to 5 minutes for students to complete the Exit Ticket. It is possible to gather formative data even if some students do not complete every problem. 514
Teacher Note Assign the Practice problems for completion outside of class or use them in class if time remains after the lesson. Refer students to the Recap for support.
© Great Minds PBC
EUREKA MATH2 6 ▸ M1 ▸ TE ▸ Lesson 26
Recap
EUREKA MATH2
6 ▸ M1 ▸ TE ▸ Lesson 26
RECAP Name
Date
26
2. The chess club has a goal to raise $500.00 for charity. So far, the club has raised $380.00. What percent of the goal has the chess club raised so far? 380 = 38 = 76 500 50 100
Solving Percent Problems
The chess club has raised 76% of its goal so far.
In this lesson, we •
EUREKA MATH2
6 ▸ M1 ▸ TE ▸ Lesson 26
used our understanding of percents to solve multi-step percent problems.
Examples
Another method is to divide the part, 380, by the whole, 500, to get 0.76. This is the decimal form of 76%.
1. Yuna has run 24 miles this week, which is 60% of her weekly running goal. What is the total number of miles Yuna needs to run to meet her weekly running goal? Use a double number line to show your thinking.
One method to find an unknown percent is to write the part out of the whole as a fraction. Then find an equivalent fraction with a denominator of 100.
×10 ÷6 0
24
4
40
Number of Miles
The total number of miles Yuna needs to run to meet her weekly running goal represents the whole, or 100%.
3. A basketball team wins 70% of its games. If the team plays a total of 20 games, how many games does the team win? 70 = 0.7 100
0.7 ´ 20 = 14
The answer to this question is the same as the solution to the problem, What is 70% of 20?
The team wins 14 games.
Percent 0% 10%
60%
100%
÷6 ×10
Yuna needs to run 40 miles to meet her weekly running goal.
© Great Minds PBC
© Great Minds PBC
Divide 24 and 60 each by 6 to calculate 10% of the total. Then multiply 4 and 10 each by 10 to calculate 100% of the total.
387
388
RECAP
© Great Minds PBC
515
EUREKA MATH2
6 ▸ M1 ▸ TE ▸ Lesson 26
Sample Solutions Expect to see varied solution paths. Accept accurate responses, reasonable explanations, and equivalent answers for all student work.
EUREKA MATH2
6 ▸ M1 ▸ TE ▸ Lesson 26
PRACTICE Name
Date
26
4. A store offers both a 40% off coupon and a $10.00 off coupon. Only one coupon may be used for each item purchased. a. Which coupon gives the lower price of the item? Mark the better coupon for each item in the table.
For problems 1–5, solve by using any method. 1. Kayla runs laps for a fitness challenge in physical education class. After Kayla runs 18 laps, her friends shout, “Yay! You’re 45% done!” How many laps is Kayla trying to run? 0
2
4
6
8
EUREKA MATH2
6 ▸ M1 ▸ TE ▸ Lesson 26
10 12 14 16 18 20 22 24 26 28 30 32 34 36 38 40
Number of Laps
Item Purchased
40% Off Coupon
$140.00 Bike
X
$10.00 Off Coupon
$15.00 Scarf
Percent
X
$75.00 Winter Coat
0% 5% 10% 15% 20% 25% 30% 35% 40% 45% 50% 55% 60% 65% 70% 75% 80% 85% 90% 95%100%
X
$12.00 Book
Kayla is trying to run 40 laps.
X
b. Show how you made your choices in part (a). Write the final price of each item after the better coupon has been used.
2. The soccer team raises $600.00 during a fundraiser. The team’s goal is to raise a total of $750.00. What percent of the team’s goal does the team raise during the fundraiser?
Bike:
600 = 80 750 100
140 × 40 = 100
The soccer team raises 80% of the team’s goal during the fundraiser.
5,600 = 56 100
140 - 56 = 84 The price of the bike is $84.00 after the 40% off coupon is used. Scarf:
15 - 10 = 5
The price of the scarf is $5.00 after the $10.00 off coupon is used.
3. The theater club set a goal to sell 48 theater tickets in one day. At the end of that day, the theater teacher says that the club sold 175% of its goal amount. How many tickets did the club sell? 175 × 48 = 8, 400 = 84 100 100
The club sold 84 tickets.
© Great Minds PBC
516
389
390
P R ACT I C E
© Great Minds PBC
© Great Minds PBC
EUREKA MATH2 6 ▸ M1 ▸ TE ▸ Lesson 26
EUREKA MATH2
6 ▸ M1 ▸ TE ▸ Lesson 26
Winter coat:
75 × 40 = 100
5. Toby considers buying three different pairs of running shoes: a $20.00 pair, a $40.00 pair, and a $60.00 pair. He has three coupons: one for 10% off one item, one for 20% off one item, and one for 25% off one item. Assume that Toby buys at least one pair of running shoes and uses a coupon for each pair of shoes he buys.
3,000 = 30 100
75 - 30 = 45 The price of the winter coat is $45.00 after the 40% off coupon is used. Book:
What is the least amount of money Toby could pay? What is the greatest amount? Explain. Least Amount:
12 - 10 = 2
The price of the book is $2.00 after the $10.00 off coupon is used.
2.5
5
7.5
10
12.5
15
17.5
25 × 20 = 5 100
20 - 5 = 15
c. Lisa chooses a shirt to buy from this store. No matter which coupon she uses, the price of the shirt will be discounted by the same amount. What is the price of the shirt? Explain how you know. 0
EUREKA MATH2
6 ▸ M1 ▸ TE ▸ Lesson 26
20
22.5
The least amount Toby could pay is $15.00. He could buy the $20.00 pair of shoes with the 25% off coupon. So Toby could use the coupon for the greatest percent off to buy the least expensive pair of shoes. Greatest Amount:
25
$60.00 pair of shoes with the 10% off coupon:
Price (dollars)
10 × 60 = 6 100
Percent 0%
10%
20%
30%
40%
50%
60%
70%
80%
90%
60 - 6 = 54
100%
$40.00 pair of shoes with the 20% off coupon:
20 × 40 = 8 100
The price of the shirt is $25.00. Either coupon will give the same discount because 40% of $25.00 is $10.00.
40 - 8 = 32
$20.00 pair of shoes with the 25% off coupon:
25 × 20 = 5 100
20 - 5 = 15
54 + 32 + 15 = 101 The greatest amount Toby could pay is $101.00. He could buy the $60.00 pair of shoes with the 10% off coupon, the $40.00 pair of shoes with the 20% off coupon, and the $20.00 pair of shoes with the 25% off coupon. He could use the coupon for the greatest percent off to buy the least expensive pair of shoes. He could use the coupon for the least percent off to buy the most expensive pair of shoes.
© Great Minds PBC
© Great Minds PBC
P R ACT I C E
391
392
P R ACT I C E
© Great Minds PBC
517
EUREKA MATH2
6 ▸ M1 ▸ TE ▸ Lesson 26
EUREKA MATH2
6 ▸ M1 ▸ TE ▸ Lesson 26
Remember For problems 6 and 7, divide. Write the quotient and the remainder on separate lines. 6. 5,264 ¸ 52
7. 8,630 ¸ 65
Quotient: 101
Quotient: 132
Remainder: 12
Remainder: 50
8. Some bats can fly at a rate of 85 miles per hour. Yuna says, “At that rate, it would take a bat less than 2 weeks to fly the 29,401-mile distance around Earth at the equator.” Do you agree or disagree with Yuna? Justify your answer. Round to the nearest tenth if necessary.
29,401 ¸ 85 » 345.9 hours 345.9 ¸ 24 » 14.4 days I disagree with Yuna. It takes the bat about 14.4 days to fly the 29,401-mile distance around Earth at the equator. This is more than 2 weeks. 9. Which statements accurately describe the ratio relationship shown in the diagram? Choose all that apply.
A. For every 4 boxes, there are 12 circles. B. For every 4 boxes, there are 3 circles. C. For every 4 circles, there are 3 boxes. D. For every 3 circles, there is 1 box. E. For every 1 box, there are 3 circles.
© Great Minds PBC
518
P R ACT I C E
393
© Great Minds PBC
Standards Content Standards Understand ratio concepts and use ratio reasoning to solve problems. 6.RP.A.1 Understand the concept of a ratio and use ratio language to describe a ratio relationship between two quantities. For example, “The ratio of wings to beaks in the bird house at the zoo was 2 : 1, because for every 2 wings there was 1 beak.” “For every vote candidate A received, candidate C received nearly three votes.” 6.RP.A.2 Understand the concept of a unit rate ab associated with a ratio a : b with b ≠ 0, and use rate language in the context of a ratio relationship. For example, “This recipe has a ratio of 3 cups of flour to 4 cups of sugar, so there is 43 cup of flour for each cup of sugar.” “We paid $75 for 15 hamburgers, which is a rate of $5 per hamburger.”1 6.RP.A.3 Use ratio and rate reasoning to solve real-world and mathematical problems, e.g., by reasoning about tables of equivalent ratios, tape diagrams, double number line diagrams, or equations. a. Make tables of equivalent ratios relating quantities with whole-number measurements, find missing values in the tables, and plot the pairs of values on the coordinate plane. Use tables to compare ratios. b. Solve unit rate problems including those involving unit pricing and constant speed. For example, if it took 7 hours to mow 4 lawns, then at that rate, how many lawns could be mowed in 35 hours? At what rate were lawns being mowed? c.
Find a percent of a quantity as a rate per 100 (e.g., 30% of a quantity means 30 100 times the quantity); solve problems involving finding the whole, given a part and the percent.
d. Use ratio reasoning to convert measurement units; manipulate and transform units appropriately when multiplying or dividing quantities. 1
Expectations for unit rates in this grade are limited to non-complex fractions.
520
© Great Minds PBC
EUREKA MATH2 6 ▸ M1
Standards for Mathematical Practice MP1
Make sense of problems and persevere in solving them.
MP2
Reason abstractly and quantitatively.
MP3
Construct viable arguments and critique the reasoning of others.
MP4
Model with mathematics.
MP5
Use appropriate tools strategically.
MP6
Attend to precision.
MP7
Look for and make use of structure.
MP8
Look for and express regularity in repeated reasoning.
© Great Minds PBC
521
Achievement Descriptors: Proficiency Indicators 6.Mod1.AD1 Write and explain ratios that describe relationships between two quantities. RELATED CCSSM
6.RP.A.1 Understand the concept of a ratio and use ratio language to describe a ratio relationship between two quantities. For example, “The ratio of wings to beaks in the bird house at the zoo was 2 : 1, because for every 2 wings there was 1 beak.” “For every vote candidate A received, candidate C received nearly three votes.”
Partially Proficient
Proficient
Identify ratios that describe relationships between two quantities.
Write and explain ratios that describe relationships between two quantities.
There are 8 green marbles for every 2 blue marbles. What is the ratio of the number of green marbles to the number of blue marbles?
Use the following information to answer parts A and B.
A. 2 : 10
There are 5 red marbles, 8 green marbles, and 2 blue marbles in a bag.
B. 2 : 8
Part A
C. 8 : 10
What is the ratio of the number of green marbles to the number of blue marbles?
D. 8 : 2
Highly Proficient
Part B Explain what the ratio 5 : 15 means in this situation.
522
© Great Minds PBC
EUREKA MATH2 6 ▸ M1
6.Mod1.AD2 Write and explain the unit rate that describes a relationship between two quantities. RELATED CCSSM
6.RP.A.2 Understand the concept of a unit rate ab associated with a ratio a : b with b ≠ 0, and use rate language in the context of a ratio relationship. For example, “This recipe has a ratio of 3 cups of flour to 4 cups of sugar, so there is 43 cup of flour for each cup of sugar.” “We paid $75 for 15 hamburgers, which is a rate of $5 per hamburger.” 1
Partially Proficient Identify the unit rate that describes a relationship between two quantities.
Write and explain the unit rate in the context of a ratio relationship.
A recipe for salad dressing calls for 5 parts oil to 2 parts vinegar. How much oil should be used for every 1 cup of vinegar?
In 6 hours, Daniel makes 2 necklaces.
A. 2 cups
When the rate is expressed as necklaces per hour, what is the unit rate?
5
B. 2 cups 5
C. 2 cups D. 5 cups
1
Proficient
Highly Proficient
Part A
Part B Explain what the unit rate means in this situation.
Expectations for unit rates in this grade are limited to non-complex fractions.
© Great Minds PBC
523
EUREKA MATH2
6 ▸ M1
6.Mod1.AD3 Solve real-world and mathematical problems by using ratio reasoning. RELATED CCSSM
6.RP.A.3 Use ratio and rate reasoning to solve real-world and mathematical problems, e.g., by reasoning about tables of equivalent ratios, tape diagrams, double number lines, or equations.
Partially Proficient
Proficient
Solve real-world and mathematical problems involving a constant ratio between two quantities.
Solve and explain real-world and mathematical problems involving changing a ratio.
The ratio of the number of ounces of cashews to the number of ounces of almonds in a snack mix is 5 : 3.
The ratio of the number of ounces of cashews to the number of ounces of almonds in a snack mix is 5 : 3. Julie adds 4 ounces of almonds to the mix to make the ratio 1 : 1.
Part A How many ounces of cashews are in a mix that has a total of 64 ounces of nuts?
Part A
Part B
How many ounces of cashews are in the original mix? Draw a diagram to show your thinking.
How many ounces of almonds are in a mix that has a total of 64 ounces of nuts?
Part B
524
Highly Proficient
What is the total number of ounces of nuts that are in the mix now? Use your diagram to explain.
© Great Minds PBC
EUREKA MATH2 6 ▸ M1
6.Mod1.AD4 Represent ratio relationships by using tables and the coordinate plane. RELATED CCSSM
6.RP.A.3.a Make tables of equivalent ratios relating quantities with whole-number measurements, find missing values in the tables, and plot the pairs of values on the coordinate plane. Use tables to compare ratios.
Partially Proficient Complete tables of ratio relationships. The table shows the ratio relationship between the number of cups of milk and the number of cups of flour in a recipe. Complete the table. Number of Cups of Milk
Number of Cups of Flour
6
9
12
18 27
24
Proficient
Highly Proficient
Create representations of ratio relationships by using tables and the coordinate plane. Kayla runs 25 meters in 5 seconds. Part A Create a table to determine the number of seconds it takes her to run 150 meters at the same speed. Part B Use your table to graph the ratio relationship between the number of meters and the number of seconds Kayla runs. Draw a coordinate plane, and then label the axes, plot the points, and give the graph a title.
36
30
© Great Minds PBC
525
EUREKA MATH2
6 ▸ M1
6.Mod1.AD5 Compare ratio relationships by using various representations. RELATED CCSSM
6.RP.A.3.a Make tables of equivalent ratios relating quantities with whole-number measurements, find missing values in the tables, and plot the pairs of values on the coordinate plane. Use tables to compare ratios.
Partially Proficient
Proficient
Highly Proficient
Compare two ratio relationships represented in tables.
Compare more than two ratio relationships that are shown in two or more representations.
The tables show the total costs for different numbers of apples and oranges. Which costs more: 1 apple or 1 orange? Explain your thinking.
A 3-pound bag of Fuji apples costs $4.44.
Number of Oranges
Total Cost (dollars)
4
3.56
8
7.12
12
10.68
16
14.24
20
17.80
The table shows the total cost of different numbers of pounds of Gala apples. Number of Pounds
Total Cost (dollars)
5
6.55
10
13.10
15
19.65
20
26.20
The double number line shows the total cost of different numbers of pounds of Red Delicious apples.
526
Number of Apples
Total Cost (dollars)
3
5.00
9
15.00
15
25.00
21
35.00
27
45.00
Total Cost (dollars) Number of Pounds
0
2.36
4.72
7.08
9.44
0
2
4
6
8
Which apple variety has the lowest cost per apple?
© Great Minds PBC
EUREKA MATH2 6 ▸ M1
6.Mod1.AD6 Solve real-world problems by using unit rates. RELATED CCSSM
6.RP.A.3.b Solve unit rate problems including those involving unit pricing and constant speed. For example, if it took 7 hours to mow 4 lawns, then at that rate, how many lawns could be mowed in 35 hours? At what rate were lawns being mowed?
Partially Proficient
© Great Minds PBC
Proficient
Highly Proficient
Solve real-world problems involving a constant unit rate.
Solve real-world problems involving multiple constant unit rates.
Scott buys potatoes for a family reunion. A store sells 5 pounds of potatoes for $2.40. How many pounds of potatoes does Scott buy for $15?
Noah and Yuna each drive at a constant speed to a town 120 miles away. Noah drives 50 miles per hour and leaves 20 minutes before Yuna. Yuna drives 60 miles per hour. Who arrives first? Explain your thinking.
527
EUREKA MATH2
6 ▸ M1
6.Mod1.AD7 Model and explain percents and problems involving percents. RELATED CCSSM
6.RP.A.3.c Find a percent of a quantity as a rate per 100 (e.g., 30% of a quantity means 30 times the quantity); solve problems involving finding the whole, given a part 100 and the percent.
Partially Proficient Represent a percent of a quantity in different forms. Consider 39%. Part A Shade the grid to represent 39%.
Proficient
Highly Proficient
Model and explain quantities in problems involving percents. Ryan conducts a survey and determines that 45% of the students in his school own a dog. There are 80 students in his school. Part A Create a diagram to find the number of students in Ryan’s school who own a dog. Part B Explain what the part, whole, and percent mean in this situation.
Part B Write 39% as a fraction. Part C Write 39% as a decimal.
528
© Great Minds PBC
EUREKA MATH2 6 ▸ M1
6.Mod1.AD8 Solve problems that involve finding the part, whole, or percent. RELATED CCSSM
30 times the quantity); solve problems involving finding the whole, given a part 6.RP.A.3.c Find a percent of a quantity as a rate per 100 (e.g., 30% of a quantity means 100 and the percent.
Partially Proficient
Proficient
Highly Proficient
Solve problems that involve finding the part, whole, or percent. Sana has 7 mystery novels. She says that 35% of her novels are mystery novels. What is the total number of novels Sana has?
6.Mod1.AD9 Convert among units by using ratio reasoning to solve problems. RELATED CCSSM
6.RP.A.3.d Use ratio reasoning to convert measurement units; manipulate and transform units appropriately when multiplying or dividing quantities.
Partially Proficient
Proficient
Highly Proficient
Convert among nonmixed units by using ratio reasoning.
Convert among units, including mixed units such as 4 feet 3 inches, to solve problems.
Solve problems involving conversion of units within ratios and rates.
Convert.
Lisa’s height is 5 feet 8 inches. What is Lisa’s height in centimeters?
Yuna runs 750 meters in 5 minutes. What is Yuna’s speed in kilometers per hour?
10 in =
cm
(1 in = 2.54 cm)
© Great Minds PBC
529
Terminology The following terms are critical to the work of grade 6 module 1. This resource groups terms into categories called New, Familiar, and Academic Verbs. The lessons in this module incorporate terminology with the expectation that students work toward applying it during discussions and in writing.
percent
Items in the New category are discipline-specific words that are introduced to students in this module. These items include the definition, description, or illustration as it is presented to students. At times, this resource also includes italicized language for teachers that expands on the wording used with students.
A quantity that describes a ratio relationship between two quantities (Lesson 16)
Items in the Familiar category are discipline-specific words introduced in prior modules or in previous grade levels.
ratio relationship
Items in the Academic Verbs category are high-utility terms that are used across disciplines. These terms come from a list of academic verbs that the curriculum strategically introduces at this grade level.
New equivalent ratios
A percent is a fraction with a denominator of 100. A number N followed by the percent symbol, N%, indicates 100 . (Lesson 22) rate
ratio An ordered pair of numbers that are not both zero (Lesson 2)
The set of all ratios that are equivalent ratios (Lesson 6) unit rate When a rate is written so that the second of the two quantities is 1 unit, the unit rate is the numerical part of the rate. (Lesson 17) value of the ratio For a ratio A : B, the value of the ratio is the quotient BA as long as B is not zero. (Lesson 15)
Two ratios A : B and C : D are equivalent ratios if there is a nonzero number c such that C = c ´ A and D = c ´ B. (Lesson 5)
530
© Great Minds PBC
EUREKA MATH2 6 ▸ M1
Familiar coordinate plane denominator factor multiple ordered pair origin quadrant quantity tiling
Academic Verbs Module 1 does not introduce any academic verbs from the grade 6 list.
© Great Minds PBC
531
Math Past Per Centum: Romans and Taxes When was the concept of percent invented? Why does percent mean “hundredths”? Who introduced the symbol % to represent percent? About 2,000 years ago, the word Roman did not just mean someone who lived in the Italian city of Rome. The Romans were citizens of a vast territory, initially called the Roman Republic (509–27 BCE) and later renamed the Roman Empire (27 BCE–476 CE).
Collecting taxes and sending them back to Rome would have been very difficult. Starting in about 167 BCE, independent contractors called tax farmers (publicani) collected the property taxes from the Roman provinces on behalf of the central government in Rome. The tax farmers competed for the right to collect taxes in provinces. They prepaid the anticipated tax due and pocketed any profits from over-collecting.
The map shows the extent of the Roman Empire in the year 14 CE. The empire’s territory was divided into provinces. The map shows the provinces in several colors, based on when the provinces were brought into the Roman Empire. A Roman province was similar to a US state; it had its own borders and its own governor. The provinces formed a ring around the Mediterranean Sea and stretched 2,500 miles from present-day Spain in the west to present-day Syria in the east. Where did the Roman Empire get the money it needed to perform the functions of government, for example, to hire soldiers for the army? Your students might have a good guess—taxes! Indeed, just like the state and the federal governments in the United States, the Roman Empire levied taxes on their citizens. The city of Rome was the center of the Roman Empire. Travel—and with it, communication and shipping—between Rome and the more distant parts of the empire took weeks by ship and by land.
532
Roman leader Augustus Caesar (63 BCE–14 CE) combined the treasuries in the provinces and the central treasury in Rome, abolished tax farming, and instituted a fairer system of direct taxation. The new system included a tax on land (tributum soli) and a poll tax (i.e., voting tax) on each adult (tributum capitis). The amount of the Roman land tax was about one part out of a hundred. The Latin words per centum mean “per one hundred.” Today, we abbreviate this as the single word percent.
© Great Minds PBC
EUREKA MATH2 6 ▸ M1
In about 1425 CE, the symbol p appeared in a manuscript to represent the idea of percent.1 The stylized P stood for “per,” and the rest of the symbol stood for “hundredths.” Over time, the p was dropped, leaving the . By around the year 1650, that new symbol became 00 .2 This eventually turned into the stylized modern symbol %, where the zeros are separated by a slash (solidus). Along with the widely used % symbol (per hundred, percent), there are less common symbols: ‰ (per thousand, permille) and ‰° (per ten thousand, permyriad).3
1
Florian Cajori, A History of Mathematical Notations Volume I, 312.
2
Cajori, A History of Mathematical Notations Volume I, 312.
3
Cajori, A History of Mathematical Notations Volume I, 312.
© Great Minds PBC
Ask your students if they can think of a situation where numbers such as 0.366 are read simply as “three-sixty-six.” Give them a hint—baseball! Students who are baseball fans may recognize this as the way we say a player’s batting average. The correct way to write that number is 366‰ because the second 6 is in the thousandths place. The number 0.366 is in fact the highest lifetime batting average recorded in the National Baseball Hall of Fame. It was earned by Ty Cobb, a legendary baseball player who played for the Detroit Tigers from 1905–1926 and the Philadelphia Athletics from 1927–1928.
533
Materials The following materials are needed to implement this module. The suggested quantities are based on a class of 24 students and one teacher. 24
Calculators
24
Personal whiteboard erasers
24
Colored pencils, set of 4
1
Projection device
24
Dry-erase markers
24
Sticky notes
24
Learn books
9
Stopwatches
24
Pencils
1
Tape, roll
10
Paper (sheets, 8.5" x 11")
1
Teach book
24
Personal whiteboards
1
Teacher computer or device
534
© Great Minds PBC
Fluency Fluency activities allow students to develop and practice automaticity with fundamental skills so they can devote cognitive power to solving more challenging problems. Skills are incorporated into fluency activities only after they are introduced conceptually within the module.
for a sequence of problems. These written recordings allow for differentiation: Based on the answers you observe, you can make responsive, in-the-moment adjustments to the sequence of problems. Each student requires a personal whiteboard and a whiteboard marker with an eraser for this routine.
Each lesson in A Story of Ratios begins with a Fluency segment designed to activate students’ readiness for the day’s lesson. This daily segment provides sequenced practice problems on which students can work independently, usually in the first few minutes of a class. Students can use their personal whiteboards to complete the activity, or you may distribute a printed version, available digitally. Each fluency routine is designed to take 3–5 minutes and is not part of the 45-minute lesson structure. Administer the activity as a bell ringer or adapt the activity as a teacher-led Whiteboard Exchange or choral response.
1. Display one problem in the sequence.
Bell Ringer This routine provides students with independent work time to determine the answers to a set of problems. 1. Display all the problems at once. 2. Encourage students to work independently and at their own pace. 3. Read or reveal the answers.
Whiteboard Exchange This routine builds fluency through repeated practice and immediate feedback. A Whiteboard Exchange maximizes participation by having every student record solutions or strategies 536
2. Give students time to work. Wait until nearly all students are ready. 3. Signal for students to show their whiteboards. Provide immediate and specific feedback to students one at a time. If revisions are needed, briefly return to validate the work after students make corrections. 4. Advance to the next problem in the sequence and repeat the process.
Choral Response This routine actively engages students in building familiarity with previously learned skills, strengthening the foundational knowledge essential for extending and applying math concepts. The choral response invites all students to participate while lowering the risk for students who may respond incorrectly. 1. Establish a signal for students to respond to in unison. 2. Display a problem. Ask students to raise their hands when they know the answer. 3. When nearly all hands are raised, signal for the students’ response. 4. Reveal the answer and advance to the next problem. © Great Minds PBC
EUREKA MATH2 6 ▸ M1
Count By This routine actively engages students in committing counting sequences to memory, strengthening the foundational knowledge essential for extending and applying math concepts. 1. Establish one signal for counting up and counting down and another signal for stopping the count. 2. Tell students the unit to count by. Establish the starting and ending numbers between which they should count. 3. Begin the count by providing the signals. Be careful not to mouth the words as students count.
Sprints Sprints are activities that develop mathematical fluency with a variety of facts and skills. A major goal of each Sprint is for
© Great Minds PBC
students to witness their own improvement within a very short time frame. The Sprint routine is a fun, fast-paced, adrenaline-rich experience that intentionally builds energy and excitement. This rousing routine fuels students’ motivation to achieve their personal best and provides time to celebrate their successes. Each Sprint includes two parts, A and B, that feature closely related problems. Students complete Sprint A, followed by two count by routines—one fast-paced and one slow-paced—that include a stretch or other physical movement. Then students complete Sprint B, aiming to improve their score from Sprint A. Each part is scored but not graded. Sprints can be given at any time after the content of the Sprint has been conceptually developed and practiced. The same Sprint may be administered more than once throughout a year or across grade levels. With practice, the Sprint routine takes about 10 minutes.
537
EUREKA MATH2
6 ▸ M1
Directions
Sample Dialogue
1. Have students read the instructions and sample problems. Frame the task by encouraging students to complete as many problems as they can—to do their personal best.
Have students read the instructions and complete the sample problems. Frame the task:
2. Time students for 1 minute on Sprint A. Do not expect them to finish. When time is up, have students underline the last problem they completed. 3. Read the answers to Sprint A quickly and energetically. Have students call out “Yes!” if they answered correctly; have them circle the answer if they answered incorrectly. 4. Have students count their correct answers and record that number at the top of the page. This is their personal goal for Sprint B. 5. Celebrate students’ effort and success on Sprint A. 6. To increase success with Sprint B, offer students additional time to complete more problems on Sprint A or ask discussion questions to analyze and discuss the patterns in Sprint A. 7. Lead students in the fast-paced and slow-paced count by routines. Include a stretch or other physical movement during the count. 8. Remind students of their personal goal from Sprint A. 9. Direct students to Sprint B.
• You may not finish, and that’s okay. Complete as many problems as you can—do your personal best. • On your mark, get set, think!
Time students for 1 minute on Sprint A. • Stop! Underline the last problem you did. • I’m going to read the answers quickly. As I read the answers, call out “Yes!” if you got it right. If you made a mistake, circle the answer.
Read the answers to Sprint A quickly and energetically. • Count the number of answers you got correct and record that number at the top of the page. This is your personal goal for Sprint B.
Celebrate students’ effort and success. Provide 2 minutes to allow students to complete more problems or to analyze and discuss patterns in Sprint A using discussion questions. Lead students in the fast-paced and slow-paced count by routines. Include a stretch or other physical movement during the count. • Point to the number of answers you got correct on Sprint A. Remember, this is your personal goal for Sprint B.
10. Time students for 1 minute on Sprint B. When time is up, have students underline the last problem they completed.
Direct students to Sprint B.
11. Read the answers to Sprint B quickly and energetically. Have students call out “Yes!” if they answered correctly; have them circle the answer if they answered incorrectly.
Time students for 1 minute on Sprint B.
12. Have students count their correct answers and record that number at the top of the page. 13. Have students calculate their improvement score by finding the difference between the number of correct answers in Sprint A and in Sprint B. Tell them to record the number at the top of the page. 14. Celebrate students’ improvement from Sprint A to Sprint B. 538
• On your mark, get set, improve!
• Stop! Underline the last problem you did. • I’m going to read the answers quickly. As I read the answers, call out “Yes!” if you got it right. If you made a mistake, circle the answer.
Read the answers to Sprint B quickly and energetically. • Count the number of answers you got correct and record that number at the top of the page. • Calculate your improvement score and record it at the top of the page.
Celebrate students’ improvement. © Great Minds PBC
EUREKA MATH2 6 ▸ M1
The table below provides implementation guidance for the Sprints recommended in this module.
Sprint Name
Administration Guidelines
Discussion Questions
Count By Routines
Compare Fractions
Students compare the fractions by using <, >, or =.
How can you use problem 9 to answer problems 10–11?
Fast-paced: Count by fives from 0 to 60.
Administer after module 1 lesson 11 or in place of module 1 lesson 13 Fluency.
Customary Conversion
Slow-paced: Count by threes from 0 to 30.
Students convert each measurement to the given unit.
How can you use problem 6 to answer problems 7–10?
Administer after module 1 lesson 16 or in place of module 1 lesson 21 Fluency.
What do you notice about problem 28?
Decimal Notation for Fractions with Denominators of 10 or 100
Students change fractions with denominators of 10 or 100 to decimal notation.
What do you notice about problems 11–18 and 31–36?
Equivalent Fractions with Denominators of 10 or 100
Students write the numerator for equivalent fractions with denominators of 10 or 100.
Factors of 100
Students find an unknown factor in problems with products of 100.
Metric Conversion
© Great Minds PBC
Fast-paced: Count by fours from 0 to 48. Slow-paced: Count by twos from 30 to 0. Fast-paced: Count by threes from 0 to 42. Slow-paced: Count by halves from 0 halves to 10 halves.
Administer after module 1 lesson 21. How can you use problem 14 to answer problems 15–18?
Fast-paced: Count by twos from 0 to 30. Slow-paced: Count by thirds from 0 thirds to 15 thirds.
Administer after module 1 lesson 21. How can you use problem 4 to answer problems 20 and 21?
Administer after module 1 lesson 21.
What are the similarities and differences between problems 10 and 19?
Students convert each measurement to the given unit.
How can you use problem 12 to answer problems 13–16?
Administer after module 1 lesson 16 or in place of module 1 lesson 19 Fluency.
What are the similarities and differences between problems 23–27?
Fast-paced: Count by tens from 0 to 120. Slow-paced: Count by sixes from 0 to 60. Fast-paced: Count by thirds from 0 thirds to 12 thirds. Slow-paced: Count by fourths from 12 fourths to 0 fourths.
539
540 > > < < < > > = < < < < = > > = <
1 2 1 2 1 6 1 8 1 8 1 2 1 2 1 2 1 2 1 2 1 3 1 3 1 3 1 3 1 3 1 3 1 3
2. 3. 4. 5. 6. 7. 8. 9. 10. 11. 12. 13. 14. 15. 16. 17. 18.
406
>
1 2
1.
12
6
4 12
12
3
2 9
9
3
4 9
9
8
10
9
10
7
10
5
4 10
10
3
1 6
1 4
1 4
1 4
1 6
1 8
Compare the fractions by using <, >, or =.
A
6 ▸ M1 ▸ Sprint ▸ Compare Fractions
Compare Fractions
36.
35.
34.
33.
32.
31.
30.
29.
28.
27.
26.
25.
24.
23.
22.
21.
20.
19.
< > >
2 9 2 9 8
5
18
10
18
7
18
7
12
7
12
>
<
<
<
<
>
5
12
>
=
=
<
>
<
4 9
9
3
9
6
9
6
9
8
9
8
9
8
>
<
2 9
9
<
2 9
5
12
5 6
2 3
2 3
2 3
1 3
1 3
2 6
4 6
5 6
5 6
11
10
8
11
8
13
2 10
2 7
2 5
2 3
Number Correct:
© Great Minds PBC
EUREKA MATH2
6 ▸ M1 EUREKA MATH2
© Great Minds PBC
© Great Minds PBC
< > < < <
1 4 1 4 1 8 2 10 3
4. 5. 6. 7.
5
>
6
<
408
12
3
18.
=
4 12
17.
> 12
6
9
8
9
>
>
5 9
9
=
>
>
3
10
9
10
6
10
16.
15.
14.
13.
12.
11.
10.
9.
=
<
1 6
3.
10
<
1 8
2.
8.
<
1 10
1.
1 3
1 3
1 3
1 3
1 3
1 3
1 3
1 2
1 2
1 2
1 2
1 2
1 6
1 8
1 2
1 2
1 2
1 2
Compare the fractions by using <, >, or =.
B
6 ▸ M1 ▸ Sprint ▸ Compare Fractions
Compare Fractions
36.
35.
34.
33.
32.
31.
30.
29.
28.
27.
26.
25.
24.
23.
22.
21.
20.
19.
> > <
7 7 7
6
24
24
6
7
24
5
12
5
12
5
12
4 9
4 9
5 6
5 6
8
8
8
=
<
<
<
<
>
>
<
=
<
>
7 8
>
>
<
<
2 7
2 7
2 7
2 7
1 4
1 3
1 3
5 6
3 4
1 4
1 3
2 3
12
10
7 8
11
10
3 4
7 9
7
12
2 12
2 9
2 5
2 3
Improvement:
Number Correct:
© Great Minds PBC
EUREKA MATH2
EUREKA MATH2 6 ▸ M1
541
542 ft ft ft ft in in in in in in ft ft ft ft ft yd yd yd in in in
2 yd = 3 yd = 10 yd = 5 yd = 1 ft = 2 ft = 3 ft = 5 ft = 10 ft = 1 ft = 2
12 in = 24 in = 48 in = 6 in = 36 in = 36 in = 72 in = 18 in = 1 yd = 2 yd = 1 yd = 2
2. 3. 4.
5. 6. 7. 8. 9. 10. 11. 12. 13. 14. 15. 16. 17. 18. 19. 20. 21.
410
22.
ft
1 yd =
1.
18
72
36
2
1
2
1
3
44.
43.
42.
41.
40.
39.
38.
37.
1
2
36.
35.
34.
33.
32.
31.
30.
29.
28.
27.
26.
4
2
1
6
120
60
36
24
12
15
30
25.
24.
6 9
23.
3
Convert each measurement to the given unit.
A
6 ▸ M1 ▸ Sprint ▸ Customary Conversion
Customary Conversion
64
ft ft in in in in in
3 1 yd = 6 2 yd = 1 1 ft = 3 1 ft = 4 1 ft = 4 ft =
4 1 yd = 2
in
ft
4 1 yd = 2
ft
yd
yd
yd
yd
yd
ft
ft
ft
120 in =
120 in =
90 in =
48 in =
18 in =
36 in =
66 in =
48 in =
42 in =
36 in =
4 1 5 ft = 3
3
4
2
2
3
3
3
ft
57
ft
2 2 yd =
© Great Minds PBC
162
2
13 1
10
31 3
2
21
3
11
1 2
1
2
51
4
2
31
3
51
42
18
20
10
8
5
ft
3
1 2 yd =
4
ft
3
1 1 yd =
Number Correct:
EUREKA MATH2
6 ▸ M1 EUREKA MATH2
© Great Minds PBC
© Great Minds PBC
in in in in in ft ft ft ft ft yd yd yd in in in ft ft ft ft ft
2 ft = 4 ft = 8 ft = 10 ft = 1 ft = 2
1 yd = 3 yd = 6 yd = 12 yd = 10 yd = 36 in = 18 in = 12 in = 1 yd = 2 yd = 1 yd = 2
12 in = 36 in = 48 in = 60 in = 6 in =
2. 3. 4. 5. 6. 7. 8. 9. 10. 11. 12. 13. 14. 15. 16. 17. 18. 19. 20. 21. 22.
412
in
1 ft =
1.
44.
1 2
38.
72
43.
37.
36
5
36.
1 3
42.
35.
1 2
4
34.
1
41.
33.
30
3
32.
36
40.
31.
18
1
30.
9
39.
29.
3
18
28.
27.
26.
6
120
96
25.
24.
24 48
23.
12
Convert each measurement to the given unit.
B
6 ▸ M1 ▸ Sprint ▸ Customary Conversion
Customary Conversion
in in in in
1 1 ft = 1 1 ft = 3 1 ft = 4 1 ft =
ft ft ft ft
2 2 yd = 3 2 yd = 5 1 yd = 6 2 yd =
2
198 in
5 1 yd = 2
© Great Minds PBC
16 1 ft
5 1 yd = 2
3
22
8
2
41
3 1 3 2
31
2
2
21
yd
ft
ft
ft
ft
ft
yd
yd
11 2
3
11
20
16
11
8
7
66
54
40
16
18
4
96 in =
96 in =
54 in =
42 in =
40 in =
24 in =
90 in =
54 in =
48 in =
3
3
3
3
yd
ft
2 1 yd = 3
in
2 5 1 ft = 2
3
3
2
in
1 ft = 3
Improvement:
Number Correct:
EUREKA MATH2
EUREKA MATH2 6 ▸ M1
543
544 0.2 0.3 0.4 0.5 0.6 0.7 0.8 0.9 1.0 1.1 1.2 1.5 1.7 2.1 2.4 2.6 3.2
2 tenths 3 10 4 10 5 10 6 10 7 10 8 10 9 10 10 10 11 10 12 10 15 10 17 10 21 10 24 10 26 10 32 10
2. 3. 4. 5. 6. 7. 8. 9. 10. 11. 12. 13. 14. 15. 16. 17.
414
18.
0.1
1 tenth
1.
Write each fraction as a decimal.
A
36.
35.
34.
33.
32.
31.
30.
29.
28.
27.
26.
25.
24.
23.
22.
21.
20.
19.
0.04 0.06 0.09 0.10 0.12 0.17 0.21 0.24 0.36 0.48 0.67 1.34 2.21 2.74 3.08 4.30 7.01
4 hundredths 6 100 9 100 10 100 12 100 17 100 21 100 24 100 36 100 48 100 67 100 134 100 221 100 274 100 308 100 430 100 701 100
© Great Minds PBC
0.01
Number Correct:
EUREKA MATH2
1 hundredth
6 ▸ M1 ▸ Sprint ▸ Decimal Notation for Fractions with Denominators of 10 or 100
Decimal Notation for Fractions with Denominators of 10 or 100
6 ▸ M1 EUREKA MATH2
© Great Minds PBC
© Great Minds PBC
0.2 0.1 0.2 0.4 0.5 0.7 0.8 0.9 1.0 1.2 1.4 1.5 1.8 2.3 2.4 2.9 3.5
2 tenths 1 10 2 10 4 10 5 10 7 10 8 10 9 10 10 10 12 10 14 10 15 10 18 10 23 10 24 10 29 10 35 10
2. 3. 4. 5. 6. 7. 8. 9. 10. 11. 12. 13. 14. 15. 16. 17. 18. 416
0.1
1 tenth
1.
Write each fraction as a decimal.
B
36.
35.
34.
33.
32.
31.
30.
29.
28.
27.
26.
25.
24.
23.
22.
21.
20.
19.
Improvement:
Number Correct:
721 100
447 100
311 100
294 100
230 100
125 100
68 100
43 100
39 100
28 100
22 100
20 100
15 100
10 100
8 100
1 100
3 hundredths
1 hundredth
6 ▸ M1 ▸ Sprint ▸ Decimal Notation for Fractions with Denominators of 10 or 100
© Great Minds PBC
7.21
4.47
3.11
2.94
2.30
1.25
0.68
0.43
0.39
0.28
0.22
0.20
0.15
0.10
0.08
0.01
0.03
0.01
EUREKA MATH2
Decimal Notation for Fractions with Denominators of 10 or 100
EUREKA MATH2 6 ▸ M1
545
546 4 6 8 5 5 6 7 8 9 4 3 2 1 2 4 6 8
2 = 5 10 3 = 5 10 4 = 5 10 1 = 2 10 10 = 20 10 12 = 20 10 14 = 20 10 16 = 20 10 18 = 20 10 8 = 20 10 6 = 20 10 6 = 30 10 5 = 50 10 10 = 50 10 20 = 50 10 30 = 50 10 40 = 50 10
2. 3. 4. 5. 6. 7. 8. 9. 10. 11. 12. 13. 14. 15. 16. 17.
418
18.
2
1 = 5 10
1.
Find the unknown numerator.
A
36.
35.
34.
33.
32.
31.
30.
29.
28.
27.
26.
25.
24.
23.
22.
21.
20.
19.
6 ▸ M1 ▸ Sprint ▸ Equivalent Fractions with Denominators of 10 or 100
30 60 80 50 50 25 75 40 60 60 75 90 90 30 60 55 80
3 = 10 100 6 = 10 100 8 = 10 100 5 = 10 100 1 = 2 100 1 = 4 100 3 = 4 100 2 = 5 100 3 = 5 100 12 = 20 100 15 = 20 100 18 = 20 100 36 = 40 100 12 = 40 100 24 = 40 100 22 = 40 100 32 = 40 100
© Great Minds PBC
10
EUREKA MATH2
1 = 10 100
Number Correct:
Equivalent Fractions with Denominators of 10 or 100
6 ▸ M1 EUREKA MATH2
© Great Minds PBC
© Great Minds PBC
5 1 3 4 6 8 10 2 4 6 8 10 1 2 4 6 10
10 = 20 10 2 = 20 10 6 = 20 10 8 = 20 10 12 = 20 10 16 = 20 10 20 = 20 10 6 = 30 10 12 = 30 10 18 = 30 10 24 = 30 10 30 = 30 10 4 = 40 10 8 = 40 10 16 = 40 10 24 = 40 10 40 = 40 10
2. 3. 4. 5. 6. 7. 8. 9. 10. 11. 12. 13. 14. 15. 16. 17. 18. 420
5
1 = 2 10
1.
Find the unknown numerator.
B
36.
35.
34.
33.
32.
31.
30.
29.
28.
27.
26.
25.
24.
23.
22.
21.
20.
19.
6 ▸ M1 ▸ Sprint ▸ Equivalent Fractions with Denominators of 10 or 100
30 = 40 100
24 = 40 100
12 = 40 100
2 = 40 100
28 = 40 100
14 = 20 100
15 = 20 100
8 = 20 100
2 = 5 100
1 = 5 100
2 = 4 100
1 = 4 100
1 = 2 100
5 = 10 100
6 = 10 100
4 = 10 100
2 = 10 100
1 = 10 100
Improvement:
Number Correct:
Equivalent Fractions with Denominators of 10 or 100
© Great Minds PBC
75
60
30
5
70
70
75
40
40
20
50
25
50
50
60
40
20
10
EUREKA MATH2
EUREKA MATH2 6 ▸ M1
547
548 28. 29.
5 10
36.
2
422
´ 5 = 100
10 ´ 18.
35.
2 ´ 10 = 100
5´ 17.
34.
2 = 100
5 ´ 10 ´
14.
16.
33.
2
´ 5 ´ 2 = 100
13.
= 100
32.
10
´ 2 ´ 5 = 100
2´5´
12.
10 ´ 5 ´
31.
10
= 100
5´2´
11.
15.
30.
10
= 100
2´
10.
´ 10 = 100
27.
5
´ 20 = 100
9.
26.
5
= 100
20 ´
8.
25.
20
= 100
5´
7.
24.
2
= 100
50 ´
6.
23.
50
= 100
2´
5.
22.
4
= 100
25 ´
21.
25
4.
20.
10
´ 10 = 100 = 100
19.
10
= 100
4´
10 ´
3.
2.
1.
Find the unknown factor.
A
6 ▸ M1 ▸ Sprint ▸ Factors of 100
Factors of 100
4´5´5=2´
´ 50
´2
= 10 ´ 10
4 ´ 5 ´ 5 = 10 ´
2
5
2
10
5
2
10
25
5
5
2
2
4
4
2
5
5
5
© Great Minds PBC
´5
´ 2 ´ 2 ´ 5 = 100
10 ´ 2 ´ 5 =
25 ´ 2 ´ 2 = 5 ´
5´2´2´
´5 ´2´5´5
5´5´2´2=4´
25 ´ 4 =
´ 10
´ 25 = 100
= 100
´ 2 = 20 ´ 5
10 ´ 10 = 2 ´ 10 ´
= 100 ´ 5 ´ 5 = 100 25 ´ 2 ´ 2´
´ 5 = 100
= 100
= 100
´ 2 ´ 25 = 100 5´5´
4´
4´5´
2 ´ 10 ´
Number Correct:
EUREKA MATH2
6 ▸ M1 EUREKA MATH2
© Great Minds PBC
© Great Minds PBC
23. 24. 25.
10 10 5
= 100 ´ 10 = 100
36.
424
´ 5 = 100
2 18.
10 ´
35.
5 ´ 20 = 100 17.
34.
5 = 100
20 ´ 16.
33.
20 = 100
5´ 15.
32.
2 = 100
5 ´ 10 ´ 14.
31.
2 = 100
10 ´ 5 ´
13.
30.
10 = 100
2´5´
12.
29.
10
´ 5 ´ 2 = 100
10.
= 100
28.
10
´ 2 ´ 5 = 100
9.
5´2´
27.
10
´ 10 = 100
5´
8.
11.
26.
2
´ 10 = 100
2´
7.
6.
10 ´
5.
22.
4
= 100
25 ´
4.
21.
25
= 100
4´
3.
20.
2
= 100
50 ´
2.
19.
= 100
2´
1.
50
Find the unknown factor.
B
6 ▸ M1 ▸ Sprint ▸ Factors of 100
Factors of 100
4´5´
´2
= 10 ´ 10
´2
´5´5
5 ´ 4 ´ 5 = 10 ´
10
2
2
10
5
2
2
10
5
2
2
5
5
5
2
2
4
4
© Great Minds PBC
´ 5 ´ 5 ´ 2 = 100
10 ´ 2 ´ 5 = 50 ´
2 ´ 25 ´ 2 = 5 ´
2´2´5´
25 ´ 4 = 5 ´ 5 ´
4 ´ 25 = 2 ´
´5 = 4 ´ 25 5´4´5=5´2´
10 ´ 2 ´
´ 5 = 100
= 100
= 100
´ 25 = 100 5 ´ 20 = 10 ´
2´
= 100 ´ 2 ´ 25 = 100 2 ´ 10 ´
4´
= 100 ´ 5 ´ 5 = 100
25 ´ 2 ´
5´5´
Improvement:
Number Correct:
EUREKA MATH2
EUREKA MATH2 6 ▸ M1
549
550 28. 29. 30. 31. 32. 33. 34. 35. 36. 37. 38. 39. 40. 41. 42. 43.
100 200 300 900 600 1,200 1 9 8 5 0.5 1 2 3 9 10
cm cm cm cm cm km km km km km m m m m m
cm
1m = 2m = 3m = 9m = 6m = 12 m = 1,000 m = 9,000 m = 8,000 m = 5,000 m = 500 m = 100 cm = 200 cm = 300 cm = 900 cm = 1,000 cm =
6. 7. 8. 9. 10. 11. 12. 13. 14. 15. 16. 17. 18. 19. 20. 21.
426
44.
27.
5,000
m
5 km =
5.
0.1
26.
7,000
m
7 km =
4.
m
25.
3,000
m
3 km =
3.
10 cm =
24.
2,000
m
2 km =
2.
22.
23.
1,000
m
1 km =
1.
Convert each measurement to the given unit.
A
6 ▸ M1 ▸ Sprint ▸ Metric Conversion
Metric Conversion
12.5 m =
125 km =
125 m =
125 cm =
25 cm =
75 cm =
50 cm =
100 cm =
523.4 cm =
510 cm =
515 cm =
500 cm =
7.035 m =
7.03 m =
7.48 m =
7.5 m =
7m =
9.054 km =
6.125 km =
6.35 km =
6.5 km =
6 km =
cm
m
km
m
m
m
m
m
m
m
m
m
cm
cm
cm
cm
cm
m
m
m
m
m
Number Correct:
© Great Minds PBC
1,250
125,000
0.125
1.25
0.25
0.75
0.5
1
5.234
5.1
5.15
5
703.5
703
748
750
700
9,054
6,125
6,350
6,500
6,000
EUREKA MATH2
6 ▸ M1 EUREKA MATH2
© Great Minds PBC
© Great Minds PBC
25. 26. 27. 28. 29. 30. 31. 32. 33. 34. 35. 36. 37. 38. 39. 40. 41. 42. 43. 44.
5,000 8,000 9,000 100 300 700 800 500 1,000 1 6 4 2 0.5 1 3 5 8 12 0.1
m m cm cm cm cm cm cm km km km km km m m m m m
m
5 km = 8 km = 9 km = 1m = 3m = 7m = 8m = 5m = 10 m = 1,000 m = 6,000 m = 4,000 m = 2,000 m = 500 m = 100 cm = 300 cm = 500 cm = 800 cm = 1,200 cm = 10 cm =
3. 4. 5. 6. 7. 8. 9. 10. 11. 12. 13. 14. 15. 16. 17. 18. 19. 20. 21. 22. 428
24.
3,000
m
3 km =
2.
m
23.
1,000
m
1 km =
1.
Convert each measurement to the given unit.
B
6 ▸ M1 ▸ Sprint ▸ Metric Conversion
Metric Conversion
15 m =
150 km =
150 m =
150 cm =
75 cm =
25 cm =
50 cm =
100 cm =
323.4 cm =
310 cm =
315 cm =
300 cm =
9.045 m =
9.04 m =
9.25 m =
9.3 m =
9m =
8.154 km =
4.375 km =
4.25 km =
4.5 km =
4 km =
cm
m
km
m
m
m
m
m
m
m
m
m
cm
cm
cm
cm
cm
m
m
m
m
m
Improvement:
Number Correct:
© Great Minds PBC
1,500
150,000
0.15
1.5
0.75
0.25
0.5
1
3.234
3.1
3.15
3
904.5
904
925
930
900
8,154
4,375
4,250
4,500
4,000
EUREKA MATH2
EUREKA MATH2 6 ▸ M1
551
EUREKA MATH2
6 ▸ M1
Mixed Practice Solutions Expect to see varied solution paths. Accept accurate responses, reasonable explanations, and equivalent answers for all student work.
EUREKA MATH2
Mixed Practice
6 ▸ M1
1
Name
EUREKA MATH2
6 ▸ M1 ▸ Mixed Practice 1
For problems 8 and 9, use the figure to complete the question. The measure of ÐJKM is 170°.
Date
L
For problems 1 and 2, list all the factors of the given number. 1. 12
1, 2, 3, 4, 6, 12 J
e° 46° K
M
2. 40
1, 2, 4, 5, 8, 10, 20, 40
8. Write an equation using e to find the measure of ÐJKL.
170 - 46 = e 3. Evaluate 55 ¸ 5 ´ (40 - 4 + 2).
418
9. What is the measure in degrees of ÐJKL?
124° For problems 4–7, write the value that makes the measurements equivalent. 4. 7 meters =
700
centimeters
5. 4,000 milliliters =
liters
6. 9 kilometers =
9,000
meters
7. 18 kilograms =
18,000
grams
© Great Minds PBC
552
4
395
396
© Great Minds PBC
© Great Minds PBC
EUREKA MATH2 6 ▸ M1
EUREKA MATH2
6 ▸ M1 ▸ Mixed Practice 1
b. How many students report a water height of more than 1 12 inches?
10. For one week, students in Mr. Sharma’s class collect water in rain gauges at home. At the end of the week, each student reports the height of the water in their gauge to the rest of the class. The data are shown in the table. Student
Height of Water (inches)
Jada
23
Kelly
5 8
Toby
6 8
Adesh
13
Eddie
21
Tara
13
Sasha
21
Leo
11 4
Scott
22
Riley
13
1
Six students report a water height of more than 1 2 inches.
c. What is the difference in inches between the greatest water height and the least water height? 1
The difference between the greatest water height and the least water height is 2 8 inches.
4
11. Lacy builds a rectangular prism with the same volume as the prism shown.
4
4
What could be the measurements of Lacy’s rectangular prism?
4
A. The length is 4 units, the width is 3 units, and the height is 3 units.
4
B. The length is 5 units, the width is 1 unit, and the height is 6 units. C. The length is 5 units, the width is 2 units, and the height is 2 units. D. The length is 3 units, the width is 5 units, and the height is 3 units.
8
8
12. Add.
a. Make a line plot to display the data.
0
5 3 8 4
× × 1
1 3
14 18
3
14
2
1
24
13. Match each division expression to its equivalent multiplication expression
× 3
24
2÷ 1
3´4
3÷ 1 4
4´3
4÷1
2´5
5
3
Height (inches)
3
© Great Minds PBC
© Great Minds PBC
3 6 +1 8 10
40
× × ×
× ×
5
6 39
Height of Water in Rain Gauges
× ×
EUREKA MATH2
6 ▸ M1 ▸ Mixed Practice 1
397
398
© Great Minds PBC
553
EUREKA MATH2
6 ▸ M1
EUREKA MATH2
Mixed Practice
6 ▸ M1
2
Name
EUREKA MATH2
6 ▸ M1 ▸ Mixed Practice 2
5. How many lines of symmetry does the given shape have?
Date
A. 1 B. 2
1. Find the quotient and the remainder.
C. 3
429 ¸ 8
D. 4
Quotient: 53 Remainder: 5
6. Plot the points in the coordinate plane. Connect the points in the order that they are given.
(3, 5), (5, 2), (6, 4), (7, 2), (9, 5)
2. Which of the following values are equivalent to 2.306? Choose all that apply.
y
A. Two and three hundred six thousandths 10
B. Two and thirty-six thousandths
9
C. 2 306
8
1,000
( )+( ) E. (2 × 1) + (3 × 1 ) + (6 × 1 ) 10 100 D. (2 × 1) +
3× 1 10
7
6× 1 1,000
6 5
2,306 1,000
4
3. Multiply.
2
F.
3
1
712 ´ 308 219, 296
0
4. Kelly buys a T-shirt for $7.99 and a pair of jeans for $15.50. He gives the clerk $30.00. How much change does Kelly receive?
1
2
3
4
5
6
7
8
9
10
x
7. Use the word bank to complete true statements about quadrilaterals. Do not use any words more than once.
Kelly receives $6.51 in change.
square
rhombus
parallelogram
a. A rectangle and a square are both examples of a b. A
square or rectangle
rectangle
parallelogram or rectangle
.
is always a rectangle.
c. A rectangle or paralleogram or rhombus is not always a square. © Great Minds PBC
554
399
400
© Great Minds PBC
© Great Minds PBC
Works Cited Cajori, Florian. A History of Mathematical Notations, Volume I. London: The Open Court Publishing Company, 1928. https://archive.org/details/historyofmathema031756mbp /page/n331/mode/2up. CAST. Universal Design for Learning Guidelines version 2.2. Retrieved from http://udlguidelines.cast.org, 2018. Common Core Standards Writing Team. 2022. Progressions for the Common Core State Standards for Mathematics, May 24, 2023. Tucson, AZ: Institute for Mathematics and Education, University of Arizona. https://mathematicalmusings.org /wp-content/uploads/2023/05/Progressions.pdf.
National Governors Association Center for Best Practices, Council of Chief State School Officers (NGA Center an CCSSO). Common Core State Standards for Mathematics. Washington, DC: National Governors Association Center for Best Practices, Council of Chief State School Officers, 2010. Zwiers, Jeff, Jack Dieckmann, Sara Rutherford-Quach, Vinci Daro, Renae Skarin, Steven Weiss, and James Malamut. Principles for the Design of Mathematics Curricula: Promoting Language and Content Development. Retrieved from Stanford University, UL/SCALE website: https://ul.stanford.edu/resources/principles-design -mathematics-curricula-and-mlrs, 2017.
The Guinness Book of World Records. “Most Canned Drinks Opened by a Parrot in One Minute.” Stamford, CT: Guinness Media, 1997. https://www.guinnessworldrecords.com/world -records/106300-most-canned-drinks-opened-by-a -parrot-in-one-minute.
© Great Minds PBC
555
Credits Great Minds® has made every effort to obtain permission for the reprinting of all copyrighted material. If any owner of copyrighted material is not acknowledged herein, please contact Great Minds for proper acknowledgment in all future editions and reprints of this module. For a complete list of credits, visit http://eurmath.link /media-credits. Cover, Gustave Caillebotte (1848–1894). Paris Street; Rainy Day, 1877 Oil on canvas, 212.2 x 276.2 cm (83 1/2 x 108 3/4 in.). Charles H. and Mary F. S. Worcester Collection. (1964.336). The Art Institute of Chicago, Chicago, IL, U.S.A. Photo Credit: The Art Institute of Chicago/Art Resource, NY; page 20,
556
21 (left) Duplass/Shutterstock.com; pages 21 (right), 111, Alena_D/Shutterstock.com; pages 47, 52, Cherstva/Shutterstock .com; page 322 (left), stockphoto-graf/Shutterstock.com, (right), Petr Kostal/Shutterstock.com; page 445, Eduardo Estellez /Shutterstock.com; page 448, Georgejmclittle/Shutterstock.com; page 532, “The Roman Empire under Augustus Caesar before the Pannonian revolt (AD 6-9) and before the battle of the Teutoburg Forest (9 AD),” by Christiano64, courtesy Wikimedia Commons, is licensed under the Creative Commons Attribution-ShareAlike 3.0 Unported license (CC BY-SA 3.0), https://creativecommons .org/licenses/by-sa/3.0/deed.en; All other images are the property of Great Minds.
© Great Minds PBC
Acknowledgments Agnes P. Bannigan, Erik Brandon, Joseph T. Brennan, Beth Brown, Amanda H. Carter, Mary Christensen-Cooper, David Choukalas, Cheri DeBusk, Jill Diniz, Mary Drayer, Dane Ehlert, Scott Farrar, Kelli Ferko, Levi Fletcher, Krysta Gibbs, Winnie Gilbert, Julie Grove, Marvin E. Harrell, Stefanie Hassan, Robert Hollister, Rachel Hylton, Travis Jones, Raena King, Emily Koesters, Liz Krisher, Robin Kubasiak, Connie Laughlin, Alonso Llerena, Gabrielle Mathiesen, Maureen McNamara Jones, Bruce Myers, Marya Myers, Kati O’Neill, Ben Orlin, Darion Pack, Brian Petras, DesLey V. Plaisance, Lora Podgorny, Janae Pritchett, Bonnie Sanders, Deborah Schluben, Andrew Senkowski, Erika Silva, Ashley Spencer, Hester Sofranko, Danielle Stantoznik, Tara Stewart, Heidi Strate, James Tanton, Jessica Vialva, Carla Van Winkle, Caroline Yang
Sandy Engelman, Tamara Estrada, Soudea Forbes, Jen Forbus, Reba Frederics, Liz Gabbard, Diana Ghazzawi, Lisa Giddens-White, Laurie Gonsoulin, Nathan Hall, Cassie Hart, Marcela Hernandez, Rachel Hirsh, Abbi Hoerst, Libby Howard, Amy Kanjuka, Ashley Kelley, Lisa King, Sarah Kopec, Drew Krepp, Crystal Love, Maya Márquez, Siena Mazero, Cindy Medici, Ivonne Mercado, Sandra Mercado, Brian Methe, Patricia Mickelberry, Mary-Lise Nazaire, Corinne Newbegin, Max Oosterbaan, Tamara Otto, Christine Palmtag, Andy Peterson, Lizette Porras, Karen Rollhauser, Neela Roy, Gina Schenck, Amy Schoon, Aaron Shields, Leigh Sterten, Mary Sudul, Lisa Sweeney, Samuel Weyand, Dave White, Charmaine Whitman, Nicole Williams, Glenda Wisenburn-Burke, Howard Yaffe
Trevor Barnes, Brianna Bemel, Adam Cardais, Christina Cooper, Natasha Curtis, Jessica Dahl, Brandon Dawley, Delsena Draper,
© Great Minds PBC
557
Exponentially Better Knowledge2 In our tradition of supporting teachers with everything they need to build student knowledge of mathematics deeply and coherently, Eureka Math2 provides tailored collections of videos and recommendations to serve new and experienced teachers alike.
Module 2 Operations with Fractions and Multi-Digit Numbers
Digital2 With a seamlessly integrated digital experience, Eureka Math2 includes hundreds of clever illustrations, compelling videos, and digital interactives to spark discourse and wonder in your classroom.
Module 3 Rational Numbers
Accessible2 Created with all readers in mind, Eureka Math2 has been carefully designed to ensure struggling readers can access lessons, word problems, and more.
Module 5 Area, Surface Area, and Volume
Joy2 Together with your students, you will fall in love with math all over again—or for the first time—with Eureka Math2. What does this painting have to do with math? An intersection in Paris on a gray, rainy day is the subject of this atmospheric Impressionist painting. Gustave Caillebotte creates depth in this scene by using perspective and proportion in a variety of ways, including by placing large figures in the foreground and smaller ones in the distance. Imagine there is a coordinate grid on the building in the background. How might you determine the distance from the front of the building to the back by using the coordinate plane? On the cover Paris Street; Rainy Day, 1877 Gustave Caillebotte, French, 1848–1894 Oil on canvas The Art Institute of Chicago, Chicago, IL, USA Gustave Caillebotte (1848–1894). Paris Street; Rainy Day, 1877. Oil on canvas, 212.2 x 276.2 cm (83½ x 108¾ in). Charles H. and Mary F. S. Worcester Collection (1964.336). The Art Institute of Chicago, Chicago, IL, USA. Photo Credit: The Art Institute of Chicago/Art Resource, NY
ISBN 978-1-64497-185-7
9
Module 1 Ratios, Rates, and Percents
781644 971857
C
Module 4 Expressions and One-Step Equations
Module 6 Statistics