ALGEBRA I
A Story of Functions®
Modeling with Functions TEACH ▸ Expressions, Equations, and Inequalities in One Variable
Module 1
Teacher Edition: Grade A1, Module 1, Cover
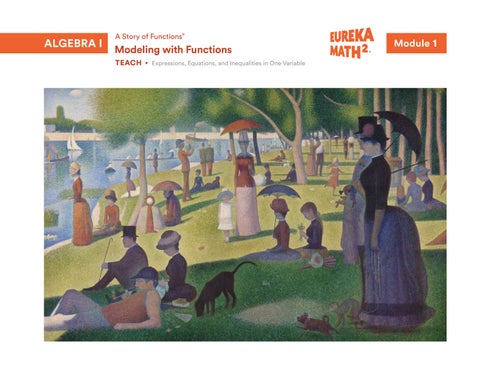
What does this painting have to do with math? A Sunday on La Grande Jatte is considered Georges Seurat’s greatest work. Even though this painting is made entirely out of small dabs of paint, our eyes mix the colors together through optical blending. To achieve this effect, Georges Seurat had to be very precise with his colors and dot placement. This methodical technique is similar to a practice you will need as you graph equations and inequalities in two variables. On the cover A Sunday on La Grande Jatte—1884, 1884–1886 Georges Seurat, French, 1859–1891 Oil on canvas Art Institute of Chicago, Chicago, IL, USA Georges Seurat (1859–1891), A Sunday on La Grande Jatte—1884, 1884/86. Oil on canvas, 81 3/4 x 121 1/4 in (207.5 x 308.1 cm). Helen Birch Bartlett Memorial Collection, 1926.224. The Art Institute of Chicago, Chicago, USA. Photo Credit: The Art Institute of Chicago/Art Resource, NY
Student Edition: Grade A1, Module 1, Copyright
Great Minds® is the creator of Eureka Math®, Wit & Wisdom®, Alexandria Plan™, and PhD Science®. Published by Great Minds PBC. greatminds.org © 2021 Great Minds PBC. All rights reserved. No part of this work may be reproduced or used in any form or by any means—graphic, electronic, or mechanical, including photocopying or information storage and retrieval systems—without written permission from the copyright holder. Where expressly indicated, teachers may copy pages solely for use by students in their classrooms. Printed in the USA C-Print 1 2 3 4 5 6 7 8 9 10 XXX 25 24 23 22 21 ISBN 978-1-64497-203-8
Teacher Edition: Grade A1, Module 1, Title
A Story of Functions®
Modeling with Functions ▸ ALGEBRA I TEACH Module
1 2 3 4 5 6
Expressions, Equations, and Inequalities in One Variable
Equations and Inequalities in Two Variables
Functions and Their Representations
Quadratic Functions
Linear and Exponential Functions
Modeling with Functions
Teacher Edition: Grade A1, Module 1, Module Overview Before This Module
Overview
Grade 8 Module 4
Expressions, Equations, and Inequalities in One Variable
Students informally apply the commutative, associative, and distributive properties and the addition and multiplication properties of equality to solve multi-step linear equations in one variable.
Grade 6 Module 6 Grade 7 Module 6 Students represent univariate data with dot plots, histograms, and box plots. They analyze the center and spread of a distribution by using the mean, median, range, mean absolute deviation, and interquartile range. They use shape, center, and spread to compare data sets.
Topic A Adding, Subtracting, and Multiplying Polynomial Expressions Students use operations and the properties of arithmetic to generate equivalent expressions and to demonstrate the equivalence of algebraic expressions. Students identify polynomial expressions and classify them based on characteristics such as number of terms and degree. They also leverage the similar arithmetic structure between integers and polynomial expressions to add, subtract, and multiply polynomial expressions.
563 = 5 ⋅ 102 + 6 ⋅ 10 + 3 251 = 2 ⋅ 102 + 5 ⋅ 10 + 1 563 − 251 = (5 ⋅ 102 + 6 ⋅ 10 + 3) − (2 ⋅ 102 + 5 ⋅ 10 + 1) 5x2 + 6 x + 3 = 5 ⋅ x2 + 6 ⋅ x + 3 2 x2 + 5 x + 1 = 2 ⋅ x2 + 5 ⋅ x + 1 (5 x 2 + 6 x + 3) − (2 x 2 + 5 x + 1) = (5 ⋅ x 2 + 6 ⋅ x + 3) − (2 ⋅ x 2 + 5 ⋅ x + 1)
2
© Great Minds PBC
EUREKA MATH2 A1 ▸ M1
Topic B Solving Equations and Inequalities in One Variable Students use operations and the properties of arithmetic, equations, and inequalities to find solution sets for linear equations and inequalities in one variable. They represent the solution sets by using set notation and set-builder notation and by using graphs on the number line. Students apply the properties and operations in new situations, including rearranging formulas, solving equations with variable coefficients, and creating equations or inequalities to model contexts.
−6 b + 2 − 2 b < 10 {b | b > −1} b
–10 –8 –6 –4 –2
0
2
4
6
8
10
Topic C Compound Statements Involving Equations and Inequalities in One Variable Students determine the solution sets of compound statements involving any combination of two equations or inequalities joined by and or or. Students rewrite absolute value equations and inequalities as compound statements and represent the solution sets by using set notation and as graphs on the number line.
0 ≤ 4 x − 3 ≤ 11 4 x − 3 ≥ 0 and 4 x − 3 ≤ 11 x ≥ 3 and x ≤ 7
{x
4 2 7 3 ≤ x ≤ 4 2
}
x
0
© Great Minds PBC
1
2
3
4
5
3
EUREKA MATH2
A1 ▸ M1
Topic D
After This Module
Univariate Data Students represent univariate data distributions with dot plots, histograms, and box plots. They use graphical displays and statistics to compare two or more data distributions based on shape, center, and spread, and they interpret the results within the context of the data. Students also analyze how outliers affect the measures of center and spread for data distributions. Maximum Speeds of Roller Coasters
Algebra I Module 2 Students build on their understanding of solving equations and inequalities and analyzing data in one variable to explore similar topics in two variables. They represent solution sets to equations, inequalities, and systems of equations and inequalities in two variables. Additionally, they analyze bivariate data distributions.
Wooden Steel
0
10
20
30
40
50
60
70
80
90
100
110
120
130
Speed (miles per hour)
4
© Great Minds PBC
Contents Expressions, Equations, and Inequalities in One Variable Why. . . . . . . . . . . . . . . . . . . . . . . . . . . . . . . . . . . . . . . . . . . . . . . . . . . . . .
8
Achievement Descriptors: Overview. . . . . . . . . . . . . . . . . . . . 10 Topic A . . . . . . . . . . . . . . . . . . . . . . . . . . . . . . . . . . . . . . . . . . . . . . . . . . 14 Adding, Subtracting, and Multiplying Polynomial Expressions Lesson 1 . . . . . . . . . . . . . . . . . . . . . . . . . . . . . . . . . . . . . . . . . . . . . . . . . . . 18 The Growing Pattern of Ducks • Compare verbal and mathematical representations of a visual pattern.
Lesson 2. . . . . . . . . . . . . . . . . . . . . . . . . . . . . . . . . . . . . . . . . . . . . . . . . . . 36 The Commutative, Associative, and Distributive Properties • Rewrite algebraic expressions in equivalent form. • Show the equivalency of two algebraic expressions by using properties and operations.
Lesson 3. . . . . . . . . . . . . . . . . . . . . . . . . . . . . . . . . . . . . . . . . . . . . . . . . . . 58 Polynomial Expressions
Topic B. . . . . . . . . . . . . . . . . . . . . . . . . . . . . . . . . . . . . . . . . . . . . . . . . . . 130 Solving Equations and Inequalities in One Variable Lesson 7. . . . . . . . . . . . . . . . . . . . . . . . . . . . . . . . . . . . . . . . . . . . . . . . . . . 134 Printing Presses • Investigate a problem that can be solved by reasoning quantitatively or algebraically.
Lesson 8. . . . . . . . . . . . . . . . . . . . . . . . . . . . . . . . . . . . . . . . . . . . . . . . . . . 152 Solution Sets for Equations and Inequalities in One Variable • Find values to assign to the variables in equations or inequalities that make the statements true. • Describe a solution set in words, in set notation, and on a graph.
Lesson 9. . . . . . . . . . . . . . . . . . . . . . . . . . . . . . . . . . . . . . . . . . . . . . . . . . . 180 Solving Linear Equations in One Variable • Explain each step in solving a linear equation.
Lesson 10. . . . . . . . . . . . . . . . . . . . . . . . . . . . . . . . . . . . . . . . . . . . . . . . . . 198 Some Potential Dangers When Solving Equations (Optional)
• Compare numbers in base 10 to numbers in base x.
• Explore steps in solving an equation that are not guaranteed to preserve the solution set.
Lesson 4. . . . . . . . . . . . . . . . . . . . . . . . . . . . . . . . . . . . . . . . . . . . . . . . . . . 74
Lesson 11. . . . . . . . . . . . . . . . . . . . . . . . . . . . . . . . . . . . . . . . . . . . . . . . . . 214
Adding and Subtracting Polynomial Expressions • Add and subtract polynomial expressions.
Lesson 5. . . . . . . . . . . . . . . . . . . . . . . . . . . . . . . . . . . . . . . . . . . . . . . . . . . 92 Multiplying Polynomial Expressions • Multiply polynomial expressions.
Lesson 6. . . . . . . . . . . . . . . . . . . . . . . . . . . . . . . . . . . . . . . . . . . . . . . . . . . 112 Polynomial Identities • Multiply polynomial expressions to establish polynomial identities.
© Great Minds PBC
Writing and Solving Equations in One Variable • Create equations in one variable and use them to solve problems.
Lesson 12 . . . . . . . . . . . . . . . . . . . . . . . . . . . . . . . . . . . . . . . . . . . . . . . . . . 228 Rearranging Formulas • Rearrange formulas to highlight a quantity of interest.
Lesson 13 . . . . . . . . . . . . . . . . . . . . . . . . . . . . . . . . . . . . . . . . . . . . . . . . . . 244 Solving Linear Inequalities in One Variable • Solve inequalities and graph the solution sets on the number line.
5
EUREKA MATH2
A1 ▸ M1
Topic C . . . . . . . . . . . . . . . . . . . . . . . . . . . . . . . . . . . . . . . . . . . . . . . . . . 264 Compound Statements Involving Equations and Inequalities in One Variable Lesson 14. . . . . . . . . . . . . . . . . . . . . . . . . . . . . . . . . . . . . . . . . . . . . . . . . . 268 Solution Sets of Compound Statements • Describe the solution set of two equations or inequalities joined by and or or and graph the solution set on a number line. • Write a compound statement to describe a situation.
Lesson 15 . . . . . . . . . . . . . . . . . . . . . . . . . . . . . . . . . . . . . . . . . . . . . . . . . . 288
Lesson 19. . . . . . . . . . . . . . . . . . . . . . . . . . . . . . . . . . . . . . . . . . . . . . . . . . 370 Describing the Center of a Distribution • Find the mean and median of data shown in a dot plot and estimate the mean and median of a data distribution represented by a histogram. • Identify whether the mean and/or the median appropriately describes a typical value for a given data set.
Lesson 20. . . . . . . . . . . . . . . . . . . . . . . . . . . . . . . . . . . . . . . . . . . . . . . . . . 396 Using Center to Compare Data Distributions • Determine the median from data distributions displayed in box plots. • Use the median to compare data distributions displayed in box plots.
Solving and Graphing Compound Inequalities
Lesson 21 . . . . . . . . . . . . . . . . . . . . . . . . . . . . . . . . . . . . . . . . . . . . . . . . . . 414
• Find the solution sets of compound inequalities in one variable and graph the solution sets on the number line.
Describing Variability in a Univariate Distribution with Standard Deviation
Solving Absolute Value Equations
• Calculate standard deviation to represent a typical variation from the mean of a data distribution. • Use standard deviation to compare two data distributions.
• Write absolute value equations in one variable as compound statements and solve.
Lesson 22. . . . . . . . . . . . . . . . . . . . . . . . . . . . . . . . . . . . . . . . . . . . . . . . . . 436
Lesson 16. . . . . . . . . . . . . . . . . . . . . . . . . . . . . . . . . . . . . . . . . . . . . . . . . . 308
Lesson 17 . . . . . . . . . . . . . . . . . . . . . . . . . . . . . . . . . . . . . . . . . . . . . . . . . . 326 Solving Absolute Value Inequalities • Write absolute value inequalities in one variable as compound statements joined by and or or. • Solve absolute value inequalities and graph the solution set on a number line.
Topic D . . . . . . . . . . . . . . . . . . . . . . . . . . . . . . . . . . . . . . . . . . . . . . . . . . 348 Univariate Data
Estimating Variability in Data Distributions • Estimate and compare variation in data distributions represented by histograms. • Use the interquartile range to compare the variation in data distributions represented by box plots and dot plots.
Lesson 23. . . . . . . . . . . . . . . . . . . . . . . . . . . . . . . . . . . . . . . . . . . . . . . . . . 460 Comparing Distributions of Univariate Data • Compare two or more data sets by using shape, center, and variability. • Interpret differences in data distributions in context.
Lesson 18. . . . . . . . . . . . . . . . . . . . . . . . . . . . . . . . . . . . . . . . . . . . . . . . . . 352 Distributions and Their Shapes • Informally describe a data distribution displayed in a dot plot.
6
© Great Minds PBC
EUREKA MATH2 A1 ▸ M1
Resources Standards. . . . . . . . . . . . . . . . . . . . . . . . . . . . . . . . . . . . . . . . . . . . . . . . . . 486 Achievement Descriptors: Proficiency Indicators. . . . . . . . . . . . . . . . 488 Terminology. . . . . . . . . . . . . . . . . . . . . . . . . . . . . . . . . . . . . . . . . . . . . . . . 498 Math Past. . . . . . . . . . . . . . . . . . . . . . . . . . . . . . . . . . . . . . . . . . . . . . . . . . 502 Materials . . . . . . . . . . . . . . . . . . . . . . . . . . . . . . . . . . . . . . . . . . . . . . . . . . 504 Fluency. . . . . . . . . . . . . . . . . . . . . . . . . . . . . . . . . . . . . . . . . . . . . . . . . . . . 506 Mixed Practice Solutions. . . . . . . . . . . . . . . . . . . . . . . . . . . . . . . . . . . . . 528 Works Cited. . . . . . . . . . . . . . . . . . . . . . . . . . . . . . . . . . . . . . . . . . . . . . . 534 Credits. . . . . . . . . . . . . . . . . . . . . . . . . . . . . . . . . . . . . . . . . . . . . . . . . . . . 535 Acknowledgments. . . . . . . . . . . . . . . . . . . . . . . . . . . . . . . . . . . . . . . . . . 536
© Great Minds PBC
7
Why Expressions, Equations, and Inequalities in One Variable Why do you open the Algebra I course with a module focused on polynomial expressions and solving linear equations? Beginning the year with a focus on using properties to generate equivalent algebraic expressions prepares students to solve linear equations in one variable, which in turn prepares students to solve equations in two variables in module 2. This approach lays a foundation for studying functions in module 3, where students represent and evaluate functions both algebraically and graphically.
Why do you use set-builder notation in this module for some solution sets and set notation for others? Set-builder notation is needed to accurately represent the solution set of inequalities without using a graph. While students may choose to represent the solution sets to equations with a finite number of solutions by using set-builder notation, using set notation may feel more accessible for students while still accurately representing the solution sets. The same reasoning applies to representing the solution sets for all real solutions and no solutions by using the symbols ℝ and {}, respectively.
Why is lesson 10 optional? While the focus of topic B is on applying the properties of operations and equality to solve linear equations in one variable, students often try to apply additional rules when solving equations. Lesson 10 provides an opportunity for students to explore how some of these rules, like dividing by variables, do not preserve the solution sets of equations. Some of the equations addressed in this lesson are nonlinear and students identify actions that are not guaranteed to preserve solution sets. For this reason, the lesson is optional, but it is recommended.
8
© Great Minds PBC
EUREKA MATH2 A1 ▸ M1
Why did you include absolute value equations and inequalities in this module? Solving absolute value equations and inequalities connects to solving compound inequalities, as they can be rewritten as simple statements connected by and or or. Solving absolute value equations in one variable builds upon students’ understanding of absolute value from previous grades, and it lays a foundation for the study of absolute value functions, which are introduced in module 3.
Why is univariate statistics included in this module? Because the focus of module 1 is on expressions, equations, and compound statements in one variable, it is appropriate to conclude the module with a study of data collected on a single variable. While univariate data analysis and bivariate data analysis are often taught in succession, it is not necessary. Separating the topics allows us to better incorporate statistics into a blended Algebra I curriculum, rather than treating it as a separate entity.
© Great Minds PBC
9
Teacher Edition: Grade A1, Module 1, Achievement Descriptors: Overview
Achievement Descriptors: Overview Expressions, Equations, and Inequalities in One Variable Achievement Descriptors (ADs) are standards-aligned descriptions that detail what students should know and be able to do based on the instruction. ADs are written by using portions of various standards to form a clear, concise description of the work covered in each module. Each module has its own set of ADs, and the number of ADs varies by module. Taken together, the sets of module-level ADs describe what students should accomplish by the end of the year. ADs and their proficiency indicators support teachers with interpreting student work on • informal classroom observations, • data from other lesson-embedded formative assessments, • Exit Tickets, • Topic Quizzes, and • Module Assessments. This module contains the 13 ADs listed.
A1.Mod1.AD1 Use the structure of a polynomial expression
to identify ways to rewrite it.
A1.Mod1.AD2 Identify polynomial expressions and explain
why they are closed under the operations of addition, subtraction, and multiplication. A.APR.A.1 A1.Mod1.AD3 Add and subtract polynomial
expressions.
A.APR.A.1
A1.Mod1.AD4 Multiply polynomial expressions.
A.APR.A.1
A1.Mod1.AD5 Identify and explain steps required to
solve linear equations in one variable and justify solution methods. A.REI.A.1 A1.Mod1.AD6 Solve linear equations and inequalities in
one variable.
A.REI.B.3
A1.Mod1.AD7 Create equations and inequalities in one
variable and use them to solve problems.
10
A.SSE.A.2
A.CED.A.1
© Great Minds PBC
EUREKA MATH2 A1 ▸ M1
A1.Mod1.AD8 Represent constraints by using equations
and inequalities.
A.CED.A.3
A1.Mod1.AD9 Interpret solutions to equations and
inequalities in one variable as viable or nonviable options in a modeling context. A.CED.A.3 A1.Mod1.AD10 Rearrange formulas to highlight a quantity
of interest.
A.CED.A.4
A1.Mod1.AD11 Represent data with dot plots, histograms,
or box plots.
S.ID.A.1
A1.Mod1.AD12 Summarize and compare data by shape,
center, and spread outside of context.
S.ID.A.2
A1.Mod1.AD13 Interpret differences in data in the context
of the data sets.
S.ID.A.3
The first page of each lesson identifies the ADs aligned with that lesson. Each AD may have up to three indicators, each aligned to a proficiency category (i.e., Partially Proficient, Proficient, Highly Proficient). While every AD has an indicator to describe Proficient performance, only select ADs have an indicator for Partially Proficient and/or Highly Proficient performance. An example of one of these ADs, along with its proficiency indicators, is shown here for reference. The complete set of this module’s ADs with proficiency indicators can be found in the Achievement Descriptors: Proficiency Indicators resource. ADs have the following parts: • AD Code: The code indicates the grade level and the module number and then lists the ADs in no particular order. For example, the first AD for Algebra I module 1 is coded as A1.Mod1.AD1. • AD Language: The language is crafted from standards and concisely describes what will be assessed. • AD Indicators: The indicators describe the precise expectations of the AD for the given proficiency category. • Related Standard: This identifies the standard or parts of standards from the Common Core State Standards that the AD addresses.
© Great Minds PBC
11
EUREKA MATH2
A1 ▸ M1
AD Language
AD Code: Grade.Module.AD# EUREKA MATH2
A1 ▸ M1
A1.Mod1.AD6 Solve linear equations and inequalities in one variable.
Related CCSS Standard RELATED CCSSM
A.REI.B.3 Solve linear equations and inequalities in one variable, including equations with coefficients represented by letters.
Partially Proficient Solve linear equations in one variable with numerical coefficients.
Solve compound equations or inequalities in one variable. Find the solution set of the compound equation.
Solve the equation −10(x − 3) = 4x + 16.
Solve for x in the equation x(c − 12) = −3x + d. Solve linear inequalities in one variable by using the multiplication property of inequality.
Find the solution set of the inequality.
Find the solution set of the inequality.
© Great Minds PBC
Highly Proficient
Solve linear equations in one variable with coefficients represented as letters.
Solve linear inequalities in one variable by using the addition property of inequality.
x+7≤8
12
Proficient
AD Indicators
1 x − 4 = −7 or 4x − 3 = 9 2
3 − 6x < −15
491
© Great Minds PBC
Teacher Edition: Grade A1, Module 1, Topic A
Topic A Adding, Subtracting, and Multiplying Polynomial Expressions Beginning in the elementary grades, students learn to perform mathematical operations on numbers. They progress through the real number system by working with whole numbers and then fractions, decimals, integers, rational numbers, and irrational numbers. Topic A introduces students to operations with polynomial expressions, leveraging the structural similarities between whole numbers written by using base 10 and expressions written by using base x. Students are encouraged throughout the topic to consider how polynomial expressions are similar to and different from numbers. Students begin the topic by analyzing a pattern in successive figures and using repeated reasoning to write a general expression that could be used to determine the number of objects in any figure in the pattern. Students are encouraged to write their general expressions based on how they see the pattern. This lesson allows students to generate different expressions that represent the same pattern. This variation leads to the question “How do we know these expressions represent the same value?” Students then formalize the definition of equivalent expressions. They identify properties and operations that can be applied to rewrite expressions and use them to verify whether two expressions are equivalent.
14
© Great Minds PBC
EUREKA MATH2 A1 ▸ M1 ▸ TA Figure 1
Figure 2
Figure 3
General 6x + 10x(2x – 3) expression for nth figure: n(n + 2) + n(1) + 1
1(1 + 2) + 1 + 1
distributive property 6x + 20x2 – 30x
2(2 + 2) + 2 + 1 3(3 + 2) + 3 + 1 Figure 1
Figure 2
commutative property of addition
Figure 3
6x – 30x + 20x2 General expression for nth figure: (n + 1)2 + n
addition of like terms –24x + 20x2
22 + 1 32 + 2
commutative property of addition 42 + 3
20x2 – 24x
Students learn a recursive definition of a polynomial expression. The recursive definition provides formality and builds on the recursive definition of an expression. Students can use the definition of a polynomial expression to distinguish between polynomial expressions and non-polynomial expressions. Students then compare the structural similarities between numbers written in expanded form and polynomial expressions. They discover that they can transfer concepts like addition and subtraction to polynomial expressions. They also apply
© Great Minds PBC
15
EUREKA MATH2
A1 ▸ M1 ▸ TA
the definition of a polynomial expression to verify that polynomial expressions are closed under addition and subtraction.
125 = 1 ⋅ 102 + 2 ⋅ 101 + 5
x 2 + 2 x + 5 = 1 ⋅ x 2 + 2 ⋅ x1 + 5
432 = 4 ⋅ 102 + 3 ⋅ 101 + 2
4 x 2 + 3 x + 2 = 4 ⋅ x 2 + 3 ⋅ x1 + 2 x 2 + 2 x + 5 + 4 x 2 + 3 x + 2 = (1 + 4) ⋅ x 2 + (2 + 3) ⋅ x1 + (5 + 2)
125 + 432 = (1 + 4) ⋅ 102 + (2 + 3) ⋅ 101 + (5 + 2)
Students transition from adding and subtracting polynomial expressions to multiplying polynomial expressions. Students first multiply polynomial expressions by using a tabular model, a structural analog of the area model used for multiplying multi-digit whole numbers and a visual representation of the distributive property. Students develop and apply the identities (a + b)2 = a2 + 2ab + b2 and (a + b)(a − b) = a2 − b2 for expressions a and b. Students also verify that polynomial expressions are closed under multiplication and are not closed under division.
200 130
20
7
200
70
10
60
21
3
21 (20 + 7)(10 + 3) = 351
2x2 13x
2x
7
2x2
7x
x
6x
21
3
21 (2x + 7)(x + 3) = 2x2 + 13x + 21
In module 1 topic B, students apply their work with polynomial expressions to write and find the solution set to one-variable equations and inequalities composed of polynomial expressions.
16
© Great Minds PBC
EUREKA MATH2 A1 ▸ M1 ▸ TA
Progression of Lessons Lesson 1
The Growing Pattern of Ducks
Lesson 2
The Commutative, Associative, and Distributive Properties
Lesson 3
Polynomial Expressions
Lesson 4
Adding and Subtracting Polynomial Expressions
Lesson 5
Multiplying Polynomial Expressions
Lesson 6
Polynomial Identities
© Great Minds PBC
17
1
Teacher Edition: Grade A1, Module 1, Topic A, Lesson 1 LESSON 1
The Growing Pattern of Ducks Compare verbal and mathematical representations of a visual pattern.
EUREKA MATH2
A1 ▸ M1 ▸ TA ▸ Lesson 1
EXIT TICKET
Student Edition: Grade A1, Module 1, Topic A, Lesson 1 Name
Date
1
Examine the pattern of socks.
Figure 1
Figure 2
Lesson at a Glance Students work in groups to examine a visual pattern of ducks. They describe each figure in the pattern verbally and with numerical expressions. Students look for structure in their numerical expressions to find a general expression that represents the number of ducks in any given figure. They compare their work with that of other students and seek to determine whether their expressions are equivalent.
Key Questions
Figure 3
• Can different expressions represent the same value? How?
1. If the pattern continues, how many socks will be in figure 4? In figure 10? In figure 100? There will be 29 socks in figure 4. There will be 131 socks in figure 10. There will be 10,301 socks in figure 100.
• How do we know whether two expressions represent the same value?
Achievement Descriptor A1.Mod1.AD1 Use the structure of a polynomial expression to identify
ways to rewrite it. (A.SSE.A.2)
2. Describe how to find the number of socks given any figure number. Sample: Each figure forms a rectangle with 1 sock missing. The length of the rectangle is 1 more than the figure number, and the width is 2 more than the figure number. So I can represent the number of socks in any figure as (n + 1)(n + 2) − 1, where n is the figure number.
© Great Minds PBC
11
© Great Minds PBC
EUREKA MATH2 A1 ▸ M1 ▸ TA ▸ Lesson 1
Agenda
Materials
Fluency
Teacher
Launch 10 min
• Computer with internet access*
Learn 25 min • How Do They Grow? • Representation Presentation
Land 10 min
• Projection device* • Teach book*
Students • Paper or notebook* • Pencil* • Scientific calculator* • Learn book*
Lesson Preparation • None *These materials are only listed in lesson 1. Ready these materials for every lesson in this module.
© Great Minds PBC
19
EUREKA MATH2
A1 ▸ M1 ▸ TA ▸ Lesson 1
Fluency
Teacher Note
Represent the Area of a Rectangle Students represent the area of a rectangle to prepare for creating verbal and mathematical representations of visual patterns. Directions: Write an expression to represent the area in square units of the rectangle with the given length and width.
20
Fluency activities are short sets of sequenced practice problems that students work on in the first 3–5 minutes of class. Administer a fluency activity as a bell ringer, or adapt the activity as a teacher-led Whiteboard Exchange or choral response. Directions for administration can be found in the Fluency resource.
1.
Length: 5 Width: 5
25
2.
Length: 8 Width: 6
48
3.
Length: 3 Width: x
3x
Teacher Note
4.
Length: x Width: 10
10x
5.
Length: x Width: x
x2
6.
Length: x Width: y
xy
Students may need to be reminded that an expression does not need an operation symbol. It can also be a single number or a variable symbol. So an expression to represent the area for the first problem could be 5 ⋅ 5, or 25.
© Great Minds PBC
EUREKA MATH2 A1 ▸ M1 ▸ TA ▸ Lesson 1
Launch
Language Support
10
Students examine a visual pattern and describe how it grows. Present problem 1 to students, and have students think–pair–share about how they see the arrangement of ducks in each figure. Give students 2 minutes of think time to examine the pattern and describe the arrangement of ducks in each figure. Invite students to draw on the figures to help show their thinking. 1. Examine the pattern of ducks. Figure 1
© Great Minds PBC
Consider using strategic, flexible grouping throughout the module, based on students’ mathematical and English language proficiency. Grouping suggestions follow: • Pair students who have different levels of mathematical proficiency. • Pair students who have different levels of English language proficiency. • Join two pairs to form small groups of four.
Figure 2
Figure 3
As applicable, complement any of these groupings by pairing students who speak the same native language.
21
A1 ▸ M1 ▸ TA ▸ Lesson 1
EUREKA MATH2
a. Describe the arrangement of ducks in figure 1. There are 3 rows of ducks. The first 2 rows each have 2 ducks. The third row has 1 duck. b. Describe the arrangement of ducks in figure 2. There are 4 rows of ducks. The first 3 rows each have 3 ducks. The fourth row has 2 ducks. c. How is the arrangement of ducks in figure 2 similar to the arrangement of ducks in figure 1? How is it different? Figure 2 is similar to figure 1 because the last row has 1 fewer duck than the other rows. Figure 2 is different from figure 1 because there is 1 more row, and each row has 1 more duck. d. Describe the arrangement of ducks in figure 3. There are 5 rows of ducks. There are 4 rows each with 4 ducks. The fifth row has 3 ducks. e. How is the arrangement of ducks in figure 3 similar to the arrangement of ducks in figure 2? How is it different? Figure 3 is similar to figure 2 because the last row has 1 fewer duck than the other rows. Figure 3 is different from figure 2 because there is 1 more row, and each row has 1 more duck. Have students discuss their thinking with a partner. Circulate as students work, and listen for students’ descriptions as they talk. Identify a few students to share their descriptions with the class. Intentionally choose a variety of descriptions to present to the class. As students share their thinking with the class, record their descriptions and representations in a place where all students can view them. After students share, ask them to consider whether these different descriptions describe the arrangement of ducks in the same way. Keep this discussion brief because this question will be revisited later in the lesson. Today, we will create and compare representations of this pattern.
22
© Great Minds PBC
EUREKA MATH2 A1 ▸ M1 ▸ TA ▸ Lesson 1
Learn
UDL: Action & Expression
25
How Do They Grow? Students create expressions and visual or verbal representations to describe a pattern. Create groups of three or four students based on who saw the arrangement of ducks in a similar way.
Consider providing grid paper so students can recreate the patterns and draw on, highlight, and partition the figures. This supports students in recognizing the arrangement of rectangles within each figure and the changes between figures.
Direct students to problem 2. Tell students that they should agree on a common description of the arrangement of ducks before moving to problem 3. In each group, students should read through problems 3 and 4 together before starting their work. Allow students to work, only intervening if a group needs support to begin work on the problems. 2. If the pattern continues, how many ducks will be in figure 4? Describe the arrangement of ducks. Sample: Figure 4 will have 29 ducks. There will be 5 rows of 5 ducks each. The sixth row will have 4 ducks. Figure 4
© Great Minds PBC
23
EUREKA MATH2
A1 ▸ M1 ▸ TA ▸ Lesson 1
3. Work with your group to find out how many ducks will be in figure 5, figure 10, and figure 100. Sample response for a different description of the arrangement of ducks: Figure 5
Figure 5: 41 ducks because (5 + 1)(5 + 2) − 1 = 41 Figure 10: 131 ducks because (10 + 1)(10 + 2) − 1 = 131 Figure 100: 10,301 ducks because (100 + 1)(100 + 2) − 1 = 10,301
24
© Great Minds PBC
EUREKA MATH2 A1 ▸ M1 ▸ TA ▸ Lesson 1
4. Describe how to find the number of ducks given any figure number. You may use words, symbols, pictures, expressions, and/or equations. Sample: Figure 1
Figure 2
Figure 3
22 + 1
32 + 2
42 + 3
For each figure, we square a number that is 1 more than the figure number. Then we add the figure number to the result. If we want to find the number of ducks for any figure, we can use the expression (n + 1)2 + n, where n is the figure number. There are many ways a group may choose to describe the arrangement of ducks, and this will result in different expressions used to represent the number of ducks in each figure. For example, a group might partition each figure into three rectangles: an n × (n + 2) rectangle, an n × 1 rectangle, and a 1 × 1 rectangle, where n is the figure number. The following expressions could represent the number of ducks in the first three figures.
© Great Minds PBC
25
EUREKA MATH2
A1 ▸ M1 ▸ TA ▸ Lesson 1 Figure 1
Figure 2
Figure 3
1(1 + 2) + 1 + 1
2(2 + 2) + 2 + 1
3(3 + 2) + 3 + 1
Another group may partition the pattern into an (n + 1) × (n + 1) square, leaving a row of n ducks below the square. The following expressions could represent the number of ducks in the first three figures.
26
© Great Minds PBC
EUREKA MATH2 A1 ▸ M1 ▸ TA ▸ Lesson 1 Figure 1
Figure 2
Figure 3
22 + 1
32 + 2
42 + 3
In problem 4, students generalize their work and describe how to find the number of ducks in any figure. The focus should be on expressing regularity in repeated reasoning; it is not necessary for students to arrive at a general expression. Instead, encourage students to recognize how their description changes from figure to figure, and use that structure to find a general description of the arrangement for any figure. Despite being able to describe the arrangement of ducks in the first four figures, some groups may have difficulty generalizing this description for any given figure. To support students in generalizing, use the following prompts to facilitate a class discussion to examine the structure of the arrangement in each figure. Consider a group that has partitioned their ducks as in the second example. What operations are the same in the expressions for each figure? In each expression, we square a number and add a number at the end.
© Great Minds PBC
Teacher Note The dialogue shown provides suggested questions and sample responses. To maximize every student’s participation, facilitate discussion by using tools and strategies that encourage student-to-student discourse. For example, make flexible use of the Talking Tool, turn and talk, think–pair–share, and Always Sometimes Never.
27
EUREKA MATH2
A1 ▸ M1 ▸ TA ▸ Lesson 1
What is changing in each expression? How do the changing numbers relate to the figure number? The numbers change each time. The number being added is the figure number. The number being squared is 1 more than the figure number. If you use the structure you described, what would the expression for figure 10 or figure 100 look like? For figure 10, it would be (10 + 1)2 + 10 or 112 + 10. For figure 100, it would be (100 + 1)2 + 100 or 1012 + 100. When students generalize this relationship to any figure number, they may choose to describe the relationship in words or to represent the unknown figure number with a variable or a blank space. Examples: 2
(n + 1) + n
(
+ 1) ⋅ (
+ 1) +
Add 1 to the figure number and square the result. Then add the figure number.
Representation Presentation
Promoting the Standards for Mathematical Practice When students notice the structure of their created expressions to find patterns and generalize to develop algebraic expressions for other figures, they are expressing regularity in repeated reasoning (MP8). Ask the following questions to promote MP8: • What patterns did you notice when you described each figure? • When you write an expression for each figure, is anything repeating? How can that help you find the number of ducks more efficiently given any figure number? • Will your general expression or description representing the number of ducks always work to find the number of ducks in a given figure?
Students compare their growth representations with those of other students. Ask groups to finalize their work on problems 3 and 4 so it can be presented to the class. Their work should include a description of how they saw the structure of the figures. It should present their solutions and any words, symbols, pictures, expressions, and/or equations they used to solve the problems. It should also describe how to find the number of ducks given any figure number. Have students present their work to the class. As groups present, record and display any expressions, equations, or verbal descriptions used to find the number of ducks in any figure.
28
© Great Minds PBC
EUREKA MATH2 A1 ▸ M1 ▸ TA ▸ Lesson 1
Land
Teacher Note
Debrief 5 min Objective: Compare verbal and mathematical representations of a visual pattern. Direct students to problem 5. Give students 2 minutes to answer the question independently and to reflect on their work.
During this discussion, students may use the term equivalent expressions because it has been introduced to them in an earlier grade. This term will be discussed further in the next lesson. Therefore, it is not necessary for students to use this term during the Debrief, but they also do not need to be discouraged from using it.
5. On your paper, record two different expressions from other groups. What is similar about the expressions? What is different? Sample: Group 1 writes (
+ 1)2 +
, and group 2 writes (n + 1) ⋅ (n + 1) + n.
Group 1 and group 2 both have correct expressions because they give the correct number of ducks when evaluated for a figure number. Their expressions both show a number added to a variable. However, group 1 uses boxes to represent the unknown figure number, but group 2 uses the variable n to represent the unknown figure number. Use the following questions to lead a brief class discussion to debrief the lesson. Students may refer to their responses to problem 5 to further the discussion. All groups found the same number of ducks for figure 100, but the expressions and methods used to find this number differed. Compare and contrast these methods, expressions, and pictures. Some groups have a number squared in their expression, but other groups used a number that was multiplied by itself. Some groups used boxes or blanks to represent the unknown figure number. Other groups used a variable, such as n. Yes. The expressions 32 + 2 and 3 ⋅ 3 + 2 represent the same value because 32 is another way to write 3 ⋅ 3.
Can different expressions represent the same value? Give an example from the lesson.
It is difficult to determine when looking at some expressions. One group wrote the expression (n + 2)(n + 1) − 1, and another group wrote the expression (n + 1)2 + n. Both groups arrived at the same number of ducks for figure 100, but their expressions look very different. © Great Minds PBC
29
EUREKA MATH2
A1 ▸ M1 ▸ TA ▸ Lesson 1
How do we know whether two expressions represent the same value? These expressions evaluate to the same number for n = 1, n = 2, n = 3, and n = 100, so it seems like they are the same. We also know that they represent the same value if we can rewrite one expression so that it looks like the other, like 32 rewritten as 3 ⋅ 3. However, we do not know how to rewrite expressions like (n + 2)(n + 1) − 1 and (n + 1)2 + n so that they look like one another.
Exit Ticket 5 min Provide up to 5 minutes for students to complete the Exit Ticket. It is possible to gather formative data even if some students do not complete every problem.
Teacher Note Assign the Practice problems for completion outside of class or use them in class if time remains after the lesson. Refer students to the Recap for support.
30
© Great Minds PBC
EUREKA MATH2 A1 ▸ M1 ▸ TA ▸ Lesson 1
Recap
EUREKA MATH2
A1 ▸ M1 ▸ TA ▸ Lesson 1
Student Edition: Grade A1, Module 1, Topic A, Lesson 1 Name
RECAP Date
1
b. Describe how to find the number of zebras in any given figure number. In each figure, there are 3 equal groups of zebras, with 2 left over. The number of zebras in each of the groups is the figure number. If n represents the figure number, this can be represented as 3n + 2.
The Growing Pattern of Ducks In this lesson, we
Figure 1
•
examined visual patterns.
•
wrote numerical expressions to represent visual patterns.
•
described visual patterns by using words and algebraic expressions.
EUREKA MATH2
A1 ▸ M1 ▸ TA ▸ Lesson 1
Figure 2
Figure 3
Example Examine the pattern of zebras. Figure 1
Figure 2
Figure 3
c. How many zebras are in figure 10? In figure 100? Figure 10: 32 zebras because 3(10) + 2 = 32 Figure 100: 302 zebras because 3(100) + 2 = 302
a. How many zebras are in figure 4? There are 14 zebras in figure 4.
© Great Minds PBC
© Great Minds PBC
Each figure has 3 more zebras than the previous figure. Figure 3 has 11 zebras.
13
14
RECAP
© Great Minds PBC
31
EUREKA MATH2
A1 ▸ M1 ▸ TA ▸ Lesson 1
Sample Solutions Expect to see varied solution paths. Accept accurate responses, reasonable explanations, and equivalent answers for all student work.
EUREKA MATH2
A1 ▸ M1 ▸ TA ▸ Lesson 1
Student Edition: Grade A1, Module 1, Topic A, Lesson 1 Name
PRACTICE Date
1
EUREKA MATH2
A1 ▸ M1 ▸ TA ▸ Lesson 1
2. Examine the pattern of mice.
1. Examine the pattern of bees. Figure 1
Figure 2
Figure 3
Figure 1
Figure 2
Figure 3
a. How many mice will be in figure 4? Figure 10? Figure 100? There will be 13 mice in figure 4, 31 mice in figure 10, and 301 mice in figure 100.
a. How many bees will be in figure 4? Figure 10? Figure 100? There will be 17 bees in figure 4, 41 bees in figure 10, and 401 bees in figure 100. b. Describe how to find the number of mice given any figure number. Sample: The first figure has 4 mice, and 3 mice are added to each new figure. I can represent the number of mice in figure 1 as 3 + 1, the number of mice in figure 2 as 3 + 3 + 1 or 3(2) + 1, and the number of mice in figure 3 as 3 + 3 + 3 + 1 or 3(3) + 1. So I can represent the number of mice in any given figure as 3n + 1, where n is the figure number. (Note: The student response is shown in the original image.)
b. Describe how to find the number of bees given any figure number. Sample: In each figure, there are 4 groups of bees plus 1 bee in the middle. The number of bees in each of the 4 groups is the figure number. So there are 4 groups of the figure number, plus 1. I can represent this as 4n + 1, where n is the figure number. (Note: The student response is shown in the original image.)
© Great Minds PBC
32
15
16
P R ACT I C E
© Great Minds PBC
© Great Minds PBC
EUREKA MATH2 A1 ▸ M1 ▸ TA ▸ Lesson 1
EUREKA MATH2
A1 ▸ M1 ▸ TA ▸ Lesson 1
EUREKA MATH2
A1 ▸ M1 ▸ TA ▸ Lesson 1
Nina’s Work:
3. Bahar and Nina examine the pattern of tacos.
2(42) + 2
2(32) + 2
2(22) + 2
2(12) + 2 Figure 1
Figure 2
Figure 3
Figure 4
Bahar and Nina divide the figures into parts. They each write expressions to represent the number of tacos in each figure. Their work is shown. Bahar’s Work:
Figure 1
42 + 42 + 2
Figure 2
Figure 3
Figure 4
For each figure, do their expressions represent the same value? Explain how you know.
32 + 32 + 2
Both of their expressions represent the same value for each figure. Adding a value to itself is the same as multiplying that value by 2. So in figure 4, 42 + 42 + 2 and 2(42) + 2 represent the same value.
22 + 22 + 2
12 + 12 + 2
Figure 1 © Great Minds PBC
© Great Minds PBC
Figure 2
Figure 3
Figure 4 P R ACT I C E
17
18
P R ACT I C E
© Great Minds PBC
33
EUREKA MATH2
A1 ▸ M1 ▸ TA ▸ Lesson 1
EUREKA MATH2
A1 ▸ M1 ▸ TA ▸ Lesson 1
4. Examine the pattern of snails. Show two ways to represent the number of snails given any figure number.
Remember For problems 5 and 6, evaluate.
Sample: Figure 1
Figure 2
EUREKA MATH2
A1 ▸ M1 ▸ TA ▸ Lesson 1
5. −12.14 − 2.32
6. 9.9 + 11.25 + (−4)
Figure 3
−14.46
17.15
7. Which equations are true? Choose all that apply.
12 + 4 · 1 22 + 4 · 2
A. 72 + 45 = 9(8 + 5)
B. 80 + 60 = 8(10 + 60)
C. 24 + 6 = 6(4 + 1)
D. 39 + 27 = 3(19 + 9)
E. 48 + 28 = 4(12 + 7) 32 + 4 · 3
Figure 1
Figure 2
Figure 3
8. Ana made a mistake solving w − 16 = −25.
w − 16 = −25
w − 16 + 16 = −25 − 16 w = −41 a. Identify Ana’s mistake, and explain what she should have done to solve the problem correctly. Ana added 16 to the left side of the equation, and she subtracted 16 from the right side of the equation. She should have added 16 to both sides of the equation.
(1 + 2)2 – 4 (2 + 2)2 – 4
b. Solve for w.
−9
(3 + 2)2 – 4
© Great Minds PBC
34
P R ACT I C E
19
20
P R ACT I C E
© Great Minds PBC
© Great Minds PBC
2
Teacher Edition: Grade A1, Module 1, Topic A, Lesson 2 LESSON 2
The Commutative, Associative, and Distributive Properties Rewrite algebraic expressions in equivalent forms. Show the equivalency of two algebraic expressions by using properties and operations.
EUREKA MATH2
A1 ▸ M1 ▸ TA ▸ Lesson 2
Student Edition: Grade A1, Module 1, Topic A, Lesson 2 Name
Date
EXIT TICKET
2
Show that 6 + 5w + 3w(w + 2) and 3w2 + 11w + 6 are equivalent expressions by stating the operation or property used in each step. Expression
Property or Operation Used
6 + 5w + 3w(w + 2) 6 + 5w + 3w2 + 6w
Distributive property
6 + 5w + 6w + 3w2
Commutative property of addition
6 + 11w + 3w2
Addition of like terms
3w2 + 11w + 6
Commutative property of addition
Lesson at a Glance Students activate prior knowledge by matching simple equivalent expressions. They name the properties of arithmetic in a graphic organizer and use the properties to formalize their understanding of equivalent expressions. Students use two-column tables and flowcharts to formally show that two given expressions are equivalent. This lesson introduces a new formalization of the terms algebraic expression and equivalent expressions.
Key Questions • What do the commutative, associative, and distributive properties allow us to do? • How do we know when two expressions are equivalent? • How do we know when two expressions are not equivalent?
Achievement Descriptor A1.Mod1.AD1 Use the structure of a polynomial expression to identify
ways to rewrite it. (A.SSE.A.2)
© Great Minds PBC
29
© Great Minds PBC
EUREKA MATH2 A1 ▸ M1 ▸ TA ▸ Lesson 2
Agenda
Materials
Fluency
Teacher
Launch 5 min
• None
Learn 30 min
Students
• Defining Equivalent Expressions
• None
• Demonstrating Equivalence
Lesson Preparation
Land 10 min
• None
© Great Minds PBC
37
EUREKA MATH2
A1 ▸ M1 ▸ TA ▸ Lesson 2
Fluency Write Expressions Students write equivalent expressions to prepare for demonstrating the equivalency of two algebraic expressions by using properties. Directions: Write three different expressions that have the same value as the given expression. Use the numbers 1, 2, 3, 4; the variable x, if needed; and the operations +, −, ⋅, or ÷. For example, write 8 as 2 ⋅ 2 + 1 + 3.
38
1.
6
2.
10
3.
3x
4.
2x + 3
Samples:
1+2+3
2+4
4+3–1
Samples:
3⋅3+1
1+2+3+4
3⋅4−2
Samples:
3⋅x
(1 + 2) ⋅ x
Samples:
2⋅x+3
3+2⋅x
2⋅ 3⋅ 2⋅ x 4
(1 + 1) ⋅ x + 2 + 1
© Great Minds PBC
EUREKA MATH2 A1 ▸ M1 ▸ TA ▸ Lesson 2
Launch
5
Students use their prior knowledge to identify equivalent expressions. Direct students to the Matching Expressions Task. Have students work independently or with a partner to match each expression in table 1 to an expression in table 2. Ask students to write one sentence for each pair of expressions that explains their reasoning. Circulate as students work. Identify a few students to share their matches and reasoning. Intentionally select student work that includes reasoning about equivalent expressions such as the following examples: I matched 9 ⋅ 2 ⋅ p and 2 ⋅ 9 ⋅ p because they can both be written as 18p.
I matched 9( p + 2) and 9p + 18 because I can use the distributive property to rewrite 9( p + 2) as 9p + 18. Match each expression in table 1 to an expression in table 2. Explain why you matched each pair of expressions. Table 1
Table 2
1. 9 + p + 2
A. (9 + p) + 6
2. 9(p + 2)
B. 9p + 18
4. (9 ⋅ p) ⋅ 6
D. 9( p + 6)
3. 9 ⋅ 2 ⋅ p
C. 9 ⋅ ( p ⋅ 6)
5. 9 + ( p + 6)
E. 2 ⋅ 9 ⋅ p
6. 9p + 54
F. p + 9 + 2
© Great Minds PBC
39
EUREKA MATH2
A1 ▸ M1 ▸ TA ▸ Lesson 2
I matched 1 and F because 9 + p + 2 and p + 9 + 2 can both be written as p + 11. I matched 2 and B because I can use the distributive property to rewrite 9(p + 2) as 9p + 18. I matched 3 and E because 9 ⋅ 2 ⋅ p and 2 ⋅ 9 ⋅ p can both be rewritten as 18p. I matched 4 and C because multiplying the product of 9 and p by 6 and multiplying the product of p and 6 by 9 result in the same product. I matched 5 and A because adding 9 to the sum of p and 6 and adding 6 to the sum of 9 and p result in the same sum. I matched 6 and D because I can use the distributive property to rewrite 9p + 54 as 9(p + 6). Today, we will use properties to rewrite one expression to match another expression.
Learn Defining Equivalent Expressions Students define equivalent expressions based on the properties of arithmetic. Direct students to the Properties of Arithmetic tree map. Display the tree map and define each property of arithmetic. Then have students identify an example of each property in the Matching Expressions Task. For example, in the Distributive box, write the equation a(b + c) = ab + ac to complete the sentence. Then have students identify a pair of expressions from the matching activity that exemplifies the distributive property, such as 9(p + 2) = 9p + 18, and write them in the Example box. Students should record the property definitions and examples on their tree maps.
40
UDL: Representation This lesson introduces the idea that the properties of arithmetic can be described by using variables. The tree map graphic organizer helps students build connections between this new, abstract idea of the properties of arithmetic and what they already know.
© Great Minds PBC
© Great Minds PBC
9p + 54 = 9(p + 6)
9(p + 2) = 9p + 18
Example
a(b + c) = ab + ac.
Distributive
If a, b, and c are real numbers, then
Addition
Multiplication
Addition
(9 + p) + 6
Example 9+p+2=p+9+2
Example (9 · p) · 6 = 9 · (p · 6)
Example 9 + (p + 6) =
9·2·p=2·9·p
Example
a · b = b · a.
Multiplication
If a and b are real numbers, then
Commutative
If a and b are real numbers, then
a + b = b + a.
If a, b, and c are real numbers, then
a · (b · c) = (a · b) · c.
a + (b + c) = (a + b) + c.
If a, b, and c are real numbers, then
Associative
Properties of Arithmetic
EUREKA MATH2 A1 ▸ M1 ▸ TA ▸ Lesson 2
Complete the statements in the tree map, and provide examples of each property. Differentiation: Support
If students have difficulty making sense of the verbal descriptions of the properties, consider using visual models to aid their understanding. For example, the following image could represent 3 + p or p + 3.
3 p
41
EUREKA MATH2
A1 ▸ M1 ▸ TA ▸ Lesson 2
Direct students’ attention to problem 7, and introduce the definition for algebraic expression. Ask students for examples, encouraging them to refer to their work in the Matching Expressions Task and the Properties of Arithmetic tree map. An algebraic expression is a number, a variable, or the result of placing previously generated algebraic expressions into the blanks of one of the four operators, ( ) + ( ), ( ) − ( ), ( ) ⋅ ( ), ( ) ÷ ( ), or into the base blank of an exponentiation with an exponent that is a rational number, ( )( ).
Students may have difficulty understanding the formal definition of algebraic expression. Consider using a simple example to demonstrate the description.
7. List some examples of algebraic expressions.
because they are numbers or variables. We can create the algebraic expression 9p + 54 by multiplying the algebraic expressions 9 and p and adding the algebraic expression 54.
6, 10, z, 12 w , 9 + p + 2, 9p + 54 Direct students’ attention to problems 8 and 9, and introduce the definition for equivalent expressions. Ask students for examples and nonexamples, encouraging them to refer to their work in the Matching Expressions Task and the Properties of Arithmetic tree map. Lead a class discussion about how to establish whether two expressions are equivalent. Use student responses to problems 8 and 9 as examples during the discussion. How could we show that two algebraic expressions are not equivalent? We could find a number for the variable such that the expressions do not evaluate to the same value. Would this also be a good way to show that two algebraic expressions are equivalent? Why? No. It would not be possible in most cases to check every possible value of the variable. How could we show that two algebraic expressions are equivalent? We can use the properties of arithmetic and the properties of exponents to convert one expression into the other.
42
Language Support
9, p, and 54 are all algebraic expressions
Teacher Note In this lesson, the properties of arithmetic and the properties of rational exponents are used to prove that two expressions are equivalent. While the lesson focuses on the properties of arithmetic, consider briefly reviewing the properties of exponents covered in grade 8. For example, ba ⋅ bc = ba + c is used when applying the distributive property to multiply two variable expressions such as x(x + 1). Properties of exponents are addressed again in module 5 when students learn about rational exponents.
© Great Minds PBC
EUREKA MATH2 A1 ▸ M1 ▸ TA ▸ Lesson 2
Consider using student responses to write a sentence explaining the equivalence of the algebraic expressions. For example, 2x is equivalent to x ⋅ 2 because of the commutative property of multiplication. Note that these properties cannot be used to establish that two expressions are not equivalent because the converse of the second statement is not always true. Two expressions are equivalent expressions if both expressions evaluate to the same number for every possible value of the variables. If we can convert one expression into the other by some number of applications of the commutative, associative, and distributive properties and the properties of exponents, then the two expressions are equivalent. 8. List two equivalent expressions. Explain why they are equivalent. Sample:
9( p + 2) and 9p + 18 are equivalent expressions because I can use the distributive property to rewrite 9( p + 2) as 9p + 18. 9. List a nonexample of two equivalent expressions. Explain why they are not equivalent.
9 + p + 2 and 9 ⋅ ( p ⋅ 6) are not equivalent expressions because they do not evaluate to the same number for every possible value of p. For example, for p = 1, the first expression evaluates to 12 and the second expression evaluates to 54. Sample:
Demonstrating Equivalence Students represent the equivalence of two algebraic expressions by using a flowchart or a two-column table. Work as a class to show the steps used to rewrite the expression −8(−5b + 7) + 5b as 45b − 56.
© Great Minds PBC
43
EUREKA MATH2
A1 ▸ M1 ▸ TA ▸ Lesson 2
−8(−5b + 7) + 5b (1)
40b − 56 + 5b
(2)
40b + 5b − 56
(3)
(40b + 5b) − 56
(4)
(40 + 5)b − 56
(5)
45b – 56
Lead the class in identifying the property or operation used to rewrite the expression in each step. What property is used to rewrite −8(−5b + 7) + 5b as 40b − 56 + 5b? The distributive property Most students will skip steps (3) and (4). If they do, leave space to add these steps later and have the following discussion. When we rewrite 40b + 5b − 56 as 45b − 56, we usually call this combining like terms or addition of like terms. But this is actually an application of two properties. Write steps (3) and (4) on the board. What property is used to rewrite 40b + 5b − 56 as (40b + 5b) − 56? The associative property of addition What property is used to rewrite (40b + 5b) − 56 as (40 + 5)b − 56? The distributive property
44
© Great Minds PBC
EUREKA MATH2 A1 ▸ M1 ▸ TA ▸ Lesson 2
What we call addition of like terms or combining like terms is actually an application of the associative property of addition and the distributive property. We can include the steps for the associative and distributive properties. We can also shorten these two steps to one step called addition of like terms. Model how to organize the information into a flowchart, and direct students to follow along in problem 10. Use the following prompts to discuss the important features of the flowchart. What information is written on the lines next to the arrows? I write the property or operation used to rewrite the expression in each step. The arrows in our flowchart are double-ended. Why do you think this is important? The arrows show that the expressions are equivalent to one another. For example, 40b + 5b − 56 is equivalent to 45b − 56, and 45b − 56 is equivalent to 40b + 5b − 56. Model how to organize the information in a two-column table, and direct students to follow along in problem 10. Discuss the important features of the table. In a two-column table, we write the property or operation used to rewrite each expression. Why is the Property or Operation Used column blank for the first expression? This is the original expression. I have not performed any operations or used any properties yet. Where do we write the property or operation used to convert the original expression to the expression in step (1)? We write it in the space next to the expression in step (1).
© Great Minds PBC
45
EUREKA MATH2
A1 ▸ M1 ▸ TA ▸ Lesson 2
10. Show −8(−5b + 7) + 5b is equivalent to 45b − 56 by using a flowchart and a two-column table.
–8(–5b + 7) + 5b distributive property 40b – 56 + 5b commutative property of addition 40b + 5b – 56 addition of like terms 45b – 56
Expression
Property or Operation Used
−8(−5b + 7) + 5b 40b − 56 + 5b
Distributive property
40b + 5b − 56
Commutative property of addition
45b − 56
Addition of like terms
Give students time to work independently or with a partner on problems 11−14. For problems 11−13, students will justify the work already shown. In problem 14, students will create their own flowcharts or two-column tables to show equivalence.
46
Promoting the Standards for Mathematical Practice When students use the properties of arithmetic to rewrite algebraic expressions, they are looking for and making use of structure (MP7). Ask the following questions to promote MP7: • How can you use what you know about rewriting numerical expressions to help you rewrite expressions with variables? • How can you use what these expressions have in common to help you identify the property or operation used?
© Great Minds PBC
EUREKA MATH2 A1 ▸ M1 ▸ TA ▸ Lesson 2
11. Show that 3( y + 2) + 9x is equivalent to 3(3x + y) + 6 by completing the flowchart. Write the property or operation used in each step on the line next to the arrow.
3(y + 2) + 9x distributive property
3y + 6 + 9x commutative property of addition associative property of addition
9x + 3y + 6
(9x + 3y) + 6 distributive property 3(3x + y) + 6
© Great Minds PBC
47
EUREKA MATH2
A1 ▸ M1 ▸ TA ▸ Lesson 2
12. Show that (5y)(4 + y) − 12 is equivalent to 5y2 + 20y − 12 by completing the two-column table. Write the property or operation used in each step.
Expression
Property or Operation Used
(5y)(4 + y) − 12
5y ⋅ 4 + 5y ⋅ y − 12
5 ⋅ 4 ⋅ y + 5 ⋅ y ⋅ y − 12 5 ⋅ 4 ⋅ y + 5 ⋅ y2 − 12
48
Distributive property Commutative property of multiplication Property of exponents (ba ⋅ bc = ba + c)
20y + 5y2 − 12
Multiplication
5y2 + 20y − 12
Commutative property of addition
© Great Minds PBC
EUREKA MATH2 A1 ▸ M1 ▸ TA ▸ Lesson 2
13. Show that 2(5a − 7 − 8 + 10a) is equivalent to 30(a − 1) by writing the property or operation used in each step on the line next to each arrow.
2(5a – 7 – 8 + 10a) commutative property of addition
distributive property
2(5a + 10a – 7 – 8)
10a – 14 – 16 + 20a commutative property of addition
addition of like terms 2(15a – 7 – 8)
10a + 20a – 14 – 16
addition
addition of like terms
2(15a – 15) distributive property
30a – 14 – 16 distributive property addition
2 · 15(a – 1)
30a – 30
multiplication
distributive property 30(a – 1)
© Great Minds PBC
49
EUREKA MATH2
A1 ▸ M1 ▸ TA ▸ Lesson 2
14. Show that 6d − d(d + 10) + 8(d + 10) is equivalent to −d2 + 4d + 80. Organize your work in a flowchart or a two-column table.
6d – d(d + 10) + 8(d + 10) distributive property 6d – d 2 – 10d + 8d + 80 commutative property of addition
Differentiation: Support Students may have difficulty justifying their steps when labeling the properties and operations in problem 14 and others like it. They may forget that they already know how to rewrite expressions from their work in prior grades. If students have difficulty creating their own flowcharts or two-column proofs, encourage them to rewrite the expression first and then label the properties and operations. By taking this approach, the problems will resemble the work done in problems 10−13.
–d 2 + 6d – 10d + 8d + 80 addition of like terms
UDL: Action & Expression To support students in organizing their reasoning in a flowchart, consider posting
–d 2 + 4d + 80
written directions for students to refer to as they work.
Expression
Property or Operation Used
6d − d(d + 10) + 8(d + 10)
2. Apply one property of arithmetic or one operation, and write the new expression below the first expression.
6d − d2 − 10d + 8d + 80
Distributive property
3. Draw a double-ended arrow between the expressions to represent equivalence.
−d2 + 6d − 10d + 8d + 80
Commutative property of addition
4. Write the property or operation used in the blank space next to the doubleended arrow.
−d2 + 4d + 80
50
1. Write the first expression.
Addition of like terms
5. Repeat steps 2 through 4 until you produce the second expression.
© Great Minds PBC
EUREKA MATH2 A1 ▸ M1 ▸ TA ▸ Lesson 2
Land Debrief 5 min Objectives: Rewrite algebraic expressions in equivalent forms. Show the equivalency of two algebraic expressions by using properties and operations. Initiate a class discussion by using the prompts below. Invite students to restate their classmates’ responses. What do the commutative, associative, and distributive properties allow us to do? They allow us to create equivalent expressions or show that two expressions are equivalent. How can we show that two expressions are equivalent? If we can apply some combination of the properties of arithmetic, arithmetic operations, and/or properties of rational exponents to convert one expression into the other, then the two expressions are equivalent. How do we know when two expressions are not equivalent? If we can find a value for the variable where the two expressions evaluate to two different numbers, then the expressions are not equivalent.
Exit Ticket 5 min Provide up to 5 minutes for students to complete the Exit Ticket. It is possible to gather formative data even if some students do not complete every problem.
Teacher Note Assign the Practice problems for completion outside of class or use them in class if time remains after the lesson. Refer students to the Recap for support.
© Great Minds PBC
51
EUREKA MATH2
A1 ▸ M1 ▸ TA ▸ Lesson 2
Recap
EUREKA MATH2
A1 ▸ M1 ▸ TA ▸ Lesson 2
Student Edition: Grade A1, Module 1, Topic A, Lesson 1 Name
2
RECAP Date
•
used the commutative, associative, and distributive properties to rewrite algebraic expressions.
•
applied properties and operations to show that two algebraic expressions are equivalent.
The Properties of Arithmetic The Distributive Property If a, b, and c are real numbers, then
a(b + c) = ab + ac. 3 (2 + 4) = 3 ⋅ 2 + 3 ⋅ 4 6 (t + 5) = 6 t + 30
6x + 20x2 – 30x
) ⋅ ( ), ( ) ÷ ( ), or into the base blank of an exponentiation with an exponent that is a rational number, ( )( ).
of the four operators, (
(
)+(
), (
)−(
), Arrows are double-ended to show that the expressions on each end are equivalent to one another.
Two expressions are equivalent expressions if both expressions evaluate to the same number for every possible value of the variables.
commutative property of addition 6x – 30x + 20x2 addition of like terms
If we can convert one expression into the other by some number of applications of the commutative, associative, and distributive properties and the properties of exponents, then the two expressions are equivalent.
The Associative Property of Multiplication If a, b, and c are real numbers, then
–24x + 20x2 commutative property of addition 20x2 – 24x
(a ⋅ b) ⋅ c = a ⋅ (b ⋅ c).
(3 + 2) + 4 = 3 + (2 + 4)
(3 ⋅ 2) ⋅ 4 = 3 ⋅ (2 ⋅ 4)
(6 + t ) + 5 = 6 + (t + 5)
(6 ⋅ t ) ⋅ 5 = 6 ⋅ (t ⋅ 5)
The Commutative Property of Addition
The Commutative Property of Multiplication
If a and b are real numbers, then
If a and b are real numbers, then
© Great Minds PBC
distributive property
An algebraic expression is a number, a variable, or the result of placing previously generated algebraic expressions into the blanks of one
If a, b, and c are real numbers, then
a + b = b + a.
52
6x + 10x(2x – 3)
Terminology
The Associative Property of Addition
(a + b) + c = a + (b + c).
Examples 1. Show that 6x + 10x(2x − 3) is equivalent to 20x2 − 24x by writing the property or operation that best describes each step next to each arrow.
The Commutative, Associative, and Distributive Properties In this lesson, we
EUREKA MATH2
A1 ▸ M1 ▸ TA ▸ Lesson 2
a ⋅ b = b ⋅ a.
3+2 = 2+3
3⋅2 = 2⋅3
6+t = t +6
6⋅t = t⋅6 31
32
RECAP
© Great Minds PBC
© Great Minds PBC
EUREKA MATH2 A1 ▸ M1 ▸ TA ▸ Lesson 2
EUREKA MATH2
A1 ▸ M1 ▸ TA ▸ Lesson 2
2. Show that 2a(5a + 4) − 3(4a − 1) is equivalent to 10a2 − 4a + 3 by writing the property or operation used in each step.
Expression
Leave this box blank because the expression in this row is the original expression.
Property or Operation Used
2a(5a + 4) − 3(4a − 1)
2a ⋅ 5a + 2a ⋅ 4 − 3 ⋅ 4a − 3 ⋅ (−1)
2 ⋅ 5 ⋅ a ⋅ a + 2 ⋅ 4 ⋅ a − 3 ⋅ 4 ⋅ a − 3 ⋅ (−1) 2 ⋅ 5 ⋅ a2 + 2 ⋅ 4 ⋅ a − 3 ⋅ 4 ⋅ a − 3 ⋅ (−1) 10a2 + 8a − 12a + 3 10a2 − 4a + 3
© Great Minds PBC
© Great Minds PBC
Distributive property Commutative property of multiplication
Property of exponents (ba ⋅ bc = ba + c) Multiplication Addition of like terms
RECAP
33
53
EUREKA MATH2
A1 ▸ M1 ▸ TA ▸ Lesson 2
Sample Solutions Expect to see varied solution paths. Accept accurate responses, reasonable explanations, and equivalent answers for all student work.
EUREKA MATH2
A1 ▸ M1 ▸ TA ▸ Lesson 2
Student Edition: Grade A1, Module 1, Topic A, Lesson 2
PRACTICE
Name
Date
2
EUREKA MATH2
A1 ▸ M1 ▸ TA ▸ Lesson 2
3. Volume of the rectangular prism
For problems 1–4, write two equivalent expressions for each situation. 1. Total length of both segments
0
1
8 2
3
4
5
6
7
8
9
10
3 + 2; 2 + 3 5
6
(5 ⋅ 6 ) ⋅ 8 ; 8 ⋅ 5 ⋅ 6 4. Number of squares in the figure 2. Area of the rectangle
10 2 + 5; 5 + 2
7
For problems 5–10, identify the property that justifies why each pair of expressions is equivalent. 5. 3 + 5 + 2 and 3 + 2 + 5 Commutative property of addition 7. 9(2 + 5) and 18 + 45 Distributive property
10 ⋅ 7; 7 ⋅ 10
9. (y + 5)(y − 3) and (y + 5)y + (y + 5)(−3) Distributive property.
© Great Minds PBC
54
35
36
P R ACT I C E
6. 5 ⋅ (4 ⋅ 6) and (5 ⋅ 4) ⋅ 6
Associative property of multiplication
8. 2x + 3x2 − 5 and 3x2 + 2x − 5 Commutative property of addition 10. m2 + 2m − 6m − 12 and m2 + (2m − 6m) − 12 Associative property of addition
© Great Minds PBC
© Great Minds PBC
EUREKA MATH2 A1 ▸ M1 ▸ TA ▸ Lesson 2
EUREKA MATH2
A1 ▸ M1 ▸ TA ▸ Lesson 2
13. Show that −4a + 3a(a + 2) is equivalent to 3a2 + 2a by writing the property or operation used in each step on the line next to each arrow.
11. Show that 2x(3x + 2) − 4(3x + 2) is equivalent to 6x2 − 8x − 8 by writing the property or operation used in each step. Expression
EUREKA MATH2
A1 ▸ M1 ▸ TA ▸ Lesson 2
–4a + 3a(a + 2)
Property or Operation Used
distributive property
2x(3x + 2) − 4(3x + 2)
2x ⋅ 3x + 2x ⋅ 2 − 4 ⋅ 3x − 4 ⋅ 2
2⋅3⋅x⋅x+2⋅2⋅x−4⋅3⋅x−4⋅2 2 ⋅ 3 ⋅ x2 + 2 ⋅ 2 ⋅ x − 4 ⋅ 3 ⋅ x − 4 ⋅ 2 6x2 + 4x − 12x − 8 6x2 − 8x − 8
–4a + 3a2 + 6a
Distributive property
commutative property of addition
Commutative property of multiplication Property of exponents (ba ⋅ bc = ba+c)
–4a + 6a + 3a2
Multiplication
addition of like terms
Addition of like terms
2a + 3a2 12. Show that −8 + x(x + 3) + 4(y + 3) is equivalent to x2 + 3x + 4(y + 1) by writing the property or operation used in each step. Expression
commutative property of addition 3a2 + 2a
Property or Operation Used
−8 + x(x + 3) + 4(y + 3)
−8 + x ⋅ x + 3x + 4y + 12 −8 + x2 + 3x + 4y + 12 x2 + 3x + 4y + 12 − 8
© Great Minds PBC
© Great Minds PBC
Distributive property
Property of exponents (ba ⋅ bc = ba+c) Commutative property of addition
x2 + 3x + 4y + 4
Addition of like terms
2
x + 3x + (4y + 4)
Associative property of addition
x2 + 3x + 4(y + 1)
Distributive property
P R ACT I C E
37
38
P R ACT I C E
© Great Minds PBC
55
EUREKA MATH2
A1 ▸ M1 ▸ TA ▸ Lesson 2
EUREKA MATH2
A1 ▸ M1 ▸ TA ▸ Lesson 2
14. Show that 2g + 8(g − 4) − 7g is equivalent to 3g − 32 by completing the flowchart. Write the property or operation used in each step on the line next to each arrow.
16. Show that 2(2 + n3) + n(5n2 + 2) is equivalent to 7n3 + 2n + 4. State the property or operation used in each step.
2g + 8(g – 4) – 7g distributive property
Expression
commutative property of addition
2g + 8g – 32 – 7g
EUREKA MATH2
A1 ▸ M1 ▸ TA ▸ Lesson 2
2(2 + n3) + n(5n2 + 2) 4 + 2n3 + 5n3 + 2n
2g – 7g + 8(g – 4)
3
3
2n + 5n + 2n + 4
distributive property
commutative property of addition
7n3 + 2n + 4 2g + 8g – 7g – 32
Property or Operation Used
Distributive property Commutative property of addition Addition of like terms
2g – 7g + 8g – 32
addition of like terms
addition of like terms 3g – 32
15. Show that 5p2 − 3 + 2(p2 − p3) is equivalent to −2p3 + 7p2 − 3 by using a flowchart or two-column table. State the property or operation used in each step. Expression
Remember For problems 17 and 18, evaluate.
Property or Operation Used
5p2 − 3 + 2(p2 − p3) 5p2 − 3 + 2p2 − 2p3
Distributive property
−2p3 + 5p2 + 2p2 – 3
Commutative property of addition
−2p3 + 7p2 – 3
Addition of like terms
17. 16.5 ⋅ 4.4
18. 45 ÷ (−2.5)
72.6
−18
19. Evaluate 4x3 + 6x − 16 for x = 2.
28
© Great Minds PBC
56
P R ACT I C E
39
40
P R ACT I C E
© Great Minds PBC
© Great Minds PBC
EUREKA MATH2 A1 ▸ M1 ▸ TA ▸ Lesson 2
EUREKA MATH2
20. Find the solution to
A1 ▸ M1 ▸ TA ▸ Lesson 2
g 7
= 8 by each method listed.
a. Use tape diagrams. g÷7
8 g g÷7
g÷7
g÷7
g÷7
g÷7
g÷7
g÷7
8
8
8
8
8
8
8
g
56
The solution is 56. b. Solve algebraically. g g 7
7
= 8
⋅7 = 8⋅7 g = 56
The solution is 56.
© Great Minds PBC
© Great Minds PBC
P R ACT I C E
41
57
3
Teacher Edition: Grade A1, Module 1, Topic A, Lesson 3 LESSON 3
Polynomial Expressions Compare numbers in base 10 to numbers in base x.
EUREKA MATH2
A1 ▸ M1 ▸ TA ▸ Lesson 3
Student Edition: Grade A1, Module 1, Topic A, Lesson 3 Name
Date
EXIT TICKET
3
1. Consider the polynomial expression 3 − 5x2 + 2 + 8x + x3 + 7x2 − 5. a. Write the expression in standard form, and state the degree of the polynomial expression.
3 − 5x 2 + 2 + 8x + x3 + 7 x 2 − 5 = x3 − 5x 2 + 7 x 2 + 8x − 5 + 3 + 2 = x 3 + (−5 x 2 + 7 x 2 ) + 8 x + (− −5 + 3 + 2 ) = x3 + 2 x 2 + 8x The standard form of the expression is x3 + 2x2 + 8x. The degree of the polynomial expression is 3.
b. Evaluate the expression for x = 10.
Lesson at a Glance Students examine the place value structure of the base-10 number system by rewriting numbers in expanded form. Students use this structure to make sense of polynomial expressions, referred to as numbers in base x, and compare the place value structure in both types of expressions. Students learn the formal definitions of polynomial expression and related terms and attributes, organizing their work in a bubble map that includes examples. Students develop and apply their understanding of these definitions to classify algebraic expressions through multiple iterations of a card sort. This lesson formalizes the terms polynomial expression, degree, term, monomial expression, binomial expression, trinomial expression, and standard form of a polynomial expression.
Key Questions
x 3 + 2 x 2 + 8 x = (10)3 + 2(10)2 + 8(10) = 1000 + 2(100) + 8(10)
• How are polynomial expressions similar to numerical expressions? How are they different?
= 1000 + 200 + 80 = 1280
• Compare polynomial expressions with algebraic expressions. What is similar? What is different?
Achievement Descriptors A1.Mod1.AD1 Use the structure of a polynomial expression to identify
ways to rewrite it. (A.SSE.A.2) A1.Mod1.AD2 Identify polynomial expressions and explain why © Great Minds PBC
45
they are closed under the operations of addition, subtraction, and multiplication. (A.APR.A.1) © Great Minds PBC
EUREKA MATH2 A1 ▸ M1 ▸ TA ▸ Lesson 3
Agenda
Materials
Fluency
Teacher
Launch 5 min
• None
Learn 30 min
Students
• Evaluating Expressions in Base x
• Polynomial Expression cards (1 set per student pair)
• Polynomial Expressions • Polynomial Expressions Card Sort
Land 10 min
© Great Minds PBC
Lesson Preparation • Copy and cut out 1 set of Polynomial Expression Card Sort cards for each student pair.
59
EUREKA MATH2
A1 ▸ M1 ▸ TA ▸ Lesson 3
Fluency Write Numbers in Expanded Form Students write numbers in expanded form to prepare for identifying similarities and differences between numbers in base 10 and numbers in base x. Directions: Write each number in expanded form. For example, 125 = 1 × 100 + 2 × 10 + 5 × 1.
60
1.
268
2 × 100 + 6 × 10 + 8 × 1
2.
807
8 × 100 + 0 × 10 + 7 × 1
3.
3439
3 × 1000 + 4 × 100 + 3 × 10 + 9 × 1
4.
5056
5 × 1000 + 0 × 100 + 5 × 10 + 6 × 1
5.
12,517
1 × 10,000 + 2 × 1000 + 5 × 100 + 1 × 10 + 7 × 1
6.
20,401
2 × 10,000 + 0 × 1000 + 4 × 100 + 0 × 10 + 1 × 1
© Great Minds PBC
EUREKA MATH2 A1 ▸ M1 ▸ TA ▸ Lesson 3
Launch
5
Students review place value represented as powers of 10 by rewriting numbers in an expanded form. Direct students to complete problems 1–3. Give students about 3 minutes to work. Then use the following prompts to ask students what they notice about the structure of the numbers. How do you see place value represented in the numbers and in their expanded forms? For all whole numbers, place value is represented by the placement of a digit. For example, the tens are always in the second place from the right. In expanded form, place value is represented by a power of 10.
Differentiation: Challenge For students ready for an additional challenge, consider allowing time for them to explore number systems in other bases. Students may explore the use of a number system in base 2 to program computers or the number system in base 20 used by the Maya people.
Our standard number system is in base 10. Each place value represents a power of 10. Some number systems are in other bases. Today, we will examine a number system in base x. What do you think this means? We will look at numbers where the place value is a power of x. For problems 1–3, complete the equation. 1. 672 =
6
⋅ 100 +
7
⋅ 10 +
2
⋅1
=
6
⋅ 102 +
7
⋅ 10 +
2
⋅1
2. 8943 =
8
⋅ 1000 +
8
3
=
⋅ 10 +
9
⋅ 100 +
4
⋅ 10 +
3
⋅1
9
⋅ 10
2
4
⋅ 10 +
3
⋅1
⋅ 1000 +
+
3. 10 , 548 =
1
⋅ 10, 000 +
0
=
1
⋅ 10 4 +
⋅ 102 +
© Great Minds PBC
5
4
5
⋅ 100 +
⋅ 10 +
8
4
⋅ 10 +
8
⋅1
⋅1
61
EUREKA MATH2
A1 ▸ M1 ▸ TA ▸ Lesson 3
Learn Evaluating Expressions in Base x Students compare polynomial expressions with numerical expressions by evaluating polynomial expressions for x = 10. Guide students to problems 4–6. Let students work independently to evaluate each expression. Then initiate a class discussion comparing types of expressions. Compare your work in these problems with your work from problems 1 through 3. What is similar? What is different? The answers to these problems are the numbers found in problems 1 through 3. The power of x determines the place value of the digit. The terms of the numbers in expanded form for these problems include powers of x, but the terms of the numbers in problems 1 through 3 include powers of 10. For problems 4–6, evaluate the expression for x = 10. 4. 6x2 + 7x + 2
6(10)2 + 7(10) + 2 = 672 5. 8x3 + 9x2 + 4x + 3
8(10)3 + 9(10)2 + 4(10) + 3 = 8943 6. x4 + 5x2 + 4x + 8
(10)4 + 5(10)2 + 4(10) + 8 = 10, 548
62
© Great Minds PBC
EUREKA MATH2 A1 ▸ M1 ▸ TA ▸ Lesson 3
Polynomial Expressions Students use a graphic organizer to define polynomial expressions and their attributes. Present the Polynomial Expressions Bubble Map to students. Use the following prompts to introduce the definition of polynomial expression, and fill in the corresponding bubble on the map with examples and nonexamples. Use the same procedure to introduce the remaining terms on the bubble map. Students should follow along and fill in the bubbles on their bubble map. Students will also add examples and nonexamples to the bubble map as they complete a card sort.
UDL: Representation This lesson introduces the topic of polynomial expressions and their attributes. The bubble map graphic organizer helps students build understanding of this abstract idea by including formal definitions with concrete examples. The graphic organizer also helps students make connections between the many attributes and related terms.
The expressions we worked with in base x are called polynomial expressions. A polynomial expression is a numerical expression or a variable, or it is the result of adding or multiplying two previously generated polynomial expressions. What are some examples of polynomial expressions that we have seen today?
6x2 + 7x + 2, 8x3 + 9x2 + 4x + 3, and x4 + 5x2 + 4x + 8 Are the expressions 1x , x−3, and x examples of polynomial expressions? Are they numerical expressions? Are they variables? Are they the result of adding or multiplying two polynomial expressions? They are not examples of polynomial expressions because they are not numerical expressions or variables, and they are not the result of adding or multiplying polynomial expressions. The expressions 1x and x−3 involve division by x, and no sum or product of x can result in
x.
Complete the map by writing examples and nonexamples, when appropriate, of each definition. Use the examples and nonexamples from the card sort activity.
Language Support Students may have difficulty understanding the formal definition of a polynomial expression. Consider using a simple example to demonstrate the description.
6, x, −7, and 2 are all polynomial expressions because they are numbers or variables. The polynomial expression 6x2 − 7x + 2 can be created by multiplying and adding these polynomial expressions.
6 ⋅ x ⋅ x + (−7) ⋅ x + 2.
Also, consider drawing a connection to the definition of an algebraic expression. For instance, students should recognize that all polynomial expressions are algebraic expressions, but not all algebraic expressions are polynomial expressions.
© Great Minds PBC
63
EUREKA MATH2
A1 ▸ M1 ▸ TA ▸ Lesson 3
Monomial Expression
Degree of a Polynomial Expression The degree of the term with the greatest degree Example:
The expression 1 2 5 5 x – 2x + 8
is a 5th-degree polynomial expression.
A polynomial expression that is generated by using only multiplication. It does not contain + or – symbols.
Example: 1 2 3 (2x )
The degree of a monomial expression in one variable is the exponent of its variable.
Example:
Term
A single nonzero monomial expression in a polynomial expression
Example:
In 8x2 + 7x – 5, there are three terms: 8x2, 7x, and –5.
2x3 is a 3rd-degree monomial expression.
Polynomial Expression
A numerical expression or variable OR the result of adding or multiplying two previously generated polynomial expressions
Example:
Standard Form
A polynomial expression is in standard form if it is a sum of a finite number of terms of the form axn, where each n is a distinct nonnegative integer, each a is nonzero, and the terms are in descending order by degree.
Example:
6x4 + 1 x3 + x2 + 1 1 3
Nonexamples:
6
6(a – a2) + 10
–f 3 + 12 f 2 – 52 f 2 + 7f
3x2 ⋅ (4x + 1) Nonexample: 1 + 2x–1 ⋅ (5x2 + 7) x
Binomial Expression
A polynomial expression with two terms where each term has a distinct degree
Example:
Trinomial Expression
4x2 – 2(3x)
A polynomial expression with three terms where each term has a distinct degree
Example:
0.25x2 + 10x – 1.7
5k2 – 8k 5 + 11k 11 1 2 h + 6h3 + 2 h + 4 2
64
© Great Minds PBC
EUREKA MATH2 A1 ▸ M1 ▸ TA ▸ Lesson 3
Polynomial Expressions Card Sort Students use the definition of a polynomial expression to identify examples and nonexamples, write polynomial expressions in standard form, and state their degree and number of terms. Have students work with a partner. Give each pair of students a set of Polynomial Expressions Card Sort cards. Ask students to use the definitions and examples found on their bubble map to sort the cards into two piles. One pile should consist of examples of polynomial expressions, and the other pile should consist of nonexamples of polynomial expressions.
—
After most students have sorted the cards, ask the following question.
How do you know that 7x − 2√ x + 3 and 4y2 + 12y − 1 − 9y−2 are not polynomial expressions?
UDL: Action & Expression Consider posting questions for students to refer to as they work on the Polynomial Expressions Card Sort. The questions prompt students to consider the important characteristics of polynomial expressions as students make their sorting decisions. • Are the expressions numerical expressions? • Are the expressions variables? • Are the expressions the result of adding or multiplying two polynomial expressions?
The expression 7 x − 2 x + 3 is not a polynomial expression because of the term 2 x . We cannot add or multiply any numbers or variables to create the expression x . The expression 4y2 + 12y − 1 − 9y−2 is not a polynomial expression because of the term 9y−2. We cannot add or multiply any numbers or variables to create the expression y−2. Direct students to view the bubble map again. Use the following prompts to define monomial expression, term, degree, binomial expression, trinomial expression, and standard form. Record examples in the corresponding bubbles. A monomial expression is a polynomial expression that is generated only by using multiplication. It does not contain + or − symbols. What are some examples of monomial expressions? Examples: 6, x, 7 ⋅ y, b2
If we want to refer to a single monomial expression inside of a larger polynomial expression, it is called a term. The polynomial expression 6x2 − 7x + 2 has three terms. What are the three terms in this polynomial expression? The three terms in this expression are 6x2, −7x, and 2. Each term in a polynomial expression has a degree, indicated by the exponent of its variable. What is the degree of each of the terms of 6x2 − 7x + 2? The degree of 6x2 is 2. The degree of −7x is 1. The degree of 2 is 0. © Great Minds PBC
65
EUREKA MATH2
A1 ▸ M1 ▸ TA ▸ Lesson 3
A polynomial expression that has all the terms distributed and all the like terms combined also has a degree. The degree of a polynomial expression is the degree of the term with the highest degree. For example, what is the degree of the expression 6x2 − 7x + 2? What is the degree of the expression −4x + 8x3 + 3 + 9x2? What about x5 − 5x2 − 4x + 8? The degree of 6x2 − 7x + 2 is 2. The degree of −4x + 8x3 + 3 + 9x2 is 3. The degree of x5 − 5x2 − 4x + 8 is 5. Two common forms of polynomial expressions we will work with are binomial expressions and trinomial expressions.
Differentiation: Support Students may have difficulty understanding how the degree of a term can be 0. Consider reviewing the properties of zero exponents with students. For example, in the expression 2x0, x0 is equal to 1. Therefore, 2x0 is equivalent to 2 ⋅ 1 or 2. This is why the term 2 has a degree of 0.
What do you think a binomial expression is? What do you think a trinomial expression is? Because bi means “two,” I think a binomial expression is a polynomial expression with two terms. Because tri means “three,” I think a trinomial expression is a polynomial expression with three terms. A binomial expression is a polynomial expression with two terms where the degree of each term is distinct. What would be an example of a binomial expression? An example of a binomial expression is 6x2 + 7x. A trinomial expression is a polynomial expression with three terms where the degree of each term is distinct. What would be an example of a trinomial expression? An example of a trinomial expression is 6x2 + 7x + 2. A polynomial expression is in standard form if it is a sum of a finite number of terms of the form axn, where each n is a distinct nonnegative integer, each a is nonzero, and the terms are in descending order by degree. You can rewrite a polynomial expression in standard form by distributing, combining like terms, and reordering the terms so that they are in descending order by degree.
Promoting the Standards for Mathematical Practice When students use vocabulary to classify expressions as polynomial expressions and identify whether they are in standard form, students are attending to precision (MP6). Ask the following questions to promote MP6: • What details are important to think about when deciding whether an expression is a polynomial expression? • How can we rewrite a polynomial expression in standard form by using the definition we learned?
Ask students to use the definitions and examples found on their bubble map to sort the Polynomial Expressions cards into two piles. One pile should consist of cards that show examples of polynomial expressions in standard form, and the other pile should consist of cards that show nonexamples. Then ask the following question.
66
© Great Minds PBC
EUREKA MATH2 A1 ▸ M1 ▸ TA ▸ Lesson 3
_1
_5
How do you know that 6(a − a2) + 10, −f 3 + f 2 − f 2 + 7f, 5k 2 − 8k 5 + 11k,
_1
2 11 __ h + 4 are not in standard form?
and h2 + 6h3 + 2
2
2
The expression 6(a − a2) + 10 is not in standard form because the 6 needs to be
distributed. The expression − f 3 + 1 f 2 − 5 f 2 + 7 f is not in standard form because the 2
2
like terms 1 f 2 and − 5 f 2 need to be combined. The expressions 5k2 − 8k5 + 11k and 2 1 2 3 h + 6 h + 11 h+4 2 2
2
are not in standard form because the terms are not in descending
order of degree.
Teacher Note While polynomial expressions such as x2 + (−3x) and x2 + 2x0 are considered to be written in standard form, it is convention to write these expressions as x2 − 3x and x2 + 2, respectively.
Have students add these nonexamples to the corresponding bubbles in their bubble map. Then ask students to work with a partner to rewrite any polynomial expressions not in standard form so that they are in standard form.
Land Debrief 5 min Objective: Compare numbers in base 10 with numbers in base x. Use the following prompts to guide a discussion about polynomial expressions. How are polynomial expressions similar to numerical expressions? How are they different? Polynomial expressions are similar to numerical expressions because polynomial expressions in standard form have terms that are like the place value in numbers. With numerical expressions, each place value represents a power of 10, while polynomial expressions have terms that include a power of a variable. Compare polynomial expressions with algebraic expressions. What is similar? What is different? Polynomial expressions and algebraic expressions are very similar. They can both be a number or a variable. They both can be formed by multiplying or by adding two previously generated expressions. However, only algebraic expressions can be formed by using the properties of rational exponents. © Great Minds PBC
67
EUREKA MATH2
A1 ▸ M1 ▸ TA ▸ Lesson 3
Exit Ticket 5 min Provide up to 5 minutes for students to complete the Exit Ticket. It is possible to gather formative data even if some students do not complete every problem.
68
Teacher Note Assign the Practice problems for completion outside of class or use them in class if time remains after the lesson. Refer students to the Recap for support.
© Great Minds PBC
EUREKA MATH2 A1 ▸ M1 ▸ TA ▸ Lesson 3
Recap
EUREKA MATH2
A1 ▸ M1 ▸ TA ▸ Lesson 3
Student Edition: Grade A1, Module 1, Topic A, Lesson 3 Name
RECAP Date
3
EUREKA MATH2
A1 ▸ M1 ▸ TA ▸ Lesson 3
3. Consider the polynomial expression.
−m2 − 10 + 7m5 + 6m2 + 5 − 2m5 + 9 + 8m3 + 2m a. Write the polynomial expression in standard form.
Polynomial Expressions
−m 2 − 10 + 7m 5 + 6 m 2 + 5 − 2 m 5 + 9 + 8m3 + 2 m
In this lesson, we •
compared numbers in base 10 with numbers in base x.
•
identified polynomial expressions.
•
stated the degree of polynomial expressions.
•
evaluated polynomial expressions.
•
wrote polynomial expressions in standard form.
Terminology
= 7m 5 − 2 m 5 + 8m3 − m 2 + 6 m 2 + 2 m − 10 + 5 + 9
A polynomial expression is a numerical expression or a variable, or the result of adding or multiplying two previously generated
= 5m 5 + 8m 3 + 5m 2 + 2 m + 4
polynomial expressions.
b. State the degree of the polynomial expression.
A monomial expression is a polynomial
5
expression that is generated by using only multiplication. It does not contain +
standard form is similar to writing a number in base 10 in expanded form.
or − symbols.
Examples For problems 1 and 2, state whether the expression is a polynomial expression. If it is a polynomial expression, state its degree. If it is not, explain how you know.
The degree of a monomial expression in one variable is the exponent of its variable. A term is a single nonzero monomial expression
c. Evaluate the polynomial expression for m = 10.
in a polynomial expression.
5(10)5 + 8(10)3 + 5(10)2 + 2(10) + 4 = 5(100, 000) + 8(1000) + 5(100) + 2(10) + 4
The degree of a polynomial expression 4
8
1. −4 w − 6 w + 2 − w + 2 Yes; degree 8 The term with the greatest degree is −w8.
2. 15 x
2
15 − x
This is not a polynomial expression. We cannot add or multiply any numbers or variables to get the term 15 x.
Writing a polynomial expression in base m in
= 500, 000 + 8000 + 500 + 20 + 4 = 508, 524
is the degree of the monomial term with the greatest degree. A binomial expression is a polynomial expression with two terms where each term has a distinct degree. A trinomial expression is a polynomial expression with three terms where each term has a distinct degree. A polynomial expression is in standard form if it is a sum of a finite number of terms of the form axn, where each n is a distinct
nonnegative integer, each a is nonzero, and
the terms are in descending order by degree.
© Great Minds PBC
© Great Minds PBC
47
48
RECAP
© Great Minds PBC
69
EUREKA MATH2
A1 ▸ M1 ▸ TA ▸ Lesson 3
Sample Solutions Expect to see varied solution paths. Accept accurate responses, reasonable explanations, and equivalent answers for all student work.
EUREKA MATH2
A1 ▸ M1 ▸ TA ▸ Lesson 3
Student Edition: Grade A1, Module 1, Topic A, Lesson 3
PRACTICE
Name
Date
3
EUREKA MATH2
A1 ▸ M1 ▸ TA ▸ Lesson 3
For problems 5–9, write the polynomial expression in standard form. 5. 6x3 + 4x − 2x3 − 5
4 x3 + 4 x − 5
For problems 1 and 2, complete each equation. 1. 2435 =
2
⋅ 1000 +
4
⋅ 100 +
3
⋅ 10 +
5
⋅1
=
2
⋅ 103 +
4
⋅ 102 +
3
⋅ 10 +
5
⋅1
6. 2x2 − 8x + 6x + x2 + 1
3x 2 − 2 x + 1
7. 5 + 2x + 3x3 − 7 + 8x2 − x + 10 − 4x2
2960
2.
3
2
3x 3 + 4 x 2 + x + 8
= 2 ⋅ 10 + 9 ⋅ 10 + 6 ⋅ 10
8. 3(x3 + 2x + 2) + 8x4 − 6
8 x 4 + 3x 3 + 6 x For problems 3 and 4, evaluate the polynomial expression for x = 10. 3. 2x3 + 4x2 + 3x + 5
9. 0.2c(c3 − 3c) + 4 − 1.3 + 2c4 + 0.4c4 − 1.2c2
2435
2.6c 4 − 1.8c 2 + 2.7
For problems 10–15, state whether the expression is a polynomial expression. If it is a polynomial expression, state its degree. If it is not, explain how you know.
4. 2x3 + 9x2 + 6x
2960
10. y5 − 3y4 + y3 − y2 − 7y + 8 Yes; this is a polynomial expression of degree 5.
© Great Minds PBC
70
49
50
P R ACT I C E
11. 0.8b2 − 0.2b3 Yes; this is a polynomial expression of degree 3.
© Great Minds PBC
© Great Minds PBC
EUREKA MATH2 A1 ▸ M1 ▸ TA ▸ Lesson 3
EUREKA MATH2
A1 ▸ M1 ▸ TA ▸ Lesson 3
1
b. State the degree of the polynomial expression.
13. u 7 + u 4 − u2 + u + 7
12. 6 g 4 − g 5 No, this is not a polynomial expression.
We cannot add or multiply any numbers
EUREKA MATH2
A1 ▸ M1 ▸ TA ▸ Lesson 3
3
Yes; this is a polynomial expression of degree 7.
1
or variables to get the term −g 5 . 14. 2c 2 +
1 c − 1 c − c2 + 1 1 3 2 6
Yes, this is a polynomial expression of degree 2.
c. Evaluate the polynomial expression for x = 10. 15. x 3 − 5 +
1 x
1462
No, this is not a polynomial expression. We cannot add or multiply any numbers or variables to get the term 1x .
d. Describe how polynomial expressions in standard form can behave like integers in expanded form. Use your response from part (c) to support your answer. When polynomial expressions are written in standard form, the coefficient of each term quantifies the number of each unit, and the base raised to each power represents the unit. When integers are written in expanded form, the base is 10, so each coefficient provides the digit, and each power of 10 assigns the digit’s place value. We can add or subtract like units.
For problems 16–19, use the description to write a polynomial expression in standard form. 16. Three terms; degree 2 Sample: x2 − 5x + 2
17. Four terms; degree 8 Sample: 5x8 + 7x6 − 9x + 4
21. Consider the expression 2x5 +
+ 7.
a. What term can be placed in the box to make this a polynomial expression in standard form? 18. Three terms; degree 12 Sample: 9x12 − 6x5 + 6
Sample: −4x3
19. Five terms; degree 9 Sample: 9x9 + 8x7 − 6x5 + 8x3 + 6
b. What term cannot be placed in the box to make this a polynomial expression?
x
Sample:
20. Consider the polynomial expression 9 + x3 + 6x − 2x2 − 7 − x4 + 6x2 + x4. a. Write the polynomial expression in standard form.
x3 + 4 x2 + 6 x + 2
c. What term can be placed in the box to make this a polynomial expression that is not in standard form? Sample: 1 x 6 3
© Great Minds PBC
© Great Minds PBC
P R ACT I C E
51
52
P R ACT I C E
© Great Minds PBC
71
EUREKA MATH2
A1 ▸ M1 ▸ TA ▸ Lesson 3
EUREKA MATH2
A1 ▸ M1 ▸ TA ▸ Lesson 3
EUREKA MATH2
A1 ▸ M1 ▸ TA ▸ Lesson 3
For problems 28–31, find the product.
Lucas says that the expression 5a − 2a2 + 6a is a binomial expression in disguise because it can be rewritten as 11a − 2a2 when all the terms have been distributed and like terms have been combined. For problems 22–25, determine whether the expression is a binomial expression in disguise.
28. m(m − 4)
29. 6t(t + 3)
m2 − 4m
6t2 + 18t
30. n(10n2 − 7)
31. −2a2(1 − 5a)
22. 2 ⋅ 5x5 − 12x4 + 3x5 + 2x4
This is a binomial expression in disguise because it can be rewritten as 13x5 − 10x4 when all the terms have been distributed and like terms have been combined.
10n3 − 7n
23. t(t + 2) + 2(t + 2) − 4t
−2a2 + 10a3
This is a binomial expression in disguise because it can be rewritten as t2 + 4 when all the terms have been distributed and like terms have been combined. For problems 32 and 33, solve the equation. 32. −3x − 12 = −18
2
24. 5(b − 1) − 10(b − 1) + 100(b − 1) 2
This is not a binomial expression in disguise because it can be rewritten as 100b − 5b − 95 when all the terms have been distributed and like terms have been combined. This is a trinomial expression.
33. 24 = 9 − 6x
−
2
5 2
25. (2πr − πr2) ⋅ r − (2πr − πr2) ⋅ 2r
This is a binomial expression in disguise because it can be rewritten as πr3 − 2πr2 when all the terms have been distributed and like terms have been combined.
Remember For problems 26 and 27, evaluate. 26. 62.34 − (−5.66) + (−11.91)
56.09
© Great Minds PBC
72
27. −1.2 ⋅ 2.4 − 3.02
−5.9
P R ACT I C E
53
54
P R ACT I C E
© Great Minds PBC
© Great Minds PBC
EUREKA MATH2 A1 ▸ M1 ▸ TA ▸ Lesson 3 ▸ Polynomial Card Sort
7x − 2 x + 3
6(a − a2) + 10
1 2 h + 6 h 3 + 11 h + 4 2 2
4y2 + 12y − 1 − 9y−2
5k2 − 8k5 + 11k
r7 − 8r5 + 9r4 − 2
−f 3 + 1 f 2 − 2
© Great Minds PBC
5 2 f + 7f 2
1.2t2 − 0.7t + 9.8
This page may be reproduced for classroom use only.
73
4
Teacher Edition: Grade A1, Module 1, Topic A, Lesson 4 LESSON 4
Adding and Subtracting Polynomial Expressions Add and subtract polynomial expressions.
EUREKA MATH2
A1 ▸ M1 ▸ TA ▸ Lesson 4
Student Edition: Grade A1, Module 1, Topic A, Lesson 4 Name
Date
EXIT TICKET
4
Find the sum or difference. Combine like terms. 1. (w3 − 3w2 + 12w + 8) + (2w3 − 18w + 4)
(w3 − 3w 2 + 12 w + 8) + (2 w3 − 18w + 4 ) = w3 + 2 w3 − 3w 2 + 12 w − 18w + 8 + 4 = 3w3 − 3w 2 − 6 w + 12
Lesson at a Glance Students evaluate a complicated expression for values of x, which creates a need to write polynomial expressions with all terms distributed and all like terms combined. Students examine the process of adding numbers in base 10 written in expanded form and use the structure to make sense of adding polynomial expressions. Students then build procedural fluency by adding and subtracting polynomial expressions. They examine their work and apply the definition of polynomial expression to show that polynomial expressions are closed under addition and subtraction.
Key Questions
2. (w3 − 3w2 + 12w + 8) − (2w3 − 18w + 4)
(w3 − 3w2 + 12 w + 8) − (2 w3 − 18w + 4 ) = w3 − 3w 2 + 12 w + 8 − 2 w3 + 18w − 4
• How is adding or subtracting polynomial expressions similar to adding or subtracting integers?
= w3 − 2 w3 − 3w 2 + 12 w + 18w + 8 − 4 3
2
= −w − 3w + 30 w + 4
• Will adding or subtracting two polynomial expressions always result in a polynomial expression? Why?
Achievement Descriptors A1.Mod1.AD2 Identify polynomial expressions and explain why
they are closed under the operations of addition, subtraction, and multiplication. (A.APR.A.1) A1.Mod1.AD3 Add and subtract polynomial expressions. (A.APR.A.1)
© Great Minds PBC
61
© Great Minds PBC
EUREKA MATH2 A1 ▸ M1 ▸ TA ▸ Lesson 4
Agenda
Materials
Fluency
Teacher
Launch 5 min
• None
Learn 30 min
Students
• Find the Sum or Difference
• None
• Adding and Subtracting Polynomial Expressions
Lesson Preparation • None
Land 10 min
© Great Minds PBC
75
EUREKA MATH2
A1 ▸ M1 ▸ TA ▸ Lesson 4
Fluency
Teacher Note
Write Equivalent Expressions Students write equivalent expressions to prepare for formal work adding and subtracting polynomial expressions. Directions: Add like terms to write an equivalent expression.
Instead of this lesson’s Fluency, consider administering the Write Equivalent Expressions Sprint. Directions for administration can be found in the Fluency resource. EUREKA MATH2
A1 ▸ M1 ▸ Sprint ▸ Write Equivalent Expressions
A
Number Correct:
Rewrite each expression as an equivalent expression in standard form.
1. 2. 3.
2x + 5 + 4x − 3 6 − 8a + 8 + 4a −4m + 10c + 5m − c
6x + 2 −4a + 14 m + 9c
1.
76
2(z − 12) + 6z
8z − 24
5.
14 − 3(p + 4)
−3p + 2
6.
−4(x − y) + y + 9x
5x + 5y
23.
4x + 6x − 12x 4x + 6x − 4x
1+1+1
24.
3.
(1 + 1) + 1
25.
4.
(1 + 1) + (1 + 1)
26.
(4x + 3) + x
5.
(1 + 1) + (1 + 1 + 1)
27.
(4x + 3) + 2x
2.
4x + 6x + 4
x+x
28.
3x + (4x + 3)
7.
x+x+x
29.
6x + (4x + 3)
8.
(x + x) + x
30.
6x + (4 + 3x)
9.
(x + x) + (x + x)
31.
6x + (4 − 3x)
10.
(x + x) + (x + x + x)
32.
11.
(x + x) + (x + x + x + x)
33.
2x + (4 − 3x)
12.
2x + x
34.
(3x + 9) + (3x + 9)
13.
3x + x
35.
(3x − 9) + (3x − 9)
6.
4x + (4 − 3x)
x + 4x
36.
15.
x + 7x
37.
(3x − 9) − (3x + 9)
16.
2x + 7x
38.
(11 − 5x) + (4x + 2)
17.
7x + 3x
39.
(5x + 11) + (2 − 4x)
18.
10x − x
40.
(11 − 5x) − (2 − 4x)
19.
10x − 5x
41.
20.
10x − 10x
42.
(2x − 3y) + (4x − y)
21.
10x − 11x
43.
(2x − 3y) + (3y − 4x)
22.
10x − 12x
44.
(2x + 3y) − (2x − 3y)
14.
4.
1+1
418
(3x − 9) + (3x + 9)
(2x + 3y) + (4x + y)
© Great Minds PBC
© Great Minds PBC
EUREKA MATH2 A1 ▸ M1 ▸ TA ▸ Lesson 4
Launch
5
Students evaluate a complicated expression for values of x to understand the benefit of writing polynomial expressions with all terms expanded and all like terms combined. Direct students to complete problem 1. Consider having students work in groups of three or four, where each student evaluates one or two values of x for each expression. 1. Evaluate the following expressions for x = −3, x = −2, x = −1, x = 0, x = 1, x = 2, and x = 3.
Language Support Students are familiar with the academic verb evaluate from previous grades. Consider reviewing the meaning of the term by asking students to define it in their own words in the context of a short example. What does it mean to evaluate 3x − 2 for x = 4?
a. 3x(x − 3) + 2 + 2x − 5(x2 − 2x + 1) + 2(x2 − x + 2) + 1
3 (−3)((−3 ) − 3) + 2 + 2 (−3) − 5 ((−3)2 − 2 (−3) + 1) + 2 ((−3)2 − (−3) + 2) + 1 = −11 3 (−2)((−2) − 3) + 2 + 2 (−2) − 5 ((−2)2 − 2 (−2) + 1 ) + 2 ((−2)2 − (−2) + 2) + 1 = 0 3 (−1)((−1) − 3) + 2 + 2 (−1) − 5 ((−1)2 − 2 (−1) + 1) + 2 ((−1)2 − (−1) + 2) + 1 = 1 3 (0)((0) − 3) + 2 + 2 (0) − 5 ((0)2 − 2 (0) + 1 ) + 2 ((0)2 − (0) + 2) + 1 = 2 3 (1)((1) − 3) + 2 + 2 (1) − 5 ((1)2 − 2 (1) + 1) + 2 ((1)2 − (1) + 2) + 1 = 3 3 (2)((2) − 3) + 2 + 2 (2) − 5 ((2)2 − 2 (2) + 1) + 2 ((2)2 − (2) + 2) + 1 = 4 3 (3)((3) − 3) + 2 + 2 (3) − 5 ((3)2 − 2 (3) + 1) + 2 ((3)2 − (3) + 2) + 1 = 5
© Great Minds PBC
77
EUREKA MATH2
A1 ▸ M1 ▸ TA ▸ Lesson 4
b. x + 2
(−3) + 2 = −1 (−2) + 2 = 0 (−1) + 2 = 1 (0 ) + 2 = 2 (1) + 2 = 3 (2 ) + 2 = 4 (3) + 2 = 5 When groups have evaluated the expressions for all values of x, debrief their answers by using the following prompts. What do you notice about your answers to parts (a) and (b)? When I evaluate the two expressions for the same value of x, I get the same result. For example, if I evaluate both expressions for x = 2, the result is 4. Are these two expressions equivalent? How can you be sure? The expressions might be equivalent. I can be sure if I use properties and operations to convert one expression into the other. It might be helpful to rewrite the first expression by applying the distributive property and then combining like terms. Today, we will explore how to use addition and subtraction to rewrite polynomial expressions.
78
© Great Minds PBC
EUREKA MATH2 A1 ▸ M1 ▸ TA ▸ Lesson 4
Learn Find the Sum or Difference Students compare addition and subtraction of multi-digit numbers to addition of polynomial expressions. Present the problem 125 + 432, and have students think–pair–share about how to add these numbers mentally. Give students approximately 1 minute of think time to find the sum by using mental math. Then have students discuss their thinking with a partner. Circulate and listen as students talk. Identify one or two students to share their thinking. Intentionally choose students who discussed using place value to add. First, I add the hundreds digits, 1 + 4, and then I add the tens digits, 2 + 3. Next, I add the ones digits, 5 + 2. So my answer is 557. Summarize that the digits with the same place value are added when adding multidigit numbers. Have students work on problems 2–4 independently or with a partner. 2. Write 125 in expanded form.
125 = 1 ⋅ 102 + 2 ⋅ 10 + 5
3. Write 432 in expanded form.
432 = 4 ⋅ 102 + 3 ⋅ 10 + 2
UDL: Representation Consider color-coding the digits with the same place value and the terms with the same power of x to highlight the similarities between integers and polynomial expressions when applying the operation of addition.
4. Add the expanded forms of problems 2 and 3 to find the total sum.
(1 ⋅ 102 + 2 ⋅ 10 + 5) + ( 4 ⋅ 102 + 3 ⋅ 10 + 2) = (1 ⋅ 102 + 4 ⋅ 102 ) + (2 ⋅ 10 + 3 ⋅ 10) + ( 5 + 2 ) = 5 ⋅ 102 + 5 ⋅ 10 + 7 = 557 © Great Minds PBC
79
EUREKA MATH2
A1 ▸ M1 ▸ TA ▸ Lesson 4
Facilitate a class discussion by using the following prompt. Compare your work from problem 4 to adding 125 and 432. What do you notice? In problem 4, I added numbers that were multiplied by the same power of 10. When adding 125 and 432, I added digits with the same place value. When I write a number in expanded form, I am representing place value with a power of 10, so the process to add the numbers is the same. Use the following prompts to lead the class in solving problem 5. Can we combine the terms x2 and 2x? Why? No, we cannot combine these terms because they have different powers of x. They are not like terms.
Teacher Note Consider asking students to provide a nonverbal answer, such as a thumbs-up or thumbs-down, before asking the question, Can we combine the terms and ? This question is used as a check for understanding. Then ask the question, Why? Use this formative information to provide additional examples, if necessary.
Can we combine the terms 2x and 3x? Why? Yes, we can combine these terms because they have the same power of x. They are like terms. How can we rewrite the expression (x2 + 2x + 5) + (4x2 + 3x + 2) to make it simpler to add like terms? What properties can we use? We can use the commutative and associative properties to rewrite this expression as
(x 2 + 4 x 2 ) + ( 2 x + 3 x ) + ( 5 + 2 ) . After adding like terms, what is the sum (x2 + 2x + 5) + (4x2 + 3x + 2)? The sum is 5x2 + 5x + 7.
5. Find the sum (x2 + 2x + 5) + (4x2 + 3x + 2). Combine like terms.
( x 2 + 2 x + 5) + ( 4 x 2 + 3 x + 2) = ( x 2 + 4 x 2 ) + (2 x + 3 x ) + (5 + 2) 2
= 5x + 5x + 7
80
Teacher Note The process of adding polynomial expressions is analogous to integer addition, but it is not exactly the same. In base-ten addition, numerical expressions are regrouped when a digit is greater than 9. This is not true for base-x addition. For example, in 2x + 9x = 11x, the ten x’s are not regrouped into one x2. However, for 20 + 90 = 110, the ten 10’s are regrouped into one 100. This is also true for subtracting and multiplying polynomial expressions. The problems in this activity were intentionally selected because regrouping is not required.
© Great Minds PBC
EUREKA MATH2 A1 ▸ M1 ▸ TA ▸ Lesson 4
Debrief the work with the following prompts. What do you notice about your answers for problems 4 and 5? How are they similar? How are they different? Both answers have two 5’s and one 7. The expanded form of 557 looks like the polynomial expression, except that there are powers of 10 instead of powers of x. How is the process of adding polynomial expressions similar to the process for adding integers? When adding integers, we add digits with the same place value or power of 10. When adding polynomial expressions, we add terms with the same power of x. Have students work individually or in pairs on problems 6–8. Then lead the class in solving problem 9. Can we combine the terms 5x2 and −5x? Why? No, we cannot combine these terms because they have different powers of x. They are not like terms.
Promoting the Standards for Mathematical Practice When students use the analogous structure of numbers in base 10 and expressions in base x, they are looking for and making use of structure (MP7). Ask the following questions to promote MP7: • How can you use what you know about adding numbers in base 10 to help you with adding polynomial expressions? • How can you decompose and rearrange these polynomial expressions into groups of like terms?
Can we combine the terms 6x and −5x? Why? Yes, we can combine these terms because they have the same power of x. They are like terms. How can we rewrite the expression (5x2 + 6x + 3) − (2x2 + 5x + 1) to make it simpler to subtract like terms? What properties can we use? We can use the distributive, commutative, and associative properties to rewrite this expression as (5x2 − 2x2) + (6x − 5x) + (3 − 1). After combining like terms, what is the difference (5x2 + 6x + 3) − (2x2 + 5x + 1)? The difference is 3x2 + x + 2.
6. Write 563 in expanded form.
563 = 5 ⋅ 102 + 6 ⋅ 10 + 3 7. Write 251 in expanded form.
251 = 2 ⋅ 102 + 5 ⋅ 10 + 1 © Great Minds PBC
81
EUREKA MATH2
A1 ▸ M1 ▸ TA ▸ Lesson 4
8. Subtract the expanded form of problem 7 from the expanded form of problem 6. Write the difference in standard form.
(5 ⋅ 102 + 6 ⋅ 10 + 3) − (2 ⋅ 102 + 5 ⋅ 10 + 1) = (5 ⋅ 102 − 2 ⋅ 102 ) + (6 ⋅ 10 − 5 ⋅ 10) + (3 − 1) = 3 ⋅ 102 + 1 ⋅ 10 + 2 = 312 9. Find the difference (5x2 + 6x + 3) − (2x2 + 5x + 1). Combine like terms.
(5 x 2 + 6 x + 3) − (2 x 2 + 5 x + 1) = (5 x 2 − 2 x 2 ) + (6 x − 5 x ) + (3 − 1) = 3x 2 + x + 2
Debrief the work with the following prompts. What do you notice about your answers for problems 8 and 9? How are they similar? How are they different? Both answers have a 3, a 1, and a 2. The expanded form of 312 looks like the polynomial expression, except there are powers of 10 instead of powers of x. How is the process of subtracting polynomial expressions similar to the process of subtracting integers? When subtracting integers, we subtract digits with the same place value or power of 10. When subtracting polynomial expressions, we subtract terms with the same power of x.
82
© Great Minds PBC
EUREKA MATH2 A1 ▸ M1 ▸ TA ▸ Lesson 4
Adding and Subtracting Polynomial Expressions Students build fluency in adding and subtracting polynomial expressions. Present problems 10–20 to students. The problems gradually increase in complexity, and students may not be able to complete all problems. Consider flexible working groups that allow students to work independently or with the support of a partner or group. All students should complete at least problems 10–13 and problem 20. For problems 10–20, find the sum or difference. Write your answer as a polynomial expression in standard form. 10. (2x2 + 1) + (5x2 + 7)
Differentiation: Support
(2 x 2 + 1) + (5 x 2 + 7) = (2 x 2 + 5 x 2 ) + (1 + 7) = 7 x2 + 8 11. (3x3 + 8x2) − (x3 + 6x2)
(3 x 3 + 8 x 2 ) − ( x 3 + 6 x 2 ) = (3 x 3 − x 3 ) + ( 8 x 2 − 6 x 2 ) = 2 x3 + 2 x2
Encourage students who are having difficulty adding polynomial expressions to rewrite the expressions so that like terms are adjacent. For example, rewriting (−2x7 + 7x4) + (5x4 − 9x2 + 3x7) as (−2x7 + 3x7) + (7x4 + 5x4) + (−9x2) will help students see which terms can be combined and which terms cannot be combined.
12. (3x5 + 4x2 + 6x) + (2x5 + 8x2 + 5x)
(3 x 5 + 4 x 2 + 6 x ) + ( 2 x 5 + 8 x 2 + 5 x ) = (3 x 5 + 2 x 5 ) + ( 4 x 2 + 8 x 2 ) + (6 x + 5 x ) = 5 x 5 + 12 x 2 + 11x 13. (4x5 + 9x3 + 11) − (x4 + 7x3 + 10)
( 4 x 5 + 9 x 3 + 11) − ( x 4 + 7 x 3 + 10) = 4 x 5 − x 4 + (9 x 3 − 7 x 3 ) + (11 − 10) = 4 x5 − x 4 + 2 x3 + 1
© Great Minds PBC
83
EUREKA MATH2
A1 ▸ M1 ▸ TA ▸ Lesson 4
14. (9x2 − 1) + (5x2 + 10)
(9 x 2 − 1) + (5 x 2 + 10) = (9 x 2 + 5 x 2 ) + (−1 + 10) = 14 x 2 + 9 15. (−4x7 + 12x2) − (3x7 − 7x2)
(− 4 x 7 + 12 x 2 ) − (3 x 7 − 7 x 2 ) = (−4 x 7 − 3 x 7) + ( 12 x 2 + 7 x 2 ) = −7 x 7 + 19 x 2 16. (−3x3 + 4x4 + 6x) + (2x − x3 − 5x4)
(−3 x 3 + 4 x 4 + 6 x) + (2 x − x 3 − 5 x 4 ) = ( 4 x 4 − 5 x 4 ) + ( −3 x 3 − x 3 ) + ( 6 x + 2 x ) = −x 4 − 4 x 3 + 8 x
17. (12x2 − 8x5 + 1) − (−7 + 9x2 − 10x5)
(12 x 2 − 8 x 5 + 1) − (−7 + 9 x 2 − 10 x 5 ) = (− 8 x 5 + 10 x 5 ) + (12 x 2 − 9 x 2 ) + (1 + 7 ) = 2 x 5 + 3x 2 + 8
84
© Great Minds PBC
EUREKA MATH2 A1 ▸ M1 ▸ TA ▸ Lesson 4
18. (7x3 + 9x2 + 4) + (4x3 + 7)
( 7 x 3 + 9 x 2 + 4 ) + ( 4 x 3 + 7) = (7 x 3 + 4 x 3 ) + 9 x 2 + ( 4 + 7 ) = 11x 3 + 9 x 2 + 11
19. (x9 + 3x8 + 6x7) − (2x7 + 5x8)
( x 9 + 3 x 8 + 6 x 7 ) − ( 2 x 7 + 5 x 8 ) = x 9 + (3 x 8 − 5 x 8 ) + ( 6 x 7 − 2 x 7 ) = x 9 − 2 x8 + 4 x 7
20. 3x(x − 3) + 2 + 2x − 5(x2 − 2x + 1) + 2(x2 − x + 2) + 1
3 x ( x − 3) + 2 + 2 x − 5 ( x 2 − 2 x + 1) + 2 ( x 2 − x + 2) + 1 = 3 x 2 − 9 x + 2 +3 x2 (xx−−53x)2 + + 210+x 2−x 5−+5 2( xx22 − − 22xx + + 14) + 12 ( x 2 − x + 2) + 1 2 2 x x−−5 x22x )++10(2x − 45 + 24x+ − ) 3+x 2(−99xx++22x + 1) 2 x + 4 + 1 = (3 x 2 − 5 x 2 + 2 x= + 210
= x +2
= (3 x 2 − 5 x 2 + 2 x 2 ) + (−9 x + 2 x + 10 x − 2 x ) + (2 − 4 + 4 + 1) = x+2
© Great Minds PBC
85
A1 ▸ M1 ▸ TA ▸ Lesson 4
EUREKA MATH2
Have students check their work for accuracy. Then guide students to notice that the answer to problem 20 is the expression found in problem 1(b). Ask them to consider whether the expressions 3x(x − 3) + 2 + 2x − 5(x2 − 2x + 1) + 2(x2 − x + 2) + 1 and x + 2 are equivalent. Direct students to examine their work for problems 10–20. Ask students to consider, based on their work, whether adding or subtracting polynomial expressions will always result in a polynomial expression. If they think the result is always a polynomial, students should provide a reason why they think this is true. If they think the result is not always a polynomial, students should find a counterexample. Allow students time to think, and have them give a signal when they have an idea. Then have students share their thoughts with a partner.
Land Debrief 5 min Objective: Add and subtract polynomial expressions. Review the definition of polynomial expression with students. Allow students to reference their bubble map from lesson 3. A polynomial expression is a number or variable symbol, or it is the result of multiplying or adding two previously generated polynomial expressions. Ask students to consider how they could use the definition of polynomial expression to show that adding polynomial expressions will always result in a polynomial expression. Allow students time to think, and have them give a signal when they have an idea. Then have them share their thoughts with a partner. Facilitate a class discussion, asking for volunteers to share their thinking and encouraging students to build on one another’s responses.
86
© Great Minds PBC
EUREKA MATH2 A1 ▸ M1 ▸ TA ▸ Lesson 4
According to the definition of polynomial expression, if we add two polynomial expressions, will the result always be a polynomial expression? Why? Adding two polynomial expressions will always result in a polynomial expression. This is because the definition says that a polynomial expression can be the result of adding two previously generated polynomial expressions. Now ask students to consider how they could use the definition of polynomial expression to show that subtracting polynomial expressions will always result in a polynomial expression. Follow the same process of allowing students to think independently and share their thoughts with a partner before facilitating a discussion. According to the definition of polynomial expression, if we subtract two polynomials, will the result always be a polynomial expression? Why? Subtracting two polynomial expressions will always result in a polynomial expression. This is because subtracting a polynomial expression is the same as adding the product of that expression and −1. Because multiplication of a polynomial expression and a number is a polynomial expression, we are adding two polynomial expressions. Then use the following question to summarize the lesson. How is adding or subtracting polynomial expressions similar to adding or subtracting integers? When adding or subtracting polynomial expressions, we add or subtract terms with the same power of x. When adding or subtracting integers, we add or subtract digits with the same power of 10 or place value.
Exit Ticket 5 min Provide up to 5 minutes for students to complete the Exit Ticket. It is possible to gather formative data even if some students do not complete every problem.
© Great Minds PBC
Teacher Note Assign the Practice problems for completion outside of class or use them in class if time remains after the lesson. Refer students to the Recap for support.
87
EUREKA MATH2
A1 ▸ M1 ▸ TA ▸ Lesson 4
Recap
EUREKA MATH2
A1 ▸ M1 ▸ TA ▸ Lesson 4
Student Edition: Grade A1, Module 1, Topic A, Lesson 4 Name
RECAP Date
4
EUREKA MATH2
A1 ▸ M1 ▸ TA ▸ Lesson 4
For problems 3–5, rewrite the polynomial expression in standard form. 3. (4p2 − 9p + 2) − (2p2 + 8p − 6)
( 4 p 2 − 9 p + 2 ) − (2 p 2 + 8 p − 6 ) = 4 p 2 − 9 p + 2 − 2 p 2 − 8 p + 6
Adding and Subtracting Polynomial Expressions
= 4 p2 − 2 p2 − 9 p − 8 p + 2 + 6
In this lesson, we •
compared the addition and subtraction of polynomial expressions to the addition and subtraction of multi-digit numbers in expanded form.
•
added and subtracted polynomial expressions.
= 2 p2 − 17 p + 8
Use the distributive property to rewrite
−(2p2 + 8p − 6) as −2p2 − 8p + 6.
4. (w4 + 6 − w2) + (12 − w2 + 6w + 4w3)
(w 4 + 6 − w2 ) + (12 − w 2 + 6 w + 4 w3 ) = w 4 + 4 w3 − w 2 − w 2 + 6 w + 6 + 12
Examples
= w 4 + 4 w3 − 2 w 2 + 6 w + 18
For problems 1 and 2, find the sum. Combine like terms. 1. (5 ⋅ 102 + 2 ⋅ 10 + 3 ⋅ 1) + (1 ⋅ 102 + 4 ⋅ 10 + 5 ⋅ 1)
(5 ⋅ 102 + 2 ⋅ 10 + 3 ⋅ 1) + (1 ⋅ 102 + 4 ⋅ 10 + 5 ⋅ 1) = 5 ⋅ 102 + 1 ⋅ 102 + 2 ⋅ 10 + 4 ⋅ 10 + 3 ⋅1 1 + 5 ⋅1
5. 1 (−15 + 6 y) − (−5 y + 3 − 6 y 2 )
= (5 + 1) ⋅ 102 + (2 + 4 ) ⋅ 10 + (3 + 5) ⋅ 1
3
= 6 ⋅ 102 + 6 ⋅ 10 + 8 ⋅ 1
1 (−15 + 6 y ) − (−5 y + 3 − 6 y2 ) = −5 + 2 y + 5 y − 3 + 6 y2 3 2
= 6 y + 2 y + 5y − 5 − 3 = 6 y2 + 7 y − 8
2
2
2. (5x + 2x + 3) + (x + 4x + 5)
(5 x 2 + 2 x + 3) + ( x 2 + 4 x + 5) = 5 x 2 + x 2 + 2 x + 4 x + 3 + 5 = (5 + 1) ⋅ x 2 + (2 + 4 ) ⋅ x + (3 + 5) = 6x2 + 6x + 8
Polynomial expressions are closed under addition and subtraction.
Adding the digits of terms with the same place value in a multi-digit number is similar to adding the coefficients of terms with the same degree
The sum or difference of two polynomial expressions is always a polynomial expression.
in a polynomial expression.
© Great Minds PBC
88
63
64
RECAP
© Great Minds PBC
© Great Minds PBC
EUREKA MATH2 A1 ▸ M1 ▸ TA ▸ Lesson 4
Sample Solutions Expect to see varied solution paths. Accept accurate responses, reasonable explanations, and equivalent answers for all student work.
EUREKA MATH2
A1 ▸ M1 ▸ TA ▸ Lesson 4
Student Edition: Grade A1, Module 1, Topic A, Lesson 4 Name
PRACTICE Date
4
A1 ▸ M1 ▸ TA ▸ Lesson 4
8. Describe how adding and subtracting polynomial expressions is similar to adding and subtracting whole numbers. Use your responses from problems 2 and 3 to support your answer. When adding or subtracting polynomial expressions, I add or subtract terms of the same degree. When adding or subtracting whole numbers, I add or subtract according to place value. Place value is determined by the powers of base 10. Adding or subtracting according to place value is the same as adding or subtracting terms of the same power of 10.
For problems 1 and 2, write the number in expanded form. 1. 306
3 ⋅ 102 + 6 ⋅ 1
EUREKA MATH2
2. 1042
1 ⋅ 103 + 4 ⋅ 10 + 2 ⋅ 1
For problems 3–7, find the sum or difference. Combine like terms.
9. Consider the polynomial expression (3n2 − 7n − 4) + (−4n + 9 + n2) + (8n + 5).
3. 80,463 + 2510
a. Evaluate the expression for n = 10.
82,973
380
4. (8 ⋅ 104 + 4 ⋅ 102 + 6 ⋅ 10) + (2 ⋅ 103 + 5 ⋅ 102 + 1 ⋅ 10)
b. Rewrite the expression in standard form.
4 n2 − 3n + 10
8 ⋅ 10 4 + 2 ⋅ 103 + 9 ⋅ 102 + 7 ⋅ 10 5. (4 ⋅ 103 + 2 ⋅ 102 + 9 ⋅ 10 + 5 ⋅ 1) − (3 ⋅ 103 + 2 ⋅ 102 + 5 ⋅ 10 + 3 ⋅ 1)
c. Evaluate your answer to part (b) for n = 10.
380
3
1 ⋅ 10 + 4 ⋅ 10 + 2 ⋅ 1 6. (8x4 + 4x2 + 6x + 3) + (2x3 + 5x2 + 1x)
d. Explain why it is useful to combine like terms in polynomial expressions. Use parts (a)–(c) to support your explanation.
8x 4 + 2 x3 + 9 x 2 + 7 x + 3
Having fewer terms makes the expression easier to evaluate for a value of the variable. 7. (4x3 + 2x2 + 9x + 5) − (3x3 + 2x2 + 5x + 3) For problems 10–14, rewrite the polynomial expression in standard form.
x3 + 4 x + 2
10. (2y2 + 6y − 4) + (−y2 − 4y + 7)
y2 + 2 y + 3
© Great Minds PBC
© Great Minds PBC
65
66
P R ACT I C E
© Great Minds PBC
89
EUREKA MATH2
A1 ▸ M1 ▸ TA ▸ Lesson 4
EUREKA MATH2
A1 ▸ M1 ▸ TA ▸ Lesson 4
EUREKA MATH2
A1 ▸ M1 ▸ TA ▸ Lesson 4
16. Find a polynomial expression that, when added to 8p3 + 4p − 7, results in a sum of 14p3 + 6p + 8.
11. (5 − 6q − 8q2) − (14q2 + 2)
−22 q 2 − 6 q + 3
6 p3 + 2 p + 15
12. (d − 4 d 2 + 8d 3 ) + 3 (−16 d + 32 d 2 ) 4
3
2
8d + 20 d − 11d 17. Consider the expression (8x2 − 3x + 1) + (−8x 13.
( 23 h − 3 h + 12) + ( 25 h − 6) 3
−
+ 2x − 4).
a. What values for the unknown exponent would make this a trinomial expression when written in standard form?
3
0 or 1
13 3 h + 2h + 6 3 5
14. (6 − 3b2) − (5b5 − 9b + 2b2) − (2b − b2 + 7)
−5b5 − 4 b2 + 7b − 1
b. What values for the unknown exponent, when substituted into the box, would make this a polynomial expression with four terms when written in standard form? Any integer 3 or higher 2
15. Write a polynomial expression in standard form for the perimeter of the triangle, where x > 3 .
A
4x + 6
3x – 2
c. What values for the unknown exponent would make this a binomial expression when written in standard form?
2 B
C 2x + 8
9 x + 12 © Great Minds PBC
90
P R ACT I C E
67
68
P R ACT I C E
© Great Minds PBC
© Great Minds PBC
EUREKA MATH2 A1 ▸ M1 ▸ TA ▸ Lesson 4
EUREKA MATH2
A1 ▸ M1 ▸ TA ▸ Lesson 4
EUREKA MATH2
A1 ▸ M1 ▸ TA ▸ Lesson 4
Remember
18. Emma wrote a 5th-degree polynomial expression. Tiah wrote a 3rd-degree polynomial expression.
For problems 19 and 20, evaluate.
a. Is the sum of their expressions a polynomial expression? Explain.
19. −
Sample: Yes, the sum of their expressions is a polynomial expression. This is because the definition of a polynomial expression says that a polynomial expression can be the result of adding two previously generated polynomial expressions.
3 2 + 5 4
20.
7 20
4 + 9
−
(− 23 ) − 271
7 27
b. Is the difference of their expressions a polynomial expression? Explain. Sample: Yes, the difference of their expressions is a polynomial expression. This is because the definition of a polynomial expression says that a polynomial expression can be the result of adding two previously generated polynomial expressions. Subtracting an expression is the same as adding the product of that expression and −1. Based on the definition, this is also a polynomial expression.
21. Show that 7 + 2m + 6m(m + 3) and 6m2 + 20m + 7 are equivalent expressions. State the property or operation used in each step.
7 + 2 m + 6 m(m + 3) = 7 + 2 m + 6 m 2 + 18m = 7 + 2 m + 18m + 6 m 2 = 7 + 20 m + 6 m 2 = 6 m 2 + 20 m + 7
Distributive property Commutative property of addition Addition of like terms Commutative property of addition
c. What is the degree of the sum of their expressions? For problems 22 and 23, solve the equation.
5
22. −2(3x − 2) = 28
−4
23. 5(2x + 4) − 12x = −6
13
d. What is the degree of the difference of their expressions?
5
© Great Minds PBC
© Great Minds PBC
P R ACT I C E
69
70
P R ACT I C E
© Great Minds PBC
91
5
Teacher Edition: Grade A1, Module 1, Topic A, Lesson 5 LESSON 5
Multiplying Polynomial Expressions Multiply polynomial expressions.
EUREKA MATH2
A1 ▸ M1 ▸ TA ▸ Lesson 5
Student Edition: Grade A1, Module 1, Topic A, Lesson 5 Name
Date
EXIT TICKET
5
Find the product. Write your answer in standard form.
(a − 6)(3a + 4)
( a − 6)(3a + 4 ) = a(3a + 4 ) − 6(3a + 4 ) = 3a 2 + 4 a − 18a − 24
Lesson at a Glance Students use their previous experience with the area model to multiply integers and build connections between integer multiplication and polynomial multiplication. Then students make connections between a tabular model and the algebraic method of applying the distributive property by using both methods to multiply polynomial expressions.
Key Questions
= 3a 2 − 14 a − 24
• Compare using a tabular model and the algebraic method of applying the distributive property. What are the advantages and disadvantages of each? • How is polynomial multiplication similar to integer multiplication? • Will the product of two polynomial expressions always be a polynomial expression? Why?
Achievement Descriptors A1.Mod1.AD2 Identify polynomial expressions and explain why
they are closed under the operations of addition, subtraction, and multiplication. (A.APR.A.1) A1.Mod1.AD4 Multiply polynomial expressions. (A.APR.A.1)
© Great Minds PBC
75
© Great Minds PBC
EUREKA MATH2 A1 ▸ M1 ▸ TA ▸ Lesson 5
Agenda
Materials
Fluency
Teacher
Launch 5 min
• None
Learn 30 min
Students
• From Area Model to Tabular Model
• None
• From Tabular Model to Algebraic Method
Lesson Preparation
Land 10 min
• None
© Great Minds PBC
93
EUREKA MATH2
A1 ▸ M1 ▸ TA ▸ Lesson 5
Fluency Apply the Distributive Property Students apply the distributive property to prepare for multiplying any two polynomial expressions. Directions: Apply the distributive property to write an equivalent expression. 1.
6(a − 4)
6a − 24
Teacher Note Instead of this lesson’s Fluency, consider administering the Apply the Distributive Property Sprint. Directions for administration can be found in the Fluency resource. EUREKA MATH2
A1 ▸ M1 ▸ Sprint ▸ Apply the Distributive Property
A
Number Correct:
Apply the distributive property and combine like terms.
2. 3. 4. 5. 6.
−3(8 − n) y(y + 10) (2z − 3)z 5m(m + 7) −6c (4c + 2)
−24 + 3n y2 + 10y 2z2 − 3z 2
5m + 35m −24c2 − 12c
1.
1(x + 1)
23.
2.
1(x + 2)
24.
3.
1(x + 3)
25.
(9 − x)x
4.
2(x − 1)
26.
x(5x + 2)
5.
2(x − 2)
27.
5x(x − 2)
6.
2(x − 3)
28.
(−5x + 2)(−x)
7.
3(2x + 1)
29.
2x(6x − 1)
8.
3(2x + 2)
30.
(−6x − 1)(2x)
9.
3(2x + 3)
31.
−6x(2x + 1)
10.
4(2x − 1)
32.
11.
4(2x − 2)
33.
10x(3x − 4)
12.
3(3x + 6)
34.
−(6 + 5x) + 6
13.
3(3x − 6)
35.
−(5x − 6) + 6
14.
−3(3x − 6)
36.
15.
(−3x + 6)(−3)
37.
4(x + 3) + 2x
16.
4(5x − 3)
38.
−4(x − 3) + 2x
17.
−4(5x + 3)
39.
18.
−4(−5x − 3)
40.
2x − 4(−x + 3)
19.
(−5x + 3)(−4)
41.
2x(6x + 1) + 4x
20.
x(x − 9)
4x(10 − 3x)
6 − (−5x + 6)
2x + 4(3 − x)
(x − 10)(−1)
42.
6x + 2x(4x − 1)
21.
−(x + 10)
43.
4x(6x − 1) − 2x
22.
−(−x − 10)
44.
4x − 2x(6x − 1)
394
94
x(x + 9)
© Great Minds PBC
© Great Minds PBC
EUREKA MATH2 A1 ▸ M1 ▸ TA ▸ Lesson 5
Launch
5
Students think deeply about multiplying integers. Present the following problem and use the Math Chat routine to engage students in mathematical discourse.
27 ⋅ 13
Give students 1 minute to use mental math to multiply 27 and 13. Tell students to give a silent signal to indicate they are finished. Have students discuss their thinking with a partner. Circulate as students work, and listen for strategies that are related to the following expressions: • 20(13) + 7(13) • 27(10) + 27(3) • 25(13) + 2(13) • (20 + 7)(10 + 3) Identify a few students to share their thinking. Purposefully choose students whose work allows for rich discussion about connections between strategies. Invite students to share their thinking with the class. Scaffold the sharing in such a way that (20 + 7)(10 + 3) is showcased last. If students do not mention this strategy, guide the discussion in that direction. Today, we will use our understanding of multiplying by using the area model to multiply polynomial expressions by using the distributive property.
© Great Minds PBC
95
EUREKA MATH2
A1 ▸ M1 ▸ TA ▸ Lesson 5
Learn
From Area Model to Tabular Model Students make connections between multiplying integers by using the area model and multiplying polynomial expressions by using a tabular model. Display the area model from problem 1.
20
7
10
3 Then ask the following questions. What multiplication expression represents the multiplication shown in the area model?
27(13) (20 + 7)(10 + 3) How is place value thinking used in the area model? Each factor is decomposed into place value parts. Guide students in completing part (a).
96
© Great Minds PBC
EUREKA MATH2 A1 ▸ M1 ▸ TA ▸ Lesson 5
1. Consider the area model shown. a. Determine the partial products and record them on the area model.
20
7
200
70
10
60
21
3
b. What is the product of 2 7and 1 3? 351 Use the answer from part (a) and the following prompt to find the sum of the partial products that lie on each diagonal. Show the hundreds group, then the tens group, followed by the ones group to guide students through finding the sum of the numbers that lie on each diagonal.
s ed dr n hu 200
20
7
200
70
10
60
21
3
es on
s ten
130 © Great Minds PBC
21 97
EUREKA MATH2
A1 ▸ M1 ▸ TA ▸ Lesson 5
Have students complete part (b). After most students have finished, ask the following questions. From your area model, how do you know that 2 7 ⋅ 13 = 351? The sum of the partial products is 3 51.
The sum of the areas of the four smaller rectangles is 3 51. The sum of the hundreds, tens, and ones is 3 51. How does finding the sum of the numbers that lie on each diagonal help us determine the product? It tells us the sum of all the hundreds, the sum of all the tens, and the sum of all the ones. When I add these three sums, the result is equal to the product of 2 7and 1 3.
Display the area model showing 2 7 ⋅ 13in base 1 0.
2 . 102
13 . 10
20 . 10
7
2 . 102
7 . 10
1 . 10
6 . 10
21
3
21
What do you notice? I notice that some numbers are written in expanded form. I notice that some numbers are written as a number times a power of 10. Exponents are used. Some of the partial products look like they are written in scientific notation. There’s no final answer for the product shown. 98
© Great Minds PBC
EUREKA MATH2 A1 ▸ M1 ▸ TA ▸ Lesson 5
What do you wonder? I wonder why we would ever write the numbers this way? Does this area model represent the same problem we just completed? Does this give the same answer as the problem we just completed? Display the equation in expanded form.
(2 ⋅ 10 + 7)(1 ⋅ 10 + 3)= 2 ⋅ 10 2+ 13 ⋅ 10 + 21
The left side of the equation shows the factors27and 1 3in expanded form. The right side of the equation shows the product in expanded form, which represents 2 groups of 102, 1 3groups of 10, and 2 1groups of 1. In previous grades, we used the area model to multiply whole numbers. We use a tabular model to multiply polynomial expressions. A tabular model is similar to the area model because we calculate the partial products and add the partial products to find the total. A tabular model is different from the area model because it allows us to work with negative values.
Teacher Note Students were introduced to a tabular model in grade 7.
UDL: Representation
Let’s write the equation in base x . Annotating a tabular model draws students’ attention to the like terms that lie on the diagonals.
Have students complete problem 2 with a partner. 2. Consider the tabular model shown. a. What multiplication expression is represented by the tabular model? (2x + 7)(1x + 3) b. Determine the partial products and record them on the tabular model.
2x2 13x
2x
7
2x2
7x
1x
6x
21
3
21
c. Write the equation that is represented by the tabular model. (2x + 7)(1x + 3)= 2 x 2+ 13x + 21 © Great Minds PBC
99
EUREKA MATH2
A1 ▸ M1 ▸ TA ▸ Lesson 5
When students are finished, debrief by asking the following questions. The 2 ⋅ 10in the first expression is like 2xin the second expression, and the 2 ⋅ 10 + 7 in the first expression is like 2x + 7in the second expression. What is similar about the expressions ( 2 · 10 + 7)(1 · 10 + 3) and ( 2x + 7)(1x + 3)?
What is different about the expressions ( 2 · 10 + 7)(1 · 10 + 3) and ( 2x + 7)(1x + 3)? The first expression is in base 1 0, and the second expression is in base x. The first expression shows the factors decomposed into tens and ones. The second expression has factors separated into x’s and ones. Direct students’ attention to problem 3. How is the expression ( 4x + 1)(2x − 5) in problem 3 different from the expressions in problems 1 and 2? One of the terms in one of the polynomial expressions is negative. One of the binomial factors has a subtraction sign. Have students draw and label a tabular model for problem 3. Then have them compare their models with a partner before having them complete problem 3 and move on to problem 4. Circulate as students work, asking the following questions: • What is the product of ___ and ___? • How do you use the four partial products to determine the total product? • How do you write the product in standard form? 3. Use a tabular model to determine the product ( 4x + 1)(2x − 5) in standard form.
4x
1
8x2
2x
2x
8x2
–20x
–5
–5
–18x
–5
8 x 2− 18x − 5 100
© Great Minds PBC
EUREKA MATH2 A1 ▸ M1 ▸ TA ▸ Lesson 5
4. Use a tabular model to determine the product ( x − 1)(3x − 7) in standard form.
x
–1
3x2
–3x
3x
3x2
–7x
+7
–7
–10x
7
3 x 2− 10x + 7 When students are finished, bring the class together by asking the following question. What are the advantages of multiplying polynomials with a tabular model? A tabular model shows how each factor is decomposed. A tabular model helps us organize our work. A tabular model shows each partial product.
From Tabular Model to Algebraic Method Students describe connections between a tabular model and the algebraic method of applying the distributive property. Display the following tabular model and expressions.
© Great Minds PBC
x
–1
3x 2
–3x
3x
–7x
+7
–7
(x − 1)(3x − 7) (x − 1)(3x) + (x − 1)( − 7)
101
EUREKA MATH2
A1 ▸ M1 ▸ TA ▸ Lesson 5
Then use the following questions to facilitate a discussion. What is being distributed? How do you know? The expression x − 1is being distributed. In the tabular model I see x − 1 being multiplied by 3 xand x − 1being multiplied by −7. The expression x − 1is being distributed. In the expressions I see x − 1being multiplied by 3 xand x − 1being multiplied by − 7. How are the visual and algebraic representations similar? Both show x − 1being distributed to the 3 xand to the − 7. Display the tabular model and expressions.
x
–1
3x 2
–3x
–7x
+7
3x –7
(x − 1)(3x − 7) (x )( 3x − 7)+ ( − 1)( 3x − 7)
What is being distributed? How do you know? The expression 3 x − 7is being distributed. In the tabular model I see 3 x − 7 being multiplied by x and 3 x − 7being multiplied by −1. The expression 3 x − 7is being distributed. In the expressions I see 3 x − 7being multiplied by x and 3 x − 7being multiplied by − 1. How are the visual and algebraic representations similar? Both show 3 x − 7being distributed to the x and to the − 1. How does a tabular model help show the distributive property? A tabular model helps organize the multiplication of terms. I see the distributive property in a tabular model when I multiply each term on the top by each term on the side. Have students record the two applications of the distributive property by completing problem 5 with a partner.
102
© Great Minds PBC
EUREKA MATH2 A1 ▸ M1 ▸ TA ▸ Lesson 5
5. Consider the expression ( x − 1)(3x − 7). a. Multiply by distributing x − 1.
(x − 1) (3x − 7) = (x − 1) (3x) + (x − 1) (−7) = 3x 2 − 3x − 7x + 7 = 3x 2 − 10x + 7 b. Multiply by distributing 3 x − 7.
(x − 1) (3x − 7) = x (3x − 7) + (−1) (3x − 7) = 3x 2 − 7x − 3x + 7 = 3x2 − 10x + 7 After students finish, have them verify that the product is the same when using a tabular model or the algebraic method. When multiplying polynomial expressions, do you prefer to use a tabular model or the algebraic method of applying the distributive property? Turn and talk to your partner. Invite students to complete problem 6 with a partner. Circulate as students work, asking questions such as the following: • When distributing, what do you multiply x + 2with? How do you know? • When distributing, what do you multiply x 2 − x − 5with? How do you know? • When determining the product, does it matter which expression you choose to distribute? Why? 6. Consider the expression ( x + 2)( x 2 − x − 5).
Differentiation: Support
a. Multiply by distributing x + 2.
(x + 2) (x 2 − x − 5) = (x + 2)(x 2) + (x + 2)(−x) + (x + 2)(−5) = x3 + 2x2 − x2 − 2x − 5x − 10 = x 3 + x2 − 7x − 10 b. Multiply by distributing x 2 − x − 5.
(x + 2) (x2 − x − 5) = x (x2 − x − 5) + 2(x2 − x − 5)
If students need additional support using the distributive property algebraically, move them forward by having them sketch a tabular model. Consider deepening comprehension by having students complete the problem by using both a tabular model and the algebraic method.
= x3 − x2 − 5x + 2x2 − 2x − 10 = x3 + x2 − 7x − 10 © Great Minds PBC
103
EUREKA MATH2
A1 ▸ M1 ▸ TA ▸ Lesson 5
When students are finished, bring the class together and ask the following question. Does it matter which expression you choose to distribute when multiplying two polynomials? Why? No. The partial products and the final product are the same regardless of which expression I choose to distribute. Display Lucas’s work.
Luca’s Work
5x3 -17x ?
5x
3
5x3
3x2
x2
-20x
-12
-4
-12
(5x + 3)(x2 - 4) = 5x3 - 17x - 12 Invite students to think–pair–share about the following prompt. Lucas is working to find the product ( 5x + 3)( x 2− 4). Explain the error Lucas made and how to fix it. Lucas added 3 x 2and − 20xto get − 17x, but 3 x 2 + (−20x) does not equal − 17x. Because they are not like terms, they cannot be rewritten as a single term. The answer should be 5 x 3+ 3 x 2− 20x − 12.
104
Promoting the Standards for Mathematical Practice When students describe the error made by Lucas and explain how to fix it, they are critiquing the reasoning of others (MP3). Ask the following questions to promote MP3: • What parts of Lucas’s solution strategy do you question? Why? • Is your description of the error made by Lucas a guess, or do you know for sure? Explain. • How would you change Lucas’s work to make it more accurate?
© Great Minds PBC
EUREKA MATH2 A1 ▸ M1 ▸ TA ▸ Lesson 5
Display Ana’s and Conor’s work.
Conor’s Work
Ana’s Work
x2
0x
-4
3
3x2
0x
-12
5x
5x3
0x2
-20x
5x3
3x2
-12
(5x + 3)(x2 - 4) (5x + 3)(x2 ) + (5x + 3)(-4) 5x3 + 3x2 + (-20x) - 12
-20x
Ana and Conor also found the product ( 5x + 3)( x 2 − 4). Did Ana and Conor get the same product? Yes. What did Conor distribute? He distributed the 5 x + 3. How does Ana write the expression x 2− 4in her tabular model? She writes x 2− 4as x 2+ 0x − 4. What does the coefficient of 0 mean? The coefficient of 0 means that there is no x -term. What is a benefit of including the term 0 xin the expression x 2 + 0x − 4 when using a tabular model? The partial products that are like terms line up on the diagonals.
© Great Minds PBC
105
A1 ▸ M1 ▸ TA ▸ Lesson 5
EUREKA MATH2
Did we need to include the term that is missing from the polynomial as 0 x? Why? No, because it is a placeholder that ensures the like terms line up on the diagonals. We can still use a tabular model without including the term0 xas long as we’re careful when adding the partial products. We can only add terms if they have the same power of x. Some may find it helpful to include the term 0 x, which we can refer to as a missing term, when using a tabular model because the like terms will line up along the diagonals of the tabular model. However, it is not necessary to include the term 0 x when using a tabular model. In Conor’s method of using the distributive property, there is no advantage to including a missing term because the product of the missing term and the other terms will be 0 . Including the missing term adds unnecessary steps in finding the product.
Land Debrief 5 min Objective: Multiply polynomial expressions. Initiate a class discussion by using the prompts below. Encourage students to restate their classmates’ responses. Compare a tabular model and the algebraic method of applying the distributive property. What are the advantages and disadvantages of each? A tabular model can help organize our work by providing a box for each product we must find. It’s possible to make a mistake with a tabular model if there is a term missing. For example, 3 x 2+ 2is missing a term; writing in 0 xto represent the missing term is helpful for aligning the like terms so we can add the values on the diagonal correctly. The algebraic method does not have the missing term problem that a tabular model does, but we can easily skip the step of distributing a term if we are not careful.
106
© Great Minds PBC
EUREKA MATH2 A1 ▸ M1 ▸ TA ▸ Lesson 5
How is polynomial multiplication like integer multiplication? With integer multiplication, each place value in the first number must be multiplied by each place value in the second number. For example, when multiplying 2 7and 1 3, we must multiply 2 0by 1 0and then by 3 , and we must multiply 7 by 1 0and by 3 . With polynomial multiplication, each term in the first expression must be multiplied by each term in the second expression. For example, when multiplying ( 2x + 7)and ( x + 3), we must multiply 2 xby x and then by 3 , and we must multiply 7by x and then by 3. Display the definition of polynomial expression from lesson 3. Will the product of two polynomial expressions always be a polynomial expression? Use the definition of a polynomial expression to explain why. Yes. By definition, a polynomial expression can be the result of multiplying two previously generated polynomial expressions.
Exit Ticket 5 min Provide up to 5 minutes for students to complete the Exit Ticket. It is possible to gather formative data even if some students do not complete every problem.
© Great Minds PBC
Teacher Note Assign the Practice problems for completion outside of class or use them in class if time remains after the lesson. Refer students to the Recap for support.
107
EUREKA MATH2
A1 ▸ M1 ▸ TA ▸ Lesson 5
Recap
EUREKA MATH2
A1 ▸ M1 ▸ TA ▸ Lesson 5
A1 ▸ M1 ▸ TA ▸ Lesson 5
5
2. (4m − 3)(5m + 2)
Student Edition: Grade A1, Module 1, Topic A, Lesson 5 Name
RECAP Date
EUREKA MATH2
Tabular Model:
Multiplying Polynomial Expressions In this lesson, we
20m2
–15m
5m
–6
2
explored connections between multiplying integers by using the area model and multiplying polynomial expressions by using the tabular model.
20m2
8m
•
described connections between the tabular model and the algebraic method for multiplying polynomial expressions.
–7m
–6
•
multiplied polynomial expressions.
= 20 m 2 + 8m − 15m − 6 = 20 m 2 − 7m − 6
(4m − 3)(5m + 2) = 20m2 − 7m − 6
1. (x + 1)(x + 4)
3. (w − 8)(w2 − 4)
Tabular Model:
x
Algebraic Method:
1
Tabular Model:
( x + 1)( x + 4 ) = x ( x + 4 ) + 1( x + 4 )
x2
x
x
x2
4x
4
4
5x
4
(x + 1)(x + 4) = x2 + 5x + 4
–8
w3
–8w2
w2
w3
0w2
0w
0w
–8w2
–4w
32
–4
–4w
32
= x + 4x + x + 4 = x 2 + 5x + 4 Both approaches require the distributive property. The terms x and 4 each are
Algebraic Method:
w
2
multiplied by x and by 1.
© Great Minds PBC
(4 m − 3)(5m + 2) = 4 m(5m + 2) − 3(5m + 2)
Unless a problem specifies otherwise, you can pick whichever method you prefer to multiply polynomial expressions.
For problems 1–3, find the product. Write the answer in standard form.
108
–3
•
Examples
Algebraic Method:
4m
(w − 8)(w 2 − 4 ) = w(w 2 − 4 ) − 8(w 2 − 4 )
(w − 8)(w2 − 4) = w3 − 8w2 − 4w + 32
Polynomial expressions are closed under multiplication. The product of two polynomial expressions is always a polynomial expression.
77
78
RECAP
= w3 − 4 w − 8w2 + 32 = w3 − 8w 2 − 4 w + 32
The polynomial expression w2 − 4 is missing a w term. If using the tabular model to multiply, it is helpful to include a 0w term to align like terms correctly along the diagonals.
© Great Minds PBC
© Great Minds PBC
EUREKA MATH2 A1 ▸ M1 ▸ TA ▸ Lesson 5
Sample Solutions Expect to see varied solution paths. Accept accurate responses, reasonable explanations, and equivalent answers for all student work.
EUREKA MATH2
A1 ▸ M1 ▸ TA ▸ Lesson 5
Student Edition: Grade A1, Module 1, Topic A, Lesson 5
PRACTICE
Name
Date
5
EUREKA MATH2
A1 ▸ M1 ▸ TA ▸ Lesson 5
For problems 8–10, find each product. 8. 58 ⋅ 15
9. (50 + 8)(10 + 5)
870
For problems 1–6, find the product. 1. 9(7t4)
2.
63t4
870
1 ( 12 h 3 − 6 h ) 2
6h3 − 3h
10. (5x + 8)(x + 5) 5
2
3
3. 8(3k + 2k + 11)
5x2 + 33x + 40
2
4. (7g )(8g )
24k5 + 16k2 + 88
56g5
6. (10s6 − 4s + 1) ⋅ s
5. p( p − 5)
p2 − 5p
11. Describe how multiplying polynomial expressions is similar to multiplying integers. Use your responses from problems 8–10 to support your answer.
10s7 − 4s2 + s
When multiplying integers, I multiply each digit in the first number by each digit in the second number. When multiplying polynomial expressions, I multiply each term in the first polynomial expression by each term in the second polynomial expression. The terms in each polynomial expression are similar to the place values in each number.
7. Find the area of the rectangle. Write the area as a polynomial expression in standard form, where b > 1.
3
12. Find the area of the triangle. Write a polynomial expression in standard form for the area of the triangle, where x > 0.
5b – 5
3x 2x + 6
15b − 15
© Great Minds PBC
© Great Minds PBC
3x 2 + 9 x 79
80
P R ACT I C E
© Great Minds PBC
109
EUREKA MATH2
A1 ▸ M1 ▸ TA ▸ Lesson 5
EUREKA MATH2
A1 ▸ M1 ▸ TA ▸ Lesson 5
19. Write a polynomial expression in standard form for the area of triangle ABC, where p > −2.
For problems 13–17, find the product. Write your answer in standard form. 13. (m + 2)(m + 5)
m2 + 7m + 10
EUREKA MATH2
A1 ▸ M1 ▸ TA ▸ Lesson 5
C
14. (a − 1)(a + 6)
a2 + 5a − 6 1 p+1 6
A
15. (9 − v)(v − 3)
−v2 + 12v − 27
B
1 p+1 2
1 2 p + 1p+ 1 24 3 2
16. (7z − 2)(3z + 2)
21z2 + 8z − 4 For problems 20–25, rewrite each expression as a polynomial expression in standard form.
17.
20. (c + 6)(c2 + 1)
21. (w + 2)(w2 + 3w + 5)
c3 + 6c2 + c + 6
w3 + 5w2 + 11w + 10
(n + 23 )(n + 53 )
22. (−2r + 7 + 3r2)(5r + 1)
n2 + 73 n + 109
15r3 − 7r2 + 33r + 7
24. (0.2u2 + 1)(0.75u − 5) + 0.3 3
2
0.15u − u + 0.75u − 4.7 18. Write a polynomial expression in standard form for the area of a rectangle with length d + 6 and width d + 9, where d > −6.
d 2 + 15 d + 54
23. 2( j − 5)( j + 3)
2j2 − 4j – 30
25. 7q2 + (2q − 7)(8q2 − 3) − 4
16q3 − 49q2 − 6q + 17
26. Li Na wrote an 8th-degree polynomial expression, and Lyla wrote a 2nd-degree polynomial expression. Will the product of their polynomial expressions be a polynomial expression? Explain. Yes, it will be. By definition, a polynomial expression can be the result of multiplying two previously generated polynomial expressions.
© Great Minds PBC
110
P R ACT I C E
81
82
P R ACT I C E
© Great Minds PBC
© Great Minds PBC
EUREKA MATH2 A1 ▸ M1 ▸ TA ▸ Lesson 5
EUREKA MATH2
A1 ▸ M1 ▸ TA ▸ Lesson 5
Remember For problems 27–29, evaluate. 27. −
−
2 5 ⋅ 3 6
28. −
5 9
7 ÷ 10
(− 29 )
63 20
29.
5 ⋅ 8
−
(− 1835 )
9 28
30. Consider the polynomial expression 7 − 8x2 − 4 + 2x2 − 6x + 4x3 − 1. a. Write the expression in standard form, and state the degree of the polynomial expression.
4x3 − 6x2 − 6x + 2; degree 3
b. Evaluate the expression for x = 10.
3342
31. Solve for x in the equation −4(x − 6) = −2(3x + 2) − 8.
−18
© Great Minds PBC
© Great Minds PBC
P R ACT I C E
83
111
6
Teacher Edition: Grade A1, Module 1, Topic A, Lesson 6 LESSON 6
Polynomial Identities Multiply polynomial expressions to establish polynomial identities.
EUREKA MATH2
A1 ▸ M1 ▸ TA ▸ Lesson 6
Student Edition: Grade A1, Module 1, Topic A, Lesson 6 Name
Date
EXIT TICKET
6
1. Find the product. Write your answer in standard form.
(2t + 1)(2t − 1) (2t + 1) (2t − 1) = (2t)2 − (1)2 = 4t 2 − 1
Lesson at a Glance Students examine the work of two fictitious students to make sense of the identity (a + b)2 = a2 + 2ab + b2 and examine the common misconception (a + b)2 = a2 + b2. They build procedural fluency by using this identity to square binomial expressions. Students use a tabular model to discover the identity (a + b)(a − b) = a2 − b2 and build procedural fluency by using this identity to multiply binomial expressions. Students revisit their work from lesson 1 and use their knowledge of equivalent and polynomial expressions to show that the expressions they wrote to represent the pattern of ducks are equivalent. This lesson introduces the term identity.
Key Questions 2. Write the polynomial expression (x − 4)2 in standard form.
• Why are (a + b)2 = a2 + 2ab + b2 and (a + b)(a − b) = a2 − b2 called identities?
(x − 4)2 = (x)2 + 2(x)(−4) + (−4)2
• Why are the identities (a + b)2 = a2 + 2ab + b2 and (a + b)(a − b) = a2 − b2 useful?
= x 2 − 8 x + 16
Achievement Descriptor A1.Mod1.AD4 Multiply polynomial expressions. (A.APR.A.1)
© Great Minds PBC
91
© Great Minds PBC
EUREKA MATH2 A1 ▸ M1 ▸ TA ▸ Lesson 6
Agenda
Materials
Fluency
Teacher
Launch 5 min
• None
Learn 30 min
Students
• Perfect Squares
• None
• Difference of Squares
Lesson Preparation
Land 10 min
• Gather 2–4 expressions students wrote in lesson 1 to represent the Growing Pattern of Ducks problem and prepare the expressions to display to the class.
© Great Minds PBC
113
EUREKA MATH2
A1 ▸ M1 ▸ TA ▸ Lesson 6
Fluency Multiply Polynomial Expressions Students multiply binomial expressions to prepare for establishing polynomial identities. Directions: Multiply and combine like terms to write an equivalent expression.
114
1.
x(x + 2) + 3(x + 2)
x2 + 5x + 6
2.
m(m − 1) + 2(m − 1)
m2 + m − 2
3.
(b − 4)(2b + 5)
2b2 − 3b − 20
4.
(c + 3)(c + 2)
c2 + 5c + 6
5.
(t + 2)(t − 1)
t2 + t − 2
6.
(n2 + n − 4)(2n + 5)
2n3 + 7n2 − 3n − 20
© Great Minds PBC
EUREKA MATH2 A1 ▸ M1 ▸ TA ▸ Lesson 6
Launch
5
Students look for patterns when multiplying special binomial pairs. Direct students to problems 1–5, and have students complete the problems independently or with a partner. As students work, answer any questions they have about multiplying binomial expressions. After students have had time to work, give them time to check their work with a partner. For problems 1–5, find the product. Write your answer as a polynomial expression in standard form. 1. (a + 3)(a + 3)
( a + 3 )( a + 3) = a 2 + 3a + 3a + 9 = a2 + 6a + 9 2. (w + 2)(w + 2)
(w + 2)(w + 2) = w 2 + 2 w + 2 w + 4 = w2 + 4 w + 4 3. (q − 7)(q − 7)
(q − 7)(q − 7) = q 2 − 7q − 7q + 49 = q 2 − 14 q + 49 4. (n + 5)(n − 5)
(n + 5)(n − 5) = n2 − 5n + 5n − 25 = n2 − 25 5. (2y + 6)(2y − 6)
(2 y + 6)(2 y − 6) = 4 y 2 − 12 y + 12 y − 36 = 4 y 2 − 36 © Great Minds PBC
115
EUREKA MATH2
A1 ▸ M1 ▸ TA ▸ Lesson 6
Have students work with a partner to identify problems with similar answers. Ask them to describe the similarities they notice. Then ask for a few volunteers to share their thinking. The following are possible responses. I noticed that the constant terms in the answers to problems 1 through 3 were the square of the constant terms in the binomials. I noticed that problems 4 and 5 have answers that are binomials. I noticed that the answers to problems 4 and 5 do not have a linear term. Today, we will continue to practice multiplying polynomial expressions. We will look for patterns in two special types of binomial products.
Learn Perfect Squares Students examine the common misconception that (a + b)2 = a2 + b2 and make sense of the identity (a + b)2 = a2 + 2ab + b2 through a visual representation. Present problems 6 and 7. Read the scenario to the class. Give students time to think independently about the problems, and then have them work with a partner to formalize their thinking. Evan and Tiah notice that problems 1, 2, and 3 are all squared binomial expressions. They wonder if squaring a binomial expression has a special result. They each decide to investigate the binomial expression a + b, where a and b are any numbers. Evan’s work is shown.
Evan’s Work (a + b)2 a2 + b2
116
Promoting the Standards for Mathematical Practice When students examine Evan and Tiah’s work to show that (a + b)2 = a2 + 2ab + b2, they are constructing viable arguments and critiquing the reasoning of others (MP3). Ask the following questions to promote MP3: • What parts of Evan’s work do you question? Why? • Is Evan’s claim that (a + b)2 = a2 + b2 always, sometimes, or never true? • Can you find a situation where (a + b)2 = a2 + 2ab + b2 is not true?
© Great Minds PBC
EUREKA MATH2 A1 ▸ M1 ▸ TA ▸ Lesson 6
6. Is Evan’s work correct? Why? Evan’s work is not correct. He made the mistake of applying the distributive property to exponents. The distributive property only applies to multiplication.
7. Tiah says that squaring a binomial expression gives the same result as multiplying a binomial expression by itself. She begins by using the tabular model to multiply (a + b) and (a + b). Complete her work to find the product (a + b)(a + b).
Tiah’s Work (a + b)2 = (a + b)(a + b)
a2 2ab
© Great Minds PBC
a
b
a2
ab
a
ab
b2
b
Differentiation: Challenge If students recognize that (a + b)2 is not always equivalent to a2 + b2 and that this misconception is a misapplication of the distributive property, offer them an additional challenge. Ask them to consider whether it is ever true that (a + b)2 = a2 + b2 for certain values of a and b. If so, ask whether they can determine all the possible values of a and b where the equation is true.
b2
117
EUREKA MATH2
A1 ▸ M1 ▸ TA ▸ Lesson 6
Debrief their work by using the following questions. According to Tiah’s work, what expressions are equivalent to (a + b)2?
Tiah’s work shows us that the expressions (a + b)(a + b) and a2 + 2ab + b2 are equivalent to (a + b)2. Is (a + b)2 equivalent to a2 + b2? How do you know?
The expression (a + b)2 is not equivalent to a2 + b2 because (a + b)2 is equivalent to a2 + 2ab + b2, but a2 + b2 is not equivalent to a2 + 2ab + b2. When I substitute values for a and b, the expressions (a + b)2 and a2 + b2 do not always have the same value. Use the following prompts to introduce the definition of identity. Consider allowing students to use calculators to explore whether the equation (a + b)2 = a2 + 2ab + b2 is true for all values of a and b. 1
Is the equation (a + b)2 = a2 + 2ab + b2 true when a = 3 2 and b = 4? Is it true when
a = −9 and b = 12.1? Is it true when a = 1.6 and b = 2 ? The equation is true for all these values of a and b.
Are there any values of a and b that do not make this equation true? If so, give an example.
Language Support Because the term identity has multiple meanings, consider reviewing the meanings with the class. Discuss the difference between a person's identity and a mathematical identity.
There are no values of a and b that do not make this equation true. Because the equation (a + b)2 = a2 + 2ab + b2 is true for any numbers a and b, it is called an identity. Have students work independently or with a partner on problems 8 and 9. For problems 8 and 9, use multiplication to rewrite the expression as a polynomial expression in standard form. 8. (x + 3)2
( x + 3)2 = ( x + 3)( x + 3) = x 2 + 3x + 3x + 9 = x2 + 6 x + 9 118
© Great Minds PBC
EUREKA MATH2 A1 ▸ M1 ▸ TA ▸ Lesson 6
9. (y − 12)2
( y − 12)2 = ( y − 12)( y − 12) = y 2 − 12 y − 12 y + 144 = y 2 − 24 y + 144 After students have had time to work, ask them to compare their work to the identity. In problem 8, what is represented by a, and what is represented by b? The variable x is represented by a, and the number 3 is represented by b. What expressions are represented by a2, 2ab, and b2 when a = x and b = 3?
a2 represents x2, 2ab represents 6x, and b2 represents 9.
Using the identity (a + b)2 = a2 + 2ab + b2, what is (x + 3)2? According to the identity, (x + 3)2 = x2 + 6x + 9.
This identity also works with negative values in a binomial. For example, in problem 9, what is represented by a, and what is represented by b? The variable y is represented by a, and the number −12 is represented by b. What expressions are represented by a2, 2ab, and b2 when a = y and b = −12?
a2 represents y2, 2ab represents −24y, and b2 represents 144.
Using the identity (a + b)2 = a2 + 2ab + b2, what is (y − 12)2? According to the identity, (y − 12)2 = y2 − 24y + 144.
Have students work on problems 10–13. Consider allowing students to work in groups so they can have peer support as problems become more difficult. For problems 10–13, use the identity (a + b)2 = a2 + 2ab + b2 to rewrite the expression as a polynomial expression in standard form. 10. (a + 12)2
a2 + 2(12a) + 122 = a2 + 24a + 144
© Great Minds PBC
119
A1 ▸ M1 ▸ TA ▸ Lesson 6
EUREKA MATH2
11. (f − 6)2
f 2 + 2(−6f ) + (−6)2 = f 2 − 12f + 36 12. (7r + 1)2
(7r)2 + 2(7r) + (1)2 = 49r2 + 14r + 1 13. (3k − 4)2
(3k)2 + 2(−4)(3k) + (−4)2 = 9k2 − 24k + 16 Confirm answers as a class.
Difference of Squares Students make sense of the identity (a + b)(a − b) = a2 − b2 through a tabular model and develop procedural fluency by using the identity to find binomial products. Refer to problems 4 and 5 from Launch. For problems 4 and 5, what do you notice about the products in standard form? The linear term is missing. Both numbers are perfect squares. Ask students to consider the following question independently and then discuss with a partner. Then have a few students share their thinking. What will (a + b)(a − b) look like in standard form? There will only be two terms. Both terms will be perfect squares. Direct students to problem 14. Have students work independently or with a partner to use a tabular model to find the product (a + b)(a − b).
120
© Great Minds PBC
EUREKA MATH2 A1 ▸ M1 ▸ TA ▸ Lesson 6
14. Use a tabular model to find the product (a + b)(a − b).
a
b
a2
ba
a
a2
–ab
–b2
–b
ba – ab, or ab – ab
–b2
(a + b)(a – b) = a2 + (ab – ab) – b2 = a2 – b2 a2 − b2 Debrief what the result means by using the following prompts. What expression is equivalent to (a + b)(a − b)?
The expression (a + b)(a − b) is equivalent to a2 − b2. Why did we use a and b instead of specific numbers? We want to know what the product is when a and b are any numbers, variables, or expressions. Is (a + b)(a − b) = a2 − b2 an identity? Why? This is an identity because it is true no matter what values are used for a and b. Have students work independently or with a partner on problems 15 and 16. For problems 15 and 16, use multiplication to rewrite the expression as a polynomial expression in standard form. 15. (g + 4)(g − 4)
( g + 4 )( g − 4 ) = g2− 4 g + 4 g − 16 = g2 − 16 © Great Minds PBC
121
EUREKA MATH2
A1 ▸ M1 ▸ TA ▸ Lesson 6
16. (10u + 5)(10u − 5)
UDL: Engagement 2
(10u + 5)(10u − 5) = 100u − 50u + 50u − 25 = 100u2 − 25 After students have had time to work, ask them to compare their work to the identity. In problem 15, which values are represented by a and b? The variable g is represented by a, and the number 4 is represented by b. What do a2 and b2 represent when a = g and b = 4?
a2 represents g2, and b2 represents 16.
According to the identity (a + b)(a − b) = a2 − b2, what is (g + 4)(g − 4)? According to the identity, (g + 4)(g − 4) = g2 − 16.
Have students work on problems 17–20. Consider allowing students to work in groups so that they can have peer support as problems become more difficult.
Consider providing feedback that emphasizes the application of strategies to sustain effort and persistence as students work. • Your effort here is evident. It shows that you remembered to avoid Evan’s mistake of applying the distributive property to exponents. • Your success on this problem shows that you understand how to use the identity because you recognized the a and b values. • Your effort is shown here as you applied the distributive property; you recognized that binomial expressions were being multiplied.
For problems 17–20, use the identity (a + b)(a − b) = a2 − b2 to rewrite the expression as a polynomial expression in standard form. 17. (m + 10)(m − 10)
m2 − 102 = m2 − 100 18. (−h + 4)(−h − 4)
(−h)2 − 42 = h2 − 16 19. (2s + 12)(2s − 12)
(2s)2 − 122 = 4s2 − 144 20. (−5b + 1)(−5b − 1)
(−5b)2 − 12 = 25b2 − 1 Confirm answers as a class.
122
© Great Minds PBC
EUREKA MATH2 A1 ▸ M1 ▸ TA ▸ Lesson 6
Land Debrief 5 min Objective: Multiply polynomial expressions to establish polynomial identities. Use the following prompts to debrief the lesson. Why are (a + b)2 = a2 + 2ab + b2 and (a + b)(a − b) = a2 − b2 called identities? They are called identities because they contain variables a and b, and they are true for any values of a and b. Why are the identities (a + b)2 = a2 + 2ab + b2 and (a + b)(a − b) = a2 − b2 useful? These identities can be used as a shortcut. We know they are true for any values of a and b, so in these problems, we do not need to recalculate the identity each time. Present students with some of the expressions they wrote for the Growing Pattern of Ducks problem in lesson 1. Some possible expressions are (x + 1)(x + 1) + x, (x + 1)2 + x, and (x + 1)(x + 2) − 1. We now have the skills to create equivalent polynomial expressions by adding, subtracting, and/or multiplying. Verify that the expressions from the Growing Pattern of Ducks problem are equivalent. Justify your reasoning for each step by using properties, identities, and/or operations. Ask students to work with partners or in groups on problem 21. They will verify that two of the expressions are equivalent. Assign pairs of expressions thoughtfully, so that all expressions can be shown as equivalent to one another.
© Great Minds PBC
123
EUREKA MATH2
A1 ▸ M1 ▸ TA ▸ Lesson 6
21. Choose two expressions from the Growing Pattern of Ducks problem from lesson 1, and verify that they are equivalent. Justify your reasoning for each step by using properties, identities, and/or operations. Sample:
( x + 1)2 + x = x 2 + 2 x + 1 + x
because (a + b)2 = a2 + 2ab + b2
= x2 + 2 x + x + 1
by the commutative property of addition
= x 2 + 3x + 1
by addition of like terms
( x + 1)( x + 2) − 1 = x ( x + 2) + 1( x + 2) − 1
using the distributive property
= x2 + 2 x + x + 2 − 1
using the distributive property
= x 2 + 3x + 1
by addition of like terms
Both expressions can be rewritten as x2 + 3x + 1, so they are equivalent.
Exit Ticket 5 min Provide up to 5 minutes for students to complete the Exit Ticket. It is possible to gather formative data even if some students do not complete every problem.
Teacher Note Assign the Practice problems for completion outside of class or use them in class if time remains after the lesson. Refer students to the Recap for support.
124
© Great Minds PBC
EUREKA MATH2 A1 ▸ M1 ▸ TA ▸ Lesson 6
Recap
EUREKA MATH2
Student Edition: Grade A1, Module 1, Topic A, Lesson 6 Name
A1 ▸ M1 ▸ TA ▸ Lesson 6
A1 ▸ M1 ▸ TA ▸ Lesson 6
6
3. (3a − 4)(3a − 4)
RECAP Date
EUREKA MATH2
(3a − 4 )(3a − 4 ) = (3a )2 + 2 (3a ⋅ (−4 )) + (−4 )2
Polynomial Identities
= 9a 2 + 2 (−12 a ) + 16
In this lesson, we •
The product (3a − 4)(3a − 4) is equivalent to (3a − 4)2.
Use the identity (a + b)2 = a2 + 2ab + b2.
= 9a 2 − 24 a + 16
multiplied polynomial expressions.
•
established the polynomial identities (a + b)2 = a2 + 2ab + b2 and (a + b)(a − b) = a2 − b2.
•
explored the usefulness of polynomial identities.
Examples
4.
In problems 1–5, rewrite the polynomial expression in standard form.
(6 − 15 w)(6 + 15 w) Use the identity (a + b)(a − b) = a2 − b2.
1. (x + 2)2
2
(6 + 15 w)(6 − 15 w) = (6)2 − ( 15 w)
Use the identity (a + b)2 = a2 + 2ab + b2.
= 36 − 1 w2
( x + 2)2 = ( x )2 + 2 ( x ⋅ 2) + (2)2
=−
= x 2 + 2 (2 x ) + 4
You can apply the commutative property of multiplication to rewrite the product
= x2 + 4 x + 4
25 1 2 w + 36 25
so that it is in the same form as the identity. Expand (y − 8)2 first. Use (a + b)2 = a2 + 2ab + b2
2. (m + 3)(m − 3)
5. 7 + (y − 8)2 − 6y
Use the identity (a + b)(a − b) = a2 − b2.
( m + 3)( m − 3) = ( m )2 − (3)2
7 + ( y − 8)2 − 6 y = 7 + ( y )2 + 2 ( y ⋅ (−8)) + (−8)2 − 6 y
= m2 − 9
= 7 + y 2 − 16 y + 64 − 6 y = y 2 − 16 y − 6 y + 7 + 64 = y 2 − 22 y + 71
© Great Minds PBC
© Great Minds PBC
93
94
RECAP
© Great Minds PBC
125
EUREKA MATH2
A1 ▸ M1 ▸ TA ▸ Lesson 6
Sample Solutions Expect to see varied solution paths. Accept accurate responses, reasonable explanations, and equivalent answers for all student work.
EUREKA MATH2
A1 ▸ M1 ▸ TA ▸ Lesson 6
Student Edition: Grade A1, Module 1, Topic A, Lesson 6
PRACTICE
Name
Date
6
12. Figure ABCD is a square. Write a polynomial expression in standard form for the area, where x > − 43 .
A
For problems 1–10, rewrite the expression as a polynomial expression in standard form. 1. (x + 3)(x + 3)
x2 + 6x + 9
2. (h + 6)
h2 + 12h + 36
7. (7x + 2)2
)
1 x +1 2
13. Levi and Zara want to find the product (12 − d)2. Levi says the expression (12 − d)2 is equivalent
( x + 13 )
2
x
2
2
1 2 x + x +1 4
C
9 x 2 + 24 x + 16
to 144 − d2. Zara says the expression is equivalent to 144 + d2.
2 1 + x+ 3 9
a. Which student is correct? Explain any mistakes Levi and Zara may have made. Neither Levi nor Zara is correct. Levi only squared the two terms, 12 and d, then wrote this as the difference of the two squares. He did not use the distributive property. Zara probably identified the two terms as 12 and −d, but she did not use the distributive property. She only squared the two terms, writing the result as the sum.
8. (8 − 3g)(8 − 3g)
49x2 + 28x + 4
(
B
p − 14p + 49
6.
x2 − 10x + 25
9.
3x + 4
2
w2 + 16w + 64
5. (x − 5)2
D
2
4. (p − 7)(p − 7)
3. (8 + w)2
EUREKA MATH2
A1 ▸ M1 ▸ TA ▸ Lesson 6
9g2 − 48g + 64
b. Write the product (12 − d)2 in standard form. 10. (0.7r − 1.1)
d 2 − 24 d + 144
2
2
0.49r − 1.54r + 1.21 For problems 14–17, rewrite the expression as a polynomial expression in standard form.
11. Explain why (a + b)(a − b) = a2 − b2 is called an identity. It is called an identity because the expressions (a + b)(a − b) and a2 − b2 are equivalent for all real values of a and b.
14. (z + 1)(z − 1)
15. (4 + w)(4 − w)
z2 − 1
−w2 + 16
16. (10 + 3a)(10 − 3a)
−9a2 + 100 © Great Minds PBC
126
95
96
P R ACT I C E
17. (1.2h − 0.6)(1.2h + 0.6)
1.44h2 − 0.36 © Great Minds PBC
© Great Minds PBC
EUREKA MATH2 A1 ▸ M1 ▸ TA ▸ Lesson 6
EUREKA MATH2
A1 ▸ M1 ▸ TA ▸ Lesson 6
18. Figure IJKL is a rectangle. Write a polynomial expression in standard form for the area, where x > 10 . 7
EUREKA MATH2
A1 ▸ M1 ▸ TA ▸ Lesson 6
20. Write a polynomial expression in standard form for the area of the triangle, where x > 3.
I 7x – 10
x–3
7x + 10
J
x+3 L
9 1 2 x − 2 2
K
For problems 21–25, rewrite the expression as a polynomial expression in standard form. 21. (6x + 3)2 + 20
49 x 2 − 100
36x2 + 36x + 29
22. 8x + (x − 1)2 − 8
x2 + 6x − 7
19. KL is the radius of the circle. Write a polynomial expression in standard form for the exact area of the circle, where k > 19 .
23. −18k − 5k + (k + 5)2 2
k − 13k + 25
24. 8b2 − (4b + 6)(4b − 6) + 14
−8b2 + 50
K 9x – 1
25. 27c2 + (8c2 − 3)2 − 8
64c4 − 21c2 + 1
L
81π x 2 − 18π x + π © Great Minds PBC
© Great Minds PBC
P R ACT I C E
97
98
P R ACT I C E
© Great Minds PBC
127
EUREKA MATH2
A1 ▸ M1 ▸ TA ▸ Lesson 6
EUREKA MATH2
A1 ▸ M1 ▸ TA ▸ Lesson 6
26. Write a polynomial expression in standard form for the volume of the square prism, where x > 3.
A1 ▸ M1 ▸ TA ▸ Lesson 6
EUREKA MATH2
For problems 30 and 31, find the sum or difference. 30. (−3p4 + 2p2 − 6p − 7) + (8p4 − 15p + 4)
5 p 4 + 2 p2 − 21 p − 3 x+3
3
31. (a3 − 6a2 − 4a + 10) − (−3a3 + 2a2 − 2)
x–3
x–3
4 a 3 − 8a 2 − 4 a + 12
2
x − 3 x − 9 x + 27
constants and a ≠ 0?
27. What is the degree of the polynomial expression for the product (ax3 + b)2, where a and b are
32. Which statements can be represented by the inequality x > 10? Choose all that apply. A. There are more than 10 students in the class.
6
B. The meeting will last for at least 10 minutes. C. The value of x is greater than 10.
Remember
D. The minimum donation for the fundraiser is $10.
For problems 28 and 29, evaluate.
E. The greatest value of x is 10.
28.
5 ÷ 2 − 11 18 3 12 1 − 2
© Great Minds PBC
128
( 4) 4
29. − 7 + − 1 ⋅ 3 8
17 − 16
P R ACT I C E
99
100
P R ACT I C E
© Great Minds PBC
© Great Minds PBC
Teacher Edition: Grade A1, Module 1, Topic B
Topic B Solving Equations and Inequalities in One Variable In grades 6, 7, and 8, students solve one-variable equations and inequalities of increasing complexity. Topic B builds on that foundation by formalizing the properties of equality and inequality. When solving equations, students justify each step of the solution path. Their work with equations is further extended to include equations with coefficients represented by letters and the concept of rearranging a formula to highlight a particular quantity. Students solve multi-step linear inequalities, write the solution sets by using set-builder notation, and graph the solution sets on the number line. Students are introduced to solving problems in real-world and mathematical contexts by creating equations and inequalities in one variable, which helps them understand how equations and inequalities can be used to represent constraints of a given situation. Students begin the topic by exploring a problem about printing presses that can be solved in many ways. Students are invited to solve the problem by using any method they believe is best. The class generalizes the different methods that can be used by developing an algebraic equation. Students learn that an algebraic approach is sometimes the most efficient way to solve a problem.
130
© Great Minds PBC
EUREKA MATH2 A1 ▸ M1 ▸ TB
Number of Printing Presses
Number of Novels
Number of Cookbooks
10
10(1) + 5(1), or 15
5(2) + 1(2) + 1(2), or 14
12
12(1) + 6(1), or 18
6(2) + 1(2) + 1(2), or 16
8
8(1) + 4(1), or 12
4(2) + 1(2) + 1(2), or 12
x
x + 1x
1 x (2) + 2 + 2 2
2
Because the print shop must print the same number of copies of each book, the expression representing the total number of novels printed must equal the expression representing the total number of cookbooks printed. Solution set is defined in terms of both equations and inequalities. Students are introduced to set-builder notation which allows them to represent solution sets with formality and precision. Students solve linear equations in one variable, formalizing their understanding that the properties of operations and equality are guaranteed to preserve the solution set of the original equation. Students use this understanding to justify each step used in solving a linear equation and to evaluate different solution paths that yield the same result.
3+
g 7
=
g 14
−2
3+
42 + 2 g = g − 28
multiplication property of equality
42 + g = −28
addition property of equality
g = −70
addition property of equality
© Great Minds PBC
g 7 g 7 g
= =
g 14 g 14
−2 −5
addition property of equality
= −5
addition property of equality
g = −70
multiplication property of equality
14
131
A1 ▸ M1 ▸ TB
EUREKA MATH2
In an optional lesson, students explore actions that may or may not preserve a solution set. This lesson is designed to deepen students’ understanding of properties of equality, in particular the multiplication property of equality, and to explore the effect of squaring both sides of an equation, a common strategy that students use to solve equations. These explorations set the stage for equations seen in later courses that have extraneous solutions. Students return to concepts found in the opening lesson, exploring problems that can be modeled and solved by using a one-variable equation. Students use their knowledge of solving linear equations with known coefficients by using the properties of equality in more abstract contexts, as they rearrange formulas and solve linear equations with coefficients represented by letters. Topic B concludes with students solving linear inequalities, a process introduced in grade 7. Students solve linear inequalities, express the solution sets by using set-builder notation, and graph the solution sets on the number line. While finite solution sets can often be written concisely by using set notation (e.g., {2}), set-builder notation represents the solution sets of linear inequalities with precision. The lesson closes by summarizing and comparing properties of equality and properties of inequality. Understanding how to find and represent solution sets of linear equations and inequalities in one variable prepares students for topic C, which focuses on finding, writing, and graphing solution sets to compound statements involving equations or inequalities.
132
© Great Minds PBC
EUREKA MATH2 A1 ▸ M1 ▸ TB
Progression of Lessons Lesson 7
Printing Presses
Lesson 8
Solution Sets for Equations and Inequalities in One Variable
Lesson 9
Solving Linear Equations in One Variable
Lesson 10 Some Potential Dangers When Solving Equations (Optional) Lesson 11 Writing and Solving Equations in One Variable Lesson 12 Rearranging Formulas Lesson 13 Solving Linear Inequalities in One Variable
© Great Minds PBC
133
7
Teacher Edition: Grade A1, Module 1, Topic B, Lesson 7 LESSON 7
Printing Presses Investigate a problem that can be solved by reasoning quantitatively or algebraically.
EUREKA MATH2
A1 ▸ M1 ▸ TB ▸ Lesson 7
Student Edition: Grade A1, Module 1, Topic B, Lesson 7 Name
Date
EXIT TICKET
7
Evan is 7 years younger than his sister, Danna. The sum of their ages is 37. Using any method, find their ages. Let x represent Danna’s age in years. Then x − 7 represents Evan’s age in years. So the expression x + (x − 7) represents the sum of their ages.
x + ( x − 7) = 37
2 x − 7 = 37 2 x = 44 x = 22
Substituting 22 for x:
Lesson at a Glance In this lesson, students work in groups to find an entry point to solve a problem about printing presses. Because this problem can be solved by using various methods, it provides an opportunity for both collaboration and student choice in a solution path. This lesson introduces the Five Framing Questions routine as students analyze a variety of solution paths, building connections between quantitative reasoning and the process of writing and solving an equation in one variable. Before beginning the problem, students analyze a picture of and read some information about the Gutenberg printing press to connect art and history with the problem they are solving in the lesson.
Key Questions
x − 7 = 22 − 7 = 15
• What are some strategies for solving a mathematical problem? How are these strategies related?
Danna is 22 years old, and Evan is 15 years old.
• How is writing an equation helpful in solving a problem?
Achievement Descriptors A1.Mod1.AD6 Solve linear equations and inequalities in one variable. (A.REI.B.3)
A1.Mod1.AD7 Create equations and inequalities in one variable and
use them to solve problems. (A.CED.A.1) © Great Minds PBC
105
© Great Minds PBC
EUREKA MATH2 A1 ▸ M1 ▸ TB ▸ Lesson 7
Agenda
Materials
Fluency
Teacher
Launch 5 min
• None
Learn 30 min
Students
• Printing Presses
• None
• Sharing Work Samples
Lesson Preparation
Land 10 min
• None
© Great Minds PBC
135
EUREKA MATH2
A1 ▸ M1 ▸ TB ▸ Lesson 7
Fluency Write Algebraic Expressions Students write algebraic expressions to prepare for writing equations in one variable. Directions: Write an algebraic expression to represent the verbal description. 1.
A number x increased by 5
x+5
2.
Two less than a number n
n−2
3.
Ten times a number y
10y
4.
Four less than 3 times a number c
3c − 4
5.
ix times the sum of a number p S and 7
6(p + 7)
6.
ne less than two times the O quantity 5 less than a number z
2(z − 5) − 1
136
© Great Minds PBC
EUREKA MATH2 A1 ▸ M1 ▸ TB ▸ Lesson 7
Launch
5
Students recognize the historical significance of the printing press by discussing a photograph and related written information. Display the photograph of the Gutenberg Press taken in the Gutenberg Museum in Mainz, Germany.
Allow 2 minutes for students to study the photograph and read the related information before completing the Printing Presses problem. © Great Minds PBC
137
A1 ▸ M1 ▸ TB ▸ Lesson 7
EUREKA MATH2
Read the following excerpt. At the start of the 15th century, Johannes Gutenberg developed the printing press. Although Chinese monks had developed a printing technique around 600 CE, the technology was not used widely until the Gutenberg printing press was introduced. It could print much faster than other presses, which meant that publishers could produce more books and pamphlets for a lower cost. Thanks to Gutenberg’s printing press, more people could now afford books. New ideas in science and mathematics spread quickly. Invite students to notice and wonder. Select a few volunteers to share what they notice and wonder, and facilitate a discussion of the historical significance of the Gutenberg printing press. If students do not wonder about how the use of the Gutenberg printing press impacted the number of books that could be printed in a specific amount of time, guide students to think about this. I wonder how the use of the Gutenberg printing press impacted the number of books that could be printed each year. I also wonder if modern printing presses print significantly faster than the Gutenberg printing press. Conclude the discussion by transitioning to the Printing Presses problem. Today, we will solve a problem related to the use of modern printing presses.
Learn Printing Presses Students select a strategy to solve a problem in context. Direct students’ attention to the Printing Presses problem. Allow students to collaborate in groups as they make sense of the problem. Consider using a reading strategy like the Three Reads routine to provide students with a structure for deconstructing this problem. 138
© Great Minds PBC
EUREKA MATH2 A1 ▸ M1 ▸ TB ▸ Lesson 7
Complete a first read of the problem. In your groups, answer the question, What is the problem about? Complete a second read of the problem. In your groups, answer the question, What is the important information? Complete a third read of the problem. In your groups, answer the question, What is the question? A print shop needed to print the same number of copies of a novel and a cookbook. The novel had twice as many pages as the cookbook. On day one, all of the printing presses made copies of the novels. On day two, the printing presses were split into two equal-size groups. The first group continued to print copies of the novel. They finished at the end of the day. The second group printed copies of the cookbook. They did not finish by the end of the day. Instead, one printing press worked for an additional two days to finish printing the copies of the cookbooks. All of the printing presses printed pages for both books at the same constant rate. How many printing presses are at the shop? There are 8 printing presses at the print shop.
UDL: Action & Expression Consider supporting students in organizing information. To accompany the Three Reads routine, have students organize their page into four sections: three small sections and one large section. The labels of the smaller sections should correspond to the questions from the Three Reads strategy. The larger section is reserved for students to solve the problem. What is the problem about?
What is the important information?
What is the question?
Workspace:
Have students solve the problem in their groups by using a solution path of their choice. Circulate as students work, intervening only if a group is having difficulty starting the problem. Refocus groups without leading them to a specific solution path. Students can create tape diagrams, use guess and check, or write equations. As students reason abstractly and quantitatively, they may make assumptions about a specific number of pages in one of the books or a constant rate at which the presses print. Allow this to happen naturally. This is part of the guess, check, generalize, and verify technique that allows students to build toward the creation of a one-variable equation. If students are having difficulty making sense of the problem, consider posing one of the following questions and modeling a think-aloud for additional support. • What information do we know remains constant? The number of pages in each cookbook, the number of pages in each novel, and the rate at which each printing press prints remain constant. Also, the total number of cookbooks that must be printed and the total number of novels that must be printed are the same.
© Great Minds PBC
139
EUREKA MATH2
A1 ▸ M1 ▸ TB ▸ Lesson 7
• What assumptions can we make? Because the printing presses all print at the same constant rate, we can simplify the calculations by assuming each printing press completes exactly one finished copy of the novel per day or exactly two finished copies of the cookbook per day. • What are the important quantities? How are these quantities related? The important quantities are the number of cookbooks and novels. The presses will print the same total number of cookbooks and novels. The number of printing presses and the number of days they each printed are also important. These are important quantities, but we know very few numbers. If groups are attempting to use guess and check, recommend organizing their work to see the flow of their calculations. This will help them generalize their calculations when writing an equation later in the lesson. Consider posing one the following questions:
Promoting the Standards for Mathematical Practice Students demonstrate perseverance and sense-making (MP1) when they make sense of the printing presses problem, look for entry points to its solution, and evaluate their own progress, changing course as necessary. Ask the following questions to promote MP1: • What information or facts do you need to find the number of printing presses at the shop?
• What number should you start with? What does this number represent?
• What are some steps you can take to start solving the problem?
• How can you verify that you have guessed the correct number of printing presses?
• Does your answer make sense? Why?
Sharing Work Samples Students make connections between various representations and solution paths by sharing work samples. Ask volunteers to share their group’s strategy for solving this problem. Share solutions by using a document camera or by displaying the problem on the board or on chart paper. Encourage students to take notes on the various strategies presented. As groups present, display a list of strategies used, and indicate when a strategy is repeated.
Differentiation: Support If groups need additional prompting, suggest that they assume a specific quantity for the rate at which a press prints. They can generalize after making reasonable calculations.
Record your notes and comments about work samples from other students. Groups that used models and numerical methods might share first, followed by groups that wrote and solved an equation in one variable. Other solution strategies, incomplete solutions, or incorrect solutions should also be discussed. Encourage students to explain their thinking rather than retelling the steps.
140
© Great Minds PBC
EUREKA MATH2 A1 ▸ M1 ▸ TB ▸ Lesson 7
Call attention to groups that used and named variables, solved the problem by using different representations and made connections between those representations, or showed detailed and accurate work. As groups share their solution paths, use the Five Framing Questions routine to invite students to analyze work samples. Review the Five Framing Questions routine in the module fluency resource. Pose a question, and then direct students to discuss in groups before sharing responses with the class.
Notice and Wonder What do you notice about this work? From your observations, what do you wonder?
Organize What steps did this group take? How do you know? Use any of the following questions to advance the discussion.
Language Support If students require a high level of support, direct them to use the Ask for Reasoning section of the Talking Tool to support their communication with their groups.
What could this group do next? Is your group’s method the same as this group’s method, or is it different? What connections do you see between this solution path and others that were shared? Which strategy do you like the most? Why? What are some questions you still have about this process? This problem can be solved in a variety of ways. Two possible solution paths are shown.
© Great Minds PBC
141
EUREKA MATH2
A1 ▸ M1 ▸ TB ▸ Lesson 7
This solution path uses a set of tape diagrams.
1 unit Number of printing presses in the shop Day 1
Novels
Day 2
Cookbooks 1 unit 2
1 unit 2
Day 3 ? unit Day 4 ? unit
All of the presses printed novels on day one. We labeled the rectangle that represents the presses printing novels on day one as 1 unit. This unit represents the number of printing presses in the shop. On day two, 1 of the presses printed novels and 12 of the 2 presses printed cookbooks, so we labeled each rectangle as 1 unit. These two 1 units 2 2 represent all of the printing presses. On day three and day four, only 1 press is printing to finish the cookbook job. We don’t know what fraction of the presses this 1 press represents, so we don’t know how large the rectangle should be. We will just draw a tape diagram with a smaller rectangle. The tape representing the number of presses working on cookbooks for day three and day four must be the same size. There were 1 12 units that printed all the pages for the novels.
142
© Great Minds PBC
EUREKA MATH2 A1 ▸ M1 ▸ TB ▸ Lesson 7
We don’t know the number of units that printed all the pages for the cookbooks. Cookbooks have 1 as many pages as novels, so it will take 12 of the 1 12 units to print 2 cookbooks in the same amount of time. 3 1 3 ⋅ units = units 2 2 4
So 43 units print all the cookbook pages. We know that 1 unit on day two printed 2 cookbooks. 3 − 1 = 1 4 2 4
Together, days three and four represent 1 unit. 4
1 ÷2 = 1 ⋅ 1 = 1 4 4 2 8
The tape diagrams for day three and day four should each be labeled as 1 unit. We know that 1 unit represents 1 printing press.
8
8
Therefore, 88 unit represents 8 printing presses.
Because 1 unit represents the total number of printing presses in the print shop, there are 8 printing presses in the print shop. This solution path follows a guess-and-check approach. On day two, 12 of the presses print cookbooks, and 12 of the presses print novels. We need to pick an even number of printing presses to avoid fractions. Let’s pick 10 because it is an even number and calculations will be easy. Because the presses all print at the same rate, let’s assume each press can make 1 novel per day or 2 cookbooks per day.
© Great Minds PBC
143
EUREKA MATH2
A1 ▸ M1 ▸ TB ▸ Lesson 7
Number of Printing Presses
Number of Novels
Number of Cookbooks
10
10(1) + 5(1), or 15
5(2) + 1(2) + 1(2), or 14
Numbers of each book are not equal.
12
12(1) + 6(1), or 18
6(2) + 1(2) + 1(2), or 16
Numbers of each book are not equal.
8
8(1) + 4(1), or 12
4(2) + 1(2) + 1(2), or 12
Numbers of each book are equal.
When we tried 10 printing presses, we calculated that 15 novels were printed, but only 14 cookbooks were printed. So we tried 12 printing presses. When we tried 12 printing presses, we calculated that 18 novels and 16 cookbooks were printed. This did not produce the same number of copies of each book either. The number of copies printed were actually not as close as our last guess. Next, we tried fewer printing presses. We tried 8. When we tried 8 printing presses, we calculated 12 novels and 12 cookbooks. The same number of copies of each book were printed. There must be 8 printing presses. Display sample student work that resembles the guess-and-check approach, or use the sample work provided. Work with the class to generalize by writing an equation. Using the following questions, advance the discussion to focus on writing an equation, and encourage student thinking that makes connections to the other methods.
144
© Great Minds PBC
EUREKA MATH2 A1 ▸ M1 ▸ TB ▸ Lesson 7
Number of Printing Presses
Number of Novels
Number of Cookbooks
10
10(1) + 5(1), or 15
5(2) + 1(2) + 1(2), or 14
12
12(1) + 6(1), or 18
6(2) + 1(2) + 1(2), or 16
8
8(1) + 4(1), or 12
4(2) + 1(2) + 1(2), or 12
How do we know that a value we picked did not work? The number of copies of novels printed was not the same as the number of copies of cookbooks printed. Why was the next number chosen [smaller/larger], and not [larger/smaller]? The next number chosen was smaller because, when we used a larger number of printing presses, the difference between the number of novels printed and the number of cookbooks printed was larger than my original guess. We want the difference between the two numbers of copies of each book to be smaller, not larger.
Reveal Let’s focus on writing an equation. How can we identify patterns in this work? We can look at our work for the guesses to see which parts stayed the same.
© Great Minds PBC
145
EUREKA MATH2
A1 ▸ M1 ▸ TB ▸ Lesson 7
Which parts stayed the same? When calculating the number of novels printed, the 1’s stayed the same because we assumed that each press printed 1 novel per day. When calculating the number of cookbooks printed, the 2’s stayed the same. If a press can print 1 novel, it will print 2 cookbooks in the same amount of time because it has half the number of pages as the novel. The 1 press that was used on day three and day four also stayed the same. Can we replace specific values with more general variables? What values could we replace, and what variables would we like to use? The number of copies of novels and the number of copies of cookbooks printed per day for each press remained the same. The other numbers in the equations varied. When we had 10 presses, the first calculation used 10 and 5. When we had 8 presses, the first calculation used 8 and 4. It looks like the first number represents the number of presses and the second number represents half that number. This makes sense because on day one, all of the presses printed novels, and on day two, half of the presses printed novels. Let x represent the number of printing presses in the print shop.
146
Number of Printing Presses
Number of Novels
Number of Cookbooks
10
10(1) + 5(1), or 15
5(2) + 1(2) + 1(2), or 14
12
12(1) + 6(1), or 18
6(2) + 1(2) + 1(2), or 16
8
8(1) + 4(1), or 12
4(2) + 1(2) + 1(2), or 12
x
x + 1x
1 x(2) + 2 + 2 2
2
© Great Minds PBC
EUREKA MATH2 A1 ▸ M1 ▸ TB ▸ Lesson 7
Because the print shop must print the same number of copies of each book, the expression representing the total number of novels printed must equal the expression representing the total number of cookbooks printed.
x + 1x = x + 4 2 1 x = 4 2
x = 8
Solving the equation confirmed the answer we found through guess and check, but we assumed that the printing rates were 1 novel per day or 2 cookbooks per day. If we had chosen different values for the rates, would our result change? Allow students time to make a conjecture in their groups about whether choosing different rates would change the answer. Then have them test the conjecture by selecting different rates, creating a new equation, and solving the equation. Consider assigning each group a different rate to test. What is the solution if a press can print 2 novels per day or 4 cookbooks per day?
Differentiation: Challenge If students are ready for an additional challenge, have them generalize further by using a rate of y novels per day to solve the problem.
xy + 1 xy = xy + 2y + 2y
(
y x +
2 1 x 2
) = y (x + 4)
Because y is a factor of both the left and right sides of the equation, divide both sides by y.
x + 1x = x + 4 2 3 x = x +4 2 1 x = 4 2
x = 8
x (2) + 1 x (2) = 1 x (4) + 4 + 4 2
2
2x + x = 2x + 8 x = 8 Distill
Further challenge students to consider why it is allowable to consider dividing both sides by y. Highlight that this can be done only because, in this context, y represents the rate of novels per day that a press can print, and therefore y cannot equal 0.
What effect does changing the rates have on this work? Changing the rates has no effect. All the rates we chose resulted in the solution 8.
© Great Minds PBC
147
EUREKA MATH2
A1 ▸ M1 ▸ TB ▸ Lesson 7
Land Debrief 5 min Objective: Investigate a problem that can be solved by reasoning quantitatively or algebraically. Facilitate a brief class discussion by using the following questions. What are some strategies for solving a mathematical problem? How are these strategies related? We can use an arithmetic approach by either guessing and testing values for an unknown quantity or by working backwards to find the unknown value. We can draw a picture, such as a tape diagram, to represent what is known and what is unknown. We can use an algebraic approach by writing and solving an equation. The algebraic approach generalizes the arithmetic approach because a variable is assigned to represent the unknown quantity. The tape diagram is a visual model of the algebraic approach.
Know How is writing an equation helpful in solving a problem? Using equations to solve problems may be more efficient than guess and check or tape diagrams if the solutions are not friendly numbers, if we need to make repeated calculations, or if the relationships between quantities are complicated.
Exit Ticket 5 min Provide up to 5 minutes for students to complete the Exit Ticket. It is possible to gather formative data even if some students do not complete every problem.
Teacher Note Assign the Practice problems for completion outside of class or use them in class if time remains after the lesson. Refer students to the Recap for support.
148
© Great Minds PBC
EUREKA MATH2 A1 ▸ M1 ▸ TB ▸ Lesson 7
Recap
EUREKA MATH2
A1 ▸ M1 ▸ TB ▸ Lesson 7
Student Edition: Grade A1, Module 1, Topic B, Lesson 7 Name
RECAP Date
7
Printing Presses
Solve Algebraically Let x represent the number of student tickets sold. Then 2x + 5 represents the number of adult tickets sold. The sum of the number of student tickets sold and the number of adult tickets sold is the total number of tickets sold.
In this lesson, we •
solved a problem by reasoning quantitatively by using a variety of methods, such as guessand-check or tape diagrams.
•
solved a problem algebraically by creating an equation in one variable.
x + (2 x + 5) = 98
3 x + 5 = 98 3 x = 93 x = 31
Example At a basketball game, the number of adult tickets sold is 5 more than 2 times the number of student tickets sold. A total of 98 tickets are sold. How many adult tickets are sold? Solve with a Tape Diagram
98
Two units represent 2 times the number of student tickets sold.
2 (31) + 5 = 62 + 5 = 67
This is the total number of tickets sold.
There are 67 adult tickets sold.
5
Number of Adult Tickets Sold
There are 31 student tickets sold. Substitute 31 for x in 2x + 5 to find the number of adult tickets sold.
This is one unit. It represents the number of student tickets sold.
Number of Student Tickets Sold
EUREKA MATH2
A1 ▸ M1 ▸ TB ▸ Lesson 7
This section represents
5 tickets.
98 − 5 = 93 3 units = 93 1 unit = 31 There are 31 student tickets sold.
98 − 31 = 67 There are 67 adult tickets sold. © Great Minds PBC
© Great Minds PBC
107
108
RECAP
© Great Minds PBC
149
EUREKA MATH2
A1 ▸ M1 ▸ TB ▸ Lesson 7
Sample Solutions Expect to see varied solution paths. Accept accurate responses, reasonable explanations, and equivalent answers for all student work.
EUREKA MATH2
A1 ▸ M1 ▸ TB ▸ Lesson 7
Student Edition: Grade A1, Module 1, Topic B, Lesson 7
PRACTICE
Name
Date
7
A1 ▸ M1 ▸ TB ▸ Lesson 7
EUREKA MATH2
3. A printing company will print an equal number of textbooks and novels to complete an order. a. A textbook has 3 times as many pages as a novel. Write expressions to represent the number of pages in each type of book.
1. The larger of two numbers is 16 more than 3 times the smaller number. The sum of the two numbers is 62.
Let n represent the number of pages in the novel. Then the number of pages in the textbook can be represented by 3n.
Lyla used a tape diagram to find the two numbers. Find the error in Lyla’s work and correct it. Then find the numbers. Smaller Number
62
Larger Number
16 b. If the order is for 2560 copies of each book, write an expression for the total number of pages.
62
The total number of pages is 2560(4n).
The error is that Lyla marked the larger number as 62 in her diagram instead of marking the sum as 62. The two numbers are 50 12 and 11 12 . 2. Mason read 1 of his book on Monday. On Tuesday, he read half of the remaining pages. 3
On Wednesday, he read 54 pages to finish the book. How many pages are in Mason’s book?
Use a tape diagram to solve. c. A total number of 1,925,120 pages needs to be printed to complete the order. Use your expression in part (b) to write and solve an equation to determine the number of pages in each book.
Total number of pages
54
There are 188 pages in each novel and 564 pages in each textbook.
Number of Number of pages read pages read Monday Tuesday
3(54) = 162 There are 162 pages in Mason’s book.
© Great Minds PBC
150
109
110
P R ACT I C E
© Great Minds PBC
© Great Minds PBC
EUREKA MATH2 A1 ▸ M1 ▸ TB ▸ Lesson 7
EUREKA MATH2
A1 ▸ M1 ▸ TB ▸ Lesson 7
EUREKA MATH2
A1 ▸ M1 ▸ TB ▸ Lesson 7
For problems 4–7, use any method to solve.
Remember
4. Levi is 4 years older than twice his younger brother’s age. The sum of their ages is 25. How old is each boy?
For problems 8 and 9, solve the equation. 8.
Levi is 18 years old, and his brother is 7 years old.
2 + x = 4 5
9.
18 5
5. Three times the difference of a number and 5 is equal to the sum of the number and 12. What is the number?
x = −2.1 3
−6.3
10. Find the product. Write the answer in standard form.
The number is 13 12 .
(w + 4)(3w − 7) 3w2 + 5w − 28 6. Danna, Evan, and Mason combine their money to buy their friend a present. Evan spends $5.50 more than Danna. Danna spends $3.00 less than Mason. They spend a total of $25. How much money does each person spend? Mason spends $8.50. Danna spends $5.50. Evan spends $11.00.
11. Write an inequality for each sentence in the table. Graph the solution set of the inequality on the number line.
7. Ji-won and Emma wrote the following problem for math class. Solve the problem to help them create the answer key. Ji-won has $68, and Emma has $18. How much money will Ji-won have to give Emma so that Emma will have four times as much money as Ji-won? Ji-won needs to give Emma $50.80.
© Great Minds PBC
© Great Minds PBC
P R ACT I C E
111
112
Sentence
Inequality
A number x is less than 20.
x < 20
A number b is more than 5.
b>5
A number z is at least 15.
z ≥ 15
P R ACT I C E
Number Line
x 0
5
10
15
20
25
30
0
5
10
15
20
25
30
0
5
10
15
20
25
30
b
z
© Great Minds PBC
151
8
Teacher Edition: Grade A1, Module 1, Topic B, Lesson 8 LESSON 8
Solution Sets for Equations and Inequalities in One Variable Find values to assign to the variables in equations or inequalities that make the statements true. Describe a solution set in words, in set notation, and on a graph.
EUREKA MATH2
A1 ▸ M1 ▸ TB ▸ Lesson 8
EXIT TICKET
Student Edition: Grade A1, Module 1, Topic B, Lesson 8 Name
Date
8
Solve each equation or inequality. Write the solution set by using set notation, and then graph the solution set on a number line. 1. 8 + 2p = 2(p + 4)
8 + 2 p = 2 ( p + 4) = 2p + 8 =8 + 2p
The solution set is ℝ because the equation is true for all real number values of p.
p –10
–8
–6
–4
–2
0
2
4
6
8
10
• Why would we consider checking all real numbers when looking for a solution set of an equation or inequality?
4+ x ≤ 7 x ≤ 3
• How is using set notation for finite solution sets different from using set notation for infinite solution sets?
Achievement Descriptor
x –10
–8
–6
–4
–2
0
2
In this lesson, students formalize their understanding of solution sets of equations and inequalities through class discussion and instructional strategies such as think–pair–share. Students complete a table by substituting values and evaluating the truth value of number sentences. This lesson emphasizes the meaning of solution sets rather than the process of solving equations or inequalities, which is covered in subsequent lessons. Students complete a graphic organizer to record the various representations of solution sets by using words, graphs, and set notation. This lesson introduces the terms empty set, elements, set-builder notation, and the symbol for the set of real numbers, ℝ.
Key Questions
2. 4 + x ≤ 7
The solution set is {x | x ≤ 3}.
Lesson at a Glance
4
6
8
10
A1.Mod1.AD6 Solve linear equations and inequalities in one variable. (A.REI.B.3)
© Great Minds PBC
123
© Great Minds PBC
EUREKA MATH2 A1 ▸ M1 ▸ TB ▸ Lesson 8
Agenda
Materials
Fluency
Teacher
Launch 5 min
• None
Learn 30 min
Students
• Make It True
• None
• Always True and Never True
Lesson Preparation
• Inequality
• None
Land 10 min
© Great Minds PBC
153
EUREKA MATH2
A1 ▸ M1 ▸ TB ▸ Lesson 8
Fluency Substitute Values to Determine Truth Values Students substitute a value for a variable and determine whether it results in an equation or inequality that is true or false to prepare for describing solution sets of equations and inequalities. Directions: Determine whether the equation or inequality is true or false for the given value of x. 1.
2 x + 7 = −1 if x = −4
True
2.
x > −2 if x = −5
False
3.
5 x − 5 = 5 − 5x if x = 0
False
4.
3 ≥ x + 5 if x = −2
True
5.
x 2 = 9 if x = −3
True
6.
2 (2x − 6) = x − 3 if x = 3
True
154
© Great Minds PBC
EUREKA MATH2 A1 ▸ M1 ▸ TB ▸ Lesson 8
Launch
5
Students apply the concept of truth values to number sentences. Direct students’ attention to problems 1–18. Give students 2 minutes to work independently to answer as many problems as they can. Encourage students to use mental math. For problems 1–18, determine whether the sentence is true or false. 1. I am in math class.
True
2. The president of the United States is a citizen of the United States. 3. The president of France is also the president of Mexico. 4. The White House is in Washington, DC. 5. 4 + 1 = 3 + 2
True
6. 3 + 2 = 4 − 9
False
7. 3 + 2 > 4 − 9
True
8.
1 ( 5 + 7) = 3 ⋅ 2 2
9.
5 4 + 1 = 3 3 3
True
10.
1 + 1 = 1 2 3 5
False
11. (7 + 9)2 = 162 12. (7 + 9)2 ≤ 162
False
True
True
True True
13. (3 + 4)2 = 32 + 42 14. 32 + 42 = 72
False
15. 32 × 42 = 122
True
© Great Minds PBC
True
False
155
EUREKA MATH2
A1 ▸ M1 ▸ TB ▸ Lesson 8
16. 32 × 43 = 126
False
17. π = 3.14
False
18. π > 3.14
True
Facilitate a brief discussion with students about why each number sentence is true or false, assigning each statement a truth value. Can a number sentence be both true and false? Why? No, a number sentence cannot be both true and false. A number sentence is a statement of equality or inequality between two numerical expressions. Just like a verbal statement, either that statement is true or false, but it cannot be both. Today, we will explore solutions to equations and inequalities and how the solutions are represented.
Language Support This lesson uses terminology covered in previous grades. Consider reviewing each of these terms with students. Write each term and each example in two separate rows and in a random order. Ask students to match each term to an example of that term. Debrief by focusing on the similarities between some of the terms (number sentence and equation) and the differences between other terms (expression and equation). One example of each term is listed. Other examples for each term can also be used. Number sentence: 3(2) + 4 = 10 Numeric expression: 3(2) + 4
Learn
Algebraic expression: 3n + 4 Numeric equation: 3(2) + 4 = 10
Make It True
Algebraic equation: 3n + 4 = 10
Students interpret solution sets and represent them by using set notation and graphs on a number line.
Solution: 2 (Solution to the equation 3n + 4 = 10)
Direct students to problem 6. Consider using think–pair–share for one or more of the following questions. Why is this number sentence false? The expression on the left side of the equal sign is equivalent to 5. The expression on the right side of the equal sign is equivalent to −5. Those numbers are not equal, so the number sentence is false.
156
Solution set: {2} (Solution set of the equation 3n + 4 = 10) Inequality: 3n + 4 ≤ 10
Strict inequality: 3n + 4 < 10
© Great Minds PBC
EUREKA MATH2 A1 ▸ M1 ▸ TB ▸ Lesson 8
Display problem 19. Facilitate a brief discussion by using the following questions. Consider this equation. How is it similar to the number sentence from problem 6? How is it different? The equation and the number sentence have the same expression on the right side. On the left side, they both have a 3. In this equation, the number 2 in the number sentence has been replaced with the variable n. What is the name for this type of equation? This is an algebraic equation. Is this algebraic equation true or false? It is neither true nor false. An algebraic equation is only true or false when the variable is assigned a value. Direct students to record their calculations in the middle column of the table in problem 19 and to record whether the resulting number sentence is true or false in the last column. Is the equation true when n = 0? Why? No, the equation is false. The expression on the left side of the equal sign is equivalent to 3 when n = 0. The expression on the right side of the equal sign is equivalent to −5. Those numbers are not equal. Is the equation true when n = 1? Why? No, the equation is false. The expression on the left side of the equal sign is equivalent to 4 when n = 1. The numbers still don’t match. Is there a value for n that makes this equation true? How do you know? Yes, −8 makes the equation true. The equation is true if we assign a value for n that makes the expression on the left side equal to −5. Have students record −8 as a value of n in the third row of the table and complete the rest of the row. Because −8 makes the equation true, we can say that −8 is a solution to the equation. Our goal is to find all the solutions to the equation, which is called the solution set. Are there any other values of n that make the equation true? I think −8 is the only value of n that makes the equation true. © Great Minds PBC
157
EUREKA MATH2
A1 ▸ M1 ▸ TB ▸ Lesson 8
Before we can say that −8 is the only solution, let’s try a few more values. Use the table in problem 19. Invite students to complete the first column of the table with a wide variety of real numbers to test in the equation. For problems 19–23, complete the table by using the provided equation or inequality. 19. 3 + n = 4 − 9 Sample:
158
Value of n
Number Sentence
True or False
0
3 + (0) = 4 − 9 3 = −5
False
1
3 + (1) = 4 − 9 4 = −5
False
−8
3 + (−8) = 4 − 9 −5 = −5
True
−3
3 + (−3) = 4 − 9 0 = −5
False
© Great Minds PBC
EUREKA MATH2 A1 ▸ M1 ▸ TB ▸ Lesson 8
Value of n
1 3
Number Sentence
(3)
3+ 1 = 4−9 3 1 = −5
True or False
False
3
3
3 + (3) = 4 − 9 6 = −5
False
100
3 + (100) = 4 − 9 103 = −5
False
π
3 + (π) = 4 − 9 3 + π = −5
False
When students finish, have them reveal their answers for the tested values. Ask students what the false statements mean. It is important for students to remember that a solution to an equation is a number that makes the equation a true statement. Values that make an equation false are not solutions to the equation. Direct students to complete problems 20–23. If no values are given in the first column, students should select values. Encourage them to include non-integer values.
© Great Minds PBC
159
EUREKA MATH2
A1 ▸ M1 ▸ TB ▸ Lesson 8
20. a2 = 25
Value of a
Number Sentence
True or False
−5
(−5)2 = 25
True
0
(0)2 = 25
False
1
(1)2 = 25
False
5
(5)2 = 25
True
Value of x
Number Sentence
True or False
−1
2((−1) − 6) = −12 + 2(−1) 2(− 7) = −12 − 2
True
0
2((0) − 6) = −12 + 2(0) 2(− 6) = −12
True
21. 2(x − 6) = −12 + 2x Sample:
1 2
1
160
(( ) )
(2)
2 1 − 6 = −12 + 2 1 2
( 2)
2 − 11 = −12 + 1
2((1) − 6) = −12 + 2(1) 2(−5) = −12 + 2
True
True
© Great Minds PBC
EUREKA MATH2 A1 ▸ M1 ▸ TB ▸ Lesson 8
22. 3g = 2(g + 1) + g Sample: Value of g
Number Sentence
True or False
−5
3(−5) = 2((−5) + 1) + (−5) −15 = 2(−4 ) − 5 −15 = −8 − 5
False
0
3 (0) = 2((0) + 1) + (0) 0 = 2(1) + 0
False
(2)
(( ) ) ( )
3 1 = 2 1 +1 + 1 1 2
1
© Great Minds PBC
2 3 3 = 2 + 1 2 2 2 3 1 = 3+ 2 2
()
2
3(1) = 2 ((1) + 1) + (1) 3 = 2 (2 ) + 1 3 = 4 +1
False
False
161
EUREKA MATH2
A1 ▸ M1 ▸ TB ▸ Lesson 8
23. x + 1 ≥ 6
Value of x
Number Sentence
True or False
−3
(−3) + 1 ≥ 6 −2 ≥ 6
False
1 3
162
( 13 ) + 1 ≥ 6 4 ≥ 6 3
False
5
(5) + 1 ≥ 6 6 ≥ 6
True
8
(8) + 1 ≥ 6 9 ≥ 6
True
100
(100) + 1 ≥ 6 101 ≥ 6
True
2
( 2) + 1 ≥ 6
False
© Great Minds PBC
EUREKA MATH2 A1 ▸ M1 ▸ TB ▸ Lesson 8
Debrief students on whether each statement is true or false within each table, and invite students to notice and wonder. Highlight the variety in the tables if students do not notice it. What do you notice about the number of true statements in each table? What do you wonder? I notice that the number sentences in problem 21 are all true and the number sentences in problem 22 are all false. I notice that problem 20 has two true number sentences. I wonder why there are some problems with one true number sentence and others with more than one true number sentence. I wonder how many different values for a single equation result in true number sentences. I notice that problem 23 has three true number sentences, but not all the number sentences are true. Before we resolve any of our wonderings, let us look back at the first equation, 3 + n = 4 − 9. We determined −8 is a solution. Do you think we can assign any other values to n to make the equation true? I think it is obvious that −8 is the only value that will make this equation true. If we build the solution set of this equation, we think this set would contain only the value −8. Display the set {−8}. It is impossible to check all the real numbers in an equation or inequality to find a solution set, so we need a practical approach. To solve an equation means to find its solution set. Does that mean that if we solve the equation, we would know whether −8 is the only number in the solution set? Let us find the solution set by solving the equation. Direct students to problem 24, and ask them to only solve the equation. Students will complete the remaining parts of the problem after debriefing the steps they use to solve the equation.
© Great Minds PBC
163
EUREKA MATH2
A1 ▸ M1 ▸ TB ▸ Lesson 8
24. Solve the equation 3 + n = 4 − 9. Write the solution set by using set notation. Then graph the solution set on the number line.
3+n = 4−9 3 + n = −5 n = −8 Solution set:
Sets are denoted in various ways in mathematical literature. Choosing a notation is simply a matter of convention. The conventions Eureka Math2 elects to use will be specifically defined within a lesson. Sample notations follow.
{−8}
n –10
–8
–6
–4
–2
0
2
4
Teacher Note
6
8
10
Ask for students to share the steps used to solve the equation. So our solution set is {−8}. A set is essentially a collection of things. In this case, the things are numbers.
• Finite sets Eureka Math2 Other resources
Direct students to record the solution set and annotate that the number listed inside the curly braces is called an element. How might we graph the solution set of this one-variable equation? Label the number line with the variable n on the right, and place a point on the number line that corresponds to −8.
{x | x = −5, 5}
• Empty set Eureka Math2 Other resources
Point to the solution set {−8}. This notation is called set notation. The curly braces indicate that we are denoting a set. Each thing in the set is called an element. In this example, the only element in our set is −8. No other elements belong in this particular set because no other numbers make the equation 3 + n = 4 − 9 true.
{−5, 5}
{}
∅
• Set of all real numbers Eureka Math2 Other resources • Other infinite sets Eureka Math2 Other resources
ℝ
{x | x ∈ ℝ} {x | x ≥ 5} {x | x ≥ 5}
While all of these are acceptable, Eureka Math2 elects to use the conventions outlined within the body of the lesson.
Do you think all solution sets will contain only one element? Did any of the equations in our sequence of problems have more than one value that made the equation true? No. Problems 20, 21, and 23 have more than one value that makes the equation true.
164
© Great Minds PBC
EUREKA MATH2 A1 ▸ M1 ▸ TB ▸ Lesson 8
Direct students to problem 25 and have them solve the equation. If students have difficulty solving this equation, refer to the truth values in the table in problem 20. Help students realize that the equation a2 = 25 referenced in problems 20 and 25 has only two solutions because no other values have a square of 25. 25. Write the solution set of the equation by using set notation. Then graph the solution set on the number line.
a2 = 25 Solution set:
{−5, 5}
a –10
–8
–6
–4
–2
0
2
4
6
8
10
Before revealing the set notation and graph, invite students to predict how to write and graph the solution set. How do we write and graph a solution set for a2 = 25? The solution set is {−5, 5}. The graph will have a point at −5 and a point at 5. We interpret this solution set in words by saying that the only solutions to this equation are −5 and 5. The equation a2 = 25 is true when a = −5 or a = 5. Label the number line with the variable a on the right, and place points on the number line that correspond to −5 and 5. Explain that writing the elements in increasing order when recording the solution by using set notation is a convention, but that {5, −5} represents the same set. Summarize the language and notation of solution sets by completing the tree map graphic organizer. Model how to complete the organizer, adding the information that is in a green color for finite sets. While directing students to complete the graphic organizer, make connections between the language and symbols, and ask students to give examples and details. The information shown in the other colors will be added later in the lesson.
© Great Minds PBC
165
EUREKA MATH2
A1 ▸ M1 ▸ TB ▸ Lesson 8
Solution Sets
In Words
Set Notation
Finite Sets
Infinite Sets
solutions 5 and –5.
has solutions of only values of a that are greater than 5.
a 2 = 25 has
Finite Sets
a+3>8
{–5, 5}
Infinite Sets curly braces
elements (in increasing order)
Graphically
Finite Sets
{a | a > 5} vertical bar read as “such that”
Infinite Sets
a –5
0
endpoint
a
5
a = –5 or a =5
0
5 10 a>5
greater than
Empty Set
The Set of All Real Numbers
{}
ℝ x
–5
0
5 The equation 3x = 3x + 2 has no solution.
166
x –5
0 5 The equation 3x + 2 = 3x + 2 has infinitely many solutions that form the set of all real numbers.
endpoint
a 0
5 10 a≥5
greater than or equal to
© Great Minds PBC
EUREKA MATH2 A1 ▸ M1 ▸ TB ▸ Lesson 8
Always True and Never True Students use set notation to represent the solution set of equations with no solution or infinitely many solutions and graph the solution set on a number line. Direct students to the table of truth values from problem 21. For problem 21, many of you found that all of the values you tried were solutions to the equation. How do you know whether these values are the only solutions to the equation? To solve an equation is to find the solution set. If I solve the equation, I will know whether I found all the solutions. Ask student volunteers to guide the class through the steps of solving the equation. Encourage students to record their work. Students will complete the remaining parts of the problem after debriefing the steps they used to solve the equation. For problems 26 and 27, solve the equation. Write the solution set by using set notation. Then graph the solution set on the number line. 26. 2(x − 6) = −12 + 2x
2(x − 6) = −12 + 2 x 2 x − 12 = −12 + 2 x 2x = 2x
ℝ
Solution set:
x –10
© Great Minds PBC
–8
–6
–4
–2
0
2
4
6
8
10
167
EUREKA MATH2
A1 ▸ M1 ▸ TB ▸ Lesson 8
Guide students to interpret the solution set by using the following questions. This equation will always be true for any value of x. What do we call an algebraic equation that is always true for any value of the variable? An algebraic equation that is true for any value of the variable is called an identity. How might we write these infinitely many solutions by using set notation? What will the graph look like? Students will likely realize that they cannot actually list an infinite set of numbers for the solution set of an identity, thus creating the need for a shorthand way to denote all real numbers. The solution set of this identity is the set of all real numbers. We cannot possibly list all of the solutions in the curly braces. We denote the set of all real numbers in set notation as a symbol. By hand, we draw a double vertical bar in the capital letter R. Display the symbol for the real numbers ℝ. Then draw the symbol by hand. Direct students to add this symbol and the following description to the bottom of their graphic organizers.
Promoting the Standards for Mathematical Practice Students attend to precision (MP6) when they understand and use symbols to communicate solution sets. Ask the following questions to promote MP6: • Is it exactly right to write {ℝ}? What could we add or change to be more precise? • How can we express the empty set by using the new symbols we have learned? • Where is it easy to make mistakes when finding the solution set of an equation or inequality?
The equation 3x + 2 = 3x + 2 has infinitely many solutions that form the set of all real numbers. This means the set of all real numbers. We do not write {ℝ ℝ} because that would mean “the set of the set of all real numbers,” which is not the same. If we try to plot every real number on this number line, each point would be so close to the next that we could not distinguish one from another. We use solid lines to represent all the points along that line. We also shade the arrows to indicate that the graph of the solution set extends infinitely to the right and to the left. Display the graph of the set of all real numbers. Encourage students to add the graph to the graphic organizer. This information corresponds to the information shown in the purple color in the sample graphic organizer.
x –10
168
–8
–6
–4
–2
0
2
4
6
8
10
© Great Minds PBC
EUREKA MATH2 A1 ▸ M1 ▸ TB ▸ Lesson 8
Direct students to the table from problem 22. For problem 22, how many of the values in the table make the equation true? Are there any values that will make this equation true? None of the values in the table made the equation true. Maybe the values that make the equation true aren’t listed in our tables. Ask student volunteers to guide the class through the steps to solving the equation. Encourage students to record their work. Students will complete the remaining parts of the problem after debriefing the steps they used to solve the equation. 27. 3g = 2(g + 1) + g
3g = 2( g + 1) + g 3g = 2 g + 2 + g 3g = 3g + 2 0 = 2
Solution set:
{}
g –10
–8
–6
–4
–2
0
2
4
6
8
10
Guide students to interpret the solution set by using the following questions. What does this result tell you about the solution? Why? This equation has no solution. When I arrive at a false statement when solving an equation, I know that there is no value that will make the equation true. How might we write that there are no solutions by using set notation? What will the graph look like?
© Great Minds PBC
169
EUREKA MATH2
A1 ▸ M1 ▸ TB ▸ Lesson 8
Students will likely realize that the set has no numbers to list inside the curly braces and wonder if there is a special symbol for denoting this. Facilitate student conversation by asking the following question. When a set has no elements, we call this the empty set. Why might we call it the empty set? Have students turn and talk about why sets that have no elements are called empty sets. Bring the class back together to highlight that it is called an empty set because the set really is empty. Display the symbol and graph used to denote an empty set. Direct students to add this notation and graph to the graphic organizer. Add an example of an equation in which its solution set is the empty set. This information corresponds to the information shown in the blue color in the sample graphic organizer.
Inequality Students use set notation to represent the solution to an inequality and graph the solution set on a number line.
UDL: Representation To help students develop understanding of the concept of set notation, consider activating their prior knowledge by comparing a set to a familiar object by using a suitcase analogy. Explain that a set is a collection of numbers called elements. A suitcase is a case used to carry the personal objects of a person traveling. A set is like a suitcase. Each object in the suitcase is called an element. The symbol ℝ represents the set of all real numbers, and everything is put into the suitcase. The empty set is like an empty suitcase.
Direct students to the table for problem 23. For problem 23, what values make this inequality a true statement? If students do not recall that many inequalities have infinitely many solutions, ask students to generate a list of values that make the inequality true by expanding the table from problem 23 to include more values. Record and display this expanding list of values. Elicit a few rational values that lie between a pair of consecutive integers. This will help students conceptualize that there are infinitely many solutions to the inequality. Can we list all the values in a solution set? No, it is impossible to list them all. How might we write that there are infinitely many solutions to this inequality by using set notation? What will the graph look like?
170
© Great Minds PBC
EUREKA MATH2 A1 ▸ M1 ▸ TB ▸ Lesson 8
Direct students to problem 28, and ask them to only solve the inequality. Before revealing the set notation and the graph, invite students to use their work from problem 23 to predict how they might write and graph the solution set. Only those values where x ≥ 5 belong in our solution set. What are our constraints?
For problems 28 and 29, solve the inequality. Write the solution set by using set notation. Then graph the solution set on the number line.
28. x + 1 ≥ 6
x +1 ≥ 6 x ≥ 5 {x | x ≥ 5}
Solution set:
x –10
–8
–6
–4
–2
0
2
4
6
8
10
Write the solution set for the class by using set notation as you narrate with the appropriate words. Annotate what each part of the notation means while using the prompt below.
x x >5
the set of all x such that
© Great Minds PBC
x is greater than or equal to 5
171
EUREKA MATH2
A1 ▸ M1 ▸ TB ▸ Lesson 8
When writing solution sets for inequalities, we traditionally use set-builder notation. We can build the set together by describing what it is. We are saying that the solution set is the set of all x values such that x ≥ 5. We denote a set by using the curly braces. We identify our variable inside the opening curly brace, in this case x. We draw a vertical bar. In this notation, this vertical bar is typically read as that or such that. Now we describe our constraints by using symbols, in this case x ≥ 5. We read this as the set of all x values such that x ≥ 5.
Students may wonder why they did not write any of the other sets by using this more formal notation. Those sets can be represented in the same way. When a solution set has a finite number of elements, a more formal presentation of the solution set may feel burdensome and unnecessary in this course. Direct students to add an example of infinitely many solutions represented by an inequality to the graphic organizer and annotate what each part of the notation means. This information corresponds to the example of set notation shown in the red color in the sample graphic organizer.
Teacher Note If students ask why they cannot simply write the solution set as {x ≥ 5}, remind them that the elements of a solution set are solutions. The inequality x ≥ 5 is not a solution. It represents the constraints on the solution set, hence the need to write x | in the solution set. Writing {x | x ≥ 5} establishes the set of x values that satisfy the constraint that x is greater than or equal to 5. As students explore new concepts, they need to identify the elements of the set before defining the constraints on the set.
Earlier we graphed an infinite set of solutions, more specifically the set of real numbers. How is this solution set different from the set of all real numbers? For this solution set, there are still infinitely many points to plot, but there is a clear endpoint of the graph of the solution set. What is the smallest possible value of x that makes this inequality true? The smallest possible value of x that makes this inequality true is 5. From the point plotted at 5 on the number line, do the values to the right or the values to the left make the inequality true? How can you tell?
The values to the right of 5 make the inequality true. I tested a value of x. If x = 6, then 6 + 1 ≥ 6 is a true statement.
Testing a value helps us visualize the graph of the solution set of the inequality x + 1 ≥ 6. Recall from your previous experience with inequalities that the number 5 in this inequality is called the endpoint of the graph of the solution set. Knowing that numbers to the right of our endpoint make the inequality true tells us which direction to shade. The only decision left to make is how to mark the endpoint.
Teacher Note Students use the term endpoint in grades 6 and 7 to describe the circle used when graphing inequalities. Endpoints that are not included in the solution set are graphed by using an open circle. Inequalities with this kind of solution set are called strict inequalities. Endpoints that are included in the solution set are graphed with a closed circle.
How do we mark the endpoint for an inequality with the greater than or equal to symbol? With a closed circle 172
© Great Minds PBC
EUREKA MATH2 A1 ▸ M1 ▸ TB ▸ Lesson 8
Allow students to answer the question even if they can only provide an informal description. It can be difficult to articulate how to distinguish inequalities that include the endpoint of the graph in the solution set from inequalities that exclude it. Consider using the term strict inequality as a convenient way to describe inequalities that do not include the endpoint of the graph in the solution set. The inequality x + 1 ≥ 6 is not a strict inequality because it includes the endpoint of the graph in its solution set. Direct students to finish problem 28 by graphing the solution set. Encourage students to add details to show endpoints and graphs to the graphic organizer. This information corresponds to the graphical examples shown in the red color in the sample graphic organizer. Have students complete problem 29. 29. b – 6 < –3
b − 6 < −3 b < 3 {b | b < 3}
Solution set:
b –10
–8
–6
–4
–2
0
2
4
6
8
10
Discuss the answers as a class. Pay careful attention that students write the solution set by using set-builder notation. The graph should be labeled properly. Emphasize that an open circle should be used on the graph to indicate that the endpoint is not included in the solution set.
© Great Minds PBC
173
EUREKA MATH2
A1 ▸ M1 ▸ TB ▸ Lesson 8
Land Debrief 5 min Objectives: Find values to assign to the variables in equations or inequalities that make the statements true. Describe a solution set in words, in set notation, and on a graph. Facilitate a class discussion by using the following questions. Why do we consider checking all real numbers when looking for a solution set of an equation or inequality? For a set to be a solution set of an equation or inequality, we must find all of the values that make the equation or inequality a true statement. If it were possible to check every real number, we could find all of the solutions. Do equations always have finite solution sets? Answer with a thumbs-up or thumbs-down. Do equations always have solution sets? Answer with a thumbs-up or thumbs-down. Do equations always have a solution? Answer with a thumbs-up or thumbs-down. Explain. Not all equations have finite solution sets. Algebraic identities have infinitely many solutions, which indicates a solution set with infinitely many elements. Equations always have a solution set. Some equations don’t have elements in the solution set. These equations don’t have solutions, but they still have a solution set. The solution set is the empty set. How is using set notation for finite solution sets different from using set notation for infinite solution sets? We use set notation to list each element in a finite solution set. We use set-builder notation for infinite sets, except the set of real numbers, because we cannot list all of the individual elements. We use a shorthand symbol, ℝ, for the infinite set of real numbers.
Exit Ticket 5 min Provide up to 5 minutes for students to complete the Exit Ticket. It is possible to gather formative data even if some students do not complete every problem. 174
Teacher Note Assign the Practice problems for completion outside of class or use them in class if time remains after the lesson. Refer students to the Recap for support.
© Great Minds PBC
EUREKA MATH2 A1 ▸ M1 ▸ TB ▸ Lesson 8
Recap
EUREKA MATH2
A1 ▸ M1 ▸ TB ▸ Lesson 8
Student Edition: Grade A1, Module 1, Topic B, Lesson 8
RECAP
Name
Date
8
•
represented solution sets in words, in set notation, and on graphs.
•
solved equations by using mental math.
I can rewrite the equation as 6x − 12 = 6x − 72. I know that 6x = 6x for all values of x. But because −12 is not equal to −72, there are no values of x that make the equation true.
Terminology
determined whether equations and inequalities are true for different values of the variable.
•
For problems 3 and 4, solve the equation by using mental math. Write the solution set, and then graph the solution set on a number line. 3. 6x − 12 = 6(x − 12)
Solution Sets for Equations and Inequalities in One Variable In this lesson, we
EUREKA MATH2
A1 ▸ M1 ▸ TB ▸ Lesson 8
{}
The solution set of this problem is the empty set. This notation means “a set with no elements.”
An element of a set is an item in the set. An empty set is a set that has no elements.
x –10 –9 –8 –7 –6 –5 –4 –3 –2 –1
0
1
2
3
4
5
6
7
8
9 10
Examples 1. Write the solution set represented by the graph.
A graph of the empty set does not show any points or shading.
a –10 –9 –8 –7 –6 –5 –4 –3 –2 –1
0
1
{a | a ≤ 0}
2
3
4
5
6
7
8
9 10
4. 6x − 12 = 6(x − 2) I can rewrite the equation as 6x − 12 = 6x − 12. All values of x make this equation true.
ℝ
The solution set of this problem contains any value of x. This notation
The solution set of this problem is infinite, so we use set-builder notation. This solution set means “the set of all values of a such that a ≤ 0.”
means “the set of all real numbers.”
x –10 –9 –8 –7 –6 –5 –4 –3 –2 –1
2. Find the value of x that satisfies the equation 9 + 3x = 6x. Write your answer in set notation. Solve the problem by using mental math. I know that 3x + 3x = 6x. So the 9 on the left side of the equation must be equal to 3x. Therefore, x = 3.
0
1
2
3
4
5
6
7
8
9 10
A graph of the set of all real numbers shows shading on the entire number line, including both arrows.
{3} The solution set of this problem is finite, so we use set notation. This solution set means “the set consisting of the number 3.”
© Great Minds PBC
© Great Minds PBC
125
126
RECAP
© Great Minds PBC
175
EUREKA MATH2
A1 ▸ M1 ▸ TB ▸ Lesson 8
Sample Solutions Expect to see varied solution paths. Accept accurate responses, reasonable explanations, and equivalent answers for all student work.
EUREKA MATH2
A1 ▸ M1 ▸ TB ▸ Lesson 8
Student Edition: Grade A1, Module 1, Topic B, Lesson 8
PRACTICE
Name
Date
8
EUREKA MATH2
A1 ▸ M1 ▸ TB ▸ Lesson 8
8.
{x x < 12 } x
For problems 1–4, determine whether the number sentence is true or false.
2. (24 + 16) ⋅ 5 = 24 + (16 ⋅ 5)
50 1. 18 + 7 = 2
True
–5
–4
–3
–2
–1
0
1
2
3
4
5
False
For problems 9–12, write the solution set represented by the graph. 3. (5 + 4)2 = 52 + 42
4.
False
–10
–6
–4
–2
0
2
4
6
8
10
–8
–6
–4
–2
0
2
4
6
8
10
–8
–6
–4
–2
0
2
4
6
8
10
{n | n ≥ −5}
–6
–4
–2
0
2
4
6
8
10
p
10.
5. {8}
–10 {−6, 6}
–10
–8
–6
–4
–2
0
2
4
6
8
10 q
11.
{− 43 }
–10 {}
–2
–1
0
1
2 n
12.
7. ℝ
–10
–10
© Great Minds PBC
176
–8
{−3}
True
For problems 5–8, graph the solution set.
6.
x
9.
2 −1 ≥ 22 − 3 3 3
–8
–6
–4
–2
0
2
4
6
8
10
127
128
–8
P R ACT I C E
© Great Minds PBC
© Great Minds PBC
EUREKA MATH2 A1 ▸ M1 ▸ TB ▸ Lesson 8
EUREKA MATH2
A1 ▸ M1 ▸ TB ▸ Lesson 8
For problems 13–17, determine whether the equation or inequality is true or false when x = 2. 13. 11 + 2x = 1 − 3x False
EUREKA MATH2
A1 ▸ M1 ▸ TB ▸ Lesson 8
23. What makes an equation an identity?
14. 11 + 2x ≥ 1 − 3x
An identity is an algebraic equation that is true for all values of the variable.
True
For problems 24–29, find the solutions to the equation. Write the solution set by using set notation. Try to solve the problem by using mental math. 15. 3(x + 4) = 8(x + 1) − 3x True
24. x − 10.5 = 12
16. 7x + 9 + 2x = 9(x + 1)
25. 4x = 6 + 2x
{22.5}
True 26.
{3}
3 x = 4 16
27.
{12}
x +1 3 = 4 16
{11}
17. 8 − 3x + 4x + 2 = 9 + 3x − 2(x + 1) 28. x2 = −9
False
29. 3x + 5 = 6x + 5
{}
{0}
For problems 30–32, solve the equation by using mental math. Write the solution set by using set notation. Then graph the solution set on the number line.
18. What is the solution set of an equation? Explain in your own words. The solution set of an equation is the set of all the values of a variable that make the equation a true number sentence when each of those values is substituted for the variable.
30. x2 = 36
{−6, 6} x
For problems 19–22, write a sentence that interprets the solution set of the equation or inequality. 19. 19 + x = 10; {−9} The equation 19 + x = 10 is only true when x = −9.
–10
20. c2 = 16; {−4, 4}
–8
–6
–4
–2
0
2
4
6
8
10
–4
–2
0
2
4
6
8
10
–4
–2
0
2
4
6
8
10
31. 5(x − 2) = 5x − 2
The equation c2 = 16 is only true when c = −4 or c = 4.
{} x
21. x − 3 = x − 5; {} There is no solution to x − 3 = x − 5.
–10
22. −6b + 4 < 10; {b | b > −1}
© Great Minds PBC
P R ACT I C E
–6
32. 5(x − 2) = 5x − 10
Only values of b greater than −1 make the inequality −6b + 4 < 10 true.
ℝ x –10
© Great Minds PBC
–8
129
130
–8
P R ACT I C E
–6
© Great Minds PBC
177
EUREKA MATH2
A1 ▸ M1 ▸ TB ▸ Lesson 8
EUREKA MATH2
A1 ▸ M1 ▸ TB ▸ Lesson 8
33. The equation A = l ⋅ w gives the area of a rectangle in square units with length l units and width w units. a. Find A when l = 10 and w = 15.5.
41. Create an equation in one variable with one solution. Write the solution set by using set notation. Sample: 2a + 4 = a − 8, {−12}
b. Find l when A = 26 and w = 2.
A = 155
EUREKA MATH2
A1 ▸ M1 ▸ TB ▸ Lesson 8
l = 13 42. Revise one expression from the equation you created in problem 41 so the solution set of the new equation is all real numbers. Sample: 2a + 4 = 2(a + 2)
c. Find w when A = 9 and l = 12 .
w = 18
43. Revise one expression from the equation you created in problem 41 so that the new equation has no solution. Sample: 2a + 4 = 2a − 8 For problems 34–39, find the solution(s) to the equation. Write your answer by using set notation. 34. 3 − b + 8 = 16
{−5}
35. 8(b − 2) = 6b − 2 + 2b
{}
Remember For problems 44 and 45, solve the equation.
36. 6b − (5 + 2b) = −5 + 4b
ℝ
38.
2b + 4 10
37. 3b(b + 1) + 6 = 3(b2 + b + 2)
44.
ℝ
=
ℝ
b +2 5
39. b2 + 6b + 3 = b(b + 6)
−1
8
(n + 3)(2n2 − 3n + 4) 3
2
2n + 3n − 5n + 12 For problems 47 and 48, solve the inequality. 47. x − 5 > −13
x > −8
2
178
45. a + −
46. Find the product. Write your answer in standard form.
{}
40. Find the value of b if the equation b(y + 1) = 2(y + 1) is an identity.
© Great Minds PBC
( 14 ) = − 83
2 = −4 a 3 9 3 − 2
P R ACT I C E
131
132
P R ACT I C E
48. 2 ≤ 7 + x
−5 ≤ x
© Great Minds PBC
© Great Minds PBC
9
Teacher Edition: Grade A1, Module 1, Topic B, Lesson 9 LESSON 9
Solving Linear Equations in One Variable Explain each step in solving a linear equation.
EUREKA MATH2
A1 ▸ M1 ▸ TB ▸ Lesson 9
Student Edition: Grade A1, Module 1, Topic B, Lesson 9 Name
Date
EXIT TICKET
9
1. Solve the equation 2 x − 3(x − 2) = 4x + 34. State the operation or property used for each step, and write the solution set by using set notation.
2 x − 3 ( x − 2) = 4 x + 34 2 x − 3 x + 6 = 4 x + 34
Distributive property
−x + 6 = 4 x + 34
Addition of like terms
−5 x + 6 = 34
Addition property of equality
−5 x = 28
Addition property of equality
28 x = − 5
Multiplication property of equality
Lesson at a Glance In this lesson, students see the effects of using the associative, commutative, and distributive properties and the properties of equality to create new equations, concluding that the new equation will have the same solution set as the original equation. Students apply this understanding to solve equations and justify solution paths by using properties and operations. Students critique the reasoning of others as they compare different solution paths with corresponding justifications to build flexible thinking.
Key Questions
The solution set is {− 28 . 5}
• What does it mean to say that applying a property preserves the solution set of an equation?
2. Without solving, explain why the equations 2 + 3x = 4x − 2 and 6x + 4 = 8x − 4 have the same solution set. Include references to properties in your answer. By the multiplication property of equality, multiplying both sides of the first equation by 2 creates an equation that has the same solution set as the original equation.
2 + 3x = 4 x − 2 2( 2 + 3 x ) = 2( 4 x − 2 ) 4 + 6 x = 8x − 4
• Which properties can we use to rewrite an equation in a way that preserves its solution set?
Achievement Descriptors A1.Mod1.AD5 Identify and explain steps required to solve linear
equations in one variable and justify solution methods. (A.REI.A.1)
I can apply the commutative property of addition to rewrite the equation 4 + 6x = 8x − 4 as 6x + 4 = 8x − 4. So the multiplication property of equality, the distributive property, and the commutative property of addition allow me to rewrite 2 + 3x = 4x − 2 as 6x + 4 = 8x − 4. This means that the two equations have the same solution set.
A1.Mod1.AD6 Solve linear equations and inequalities in one variable. (A.REI.B.3)
© Great Minds PBC
137
© Great Minds PBC
EUREKA MATH2 A1 ▸ M1 ▸ TB ▸ Lesson 9
Agenda
Materials
Fluency
Teacher
Launch 5 min
• None
Learn 30 min
Students
• Property Development
• None
• Justifying Steps
Lesson Preparation
Land 10 min
• None
© Great Minds PBC
181
EUREKA MATH2
A1 ▸ M1 ▸ TB ▸ Lesson 9
Fluency
Teacher Note
Solve One- and Two-Step Equations Students solve one- and two-step equations to prepare for solving multi-step equations and explaining each step in the process.
Instead of this lesson’s Fluency, consider administering the Solve One- and Two-Step Equations Sprint. Directions for administration can be found in the Fluency resource. EUREKA MATH2
A1 ▸ M1 ▸ Sprint ▸ Solve One- and Two-Step Equations
A
Directions: Solve each equation for x. 1.
2.
3.
182
x + 12 = 2 −9 = 3 + x − 4 x = −6 5
Number Correct:
Solve each equation.
−10 −12 15 2
4.
27 = 4x + 11
4
5.
14 − x = 20
−6
6.
2 ( x − 6 ) = −8 3
−6
1.
x+2=6
23.
2.
x+4=6
24.
2x + x = 18
3.
x+6=6
25.
2x + x + 3 = 18
2x = 18
4.
x − 3 = 12
26.
2x + x + 6 = 18
5.
x − 5 = 12
27.
3x + 6 = 18
6.
x − 7 = 12
28.
18 = 3(x + 2)
7.
8x = 16
29.
8.
4x = 16
30.
12 = −x − x − x
9.
2x = 16
31.
−x − 3 − x − x = 12
12 = −3x
10.
1 x = 4 2
32.
11.
1 x = 4 3
33.
12 = −3(x + 1)
12.
8 + x = −4
34.
− 1 ( x − 4) = 2
13.
−8 + x = −4
35.
−1 x + 1 = 2
14.
x − 8 = −4
36.
−2 = 1 x − 1
15.
x − (−8) = 4
37.
3 x +6 = 9 2
16.
−5x = 10
38.
3 (x + 4) = 9 2
17.
10x = −5
39.
9 = 3( x + 8)
18.
2x = −6
40.
−9 =
19.
−6x = 2
41.
− 3 ( x + 8) = −9
20.
1 x = −6 2
42.
−2 x + 1 = 1
21.
− 1 x = −6 2
43.
− 2 ( x − 1) = 1
22.
−1 x = 2
44.
1 = −2 x + 2
6
−3x − 3 = 12
4
4
4
4
3 4
( x + 8)
4
3
3
3
3
© Great Minds PBC
EUREKA MATH2 A1 ▸ M1 ▸ TB ▸ Lesson 9
Launch
5
Students use prior knowledge to solve equations by using if–then moves. Display the following conditional statement, or create your own in the if–then format. If it rains, then Emma wears a coat. Ask students to turn and talk to interpret the conditional statement. Choose two students to share their thinking with the class. If students do not naturally conclude that the if portion of the statement must be true before considering the then portion, pose the following questions. If it does not rain, what can you conclude? I cannot conclude anything. If it rains, what can you conclude? Emma wears a coat. Explain that when the condition in the if part of the statement (it rains) is satisfied, the conclusion in the then part of the statement will follow. We cannot conclude anything when the if part of the statement is not satisfied. Direct students to the two if–then statements found above problem 1. Students learned to solve equations by using these if–then moves in grade 7. Students will formally name these properties after completing problems 1–3. Have students complete problems 1–3. Consider allowing them to work in pairs to complete the problems. Given that a, b, and c are expressions: If a = b, then a + c = b + c.
Addition property of equality
If a = b, then ac = bc.
Multiplication property of equality
© Great Minds PBC
183
EUREKA MATH2
A1 ▸ M1 ▸ TB ▸ Lesson 9
For problems 1–3, identify the solution set for each equation. Use the if–then moves to justify each step of your solution path. Problem 1 has been started for you. Complete each statement. 1. 7x + 3 = 45
7 x + 3 = 45 7 x = 42 x = 6 Solution set:
If a = b, then a + c = b + c. If a = b, then ac = bc .
{6}
2. 5(v − 4) = 100
5 ( v − 4 ) = 100 v − 4 = 20 v = 24 Solution set:
If a = b, then ac = bc.
If a = b, then a + c = b + c.
{24}
3. 3z + 1.6 = 2z
3 z + 1. 6 = 2 z 1.6 = −z −1.6 = z
If a = b, then a + c = b + c. If a = b, then ac = bc.
Solution set: {−1.6} Debrief student thinking with a focus on if–then moves. Ensure that students justify steps requiring subtraction by using the if–then move for addition and justify steps requiring division by a nonzero number by using the if–then move for multiplication. Eureka Math2 defines only the addition and multiplication properties of equality.
184
Teacher Note Notice how students handle problem 2. If students can properly justify using the distributive property in their first step, allow them that flexibility. Also notice whether students need support in their final step of solving problem 3. They can justify the step by multiplying by −1.
© Great Minds PBC
EUREKA MATH2 A1 ▸ M1 ▸ TB ▸ Lesson 9
Return to the if–then moves above problem 1, and formalize by naming the properties of equality and having students write the property names. Students encountered these properties in grade 8 but may not recall their formal names. Today, we will continue to explore how to use properties and operations to solve equations.
Learn Property Development Students verify that using the commutative, associative, and distributive properties along with the properties of equality creates a new equation with the same solution set. Have students complete problems 4–6. For problems 4–9, without solving, state the property or properties that justify why the two equations must have the same solution set. 4. 5(v − 4) = 100 and (v − 4)5 = 100 Commutative property of multiplication 5. 5(v − 4) = 100 and 5v − 20 = 100 Distributive property
6. 2[5(v − 4)] = 2(100) and (2 ⋅ 5)(v − 4) = 2(100) Associative property of multiplication
© Great Minds PBC
185
A1 ▸ M1 ▸ TB ▸ Lesson 9
EUREKA MATH2
Debrief student thinking by posing the following question. We used the commutative, associative, and distributive properties in topic A to demonstrate that two expressions were equivalent. Why can we use these properties to justify relationships between two equations? Equations state that two expressions are equivalent, so if we apply these properties to one or both expressions in an equation, the new equation will still have the same solution set as the original equation. We can say that using these properties to rewrite an equation preserves the solution of the original equation. This means that the new equation must have the same solution set as the original equation. Have students complete problems 7–9. 7. v − 4 = 20 and 5(v − 4) = 100 Multiplication property of equality 8. v − 4 = 20 and v − 2 = 22 Addition property of equality 9. 5v − 20 = 100 and −4 + v = 20 Multiplication property of equality and commutative property of addition Debrief student responses, and assess students’ understanding by posing the following questions. If we have four operations, why do we only name two properties of equality? Subtraction is really the same operation as adding the opposite of a number, and division is really the same operation as multiplying by the reciprocal of a nonzero number. The solution set of every equation in problems 4–9 is the same. What is the solution set, and why is it the same for all the problems? The solution set of every equation in problems 4–9 is {24}. Help students recognize the relationship among the equations in the problems. Lead students to conclude that applying
186
© Great Minds PBC
EUREKA MATH2 A1 ▸ M1 ▸ TB ▸ Lesson 9
properties of arithmetic or equality to an equation preserves its solution set. In other words, applying any of these properties will produce an equation that has the same solution set. Allow students additional time to verify solution sets if they do not trust the conclusion. Ask students to complete problems 10 and 11, encouraging them to be creative with their number selection. Invite two or three students to share their responses with the class. 10. Apply the addition property of equality to the equation 1 − 9q = −19 to create an equation with the same solution set. Sample: 11 − 9q = −9 11. Apply the multiplication property of equality to the equation 1 − 9q = −19 to create an equation with the same solution set. Sample: 10 − 90q = −190 Facilitate a brief discussion by asking students to focus on the conditional nature of the properties of equality.
Teacher Note Ensure that students understand that although the application of the addition or multiplication property of equality preserves an equation’s solution set, not every application will move us closer to finding the solution set.
3x + 5 = 23 (2)(3x + 5) = (2)23 6x + 10 = 46 This type of application of the multiplication property of equality can be helpful when solving systems of equations in two variables in module 2.
How does each property begin? If a = b So the assumption is that we begin with a true sentence. That sentence could be a numeric equation or an algebraic equation. The multiplication property of equality says that whenever a = b is true, then ac = bc will also be true for all real numbers c. For problem 11, what happens if we multiply both sides of the equation by 0? We get the equation 0 = 0. The result is a true statement, so the multiplication property of equality holds for the case when c is 0. But does the new equation have the same solution set as the original equation? No. The new equation is now an identity. Does applying the addition or multiplication property of equality to an equation preserve its solution set?
© Great Minds PBC
187
EUREKA MATH2
A1 ▸ M1 ▸ TB ▸ Lesson 9
Using the addition property of equality to rewrite an equation always preserves the equation’s solution set. Using the multiplication property of equality to rewrite an equation preserves the equation’s solution set as long as we are multiplying by a constant other than 0. Display the equation from problem 12. Ask students to use mental math to find a value of x that satisfies the equation. Students should quickly realize that it will be impossible to find a value of x that makes 3 times a number equal to 3 times that number plus 2. Have students complete the first row of the table in problem 12. Ask students to share their answers. 12. Consider the equation 3x = 3x + 2. Complete the table. Original Equation
Resulting Equation
Step
Solution Set of Original Equation UDL: Representation
Add −3x to both sides of the equation.
3x = 3x + 2
Solution Set of Resulting Equation
0=2
Multiply both sides of the equation by a nonzero number.
Sample:
−6x = −6x − 4
Multiply both sides of the equation by 0.
0=0
{}
{}
{}
{}
ℝ
{}
Display 3x − 3x = 3x + 2 − 3x. Consider using different colors to connect this equation to a + c = b + c, where a = 3x and b = 3x + 2. In this instance, c = − 3x.
a+c=b+c 3x – 3x = 3x + 2 – 3x
Color-coding serves as a visual cue, focusing students’ attention on each element of the equation and how it relates to the addition property of equality.
Teacher Note This lesson provides an ideal time to incorporate the material in the Math Past resource. The concepts covered in this lesson along with those in the next two lessons strongly connect to the selected math history topic. If time is limited, consider dispersing the material throughout these three lessons.
0=2 188
© Great Minds PBC
EUREKA MATH2 A1 ▸ M1 ▸ TB ▸ Lesson 9
The resulting equation is 0 = 2. This statement is false. What does this imply about our original equation 3x = 3x + 2 and its solution set? The expressions on either side of the original equation are not equal. In other words, a ≠ b. No value of x will result in a true statement, so the solution set to the original equation is empty. More generally, if a + c ≠ b + c, then a ≠ b.
Direct students to complete the second row in the table. Display the answer, and debrief with students. Guide students to reach the following conclusions: • When we apply a property of equality to begin solving an equation, we assume the equation has a solution. That is, we assume there exists a value of x that makes the equation true.
• Our results confirm our previous finding that the expressions on either side of the original equation are not equal; that is, a ≠ b. • Any value we substitute for x will result in a false statement. That means the solution set is the empty set. Direct students to complete the third row in the table. Display the answer, and debrief with students. The multiplication property of equality says that whenever a = b, then ac = bc. We multiplied in both the second and third rows of the table. Do the new equations have the same solution sets as the original equation? The solution set is preserved in the second row but not in the third row. What is the difference between the multiplication in the second and third rows? The second row requires multiplying by a nonzero number, and the third row specifies multiplying by zero. Why do we need to specify that we multiply by nonzero real numbers? Multiplying both sides of an equation by zero can make a false statement true. The solution set of our resulting equation is different from the solution set of the original one. This example highlights one reason for noting that using the multiplication property of equality to rewrite an equation only preserves the equation’s solution set when multiplying by nonzero real numbers. © Great Minds PBC
189
EUREKA MATH2
A1 ▸ M1 ▸ TB ▸ Lesson 9
Adding a real number or multiplying by a nonzero number, even if our assumption a = b is wrong, preserves the solution set. This tells us that we can rely on our properties to help us generate new equations until we arrive at an equation for which we know the solution set.
Justifying Steps Students solve equations and justify solution sets by using properties of arithmetic, properties of equality, and operations. Display problem 13 and solve as a class by asking students to suggest a solution path. Display each step, and record the property or operation justification next to it. Probe student thinking by eliciting the justification and asking for alternate steps students might have taken to get to the same solution. For problems 13–15, solve each equation. Write the property or operation used in each step. Write the solution set by using set notation. 13. 3 +
g 7
=
3+
g
14 g 7 g 7 g 14
−2 = =
g 14 g 14
−2 −5
= −5
g = −70
UDL: Engagement Building a classroom culture that supports a growth mindset includes sharing efficient work samples and work samples that may include unnecessary steps or repeated steps. Emphasize that learning is most effective if students evaluate their work, identify their errors, and adjust their strategies accordingly to ensure future success.
UDL: Action & Expression Consider scaffolding practice. While students complete this problem, display a worked example. The example should match the written instructions by including the solution steps, the justification for each step, and the solution set written in set notation.
Addition property of equality Addition property of equality Multiplication property of equality
Solution set: {−70} Ask students to complete problems 14 and 15. Monitor students as they work, looking for a variety of solution paths to display during the debrief.
190
© Great Minds PBC
EUREKA MATH2 A1 ▸ M1 ▸ TB ▸ Lesson 9
14. 3x + 7 = 3 + 8x − 16
3 x + 7 = 3 + 8 x − 16 3 x + 7 = 8 x − 13 7 = 5 x − 13 20 = 5 x 4 = x
Solution set:
Addition of like terms Addition property of equality Addition property of equality Multiplication property of equality
{4}
15. 6(2 + x) + 4x − 19 = −18x − 3
6 (2 + x ) + 4 x − 19 = −18 x − 3 12 + 6 x + 4 x − 19 = −18 x − 3 10 x − 7 = −18 x − 3 28 x − 7 = −3 28 x = 4 x = 1
7
Solution set:
Distributive property Addition of like terms Addition property of equality Addition property of equality Multiplication property of equality
{ 17 }
Display the answers to both problems. Next, have students exchange their work with a partner and conduct a peer review. Students should briefly discuss their solution path with their partner. Close the activity by displaying selected student work samples, and debrief any outstanding questions or disputes. Elicit the following points during the debrief:
© Great Minds PBC
191
EUREKA MATH2
A1 ▸ M1 ▸ TB ▸ Lesson 9
• There are infinitely many ways to create a new equation that has the same solution set as the one you started with. • Some steps are helpful in finding the solution to the equation, and some are not. A step may be mathematically accurate without helping you isolate the variable in an equation. Refer back to problems 4 and 5 to illustrate this point.
Land
Promoting the Standards for Mathematical Practice Students construct viable arguments and critique the reasoning of others (MP3) when they justify each step in solving an equation by using the associative, commutative, and distributive properties and the properties of equality and then peer review their classmates’ solution paths and corresponding justifications.
Debrief 5 min
Ask the following questions to promote MP3:
Objective: Explain each step in solving a linear equation.
• Why does your solution path work? Convince your partner.
Facilitate a brief discussion by using the following questions. What does it mean to say that applying a property preserves the solution set of an equation? It means that we applied a property to create a new equation that we know must have the same solution set as the original equation.
• What questions can you ask your partner to make sure you understand his or her justifications? • Is your partner’s solution path true? How do you know?
Which properties can we use to rewrite an equation in a way that preserves its solution set? The associative property, the commutative property, the distributive property, the addition property of equality, and the multiplication property of equality using a nonzero multiplier preserve the solution set of an equation.
Exit Ticket 5 min Provide up to 5 minutes for students to complete the Exit Ticket. It is possible to gather formative data even if some students do not complete every problem.
192
Teacher Note Assign the Practice problems for completion outside of class or use them in class if time remains after the lesson. Refer students to the Recap for support.
© Great Minds PBC
EUREKA MATH2 A1 ▸ M1 ▸ TB ▸ Lesson 9
Recap
EUREKA MATH2
A1 ▸ M1 ▸ TB ▸ Lesson 9
Student Edition: Grade A1, Module 1, Topic B, Lesson 9 Name
RECAP Date
EUREKA MATH2
A1 ▸ M1 ▸ TB ▸ Lesson 9
9
By the commutative property of addition, I can rewrite 16m + 48 as 48 + 16m. The result is an equation with the same solution set as the original equation.
−6(m − 5) = 48 + 16m
Solving Linear Equations in One Variable
−3(m − 5) = 8(m + 3).
In this lesson, we •
solved linear equations.
•
verified that, with the exception of multiplying both sides of an equation by 0, applying the properties of arithmetic and equality preserves the solution set of an equation.
•
justified each step in solving an equation by applying properties and operations.
The original equation is
The equations −3(m − 5) = 8(m + 3) and −6(m − 5) = 48 + 16m have the same solution set because each property applied preserved the solution set. For problems 2–4, find the solution set. State the property or operation used in each step. 2. 9x − 5 = 10x − 5
Examples
9 x − 5 = 10 x − 5 −5 = x − 5
1. Explain why the equations −3(m − 5) = 8(m + 3) and −6(m − 5) = 48 + 16m have the same solution set.
0 = x
By the multiplication property of equality, I can multiply both sides of the first equation by 2. This preserves the solution set because I multiplied by a nonzero number.
{0}
2 ⋅ (−3(m − 5)) = 2 ⋅ (8(m + 3))
Addition property of equality Addition property of equality The solution set {0} means that the equation is true only when x equals 0. The solution set {0} is not the same as { }.
By the associative property of multiplication, I can regroup the factors. This preserves the solution set.
3. 11x + 7(2 − x) − 8 = 4x + 6
(2 ⋅ (−3))( m − 5) = (2 ⋅ 8)( m + 3) −6 ( m − 5) = 16 ( m + 3)
11x + 7 (2 − x ) − 8 = 4 x + 6 11x + 14 − 7 x − 8 = 4 x + 6 11x − 7 x + 14 − 8 = 4 x + 6 4x + 6 = 4x + 6
The associative property of multiplication says you can regroup the factors to multiply 2
Distributive property Commutative property of addition Addition of like terms
ℝ
and −3 first.
The resulting expressions are identical. Therefore, the values of the expressions must be equal for all values of x.
By the distributive property, I can rewrite 16(m + 3) as 16m + 48. This preserves the solution set.
−6(m − 5) = 16m + 48
© Great Minds PBC
© Great Minds PBC
139
140
RECAP
© Great Minds PBC
193
EUREKA MATH2
A1 ▸ M1 ▸ TB ▸ Lesson 9
EUREKA MATH2
4.
A1 ▸ M1 ▸ TB ▸ Lesson 9
4 ( 5 x − 1) x −2 = 3 24
24
(
x − 2 = 4 (5 x −1) 24 3 x − 2 = 24 4 (5 x −1) 3 24
(
)
8( x − 2) = 4(5 x − 1) 8 x − 16 = 20 x − 4 −16 = 12 x − 4 −12 = 12 x −1 = x
)
Multiplication property of equality Multiplication Distributive property Addition property of equality Addition property of equality Multiplication property of equality
{−1}
© Great Minds PBC
194
RECAP
141
© Great Minds PBC
EUREKA MATH2 A1 ▸ M1 ▸ TB ▸ Lesson 9
Sample Solutions Expect to see varied solution paths. Accept accurate responses, reasonable explanations, and equivalent answers for all student work.
EUREKA MATH2
A1 ▸ M1 ▸ TB ▸ Lesson 9
Student Edition: Grade A1, Module 1, Topic B, Lesson 9
PRACTICE
Name
Date
9
6. 3w + (8 + 6w) + 2w = 180 and 11w = 172 By the associative and commutative properties of addition, I can regroup and change the order of the terms in the left-side expression, resulting in the equation 3w + 6w + 2w + 8 = 180. Applying these properties preserves the solution set of the original equation. By adding like terms, the resulting equation is 11w + 8 = 180. I can then use the addition property of equality. I can add −8 to both sides of the equation to obtain 11w = 172. This means that the two equations have the same solution set.
For problems 1–4, write the property or operation that explains why the given equations have the same solution set. 1. 2x = 6 and 2x + 7 = 13
2.
Addition property of equality
EUREKA MATH2
A1 ▸ M1 ▸ TB ▸ Lesson 9
1 g = 4 and 2g = 64 8
Multiplication property of equality
7. For each step, write the property or operation that shows why each equation has the same solution set as the equation in the previous step.
9x − 3 + 2 x + 4 = 8 (x − 3) + 4
4. 3p − 8 = 21 and p − 8 = 7
3. 5y − 7y = 14 and −2y = 14
9x − 3 + 2 x + 4 = 8 x − 24 + 4 9x + 2 x − 3 + 4 = 8 x − 24 + 4 11x + 1 = 8 x − 20
3
Addition of like terms
Multiplication property of equality
Distributive property Commutative property of addition Addition of like terms
3 x + 1 = −20 3 x = −21 x = −7
Addition property of equality Addition property of equality Multiplication property of equality
For problems 5 and 6, without solving, explain why the two equations have the same solution set. Include references to properties in your answer. For problems 8–13, find the solution set of the equation.
5. 3(a + 5) = −4a + 8 and 9(a + 5) = −12(a − 2)
8. 4x − 9 = 5
By the multiplication property of equality, multiplying both sides of the first equation by 3 preserves the solution set.
{ 27 }
3 ⋅ (3(a + 5)) = 3 ⋅ (−4a + 8)
By the associative property of multiplication, rewriting 3 ⋅ (3(a + 5)) as 9(a + 5) preserves the solution set. By the distributive property, rewriting 3 ⋅ (−4a + 8) as −12a + 24 preserves the solution set.
9. 3m − 5 = 2(m + 6) − 17 + m
9(a + 5) = −12a + 24
ℝ
10. 3 +
{−9}
x 6
=
x +2 18
(
11. 5(2 x + 1) − 2 x = 10 x − 2 x −
{}
3 2
)
I can apply the distributive property again to rewrite −12a + 24 as −12(a − 2), resulting in 9(a + 5) = −12(a − 2). This means that the two equations have the same solution set.
© Great Minds PBC
© Great Minds PBC
143
144
P R ACT I C E
© Great Minds PBC
195
EUREKA MATH2
A1 ▸ M1 ▸ TB ▸ Lesson 9
EUREKA MATH2
12.
x +6 5
=
{4}
A1 ▸ M1 ▸ TB ▸ Lesson 9
2 ( 3 x + 8) 20
13.
2q 6
{3}
=
EUREKA MATH2
A1 ▸ M1 ▸ TB ▸ Lesson 9
16. Nina and Angel both solved an equation. They compared their solution paths. The beginning steps of each path is provided.
7− q 4
Nina’s Work
3 1 4 ( x + 3) = − x + + x 5 5 5 3 3 1 4 x + = − x + + x 5 5 5 5
For problems 14 and 15, solve the equation. State the property or operation used in each step. Write the solution set by using set notation.
Angel’s Work
3 1 (x + 3) = − 4 x + + x 5 5 5 3 1 4 5 (x + 3) = 5 − x + + x 5 5 5 3 4 1 (x + 3) = 5 ⋅ − x + 5 ⋅ + 5 ⋅ x 5 5
(
)
(
)
( )
14. 5x + 7 = 4x + 7
5x + 7 = 4 x + 7 x+7 = 7 x = 0
a. Complete Nina and Angel’s work. Write the solution set by using set notation.
Addition property of equality
Nina’s work:
Addition property of equality
3 3 1 1 x+ = x+ 5 5 5 5
{0}
ℝ
Angel’s work:
x + 3 = −4 x + 3 + 5 x x+3 = x+3 ℝ
15. 3(m − 2) = 5m + 4(2m + 1)
3( m − 2) = 5m + 4(2 m + 1) 3m − 6 = 5m + 8m + 4 3m − 6 = 13m + 4 −6 = 10 m + 4 −10 = 10 m −1 = m
Distributive property
b. Explain why Nina and Angel will both arrive at the same solution set. Use properties or operations to justify your response.
Addition of like terms Addition property of equality
Nina used the distributive property to rewrite the equation. Angel used the multiplication property of equality to multiply both sides of the equation by 5. Then Angel used the distributive property to rewrite the expression on the right and the associative property to rewrite the expression on the left. He also added like terms. Applying any of these properties or operations creates a new equation that has the same solution set as the original equation, so both students should arrive at the same solution set. As I completed the work, I used only the distributive property and the addition and multiplication properties of equality.
Addition property of equality Multiplication property of equality
{−1}
© Great Minds PBC
196
P R ACT I C E
145
146
P R ACT I C E
© Great Minds PBC
© Great Minds PBC
EUREKA MATH2 A1 ▸ M1 ▸ TB ▸ Lesson 9
EUREKA MATH2
A1 ▸ M1 ▸ TB ▸ Lesson 9
Remember For problems 17 and 18, solve the equation. 17. 1.6 − m = 14.2
18. −5m = −22.5
−12.6
4.5
19. Find the difference. Write your answer in standard form.
(5a + 2)2 − (6a3 − 10a − 9) 3
2
−6a + 25a + 30a + 13
For problems 20 and 21, solve the inequality. 20. −3x ≤ 42
x ≥ −14
© Great Minds PBC
© Great Minds PBC
21.
x > −5 2
x > −10
P R ACT I C E
147
197
10
Teacher Edition: Grade A1, Module 1, Topic B, Lesson 10 LESSON 10
Some Potential Dangers When Solving Equations (Optional) Explore steps in solving an equation that are not guaranteed to preserve the solution set.
EUREKA MATH2
A1 ▸ M1 ▸ TB ▸ Lesson 10
Student Edition: Grade A1, Module 1, Topic B, Lesson 10
EXIT TICKET
Name
Date
10
Consider the equation x + 3 = 10, which has the solution set {7}. For each of the following problems, create a new equation by performing the action described on the equation x + 3 = 10. Then state the solution set of the new equation. 1. Square both sides of the equation.
( x + 3)2 = 102 ( x + 3)2 = 100 The original solution 7 is also a solution to the new equation because (7 + 3)2 = (10)2 = 100. There is a second solution to the new equation, −13, because (−13 + 3)2 = (−10)2 = 100. The solution set is {−13, 7}.
Lesson at a Glance In this optional lesson, students expand their knowledge of ways to solve an equation by exploring steps beyond using the properties that are guaranteed to preserve a solution set. Students independently explore the effects of squaring both sides of an equation, multiplying both sides of an equation by a variable expression, and dividing both sides of an equation by a variable expression before sharing their observations with others. These explorations not only solidify students’ understanding of the properties learned and applied in the previous lessons of this topic but also give students the freedom to experiment with other actions.
Key Questions 2. Multiply both sides of the equation by x.
• What are some potential dangers when taking actions outside of the properties of arithmetic and equality when solving an equation?
x(x + 3) = 10x The original solution of 7 is also a solution to the new equation. When x = 7, x(x + 3) = 7(7 + 3) = 7(10) = 70, and 10x = 10(7) = 70. There is a second solution to the new equation, 0, because when 0 is substituted for x, the expressions on both sides of the equal sign have a value of 0.
• While it is a good habit to always check solutions, when is it necessary to check solutions to an equation?
The solution set is {0, 7}.
Achievement Descriptors
3. Add x to both sides of the equation.
x + x + 3 = x + 10 2 x + 3 = x + 10
A1.Mod1.AD5 Identify and explain steps required to solve linear
equations in one variable and justify solution methods. (A.REI.A.1)
x = 7
The solution set is {7}.
A1.Mod1.AD6 Solve linear equations and inequalities in one variable. (A.REI.B.3)
© Great Minds PBC
153
© Great Minds PBC
EUREKA MATH2 A1 ▸ M1 ▸ TB ▸ Lesson 10
Agenda
Materials
Fluency
Teacher
Launch 10 min
• None
Learn 25 min
Students
• Squaring Both Sides
• None
• Multiplication Property of Equality
Lesson Preparation
Land 10 min
• None
© Great Minds PBC
199
EUREKA MATH2
A1 ▸ M1 ▸ TB ▸ Lesson 10
Fluency Solve Equations by Inspection Students solve equations by using mental math to prepare for exploring steps in solving an equation that are not guaranteed to preserve the solution set. Directions: Solve each equation by using mental math. Write the solution set by using set notation. 1.
x + 5 = 12
{7}
2.
x2 + x + 5 = x2 + 12
{7}
3.
x2 = 16
{−4, 4}
4.
2x2 = 32
{−4, 4}
5.
5x = 10
{2}
6.
5 x− 2 8 = 3 3
{2}
200
Teacher Note If time permits, ask students to identify the property or properties that explain why the two equations in each pair (problems 1 and 2, problems 3 and 4, and problems 5 and 6) have the same solution set.
© Great Minds PBC
EUREKA MATH2 A1 ▸ M1 ▸ TB ▸ Lesson 10
Launch
10
Students summarize what actions are guaranteed to preserve a solution set and explore actions that do not preserve a solution set. Initiate a class discussion by using the following prompts. Blank space is provided for students to work and make notes about their observations. What are the properties we applied when solving equations in previous lessons? Commutative, associative, and distributive properties; addition property of equality; and multiplication property of equality for any nonzero multiplier What does it mean if we say that applying these properties is guaranteed to preserve the solution set of the original equation? We can apply any combination of these properties, and each new equation produced is guaranteed to have the same solution set as the original equation. Display the equation
x = 1. 12 4
The properties of equality are sometimes summarized by saying that whatever is done to one side of the equation has to be done to the other. Applying this idea, Nina decides to erase both denominators. Does that give her the correct solution set? No. Erasing both denominators gives her the equation x = 1, which has the solution set {1}. However, this is not the solution set of the original equation. The correct solution set can be found by multiplying both sides by 12. The solution set is {3}. Display the equation 3x + 4 = 4x − 5. Find the solution set of the equation. Give students 1 minute to work, and then confirm that the solution set is {9}.
Promoting the Standards for Mathematical Practice When students test conjectures, examine counterexamples, and justify their conclusions, they are constructing viable arguments (MP3). Ask the following questions to promote MP3: • Is it true that applying the properties of equality always preserves the solution set? How do you know?
Ji-won decides to add x + 2 to both sides of the equation. Does that action preserve the solution set of the original equation?
• Can you find a situation where applying the multiplication property of equality does not preserve the solution set?
Yes. He’s using the addition property of equality, so the new equation will have the same solution set as the original equation.
• When do you think this strategy preserves the solution set?
© Great Minds PBC
201
A1 ▸ M1 ▸ TB ▸ Lesson 10
EUREKA MATH2
Confirm by solving the problem as a class or by having students work individually. Display the equation 3x2 + 4 = 4x2 − 5. What is the solution set of this equation? If students need help getting started, prompt them to subtract 3x2 from both sides. Give students 1 minute to work, and then confirm that the solution set is {−3, 3}. Tiah decides to ignore the exponents on both sides of the equation. Does that action preserve the solution set of the original equation? No. Ignoring the exponents would result in the equation 3x + 4 = 4x − 5, which has the solution set {9}. Have students summarize their key takeaways from this sequence of problems. Lead them to the idea that they have the freedom to try various operations or actions when solving an equation, but if they take any actions outside of the associative, commutative, and distributive properties, properties of equality, or properties of rational exponents, they are not guaranteed to end up with the same solution set that the original equation has. Today, we will explore some actions that produce equations with solution sets that are different from the solution set for the original equation.
Learn
25
Squaring Both Sides Students explore how squaring both sides of an equation may not preserve the solution set of the original equation. Allow students to work on problems 1 and 2 either independently or in groups. Then debrief by having students share their responses to problem 2(b).
202
© Great Minds PBC
EUREKA MATH2 A1 ▸ M1 ▸ TB ▸ Lesson 10
1. Consider the equations x + 1 = 4 and (x + 1)2 = 16. a. What is the solution set of x + 1 = 4? Explain. The solution set is {3} because 3 + 1 = 4. b. What is the solution set of (x + 1)2 = 16? Explain. The solution set is {−5, 3} because (3 + 1)2 = 42 = 16 and (−5 + 1)2 = (−4)2 = 16. c. Based on your results, does squaring both sides of an equation preserve the solution set of the original equation? No. The solution set of the new equation contains the solution to the original equation but also contains a second solution. 2. Consider the equations x − 2 = 0 and (x − 2)2 = 0. a. What are the solution sets of the two equations? The solution set of both equations is {2} because 2 − 2 = 0 and (2 − 2)2 = 0. b. Based on your results, does squaring both sides of an equation preserve the solution set of the original equation? Sometimes but not always. The solution set of the new equation contains the solution to the original equation, but it might also contain a second solution. Return to the first problem from Launch. x = 1 4 12
If we square both sides of the equation, do you think the new equation will have the same solution set as the original equation? Probably not. I think 3 will still be a solution, but there will probably be a second solution to the new equation.
© Great Minds PBC
203
EUREKA MATH2
A1 ▸ M1 ▸ TB ▸ Lesson 10
Have students square both sides and find the solutions to the new equation.
(12x ) = ( 14 ) 2
Teacher Note
2
x2 = 1 144 16
x2 = 9 x = 3 or x = −3
The work done in this lesson will help students to understand why extraneous solutions sometimes arise when solving radical and rational equations in Algebra II.
Reiterate that squaring both sides of the equation did not preserve the solution set of the original equation; the new equation’s solution set consists of the original solution, 3, and an additional solution, −3.
Multiplication Property of Equality Students explore how multiplying both sides of an equation by a variable expression may not preserve the solution set of the original equation. Allow students time to work on problem 3 either independently or in groups. 3. Consider the equation x − 3 = 5. a. Multiply both sides of the equation by a nonzero constant, and verify that the solution set of the new equation is the same as the original equation. Sample:
7(x − 3) = 7(5) 7x − 21 = 35 7x = 56 x = 8 The solution set of both the original equation and the new equation is {8}. 204
© Great Minds PBC
EUREKA MATH2 A1 ▸ M1 ▸ TB ▸ Lesson 10
b. Multiply both sides of the equation by x, and verify that 8 is a solution to the new equation.
x(x − 3) = 5x When x = 8, x(x − 3) = 8(8 − 3) = 8(5) = 40 and 5x = 5(8) = 40. c. Show that 0 is also a solution to the equation from part (b). When x = 0, x(x − 3) = 0(0 − 3) = 0 and 5x = 5(0) = 0. d. Based on your results, does multiplying both sides of an equation by a nonzero constant preserve the solution set of the original equation? Yes. Multiplying both sides of an equation by a nonzero constant produces an equation that has the same solution set as the original equation. e. Based on your results, does multiplying both sides of an equation by a variable expression preserve the solution set of the original equation? Multiplying both sides of an equation by a variable expression could produce an equation with a solution set that is different from that of the original equation. The solution set of the new equation contains the solution to the original equation, but it also might contain a second solution. Debrief as a class by having students share their responses to problems 3(d) and 3(e). Then pose the following question. Why did multiplying both sides by x produce an equation where the solution set was not the same as that of the original equation? Applying the multiplication property of equality is only guaranteed to preserve the solution set if we multiply both sides by a nonzero constant. Because x is an unknown value that could be equal to 0, multiplying both sides by x could produce an equation with a solution set that is different from that of the original equation. Display the second equation from Launch.
3x + 4 = 4x − 5 We saw earlier that adding x + 2 to both sides preserved the solution set of the original equation. What do you think multiplying both sides by x + 2 will do? I think that it will create a new equation that has a second solution. © Great Minds PBC
205
EUREKA MATH2
A1 ▸ M1 ▸ TB ▸ Lesson 10
Write (x + 2)(3x + 4) = (x + 2)(4x − 5). Is 9 a solution to this new equation? Yes. When I substituted 9 into the expressions on each side of the equal sign, I got the same value of 341. Is there a second solution to the new equation? How can you tell? There is a second solution of −2. When x is −2, the expression x + 2 is 0, so when I substitute −2 for x, both sides of the equation equal 0. Direct students to problem 4, and ask them to explain how they might solve part (a). Because both denominators are the same, I can just equate the numerators and solve. I can multiply both sides of the equation by x − 2. Give students time to complete both parts of problem 4.
Differentiation: Support If students have difficulty solving the rational equations in problem 4, remind them of work done with equivalent fractions in previous grades. For example, if x = 5 , then what 7 7 value must x have for those fractions to be equivalent?
4. Solve for x, and then check the solution. a. x − 4 = x −2
5 x −2
x−4 = 5 x = 9 When x = 9, x−4 = 9−4 = 5 and x−5 2 = 9−5 2 = 57 . The solution is 9. x −2
b. x + 3 = x −2
9−2
7
5 x −2
x +3 = 5 x = 2 = ____ When x = 2, ____ = _ 5 , which is undefined. The equation has no solution. x+3 x−2
206
2+3 2−2
0
© Great Minds PBC
EUREKA MATH2 A1 ▸ M1 ▸ TB ▸ Lesson 10
Debrief by having students share what happened when they checked the solutions. For the first equation, the solution worked when I checked it, but when I checked the solution in the second equation, I ended up with 0 in the denominator. Elicit the idea again that applying the multiplication property of equality is not guaranteed to preserve the solution set when multiplying both sides of an equation by a variable expression. Students are still free to take that action, but they must check any solutions. Allow students time to work on problems 5 and 6 either independently or in groups. 5. Consider the equation x2 = 5x. a. Ana multiplies both sides by 1x to solve. What solution does she get? Verify that it is a solution to the original equation. 1 ⋅ x2 = 1 ⋅ 5x x x
x=5 When x = 5, x2 = 52 = 25 and 5x = 5(5) = 25. b. Bahar says that the equation actually has two solutions. What is the second solution to the equation? The second solution is 0 because 02 = 0 and 5(0) = 0. 6. Consider the equation (x − 1)(x − 5) = 2(x − 1). a. The solution set of this equation is {1, 7}. Show that these are both solutions to the equation. When x = 1, (1 − 1)(1 − 5) = 0 and 2(1 − 1) = 0. When x = 7, (7 − 1)(7 − 5) = (6)(2) = 12 and 2(7 − 1) = 12. 1 creates a new equation. What value is not b. Multiplying both sides of the equation by x− 1 included in the solution set of this new equation?
1
© Great Minds PBC
207
A1 ▸ M1 ▸ TB ▸ Lesson 10
EUREKA MATH2
c. Based on your results, does dividing both sides of an equation by a variable expression preserve the solution set of the original equation? No. Dividing both sides of an equation by a variable expression can produce a new equation with a solution set that does not contain all of the solutions to the original equation. Debrief as a class. In problem 5, Ana multiplied both sides of the equation by 1x . What is the issue with multiplying both sides of an equation by an expression like this? If we multiply both sides by 1x , we are assuming x ≠ 0. This means the new solution set does not include 0, but we can see from Bahar’s work that 0 should be part of the solution set. In each problem, what happened when you divided both sides by a variable expression? The new equation did not have the same solution set as the original. The solution set of the new equation only contained one of the solutions to the original equation.
Land Debrief 5 min Objective: Explore steps in solving an equation that are not guaranteed to preserve the solution set. Ask students to summarize their key takeaways from the lesson. During the discussion, pose the following questions.
208
© Great Minds PBC
EUREKA MATH2 A1 ▸ M1 ▸ TB ▸ Lesson 10
What are some potential dangers when taking actions outside of the properties of arithmetic and equality when solving an equation? If we take any steps other than using the properties that we know will preserve the solution set, we might get an equation with a solution set that is different from that of the original equation. While it is a good habit to always check solutions, when is it necessary to check solutions to an equation? We need to check solutions if we do anything besides apply the properties of arithmetic or the properties of equality. We can try other actions, but we always need to check the solutions in the original equation.
Exit Ticket 5 min Provide up to 5 minutes for students to complete the Exit Ticket. It is possible to gather formative data even if some students do not complete every problem.
Teacher Note Assign the Practice problems for completion outside of class or use them in class if time remains after the lesson. Refer students to the Recap for support.
© Great Minds PBC
209
EUREKA MATH2
A1 ▸ M1 ▸ TB ▸ Lesson 10
Recap
EUREKA MATH2
A1 ▸ M1 ▸ TB ▸ Lesson 10
Student Edition: Grade A1, Module 1, Topic B, Lesson 10 Name
RECAP Date
10
c. Show that multiplying both sides of the equation by x + 5 results in a new equation with a solution set that also includes −5.
(4x − 3)(x + 5) = (x + 9)(x + 5)
Some Potential Dangers When Solving Equations
Substitute −5 for x to verify that −5 is also a solution. Left side: (4(−5) − 3)((−5) + 5) = (−23)(0) = 0
In this lesson, we
Right side: ((−5) + 9)((−5) + 5) = (4)(0) = 0
•
discovered that not all moves preserve the solution set when solving an equation.
•
explored popular moves that are not guaranteed to preserve the solution set, such as squaring both sides of an equation and multiplying both sides of an equation by a variable expression.
•
EUREKA MATH2
A1 ▸ M1 ▸ TB ▸ Lesson 10
2. Consider the equation 3x = x − 4. a. Find the solution set.
discovered that certain moves when solving an equation may result in an equation with a solution set that is different from that of the original equation.
x = −2 {−2}
1. Consider the equation 4x − 3 = x + 9. a. Find the solution set.
b. Square both sides of the equation. Show that −2 is a solution of the resulting equation.
4x − 3 = x + 9
(3x)2 = (x − 4)2
3x − 3 = 9 3 x = 12 x =4
Substitute −2 for x to verify that −2 is a solution. Left side: (3(−2))2 = (−6)2 = 36 Right side: ((−2) − 4)2 = (−6)2 = 36
{4}
c. Show that 1 is also a solution of the resulting equation.
b. Show that adding x + 5 to both sides of the equation preserves the solution set.
(3x)2 = (x − 4)2
4 x − 3 + ( x + 5) = x + 9 + ( x + 5) 5 x + 2 = 2 x + 14 3 x + 2 = 14 By the addition property 3 x = 12 of equality, adding a variable expression to both sides x =4 {4}
210
both sides of an equation by a variable expression may result in a new equation with a different solution set.
3x = x − 4 2x = −4
Examples
© Great Minds PBC
The solution set of the resulting equation is {−5, 4}. So multiplying
Substitute 1 for x to verify that 1 is also a solution. Left side: (3(1))2 = (3)2 = 9 Right side: ((1) − 4)2 = (−3)2 = 9
of an equation preserves the solution set.
155
156
RECAP
The solution set of the resulting equation is {−2, 1}. So squaring both sides of an equation may result in a new equation with a different solution set.
© Great Minds PBC
© Great Minds PBC
EUREKA MATH2 A1 ▸ M1 ▸ TB ▸ Lesson 10
Sample Solutions Expect to see varied solution paths. Accept accurate responses, reasonable explanations, and equivalent answers for all student work.
EUREKA MATH2
A1 ▸ M1 ▸ TB ▸ Lesson 10
Student Edition: Grade A1, Module 1, Topic B, Lesson 10 Name
PRACTICE Date
EUREKA MATH2
A1 ▸ M1 ▸ TB ▸ Lesson 10
10
c. Show that multiplying both sides of the equation by x − 4 creates a new equation with a different solution set that includes 4.
(x − 4)(x + 4) = (x − 4)(3x + 2)
1. Consider the equation a = 3. Create a new equation by performing the action described on the equation. Then state the solution set of the new equation.
When x = 4, (x − 4)(x + 4) = (4 − 4)(4 + 4) = 0 and (x − 4)(3x + 2) = (4 − 4)(3(4) + 2) = 0.
a. Square both sides of the equation.
a2 = 9, {−3, 3}
b. Cube both sides of the equation. 3. Consider the equation x + 2 = 2x.
a3 = 27, {3}
a. Find the solution set.
{2}
c. Multiply both sides of the equation by a. 2
a = 3a, {0, 3}
b. Square both sides of the equation, and verify that your solution satisfies this new equation.
2. Consider the equation x + 4 = 3x + 2.
(x + 2)2 = (2x)2
When x = 2, (x + 2) = (2 + 2) = 16 and (2x)2 = (2 ⋅ 2)2 = 16.
a. Find the solution set.
2
{1}
b. Show that adding x − 4 to both sides of the equation creates a new equation with the same solution set.
2
c. Show that − 23 is also a solution to the new equation. 2
2
When x = − 23 , ( x + 2) = (− 23 + 2) =
(x − 4 ) + x + 4 = (x − 4 ) + 3 x + 2
2
2
2
2
( 43 ) = 169 and (2 x) = (2 ⋅ (− 23 )) = (− 43 ) = 169 .
2x = 4x − 2 2 = 2x 1= x
© Great Minds PBC
© Great Minds PBC
157
158
P R ACT I C E
© Great Minds PBC
211
EUREKA MATH2
A1 ▸ M1 ▸ TB ▸ Lesson 10
EUREKA MATH2
A1 ▸ M1 ▸ TB ▸ Lesson 10
4. Consider the equation x(x − 3) = 5(x − 3).
EUREKA MATH2
A1 ▸ M1 ▸ TB ▸ Lesson 10
Remember
a. Explain why it is incorrect to divide both sides by x − 3 to solve for x.
For problems 8 and 9, solve the equation.
Because x − 3 is a variable expression, it can equal 0. Dividing both sides by x − 3 would mean that for an x-value of 3, we would be dividing by 0, which we cannot do. It would create a new equation with a solution set that is different from that of the original equation.
9. p − 4.7 = −12.2
8. − 3 p = 5 4 5 − 9
12
−7.5
b. What is the solution set of the equation?
{3, 5} 10. Find the difference. Write your answer in standard form.
(9y3 − 6y + 7) − (3y − 1)2 3
9y − 9y + 6
For problems 5–7, solve the equation for x. 5.
2
1 = 3 x −5 16 3
6.
x −5 = 3 x −5
For problems 11 and 12, solve the inequality.
No solution
11. 5 − n > 35
n < −30 7.
3 8
12. − n ≤ −9
n ≥ 24
x −5 =1 x −5
All real numbers except 5
© Great Minds PBC
212
P R ACT I C E
159
160
P R ACT I C E
© Great Minds PBC
© Great Minds PBC
11
Teacher Edition: Grade A1, Module 1, Topic B, Lesson 11 LESSON 11
Writing and Solving Equations in One Variable Create equations in one variable and use them to solve problems.
EUREKA MATH2
A1 ▸ M1 ▸ TB ▸ Lesson 11
Student Edition: Grade A1, Module 1, Topic B, Lesson 11 Name
Date
EXIT TICKET
11
Nina sells tickets to the school play. Adult tickets are $8 each, and student tickets are $5 each. She sells 15 fewer student tickets than adult tickets. If Nina’s ticket sales are $315 total, how many student tickets does she sell? Let x represent the number of adult tickets Nina sells.
Then x − 15 represents the number of student tickets Nina sells.
8 x + 5 ( x − 15) = 315
8 x + 5 x − 75 = 315 13 x − 75 = 315 13 x = 390 x = 30
Substituting 30 for x: Nina sells 15 student tickets.
Lesson at a Glance Students work in pairs to solve a real-world problem by using a method of their choice. Students transition to writing and solving equations for other real-world and mathematical contexts. They consider the importance of clearly defining the variable when solving a problem. Through discussion in groups, they connect the process of creating and solving equations from real-world and mathematical problems.
Key Questions • When we write an equation to represent a situation, why is it important to define the variable as specifically as possible?
x − 15 = 30 − 15 = 15
• When can we write a one-variable equation to solve a problem in context?
Achievement Descriptors A1.Mod1.AD5 Identify and explain steps required to solve linear
equations in one variable and justify solution methods. (A.REI.A.1) A1.Mod1.AD6 Solve linear equations and inequalities in one variable. (A.REI.B.3)
A1.Mod1.AD7 Create equations and inequalities in one variable and
use them to solve problems. (A.CED.A.1) A1.Mod1.AD9 Interpret solutions to equations and inequalities © Great Minds PBC
165
in one variable as viable or nonviable options in a modeling context. (A.CED.A.3) © Great Minds PBC
EUREKA MATH2 A1 ▸ M1 ▸ TB ▸ Lesson 11
Agenda
Materials
Fluency
Teacher
Launch 5 min
• None
Learn 30 min
Students
• School Choir
• None
• Writing and Solving Equations
Lesson Preparation
Land 10 min
• None
© Great Minds PBC
215
EUREKA MATH2
A1 ▸ M1 ▸ TB ▸ Lesson 11
Fluency Solve Multi-Step Equations Students solve multi-step equations to prepare for using equations in one variable to solve problems. Directions: Solve each equation for m. 1.
2(3m + 4) − 3m = 35
9
2.
0 = 7 − _ 1 (8 − 5m) 4
−4
3.
10 − 6m = 2m + 58
−6
4.
−2(4m − 1) = 9(2m − 2)
10 13
216
__
© Great Minds PBC
EUREKA MATH2 A1 ▸ M1 ▸ TB ▸ Lesson 11
Launch
5
Students consider the most efficient method for solving a problem. Direct students to problem 1 and give them two minutes of silent time to read and take notes on the problem. Thinking back to the printing press problem from the beginning of this topic, what were some of the strategies groups used to solve the problem? Some groups used guess and check. Other groups used tape diagrams. And some groups wrote and solved an equation. What strategy do you think would be most efficient for solving this problem? Turn and talk. Allow students time to discuss solution strategies with a partner and then say: In today’s lesson, we will solve problems a variety of ways, including by creating and solving equations.
UDL: Action & Expression Consider supporting students in understanding the problem by using the Three Reads routine. Provide additional support by having students organize the information from the problem into four sections—three small sections and one large section. The labels of the smaller sections should correspond to the questions from the Three Reads strategy: What is the problem about? What is the important information? What is the question? The larger section is reserved for students to solve the problem. What is the problem about?
What is the important information?
What is the question?
Workspace:
Learn School Choir
Teacher Note
Students solve a problem by using the method of their choice. Have students work with a partner to solve problem 1. Circulate as students work, seeing if students are attending to precision. Regardless of the method chosen, students should define their variable, clearly organize their work, and be able to explain their thinking. While circulating, look for a few different solution paths to share during debrief such as guess and check, tape diagrams, and writing and solving an equation.
© Great Minds PBC
Students can either work together by using the same strategy or they can opt to solve the problem by using different strategies and then compare results and check each other’s work. If they use the same strategy, encourage the student pair to find another pair that solved the problem a different way and compare their work.
217
EUREKA MATH2
A1 ▸ M1 ▸ TB ▸ Lesson 11
1. At the beginning of the school year, the school choir had an equal number of freshmen and sophomores. At the end of the first semester, 3 sophomores left the choir. After that, the ratio of the number of sophomores to the number of freshmen became 3 : 4. How many sophomores remained in the choir? Let srepresent the number of sophomores in the choir at the beginning of the year. Then salso represents the number of freshmen in the choir. And s − 3represents the number of sophomores remaining in the choir.
Using the ratio of 3 : 4, the number of sophomores remaining must equal _ times the 4 number of freshmen. s − 3 = _3 s 4 3 _ s − 3 − s = 0 4 1_ s = 3 4 3
s = 12
Promoting the Standards for Mathematical Practice When students solve a problem by using a method of their choice, they are making sense of problems and persevering in solving them (MP1). Ask the following questions to promote MP1: • What steps can you take to start identifying the known and unknown quantities in this problem? • What information do you need to write an equation? • Does your answer make sense? Why?
Substituting 12for s:
s − 3 = 12 − 3 = 9 The number of sophomores remaining in the choir is 9. Once most students have finished, share a few different work samples that reflect different solution strategies if they exist. Just as we saw in the printing press problem, this problem can be solved by using a variety of strategies, but writing and solving an algebraic equation is sometimes the most efficient way to solve a problem such as this one. What are the advantages to using algebraic equations to solve problems like this one? The problems can be solved faster by using equations than by using guess and check. Equations help us describe general relationships that exist. We can use equations to efficiently determine unknowns in a variety of situations.
218
© Great Minds PBC
EUREKA MATH2 A1 ▸ M1 ▸ TB ▸ Lesson 11
Writing and Solving Equations Students create and solve equations from real-world and mathematical problems. Consider allowing students to work in groups. Read problem 2 to the class. This problem has two unknowns: the number of dimes and the number of quarters. Share your thinking aloud with the class as you model how to generate an equation by letting x represent the number of quarters. Invite students to write an expression in terms of xfor the number of dimes. Organize the information to scaffold writing an equation by documenting what each expression represents. Allow students to write an equation that represents the situation before offering support. Verify that students have written an accurate equation. Then pose the following question. How could we define our variable differently? We could define our variable to represent the number of dimes. Have students write an equation to represent the situation where xrepresents the number of dimes. Display the different equations side by side. Approach 1:
Approach 2:
Let x represent the number of quarters.
Let x represent the number of dimes.
Then x − 5 represents the number of dimes.
Then x + 5 represents the number of quarters.
Equation: 0.25x + 0.10 (x − 5) = 5.45
Equation: 0.10x + 0.25(x + 5) = 5.45
All students should write both equations. Half of the class should solve the equation for approach 1, where xrepresents the number of quarters, and the other half of the class should solve the equation for approach 2, where xrepresents the number of dimes. Regardless of how the students define the variables, they should use their solutions to answer the question in terms of the scenario.
© Great Minds PBC
219
EUREKA MATH2
A1 ▸ M1 ▸ TB ▸ Lesson 11
Solve each problem by writing and solving an equation. 2. Angel has $ 5.45in quarters and dimes. He has 5 fewer dimes than quarters. How many of each coin does Angel have? Approach 1:
Approach 2:
Let x represent the number of quarters.
Let x represent the number of dimes.
The expression x − 5 represents the number of dimes.
The expression x + 5 represents the number of quarters.
Then 0.25x represents the amount of money in dollars from the quarters.
Then 0.10x represents the amount of money in dollars from the dimes.
Then 0.10(x − 5) represents the amount of money in dollars from the dimes.
Then 0.25(x + 5) represents the amount of money in dollars from the quarters.
0.25x + 0.10(x − 5) = 5.45
0.10x + 0.25(x + 5) = 5.45
0.25x + 0.10x − 0.50 = 5.45
0.10x + 0.25x + 1.25 = 5.45
0.35x − 0.50 = 5.45
0.35x + 1.25 = 5.45
0.35x = 5.95
0.35x = 4.20
x = 17
x = 12
When we substitute 17 for x, the number of dimes is 12 since (17) − 5 = 12.
When we substitute 12 for x, the number of quarters is 17 since (12) + 5 = 17.
Angel has 17 quarters and 12 dimes.
Angel has 12 dimes and 17 quarters.
Debrief the student work by using the following prompt. The solution in approach 1 is different from the solution in approach 2. How can both solutions help us answer the question? In approach 1, solving for xtells us the number of quarters. Then we can substitute the number of quarters to find the number of dimes. In the second equation, solving for x tells us the number of dimes. Then we can substitute the number of dimes to find the number of quarters. The only difference between the two approaches is the order in which we find the number of dimes and number of quarters.
220
© Great Minds PBC
EUREKA MATH2 A1 ▸ M1 ▸ TB ▸ Lesson 11
Direct students to complete the remaining problems. Circulate as students work and offer support as appropriate. Ensure that students attend to the following details: • Define variables. • Document each expression created. • Substitute the solution to the equation into each expression to answer any multi-part questions. If students need support writing the related expressions for the problems, encourage them to use a tape diagram or guess, check, generalize, and verify to make sense of the problem. Students can use the tape diagram or the repeated reasoning used in guess and check to generalize by creating an equation. Students can use colors to highlight the portion of each equation that changes with each new guess. The following is an example for problem 3:
Differentiation: Challenge In problem 3, consider asking students who are ready for a challenge to define the variable t to represent Tiah’s age 12 years ago or to represent Tiah’s age 16 years from now. Ask them to create an equation by using this new relationship. Students will create expressions based on how the variable is defined. Follow up by asking why all the equations they created have different solution sets although they each model Tiah’s age.
Let 1 0be Tiah’s current age:
10 + 16 = 26
2(10 − 12) = −4
An age of −4years doesn’t make sense, so she must be older than 1 0. Let 2 0be Tiah’s current age:
20 + 16 = 36
2(20 − 12) = 16
Those numbers are pretty far apart. Let 4 0be Tiah’s current age:
40 + 16 = 56
2(40 − 12) = 56
Write an equation that uses the variable t , which represents Tiah’s current age.
t + 16 = 2(t − 12) Debrief any interesting solution paths, especially those where one group may have defined a variable differently from the other groups.
© Great Minds PBC
221
EUREKA MATH2
A1 ▸ M1 ▸ TB ▸ Lesson 11
3. Sixteen years from now, Tiah’s age will be twice her age 1 2years ago. What is Tiah’s current age? Let t represent Tiah’s current age in years. Then, t + 16represents Tiah’s age 1 6years from now, and t − 12represents Tiah’s age 1 2years ago, in years.
t + 16 = 2(t − 12) t + 16 = 2t − 24 16 = t − 24 40 = t
Tiah is 4 0years old. 4. Bahar and Huan filled bags of popcorn to sell at the baseball game. • Huan filled 2 5%more bags of popcorn than Bahar. • After the game, 1 5%of the combined total of their bags was not sold. • The bags sold for $ 0.75 each. • Bahar and Huan made $ 114.75selling bags of popcorn. How many bags of popcorn did each person fill?
Let b represent the number of bags of popcorn Bahar filled.
Then b + 0.25b, or 1 .25b, represents the number of bags of popcorn Huan filled.
Together they filled b + 1.25bbags of popcorn. If 1 5%of the bags were not sold, Bahar and Huan sold 1 00 % − 15%, or 8 5%. Then 0 .85(b + 1.25b)represents the total number of bags sold.
Therefore, 0 .75(0.85(b + 1.25b)) represents the amount of money they made.
0.75(0.85(b + 1.25b)) = 114.75
0.75(0.85(2.25b)) = 114.75 1.434375b = 114.75 b = 80 Substituting 8 0for b :
1.25b = 1.25(80) = 100
Bahar filled 8 0bags of popcorn, and Huan filled 1 00bags of popcorn. 222
© Great Minds PBC
EUREKA MATH2 A1 ▸ M1 ▸ TB ▸ Lesson 11
Land Debrief 5 min Objective: Create equations in one variable and use them to solve problems. Facilitate a discussion by using the following prompts. Have students think about the prompts independently for 2 minutes, and then discuss as a class. When we write an equation to represent a situation, why is it important to define the variable as specifically as possible? For example, in problem 3, why should we define tto represent Tiah’s current age in years? This problem referenced three different ages for Tiah: her current age, her age 1 2 years ago, and her age 1 6years from now. If we define the variable to represent her age, it is unclear what our result means. If we define t to represent Tiah’s current age, we can solve the equation and answer the question without further calculations. Thinking about problem 3, explain why the solution set to this equation has only one element. Tiah cannot be more than one age at any given time, whether that is now, 12 years ago, or 1 6years from now. When can we write a one-variable equation to solve a problem in a real-world situation? We can write a one-variable equation to solve a problem in context when we have enough information to create expressions for any related quantity in terms of the defined variable.
Teacher Note
Exit Ticket 5 min
Assign the Practice problems for completion outside of class or use them in class if time
Provide up to 5 minutes for students to complete the Exit Ticket. It is possible to gather formative data even if some students do not complete every problem.
remains after the lesson. Refer students to the Recap for support.
© Great Minds PBC
223
EUREKA MATH2
A1 ▸ M1 ▸ TB ▸ Lesson 11
Recap
EUREKA MATH2
A1 ▸ M1 ▸ TB ▸ Lesson 11
Student Edition: Grade 8, Module 1, Topic A, Lesson 1 Name
RECAP Date
11
Angel is 17 years old now. Substitute 17 for a in 25 − a to find his sister’s age now.
25 − (17) = 8
Writing and Solving Equations in One Variable
Angel’s sister is 8 years old now.
In this lesson, we •
wrote equations in one variable.
•
used equations in one variable to solve problems.
EUREKA MATH2
A1 ▸ M1 ▸ TB ▸ Lesson 11
Examples 1. A bowling alley has two different options to pay for bowling: •
a cost of $5.75 per game plus a shoe rental fee of $3.50 or
•
a flat hourly rate of $32.25 that includes shoe rental.
How many games must a player bowl in one hour for the two options to cost the same? Let g represent the number of games.
5.75g + 3.50 = 32.25 5.75g = 28.75 g = 5
A player must bowl 5 games in one hour for the cost to be the same. 2. The sum of Angel’s age now and his sister’s age now is 25. Three years ago, Angel’s age was 1 less than 3 times his sister’s age then. How old are Angel and his sister now? Let a represent Angel’s age now. Then 25 − a represents his sister’s age now. Also, a − 3 represents Angel’s age 3 years ago, and 22 − a represents his sister’s age 3 years ago.
Angel’s age 3 years ago
© Great Minds PBC
224
a − 3 = 3(22 − a ) − 1 a − 3 = 66 − 3a − 1 a − 3 = 65 − 3a 4 a − 3 = 65 4 a = 68 a = 17
Three years ago, Angel’s sister was
(25 − a) − 3, or 22 − a.
One less than 3 times his sister’s age then
167
168
RECAP
© Great Minds PBC
© Great Minds PBC
EUREKA MATH2 A1 ▸ M1 ▸ TB ▸ Lesson 11
Sample Solutions Expect to see varied solution paths. Accept accurate responses, reasonable explanations, and equivalent answers for all student work.
EUREKA MATH2
A1 ▸ M1 ▸ TB ▸ Lesson 11
Student Edition: Grade A1, Module 1, Topic B, Lesson 11
PRACTICE
Name
Date
11
d. Use your expression from part (b) to find x, the number covered by the center of the pentomino when the sum of the five covered numbers is 118. Write an equation that verifies your placement. 3
If 5x = 118, then x = 23 5 . The center of the pentomino cannot be placed on a mixed number, so it is not possible for the sum of the five numbers to be 118.
1. The pentomino can be placed on the grid to cover a set of numbers.
1
2
3
4
5
6
7
8
9
10
11
12
13
14
15
16
17
18
19
20
21
22
23
24
25
26
27
28
29
30
EUREKA MATH2
A1 ▸ M1 ▸ TB ▸ Lesson 11
2. Consider two integers. The first integer is 3 more than twice the second integer. Adding 21 to five times the second integer will give us the first integer. Find the two integers. The two integers are −6 and −9.
a. Where should the center of the pentomino be placed so the sum of the five covered numbers is 55? Write a number sentence that verifies your placement. The center of the pentomino should be placed at 11 for the sum of the five numbers to be 55.
3. The sum of a father’s age and his son’s age is 53 years. In 9 years, the father’s age will be 8 years more than twice his son’s age at that time. Find the current age of each. The father’s current age is 41, and his son’s current age is 12.
11 + 17 + 5 + 12 + 10 = 55 b. Write an expression to represent the sum of any five numbers covered by the pentomino on the grid. Let x represent the number covered by the center of the pentomino.
(x + 6) + (x − 6) + x + (x − 1) + (x + 1) 4. A budget cell phone company offers two texting plans. c. Use your expression from part (b) to find x, the number covered by the center of the pentomino when the sum of the five covered numbers is 75. Write an equation that verifies your placement.
Option B: Base cost of $25 and no additional fees for text messages sent or received
A customer would need to send or receive 150 text messages for the service plans to cost the same.
21 + 9 + 15 + 14 + 16 = 75
© Great Minds PBC
Option A: Base cost of $10 plus a fee of $0.10 per text message sent or received
•
How many text messages would a customer need to send or receive for the two service plans to cost the same?
The center of the pentomino should be placed over the number 15 for the sum of the five numbers to be 75.
© Great Minds PBC
•
169
170
P R ACT I C E
© Great Minds PBC
225
EUREKA MATH2
A1 ▸ M1 ▸ TB ▸ Lesson 11
EUREKA MATH2
A1 ▸ M1 ▸ TB ▸ Lesson 11
A1 ▸ M1 ▸ TB ▸ Lesson 11
EUREKA MATH2
9. Mr. Wu’s age is 7 years more than twice Angel’s age. The sum of their ages is 79. How old is Angel?
5. Ana sells T-shirts and sweatshirts for the soccer team. The price of one sweatshirt is $10 more than the price of one T-shirt. She sells 50 T-shirts and 40 sweatshirts for a total of $1480. What is the price of one T-shirt? What is the price of one sweatshirt?
Angel is 24 years old.
The price of one T-shirt is $12, and the price of one sweatshirt is $22.
10. Which equation correctly models the statement that −30 is 30 units from 0 on a number line? A. (−30) = 30 B. −30 = 30 C. |30| = −30 D. |−30| = 30 6. A pet rescue center is creating a monthly food budget. The center currently has two-thirds as many dogs as cats. Each animal is fed 2 cans of food a day. Dog food costs $0.68 per can, while cat food costs $0.65 per can. The rescue center has budgeted a total of $2581.80 for food for this 30-day month. How many dogs are at the rescue center? The rescue center has 26 dogs.
Remember For problems 7 and 8, solve the equation. 7. −6r + 8 = −28
6 8. 32 = 4 − 9r + 6r
−
28 3
© Great Minds PBC
226
P R ACT I C E
171
172
P R ACT I C E
© Great Minds PBC
© Great Minds PBC
12
Teacher Edition: Grade A1, Module 1, Topic B, Lesson 12 LESSON 12
Rearranging Formulas Rearrange formulas to highlight a quantity of interest.
EUREKA MATH2
A1 ▸ M1 ▸ TB ▸ Lesson 12
Student Edition: Grade A1, Module 1, Topic B, Lesson 12
EXIT TICKET
Name
Date
12
1 mv 2. Rearrange the formula to write the mass m in terms of K and v, where v ≠ 0. 2 1 K = mv 2 2
The kinetic energy K of an object depends on its mass m and its velocity v. The formula for kinetic
energy is K =
2 K = mv 2 2K
v2
= m
Lesson at a Glance Students work in groups to rearrange formulas by applying properties of equality to solve for a specific unknown quantity. This lesson promotes flexible thinking by encouraging students to choose their own solution paths. Through discussion, they connect the process of rearranging a formula or equation to solving one-variable equations. Students share and compare different representations to verify their equivalence.
Key Questions • How is rearranging a formula or equation to highlight a variable of interest similar to solving an equation in one variable? • When can it be useful to rearrange a formula or equation?
Achievement Descriptor A1.Mod1.AD10 Rearrange formulas to highlight a quantity of interest. (A.CED.A.4)
© Great Minds PBC
179
© Great Minds PBC
EUREKA MATH2 A1 ▸ M1 ▸ TB ▸ Lesson 12
Agenda
Materials
Fluency
Teacher
Launch 5 min
• None
Learn 30 min
Students
• Width of Any Rectangle
• None
• Use a Formula to Make a Formula
Lesson Preparation
• Numbers Versus Letters
• None
Land 10 min
© Great Minds PBC
229
EUREKA MATH2
A1 ▸ M1 ▸ TB ▸ Lesson 12
Fluency Solve Proportions Students solve proportions to prepare for rearranging formulas. Directions: Solve each equation. 1.
x 4
= 3
12
2.
c = 3 4 1
12
3.
h = 7 4 2
14
4.
3 = 6 y 22
11
5.
3 = w 5 8
24 5
6.
3 = 8 k 5
40 3
230
© Great Minds PBC
EUREKA MATH2 A1 ▸ M1 ▸ TB ▸ Lesson 12
Launch
5
Students substitute known quantities into a formula and solve for the unknown quantity. Direct students to problem 1. Allow them to solve the problem with a partner by using any strategy they choose. Monitor how students solve this problem. Find two student work samples to display: one where the student first distributed the 2 and one where the student first multiplied both sides by 1 . 2
1. A rectangular portion of a park will be fenced off to create a playground. A construction company donated a total of 117.5 feet of fencing. Based on the space provided to create the playground, the length of the playground must be 35.5 feet. Use the formula for the perimeter of a rectangle to determine what the width of the playground must be.
P = 2(l + w) P = 2 (l + w ) 117.5 = 2 (35.5 + w ) 117.5 = 71 + 2 w 46.5 = 2 w 23.25 = w The width of the playground must be 23.25 feet. In previous lessons, we used properties and operations to solve equations in one variable. Today, we will solve equations with more than one unknown value.
© Great Minds PBC
231
EUREKA MATH2
A1 ▸ M1 ▸ TB ▸ Lesson 12
Learn
UDL: Action & Expression
Width of Any Rectangle Students use properties to rearrange a formula and solve for a specific unknown quantity. Introduce the scenario in problem 2. Inform students that there are no restrictions on the amount of fencing used or on the length of the playground. Prompt students to find a general formula to solve for w. Circulate as students work and give the following guidance as needed: • Recall that the variables are placeholders for unknown numbers. • There will be no numeric calculations.
Consider supporting students in planning and strategizing. After the scenario is introduced, prompt students to stop and think before they begin the task. For example, set a timer for 1 minute, and direct students to brainstorm possible strategies before they begin recording their steps. As students work, provide worked examples of analogous problems. For example, display a solution path for an analogous one-variable equation and include justifications for each step.
• When solving for w, the goal is to isolate that variable. Monitor how students approach this problem. 2. Solve the perimeter formula P = 2(l + w) for w.
P = 2 (l + w ) P = 2l + 2 w P − 2l = 2 w P −2l 2
= w
Select two student work samples to debrief different solution paths: one where students first distribute the 2 and one where students first multiply by 1 . Display the most used 2 solution path first.
232
UDL: Engagement Consider providing mastery-oriented feedback by focusing attention on students’ effort, the application of learned strategies, and the value in understanding errors. For example, if students incorrectly apply the distributive property, first acknowledge their decision to apply the distributive property to eliminate the grouping symbols. Then direct them to verify that they distributed to every term within the grouping symbols. When students discover their mistake, discuss the advantages of finding errors and using this knowledge to ensure success with similar problems in the future.
© Great Minds PBC
EUREKA MATH2 A1 ▸ M1 ▸ TB ▸ Lesson 12
Both of these are formulas for finding the width of a rectangle. How can we determine whether these two formulas are equivalent? If we can rewrite the expression for the width in one formula to look like the other expression for width by using the commutative, associative, and distributive properties, the two formulas are equivalent. Rewrite the equation that you created to resemble one of the two work samples just shared.
P −2l 2
= w
1 ( P − 2l ) = w 2 1 P−l = w 2 P −l = w 2
Promoting the Standards for Mathematical Practice When students apply what they know about solving one-variable equations to rearrange formulas by using mathematical rules such as the arithmetic properties, they are making use of structure (MP7). Ask the following questions to promote MP7: • How can what you know about solving a one-variable equation help you with solving for a specified variable in a multiple-variable equation? • How is the problem similar to one-variable equations that you have solved before?
Emphasize that these two formulas to find the width of a rectangle in terms of perimeter and length are equivalent. Address any outstanding questions. Revisit the problem from Launch with the known perimeter of 117.5 feet and the length of 35.5 feet. Ask half of the class to substitute these known values into the formula P −2 2l = w and the other half of the class to substitute these values into the formula P − l = w . 2 Compare student responses to the calculations from Launch. Consider displaying each student work sample from Launch next to its analogous approach.
Use a Formula to Make a Formula Students practice rearranging well-known formulas for a specified quantity. Transition students to problems 3–5. Allow students to work in groups to complete the problems. Focus their attention on using the properties of equality to rearrange the formulas.
© Great Minds PBC
Teacher Note Watch for students who rewrite P − 2l = w as 2 P − l = w because they incorrectly divided the numerator and denominator by 2. Consider having students compare the calculations from Launch with known values for P and l to help them conceptualize that they divided the difference, P − 2l, by 2, not just the expression 2l.
233
EUREKA MATH2
A1 ▸ M1 ▸ TB ▸ Lesson 12
3. The formula for the area of a rectangle is A = lw, where l represents the length and w represents the width. a. Solve for l.
l = wA b. Solve for w. A = w l
4. To find the volume of a cylinder with radius r and height h, we use the formula V = πr2h. Solve the formula for height h.
V = πr 2h V πr 2
= h
5. Angel decided to memorize three formulas that relate velocity v, displacement d, and the time t traveled by an object.
v = dt
t = dv
d = vt
Does he need to memorize all three formulas, or can he just memorize one? Explain your reasoning. Angel does not need to memorize all three formulas. He can memorize just one of them and rearrange it to solve for any variable that he needs. Display answers and discuss them with students. Be sure to include the following restrictions during the discussion: • w ≠ 0 for problem 3(a) • l ≠ 0 for problem 3(b) • r ≠ 0 for problem 4
• t ≠ 0 and v ≠ 0 for problem 5 234
© Great Minds PBC
EUREKA MATH2 A1 ▸ M1 ▸ TB ▸ Lesson 12
For problem 5, discuss that in the first equation students should assume that t ≠ 0, and in the second equation students should assume that v ≠ 0. Emphasize the significance of knowing that none of these variables can be 0 because the reciprocal of 0 is undefined.
Facilitate a brief discussion about why it might be helpful to rearrange a formula by asking the following question. Why might you want to rearrange a formula like the one for velocity in problem 5? I might want to rearrange a formula if I need to perform repeated calculations. For example, if I need to compare several different velocities, I might want to solve the formula for v. If I need to compare several different displacements, I might want to solve the formula for d. If I need to compare several different times, I might want to solve the formula for t.
Teacher Note The Use a Formula to Make a Formula problems connect to lesson 10, the optional lesson in this topic. These problems require application of the multiplication property of equality to multiply by the reciprocal of a variable. This is a perfect opportunity to remind students that this move may not preserve the solution set.
Allow groups to complete problems 6–8. Circulate as students work, looking for interesting solution paths. Display samples of student work to showcase the variety of equivalent representations. Debrief student responses. If student work lacks variety, consider introducing your own equivalent representation. Invite students to compare work samples and build connections between solution paths. 6. Given an equation of a line ax + by = c, solve for y, where b ≠ 0.
ax + by = c by = −ax + c a b
y = − x +
c b
7. The formula for the surface area of a rectangular prism with a square base is S = 2w2 + 4hw, where w represents the side length of the square base, and h represents the height of the prism. Solve for h, where w ≠ 0.
S = 2 w 2 + 4 hw
S − 2 w 2 = 4 hw S − 2 w2 4w
© Great Minds PBC
= h
235
EUREKA MATH2
A1 ▸ M1 ▸ TB ▸ Lesson 12
8. If F represents temperature in degrees Fahrenheit and C represents the same temperature in degrees Celsius, then this equation is always true:
5F − 9C = 160. Rewrite the formula so it is more convenient for the following situations. a. A traveler to the United States from a country that measures temperature in degrees Celsius
5F − 9C = 160 −9C = 160 − 5F −9C = −5 ( F − 32)
(− 19 )(−9C) = (− 19 )(−5)(F − 32) C = 5 ( F − 32) 9
236
© Great Minds PBC
EUREKA MATH2 A1 ▸ M1 ▸ TB ▸ Lesson 12
b. A traveler from the United States to a country that measures temperature in degrees Celsius
5F − 9C = 160 5F = 9C + 160 F = 9 C + 32 5
Why would the two travelers prefer different formulas? The travelers prefer different formulas because they are performing opposite conversions. The traveler to the United States wants to convert Fahrenheit into the more familiar Celsius; the traveler from the United States wants to do the reverse.
Numbers Versus Letters Students compare solving equations containing more than one variable with related one-variable equations. Present problem 9 to the class and guide them by solving one equation at a time, or solve both equations simultaneously, one line at a time. Justify the reason for each step. As you solve each equation, highlight the following: • The distributive property is used to isolate x. • Precise language is used to describe steps. For example, justify the step from b x(a + c) = d − b to x = da − by saying that students will multiply the expressions on both +c sides of the equation by the reciprocal of the sum of a and c.
Differentiation: Support If students still need support justifying the steps to solving an equation by using the properties of arithmetic—specifically the associative, commutative, and distributive properties and the properties of equality—ask them to include justifications for each step for any of the equations in the Numbers Versus Letters problem.
• Division by 0 or having a denominator equal to 0 is avoided. Emphasize the similarities of solving each type of equation, and inform students that variables are simply placeholders for unknown numbers. Ask students to complete problem 10. For each pair of equations in problems 9 and 10, first solve the equation that contains more than one variable. Then solve the one-variable equation. As you work, pay attention to the similarities and differences in each step of solving the equations.
© Great Minds PBC
237
EUREKA MATH2
A1 ▸ M1 ▸ TB ▸ Lesson 12
Equation Containing More than One Variable 9. Solve ax + b = d − cx for x.
Related Equation in One Variable Solve 3x + 4 = 6 − 5x for x.
ax + b = d − cx ax + cx + b = d ax + cx = d − b x (a + c) = d − b where a + c ≠ 0
10. Solve
ax + cx b d
bd
(
3x + 4 = 6 − 5 x 3x + 5 x + 4 = 6 3x + 5 x = 6 − 4 x (3 + 5) = 6 − 4
x = d −b a +c
x = 6−4
3+ 5 2 x = 8 x = 1 4
= f for x.
ax + cx b d ax cx + b d
= f
) = bd ( f )
adx + bcx = bdf x ( ad + bc ) = bdf x = where ad + bc ≠ 0
bdf ad + bc
Solve
2x + x = 3 for x. 5 7 2x + x = 3 5 7
(5
)
(5 ⋅ 7) 2 x + x = (5 ⋅ 7)(3) 7
14 x + 5 x = 105 x (14 + 5) = 105 x =
105
14 + 5
x = 105 19
Debrief student work, highlighting any interesting student responses. The focus of these problems is to solidify that the process for rearranging equations with more than one variable relies on the same properties and operations used to solve one-variable equations. 238
© Great Minds PBC
EUREKA MATH2 A1 ▸ M1 ▸ TB ▸ Lesson 12
Land Debrief 5 min Objective: Rearrange formulas to highlight a quantity of interest. Facilitate a discussion by using the following questions. Is it easier to rearrange an equation with more than one variable or to solve its related equation with only one variable? Explain. It is easier to rearrange an equation with more than one variable, especially if the coefficients in the equation with one variable are not friendly numbers. It is easier because we do not have to actually perform the calculations to find the value of the variable. How is rearranging a formula or equation to highlight a variable of interest similar to solving an equation in one variable? The properties and reasoning used to solve equations apply regardless of how many variables appear in the equation or formula. When can it be useful to rearrange a formula or equation? Rearranging formulas or equations to solve for a specific variable can be useful when solving applied problems or when performing the same calculations repeatedly with different values.
Exit Ticket 5 min Provide up to 5 minutes for students to complete the Exit Ticket. It is possible to gather formative data even if some students do not complete every problem.
Teacher Note Assign the Practice problems for completion outside of class or use them in class if time remains after the lesson. Refer students to the Recap for support.
© Great Minds PBC
239
EUREKA MATH2
A1 ▸ M1 ▸ TB ▸ Lesson 12
Recap
EUREKA MATH2
A1 ▸ M1 ▸ TB ▸ Lesson 12
Student Edition: Grade A1, Module 1, Topic B, Lesson 12 Name
RECAP Date
EUREKA MATH2
A1 ▸ M1 ▸ TB ▸ Lesson 12
12
b. This time, start with the formula and rearrange the variables to solve for h. Then substitute the values to find the height of a rectangular prism. Recall that SA = 108, l = 6, and w = 4. The measurements are in inches.
Rearranging Formulas
SA = 2 lw + 2 (l + w)h
SA − 2 lw = 2 (l + w)h
In this lesson, we •
compared solving equations with more than one variable to solving equations with one variable.
•
rearranged formulas to solve for a specific quantity.
Generally assume that shapes like rectangular prisms have positive side lengths. So the possibility of dividing by 0 is not a concern in the
Examples 1. One formula for the surface area of a rectangular prism with length l, width w, and height h is SA = 2lw + 2(l + w)h. The measurements are in inches.
rearranged formula.
a. Find the height of a rectangular prism when SA = 108, l = 6, and w = 4.
60 = 20 h
108 − 2 (6)(4)
= h
2 (6 + 4)
108 − 48 = h 20 60 = h 20
3 = h
The height of the rectangular prism is 3 inches.
SA = 2lw + 2(l + w)h 108 = 2(6)( 4 ) + 2(6 + 4 )h 108 = 48 + 20 h
The rearranged formula is equivalent to the given formula.
SA −2 lw = h 2 ( l+w )
Substitute the known values into the formula. Then solve the equation.
We get the same answer regardless of which arrangement of the formula we choose.
2. Solve each equation for n. Equation with One Variable
3 = h
n− 6 = 4 10
The height of the rectangular prism is 3 inches.
n −6 = 4 10
n − 6 = 40 n = 46
Related Equation with More than One Variable Apply the same properties of equality to solve for n.
n−a b
= c where b ≠ 0
n−a b
= c
n − a = bc n = bc + a
3. Rewrite the equation in slope-intercept form: y = mx + b. 2 x − 3 y = 24 3
2 x − 3 y = 24 3 2 −3 y = − x + 24 3 2 y = x−8 9
© Great Minds PBC
240
181
182
RECAP
© Great Minds PBC
© Great Minds PBC
EUREKA MATH2 A1 ▸ M1 ▸ TB ▸ Lesson 12
Sample Solutions Expect to see varied solution paths. Accept accurate responses, reasonable explanations, and equivalent answers for all student work.
EUREKA MATH2
A1 ▸ M1 ▸ TB ▸ Lesson 12
Student Edition: Grade A1, Module 1, Topic B, Lesson 12 Name
PRACTICE Date
12
For problems 3–6, solve the equation for the listed variable. Equation with One Variable
1. The formula for the perimeter of a rectangle with length l and width w is P = 2(l + w). a. Find the width of a rectangle when P = 92 and l = 13. The measurements are in centimeters. The width is 33 cm.
2 for m. 3. Solve 3 = m + 5
13
5. Solve 13 − 5x = 3x − 3 for x.
b. Using the formula P = 2(l + w), solve for w first. Then substitute values when P = 92 and l = 13.
2
Related Equation with More than One Variable
n 4. Solve t = m + for m where s ≠ 0. s
m = ts − n
6. Solve b − ax = cx − d for x.
x = c + a where c + a ≠ 0 b+d
P −l = w 2
The width is 33 cm.
EUREKA MATH2
A1 ▸ M1 ▸ TB ▸ Lesson 12
7. Use problems 3–6 to compare each equation with one variable to its related equation with more than one variable. Explain how they are similar and how they are different. The equations are similar because I use the same properties and operations to solve them. The equations are different because in the equation with one variable I ended up with a solution, but in the related equation I don’t know the value of any variable. Another difference is that with one-variable equations, I don’t need to make sure I don’t divide by 0. When solving equations with more than one variable, I need to know what values are excluded to make sure I don’t divide by 0.
2. The formula for the volume of a cylinder with radius r and height h is V = πr 2h. a. Find the height of a cylinder when r = 4 and V = 112π. The radius is measured in inches and the volume is measured in cubic inches. The height of the cylinder is 7 inches.
For problems 8–13, rewrite the formula by solving for the listed variable. 8. The formula for the perimeter of a square is P = 4s, where s is the side length. Solve for s.
b. Using the formula V = πr 2h, solve for h first. Then substitute values when r = 4 and V = 112π to find the height. V πr 2
P 4
= s
= h 9. The formula for the circumference of a circle with radius r is C = 2πr. Solve for r.
The height of the cylinder is 7 inches.
C 2π
© Great Minds PBC
© Great Minds PBC
183
184
= r
P R ACT I C E
© Great Minds PBC
241
EUREKA MATH2
A1 ▸ M1 ▸ TB ▸ Lesson 12
EUREKA MATH2
A1 ▸ M1 ▸ TB ▸ Lesson 12
10. The formula for the force on an object with mass m and acceleration a is F = ma. Solve for m.
m =
EUREKA MATH2
A1 ▸ M1 ▸ TB ▸ Lesson 12
18. The formula used to convert temperature in degrees Celsius to degrees Fahrenheit is F = 9 C + 32 . 5
a. Rewrite this formula to convert temperature in degrees Fahrenheit to degrees Celsius.
F a
C =
5 (F − 32) 9
11. The formula for the perimeter of a triangle with side lengths a, b, and c is P = a + b + c. Solve for b.
P–a–c=b b. Use the formula from part (a) to convert 72 degrees Fahrenheit to degrees Celsius.
12. The formula for the surface area of a prism is S = 2B + ph, where B represents the area of the base, p represents the perimeter of the base, and h represents the height of the prism. Solve for h. S −2 B p
The temperature equivalent to 72 degrees Fahrenheit is 22.2 degrees Celsius.
= h
13. The formula for the area of a trapezoid is A = Solve for b.
( ) h. a+b
b
2
2A −a = b h
h
19. A snow cone consists of flavored ice that fills a right circular paper cone and sits on top of the cone in the shape of a hemisphere. The volume of a snow cone is estimated by the formula V = 1 πr 2 h + 2 πr 3. 3 3 a. Solve for h.
h
h = a
3V − 2 πr 3 πr 2
h
For problems 14–17, rewrite the equation in slope-intercept form, y = mx + b. 14. 2x + 4y = 8
15. −3x + 7y = 14
1 2
y =
y = − x+2
16. 6 x + 1 y = 2 3
y = −18x + 6
© Great Minds PBC
242
17.
3 x+2 7
b. Use the equation from part (a) to estimate the height of the right circular cone of a snow cone that has an estimated volume of 17.08 cubic inches and a diameter of 3 inches. The height of the right circular cone of the snow cone is approximately 4.25 inches.
3 x − 5y = 20 4
y =
3 x−4 20
P R ACT I C E
185
186
P R ACT I C E
© Great Minds PBC
© Great Minds PBC
EUREKA MATH2 A1 ▸ M1 ▸ TB ▸ Lesson 12
EUREKA MATH2
A1 ▸ M1 ▸ TB ▸ Lesson 12
EUREKA MATH2
A1 ▸ M1 ▸ TB ▸ Lesson 12
26. Use the number line to answer each question.
20. When is it useful to rearrange a formula? It might be useful to rearrange a formula if you need to make repeated calculations for the same variable or if the calculations are difficult to make when solving an equation.
A
B
C
–11 –10 –9 –8 –7 –6 –5 –4 –3 –2 –1
0
1
D
E
2
3
F
4
5
6
7
8
9
a. Which points, if any, correspond to a number with an absolute value of 3? Explain. Points C and E each correspond to a number with an absolute value of 3 because they are each 3 units from 0 on the number line.
Remember For problems 21 and 22, solve the equation. 21. 9 − 1.6t = −11
12.5
22.
4 2 t − t = −2 3 9
−
9 5
b. Which points, if any, correspond to a number with an absolute value that is greater than 3? Explain. Points A, B, and F each correspond to a number with an absolute value that is greater than 3 because they are each more than 3 units from 0 on the number line.
For problems 23–25, solve the equation for x. Write the solution set by using set notation. 23. x2 = 36
{−6, 6}
24. 2x + 5 = 5 + 2x
ℝ c. Which points, if any, correspond to a number with an absolute value of −7? Explain. No points correspond to a number with an absolute value of −7. The absolute value of a number is the distance of that number from 0 on the number line, and distance cannot be negative.
25. x + 6 = x + 1
{}
© Great Minds PBC
© Great Minds PBC
P R ACT I C E
187
188
P R ACT I C E
© Great Minds PBC
243
13
Teacher Edition: Grade A1, Module 1, Topic B, Lesson 13 LESSON 13
Solving Linear Inequalities in One Variable Solve inequalities and graph the solution sets on the number line.
EUREKA MATH2
A1 ▸ M1 ▸ TB ▸ Lesson 13
Student Edition: Grade A1, Module 1, Topic B, Lesson 13
EXIT TICKET
Name
Date
13
Find the solution set of each inequality. Write the solution set by using set notation, and then graph the solution set on a number line. 1. 6x − 5 < 7x + 4
6x − 5 < 7x + 4 −5 < x + 4 −9 < x
{x | x > −9} x –20 –18 –16 –14 –12 –10
–8
–6
–4
–2
0
Lesson at a Glance Through a cycle of independent think time, collaboration, and discussion, students classify a set of inequalities as always, sometimes, or never true. Students determine the conditions for which each inequality is true, which provides them the opportunity to formalize the properties of inequality. Students organize the properties of inequality in a tree map and then use the properties to solve inequalities and graph the solution set on the number line. By the end of the lesson, students work in groups to write and solve inequalities to represent a real-world context.
Key Questions • What does it mean if an inequality is sometimes true?
2. 10 − 3x ≤ −6(x − 2)
• How can we determine what conditions make an equality true? • How are the properties of equality and the properties of inequality similar? How are they different?
10 − 3 x ≤ −6 ( x − 2) 10 − 3 x ≤ −6 x + 12 10 + 3 x ≤ 12 3x ≤ 2
Achievement Descriptors
x ≤ 2
3
{x x ≤ } 2 3
A1.Mod1.AD6 Solve linear equations and inequalities in one variable. (A.REI.B.3)
x –2
–1
0
1
2
3
A1.Mod1.AD7 Create equations and inequalities in one variable and
use them to solve problems. (A.CED.A.1)
© Great Minds PBC
195
© Great Minds PBC
EUREKA MATH2 A1 ▸ M1 ▸ TB ▸ Lesson 13
Agenda
Materials
Fluency
Teacher
Launch 5 min
• None
Learn 30 min
Students
• Naming the Properties of Inequality
• None
• Solving Inequalities
Lesson Preparation
• Making the Grade
• None
Land 10 min
© Great Minds PBC
245
EUREKA MATH2
A1 ▸ M1 ▸ TB ▸ Lesson 13
Fluency
Teacher Note
Solve One- and Two-Step Inequalities Students solve one- and two-step inequalities to prepare for solving multi-step inequalities and graphing the solution sets on a number line.
Instead of this lesson’s Fluency, consider administering the Solve One- and TwoStep Inequalities Sprint. Directions for administration can be found in the Fluency resource. EUREKA MATH2
A1 ▸ M1 ▸ Sprint ▸ Solve One- and Two-Step Inequalities
A
Directions: Solve each inequality for n. 1.
2.
n+8>6 4 ≤ −3 + n
Solve each inequality for x.
n > −2 7≤n
5n > 25
n>5
4.
n ≤ 9 2
5.
24 ≥ 6n − 12
n ≤ 18
6.
4(n + 1) < −48
3.
246
Number Correct:
1.
x + 2 > 10
17.
5x < −20
2.
x + 4 > 10
18.
−4x < −20
3.
x + 6 > 10
19.
2x < −20
4.
x−3<9
20.
−2x < −20
5.
x−5<9
21.
−x < −20
6.
x−7<9
22.
1 x < −2 2
7.
2x < 18
23.
−1 x < 3
8.
3x > 18
24.
− 1 x > −2
9.
10 + x > 15
25.
3(x + 3) > 18
10.
10 + x > −15
26.
−4(x + 3) > 24
11.
−10 + x > −15
27.
−4x − 12 > 24
12.
−10 + x > 15
28.
2 x − 6 < 12 3
13.
4x > −4
29.
−6 − 2 x < 12
14.
4x > 8
30.
2 3
15.
4x > −16
31.
−12 − 3 x < −6
16.
4x > 32
32.
3 ( x + 20 ) < 6 5
410
2
3
3
( x + 9) < −12 5
© Great Minds PBC
6≥n
n < −13
© Great Minds PBC
EUREKA MATH2 A1 ▸ M1 ▸ TB ▸ Lesson 13
Launch
5
Students classify inequalities as always, sometimes, or never true. Display problem 1. Use the Always, Sometimes, Never routine to engage students in constructing meaning and discussing their ideas. Give students 1 minute of silent think time to evaluate whether the statement is always, sometimes, or never true. Have students discuss their thinking with a partner. Circulate as students talk, and identify a few students to share their thinking. As you call on these students to share with the class, encourage them to provide examples and nonexamples to support their claim. Conclude that the statement is never true because there are no values of n that make the statement true. Repeat the routine for problems 2–4. For problems 1–4, determine whether the statement is always, sometimes, or never true for any value of n. 1. 3n + 1 > 3n + 5 This statement is never true. 2. 3n + 8 > 3n + 5 This statement is always true. 3. 4n − 12 > 3n + 5 This statement is sometimes true. 4.
1 n+3> n+8 2
This statement is sometimes true. Elicit the following details through the class discussion: • Problem 2 is always true because any value of n makes the statement true.
© Great Minds PBC
247
EUREKA MATH2
A1 ▸ M1 ▸ TB ▸ Lesson 13
• Problem 3 is sometimes true. For example, the statement is true when n is 20 but false when n is 0. • Problem 4 is sometimes true. For example, the statement is true when n is −20 but false when n is 0. Today, we will solve a variety of inequalities and graph their solution sets on a number line.
Learn Naming the Properties of Inequality Students formalize the properties of inequality and use them to solve inequalities. Solving an inequality reveals the constraints on the values that make the inequality a true statement. Guide students to identify the constraints on the values that make each inequality in problems 1–4 true. Some students may have already solved the inequalities to answer the problems. If students have not yet solved the inequalities, use the following prompts to guide them through finding the values of n that make the inequality true in problem 3. We determined that the statement 4n − 12 > 3n + 5 is sometimes true. If 4n − 12 is sometimes greater than 3n + 5, this means that 4n − 12 is sometimes less than 3n + 5, or 4n − 12 is sometimes equal to 3n + 5. I wonder when 4n − 12 is greater than 3n + 5. Asking when in this case is really asking about the values of n for which that statement is true. Solve the inequality to determine what values of n make the inequality a true statement.
4 n − 12 > 3n + 5 n − 12 > 5 n > 17 This means that 4n − 12 > 3n + 5 when n > 17. 248
© Great Minds PBC
EUREKA MATH2 A1 ▸ M1 ▸ TB ▸ Lesson 13
Write the solution set by using set-builder notation.
{n | n > 17} What steps did you take to solve the inequality? I added −3n to both sides of the inequality. Then I added 12 to both sides of the inequality. Are you convinced that adding the same value to both sides of the inequality will preserve the solution set of the original inequality? Yes, I am convinced that I can add any value to both sides of an inequality and preserve the solution set. If students have difficulty recalling the if–then moves used to solve inequalities in grade 7, support their understanding by starting with a numeric inequality that has a known truth value: for example, −3 < 5. Then add a number such as −3 to both sides of the inequality to show that the statement is still true.
Promoting the Standards for Mathematical Practice Students look for and make use of structure (MP7) when they use the properties of equality to formalize and use the properties of inequality. Ask the following questions to promote MP7: • How are equations and inequalities related? How can that help you find the solution set? • How can what you know about the properties of equality help you with the properties of inequality?
There is a property of equality that tells us that adding the same value to both sides of an equation ensures its solution set is preserved. However, because this is an inequality, we cannot apply a property of equality. We now need to define the addition property of inequality. Have students record the description and an example of the addition property of inequality in the Naming the Properties of Inequality tree map. The multiplication property of inequality will be addressed later in this lesson.
© Great Minds PBC
249
EUREKA MATH2
A1 ▸ M1 ▸ TB ▸ Lesson 13
Complete the statements in the graphic organizer, and provide examples of each property.
Properties of Inequality
Addition For real numbers a, b, and c: If a > b, then
Example If 4n – 12 > 3n + 5, then
4n – 12 – 3n > 3n + 5 – 3n.
The consequence of the multiplication property of inequality when multiplying by negative values can be difficult to communicate. When displaying solution steps, consider annotating solution steps to emphasize reversing the inequality sign by drawing an arrow. Use of the annotation may be easier for students to understand than a verbal explanation.
Multiplication
a + c > b + c.
For real numbers a, b, and c: If a > b and c > 0, then
ac > bc.
For real numbers a, b, and c: If a > b and c < 0, then
ac < bc.
Example
Example
If –5 > 12 n, then
If – 12 n > 5, then –2 – 12 n < –2(5).
2(–5) > 2( 12 n).
(
)
1 Direct students to problem 4. Ask half of the class to solve by first adding − 2 n to both
sides of the inequality, and ask the other half of the class to solve by first adding −n to both sides. Compare the different solution paths. If students have difficulty remembering when to reverse the inequality sign, encourage them to consider these cases on a numeric equation like −3 = 5 and a numeric inequality like −3 < 5, where the truth value of each is known. The equation −3 = 5 is false, and multiplying by either a positive or a negative number does not change its truth value. The
250
Language Support
1n+3>n+8 2 –1n+3>8 2 –1n>5 2 1 (–2) · – 2 n < (–2) · 5
(
)
n < –10
UDL: Representation The tree map graphic organizer highlights the relationships associated with the addition property of inequality and the multiplication property of inequality. Throughout the lesson, assist students in completing each section of the graphic organizer by adding examples.
© Great Minds PBC
EUREKA MATH2 A1 ▸ M1 ▸ TB ▸ Lesson 13
inequality −3 < 5 is true, and multiplying by a positive number does not change its truth value. However, multiplying by a negative number without reversing the inequality sign does change its truth value. The use of concrete examples helps students conceptualize the need to reverse the inequality sign when multiplying by a negative number as well as to recognize the parallel between the multiplication properties of equality and inequality. Formalize by writing the solution set of problem 4 by using set-builder notation. What is the solution set of the inequality 1 n + 3 > n + 8 ? Write the solution set 2 by using set-builder notation.
{n | n < −10} Everyone added some value in the first step and likely in the first few steps. Besides addition, what other steps did you and your classmates take to solve the inequality? Some of us multiplied both sides by 2 and some of us multiplied both sides by −2 in our final step in solving the inequality. Those two different steps may not lead to the solution the same way that they would when solving an equation. Why? Multiplying both sides of an equation by any value besides 0 preserves the solution set. Inequalities do not always behave in the same way. I can multiply both sides of an inequality by a positive value and create a new inequality with the same solution set. However, I cannot multiply by a negative value without reversing the direction of the inequality sign to produce a new inequality with the same solution set as the original inequality. Have students revisit the Naming the Properties of Inequality tree map. Name the multiplication property of inequality. Specify that there are conditions to consider before summarizing the property: one for multiplying by a positive value and another for multiplying by a negative value. Encourage students to consider a third condition where the value is neither positive nor negative with the following question. What happens if we multiply both sides of an inequality by 0? Consider the inequality −3 < 5 again. What is the truth value of the inequality after we multiply by 0?
© Great Minds PBC
251
EUREKA MATH2
A1 ▸ M1 ▸ TB ▸ Lesson 13
Emphasize that multiplying both sides by 0 made both expressions equal to 0, which may not preserve the solution set. Direct the students to the box labeled Multiplication in the tree map, and have students summarize the properties of inequality and record the descriptions and examples. Once students finish recording their descriptions and examples, invite them to summarize the properties of inequality in their own words. Ask them to cite evidence from the tree map as they summarize. Elicit the following details: • Adding a number to both sides of an inequality creates a new inequality with the same solution set as the original inequality. This is known as the addition property of inequality. • Multiplying by a positive number on both sides of the inequality creates a new inequality with the same solution set as the original inequality. This is known as the multiplication property of inequality. • Multiplying by a negative number on both sides of the inequality and reversing the inequality sign creates a new inequality with the same solution set as the original inequality. This is also known as the multiplication property of inequality. • We can always rearrange the inequality by using the addition property of inequality so that the variable term is positive.
Solving Inequalities Students practice solving inequalities and representing their solution sets. Transition students to problems 5–10. Allow students to work in pairs to complete the problems. Circulate as students work, paying careful attention to how students graph the solution sets and how they apply the properties of inequality. If students need support to graph the correct interval, inform them that they can find the endpoint of the graph of the solution set, test a value on an interval by using the original inequality, and shade the interval if the inequality is true.
Teacher Note If students have difficulty applying the multiplication property of inequality for negative values, recommend that they use the addition property of inequality instead.
4 − 3 x > 10 4 > 10 + 3 x −6 > 3 x −2 > x This eliminates the need to reverse the inequality sign.
252
© Great Minds PBC
EUREKA MATH2 A1 ▸ M1 ▸ TB ▸ Lesson 13
If students have difficulty identifying the solution sets of the inequalities in problems 8 or 9, ask them to interpret the truth value of the final step in each problem. Summarize how to determine whether the solution set of an inequality is the empty set or the set of all real numbers. Emphasize that students interpret the final step of solving an inequality the same way that they interpreted the final step of solving an equation. For problems 5–9, find the solution set of the inequality. Write the solution set by using set notation, and then graph the solution set on a number line. 5. 3(x − 4) > 18
3( x − 4 ) > 18 3 x − 12 > 18 3 x > 30 x > 10 Solution set:
{x | x > 10}
x –5 –4 –3 –2 –1 0 1 2 3 4 5 6 7 8 9 10 11 12 13 14 15 6. 6 − 2x ≥ −4
Solution set:
{x | x ≤ 5}
6 − 2 x ≥ −4 −2 x ≥ −10 x ≤ 5
x –5 –4 –3 –2 –1 0 1 2 3 4 5 6 7 8 9 10 11 12 13 14 15 © Great Minds PBC
253
EUREKA MATH2
A1 ▸ M1 ▸ TB ▸ Lesson 13
7. 2 g − 3 ≥ 1 g + 5 3
3
3 5 2 g − 3 ≥ 1g + 3 3 3 2 g ≥ 1 g + 14 3 3 3 1 g ≥ 14 3 3
Solution set:
{g | g ≥ 14}
g ≥ 14
g –1 0 1 2 3 4 5 6 7 8 9 10 11 12 13 14 15 16 17 18 19 8. −6(x − 1) < 6 − 6x
−6( x − 1) < 6 − 6 x −6 x + 6 < 6 − 6 x 6 < 6 Solution set:
{}
x –10 –9 –8 –7 –6 –5 –4 –3 –2 –1 0 1 2 3 4 5 6 7 8 9 10 9. 2(x − 3) + x < 3(x + 4)
2( x − 3) + x < 3 ( x + 4 ) 2 x − 6 + x < 3 x + 12 3 x − 6 < 3 x + 12 −6 < 12 Solution set: 254
ℝ © Great Minds PBC
EUREKA MATH2 A1 ▸ M1 ▸ TB ▸ Lesson 13
x –10 –9 –8 –7 –6 –5 –4 –3 –2 –1 0 1 2 3 4 5 6 7 8 9 10 10. Fin and Bahar each solved the inequality 8 − 5x > −10 in class today. They found different solution sets. Fin’s Work
Bahar’s Work
8 − 5 x > −10 8 − 5 x + 5 x > −10 + 5 x 8 + 10 > −10 + 10 + 5 x 18 > 5 x
8 − 5 x > −10
()
()
1 18 > 1 5 x 5 5 18 > x 5
{
x
18 > x 5
8 − 8 − 5 x > −10 − 8 −5 x > −18
(− 15 )(−5x ) > (− 15 )(−18)
}
x > 18 5
{x x > } 18 5
a. Which solution set is correct? Fin’s solution set is correct. b. Use the properties of inequality to explain the mistake. Bahar multiplied each side of the inequality by a negative number but did not reverse the inequality sign. When most students have completed the problems, reveal the answers. During the debrief, ask students to justify their steps. Display −6(x − 1) ≤ 6 − 6x. Assess student understanding by posing the following question.
© Great Minds PBC
255
EUREKA MATH2
A1 ▸ M1 ▸ TB ▸ Lesson 13
How would your answer change if the inequality sign in problem 8 was replaced with the less than or equal sign?
Every solution step of this new inequality would use the same properties of inequality as the original. The only difference is how I interpret the final step, 6 ≤ 6. This statement is always true because this new inequality sign allows the expression on the left to be equal to the expression on the right. The solution is all real numbers.
Making the Grade Students create and solve an inequality in context. Present problem 11, and read the prompt aloud. Allow students to work in groups to complete the problem. Circulate as students work, monitoring their ability to decontextualize to write and solve an inequality and then recontextualize to interpret the solution set. Debrief student responses. Showcase any variety present in student work. 11. Every student in Zara’s science class will have 5 test scores by the end of the grading period. Zara sets a goal to have at least a 90 average for the grading period. Her first four test scores are 97, 85, 96, and 89. Write an inequality to find the score Zara needs to earn on her fifth test to meet her goal. Then solve the inequality.
Differentiation: Support If students have difficulty writing an inequality from the context, ask them to first write an expression for Zara’s average score on the 5 science tests. Then, ask them to use this expression to write an equation to represent an average score of exactly 90. Finally, they can transition to writing an inequality.
Let x represent Zara’s fifth test score. 97 + 85 + 96 + 89 + x 5
≥ 90
97 + 85 + 96 + 89 + x ≥ 450 367 + x ≥ 450 x ≥ 83 Zara must earn at least an 83 on the fifth test to meet her goal.
256
© Great Minds PBC
EUREKA MATH2 A1 ▸ M1 ▸ TB ▸ Lesson 13
Land Debrief 5 min Objective: Solve inequalities and graph the solution sets on the number line. Use the following prompts to guide a discussion about solving inequalities. What does it mean if an inequality is sometimes true? How can we determine what conditions make it true? If an inequality is sometimes true, some values will make the inequality a true statement when they are substituted for the variable. The conditions that make the inequality true can be determined by solving the inequality. Problems 1 through 4 required us to identify whether each inequality is always true, sometimes true, or never true when values are substituted for the variable. How is this represented graphically? For inequalities that are sometimes true, how can reading the graph tell us which values make the inequality true? If the entire number line is shaded, the solution set is all real numbers. If the graph has no shading, the solution set is the empty set. For inequalities that are sometimes true, only the portion of the number line where the values make the inequality true is shaded. The marking used to indicate the endpoint of the graph of the solution set tells us whether the value of the endpoint of the graph is included in the solution set. For inequalities that are never true, the solution set is the empty set.
UDL: Representation As the class summarizes solving inequalities, consider using a graphic organizer to compare the graphic representations of inequalities. Provide a three-column chart with the labels Always True, Sometimes True, and Never True. Students can record a description and include a sketch for each type of graph. Inequalities
Always True
Sometimes True
Never True
The solution set is the set of all real numbers because every value makes it true.
Only shade the portion of the number line where the values make the inequality true.
The solution set is the empty set because the graph of the empty set has no shading.
ℝ
{x ∣ x ≥ 5}
{}
5
x
How are the properties of equality and the properties of inequality similar? How are they different? Addition properties are the same. We can add the same number to both sides of an equation or inequality and preserve its solution set. The multiplication property of inequality is more complicated than the multiplication property of equality because we need to think about whether the direction of the inequality sign needs to be reversed. The two multiplication properties are the same only if we multiply both sides by positive numbers. Multiplying both sides of an inequality by a negative number requires reversing the inequality sign to create a new inequality that has the same
© Great Minds PBC
257
EUREKA MATH2
A1 ▸ M1 ▸ TB ▸ Lesson 13
solution set as the original inequality. Neither multiplication property is guaranteed to preserve the solution set when multiplying both sides by 0.
Exit Ticket 5 min Provide up to 5 minutes for students to complete the Exit Ticket. It is possible to gather formative data even if some students do not complete every problem.
Teacher Note Assign the Practice problems for completion outside of class or use them in class if time remains after the lesson. Refer students to the Recap for support.
258
© Great Minds PBC
EUREKA MATH2 A1 ▸ M1 ▸ TB ▸ Lesson 13
Recap
EUREKA MATH2
A1 ▸ M1 ▸ TB ▸ Lesson 13
Student Edition: Grade A1, Module 1, Topic B, Lesson 13
RECAP
Name
Date
13
EUREKA MATH2
A1 ▸ M1 ▸ TB ▸ Lesson 13
2. One number is 5 less than half another number. The numbers have a sum of at most −68. What are the largest numbers that satisfy these conditions? Let n and 12 n − 5 represent the two numbers.
Solving Linear Inequalities in One Variable
n+
In this lesson, we •
formalized the addition and multiplication properties of inequality.
•
solved inequalities and graphed the solution sets on number lines.
n ≤ −42
Examples
1. Find the solution set of the inequality 10 − 9w ≥ 28. Write the solution set by using set notation, and then graph the solution set on a number line. Method 1:
10 − 9w ≥ 28 −9w ≥ 18
w ≤ −2
−18 ≥ 9w −2 ≥ w
–10 –9 –8 –7 –6 –5 –4 –3 –2 –1
0
1
2
The greatest number less than or equal to −42 is −42.
1 (−42) − 5 = −21 − 5 = −26 2
Apply the addition property of inequality so that the coefficient of the variable term is positive.
10 − 9w ≥ 28 10 ≥ 9w + 28
{w | w ≤ −2}
© Great Minds PBC
Substitute −42 for n in 12 n − 5 .
Method 2: Reverse the inequality sign when applying the multiplication property of inequality with a negative value.
© Great Minds PBC
1 n − 5 ≤ −68 2 3 n − 5 ≤ −68 2 3 n ≤ −63 2
The phrase at most −68 indicates that the sum of the numbers must be less than or equal to −68.
The largest numbers that satisfy the given conditions are −42 and −26.
w 3
4
5
6
7
8
9 10
197
198
RECAP
© Great Minds PBC
259
EUREKA MATH2
A1 ▸ M1 ▸ TB ▸ Lesson 13
Sample Solutions Expect to see varied solution paths. Accept accurate responses, reasonable explanations, and equivalent answers for all student work.
EUREKA MATH2
A1 ▸ M1 ▸ TB ▸ Lesson 13
Student Edition: Grade A1, Module 1, Topic B, Lesson 13
PRACTICE
Name
Date
13
6. Why is graphing solution sets of one-variable inequalities more helpful than graphing solution sets of one-variable equations? We graph solution sets of inequalities because they’re usually more difficult to visualize than solution sets of equations. A graph is a convenient way to represent the entire solution set. Many equations generally have a limited number of solutions, and listing them is an efficient way of representing the solution set.
For problems 1 and 2, graph the solution set on the number line. 1. {g | g > 4}
g
For problems 7–10, place the correct inequality sign in the box. Write the property used in each case.
–10 –9 –8 –7 –6 –5 –4 –3 –2 –1 0 1 2 3 4 5 6 7 8 9 10
7. If y + 3 > 9, then y + 3 − 3
2. {m | 3 ≤ m}
–10
–8
EUREKA MATH2
A1 ▸ M1 ▸ TB ▸ Lesson 13
8. If −2x ≤ 8, then
9 − 3.
>
–4
–2
0
2
4
6
8
10
9. If 17 >
m , then 3(17) 3
>
≥
8 . −2
Multiplication property of inequality
Addition property of inequality
m –6
−2 x −2
3
( m3 ) .
10. If −9 ≤
≤
1 k , then 3 ( −9 ) 3
3
( 13 k).
Multiplication property of inequality
Multiplication property of inequality For problems 3–5, write the solution set that represents the graph shown on the number line.
For problems 11–14, find the solution set of the inequality. Write the solution set by using set notation, and then graph the solution set on a number line.
p
3.
–6
–5
–4
–3
–2
–1
0
1
2
3
4
5
11. 2c > −9
{p | p < 0}
4.
–5
1 2
c
n –6
{c c > −4 }
Solution set:
–4
–3
–2
–1
0
1
2
3
4
–5
5
–4
–3
–2
–1
0
1
2
3
4
5
{n | n > −5} 12. h – 7 < 3 5.
Solution set:
h
{h | h < 10}
–10 –9 –8 –7 –6 –5 –4 –3 –2 –1 0 1 2 3 4 5 6 7 8 9 10
h
{}
© Great Minds PBC
260
–5 –4 –3 –2 –1
199
200
P R ACT I C E
0
1
2
3
4
5
6
7
8
9 10 11 12 13 14 15
© Great Minds PBC
© Great Minds PBC
EUREKA MATH2 A1 ▸ M1 ▸ TB ▸ Lesson 13
EUREKA MATH2
A1 ▸ M1 ▸ TB ▸ Lesson 13
13. 54 ≥ −6v
For problems 16–18, find the solution set of the inequality. Write the solution set by using set notation, and then graph the solution set on a number line.
{v | v ≥ −9}
Solution set:
EUREKA MATH2
A1 ▸ M1 ▸ TB ▸ Lesson 13
16. –6b + 4 < 10
v –15 –14 –13 –12–11 –10 –9 –8 –7 –6 –5 –4 –3 –2 –1
0
1
2
3
4
{b | b > −1}
Solution set:
5
b –10
14. −9 ≤ 3 f
{f | f ≥ −12}
4
Solution set:
17.
–18 –16
–14
–12 –10
–8
–6
–4
–2
–6
–4
–2
0
2
4
6
8
10
{u u > 5 } 5 8
Solution set:
f –20
2 1 u− > 2 5 4
–8
0
u 5
6
7
18. 2(g – 8) > 2g – 16
15. Write and solve an inequality that represents the statement that a number increased by 4 is greater than 16.
{}
Solution set:
Let n represent a number.
g
n + 4 > 16
–10
n > 12
–8
–6
–4
–2
0
2
4
6
8
10
Any number greater than 12 is a solution to this statement. 19. Evan buys 3 yards of fabric that is the same price per yard. He needs to have at least $5 left after making his purchase. He has a $50 bill. What’s the maximum price per yard he can pay for the fabric? The maximum price per yard that he can pay for the fabric is $15.
© Great Minds PBC
© Great Minds PBC
P R ACT I C E
201
202
P R ACT I C E
© Great Minds PBC
261
EUREKA MATH2
A1 ▸ M1 ▸ TB ▸ Lesson 13
EUREKA MATH2
A1 ▸ M1 ▸ TB ▸ Lesson 13
EUREKA MATH2
A1 ▸ M1 ▸ TB ▸ Lesson 13
23. One number is 8 more than twice the other number. If the numbers have a sum of at least −22, what is the smallest pair of numbers that fits these constraints?
For problems 20–22, find the solution set for the inequality. Write the solution set by using set notation, and then graph the solution set on a number line. 20. 2g + (g + 5) ≥ 6g – 10
The smallest pair of numbers is −10 and −12.
{g | g ≤ 5}
Solution set:
g –10
–8
–6
–4
–2
0
2
4
6
8
10
24. Twelve more than four times a number is at most 42 more than twice the number. Find the solution set.
{x | x ≤ 15}
21.
3 (10b − 6) ≥ 16b 5
{b b ≤ − } 9 25
Solution set:
Remember For problems 25 and 26, solve the equation.
b – 9
–1
22.
2q 5
+4 <
2q 3
25. −9n + 5n − 10 + 14n = 30
0
25
4
−9 3 4
47
−20
5( x + 4 ) + 6 x = 11 − 3 x
5 x + 20 + 6 x = 11 − 3 x 5 x + 6 x + 20 = 11 − 3 x 11x + 20 = 11 − 3 x 14 x + 20 = 11 14 x = −9
3
48 4 46
48
q 49
50
51
x = −
© Great Minds PBC
262
3 1 n − n = 26 10 5
27. Write the property or operation used for each step in solving the equation 5(x + 4) + 6x = 11 − 3x.
{q q > 48 }
Solution set:
26. 12 −
P R ACT I C E
203
204
P R ACT I C E
9 14
Distributive property Commutative property of addition Addition of like terms Addition property of equality Addition property of equality Multiplication property of equality
© Great Minds PBC
© Great Minds PBC
EUREKA MATH2 A1 ▸ M1 ▸ TB ▸ Lesson 13
EUREKA MATH2
A1 ▸ M1 ▸ TB ▸ Lesson 13
28. A soccer team’s coach made a dot plot showing the number of goals scored in each game this season. Goals Scored in Games This Season
0
1
2
3
4
5
6
Number of Goals
a. How many games did the soccer team play this season? The soccer team played 15 games this season.
b. In how many games this season did the soccer team score at least 2 goals? The team scored at least two goals in 10 games this season.
c. How many goals in total did the team score this season? The team scored a total of 29 goals this season.
© Great Minds PBC
© Great Minds PBC
P R ACT I C E
205
263
Teacher Edition: Grade A1, Module 1, Topic C
Topic C Compound Statements Involving Equations and Inequalities in One Variable In topic C, students build upon the work done with equations and inequalities in topic B by examining and creating compound statements involving two linear equations or inequalities and by interpreting their solution sets. Students solve a variety of compound statements and graph the solution sets on a number line. Students then apply that concept to solving absolute value equations and inequalities. To begin topic C, students examine real-world situations with multiple constraints, requiring students to represent the situations with compound inequalities. The goal is for students to develop an understanding of mathematical compound statements, emphasizing the difference between statements connected by and and those separated by or. Students then participate in a lesson in which they first solve compound inequalities through a trial-and-error process. Students independently find solutions that are then compiled as a class to produce the solution set on a number line. They then find the solution sets algebraically. Students work through a set of compound inequalities, searching for the integer that satisfies all of the restrictions of the inequalities.
Clue #2 of 4 When I subtract two from my number and then triple that difference, the result is strictly between –21 and 12. –21 < 3(x – 2) < 12
264
–16 –14 –12 –10 –8 –6 –4 –2
0
2
4
6
8
10 12 14 16
© Great Minds PBC
EUREKA MATH2 A1 ▸ M1 ▸ TC
Students use their knowledge of solving compound statements to solve absolute value equations and inequalities. A large number line placed on the classroom floor is used to connect students’ previous understanding of the definition of absolute value, from grade 6, to finding the solution sets of absolute value equations or inequalities. Students solve absolute value equations and determine when an absolute value equation has no solution, one solution, or two solutions. In module 3, students will revisit absolute value equations and solve them by graphing absolute value functions. Students also solve absolute value inequalities by rewriting them as compound inequalities connected by and or or, with an emphasis on understanding when each word is used to connect the inequalities.
−2|6 x − 8 | = −40 |6 x − 8 | = 20 6x − 8 = 20 or −(6x − 8) = 20 6 x − 8 = 20 6 x = 28 x = 14 3
− (6 x − 8) = 20 6 x − 8 = −20 6 x = −12 x = −2
{−2, 143 } The work in topic C prepares students for module 2, as they transition from working with systems of equations and inequalities in one variable to those in two variables. Additionally, applying the definition of absolute value when solving equations and inequalities prepares students for applying the definition of absolute value when graphing absolute value functions in module 3.
© Great Minds PBC
265
A1 ▸ M1 ▸ TC
EUREKA MATH2
Progression of Lessons Lesson 14 Solution Sets of Compound Statements Lesson 15 Solving and Graphing Compound Inequalities Lesson 16 Solving Absolute Value Equations Lesson 17 Solving Absolute Value Inequalities
266
© Great Minds PBC
14
Teacher Edition: Grade A1, Module 1, Topic C, Lesson 14 LESSON 14
Solution Sets of Compound Statements Describe the solution set of two equations or inequalities joined by and or or and graph the solution set on a number line. Write a compound statement to describe a situation.
EUREKA MATH2
A1 ▸ M1 ▸ TC ▸ Lesson 14
Student Edition: Grade A1, Module 1, Topic C, Lesson 14
EXIT TICKET
Name
Date
14
d
Students extend their study of inequalities and equations by exploring those that can be written as compound mathematical statements. Students build a need for mathematical statements connected by and or or by using a familiar context: height requirements for amusement park rides. Then they use the truth value of compound English sentences to identify the truth values for compound mathematical statements. Partners work to solve and graph compound mathematical statements to summarize how the words and or or affect the solution set. This lesson formalizes the terms statement and compound statement.
e
Key Questions
a
• What is required for a compound statement connected by the word and to be true?
c
• What is required for a compound statement connected by the word or to be true?
b
Achievement Descriptors
1. Match each compound statement to the graph of its solution set on the number line. a. x = 5 or x = −10 b. x < 5 and x > −10 c. x > 5 or x < −10 d. x ≥ 5 or x ≤ −10
e. x ≤ 5 and x ≥ −10
x –15
–10
–5
0
5
10
–15
–10
–5
0
5
10
x
x –15
–10
–5
0
5
10 x
–15
–10
–5
0
5
10
–15
–10
–5
0
5
10
x
A1.Mod1.AD8 Represent constraints by using equations and
2. The acceptable range of chlorine levels in swimming pools is at least 1 part per million and no more than 3 parts per million. Write a compound inequality for the acceptable range of chlorine levels in a swimming pool.
inequalities. (A.CED.A.3) A1.Mod1.AD9 Interpret solutions to equations and inequalities
Let x represent the acceptable chlorine level in a swimming pool in parts per million. The acceptable range of chlorine levels is 1 ≤ x ≤ 3.
© Great Minds PBC
Lesson at a Glance
in one variable as viable or nonviable options in a modeling context. (A.CED.A.3) 217
© Great Minds PBC
EUREKA MATH2 A1 ▸ M1 ▸ TC ▸ Lesson 14
Agenda
Materials
Fluency
Teacher
Launch 5 min
• None
Learn 30 min
Students
• Determining Truth
• Colored pencil set, 3 different colors
• Graphing Solution Sets
Lesson Preparation
• Let’s Apply It
• None
Land 10 min
© Great Minds PBC
269
EUREKA MATH2
A1 ▸ M1 ▸ TC ▸ Lesson 14
Fluency Truth Values Students determine whether equations or inequalities are true or false to prepare for describing the solution sets of compound statements. Directions: Decide whether each statement is true or false. 1.
4 ⋅ 23 = 32
True
2.
6 < −3(−2)
False
3.
8 + x = 12 when x = −4
False
4.
9 ≥ a − 6 when a = 15
True
5.
14 = 2(5 − m) when m = 12
False
6.
3y + 1 < −2 when y = −2
True
270
© Great Minds PBC
EUREKA MATH2 A1 ▸ M1 ▸ TC ▸ Lesson 14
Launch
5
Students write inequality statements for a real-world situation. Open and display the Epic Park interactive. Display the descriptions of the park rides. Introduce the activity by asking students to predict the height requirement in inches for the Caterpillar Coaster ride. Display the sentence at the end of the ride description that shows the height requirement. As a class, discuss an inequality that would represent the height of an unaccompanied rider. What does Height Requirement: 36 inches actually mean? It means that you have to be at least 36 inches tall to ride by yourself.
h ≥ 36
How could we write at least 36 inches symbolically? What does h represent? It represents the height of the unaccompanied rider in inches. Students are likely to forget that they need to define the variable. Direct students to record the definition of h above problem 1. Click on the links for the rides listed in problems 2–4 so that the height requirements are visible to the students. Have students write inequalities to represent the height requirements for the rides.
© Great Minds PBC
271
A1 ▸ M1 ▸ TC ▸ Lesson 14
EUREKA MATH2
For problems 1–4, use one or more inequalities to represent the height requirements of an unaccompanied rider for the rides at Epic Park. Let h represent the height of an unaccompanied rider in inches.
h ≥ 36
1. Caterpillar Coaster
h ≥ 54
2. Mobius Loop
h ≥ 36 and h ≤ 54
3. Roaring River 4. Lil’ Dipper
h < 48 and h > 0 Debrief as a class by asking students to share the inequalities they wrote for each ride and discussing and revising them as a class. Consider using the following questions to guide the discussion. There are two height requirements, or conditions, for Roaring River. How did you approach writing an inequality for this ride? I wrote two inequalities because the rider must be at least 36 inches tall but can’t be taller than 54 inches. Would h < 48 be a precise description for the height requirement for the Lil’ Dipper ride? Explain. Heights cannot be negative, so we know h > 0. There is no minimum height listed, but it isn’t realistic that a very small child would be able to ride unaccompanied. Even a very small child would not have a height close to 0 inches. What would be an appropriate minimum height requirement for the Lil’ Dipper ride? Allow students to answer intuitively with a height that seems appropriate. Today, we will analyze statements with more than one condition, such as the height requirements for the Roaring River and Lil’ Dipper rides.
272
© Great Minds PBC
EUREKA MATH2 A1 ▸ M1 ▸ TC ▸ Lesson 14
Learn Determining Truth Students determine when mathematical statements connected by the words and or or are true by comparing them to English sentences with the same connecting words. Guide students to complete problems 5–8 and to read the definitions for statement and compound statement. For problems 5–13, determine whether the statement is true or false. 5. Right now, I am in math class, and I am in English class. False 6. Right now, I am in math class, or I am in English class. True (assuming students answer this question in math class or English class) 7. Ice is cold, and fire is hot. True
Language Support Consider creating a tree map graphic organizer for compound statements to support students’ comprehension of truth values. Include the rules for truth values and the examples of compound statements. The definition for statement and compound statement could be included at the top of the map. As a contrast, the definition for compound inequality could be included at the bottom of the map. Compound Statements
8. Ice is cold, or fire is hot. True A statement is a sentence that is either true or false, but not both. A compound statement consists of two or more statements connected by logical modifiers, like and or or. Problems 5 and 7 both use the connecting word and. How do you determine whether the statement is true or false for these problems? For problem 5, I am only in math class. I can’t be in two different classes at the same time. For problem 7, I know that both are true, so the statement is true.
© Great Minds PBC
and
or
True if both statements are true.
True if at least one statement is true.
Examples Ice is cold and fire is hot. TRUE
Examples Ice is cold or fire is hot. TRUE
3 + 5 = 8 and 5 < 7 – 1
TRUE
3 < 5 + 4 or 6 + 4 = 9
TRUE
10 + 2 12 and 8 – 3 > 0
FALSE
16 – 20 > 1 or 5.5 + 4.5 = 11
FALSE
273
EUREKA MATH2
A1 ▸ M1 ▸ TC ▸ Lesson 14
These are examples of compound statements. When two statements in a sentence are connected by the word and, how many statements have to be true to make the compound statement true? Both statements have to be true for the compound statement to be true. Problems 6 and 8 both use the connecting word or. How do you determine whether the compound statement is true or false for these problems? For problem 6, I am in math class. Because I am in one of the classes listed, the statement is true. For problem 8, both of those statements are true, so the statement is true. When two statements in the sentence are connected by the word or, how many statements have to be true to make the compound statement true? At least one of the statements has to be true for the compound statement to be true. Encourage students to use their understanding of truth value in English sentences to complete problems 9–13.
Differentiation: Support If students are confused about the truth value for problem 8, consider using the following discussion for clarification: • Suppose we went to an ice cream store, and I said, “I can’t decide if I want chocolate or vanilla. Surprise me!” Getting one scoop of vanilla, one scoop of chocolate, or one scoop of each flavor are all actions that would fulfill my request. While it is true that getting one scoop of each flavor fulfills the request for chocolate or vanilla, it may seem strange to us because we think of or as meaning “either or, but not both.”
Consider pairing students to discuss their reasoning. 9. 3 + 5 = 8 and 5 < 7 − 1 True
10. 10 + 2 ≠ 12 and 8 − 3 > 0 False
11. 3 < 5 + 4 or 6 + 3 = 9 True 12. 16 − 20 > 1 or 5.5 + 4.5 = 11 False 13. 16 + 20 > 1 or 5.5 + 4.5 = 11 True
274
© Great Minds PBC
EUREKA MATH2 A1 ▸ M1 ▸ TC ▸ Lesson 14
Read the answers to the class, and initiate a class discussion to summarize the following truth value requirements for compound statements connected by and or or: • The word and has the same meaning in a compound mathematical statement as it does in an English sentence. • For a compound statement connected with and to be true, both statements in the sentence have to be true. • The word or has a similar meaning in a compound mathematical statement as it does in an English sentence, with one important difference. In an English sentence, the word or commonly means that if one, not both, of the statements is true, the compound statement is true. In mathematics, the word or means the compound statement is true if either statement is true or if both statements are true. • For a compound statement connected by or to be true, at least one statement in the sentence needs to be true.
Graphing Solution Sets Students graph the solution set of one-variable compound equations and inequalities on a number line. Guide students to problem 14. Have students discuss with a partner their approach for solving the problem. Inform students that they do not actually solve the problem yet. Invite one or two pairs to share their approaches for solving problem 14. The compound statement has or, so at least one part of the statement needs to be true. The solution set consists of all y values, where y + 8 = 3 is true or y − 6 = 2 is true, so we need to find the solution to both equations to find the possible values of y. Direct students to work with their partners to complete problem 14. Call the class back together to discuss the solution set and graph. Direct students to continue their work through problem 16. Then display the correct answers, and summarize the process of writing the solution sets by using set notation and graphing the solution sets.
© Great Minds PBC
275
EUREKA MATH2
A1 ▸ M1 ▸ TC ▸ Lesson 14
For problems 14–16, solve each compound statement. Write the solution set by using set notation. Then graph the solution set on the given number line. 14. y + 8 = 3 or y − 6 = 2
y = −5 or y = 8; {−5, 8}
y –10 –9 –8 –7 –6 –5 –4 –3 –2 –1 0 1 2 3 4 5 6 7 8 9 10
15. d − 6 = 1 and d + 2 = 9
d = 7 and d = 7, {7}
d –10 –9 –8 –7 –6 –5 –4 –3 –2 –1 0 1 2 3 4 5 6 7 8 9 10
16. 2w − 8 = 10 and w > 9
w = 9 and w > 9, {}
w –10 –9 –8 –7 –6 –5 –4 –3 –2 –1 0 1 2 3 4 5 6 7 8 9 10
276
© Great Minds PBC
EUREKA MATH2 A1 ▸ M1 ▸ TC ▸ Lesson 14
Give each student three different colored pencils. Ask students to complete parts (a)–(d) of problem 17. Then stop and discuss the results. For the compound statement x < 3 and x > −1 to be true, what has to be true about x? The value of x has to be both greater than −1 and less than 3. For which part of this problem did you color the solution to the compound statement? I colored the solution to the compound statement for part (c). Draw a new number line that displays only the solution set. List some of the solutions to the compound statement. 3
Sample: 0, 0.25, 2, − 7 .
UDL: Representation Consider annotating the number line to draw students’ attention to the section of the line that represents the solution set. For example, display problem 17 as the results are discussed. Annotate the number line by darkening the section where x < 3 and x > −1, and label that section as the solution set. Encourage students to make the same notation on their number lines. Then draw a new number line that displays only the solution set.
If students do not offer any examples of non-integer solutions, prompt them to do so. Discuss parts (e) and (f) as a class. How many solutions are there to this compound inequality? Explain your answer. There are infinitely many solutions to this compound inequality because there are infinitely many real numbers between −1 and 3. What is a more efficient way to write this compound inequality?
−1 < x < 3 Point out that when the compound inequality is written as −1 < x < 3, the x is between the −1 and 3, just as students saw on the graph of the solution. Consider reviewing the term strict inequality by noting that −1 < x < 3 is a strict inequality because it is a representation that x is strictly between −1 and 3 but does not include −1 or 3.
© Great Minds PBC
277
EUREKA MATH2
A1 ▸ M1 ▸ TC ▸ Lesson 14
17. x < 3 and x > −1
x –10 –9 –8 –7 –6 –5 –4 –3 –2 –1 0 1 2 3 4 5 6 7 8 9 10 a. Using a colored pencil, graph the inequality x < 3. b. Using a different colored pencil, graph the inequality x > −1. c. Using a third colored pencil, darken the section of the number line where x < 3 and x > −1.
{x ∣ x < 3 and x > −1}
d. Write the solution set by using set notation. e. How many solutions are there to this compound inequality? Explain. There are infinitely many solutions to this compound inequality because there are infinitely many real numbers between −1 and 3. f. Is there a more efficient way to write this statement?
−1 < x < 3 Give students time to work on problems 18–23, and then allow students to share their answers with one another. Consider combining partners to form a group of four. Encourage students to continue using colored pencils if needed. Circulate as students work, and listen for opportunities to ask the following questions to guide student thinking: • Is there a more efficient way to write your solution set? • How can you use your graph to verify your solution set? Problems 22 and 23 may require additional review as a class. Listen intently while students discuss these problems to determine whether a class discussion is needed.
278
© Great Minds PBC
EUREKA MATH2 A1 ▸ M1 ▸ TC ▸ Lesson 14
For problems 18–21, write the solution set of the compound statement by using set notation. Then graph the solutions on the number line.
18. f > 4 or f ≤ 0
{f ∣ f ≤ 0 or f > 4}
Differentiation: Challenge
f
–10 –9 –8 –7 –6 –5 –4 –3 –2 –1 0 1 2 3 4 5 6 7 8 9 10 19. g > −2 or g = −2
{g ∣ g ≥ −2}
g
–10 –9 –8 –7 –6 –5 –4 –3 –2 –1 0 1 2 3 4 5 6 7 8 9 10 20. m > 2 or m > 6
{m ∣ m > 2}
If students finish problems 18–23 quickly, challenge them to explore the effect that changing or to and in problems 18, 20, and 21 has on the solution set. In problem 18, changing or to and would create a compound inequality that has no solution. In problem 20, the solution would change to m > 6. In problem 21, the solution would change to −5 ≤ x ≤ 2.
Teacher Note
m
–10 –9 –8 –7 –6 –5 –4 –3 –2 –1 0 1 2 3 4 5 6 7 8 9 10
21. x ≥ −5 or x ≤ 2
ℝ
x
In compound statements such as problem 20, students may wonder whether it is necessary to include an open dot at 6 on the number line. Ask students to consider whether 6 makes this compound statement true. Because it does, 6 is a part of the solution set, so there should not be an open dot at 6 on the number line.
–10 –9 –8 –7 –6 –5 –4 –3 –2 –1 0 1 2 3 4 5 6 7 8 9 10
© Great Minds PBC
279
EUREKA MATH2
A1 ▸ M1 ▸ TC ▸ Lesson 14
For problems 22 and 23, rewrite as a compound statement connected by and or or. Graph the solution set on the number line.
22. x ≤ 4
x < 4 or x = 4
x –10 –9 –8 –7 –6 –5 –4 –3 –2 –1 0 1 2 3 4 5 6 7 8 9 10
23. 1 < d < 3
d > 1 and d < 3
d –10 –9 –8 –7 –6 –5 –4 –3 –2 –1 0 1 2 3 4 5 6 7 8 9 10
Let’s Apply It Students represent situations with compound statements. Have students think independently about the scenarios given in problems 24–26. Give students time to discuss the problems with their partner and to work to define variables and write compound statements that represent each situation. Call the class back together. Then display the answers and discuss the problems.
280
Promoting the Standards for Mathematical Practice When students decontextualize problems by using compound inequalities, they are reasoning abstractly (MP2). Ask the following questions to promote MP2: • What is the problem asking you to do? • What does this problem tell you about which inequalities you should write? • Does the solution you found make sense mathematically?
© Great Minds PBC
EUREKA MATH2 A1 ▸ M1 ▸ TC ▸ Lesson 14
24. Each student has to present a speech in English class. The guidelines state that the speech must be at least 7 minutes, but it must not exceed 12 minutes. Write a compound inequality for the possible lengths of the speech. Let s represent the length of a speech in minutes.
7 ≤ s ≤ 12
25. The element mercury has a freezing point of −37.9°F and a boiling point of 673.9°F. It is a liquid between these temperatures. Write a compound inequality for the temperatures at which mercury is a liquid. Let m represent the temperatures in degrees Fahrenheit at which mercury is a liquid.
−37.9 < m < 673.9
26. The internal temperature of a cooked steak must be at least 145°F when warm or below 40°F when refrigerated. At any other temperature, bacteria can grow and make the steak unsafe to eat. Write a compound inequality for the internal temperature of a cooked steak that is safe to eat. Let x represent the temperature in degrees Fahrenheit of a cooked steak that is safe to eat.
x ≥ 145 or x < 40
© Great Minds PBC
281
EUREKA MATH2
A1 ▸ M1 ▸ TC ▸ Lesson 14
Land Debrief 5 min Objectives: Describe the solution set of two equations or inequalities joined by either and or or and graph the solution set on the number line. Write a compound statement to describe a situation. Use the following prompts to guide a discussion about compound statements. What is required for a compound statement connected by the word and to be true? Both statements must be true for the compound statement to be true. What is required for a compound statement connected by the word or to be true? At least one statement must be true for the compound statement to be true. Some inequalities are actually compound statements without including the words and or or. What are some examples of these inequalities, and how can we rewrite them by using and or or?
−3 < x ≤ 5 means x > −3 and x ≤ 5. 6 ≥ k means k < 6 or k = 6.
7 < m < 15 means m > 7 and m < 15.
Exit Ticket 5 min Provide up to 5 minutes for students to complete the Exit Ticket. It is possible to gather formative data even if some students do not complete every problem.
282
Teacher Note Assign the Practice problems for completion outside of class or use them in class if time remains after the lesson. Refer students to the Recap for support.
© Great Minds PBC
EUREKA MATH2 A1 ▸ M1 ▸ TC ▸ Lesson 14
Recap
EUREKA MATH2
A1 ▸ M1 ▸ TC ▸ Lesson 14
Student Edition: Grade A1, Module 1, Topic C, Lesson 14
RECAP
Name
Date
14
EUREKA MATH2
A1 ▸ M1 ▸ TC ▸ Lesson 14
3. c ≥ −7 and c ≤ 2
Solution Sets of Compound Statements
The connecting word is and. Solutions must make both parts of the compound statement true.
c
In this lesson, we
Terminology
•
described solution sets of two equations or two inequalities joined by and or or.
•
graphed solution sets of two equations or two inequalities joined by and or or on a number line.
•
wrote compound statements to describe contexts.
–10 –9 –8 –7 –6 –5 –4 –3 –2 –1
A statement is a sentence that is either true or false, but not both.
For problems 1−3, graph the solution set of the compound statement.
1
2
3
4
5
6
7
8
9 10
The graph of the solution set is where the graphs of c ≥ −7 and c ≤ 2 overlap.
A compound statement consists of two or more statements connected by logical modifiers, like and or or.
Examples
0
4. Write a compound inequality for the graph.
m –10 –9 –8 –7 –6 –5 –4 –3 –2 –1
−4 ≤ m ≤ 6
1. x + 1 = 3 or x − 2 = 5
0
1
2
3
4
5
6
7
8
9 10
Another way to write this compound inequality is m ≥ −4 and m ≤ 6.
5. Consider the compound inequality −5 < x ≤ 5.
The connecting word is or. Solutions must make at least one part of the compound statement true.
a. Rewrite as a compound statement separated by and or or.
x > −5 and x ≤ 5
x –10 –9 –8 –7 –6 –5 –4 –3 –2 –1
0
1
2
3
4
5
6
7
8
9 10
b. Graph the compound inequality.
x 2. w > 5 or w < −4
–10 –9 –8 –7 –6 –5 –4 –3 –2 –1 w
–10 –9 –8 –7 –6 –5 –4 –3 –2 –1
0
1
2
3
4
5
6
7
8
0
1
2
3
6
7
8
9 10
There are infinitely many solutions to the compound inequality. 6. Write a compound inequality to represent the situation. The car repair is expected to cost at least $100 but no more than $150. Let r represent the cost for the car repair in dollars.
100 ≤ r ≤ 150
© Great Minds PBC
5
c. How many solutions are there to the compound inequality?
9 10
The graph of the solution set consists of both regions.
© Great Minds PBC
4
219
220
RECAP
The phrases at least and no more than indicate that the inequality should include the values 100 and 150.
© Great Minds PBC
283
EUREKA MATH2
A1 ▸ M1 ▸ TC ▸ Lesson 14
Sample Solutions Expect to see varied solution paths. Accept accurate responses, reasonable explanations, and equivalent answers for all student work.
EUREKA MATH2
A1 ▸ M1 ▸ TC ▸ Lesson 14
Student Edition: Grade A1, Module 1, Topic C, Lesson 14 Name
PRACTICE Date
14
EUREKA MATH2
A1 ▸ M1 ▸ TC ▸ Lesson 14
For problems 7–16, graph the solution set of the statement on the given number line. 7. x = −2 or x = 8
For problems 1–6, write whether the compound statement is true or false.
x –10 –9 –8 –7 –6 –5 –4 –3 –2 –1
1. 6 + 1 = 7 and 8 − 6 = 2
0
1
2
3
4
5
6
7
8
9 10
0
1
2
3
4
5
6
7
8
9 10
0
1
2
3
4
5
6
7
8
9 10
0
1
2
3
4
5
6
7
8
9 10
0
1
2
3
4
5
6
7
8
9 10
True 8. w > 5
w
2. 5 > 3 or 7 < 1
–10 –9 –8 –7 –6 –5 –4 –3 –2 –1
True 3. 3 ⋅ 4 = 12 and False
4. 9 ⋅ 1 < 22 or True
9. g ≤ 2
1 ⋅7 = 4 2
–10 –9 –8 –7 –6 –5 –4 –3 –2 –1 21 > 6 3
g
10. k > 5 or k < 2
k 5.
1 ⋅ 9 ≠ 3 and 0.2 ⋅ 10 > 5 3
–10 –9 –8 –7 –6 –5 –4 –3 –2 –1 11. m ≤ −8 or m ≥ −1
False
6. 4 − 10 > 6 or False
© Great Minds PBC
284
1 ⋅ 16 ≤ 3 4
–10 –9 –8 –7 –6 –5 –4 –3 –2 –1
221
222
P R ACT I C E
m
© Great Minds PBC
© Great Minds PBC
EUREKA MATH2 A1 ▸ M1 ▸ TC ▸ Lesson 14
EUREKA MATH2
A1 ▸ M1 ▸ TC ▸ Lesson 14
12. d < 9 and d > 7
EUREKA MATH2
A1 ▸ M1 ▸ TC ▸ Lesson 14
For problems 17 and 18, write a compound inequality for each graph.
d –10 –9 –8 –7 –6 –5 –4 –3 –2 –1
0
1
2
3
4
5
6
7
8
b
17.
–10 –9 –8 –7 –6 –5 –4 –3 –2 –1
9 10
0
1
2
3
4
5
6
7
8
9 10
0
1
2
3
4
5
6
7
8
9 10
b < 1 or b > 3 13. v > −3 and v < 5
v –10 –9 –8 –7 –6 –5 –4 –3 –2 –1
0
1
2
3
4
5
6
7
8
p
18.
–10 –9 –8 –7 –6 –5 –4 –3 –2 –1
9 10
p < 2 or p > 2 14. c ≤
3 1 or c > 2 4
c –5
–4
–3
–2
–1
0
1
2
3
4
19. Consider the compound inequality 0 < x < 3.
5
a. Rewrite the compound inequality as a compound statement connected by and or or.
x > 0 and x < 3 15. q ≤ −2
1 1 or q ≥ 2 4 4
b. Graph the compound inequality on a number line.
q –5
–4
–3
–2
–1
0
1
2
3
4
x
5
–10 –9 –8 –7 –6 –5 –4 –3 –2 –1
0
1
2
3
4
5
6
7
8
9 10
c. How many solutions are there to the compound inequality? There are infinitely many solutions to the inequality.
16. x = −2 and x = 8
x –10 –9 –8 –7 –6 –5 –4 –3 –2 –1
0
1
2
3
4
5
6
7
8
9 10
20. Consider the compound inequality −1.75 ≤ u < 4.
a. Rewrite the compound inequality as a compound statement connected by and or or.
u ≥ −1.75 and u < 4
b. Graph the compound inequality on a number line.
u –5
© Great Minds PBC
© Great Minds PBC
P R ACT I C E
223
224
–4
P R ACT I C E
–3
–2
–1
0
1
2
3
4
5
© Great Minds PBC
285
EUREKA MATH2
A1 ▸ M1 ▸ TC ▸ Lesson 14
EUREKA MATH2
A1 ▸ M1 ▸ TC ▸ Lesson 14
21. Consider the inequality n ≤ 6.
26. Children and senior citizens receive a discount on tickets at the movie theater. The discount applies to 2- to 12-year-olds as well as adults 60 years of age or older.
a. Rewrite the inequality as a compound statement connected by and or or.
Let a represent the age in years a person must be to receive a discount.
2 ≤ a ≤ 12 or a ≥ 60
n < 6 or n = 6
If students define age continuously, they may also write the inequality 2 ≤ a < 13 or a ≥ 60.
b. Graph the inequality on a number line.
n –10 –9 –8 –7 –6 –5 –4 –3 –2 –1
0
1
2
3
4
5
6
7
EUREKA MATH2
A1 ▸ M1 ▸ TC ▸ Lesson 14
8
9 10
For problems 22–26, write a single or compound inequality for the situation. 22. The scores on the last test ranged from 65% to 100%.
27. Consider the following compound statements.
Let s represent a score on the last test, as a percent.
65 ≤ s ≤ 100
x < 1 and x > −1
x < 1 or x > −1
Does changing the word and to or change the solution set? Explain and graph the solutions to both statements.
23. To ride the roller coaster, a person must be at least 48 inches tall. Let h represent the height in inches of a person allowed to ride the roller coaster.
h ≥ 48
For the first statement, both inequalities must be true, so x can only equal values that are both greater than −1 and less than 1. For the second statement, only one inequality must be true, so x must be greater than −1 or less than 1. This means x can equal any number on the number line.
24. Unsafe body temperatures are those lower than 96°F or above 104°F. Let t represent an unsafe body temperature in degrees Fahrenheit.
x
t < 96 or t > 104
–10 –9 –8 –7 –6 –5 –4 –3 –2 –1
0
1
2
3
4
5
6
7
8
9 10
–10 –9 –8 –7 –6 –5 –4 –3 –2 –1
0
1
2
3
4
5
6
7
8
9 10
x
25. For a shark to survive in an aquarium, the water in its tank must be at least 18°C and no more than 22°C. Let x represent the water temperature in degrees Celsius in which a shark can survive.
18 ≤ x ≤ 22
© Great Minds PBC
286
P R ACT I C E
225
226
P R ACT I C E
© Great Minds PBC
© Great Minds PBC
EUREKA MATH2 A1 ▸ M1 ▸ TC ▸ Lesson 14
EUREKA MATH2
A1 ▸ M1 ▸ TC ▸ Lesson 14
Remember For problems 28 and 29, solve the equation. 28. 3(x + 5) = −18
29. 7 = −4(2x − 1)
−11
−
3 8
For problems 30 and 31, write the polynomial expression in standard form. 30. (a − 6)2
31. (m − 9)(m + 9)
a2 − 12a + 36
m2 − 81
32. The data list the heights in inches of the vertical jumps of 18 players on a youth basketball team.
13
15
17
13
15
18
15
15
14
13
15
15
13
16
14
15
13
13
Make a dot plot of the data. Vertical Jump Measurements
10
11
12
13
14
15
16
17
18
19
20
Vertical Jump (inches)
© Great Minds PBC
© Great Minds PBC
P R ACT I C E
227
287
15
Teacher Edition: Grade A1, Module 1, Topic C, Lesson 15 LESSON 15
Solving and Graphing Compound Inequalities Find the solution sets of compound inequalities in one variable and graph the solution sets on the number line.
EUREKA MATH2
A1 ▸ M1 ▸ TC ▸ Lesson 15
Student Edition: Grade A1, Module 1, Topic C, Lesson 15
EXIT TICKET
Name
Date
15
Solve each compound inequality. Write the solution set by using set notation. Then graph the solution set on the number line. 1. 9 + 2x > 15 or 7 + 4x < −9
9 + 2 x > 15 2x > 6 x > 3
7 + 4 x < −9 4 x < −16 x < −4
{x | x > 3 or x < −4}
x –10 –9 –8 –7 –6 –5 –4 –3 –2 –1 2. 6 ≤
0
1
2
3
4
5
6
7
8
9 10
x 3
Key Questions
• How does the inequality symbol impact the graph of the solution set?
12 ≤ x
x ≤ 11 2
• How do the words and and or affect the solution set of a compound inequality?
x ≤ 22
{x | 12 ≤ x ≤ 22}
Students solve two compound inequalities in which the expressions on each side of the inequalities are the same, but one expression is separated by and and one expression is separated by or. Students note the similarities and differences between the solution sets and their graphs. Students then practice solving compound inequalities and graphing their solution sets on a number line as they progress through a series of clues to solve a riddle. Working in groups, students participate in a card sort activity to visualize key characteristics of compound inequalities and make connections to the graphs of their solution sets.
• Given a compound inequality, how do we know the endpoints of the graph of its solution set?
x ≤ 11 2
6 ≤
Lesson at a Glance
x –2
© Great Minds PBC
0
2
4
6
8
10
12
14
16
18
20
22
24
233
© Great Minds PBC
EUREKA MATH2 A1 ▸ M1 ▸ TC ▸ Lesson 15
Achievement Descriptors A1.Mod1.AD6 Solve linear equations and inequalities in one variable. (A.REI.B.3) A1.Mod1.AD7 Create equations and inequalities in one variable and use them to solve
problems. (A.CED.A.1) A1.Mod1.AD8 Represent constraints by using equations and inequalities. (A.CED.A.3) A1.Mod1.AD9 Interpret solutions to equations and inequalities in one variable as viable
or nonviable options in a modeling context. (A.CED.A.3)
Agenda
Materials
Fluency
Teacher
Launch 5 min
• None
Learn 30 min
Students
• Solving Compound Inequalities
• None
• What’s My Integer?
Lesson Preparation
• They Look the Same
• Copy and cut out 1 set of cards from the They Look the Same Card Sort page for each group of 3 or 4 students.
Land 10 min
© Great Minds PBC
289
EUREKA MATH2
A1 ▸ M1 ▸ TC ▸ Lesson 15
Fluency Solve Inequalities
Teacher Note
Students solve inequalities and graph the solution sets to prepare for solving and graphing the solution sets of compound statements.
Students may use the Number Lines removable.
Directions: Solve each inequality. Write the solution set by using set notation, and then graph the solution set on a number line.
1.
2.
3.
4.
−3 + x ≤ −5
−7_ x > 2 2
18 ≥ −2(2x − 1)
{x | x ≤ −2}
–10 –8 –6 –4 –2
2
4
6
8 10
{x | x < −7}
–10 –8 –6 –4 –2
0
2
x 4
6
8 10
{x | x ≥ −4}
–10 –8 –6 –4 –2
0
2
x 4
6
8 10
{x | x > 8}
8x + 27 < 12x −5
–10 –8 –6 –4 –2
290
0
x
0
2
x 4
6
8 10
© Great Minds PBC
EUREKA MATH2 A1 ▸ M1 ▸ TC ▸ Lesson 15
Launch
5
Students use prior knowledge to interpret compound inequalities. Direct students to problem 1 and have them complete it individually. Encourage students to share their solutions with a partner and to add their partner’s values to their number lines. 1. Consider the compound inequality − 5 < 2x + 1 < 4. a. Rewrite the inequality as a compound statement separated by and or or.
2x + 1 > −5 and 2x + 1 < 4 b. List four values of x that are part of the solution set. Include at least two non-integer solutions. Then plot the values on the number line. 1 Sample: −2, − _ , 0, 1.4 2
–10 –9 –8 –7 –6 –5 –4 –3 –2 –1 0 1 2 3 4 5 6 7 8 9 10 After students have placed their solutions on the number line, ask the following question. Based on the points you see plotted on the number line, what do you think the solution set to this compound inequality is? Allow a few students to share their predictions and have the class plot these additional points on their number line in part (b). Depending on the variety of solutions the class finds, students may be able to predict the actual solution set. Do not confirm predictions at this time. Students will solve this compound inequality algebraically in the next part of the lesson.
Differentiation: Support If students need support rewriting the compound statement or finding solutions, have them consider the compound inequality 5 < x < 4. Ask students questions such as − the following: • How can you rewrite this compound inequality as a compound statement? • What is one value of x that makes the compound statement true? How do you know? • Does this value of x make the compound inequality in problem 1 true? How can you check?
Today, we will find and graph solution sets of inequalities where x is not isolated while reinforcing the differences between and and or.
© Great Minds PBC
291
EUREKA MATH2
A1 ▸ M1 ▸ TC ▸ Lesson 15
Learn Solving Compound Inequalities Students solve compound inequalities and graph their solution sets on the number line. Direct students to problem 2 and display both the original compound inequality and the compound statement separated by and. −5 < 2x + 1 < 4 2x + 1 > −5and 2 x + 1 < 4 For problem 1, we predicted what the solution set might be based on individual solutions we found. How do you think we can find the solution set algebraically? We can solve each inequality separately to find the solution set. Have students complete problem 2.
Promoting the Standards for Mathematical Practice
For problems 2 and 3, find the solution set of the compound inequality. Then graph the solution set on the number line. 2. −5 < 2x + 1 < 4
2x + 1 > −5
2x + 1 > −5 and 2x + 1 < 4
2x > −6 x > −3
2x + 1 < 4 2x < 3
x < _ 3 2
3 The solution set is {x | −3 < x < _ . 2}
–10 –9 –8 –7 –6 –5 –4 –3 –2 –1 0 1 2 3 4 5 6 7 8 9 10
292
When students compare their predictions with the graphed class data and use this data to determine solution sets to compound inequalities and the endpoints of the graphs, they are making sense of problems and persevering in solving them (MP1). Ask the following questions to promote MP1: • What are some steps you could take to start solving the problem?
x
• What is your plan to find the endpoints? • Does your answer make sense? Why?
© Great Minds PBC
EUREKA MATH2 A1 ▸ M1 ▸ TC ▸ Lesson 15
Once students finish, display the correct work. Have students compare their graphs from problems 1 and 2 and share whether their predictions from the beginning of class were correct. Then direct students to problem 3. How is this compound inequality the same as the one from problem 2? The expressions on each side of the inequality are the same. How is it different? The compound statement is separated by or instead of and. The inequalities are less than or equal to and greater than or equal to, rather than just less than and greater than.
Teacher Note If the term strict inequality was used in previous lessons, consider continuing to use it in this lesson. Students might describe problem 2 as a compound statement that consists of strict inequalities, while they might describe problem 3 as a compound statement that consists of inequalities that are not strict.
What is the difference between the solution sets when the compound statement is separated by or instead of and? When the compound statement is separated by or, the solution set consists of all the values of xthat make at least one of the statements true. When the compound statement is separated by and, the solution set consists of all the values of x that make both statements true. What do the greater than or equal to and the less than or equal to inequality symbols mean for the solution set of a compound inequality and its graph? The solution set will contain the endpoints. The graph of the solution set will have closed circles on the endpoints rather than open circles like in problem 2.
© Great Minds PBC
293
EUREKA MATH2
A1 ▸ M1 ▸ TC ▸ Lesson 15
Have students complete problem 3. Then display the correct work and address any questions. 3. 2x + 1 ≤ −5 or 2x + 1 ≥ 4
2x + 1 ≤ −5
2x + 1 ≥ 4
2x ≤ −6
2x ≥ 3
x ≤ −3
x ≥ _ 3 2
3_ The solution set is { x | x ≤ −3 or x ≥ }. 2
x
–10 –9 –8 –7 –6 –5 –4 –3 –2 –1 0 1 2 3 4 5 6 7 8 9 10 Display and have students compare the graphs of the solution sets for problems 2 and 3.
{x | −3 < x < _ } 3 2
x
–10 –9 –8 –7 –6 –5 –4 –3 –2 –1 0 1 2 3 4 5 6 7 8 9 10 3 {x | x ≤ −3 or x ≥ _ 2}
x
–10 –9 –8 –7 –6 –5 –4 –3 –2 –1 0 1 2 3 4 5 6 7 8 9 10
294
© Great Minds PBC
EUREKA MATH2 A1 ▸ M1 ▸ TC ▸ Lesson 15
What’s My Integer?
UDL: Representation
Students practice finding solution sets of a series of compound inequalities. Direct students to problem 4 and use the following directions to introduce the activity:
When they line up the graphs for Clues A, B, C, and D, consider having students mark on the number line where the graphs overlap. This may support students in visualizing where the mystery integer lies on the number line.
• The goal of the activity is to find the mystery integer by using a series of clues. • For each clue, solve the compound inequality and graph the solution on the number line next to the clue.
x
• After completing each clue, guess the mystery integer based on the information you have at that point.
–10 –8 –6 –4 –2 0 2 4 6 8 10
• After completing the last clue, find the mystery integer.
x
Address any questions about the directions, and then have students work with a partner on problem 4.
–10 –8 –6 –4 –2 0 2 4 6 8 10
x
4. Use the series of clues to determine the mystery integer.
–10 –8 –6 –4 –2 0 2 4 6 8 10
For each clue, find the solution set of the compound inequality. Write the solution set in set notation and graph the solution set on the number line. Then guess what the mystery integer is. Clue
Graph
x –10 –8 –6 –4 –2 0 2 4 6 8 10 Guess
A. When I take a third of my number and then add 2, the result is less than or
_4
10 __
equal to or greater than or equal to . 10 4 1 1 x + 2 ≤ or x + 2 ≥ 3 3 3 3
_
3
_
1 4 x + 2 ≤ 3 3 1 2 x ≤ − 3 3
_
_
_
_
x ≤ −2
_
3
__
10 1 x + 2 ≥ 3 3 1 4 x ≥ 3 3
_
_
__ _
–10 –8 –6 –4 –2
0
2
4
6
8 10
Sample: −2
x≥4
The solution set is {x | x ≤ −2 or x ≥ 4}. © Great Minds PBC
x
295
EUREKA MATH2
A1 ▸ M1 ▸ TC ▸ Lesson 15
Clue
Graph
Guess
B. When I subtract 2 from my number and then triple that difference, the result is strictly between −21 and 12.
−21 < 3(x − 2) < 12 3(x − 2) > −21 x − 2 > −7 x > −5
and
3(x − 2) < 12 x−2<4 x<6
x –10 –8 –6 –4 –2
0
2
4
6
8 10
Sample: −2
The solution set is {x | −5 < x < 6}.
C. Half the sum of the opposite of my number and 5 is less than 3 or greater than 4. −x + 5 −x + 5 _____ < 3 or _____ > 4 2 2 −x + 5 _____ < 3 2
−x + 5 < 6 −x < 1 x > −1
−x + 5 _____ > 4 2
−x + 5 > 8 −x > 3 x < −3
x –10 –8 –6 –4 –2
0
2
4
6
8 10
Sample: 4
The solution set is {x | x < −3 or x > −1}.
296
© Great Minds PBC
EUREKA MATH2 A1 ▸ M1 ▸ TC ▸ Lesson 15
Clue
Graph
Guess
D. The difference between my number and one-third of my number is at least −4 and at most 2. −4 ≤ x − _ x ≤ 2
1 x − x ≥ −4 3 2 x ≥ −4 3
_ _
1 3
and
x ≥ −6
1 x − x ≤ 2 3 2 x ≤ 2 3
_ _
x –10 –8 –6 –4 –2
0
2
4
6
8 10
Sample: −4
x≤3
The solution set is {x | −6 ≤ x ≤ 3}. What is the mystery integer? The mystery integer is − 4.
As students finish the last clue, have them check their work with another pair of students. Invite students to share how each solution set narrowed the possibilities for the value of the mystery integer. Then display a few samples of students’ number lines and guesses. Come to a class consensus that the only integer found in all four solution sets is − 4. Have students think–pair–share about how to solve compound inequalities. When solving compound inequalities, what effect does the word and or the word or have on the solution set? When the word and is in the compound inequality, the solution set is the set of all values of the variable that make both statements true. When the word or is in the compound inequality, the solution set is the set of all values of the variable that make at least one of the statements true.
© Great Minds PBC
297
EUREKA MATH2
A1 ▸ M1 ▸ TC ▸ Lesson 15
What impact does the word and or the word or have on the graph of the solution set? When the word and is in the compound inequality, the graph of the solution set includes all the points where the two separate rays intersect. When the word or is in the compound inequality, the graph of the solution set includes all the points that lie on either or both rays.
They Look the Same Students identify characteristics that make the graphs of similar compound inequalities different. Have students form groups of 3 or 4. Distribute a set of cards to each group for the They Look the Same card sort activity. Have students work in groups to match each compound inequality to the graph of its solution set. When most groups have finished, display the answers to the card sort activity and give students time to rearrange their cards to correct any errors. 1-F, 2-A, 3-C, 4-E
Differentiation: Challenge If time permits, challenge students by asking them to create a compound inequality for one of the unmatched graphs. Encourage students to use a variety of operations, variables, and constants.
Facilitate a class discussion by inviting students to compare the key characteristics of each inequality in the card sort with questions such as the following. Which characteristics of the compound inequalities were important to pay attention to when identifying the graphs of the solution sets? It was important to pay attention to whether the statement included and or or. It was important to note whether the endpoints were part of the solution set. Look at cards 1 and 3. How did changing or to and affect the solution set of the inequality? When the inequalities were separated by or, only one inequality had to be true to make the statement true, so the solution set included all values greater than or equal to − 5. When the inequalities were separated by and, both inequalities had to be true to make the statement true, so the solution set only included values greater than − 2.
298
Teacher Note If time is a concern, consider removing graphs B and D from the card sort.
© Great Minds PBC
EUREKA MATH2 A1 ▸ M1 ▸ TC ▸ Lesson 15
Look at card 2. How did you know that the solution set was all real numbers? When we graphed the two inequalities, every number on the number line was included, so we knew the solution set was all real numbers. Since the inequalities were separated by or, we knew only one inequality had to be true to make the statement true, so x could be any value greater than or equal to − 5or less than − 2. This includes every number, so we knew the solution set was all real numbers. Look at card 4. Why wasn’t the solution set for card 4 also all real numbers? Since the inequalities were separated by and, the solution set only included values where the two graphs intersected. So the solution set was all values greater than or equal to − 5and less than − 2.
Land Debrief 5 min Objective: Find the solution sets of compound inequalities in one variable and graph the solution sets on the number line. Facilitate a class discussion by using the following questions to assess students’ understanding of how to solve and graph the solutions to compound inequalities. Given a compound inequality, how do we find the endpoints of the graph of its solution set? We solve the inequalities to find the endpoints. If the endpoints are not part of the solution set, we use an open circle. If the endpoints are part of the solution set, we use a closed circle.
© Great Minds PBC
299
EUREKA MATH2
A1 ▸ M1 ▸ TC ▸ Lesson 15
How does the inequality symbol impact the graph of the solution set? The inequality symbol determines which part of the graph is shaded. If x < a, then the graph of the solution set shows that the values to the left of the endpoint a are shaded. If x > a, then the graph of the solution set shows that the values to the right of the endpoint aare shaded. How do the words and and or affect the solution set of a compound inequality? When the word and is in the compound inequality, the solution set is the set of all values of the variable that make both statements true. When the word or is in the compound inequality, the solution set is the set of all values that make one or both statements true.
Exit Ticket 5 min Provide up to 5 minutes for students to complete the Exit Ticket. It is possible to gather formative data even if some students do not complete every problem.
300
Teacher Note Assign the Practice problems for completion outside of class or use them in class if time remains after the lesson. Refer students to the Recap for support.
© Great Minds PBC
EUREKA MATH2 A1 ▸ M1 ▸ TC ▸ Lesson 15
Recap
EUREKA MATH2
A1 ▸ M1 ▸ TC ▸ Lesson 15
Student Edition: Grade A1, Module 1, Topic C, Lesson 15
RECAP
Name
Date
15
2. 1 ≤
1 w+5 ≤ 8 2
1 w + 5 ≥ 1 and 1 w + 5 ≤ 8 2 2
Solving and Graphing Compound Inequalities In this lesson, we •
found solution sets of compound inequalities.
•
graphed solution sets of compound inequalities.
EUREKA MATH2
A1 ▸ M1 ▸ TC ▸ Lesson 15
Rewrite as a compound statement by using and.
1 w+5 ≥1 2 1 w ≥ −4 2
1 w+5 ≤ 8 2 1 w ≤ 3 2
w ≥ −8
Examples
w ≤ 6 The notation −8 ≤ w ≤ 6 means w ≥ −8 and w ≤ 6.
{w | −8 ≤ w ≤ 6}
For problems 1 and 2, find the solution set of the compound inequality. Write the solution set in set notation. Then graph the solution set on the number line. 1. 5x − 2 > 8 + 3x or 5 − 2x > 3 Solve each part of the compound inequality individually.
w 5x − 2 > 8 + 3 x 5 x > 10 + 3x 2 x > 10 x > 5
5 − 2x > 3 −2 x > −2
–10 –9 –8 –7 –6 –5 –4 –3 –2 –1
0
1
2
3
4
5
6
7
8
9 10
x <1
{x | x < 1 or x > 5} x
–10 –9 –8 –7 –6 –5 –4 –3 –2 –1
© Great Minds PBC
© Great Minds PBC
0
1
2
3
4
5
6
7
8
9 10
235
236
RECAP
© Great Minds PBC
301
EUREKA MATH2
A1 ▸ M1 ▸ TC ▸ Lesson 15
Sample Solutions Expect to see varied solution paths. Accept accurate responses, reasonable explanations, and equivalent answers for all student work.
EUREKA MATH2
A1 ▸ M1 ▸ TC ▸ Lesson 15
Student Edition: Grade A1, Module 1, Topic C, Lesson 15 Name
PRACTICE Date
15
7.
and
2. x > 4
or
x ≥ 1 and x < 1 2
1 ≤ x <1 2
For problems 1–4, choose the word and or or for the compound inequality so that the solution set is neither the empty set nor the set of all real numbers. 1. x > −2
The value of x is any number greater than or equal to
x < 12
4.
1 x > 0 3
or
2
1 x < 4 3
4
x 5
6
7
8
9
10
11
12
13
14
15
3
4
5
6
7
8
9
10
11
12
13
–2
–1
0
1
2
3
4
5
6
7
8
{y | 5 ≤ y < 10}
5. x > −6 and x < −1
−6 < x < −1
0
The value of x is any number greater than −6 and less than −1. 6. x ≤ 5 and x > 0
1
y 2
10. 2w > 8 or −2w < 4
0<x≤5
{w | w > −2}
The value of x is any number greater than 0 and less than or equal to 5.
–5
302
3
9. 5y + 2 ≥ 27 and 3y − 1 < 29
For problems 5–7, write each compound inequality as one statement without the word and. Then write a sentence describing all possible values of x.
© Great Minds PBC
x > 4 3
{x | x < 8 or x > 12}
x + 1 < −3
and ______
1 and less than 1. 2
For problems 8–10, find the solution set of each compound inequality. Write the solution set by using set notation. Then graph the solution set on the number line.
x < −1
8. x − 2 < 6 or 3. x + 1 > 3
EUREKA MATH2
A1 ▸ M1 ▸ TC ▸ Lesson 15
237
238
–4
P R ACT I C E
w –3
© Great Minds PBC
© Great Minds PBC
EUREKA MATH2 A1 ▸ M1 ▸ TC ▸ Lesson 15
EUREKA MATH2
A1 ▸ M1 ▸ TC ▸ Lesson 15
11. Consider the compound inequality 4p + 8 > 2p − 10 or
EUREKA MATH2
A1 ▸ M1 ▸ TC ▸ Lesson 15
13. Consider the compound inequality −1 < g − 6 < 1.
1 p − 3 < 2. 3
a. Rewrite the compound inequality as a compound statement.
a. Find the solution set. Write the solution set by using set notation. Then graph the solution set on the number line.
g − 6 > −1 and g − 6 < 1
ℝ p 0
1
2
3
4
5
6
7
8
9
10
11
12
b. Solve each inequality from part (a) for g.
13
g>5
b. If the inequalities are joined by and instead of or, what is the solution set? Graph the solution set on the number line.
g<7
4p + 8 > 2p – 10 and 1 p − 3 < 2 3
{p | p > −9 and p < 15} –10
–8
–6
–4
c. Write the solution set by using set notation.
{g | 5 < g < 7}
p –2
0
2
4
6
8
10
12
14
16 d. Graph the solution set on the number line.
12. Consider the compound inequality 7 − 3x < 16 and x + 12 < −8. a. Find the solution set. Write the solution set by using set notation. Then graph the solution set on the number line.
g –10 –9 –8 –7 –6 –5 –4 –3 –2 –1
{}
0
1
2
3
4
5
6
7
8
9 10
x 2
3
4
5
6
7
8
9
10
11
12
13
14
15
b. If the inequalities are joined by or instead of and, what is the solution set? Graph the solution set on the number line.
7 − 3x < 16 or x + 12 < −8 {x | x > −3 or x < −20}
x
–22 –21 –20 –19 –18 –17 –16 –15 –14 –13 –12 –11 –10 –9 –8 –7 –6 –5 –4 –3 –2 –1
© Great Minds PBC
© Great Minds PBC
P R ACT I C E
239
240
P R ACT I C E
© Great Minds PBC
303
EUREKA MATH2
A1 ▸ M1 ▸ TC ▸ Lesson 15
EUREKA MATH2
A1 ▸ M1 ▸ TC ▸ Lesson 15
14. Consider the compound inequality −1 <
EUREKA MATH2
A1 ▸ M1 ▸ TC ▸ Lesson 15
For problems 15–17, solve the compound inequality. Then graph the solution set on the number line.
h ≤ 3. 2
15. 0 ≤ 4x − 3 ≤ 11
a. Rewrite the compound inequality as a compound statement.
{x 43 ≤ x ≤ 27 }
h h > −1 and ≤ 3 2 2
x 0
b. Solve each inequality from part (a) for h.
h > −2
h≤6
1
17. −6 <
4
5
2
x +1
x 3
4
5
6
7
8
9
10
11
12
13
14
< 3
{x | −25 < x < 11}
d. Graph the solution set on the number line.
h
304
3
{x | 5 ≤ x ≤ 13}
{h | −2 < h ≤ 6}
© Great Minds PBC
2
16. −8 ≤ −2(x − 9) ≤ 8
c. Write the solution set by using set notation.
–10 –9 –8 –7 –6 –5 –4 –3 –2 –1
1
0
1
2
3
4
5
6
7
8
–27 –25 –23 –21 –19 –17 –15 –13 –11 –9 –7 –5 –3 –1
9 10
P R ACT I C E
241
4
242
P R ACT I C E
x 1
3
5
7
9 11 13 15
© Great Minds PBC
© Great Minds PBC
EUREKA MATH2 A1 ▸ M1 ▸ TC ▸ Lesson 15
EUREKA MATH2
A1 ▸ M1 ▸ TC ▸ Lesson 15
Remember For problems 18 and 19, solve the equation. 18.
2 (−6r + 9) = −12 3 9 2
19. −5
(10r + 2) = 15
−50
20. Without solving, use properties to explain why the equations 5x + 6 = 3 − 4x and 18 + 15x = 9 − 12x have the same solution set. By the multiplication property of equality, 3(5x + 6) = 3(3 − 4x), which means 15x + 18 = 9 − 12x. By the commutative property of addition, 15x + 18 is equivalent to 18 + 15x. So the equation 5x + 6 = 3x − 4 can be rewritten as 18 + 15x = 9 − 12x. Therefore, the equations must have the same solution set. 21. Emma surveyed her friends and recorded the number of states each friend has visited. The numbers of states visited are 3, 8, 7, 6, 5, 4, 4, 5, 6, 4, and 5. a. Find the mean number of states visited by Emma’s friends. Round to the nearest tenth. The mean number of states visited by Emma’s friends is about 5.2.
b. Find the median number of states visited by Emma’s friends. The median number of states visited by Emma’s friends is 5.
© Great Minds PBC
© Great Minds PBC
P R ACT I C E
243
305
306 This page may be reproduced for classroom use only. –6
–6
–10 –8
–10 –8
–4
–4
–2
–2
–2
0
E
0
C
0
2
2
2
4
4
4
6
6
6
8
8
8
10
–10 –8
10
10
x
x
–10 –8
–10 –8
–6
–6
–6
–4
–4
–4
–2
–2
–2
0
0
F
D
0
2
2
2
4
4
4
6
6
6
8
8
8
B
A
–4
1 + x ≥ −4 and 3x − 6 < −12
1 + x ≥ −4 and 3x − 6 > −12
–6
4
3
–10 –8
1 + x ≥ −4 or 3x − 6 < −12
1 + x ≥ −4 or 3x − 6 > −12
x
2
1
10
10
10
x
x
x
A1 ▸ M1 ▸ TC ▸ Lesson 15 ▸ They Look the Same Card Sort EUREKA MATH2
© Great Minds PBC
16
Teacher Edition: Grade A1, Module 1, Topic C, Lesson 16 LESSON 16
Solving Absolute Value Equations Write absolute value equations in one variable as compound statements and solve.
EUREKA MATH2
A1 ▸ M1 ▸ TC ▸ Lesson 16
Student Edition: Grade A1, Module 1, Topic C, Lesson 16 Name
Date
EXIT TICKET
16
Consider the equation |2x + 5| = 3.
a. Rewrite the equation as a compound statement.
2x + 5 = 3 or −(2x + 5) = 3
b. Use the compound statement to find the solution set of the original equation.
2x + 5 = 3 2 x = −2
Lesson at a Glance Through discussion, partner work, and physical movement on a large number line in the classroom, students recognize absolute value equations as compound statements connected with the word or. Students discuss solutions to absolute value equations to refine their thinking about the solution set. This work includes equations where the absolute value is isolated before students write a compound statement to find the solution. This lesson reminds students of the definition of absolute value and introduces the term absolute value equation.
Key Questions
x = −1
− ( 2 x + 5) = 3
• How can we predict the number of solutions an absolute value equation has before we solve it?
2 x + 5 = −3 2 x = −8 x = −4
• Why do we rewrite absolute value equations as compound statements?
{−4, −1} c. Use the original equation to verify the solutions found in part (b).
Substitute −4 for x. Because |2(−4) + 5| = |−3| = 3, we know that −4 is a solution to the equation.
Achievement Descriptor
Substitute −1 for x. Because |2(−1) + 5| = |3| = 3, we know that −1 is a solution to the equation.
A1.Mod1.AD6 Solve linear equations and inequalities in one variable.
d. Explain why the equation |2x + 5| = −3 has no solution.
(A.REI.B.3)
There is no solution to the equation because the absolute value of a number cannot be negative. It cannot be negative because absolute value represents the distance from 0 on a number line. Distance is never negative. Therefore, there is no value of x that produces a value of −3 on the left side of the equation, so it is impossible to create a true number sentence.
© Great Minds PBC
251
© Great Minds PBC
EUREKA MATH2 A1 ▸ M1 ▸ TC ▸ Lesson 16
Agenda
Materials
Fluency
Teacher
Launch 5 min
• Painter’s tape
Learn 30 min
• Index cards (4)
• Absolute Value Equations
Students
• More Than Just Absolute Value
• Personal whiteboard
Land 10 min
• Dry-erase marker • Personal whiteboard eraser
Lesson Preparation • Prepare a large number line on the classroom floor by using painter’s tape. (See figure 16.1.) Use floor tiles or a meter stick to create 21 equidistant tick marks. This number line will be used again in lesson 17. • Write a large 0 on an index card, and place it below the middle tick mark on the floor number line. • Write x, k, and y on the three other index cards (one letter per card).
© Great Minds PBC
309
EUREKA MATH2
A1 ▸ M1 ▸ TC ▸ Lesson 16
Fluency Evaluate Absolute Values Students evaluate numerical expressions containing absolute value symbols to prepare for solving absolute value equations. Directions: Evaluate each expression. 1. 2. 3. 4. 5. 6.
310
|−3|
3
|2(−3) + (−3)(−4)|
6
|9 − 14|
5
6 − |−10|
−4
−|−3 ⋅ 6| + |2 − 20|
0
|5(−5)| − 8
17
© Great Minds PBC
EUREKA MATH2 A1 ▸ M1 ▸ TC ▸ Lesson 16
Launch
5
Students recall the definition of absolute value and apply the definition in an activity. Direct students to the number line on the classroom floor. (See figure 16.1.) Identify 0 on the number line. Figure 16.1
0
UDL: Representation The life-sized number line used throughout the lesson presents the concept in another format by engaging students in a kinesthetic activity.
Ask a pair of students to go to the number line. Have one student stand at 4 and the other stand at −4. Place the index card labeled x near the right arrow of the number line.
0 These students represent the graph of the compound statement x = 4 or x = −4. Take a moment to analyze the graph, and then describe what you notice about the placement of your peers in relation to 0. Give students 1 minute of think time to examine the points on the graph where their peers are standing. Facilitate student conversation by asking the following questions. What do you notice about the placement of your peers in relation to 0? One is to the left of 0. The other is to the right of 0. They are both 4 away from 0. Help students notice that the points on the graph represent points that are a distance of 4 units from 0. What do we call a number’s distance from 0? We call it the absolute value.
© Great Minds PBC
311
EUREKA MATH2
A1 ▸ M1 ▸ TC ▸ Lesson 16
Even if students do not use precise language, encourage them to discuss their ideas. Have the standing students return to their seats.
Discuss that |x| = 4 means that the value of x is a distance of 4 units from 0. This means that either x is 4 or the opposite of x is 4. Write the equation as a compound statement.
x = 4 or −x = 4
Explain that the equation |x| = 4 can be rewritten as a compound statement because there are two values of x that are a distance of 4 units from 0. Therefore, there are two solutions to the equation, −4 and 4. Today, we will use our knowledge of absolute value and of writing and solving compound statements to write and solve absolute value equations.
Learn Absolute Value Equations Students write absolute value equations as compound statements connected with the word or and solve each part of the compound statement to find the original equation’s solution set. Direct students to problems 1–5. Give students 1 minute of silent time to think about the equations. Then have students discuss their thinking with a partner. For problems 1–5, write the equation as a compound statement, if applicable. Use the compound statement to find the solution set. Check your solutions in the original equation. Then graph the solution set on the given number line.
312
© Great Minds PBC
EUREKA MATH2 A1 ▸ M1 ▸ TC ▸ Lesson 16
1. |x| = 5
x = 5 or −x = 5 {−5, 5}
Substitute 5 for x. Because |5| = 5, we know that 5 is a solution to the equation.
Substitute −5 for x. Because |−5| = 5, we know that −5 is a solution to the equation.
–10 –9 –8 –7 –6 –5 –4 –3 –2 –1
0
1
2
3
4
5
6
7
x 8
9 10
2. |x| = −5
The equation has no solution. Distance is never negative.
{}
x –10 –9 –8 –7 –6 –5 –4 –3 –2 –1
0
1
2
3
4
5
6
7
8
9 10
3. |k − 2| = 7
k − 2 = 7 or − (k − 2) = 7 {−5, 9}
Substitute −5 for k. Because |−5 − 2| = |−7| = 7, we know that −5 is a solution to the equation.
Substitute 9 for k. Because |9 − 2| = |7| = 7, we know that 9 is a solution to the equation.
–10 –9 –8 –7 –6 –5 –4 –3 –2 –1
© Great Minds PBC
0
1
2
3
4
5
6
7
8
k 9 10
313
EUREKA MATH2
A1 ▸ M1 ▸ TC ▸ Lesson 16
4. |4y + 2| = 3
4y + 2 = 3 or −(4y + 2) = 3
{− , } 5
1
4
4
Substitute −
5 4
( )
5 for y. Because 4 − 5 + 2 = |−5 + 2| = |−3| = 3 , we know that − is a
solution to the equation.
4
4
()
Substitute 1 for y. Because 4 1 + 2 = | 1 + 2| = | 3| = 3, we know that 1 is a solution 4
to the equation.
4
4
y –10 –9 –8 –7 –6 –5 –4 –3 –2 –1
5. |2x − 3| = 0
0
1
2
3
4
5
6
7
8
9 10
2x − 3 = 0
{} 3 2
3
()
3
Substitute for x. Because 2 3 − 3 = | 3 − 3 | = 0 , we know that is a solution to 2 2 2 the equation.
x –10 –9 –8 –7 –6 –5 –4 –3 –2 –1
0
1
2
3
4
5
6
7
8
9 10
Guide students to problem 1, and facilitate a class discussion. Listen for responses that allow for a rich discussion of absolute value. What does the equation |x| = 5 mean?
The equation means the value of x is a distance of 5 units from 0.
314
© Great Minds PBC
EUREKA MATH2 A1 ▸ M1 ▸ TC ▸ Lesson 16
Ask a pair of students to go to the number line on the classroom floor and stand on the marks that represent the values of x that are 5 units from 0. What do these students represent in our equation? They represent the values of x that make the equation true. Look at where the students are standing. How could we describe the compound statement that is equivalent to | x| = 5? Either x is 5 or the opposite of x is 5. Ask students to write this compound statement symbolically and then find the solution set. Have the standing students return to their seats, and ask their classmates to share what they have written for problem 1. Ask students to check their solutions in the original equation. Review the solution set and its graph with the class. Guide students to problem 2. What does the equation |x| = −5 mean?
Teacher Note In preparation for the next lesson, encourage students to write the compound statement as x = 5 or −x = 5. Once students have mastered this conceptual foundation, writing x = 5 or x = −5 without first writing the compound statement x = 5 or −x = 5 is acceptable.
The equation means the value of x is a distance of −5 units from 0. Ask a pair of students to go to the number line on the classroom floor and stand on the marks that represent the values of x that would be −5 units from 0. Students should realize that, because distance is never negative, it is impossible for them to stand on the marks on the number line. What does this distance mean for the solution set to this equation? There is no solution, so the solution set is the empty set. Ensure the class records their answer and a brief explanation for problem 2. Guide students to problem 3. How is the equation for problem 3 different from the equations for problems 1 and 2? We are given the absolute value of (k − 2), not just k. What does the equation |k − 2| = 7 mean? The equation means that k − 2 represents a value that is a distance of 7 units from 0. © Great Minds PBC
315
EUREKA MATH2
A1 ▸ M1 ▸ TC ▸ Lesson 16
Have two students bring their whiteboards and markers and stand on the number line at the marks that represent a distance of 7 units from 0. What do these students represent in our equation? The students represent the possible values of the expression k − 2. Ask the students on the number line to write k − 2 on their whiteboards. Are the numbers the students are standing on solutions to the equation? No, the solutions to the equation are the numbers that can replace the variable and make the equation a true statement. Look at where the students are standing. How could we explain the compound statement that is equivalent to |k − 2| = 7? Either k − 2 is 7, or the opposite of k − 2 is 7. Have students write this compound statement symbolically and then find the solution set.
Differentiation: Support If students write k − 2 = −7 without conceptual understanding of −(k − 2) = 7, consider concentrating on the idea that the definition of absolute value says the expression and its opposite are the same distance from 0. • k − 2 equals 7. • The opposite of k − 2 equals 7. In addition, thinking about absolute value as a distance will help students avoid procedural misconceptions such as removing all of the negative signs.
Direct the students standing on the number line to revise their whiteboards so they have only k written on them. Where should our peers stand now that they are representing the values of k? They should stand at 9 and −5. Ask the students at the number line to move to these new locations. Direct students to check their solutions in the original equation. Review the solution set by using set notation and its graph with the class.
Language Support If students need additional support with the terminology, consider completing a Frayer model graphic organizer to add to the definition of absolute value from grade 6.
Continue this discussion pattern for problems 4 and 5. Have students read the description of an absolute value equation and discuss as a class, addressing any questions. Students should note that problems 1–5 are all examples of absolute value equations that were already written in the form |bx − c| = d.
An absolute value equation is an equation of the form, or equivalent to the form, |bx − c| = d, where b, c, and d are real numbers. The equation |bx − c| = d means bx − c is a distance of d units from 0 for some value or values of x and can be interpreted through the compound statement bx − c = d or −(bx − c) = d.
316
Teacher Note In Algebra I, absolute value equations are limited to those with linear expressions within the absolute value. Therefore, absolute value equations are described but not formally defined in this manner. In subsequent courses such as Calculus, students may encounter other types of absolute value equations.
© Great Minds PBC
EUREKA MATH2 A1 ▸ M1 ▸ TC ▸ Lesson 16
Facilitate a class discussion to summarize this section. Use the following statements to address some common student misconceptions: • It is possible for the solution to an absolute value equation to be a negative value. • It is not possible for an absolute value to be equal to a negative value. • An absolute value equation may have zero, one, or two solutions.
More Than Just Absolute Value Students isolate the absolute value to solve more complicated absolute value equations. Guide students to problem 6. Based on the description of an absolute value equation, is this an absolute value equation? Allow students to discuss in pairs and then share their thoughts as a class. If students do not mention the part of the description that says or equivalent to the form, guide them to this part. The equation is not written in the form |bx − c| = d as it is in the previous problems, but can it be written in that form? If so, how? Yes, it can, by subtracting 2 from both sides. Why do you think it is useful to isolate the absolute value first? By isolating the absolute value first, I can identify two locations on the number line and rewrite the equation as a compound statement to find the solutions. Direct students to write the compound statement for problem 6 and to find the solution set. Have students turn and talk to summarize their work for problems 6 and 7. Facilitate student conversation by asking the following question. How is the solution path for problems 6 and 7 similar to the solution paths for problems 1 through 5? How are the solution paths different? The solution paths are similar after we isolate the absolute value. The expression within the absolute value bars and its opposite expression are equal to the same number.
© Great Minds PBC
Language Support Students have likely isolated variables in earlier grades, but some may have difficulty understanding what it means to isolate the absolute value. Consider supporting these students by emphasizing that solving for the value of a variable in an algebraic equation is equivalent to isolating that variable. Therefore, isolating the absolute value means using operations and properties so that the absolute value is alone on one side of the equation.
Differentiation: Support If students isolate the absolute value to get |bx − c| = d and they automatically conclude the solution set of the equation is {−d, d}, guide them to see the absolute value as a single object that is composed of different parts. First, physically cover the expression within the absolute value bars and ask students to analyze what the absolute value means. Then uncover the expression and ask students to write the compound statement with the expression inside the absolute value bars.
317
EUREKA MATH2
A1 ▸ M1 ▸ TC ▸ Lesson 16
The solution paths are different because we had to use the properties of equality to isolate the absolute values in problems 6 and 7. The absolute values were already isolated in problems 1 through 5. Have students continue working with their partners on problems 8–10. Display the answers to problems 8–10. Then discuss solution pathways and errors. Students may be tempted to use the distributive property as they would with equations that have parentheses. Emphasize to students that, just like with absolute value problems involving addition and subtraction, it is best to isolate the absolute value first and then think about what that expression means in terms of distance from 0. For problems 6–10, solve the equation. Write the solution set by using set notation. 6. |b − 5| + 2 = 10
or
When students apply their previous understanding of solution sets and absolute values to absolute value equations, they are making use of structure (MP7). Ask the following questions to promote MP7: • How can what you know about absolute values help you find the solution set of this absolute value equation? • What is another way you could write this equation that would help you find the solution set?
| b − 5| + 2 = 10 | b − 5| = 8
b−5 = 8 b = 13
Promoting the Standards for Mathematical Practice
− (b − 5) = 8 b − 5 = −8 b = −3
{−3, 13}
7. 14 = 3 + |m + 6|
14 = 3 + | m + 6| 11 = | m + 6|
11 = m + 6 5 = m
or
11 = − (m + 6) −11 = m + 6 −17 = m
{−17, 5}
318
© Great Minds PBC
EUREKA MATH2 A1 ▸ M1 ▸ TC ▸ Lesson 16
8. 36 = 4|2 − h|
36 = 4| 2 − h| 9 = | 2 − h| 9 = 2−h 7 = −h −7 = h
or
9 = − (2 − h) −9 = 2 − h −11 = − h 11 = h
{−7, 11} 9. −2|6x − 8| = −40
−2|6 x − 8| = −40 |6 x − 8| = 20 6 x − 8 = 20 6 x = 28 x =
14 3
or
− (6 x − 8) = 20 6 x − 8 = −20 6 x = −12 x = −2
{−2 , } 14 3
© Great Minds PBC
319
EUREKA MATH2
A1 ▸ M1 ▸ TC ▸ Lesson 16
10. 8 + 2|3w + 8| = 4
8 + 2| 3 w + 8| = 4 2|3w + 8| = −4 |3w + 8| = −2 The equation has no solution because distance is never negative.
{}
Land Debrief 5 min Objective: Write absolute value equations in one variable as compound statements and solve. Facilitate a brief discussion by using the following prompts. Compare and contrast solving linear equations and solving absolute value equations. We can use the properties of equality for solving both linear equations and absolute value equations. However, absolute value equations must have the absolute value isolated first and then be written as a compound statement to solve for the variable. Absolute value equations can have zero, one, or two distinct solutions. Linear equations can have zero, one, or infinitely many solutions. How can we predict the number of solutions an absolute value equation has before solving it? An absolute value equation has two distinct solutions if the absolute value is equal to a positive number. It has one solution if the absolute value is equal to 0. It has no solutions if the absolute value is equal to a negative number.
320
© Great Minds PBC
EUREKA MATH2 A1 ▸ M1 ▸ TC ▸ Lesson 16
Why do we rewrite absolute value equations as compound statements?
When there are two solutions to an absolute value equation, they can be represented as distances from 0 on a number line. For example, in the equation |x − 1| = 7, the value of x − 1 is 7 units from 0. This means that one distance is x − 1, and the other distance is −(x − 1). These two distances are best analyzed through a compound statement.
Exit Ticket 5 min Provide up to 5 minutes for students to complete the Exit Ticket. It is possible to gather formative data even if some students do not complete every problem.
© Great Minds PBC
Teacher Note Assign the Practice problems for completion outside of class or use them in class if time remains after the lesson. Refer students to the Recap for support.
321
EUREKA MATH2
A1 ▸ M1 ▸ TC ▸ Lesson 16
Recap
EUREKA MATH2
A1 ▸ M1 ▸ TC ▸ Lesson 16
Student Edition: Grade A1, Module 1, Topic C, Lesson 16 Name
RECAP Date
EUREKA MATH2
A1 ▸ M1 ▸ TC ▸ Lesson 16
16
b. Solve each linear equation for z.
z−6 = 2
Solving Absolute Value Equations In this lesson, we •
wrote absolute value equations as compound statements.
•
solved absolute value equations.
•
graphed solution sets of absolute value equations on a number line.
An absolute value equation is an equation of the form, or equivalent to the form, |bx − c| = d, where b, c,
{4, 8}
|bx − c| = d means bx − c is a distance and d are real numbers. The equation
of d units from 0 for some value or values of x and can be interpreted through the
d. Graph the solution set on the number line.
−(bx − c) = d.
z
For problems 1 and 2, write the equation as a compound statement, if applicable. Then write the solution set in set notation. 1. |x| = 7
x = 7 or −x = 7
–10 –9 –8 –7 –6 –5 –4 –3 –2 –1
2. |m| = −9
{}
{−7, 7} The compound statement means that
x is 7 or the opposite of x is 7. If the opposite of x is 7, then x is −7.
z − 6 = −2 z = 4
c. Write the solution set in set notation.
compound statement bx − c = d or
Examples
− ( z − 6) = 2
z = 8
Terminology
Absolute value represents distance from 0, and distance is never
0
1
2
3
4
5
6
7
8
9 10
4. Solve the absolute value equation 4|6 − 4x| + 9 = 81. Write the solution set in set notation.
4 |6 − 4 x | + 9 = 81
negative. This equation is not true
4 |6 − 4 x | = 72
for any value of m.
|6 − 4 x | = 18
3. Consider the absolute value equation |z − 6| = 2.
6 − 4 x = 18 −4 x = 12
a. Rewrite the absolute value equation as a compound statement.
x = −3
z − 6 = 2 or −(z − 6) = 2
or
Apply properties of equality to isolate the absolute value first.
− (6 − 4 x ) = 18
6 − 4 x = −18 − 4 x = −24 x = 6
{−3, 6}
© Great Minds PBC
322
253
254
RECAP
© Great Minds PBC
© Great Minds PBC
EUREKA MATH2 A1 ▸ M1 ▸ TC ▸ Lesson 16
Sample Solutions Expect to see varied solution paths. Accept accurate responses, reasonable explanations, and equivalent answers for all student work.
EUREKA MATH2
A1 ▸ M1 ▸ TC ▸ Lesson 16
Student Edition: Grade A1, Module 1, Topic C, Lesson 16
PRACTICE
Name
Date
16
EUREKA MATH2
A1 ▸ M1 ▸ TC ▸ Lesson 16
5. Consider the absolute value equation |x + 7| = 3.
a. Rewrite the absolute value equation as a compound statement.
x + 7 = 3 or −(x + 7) = 3
For problems 1–4, write the equation as a compound statement, if applicable. Then graph the solution set of each equation on the number line. 1. |p| = 10
b. Solve the compound statement for x. Write the solution set by using set notation.
p = 10 or −p = 10
{−10, −4}
p –10 –9 –8 –7 –6 –5 –4 –3 –2 –1
2. |x| = 0
0
1
2
3
4
5
6
7
8
9 10 c. Graph the solution set on the given number line.
x
x=0
x –10 –9 –8 –7 –6 –5 –4 –3 –2 –1
3. |t| = 1.5
0
1
2
3
4
5
6
7
8
(
–4
–3
–2
–1
0
1
2
3
4
2
3
4
5
6
7
8
9 10
–10 –9 –8 –7 –6 –5 –4 –3 –2 –1
0
1
2
3
4
5
6
7
8
)=1
b. Solve the compound statement for d. Write the solution set by using set notation.
5
{6, 10}
c. Graph the solution set on the given number line.
y
© Great Minds PBC
= 1.
d d − 4 = 1 or − − 4 2 2
Distance is never negative, so this equation has no solution.
© Great Minds PBC
d −4 2
1
a. Rewrite the absolute value equation as a compound statement.
t 4. |y| = −3
0
6. Consider the absolute value equation
9 10
t = 1.5 or −t = 1.5 –5
–10 –9 –8 –7 –6 –5 –4 –3 –2 –1
d
9 10
–10 –9 –8 –7 –6 –5 –4 –3 –2 –1
255
256
P R ACT I C E
0
1
2
3
4
5
6
7
8
9 10
© Great Minds PBC
323
EUREKA MATH2
A1 ▸ M1 ▸ TC ▸ Lesson 16
EUREKA MATH2
A1 ▸ M1 ▸ TC ▸ Lesson 16
EUREKA MATH2
A1 ▸ M1 ▸ TC ▸ Lesson 16
12. Why does an absolute value equation need to be rewritten as a compound statement?
For problems 7–11, solve the absolute value equation. Write the solution set by using set notation. 7. |x + 2| − 4 = 6
An absolute value equation needs to be rewritten as a compound statement because absolute value represents the distance from 0 on a number line. The two statements in the compound statement represent the two values that are the same distance from 0.
{−12, 8}
13. Why is there no solution to an absolute value equation when the absolute value is equal to a negative number? Absolute value represents a number’s distance from 0 on the number line. Because distance is always nonnegative, an absolute value cannot equal a negative number. So there is no solution.
8. 2|2p − 11| = 66
{−11, 22}
Remember For problems 14 and 15, solve the equation. 14. 0 = −4(−6t + 3)
9. 8 + |5x − 2| − 2 = 6
15. 2.5(8 − 2t) = 2
3.6
1 2
{} 2 5
16. The formula for the volume V of a right cone is V =
1 2 πr h, where r represents the radius 3
of the base of the cone, and h represents the height of the cone. Rearrange the formula to write the height h in terms of V and r. 10. −2|2x + 25| = 14
V = 1 πr 2 h 3
{}
3V = πr 2 h 3V
πr 2
= h
11. 8|3 − 3x| − 5 = 91
{−3, 5}
© Great Minds PBC
324
P R ACT I C E
257
258
P R ACT I C E
© Great Minds PBC
© Great Minds PBC
EUREKA MATH2 A1 ▸ M1 ▸ TC ▸ Lesson 16
EUREKA MATH2
A1 ▸ M1 ▸ TC ▸ Lesson 16
17. A lifeguard counted and recorded the number of children in the splash pool at each half hour. The data are listed in ascending order.
0
0
0
1
1
1
1
2
3
3
3
4
4
5
2
2
2
Make a box plot of the data. Splash Pool Usage
0
1
2
3
4
5
6
Number of Children
© Great Minds PBC
© Great Minds PBC
P R ACT I C E
259
325
17
Teacher Edition: Grade A1, Module 1, Topic C, Lesson 17 LESSON 17
Solving Absolute Value Inequalities Write absolute value inequalities in one variable as compound statements joined by and or or. Solve absolute value inequalities and graph the solution set on a number line.
EUREKA MATH2
A1 ▸ M1 ▸ TC ▸ Lesson 17
Student Edition: Grade A1, Module 1, Topic C, Lesson 17
EXIT TICKET
Name
Date
17
Consider the inequality |2x + 5| ≤ 3.
a. Rewrite the inequality as a compound statement.
2x + 5 ≤ 3 and −(2x + 5) ≤ 3
b. Find the solution set.
2x + 5 ≤ 3 2 x ≤ −2 x ≤ −1
• How do the solution sets of absolute value equations differ from the solution sets of absolute value inequalities?
2 x + 5 ≥ −3 2 x ≥ −8 x ≥ −4
Achievement Descriptor
c. Graph the solution set on a number line.
x –10 –9 –8 –7 –6 –5 –4 –3 –2 –1
© Great Minds PBC
0
1
Students work with partners to match equations and inequalities to solution sets. Through continued use of the classroom floor number line, this lesson guides students to summarize when an absolute value inequality corresponds to a compound statement with the word and versus the word or. Partners solve absolute value inequalities by writing and solving compound statements. Students use absolute value inequalities to represent situations such as those involving measurement. The Always, Sometimes, Never routine synthesizes learning, encouraging partners to include examples or counterexamples to support their claims. This lesson introduces the term absolute value inequality.
Key Question
− ( 2 x + 5) ≤ 3
{x | −4 ≤ x ≤ −1}
Lesson at a Glance
2
3
4
5
6
7
8
9 10
A1.Mod1.AD6 Solve linear equations and inequalities in one variable. (A.REI.B.3)
267
© Great Minds PBC
EUREKA MATH2 A1 ▸ M1 ▸ TC ▸ Lesson 17
Agenda
Materials
Fluency
Teacher
Launch 5 min
• Painter’s tape
Learn 30 min
• Index cards (4)
• Between or Not Between
Students
• More Than Just Absolute Value
• Personal whiteboard
• Applying Absolute Value
• Dry-erase marker
Land 10 min
• Personal whiteboard eraser
Lesson Preparation • Prepare a large number line, used in lesson 16, on the classroom floor by using painter’s tape (see figure 16.1). Use floor tiles or a meter stick to create 21 equidistant tick marks. • Write a large 0 on an index card, and place it below the middle tick mark of the floor number line. • Write x, k, and a on the three other index cards (one letter per card).
© Great Minds PBC
327
EUREKA MATH2
A1 ▸ M1 ▸ TC ▸ Lesson 17
Fluency
Teacher Note
Graph Compound Inequalities
Students may use the Number Lines removable.
Students graph compound inequalities to prepare for solving absolute value inequalities and graphing the solution sets on a number line. Directions: Graph each compound inequality on a number line.
1.
x < −5 or x > 6
2.
x ≥ −1 and x < 4
3.
x > 8 or x ≤ −3
4.
−9 < x < −2
5.
x ≥ 0 or x < 3
328
x –10 –8 –6 –4 –2
0
2
4
6
8 10 x
–10 –8 –6 –4 –2
0
2
4
6
8 10 x
–10 –8 –6 –4 –2
0
2
4
6
8 10 x
–10 –8 –6 –4 –2
0
2
4
6
8 10 x
–10 –8 –6 –4 –2
0
2
4
6
8 10
© Great Minds PBC
EUREKA MATH2 A1 ▸ M1 ▸ TC ▸ Lesson 17
Launch
5
Students use the structure of equations and inequalities to match the equations and inequalities to the graphs of their solution sets. Direct students to the matching problem set. Ask students to work with a partner to match the equation or inequality in the left table with the graph of its solution set in the right table. Then have students discuss and record how the structure of the equation or inequality helped them complete the matching activity. Circulate as students work, and listen for different strategies.
© Great Minds PBC
Teacher Note The matching problem set includes problems with absolute value inequalities. Students may have difficulty with those problems, but they should be able to use the process of elimination to assist them with correctly matching those statements to the graphs of their solution sets.
329
EUREKA MATH2
A1 ▸ M1 ▸ TC ▸ Lesson 17
Write the letter of the equation or inequality next to the graph of its solution set. Statement A. |x| = 7
B. x > 7
C. |x| < 7
D. x = 7
E. |x| > 7
Language Support
Graph
x –10 –8 –6 –4 –2
0
2
4
6
8 10 x
–10 –8 –6 –4 –2
0
2
4
6
8 10 x
–10 –8 –6 –4 –2
0
2
4
6
8 10 x
–10 –8 –6 –4 –2
0
2
4
6
8 10 x
–10 –8 –6 –4 –2
0
2
4
6
8 10
C
The definition and language support ideas for the term absolute value can be found in lesson 16.
B
D
A
E
Sample: I knew that x = 7 would be a graph with a single point at 7 and that |x| = 7 would have two points at −7 and 7. I knew that x > 7 would have an open circle at 7 and then the values to the right would be shaded. For |x| < 7 and |x| > 7, I tried a test value of 0. Because |0| < 7 is true, I knew that the graph for |x| < 7 had to contain 0. Explain how you matched each equation or inequality to the graph of its solution set.
Invite pairs of students to share the different strategies they used.
Today, we will use our knowledge of absolute value and of writing and solving inequalities to write and solve absolute value inequalities. 330
© Great Minds PBC
EUREKA MATH2 A1 ▸ M1 ▸ TC ▸ Lesson 17
Learn Between or Not Between Students write absolute value inequalities as compound statements by using and or or.
Introduce problem 1, and display the inequality |x| < 4. Help students conclude that this means the value of x is a distance of less than 4 units from 0. Direct students’ attention to the number line on the classroom floor. Identify 0 on the number line. Ask a pair of students to go to the number line and stand on the marks that represent the values of x that are exactly 4 units from 0. Ask students the following questions to discuss the placement of the students on the number line in relation to the inequality. What do these students represent in relation to our inequality? They represent the endpoints for the graph of the solution set. Are 4 or −4 solutions to the inequality? No, this is a strict inequality, so neither 4 nor −4 are part of the solution set.
Language Support Asking students whether the inequality they are describing is a strict inequality will help students begin to use the terminology in their own discussions when describing solution sets. It is not required that students master the use of this terminology.
Ask another student to stand at a point on the number line that is less than 4 units from 0. Ask five more students to do the same, and then ask students what they can conclude about all the points in the solution set of this inequality. Tell students to write a compound statement for the absolute value inequality on their whiteboards, along with the graph of the solution set. Have them compare their answers with a partner. Then display the compound statement and its graph so students can verify the accuracy of their work. Ask all standing students to be seated, and have them record the problem 1 work. Students learned in lesson 16 that the compound statement includes two inequalities, x < 4 and −x < 4. Guide students through solving the second inequality for x, which results in x > −4. Should the compound statement have and or or between the two inequalities? The solution set consists of every number between 4 and −4. Because no other values outside that range are solutions, this means the compound statement uses and. © Great Minds PBC
331
EUREKA MATH2
A1 ▸ M1 ▸ TC ▸ Lesson 17
Review how to write the solution set by using set notation with students. For problems 1–6, write the inequality as a compound statement, if applicable. Find the solution set and write it by using set notation. Then graph the solution set on the number line. 1. |x| < 4
x < 4 and −x < 4 {x | −4 < x < 4}
–10 –9 –8 –7 –6 –5 –4 –3 –2 –1
x 0
1
2
3
4
5
6
7
8
9 10
Direct students to problem 2, |x| > 4. Have students discuss with a partner and predict what the solution set and graph will look like for this inequality. Ensure students conclude that the inequality |x| > 4 means the value of x is a distance of more than 4 units from 0. Repeat the sequence of steps used in problem 1.
Should the compound statement have and or or between the two inequalities? The solution set consists of numbers greater than 4 or numbers less than −4. Because x can’t satisfy both inequalities at the same time, the compound statement uses or. Give students 1 minute to compare problems 1 and 2 with a partner. 2. |x| > 4
x > 4 or −x > 4
{x | x < −4 or x > 4} –10 –9 –8 –7 –6 –5 –4 –3 –2 –1
332
x 0
1
2
3
4
5
6
7
8
9 10
© Great Minds PBC
EUREKA MATH2 A1 ▸ M1 ▸ TC ▸ Lesson 17
Have students solve problems 3 and 4 with a partner. Circulate as students work, and listen for students experiencing challenges, such as inaccurately identifying endpoints and having difficulty writing a compound statement. 3. |k + 2| ≤ 7
k + 2 ≤ 7 and −(k + 2) ≤ 7 {k | −9 ≤ k ≤ 5}
k
–10 –9 –8 –7 –6 –5 –4 –3 –2 –1
0
1
2
3
4
5
6
7
8
9 10
4. |a − 5| > 3
a − 5 > 3 or −(a − 5) > 3 {a | a < 2 or a > 8} 0
a 2
4
6
8
10
Debrief as a class. If necessary, use the number line on the floor as was done in lesson 16 to solidify understanding. For example, for problem 3, invite two students to stand at −9 and 5 and ask what these values represent, eliciting the answer that they are the smallest and largest possible values of k. Then ask students to stand at other values that are in the solution set. What predictions can you make about the use of and or or with absolute value inequalities? Absolute value represents distance from 0. So when an inequality states that the absolute value, or distance from 0, is less than a positive number, solutions on the number line are closer to 0 than the endpoints. The graph of the solution set falls between the endpoints. For example, all solutions to |x| < 4 are less than 4 and greater than −4.
© Great Minds PBC
Promoting the Standards for Mathematical Practice When students identify whether compound statements should include and or or when rewriting as absolute value inequalities, they are looking for regularity in repeated reasoning (MP8). Ask the following questions to promote MP8: • What is the same about compound statements for absolute value inequalities that use this inequality sign? • What patterns did you notice when you solved these absolute value inequalities?
333
EUREKA MATH2
A1 ▸ M1 ▸ TC ▸ Lesson 17
When an inequality states that the absolute value is greater than a positive number, solutions on the number line are farther from 0 than the endpoints. The graph of the solution set includes values to the left of the smaller endpoint and to the right of the larger one. For example, all solutions to |x| > 4 are values greater than 4 or less than −4.
Teacher Note
Have students read the description of an absolute value inequality and discuss as a class, addressing any questions. In particular, note the portion of the description that says any inequality symbol is used to ensure that students understand that this means the inequality could be >, <, ≥, or ≤. Have students complete the statements after the absolute value inequality description and then verify the correct responses. Ask students to work on problems 5 and 6 with a partner. Display the correct answers and address any questions.
In Algebra I, absolute value inequalities are limited to those with linear expressions within the absolute value. Thus, absolute value inequalities are described, but not formally defined, in this manner. In subsequent courses, such as Calculus, students may encounter other types of absolute value inequalities.
An absolute value inequality is an inequality of the form, or equivalent to the form, |bx − c| > d where b, c, and d are real numbers and any inequality symbol is used.
Complete each statement with either more or less based on the absolute value inequality. The inequality |bx − c| > d means that the value of the expression bx − c is than d units from 0. The inequality |bx − c| < d means that the value of the expression bx − c is than d units from 0.
more less
5. |6y − 2| ≥ 5
6y − 2 ≥ 5 or −(6y − 2) ≥ 5
{y y ≤ − or y ≥ } 1 2
7 6
y –10 –9 –8 –7 –6 –5 –4 –3 –2 –1
334
0
1
2
3
4
5
6
7
8
9 10
© Great Minds PBC
EUREKA MATH2 A1 ▸ M1 ▸ TC ▸ Lesson 17
6. |10x + 1| < 11
10x + 1 < 11 and −(10x + 1) < 11
{x − < x < 1} 6 5
x –2
–1
0
1
2
Debrief by having students compare and contrast solving absolute value equations with solving absolute value inequalities. The following are some possible points: • Both are solved by rewriting as a compound statement. • When solving an absolute value equation, the compound statement is always joined by or. When solving an absolute value inequality, whether the compound statement is joined by and or or depends on the direction of the inequality sign.
UDL: Representation Consider using a graphic organizer, such as a Venn diagram, to compare solving absolute value equations with solving absolute value inequalities.
• An absolute value equation can have zero, one, or two solutions, while an absolute value inequality can have infinitely many solutions. Use this last point to transition to the next section. Do you think an absolute value inequality could have no solution? Only one solution? A solution of all real numbers? Give students 1 minute to discuss with a partner, and then direct them to work on problems 7–10. Tell the class before they start that instead of solving algebraically, they should use what they know about absolute value to find the solutions. For problems 7–10, find the solution set. Write a brief justification for your answer. 7. |m| > −2
ℝ
Distance is never negative, so the value of |m| will always be greater than or equal to 0. Therefore, |m| will also always be greater than −2.
© Great Minds PBC
335
EUREKA MATH2
A1 ▸ M1 ▸ TC ▸ Lesson 17
8. |m| < −2
{}
Distance is never negative, so there is no value for m that will make |m| less than −2.
9. |g − 4| ≥ 0
ℝ
Distance is never negative, so the value of |g − 4| will always be greater than or equal to 0 for any value of g.
10. |g − 4| ≤ 0
{4}
Distance is never negative, so the value of |g − 4| can never be less than 0. The value of |g − 4| can equal 0 when g = 4, so that is the only solution to the inequality.
After students have completed these problems, review the answers as a class and discuss any misconceptions or errors. What does the inequality |m| > −2 mean? The inequality means the value of m is a distance of more than −2 units from 0. What values of m will make the inequality true? Any value of m will make the inequality true because the absolute value will always be greater than or equal to 0. What does the inequality |m| < −2 mean? The inequality means the value of m is a distance of less than −2 from 0. What values of m will make the inequality true? No value of m will make the statement true because the absolute value will never be negative, so it can never be less than a negative number. If time permits, have students explore how the solution sets to problems 9 and 10 change if the inequality symbols are changed to make each problem a strict inequality.
336
Teacher Note Some students may have difficulty with the idea that |m| > −2 has a solution set of all real numbers, when previously an absolute value equation with a negative number had no solution. Clarify for students that it does not matter that |m| will never take on a value between 0 and −2. Because |m| will always have a nonnegative value, it will always be greater than −2. This could lead students to the generalization that, for a negative number b, |x| > b will have a solution set of all real numbers.
© Great Minds PBC
EUREKA MATH2 A1 ▸ M1 ▸ TC ▸ Lesson 17
More Than Just Absolute Value Students solve absolute value inequalities by first isolating the absolute value. Direct students to problem 11. Based on the description of an absolute value inequality that we read earlier, is this an absolute value inequality? Why? Yes. It can be written in the form described. What should the first step be in solving the inequality? We should add 8 to both sides to isolate the absolute value. Have the students work problems 11 and 12 with their partners. Display the answers and discuss as a class. For problems 11 and 12, solve the inequality. Write the solution set by using set notation.
11. |c + 4| − 8 < 20
|c + 4 | − 8 < 20 |c + 4 | < 28 c + 4 < 28 and −(c + 4) < 28 c + 4 < 28 c < 24
{c | −32 < c < 24}
© Great Minds PBC
− (c + 4) < 28 c + 4 > − 28 c > − 32
337
EUREKA MATH2
A1 ▸ M1 ▸ TC ▸ Lesson 17
12. −3 | w + 12| + 10 ≤ −5
−3| w + 12 | + 10 ≤ −5 −3| w + 12 | ≤ −15 | w + 12 | ≥ 5
w + 12 ≥ 5 or −(w + 12) ≥ 5
w + 12 ≥ 5
w ≥ −7
{w | w ≤ −17 or w ≥ −7}
−(w + 12) ≥ 5
w + 12 ≤ −5
w ≤ −17
Applying Absolute Value Students write and solve absolute value inequalities based on real-world scenarios involving restrictions or error in measurement. Consider asking students whether they are aware of the terms margin of error or ranges of acceptable measurement. If they are, allow a few students to share what these terms mean with the class. Then read problem 13 aloud to the class. If students are not familiar with the terms, direct them to read problem 13, and then summarize the idea.
338
© Great Minds PBC
EUREKA MATH2 A1 ▸ M1 ▸ TC ▸ Lesson 17
Guide students through writing an absolute value inequality for the given scenario by using the following prompts. What is the target weight for a bag of flour? The target weight is 5 pounds. How much error is allowed? In other words, how far above or below the target weight of 5 pounds can we be? We can be 0.04 pounds above or below the target weight. If we let w represent the weight of a bag of flour in pounds, what does w − 5 represent? The difference between the actual weight of the bag and the target weight What does |w − 5| represent? The distance of w − 5 from 0 Turn to a partner, and discuss the process for finding the inequality that represents this problem. Circulate as students talk, and listen for productive discussion about defining a variable for the unknown and writing an absolute value inequality for the given scenario. Strategically select pairs to share their absolute value inequalities and their thinking about defining variables and writing an inequality to represent the situation. Prompt students to explain the placement of the target weight and the acceptable distance from the target weight in their absolute value inequalities. Work as a class to write a solution set by using set notation to represent the range of acceptable weights for a bag of flour. Direct students to complete problem 14 with their partners. Review the correct answer, and let student understanding dictate the amount of discussion needed.
© Great Minds PBC
339
A1 ▸ M1 ▸ TC ▸ Lesson 17
EUREKA MATH2
13. A machine weighs bags of flour. The weight of a filled bag of flour should be no more than 0.04 pounds from the desired weight of 5 pounds. Write and solve an absolute value inequality to find the range of acceptable weights. Let w represent the weight of each bag in pounds.
|w − 5| ≤ 0.04
w − 5 ≤ 0.04 and −(w − 5) ≤ 0.04 w ≤ 5.04 and w ≥ 4.96 {w | 4.96 ≤ w ≤ 5.04}
The acceptable weight of a bag of flour ranges from 4.96 pounds to 5.04 pounds. 14. A factory is designing a sensor for an aircraft engine. Regulations allow for the height to be no more than 0.001 inches from the desired height of 6 inches. Write and solve an absolute value inequality to determine the range of acceptable heights for the sensor. Write the solution set by using set notation. Let h represent the height of the sensor in inches.
|h − 6| ≤ 0.001
h − 6 ≤ 0.001 and −(h − 6) ≤ 0.001 h ≤ 6.001 and h ≥ 5.999 {h | 5.999 ≤ h ≤ 6.001}
The acceptable height for a sensor ranges from 5.999 inches to 6.001 inches.
340
© Great Minds PBC
EUREKA MATH2 A1 ▸ M1 ▸ TC ▸ Lesson 17
Land Debrief 5 min Objectives: Write absolute value inequalities in one variable as compound statements joined by and or or. Solve absolute value inequalities and graph the solution set on a number line. Choose three of the statements provided below to engage students in the Always, Sometimes, Never routine. For each statement, give students 30 seconds of thinking time followed by another 30 seconds to share their thinking with a partner. Ask pairs to share whether they think the statement is always, sometimes, or never true, encouraging examples or counterexamples to support their claim. Come to a consensus that the statement is [always/sometimes/never] true [because…]. Repeat the routine for each statement selected. • Absolute value inequalities have infinitely many solutions.
Sometimes, because there are times when there will be no solution or a finite number of solutions. For example, |x| > −5 has infinitely many solutions, but |x| < −5 has no solutions. Sometimes, because inequalities such as |x| ≤ 0 have one solution, while other inequalities such as |x| > 4 have more than one solution.
• Absolute value inequalities have one solution.
• Absolute values are less than a negative number.
Never, because distance is never negative, so absolute value will always be greater than a negative number. • Absolute values are greater than a negative number. Always, because distance is always greater than a negative number. • Absolute value equations have two solutions.
Sometimes, because there are equations that can have one solution, no solution, or two solutions. For example, |x| = 2 has two solutions, while |x| = 0 has one solution and |x| = −7 has no solution.
© Great Minds PBC
341
EUREKA MATH2
A1 ▸ M1 ▸ TC ▸ Lesson 17
Exit Ticket 5 min Provide up to 5 minutes for students to complete the Exit Ticket. It is possible to gather formative data even if some students do not complete every problem.
342
Teacher Note Assign the Practice problems for completion outside of class or use them in class if time remains after the lesson. Refer students to the Recap for support.
© Great Minds PBC
EUREKA MATH2 A1 ▸ M1 ▸ TC ▸ Lesson 17
Recap
EUREKA MATH2
A1 ▸ M1 ▸ TC ▸ Lesson 17
Student Edition: Grade A1, Module 1, Topic C, Lesson 17
RECAP
Name
Date
17
EUREKA MATH2
A1 ▸ M1 ▸ TC ▸ Lesson 17
2. Consider the absolute value inequality 2|6a − 10| ≥ 4. a. Isolate the absolute value.
Solving Absolute Value Inequalities
2 |6 a − 10 | ≥ 4
Terminology
In this lesson, we
|6 a − 10 | ≥ 2
An absolute value inequality is an inequality of the form, or equivalent to the form,
•
wrote absolute value inequalities as compound inequalities.
•
solved absolute value inequalities.
•
graphed solution sets of absolute value inequalities on a number line.
|bx − c| > d where b, c, and
b. Rewrite the absolute value inequality as a compound inequality.
d are real numbers and any
bx − c is more than d units from 0. The inequality |bx − c| < d means bx − c is less than d units from 0.
Examples
1. Consider the absolute value inequality |4r + 3| < 7.
If 6a − 10 and its opposite are at least 2 units from 0, then the
6a − 10 ≥ 2 or −(6a − 10) ≥ 2
inequality symbol is used. The inequality |bx − c| > d means
value of 6a − 10 must be less than or equal to −2 or greater than or equal to 2. Use or.
c. Solve each inequality for a.
a. Rewrite the absolute value inequality as a compound inequality.
4r + 3 < 7 and −(4r + 3) < 7
If 4r + 3 and its opposite are less than 7 units from 0,
− (6 a − 10 ) ≥ 2
6 a − 10 ≥ 2 6 a ≥ 12
then the value of 4r + 3 must be between −7 and 7.
6 a − 10 ≤ −2 6a ≤ 8
a ≥ 2
Use and.
b. Solve each inequality for r.
a ≤ d. Write the solution set by using set notation.
− ( 4r + 3 ) < 7
4r + 3 < 7 4r < 4 r <1
4r + 3 > − 7 4r > −10 r > −
{a a ≤ 43 or a ≥ 2}
5 2
c. Write the solution set by using set notation.
{r
4 3
e. Graph the solution set on the number line.
}
5 − < r <1 2
a –4
d. Graph the solution set on the number line.
–3
–2
–1
0
1
2
3
4
r –5
© Great Minds PBC
© Great Minds PBC
–4
–3
–2
–1
0
1
2
3
4
5 269
270
RECAP
© Great Minds PBC
343
EUREKA MATH2
A1 ▸ M1 ▸ TC ▸ Lesson 17
Sample Solutions Expect to see varied solution paths. Accept accurate responses, reasonable explanations, and equivalent answers for all student work.
EUREKA MATH2
A1 ▸ M1 ▸ TC ▸ Lesson 17
Student Edition: Grade A1, Module 1, Topic C, Lesson 17
PRACTICE
Name
Date
17
1. Consider the inequality |x + 1| < 2.
For problems 3–9, find the solution set of the inequality. Write the solution set by using set notation. Then graph the solution set on the given number line. 3. |w + 2| < 10
{w | −12 < w < 8}
a. Rewrite the inequality as a compound statement.
x + 1 < 2 and −(x + 1) < 2 {x | −3 < x < 1}
2. Consider the inequality |2b − 1| ≥ 6.
0
1
2
3
4
5
6
7
8
5
6
7
8
0
1
2
3
4
5
6
7
8
9 10 11 12 13
{ p − ≤ p ≤ 1} 13 3
p
{b b ≤ − 25 or b ≥ 27 }
6.
c. Graph the solution set on the number line provided.
b
344
4
m
–7 –6 –5 –4 –3 –2 –1
b. Solve the compound statement for b. Write the solution set by using set notation.
© Great Minds PBC
3
5. |3p + 5| + 20 ≤ 28
2b − 1 ≥ 6 or −(2b − 1) ≥ 6
–2
2
9 10
a. Rewrite the inequality as a compound statement.
–3
1
{m | m < −6 or m > 13}
x –10 –9 –8 –7 –6 –5 –4 –3 –2 –1
0
4. |2m − 7| > 19
c. Graph the solution set on the number line provided.
–4
w
–12 –11 –10 –9 –8 –7 –6 –5 –4 –3 –2 –1
b. Solve the compound statement for x. Write the solution set by using set notation.
–5
EUREKA MATH2
A1 ▸ M1 ▸ TC ▸ Lesson 17
–1
0
1
2
3
4
–5
–4
1 4d − 2 2
<1
–3
–2
–1
271
272
1
2
3
4
5
8
9 10
{d | 0 < d < 1}
–10 –9 –8 –7 –6 –5 –4 –3 –2 –1
5
0
P R ACT I C E
d 0
1
2
3
4
5
6
7
© Great Minds PBC
© Great Minds PBC
EUREKA MATH2 A1 ▸ M1 ▸ TC ▸ Lesson 17
EUREKA MATH2
A1 ▸ M1 ▸ TC ▸ Lesson 17
A1 ▸ M1 ▸ TC ▸ Lesson 17
10. Compare and contrast the solution set of |k − 2| = 3 with the solution set of |k − 2| ≥ 3.
7. |2r − 3| ≥ 0
ℝ
The solution set of the inequality has infinitely many solutions, while the solution set of the equation has only two solutions. Both solution sets contain −1 and 5. Those are the only solutions to the equation, while the solution set of the inequality also includes all values greater than 5 or less than −1.
r –10 –9 –8 –7 –6 –5 –4 –3 –2 –1
0
1
2
3
4
5
6
7
8
9 10
8. −5|4c + 25| + 7 ≥ −8
For problems 11–14, create an equation or inequality for the situation. 11. An absolute value equation that has two solutions
{c − 7 ≤ c ≤ − 112}
Sample: |x − 3| = 5
c –10
EUREKA MATH2
–9
–8
–7
–6
–5
–4
–3
–2
–1
0
9. |5 − x| − 3 > 7
12. An absolute value equation that has one solution
{x | x < −5 or x > 15} –5 –4 –3 –2 –1
Sample: |x − 3| = 0
x 0
1
2
3
4
5
6
7
8
9 10 11 12 13 14 15 13. An absolute value inequality that has a solution of all real numbers Sample: |x − 3| > −2
14. An absolute value inequality that has no solution Sample: |x − 3| < −2
© Great Minds PBC
© Great Minds PBC
P R ACT I C E
273
274
P R ACT I C E
© Great Minds PBC
345
EUREKA MATH2
A1 ▸ M1 ▸ TC ▸ Lesson 17
EUREKA MATH2
A1 ▸ M1 ▸ TC ▸ Lesson 17
15. A candy manufacturer typically fills each bag with 362 pieces of candy. The candy count can be up to 12 pieces above or below this number.
EUREKA MATH2
A1 ▸ M1 ▸ TC ▸ Lesson 17
18. Match each compound equation or inequality to the graph of its solution set on the number line.
a. Write an absolute value inequality that represents the acceptable range of candy pieces in a bag.
n > 4 or n < −2
–8
–6
–4
–2
0
2
4
6
8
n ≤ 4 and n ≥ −2
–8
–6
–4
–2
0
2
4
6
8
–8
–6
–4
–2
0
2
4
6
8
−2 < n < 4
–8
–6
–4
–2
0
2
4
6
8
n ≥ 4 or n ≤ −2
–8
–6
–4
–2
0
2
4
6
8
n
Let c represent the total number of candy pieces in a bag.
|c − 362| ≤ 12
n
b. Solve the absolute value inequality from part (a) to find the acceptable number of candy pieces in any bag of candy.
c − 362 ≤ 12 and −(c − 362) ≤ 12 c ≤ 374 and c ≥ 350
n = 4 or n = −2
Any bag of candy may contain 350 to 374 pieces of candy.
Remember For problems 16 and 17, solve the equation. 16. −2(d − 6) + 5d = 12
0
© Great Minds PBC
346
17. −42 = 8d − 9 +
−4
d 4
P R ACT I C E
275
276
P R ACT I C E
n
n
n
© Great Minds PBC
© Great Minds PBC
EUREKA MATH2 A1 ▸ M1 ▸ TC ▸ Lesson 17
EUREKA MATH2
A1 ▸ M1 ▸ TC ▸ Lesson 17
19. One random sample was taken from all shoppers at store A, and another random sample was taken from all shoppers at store B. The box plots show the distributions of the time shoppers spent at each store. Which statements must be true based on the data distributions shown in the box plots? Choose all that apply. Length of Time Spent in Grocery Store
Store A Store B
6
12 18 24 30 36 42 48 54 60 66 72 78 Time (minutes)
A. The ranges of the two data sets are the same. B. The median for store A is less than the median for store B. C. The interquartile range for store B is greater than the interquartile range for store A. 1
D. The difference in the medians of the two data sets is times the interquartile range 2 for store A. E. The difference in the medians of the two data sets is 2 times the interquartile range for store B.
© Great Minds PBC
© Great Minds PBC
P R ACT I C E
277
347
Teacher Edition: Grade A1, Module 1, Topic D
Topic D Univariate Data Beginning in grade 6, students identify statistical questions for which variation in the responses is anticipated. They collect data on a single variable and display it in dot plots, histograms, and box plots. Students identify the shapes of data distributions from these graphs. Additionally, students calculate statistical measures of center and spread to describe data distributions, and they analyze how the shapes of data distributions affect which measures of center and spread most accurately represent the data sets. In grade 7, students use measures of center and variability to make informal comparative inferences about univariate data distributions. In Algebra I, students build on their middle school experiences to describe and compare univariate data distributions by using shape, center, and spread, noting the effect of outliers and interpreting comparisons in context. Topic D begins by reintroducing students to collecting and analyzing univariate data. First, students participate in a fun activity in which they make predictions, generate data, and analyze dot plots of pooled class data to informally compare the shapes of data distributions. This lesson provides an access point for all students to informally compare univariate data distributions. The activity also provides an opportunity to formatively assess what students recall from middle school about univariate data analysis. Next, students use measures of center to compare univariate data distributions. They compare the centers of data sets by using mean and median and discussing the relationship between the shape of a data distribution and the mean and median of the data set. Students use measures of center to compare data distributions represented in dot plots, and they estimate means and medians of distributions displayed in histograms. Students then use the medians to compare distributions represented in box plots. Throughout these lessons, students are encouraged both to use precision when describing data distributions and to discuss comparisons in the context in which the data are collected. The goal is for students to strategically choose which measures of center are the most appropriate to compare data distributions based on the shapes of the distributions.
348
© Great Minds PBC
EUREKA MATH2 A1 ▸ M1 ▸ TD
Students are introduced to standard deviation to measure and compare the spread of two univariate data distributions. The lessons emphasize understanding how the standard deviation measures a typical distance between a value in the distribution and the mean of the distribution, as well as how the standard deviation is affected by outliers. The usefulness of standard deviation as a measure of variation for normal distributions is addressed in Algebra II. Students estimate measures of center and spread to compare univariate distributions displayed by using histograms. The goal is to enable students to approximate the center and typical variation in a distribution to facilitate comparison. Students also use the interquartile range to compare sets of data for distributions displayed in box plots as well as for skewed distributions represented in dot plots.
Maximum Speeds of Roller Coasters
Wooden Steel
0
10
20
30
40
50
60
70
80
90
100
110
120
130
Speed (miles per hour)
Topic D concludes with a culminating activity as students decide which measures of center and spread to use to compare two or more sets of univariate data. Students present their comparisons, justifying their choices of statistics for comparing the distributions and interpreting similarities and differences between the distributions in context. Throughout the topic, a principal goal is to build students’ capacity to explain what statistical measures indicate about a data set and how statistics can be used to answer questions. The skills students develop in module 1 will be applied in module 2 when they analyze bivariate data, in module 6 when they solve real-world problems by using statistical models, and in Algebra II when they engage in formal comparative inference.
© Great Minds PBC
349
A1 ▸ M1 ▸ TD
EUREKA MATH2
Progression of Lessons Lesson 18 Distributions and Their Shapes Lesson 19 Describing the Center of a Distribution Lesson 20 Using Center to Compare Data Distributions Lesson 21 Describing Variability in a Univariate Distribution with Standard Deviation Lesson 22 Estimating Variability in Data Distributions Lesson 23 Comparing Distributions of Univariate Data
350
© Great Minds PBC
18
Teacher Edition: Grade A1, Module 1, Topic D, Lesson 18 LESSON 18
Distributions and Their Shapes Informally describe a data distribution displayed in a dot plot.
EUREKA MATH2
A1 ▸ M1 ▸ TD ▸ Lesson 18
Student Edition: Grade A1, Module 1, Topic D, Lesson 18
EXIT TICKET
Name
Date
18
The dot plot shows the delay times rounded to the nearest five minutes for 60 Big Air flights in 2019. Delay Times of Big Air Flights from 2019
Lesson at a Glance In this lesson, students compare data sets related to a memory game. Students answer statistical questions related to data type and the shape, center, and spread of data on dot plots. Several terms used to describe the shape of data distributions are reviewed in this lesson, including symmetric, right-skewed, left-skewed, and mound-shaped. This lesson formalizes the terms uniform distribution and univariate quantitative data.
Key Question 0
• What information can we use from a dot plot to help describe a set of univariate quantitative data?
10 20 30 40 50 60 70 80 90 100 110 120 Delay Time (minutes)
a. What shape is the distribution?
Achievement Descriptors
The distribution is right-skewed.
A1.Mod1.AD11 Represent data with dot plots, histograms, or box
plots. (S.ID.A.1) A1.Mod1.AD12 Summarize and compare data by shape, center, and
b. Was 70 minutes a typical delay time for Big Air flights? Justify your answer. No, a typical delay time was not 70 minutes. Only 12 of the 60 flights had delays of 70 minutes or more, and more than half the flights had delays of less than 40 minutes.
spread outside of context. (S.ID.A.2) A1.Mod1.AD13 Interpret differences in data in the context of the data
sets. (S.ID.A.3)
© Great Minds PBC
287
© Great Minds PBC
EUREKA MATH2 A1 ▸ M1 ▸ TD ▸ Lesson 18
Agenda
Materials
Fluency
Teacher
Launch 5 min
• None
Learn 30 min
Students
• Comparing Dot Plots
• Univariate Quantitative Data graphic organizer
• Typical Values • Putting It All Together
Land 10 min
© Great Minds PBC
Lesson Preparation • None
353
EUREKA MATH2
A1 ▸ M1 ▸ TD ▸ Lesson 18
Fluency Read a Dot Plot Students read a dot plot to prepare for describing shapes of distributions represented in dot plots. Directions: The dot plot shows the number of siblings each student in one class has. Use the dot plot to answer each question. Students’ Siblings
0
1
2
3
4
5
6
Number of Siblings
1.
How many students are in the class?
27
2.
hat is the greatest number of W siblings any student in the class has?
5
3.
hat is the least number of siblings W any student in the class has?
0
4.
hat number of siblings is the most W common for students in the class?
1
354
© Great Minds PBC
EUREKA MATH2 A1 ▸ M1 ▸ TD ▸ Lesson 18
Launch
5
Students informally analyze data collected from a memory game. Introduce the memory game context by reading the following information. A group of researchers investigated memory traits by having people participate in a game. To play the game, participants studied a sequence of letters for a limited time and then were asked to recall as much of the sequence as they could from memory. Next, they repeated this process for a different sequence of letters. For each sequence, participants tallied the number of letters they remembered from the first letter until they made an error. Researchers then compared the tallies for the two different sequences of letters. Display the following sequences of letters. Allow students to analyze the sequences. reomdibrntiogorfkleisfhionilnebemseoynmaoagtngloidfnreabwnodfwlo morebirdintofroglikefishlionbeensomemanygoatlongfindbeardownwolf Facilitate a discussion about the sequences of letters by asking the following questions.
Teacher Note Consider having students play the memory game in class. • Display the first sequence of letters, provide time for students to study it, and then have students write as much of the sequence as they can recall from memory. • Ask students to tally their score, and then repeat the process for the second sequence of letters. • Have students use sticky notes to anonymously submit their scores. • Use the data collected to compare the results for the different sequences of letters.
What do you notice? What do you wonder? I notice that both sequences have about the same number of letters. I notice that the second sequence seems to include words. I wonder how many letters the participants remembered from each sequence. Do you think there is a difference in the typical number of letters correctly recalled from memory between the two sequences of letters? Why? I think the typical number of letters would be greater for the second sequence of letters. I think it might be easier to remember more letters from the second sequence because the letters are grouped into words. Today, we will compare the results from the memory game by analyzing data distributions shown in dot plots.
© Great Minds PBC
355
EUREKA MATH2
A1 ▸ M1 ▸ TD ▸ Lesson 18
Learn Comparing Dot Plots Students compare data distributions and acquire formal language to describe their shapes. Display the dot plots of trial 1 and trial 2.
Promoting the Standards for Mathematical Practice When students analyze data to answer a question about memorizing sequences of letters, they are modeling with mathematics (MP4).
Trial 1
Ask the following questions to promote MP4: • What assumptions could you make to help approximate a typical value?
0
4
8
12
16
20
24
28
32
36
40
44
48
52
56
60
64
44
48
52
56
60
64
Number of Letters Remembered
• What do you wish you knew to compare these data distributions?
Trial 2
0
4
8
12
16
20
24
28
32
36
40
Number of Letters Remembered
What do you notice? I notice the number of letters remembered in trial 1 looks like it is fewer than the number of letters remembered in trial 2. I notice most participants in the game were able to remember about the same number of letters in trial 1. I notice that the data distribution from trial 2 is more spread out. 356
© Great Minds PBC
EUREKA MATH2 A1 ▸ M1 ▸ TD ▸ Lesson 18
What do you wonder? I wonder whether the participants would remember more letters if they played the game again with the same sequences of letters. I wonder why the greatest number of letters remembered for trial 2 is so much larger than the greatest number for trial 1. Which trial do you think represents the results from the first sequence of letters? Explain. I think trial 1 represents the results from the first sequence of letters. I think the participants would typically remember fewer letters from the sequence in which the letters are not grouped into words. What do the dot plots tell us about the memory game? In trial 1, the participants did not remember many letters. The number of letters that participants remembered in trial 2 were more spread out. In trial 2, participants were typically able to remember more letters. Accept all valid responses. Note that students are not expected to use formal measures of center and spread to compare the distributions yet. Display the term univariate quantitative data. The data that represent the number of letters remembered from a sequence are univariate quantitative data. To better understand that term, let’s look at each word by itself. How many variables are there for each trial, and what do they represent? There is only one variable. It represents the number of letters remembered. Recall that uni- means “one.” There is only one variable in the memory game context, so we say that the data set is univariate. Are these data categorical or numerical? How do you know? These data are numerical because each value in the data set is a number. Numerical data are said to be quantitative. Quantitative data are information about quantity. They are expressed as a number.
© Great Minds PBC
Language Support To support the meaning of the term univariate, remind students that the prefix uni- means “one” and refer them to other terms that use the same prefix. • A unicorn is a fictitious creature with one horn. • A unicycle is a vehicle with one wheel. • Univariate data are information collected on one variable.
357
EUREKA MATH2
A1 ▸ M1 ▸ TD ▸ Lesson 18
This type of data is called univariate quantitative data. Univariate quantitative data means that there is one variable, and the data values are numerical. Why might we choose to use dot plots rather than lists of data values to compare two data sets? The dot plot shows how spread out the data distribution is and where the data values clump together, if anywhere. I would have a difficult time determining that information from a list of numbers. Have students complete problem 1 with a partner. Circulate as students work, and identify pairs who use characteristics such as shape, center, and spread to compare the distributions. 1. Consider the dot plots showing the distributions of four different groups of participants for trial 1.
358
Group A
Group B
0 1 2 3 4 5 6 7 8 9 10 11 12 13
0 1 2 3 4 5 6 7 8 9 10 11 12 13
Number of Letters Remembered
Number of Letters Remembered
Group C
Group D
0 1 2 3 4 5 6 7 8 9 10 11 12 13
0 1 2 3 4 5 6 7 8 9 10 11 12 13
Number of Letters Remembered
Number of Letters Remembered
© Great Minds PBC
EUREKA MATH2 A1 ▸ M1 ▸ TD ▸ Lesson 18
Choose two of the distributions. Then explain how the distributions for the two groups are similar and how they are different. Sample: The data distributions for group C and group D are similar because neither is symmetric or approximately symmetric. They are different because group C has a cluster of data values on the left side, and group D has a cluster of data values on the right side. In group A, the typical number of letters a participant remembered is 7 letters. In group D, the typical number of letters a participant remembered is 9 letters.
Differentiation: Support Support identifying different types of distributions by providing an image of each type.
Mound
Approximately Uniform
Left-Skewed
Right-Skewed
When students are finished, bring the class together and invite the identified pairs to share their thinking. Review previous terms used to describe shape. • A symmetric distribution is a distribution in which its left half mirrors its right half. • A skewed distribution is not symmetric. It has a longer tail on one side of the distribution than on the other side. • A mound-shaped distribution is approximately symmetric and looks like the data are piled up in the center, like a small mound of dirt. Direct students to the Univariate Quantitative Data graphic organizer. Have them sketch an example and include a summary of each term on their graphic organizer. A distribution is said to be approximately uniform when most of the values have about the same frequencies. Have students sketch an example and include a summary of the term uniform on their graphic organizer. Look at all four distributions in problem 1. Are any of the distributions approximately uniform? How do you know? Group B is approximately uniform because each of the numbers of letters that participants remembered has about the same frequency.
Teacher Note Students continue to add information to their graphic organizer throughout the topic.
UDL: Representation Consider asking students to model the different shapes of data distributions with their arms.
Invite students to turn and talk to summarize the four shapes of data distributions.
© Great Minds PBC
359
EUREKA MATH2
A1 ▸ M1 ▸ TD ▸ Lesson 18
Typical Values Students informally explore the meaning of a typical value in a data distribution. Display the two sequences of letters from trial 1 and trial 2.
UDL: Engagement Students collaborate with peers about data sets with different shapes and variabilities. In addition, students have the opportunity to express personal preference about which sequence of letters is easier to remember.
reomdibrntiogorfkleisfhionilnebemseoynmaoagtngloidfnreabwnodfwlo morebirdintofroglikefishlionbeensomemanygoatlongfindbeardownwolf Then display the dot plots from trial 1 and trial 2. Trial 1
0
4
8
12
16
20
24
28
32
36
40
44
48
52
56
60
64
44
48
52
56
60
64
Number of Letters Remembered
Trial 2
0
4
8
12
16
20
24
28
32
36
40
Number of Letters Remembered
360
© Great Minds PBC
EUREKA MATH2 A1 ▸ M1 ▸ TD ▸ Lesson 18
Let’s think of a typical number of letters remembered for each trial. A typical value is the one number you would choose to best represent all the data. What is a typical number of letters remembered for trial 1? How do you know? Sample: A typical number of letters remembered for trial 1 is 8 because that number appears to be the middle of the distribution. What is a typical number of letters remembered for trial 2? How do you know? Sample: A typical number of letters remembered for trial 2 is 2 8because that number appears to be the middle of the distribution. Are the results what you expected? Why? Yes, because it seems reasonable that the participants would remember more letters when the letters were arranged into short words. It is sometimes said that short-term memory can hold about 7 pieces of information. Is this supported by the results of each trial? Explain. Sample: Yes. In trial 1, the middle of the data looks a bit greater than 7 , but it is pretty close to 7 . For trial 2, the middle of the data is in the twenties. Trial 2 had words in the sequence, and each word was 4 letters long. This means that I might expect to see 2 8 as the typical value because 4 (7) = 28. Invite students to complete problem 2 with a partner. Anticipate that students may need support in identifying typical scores for groups C and D. Although students may question how to find the typical value, do not introduce formal terms for measures of center.
© Great Minds PBC
361
EUREKA MATH2
A1 ▸ M1 ▸ TD ▸ Lesson 18
2. The dot plots show the distributions for trial 1 for groups A, B, C, and D. Mark a typical score for each data set with an X on the dot plot. Sample: Group A
Group B
×
×
0 1 2 3 4 5 6 7 8 9 10 11 12 13
0 1 2 3 4 5 6 7 8 9 10 11 12 13
Number of Letters Remembered
Number of Letters Remembered
Group C
Group D ×
×
0 1 2 3 4 5 6 7 8 9 10 11 12 13
0 1 2 3 4 5 6 7 8 9 10 11 12 13
Number of Letters Remembered
Number of Letters Remembered
When students are finished, invite them to share where they placed an X on each dot plot and why. Encourage students to defend their position and to respectfully question one another’s choices. Highlight that there is not one correct answer.
Putting It All Together Students describe the shape of the distributions shown in the dot plots and informally discuss typical values and spread. Invite students to complete problem 3 with a partner. 362
© Great Minds PBC
EUREKA MATH2 A1 ▸ M1 ▸ TD ▸ Lesson 18
3. Match each dot plot to the description that best represents the distribution. Group A
Approximately symmetric with a typical value around 7 0 1 2 3 4 5 6 7 8 9 10 11 12 13 Number of Letters Remembered
Group B
Right-skewed with a typical value around 6 or 7 0 1 2 3 4 5 6 7 8 9 10 11 12 13 Number of Letters Remembered
Group C
Left-skewed with a typical value around 8 or 9 0 1 2 3 4 5 6 7 8 9 10 11 12 13 Number of Letters Remembered
Group D
Approximately uniform with a typical value around 7 0 1 2 3 4 5 6 7 8 9 10 11 12 13 Number of Letters Remembered
© Great Minds PBC
363
EUREKA MATH2
A1 ▸ M1 ▸ TD ▸ Lesson 18
When students are finished, bring the class together. Invite a student to share their answers. Consider asking any or all of the following questions to summarize student understanding: • What does it mean if a data distribution is symmetric? What does the dot plot of a symmetric data distribution look like? • What does it mean if a data distribution is right-skewed? What does the dot plot of a right-skewed data distribution look like? • What does it mean if a data distribution is left-skewed? What does the dot plot of a left-skewed data distribution look like? • What does it mean for a value to be a typical value in a data distribution?
Land Debrief 5 min Objective: Informally describe a data distribution displayed in a dot plot. Facilitate a brief class discussion by using the following question. What information can we use from a dot plot to help us describe a set of univariate quantitative data? We can look at the shape of the distribution to determine whether it is approximately symmetric or skewed, for example. We can also look at the distribution in the dot plot to estimate a typical value and determine how spread out the data are in the distribution.
Exit Ticket 5 min Provide up to 5 minutes for students to complete the Exit Ticket. It is possible to gather formative data even if some students do not complete every problem.
364
Teacher Note Assign the Practice problems for completion outside of class or use them in class if time remains after the lesson. Refer students to the Recap for support.
© Great Minds PBC
EUREKA MATH2 A1 ▸ M1 ▸ TD ▸ Lesson 18
Recap
EUREKA MATH2
A1 ▸ M1 ▸ TD ▸ Lesson 18
Student Edition: Grade A1, Module 1, Topic D, Lesson 18 Name
RECAP Date
Distributions and Their Shapes
18
Terminology
In this lesson, we •
described shapes of data distributions displayed in dot plots by using the terms symmetric, right-skewed, left-skewed, and mound-shaped.
•
compared data distributions displayed in dot plots.
•
estimated typical values for data distributions.
Univariate quantitative data means there is one variable, and the data values are numerical. A data distribution is approximately uniform when most of the values have about the same frequencies.
Example
The numbers of grams of protein per serving in 20 different varieties of breakfast cereals are listed.
1, 1, 1, 1, 1, 2, 2, 2, 2, 3, 3, 3, 4, 4, 5, 5, 6, 6, 7, 8 a. Create a dot plot showing the distribution of grams of protein per serving in the 20 breakfast cereals. Each dot represents one value in the data set.
0
1
Protein per Serving of Cereal
2
3
4
5
Protein (grams)
b. Describe the shape of the distribution. The distribution is right-skewed. c. Use the dot plot to estimate a typical number of grams of protein for one serving of cereal. A typical number of grams of protein in one serving is about 3 grams. © Great Minds PBC
© Great Minds PBC
6
7
8
9
A skewed distribution has a tail on one side. This distribution has a tail on the right side.
The data value 3 grams falls in the middle of the data set, so it is a good estimate of a typical data value.
289
365
EUREKA MATH2
A1 ▸ M1 ▸ TD ▸ Lesson 18
Sample Solutions Expect to see varied solution paths. Accept accurate responses, reasonable explanations, and equivalent answers for all student work.
EUREKA MATH2
A1 ▸ M1 ▸ TD ▸ Lesson 18
Student Edition: Grade A1, Module 1, Topic D, Lesson 18 Name
PRACTICE Date
18
EUREKA MATH2
A1 ▸ M1 ▸ TD ▸ Lesson 18
2. Ana recorded the daily high temperature in degrees Fahrenheit at her house for 10 days.
77, 85, 77, 79, 82, 84, 79, 78, 79, 80 1. Match each dot plot to the description of its shape.
a. Create a dot plot showing the distribution of high temperatures in degrees Fahrenheit for the 10-day period.
Number of Pets Owned by Students
Daily High Temperatures
Approximately symmetric
75 76 77 78 79 80 81 82 83 84 85 86 87 0
2
4
6
8
10
Temperature (degrees Fahrenheit)
12
Number of Pets
Measurements of Length of East Hallway
b. What is the shape of the distribution? The distribution is right-skewed.
Skewed to the right 8.2
8.3
8.4
8.5
8.6
8.7
8.8
8.9
Length (meters)
Ages of Cars Driven by Teachers
Skewed to the left
0
1
2
3
4
5
6
7
8
Age (years)
© Great Minds PBC
366
291
292
P R ACT I C E
© Great Minds PBC
© Great Minds PBC
EUREKA MATH2 A1 ▸ M1 ▸ TD ▸ Lesson 18
EUREKA MATH2
A1 ▸ M1 ▸ TD ▸ Lesson 18
EUREKA MATH2
A1 ▸ M1 ▸ TD ▸ Lesson 18
4. A random sample of 80 viewers of a television show was selected. The dot plot shows the distribution of the ages of the viewers in years.
3. There were 25 people who attended an event. The ages of the people in attendance are listed.
3, 3, 4, 4, 4, 4, 5, 6, 6, 6, 6, 6, 7, 7, 7, 7, 7, 7, 8, 8, 8, 9, 9, 9, 10
Ages of Television Show Viewers
a. Create a dot plot showing the distribution of the ages in years of the people in attendance. Ages of People Attending the Event
0 0
1
2
3
4
5
6
7
8
10
20
30
40
50
60
70
80
Viewer Age (years)
9 10 11 12 13 14 15 a. What shape is the distribution?
Age (years)
The distribution is left-skewed.
b. Based on the dot plot, what is the typical age of a viewer?
b. What is the shape of the distribution?
The typical age of a viewer is around 60 years old.
The distribution is approximately symmetric.
c. Would you say that this television show appeals to a wide age range of viewers? Explain. I would say that it does appeal to a wide age range because the viewers’ ages range from under 10 to over 70.
c. What is a typical age of a person who attended the event? The typical age of a person who attended the event is 7 years old.
5. When is it not efficient to represent a data set by using a dot plot? Dot plots are not efficient for displaying data for sets with a large number of observations. For instance, it may take a long time to create a dot plot for a sample with over 100 observations. In addition, it might be challenging to create a dot plot for a data set with outliers or for one where the data has a large range.
d. What might the event have been? Sample: The event might have been a class for children where parents drop off their children and pick them up after the event ends.
© Great Minds PBC
© Great Minds PBC
P R ACT I C E
293
294
P R ACT I C E
© Great Minds PBC
367
EUREKA MATH2
A1 ▸ M1 ▸ TD ▸ Lesson 18
EUREKA MATH2
A1 ▸ M1 ▸ TD ▸ Lesson 18
6. A doctor measured the resting heart rates of a large group of middle-aged adults. From the group, the doctor randomly selected 20 adults who are right-handed and 20 adults who are left-handed. The distributions are shown in the dot plots.
EUREKA MATH2
A1 ▸ M1 ▸ TD ▸ Lesson 18
Remember For problems 7 and 8, solve the equation. 7. 16 = 7 − 2x − 5x
Resting Heart Rates for Right-Handed Adults
8. −
9 − 7
44 46 48 50 52 54 56 58 60 62 64 66 68 70 72 74 76 78 80 82 84
2 ( x + 20) − 9 = 15 5
−80
9. Circle each polynomial expression.
Heart Rate (beats per minute)
Resting Heart Rates for Left-Handed Adults
(3x2 − 2x + 5) − (7x − 4)
15 x 3 5x4
10 − 2
9 x3 4
(3x + 1)(3x − 1)
−x x − 2 x 2 − 8 x + 1
(
3
6
)
44 46 48 50 52 54 56 58 60 62 64 66 68 70 72 74 76 78 80 82 84 Heart Rate (beats per minute)
a. In 2 or 3 sentences, compare the distribution for the resting heart rates of right-handed adults with the distribution for the resting heart rates of left-handed adults. The distribution for the right-handed adults looks left-skewed, while the distribution for the left-handed adults is right-skewed. According to the distributions, the typical resting heart rate for right-handed adults is estimated to be a few beats per minute more than the typical resting heart rate for left-handed adults. The overall spread of the distribution of right-handed adults is also greater than that of left-handed adults.
10. Danna earns $114 for 8 hours of work. She earns the same amount of money each hour. Write an equation that represents the relationship between Danna’s earnings in dollars y and the number of hours she works x.
y = 14.25x
b. Based on the data, can the fact that an adult is left-handed or right-handed influence that adult’s resting heart rate? Explain your reasoning. No. While the typical resting heart rate for this sample of right-handed adults is greater than that of the left-handed adults, there is not enough evidence to conclude that there is a causal relationship between the two variables. The difference in the typical resting heart rates that we observe could be due to chance alone or some other factor than being right-handed or left-handed. © Great Minds PBC
368
P R ACT I C E
295
296
P R ACT I C E
© Great Minds PBC
© Great Minds PBC
19
Teacher Edition: Grade A1, Module 1, Topic D, Lesson 19 LESSON 19
Describing the Center of a Distribution Find the mean and median of data shown in a dot plot and estimate the mean and median of a data distribution represented by a histogram. Identify whether the mean and/or the median appropriately describes a typical value for a given data set.
EUREKA MATH2
A1 ▸ M1 ▸ TD ▸ Lesson 19
Student Edition: Grade A1, Module 1, Topic D, Lesson 19
EXIT TICKET
Name
Date
EUREKA MATH2
A1 ▸ M1 ▸ TD ▸ Lesson 19
19
Consider the dot plot showing the number of text messages the students sent. Text Messages Sent by Ninth Graders Last Tuesday
1. A random sample of 10 ninth grade students was asked how many text messages they sent last Tuesday.
Student
© Great Minds PBC
Number of Text Messages Sent
1
285
2
15
3
37
4
3
5
11
6
56
7
22
8
32
9
71
10
28
0
50
100
150
200
250
300
Number of Text Messages Sent
a. Calculate the mean and median of the data set. The sum of the data values is 560. 560 = 56 10
The mean is 56 text messages. The data values arranged from smallest to largest are 3, 11, 15, 22, 28, 32, 37, 56, 71, and 285. 28 + 32 2
= 30
The median is 30 text messages. b. To describe a typical number of text messages students sent last Tuesday, would you use the mean, median, or both? Explain your answer. I would use the median to describe a typical number of text messages students sent last Tuesday. The distribution is skewed to the right, and the median is a better measure of center for skewed distributions.
303
304
EXIT TICKET
© Great Minds PBC
© Great Minds PBC
EUREKA MATH2 A1 ▸ M1 ▸ TD ▸ Lesson 19
Lesson at a Glance Students work individually or with a partner to calculate the mean and median of the data distributions introduced in the previous lesson. They discuss in groups how to use the measures to compare typical values for the distributions. They engage in a class discussion to formalize their thinking about whether the mean and/or median are appropriate measures to describe the center of a data distribution based on its shape. Students analyze a set of data that includes an outlier to explore the effect of outliers on measures of center. They apply their understanding to use measures of center to describe a typical value of a data distribution displayed in a histogram, realizing that the mean and median can only be estimated.
Key Questions • What are some ways to describe the shape of a data distribution? • What are some ways to describe the center of a data distribution? • How are the mean and median of a data set related to the shape of the distribution?
Achievement Descriptors A1.Mod1.AD11 Represent data with dot plots, histograms, or box plots. (S.ID.A.1) A1.Mod1.AD12 Summarize and compare data by shape, center, and spread outside
of context. (S.ID.A.2) A1.Mod1.AD13 Interpret differences in data in the context of the data sets. (S.ID.A.3)
© Great Minds PBC
371
EUREKA MATH2
A1 ▸ M1 ▸ TD ▸ Lesson 19
Agenda
Materials
Fluency
Teacher
Launch 5 min
• None
Learn 30 min
Students
• Test Your Memory Revisited
• None
• Choosing a Measure of Center
Lesson Preparation
• Measures of Center from a Histogram
• None
Land 10 min
372
© Great Minds PBC
EUREKA MATH2 A1 ▸ M1 ▸ TD ▸ Lesson 19
Fluency Find Mean and Median Students find the mean and median of data sets to prepare for determining a typical value for a data set. Directions: Find the mean and median of each data set. 1.
5, 7, 2, 5, 4
2.
6, 1, 0, 3, 8, 6, 46
3.
3.1, 3.3, 2.8, 3.6, 3.5, 2.9
© Great Minds PBC
Mean: 4.6
Teacher Note The data sets shown here are also used in the Fluency activities in lessons 20, 21, and 22. Consider having students keep their mean and median calculations easily accessible.
Median: 5 Mean: 10 Median: 6 Mean: 3.2 Median: 3.2
373
EUREKA MATH2
A1 ▸ M1 ▸ TD ▸ Lesson 19
Launch
5
Students estimate typical measures from dot plots to elicit and assess their prior knowledge of the mean and median. Display the trial 1 and trial 2 dot plots that show the data collected from lesson 18. The goal is to compare a distribution that is approximately symmetric with one that is not symmetric. If the class-generated dot plots are not suitable, use the sample dot plots provided in lesson 18 (and shown here). If using different dot plots than those used for lesson 18, have students work with a partner to estimate a typical value for each distribution. If using the plots in lesson 18, remind students of their estimates for each distribution. Have volunteers share their estimates.
Trial 1
0
4
8
12
16
20
24
28
32
36
40
44
48
52
56
60
64
44
48
52
56
60
64
Number of Letters Remembered
Trial 2
0
4
8
12
16
20
24
28
32
36
40
Number of Letters Remembered
374
© Great Minds PBC
EUREKA MATH2 A1 ▸ M1 ▸ TD ▸ Lesson 19
Recall that in lesson 18 we talked about typical values for data sets. How did you estimate the typical value for each trial? I estimated the value of the dot that was in the middle of the data. I looked for a dot that had about the same number of dots to the left of it and to the right of it. Does the process of finding these typical values seem familiar? Elicit the idea that the mean and median, both learned in grade 6, are measures of center and are often used to represent a typical value for a data set. Today, we will look at how the mean and median are used to describe a typical value for a data distribution.
Learn Test Your Memory Revisited Students calculate the mean and median of data sets and recognize the relationship between distribution shape and the mean and median. Using the same dot plots from Launch, assign half of the class trial 1 and half of the class trial 2. Have them find the mean and median for their assigned trial. Direct students to the Test Your Memory Revisited section to record their work. Display the answers under each dot plot, have students record the answers, and discuss as a class. Note that the answers that follow correspond to the sample dot plots from lesson 18.
© Great Minds PBC
UDL: Representation Activate students’ prior knowledge by reviewing how to find the mean and median for quantitative data by using a sample data set from the Fluency activity.
375
EUREKA MATH2
A1 ▸ M1 ▸ TD ▸ Lesson 19
Trial 1: Sum of the numbers: 257
Mean: Approximately 9.9, because ___ 257 ≈ 9.9 Median: 8.5, because
8+9
Trial 2:
2
= 8.5
26
Sum of the numbers: 685
Mean: Approximately 26.3, because ___ 685 ≈ 26.3 Median: 22.5, because
21 + 24 2
= 22.5
26
Trial 1
0
4
8
12
16
20
24
28
32
36
40
44
48
52
56
60
64
44
48
52
56
60
64
Number of Letters Remembered
The mean is approximately 9.9 letters. The median is 8.5 letters.
Trial 2
0
4
8
12
16
20
24
28
32
36
40
Number of Letters Remembered
The mean is approximately 26.3 letters. The median is 22.5 letters. 376
© Great Minds PBC
EUREKA MATH2 A1 ▸ M1 ▸ TD ▸ Lesson 19
For trial 1, how do the values of the mean and median compare to your estimate of a typical value from lesson 18? Both the mean and median are close to what I estimated as a typical value. Describe the shape of the data distribution for trial 1. The data distribution is approximately symmetric and mound-shaped. For trial 2, how do the values of the mean and median compare to your estimate of a typical value from lesson 18? The mean is greater than what I estimated as a typical value. The median is closer to what I estimated as a typical value. Describe the shape of the data distribution for trial 2. The data distribution for trial 2 is skewed to the right. Would you compare typical values for the two distributions by using the mean or by using the median? Why? I would use the median. For trial 1, the mean and median both seem like pretty good estimates of a typical value, so it does not really matter which one I use. For trial 2, the median seems like a better estimate of a typical value because the mean is much larger than most of the values in the distribution. Interpret the difference in the typical values of the distributions in context. Interpreting in context means discussing the measures of center and/or variability in relation to the data being collected. For this situation, interpreting in context would mean discussing what the difference in typical values tells us about the number of letters memorized in each trial. The typical number of letters memorized in trial 2 is about 14 more than the typical number of letters memorized in trial 1. I am going to read aloud four statements, one at a time. After I read a statement, stand up at your desk if you agree with it. Remain seated if you disagree with it.
© Great Minds PBC
377
EUREKA MATH2
A1 ▸ M1 ▸ TD ▸ Lesson 19
After reading the first statement, ask students to share their thinking. Then clarify the correct answer for the class and have the students sit down. Repeat this process with each of the remaining statements. The mean and median are about the same for distributions that are symmetric or approximately symmetric. Agree The mean and median are about the same for distributions that are skewed, or asymmetric. Disagree—the mean and median will be farther apart for skewed distributions. The mean is a good descriptor of a typical value for skewed distributions. Disagree—the mean will be pulled in the direction of the skew, which will either result in a mean that is larger or smaller than a typical value in the data set.
Teacher Note Some students may recognize that the median is a good measure of a typical value for both approximately symmetric distributions and skewed distributions, causing them to wonder why it is necessary to ever calculate the mean of a distribution. Explain that, while the median is always a good measure of center, the mean is used to calculate other measures. For example, the mean is used to calculate one of the measures of spread, which students will learn about later in the topic.
The mean is a good descriptor of a typical value for symmetric or approximately symmetric distributions. Agree It is possible that students may think that the median is also a good descriptor of a typical value for symmetric or approximately symmetric distributions and decide to remain seated. Once the four statements have been discussed, direct students to the Typical Measures for Data Distributions table. Have them draw a sample dot plot for each case and summarize the information about whether the mean or median, or both measures, appropriately describe a typical value for the distributions. In the next section, students will add information to the table about the relative positions of the mean and median for the distributions based on their shape.
378
© Great Minds PBC
EUREKA MATH2 A1 ▸ M1 ▸ TD ▸ Lesson 19
Draw a sample dot plot for each case, and summarize the information about the mean and median. Typical Measures for Data Distributions Distribution Shapes Symmetric or Approximately Symmetric
0
1
2
3
4
5
The mean and median are both appropriate descriptors of a typical value. The mean and median are the same or approximately the same value.
Skewed to the Left
0
1
2
3
4
Skewed to the Right
5
0
1
2
3
4
5
The median is a better descriptor of a typical value.
The median is a better descriptor of a typical value.
The mean will be less than the median.
The mean will be greater than the median.
Choosing a Measure of Center Students decide whether the mean and/or median is appropriate to describe a typical value for a data distribution. Direct students to the table of penguin populations by species and have them review the table. Make sure students realize that the populations are measured in thousands. Allow students time to work through problems 1–5 in groups. Circulate as students work, and provide support as needed. Listen for groups who are able to explain their answers, and invite some of them to share their answers during the debrief.
© Great Minds PBC
379
EUREKA MATH2
A1 ▸ M1 ▸ TD ▸ Lesson 19
Differentiation: Support
The table shows estimates of the population size in thousands of 16 penguin species.
380
Species
Population (thousands)
Species
Population (thousands)
Chinstrap
8000
Northern rockhopper
530
Adelie
7560
Erect-crested
150
King
4600
Snares
63
Southern rockhopper
2500
African
50
Royal
1700
Humboldt
32
Magellanic
1300
Fiordland
6
Gentoo
774
Yellow-eyed
3.4
Emperor
595
Galapagos
1.2
If students have difficulty recognizing the position of the mean relative to the median in skewed distributions, consider having them mark the estimated center and balance point on the dot plots of the distributions from lesson 18. This may help students to notice that the mean is pulled in the direction of the skew. Trial 2
0
4
8
12 16 20 24 28 32 36 40 44 48 52 56 60 64 balance point center
© Great Minds PBC
EUREKA MATH2 A1 ▸ M1 ▸ TD ▸ Lesson 19
1. Complete the dot plot.
Penguin Species Population Sizes
0
1000
2000
3000
4000
5000
6000
7000
8000
Population Size (thousands)
2. What is the median population size? The median is halfway between 530 and 595. 530 + 595 2
= 562.5
The median population size is 562.5 thousand penguins, or 562,500 penguins.
3. Without computing, which is greater, the mean or the median? Why? The mean population size is greater than the median because the distribution of the population sizes is skewed to the right. The very large population sizes will pull the mean toward the upper end of the distribution.
© Great Minds PBC
381
A1 ▸ M1 ▸ TD ▸ Lesson 19
4. To estimate the typical penguin population size, is it appropriate to use the mean, the median, or both? Why? It is appropriate to use the median because it is a better estimate of a typical penguin population size since the data distribution is skewed.
5. The population size of the macaroni penguin species is approximately 18,000,000. If we included the population size for the macaroni penguins in the data set, how would that affect the mean and the median? Which measure would be more affected and why? Including the macaroni penguin data will increase the median population size from 562,500 to 595,500. It will increase the mean more substantially than the median because the macaroni population size is an outlier. It will pull the mean population size toward the greater values. Call the class back together to discuss. Then redirect students to the Typical Measures for Data Distributions table.
EUREKA MATH2
Promoting the Standards for Mathematical Practice When students consider the effect the data distribution and possible outliers have on the mean and the median, they are making sense of the problem (MP1). Ask the following questions to promote MP1: • What information do you need to determine whether it is appropriate to use the mean, the median, or both? • What can you determine about the mean and the median by looking at the value 18,000,000? • Does your answer make sense? Why?
When a data distribution is right-skewed, how does the mean compare to the median? The mean will be larger than the median. Because the mean represents the balance point of a data set, the values that lie farther to the right pull the mean in that direction, making it larger than the median. When a data distribution is left-skewed, how does the mean compare to the median? The mean will be smaller than the median. The values that lie farther to the left pull the mean in that direction, making it smaller than the median. Have students record this information in the table. Then direct students to problem 5. The population size of the macaroni penguins is much larger than the population size of the other penguin species. We call this value an outlier. Recall that outliers are values that are either much smaller or much larger than the rest of the values in a data set. How did the outlier affect the mean and median of the data set? It increased both the mean and median of the data set, but it increased the mean by much more than it increased the median. 382
© Great Minds PBC
EUREKA MATH2 A1 ▸ M1 ▸ TD ▸ Lesson 19
Measures of Center from a Histogram Students estimate the mean and median from a histogram and decide whether each is appropriate to describe a typical value of a data distribution. Direct students to the histogram shown in Measures of Center from a Histogram. Use the following questions to guide students on how to read this type of graph. What is the interval size?
15 Why would a histogram be used for this data set rather than a dot plot? In the histogram, we can group the data into intervals, in this case intervals of 15 days, and display the frequency of cities in each interval rather than displaying the frequency for the individual number of clear days. What information can you get about the average number of clear days from looking at this histogram? It looks like most of the cities have between 80 and 125 clear days each year. There are a few cities that get many more clear days than the typical number of days. What is not evident from the histogram? Exactly how many clear days any one city gets in a year is not evident. Within each interval, I can’t tell where the values fall.
© Great Minds PBC
383
EUREKA MATH2
A1 ▸ M1 ▸ TD ▸ Lesson 19
The histogram summarizes the average number of clear days in a year for the 48 largest cities in the United States. A clear day is defined as one in which clouds cover at most 30 percent of the sky during daylight hours.
Frequency
Clear Days in a Year for US Cities 16 15 14 13 12 11 10 9 8 7 6 5 4 3 2 1 0
50
65
80
95
110 125 140 155 170 185 200 215
Average Number of Clear Days in a Year
384
© Great Minds PBC
EUREKA MATH2 A1 ▸ M1 ▸ TD ▸ Lesson 19
Direct students to problem 6. Sketch a vertical line on the histogram where the median value is approximately located. In what interval does your estimate of the median lie? My estimate is in the interval of 95 to 110 clear days. Is it possible to calculate the exact value of the median of a data set from a histogram? Explain your reasoning. In most cases, it is not possible to calculate the exact value of the median of a data set because it is located within an interval on the histogram, and the exact values in the interval are unknown. How can we estimate the mean from the histogram? We can estimate the balance point for the distribution. Sketch a vertical line on the histogram where the mean value is approximately located. Describe the location of your vertical line relative to the location of the line representing the median of the data set. Accept all reasonable estimates that are slightly to the right of the median. Example: 105–120. The line I drew to estimate the mean is to the right of the line I drew to estimate the median. The distribution is skewed to the right, and the large values pull the mean to the right.
© Great Minds PBC
385
A1 ▸ M1 ▸ TD ▸ Lesson 19
EUREKA MATH2
Direct the students to record their estimates for the median and the mean of the distribution under problem 6. Then allow time for students to answer problem 7. 6. Estimate the median and the mean from the histogram. The median is located in the interval of 95 to 110, so the median is between 95 and 110 clear days. The mean is approximately 110 clear days. 7. What is a typical number of clear days in a year for one of these cities? Explain your answer. A typical number of clear days in a year for one of these cities is somewhere between 95 and 110 days. The mean is slightly larger than the median because of the 3 cities that have a much larger number of clear days than the remaining 45, which makes the median a slightly better descriptor of the typical number of clear days. Direct students’ attention to problem 8. Have students work in pairs to construct the relative frequency histogram. If students have difficulty recalling how to create a relative frequency histogram, consider asking them how a relative frequency histogram and a frequency histogram look different and how information from a frequency histogram can be used to make a relative frequency histogram.
386
© Great Minds PBC
EUREKA MATH2 A1 ▸ M1 ▸ TD ▸ Lesson 19
Give students time to answer problem 9. 8. Construct a relative frequency histogram from the histogram for the average number of clear days.
Clear Days in a Year for US Cities
Relative Frequency
0.5 0.4 0.3 0.2 0.1 0
50
65
80
95 110 125 140 155 170 185 200 215
Average Number of Clear Days in a Year
© Great Minds PBC
387
A1 ▸ M1 ▸ TD ▸ Lesson 19
EUREKA MATH2
9. Estimate the median and the mean of the distribution. The median is located in the interval of 95 to 110, so the median is between 95 and 110 clear days. The mean is approximately 110 clear days. Debrief with the following questions. How do your estimates for the median and the mean of the data distribution compare to the estimates from the frequency histogram? The estimates are the same. Would you prefer to estimate the median and the mean from a frequency histogram or from a relative frequency histogram? Explain your reasoning. Estimating the balance point seems to require the same sort of thinking regardless of the type of histogram. The shapes of the graphs are exactly the same, and it is only the scaling of the y-axis that has changed. I would prefer to estimate the median from the relative frequency histogram because it seems easier because I just need to add up the relative frequencies until I get to 50 percent.
388
© Great Minds PBC
EUREKA MATH2 A1 ▸ M1 ▸ TD ▸ Lesson 19
Land Debrief 5 min Objectives: Find the mean and the median for data shown in a dot plot and estimate the mean and the median for a data distribution represented by a histogram. Identify whether the mean and/or the median appropriately describes a typical value for a given data set. Pose each question to the class and invite students to respond. Use this time to check that students have summarized the key takeaways from the lesson in the Typical Measures for Data Distributions table. What are some ways to describe the shape of a data distribution? The shape can be described as symmetric (or approximately symmetric) or either leftskewed or right-skewed. What are some ways to describe the center of a data distribution? The center can be described by using either the mean or the median. How are the mean and the median of a data set related to the shape of the distribution? For approximately symmetric distributions, the mean and the median are approximately equal, and both are located approximately in the center of the distribution. For skewed distributions, the mean is pulled in the direction in which the distribution is skewed, while the median is not affected by the skew in the same way. If we want to compare the typical value for two different distributions, what measure of center should we use: the mean or the median? Median and mean are both appropriate measures of center for distributions that are symmetric or approximately symmetric. If one or both distributions are skewed, the median is preferred over the mean to compare measures of center.
© Great Minds PBC
389
EUREKA MATH2
A1 ▸ M1 ▸ TD ▸ Lesson 19
Exit Ticket 5 min Provide up to 5 minutes for students to complete the Exit Ticket. It is possible to gather formative data even if some students do not complete every problem.
390
Teacher Note Assign the Practice problems for completion outside of class or use them in class if time remains after the lesson. Refer students to the Recap for support.
© Great Minds PBC
EUREKA MATH2 A1 ▸ M1 ▸ TD ▸ Lesson 19
Recap
EUREKA MATH2
A1 ▸ M1 ▸ TD ▸ Lesson 19
Student Edition: Grade A1, Module 1, Topic D, Lesson 19
RECAP
Name
Date
19
EUREKA MATH2
A1 ▸ M1 ▸ TD ▸ Lesson 19
2. The histogram shows the distribution of audience ratings (out of 100%) for a sample of 100 movies. Audience Ratings for Movies
Describing the Center of a Distribution 35
In this lesson, we determined the mean and median of a distribution from a dot plot.
•
estimated the mean and median of a distribution from a histogram.
•
determined which measures of center are most appropriate to describe a distribution.
Frequency
30
•
25
The left half of the distribution almost mirrors the right half of the distribution.
20 15 10
Examples
5
1. The dot plot shows the number of grams of protein per serving in 20 different varieties of breakfast cereal.
0
Protein per Serving of Cereal
30
40
50
60
70
80
90
100
Audience Rating (percent)
a. Describe the shape of the distribution. The distribution is approximately symmetric.
0
1
2
3
4
5
6
7
8
b. Use the histogram to estimate the mean and median of the distribution.
9
The mean movie rating is about 65.
Protein (grams)
The median movie rating is between 60 and 70.
a. Find the mean and median. 5 (1) + 4 ( 2 ) + 3 (3) + 2 ( 4 ) + 2 ( 5) + 2 (6 ) + 7 + 8 20
=
67 = 3.35 20
The mean is 3.35 grams. The median is 3 grams.
The balance point is near the center because the distribution is approximately symmetric.
Because there are an even number of data values, the median is the mean of the two middle values. 3+3 2
= 3
c. Determine whether the mean, median, or both would be appropriate to use to describe a typical audience rating for a movie in this sample. Explain.
b. Determine whether the mean, median, or both would be appropriate to use to describe a typical number of grams of protein for one serving of cereal. Explain. The median would be more appropriate to use to describe a typical number of grams of protein for one serving of cereal because the distribution is right-skewed.
© Great Minds PBC
© Great Minds PBC
A histogram does not provide exact data values. The best estimate of the median is within an interval.
Both the mean and the median are appropriate to use to describe the typical audience rating because the distribution is approximately symmetric.
In a right-skewed distribution, the mean is usually greater than the median.
305
306
RECAP
In an approximately symmetric distribution, the mean and the median are about the same value.
© Great Minds PBC
391
EUREKA MATH2
A1 ▸ M1 ▸ TD ▸ Lesson 19
Sample Solutions Expect to see varied solution paths. Accept accurate responses, reasonable explanations, and equivalent answers for all student work.
EUREKA MATH2
A1 ▸ M1 ▸ TD ▸ Lesson 19
Student Edition: Grade A1, Module 1, Topic D, Lesson 19
PRACTICE
Name
Date
19
EUREKA MATH2
A1 ▸ M1 ▸ TD ▸ Lesson 19
For problems 3 and 4, determine whether it is appropriate to use the mean, median, or both to describe a typical value. Explain. 3. A random sample of 70 employees of several different companies was asked how much money they spent on lunch last week.
1. Draw a dot plot of a data distribution representing the ages of 20 people for which the median and the mean are approximately the same value. Explain your reasoning.
Employee Spending on Lunch Last Week (Several Workplaces)
Sample:
25
3
4
5
6
7
8
9
10
11
12
Frequency
20 13
Age (years)
15 10 5
The mean and median are approximately the same value in an approximately symmetric distribution.
0
0
10
20
30
40
50
Money (dollars)
Both the mean and median are appropriate measures of a typical value for the data set because the distribution is approximately symmetric.
2. Draw a dot plot of a data distribution representing the ages of 20 people for which the median is noticeably less than the mean. Explain your reasoning. Sample:
3
4
5
6
7
8
9
10
11
12
13
14
Age (years)
The median is less than the mean in a right-skewed distribution.
© Great Minds PBC
392
307
308
P R ACT I C E
© Great Minds PBC
© Great Minds PBC
EUREKA MATH2 A1 ▸ M1 ▸ TD ▸ Lesson 19
EUREKA MATH2
A1 ▸ M1 ▸ TD ▸ Lesson 19
The median movie length for the movies is 133.5 minutes. Determine by inspection whether the mean movie length is greater than, less than, or the same as the median movie length. Explain your reasoning.
4. Another random sample of 70, this time from the same workplace, was asked how much they spent on lunch last week. Employee Spending on Lunch Last Week (Same Workplace)
The mean movie length is less than the median movie length. The value 121 is several minutes less than the other values in the data set, which makes the mean movie length less than the median movie length.
30
Frequency
25
6. An event was attended by 40 people. The ages of the people are as follows:
20 15 10 5 0
EUREKA MATH2
A1 ▸ M1 ▸ TD ▸ Lesson 19
0
10
20
30
40
50
Money (dollars)
The median is the more appropriate measure to estimate a typical value for the data set because the data distribution is skewed to the right. The larger values in the data set pull the mean toward the right, which makes it a less appropriate measure of the center of the distribution than the median.
6
13
24
27
28
32
32
34
38
42
42
43
48
49
49
51
52
52
53
53
53
53
54
55
56
57
57
60
61
61
62
66
66
66
68
70
72
78
83
97
Create a histogram of the ages by using the provided axes. Use intervals of 10 years. Ages of People Attending an Event 14
5. The dot plot shows the movie lengths in minutes of the 8 Best Picture nominees for the 2019 Oscars.
12
Movie Lengths of Best Picture Nominees for Oscars 2019 Frequency
10
120 121 122 123 124 125 126 127 128 129 130 131 132 133 134 135 136 137
8 6 4
Time (minutes)
2 0
0
10
20
30
40
50
60
70
80
90
100
Age (years)
© Great Minds PBC
© Great Minds PBC
P R ACT I C E
309
310
P R ACT I C E
© Great Minds PBC
393
EUREKA MATH2
A1 ▸ M1 ▸ TD ▸ Lesson 19
EUREKA MATH2
A1 ▸ M1 ▸ TD ▸ Lesson 19
a. Would you describe the histogram as symmetric or skewed? Explain your choice. The histogram is approximately symmetric. If I make a vertical line through the center of the histogram and fold the histogram along the line, the two halves almost match up.
EUREKA MATH2
A1 ▸ M1 ▸ TD ▸ Lesson 19
7. The relative frequency histogram shows the distribution of heights for a sample of 25 players in the Women’s National Basketball Association (WNBA). Heights of 25 WNBA Players 1 0.9 0.8 Relative Frequency
b. Using the histogram, estimate the mean and median. The mean is about 50 years old. The median is between 50 and 60 years old.
c. Would the mean, median, or both appropriately describe the typical age of a person attending this event?
0.7 0.6 0.5 0.4 0.3 0.2 0.1
Because the data distribution is approximately symmetric, both the mean and median would appropriately describe the typical age of a person attending this event.
0
65
68
71
74
77
80
Height (inches)
a. Estimate the mean and median. The median is in the interval of 71 to 74 inches. Because the distribution is skewed to the left, the mean should be less than the median but probably in the interval of 71 to 74 inches.
b. To describe the typical height of these basketball players, is it appropriate to use the mean, median, or both? Explain. Since the distribution is skewed, it is appropriate to use the median because it is a better estimate of the typical height of the basketball players.
© Great Minds PBC
394
P R ACT I C E
311
312
P R ACT I C E
© Great Minds PBC
© Great Minds PBC
EUREKA MATH2 A1 ▸ M1 ▸ TD ▸ Lesson 19
EUREKA MATH2
A1 ▸ M1 ▸ TD ▸ Lesson 19
Remember For problems 8 and 9, solve the inequality for p. 8. 5p + 8 > 28
9. 3(p − 5) ≤ −18
p>4
p ≤ −1
10. The drama club sells bouquets of flowers at the spring musical performances. Each small bouquet sells for $12, and each large bouquet sells for $20. The drama club sells 14 more small bouquets than large bouquets. If the drama club makes $552 in total sales, how many small bouquets do they sell? The drama club sells 26 small bouquets.
11. The soccer coach purchased headbands for the team. The graph shows the relationship between the number of headbands purchased and the total cost. What is the cost per headband?
Total Cost (dollars)
y 26 24 22 20 18 16 14 12 10 8 6 4 2 0
(8, 24)
(4, 12) (2, 6)
1
2
3
4
5
6
7
8
9
10
x
Number of Headbands Purchased
The cost per headband is $3.
© Great Minds PBC
© Great Minds PBC
P R ACT I C E
313
395
20
Teacher Edition: Grade A1, Module 1, Topic D, Lesson 20 LESSON 20
Using Center to Compare Data Distributions Determine the median from data distributions displayed in box plots. Use the median to compare data distributions displayed in box plots.
EUREKA MATH2
A1 ▸ M1 ▸ TD ▸ Lesson 20
Student Edition: Grade A1, Module 1, Topic D, Lesson 20
EXIT TICKET
Name
Date
20
A forest is divided into equal sections, and 100 of these sections are randomly selected. A scientist asks volunteers to record the number of squirrels and birds seen in each section. The box plots show the distributions of the number of squirrels and birds observed in each section. Animal Sightings in
100 Sections of the Forest
Squirrels
Lesson at a Glance In this lesson, students use the median to compare typical values of two data sets. Facilitated by teacher guidance, students construct a box plot from a given relative frequency histogram and engage in a discussion to interpret the information provided in the box plot. They work in groups to compare data distributions represented in box plots. Students share their key takeaways and critique one another’s reasoning through a class discussion focused on interpreting differences in the shapes and centers of data distributions in terms of the situations described.
Birds
Key Questions 0 1 2 3 4 5 6 7 8 9 10 11 12
• Suppose we wanted to compare two data distributions. Should we compare them by using histograms or box plots? Why?
Number of Squirrels and Birds Seen
Is the typical number of squirrels seen in each section of the forest greater than the typical number of birds seen? Justify your answer. Both box plots show that the median number of each type of animal seen in each section of the forest is 5. So the typical number of squirrels seen in each section of the forest is not greater than the typical number of birds seen.
• Besides measures of center, mean and median, what are other ways we can compare two data sets?
Achievement Descriptors A1.Mod1.AD11 Represent data with dot plots, histograms, or box
plots. (S.ID.A.1) A1.Mod1.AD12 Summarize and compare data by shape, center, and
spread outside of context. (S.ID.A.2) A1.Mod1.AD13 Interpret differences in data in the context of the
data sets. (S.ID.A.3) © Great Minds PBC
321
© Great Minds PBC
EUREKA MATH2 A1 ▸ M1 ▸ TD ▸ Lesson 20
Agenda
Materials
Fluency
Teacher
Launch 5 min
• None
Learn 30 min
Students
• Constructing a Box Plot
• None
• Comparing Data Distributions
Lesson Preparation
Land 10 min
• None
© Great Minds PBC
397
EUREKA MATH2
A1 ▸ M1 ▸ TD ▸ Lesson 20
Fluency Describe Distributions Numerically Students describe data sets numerically to prepare for constructing box plots and comparing distributions represented in box plots. Directions: Find the minimum, first quartile, median, third quartile, and maximum for each data set.
Teacher Note These five-number summaries will be useful for calculating range and interquartile range in the lesson 22 Fluency activity. Consider having students keep them easily accessible.
Minimum: 2 First quartile: 3 1.
5, 7, 2, 5, 4
Median: 5 Third quartile: 6 Maximum: 7 Minimum: 0 First quartile: 1
2.
6, 1, 0, 3, 8, 6, 46
Median: 6 Third quartile: 8 Maximum: 46 Minimum: 2.8 First quartile: 2.9
3.
3.1, 3.3, 2.8, 3.6, 3.5, 2.9
Median: 3.2 Third quartile: 3.5 Maximum: 3.6
398
© Great Minds PBC
EUREKA MATH2 A1 ▸ M1 ▸ TD ▸ Lesson 20
Launch
5
Students analyze a relative frequency histogram to determine how the same information could be displayed by using a box plot. Allow students time to work on problem 1, and then have students compare their answers with a partner before debriefing as a class. This histogram is specifically designed with clear breaks at 25%, 50%, 75%, and 100% to facilitate the process of representing the distribution by using a box plot. If students do not notice the breaks, point them out to the class. Consider having students mark the locations of the breaks on the histogram with vertical line segments. It may also be helpful to remind students that 100 people were surveyed. Then ask the following question.
Language Support If students require a high level of support, have them debrief the meaning of problem 1 with a partner before writing a description of a typical value for a reasonable price for the sandwich.
In what type of graph can we clearly display the data as divided into quarters or quartiles? A box plot Box plots are often a convenient way to display data distributions, particularly when comparing two sets of data. Today, we will construct box plots and compare data distributions that are represented in box plots.
Suggested Price for Sandwich
Relative Frequency
1. A restaurant owner invited 100 people to try a new sandwich and to provide feedback by completing a survey. One of the survey questions asked what would be a reasonable price to the nearest dollar for the sandwich. The results are shown in the relative frequency histogram.
0.25 0.2 0.15 0.1 0.05 0
5
6
7
8
9 10 11 12 13 14 15 16 Price (dollars)
© Great Minds PBC
399
EUREKA MATH2
A1 ▸ M1 ▸ TD ▸ Lesson 20
Write 2 or 3 sentences that describe a typical value for the data set and what that means in terms of the suggested reasonable price for the sandwich. The median of the data is 10.5, and the mean is similar to the value of the median. So based on the survey, a typical response was that a reasonable price for the sandwich would be $10 or $11. Describe the distribution in terms of quartiles and what the quartiles mean in terms of the suggested reasonable price for the sandwich. The first quartile is $8.50, and the third quartile is $12.50. This means that, of those surveyed, 25% thought that a reasonable price was either $6, $7, or $8; 25% thought that a reasonable price was $9 or $10; 25% thought a reasonable price was $11 or $12; and 25% thought that a reasonable price was $13, $14, or $15.
Learn Constructing a Box Plot Students construct a box plot and interpret the information displayed.
Language Support
Direct the students’ attention to problem 2. Use the relative frequency histogram from problem 1 to review how to construct a box plot. Review the elements of the five-number summary with students: minimum, first quartile, median, third quartile, and maximum. As a class, use the five-number summary to construct the box plot by using the axis provided in problem 2. If students had difficulty identifying the quartiles in Launch, guide them on how to find the first quartile and the third quartile values by helping them to recall that these values, often abbreviated as Q1 and Q3, are the medians of the lower half and upper half of the data set, respectively. Students may also benefit from labeling each component of the five-number summary on their box plot.
For students who need support organizing the terms in this topic, consider having them add the term box plot to the Univariate Quantitative Data graphic organizer from lesson 18. Students can sketch a box plot in the section labeled Graphical Displays. They can also label components of the box plot, including the five-number summary.
400
© Great Minds PBC
EUREKA MATH2 A1 ▸ M1 ▸ TD ▸ Lesson 20
2. Find each value and create a box plot that shows the distribution from problem 1. Minimum value: $6
Suggested Price for Sandwich
Q1: $8.50 Median: $10.50 Q3: $12.50 5
Maximum value: $15
6
7
8
9 10 11 12 13 14 15 16 Price (dollars)
Once students have constructed the box plot, debrief to ensure they understand how to read and interpret a box plot. Display the relative frequency histogram and the box plot aligned as shown, and then have students align their plots so they can see that 25% of the data falls within each section of the box plot. 0.25 0.2
0.1 0.05 5
6
7
8
9 10 11 12 13 14 15 16 Price (dollars)
© Great Minds PBC
Students first created box plots in grade 6. Note that in Algebra I, the focus is less on the construction of the plots and more about the ability to read and interpret them. A common misconception is for students to equate the size of the parts of the box plot with the amount of data in the part. Be sure to emphasize correct understanding of the box plot throughout the lesson.
0.15
0
Teacher Note
Note that when there is an odd number of data points, there is no consensus among mathematicians as to what to do with the median of the data set when calculating Q1 and Q3. In the Eureka Math2 curriculum, the median is excluded from both halves when calculating the values of Q1 and Q3, which is the method students learn in grade 6.
401
EUREKA MATH2
A1 ▸ M1 ▸ TD ▸ Lesson 20
Then ask the following questions about the data. What percent of the values lie between $12.50 and $15?
25% Explain what this means in terms of this survey. This means that 25% of the people surveyed thought a reasonable price would be $13, $14, or $15. Is it correct to say that more people thought a reasonable price would be somewhere from $13 to $15 than from $11 to $12? No. Each section of the box plot represents 25% of those surveyed, so the same number of people would fall into each section. What are some advantages to displaying data by using a box plot? It is usually easier to identify values like the minimum, median, first and third quartiles, and maximum from a box plot than from a histogram.
Comparing Data Distributions Students compare data distributions displayed by using box plots. Give students time to work in groups on problem 3. Circulate as students work, and listen for understanding about how to read and interpret the information from the box plots.
402
UDL: Engagement Structure peer interactions for success by assigning group roles (e.g., facilitator and timekeeper) and defining responsibilities. Review the directions and group norms before groups begin. Suggest a target completion time and project a visual timer.
© Great Minds PBC
EUREKA MATH2 A1 ▸ M1 ▸ TD ▸ Lesson 20
3. The box plots summarize the life expectancy at birth in countries in Asia and Europe in 2017.
Life Expectancy at Birth
Asia Europe
68 69 70 71 72 73 74 75 76 77 78 79 80 81 82 83 84 85 86 87 88 89 90 Age (years)
a. What is the lowest life expectancy in any country in Europe?
71 years
b. What is the highest life expectancy in any country in Asia?
85 years
c. Is it true that there are more countries in Europe where people have a life expectancy between 76 and 80.5 years than between 80.5 and 89 years? Explain. No. While life expectancy in 25% of the countries in Europe is between 76 and 80.5 years, the life expectancy in 50% of the countries in Europe is between 80.5 and 89 years.
© Great Minds PBC
Teacher Note Some students may be more familiar with calling a box plot a box-and-whisker plot. They may interpret the distributions in box plots by referencing the endpoints of whiskers rather than specifically referencing elements from the five-number summary.
403
A1 ▸ M1 ▸ TD ▸ Lesson 20
EUREKA MATH2
d. Mason says that the number of countries in Asia where people have a life expectancy between 75 and 78 years is the same as the number of countries in Europe where people have a life expectancy between 80.5 and 82 years. Do you agree with Mason? Explain. No. While the same percentage of countries in Europe and Asia have people with life expectancies within the ranges stated, this does not mean that the number of countries in Asia with people who have a life expectancy between 75 and 78 years is the same as the number of countries in Europe with people who have a life expectancy between 80.5 and 82 years because Europe and Asia may not have the same number of countries.
e. How does a typical life expectancy for people in a country in Asia compare with a typical life expectancy for people in a country in Europe? A typical life expectancy for people in a country in Asia is around 75 years, while a typical life expectancy for people in a country in Europe is greater, at around 80.5 years. Therefore, the typical life expectancy in an Asian country is 5.5 years less than the typical life expectancy in a European country.
f. Write a few sentences comparing the life expectancy for people in an Asian country and the life expectancy for people in a European country. The typical life expectancy for people in a European country is greater than that for people in an Asian country. However, 25% of the Asian countries have people with a vlife expectancy between 78 and 85 years, so there are Asian countries where the life expectancy is comparable to that of European countries. But 25% of Asian countries have people with a life expectancy between 69 and 71.5 years, which means that the minimum life expectancy of people in Asian countries is less than the minimum life expectancy of people in European countries.
404
© Great Minds PBC
EUREKA MATH2 A1 ▸ M1 ▸ TD ▸ Lesson 20
Debrief students’ responses as a class by using informal assessment. For instance, pose statements about the distributions, and consider having students give a thumbs-up or thumbs-down to indicate whether they agree or disagree with the statements. The lowest life expectancy for people in any country in Europe is 71 years. (thumbs-up) More countries in Europe have people with a life expectancy between 71 and 82 years than between 82 and 89 years. (thumbs-up) Have different students share one key takeaway based on what they wrote in part (f), and invite the class to respond to each key takeaway by giving a reason why they agree or disagree. Direct students to work on problem 4 either individually or in groups.
Promoting the Standards for Mathematical Practice Students are constructing viable arguments and critiquing the reasoning of others (MP3) when they discuss their summaries about the life expectancies of people in the two continents and explain why they agree or disagree with the summary statements of others. Ask the following questions to promote MP3: • Is Mason’s reasoning in problem 3(d) valid? How do you know?
4. The box plots summarize the average points per game for two sets of NBA players. • The first box plot shows the distribution of the average points per game of the 21 leading scorers in NBA history.
• How would you change your argument to make it more accurate?
• The second box plot shows the distribution of the average points per game of the 21 leading scorers among NBA players who were active through June 2019.
NBA Leading Scorers
Throughout NBA History Active Players
16
18
20
22
24
26
28
30
32
Average Points per Game
© Great Minds PBC
405
A1 ▸ M1 ▸ TD ▸ Lesson 20
EUREKA MATH2
a. Complete each sentence.
100 % of the leading scorers in NBA history had a higher average than the bottom 75% of the leading scorers who were active through June 2019. Approximately 25 % of the leading scorers in NBA history had a higher average than 100% of the leading scorers who were active through June 2019.
b. Describe the shape of each data distribution. Both data distributions are right-skewed.
c. Compare a typical value for average points per game for the leading scorers in NBA history and the leading scorers who were active through June 2019. A typical value for the leading scorers in NBA history is approximately 25 points per game. A typical value for the leading scorers who were active through June 2019 is approximately 21 points per game. The leading players in NBA history typically scored 4 more points per game than the active players. Debrief problem 4, discussing how students determined the shape of the distributions. Use the discussion to further solidify the idea that each section of the box plot represents 25% of the data. How did you know that the data distributions were both right-skewed? For both distributions, the lower 50% of the data is clustered in a smaller range of values than the upper 50% of the data. The median is also located to the left of the center of each box, which means the data between Q1 and the median have a smaller range of values than the data between the median and Q3. This indicates that the distributions are right-skewed.
406
© Great Minds PBC
EUREKA MATH2 A1 ▸ M1 ▸ TD ▸ Lesson 20
Land Debrief 5 min Objectives: Determine the median from data displayed in box plots. Use the median to compare data distributions displayed in box plots. Pose the first question, and give a minute of silent time for students to think about the advantages and disadvantages of each plot. Then ask for students to volunteer answers. Pose the second question. If students do not mention the idea of describing the spread, it can be mentioned as a lead-in to lesson 21 without explicitly naming measures of spread. Suppose we wanted to compare two data distributions. Would we prefer to compare them represented in histograms or box plots? Why? We would rather use histograms to compare two distributions because it is easier for us to tell if the data distribution is skewed and, if so, in which direction. We can also determine the number of observations in a distribution that is represented in a frequency histogram, while we cannot determine the number of observations in a distribution that is represented in a box plot or a relative frequency histogram. We would rather use box plots because it is easy to identify the median, which makes comparing the center of two distributions easier than with a histogram. Besides measures of center, mean and median, what are other ways we can compare two data distributions? We could compare their shape. We also might want to describe how spread out the data values are, for instance, by using range.
© Great Minds PBC
407
EUREKA MATH2
A1 ▸ M1 ▸ TD ▸ Lesson 20
Exit Ticket 5 min Provide up to 5 minutes for students to complete the Exit Ticket. It is possible to gather formative data even if some students do not complete every problem.
408
Teacher Note Assign the Practice problems for completion outside of class or use them in class if time remains after the lesson. Refer students to the Recap for support.
© Great Minds PBC
EUREKA MATH2 A1 ▸ M1 ▸ TD ▸ Lesson 20
Recap
EUREKA MATH2
A1 ▸ M1 ▸ TD ▸ Lesson 20
Student Edition: Grade A1, Module 1, Topic D, Lesson 20 Name
RECAP Date
20
a. Determine whether each statement is true or false. Most of the swimmers’ maximum speeds when not wearing a wetsuit are less than 1.4 meters per second.
Using Center to Compare Data Distributions In this lesson we
False
•
interpreted information about a distribution from a box plot.
•
compared distributions displayed in box plots.
EUREKA MATH2
A1 ▸ M1 ▸ TD ▸ Lesson 20
Example Twelve swimmers each swam 1500 meters two times: once wearing a wetsuit and once without wearing a wetsuit. The box plots show the distributions of the swimmers’ maximum speeds in meters per second.
Only about 25% of the speeds fall into this category.
The range of maximum speeds for the swimmers when not wearing a wetsuit is less than the range of maximum speeds for the swimmers when wearing a wetsuit. True
About 50% of the swimmers’ maximum speeds when wearing a wetsuit are between 1.2 meters per second and 1.5 meters per second.
The typical maximum speed for a swimmer when wearing a wetsuit is less than the typical maximum speed for a swimmer when not wearing a wetsuit.
True
False
Swimming Speeds
The median speed for swimmers when wearing a wetsuit is 1.5 m/s. The median speed for swimmers when not wearing a wetsuit is 1.45 m/s.
No Wetsuit Wetsuit
b. Did a greater percentage of swimmers reach a maximum speed of at least 1.45 meters per second when wearing a wetsuit or when not wearing a wetsuit? Explain.
1 1.05 1.1 1.15 1.2 1.25 1.3 1.35 1.4 1.45 1.5 1.55 1.6 1.65 1.7 1.75 1.8 1.85
A greater percentage, about 75%, of swimmers reached maximum speeds of at least 1.45 meters per second when wearing a wetsuit. This is a greater percentage than the approximately 50% of swimmers who achieved this maximum speed when not wearing a wetsuit.
Maximum Speed (meters per second)
© Great Minds PBC
© Great Minds PBC
323
324
RECAP
© Great Minds PBC
409
EUREKA MATH2
A1 ▸ M1 ▸ TD ▸ Lesson 20
Sample Solutions Expect to see varied solution paths. Accept accurate responses, reasonable explanations, and equivalent answers for all student work.
EUREKA MATH2
A1 ▸ M1 ▸ TD ▸ Lesson 20
Student Edition: Grade A1, Module 1, Topic D, Lesson 20 Name
PRACTICE Date
20
EUREKA MATH2
A1 ▸ M1 ▸ TD ▸ Lesson 20
2. The box plot displays the distribution of heights for a sample of 25 players in the Women’s National Basketball Association (WNBA). Determine whether each statement is true or false and justify your choice.
1. Ana recorded the daily high temperature in degrees Fahrenheit at her house for 10 days.
Heights of 25 WNBA Players
77, 85, 77, 79, 82, 84, 79, 78, 79, 80 Find each value and create a box plot that shows the distribution of the daily high temperatures. Minimum: 77°F
Daily High Temperatures
61 62 63 64 65 66 67 68 69 70 71 72 73 74 75 76 77 78 79 80 81 Height (inches)
Q1: 78°F
a. The minimum height of the basketball players is 66 inches.
Median: 79°F Q3: 82°F Maximum: 85°F
True; the lower whisker begins at 66 inches, which means this is the minimum value.
73 74 75 76 77 78 79 80 81 82 83 84 85 86 87 88
b. Most of the basketball players have a height of 73 inches or less.
Temperature (degrees Fahrenheit)
False; 50% of the basketball players have a height of 73 inches or less.
c. More basketball players are between 69 inches and 73 inches tall than between 73 inches and 76 inches. False; there are the same number of basketball players, 25% of the total, with heights in each interval.
d. Approximately 25% of the basketball players are between 76 inches and 78 inches tall. True; a whisker extends from 76 inches to 78 inches, which means 25% of the players have heights in this interval.
© Great Minds PBC
410
325
326
P R ACT I C E
© Great Minds PBC
© Great Minds PBC
EUREKA MATH2 A1 ▸ M1 ▸ TD ▸ Lesson 20
EUREKA MATH2
A1 ▸ M1 ▸ TD ▸ Lesson 20
3. A timed quiz was given to 20 students. The next day students were given the same quiz, but it was untimed. The distributions of the scores for the quizzes are shown in the box plots.
EUREKA MATH2
A1 ▸ M1 ▸ TD ▸ Lesson 20
4. Why are box plots useful to compare two univariate data sets? Box plots allow for a direct comparison of the quartiles for each distribution. Because box plots display the distributions of data rather than individual data points, I can directly compare data sets with different sample sizes. The minimum and maximum values are also easy to compare, because they are evident in a box plot.
Quiz Scores
Timed
5. The box plot displays the distribution of ages for 200 randomly selected residents from Kenya. The relative frequency histogram displays the distribution of ages for 200 randomly selected residents from the United States.
Untimed
Ages of US Residents
0
1
2
3
4
5
6
7
8
9
10 11 12 13
0.08
Score
0.07 Relative Frequency
a. Which distribution had a higher percentage of scores that are 7 points or greater? Explain. The untimed score distribution had a higher percentage of scores that are at least 7 points. While 25% of the scores on the timed quiz are 7 points or higher, 50% of the scores on the untimed quiz are 7 points or higher.
Ages of Kenya Residents
Kenya Residents
b. Describe a typical score on the timed quiz and a typical score on the untimed quiz. A typical score on the timed quiz is 5 points. A typical score on the untimed quiz is 7 points.
20
40
60
80
0
0
15
30
45
60
75
90
105
Age (years)
b. Estimate the percentage of the people in each distribution who are at least 50 years old. Kenya: between 0% and 25%
The teacher can conclude that the results were better but not because it was untimed. A variable other than whether the test was timed also might have affected students’ performance. For example, students may have scored better because they have seen the quiz questions before.
© Great Minds PBC
100
The United States distribution has a greater percentage of people who are at least 20 years old. Only 50% of the Kenya residents are at least 20 years old, versus 75% of the United States residents.
d. Can the teacher conclude that students had better scores on the second quiz because it was untimed? Explain.
327
0.03
a. Which country’s distribution has a greater percentage of people who are at least 20 years old? Explain.
The median for the untimed quiz was 2 points higher than the timed quiz. Fifty percent of the scores on the untimed quiz were between 7 and 10 points, and 50% of the data on the timed quiz were between 5 and 8 points. The minimum score on the timed quiz was 1 point, while the minimum score on the untimed quiz was 3 points.
P R ACT I C E
0.04
0.01
Age (years)
© Great Minds PBC
0.05
0.02
0
c. Based on the box plots, the teacher concludes that students did significantly better on the untimed quiz than on the timed quiz. Give three pieces of evidence that support this conclusion.
0.06
United States: between 30% and 35%
328
P R ACT I C E
© Great Minds PBC
411
EUREKA MATH2
A1 ▸ M1 ▸ TD ▸ Lesson 20
EUREKA MATH2
A1 ▸ M1 ▸ TD ▸ Lesson 20
Remember For problems 6 and 7, solve the inequality for c. 6. −34c + 18c ≤ 8
7. −4(2c − 8) < −24
c>7
c ≥ −1
2
8. Consider the equation |3x − 5| = 4.
a. Rewrite the equation as a compound statement.
3x − 5 = 4 or 3x − 5 = −4 b. Use the compound statement from part (a) to find the solution set of the original equation.
{ 13 , 3} 9. Suppose Nina and Danna each walk at a constant rate. The equation d =
16 t represents 5
Nina’s distance d in miles for t hours of walking. The graph represents Danna’s distance during the time she walks. Who walks at a greater rate? Explain. y
Danna’s Distance (miles)
3.5 3 2.5 2 1.5 1 0.5 0
0.25
0.5
0.75
1
1.25
1.5
1.75
x
Time (hours)
Because Nina walks at a rate of
16 mph, or 3.2 mph, and Danna walks at a rate of 3 mph, 5
Nina walks at a greater rate than Danna.
© Great Minds PBC
412
P R ACT I C E
329
© Great Minds PBC
21
Teacher Edition: Grade A1, Module 1, Topic D, Lesson 21 LESSON 21
Describing Variability in a Univariate Distribution with Standard Deviation Calculate standard deviation to represent a typical variation from the mean of a data distribution. Use standard deviation to compare two data distributions.
EUREKA MATH2
A1 ▸ M1 ▸ TD ▸ Lesson 21
Student Edition: Grade A1, Module 1, Topic D, Lesson 21 Name
Date
EXIT TICKET
21
EUREKA MATH2
A1 ▸ M1 ▸ TD ▸ Lesson 21
2. The following data set lists the fuel economy of 5 cars in miles per gallon.
23.4, 24.7, 24.7, 24.9, 27.9 1. The dot plot for data set A shows scores on a math quiz that had 4 questions worth 2 points each. The dot plot for data set B shows scores on a math quiz that had 8 questions worth 1 point each.
The mean of the data set is approximately 25.1 miles per gallon, and the standard deviation is approximately 1.7 miles per gallon.
Which statement correctly compares the mean and the standard deviation of data set A and data set B?
A different data set lists the fuel economy of 6 other cars in miles per gallon.
22.9, 23.7, 23.7, 25.9, 26.5, 50.0
Data Set A
Without calculating the standard deviations, explain why the standard deviation of the second data set is larger than the standard deviation of the first data set. The standard deviation of the second data set is larger than that of the first data set because the second data set has a large outlier of 50.0 miles per gallon.
0
2
4
6
8
6
8
Quiz Scores
Data Set B
0
2
4 Quiz Scores
A. Data set A and data set B have the same mean and standard deviation. B. Data set A has a larger mean and a larger standard deviation than data set B. C. Data set A has a larger mean than data set B, but data set A and data set B have the same standard deviation. D. Data set A and data set B have the same mean, but data set A has a larger standard deviation than data set B.
© Great Minds PBC
337
338
EXIT TICKET
© Great Minds PBC
© Great Minds PBC
EUREKA MATH2 A1 ▸ M1 ▸ TD ▸ Lesson 21
Lesson at a Glance In this lesson, students engage in a class discussion to compare two data sets with similar measures of center and different amounts of spread, realizing that measures of center alone may be inadequate to compare the data distributions. After being introduced to the standard deviation as a measure of spread, students calculate the standard deviations of the data sets, first by hand and then by using technology. Students use the Always Sometimes Never routine and visual support from a digital interactive to discuss the effect of individual data values on the standard deviation of a data set. This lesson introduces the terms variance and standard deviation.
Key Questions • What does standard deviation reveal about a data distribution? • Why is comparing the mean or median of two data sets not enough to describe differences in their distributions?
Achievement Descriptors A1.Mod1.AD12 Summarize and compare data by shape, center, and spread outside
of context. (S.ID.A.2) A1.Mod1.AD13 Interpret differences in data in the context of the data sets. (S.ID.A.3)
© Great Minds PBC
415
EUREKA MATH2
A1 ▸ M1 ▸ TD ▸ Lesson 21
Agenda
Materials
Fluency
Teacher
Launch 5 min
• None
Learn 30 min
Students
• Measuring Spread with Standard Deviation
• Statistics technology
• Using Technology to Calculate Standard Deviation
• None
Lesson Preparation
• Changing Values and Standard Deviation
Land 10 min
416
© Great Minds PBC
EUREKA MATH2 A1 ▸ M1 ▸ TD ▸ Lesson 21
Fluency Find Deviations from the Mean Students find deviations from the mean for individual data values to prepare for calculating standard deviation. Directions: Find the mean of each data set and the deviations from the mean for each value in the data set. For example, if the mean of a data set is 3, a data value of 2 has a deviation of 2 − 3, or −1. 1.
2, 4, 5, 5, 7
2.
0, 1, 3, 6, 6, 8, 46
3.
2.8, 2.9, 3.1, 3.3, 3.5, 3.6
© Great Minds PBC
Mean: 4.6 Deviations: −2.6, −0.6, 0.4, 0.4, 2.4 Mean: 10 Deviations: −10, −9, −7, −4, −4, −2, 36 Mean: 3.2 Deviations: −0.4, −0.3, −0.1, 0.1, 0.3, 0.4
417
A1 ▸ M1 ▸ TD ▸ Lesson 21
Launch
EUREKA MATH2
5
Students compare two data distributions to illustrate the need for using a statistical measure of variation. Pose the following questions to students. Do you think the typical amount of sleep high school students get differs from the typical amount of sleep middle school students get? How could we test your conjecture? Invite students to share their responses. Highlight responses that suggest comparing the typical amounts of sleep for high school students and for middle school students. For example, students could collect data from high school and middle school students selected at random and then compare the shapes of the data distributions. Measures of center and spread for the data set could also be compared. Direct students’ attention to the dot plots displayed in problem 1. Have students think− pair−share to compare typical values for the distributions. Allow students 2 minutes to think about the question, and then allow them to share their thoughts with a partner. Circulate as students work, and listen for students using different characteristics for comparison (e.g., mean, median, and mode).
418
© Great Minds PBC
EUREKA MATH2 A1 ▸ M1 ▸ TD ▸ Lesson 21
1. A principal wants to know how much sleep students get each night. She randomly selects 8 students from ninth grade and 8 students from sixth grade and asks them to report the number of hours they slept the night before to the nearest hour. The dot plots display the results.
Hours of Sleep for Sixth Grade Students
Hours of Sleep for Ninth Grade Students
4
5
6
7
8
9
10 11 12
Amount of Sleep (hours)
4
5
6
7
8
9
10 11 12
Amount of Sleep (hours)
Based on the distributions, compare the typical amount of sleep for the ninth grade students with the typical amount of sleep for the sixth grade students. The typical amount of sleep for the ninth grade students is about the same as the typical amount of sleep for the sixth grade students. The mean and median of both distributions is 8 hours. Use the following questions to facilitate a brief discussion. Emphasize that a measure of center does not necessarily provide a complete picture of a data distribution. It is okay if students do not recall specific measures of spread, as these measures are addressed in this lesson and in lesson 22. Based on the sample distributions, does the typical amount of sleep for the ninth grade students differ from that of sixth grade students? Justify your reasoning. The typical amount of sleep for the ninth grade students is about the same as that for the sixth grade students. The mean and median for both groups is 8 hours.
© Great Minds PBC
419
A1 ▸ M1 ▸ TD ▸ Lesson 21
EUREKA MATH2
Can we use these data sets to draw general conclusions about the amount of sleep ninth grade students get in relation to the amount of sleep sixth grade students get? Why? We cannot use these data sets to draw general conclusions about the amount of sleep ninth grade students get in relation to the amount of sleep sixth grade students get. The principal took random samples of the students but only asked them about how much sleep they got the night before. They could have gotten less sleep just on that night because of a sports event, for example, so it would be better to ask about more nights. In what ways are the distributions different? The distributions have different shapes. The ranges are also different. What other measures besides measures of center can we use to compare the distributions? We can use measures of spread, such as range, interquartile range, or mean absolute deviation. Today, we will learn about new measures of spread and use them to compare distributions of univariate data.
Learn Measuring Spread with Standard Deviation Students measure spread in a small set of data by calculating the standard deviation by hand. Direct students’ attention to problem 2, which shows the data set for ninth grade students from problem 1 in a table. Allow students about 1 minute to determine the mean of the data set if they did not calculate it during Launch, and have them record the value beneath the table. Students will complete the remaining parts of problem 2 as a class as the lesson progresses.
420
© Great Minds PBC
EUREKA MATH2 A1 ▸ M1 ▸ TD ▸ Lesson 21
Verify that students correctly calculated the mean, and briefly discuss its meaning in context. 2. Ninth Grade Students Amount of Sleep (hours)
Deviation from the Mean
Squared Deviation from the Mean
6
−2
4
7
−1
1
7
−1
1
8
0
0
8
0
0
8
0
0
10
2
4
10
2
4
Sum of deviations: 0
Sum of squared deviations: 14
Mean: 8 hours Estimate the typical deviation from the mean of the ninth grade student data set. The typical deviation is about 1 hour.
© Great Minds PBC
421
EUREKA MATH2
A1 ▸ M1 ▸ TD ▸ Lesson 21
Variance: the sum of the squared deviations from the mean divided by one less than the sample size Standard deviation: the square root of the variance; can be used to measure the typical distance from the mean
=2 Variance: 2, because 14 7 Standard deviation: Approximately 1.4 hours, because
2 ≈ 1.4
What does the standard deviation represent in this context? The ninth grade students’ sleep times typically vary by about 1.4 hours from the mean sleep time of 8 hours. Use the following prompts to introduce the terms variance and standard deviation. Model how to calculate standard deviation by hand by using the data from the data set for the ninth grade students. In previous grades, you calculated spread in a data distribution by using deviations from the mean. What does a deviation from the mean measure? A deviation measures how far each value is above or below the mean of the data set. Look at the dot plot that displays the distribution of ninth grade student data. What is a typical deviation from the mean for these times? Write this value below the table. Sample: About an hour How do we calculate deviations from the mean? We calculate deviations from the mean by subtracting the mean from the data value. Have students calculate the deviations from the mean for the data set for ninth grade students and record the deviations in the table. Also have students calculate and record the sum of the deviations.
422
© Great Minds PBC
EUREKA MATH2 A1 ▸ M1 ▸ TD ▸ Lesson 21
What do you notice about the sum of the deviations from the mean of the data set? The sum of the deviations is 0. Why is the sum of the deviations from the mean 0? The mean is the balance point, so the sum of the positive deviations is the same as the sum of the negative deviations. In grades 6 and 7, we calculated the mean of the absolute value of the deviations (MAD) to represent a typical distance from the mean. We can also use the standard deviation to calculate a typical deviation, and this measure is especially useful for distributions that are mound-shaped. Instead of using the absolute value of the deviations for this problem, we use squared deviations to find a typical distance from the mean. Why might we want to find the absolute value of the deviations or square the deviations instead of just finding the average of the deviations?
Differentiation: Additional Challenge If students quickly compute the sample standard deviation, encourage them to consider why dividing by n − 1 instead of by n becomes less important when calculating the sample standard deviation as the sample size increases. Challenge students to justify their reasoning in terms of the calculation (the two values will approach one another as n increases) and in terms of the sample size (as sample size increases, it eventually approaches the population size).
To find an average, we usually add the numbers and then divide by the count, but that will not work with deviations, because they always sum to 0. Briefly mention to the students that, in addition to ensuring that the sum is not 0, squaring the deviations is preferred in more advanced statistics. Have students calculate the squared deviations from the mean and record them in their tables. Also have students calculate and record the sum of the squared deviations. We have now found the sum of the squared deviations. To find the average squared deviation, we would typically divide the sum by the number of values. However, dividing by one less than the sample size provides a more accurate measure of average squared deviation. Because we have 8 values in this distribution, we divide the sum of the squared deviations by 7. The resulting value is called the variance.
© Great Minds PBC
423
EUREKA MATH2
A1 ▸ M1 ▸ TD ▸ Lesson 21
Have students read the definitions of variance and standard deviation. Debrief by using the following points: • The variance is the sum of the squared deviations from the mean divided by one less than the sample size. • The variance is a squared value that is measured in square units. It represents the typical squared deviation. • To get a measure with units that are the same as those of the original measures, we take the square root of the variance. The square root of the variance is called the standard deviation. It can be used to measure the typical distance from the mean. Have students calculate the variance and standard deviation and record them.
Language Support If students need additional support with the terminology, consider having them add the terms variance and standard deviation to the Measures of Spread section of the Univariate Quantitative Data graphic organizer from lesson 18. Along with the terms, students can include a brief description of what each value measures, how to calculate the values, and an example of each term.
How close is the standard deviation to the typical deviation you estimated? My estimate of 1 is pretty close to the standard deviation, which is about 1.4. What does the standard deviation represent in this problem? Record your thoughts in the space at the end of problem 2. In this problem, the standard deviation means that the difference between the typical amount of sleep a ninth grade student gets and the mean amount of sleep for the sample is about 1.4 hours. Have students turn and talk about what standard deviation measures and how it is calculated. Answer any questions students have about standard deviation. Then direct their attention to problem 3. Have students predict whether the standard deviation of the distribution of data for sixth grade students will be greater than, less than, or about the same as that of the data set for ninth grade students. Then have students compute the standard deviation for the data set for sixth grade students, recording their work in the table.
424
© Great Minds PBC
EUREKA MATH2 A1 ▸ M1 ▸ TD ▸ Lesson 21
3.
Sixth Grade Students Amount of Sleep (hours)
Deviation from the Mean
Squared Deviation from the Mean
7
−1
1
8
0
0
8
0
0
8
0
0
8
0
0
8
0
0
8
0
0
9
1
1
Sum of deviations: 0
Sum of squared deviations: 2
Mean: 8 hours Variance: 27 Standard deviation: about 0.5 hours, because
2 ≈ 0.5 7
Interpret the standard deviation in this context. The sixth grade students’ sleep times typically vary by about 0.5 hours from the mean sleep time of 8 hours.
© Great Minds PBC
425
A1 ▸ M1 ▸ TD ▸ Lesson 21
EUREKA MATH2
Debrief with the following questions. What does the standard deviation measure? It measures the typical distance from the mean. Why is the standard deviation smaller for the data set for sixth grade students? What does that tell us in this situation? The values are closer together for the data set for sixth grade students. It tells us that there is less variation in the amount of sleep in the sixth grade student sample than in the ninth grade student sample. Suppose data are collected from two other sixth grade students. One student got approximately 3 hours of sleep the previous night, and the other student got approximately 13 hours of sleep the previous night. How do these values compare to the other values in the data set? The value of 3 hours is much smaller than the other values. The value of 13 hours is much larger than the other values. Remember that we use the term outlier to describe a value in a data set that is unusually small or large. The values of 3 hours and 13 hours would be considered outliers. How do the outliers affect the mean? They don’t affect the mean because they cancel one another out. Because 3 hours and 13 hours both differ from the mean by 5 hours, but in different directions, their deviations sum to 0. They are exactly balanced on opposite sides of the mean, so they do not change the balance point. How do the outliers affect the standard deviation of the sixth grade student distribution? Explain.
426
© Great Minds PBC
EUREKA MATH2 A1 ▸ M1 ▸ TD ▸ Lesson 21
They increase the standard deviation because they increase the typical distance from a data value to the mean of the distribution. Including the new values in the data set for sixth grade students would increase the standard deviation to approximately 2.4 hours of sleep. Should we conclude that the typical variation in the revised sixth grade student data set is greater than that of the ninth grade student data set? No. The values of 3 and 13 are outliers, which increased the standard deviation. Overall, the sixth grade student data set is still less varied than the ninth grade student data set. Emphasize that an outlier increases the standard deviation of a distribution, sometimes greatly.
UDL: Representation Consider pausing after emphasizing that an outlier increases the standard deviation of a distribution. Prompt students to think and generate questions that address how the inclusion of an outlier increases the standard deviation of a data distribution. This prompt supports information processing and signifies the importance of the information.
Using Technology to Calculate Standard Deviation Students calculate standard deviation by using technology to compare variations in two data sets. Direct the students’ attention to problem 4. Model how to use technology to calculate standard deviation for the ninth grade student data set, and have students record the value. Then have students work in pairs to calculate the standard deviation for the sixth grade student data set by using technology, and record the results. Ask students to compare the standard deviations of the data sets. Confirm the results with the students, answering any questions that arise. Then pose the following question. When would it be more efficient to use technology to calculate the standard deviation of a data set? It is more efficient to calculate standard deviation by using technology for data sets with large sample sizes and when the deviations from the mean are not integers.
© Great Minds PBC
Teacher Note An online keyword search of the phrase standard deviation calculator should provide links to applications that allow students to quickly enter data and calculate the standard deviation. Make sure students use a calculator for sample standard deviation. Population standard deviation is found by dividing the sum of the squared deviations by the sample size instead of one less than the sample size.
427
EUREKA MATH2
A1 ▸ M1 ▸ TD ▸ Lesson 21
4. The following dot plots show a larger random sample of ninth grade students and sixth grade students. Use technology to find the standard deviation of each data set.
Hours of Sleep for Ninth Grade Students
Hours of Sleep for Sixth Grade Students
Promoting the Standards for Mathematical Practice Students use appropriate tools strategically (MP5) when they calculate the standard deviation for a data set by using pencil and paper and by using technology and then reflect on the efficiency of using one tool over the other. Ask the following questions to promote MP5:
4
5
6
7
8
9
10 11 12
4
Amount of Sleep (hours)
5
6
7
8
9
10 11 12
Amount of Sleep (hours)
Calculate the standard deviation of the ninth grade student data set. The standard deviation of the ninth grade student data set is approximately 1.29 hours. Calculate the standard deviation of the sixth grade student data set.
• Which tool would be the most efficient to calculate the standard deviation for a large data set? Why? • Which tool would be the most helpful to calculate the standard deviation for a data set with only a few values? Why? • How can you estimate the standard deviation? Does your estimate sound reasonable?
The standard deviation of the sixth grade student data set is approximately 1.32 hours. Compare the standard deviations of the samples. The standard deviations of the samples are nearly the same.
Changing Values and Standard Deviation Students analyze the effects of changing values on the standard deviation of a distribution. Open and display the Standard Deviation interactive, which shows the sixth grade student data set from Launch. Direct the students to the statements in problems 5–7. Use the Always Sometimes Never routine to engage students in constructing meaning
428
© Great Minds PBC
EUREKA MATH2 A1 ▸ M1 ▸ TD ▸ Lesson 21
and discussing their ideas. Give students 2 minutes of silent time to evaluate whether the statements are always, sometimes, or never true. Have students discuss their thinking with a partner. Circulate and listen as students talk. Identify a few students to share their thinking. Next, facilitate a class discussion. Invite students to share their thinking with the class. Encourage them to provide examples and nonexamples to support their claim. Students can be instructed to use the demo to support their reasoning by moving points and examining how this affects the standard deviation of the data set. Determine whether each statement is always, sometimes, or never true. Explain your reasoning. 5. Decreasing the value of a point will decrease the standard deviation of a data set. Sometimes true. Decreasing the value will decrease the standard deviation of a data set only if it decreases the typical distance between a point in the data set and the mean of the data set. 6. Increasing the value of a point will increase the standard deviation of a data set. Sometimes true. Increasing the value will increase the standard deviation of a data set only if it increases the typical distance between a point in the data set and the mean of the data set. 7. Including an outlier in the calculation will increase the standard deviation of a data set. Always true. Including an outlier will increase the typical distance between a value in the data set and the mean of the data set. Conclude by coming to the consensus that the statements in problems 5 and 6 are sometimes true. A change in a data value that decreases the typical distance from the mean will decrease the standard deviation, and a change in a data value that increases the typical distance from the mean will increase the standard deviation. The effect of changing a value in a distribution on the standard deviation is related to how that change affects distance from the mean, not whether the value itself increases or decreases. The statement in problem 7 is always true because an outlier increases the typical distance from a data value to the mean of the data set.
© Great Minds PBC
429
EUREKA MATH2
A1 ▸ M1 ▸ TD ▸ Lesson 21
Land Debrief 5 min Objectives: Calculate standard deviation to represent a typical variation from the mean of a data distribution. Use standard deviation to compare two data distributions. Use the following prompts to guide a discussion about standard deviation. What does standard deviation reveal about a data distribution? It is the typical distance of a value from the mean of the distribution. Why is comparing the mean or median of two data sets not enough to describe differences in their distributions? The mean and median are measures of center. However, there may be other differences in the distributions that they do not show, such as spread or how much variation there is in each data set. All of our examples today were approximately symmetric distributions. Is standard deviation an appropriate measure of the typical variation in a skewed distribution? Explain your reasoning, and provide an alternative measure of spread if you do not think the standard deviation would be appropriate to measure the typical variation in a skewed distribution. I don’t think it would be a good measure of spread. Because standard deviation measures typical distance from the mean and mean is not the most appropriate measure of center to represent typical values in a skewed distribution, standard deviation may not be the most appropriate measure of variation for skewed distributions. The interquartile range would be a more appropriate measure of spread.
Exit Ticket 5 min
Teacher Note Assign problems for completion outside of class or use them in class if time remains after the lesson. Refer students to the Recap for support.
Provide up to 5 minutes for students to complete the Exit Ticket. It is possible to gather formative data even if some students do not complete every problem.
430
© Great Minds PBC
EUREKA MATH2 A1 ▸ M1 ▸ TD ▸ Lesson 21
Recap
EUREKA MATH2
A1 ▸ M1 ▸ TD ▸ Lesson 21
Student Edition: Grade A1, Module 1, Topic D, Lesson 21 Name
RECAP Date
EUREKA MATH2
A1 ▸ M1 ▸ TD ▸ Lesson 21
21
c. Record deviations from the mean and the squared deviations from the mean in the table. Subtract the mean from each data value.
Describing Variability in a Univariate Distribution with Standard Deviation In this lesson, we •
calculated the variance and standard deviation of a distribution, by hand and with technology.
•
used standard deviation to compare two distributions.
•
explored the effects of changing data values on the standard deviation of a distribution.
Example The list shows the ages in years of 5 children on the swings at a playground.
6, 8, 8, 11, 12
Terminology The variance is the sum of the squared deviations from the mean of a data set divided by one less than the sample size. Variance is a measure
12 − 6 = 6
The standard deviation is a measure of variability appropriate for data distributions that are approximately symmetric. Standard deviation is often used to describe the typical distance from the mean.
6
−3
9
8
−1
1
8
−1
1
11
2
4
12
3
9
9 + 1 + 1 + 4 + 9 4
= 6
6
The deviation from the mean is negative when the data value is less than the mean. The squared deviation is always positive.
To calculate variance, divide by 1 less than the sample size. The sample size is 5. So divide by 4.
e. What is the standard deviation of the distribution? Round to the nearest tenth.
b. What is the mean of the distribution? 5
Squared Deviation from the Mean
d. What is the variance of the distribution?
6 years
6 + 8 + 8 + 11 + 12
Deviation from the Mean
of the overall variation from the mean in a sample.
It is calculated by taking the square root of the variance of a data set.
a. What is the range of the data set?
Age (years)
6 ≈ 2.449
= 9
2.4 years
9 years
f.
The standard deviation is the square root of the variance.
Interpret the standard deviation in context. The typical distance the ages of the children are from the mean age is about 2.4 years.
© Great Minds PBC
© Great Minds PBC
339
340
RECAP
© Great Minds PBC
431
EUREKA MATH2
A1 ▸ M1 ▸ TD ▸ Lesson 21
Sample Solutions Expect to see varied solution paths. Accept accurate responses, reasonable explanations, and equivalent answers for all student work.
EUREKA MATH2
A1 ▸ M1 ▸ TD ▸ Lesson 21
Student Edition: Grade A1, Module 1, Topic D, Lesson 21 Name
PRACTICE Date
21
EUREKA MATH2
A1 ▸ M1 ▸ TD ▸ Lesson 21
3. The following list shows the quiz scores for five students selected at random.
6, 7, 9, 9, 9 a. What is the range of the data set?
1. At a high school, ninth grade students are required to run a timed mile as part of a yearly physical fitness test. Each data set shows the times it took 5 randomly selected ninth grade students to run a mile, rounded to the nearest minute.
3 points
Data Set 1: 9, 9, 9, 9, 9
b. What is the mean of the data set?
8 points
Data Set 2: 7, 8, 9, 10, 11 a. Write a sentence that compares the centers and spreads of the data sets.
c. Record the deviations from the mean and the squared deviations from the mean in the table.
The centers of the data sets are the same, but data set 2 is more spread out than data set 1.
Quiz Score
Deviation from the Mean
Squared Deviation from the Mean
6
−2
4
7
−1
1
9
1
1
9
1
1
9
1
1
b. Interpret what the centers and spreads mean in this situation. The typical time it took the ninth grade students in each data set to run the mile was 9 minutes. Every student in data set 1 completed the mile run in about 9 minutes, while the typical deviation of students’ run times from the mean as measured by the standard deviation was about 1.6 minutes in data set 2. 2. A manager of a trampoline park recorded attendance at the park each day over several months. The mean of the data set is 85 people, and the standard deviation is 6 people. a. Explain what the mean of this data set tells you about the number of people who attended the trampoline park.
d. What is the variance for the data distribution?
Typically, 85 people attended the trampoline park each day.
2 e. What is the standard deviation for the data distribution? Round to the nearest tenth.
b. Explain what the standard deviation of this data set tells you about the number of people who attended the trampoline park.
1.4 points
The typical deviation between the attendance at the trampoline park each day and the mean attendance is 6 people.
f.
Interpret the standard deviation in context. The typical difference between the number of points scored on the quiz and the typical score on the quiz is approximately 1.4 points.
© Great Minds PBC
432
341
342
P R ACT I C E
© Great Minds PBC
© Great Minds PBC
EUREKA MATH2 A1 ▸ M1 ▸ TD ▸ Lesson 21
EUREKA MATH2
A1 ▸ M1 ▸ TD ▸ Lesson 21
EUREKA MATH2
A1 ▸ M1 ▸ TD ▸ Lesson 21
Race 1
5. A grocery store manager wondered whether there was a consistent number of apples in the bags of apples sold at the store. The manager randomly selected 20 bags of apples and recorded the number of apples in each bag. The mean number of apples in each bag was 8, and the standard deviation was approximately 2 apples.
Race 2
Randomly Selected Bags of Apples
4. At a track meet, there are three men’s 100-meter races. The times in which the runners completed each race are recorded to the nearest 0.1 second and are shown in the dot plots.
Race 3
10.5
11.0
11.5
12.0
12.5
13.0
Time (seconds)
a. Without calculating, rank the races in order from least standard deviation to greatest standard deviation.
4
Race 3, race 1, race 2
7
8
9
10
11
12
13
a. How could the manager redistribute the apples into bags so that the mean of the distribution is unchanged but the standard deviation is 0? All the bags of apples would need to have exactly 8 apples in them.
I estimated the mean for each data set. Then I estimated the typical distance between each point and the mean. c. Which estimate is closest to the standard deviation for the data from race 1?
b. How could the manager redistribute the apples into bags so that the mean and range of the distribution are unchanged but the standard deviation is maximized?
A. 0.1 second
The manager would need to place 5 apples each in 10 bags and then 11 apples each in the other 10 bags.
B. 0.75 seconds C. 1.15 seconds D. 1.30 seconds
c. Suppose another bag of apples is added to the original sample. Describe what would happen to the standard deviation if the bag contains the following amounts of apples:
d. Use your calculator to find the mean and standard deviation for race 1. Round each value to the nearest hundredth. How close was your estimate of standard deviation to the actual value?
i. 9 apples Standard deviation would decrease.
Race 1 mean:
ii. 11 apples
11.73 seconds
Standard deviation would increase.
Race 1 standard deviation:
iii. 3 apples
0.77 seconds
Standard deviation would increase.
My estimate was within a few hundredths of a second of the actual standard deviation.
© Great Minds PBC
6
Number of apples
b. Explain how you were able to rank the standard deviations of the distributions without calculating.
© Great Minds PBC
5
P R ACT I C E
343
344
P R ACT I C E
© Great Minds PBC
433
EUREKA MATH2
A1 ▸ M1 ▸ TD ▸ Lesson 21
EUREKA MATH2
A1 ▸ M1 ▸ TD ▸ Lesson 21
Remember For problems 6 and 7, solve the inequality. 6. 5 −
7. −0.5(−4m − 6) > 4
4 m ≤ −31 5
m ≥ 45
m > 0.5
8. Which equations or inequalities have no solution? Choose all that apply. A. |x + 2| = −5 B. −|x + 2| = 5 C. −|x + 2| = −5 D. |x + 2| < −5
E. |x + 2| ≥ −5
9. Find the slope of the line. y 10 9 8 7 6 5 4 3 2 1 −10 −9 −8 −7 −6 −5 −4 −3 −2 −1 0 −1
1
2
3
4
5
6
7
8
9 10
x
−2 −3 −4 −5 −6 −7 −8 −9 −10
−
1 5
© Great Minds PBC
434
P R ACT I C E
345
© Great Minds PBC
22
Teacher Edition: Grade A1, Module 1, Topic D, Lesson 22 LESSON 22
Estimating Variability in Data Distributions Estimate and compare variation in data distributions represented by histograms. Use the interquartile range to compare the variation in data distributions represented by box plots and dot plots.
EUREKA MATH2
A1 ▸ M1 ▸ TD ▸ Lesson 22
Student Edition: Grade A1, Module 1, Topic D, Lesson 22
EXIT TICKET
Name
Date
22
EUREKA MATH2
A1 ▸ M1 ▸ TD ▸ Lesson 22
2. Two different locations have a speed limit of 70 kilometers per hour. Ana uses a speed detector to collect random samples of the speeds, in kilometers per hour, of cars traveling past the two locations in one day. The box plots display the distributions of those random samples.
1. The histogram shows the distribution of the weights in pounds of 50 dogs at a dog show.
Location 1
Weights of Dogs
Location 2 18 16 Frequency
14
50
12
70
80
90
100
Speed (kilometers per hour)
10 8
Suppose Ana claims that the amount of variation in the driving speeds at location 1 is greater than the amount of variation in the driving speeds at location 2.
6 4
a. Provide one form of evidence from the data that supports Ana’s claim.
2 0
60
0
15
30
45
60
Sample:
75
The range is greater for the distribution of the driving speeds at location 1 than for the distribution of the driving speeds at location 2.
Weight (pounds)
Which value is the best estimate of the standard deviation of the distribution? A. 15 pounds b. Provide one form of evidence from the data that refutes Ana’s claim.
B. 30 pounds C. 37.5 pounds
Sample:
D. 75 pounds
The interquartile range is greater for the distribution of the driving speeds at location 2 than for the distribution of driving speeds at location 1.
© Great Minds PBC
353
354
EXIT TICKET
© Great Minds PBC
© Great Minds PBC
EUREKA MATH2 A1 ▸ M1 ▸ TD ▸ Lesson 22
Lesson at a Glance In this lesson, students work in pairs and engage in discussions to determine appropriate measures of spread to represent and compare data distributions. Students compare the standard deviation of a mound-shaped distribution with that of a distribution that is skewed, leading to a class discussion of whether standard deviation is an appropriate measure of spread for skewed data distributions. Students estimate and compare variations of distributions represented with histograms, in which standard deviation can only be estimated. Students use the interquartile range to compare the variations in distributions displayed with box plots, including distributions that contain outliers. As with previous lessons, discussions focus on the importance of interpreting comparisons of the shape, center, and spread of data distributions within real-world contexts.
Key Questions • How does the shape of a distribution influence your decision about which measures of center and variation to use to compare data sets? • How can the presence of outliers affect measures of center and variation?
Achievement Descriptors A1.Mod1.AD12 Summarize and compare data by shape, center, and spread outside
of context. (S.ID.A.2) A1.Mod1.AD13 Interpret differences in data in the context of the data sets. (S.ID.A.3)
© Great Minds PBC
437
EUREKA MATH2
A1 ▸ M1 ▸ TD ▸ Lesson 22
Agenda
Materials
Fluency
Teacher
Launch 5 min
• None
Learn 30 min
Students
• Estimating Spread from Histograms
• None
• Measuring Variation from Box Plots
Lesson Preparation
Land 10 min
• None
438
© Great Minds PBC
EUREKA MATH2 A1 ▸ M1 ▸ TD ▸ Lesson 22
Fluency Find Range and Interquartile Range Students find the range and interquartile range of data sets to prepare for comparing variation in distributions represented by box plots and dot plots. Directions: Find the range and the interquartile range of each data set. 1.
5, 7, 2, 5, 4
2.
6, 1, 0, 3, 8, 6, 46
3.
3.1, 3.3, 2.8, 3.6, 3.5, 2.9
© Great Minds PBC
Range: 5 Interquartile range: 3 Range: 46 Interquartile range: 7 Range: 0.8 Interquartile range: 0.6
439
EUREKA MATH2
A1 ▸ M1 ▸ TD ▸ Lesson 22
Launch
5
Students compare data sets with mound-shaped distributions to skewed distributions to illustrate that the range and standard deviation are not always appropriate measures of spread. Direct students’ attention to the dot plots in problem 1. Allow students 2 minutes to think− pair−share to compare the spreads of the distributions without calculating. Instruct students to record their thoughts. Circulate as students work, and listen for varying responses and reasoning, including student responses that apply the definition of standard deviation as a typical distance from the mean of a data set and those that compare the spread by using range. 1. As part of a project, Mrs. Allen’s Algebra I class collected data to determine whether the amount of homework increased as grade level increased. One group surveyed a random sample of 50 ninth grade students and 50 eleventh grade students and asked them how many hours each week they spent on homework. The dot plots show the results of the survey.
440
Weekly Hours of Homework for Ninth Grade Students
Weekly Hours of Homework for Eleventh Grade Students
0 1 2 3 4 5 6 7 8 9 1011121314
0 1 2 3 4 5 6 7 8 9 1011121314
Time (hours)
Time (hours)
© Great Minds PBC
EUREKA MATH2 A1 ▸ M1 ▸ TD ▸ Lesson 22
Compare the spreads of the distributions. Explain your reasoning. The ninth grade student distribution has a greater spread. The range of the ninth grade distribution is 11 hours, while the range of the eleventh grade distribution is 10 hours. Use the following questions to facilitate a brief discussion. Some of you said that the ninth grade student data set had a greater spread. What evidence supports this conclusion? The range is greater for the ninth grade student data set. If students do not mention range, help them recall that the range is the difference between the maximum and minimum data values and can be used to describe the overall spread in a data set. Some of you said that the eleventh grade student data set had a greater spread. What evidence supports this conclusion? The average distance from a typical value to the mean looks like it is greater for the eleventh grade data set than for the ninth grade data set. The standard deviation represents the distance between a typical value in the data set and the mean of the data set. Does comparing standard deviations of the ninth grade student data set and eleventh grade student data set provide an appropriate measure of the differences in the spreads of the distributions? Explain your reasoning. I don’t think standard deviation is an appropriate measure of variability for the eleventh grade student data distribution because the distribution is skewed. Because the mean is not the most appropriate measure of center for a skewed distribution, it does not seem to be appropriate to measure the variation of a skewed distribution by using standard deviation, which measures a typical distance from the mean. In previous grades, we also measured the range of the middle 50% of the data to represent the spread for a data set. What do we call that measure? Interquartile range Point out to students that for some distributions, range and standard deviation are not the most representative measures of spread, either because the distributions are skewed or because the data are summarized in a way where standard deviation cannot be calculated. Today, we will continue to compare the spreads in distributions by using estimations of standard deviation and the interquartile range (IQR). © Great Minds PBC
441
EUREKA MATH2
A1 ▸ M1 ▸ TD ▸ Lesson 22
Learn Estimating Spread from Histograms Students estimate the standard deviation of distributions displayed in histograms and use the estimates to compare distributions of univariate data. Direct students’ attention to the histogram that displays the distribution of battery life for brand D batteries. Read the scenario aloud to the students and discuss it with them. Have the students analyze the graph for brand D for about 1 minute, and answer any questions that arise. It may be beneficial to point out that the histogram displays relative frequencies. Then allow students to work on problems 2 and 3 with a partner. Circulate as students work, and listen for students’ reasoning as they estimate the mean and standard deviation. A product review team is conducting a study of various brands of batteries. The team measures the battery life of a random sample of 100 batteries from brand D and a random sample of 100 batteries from brand E.
Brand D Battery Life
Relative Frequency
0.40 0.30 0.20 0.10 0
85
95
105 115 125 135 145 155 165 Battery Life (hours)
442
© Great Minds PBC
EUREKA MATH2 A1 ▸ M1 ▸ TD ▸ Lesson 22
2. Estimate the mean of the battery life distribution for brand D. The mean battery life appears to be about 110 hours. 3. Which value is closest to the value of the standard deviation of the battery life distribution? Circle the best estimate.
3 hours 10 hours 30 hours Once most students have finished, invite students to share their responses, highlighting the following points: • Because the distribution for brand D battery life is approximately symmetric, the mean should have a value similar to that of the median, near the center of the distribution. • We can estimate the mean to be a value of about 110 hours, but we can’t find its exact value because histograms do not display exact values. • The typical deviation is likely larger than 3 hours from the estimated mean because the interval size is 10 hours. • Almost all of the data is at a distance of 30 hours or less from the mean, so 30 is too large to represent a typical distance from the mean. • While 10 hours is the best estimate of the standard deviation given the three options provided, this value is an approximation. Students will likely have difficulty estimating the standard deviation from the distribution. To help students visualize the estimates, encourage them to sketch a vertical line segment at the center of the distribution. Then have them sketch a vertical line segment 3 units below the center and sketch another segment 3 units above the center. Ask the following questions. Approximately what fraction of the values in the distribution are at a distance of 3 hours or less from the center? About a third
© Great Minds PBC
443
A1 ▸ M1 ▸ TD ▸ Lesson 22
Approximately what fraction of the values in the distribution are at a distance greater than 3 hours from the center? About two-thirds Because standard deviation measures the typical distance of a value from the mean of a distribution, is 3 hours a good estimate of the standard deviation for the distribution of brand D battery life? Explain your thinking. No, it is too small. There are clearly more values that are greater than 3 hours from the mean than there are values less than 3 hours from the mean. Repeat the same process for the estimates of 10 hours and 30 hours. Students should recognize that 10 hours is the best estimate of the three choices. The goal of this discussion is to help students identify a rough estimate for the standard deviation and to identify values that are clearly too small or too large. The interval between one standard deviation less than the mean and one standard deviation greater than the mean should incorporate approximately 68% of the data for a mound-shaped distribution. Emphasize to the students that both the mean and standard deviation values are estimates. Because histograms do not display exact data values, the exact mean or standard deviation cannot be calculated, but estimations can be made and used to compare distributions of data.
EUREKA MATH2
Promoting the Standards for Mathematical Practice When students decontextualize the data on battery life and interpret the measures of center and spread of the data sets through context, they are reasoning abstractly and quantitatively (MP2). Ask the following questions to promote MP2: • What does the difference in estimated standard deviations tell you about the battery lives? • Does your answer make sense as a reasonable amount of variation for the battery lives?
Allow students to work on problems 4–6 independently. Then have them briefly share their responses with a partner.
444
© Great Minds PBC
EUREKA MATH2 A1 ▸ M1 ▸ TD ▸ Lesson 22
Brand E Battery Life
Relative Frequency
0.40 0.30 0.20 0.10 0
85
95
105 115 125 135 145 155 165 Battery Life (hours)
4. Estimate the mean of the battery life distribution for brand E. The mean of the distribution is about 130 hours. 5. Is the standard deviation for this distribution greater than, about the same as, or less than the standard deviation for the brand D battery life distribution? Explain your reasoning. The spreads for both distributions look about the same, so the standard deviation for the distributions is probably similar. 6. Compare the distribution of brand D battery life with the distribution of brand E battery life. Interpret the comparison in context. The typical battery life of brand E is greater than that of brand D. The overall variation in battery life is about the same for both battery brands.
© Great Minds PBC
445
EUREKA MATH2
A1 ▸ M1 ▸ TD ▸ Lesson 22
Invite a few students to share their answers with the class. Focus on the comparisons of the mean and standard deviation and their meaning in context. In this situation, students should describe what differences in center or spread indicate about battery lives. The goal of this activity is for students to recognize that the typical battery life of brand E is greater than that of brand D and that the overall variation in battery life is about the same for both battery brands. Suppose the product review team tested one additional battery for brand E and found that its life was 300 hours. How would this added value affect the mean and standard deviation of the distribution? Explain your reasoning. It would increase both the mean and the standard deviation because the added value is an outlier that is much greater than the other values in the distribution. Display the relative frequency histogram for brand F batteries. Then conclude the activity by facilitating a brief discussion reviewing when standard deviation is most appropriate to use as a measure of variation for a distribution.
Brand F Battery Life
Relative Frequency
0.40 0.30 0.20 0.10 0
85
95
105 115 125 135 145 155 165 Battery Life (hours)
446
© Great Minds PBC
EUREKA MATH2 A1 ▸ M1 ▸ TD ▸ Lesson 22
Look at the relative frequency histogram for brand F batteries. Would standard deviation be an accurate measure of variation for this distribution? Explain your thinking. Standard deviation would not be the best measure of typical variation because the distribution is skewed. Measures of center for skewed distributions are usually better estimated by using the median, so it would not make sense to use standard deviation, which measures variation from the mean, as a measure of variation for a skewed distribution. What measures of center and variation might be more appropriate for this distribution? Median and interquartile range
Measuring Variation from Box Plots Students use the interquartile range to compare variation in distributions displayed in box plots and dot plots. To transition to measuring variation for data distributions represented in box plots, ask students the following question. What other graphical display can be used to represent a distribution if we are only provided with a histogram? Turn and talk to your partner. After about a minute, invite volunteers to share their responses. Students should recognize they cannot represent the data by using dot plots because histograms do not record exact values. However, the distributions could be represented by using box plots if the quartiles are easy to identify from the histogram. Direct students’ attention to the Maximum Speeds of Roller Coasters box plots. Provide about 2 minutes for students to notice and wonder about the distributions. Invite volunteers to share their thoughts. Students are likely to wonder about the points to the right of the box plot for the distribution of steel roller coaster speeds. Explain that these values are outliers, and box plots may display outliers as points that are separated from the rest of the plot. This means that the rightmost edge of the box plot represents the maximum value, excluding outliers.
© Great Minds PBC
Language Support To support students with terms revisited from grades 6 and 7, have them add the terms range and interquartile range to the Measures of Spread section of the Univariate Quantitative Data graphic organizer from lesson 18. Students could include a brief description of what each measure means, how to calculate the values, and an example of each term.
Differentiation: Challenge If students seem especially interested in knowing how to determine whether values in a data set are outliers, consider presenting them with one common definition of an outlier. Outlier: any data value that is more than 1.5 times the IQR above the third quartile, or less than 1.5 times the IQR below the first quartile. Have students apply the definition to verify that the speeds of the two fastest steel roller coasters are outliers.
447
EUREKA MATH2
A1 ▸ M1 ▸ TD ▸ Lesson 22
Similarly, the leftmost edge of the box plot represents the minimum value, excluding outliers. Note also that technology is used to identify outliers, and some calculators or apps may use different rules for doing so. Have students label the outliers on the plot and record the answers to problem 7. Emphasize that outliers are included in calculations of center and spread. A company that owns amusement parks was studying wooden and steel roller coasters of their competitors. A researcher selected a random sample of 75 wooden roller coasters and 75 steel roller coasters and recorded their maximum speeds. The distribution of the data is shown in the box plots.
Maximum Speeds of Roller Coasters
Wooden Steel
0
10
20
30
40
50
60
70
80
90
100
110
120
130
Speed (miles per hour)
7. How many outliers does each distribution have? Estimate their values. Outliers for wooden coasters: no outliers Outliers for steel coasters: two outliers, about 118 miles per hour and 127 miles per hour Give students time to complete problems 8–12 in pairs. Circulate while students work, listening for students’ reasoning for selecting a particular measure of variation to compare the distributions. If students have difficulty identifying the interquartile ranges from the box plots, remind them that the interquartile range (IQR) is the difference between the third quartile and the first quartile.
448
© Great Minds PBC
EUREKA MATH2 A1 ▸ M1 ▸ TD ▸ Lesson 22
8. What is the approximate difference in the median speeds of the distributions? The difference in the median speeds of the distributions is approximately 3 miles per hour. 9. What is the approximate difference in the ranges of the distributions? Range of the distribution for wooden roller coasters: approximately 36 miles per hour Range of the distribution for steel roller coasters: approximately 122 miles per hour Difference in the ranges of the distributions: approximately 86 miles per hour The range of the distribution of speeds for the steel roller coasters is about 86 miles per hour greater than the range of the distribution of speeds for the wooden roller coasters. 10. What is the approximate difference in the interquartile ranges of the distributions? IQR of the distribution for wooden roller coasters: approximately 10 miles per hour IQR of the distribution for steel roller coasters: approximately 35 miles per hour Difference in the IQRs of the distributions: approximately 25 miles per hour The interquartile range of the distribution of speeds for the steel roller coasters is about 25 miles per hour greater than the interquartile range of the distribution of speeds for the wooden roller coasters. 11. Which measure more accurately compares the variation in the distributions? Justify your reasoning. The interquartile range more accurately compares the variation in the distributions. The outliers in the distribution of speeds for the steel roller coasters greatly increases the range of the distribution, but they do not affect the interquartile range. Therefore, the interquartile range is a better estimate of the spread in the distribution. 12. Compare the distributions of roller coaster maximum speeds. Interpret your findings in context. The typical maximum speed for wooden roller coasters is about the same as the typical maximum speed for steel roller coasters. However, the maximum speeds of steel roller coasters vary more than the maximum speeds of wooden roller coasters.
© Great Minds PBC
449
EUREKA MATH2
A1 ▸ M1 ▸ TD ▸ Lesson 22
Facilitate a brief discussion comparing the distributions. How does the difference in the medians of the distributions compare to the differences in the interquartile ranges or ranges of the distributions? The difference in the medians of the distributions is much smaller than the differences in ranges or interquartile ranges. Which is a better measure of variation to compare the distributions: the range or the IQR? The IQR is a better measure for comparing the variations of the distributions because outliers in the distribution of steel roller coaster speeds greatly increase the range, making it a less appropriate measure of variation. Suppose the distribution of maximum speeds of steel roller coasters was skewed to the right. Would this affect your choice of measure to describe the variation in the distribution?
UDL: Action & Expression To support students as they complete problems 8–12, consider providing a reference sheet that includes the following: • A box plot with labels that identify the minimum, first quartile, median, third quartile, and maximum • Directions for finding the interquartile range, IQR = Q3 − Q1 Additionally, encourage students to label the first and third quartiles on the box plots in their books.
No, the IQR still represents the range of the middle 50% of the data in the distribution, regardless of the shape of the distribution. Ask for a few volunteers to share their responses to problem 12, and discuss the comparison of the distributions as a class, making sure that students compared both the typical maximum speeds and the variation of maximum speeds. Direct students’ attention back to the dot plots from problem 1. Have students work in pairs to calculate the medians and interquartile ranges of the distributions. Consider assigning half of the pairs to calculate the measures for the ninth grade student data distribution and half of the pairs to calculate the measures for the eleventh grade student data distribution. Then facilitate a brief discussion comparing the distributions. What are the median and IQR for the ninth grade student data distribution? The median is 5 hours, and the IQR is 4 hours. What are the median and IQR for the eleventh grade student data distribution? The median is 11 hours, and the IQR is 4 hours.
450
© Great Minds PBC
EUREKA MATH2 A1 ▸ M1 ▸ TD ▸ Lesson 22
Compare the distributions. Explain any differences in context. The ninth grade student data distribution is approximately symmetric and moundshaped, while the eleventh grade student data distribution is skewed to the left. The typical number of hours spent completing math homework weekly is about 6 hours greater for eleventh grade students than for ninth grade students, and the variability in the amount of time spent completing math homework weekly is the same for eleventh grade students and ninth grade students.
Land Debrief 5 min Objectives: Estimate and compare variation in data distributions represented by histograms. Use the interquartile range to compare the variation in data distributions represented by box plots and dot plots. Use the following prompts to guide a discussion about estimating variation in distributions represented by histograms or box plots. From which graphs can we estimate the mean and standard deviation? What about the median, range, and interquartile range? Dot plots and histograms can be used to estimate the mean and standard deviation. Dot plots, histograms, and box plots can be used to estimate the median, range, and interquartile range. How does the shape of a distribution influence your decision about which measures of center and variation to use to compare data sets? If a distribution is skewed, the median and interquartile range are the most appropriate measures to use to estimate the center and variation in distributions. For approximately symmetric distributions, any of the measures we have learned about are appropriate.
© Great Minds PBC
451
EUREKA MATH2
A1 ▸ M1 ▸ TD ▸ Lesson 22
How can the presence of outliers affect measures of center and variation? Outliers can increase or decrease the mean drastically so that the mean is not an appropriate measure of a typical value in a distribution. Outliers also increase the range and standard deviation so those are not appropriate measures of spread in a distribution. Outliers have little to no effect on the median and interquartile range.
Exit Ticket 5 min Provide up to 5 minutes for students to complete the Exit Ticket. It is possible to gather formative data even if some students do not complete every problem.
Teacher Note Assign the Practice problems for completion outside of class or use them in class if time remains after the lesson. Refer students to the Recap for support.
452
© Great Minds PBC
EUREKA MATH2 A1 ▸ M1 ▸ TD ▸ Lesson 22
Recap
EUREKA MATH2
A1 ▸ M1 ▸ TD ▸ Lesson 22
Student Edition: Grade A1, Module 1, Topic D, Lesson 22 Name
RECAP Date
EUREKA MATH2
A1 ▸ M1 ▸ TD ▸ Lesson 22
22
b. Which value is closest to the value of the standard deviation of the age distribution? Circle the best estimate.
8 years
Estimating Variability in Data Distributions
16 years
In this lesson, we •
estimated the mean and standard deviation of a distribution from a histogram.
•
compared spreads of distributions in box plots and dot plots.
24 years c. On the histogram, mark the locations that are approximately one standard deviation greater than the mean and one standard deviation less than the mean.
Examples 2. The box plot summarizes the numbers of videos that the random sample of video streaming service subscribers streamed over the last month.
1. The histogram shows the ages of a random sample of 100 subscribers of one streaming video service.
A data point separated from the rest of the plot in a box plot is an outlier.
The distribution is mound-shaped. About two-thirds of the data values lie within one standard deviation of the mean of the distribution.
The mean is located at approximately the center of the
30
Frequency
25
0
4
6
8
10 12 14 16 18 20 22 24 26 28 30 32 Number of Videos
distribution.
20
a. Identify any outliers in the distribution.
15
0 videos
10
b. What is the range of the distribution?
5 0
2
Videos Streamed Last Month
30 videos 10
20
30
40
50
60
c. What is the interquartile range (IQR) of the distribution?
70
Age (years)
8 videos
IQR is the difference between Q3 and Q1.
24 − 16 = 8
The IQR is a better measure of spread for this distribution. The outlier increases the range of the distribution significantly, but it has little to no effect on the IQR. So the IQR better represents the overall spread of the data.
About 40 years
© Great Minds PBC
30 − 0 = 30
d. Is the range or IQR a better measure of the spread for this distribution? Explain.
a. Estimate the mean age of a subscriber to the streaming video service. Mark it on the histogram with a vertical line.
© Great Minds PBC
Include outliers when calculating measures of center and spread. The minimum value in this distribution is 0 videos, not 13 videos.
355
356
RECAP
© Great Minds PBC
453
EUREKA MATH2
A1 ▸ M1 ▸ TD ▸ Lesson 22
Sample Solutions Expect to see varied solution paths. Accept accurate responses, reasonable explanations, and equivalent answers for all student work.
EUREKA MATH2
A1 ▸ M1 ▸ TD ▸ Lesson 22
Student Edition: Grade A1, Module 1, Topic D, Lesson 22
PRACTICE
Name
Date
22
EUREKA MATH2
A1 ▸ M1 ▸ TD ▸ Lesson 22
2. Suppose all the members of a different high school swim team were asked how many hours they studied last week, estimated to the nearest half hour. The box plot shows the data distribution. Weekly Time Spent Studying Swim Team B
1. All the members of a high school swim team were asked how many hours they studied last week, estimated to the nearest half hour. The histogram summarizes the results. Weekly Time Spent Studying Swim Team A 12
0
Frequency
10
4
6
8
10
12
14
16
18
20
22
24
26
28
30
32
34
36
38
40
Study Time (hours)
8
a. What is the range of the distribution?
6
33 hours
4 2 0
2
b. Interpret the range in this context. 2.5
7.5
12.5
17.5
22.5
27.5
32.5
37.5
The student who studied the longest amount of time studied 33 hours more than the student who studied for the least amount of time.
42.5
Study Time (hours)
a. Which value best estimates the mean study time?
c. Identify any outliers in the distribution.
A. 5 hours
There are no outliers in this distribution.
B. 10 hours C. 20 hours
d. What is the interquartile range (IQR) of the distribution?
14 hours
b. Which value best estimates the standard deviation of the study time? A. 2.5 hours B. 5 hours
e. Interpret the IQR in this context.
C. 10 hours
The middle 50% of the number of hours studied lies within a range of 14 hours.
D. 20 hours
© Great Minds PBC
454
357
358
P R ACT I C E
© Great Minds PBC
© Great Minds PBC
EUREKA MATH2 A1 ▸ M1 ▸ TD ▸ Lesson 22
EUREKA MATH2
A1 ▸ M1 ▸ TD ▸ Lesson 22
EUREKA MATH2
A1 ▸ M1 ▸ TD ▸ Lesson 22
4. City A hosts a marathon. The ages of the runners in the marathon are summarized in the histogram.
3. Now, suppose all the members of a high school track team were asked how many hours they studied last week. The box plot shows the data distribution.
a. Estimate the mean age of runners in the city A marathon. Mark this value on the histogram with a vertical line.
Weekly Time Spent Studying Track Team
Ages of Participants City A Marathon 16000 0
2
4
6
8
10
12
14
16
18
20
22
24
26
28
30
32
34
36
38
14000
40 Frequency
Study Time (hours)
a. Identify any outliers in the distribution.
40 hours is an outlier.
8000 6000 2000 0
37 hours
18
28
38
48
58
68
78
Age (years)
c. What is the IQR of the distribution?
The mean age of runners in the city A marathon is about 40 years old.
11 hours
Circle the best estimate of the standard deviation of the ages of runners in the city A marathon.
d. Is the range or IQR a better measure of the spread in the distribution? Explain your reasoning.
5 years 10 years
The IQR is a better measure of spread. The outlier increases the range of the data set by a lot while it has either no effect or a smaller effect on the IQR. Because the IQR is less affected by the outlier, it better represents the overall spread of the distribution.
© Great Minds PBC
10000
4000
b. What is the range of the distribution?
© Great Minds PBC
12000
P R ACT I C E
359
15 years
360
P R ACT I C E
© Great Minds PBC
455
EUREKA MATH2
A1 ▸ M1 ▸ TD ▸ Lesson 22
EUREKA MATH2
A1 ▸ M1 ▸ TD ▸ Lesson 22
EUREKA MATH2
A1 ▸ M1 ▸ TD ▸ Lesson 22
c. Approximately what percentage of the runners’ ages lies between one standard deviation less than the mean and one standard deviation greater than the mean?
b. On the histogram, mark with vertical lines the locations that are approximately one standard deviation greater than the mean and less than the mean.
About 66% of the runner’s ages lies within one standard deviation of the mean age.
Ages of Participants City A Marathon
City B also hosted a marathon. The ages of the runners in the marathon are summarized in the histogram.
16000
Ages of Participants City B Marathon
Frequency
14000 12000 10000
100
8000
80
6000 Frequency
4000 2000 0
18
28
38
48
58
68
78
60 40 20
Age (years)
The standard deviation of the ages of the runners in the city A marathon is about 10 years.
0
18
28
38
48
58
68
78
Age (years)
d. Estimate the mean of the age of the runners in the city B marathon. The mean age of runners in the city B marathon is about 48 years old. e. Circle the best estimate for the standard deviation of the runners in the city B marathon.
5 years 10 years 15 years f.
For which distribution is the standard deviation of the ages of the runners greater? Why is it greater? The standard deviation of the ages of runners is greater for the city B distribution than for the city A distribution. The ages of runners in the city B marathon are typically farther from their mean age compared to the city A runners’ ages. The ages of runners in the city A marathon are more clustered around the mean.
© Great Minds PBC
456
P R ACT I C E
361
362
P R ACT I C E
© Great Minds PBC
© Great Minds PBC
EUREKA MATH2 A1 ▸ M1 ▸ TD ▸ Lesson 22
EUREKA MATH2
A1 ▸ M1 ▸ TD ▸ Lesson 22
EUREKA MATH2
A1 ▸ M1 ▸ TD ▸ Lesson 22
5. Consider the box plots of the distributions of delay times in minutes of 60 randomly selected Big Air flights in November 2019 and December 2019.
a. Calculate the mean and median for the data from each class.
Delay Times for Big Air Flights
November December
Class
Mean
Median
English
2.3 movies
2 movies
Math
3.1 movies
2 movies
b. Calculate the standard deviation and IQR for the data from each class. Round to the nearest tenth.
0 10 20 30 40 50 60 70 80 90 100 110 120 Delay Time (minutes)
Compare the distributions of delay times in context by using measures of shape, center, and spread. Both distributions are right-skewed. The typical delay times as measured by the median of each distribution are about the same at 30 minutes. The variation in delay times is greater for the November flights, as both the IQR and range are greater for the November distribution than for the December distribution.
Math Class
0, 0, 0, 1, 2, 2, 2, 4, 4, 16
Interquartile Range (IQR)
English
1.9 movies
3 movies
Math
4.8 movies
4 movies
The math class data set has an outlier of 16 movies.
d. Which measures of spread are most affected by the outlier? Explain your reasoning. The standard deviation is affected more than the IQR because the outlier increases the average distance between the values in the data set and the mean, while the outlier does not affect the range of the middle 50% of the data as much.
Number of Movies Watched by Students Last Month
0, 0, 1, 1, 2, 2, 3, 4, 4, 6
Standard Deviation
c. Identify the outliers in either data set.
6. Nina selected 10 students at random from her English class and 10 students at random from her math class. She asked each student how many movies they had watched in the previous month. The students’ responses are included in the lists shown.
English Class
Class
e. Is the typical number of movies watched last month by students in Nina’s English class different from the typical number of movies watched last month by students in Nina’s math class? Explain your reasoning. The typical number of movies watched by students in Nina’s English class is about the same as the typical number of movies watched by students in her math class. The median values for the data sets are identical.
© Great Minds PBC
© Great Minds PBC
P R ACT I C E
363
364
P R ACT I C E
© Great Minds PBC
457
EUREKA MATH2
A1 ▸ M1 ▸ TD ▸ Lesson 22
EUREKA MATH2
A1 ▸ M1 ▸ TD ▸ Lesson 22
EUREKA MATH2
A1 ▸ M1 ▸ TD ▸ Lesson 22
10. The dot plot shows the distribution of the workout lengths on Tuesday for a random sample of 40 gym members. Times are rounded to the nearest 5 minutes.
7. Three data sets are shown in the dot plots.
Time Spent at Gym
Data Set A Data Set B Data Set C
20 21 22 23 24 25 26 27 28 29 30 0
a. Compare the distributions by using measures of shape, center, and variation.
5 10 15 20 25 30 35 40 45 50 55 60 65 Time (minutes)
Data sets A and B are approximately symmetric, while data set C is left-skewed. The medians of data sets A and B are both 25, and the median of data set C is 24.5, which is only 0.5 units smaller than those of A and B. The IQR of data set A is 2, the IQR of data set B is 5, and the IQR of data set C is 3. Using interquartile range, data set A has the least spread, followed by data set C, and then data set B.
a. What is the shape of the distribution of workout lengths? The distribution of workout lengths is left-skewed. b. Is 30 minutes a typical workout length for this sample of gym members? Justify your answer.
b. Which measures of center and variation did you choose to compare? Why?
No, 30 minutes is not a typical workout length for these gym members. Three-fourths of the sample spent at least 40 minutes working out.
I chose the median and IQR to compare the data sets because data set C is skewed, so the median and IQR may be more typical measures of center and spread than the mean and standard deviation.
11. Write the equation of the line in slope-intercept form. y 10
c. How do these data sets illustrate the importance of measuring variation to describe a data distribution?
8 6
If I only used the centers to compare the distributions, all I can conclude is that they have about the same typical value. Analyzing the measures of variation tells us that these distributions differ from one another in how spread out they are.
4 2 −10
Remember
−
3 > t 8
−6
−4
−2
0
2
4
6
8
10
x
−2
For problems 8 and 9, solve the inequality. 8. −25 > 8
−8
( 3t − 3)
−4
9.
−6
2 4 t − t ≤ 30 9 3
t ≥ −27
−8 −10
y = −3x + 6 © Great Minds PBC
458
P R ACT I C E
365
366
P R ACT I C E
© Great Minds PBC
© Great Minds PBC
23
Teacher Edition: Grade A1, Module 1, Topic D, Lesson 23 LESSON 23
Comparing Distributions of Univariate Data Compare two or more data sets by using shape, center, and variability. Interpret differences in data distributions in context.
EUREKA MATH2
A1 ▸ M1 ▸ TD ▸ Lesson 23
Student Edition: Grade A1, Module 1, Topic D, Lesson 23
EXIT TICKET
Name
Date
A1 ▸ M1 ▸ TD ▸ Lesson 23
23
EUREKA MATH2
b. Compare the centers of the data distributions in this context. Because the distribution represented by the dot plot is approximately symmetric, the mean and the median are both appropriate measures of center. The mean of this sample is approximately 10 push-ups, and the median is 10 push-ups.
The dot plot displays the distribution of the number of push-ups done in a row by a random sample of 20 people.
Because the distribution represented by the box plot is skewed to the right, the median is the most appropriate measure of center of the distribution. The median of the sample is 10 push-ups. The typical number of push-ups completed in a row by one person is about the same for both samples.
0
2
4
6
8
10
12
14
16
18
20
Number of Push-ups
The box plot displays the distribution of the number of push-ups done in a row by a random sample of 200 people.
0
2
4
6
8
10
12
14
16
18
c. Compare the variation of the data distributions in this context. The variation of the second sample is greater than the variation of the first sample. The interquartile range of the second sample is 10, which is greater than the range of the first sample, which is 8. This means that variation in the middle 50% of the second sample is greater than the variation in the entire first sample. Therefore, there is greater variation in the number of push-ups completed in a row in the second sample than in the first sample.
20
Number of Push-ups
a. Compare the shapes of the data distributions. The distribution of the number of push-ups displayed by the dot plot is approximately symmetric. The distribution of the number of push-ups displayed by the box plot appears right-skewed.
© Great Minds PBC
371
372
EXIT TICKET
© Great Minds PBC
© Great Minds PBC
EUREKA MATH2 A1 ▸ M1 ▸ TD ▸ Lesson 23
Lesson at a Glance In this lesson, students work in groups to compare two or more sets of univariate data by using tables, graphs, and summary statistics provided to them. They work in their groups to informally compare the sets of data they are assigned, and they select statistics appropriate to the shapes of the distributions to compare the center and spread of the data sets. Students interpret differences in the data sets in terms of the real-world context and present their findings to the rest of the class. Students conclude the topic by debriefing the process of comparing two or more sets of univariate data in a class discussion. Note: To save time, students are provided with graphical representations and the summary statistics for the data sets they compare. If time permits, consider providing only the raw data, and have students display the data in a graph and calculate appropriate statistics to compare the data sets.
Key Questions • What do the shape, center, and spread reveal about distributions of univariate data? • Why is it important to always interpret data in context?
Achievement Descriptors A1.Mod1.AD12 Summarize and compare data by shape, center, and spread outside
of context. (S.ID.A.2) A1.Mod1.AD13 Interpret differences in data in the context of the data sets. (S.ID.A.3)
© Great Minds PBC
461
EUREKA MATH2
A1 ▸ M1 ▸ TD ▸ Lesson 23
Agenda
Materials
Fluency
Teacher
Launch 5 min
• None
Learn 30 min
Students
• Comparing Sets of Univariate Data
• Statistics technology
• Presenting the Findings
• Copies of Data Sets (1 problem per student group and 1 copy per student)
Land 10 min
Lesson Preparation • Divide the class into groups of four. • Make enough copies of each problem in the Data Sets pages for each student to have a copy of their group’s assigned problem. This should be approximately 4–8 copies of each problem.
462
© Great Minds PBC
EUREKA MATH2 A1 ▸ M1 ▸ TD ▸ Lesson 23
Fluency Analyze Distributions with Appropriate Vocabulary Students describe shapes of distributions to prepare for comparing two or more data sets by using shape, center, and variability. Directions: Use the appropriate data display to answer each question. 9 8 7 6 5 4 3 2 1 0
0
5
10
15
20
25
1.
hat is the shape of the W distribution in the histogram?
2.
hat measure of center W is appropriate to describe a typical data value for the data in the histogram: mean, median, or both?
3.
hat is the shape of the W distribution in the dot plot?
© Great Minds PBC
0
1
2
3
4
5
Symmetric
Both
Left-skewed
463
A1 ▸ M1 ▸ TD ▸ Lesson 23
Launch
EUREKA MATH2
5
Students informally compare univariate data sets. There are four data sets provided for this activity in the Data Sets pages. Divide students into groups of four, and assign each group to one of the four sets: Population, Home Runs, Rainfall, or Gasoline. Depending on class size, it is possible that two or three groups may be assigned the same set of data. Distribute to each group the information associated with their data set. Direct students to read the information provided. Invite students to write the name of their assigned data set and one sentence describing the context for their group’s assigned data set. Encourage them to write down thoughts that informally compare the distributions based on the students’ brief, informal analysis of the raw data. Data sets you were assigned: In one sentence, describe the context for the data sets you will compare. Informal comparison of the data sets: Today, we will analyze the distributions of the data sets provided and choose appropriate statistics to compare them. We will interpret differences between the data sets in context and present our findings.
464
© Great Minds PBC
EUREKA MATH2 A1 ▸ M1 ▸ TD ▸ Lesson 23
Learn Comparing Sets of Univariate Data Students use graphs and statistics to compare sets of univariate data. Direct the students’ attention to the bulleted list of tasks to complete for this activity. Answer any initial questions students have about the expectations. Then allow students to work in the groups formed during Launch, only intervening if a group has difficulty progressing. Students should have access to statistics technology. However, students should consider when and how to use technology to analyze the data. You will compare the data sets assigned to your group by completing the following tasks: • Determine which measures of center and spread are appropriate to use to compare the data distributions.
Promoting the Standards for Mathematical Practice When students are given data sets from a real-life scenario and are asked to analyze and compare them, they are making sense of the problem (MP1). Ask the following questions to promote MP1: • How can you explain this context in your own words? • What information do you need to compare the data sets? • What is your plan to compare the data sets?
• Calculate the measures of center and spread that you selected, if necessary. • Compare the shape, center, and spread of the data sets. Interpret any differences in context. Circulate and listen as groups compare the data sets for the problem they are assigned. A primary focus should be on constructing viable arguments about which plots and statistical measures to use to represent the data. Another area of focus should be on explaining what the comparisons of shape, center, and spread mean in context.
UDL: Representation
There is not one correct set of statistical measures that students must use for their comparisons. For instance, the center of the distributions of the home run data could be compared by using either the mean or median, as both distributions are roughly symmetric and do not contain outliers. It is more important for students to be able to defend their choice of plots and measures than for them to make a particular selection.
Consider having students use the Univariate Quantitative Data graphic organizer from lesson 18 to determine which measures of center and shape are appropriate to use to compare the distributions.
If groups have difficulty determining which statistical measures to use to compare the data sets, ask the following guiding questions about how the shapes of data distributions provide insight into which measures of center and spread best represent the distributions: • If your distribution is skewed, how does the skewness affect the mean and median? How does the skewness affect the range, standard deviation, and interquartile range? © Great Minds PBC
465
EUREKA MATH2
A1 ▸ M1 ▸ TD ▸ Lesson 23
• Is there always one correct measure of center and one correct measure of spread to use to compare data distributions? If not, when might more than one measure of center or spread provide an accurate description of a data distribution? If groups are comparing the shapes and measures of center and spread for the distributions but are not interpreting them in context, ask students to restate their comparisons in terms of the situation. Example: • I heard you say that the median for the Pittsburgh data is 27.3 inches greater than the median for the Los Angeles data. What does this difference tell you about the rainfall in these cities? As groups finalize their comparisons, have them create a visual to share with the class. The visual should be a graphic organizer that includes any statistics they used to compare the data sets, and it should briefly compare the data sets in context. Groups can create the visual on a sheet of paper to be displayed under a document camera, or, time permitting, they could create a more elaborate visual on chart paper or by using technology.
Presenting the Findings Students use a visual to explain how data sets compare. Have students present their visuals to the class. They should briefly describe the context of the data, explain their reasoning for choosing plots and statistical measures for comparison, and interpret the results in context. Consider having groups that analyzed the same data present in succession to facilitate a coherent class discussion. Invite students to ask questions about the groups’ choices for plots and statistics or the conclusions they made.
Population Sample: While both distributions are right-skewed, the distribution of the ages in Kenya has a high peak at the youngest interval and declines as age increases. The distribution of the ages in the United States is approximately uniform until about age 60, where it sharply declines as age increases. Because both distributions are skewed, the median and interquartile range are the most appropriate measures to use. The estimated median for the distribution of ages in the United States is about 20 years greater than the estimated median age in Kenya. The estimated interquartile range of the distribution of ages in the United States is 10 years greater than that of the ages in Kenya. 466
Teacher Note As time permits, encourage students to use their experiences to form conjectures about the conclusions drawn from comparisons of the data sets. For instance, some students might suggest that the American League teams typically hit more home runs in a baseball season because the American League uses a designated hitter to bat for the pitchers, who are not generally considered powerful hitters.
© Great Minds PBC
EUREKA MATH2 A1 ▸ M1 ▸ TD ▸ Lesson 23
According to the data, the typical age in Kenya is 15–19, while the typical age in the United States is 35–39. This means that half of the Kenyan population is under the age of 20. In comparison, roughly one-fourth of the United States population is under the age of 20. In addition, while about half of the United States population is 35 years or older, only about one-fifth of the population in Kenya is 35 years or older.
Home Runs Sample: Both distributions are approximately symmetric with no outliers. Using the mean, American League teams averaged 193.3 home runs, compared to National League teams averaging only 179 home runs. So these data do support the claim that the typical number of home runs hit by American League teams is greater than the typical number hit by National League teams. The variation in the American League distribution is somewhat greater than the distribution for the National League, as the standard deviation is 4.6 home runs greater and the interquartile range is 7 home runs greater than the respective values for the National League.
Rainfall Sample: The annual rainfall distributions for both Seattle and Pittsburgh appear approximately symmetric, while the annual rainfall distribution for Los Angeles appears right-skewed. The distributions for Pittsburgh and Los Angeles both contain outlier values that are much greater than most of the other values in these distributions, so I chose the median to compare the centers of the distributions, and the IQRs to compare the spreads of the distributions. Seattle’s typical annual rainfall is similar to that of Pittsburgh, and both cities typically get about 28 inches more annual rainfall than Los Angeles. The interquartile range of the annual rainfall for Seattle is 11.1 inches, which is greater than the interquartile ranges of the distributions for Los Angeles and Pittsburgh. The annual rainfall in Seattle varies more from year to year than it does in Pittsburgh and Los Angeles.
© Great Minds PBC
467
A1 ▸ M1 ▸ TD ▸ Lesson 23
EUREKA MATH2
Gasoline Sample: According to the data, the typical price of gasoline does not differ based on whether a state is one of the first 25 states or last 25 states when listed alphabetically. Because the shape of the distribution of average prices for group A is right-skewed, I chose to compare the medians. The median average gas price for group B is only 2 cents more than the median average gas price for group A. However, group A has average gas prices that are more variable than group B, as measured by both the ranges and the IQRs.
Land Debrief 5 min Objectives: Compare two or more data sets by using shape, center, and variability. Interpret differences in data distributions in context. Use the following questions to facilitate a brief discussion with the students about comparing sets of univariate data. What do the shape, center, and spread reveal about distributions of univariate data? The shape of distributions can reveal information about whether data values are clumped together or more evenly spread out. The shape of a distribution can also help determine which measures of center and spread are appropriate to use to characterize a set of data. Measures of center provide information about typical values in a data set, while measures of spread provide information about the overall variation in a data set. Why is it important to always interpret data in context? The different data sets aren’t just different sets of numbers. They can each be used to answer a different statistical question. The meanings of the similarities and differences we found change depending on what data set we analyzed.
468
© Great Minds PBC
EUREKA MATH2 A1 ▸ M1 ▸ TD ▸ Lesson 23
Exit Ticket 5 min Provide up to 5 minutes for students to complete the Exit Ticket. It is possible to gather formative data even if some students do not complete every problem.
© Great Minds PBC
Teacher Note Assign the Practice problems for completion outside of class or use them in class if time remains after the lesson. Refer students to the Recap for support.
469
EUREKA MATH2
A1 ▸ M1 ▸ TD ▸ Lesson 23
Recap
EUREKA MATH2
A1 ▸ M1 ▸ TD ▸ Lesson 23
Student Edition: Grade A1, Module 1, Topic D, Lesson 23
RECAP
Name
Date
A1 ▸ M1 ▸ TD ▸ Lesson 23
23
Center: The median flight time for Boston to San Francisco is about 356 minutes. The median flight time for San Francisco to Boston is between 295 minutes and 300 minutes. The typical flight time for a flight from Boston to San Francisco is about 55 to 60 minutes longer than the typical flight time from San Francisco to Boston.
Comparing Distributions of Univariate Data In this lesson, we •
compared distributions by using shape, center, and variability.
•
interpreted differences in distributions in context.
EUREKA MATH2
Spread: The IQR for the distribution of flight times from Boston to San Francisco is about 28 minutes. The IQR for the distribution of flight times from San Francisco to Boston is between 10 and 20 minutes. The typical variation in flight times from Boston to San Francisco is about 10 to 20 minutes more than the typical variation in flight times from San Francisco to Boston.
Example The graphs show the distributions of flight times for a random sample of flights from Boston to San Francisco and a random sample of flights from San Francisco to Boston. Flights from San Francisco to Boston
Frequency
Flights from Boston to San Francisco
325 330 335 340 345 350 355 360 365 370 375 380 385 390 Flight Time (minutes)
7 6 5 4 3 2 1 0
285
290
295
300
305
310
315
320
325
Flight Time (minutes)
Compare the distributions of flight times in context by using shape and measures of center and spread. Shape: The distribution of flight times from Boston to San Francisco appears approximately symmetric, while the distribution of the flight times from San Francisco to Boston appears right-skewed.
© Great Minds PBC
470
373
374
RECAP
© Great Minds PBC
© Great Minds PBC
EUREKA MATH2 A1 ▸ M1 ▸ TD ▸ Lesson 23
Sample Solutions Expect to see varied solution paths. Accept accurate responses, reasonable explanations, and equivalent answers for all student work.
EUREKA MATH2
A1 ▸ M1 ▸ TD ▸ Lesson 23
Student Edition: Grade A1, Module 1, Topic D, Lesson 23 Name
PRACTICE Date
EUREKA MATH2
A1 ▸ M1 ▸ TD ▸ Lesson 23
23
f.
What measure of spread did you use to calculate spread in part (e)? Justify your choice. I used the range because it was the easiest measure to calculate. Because the distribution is approximately symmetric, the range is a reasonable estimate of spread for the data set.
1. The following dot plot represents the ages of 60 randomly selected people from Japan in 2018.
2. The relative frequency histogram summarizes the ages of a random sample of people in Bangladesh in 2018.
Ages of Individuals from Japan
Ages of People in Bangladesh
10
20
30
40
50
60
70
80
90
0.12
100 Relative Frequency
0
Age (years)
a. What is the shape of the distribution? The distribution is approximately symmetric.
0.06 0.04 0.02 0 5 10 15 20 25 30 35 40 45 50 55 60 65 70 75 80 85 90 95 100 Age (years)
The shape of the distribution provides information about whether the mean, range, and standard deviation are appropriate measures of center and spread for a data set. When the shape is approximately symmetric, all the measures can be used; when it’s skewed, we should only use the median and IQR.
a. Compare the shapes of the distributions of the ages in the sample from Japan and the sample from Bangladesh. The distribution of ages in the sample from Japan is approximately symmetric, while the distribution of the ages in the sample from Bangladesh is skewed to the right.
c. What is the typical age of a person in the sample? The typical age of a person in the sample is 51 years old.
b. Which measures of center and spread would you use to compare the distributions? Justify your reasoning. I would use the median and interquartile range because the distribution of ages in Bangladesh is skewed.
d. What measure of center did you use to calculate a typical age in part (c)? Justify your choice. I chose the median because it was easier to calculate than the mean. I can easily find the locations of the 30th and 31st ordered values, rather than adding all the values.
c. Compare the distributions by using appropriate measures of center and spread. The median age in the sample from Bangladesh is between 25 and 30 years. This is between 21 to 26 years less than the median age of the sample from Japan. The spread of ages is similar in the samples for Bangladesh and Japan. The interquartile ranges of the two samples are roughly the same.
e. What is an estimate of spread for the distribution? An estimate of spread for the distribution is 100 years.
© Great Minds PBC
0.08
0
b. How does the shape of a distribution help us decide which measures of center and spread to use?
© Great Minds PBC
0.10
375
376
P R ACT I C E
© Great Minds PBC
471
EUREKA MATH2
A1 ▸ M1 ▸ TD ▸ Lesson 23
EUREKA MATH2
A1 ▸ M1 ▸ TD ▸ Lesson 23
3. A principal selected 100 eighth grade students at random to participate in a reading fluency test. Teachers recorded the number of words students read accurately in one minute. Students were tested in the fall and then again in the spring. The results of each test are summarized in the box plots.
Compare the distributions in context by using shape and measures of center and spread. The distribution of runs scored by the Blue Socks team is symmetric, while the distribution of runs scored by the Black Socks team is right-skewed. Both distributions have a median of 5 runs, which means the typical number of runs scored is the same for both teams. The interquartile range of the distribution for the Blue Socks is 4 runs, while the interquartile range of the distribution for the Black Socks is 9 runs. Based on the IQR, the Black Socks’ distribution is more variable.
Reading Fluency Test Scores
Spring
EUREKA MATH2
A1 ▸ M1 ▸ TD ▸ Lesson 23
5. The box plots summarize the distributions of weekly sales of chocolate chip cookies from three bakeries.
Fall
Weekly Chocolate Chip Cookie Sales
60
70
80
90 100 110 120 130 140 150 160 170 180 190 200 210 220 Bakery A
Fluency (words per minute)
Write two or three sentences about the eighth grade reading test results. Bakery B
The numbers of words read fluently in the spring and fall tests both have approximately symmetric distributions. The typical number of words read fluently in the spring test is about 20 more than the typical number of words read in the fall test. The overall spread in the number of words read in the fall and spring tests is similar, with a slightly smaller spread in the spring.
Bakery C
4. The following graphs show the distributions of the number of runs scored per game for a random sample of 30 games for the Blue Socks baseball team and a random sample of 30 games for the Black Socks baseball team. Runs Scored by Black Socks Baseball Team
0 1 2 3 4 5 6 7 8 9 10
0 1 2 3 4 5 6 7 8 9 10 11 12 13 14 15
Number of Runs Scored
Number of Runs Scored
P R ACT I C E
50
70
90
110
130
150
170
190
210
230
250
Number of Cookies Sold
Runs Scored by Blue Socks Baseball Team
© Great Minds PBC
472
30
Compare the distributions in this context by using measures of shape, center, and spread.
377
The distribution for bakery A is approximately symmetric with an outlier. The distribution for bakery B is left-skewed. The distribution for bakery C is approximately symmetric. The median for bakery A is about 120 cookies, while the medians for bakery B and bakery C are about 145 cookies and 150 cookies, respectively. This means that bakeries B and C typically sold about the same number of chocolate chip cookies each week, which was about 25 more than the typical number of chocolate chip cookies sold each week by bakery A. The IQR for bakery A is 60 cookies, the IQR of bakery B is 120 cookies, and the IQR of bakery C is about 95 cookies. This means that the variation in weekly cookie sales is least to greatest at bakery A, bakery C, and bakery B.
378
P R ACT I C E
© Great Minds PBC
© Great Minds PBC
EUREKA MATH2 A1 ▸ M1 ▸ TD ▸ Lesson 23
EUREKA MATH2
A1 ▸ M1 ▸ TD ▸ Lesson 23
9. Graph y =
Remember
EUREKA MATH2
A1 ▸ M1 ▸ TD ▸ Lesson 23
2 x − 5. 3
For problems 6 and 7, solve the equation.
y
6. 6a − 4a − 3(4a + 1) = 47
7. −8a + 2(−3a + 3) − a = 1
−5
10 9
1 3
8 7 6 5 4 3 2 1 −10 −9 −8 −7 −6 −5 −4 −3 −2 −1 0 −1
8. A random sample of ninth grade students and tenth grade students at one school was asked how many hours they volunteered last month. The box plots show the distributions of time spent volunteering.
1
2
3
4
5
6
7
8
9 10
x
−2 −3 −4 −5
Volunteer Hours
−6 −7 −8 −9
Tenth Grade
−10
Ninth Grade
0
1
2
3
4
5
6
7
8
Time (hours)
Is the typical number of volunteer hours for ninth grade students in the survey greater than, less than, or equal to the typical number of volunteer hours for tenth grade students in the survey? Justify your answer. Sample: The typical number of volunteer hours for ninth grade students is greater than the typical number of volunteer hours for tenth grade students. The box plots show that the median number of volunteer hours for ninth grade students is 4, and the median number of volunteer hours for tenth grade students is 3.
© Great Minds PBC
© Great Minds PBC
P R ACT I C E
379
380
P R ACT I C E
© Great Minds PBC
473
474 This page may be reproduced for classroom use only.
14.4 12.6 10.6 10.0 8.7 7.0 5.4 3.9 3.0 2.4 1.9 1.3 0.9
5–9 10–14 15–19 20–24 25–29 30–34 35–39 40–44 45–49 50–54 55–59 60–64 65–69
0.7
16.2
0–4
70–74
Kenya
Age Range
2.9
4.0
5.3
6.3
7.2
7.4
6.8
6.5
6.5
7.1
7.0
6.9
6.5
6.8
7.0
United States
Percent of Population
The table shows the population percentages in each age group for both countries.
Students at Waldo High School are doing an integrated week-long study of African nations. In their mathematics classes, they decided to study Kenya by using demographic age structure data from 2010 provided by the United Nations Population Division. They also obtained age structure data for the United States from 2010 for comparison.
Population
A1 ▸ M1 ▸ TD ▸ Lesson 23 ▸ Data Sets EUREKA MATH2
Teacher Edition: Grade A1, Module 1, Topic D, Lesson 23
© Great Minds PBC
0.5 0.3 0.01
75–79 80–84 85–89
1.5
1.9
2.4
United States
Mean estimate: 36.9 years Median: 35–39 years Standard deviation estimate: 22 years Interquartile range estimate: 35 years
Median: 15–19 years Standard deviation estimate: 17 years Interquartile range estimate: 25 years
Age (years)
10 20 30 40 50 60 70 80 90 100
Mean estimate: 21.4 years
Age (years)
10 20 30 40 50 60 70 80 90 100
0.18 0.16 0.14 0.12 0.10 0.08 0.06 0.04 0.02 0
Ages of People in the United States in 2010
Distribution of ages in the United States
0.18 0.16 0.14 0.12 0.10 0.08 0.06 0.04 0.02 0
Ages of People in Kenya in 2010
Distribution of ages in Kenya
Relative Frequency
How does the age distribution in Kenya differ from the age distribution in the United States?
Link to Kenya data: https://population.un.org/wpp/Download/Standard/Population/
Relative Frequency
© Great Minds PBC
Link to United States data: https://www.census.gov/data/tables/2010/demo/age-andsex/2010-age-sex-composition.html
Kenya
Age Range
Percent of Population
EUREKA MATH2 A1 ▸ M1 ▸ TD ▸ Lesson 23 ▸ Data Sets
This page may be reproduced for classroom use only.
475
476 This page may be reproduced for classroom use only.
188 182 216 135 205 155 214 166 267 227 176 150 194 217 208
176 175 167 172 210 235 128 218 170 186 157 162 133 205 191
Link to American League data: https://www.baseball-reference.com/leagues/AL/
Link to National League data: https://www.baseball-reference.com/leagues/NL/
American League
National League
Home Runs by Team
The following table shows the total number of home runs hit by each team in the National League and each team in the American League for the 2018 baseball season.
Major League Baseball is a professional baseball league in the United States and Canada. The league has two subdivisions: the National League and the American League. Some fans feel as though the American League is the hitter’s division, which means that there are more powerful batters in the American League. One way to measure powerful batting is by counting the number of home runs hit by each team in a baseball season.
Home Runs
A1 ▸ M1 ▸ TD ▸ Lesson 23 ▸ Data Sets EUREKA MATH2
© Great Minds PBC
© Great Minds PBC
120
140
Range: 132 home runs
Interquartile range: 50 home runs
Median: 194 home runs
Standard deviation: 33.0 home runs
Mean: 193.3 home runs
American League Statistics
Range: 107 home runs
Interquartile range: 43 home runs
Median: 175 home runs
Standard deviation: 28.6 home runs
Mean: 179 home runs
National League Statistics
National League
American League
160
200
220
Number of Home Runs per Team
180
240
Home Runs Hit in Major League Baseball in 2018
260
280
Do these data support the claim that the typical number of home runs hit by American League teams is greater than the typical number hit by National League teams?
EUREKA MATH2 A1 ▸ M1 ▸ TD ▸ Lesson 23 ▸ Data Sets
This page may be reproduced for classroom use only.
477
478
Pittsburgh
39.5 37.5 32 41.4 35.3 38.5 37.4 39.2 27.1 42.5 52.2 (outlier) 32 36.7 38.2 41.3
Seattle
35.6 35.4 39.3 40.9 37 25.1 38.3 29.9 33 34.7 44.8 35.4 32.8 28.8 34.8
Year 1980 1981 1982 1983 1984 1985 1986 1987 1988 1989 1990 1991 1992 1993 1994
Annual Rainfall (inches)
This page may be reproduced for classroom use only.
8
20.7
16.6
11
5.2
4.2
8
7.2
15.9
9.3
7.8
29.5 (outlier)
13.7
11.4
21.6
Los Angeles
Seattle is known as a rainy city because of its large amount of annual rainfall. Is this reputation supported by data? The following table shows annual rainfall amounts in inches for the cities of Seattle, Pittsburgh, and Los Angeles from 1980 to 2018.
Rainfall
A1 ▸ M1 ▸ TD ▸ Lesson 23 ▸ Data Sets EUREKA MATH2
© Great Minds PBC
Pittsburgh
28.9 45.5 34.5 34.2 36.2 40.1 35.7 32.3 41 57.4 (outlier) 41.2 34.9 40.7 39.7 32.8 37.9 43.5
Seattle
42.6 50.7 43.3 44.1 42.1 28.7 37.6 31.4 41.8 31.1 35.4 48.8 39 30.7 38.4 47 36.4
Year 1995 1996 1997 1998 1999 2000 2001 2002 2003 2004 2005 2006 2007 2008 2009 2010 2011
Annual Rainfall (inches)
© Great Minds PBC
9.9
2
7.5
11
4.9
9.2
18.8
16.3
9.5
5
17
11
6.9
27.1
12
16.1
23.3
Los Angeles
EUREKA MATH2 A1 ▸ M1 ▸ TD ▸ Lesson 23 ▸ Data Sets
This page may be reproduced for classroom use only.
479
480 This page may be reproduced for classroom use only.
41.7 36.7 36.8 40.6 35 42.2 57.8 (outlier)
48.3 32.6 48.5 44.8 45.2 47.9 35.8
2012 2013 2014 2015 2016 2017 2018
7.8
12.3
10.3
6
8.3
3.7
8.9
Los Angeles
Link to Los Angeles data: http://www.laalmanac.com/weather/we09aa.php (LAX)
Link to Pittsburgh data: https://xmacis.rcc-acis.org/ (Pittsburgh)
Link to Seattle data: http://www.seattleweatherblog.com/rain-stats/
Does the distribution of annual rainfall in Seattle differ from the distributions of annual rainfall in Pittsburgh and Los Angeles?
Pittsburgh
Seattle
Year
Annual Rainfall (inches)
A1 ▸ M1 ▸ TD ▸ Lesson 23 ▸ Data Sets EUREKA MATH2
© Great Minds PBC
© Great Minds PBC
0
5
10
This page may be reproduced for classroom use only.
Range: 27.5 inches
Interquartile range: 8.6 inches
Median: 9.9 inches
Standard deviation: 6.4 inches
Mean: 11.7 inches
Los Angeles Statistics
Range: 30.7 inches
Interquartile range: 6.3 inches
Median: 38.2 inches
Standard deviation: 6.4 inches
Mean: 38.9 inches
Pittsburgh Statistics
Range: 25.6 inches
Interquartile range: 11.1 inches
Median: 37.6 inches
Standard deviation: 6.5 inches
Mean: 38.4 inches
Seattle Statistics
Seattle
Pittsburgh
Los Angeles
15
20
30
35
Annual Rainfall (inches)
25
40
Annual Rainfall from 1980 to 2018
45
50
55
60
EUREKA MATH2 A1 ▸ M1 ▸ TD ▸ Lesson 23 ▸ Data Sets
481
482
Group B
2.84 2.51 3.51 (outlier) 3.46 (outlier) 3.40 (outlier) 3.07 3.05 2.95 2.92 2.87 2.85 2.85 2.83 2.81
Group A
2.51 3.36 3.14 2.55 4.08 (outlier) 2.79 2.98 2.77 2.72 3.58 (outlier) 2.72 2.76 2.90 3.03
Average Gasoline Price per Gallon (dollars)
Do you think average gas prices would vary based on the name of a state? The data shows the average gasoline price per gallon in dollars on a particular day in 2019 for each state in the United States. Each state is grouped by whether it is one of the first twenty-five states (group A) or the last twenty-five states (group B) when listed alphabetically.
Gasoline
A1 ▸ M1 ▸ TD ▸ Lesson 23 ▸ Data Sets EUREKA MATH2
This page may be reproduced for classroom use only. © Great Minds PBC
© Great Minds PBC
2.79 2.77 2.76 2.75 2.74 2.71 2.70 2.65 2.6 2.55 2.52
3.08 2.71 2.63 2.50 2.51 2.62 2.76 2.81 2.83 2.84 2.94
Does the typical price of gasoline differ based on whether a state is in group A or group B?
Link to gas price data: https://www.gasbuddy.com/USA
Group B
Group A
Average Gasoline Price per Gallon (dollars)
EUREKA MATH2 A1 ▸ M1 ▸ TD ▸ Lesson 23 ▸ Data Sets
This page may be reproduced for classroom use only.
483
484
2
This page may be reproduced for classroom use only.
Range: $1.01
Interquartile range: $0.23
Median: $2.81
Standard deviation: $0.26
Mean: $2.86
Group B Statistics
Range: $1.58
Interquartile range: $0.34
Median: $2.79
Standard deviation: $0.36
Mean: $2.88
Group A Statistics
Group A
Group B
3
3.5
4
Average Gasoline Price per Gallon (dollars)
2.5
State Average Gasoline Prices in 2019
4.5
A1 ▸ M1 ▸ TD ▸ Lesson 23 ▸ Data Sets EUREKA MATH2
© Great Minds PBC
Teacher Edition: Grade A1, Module 1, Standards
Standards Module Content Standards Interpret the structure of expressions. A.SSE.A.2 Use the structure of an expression to identify ways to rewrite it. For example, see x4 − y4 as (x2)2 − (y2)2, thus recognizing it as a difference of squares that can be factored as (x2 − y2)(x2 + y2). Perform arithmetic operations on polynomials. A.APR.A.1 Understand that polynomials form a system analogous to the integers, namely, they are closed under the operations of addition, subtraction, and multiplication; add, subtract, and multiply polynomials. Create equations that describe numbers or relationships. A.CED.A.1 Create equations and inequalities in one variable and use them to solve problems. Include equations arising from linear and quadratic functions, and simple rational and exponential functions. A.CED.A.3 Represent constraints by equations or inequalities, and by systems of equations and/or inequalities, and interpret solutions as viable or nonviable options in a modeling context. For example, represent inequalities describing nutritional and cost constraints on combinations of different foods. A.CED.A.4 Rearrange formulas to highlight a quantity of interest, using the same reasoning as in solving equations. For example, rearrange Ohm's law V = IR to highlight resistance R. Understand solving equations as a process of reasoning and explain the reasoning. A.REI.A.1 Explain each step in solving a simple equation as following from the equality of numbers asserted at the previous step, starting from the assumption that the original equation has a solution. Construct a viable argument to justify a solution method.
486
© Great Minds PBC
EUREKA MATH2 A1 ▸ M1
Solve equations and inequalities in one variable. A.REI.B.3 Solve linear equations and inequalities in one variable, including equations with coefficients represented by letters. Summarize, represent, and interpret data on a single count or measurement variable. S.ID.A.1
Represent data with plots on the real number line (dot plots, histograms, and box plots).
S.ID.A.2
Use statistics appropriate to the shape of the data distribution to compare center (median, mean) and spread (interquartile range, standard deviation) of two or more different data sets.
S.ID.A.3
Interpret differences in shape, center, and spread in the context of the data sets, accounting for possible effects of extreme data points (outliers).
Standards for Mathematical Practice MP1
Make sense of problems and persevere in solving them.
MP2
Reason abstractly and quantitatively.
MP3
Construct viable arguments and critique the reasoning of others.
MP4
Model with mathematics.
MP5
Use appropriate tools strategically.
MP6
Attend to precision.
MP7
Look for and make use of structure.
MP8
Look for and express regularity in repeated reasoning.
© Great Minds PBC
487
Teacher Edition: Grade A1, Module 1, Achievement Descriptors: Proficiency Indicators
Achievement Descriptors: Proficiency Indicators A1.Mod1.AD1 Use the structure of a polynomial expression to identify ways to rewrite it. RELATED CCSSM
A.SSE.A.2 Use the structure of an expression to identify ways to rewrite it. For example, see x4 − y4 as (x2)2 − (y2)2, thus recognizing it as a difference of squares that can be factored as (x2 − y2)(x2 + y2).
Partially Proficient
Proficient
Use the structure of a polynomial expression to recognize equivalent expressions.
Use the structure of a polynomial expression to rewrite equivalent expressions.
Match each polynomial expression to the equivalent expression.
Find the value of p that makes the equation px (4 − 2 x ) = 12 x − 6 x 2 true for all values of x.
25x2 − 16y2 and (5x − 4y)(5x + 4y) 4x2 + 20x + 25 and (2x + 5)2
488
5
Highly Proficient
5
Identify properties of operations used to generate equivalent polynomial expressions. Show that 6x2 − 10 − 4x(x − 3) and 2x2 + 12x − 10 are equivalent expressions. Write the property or operation from the list that describes each step.
© Great Minds PBC
EUREKA MATH2 A1 ▸ M1
A1.Mod1.AD2 Identify polynomial expressions and explain why they are closed under the operations of addition,
subtraction, and multiplication. RELATED CCSSM
A.APR.A.1 Understand that polynomials form a system analogous to the integers, namely, they are closed under the operations of addition, subtraction, and multiplication; add, subtract, and multiply polynomials.
Partially Proficient
Proficient
Identify polynomial expressions from a list of algebraic expressions.
Identify which operations result in a polynomial expression given two polynomial expressions.
Which algebraic expressions are polynomial expressions? Choose all that apply.
Determine whether each expression is a polynomial expression. Write each expression in the appropriate category.
2
A.
x2
B.
4 x2
C.
10
5
(3x2 − 2x + 5) − (3x − 2x)
Highly Proficient Explain why polynomial expressions are closed under addition, subtraction, and multiplication, and identify that polynomial expressions are not closed under division. Evan claims that the addition, subtraction, multiplication, and division of the expressions 4x2 and 20x3 all result in polynomial expressions. Do you agree? Explain why.
(−2x + 7x − 3)(x + 1) 1 2 x − 10 x + 4 + ( 2 x + 8 ) 2
(
3
D. (−1)
E. −(x − 2) 2
F. 10x − 8x + 3
)
3x2 x4
A1.Mod1.AD3 Add and subtract polynomial expressions. RELATED CCSSM
A.APR.A.1 Understand that polynomials form a system analogous to the integers, namely, they are closed under the operations of addition, subtraction, and multiplication; add, subtract, and multiply polynomials.
Partially Proficient Add and subtract polynomial expressions where variable terms have the same degree in each expression. Find the sum. Write your answer in standard form.
(8x2 − 3) + (−3x2 + 11)
© Great Minds PBC
Proficient
Highly Proficient
Add and subtract any polynomial expression. Find the difference. Write your answer in standard form.
(5x2 − 4x + 9) − (2x3 − 3x + 1)
489
EUREKA MATH2
A1 ▸ M1
A1.Mod1.AD4 Multiply polynomial expressions. RELATED CCSSM
A.APR.A.1 Understand that polynomials form a system analogous to the integers, namely, they are closed under the operations of addition, subtraction, and multiplication; add, subtract, and multiply polynomials.
Partially Proficient Multiply a monomial expression and a binomial expression or a monomial expression and a trinomial expression. Find the product. Write your answer in standard form.
−3x(x2 − 7x + 3)
Proficient
Highly Proficient
Multiply two binomial expressions or a binomial expression and a trinomial expression.
Multiply three binomial expressions or two trinomial expressions.
Find the product. Write your answer in standard form.
Find the product. Write your answer in standard form.
(12x + 1)(−5x − 2)
(2x + 3)(7x − 5)(x + 1)
A1.Mod1.AD5 Identify and explain steps required to solve linear equations in one variable and justify solution methods. RELATED CCSSM
A.REI.A.1 Explain each step in solving a simple equation as following from the equality of numbers asserted at the previous step, starting from the assumption that the original equation has a solution. Construct a viable argument to justify a solution method.
Partially Proficient Identify steps required to solve linear equations in one variable by filling in missing steps that justify a given solution method. The steps to solve the equation −3(x + 2) + 15 = −5x − 7 are shown. Write the property or operation used to justify each step.
−3 ( x + 2) + 15 = −5 x − 7 −3 x − 6 + 15 = −5 x − 7 −3 x + 9 = −5 x − 7 2 x + 9 = −7 2 x = −16
Proficient
Highly Proficient
Solve linear equations in one variable and explain the property used for each step.
Construct viable arguments to justify or critique solution methods to linear equations in one variable.
Solve the equation −10x + 3 = 4(x − 6) + 1. Write the property or operation that describes each step.
Ji-won solved the equation 13 − 3(x + 1) + 5x = 9 − 2x. His work is shown. Is his solution method correct? Why?
13 − 3 ( x + 1) + 5 x = 9 − 2 x 13 − 3 x − 3 + 5 x = 9 − 2 x 13 − 3 − 3 x + 5 x = 9 − 2 x 10 − 3 x = 9 − 2 x 1= x
x = −8
490
© Great Minds PBC
EUREKA MATH2 A1 ▸ M1
A1.Mod1.AD6 Solve linear equations and inequalities in one variable. RELATED CCSSM
A.REI.B.3 Solve linear equations and inequalities in one variable, including equations with coefficients represented by letters.
Partially Proficient
Proficient
Highly Proficient
Solve linear equations in one variable with numerical coefficients.
Solve linear equations in one variable with coefficients represented as letters.
Solve compound equations or inequalities in one variable.
Solve the equation −10(x − 3) = 4x + 16.
Solve for x in the equation x(c − 12) = −3x + d.
Find the solution set of the compound equation.
Solve linear inequalities in one variable by using the addition property of inequality.
Solve linear inequalities in one variable by using the multiplication property of inequality.
Find the solution set of the inequality.
Find the solution set of the inequality.
x+7≤8
© Great Minds PBC
1 x − 4 = −7 or 4x − 3 = 9 2
3 − 6x < −15
491
EUREKA MATH2
A1 ▸ M1
A1.Mod1.AD7 Create equations and inequalities in one variable and use them to solve problems. RELATED CCSSM
A.CED.A.1 Create equations and inequalities in one variable and use them to solve problems. Include equations arising from linear and quadratic functions, and simple rational and exponential functions.
Partially Proficient Match real-world contexts to equations or inequalities that model the situation. Match each equation or inequality with the situation it represents. Lucas has at most $95 to order x button pins. Each pin costs $5, and there is a shipping fee of $10 per order. Determine the number of pins he can purchase.
5x + 10 ≤ 95
Tiah pays an annual fee of $50 and $15 per month for a gym membership. Determine the number of months x that she has been a member if she has paid a total of $95.
Proficient
Highly Proficient
Create equations and inequalities in one variable and use them to solve problems, including those in a real-world context. Lyla has $50 in her savings account and saves $10 per week from her babysitting job. Part A Write an inequality that can be used to find the minimum number of weeks Lyla must work to save at least $375. Part B Solve the inequality to find the minimum number of weeks Lyla must work to save at least $375.
15x + 50 = 95 Danna spends $50 at the art supply store. She purchases x rolls of paper for $5 each and an easel for $15. How many rolls of paper does she purchase?
5x + 15 = 50
492
© Great Minds PBC
EUREKA MATH2 A1 ▸ M1
A1.Mod1.AD8 Represent constraints by using equations and inequalities. RELATED CCSSM
A.CED.A.3 Represent constraints by equations or inequalities, and by systems of equations and/or inequalities, and interpret solutions as viable or nonviable options in a modeling context. For example, represent inequalities describing nutritional and cost constraints on combinations of different foods.
Partially Proficient
Proficient
Apply constraints of equations or inequalities in one variable.
Represent constraints by using equations or inequalities in one variable.
Nina receives an allowance of $25 each week. She wants to start saving for a tablet that costs $225, but she needs to use two weeks of allowance to repay her sister. Let x represent the number of weeks from today. Then x − 2 represents the number of weeks until she can purchase the tablet. Use the inequality 25(x − 2) ≥ 225 to determine the number of weeks until she can purchase the tablet.
Zara needs to create a portfolio with at least 15 drawings and no more than 25 drawings. She already has 6 drawings. Let x represent the number of drawings Zara still needs to create for the portfolio. Write an inequality that represents how many drawings Zara still needs to create.
Highly Proficient
A1.Mod1.AD9 Interpret solutions to equations and inequalities in one variable as viable or nonviable options in a
modeling context. RELATED CCSSM
A.CED.A.3 Represent constraints by equations or inequalities, and by systems of equations and/or inequalities, and interpret solutions as viable or nonviable options in a modeling context. For example, represent inequalities describing nutritional and cost constraints on combinations of different foods.
Partially Proficient Interpret solutions to linear equations and inequalities in one variable as viable or nonviable options in a modeling context by identifying solutions. The sum of the ages of Emma and her brother is at least 22. Emma is no more than 4 years older than her brother. Which are the possible ages of Emma and her brother? Choose all that apply. A. 12 and 9 B. 13 and 10 C. 15 and 14 D. 16 and 17
Proficient
Highly Proficient
Interpret solutions to linear equations and inequalities in one variable as viable or nonviable options in a modeling context by writing linear equations or inequalities and finding their solution sets. Riku sells pins for $3 each. With his earnings, he plans to pay his sister the $25 that he owes her, but he wants to have at least $100 left. Part A Write an inequality to represent the given situation. Part B How many pins must Riku sell? Explain your answer.
E. 18 and 20 © Great Minds PBC
493
EUREKA MATH2
A1 ▸ M1
A1.Mod1.AD10 Rearrange formulas to highlight a quantity of interest. RELATED CCSSM
A.CED.A.4 Rearrange formulas to highlight a quantity of interest, using the same reasoning as in solving equations. For example, rearrange Ohm’s law V = IR to highlight resistance R.
Partially Proficient
Proficient
Rearrange formulas to highlight a quantity of interest in one step by using the same reasoning as in solving equations.
Rearrange formulas to highlight a quantity of interest in two or more steps by using the same reasoning as in solving equations.
The formula for finding the volume V of a rectangular prism is V = lwh, where l represents its length, w represents its width, and h represents its height. Which equation represents the width of a rectangular prism in terms of its volume, length, and height?
The formula for finding the surface area SA of a prism is SA = 2B + ph, where B represents the area of the base, p represents the perimeter of the base, and h represents height. Which equation represents the height of a prism in terms of its surface area, area of its base, and perimeter of its base?
A. w = B. w = C. w = D. w =
V lh l
A. h =
Vh lh
B. h =
V
Highly Proficient
p 2 B − SA 2 B − SA p
C. h = p(2B − SA)
h
D. h = 2B − SA − p
lV
A1.Mod1.AD11 Represent data with dot plots, histograms, or box plots. RELATED CCSSM
S.ID.A.1 Represent data with plots on the real number line (dot plots, histograms, and box plots).
Partially Proficient
Proficient
Highly Proficient
Represent data with dot plots, histograms, and/or box plots. A random sample of 30 people was asked about the number of text messages they sent last month.
274, 609, 415, 239, 823, 548, 113, 226, 342, 465, 329, 453, 748, 176, 408, 624, 378, 637, 506, 461, 317, 527, 293, 302, 481, 396, 521, 464, 525, 329 Represent the given data with a box plot.
494
© Great Minds PBC
EUREKA MATH2 A1 ▸ M1
A1.Mod1.AD12 Summarize and compare data by shape, center, and spread outside of context. RELATED CCSSM
S.ID.A.2 Use statistics appropriate to the shape of the data distribution to compare center (median, mean) and spread (interquartile range, standard deviation) of two or more different data sets.
Partially Proficient Describe the shape, center, and variability of data sets outside of context. Which histogram shows a distribution that is leftskewed and has a median between 40 and 50? A.
Proficient Compare and identify differences in shape, center, and variability of two or more data sets outside of context, including effects of outliers, if any. Consider the following dot plots.
Veterinary Clinic A
Frequency
Time Spent at Restaurant A 12 10 8 6 4 2 0
0
20
40
60
80
Time (minutes)
B.
2
4
6
Frequency
Time Spent at Restaurant B 12 10 8 6 4 2 0
Highly Proficient
8 10 12 14 16 18 20 22 24 26 Number of Animals
Veterinary Clinic B
0
20
40
60
80
Time (minutes)
C.
Frequency
Time Spent at Restaurant C 12 10 8 6 4 2 0
2
8 10 12 14 16 18 20 22 24 26
Write the option from the list that completes each sentence. 0
D.
20
40
60
80
Time Spent at Restaurant D
Frequency
6
Number of Animals
Time (minutes)
12 10 8 6 4 2 0
4
0
20
40
60
The center of the first distribution is (less than/ greater than/equal to) the center of the second distribution. The variability of the first distribution is (less than/ greater than/equal to) the variability of the second distribution.
80
Time (minutes)
© Great Minds PBC
495
EUREKA MATH2
A1 ▸ M1
A1.Mod1.AD13 Interpret differences in data in the context of the data sets. RELATED CCSSM
S.ID.A.3 Interpret differences in shape, center, and spread in the context of the data sets, accounting for possible effects of extreme data points (outliers).
Partially Proficient
Proficient
Highly Proficient
Determine the appropriate measure of center or variability to compare data sets.
Interpret differences in data distributions in the context of the data, including the effects of outliers.
Interpret measures of variation and use them to support or refute a claim.
The box plot and dot plot display the data distributions of shoe sizes of random samples of customers at two different shoe stores. Determine the appropriate measure of center and variability to compare the data distributions.
Employees at two veterinary clinics created dot plots to show the number of animals they have treated each day over a month.
The box plot displays the distribution of screen time in minutes for a random sample of 200 students at Northside High School.
Veterinary Clinic A
Northside High School
Customer Shoe Sizes at Store A
2
5
8
11
4
6
8 10 12 14 16 18 20 22 24 26 Number of Animals
14
Veterinary Clinic B
Sizes
Customer Shoe Sizes at Store B
200
250
300
350
400
450
500
Screen Time (minutes)
The dot plot displays the screen time in minutes for a random sample of 25 students at West Dale High School.
West Dale High School
2
5
8
11 Sizes
4
6
8 10 12 14 16 18 20 22 24 26 Number of Animals
14 Part A
Compare the number of animals treated at Veterinary Clinic A with the number of animals treated at Veterinary Clinic B. Use appropriate statistics to justify your reasoning. Part B Suppose Veterinary Clinic B hosted an event one day during the month where all animals received a free checkup. On this day, Veterinary Clinic B treated 100 animals. How does this value affect your comparison of the number of animals treated at the veterinary clinics?
496
200
250
300
350
400
450
500
Screen Time (minutes)
Huan says there is more variation in screen time at West Dale High School compared to Northside High School. He reasons that this is true because the range of screen time at West Dale High School is greater than the range of screen time at Northside High School. Do you agree with him? Explain your answer.
© Great Minds PBC
Teacher Edition: Grade A1, Module 1, Terminology
Terminology The following terms are critical to the work of Algebra I module 1. This resource groups terms into categories called New, Familiar, and Academic Verbs. The lessons in this module incorporate terminology with the expectation that students work toward applying it during discussions and in writing. Items in the New category are discipline-specific words that are introduced to students in this module. These items include the definition, description, or illustration as it is presented to students. At times, this resource also includes italicized language for teachers that expands on the wording used with students. Items in the Familiar category are discipline-specific words introduced in prior modules or in previous grade levels. Items in the Academic Verbs category are high-utility terms that are used across disciplines. These terms come from a list of academic verbs that the curriculum strategically introduces at this grade level.
New absolute value equation An equation of the form, or equivalent to the form, |bx − c| = d, where b, c, and d are real numbers. The equation |bx − c| = d means bx − c is a distance of d units from 0 for some value or values of x and can be interpreted through the compound statement bx − c = d or –(bx − c) = d. (Lesson 16) absolute value inequality An inequality of the form, or equivalent to the form, |bx − c| > d, where b, c, and d are real numbers and any inequality symbol is used (Lesson 17) 498
algebraic expression* A number, a variable, or the result of placing previously generated algebraic expressions into the blanks of one of the four operators ( ) + ( ), ( ) − ( ), ( ) ⋅ ( ), ( ) ÷ ( ), or into the base blank of an exponentiation with an exponent that is a rational number, ( )( ) (Lesson 2) binomial expression A polynomial expression with two terms where each term has a distinct degree (Lesson 3) compound statement Two or more statements connected by logical modifiers, like and or or (Lesson 14) degree of a monomial expression (in one variable) The value of the variable’s exponent when there is one instance of that variable (Lesson 3) degree of a polynomial expression* The degree of the term with the highest degree (Lesson 3) Example: The polynomial expression 2x + 6x3 + 5 has a degree of 3. element of a set An item in the set (Lesson 8) Example: 3 is an element of the set {1, 3}. empty set* The set that contains no elements, denoted {} (Lesson 8) equivalent expressions* When both expressions evaluate to the same number for every possible value of the variables (Lesson 2)
© Great Minds PBC
EUREKA MATH2 A1 ▸ M1
monomial expression* A polynomial expression that is generated by using only multiplication. It does not contain + or − symbols. (Lesson 3)
uniform distribution A quantitative data distribution where the values have the same frequencies (Lesson 18)
Lyla’s Neighborhood
polynomial expression* A numerical expression or variable, or the result of adding or multiplying two previously generated polynomial expressions (Lesson 3)
standard form (of a polynomial expression)* A sum of a finite number of terms of the form axn, where each n is a distinct nonnegative integer, each a is nonzero, and the terms are in descending order by degree (Lesson 3) statement* A sentence that is either true or false, but not both (Lesson 14) term (of a polynomial expression)* A single nonzero monomial expression in a polynomial expression (Lesson 3) trinomial expression A polynomial expression with three terms where each term has a distinct degree (Lesson 3)
Frequency
standard deviation A measure of variability appropriate for data distributions that are approximately symmetric, often used to describe the typical distance from the mean. It is calculated by taking the square root of the variance of a data set. (Lesson 21)
4 3 2 1
0
0
1
2
3
4
5
6
Number of Pets per Household
univariate quantitative data Observations on one numerical variable (Lesson 18) variance The sum of the squared deviations from the mean of a data set divided by one less than the sample size. It is a measure of the overall variation from the mean in a sample. (Lesson 21)
Familiar absolute value of a number area model box plot
*
formal definition
© Great Minds PBC
499
EUREKA MATH2
A1 ▸ M1
center of a data distribution
properties of exponents
data distribution
range
data set
relative frequency histogram
dot plot
set
endpoint (of the graph of the solution set of a single-variable inequality)
set-builder notation
histogram identity inequality interquartile range (IQR) mean
skewed data distribution solution set spread of a data distribution symmetric data distribution tabular model variable
median observation
Academic Verbs
observational unit
Module 1 does not introduce any academic verbs from the Algebra I list.
outlier properties: addition property of equality addition property of inequality associative property of addition associative property of multiplication commutative property of addition commutative property of multiplication multiplication property of equality multiplication property of inequality
500
© Great Minds PBC
Teacher Edition: Grade A1, Module 1, Math Past
Math Past Algebra Begins When did algebra begin? Who first wrote about it? What is the origin of the word algebra? Invite students to examine this algebra problem. You have [separated] ten into two parts, and you have divided one by the other; the obtained quotient is four. [Find the two parts.] 1
gives us the modern word algebra. Historians call al-Khwārizmī the “father of algebra” because he was the first mathematician to establish systematic procedures for simplifying equations. Al-Khwārizmī was so respected for his work that his likeness was depicted in sculpture and on a postage stamp. The sculpture in the photo is in modern-day Khiva, Uzbekistan— near where al-Khwārizmī was born.
The language is a bit old-fashioned, so parsing this problem could benefit from a few hints. First, clarify to students that the phrase separated ten into two parts means that two numbers add to 10 and that the words divided and quotient have their usual meanings. Next, encourage students to test some pairs of numbers—to take guesses, in other words. For example, students might test 5 and 5, 6 and 4, or some other combinations, including those with fractions. If they test 8 and 2, students will realize that they have found the correct answer. But algebra is not about guessing. Algebra uses general rules that lead directly to solutions to problems like this one. Students may be intrigued to learn that this problem appeared about 1200 years ago in a book that represents the beginning of algebra. The author of that book was Persian scholar Muh.ammad ibn Mūsā al-Khwārizmī (780–850). Al-Khwārizmī lived in the city of Baghdad as a member of the House of Wisdom, a center of learning. The year 820 saw the publication of al-Khwārizmī’s book Kitāb al-jabr wa al-muqābala. The title means “Book of Restoration and Balancing.” The word al-jabr in the title 1
Rashed, The Beginnings of Algebra, 148.
502
Let’s go back to al-Khwārizmī’s algebra problem and see how he solved it. We thus infer that you posit one of the two parts as one thing and the other as ten minus one thing.2 More old-fashioned language. The terms one thing and ten minus one thing are al-Khwārizmī’s version of our expressions x and 10 − x. The use of symbols to represent numbers was unknown in al-Khwārizmī’s time, and every problem was a word problem. Then you divide ten minus one thing by one thing, in order to get four.3 2
Rashed, The Beginnings of Algebra, 148.
3
Rashed, The Beginnings of Algebra, 148.
© Great Minds PBC
EUREKA MATH2 A1 ▸ M1
This would translate into the modern equation 10 − x = 4. x
Next, al-Khwārizmī jumps out of the flow of the problem to make a general observation. You know that when you multiply the quotient by the divisor, you find the amount you had divided once again.4 Al-Khwārizmī tells us here that multiplying a fraction (quotient) by the denominator (divisor) gives us the numerator (the amount you had divided).
Al-Khwārizmī used al-jabr (restoration) to move a negative quantity away from one side to become a positive quantity on the other side. There is another part of al-Khwārizmī’s procedure, al-muqābala (balancing), which means to remove the same quantity from both sides by adding or subtracting it. Al-Khwārizmī invented the procedures of al-jabr and al-muqābala to simplify any linear or quadratic equation to one of the following six types.8 (1) ax2 = bx (2) ax2 = c (3) bx = c (4) ax2 + bx = c (5) ax2 + c = bx (6) bx + c = ax2
In this problem, the quotient is four and the divisor is one thing. Multiply four by one thing; the result is four things equal to the amount you have divided; that is ten minus one thing.5 Al-Khwārizmī says that multiplying both sides of the equation 10 − x = 4 by x results in 10 − x = 4x. x
Now al-Khwārizmī uses an unusual word: restore. Restore ten by the thing, and add it to the four things …6 The word restore comes from the Arabic word al-jabr in the title of al-Khwārizmī’s book and connotes the reuniting of broken parts, such as when a doctor realigns a broken bone. Al-Khwārizmī regards minus one thing as a broken part that must be restored to where it belongs, together with the four things. He is saying that we should add x to both sides of 10 − x = 4x and obtain 10 = 5x. … the result is five things equal to ten, and one thing is two, which is one of the two parts.7 To complete the problem, al-Khwārizmī found that one of the two parts (one thing) is 2. He did not state that the other part is 8 and apparently regarded this detail as obvious enough that readers can fill it in for themselves. 4
Rashed, The Beginnings of Algebra, 148.
5
Rashed, The Beginnings of Algebra, 148.
6
Rashed, The Beginnings of Algebra, 148.
7
Rashed, The Beginnings of Algebra, 148.
© Great Minds PBC
(squares equal to roots) (squares equal to a number) (roots equal to a number) (squares plus roots equal to a number) (squares plus a number equal to roots) (roots plus a number equal to squares)
Squares means “multiples of the second power of the unknown number.” Roots means “multiples of the first power of the unknown number.” A number simply refers to a known constant. Al-Khwārizmī required the coefficients a, b, and c to be positive. You might encourage your students to verify that every possible combination involving squares, roots, and numbers with positive coefficients is accounted for in al-Khwārizmī’s list of problem types. Type (3) on al-Khwārizmī’s list is just a linear equation. It is the only combination of squares, roots, and numbers where no squares actually occur. The problem that al-Khwārizmī just explained to us falls into type (3). You and your students have probably noticed that al-Khwārizmī followed pretty much the same steps that we follow in solving algebra problems today. After all, we are using his procedures! If he were alive today, we could show him how to use x instead of referring to the variable as one thing. Then al-Khwārizmī would be ready to learn Eureka Math2! 8
Rashed, The Beginnings of Algebra, 23–24.
503
Teacher Edition: Grade A1, Module 1, Materials
Materials The following materials are needed to implement this module. The suggested quantities are based on a class of 24 students and one teacher. 72
Colored pencils
24
Pencils
1
Teacher computer or device
24
Personal whiteboards
24
Dry-erase markers
24
Personal whiteboard erasers
8
Index cards
1
Projection device
24
Learn books
24
Scientific calculators
1
Painter’s tape
24
Statistics technology
24
Paper or notebook
1
Teach book
504
© Great Minds PBC
Teacher Edition: Grade A1, Module 1, Fluency
Fluency Fluency activities allow students to develop and practice automaticity with fundamental skills so they can devote cognitive power to solving more challenging problems. Skills are incorporated into fluency activities only after they are introduced conceptually within the module. Each lesson in A Story of Functions begins with a Fluency segment designed to activate students’ readiness for the day’s lesson. This daily segment provides sequenced practice problems on which students can work independently, usually in the first few minutes of a class. Students can use their personal whiteboards to complete the activity, or you may distribute a printed version, available digitally. Each fluency routine is designed to take 3–5 minutes and is not part of the 45-minute lesson structure. Administer the activity as a bell ringer or adapt the activity as a teacher-led Whiteboard Exchange or choral response.
Whiteboard Exchange This routine builds fluency through repeated practice and immediate feedback. A Whiteboard Exchange maximizes participation by having every student record solutions or strategies for a sequence of problems. These written recordings allow for differentiation: Based on the answers you observe, you can make responsive, in-the-moment adjustments to the sequence of problems. Each student requires a personal whiteboard and a whiteboard marker with an eraser for this routine. 1. Display one problem in the sequence. 2. Give students time to work. Wait until nearly all students are ready.
Bell Ringer
3. Signal for students to show their whiteboards. Provide immediate and specific feedback to students one at a time. If revisions are needed, briefly return to validate the work after students make corrections.
This routine provides students with independent work time to determine the answers to a set of problems.
4. Advance to the next problem in the sequence and repeat the process.
1. Display all the problems at once. 2. Encourage students to work independently and at their own pace. 3. Read or reveal the answers.
506
© Great Minds PBC
EUREKA MATH2 A1 ▸ M1
Choral Response
Sprints
This routine actively engages students in building familiarity with previously learned skills, strengthening the foundational knowledge essential for extending and applying math concepts. The choral response invites all students to participate while lowering the risk for students who may respond incorrectly.
Sprints are activities that develop mathematical fluency with a variety of facts and skills. A major goal of each Sprint is for students to witness their own improvement within a very short time frame. The Sprint routine is a fun, fast-paced, adrenaline-rich experience that intentionally builds energy and excitement. This rousing routine fuels students’ motivation to achieve their personal best and provides time to celebrate their successes.
1. Establish a signal for students to respond to in unison. 2. Display a problem. Ask students to raise their hands when they know the answer. 3. When nearly all hands are raised, signal for the students’ response. 4. Reveal the answer and advance to the next problem.
Count By This routine actively engages students in committing counting sequences to memory, strengthening the foundational knowledge essential for extending and applying math concepts.
Each Sprint includes two parts, A and B, that feature closely related problems. Students complete Sprint A, followed by two count by routines—one fast-paced and one slow-paced—that include a stretch or other physical movement. Then students complete Sprint B, aiming to improve their score from Sprint A. Each part is scored but not graded. Sprints can be given at any time after the content of the Sprint has been conceptually developed and practiced. The same Sprint may be administered more than once throughout a year or across grade levels. With practice, the Sprint routine takes about 10 minutes.
1. Establish one signal for counting up and counting down and another signal for stopping the count. 2. Tell students the unit to count by. Establish the starting and ending numbers between which they should count. 3. Begin the count by providing the signals. Be careful not to mouth the words as students count.
© Great Minds PBC
507
EUREKA MATH2
A1 ▸ M1
Directions 1. Have students read the instructions and sample problems. Frame the task by encouraging students to complete as many problems as they can—to do their personal best. 2. Time students for 1 minute on Sprint A. Do not expect them to finish. When time is up, have students underline the last problem they completed. 3. Read the answers to Sprint A quickly and energetically. Have students call out “Yes!” if they answered correctly; have them circle the answer if they answered incorrectly. 4. Have students count their correct answers and record that number at the top of the page. This is their personal goal for Sprint B. 5. Celebrate students’ effort and success on Sprint A. 6. To increase success with Sprint B, offer students additional time to complete more problems on Sprint A or ask discussion questions to analyze and discuss the patterns in Sprint A. 7. Lead students in the fast-paced and slow-paced count by routines. Include a stretch or other physical movement during the count. 8. Remind students of their personal goal from Sprint A. 9. Direct students to Sprint B. 10. Time students for 1 minute on Sprint B. When time is up, have students underline the last problem they completed.
Sample Dialogue Have students read the instructions and complete the sample problems. Frame the task: • You may not finish, and that’s okay. Complete as many problems as you can—do your personal best. • On your mark, get set, think! Time students for 1 minute on Sprint A. • Stop! Underline the last problem you did. • I’m going to read the answers quickly. As I read the answers, call out “Yes!” if you got it right. If you made a mistake, circle the answer. Read the answers to Sprint A quickly and energetically. • Count the number of answers you got correct and record that number at the top of the page. This is your personal goal for Sprint B. Celebrate students’ effort and success. Provide 2 minutes to allow students to complete more problems or to analyze and discuss patterns in Sprint A using discussion questions. Lead students in the fast-paced and slow-paced count by routines. Include a stretch or other physical movement during the count. • Point to the number of answers you got correct on Sprint A. Remember, this is your personal goal for Sprint B. Direct students to Sprint B.
11. Read the answers to Sprint B quickly and energetically. Have students call out “Yes!” if they answered correctly; have them circle the answer if they answered incorrectly.
• On your mark, get set, improve!
12. Have students count their correct answers and record that number at the top of the page.
• Stop! Underline the last problem you did.
13. Have students calculate their improvement score by finding the difference between the number of correct answers in Sprint A and in Sprint B. Tell them to record the number at the top of the page. 14. Celebrate students’ improvement from Sprint A to Sprint B.
Time students for 1 minute on Sprint B. • I’m going to read the answers quickly. As I read the answers, call out “Yes!” if you got it right. If you made a mistake, circle the answer. Read the answers to Sprint B quickly and energetically. • Count the number of answers you got correct and record that number at the top of the page. • Calculate your improvement score and record it at the top of the page. Celebrate students’ improvement.
508
© Great Minds PBC
EUREKA MATH2 A1 ▸ M1
The table below provides implementation guidance for the Sprints recommended in this module.
Sprint Name
Administration Guidelines
Discussion Questions
Count By Routines
Additional Challenge
Add and Subtract Fractions
Students add and subtract fractions to build and maintain procedural fluency for module 1.
How are problems 10–18 related?
Fast-paced: tens from 0 to 120
List multiples of 8.
How do problems 10–18 relate to problems 19–27?
Slow-paced: fours from 0 to 44
Apply the Distributive Property
Students apply the distributive property to algebraic expressions to prepare for using properties to demonstrate equivalence in module 1.
What patterns do you notice in problems 1–3, problems 4–6, and problems 7–9?
Fast-paced: fours from 0 to −36
Administer anytime in module 1.
Administer before module 1 lesson 2 or in place of the module 1 lesson 5 Fluency.
How are problems 20 and 21 related?
Slow-paced: threes from −30 to 30
Multiply and Divide Fractions
Students multiply and divide fractions to build and maintain procedural fluency for module 1.
What do you notice about problems 2 and 3? About problems 10 and 11?
Administer anytime in module 1.
Do you think problem 13 or problem 18 was easier? Why?
Operations with Integers
Students add, subtract, multiply, and divide integers to build and maintain procedural fluency for module 1.
How are problems 12–14 related?
Fast-paced: nines from 0 to 99
How can you use problem 18 to answer problem 19?
Slow-paced: eights from 72 to 8
How do problems 7–9 compare to problems 10 and 11?
Fast-paced: fives from 0 to −50
Administer anytime in module 1.
Solve Oneand Two-Step Equations
Students solve one- and twostep equations to prepare for solving multi-step equations in module 1. Administer before module 1 lesson 8 or in place of the module 1 lesson 9 Fluency.
© Great Minds PBC
How can you use problem 20 to answer problem 21?
Fast-paced: fives from 0 to 100 Slow-paced: threes from 0 to 48
Slow-paced: twos from −20 to 20
Write factor pairs that have a product of 36x.
Write equivalent fractions for 43 .
Write factor pairs with a product of −24.
Write a one-step linear equation that has a solution of 4.
509
EUREKA MATH2
A1 ▸ M1
Sprint Name
Administration Guidelines
Discussion Questions
Count By Routines
Additional Challenge
Solve Oneand Two-Step Inequalities
Students solve one- and twostep inequalities to prepare for solving multi-step inequalities in module 1.
How is the strategy you used for problems 1–3 the same as or different from the strategy you used for problems 4–6?
Fast-paced: powers of 3 from 3 to 243
Write two or more expressions that are equivalent to −3(x + 5).
Administer before module 1 lesson 13 or in place of the module 1 lesson 13 Fluency.
Solve Two-Step Equations
Students solve two-step equations to prepare for solving multi-step equations in module 1. Administer before module 1 lesson 8.
Write Equivalent Expressions
Students rewrite simple numeric and algebraic expressions in equivalent forms to prepare for using properties to demonstrate equivalence in module 1. Administer before module 1 lesson 2 or in place of the module 1 lesson 4 Fluency.
510
What do you notice about problems 9–12? Do you think problem 13 or problem 14 was easier? Why? What pattern do you notice in problems 14–16?
1
Slow-paced: powers of 3 1 1 from 81 to 3
Fast-paced: powers of 2 from 2 to 128 1
Slow-paced: powers of 2 1 1 from 64 to 2
Write a two-step linear equation that has a solution of 12.
How are problems 23 and 24 related? How are problems 1–5 and 6–11 related?
Fast-paced: sevens from 0 to 77
How is the strategy you used for problems 1–5 the same as or different from the strategy you used for problems 6–11?
Slow-paced: sixes from 48 to 6
Write expressions that are equivalent to 5x.
© Great Minds PBC
© Great Minds PBC
27. 28.
4 7 6 7 7 11 4 11 3 11 1 11
0 3 10 1 2 7 10 1 18 13 18 5 18 11 20 19 20 17 20
1 + 3 7 7 5 1 + 7 7 8 − 1 11 11 8 − 4 11 11 8 5 − 11 11 8 − 7 11 11 8 − 8 11 11 1 + 1 5 10 3 1 + 5 10 3 1 + 10 5 1 − 1 9 18 7 − 1 9 18 7 − 1 18 9 9 + 1 20 10 9 1 + 20 10 9 − 1 10 20
3. 4. 5. 6. 7. 8. 9. 10. 11. 12. 13. 14. 15. 16. 17. 18.
398
20.
3 7
1 + 2 7 7
2.
36.
35.
34.
33.
32.
31.
30.
29.
26.
25.
24.
23.
22.
21.
19.
2 7
1 + 1 7 7
1.
Add or subtract.
A
A1 ▸ M1 ▸ Sprint ▸ Add and Subtract Fractions
Add and Subtract Fractions
7 − 5 12 18
9 4 + 25 10
5 − 4 6 27
5 + 3 12 8
© Great Minds PBC
11 36
53 50
37 54
19 24
49 40
29 72
5 − 2 8 9 7 + 7 20 8
61 72
3 70 5 + 2 8 9
1 − 1 7 10
17 70
19 35
9 4 − 5 35 1 + 1 7 10
11 32
25 24 5 − 9 8 32
9 + 2 24 3
11 24
13 25
3 2 + 5 25 3 − 7 4 24
21 16
11 27
13 21
11 9
3 + 9 4 16
5 − 4 9 27
3 + 4 7 21
5 + 2 9 3
Number Correct:
EUREKA MATH2
EUREKA MATH2 A1 ▸ M1
511
512 27. 28.
7 9 8 13 5 13 4 13 2 13
0 3 8 5 8 7 8 1 14 9 14 3 14 9 16 15 16 13 16
6 1 + 9 9 9 − 1 13 13 9 − 4 13 13 9 5 − 13 13 9 − 7 13 13 9 − 9 13 13 1 + 1 4 8 3 1 + 4 8 3 1 + 8 4 1 − 1 7 14 5 − 1 7 14 5 − 1 14 7 7 + 1 16 8 7 1 + 16 8 7 − 1 8 16
4. 5. 6. 7. 8. 9. 10. 11. 12. 13. 14. 15. 16. 17. 18.
400
21.
5 9
1 + 4 9 9
3.
36.
35.
34.
33.
32.
31.
30.
29.
26.
25.
24.
23.
22.
20.
4 9
3 1 + 9 9
2.
19.
2 9
1 + 1 9 9
1.
Add or subtract.
B
A1 ▸ M1 ▸ Sprint ▸ Add and Subtract Fractions
Add and Subtract Fractions
7 − 4 12 15
9 + 3 35 10
7 − 5 8 12
7 + 5 16 6
© Great Minds PBC
19 60
39 70
11 24
61 48
32 45
23 42
5 − 2 6 7 4 + 4 15 9
47 42
1 90
19 90
10 21
5 28
47 85
5 + 2 6 7
1 − 1 9 10
1 + 1 9 10
2 − 4 3 21
2 − 3 7 28
7 5 + 48 6
11 30
13 35
3 2 + 7 35 3 − 7 5 30
13 12
4 15
17 21
13 9
5 2 + 3 12
4 − 8 5 15
5 + 4 21 7
7 2 + 3 9
Improvement:
Number Correct:
EUREKA MATH2
A1 ▸ M1 EUREKA MATH2
© Great Minds PBC
© Great Minds PBC
x+2 x+3 2x – 2 2x – 4 2x – 6 6x + 3 6x + 6 6x + 9 8x – 4 8x – 8 9x + 18 9x – 18 −9x + 18 9x – 18 20x − 12 −20x − 12 20x + 12 20x − 12 −x + 10 −x − 10 x + 10
1(x + 2) 1(x + 3) 2(x − 1) 2(x − 2) 2(x − 3) 3(2x + 1) 3(2x + 2) 3(2x + 3) 4(2x − 1) 4(2x − 2) 3(3x + 6) 3(3x − 6) −3(3x − 6) (−3x + 6)(−3) 4(5x − 3) −4(5x + 3) −4(−5x − 3) (−5x + 3)(−4) (x − 10)(−1) −(x + 10) −(−x − 10)
2. 3. 4. 5. 6. 7. 8. 9. 10. 11. 12. 13. 14. 15. 16. 17. 18. 19. 20. 21. 22.
402
x+1
1(x + 1)
1.
Apply the distributive property and combine like terms.
A
A1 ▸ M1 ▸ Sprint ▸ Apply the Distributive Property
Apply the Distributive Property
44.
43.
42.
41.
40.
39.
38.
37.
36.
35.
34.
33.
32.
31.
30.
29.
28.
27.
26.
25.
24.
23.
5x2 − 2x 12x2 − 2x −12x2 − 2x −12x2 − 6x 40x − 12x2
(−5x + 2)(−x) 2x(6x − 1) (−6x − 1)(2x) −6x(2x + 1) 4x(10 − 3x)
4x − 2x(6x − 1)
4x(6x − 1) − 2x
6x + 2x(4x − 1)
2x(6x + 1) + 4x
2x − 4(−x + 3)
2x + 4(3 − x)
−4(x − 3) + 2x
4(x + 3) + 2x
6 − (−5x + 6)
−(5x − 6) + 6
−(6 + 5x) + 6
© Great Minds PBC
6x − 12x2
24x2 − 6x
4x + 8x2
12x2 + 6x
6x − 12
−2x + 12
−2x + 12
6x + 12
5x
−5x + 12
−5x
30x2 − 40x
5x2 − 10x
5x(x − 2)
10x(3x − 4)
5x2 + 2x
9x − x2
x2 − 9x
x2 + 9x
x(5x + 2)
(9 − x)x
x(x − 9)
x(x + 9)
Number Correct:
EUREKA MATH2
EUREKA MATH2 A1 ▸ M1
513
514 x+5 x+6 2x − 8 2x − 10 2x − 12 9x + 3 9x + 6 9x + 9 12x − 4 12x − 8 8x + 16 8x − 16 −8x + 16 8x − 16 18x − 12 −18x − 12 18x + 12 18x − 12 −x + 12 −x − 12 x + 12
1(x + 5) 1(x + 6) 2(x − 4) 2(x − 5) 2(x − 6) 3(3x + 1) 3(3x + 2) 3(3x + 3) 4(3x − 1) 4(3x − 2) 2(4x + 8) 2(4x − 8) −2(4x − 8) (−4x + 8)(−2) 3(6x − 4) −3(6x + 4) −3(−6x − 4) (−6x + 4)(−3) (x − 12)(−1) −(x + 12) −(−x − 12)
2. 3. 4. 5. 6. 7. 8. 9. 10. 11. 12. 13. 14. 15. 16. 17. 18. 19. 20. 21. 22.
404
x+4
1(x + 4)
1.
Apply the distributive property and combine like terms.
B
A1 ▸ M1 ▸ Sprint ▸ Apply the Distributive Property
Apply the Distributive Property
44.
43.
42.
41.
40.
39.
38.
37.
36.
35.
34.
33.
32.
31.
30.
29.
28.
27.
26.
25.
24.
23.
4x − 5x(3x − 1)
4x(3x − 1) − 5x
3x + 2x(4x − 1)
2x(3x + 1) + 2x
2x − 3(−x + 4)
2x + 3(4 − x)
−3(x − 4) + 2x
3(x + 4) + 2x
4 − (−7x + 4)
−(7x − 4) + 4
−(4 + 7x) + 4
10x(4x − 3)
3x(10 − 4x)
−5x(2x + 1)
(−5x − 1)(2x)
2x(5x − 1)
(−7x + 3)(−x)
7x(x − 3)
x(7x + 3)
(5 − x)x
x(x − 5)
x(x + 5)
Improvement:
Number Correct:
© Great Minds PBC
9x − 15x2
12x2 − 9x
x + 8x2
6x2 + 4x
5x − 12
−x + 12
−x + 12
5x + 12
7x
−7x + 8
−7x
40x2 − 30x
30x − 12x2
−10x2 − 5x
−10x2 − 2x
10x2 − 2x
7x2 − 3x
7x2 − 21x
7x2 + 3x
5x − x2
x2 − 5x
x2 + 5x
EUREKA MATH2
A1 ▸ M1 EUREKA MATH2
© Great Minds PBC
© Great Minds PBC
22. 23.
25. 26. 27.
29. 30.
3 5 5 3
1 1 5 3 3 5 2 15 2 15 5 6
15 3 28 3 28 21 4
28 1 21
3⋅ 1 5
5⋅ 1 3
1 ÷ 1 3 3 1 ÷ 1 5 5 1 ÷ 1 3 5 1 ÷ 1 5 3 1 2 ⋅ 3 5 2 1 ⋅ 3 5 1 ÷ 2 3 5
3÷ 1
5 3 1 ⋅ 4 7 1 3 ⋅ 4 7 3 ÷ 1 4 7
7÷ 1
4 1 ÷3 7
4. 5. 6. 7. 8. 9. 10. 11. 12. 13. 14. 15. 16. 17. 18.
406
21.
1 15
1 1 ⋅ 5 3
3.
36.
35.
34.
33.
32.
31.
28.
24.
20.
1 15
1 1 ⋅ 3 5
2.
19.
1 9
1 1 ⋅ 3 3
1.
Multiply or divide.
A
A1 ▸ M1 ▸ Sprint ▸ Multiply and Divide Fractions
Multiply and Divide Fractions
12 5 21 5 20 63 36 35 35 27 5 63 15 64 21 320 80 21 24 175 70 27 16 15 10 63
5 7 5 4 ⋅ 9 7 5 4 ÷ 7 9 7 ÷ 3 9 5 5 ÷7 9 1 3 5 ⋅ ⋅ 2 4 8 7 1 3 ⋅ ⋅ 4 8 10 5 2 ⋅8⋅ 3 7 2 3 4 ⋅ ⋅ 5 7 5 3
3 ⋅4 5
7⋅ 5 ⋅ 2
2 4 ⋅ ÷ 1 3 5 2 3 2 ÷ ⋅ 1 3 5 7
2 4 ⋅ ÷3 3 5
5
3÷ 4 ⋅ 1
9
© Great Minds PBC
8 45
15 28
28 15
4 ÷ 3 5 7
7
21 20
3 ÷ 4 5 7
3÷
12 35
4 3 ⋅ 7 5
Number Correct:
EUREKA MATH2
EUREKA MATH2 A1 ▸ M1
515
516 22. 23.
25. 26. 27.
29. 30.
5 7 7 5
1 1 7 5 5 7 2 35 2 35 7 10
35 5 36 5 36 45 4
36 1 45
5⋅ 1 7
7⋅ 1 5
1 ÷ 1 5 5 1 ÷ 1 7 7 1 ÷ 1 5 7 1 ÷ 1 7 5 1 2 ⋅ 5 7 2 1 ⋅ 5 7 1 ÷ 2 5 7
5÷ 1
7 5 1 ⋅ 4 9 1 5 ⋅ 4 9 5 ÷ 1 4 9
9÷ 1
4 1 ÷5 9
4. 5. 6. 7. 8. 9. 10. 11. 12. 13. 14. 15. 16. 17. 18.
408
21.
1 35
1 1 ⋅ 7 5
3.
36.
35.
34.
33.
32.
31.
28.
24.
20.
1 35
1 1 ⋅ 5 7
2.
19.
1 25
1 1 ⋅ 5 5
1.
Multiply or divide.
B
A1 ▸ M1 ▸ Sprint ▸ Multiply and Divide Fractions
Multiply and Divide Fractions
15 28 20 21 4 45 35 72 21 200 135 28 48 175 162 35 24 35 9 70 21 10 8 105
5 3 ÷ 7 4 4 ÷5 9 1 5 7 ⋅ ⋅ 2 4 9 7 1 3 ⋅ ⋅ 4 5 10 3 ⋅9⋅ 5 4 7 3 4 4 ⋅ ⋅ 5 7 5
9⋅ 6 ⋅ 3 4 2 ⋅ ÷ 1 5 7 3 3 ÷ 2 ⋅ 1 7 3 5 5
3 ÷ 4 7 5
3÷ 2 ⋅ 1
4 2 ⋅ ÷3 7 5
7
7
© Great Minds PBC
12 35
4 3 ⋅ 5 7
5
35 3
3 7
5÷
14 5
21 10
14 15
6 35
2 ⋅7 5
3 ÷ 2 5 7
3 2 ÷ 5 7
3 2 ⋅ 7 5
Improvement:
Number Correct:
EUREKA MATH2
A1 ▸ M1 EUREKA MATH2
© Great Minds PBC
© Great Minds PBC
−1 + (−1)
1 + (−1)
3.
−1 − (−1)
−2 + 3
410
22.
21.
20.
19.
18.
17.
16.
15.
14.
13.
−14 ÷ (−2)
−14 ÷ 2
−10 ⋅ (−5)
10 ⋅ (−5)
−10 ⋅ 5
−4 − (−6)
4 − (−6)
−4 − 6
−2 + (−3)
2 + (−3)
−1 ÷ (−1)
12.
11.
−1 ÷ 1
−1 ⋅ (−1)
1 ⋅ (−1)
−1 ⋅ 1
10.
9.
8.
7.
1 − (−1)
6.
5.
−1 − 1
4.
2.
−1 + 1
1.
Evaluate.
A 25. 26. 27. 28. 29. 30. 31. 32. 33. 34. 35. 36. 37. 38. 39. 40. 41. 42. 43. 44.
−2 −2 2 0 −1 −1 1 −1 1 1 −1 −5 −10 10 2 −50 −50 50 −7 7
23. 24.
0 0
A1 ▸ M1 ▸ Sprint ▸ Operations with Integers
Operations with Integers
(8 ⋅ (−2)) − (−3 ⋅ 4)
(−8 ⋅ 2) + (−4 ⋅ 3)
6 + 5 ⋅ (−2)
(−5 + 6) ⋅ 2
−5 ⋅ 2 − 6
−5(2 − 6)
−1 ⋅ 1 − 1
−1(1 − 1)
−2 ⋅ 7 ⋅ (−3)
−2 − 7 − (−3)
−2 + 7 + (−3)
−4 + (−13)
−13 ⋅ 4
4 − 13
−12 ⋅ (−6)
−6 + (−12)
−12 ÷ 6
6 − (−12)
−9 − (−3)
−9 ÷ (−3)
−3 + (−9)
−9 ⋅ (−3)
Number Correct:
© Great Minds PBC
−4
−28
−4
2
−16
20
−2
0
42
−6
2
−17
−52
−9
72
−18
−2
18
−6
3
−12
27
EUREKA MATH2
EUREKA MATH2 A1 ▸ M1
517
518 −4 + 5
412
22.
21.
20.
19.
18.
17.
16.
15.
14.
13.
−18 ÷ (−3)
−18 ÷ 3
−20 ⋅ (−4)
20 ⋅ (−4)
−20 ⋅ 4
−6 − (−9)
6 − (−9)
−6 − 9
−4 + (−5)
4 + (−5)
−2 ÷ (−2)
12.
11.
−2 ÷ 2
−2 ⋅ (−2)
2 ⋅ (−2)
−2 ⋅ 2
−2 − (−2)
2 − (−2)
10.
9.
8.
7.
6.
5.
4.
−2 − 2
−2 + (−2)
2 + (−2)
3.
2.
−2 + 2
1.
Evaluate.
B 23. 24. 25. 26. 27. 28. 29. 30. 31. 32. 33. 34. 35. 36. 37. 38. 39. 40. 41. 42. 43. 44.
0 0 −4 −4 4 0 −4 −4 4 −1 1 1 −1 −9 −15 15 3 −80 −80 80 −6 6
A1 ▸ M1 ▸ Sprint ▸ Operations with Integers
Operations with Integers
(5 ⋅ (−4)) − (−2 ⋅ 7)
(−5 ⋅ 4) + (−7 ⋅ 2)
6 + 5 ⋅ (−3)
(−5 + 6) ⋅ 3
−6 ⋅ 3 − 5
−6(3 − 5)
−2 ⋅ 2 − 2
−2(2 − 2)
−1 ⋅ 9 ⋅ (−4)
−1 − 9 − (−4)
−1 + 9 + (−4)
−6 + (−15)
−15 ⋅ 6
6 − 15
−21 ⋅ (−7)
−7 + (−21)
−21 ÷ 7
7 − (−21)
−12 − (−4)
−12 ÷ (−4)
−4 + (−12)
−12 ⋅ (−4)
Improvement:
Number Correct:
© Great Minds PBC
−6
−34
−9
3
−23
12
−6
0
36
−6
4
−21
−90
−9
147
−28
−3
28
−8
3
−16
48
EUREKA MATH2
A1 ▸ M1 EUREKA MATH2
© Great Minds PBC
© Great Minds PBC
40. 41.
17 19 2 4 8 8 12 −12 4 4 −4 −2 −1
2
−3 −1
3
−12 12 −12
x − 5 = 12 x − 7 = 12 8x = 16 4x = 16 2x = 16 1 x = 4 2 1 x = 4 3
8 + x = −4 −8 + x = −4 x − 8 = −4 x − (−8) = 4 −5x = 10 10x = −5 2x = −6 −6x = 2 1 x = −6 2
− 1 x = −6 −1 x = 2 6
5. 6. 7. 8. 9. 10. 11. 12. 13. 14. 15. 16. 17. 18. 19. 20. 21. 22. 414
39.
15
x − 3 = 12
4.
2
38.
0
x+6=6
3.
44.
43.
42.
37.
36.
35.
34.
33.
32.
31.
30.
29.
28.
27.
26.
25.
24.
2
x+4=6
2.
23.
4
x+2=6
1.
Solve each equation.
A
A1 ▸ M1 ▸ Sprint ▸ Solve One- and Two-Step Equations
Solve One- and Two-Step Equations
4 −20 4
9 = 3( x + 8) −9 = 3 ( x + 8) − 3 ( x + 8) = −9
1 = −2 x + 2 3 3
3
− 2 ( x − 1) = 1
3
−2 x + 1 = 1
4
2
© Great Minds PBC
−1 2
−1
0
2
3 (x + 4) = 9 2
4
2
3 x +6 = 9 2
4
−4
−2 = 1 x − 1 4
−4
−1 x + 1 = 2 4
−4
− 1 ( x − 4) = 2 4
−5
−5
−5
−4
−4
4
4
4
5
6
9
12 = −3(x + 1)
−3x − 3 = 12
−x − 3 − x − x = 12
12 = −x − x − x
12 = −3x
18 = 3(x + 2)
3x + 6 = 18
2x + x + 6 = 18
2x + x + 3 = 18
2x + x = 18
2x = 18
Number Correct:
EUREKA MATH2
EUREKA MATH2 A1 ▸ M1
519
520 41.
16 2 3 6 15 20 −9 3 3 −3 −3 −1
3
−2 −1
2
−12 12
x − 6 = 10 9x = 18 6x = 18 3x = 18 1 x = 5 3 1 x = 5 4
6 + x = −3 −6 + x = −3 x − 6 = −3 x − (−6) = 3 8x = −24 −24x = 8 −6x = 12 12x = −6 1 x = −4 3
− 1 x = −4
6. 7. 8. 9. 10. 11. 12. 13. 14. 15. 16. 17. 18. 19. 20. 21.
416
−1 x = 3 4
−12
40.
14
x − 4 = 10
5.
22.
39.
12
x − 2 = 10
4.
3
38.
0
x+7=7
3.
44.
43.
42.
37.
36.
35.
34.
33.
32.
31.
30.
29.
28.
27.
26.
25.
24.
2
x+5=7
2.
23.
4
x+3=7
1.
Solve each equation.
B
A1 ▸ M1 ▸ Sprint ▸ Solve One- and Two-Step Equations
Solve One- and Two-Step Equations
−12 −12 2 2
−1 x + 1 = 3 −3 = 1 x − 1 5 x + 10 = 15 2 5 2
−2
− 3 ( x − 2) = 2 2 = −3 x + 6 4 4
4
© Great Minds PBC
−2 3
3
0
−3 x + 2 = 2 4
8
− 4 ( x + 12) = −16 5
−32
−16 = 4 ( x + 12 ) 5
8
16 = 4 ( x + 12 ) 5
( x + 4) = 15
6
6
−12
− 1 ( x − 6) = 3 6
−5
−5
−5
−4
−4
2
2
2
3
4
5
16 = −4(x + 1)
−4x − 4 = 16
−x − 4 − x − x − x = 16
16 = −x − x − x − x
16 = −4x
20 = 5(x + 2)
5x + 10 = 20
4x + x + 10 = 20
4x + x + 5 = 20
4x + x = 20
4x = 20
Improvement:
Number Correct:
EUREKA MATH2
A1 ▸ M1 EUREKA MATH2
© Great Minds PBC
© Great Minds PBC
x>6 x>4 x < 12 x < 14 x < 16 x<9 x>6 x>5 x > −25 x > −5 x > 25 x > −1 x>2 x > −4 x>8
x + 4 > 10 x + 6 > 10 x−3<9 x−5<9 x−7<9 2x < 18 3x > 18 10 + x > 15 10 + x > −15 −10 + x > −15 −10 + x > 15 4x > −4 4x > 8 4x > −16 4x > 32
2. 3. 4. 5. 6. 7. 8. 9. 10. 11. 12. 13. 14. 15. 16.
418
x>8
x + 2 > 10
1.
Solve each inequality for x.
A
A1 ▸ M1 ▸ Sprint ▸ Solve One- and Two-Step Inequalities
Solve One- and Two-Step Inequalities
32.
31.
30.
29.
28.
27.
26.
25.
24.
23.
22.
21.
20.
19.
18.
17.
x > 10 x > 20 x < −4 x > −6 x<6 x>3 x < −9 x < −9 x < 27 x > −27 x < −27 x > −10 x < −10
−2x < −20 −x < −20 1 x < −2 2
−1 x < 3 − 1 x > −2 3(x + 3) > 18 −4(x + 3) > 24 −4x − 12 > 24 2 x − 6 < 12 3
−6 − 2 x < 12
( x + 9) < −12
2 3
−12 − 3 x < −6 3 ( x + 20 ) < 6 5
3
5
© Great Minds PBC
x < −10
2x < −20
3
x>5
−4x < −20
2
x < −4
5x < −20
Number Correct:
EUREKA MATH2
EUREKA MATH2 A1 ▸ M1
521
522 x>7 x>5 x < 10 x < 12 x < 14 x<4 x>2 x>5 x > −35 x > −5 x > 35 x > −1 x>2 x > −3 x>6
x + 5 > 12 x + 7 > 12 x−2<8 x−4<8 x−6<8 4x < 16 8x > 16 15 + x > 20 15 + x > −20 −15 + x > −20 −15 + x > 20 6x > −6 6x > 12 6x > −18 6x > 36
2. 3. 4. 5. 6. 7. 8. 9. 10. 11. 12. 13. 14. 15. 16.
420
x>9
x + 3 > 12
1.
Solve each inequality for x.
B
A1 ▸ M1 ▸ Sprint ▸ Solve One- and Two-Step Inequalities
Solve One- and Two-Step Inequalities
32.
31.
30.
29.
28.
27.
26.
25.
24.
23.
22.
21.
20.
19.
18.
17.
x < 20
− 1 x > −4
x < 50 x > −50
2 x − 6 < 14 5
−6 − 2 x < 14
x > −21
3 x < −9 7 3 7
( x + 42) < 9
© Great Minds PBC
x < −21
x < −50
( x + 15) < −14
5
x < −7
x < −7 −4x − 8 > 20
−4(x + 2) > 20
4(x + 2) > 16
5
−18 −
2 5
x > −20
−1 x < 5
x>2
x < −12
1 x < −3 4 4
x > 28
x > 14
x < −14
x>4
x < −7
−x < −28
−2x < −28
2x < −28
−7x < −28
4x < −28
Improvement:
Number Correct:
EUREKA MATH2
A1 ▸ M1 EUREKA MATH2
© Great Minds PBC
© Great Minds PBC
5 5 5 5 4 5 6 7 10 9 7 6 6 7 8 12 11
2x + 5 = 15 2x + 6 = 16 2x + 7 = 17 2x + 8 = 18 2x − 2 = 6 2x − 4 = 6 2x − 6 = 6 2x − 8 = 6 2x − 6 = 14 2x − 6 = 12 2x + 4 = 18 2x + 4 = 16 2(x + 2) = 16 2(x + 2) = 18 2(x + 2) = 20 2(x − 2) = 20 2(x − 2) = 18
2. 3. 4. 5. 6. 7. 8. 9. 10. 11. 12. 13. 14. 15. 16. 17. 18. 422
5
2x + 4 = 14
1.
Solve each equation.
A
A1 ▸ M1 ▸ Sprint ▸ Solve Two-Step Equations
Solve Two-Step Equations
36.
35.
34.
33.
32.
31.
30.
29.
28.
27.
26.
25.
24.
23.
22.
21.
20.
19.
15 3 15 0 0 18
1 x−3 = 2 3
−1 x + 3 = 2 −2 = − 1 ( x − 9 ) −1 ( x − 9 ) = 3 3 = −1 x + 3 − 1 x + 3 = −3 3
3
3
3
© Great Minds PBC
−3
1 x − 2 = −3 3
3
3
3 = 1x + 2 3
3
)=3
1 x +6 3
(
−4
0
6
2
2
−6
−2
2
2
3(x + 2) = −6
6 = −3(x − 2)
−3(x − 2) = −12
−3x − 6 = −12
3x − 12 = −6
−6 = 3x + 12
3x + 12 = 6
3x + 6 = 12
12 = 3(x + 2)
Number Correct:
EUREKA MATH2
EUREKA MATH2 A1 ▸ M1
523
524 2 2 3 4 5 6 8 7 4 3 3 4 5 11
3x + 7 = 13 3x + 8 = 14 3x − 3 = 6 3x − 6 = 6 3x − 9 = 6 3x − 12 = 6 3x − 6 = 18 3x − 6 = 15 3x + 9 = 21 3x + 9 = 18 3(x + 3) = 18 3(x + 3) = 21 3(x + 3) = 24 3(x − 3) = 24
4. 5. 6. 7. 8. 9. 10. 11. 12. 13. 14. 15. 16. 17.
424
10
2
3x + 6 = 12
3.
3(x − 3) = 21
2
3x + 5 = 11
2.
18.
2
3x + 4 = 10
1.
Solve each equation.
B
A1 ▸ M1 ▸ Sprint ▸ Solve Two-Step Equations
Solve Two-Step Equations
36.
35.
34.
33.
32.
31.
30.
29.
28.
27.
26.
25.
24.
23.
22.
21.
20.
19.
2 2 8 0 −6 8 8 −8 24 8 24 0 0 32
4x − 20 = −12 −4x − 12 = −20 −4(x − 3) = −20 12 = −4(x − 3) 4(x + 3) = −12
( x + 8) = 4
1 4
4 = 1x +2 1 x − 2 = −4 4 1 x−4 = 2 4
−1 x + 4 = 2 −2 = − 1 ( x − 16 ) − 1 ( x − 16) = 4 4 = −1 x + 4 − 1 x + 4 = −4 4
4
4
© Great Minds PBC
−8
−12 = 4x + 20
4
−2
4x + 20 = 12
4
2
4x + 12 = 20
4
2
20 = 4(x + 3)
Improvement:
Number Correct:
EUREKA MATH2
A1 ▸ M1 EUREKA MATH2
© Great Minds PBC
© Great Minds PBC
3 3 4 5 2x 3x 3x 4x 5x 6x 3x 4x 5x 8x 9x 10x 9x 5x 0 −x −2x
1+1+1 (1 + 1) + 1 (1 + 1) + (1 + 1) (1 + 1) + (1 + 1 + 1) x+x x+x+x (x + x) + x (x + x) + (x + x) (x + x) + (x + x + x) (x + x) + (x + x + x + x) 2x + x 3x + x x + 4x x + 7x 2x + 7x 7x + 3x 10x − x 10x − 5x 10x − 10x 10x − 11x 10x − 12x
2. 3. 4. 5. 6. 7. 8. 9. 10. 11. 12. 13. 14. 15. 16. 17. 18. 19. 20. 21. 22.
426
2
1+1
1.
44.
43.
42.
41.
40.
39.
38.
37.
36.
35.
34.
33.
32.
31.
30.
29.
28.
27.
26.
25.
24.
23.
Number Correct:
(2x + 3y) − (2x − 3y)
(2x − 3y) + (3y − 4x)
(2x − 3y) + (4x − y)
(2x + 3y) + (4x + y)
(11 − 5x) − (2 − 4x)
(5x + 11) + (2 − 4x)
(11 − 5x) + (4x + 2)
(3x − 9) − (3x + 9)
(3x − 9) + (3x + 9)
(3x − 9) + (3x − 9)
(3x + 9) + (3x + 9)
2x + (4 − 3x)
4x + (4 − 3x)
6x + (4 − 3x)
6x + (4 + 3x)
6x + (4x + 3)
3x + (4x + 3)
(4x + 3) + 2x
(4x + 3) + x
4x + 6x + 4
4x + 6x − 4x
4x + 6x − 12x
Rewrite each expression as an equivalent expression in standard form.
A
A1 ▸ M1 ▸ Sprint ▸ Write Equivalent Expressions
Write Equivalent Expressions
© Great Minds PBC
6y
−2x
6x − 4y
6x + 4y
−x + 9
x + 13
−x + 13
−18
6x
6x − 18
6x + 18
−x + 4
x+4
3x + 4
9x + 4
10x + 3
7x + 3
6x + 3
5x + 3
10x + 4
6x
−2x
EUREKA MATH2
EUREKA MATH2 A1 ▸ M1
525
526 4 4 5 6 3x 4x 4x 5x 6x 6x 5x 6x 9x 12x 14x 16x 8x 4x 0 −x −2x
1+1+1+1 (1 + 1) + (1 + 1) (1 + 1 + 1) + (1 + 1) (1 + 1 + 1) + (1 + 1 + 1) x+x+x x+x+x+x (x + x) + (x + x) (x + x + x) + (x + x) (x + x + x) + (x + x + x) (x + x) + (x + x) + (x + x) 4x + x 5x + x x + 8x x + 11x 3x + 11x 11x + 5x 9x – x 9x − 5x 9x − 9x 9x − 10x 9x − 11x
2. 3. 4. 5. 6. 7. 8. 9. 10. 11. 12. 13. 14. 15. 16. 17. 18. 19. 20. 21. 22.
428
3
1+1+1
1.
44.
43.
42.
41.
40.
39.
38.
37.
36.
35.
34.
33.
32.
31.
30.
29.
28.
27.
26.
25.
24.
23.
Improvement:
Number Correct:
(4x + 9y) − (4x − 9y)
(4x − 9y) + (9y − 8x)
(4x − 9y) + (8x − 3y)
(4x + 9y) + (8x + 3y)
(6 − 13x) − (3 − 8x)
(13x + 6) + (3 − 8x)
(6 − 13x) + (8x + 3)
(5x − 7) − (5x + 7)
(5x + 7) + (5x − 7)
(5x − 7) + (5x − 7)
(5x + 7) + (5x + 7)
3x + (3 − 4x)
5x + (3 − 4x)
7x + (3 − 4x)
7x + (3 + 4x)
7x + (3x + 4)
3x + (3x + 4)
(3x + 4) + 2x
(3x + 4) + x
3x + 5x + 3
3x + 5x − 3x
3x + 5x − 10x
Rewrite each expression as an equivalent expression in standard form.
B
A1 ▸ M1 ▸ Sprint ▸ Write Equivalent Expressions
Write Equivalent Expressions
© Great Minds PBC
18y
−4x
12x − 12y
12x + 12y
−5x + 3
5x + 9
−5x + 9
−14
10x
10x − 14
10x + 14
−x + 3
x+3
3x + 3
11x + 3
10x + 4
6x + 4
5x + 4
4x + 4
8x + 3
5x
−2x
EUREKA MATH2
A1 ▸ M1 EUREKA MATH2
© Great Minds PBC
EUREKA MATH2
A1 ▸ M1
Teacher Edition: Grade A1, Module 1, Sample Solutions
Mixed Practice Solutions Expect to see varied solution paths. Accept accurate responses, reasonable explanations, and equivalent answers for all student work.
EUREKA MATH2
A1 ▸ M1
EUREKA MATH2
A1 ▸ M1 ▸ Mixed Practice 1
Student Edition: Grade A1, Module 1, Mixed Practice 1
Mixed Practice
1
1. Evaluate 4
( 12 x − 1)
−5
Name
Date
4. Choose the solution to the system of linear equations shown in the graph.
y 3
A. Point F
1 for x = − . 2
2
B. Point G
G
J
1
C. Point J −3
D. Points F, G, and J
−2
−1
0
−1
F 1
2
3
x
−2 −3
2. Solve 6 +
12
7 3 x = 4 + x + 8 for x. 8 8
5. Solve the system of linear equations algebraically.
y = 3 x + 16 5 y = − 1 x 5
3. Write a number that completes the equation so it has infinitely many solutions.
4(2x + _____) = 8x + 12 3
© Great Minds PBC
528
(−20, 4)
381
382
© Great Minds PBC
© Great Minds PBC
EUREKA MATH2 A1 ▸ M1
EUREKA MATH2
A1 ▸ M1 ▸ Mixed Practice 1
6. Match each graph to its description.
EUREKA MATH2
A1 ▸ M1 ▸ Mixed Practice 1
7. Each student at Sparks Middle School takes one elective class. A random sample of students was asked which elective class they currently take. The two-way table shows the number of students in the sample by grade level who take each elective class. Use the data in the table to calculate each proportion in parts (a) and (b). Elective Classes
The graph shows an outlier.
Grade Level
The graph shows a negative, nonlinear association.
Band
Art
Yearbook
Total
Grade 6
22
19
0
41
Grade 7
15
12
10
37
Grade 8
17
14
16
47
Total
54
45
26
125
a. What proportion of students from the sample take art class? If necessary, round the answer to two decimal places. A. 0.27 B. 0.31 C. 0.36 D. 0.42
The graph shows clustering.
b. What proportion of seventh grade students from the sample take yearbook class? If necessary, round the answer to two decimal places. A. 0.21 B. 0.27 C. 0.30
The graph shows a positive, linear association.
© Great Minds PBC
© Great Minds PBC
D. 0.38
383
384
© Great Minds PBC
529
EUREKA MATH2
A1 ▸ M1
EUREKA MATH2
A1 ▸ M1 ▸ Mixed Practice 1
8. Over a period of several years, Tiah recorded how many fish she caught each time she went fishing. She plans to go fishing again today. The table shows the number of fish Tiah caught on previous trips and the probability that she catches that number of fish today.
Number of Fish
0
1
2
3
4
5
Probability
0.1
0.05
0.09
0.25
0.3
0.2
6
or more
0.01
a. What is the probability that Tiah will catch exactly 4 fish? The probability that Tiah will catch exactly 4 fish is 0.3, or 30%.
b. What is the probability that Tiah will catch at least 3 fish? The probability that Tiah will catch at least 3 fish is 0.76, or 76%.
© Great Minds PBC
530
385
© Great Minds PBC
EUREKA MATH2 A1 ▸ M1
EUREKA MATH2
A1 ▸ M1
EUREKA MATH2
A1 ▸ M1 ▸ Mixed Practice 2
Student Edition: Grade A1, Module 1, Mixed Practice 2
Mixed Practice
2
Name
Date
3. Match each statement to the inequality that models it. An inequality may be matched to more than one statement.
1. Which expressions are equivalent to 43 ⋅ 4−8? Choose all that apply. A. 4
Five less than 7 times a number is at least 21.
−24
Five less than 7 times a number is at most 21.
C. 411
E. F.
4
3
7x − 5 > 21
7x − 5 ≥ 21
Five less than 7 times a number is no more than 21.
4−8 4
7x − 5 ≤ 21
Five less than 7 times a number is less than 21.
B. 4−5
D.
7x − 5 < 21
Five less than 7 times a number is greater than 21.
3
48 1
45
4. Water flows from a hose at a constant rate of 14 gallons per minute. a. Write an equation to represent the number of gallons g that flows from the hose in t minutes.
g = 14t
5
2. Which expressions are equivalent to 1.2 × 10 ? Choose all that apply. A. 120,000 B. (1.0 × 10⁶) + (2.0 × 10⁵) C. (2.0 × 10³)(6.0 × 10²)
b. Complete the table.
7 D. 4.8×10
4.0×10²
E. (2.0 × 10⁵) − (8.0 × 10⁴)
© Great Minds PBC
© Great Minds PBC
387
388
Time, t (minutes)
Number of Gallons, g
0
0
5
70
7
98
10
140
© Great Minds PBC
531
EUREKA MATH2
A1 ▸ M1
EUREKA MATH2
A1 ▸ M1 ▸ Mixed Practice 2
c. Graph the relationship between time and gallons of water.
6. The table represents a function. Which ordered pairs can be added to the table so that it still represents a function? Choose all that apply.
g 160 Number of Gallons
EUREKA MATH2
A1 ▸ M1 ▸ Mixed Practice 2
140 120 100 80 60 40
x
y
1
−4
2
−7
3
−10
20 0
1
2
3
4
5
6
7
8
9 10 11
A. (4, −13)
t
B. (1, −1)
Time (minutes)
C. (−4, −1) D. (0, −1)
5. Calculate the slope of the line twice by using two different pairs of points.
E. (6, −10)
y
F. (3, −12)
10
5
(0, 6) (1, 3) (2, 0)
−10
−5
5
0
10
7. A right triangle has one leg with a length of 12 cm and a hypotenuse with a length of 20 cm. What is the length of the other leg?
x
(3, –3)
16 cm
−5
−10
Using the points (0, 6) and (1, 3), m = Using the points (1, 3) and (2, 0), m =
( 6 −3 ) ( 0 −1 ) ( 3− 0 ) ( 1− 2 )
=
3 = −3 . −1
=
3 = −3 . −1
The slope of the line is −3.
© Great Minds PBC
532
389
390
© Great Minds PBC
© Great Minds PBC
EUREKA MATH2 A1 ▸ M1
EUREKA MATH2
A1 ▸ M1 ▸ Mixed Practice 2
8. Ji-won says that a translation is the only transformation of AB that will result in an image with the same length as AB . Do you agree with Ji-won? Explain.
B
A No, I do not agree with Ji-won. While Ji-won is correct that a translation will result in a segment that is the same length as AB , it is not the only transformation that will do so. A reflection or a rotation will also result in a segment with the same length as AB . Translations, reflections, and rotations all preserve length.
© Great Minds PBC
© Great Minds PBC
391
533
Teacher Edition: Grade A1, Module 1, Works Cited
Works Cited National Governors Association Center for Best Practices, Council of Chief State School Officers (NGA Center, CCSSO). Common Core State Standards for Mathematics. Washington, DC: NGA Center, CCSSO, 2010. O’Connor, John J. and Edmund F. Robertson. “Abu Ja’far Muhammad ibn Musa Al-Khwarizmi.” St. Andrews, Scotland: School of Mathematics and Statistics, University of St. Andrews. 2019. http://mathshistory.st-andrews.ac.uk/ Biographies/Al-Khwarizmi.html.
534
O’Connor, John J. and Edmund F. Robertson. “Arabic Mathematics: Forgotten Brilliance?” St. Andrews, Scotland: School of Mathematics and Statistics, University of St. Andrews. 2019. http://mathshistory.st-andrews.ac.uk/HistTopics/ Arabic_mathematics.html#13. Rashed, Rashdi. Al-Khwarizmi: The Beginnings of Algebra. London: Saqi Books, 2010.
© Great Minds PBC
Teacher Edition: Grade A1, Module 1, Credits
Credits Great Minds® has made every effort to obtain permission for the reprinting of all copyrighted material. If any owner of copyrighted material is not acknowledged herein, please contact Great Minds for proper acknowledgment in all future editions and reprints of this module. Common Core State Standards for Mathematics © Copyright 2010 National Governors Association Center for Best Practices and Council of Chief State School Officers. All rights reserved.
Cover, Georges Seurat (1859–1891). A Sunday on La Grande Jatte. 1884, 1884/86. Oil on canvas, 81 3/4 × 121 1/4 in. (207.5 × 308.1 cm). Helen Birch Bartlett Memorial Collection, 1926.224. The Art Institute of Chicago, Chicago, USA. Photo Credit: The Art Institute of Chicago/Art Resource, NY, page 137, Courtesy Gutenberg Museum, Mainz. Photograph by D. Bachert; page 502, Konstik/iStock/Getty Images Plus; All other images are the property of Great Minds.
For a complete list of credits, visit http://eurmath.link /media-credits.
© Great Minds PBC
535
Teacher Edition: Grade A1, Module 1, Acknowledgements
Acknowledgments Tiah Alphonso, Christopher Barbee, Joseph Phillip Brennan, Beth Brown, Mary Christensen-Cooper, Keith J. Coates, Monique Colbert, Cheri DeBusk, Wendy DenBesten, Jill Diniz, Mary Drayer, Karen Eckberg, Dane Ehlert, Samantha Falkner, Scott Farrar, Krysta Gibbs, Danielle Goedel, Julie Grove, Ryan Grover, Robert Hollister, Rachel Hylton, Alanna Jackson, Travis Jones, David Kantor Choukalas, Kathy Kehrli, Emily Koesters, Sara Lack, Alonso Llerena, Liz Krisher, Gabrielle Mathiesen, Maureen McNamara Jones, Melissa Mink, Richard Monke, Dave Morris, Bruce Myers, Marya Myers, Ben Orlin, Selena Oswalt, Brian Petras, Lora Podgorny, Rebecca Ratti, Bonnie Sanders, Hester Sofranko, Bridget Soumeillan, Danielle Stantoznik, Tara Stewart, James Tanton, Cathy Terwilliger
Sandy Engelman, Tamara Estrada, Soudea Forbes, Jen Forbus, Reba Frederics, Liz Gabbard, Diana Ghazzawi, Lisa Giddens-White, Laurie Gonsoulin, Nathan Hall, Cassie Hart, Marcela Hernandez, Rachel Hirsh, Abbi Hoerst, Libby Howard, Amy Kanjuka, Ashley Kelley, Lisa King, Sarah Kopec, Drew Krepp, Crystal Love, Maya Márquez, Siena Mazero, Cindy Medici, Patricia Mickelberry, Ivonne Mercado, Sandra Mercado, Brian Methe, Mary-Lise Nazaire, Corinne Newbegin, Max Oosterbaan, Tamara Otto, Christine Palmtag, Andy Peterson, Lizette Porras, Karen Rollhauser, Neela Roy, Gina Schenck, Amy Schoon, Aaron Shields, Leigh Sterten, Mary Sudul, Lisa Sweeney, Samuel Weyand, Dave White, Charmaine Whitman, Nicole Williams, Glenda Wisenburn-Burke, Howard Yaffe
Trevor Barnes, Brianna Bemel, Adam Cardais, Christina Cooper, Natasha Curtis, Jessica Dahl, Brandon Dawley, Delsena Draper,
536
© Great Minds PBC
Exponentially Better Knowledge2 In our tradition of supporting teachers with everything they need to build student knowledge of mathematics deeply and coherently, Eureka Math2 provides tailored collections of videos and recommendations to serve new and experienced teachers alike.
Module 2 Equations and Inequalities in Two Variables
Digital2 With a seamlessly integrated digital experience, Eureka Math2 includes hundreds of clever illustrations, compelling videos, and digital interactives to spark discourse and wonder in your classroom.
Module 3 Functions and Their Representations
Accessible2 Created with all readers in mind, Eureka Math2 has been carefully designed to ensure struggling readers can access lessons, word problems, and more.
Module 5 Linear and Exponential Functions
Joy2 Together with your students, you will fall in love with math all over again—or for the first time—with Eureka Math2. What does this painting have to do with math? A Sunday on La Grande Jatte is considered Georges Seurat’s greatest work. Even though this painting is made entirely out of small dabs of paint, our eyes mix the colors together through optical blending. To achieve this effect, Georges Seurat had to be very precise with his colors and dot placement. This methodical technique is similar to a practice you will need as you graph equations and inequalities in two variables. On the cover A Sunday on La Grande Jatte—1884, 1884–1886 Georges Seurat, French, 1859–1891 Oil on canvas Art Institute of Chicago, Chicago, IL, USA Georges Seurat (1859–1891), A Sunday on La Grande Jatte—1884, 1884/86. Oil on canvas, 81 3/4 x 121 1/4 in (207.5 x 308.1 cm). Helen Birch Bartlett Memorial Collection, 1926.224. The Art Institute of Chicago, Chicago, USA. Photo Credit: The Art Institute of Chicago/Art Resource, NY
ISBN 978-1-64497-203-8
9
Module 1 Expressions, Equations, and Inequalities in One Variable
781644 972038
C
Module 4 Quadratic Functions
Module 6 Modeling with Functions