Empowering the geospatial community www.gim-international.com
Issue 4 2026 Volume 40
State of play: automation and robotics in surveying Howisthecurrentshift reallyaffecting industry professionals today?
Capturing Greater Paris in 3D
Making AI-enhanced geospatial intelligence actionable
When the GNSS signal drops
One trusted design. Three levels of performance. Introducing the next generation Leica RTC laser scanners.
Advanced scanning. Real-time collaboration. Scalable workflows. Experience Leica RTC.
Contents
Director Strategy & Business Development Durk Haarsma Financial Director Meine van der Bijl Technical Editor Huibert-Jan Lekkerkerk Contributing Editors Dr Rohan Bennett, Lars Langhorst Head of Content Wim van Wegen Copy Editor Lynn Radford, Englishproof.nl Marketing Advisors Myrthe van der Schuit, Sandro Steunebrink Traffic Manager Linda van der Lans Circulation Manager Adrian Holland Design Persmanager, The Hague GIM International,one of the worldwide leading magazines in the geospatial industry, is published five times per year by Geomares. The magazine and related website and newsletter provide topical overviews and reports on the latest news, trends and developments in geomatics a ll around t he world. GIM International is orientated towards a professional and managerial readership, those leading decision making, and has a worldwide circulation. Subscriptions GIM International is available five times per year on a subscription basis. Geospatial professionals can subscribe at any time via https://www.gim-international.com/subscribe/ print. Subscriptions will be automatically renewed upon expiry, unless Geomares receives written notification of cancellation at least 60 days before expiry date. Advertisements Information about advertising and deadlines are available in the media planner. For more information please contact our marketing advisor: myrthe.van.der.schuit@geomares.nl. Editorial Contributions All material submitted to Geomares and relating to GIM International will be treated as unconditionally assigned for publication under copyright subject to the editor’s unrestricted right to edit and offer editorial comment. Geomares assumes no responsibility for unsolicited material or for the accuracy of information thus received. Geomares assumes, in addition, no obligation to return material if not explicitly requested. Contributions must be sent for the attention of t he head of content: wim.van.wegen@geomares.nl.
12
16
The Greater Paris 3D mesh project combined nadir imagery and airborne Lidar to produce a homogeneous, textured mesh of the metropolitan area in a single campaign. This article covers the workflow and weighs it against dedicated oblique surveys.
33
42
GNSS jamming and spoofing have gone from a niche concern to a recurring headline. This article shares real-world experiences from two companies that encountered it in aerial survey missions, and how one national mapping agency is adapting procurement in response.
5 6 50 52 66
Recent research shows that detailed 3D city models for Mexican cities can be automatically generated using only open data from the national mapping agency, deriving building footprints and road polygons to overcome dataset limitations.
Underground infrastructure mapping means working in the dark, dirty and without satellite reception. Fraunhofer IPM researchers are tackling this with robot-assisted systems combining SLAM navigation, edge computing and miniaturization.
Editorial Headlines From GeoAI to collaborative intelligence Making AI-enhanced geospatial intelligence accessible and actionable FIG Congress 2026
20
26
In this exclusive interview, Klaus Thymann talks about conducting drone surveys at almost 5,000m, waiting over a decade for a 90-minute weather window, and why geospatial professionals should put their skills to work for people and planet.
For a decade, surveying has been told robots and AI would transform it. In 2026, that transformation is underway, with mixed results. This article looks at what’s genuinely automated today, what remains manual, and what it means for professionals in the field.
46
61
Digital cadastres in the Global South often rest on fragmented documentary foundations, though the records needed to fill the gaps already exist in scattered archives. This article proposes a four-phase framework – HGIIM – to digitize and integrate this material into land administration systems.
A multi-sensor survey connects Florence’s visible city, the submerged riverbed and subsurface of the Arno river into a high-resolution digital twin, supporting hydraulic understanding, heritage conservation and urban stewardship.
68 70 72
The importance of mentorship GIM International interviews Rudolf Staiger Organizations
To subscribe to GIM International go to www.gim-international.com/subscribe
Geomares The Netherlands T: +31 (0) 514-56 18 54 F: +31 (0) 514-56 38 98 gim-international@geomares.nl www.gim-international.com No material may be reproduced in whole or in part without written permission of Geomares. Copyright © 2026, Geomares, The Netherlands All rights reserved. ISSN 1566-9076
Cover story A Copernicus Sentinel-1 satellite image of Kangerlussuaq Glacier, Greenland. This false-colour image shows visible changes on the ground and sea surface across three different acquisition dates. Glaciers are not limited to Greenland or the world’s better-known mountain ranges, but can also be found in tropical areas – although no one is sure for how much longer. This issue of GIM International features a fascinating feature about mapping some of the world’s highest tropical glaciers before they disappear forever. (Image courtesy: ESA)
Issue 4 2026
3
Digitize the World Fast. Precise. Efficiently. RIEGL 3D LASER SCANNING
STATIC
MOBILE
AIRBORNE
UAV-BASED
BATHYMETRIC
INDUSTRIAL
Powered by highly sophisticated hardware and intelligent software, RIEGL LiDAR sensors and systems deliver the precision and reliability needed to create accurate, reliable, high-resolution 3D digital twins. Across air, land, and water, RIEGL enables professionals worldwide to capture reality with confidence, streamline workflows, and unlock deeper insights.
Visit us at
Explore RIEGL´s LiDAR Technology www.riegl.com
Austria | USA | Japan | China | Australia | Canada | United Kingdom | South America | Asia Pacific | Germany | France
Editorial
The surveyor as a chronicler Back in 1491, German cartographer Henricus Martellus drew a map of the world. It is the bestpreserved map from that time, and researchers have confirmed its influence on later maps, including Martin Waldseemüller’s 1507 map, which was the first to use the name ‘America’. In 1492, Christopher Columbus sailed west across the Atlantic, likely with a copy of Martellus’s map on board. Even though – contrary to a stubborn myth – 15thcentury Europeans did not actually believe that Columbus was about to sail off the edge of a flat Earth, when he made landfall in 1492 he still believed he had reached Asia. The map was the best knowledge available, and it was wrong. This is what a map really is: not just a navigational tool, but a snapshot of the knowledge of the moment. By extension, the people who make maps possible – the surveyors and other geospatial professionals – are eyewitnesses to their time, and their maps are living records of the very latest information. Needless to say, today’s maps are incomparably better than Martellus’s version. But fast-forward more than five centuries to 2012 – just 14 years ago. As the Australian vessel Southern Surveyor sailed through the Coral Sea, it approached Sandy Island: a landmass shown on navigational charts, in major databases, even on Google Earth. However, it turned out not to be real. Despite all the sophisticated instruments, a nonexistent island still made it onto the map. The fundamental problem remains: a map should be seen only as a representation of reality, never reality itself. And reality keeps changing.
As a result, the purpose of cartography has quietly shifted focus somewhat. Back in 1492, we mapped the world because we didn’t yet know what was out there. In 2026, we map it partly because we know it may not remain and we want to record it before it vanishes. We have gone from mapping the unknown, to mapping the known with precision, to preserving disappearing worlds in the shape of geoinformation. For example, Project Pressure documents the world’s rapidly retreating glaciers with photography, drones and high-precision 3D mapping. Its recent expeditions have focused on tropical glaciers near the equator, in Uganda’s Rwenzori Mountains and on Puncak Jaya in Papua, Indonesia. Unlike a traditional map describing a stable world, this is mapping in four dimensions: x, y, z and time. Measurements of a glacier captured today only become meaningful against its past extent and for comparisons in the future – when it might be gone. Behind Project Pressure resonates a broader message about the role of geospatial technology. The tools to measure and visualize a changing planet are more powerful than ever, says Klaus Thymann, the initiator of Project Pressure. But what matters is where this expertise is directed. “Put your skills to good use,” he urges. Today’s geospatial professionals are the ‘Martelluses’ of our era: chroniclers building the records to help future generations understand a world that may not exist as we currently know it. Perhaps ‘terra incognita’ is no longer the white spots on the map, but the unknown future state of places we can map perfectly accurately today.
Wim van Wegen head of content, GIM International wim.van.wegen@geomares.nl
Issue 4 2026
5
Javad GNSS introduces modular GNSS+INS line to counter jamming and spoofing In order to offer integrators a way to keep navigating when GPS cannot be trusted, Javad GNSS has introduced a new GNSS+INS product line. The family of tightly integrated GNSS and inertial navigation solutions is now available for evaluation and integration by qualified users. The US-based developer and manufacturer of high-precision GNSS receivers for aerospace, defence and PNT applications built the line by pairing its multi-constellation GNSS receivers with proven commercial and defence-grade IMU modules through a purpose-built interface board. The result is a turnkey navigation system for OEMs, capable of producing PVT solutions with attitude even when satellite signals are jammed, spoofed or denied. Jamming and spoofing have become persistent challenges for operators in aviation, maritime and uncrewed systems worldwide. Platforms most exposed to this threat – small UAS, autonomous ground vehicles, and marine systems among them – need compact, tightly integrated navigation systems capable of bridging these gaps. Until now, integrators have generally faced two choices: source a GNSS receiver and an IMU separately and take on the integration burden themselves, or purchase a sealed GNSS+INS unit built around a fixed, preselected inertial sensor. Javad’s GNSS+INS configuration offers a third path. It ships as a pre-assembled stack that integrators can deploy as-is, or disassemble and remount to fit the mechanical constraints The TR-2S HDA INS is of their platform. The interface board manages the electrical connection, time synchronization and a small, advanced OEM data path between the receiver and IMU – eliminating the cabling, timing alignment navigation system built and sensor calibration work that integrators previously had to handle on their own. on the fusion of GNSS and Crucially, the inertial sensor itself remains a configurable choice. inertial sensing. (Image courtesy: Javad GNSS)
NavVis raises US$85 million to expand spatial data platform To fund a significant expansion of its data infrastructure and a deeper push into AI, NavVis has raised US$85 million in funding. The fresh capital injection comes at a time when the Munich-based provider of spatial data capture and management technology for industrial and construction clients is looking to cement its position as a system of record for physical facilities and extend its reach in the US market. The round was led by US private equity firm The Jordan Company (TJC), with existing backers Yttrium, together with a consortium of industrial family offices – Kozo Keikaku Engineering Inc. (KKE) and Cipio Partners also participating. NavVis’s core business is capturing detailed 3D scans of factories, urban environments, construction sites and other large facilities, then organizing that data through its cloud platform, NavVis IVION, so that engineering, maintenance and construction teams can reference an up-to-date model of a physical site rather than relying on outdated blueprints. The company’s advanced VLX and MLX mapping devices are built to replace slower, traditional surveying with a faster, more efficient way to capture complex sites. Proceeds from the round will go toward scaling its data-processing capacity and building out an AI layer intended to The technology’s reach now extends far beyond make spatial data more directly usable, both for human operators factories and construction sites. US-based BIMstream and, eventually, for robots and autonomous systems operating in has used the NavVis VLX to map a baseball stadium, industrial and construction settings. for instance. (Image courtesy: BIMstream / NavVis)
6
Issue 4 2026
Headlines
Topcon and GreenValley join forces to advance Lidar and spatial intelligence
A strategic agreement between Topcon Positioning Systems and GreenValley International will drive next-generation technologies across surveying, mapping, construction, forestry and other spatial intelligence applications. The partnership is set to deliver integrated hardware and software solutions for handheld, aerial and mobile Lidar data collection and processing – with plans to expand into robotic systems, autonomous monitoring, and real-time cloud-based data processing and transfer. “Collaborating with GreenValley allows us to combine the strengths of both organizations and deliver simpler, more efficient workflows to more professionals,” said Ron Oberlander, head of the Topcon Geomatics and Construction Platforms. “By advancing joint research and integrating emerging AI technologies into spatial solutions, we aim to help users collect, process and apply data more effectively, even in remote and challenging environments.” Cody McColl, North American operations manager with GreenValley International, commented: “This alliance unites GreenValley’s spatial intelligence expertise with Topcon’s precise positioning technologies to deliver next-generation solutions for the global geospatial community. Together, we are focused on developing AI-enhanced point cloud processing, including automated feature extraction and classification, multi-sensor integration and intelligent workflow automation to help users collect, process and maximize the value of geospatial data.” Topcon and GreenValley have reached a strategic agreement to collaborate on advanced geospatial data collection technologies. (Image courtesy: Topcon)
SSMC expands mobile Lidar capabilities with RIEGL technology
Southeastern Surveying and Mapping Corporation (SSMC) has added the VMX-2HA mobile mapping system to its geospatial data acquisition operations, expanding the firm’s mobile Lidar capacity for infrastructure and surveying projects. SSMC, a 100% employeeowned surveying, mapping and geospatial firm founded in Florida, provides services Fully equipped and field-ready: across the southeastern SSMC’s newest mobile Lidar vehicle United States. The addition with the VMX-2HA mounted. (Image of the VMX-2HA is the company’s latest investment courtesy: RIEGL, SSMC) in mobile mapping equipment, intended to increase the speed and accuracy of data collection across project sites. “For more than 50 years, SSMC has invested in technologies that help us deliver better results for our clients. The addition of the RIEGL VMX-2HA expands our ability to collect highly accurate data more efficiently while improving safety for our field crews and providing clients with the information they need to make informed decisions throughout the project lifecycle,” said Thom Mead, CEO and president at SSMC. The company also operates a VUX-12023 UAV Lidar system, system for aerial data collection, which it uses in areas where ground-vehicle access is limited. The new system is designed for corridor mapping and infrastructure work, using full waveform Lidar technology to capture millions of measurements per second. SSMC will use it to collect data across transportation corridors, urban environments and utility networks, supplementing its existing aerial capabilities.
Hexagon acquires ITRES to expand the scope of airborne mapping
Hexagon has acquired ITRES, the Calgary-based provider of high-performance airborne hyperspectral and thermal imaging systems, strengthening its ability to deliver richer multi-sensor geospatial data for advanced airborne mapping and analysis. The acquisition unites two complementary portfolios under one provider. Hexagon brings a market-leading suite of airborne sensing and processing products for geodata development – including Lidar point clouds, high-resolution optical imagery, digital twins, integrated workflow software, flight planning tools and data delivery systems. ITRES adds hyperspectral and thermal imaging sensors operating across a wide spectrum of wavelengths, enabling precise material identification and temperature analysis beyond the reach of visible and near-infrared modalities alone. Together, these capabilities allow customers to collect richer, more analytically powerful datasets from a single airborne survey. Fusing multispectral and thermal data with Lidar and optical imagery opens new possibilities for ground surface assessment, object classification and thermal property detection, while Hexagon’s proven software ecosystem helps teams process and act on that data faster. The result is a more complete multi-sensor mapping platform, and new opportunities for hybrid data fusion workflows that previously required combining solutions from multiple vendors. “Geospatial professionals are looking to extract deeper insight from each airborne survey,” said Anders Svensson, president and CEO of Hexagon. “By integrating hyperspectral and thermal sensing into our portfolio, we further expand the range of information that can be A practical example of how ITRES is captured and analysed. Combining complementary sensing technologies helps setting the industry standard with sustained geospatial professionals improve classification accuracy, better distinguish technical innovation and high-performance materials and derive more reliable thermal insights, supporting more sensor design. (Image courtesy: ITRES) advanced and specialized applications.”
Issue 4 2026
7
Exyn partners with UP Caeli Via on autonomous aerial mapping
A new partnership is bringing autonomous flight into tighter, harder-to-reach spaces. Exyn Technologies – known for its work in autonomous mapping and AI-powered navigation across GPS-denied environments – has teamed up with Italian UAS manufacturer UP Caeli Via to bring the two companies’ technologies together. ExynAI and the Nexys autonomous mapping platform will now integrate with UP Caeli Via’s Argos aerial platform. Because the Argos is a lightweight, compact aircraft, the collaboration opens the door to autonomous inspection and mapping in confined or difficult-to-access spaces that bulkier platforms simply cannot reach efficiently. For customers in industrial inspection, infrastructure, manufacturing, energy and government sectors, that means more deployment options than before. The move also marks another step in Exyn’s ongoing expansion of supported robotic platforms, growing the ecosystem in which its autonomous navigation technology can operate. At the core of the integrated solution is ExynAI, which unlocks autonomous flight, real-time mapping and survey-grade 3D data collection, all without needing GPS, prior maps or continuous operator control. That capability directly translates into practical workflows including inspection, digital twin creation, asset management and reality capture across complex industrial facilities.
ExynAI and the Nexys autonomous mapping platform will now integrate with UP Caeli Via’s Argos aerial platform. (Image courtesy: Exyn Technologies)
Emesent lands US$17 million in new funding for AI-powered mapping and robotics
To speed up work on its AI autonomy platform, grow its Aura cloud software and expand across mining, defence, and architecture, engineering and construction (AEC), Emesent has announced US$17 million in new funding. Hovermap can be mounted on a The money will go towards drone (as shown here surveying a tunnel) growing production at the or a robot, or can easily be switched to Australian autonomous handheld, backpack, vehicle or polemapping and robotics mounted scanning. (Image courtesy: company’s factory in Wacol, Emesent) Queensland, and towards two of its core platforms: Cortex AI, onboard software that lets equipment navigate and operate fully autonomously even in places with no GPS signal and hazardous conditions, and Aura, a cloud platform for processing, viewing and analysing 3D data. Emesent’s flagship product, Hovermap, is deployed at more than 200 mine sites worldwide and is considered mission-critical equipment by major mining operators including Rio Tinto, BHP and Glencore. The company’s broader product line includes the Hovermap STX, a Lidar scanning payload that can be mounted on drones or vehicles, or carried as a backpack; the GX1, an all-in-one scanner combining SLAM, RTK positioning, and 360° imagery capture; the Aura data-processing software; and the Cortex AI autonomous flight software. These are used by clients across mining, AEC, defence and critical infrastructure in more than 40 countries. The funding announcement follows strong commercial momentum for the GX1, which recently completed a global AEC roadshow across the Americas, Europe and Asia. Emesent’s broader strategy – anchored by Cortex AI and Aura – is to pair its scanning hardware with ongoing software intelligence and cloud services, so customers keep getting more value from their equipment over time.
Intermap’s PCI Geomatics acquisition pairs 3D elevation data with image processing
In a deal structured as an arrangement under the Canada Business Corporations Act, Intermap Technologies will acquire all outstanding PCI Geomatics shares not already in its possession, using US$11 million in cash to complete the transaction. Intermap Technologies is a global leader in geospatial intelligence powered by proprietary 3D data and AI-driven analytics. PCI Geomatics is known commercially as CATALYST. The acquisition brings together PCI’s satellite and aerial image processing technology, which includes more than 750 proprietary algorithms supporting imagery from over 500 satellites, with Intermap’s elevation data and AI analytics. Together, the companies aim to deliver automated, near real-time geospatial intelligence across commercial, government and defence markets, spanning applications from infrastructure monitoring and insurance underwriting to defence positioning and navigation systems. “We are excited to welcome June McAlarey and her team of talented geospatial professionals to our team,” said Patrick A. Blott, chairman and CEO of Intermap. “This acquisition represents a significant milestone in Intermap’s strategy to build the world’s The acquisition pairs PCI’s image leading platform for geospatial intelligence. As demand shifts toward processing technology with Intermap’s automated and autonomous geospatial intelligence and AI-powered decision elevation data and AI analytics. (Image support, Intermap is positioned to create lasting value for customers and courtesy: PCI Geomatics) shareholders.”
8
Issue 4 2026
Headlines
Emlid adds one-click RTK corrections to GNSS receivers
Emlid has introduced Emlid Corrections, a new RTK correction service integrated directly into its Reach line of GNSS receivers and the Emlid Flow mobile app. The service, powered by Point One Navigation’s corrections network, is designed to remove one of the most persistent obstacles in professional surveying: the setup and configuration of external correction sources. Every field-ready Reach receiver now ships with one year of Emlid Corrections included at no additional cost. Users can activate the service directly within the Emlid Flow app. Achieving centimetre-accurate positioning with RTK-enabled GNSS receivers has traditionally required either deploying a local base station or subscribing Emlid Corrections supports all of Emlid’s current to a third-party regional correction network, both of which demand technical field-ready hardware. (Image courtesy: Emlid) setup, ongoing management or complex licensing. Emlid Corrections aims to eliminate that friction entirely. With the new service active, users can open the Emlid Flow app, select Emlid Corrections and begin surveying with centimetre-level precision, without configuring a base station or negotiating access to a regional RTK network. The service supports all of Emlid’s current field-ready hardware, including the Reach RX, RX2, RS2, RS2+, RS3, RS4 and RS4 Pro. Licences are device-specific and are activated through the Emlid Flow application. Under the hood, Emlid Corrections draws on Point One Navigation’s virtual reference station (VRS) architecture, delivering corrections over the internet. According to the companies, the system achieves horizontal and vertical accuracy of 1-2 centimetres, or sub-inch precision, within covered regions. That coverage currently spans the United States, the United Kingdom, much of continental Europe, New Zealand and Australia, with additional regions expected as Point One continues to expand its base station network. Point One designs, manufactures, deploys and monitors each base station in the network daily, with baseline spacing of under 40km across covered areas – a density the companies say supports both accuracy and fast positioning convergence.
TiC Solutions and GeoVerra partner to expand geospatial services in Canada
To achieve broader reach across infrastructure, energy, utilities, transportation, land development and natural resources, TiC Solutions has acquired GeoVerra, one of Canada’s largest surveying and geomatics firms. The deal adds GeoVerra’s surveying, mapping, reality capture, land services and geospatial data capabilities to a platform that already includes NV5 and Acuren, expanding TiC Solutions’ geospatial operations nationwide. TiC Solutions, a publicly listed provider of tech-enabled asset integrity, engineering, consulting and geospatial services, has built its business through an integrated portfolio of companies – including Acuren and NV5 – that together are serving industrial assets, buildings and public infrastructure across their full lifecycle, from planning and construction through ongoing operations and maintenance. GeoVerra, founded in Canada, is known as one of the country’s largest surveying and geomatics firms, offering surveying, mapping, geospatial and land solutions to a wide range of clients. The company has worked on a number of Canada’s major infrastructure and resource development projects and brings established GeoVerra is one of Canada’s largest client relationships in those markets to TiC Solutions. geomatics firms. (Image courtesy: GeoVerra)
Discover the Future of Geomatics at Hall B5, Stand H059
Issue 4 2026
9
Confidence ™ at every turn
Experience our connected solutions at INTERGEO 2026 15-17 September MESSE MÜNCHEN | HALL B6
© 2026, Trimble Inc. All rights reserved. PN GEO-263
More Information
Nadir imagery and Lidar for urban 3D meshes
Capturing Greater Paris in 3D By Irène Gobran, Aerodata France
Regional-scale 3D city modelling is often associated with long acquisition campaigns, very large image blocks and high production costs. The Greater Paris 3D mesh project tested a more efficient approach: reusing high-resolution nadir imagery acquired for mapping, and combining it with airborne Lidar where image matching alone was insufficient. The result was a homogeneous, textured mesh covering the metropolitan area, produced within a single acquisition campaign. This article describes the workflow – from flight planning and aerial triangulation to Lidar integration – and considers its strengths and limitations compared with dedicated oblique surveys. Large urban areas increasingly need more than orthophotos and planimetric datasets. Planners, infrastructure operators and public authorities need 3D representations that show the city as a volume rather than as a flat map. A textured 3D mesh can support communication, heritage documentation, asset management and the intuitive exploration of complex urban environments. The key question is often not whether 3D is useful, but whether it can be produced within realistic timeframes and budgets while
remaining consistent across a complete region. From 2D mapping to 3D mesh In 2025, across several mapping projects, Aerodata acquired high-overlap imagery at a 5cm ground sample distance (GSD) over approximately 42,000km² for mapping and orthophoto production. This dataset created an opportunity to test whether the same images could also support 3D mesh production. Several trials were carried
out, and two projects proved particularly promising. One of them was Greater Paris: a highly constrained urban environment with dense and vertically complex development, varied architecture, tall buildings, narrow streets and broad urban corridors. The Greater Paris project combined nadir aerial imagery and airborne Lidar to construct the 3D mesh. The process began with flight planning. The block had to support not only orthophoto
Composite illustration of the Greater Paris 3D mesh over Place des Vosges, showing Aerodata’s acquisition aircraft. (Image courtesy: Aerodata France)
12
Issue 4 2026
Feature and tie points. The adjustment had to be precise, because even small residual errors can create double edges, misaligned textures or softened architectural detail in the 3D mesh. Independent survey teams validated the block against ground checkpoints, giving a horizontal root mean square error (RMSE) of approximately 3cm and a vertical RMSE of approximately 6cm. Imagery of this type is traditionally used for orthophotography, feature extraction and 2D mapping. The project examined how far it could also support textured 3D mesh production when acquired with sufficient overlap and complemented by airborne Lidar. Why nadir images can support 3D reconstruction A nadir image is vertical only near its centre. Because the camera uses central perspective, objects farther from the principal point are viewed at increasing off-nadir angles. Tall objects therefore appear to lean away from the image centre. In an orthophoto workflow, this displacement is corrected or excluded. In a 3D mesh workflow, it is useful because overlapping images can reveal vertical and inclined surfaces from different directions. Perspective displacement in a nadir image. Objects near the image centre appear almost vertical, while objects near the edges and corners lean away from the principal point, making some façade surfaces visible. production, but also multi-view geometry. Overlap, flight altitude, camera footprint, sun angle, airspace restrictions and expected occlusions were considered together. The aim was to ensure that each part of the urban fabric was visible in enough images to support both surface reconstruction and texture mapping. After acquisition, quality control removed blurred or unusable frames and checked radiometry, exposure and completeness. Aerial triangulation then created a coherent image block using GNSS/ IMU trajectory data, camera calibration
This helps explain why nadir imagery can support 3D reconstruction. A façade can be reconstructed when it is visible in several overlapping images, especially when the building appears away from the image centre or near the edges of frames from different flight lines. Dense forward and lateral overlap increases the chance that roofs and visible façades are observed from several directions. Image-matching algorithms use the resulting parallax to reconstruct surfaces, while visible wall areas provide texture. Deep shadows can reduce image-matching reliability, while occlusions leave hidden surfaces unobserved. These areas may require additional viewpoints or Lidar support. The role of dense overlap Early tests using 70% forward and 50% lateral overlap produced a largely 2.5D result, with reliable geometry primarily on roofs and other surfaces visible from above. Where façade observations were insufficient, the workflow reconstructed the walls by projecting vertical surfaces downward from the roof edges to the ground. For the Greater Paris mesh, the block was designed with dense overlap – typically 80% forward and 80% lateral – applied consistently throughout the project area. This increased the number of viewing rays per object and made it more likely that roofs, visible façades, street furniture and narrow urban gaps would be captured in several images. However, some surfaces remained hidden from all
3D mesh of a courtyard in Paris. (Image courtesy: Aerodata France)
Issue 4 2026
13
available viewpoints because they were obstructed by surrounding buildings, vegetation or other objects. Dense overlap also improves texture selection. If a wall or roof is blurred, shadowed, occluded or seen at an unfavourable angle in one image, another image may provide a better view. The workflow can then select the most suitable source, improving visual continuity. This redundancy is particularly important in a dense city such as Paris, where narrow streets, courtyards and tall buildings create frequent occlusions. Adding Lidar to complete the information Although high-overlap nadir imagery can reconstruct a significant part of the urban scene, occlusions, deep shadows and vegetation can still reduce reconstruction quality in some areas. Airborne Lidar provides complementary 3D measurements because it does not rely on visibleimage texture or ambient illumination. However, Lidar remains affected by scan geometry and line-of-sight occlusion, while glass and water can produce weak, missing or anomalous returns. The two datasets are therefore complementary, with each compensating for limitations in the other to improve the completeness and quality of the 3D mesh. In the Greater Paris workflow, Lidar was integrated as a core component of the mesh-production pipeline. Precise alignment between the image block and the Lidar data was essential, because even small horizontal or vertical discrepancies can become visible in a textured mesh, particularly along roof edges, façades and bridges. This required accurate trajectory data, reliable sensor calibration and systematic co-registration checks. However, internal quality control showed that the Lidar data could not be used directly in its initial form. The data also introduced
specific production challenges: point density varied with flight geometry, scan angle, surface reflectance and occlusion, while some areas remained sparse or contained gaps. Making the data suitable for mesh production therefore required substantial technical investigation and the development of a dedicated sequence of processing and correction steps. The workflow combined artificial-intelligence-based processing with pointcloud classification, noise filtering, co-registration with the photogrammetric block and, where appropriate, interpolation across small gaps. These preprocessing steps were essential to ensure that the Lidar data could be used reliably in mesh production. This complex and iterative work ultimately enabled the Lidar to be successfully integrated with the photogrammetric reconstruction. The processed point cloud strengthened the surface model, reduced gaps, provided additional constraints in difficult areas and significantly improved the completeness and overall quality of the final 3D mesh. Acquisition efficiency at regional scale One of the main advantages of this approach is acquisition efficiency. For this area of interest, the nadir-plus-Lidar strategy required about 42 flight hours, more than 60,000 large-format images and airborne Lidar with a nominal point density of approximately 75 points/m². A project-specific comparison with selected multi-head nadir-oblique configurations indicated approximately 28% to 51% more flight time, depending on sensor geometry and planning assumptions. The same configurations were estimated to generate around five to six times as many individual image files because several camera heads record simultaneously at each exposure station.
Greater Paris 3D mesh showing Opéra Bastille / Place de la Bastille. (Image courtesy: Aerodata France)
14
Issue 4 2026
Feature Strengths at regional scale This difference in acquisition efficiency has practical implications throughout a project. Fewer flight hours reduce exposure to changing weather, lighting and seasonal conditions. Because largeformat nadir frames cover a wide footprint, Greater Paris could also be captured in fewer sessions. This helped limit differences caused by construction activity, traffic, seasonal vegetation and changing illumination, while supporting radiometric and geometric consistency across the block. For a metropolitan-scale 3D mesh, this consistency can be as important as the highest level of local detail.
About the author Irène Gobran is president and technical director of Aerodata France, where she has led aerial geospatial data production for 26 years. She holds two master’s degrees, in Photogrammetry and GIS, from ParisSorbonne/ENSG in France and ITC in the Netherlands.
Applications for geospatial professionals A regional 3D mesh can provide a common spatial reference for many disciplines and make urban objects easier to understand in context. It can serve as a background layer for digital-twin applications, while engineering teams can use it alongside building models, orthophotos and Lidar point clouds. Compared with an orthophoto, a 3D mesh adds height, façades, perspective and spatial context. These products are complementary and can be selected according to the required application.
Illustrative comparison of vertical façade sampling for a 5cm nadir GSD as a function of the viewing angle from the vertical. Fewer exposure stations and image files also simplify data management. The lower total number of gigapixels reduces storage and processing requirements. For the sensor configurations and production workflow tested in this project, this was estimated to reduce mesh-processing costs by a factor of approximately five to six compared with the much larger oblique dataset. Note: this is a project-specific estimate rather than a universal ratio. In addition, the method reuses imagery acquired for other deliverables, including orthophotos, mapping products and visual archives. This increases the value obtained from each flight campaign and supports a more integrated production strategy. Limitations Dedicated oblique camera systems still provide more direct views of façades and generally support finer texturing of vertical surfaces. The reason is geometric: at a small off-nadir angle (a near-vertical view), the line of sight runs almost parallel to a vertical façade, so each pixel covers a relatively large vertical area of the wall. As the viewing angle increases, the façade is seen more directly and the vertical sampling becomes finer. In a nadir block, façades are therefore captured mainly near the image edges and corners, whereas a dedicated oblique survey views them more directly and typically uses longer focal lengths for the oblique camera heads than for the nadir head, further improving façade detail. Large-format nadir cameras may reach corner angles of roughly 20° to 37°, depending on focal length and image format. For the Greater Paris block, the maximum geometric off-nadir angle at the image corners was approximately 24.3°. Figure 5 compares a 5cm nadir GSD at 24.3°, giving about 13cm along the façade height, with a representative oblique view near 45°, giving about 6-8cm. These indicative values describe the source-image detail available for façade texturing.
For geospatial professionals, the project also shows why acquisition design and downstream production should be planned together. The value of an aerial survey depends not only on the sensor, but also on block geometry, overlap, complementary data sources and quality control. When these elements are aligned, imagery originally acquired for high-resolution 2D mapping can also provide the foundation for large-scale 3D representation. Conclusion The Greater Paris 3D mesh project demonstrates a practical route to producing a regional urban 3D base layer for digital-twin applications. By combining high-overlap nadir imagery with airborne Lidar, it was possible to generate a textured mesh over a large metropolitan area while limiting acquisition time and data volume. The method is not intended to replace dedicated oblique imagery in every situation, particularly where very detailed façade inspection is required, but it provides an efficient and scalable alternative for many city-scale applications. The conclusions drawn from this work extend beyond the Greater Paris project. They are the result of more than two decades of experience gained since 2001 in acquiring and processing a wide range of airborne datasets across different sensor types, manufacturers and geographical environments, including nadir, oblique and pushbroom imagery, as well as Lidar. This project should not be seen as an endpoint. Further development is already underway to explore workflows in which Lidar provides the primary mesh geometry and imagery is used for texturing, with the aim of reducing mesh-processing time. Continued collaboration between geospatial specialists, researchers and AI experts will be essential to unlock further value from airborne data. More information Online demonstration of the Greater Paris 3D mesh, https://u2l.ai/A1kZMx
Issue 4 2026
15
A workflow to create urban digital twins from open data
Open 3D city models for Mexico By Ken Arroyo Ohori and Jantien Stoter, Delft University of Technology, the Netherlands
3D city models are valuable tools for urban planning, solar potential analysis, wind simulations and many other applications. Yet openly available models currently exist for only a limited number of cities across some 20 countries, almost all of which are in the Global North. Recent research in Mexico demonstrates that detailed 3D city models can be automatically generated for the country’s cities using only open data from the national mapping agency. Significant limitations in the available datasets are overcome by an approach that derives building footprints and road polygons from existing sources. In some countries, creating 3D city models follows a well-established workflow. A 2D topographic dataset providing building footprints and road polygons is combined with a high-resolution elevation dataset such as a point cloud or digital surface model (DSM). The elevation information lifts the 2D geometries into three dimensions. This approach works efficiently when both datasets are available at sufficient quality. However, this is not the case in much of the world. Mexico presents a particularly illustrative example. The National Institute of Statistics and Geography (INEGI) provides extensive topographic and elevation datasets covering the entire country. The 1:50,000-scale
vector topographic dataset contains useful polygonal features including city blocks (known as manzanas in Spanish), land-use types such as schools and recreational areas, and water bodies. However, it lacks two of the most important feature types for 3D city models: individual building footprints, which are not recorded at all, and roads, which are represented only as centre lines rather than as area polygons (Figure 1).
and Lidar surveys. Older 5m models cover approximately a third of the country, and a nationwide digital terrain model (DTM) at 15m resolution completes the picture. This means that, while buildings can be clearly seen in the high-resolution DSMs where they are available (Figure 2), the incomplete 2D topographic features and the patchy coverage of the best elevation data render the standard 3D city model pipeline inapplicable.
Elevation data is available but with considerable variation in coverage and resolution. INEGI provides DSMs at 1.5m resolution in and around some of the larger cities, acquired through a mix of satellite photogrammetry, aerial imagery
As a result, no 3D city models are currently openly available for any city in Mexico. Previous academic efforts have been limited to small areas using largely manual modelling methods or proprietary software. While global building-footprint datasets
Figure 1: Some of the topographic features available in the 1:50,000 vector topographic dataset from INEGI, with city blocks (yellow), roads (red lines), public areas (green), water bodies and canals (blue).
16
Issue 4 2026
Figure 2: Individual buildings can be clearly seen in the 1.5m DSM from INEGI.
Feature resulting raster, building footprints are extracted using a regiongrowing algorithm that starts from seed points where the height exceeds 10m, a threshold chosen to distinguish building roofs from vegetation.
Figure 3: A view of the 3D city model created using the methodology. The Paseo de la Reforma can be seen on the right. from Microsoft and Google do cover parts or all of Mexico, they have significant quality problems in dense urban environments. Computational steps to fill the data gaps The novel methodology addresses these challenges through a series of computational steps. Instead of using pre-existing building footprints, it derives them directly from the elevation data. Rather than relying on pre-existing road polygons, it generates them from the empty spaces between city blocks in the topographic dataset. Building-footprint extraction begins by subtracting the DTM (not including buildings and other objects above ground level) from the DSM (including buildings and other objects) to obtain an elevation map showing only the heights of objects above ground level. Areas where buildings are not expected, such as green spaces, water bodies and the newly identified road areas, are masked out to avoid generating false footprints from tree canopies. From the
From these seed points, regions are expanded using two different height-difference tolerances to identify different types of buildings. For tall buildings above 100m in height, a tolerance of 15m between neighbouring pixels captures steeply inclined facades and spires without merging adjacent structures, which are always well separated at such heights. For shorter buildings, where adjacent structures often have no discernible gap between them, a stricter tolerance of 0.75m helps to keep them separate. Small artefacts are removed by discarding polygons with an area below approximately 100m2, and the outlines are simplified to eliminate the staircase effect typical of raster-to-vector conversions. Road polygons are generated through a complementary logic. By computing the Boolean union of certain areal features present in the INEGI data, including city blocks, land use types and water features, a complete coverage of the built-up land surface is obtained. The remaining empty spaces, located between city blocks, largely correspond to roads, railways and smaller water streams. These are then classified by proximity to the linear road and railway centre lines in the original dataset, enabling the assignment of correct semantic labels to each newly created area. Lifting to 3D Once the building footprints, road polygons and additional feature types (including plant cover, water bodies and terrain) have been prepared, they are processed into full three-dimensional geometries using three different lifting rules. Buildings are lifted uniformly to a flat height computed as the 90th percentile of all DSM cells within each footprint. This yields a value close to the maximum
Figure 4: Google’s Open Buildings over-segments the data, creating new polygons for smaller rooftop features and for clearly non-existent buildings.
Issue 4 2026
17
Figure 5: Tall vegetation is identified as buildings around the National Museum of Anthropology. building height while avoiding outliers in the elevation data. Roads, water bodies and terrain are lifted by snapping polygon vertices to the heights at those locations in a simplified DTM. Plant-cover areas use a more detailed approach: polygon vertices are lifted to DTM heights, and additional interior points from the DTM are added to the polygonal surface, with the polygon re-triangulated to capture terrain variations beneath vegetation. Vertical surfaces are generated to close the gaps between differently lifted polygons, creating building walls and any other vertical features. The completed model is exported in two formats: CityJSON, a compact JSONbased encoding of the CityGML standard that preserves full semantic information, and OBJ for easy visualization in standard 3D graphics software. The workflow was implemented in Python and C++ with some preprocessing steps directly performed in QGIS, and all code is publicly available on GitHub. Results in Mexico City The methodology was tested in a tile covering central-western Mexico City (Figure 3). The area was chosen for its rich mix of building types spanning detached homes, apartment blocks and high-rise office towers, as well as its varied land uses and terrain. The area includes several of Mexico City’s best-known landmark buildings, providing a straightforward way to visually assess the generated models. Most landmarks are clearly visible and recognizable in the reconstructed 3D model, with heights that match publicly available
18
Issue 4 2026
Figure 6: The terraced architecture of the World Trade Center is recognized as multiple buildings.
information. The Torre Mayor, Torre Reforma and the distinctive buildings along the Paseo de la Reforma are all identifiable. The road polygons are accurately placed and correctly reflect the hierarchy of road widths visible in the city’s street network, with major avenues clearly wider than side streets. Perhaps most notably, the building footprints generated by this method often outperform those from global datasets (Figure 4). Microsoft’s Global ML Building Footprints consistently under-segments dense built-up areas, frequently merging entire city blocks into single polygons. Google’s Open Buildings dataset captures more individual buildings but over-segments the data, creating spurious footprints from rooftop features and even clearly nonexistent structures. Neither handles nonrectilinear buildings. By contrast, the INEGIderived method captures complex building shapes well and avoids placing buildings on roads or in other unlikely locations.
Current limitations Despite these promising results, the methodology has some known shortcomings. Approximately a third of buildings in the study area remain undetected, predominantly smaller structures that cannot be clearly distinguished in the 1.5m-resolution DSM. Uniform vegetation taller than 10m in areas not classified as green space is sometimes incorrectly identified as buildings. This issue is particularly visible around the National Museum of Anthropology where rows of tall trees generate spurious building footprints (Figure 5). Terrace-shaped buildings with sections at significantly different heights, such as the stepped architecture of the Mexico City World Trade Center, are occasionally split into multiple detected buildings (Figure 6). Conversely, adjacent buildings of the same height with no visible separation are merged into a single footprint. Three-dimensional road structures such as overpasses and
Further reading Biljecki, F., Stoter, J., Ledoux, H., Zlatanova, S., Çöltekin, A. (2015) Applications of 3D City Models: State of the Art Review. ISPRS International Journal of Geo-Information, 4(4), pp. 2842–2889. Ledoux, H., Arroyo Ohori, K., Kumar, K., Dukai, B., Labetski, A., Vitalis, S. (2019) CityJSON: A compact and easy-to-use encoding of the CityGML data model. Open Geospatial Data, Software and Standards, 4(4). Ledoux, H., Biljecki, F., Dukai, B., Kumar, K., Peters, R., Stoter, J., Commandeur, T. (2021) 3dfier: automatic reconstruction of 3D city models. Journal of Open Source Software, 6(57), 2866. INEGI elevation models: https://www.arcgis.com/apps/mapviewer/index. html?webmap=b593168ba9784bbc9dd4b909407e559a Methodology source code: https://github.com/kenohori/3dcm-mexico
Feature highway interchanges are not modelled, since all roads are set at the simplified DTM height. Directions for further development Several promising avenues exist for extending this initial work. The building detection algorithm could incorporate machine learning techniques for improved classifications. A more flexible rectilinear optimization of building footprints could enhance geometric quality without the aggressive regularization that limits existing global datasets. Testing the methodology in other Mexican cities where high-resolution elevation data is available would help assess how well the parameters generalize across different climates and urban morphologies. Fine-tuning parameters such as height thresholds, minimum areas and height-difference tolerances could substantially improve results. Incorporating 3D road modelling and applying the lifting algorithms in varied configurations would add significant detail for professional urban planning and analysis applications. Conclusion This research demonstrates that detailed 3D city models can be created for Mexican cities using only open data, despite the limitations of national datasets. By deriving building footprints from elevation models, and road polygons from the gaps between city blocks, the methodology overcomes the absence of these critical features in Mexico’s topographic data. The results show that the approach already produces more accurate building footprints than those in widely used global datasets for dense
About the authors Ken Arroyo Ohori is a lecturer and researcher in the 3D Geoinformation Group at Delft University of Technology, the Netherlands. His research focuses on the use of novel techniques to process data geometrically and topologically. Jantien Stoter is a Professor of 3D Geoinformation at Delft University of Technology. She leads research on the automated reconstruction, use and maintenance of 3D geoinformation at national scale, with a focus on bridging the gap between research and practice.
urban areas, particularly for non-rectilinear landmark buildings. While approximately 30% of smaller buildings remain undetected and vegetation occasionally causes false positives, the work establishes a viable foundation for open 3D city models across all areas of Mexico where high-resolution elevation data exists. The methodology and source code are openly available for further development by the geospatial community.
Issue 4 2026
19
The deeper purpose of surveying the planet’s ‘white spots’
Mapping some of the world’s highest tropical glaciers By Wim van Wegen, GIM International
As a photographer, explorer and founder of Project Pressure, Klaus Thymann thrives in remote, unexplored places. He has led over 60 expeditions to extreme environments across six continents and four oceans, with a focus on contemporary issues and the climate emergency. In this exclusive interview, he talks about conducting drone surveys at almost 5,000m, waiting over a decade for a 90-minute weather window, and why geospatial professionals should put their skills to work for people and planet. When deciding where to explore next, Klaus Thymann often looks for the places that have been ‘forgotten’ by science – places that early explorers described as the “white spots” because they were left blank on the maps, which were printed on white paper. Uganda’s Rwenzori Mountains – the ‘Mountains of the Moon’ – are a near-perfect example. In the 20th century, they included three glaciated peaks: Mount Baker, Mount Speke and
Mount Stanley. Despite a recorded history of exploration stretching back to a 1906 expedition by the Duke of Abruzzi, whose team included the Italian photographer and mountaineer Vittorio Sella, meaningful scientific data about the range long remained almost nonexistent. In theory, remote sensing presents the most obvious solution to capture such
data, but attempts had consistently struggled, not least due to dense and persistent cloud cover. Moreover, the steep inclination of the peaks introduces significant uncertainty into satellitederived measurements. But the challenge runs even deeper, according to Thymann. “The Google Earth repositories contain extremely distorted images because there is no proper satellite coverage,” he
The team gathering data from a rocky outcrop on the Stanley Plateau’s glacier. (Image courtesy: Klaus Thymann/Project Pressure)
20
Issue 4 2026
Feature
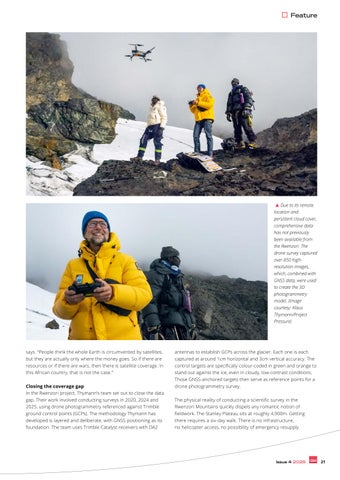
Due to its remote location and persistent cloud cover, comprehensive data has not previously been available from the Rwenzori. The drone survey captured over 850 highresolution images, which, combined with GNSS data, were used to create the 3D photogrammetry model. (Image courtesy: Klaus Thymann/Project Pressure)
says. “People think the whole Earth is circumvented by satellites, but they are actually only where the money goes. So if there are resources or if there are wars, then there is satellite coverage. In this African country, that is not the case.” Closing the coverage gap In the Rwenzori project, Thymann’s team set out to close the data gap. Their work involved conducting surveys in 2020, 2024 and 2025, using drone photogrammetry referenced against Trimble ground control points (GCPs). The methodology Thymann has developed is layered and deliberate, with GNSS positioning as its foundation. The team uses Trimble Catalyst receivers with DA2
antennas to establish GCPs across the glacier. Each one is each captured at around 1cm horizontal and 3cm vertical accuracy. The control targets are specifically colour-coded in green and orange to stand out against the ice, even in cloudy, low-contrast conditions. Those GNSS-anchored targets then serve as reference points for a drone photogrammetry survey. The physical reality of conducting a scientific survey in the Rwenzori Mountains quickly dispels any romantic notion of fieldwork. The Stanley Plateau sits at roughly 4,900m. Getting there requires a six-day walk. There is no infrastructure, no helicopter access, no possibility of emergency resupply.
Issue 4 2026
21
Everything – drones, batteries, ground control equipment, spare parts – is carried by hand, typically with the help of up to 50 local porters. Designed to survive bad luck Redundancy is therefore built into every element of the operation. “We are so far away from support that we have two of every critical component, and three drones,” says Thymann. SIM cards are swapped between battery changes so that a crash does not mean losing the flight data. The team also carries a printed cheat sheet on waterproof plastic paper so that local crew members can operate the equipment independently if needed. “That methodology allows us to be unlucky and still complete the task,” he explains. At that altitude, there is roughly half the amount of oxygen as at sea level. “Even when you are acclimatized, it’s tougher to work. And the plateau is so big, it’s not like you can just stand anywhere and fly a drone. You have to pick your spots for doing an aerial survey,” he continues. Part of what makes the Trimble equipment particularly suited for this work is its operational simplicity under such duress. “You simply switch it on,” Thymann says. “As long as the Bluetooth connects, then you’re pretty much set, and then you just have to wait. And be patient.”
Helicopter access is the only way to reach Puncak Jaya, where every kilogram counts. The team weighs in to ensure a safe flight. With frequent rain in the region, the first challenge is simply getting off the ground. (Image courtesy: Project Pressure) Ready for when cloud cover clears Cloud cover is perhaps the most persistent adversary. Flying a drone at almost 5,000m under low cloud is no small task. Thymann’s team includes a visual spotter tracking the drone and a second person
dedicated to watching cloud movement, constantly trying to stay below the ceiling to capture the glacier’s full perimeter, including slopes and edges. His solution to the broader problem is pragmatic: “The only way to overcome that challenge is to buy more time on the mountain and increase your chances of experiencing the right moment. Because there will be times when the mountains are clear, particularly in the mornings, so we get up early – in the middle of the night, almost – and make sure we’re ready. As soon as there’s daylight, we start flying.” Following the surveys, the data analysis and construction of the 3D model – which entailed stitching together more than 850 images – was carried out in partnership with Pix4D. The post-processing work turned the raw survey imagery into the first complete, high-precision, georeferenced 3D model of Mount Stanley’s glacier – the last remaining one in Africa – with an overall uncertainty of less than 10cm.
A still from Project Pressure’s 3D photogrammetry model. Project Pressure’s data from Mt. Stanley’s glacier reveals a loss in surface area of 29.5% between 2020 and 2024. (Image courtesy: Project Pressure)
22
Issue 4 2026
Extraordinary data accuracy “Our data is the most complete and most
Feature
Klaus Thymann at the survey point, where the team establishes location coordinates with centimetre-level precision, enabling a highly accurate, georeferenced photogrammetry model of the glacier. (Image courtesy: Project Pressure)
accurate today,” comments Thymann. He describes this accuracy as “pretty extraordinary” for an environment where historical measurements contained errors in the magnitude of many metres. The findings reliably confirmed a substantial loss of glacial surface area since 2020. Moreover, because each of the surveys were coregistered using stable geomorphological features on the mountain itself, historic data could be used to draw a credible trend line from the data. “With some uncertainty, we can see that the glaciers will likely be gone somewhere between 2030 and 2040,” he states.
A clear morning allows Project Pressure to capture extensive images of the glacier. Ice once blanketed the summit of Puncak Jaya from ridge to ridge, but is now confined to the saddle between them. (Image courtesy: Project Pressure)
Unhealthy ascent profile If patience was key in the Rwenzori Mountains, Thymann’s mapping project in Puncak Jaya in Papua, Indonesia, demanded something closer to faith. As the highest peak in Oceania and one of the last tropical mountains still carrying glacial ice, Puncak Jaya has been largely off-limits to researchers since 2017, when the surrounding territory was closed due to conflict among local armed groups. The only permitted access today is by helicopter directly into the caldera, bypassing all restricted territory but ascending from
Issue 4 2026
23
retreated by 95% since 2002. Puncak Jaya’s ice is as good as gone. This is often a common thread running through Thymann’s work; he is building meticulous, high-resolution records of situations that will soon no longer exist. His 3D models go beyond confirming what is already broadly understood about climate change, he explains. “The 3D model visualizes what was there, so it’s a visual legacy. But if you want to understand both past climate and future climate, it’s very important to have a high-accuracy dataset that can be used for meteorological purposes, to understand the local implications of climate change and also the implications of how the hydrology is changing.”
3D model created by Project Pressure, preserving the last of Puncak Jaya’s tropical glacier, before it disappears entirely. (Image courtesy: Project Pressure & Pix4D) sea level to over 4,800m in less than 30 minutes.
like the military: you have to be able to assemble your rifle blindfolded.”
“That is not a healthy ascent profile at all,” Thymann says drily. “My body is fairly acclimatized to altitude, so I didn’t have a problem. But the local Indonesian team did. One of the guys couldn’t do the job and I said ‘It’s not safe, you have to go back’. So I had to put the 15 kilos he was carrying into my backpack. And all of a sudden, I had a very, very heavy backpack to carry, in an oxygen-low environment.”
Even deep in cloud cover in remote Papua, the Trimble equipment picked up full satellite signals. Thymann laughs when recounting one particular adaptation to the cold: “I get cold hands, but then I operate the Android with my nose. You can do data capture with your nose, you know – it’s pretty cool.” Another genuine in-field advantage of the Trimble Android over consumer devices, according to Thymann, is that the battery is replaceable, especially because battery performance degrades rapidly in freezing conditions.
Seizing the weather window The next challenge was the weather. Six days of unbroken cloud and rain pinned the team at altitude. The cloudy days were not entirely wasted; the team established ground control points at lower elevation close to the ice, ensuring high accuracy around the glacier margins when the sky finally cleared. Thymann had carried 12 drone batteries up to the caldera precisely because he knew any window, when it came, would be brief and had to be seized immediately. “Finally, one morning, we had a clear window and we could go, and that was very exciting. The expedition had been more than a decade in the planning, and it took nine days to get up to the mountain. So when you get a weather window, and especially if it only lasts one and a half hours, you need to have stuff that works and a team that follows the drill. It’s a bit
24
Issue 4 2026
The hydrological stakes can be considerable. The Rwenzori catchment, for example, supplies water to an estimated four to five million people in the plains below. As glacial meltwater diminishes and seasonal patterns shift, farmers in the region are already adapting by changing their crops or rethinking planting schedules. Precise 3D data about ice volume and retreat rates has direct downstream value for planners and communities navigating that transition. Low barrier to replication Thymann therefore also takes reproducibility into account. “The beauty of photogrammetry is that the model only has to be georeferenced once, which means that the barrier to replication is low,” he says. A local researcher with a consumer-
“The beauty of photogrammetry is that the model only has to be georeferenced once” “You can keep a spare battery warm on your body and then swap it out, which you can’t do with an iPhone,” he comments. These are small technical considerations that can determine whether a survey gets completed or not. More than a visual legacy The results were stark. The measurements taken in 2025 revealed that the glacier had
level drone can produce good enough follow-up data to extend a trend line against the baseline his team has established. That’s why all of Project Pressure’s data is made available royalty-free. “This allows other scientists or locals to survey in a very lowcost manner,” he adds. The Puncak Jaya survey is complete, but the Rwenzori work is still ongoing. In fact, the
Feature Rwenzori has become, for Thymann, much more than a research site. “I love the area and I love the people I collaborate with there,” he says. “They have become close friends over the years.” Nevertheless, he is aware that his mission is far from done and he is already turning his attention elsewhere. “There are around 300,000 glaciers in the world, and a lot of them in the tropics are not being monitored,” he states. “We’re actually working on something in Bolivia.” The true purpose of geospatial expertise For Thymann, Project Pressure’s work – at the intersection of science, technology and urgency – is the ultimate illustration of the power of geospatial tools and techniques such as photogrammetry, GNSS positioning, remote sensing and 3D modelling in understanding a changing planet. But it is important that they are directed towards the right problems. “Put your skills to good use,” he says. “We live in a very rich world of data, where everyone’s personal data is being collected and used for business decisions that might not necessarily be of benefit to the planet – whereas geospatial data has a lot of use for environmental purposes, for science and for other altruistic aims. So keep up the good work, everybody out there. That’s my message.” It is, in the end, a straightforward equation: large-scale data shows that the planet is heading in the wrong direction, and people with the skills and insights to mitigate the situation are not always deploying them in the right way. Thymann has been trying to close that gap for years, one glacier at a time, by building records of landscapes that will outlast the ice itself.
About the author As an experienced editor and writer in the geospatial and hydrographic industries, Wim van Wegen regularly contributes columns and feature articles and speaks with renowned experts in the field. He currently serves as head of content at GIM International and Hydro International, two of the world’s leading geomatics and hydrography media brands.
About Klaus Thymann Klaus Thymann is a Danish explorer, environmental scientist, multi-award-winning photographer, journalist and filmmaker. In 2008, he established Project Pressure, an ecological and climate-focused charity instigating, conceptualizing and leading ambitious change-driven projects with an emphasis on fieldbuilding. Thymann is a consulting scientist with the Technical University of Denmark and Stockholm University, a Fellow of the Explorers Club of New York and the Royal Geographical Society (UK). He has collaborated with the UN, UNESCO, NASA and Oxford University, and has worked together with publishers and broadcasters including CNN, The Guardian, National Geographic and New Scientist.
FIG Working Week 2027 Stavanger, Norway, 23-27 May 2027 Join the global surveying and geospatial community in Stavanger to shape The Power of Where for the New Generations Photo: Tomas Walter FIG Working Week 2027 will explore how geospatial knowledge and surveying expertise provide the foundation for sustainable development, resilient societies, and smart innovation - empowering the next generation to lead the future.
Why attend Gain cutting-edge insights into climate adaptation, coastal and ocean management, Arctic monitoring, and building resilient societies. Connect globally with experts, policymakers, industry leaders and young professionals. Shape the future of sustainable and resilient geospatial infrastructure. Experience Stavanger - where professional dialogue meets fjords and smart-city innovation.
Get involved There are several ways to take part: as a delegate, by contributing a project or presentation to the technical programme, as an exhibitor, or as a sponsor. Peer review abstracts + full paper
1 October 2026
Non-peer review abstract
1 November 2026
Exhibition & sponsorship
Open now
Registration
Opens October 2026
fig.net/fig2027
Issue 4 2026
25
How is the current shift really affecting industry professionals today?
State of play: automation and robotics in surveying By Lars Langhorst, GIM International
The surveying profession has spent a decade being told that robots and artificial intelligence would transform it. In 2026, we are in the midst of this transformation, and around us we see varying results. This article provides an objective look at the facts: what is genuinely automated today, what remains stubbornly manual, and what does the shift mean for the professional in the field? Picture the modern survey: first thing in the morning, a surveyor arrives alone at a mid-sized infrastructure site, launches a drone for the aerial capture, walks the critical structures with a handheld SLAM scanner, checks the scan data against RTK rover measurements, and reviews the initial point cloud on a tablet, all before lunch. Two decades ago, the same deliverable would have required a crew of two or three, a week of fieldwork and another week of office processing. On some sites, the four-hour survey is already common practice, although
other fields have yet to embrace this modern approach to data capture. So how did we get to this level of efficiency in such a complex and varied profession? There was no single breakthrough moment when surveying became automated. Instead, the profession has absorbed two decades of quiet, steady advances – in positioning, in sensors, in data processing and, now, in the application of artificial intelligence (AI). Together, these technologies have compounded into a fundamentally different
reality (Woolpert/LIDAR Magazine, 2026). The interesting question in 2026 is no longer whether automation is coming, but where the frontier actually lies: which parts of the surveyor’s work have genuinely been taken over by machines, and which have merely been compressed? Transforming routine work On most surveying jobs in the field, oneperson operation has become the standard configuration for routine work, particularly in construction and topographic surveying
‘Spot’ the robot dog equipped with Trimble’s X7 high-speed 3D laser scanning system. (Image courtesy: Boston Dynamics)
26
Issue 4 2026
Feature What began as a safety measure has become a production workflow. Some operations now scan voids weekly that were previously only surveyed once a quarter, if at all.
DJI Dock is DJI’s automated drone-in-a-box solution, enabling remote drone deployment and charging. (Image courtesy: DJI Enterprise) (SurveySlate, 2026). Robotic total stations from the likes of Leica Geosystems, Trimble, Topcon and South track their own prisms, GNSS rovers deliver centimetre-level positions in real time, and machine-guidance workflows push design surfaces directly to excavators without a stake being driven. Parallel developments and implementation have been occurring with SLAM-based mobile mapping. Handheld and wearable scanners using simultaneous localization and mapping (SLAM) have arguably changed terrestrial reality capture more than any single robotic platform. This versatile technology transforms building and site documentation from days of static scanning into a walk-through. Such scanners have made 3D capture the default deliverable in combination with drone Lidar and photogrammetry, both of which are now commodity tools. On the Lidar side, dedicated payloads from RIEGL and YellowScan sit alongside DJI’s integrated Zenmuse L-series, while photogrammetry-based mapping runs on RTK-enabled platforms such as DJI’s enterprise drones and Wingtra’s fixed-wing VTOL mappers, feeding processing software from the likes of Pix4D and Agisoft. Robotic platforms move from pilots to production Meanwhile, the genuinely robotic platforms have moved from pilot projects to production in specific niches. Quadruped robots (robot dogs) equipped with survey-grade Lidar scanners walk construction sites on scheduled scan missions, capturing week-to-week as-built progress for building information modelling (BIM) comparisons (Trimble/Boston Dynamics). Offshore, we see major improvements. For example, Fugro now performs North Sea pipeline and platform inspections with uncrewed surface vessels controlled from remote operations centres hundreds of kilometres away, collecting over a thousand linear kilometres of bathymetry in a single campaign without a person on board. These high-risk, high-cost surveying situations accelerate innovation, as one of the main drivers of technology adaption is improvement of safety for humans. Supervised autonomy The same pattern is visible on land in construction layout. Civ Robotics’ CivDot, an autonomous stakeout rover, drives itself to design coordinates and marks them with paint or a physical stake. It routinely sets out several thousand points per day on utility-scale solar farms and highway alignments – work that would otherwise occupy a two-person crew for a week. The surveyor’s role shifts to loading the design file, establishing control and spotchecking marks: a textbook case of supervised autonomy. Autonomy is arguably most advanced in the underground domain – purely because it has to be. In GNSS-denied mines and tunnels, drones fitted with SLAM Lidar payloads from Emesent (Hovermap) and Exyn Technologies fly themselves beyond line of sight and beyond communication range. They navigate stopes and ore passes no human should enter, and return with survey-grade point clouds for convergence monitoring and volume reconciliation.
Above ground, the ‘drone in a box’ has quietly matured. Resident systems such as DJI Dock and Percepto stations are permanently based at mine sites, ports and large construction projects, flying scheduled photogrammetry missions, then recharging and uploading without a pilot present. With beyond-visual-line-of-sight approvals expanding across Europe, daily stockpile volumetrics and progress capture are becoming a background process rather than requiring a site visit. Surveyors are being relocated, not removed The marine domain keeps stretching the definition of a survey crew even further. XOCEAN’s uncrewed surface vessels run multibeam campaigns for offshore wind developers with pilots rotating shifts in onshore control rooms. Meanwhile, the wind- and solar-powered Saildrone Surveyor has mapped tens of thousands of square kilometres of deep ocean, feeding the Seabed 2030 initiative. Below the surface, autonomous underwater vehicles such as Kongsberg’s HUGIN execute preprogrammed cable-route and pipeline inspections at depths and endurances no towed system can match. The common thread across these examples is not the removal of the surveyor but a relocation: from behind the instrument to in front of the mission plan and the QC dashboard. The robots go where the work is dull, dirty, dangerous or simply repetitive,
A job for a robot or a surveyor? When assessing automation opportunities and AI applications, we should ask ourselves whether the tasks and their results are verifiable and whether there is a clear distinction between good and bad outcomes. If so, robots and AI can be effectively trained for them. In the case of surveying, results are by definition verifiable, making the profession the ideal breeding ground for AI-human collaboration.
Issue 4 2026
27
and the measurement expertise that defines the profession moves with them, one abstraction level up. Leaps in data processing In the office, data processing is taking leaps into automation, where processes can be fully replaced and tested for verification. This is done at high iteration, relatively low cost, and low risk. The tasks that consumed the most technician-hours a decade ago were classification and extraction: turning raw point clouds into classified surfaces, extracting features, drafting topographic detail. This is pattern recognition at scale, which is precisely what machine learning does well. Modern processing pipelines can classify much of a scene automatically, although manual correction remains necessary in complex environments, such as those with dense canopy, industrial clutter or snow, or construction sites in flux. Feature extraction that took days can now be reduced to hours of model runtime plus an afternoon of review.
About the author Lars Langhorst (MSc) is a pioneer at the frontier where AI meets surveying and asset management. With a background in geomatics and AI, Langhorst believes the next big innovations are just around the corner. He aims to bring these innovations to organizations, bridging the gap between today’s and tomorrow’s technology.
The traditional survey was a snapshot, being a dataset with a date on it, delivered and archived. The direction of travel is continuous: satellite imagery, aerial and drone capture, mobile mapping and fixed sensors combined into datasets that are maintained rather than delivered. This is precisely a trajectory that practitioners in the GIM International Industry Survey 2026 identify as a defining trend. Nonetheless, digital twins are becoming operational products in infrastructure and asset management. Digital twins have existed for years, but the recent ease of processing has truly brought the general digital twin to a new level. Data capture, fusion of data sources and maintaining the level of digital twins we see today would not be feasible without deeply integrated automation. AI: from generic to industry-specific The generic artificial intelligence (AI) of a few years ago is differentiating into something specific to our field: geospatial foundation models trained on Earth observation archives. NASA and IBM’s open-source Prithvi-EO family, trained on millions of Harmonized Landsat–Sentinel samples, and the Clay Foundation Model are prominent examples. On top of these, early AI agents are beginning to answer spatial questions directly: querying geodata, running analysis, drafting answers. Commercial platforms are moving in the same direction. Colombian geomatics firm Cuatro Conceptos, for instance, has built AI-enhanced querying, geoprocessing and 3D analysis into its XphereLab platform for territorial planning and decision support. This remains an emerging capability rather than a
An XOcean USV departs on an autonomous bathymetric survey mission in the UK Atlantic. (Image courtesy: UKHO)
28
Issue 4 2026
The Yukon Delta in Alaska, where the Yukon River empties into the Bering Sea. Geospatial foundation models today are trained on extensive Earth observation archives. (Image courtesy: ESA)
production reality, but its implication is already clear. Respondents in the GIM International survey point out that an agent is only as good as the metadata that tells it what it is looking at. That makes metadata, an often neglected aspect in data and geomatics, quietly one of the most valuable assets an organization can maintain when looking at a future with agents. The surveyors who have documented their data properly for 20 years are about to be vindicated. What is not automated? It has become fashionable to write about automation as an unstoppable tide. But which aspects of surveying will remain the same? The aim of answering this question is not to predict the bursting of the AI bubble, but to put things into the right perspective. Boundary determination and legal surveying top the list, because the constraint is not technological but institutional. Reconstructing a boundary is an act of legal interpretation for which a licensed professional carries personal liability. No classifier output can absorb that liability. Expert testimony, dispute resolution and complex cadastral work belong to the same category. It is no coincidence that these are among the highest-margin activities in the profession, and firms are increasingly specializing in exactly this judgment-
Feature conventional methods at conventional prices for work that automated competitors deliver in a third of the time – appears to be eroding.
An example of AI-powered mapping. A sample of 3D buildings extracted by Ecopia from Maxar imagery in Kuala Lumpur, Malaysia. (Image courtesy: Maxar / Ecopia) heavy niche as routine measurement commoditizes, according to SurveySlate’s ‘Land Surveyor Industry Trends’. That being said, technological advancements are slowly creeping into this domain – slowed down, but never stopped, by these institutional restraints. Quality assurance (QA) will continue to remain – for a while, at least – a dignified bottleneck in AI and automation adoption. Every automated pipeline ends at the same station: a person has to take responsibility and provide a signature of approval in the context of the accuracy budget, the independent checks, and the assessment that a dataset is fit for its stated purpose. This is codified in frameworks such as ISO 19157 for geographic data quality and ISO 19115 for metadata, and in national QA regimes. This constitutes professional accountability and cannot be delegated to the tool. Shifting professional roles So what does this mean for industry professionals? The role has shifted from measurement technician towards geospatial intelligence manager: someone who plans and supervises automated acquisition, validates AI-assisted processing, owns the accuracy budget end to end, and stands behind the result. Instrument skills that defined the profession for a century are now table stakes, and the differentiating skills are data engineering, statistics and critical evaluation of automated output. This means that knowing (and daring to say) when the pipeline is wrong is worth more than knowing how to run it. The scarce profile in
2026 is the professional who understands both the measurement science and the data science, and who can carry accountability across the seam between them. For firms, a strategic fork in the road is emerging, at least in markets where automation has taken hold. One path is full investment in the technology stack: platforms, sensors, cloud processing, training. This demands significant capital but keeps a practice competitive for routine and large-scale work. The other, according to SurveySlate, is specialization in judgmentheavy niches where automation does not reach: legal surveying, expert work, complex engineering surveys, QA services. While both are viable, the middle ground – those offering
Conclusion Today, the industry is further along than the sceptics admit and close to where enthusiasts hope it is, but we are not quite there. Fieldwork has been transformed; in adopting markets, one person now does the work of a crew, and robots go where people should not. The office has also been transformed; machines do the pattern recognition, and deliverables are becoming living datasets rather than dated snapshots. And in all fields of work, AI and robotics have shown to be a revolution that will not be reversed. As we enter a new era of work, working conditions, safety, efficiency and results are all improving, at certain costs. The surveyor who works alone with yesterday’s toolkit will need to adjust or will be outperformed by new tools, methods and prices. In 2026, the realistic picture is of augmentation powered by automation, with the professional remaining firmly accountable for the result. In fact, this may be the strongest position the surveying role has held in a generation. Fewer hours are spent on measuring, and more are spent on the questions that were always the point of measuring in the first place. Your surveying knowledge and judgement will remain critical for the next decades.
Further reading GIM International Industry Survey 2026, https://www.gim-international.com/content/ article/the-geospatial-profession-in-2026-expanding-and-evolving-but-not-without-itschallenges Woolpert/LIDAR Magazine (2026), ‘Mapping the Future: Critical Geospatial Trends for 2026’, https://woolpert.com / https://lidarmag.com SurveySlate (2026), ‘Land Surveyor Industry Trends: What’s Changing in 2026’, https:// surveyslate.com Szwarcman, D., Roy, S., Fraccaro, P., et al. (2024, rev. 2026), ‘Prithvi-EO-2.0: A Versatile Multi-Temporal Foundation Model for Earth Observation Applications’, arXiv:2412.02732; accepted in IEEE Transactions on Geoscience and Remote Sensing. NASA–IBM open-source geospatial foundation model trained on ~4.2 million Harmonized Landsat–Sentinel time-series samples, https://arxiv.org/abs/2412.02732v3 Clay Foundation Model for Earth observation, https://clay-foundation.github.io/model Trimble/Boston Dynamics, integrated autonomous scanning solution (Spot robot with Trimble X7 laser scanner and FieldLink software), https://bostondynamics.com / https:// aecmag.com (2021) Fugro (2023–2024), fully remote North Sea pipeline and platform inspection campaigns using Blue Essence uncrewed surface vessels operated from onshore remote operations centres, https://www.fugro.com
Issue 4 2026
29
Usable Gaussian splats for CAD environments
A complete workflow with IGI, Bentley and Terrasolid By Dr. Ana Puttonen, Juuso Siren, Arttu Soininen, Mika Salolahti, Marta Kaczmarek, Dr. Lomme Devriendt, and Kamil Wójcik.
One of the most significant new developments in making 3D reality capture more realistic, efficient and valuable is the adoption of 3D Gaussian splats. These provide highly detailed and photorealistic visualization while reducing many of the limitations of traditional mesh models. A real-world project over the historic city of Tallinn, Estonia, demonstrates how modern airborne imagery, advanced photogrammetric processing and Lidar classification can be combined into a single production workflow. The high-quality imagery and Lidar data can be transformed into accurate, georeferenced and production-ready reality models. Every successful reality modelling project begins with high-quality data acquisition. One of the major advantages of the IGI Systems platform is its modular architecture. Camera systems, Lidar scanners, GNSS/INS units, mission planning and sensor management are all tightly integrated, allowing operators to configure airborne systems for a wide variety of mapping missions. For the Tallinn project, the IGI UrbanMapper 2 Evo camera system was used. The survey combined ultra-high-resolution nadir imagery, four oblique camera views, integrated Lidar acquisition, accurate GNSS/ INS positioning, and flight management and sensor synchronization. The project was flown at approximately 500m above ground level, producing imagery with a ground sampling distance (GSD) of 2cm and Lidar data with approximately 45 points per square metre. The example dataset showcased how high-resolution aerial photographs can be transformed into highly detailed 3D Gaussian splats, accurately reproducing complex urban environments, including historic buildings, streets, public spaces, and modern infrastructure.
Overcoming GPS jamming with advanced navigation technology GPS jamming and spoofing is a growing challenge, especially across Eastern Europe. This can pose threats to reliable image acquisition in challenging operational environments such as near airports, critical infrastructure, ports and other sensitive areas. Such interference can affect positioning accuracy and, if not properly managed, reduce the quality of geospatial data products. IGI’s latest navigation technology can continue producing usable trajectory data even when GNSS signals are partially disrupted. Instead of relying on a single satellite frequency, the system analyses multiple GNSS frequencies and continues processing using signals that remain unaffected by interference. While direct georeferencing accuracy may decrease under severe jamming conditions, the resulting trajectories remain sufficiently accurate for aerial triangulation and Lidar strip adjustment workflows. This technology was tested during extensive flights across Estonia, where both jammed and non-jammed areas were surveyed, demonstrating practical resilience under real operational conditions. Motion compensation for sharper images Another relevant innovation from IGI is overlay rotation correction (ORC), a forward-motion compensation technology. During flight, aircraft motion naturally introduces blur into aerial imagery. ORC compensates by dynamically rotating the camera mount according to aircraft speed, altitude and direction, significantly reducing image blur. The results in Tallinn demonstrated sharper imagery, improved finedetail preservation, better image matching during photogrammetric processing, and higher-quality Gaussian splats. For applications requiring centimetre-level accuracy, this improvement directly enhances the final reconstruction quality. Processing city-scale projects Once imagery has been collected, the next challenge is processing thousands of high-resolution photographs into accurate 3D models. The Tallinn project made use of the Bentley Systems iTwin Capture Modeler Flex, designed specifically for large photogrammetric projects. This software supports automatic aerial triangulation, RTK and GNSS
30
Issue 4 2026
Sponsored article
Applications This workflow is particularly valuable for: • Transportation corridors • Highway and railway projects • Airports • Utilities and energy infrastructure • Urban planning • Mining operations • Industrial facilities • Environmental monitoring • Smart city initiatives • Large-scale digital twin projects
positioning, ground control points (GCPs), camera calibration, Lidar integration, reality meshes, photogrammetric point clouds, true orthophotos and 3D Gaussian splats. The Tallinn dataset consisted of approximately 1,700 aerial images, each roughly 300MB in size. The software supports both local processing and Bentley Cloud processing, allowing users to balance hardware resources and project deadlines. Cloud computing dramatically reduces processing time One of the most striking results involved processing performance. For the Tallinn dataset, medium-quality Gaussian splats required approximately 18 hours using Bentley Cloud. For comparison, the same dataset required approximately six days on a single high-end GPU workstation. At the highest quality settings, Bentley Cloud completed processing in approximately 2 days and 11 hours, while a local workstation required nearly 17 days. For city-scale projects, cloud processing offers a significant productivity advantage, enabling organizations to deliver results much faster without investing in extensive local computing infrastructure. Bringing Gaussian splats into production Traditional reality meshes often struggle
with features such as thin structures, glass surfaces, fences, wires, vegetation and complex architectural details. Gaussian splats preserve these features far more effectively, as can be seen in examples from Tallinn’s Old Town. Terrasolid’s TerraSplat and TerraScan solutions extend Gaussian splats beyond visualization and into practical production workflows. Instead of treating Gaussian splats and Lidar as separate datasets, Terrasolid merges both into a hybrid point cloud model, combining the strengths of each technology. While Gaussian splats provide photorealistic visualization, facade detail, object recognition and improved interpretation, Lidar provides precise geometry, reliable ground detection, vegetation penetration and established classification workflows. Hybrid models improve classification When using photogrammetry alone, dense vegetation often obscures the ground. Conversely, Lidar excels at ground detection but may contain gaps on vertical surfaces or fine objects. By merging the two datasets, TerraScan enables improved visualization, better object interpretation, enhanced quality control, more intuitive manual editing and preservation of Lidar classification logic. Poles, trees, buildings and infrastructure become much easier to inspect when displayed as photorealistic splats linked directly to classified Lidar points. Conclusion The future of reality capture lies not only in creating visually impressive models but in making those models usable throughout the engineering lifecycle. The Tallinn case study illustrates how the technologies of IGI Systems, Bentley iTwin Capture Modeler Flex and
Terrasolid complement one another to create accurate, efficient and scalable city-scale digital twins. By connecting reality capture, photogrammetry and CAD, this integrated approach helps professionals build more informative digital twins, improve project collaboration and make better decisions across the planning, design, construction and maintenance phases of infrastructure projects. As Gaussian splats continue to mature, hybrid reality models are likely to become a standard workflow for mapping professionals, surveyors, infrastructure managers and digital twin developers seeking both visual realism and engineering-grade accuracy.
More information TerraScan user guide, http://www. terrasolid.com/guides/tscan/index. html TerraSplat user guide, https:// terrasolid.com/guides/tsplat/tsplatweb/about-terrasplat.html Introduction to TerraSplat, https:// attendee.gotowebinar.com/ recording/7092026374054837930 Editing Gaussian splats in TerraSplat with the Copy Toolbox, https://www. youtube.com/watch?v=AuGnKKR6Y-s Recording of joint webinar hosted by IGI Systems, Bentley Systems and Terrasolid: ‘Usable Gaussian splats for CAD Environment’, https://attendee.gotowebinar.com/ recording/6420345719122924800
Issue 4 2026
31
UltraMap strengthens the foundations of photogrammetric production UltraMap’s latest innovations focus on what matters most in photogrammetric production: stronger geometric foundations and more consistent image quality. A fully redesigned automated global colour balancing algorithm and an upcoming machine learning-based reconstruction pipeline reinforce both the radiometric and geometric basis of the workflow. Introduced in July, UltraMap’s new global colour balancing for nadir and oblique imagery automatically creates seamless, homogeneous projects with naturally preserved appearance. The result is more consistent image quality across complete datasets, achieved with up to 2x faster processing throughput. Additional major advances made in development will be presented at Intergeo 2026, including a new ML-based reconstruction pipeline for UltraMap. This is a fundamental innovation, because the quality of every deliverable depends on the quality of the underlying geometric
reconstruction. Whether generating point clouds, DSMs, DTMs, orthophotos or 3D TINs, improving reconstruction at the source elevates every downstream product: surface models become cleaner, terrain models more reliable, orthomosaics more precise and 3D outputs more consistent. UltraMap is Vexcel’s end-to-end software platform for producing these products from UltraCam imagery within one integrated environment. Built for ever-larger data volumes, it combines a high degree of automation with quality monitoring and diagnostics, while still enabling intuitive manual interaction where needed. Its sophisticated machine learning algorithms are trained on the robust foundation of the Vexcel Data Program, the world’s largest aerial imagery and geospatial data library, and make full use of the rich raw information captured by UltraCam sensors. The result is a photogrammetric workflow engineered not only for productivity, but for measurable advances in output quality.
More information
Feature
How aerial surveying companies are coping with jamming and spoofing
When the GNSS signal drops By Ada Perello, EAASI
GNSS jamming and spoofing have gone from a niche technical concern to a recurring headline, particularly over the past year. But what does that actually mean for aerial survey missions – both in the air, in post-processing and for the associated contracts? This article shares the real-world experiences of two EAASI members whose missions encountered jamming or spoofing and what it took to recover usable data afterwards. It also provides insight into how one national mapping agency – as both operator and client – is adapting on the procurement side. In 2025, independent reporting traced clusters of jamming activity affecting air and sea traffic across the Baltic Sea to sources in and around the Kaliningrad Oblast. By January 2026, the pattern had escalated enough that the coastal states of the Baltic and North Seas, together with Iceland, signalled a shift towards stricter enforcement by issuing a joint open letter declaring they would no longer tolerate violations of international maritime law in the region. The letter cited Russia’s regular disruption of GNSS signals as one driver, alongside separate concerns over “shadow-fleet” vessels breaching maritime norms. According to tracking by the European Union Aviation Safety Agency (EASA), the trend dates back to earlier still, with a marked rise in GNSS jamming and spoofing – concentrated around the Mediterranean, Black Sea, Middle East, Baltic Sea and Arctic – having been recorded since February 2022. Europe’s aviation authorities have responded at policy level. EASA and EUROCONTROL published a joint Action Plan in March 2026 to strengthen the resilience of European aviation operations against GNSS interference, building on concerns raised by EU member states in 2025 and on prior work by EASA, ICAO and IATA. Much of that response is framed around commercial air transport, where GNSS interference can affect route planning, performancebased navigation (PBN) operations, crew procedures and air traffic control (ATC) coordination.
Undermining accuracy Under Regulation (EU) No 965/2012, aerial surveying usually sits in Part-SPO, which is a different operational category from commercial air transport (CAT) and is typically mission-specific rather than scheduledriven. That distinction matters because, for survey missions, GNSS interference is often less a route-deviation issue and more of a data-quality issue. A jammed or spoofed signal may not automatically endanger the flight in the way it can complicate a busy airliner operation, but it can undermine positioning accuracy and compromise the geospatial outputs the mission was flown to collect. What that means in reality varies by geography, but its scale is already substantial across parts of Eastern Europe.
In north-eastern Poland, for example, flight-tracking data from OPEGIEKA indicates that, at typical cruising altitude, over half the country’s territory falls within range of jamming systems based in the Kaliningrad Oblast. The footprint of those systems also extends into Finland, Estonia, Latvia, Lithuania, Romania and Bulgaria. What OPEGIEKA in 2024 described as an occasional, manageable problem that could be mitigated simply by flying lower, had by 2025 become a near-daily operating condition, with flyable windows that no longer followed any predictable calendar. Knock-on effects beyond missions Severity varies depending on equipment as well as geography. According to AVT Airborne
POSPac (Applanix) signal-tracking plot showing satellite visibility across all tracked constellations combined (GPS, GLONASS and Galileo) during the flight. (Image courtesy: BSF Swissphoto)
Issue 4 2026
33
GPS-only signal-tracking plot, showing 15-20 short interruptions where the signal dropped to zero. (Image courtesy: BSF Swissphoto) Sense, which flies aerial-imaging missions in Finland, the GPS of its aircraft has been known to go out entirely in some areas, while its camera systems, fitted with more modern antennas, kept functioning. Pilots have been required to fall back on compass-and-map navigation – a skill rarely called on since before satellite positioning. AVT itself has not had to halt a mission, but other operators have. One of them is BSF Swissphoto; when flying Lidar missions near Kotka, it stopped a survey mid-flight rather than risk collecting data that could not be used. The consequences extend well beyond the companies flying the missions, since national mapping agencies are also affected. According to Finland’s National Land Survey
(Maanmittauslaitos), for example, GNSS interference moving westward from eastern Europe into countries such as Finland, Poland and the Baltic states constrains its ability to deliver public geospatial data. This causes knock-on effects for sectors that depend on that data, including forestry and agriculture and, by extension, the wider economy. Case study 1: Lidar survey, Finland (BSF Swissphoto) On 25 May 2026, BSF Swissphoto was flying a Lidar survey near Kotka, in south Finland. The region is located roughly 40km from the Russian border and close to the southern Baltic Sea – one of the areas EASA has flagged for a sustained rise in GNSS
What is GNSS interference? Having travelled roughly 20,000km from satellite to ground, GNSS signals arriving at a receiver are already weak enough that a comparatively low-power transmitter can disrupt them. That disruption takes two distinct forms: • Jamming is the deliberate transmission of radio-frequency noise that overwhelms the legitimate signal, preventing a receiver from acquiring or tracking it at all. The effect is usually immediate, with the receiver losing lock, and the crew or system seeing a clear warning. • Spoofing is harder to detect than jamming. Rather than blocking the signal, a spoofer transmits counterfeit signals that are convincing enough for a receiver to lock onto them and report a false position, velocity or time as valid, often without triggering an obvious warning. The deception can be striking. In a 2026 mission flown by AVT in Finland, a pilot’s spoofed navigation display showed the aircraft apparently en route to St Petersburg, hundreds of kilometres off its actual course. Reducing reliance on GNSS alone is already an active research area. A 2026 review in Photogrammetric Engineering & Remote Sensing 92(6) (Eid, M.O., Remondino, F., & Toth, C. (2026). ‘Beyond GNSS-Based Georeferencing’, https:// doi.org/10.14358/PERS.25-00220R2) assesses emerging alternatives: from 5G and satellite signals of opportunity, to UWB and ultrasonic positioning, to Lidar- and radar-based simultaneous localization and mapping (SLAM). The conclusion: GNSS remains unmatched for now, given decades of infrastructure investment and operational evolution. interference. Around noon, midway through the mission, the flight crew began receiving repeated warnings of missing or poor satellite signal registration, most pronounced over the southern Baltic Sea. Real-time accuracy dropped, though the crew noted this appeared to occur specifically during turns.
GLONASS-only signal-tracking plot, showing markedly more interruptions than GPS or Galileo over the same period. (Image courtesy: BSF Swissphoto)
34
Issue 4 2026
Following standard procedure, the crew worked through two checks before deciding whether to continue. First, could the aircraft be confirmed to be operating only within
Feature of those windows became visible indirectly. In a few locations, alignment between neighbouring flight strips was less precise than usual – a difference of roughly 10-15cm, against an expected maximum of around 5cm under normal conditions. According to BSF Swissphoto, this will be resolved with local adjustments once the project is fully flown. Lessons learned BSF Swissphoto’s stated approach in similar situations is to keep flying and check the flight-path calculation for any affected mission within 24 hours of landing, so that a result is available the following day. Galileo-only signal-tracking plot, showing just five brief interruptions – the least affected of the three constellations. (Image courtesy: BSF Swissphoto) Finnish airspace? Yes, so the decision was made to continue. Second, was the accuracy level the system was reporting still good enough to fly? On several checks, it was. The crew continued flying for approximately one hour before stopping the mission, judging that continuing further risked collecting data that ultimately could not be used. The interruption was logged in the operator journal. Data processing According to BSF Swissphoto, GPS jamming in this case affected the registration of the flight path, not the Lidar measurement itself. The company checked the effect directly after the flight using Applanix’s POSPac software, which flagged GNSS problems as soon as the real-time flight data was imported. The aircraft was tracking GPS, GLONASS and Galileo signals simultaneously. Reviewing each constellation separately showed the impact was uneven: GPS recorded 15-20 interruptions where the signal dropped to zero; GLONASS showed a larger number of interruptions; Galileo recorded only five. Additional checks on the processed solution found good position dilution of precision (PDOP) throughout, with only three short timeframes exceeding a value of 5, and a processing mode that stayed at a maximum of 2. For BSF Swissphoto, this meant the flight path could be processed without interruption for an estimated 99.9% of the mission. Result BSF Swissphoto’s assessment was that the jamming did not affect all signal types equally, and that the comparatively small impact on Galileo helped in reconstructing the flight path. The trajectory could ultimately be calculated with only small time windows of reduced accuracy. When the flight path was combined with the raw laser data, the effect
Case study 2: North-eastern Poland (OPEGIEKA) For OPEGIEKA, a Polish geoinformatics company operating from Elbląg and Warsaw, GNSS interference in north-eastern Poland has moved from an occasional nuisance to a standing operating condition. Jamming first appeared in 2024 and was, at the time, manageable by flying lower. Since 2025, it has occurred on an almost daily basis, though intensity varies from day to day. Moreover, the calmer, more flyable windows no longer follow a predictable calendar. This is a particular problem given that different products require specific seasonal conditions, so a quiet window is only useful if it happens to coincide with the right season for a given project. The consequences became concrete on a project OPEGIEKA flew in 2025 as a subcontractor for GUGiK, Poland’s national mapping agency, under the national S1 standard (rural areas, 10cm orthophoto and 4 points/m² ALS). GNSS jamming forced OPEGIEKA to drop three acquisition blocks – Giżycko, Olecko and Pisz – covering roughly 3,500km², amounting to approximately €165,000 in lost contract value. The remaining area in the same region, around 2,765km², was completed and delivered successfully.
PDOP plot for the processed trajectory, showing good geometry throughout, with only three short timeframes where it briefly worsened. (Image courtesy: BSF Swissphoto)
Issue 4 2026
35
Receiver status screen showing a degraded ‘SinglePoint’ solution with PDOP spiking to over 51,000. (Image courtesy: OPEGIEKA) Other affected projects show different outcomes rather than a single pattern. A July 2025 forest-inventory contract for Poland’s State Forests had to be renegotiated and compressed after interference pushed acquisition past its original deadline. A separate high-altitude orthophoto project for Poland’s agricultural paying agency, ARiMR, saw priority areas substituted with satellite imagery instead of aerial capture, and even that fallback left some areas uncovered by either method. Mitigation OPEGIEKA’s response combines operational and technical measures: repeated flight attempts on different days, flying lower at significant cost in flight time, shortening flight lines to avoid the worst-affected zones, and firmware updates developed with sensor manufacturer Leica to improve signal tracking under jamming. Trajectoryprocessing techniques – switching primary frequency, combining or restricting satellite constellations, excluding degraded time windows – can recover some accuracy where at least some GNSS data was logged during the interference, though not where the signal was lost entirely.
36
Issue 4 2026
Lessons learned According to OPEGIEKA, no single mitigation is universal, and even with these measures in place, some residual loss of accuracy should be expected rather than a full return to nominal quality. Interference-affected regions have simply become more expensive to serve – in terms of flight attempts, flight hours and processing time – and being upfront with clients about what is achievable, rather than promising a reliability that may not hold, has become part of how the company manages these projects.
the first question is simply whether onboard systems – cameras and laser scanners – can keep operating once interference exceeds their tolerance. Beyond that threshold, acquisition is no longer possible at all. Even below it, there is often real uncertainty over whether the data collected will meet required quality standards. Aerial imagery and ALS are affected differently. Once images are successfully captured, the main risk has usually passed, but ALS is considerably more sensitive to GNSS degradation, making quality assurance a persistent challenge.
A national mapping agency’s perspective The two case studies show what GNSS interference does to a mission in progress. National Land Survey of Finland’s perspective is different in that it comes from the client side as well as the operator side. The agency carries out roughly 50% of Finland’s annual aerial imaging programme and around 15% of its airborne laser scanning (ALS) programme with its own resources, procuring the rest through competitive tenders from commercial aerial surveying companies.
That unpredictability creates a problem NLS Finland has had to solve not just as an operator but as a client. How can it write fair contracts when GNSS interference cannot be predicted, and contractors are only paid for data that meets agreed quality standards and is formally accepted? What is a reasonable number of failed acquisition attempts to expect from a contractor working in an unpredictable interference zone? Determining a fair allocation of risk between client and contractor has become an increasingly important procurement question.
For NLS Finland, GNSS interference has two distinct effects: on flight safety and operational performance, and on the quality of the data collected. Flight safety comes first, without compromise. In practice, interference near the Russian border has at times prevented flight operations in certain border areas altogether. On the data side,
This year, NLS Finland has responded with four measures: 1) prioritizing ALS acquisition in lower-risk areas, 2) adding a specific GNSS-interference clause to its procurement contracts to define responsibilities on both sides, 3) procuring satellite imagery instead of aerial imagery, for the first time, in areas
Strip mismatch on a roof profile after adjustment, showing that software adjustment reduces but does not fully remove interference-induced offsets. (Image courtesy: OPEGIEKA)
Feature
About the author
DA62 MPP SurveyStar aircraft in action. next to the Russian border where aerial surveys are no longer practical, and 4) continuing joint research with the Finnish Geospatial Research Institute (FGI) towards more robust long-term solutions. As NLS Finland put it, if data-acquisition capacity keeps being constrained, the impact accumulates from one production season to the next – for the agency and, in turn, for every public authority and industry that depends on its geospatial data. Conclusion GNSS jamming and spoofing are no longer a distant threat for European aerial surveying – they are already reshaping how missions are flown, how data is processed and how contracts are written, from the Baltic coast to north-eastern Poland. But the story here is
Ada Perello is the communications manager at the European Association of Aerial Surveying Industries (EAASI), which was established in 2019 to unite companies generating geographic data from crewed aerial platforms and has experienced rapid growth ever since. Prior to joining EAASI, Perello worked in external communications for organizations like IMO, FAO and the private sector. She holds a master’s degree in Journalism and International Business Administration.
bigger than just operational headaches in the survey sector alone. Aerial surveys produce the geospatial data that underpins public mapping, forestry management, agricultural monitoring and much more besides. When that data becomes harder, slower or more expensive to collect, the effects don’t stop with the companies flying the missions. They travel downstream, to every public authority and industry that depends on reliable geospatial data to do its work. That is the case for taking GNSS interference seriously, well beyond the cockpit.
Issue 4 2026
37
Connected geospatial workflows will define the next decade of infrastructure delivery Geospatial information now has a role far beyond the initial survey, moving through design and construction and into the long-term management of infrastructure. Neil Vancans, head of geomatics at Topcon Positioning Systems, explores what that means for the future of geomatics, the need for open workflows and how Topcon’s dedicated Geomatics Business Unit is responding to the way the market is changing. Over the past 30 years, advances in measurement, positioning and geospatial technologies have transformed the work of surveyors and geomatics professionals. GNSS, robotic total stations, laser scanning, mobile mapping, monitoring and reality capture have changed not only how quickly the physical world can be measured, but how far that information now travels across an infrastructure project.
reach other people, whether as a drawing, coordinates for setting out or an as-built survey. What has changed in recent years is the number of people, systems and decisions that now rely on that information.
Precision is at the heart of that progress. From optical instruments through to today’s positioning and measurement technologies, it provides the foundation for producing geospatial information that people can rely on. At the same time, the volume and richness of information being produced has grown enormously. A coordinate established in the field, a point cloud representing existing conditions or a series of monitoring observations may go on to inform the work of engineers, contractors, machine operators, GIS teams and asset managers.
The challenge here, though, is evident. Take the everyday movement between field and office; faster measurement and automated data collection can create considerable time efficiencies, only for that time to later be lost when teams need to transfer files manually, convert formats, check which version is current or reconcile information held in different systems. And the consequences aren’t limited to lost time.
Surveyors remain central to establishing control, understanding measurement quality and making sure geospatial information is correctly referenced and fit for its intended purpose. As that information travels further through a project or organization, those fundamentals need to travel with it.
Design teams need confidence that they are working from the correct survey information, contractors need current design data in the field, GIS teams need reliable information that can be incorporated into their systems of record, while asset owners need reliable asbuilt records that reflect what was actually constructed. Keeping information reliable and usable through each of those handovers is
As geospatial information moves through more systems and into more hands, the challenge is keeping it reliable and useful along the way. For infrastructure, this creates an opportunity to build a much clearer picture of an asset throughout its lifecycle. Information can be created and updated as work progresses, connecting what exists on the ground with what is designed, what is built and, eventually, how that asset performs. Extending the value of geospatial information Survey information has always needed to
38
Issue 4 2026
Neil Vancans, head of geomatics at Topcon Positioning Systems.
Sponsored article
utilities, field-verified asset locations can feed directly into an Esri ArcGIS system of record for network management, maintenance and future works.
A Topcon field controller displaying tunnel mapping data as part of an underground surveying and scanning workflow. becoming an integral part of the geomatics workflow. Following the data through the asset lifecycle The role of geospatial information becomes acutely critical when looking at how it moves through the lifecycle of an infrastructure project. From understanding existing conditions and developing a design through to construction, verification and long-term operation, each stage builds on information created before it. It starts with understanding what is already there. Surveyors and geospatial professionals need the right method for the job, whether establishing control and positioning with GNSS and total stations, mapping assets or creating a detailed three-dimensional record of existing conditions. Solutions like those within our Capture Reality portfolio add terrestrial, mobile and handheld options to that toolkit as well. Once the survey and capture methodology is in place, what happens next is just as important. Survey data feeds into design and planning, while design information needs to make its way back to the crews carrying out fieldwork. As construction progresses, measurements and updated information move between field and office, giving teams a current view of the project rather than a series of disconnected handovers. That’s where software becomes an essential part of the surveying workflow. Topcon MAGNET, for example, connects field and office teams by supporting the movement of
project information between data collection, stakeout and the wider project environment. For the larger datasets generated through reality capture, Topcon Collage provides the processing environment, while Collage Web makes that information available to view and work with beyond the survey team. The critical point is that these workflows do not stop at Topcon software. As the project moves into design, connections with established Autodesk and ClearEdge3D environments allow captured information to feed into the tools already used by engineering and design teams. By the point of handover, the geospatial record has developed alongside the asset itself. Verification and as-built information provide asset owners with a reliable record of what has been constructed and, in sectors such as
Even beyond this point, monitoring solutions provide continued observations of movement, deformation and changing conditions, keeping that spatial record current as the asset moves into operation. Rail and tunnelling are good examples of where this continuity matters immensely, with control and alignment during construction closely linked to verification and longer-term monitoring. Our collaboration with Amberg Technologies combines Topcon positioning expertise with specialist rail and tunnel hardware and software across track alignment, tunnel profiling and monitoring. The common thread across these applications is the need for geospatial information to keep its value as the people, systems and requirements around it change. A measurement made at the start of a project can have a role much further down the line, but only if the information remains reliable, accessible and usable by the teams that need it next. Keeping workflows open Viewed in this context, interoperability has become one of the defining challenges of modern geomatics. Very few infrastructure projects are delivered using technology from a single supplier. Surveyors, engineers, contractors, GIS teams and asset owners often work with different instruments, software and data environments, chosen for
A CR-P1 terrestrial laser scanner, part of Topcon’s Capture Reality portfolio.
Issue 4 2026
39
About Topcon For nearly a century, Topcon has been a leading innovator of precision technologies. Its products have transformed infrastructure and agriculture worldwide by harnessing the power of precision through value-added solutions that save time and money, enable better outcomes and build the future of global markets. Topcon Positioning Systems is headquartered in Livermore, California, USA. Its European head office is in Zoetermeer, the Netherlands. Parent company Topcon Corporation, founded in 1932, is headquartered in Tokyo, Japan.
Topcon’s LN-1000i robotic total station set up on site to support construction layout and positioning tasks.
establishing control are different from those of a utility team managing network records or an asset owner monitoring infrastructure, but increasingly the information they work with is connected. A dedicated geomatics function creates the opportunity to look across those workflows rather than at individual technologies in isolation – bringing hardware, software, application expertise and partnerships together around the problems customers are trying to solve.
the particular job they need to do. In many cases, those systems also represent years of investment and established ways of working. A connected workflow therefore has to work across that reality. Customers need to be able to choose the right technology for each stage of the job without creating unnecessary barriers when information moves between them. That principle sits behind Topcon’s approach to open architecture. Connections with established environments including Esri ArcGIS and Autodesk allow information created using Topcon technology to move into the systems our customers already use, rather than requiring an entire project team or organization to work within one proprietary ecosystem. The benefit of that flexibility means less time is spent moving data manually, recreating information or working around incompatible systems, while surveyors and geospatial professionals can remain focused on the areas where their expertise matters most – establishing appropriate methodology and control, understanding the quality of the information being produced and making sure it is fit for the job it needs to do. The technology will continue to evolve, and so will the mix of tools used across projects. Keeping those workflows open gives customers room to adopt new capabilities where they add value without having to rethink everything around them.
40
Issue 4 2026
Capturing and analysing track data with the Topcon and Amberg rail surveying system. Bringing it all together This broader view of geomatics workflows is also what drove Topcon’s decision to establish a dedicated Geomatics Business Unit. Topcon’s roots in geomatics stretch back decades, from optical instruments through to total stations, GNSS, scanning and today’s wider range of positioning and measurement technologies. That experience is now also complemented by reality capture, monitoring, software and a growing number of specialist applications and partnerships. Bringing those capabilities together allows us to support the way our customers are working today. The needs of a surveyor
It also reflects the growing reach of the profession itself. Geospatial information is being used by more people, across more stages of the infrastructure lifecycle, while the standards of precision, control and professional judgement that sit behind it remain just as important. For Topcon, our focus is clear: build on the precision expertise that is, and has always been, at the heart of our business, while making it easier for surveyors and geospatial professionals to connect their work with the people and ecosystems that depend on it. As infrastructure becomes increasingly digital, the quality of information describing the physical world will matter just as much as the ability to collect it. Keeping that information dependable as it moves from survey through design, construction, operation and beyond is where connected geomatics can make a tangible difference.
More information www.topconpositioning.com
Capacity building
Ordnance Survey strengthens Bahamas geospatial capacity with survey kit donation The Bahamas has received a significant boost to its geospatial capabilities, with Britain’s national mapping service, Ordnance Survey (OS), donating 170 field survey kits to strengthen mapping and surveying skills across the country. The equipment donation traces back to a technical exchange visit last year, when officials from the Bahamas National Geographic Information Systems (BNGIS) traveled to the UK and identified a clear need for high-quality survey instruments. That visit set the donation in motion, with the Leica Geosystems kit eventually flown over by the Royal Air Force and welcomed at a handover ceremony attended by the British High Commission, the Bahamas Government and BNGIS. Once in use, the kits are expected to enhance practical training and support ongoing work in surveying, mapping, environmental management, infrastructure planning, disaster resilience and sustainable national development. Growth of the geospatial sector in the Bahamas Zane Lightbourne, the Bahamas’ Minister of Environment and Natural Resources, called the donation a milestone and an investment in people, education and the future of the surveying and geospatial professions. He also pointed to the long history behind the partnership, noting that the relationship between the Bahamas and Ordnance Survey dates back to the early 1950s, when surveying and mapping played a critical role in the country’s national development. He added: “Today, this longstanding relationship continues to support capacity building, knowledge exchange and the growth of the geospatial sector in the Bahamas.” The donated equipment will be distributed by the BNGIS Centre to educational institutions, government agencies and surveying organizations, supporting technical
training, capacity building and the ongoing development of geospatial expertise across the country. The former OS equipment had been replaced by new kit for OS surveyors. The Deputy British High Commissioner Ryan Griffin recognized the contribution of OS and its willingness to share expertise and donate the equipment. He said: “This is an investment in capability, partnership and the long-term development of geospatial expertise in the Bahamas. Partnerships like this demonstrate what can be achieved when expertise is shared, institutions work together and countries invest in one another’s success.” Fit-for-purpose The handover was the result of months of planning and collaboration by OS teams. It was essential that the equipment was fully
configured and fit for purpose in its new role. Donation agreements were established, 170 kits were prepared and packed, and logistics coordinated with the RAF to ensure a seamless transfer. Every receiver, battery and ancillary component was carefully inspected, catalogued and documented, ensuring the equipment arrived safely and ready for operational use. James Norris, head of international affairs at OS, said: “The work that national mapping and geospatial agencies do to produce, develop and share foundational geospatial information is key to national development. This opportunity came at the right time for both BNGIS and OS and is an example of OS’s commitment to sharing knowledge, skills and, in this case, survey equipment with our partners across the globe.”
The Leica Geosystems equipment was flown over by the Royal Air Force and formally welcomed at a handover ceremony attended by the British High Commission, the Bahamas Government, and the Bahamas National Geographic Information Systems. (Image courtesy: Bahamas Government)
Issue 4 2026
41
The underground and above-ground benefits of small, lightweight sensor systems
Creating urban digital twins in GNSS-denied environments By Prof Dr Alexander Reiterer, Fraunhofer IPM
With a growing number of cities worldwide now developing urban digital twins, surveyors are increasingly coming up against the unique challenges of mapping infrastructure that is located underground. It is dark, it is dirty, it is cramped and there is no satellite reception. To address these challenges, researchers at Fraunhofer IPM are leveraging the advantages of SLAM-based navigation, edge computing and miniaturization to develop robot-assisted multisensory systems for collecting geodata for digital twins. Besides offering advantages during underground surveys, advances in autonomous data acquisition, navigation in GNNS-denied environments and miniaturization are also driving progress in above-ground mobile mapping. A significant portion of civilian utility infrastructure is buried underground. Maintaining subway tunnels, sewers and utility shafts, as well as detecting damage in a timely manner, poses a sizable challenge for infrastructure operators. Similar to how smart city models work for above-ground infrastructure, digital twins that contain geodata and other available inventory data are expected to enable the efficient, proactive planning and maintenance of underground infrastructure in the future. However, mapping underground requires sensors and measurement systems that can function without satellite reception, in hardto-reach terrain. The harsh underground environment, with poor lighting conditions and limited space, poses additional challenges. Safe navigation without GNSS How can a measurement system navigate reliably and autonomously in environments without GNSS position data? Simultaneous localization and mapping (SLAM) algorithms make it possible. Based on sensor data, these algorithms generate a map of the surroundings while simultaneously determining the measurement system’s position within that map using information on its spatial geometry. The SLAM algorithms fuse the captured 3D data with the camera images and data from the inertial
42
Issue 4 2026
A four-legged robot carrying Lidar, cameras and other sensors was successfully tested in an abandoned silver mine. Its multisensory system uses SLAM technology to map the environment and detect surface characteristics. (Image courtesy: Fraunhofer IPM) measurement unit (IMU). Real-time data processing and edge computing are key in this process. Researchers at Fraunhofer Institute for Physical Measurement Techniques IPM have developed strategies for semantically enriching measurement data directly within the device, no postprocessing needed. This allows the spatial geometry
to be derived directly and the system’s relative position in its surroundings to be determined. In autonomous operation, this is important for remotely locating a robot’s position, especially if it stops unexpectedly. In addition to SLAM algorithms, machine learning (ML) algorithms, such as
Feature
Cross-sectional view of the 3D point cloud captured inside the mine tunnel. This high-resolution image shows the rock formation’s structure in great detail over a distance of approximately 20m. Cables and the entrance to a side tunnel of the mine are also visible. (Image courtesy: Fraunhofer IPM) reinforcement learning (RL), can be used to enhance a robot’s motion sequences and orientation in unfamiliar environments. RL enables robots to develop efficient motion and collisionavoidance techniques. For instance, the robot can learn to detect obstacles, manoeuvre around them and navigate with greater precision. Furthermore, RL allows adjustments to be made to the SLAM parameters. This enables the robot to adapt to changing environmental conditions, such as temporary obstacles or changing lighting. The issue of navigation in GNSS-denied areas is not confined to underground environments but also applies to densely built-up cities or inside large buildings. This makes SLAM-based localization strategies an important complement to GNSS-based positioning for many mobile mapping tasks. RoboTUNN: autonomous 3D mapping underground To apply SLAM-based strategies for navigation in GNSS-denied environments, a robot-assisted method for the autonomous digital surveying of underground tunnels has been under development since 2024. The method is intended to facilitate damage detection and the creation of digital twins. Some of the research is part of the RoboTUNN project, funded by the German Federal Ministry of Transport. Researchers at the University of Freiburg and Fraunhofer IPM (as an associated partner) are responsible for the measurement hardware, 3D mapping, SLAM-based localization and data processing. They have developed a compact, multi-sensor system that can be installed on robotic platforms. The measurement unit will collect georeferenced data in inhospitable underground environments with no GNSS coverage. The ultimate goal is for the autonomous measurement system to be able to independently map underground infrastructure. Today, inspections are carried out by qualified personnel as part of on-site assessments, sometimes under hazardous conditions. Alongside the sensor technology, strategies are being developed for AI-based data analysis, as well as for the integration of geodata with existing data from various sources, to create a digital twin. Operating autonomously in enclosed spaces places high demands on the sensor system. The system must be robust, lightweight and energy-efficient to avoid exceeding the robot’s maximum payload capacity or limiting the operating range of the carrier platform. At the same time, high measurement accuracy is required to detect even
minor damage to tunnel walls, cables and wires during maintenance monitoring. The RoboTUNN sensor box is equipped with Lidar, RGB cameras, an IR camera, a lighting unit, an inertial measurement unit (IMU) and a processing unit, which enables real-time AI-based data analysis. All these components are housed in a robust case approximately the size of two shoeboxes. The system weighs around 10kg including battery. It features interfaces for low-latency, reliable data communication. A custom-designed protective device shields the sensitive sensors from dust and potential collision damage. Successfully tested In April 2026, the researchers tested an initial prototype of the sensor system on a robot dog at a construction site. The sensors reliably detected cracks, spalling, rust and efflorescence in the concrete. The following month, the sensor-equipped robot dog took its first steps in a disused silver mine in the Black Forest near Freiburg, Germany. The system-mapping algorithm was successfully tested in this GNSS-denied environment and high-resolution 3D data of the tunnel interior was captured. Small, lightweight systems such as the multi-sensor system developed for the RoboTUNN project are essential for autonomous measurement robots. In fact, miniaturization greatly benefits mobile mapping technology in general. Intelligent, autonomous sensor systems will significantly increase the efficiency of mobile mapping in the future as they can operate without specialized staff. Deploying these systems on drones, uncrewed ground vehicles (UGVs), autonomous underwater vehicles (AUVs) or quadrupedal robots opens up new applications for mobile mapping, such as sewer inspection and aerial mapping of large forest areas or major construction sites. Plug-and-play systems for conventional vehicles Small, integrated systems are also creating new opportunities for mobile mapping of roads and railways. The primary drivers are the requirements associated with smart-city initiatives. Cities and municipalities need mobile mapping solutions that can efficiently and easily map urban environments in great detail. At Fraunhofer IPM, this led to the idea of integrating complex measuring technology into a compact sensor unit to be mounted on garbage trucks, buses or taxis. As part of various research projects, the Mobile Urban Mapping
Issue 4 2026
43
The MUM mini is a compact measurement box that is plugged onto the roof of a vehicle. It transforms public transportation and commercial vehicles into mobile mapping platforms that provide real-time geodata for digital urban twins. This allows the urban environment to be recorded at short intervals. (Image courtesy: AWG Wuppertal) System (MUM mini) – a plug-and-play system for conventional vehicles – was developed, eliminating the need for expensive, dedicated measurement vehicles in many cases. The entire sensor array – consisting of two laser scanners, several cameras, a positioning unit, computing and storage devices, and power supply – is housed in a 60×60×40cm3 box. Weighing approximately 20kg, the system can easily be installed on the roof
of any vehicle using suction cups. The MUM mini is currently in use in several German cities for real-time geodata collection. Portable real-time, SLAM-based laser scanner for building surveying Handheld Lidar camera systems are useful for surveying construction sites and buildings in 3D, both indoors and outdoors. A compact, lightweight design is especially important here, and so are intelligent
positioning solutions. As part of the Bau DNS research project, Fraunhofer IPM is developing a portable 3D sensor system for building surveying. The measurement data will be incorporated into digital twins of buildings and will enable the industrial prefabrication of facade elements, among other things. The portable scanner system integrates multiple cameras, a Lidar module, an inertial measurement unit, GNSS, a barometer, a processing unit and a wireless module into a compact, lightweight system. It captures buildings with millimetre-level accuracy from a distance of several metres and delivers reliable measurement results regardless of lighting conditions. The scanner will be the first device on the market that can process, semantically enrich and reduce measurement data in real time directly within the device. Based on the data analysis, the system continuously performs completeness and error checks to avoid time-consuming repeat measurements. Further information Fraunhofer IPM will present mobile mapping technologies at Intergeo 2026 in Munich, Hall B5, booth I010.
The data collected by the MUM mini sensor system is evaluated and classified in real time. AI is used to semantically enrich the 2D and 3D data. Each colour represents a different object class. (Image courtesy: Fraunhofer IPM)
44
Issue 4 2026
Feature
About the author Prof Dr Alexander Reiterer is a professor at the University of Freiburg and head of the ‘Object and Shape Detection’ business unit at Fraunhofer IPM. His research focuses on optical measurement technology, 3D imaging, artificial intelligence, digital twins and laser-based measurement systems for industrial, scientific and environmental applications.
AI-based segmentation identifies specific object classes, such as windows, doors and walls, using a trained artificial neural network. Simple object representations are extracted from the raw data within the device so that only a reduced dataset is transferred via Wi-Fi or 5G to the cloud or a building information modelling (BIM) model. These datasets are visually processed in real time and can be used directly on the construction site. Satellite signals are often unavailable indoors or in densely developed areas. Therefore, in addition to GNSS positioning, this portable system also relies on SLAM for position determination. By fusing image and GNSS data, the system can determine its position in real time with an uncertainty at the centimetre level and less than 200ms latency. Immediately available semantic information improves this SLAM-based positioning by distinguishing between static and moving objects. Researchers are currently testing an initial prototype under real-world conditions. Conclusion Creating digital twins can improve the efficiency and costeffectiveness of infrastructure planning and monitoring. This applies to both above-ground and underground infrastructure. Sensor systems for mapping underground structures must be compact, lightweight and robust. Ideally, they are operated on autonomous platforms. Lighting and space constraints, as well as poor satellite reception, require innovative solutions for optics and navigation. Mobile mapping solutions for such challenging environments also benefit traditional mobile mapping on roads, railways and from the air.
Further reading MUM mini: https://www.ipm.fraunhofer.de/en/presspublications/press-releases/sensor-box-mobile-mappinginfrastructure-monitoring.html Digital twin project: https://smart.wuppertal.de/beteiligung/ forschungskooperation-digital-zwilling-2024.php Bau DNS: https://www.ibp.fraunhofer.de/en/projects-references/ flagship-project-bau-dns.html https://ipm.fraunhofer.de/en https://uni-freiburg.de/tf-inatech-mls-en/
Explore CHCNAV reality capture solutions at Intergeo 2026 Meet CHCNAV at Intergeo 2026 and explore the RS10 and RS7 handheld 3D laser scanners. The RS10 combines GNSS RTK, Lidar and visual SLAM for georeferenced indoor and outdoor surveying, while the RS7 delivers high-rate Lidar capture, ultra-wide coverage and reliable SLAM performance for building and interior applications. See how CHCNAV connects fast reality capture with efficient 3D workflows. Visit CHCNAV at Hall C, Booth D149 in Munich, 15-17 September 2026.
Explore CHCNAV reality capture solutions
Issue 4 2026
45
How geohistorical archives can strengthen land administration
Historical layers adding value to digital cadastres By Durk Haarsma, Paula Dijkstra and Claudia Lindner
Across the Global South, digital cadastres are being built. Maps, deeds and survey records that could fill the gaps already exist, albeit scattered across colonial repositories, national archives and university collections. Bringing them into modern land information systems could accelerate land rights registration, deepen inclusivity and preserve cultural heritage at the same time. The missing link lies in a new type of collaboration: between land registries and the world of digital humanities. A four-phase conceptual framework called the Historical Geo-Information Integration Method (HGIIM) is proposed to help institutions identify, assess and digitize geohistorical material for integration into digital land administration. Land administration in the Global South increasingly depends on digital cadastres and land information systems (LIS) to deliver secure, inclusive and transparent land rights. But a system is only as reliable as the records beneath it, and in many countries those records are thin. Cadastral archives often exist only on paper, held in conditions of heat and humidity that give them a short and
uncertain shelf life. Kadaster International (KI), the international branch of the Dutch Land Registry, has been investigating a proposition that reframes this problem – one in which geo-relevant historical archive material serves not as a curiosity, but as a genuine, value-adding source layer for building and improving land administration systems.
In this case, ‘relevant’ material means cadastral maps, title deeds, survey records and related documents pertaining to land rights. In much of the Global South, these sources remain undigitized. Digitizing them – both an organization’s own archive and supplementary sources held elsewhere – can contribute to faster and more inclusive registration. The catch is that doing this well requires expertise that land registries do not usually hold in-house, but is instead found in the fields of history, digital humanities and digital cultural heritage. That interdisciplinary bridge is, at present, almost entirely missing. Spatial turn meets historical turn To understand why the time is now ripe, it helps to look at what has been happening within the humanities. Over recent decades, a ‘spatial turn’ has reshaped historical and social-science research. Geographical data is now routinely used to analyse social and historical phenomena, enabled by GIS and related digital tools. Alongside it, the interdisciplinary field of humanities has matured technologically, applying digital solutions to traditional humanistic questions, and a sub-field of digital cultural heritage has grown up around digitizing heritage material for both research and preservation purposes.
Historical map of new plots that were to be allocated around Marchals Creek in the Dutch colony of Suriname in 1696, georeferenced and published on Allmaps.org.
46
Issue 4 2026
The intersection of these fields is sometimes called the ‘spatial humanities’, where enriched databases, the spatial component
Feature As recently as the 1960s, 1970s and 1980s, maps and deeds were still being produced that exist in no digital form at all, and in some countries paper archiving remains the norm even today. Together, these scattered archives form a network of invaluable information that is not yet accessible, visible nor connected. The urgency is physical as much as intellectual. Some of this material is exposed to extreme heat and humidity, particularly in tropical regions, and there is a real danger that supplementary information will be lost for good. The European Union recognizes the digitization of cultural heritage as a value-adding economic activity – a stance that is in sharp contrast to the approach on much of the African continent, where funds are scarce and digitization priorities lie elsewhere. Rapid, efficient digitization could partially unlock and connect this network, contributing to more land rights for citizens, better insight into historical land use and, ultimately, greater prosperity and equality.
Cadastral map of Batavia in the Dutch East Indies (now Jakarta, Indonesia). From the Dutch Kadaster, 1904, scale 1:20,000. of historical sources, and visualization sit at the centre of enquiry. Across faculties in universities everywhere, researchers studying gender equality or economic history have become heavy users of digitized map material. Traditionally, land registries have never thought to call these kinds of institutions. Herein lies an opportunity. If humanities scholars are increasingly drawn to spatial sources, and land registries increasingly need historical depth to substantiate rights, the two are looking for versions of the same thing from opposite directions. Digitized historical maps and deeds are obvious sources for reconstructing land rights – provided they are analysed carefully and subjected to rigorous source criticism. In other words, the spatial turn in the humanities could be met by a historical turn in cadastres, and each could strengthen the other. Why archives are at risk An immense volume of relevant material sits in archives around the world. It includes cadastral maps, title deeds, topographical maps at various scales, aerial photographs, and even orally transmitted descriptions of ownership. Such sources can supplement missing data in a new digital cadastre in concrete ways: they may record boundaries that have remained stable, indicate previous ownership, provide landmarks for georeferencing, or preserve textual descriptions of plot boundaries as they applied to indigenous populations. Much of this material is held in the archives of former colonial powers – the National Archives in the Netherlands and the British Library are prominent examples – as well as in local archives across Indonesia, India and British Africa, and in collections spanning both colonial and post-colonial periods in Asia and South America.
Remaining critical: not all history is usable Such work should be performed with some caution, because not all historical material is automatically suitable for a database that will underpin legal rights. For many areas in the Global South, the colonial period was the first time map material was produced and preserved at scale. That material demands a critical approach, because colonial maps were by definition instruments intended to consolidate power rather than protect the rights of indigenous populations. Another important point for consideration is the ‘silence of the archives’; one should question why material is absent and what those gaps signify. The silence may also extend to the systematic absence from official records of women, indigenous peoples and farming communities – precisely those groups for whom registration is now most critical. There is also an optimistic aspect to the use of material stemming from colonial times. Research on the stability of borders in British Africa, conducted by University of Groningen together with the London School of Economics, found that boundaries at national and municipal levels have remained surprisingly stable over the years, despite having been drawn to serve colonial power. That stability suggests much of the material, down to plot level, can be genuinely useful. The lesson is not to discard colonial records, but to view them critically. Intrinsic value must be weighed alongside collective memory, customary law, continuity of governance, official language and border stability before anything is integrated into a live system. The technology is already shared One of the more encouraging findings from Kadaster International is how little new technology this actually requires. Academic and cadastral digitization projects already use much of the same hardware and software; the gap is organizational, not technical. What is missing are the international repositories that would connect disparate efforts. Projects are rarely linked, and researchers routinely reinvent methods for handling stored spatial information with little knowledge of the land-registry world. On the cadastral side, the capability is advancing fast. Specialists at the Dutch Land Registry are global leaders in digitization and the application of artificial intelligence to legacy map material. KI has direct experience from projects in Armenia, Jordan and Bangladesh
Issue 4 2026
47
where digitizing paper registries formed part of strengthening land rights. Two examples show what cross-domain collaboration can produce. In West Bengal, India, a set of colonial maps around Haldia was digitized and combined with satellite imagery and GPS measurements to establish a land information system. In Austria, researchers trained deep-learning models on the 19thcentury Habsburg Franciscan cadastre to extract large-scale data, enabling them to identify historical building locations and helping government agencies flag culturally sensitive regions. Each case points the same way: digital humanists want cadastral material for research, while cadastral authorities in the Global South need help with digitization. That is an unusually clean basis for exchange. A toolbox for institutions: the HGIIM method To turn this from an argument into a practice, the study proposes a conceptual framework – a collaborative toolbox designated the Historical Geo-Information Integration Method (HGIIM). It is designed to help institutions in the Global South identify, assess and digitize geohistorical material for integration into digital land administration. It is organized into four phases: • Phase 1: Research, assessment and planning The first phase is systematic research into available source material: historical cadastral maps, surveying registers, field books and sketches, alongside current sources such as existing GIS datasets, topographical maps and aerial photographs. Inventories are carried out on location and at external institutions using established archival methods. Standardized assessment forms cover provenance and dating, physical condition, format, content relevance for cadastral purposes, and juridical and contextual value. A project-scope calculator then helps estimate time, cost and capacity based on archive volume, physical state and the processing steps required. • Phase 2: Partnership and funding The second phase builds partnerships with national archival services, universities and research institutes, international organizations such as UNESCO and the World Bank, and specialized heritage bodies. It also opens funding routes that cadastral
48
Issue 4 2026
Dashed lines are detected by AI on a map of Ikole in the southwest of Nigeria. From Federal Surveys, Nigeria, held at the University of Wisconsin Libraries, Madison, WI, 1966, scale 1:100,000. projects rarely reach on their own. Because the work bridges land administration and digital cultural heritage, it can tap into heritage funds, EU programmes and development banks that support digital preservation but would never finance a land
registry directly. That co-financing potential is a practical advantage of this approach. • Phase 3: Digitization and processing The third phase is the digitization and data-processing workflow itself. A hardware
Further reading This article is based on a paper presented at the FIG Congress 2026 in Cape Town, South Africa. Bodenhamer, D.J., Corrigan, J. and Harris, T.M. (Eds.) (2010). The Spatial Humanities: GIS and the Future of Humanities Scholarship. Indiana University Press. Femenia-Ribera, C., Mora-Navarro, G. and Santos Pérez, L.J. (2022). Evaluating the Use of Old Cadastral Maps. Land Use Policy, 114, 105984. Göderle, W.T., et al. (2024). Deep Learning for Historical Cadastral Maps and Satellite Imagery Analysis: Insights from Styria’s Franciscean Cadastre. Digital Humanities Quarterly, 18(3). Hagemans, E., et al. (2022). The New, LADM-Inspired Data Model of the Dutch Cadastral Map. Land Use Policy, 117, 106074. Lindner, C., et al. (2023). The SmartLandMaps Approach for Participatory Land Rights Mapping. Land, 12, 2043. Rodima-Taylor, D. (2021). Digitalising Land Administration: The Geographies and Temporalities of Infrastructural Promise. Geoforum, 122, 140–151. Zaagsma, G. (2023). Digital History and the Politics of Digitisation. Digital Scholarship in the Humanities, 38, 830–851.
Feature package might combine mobile document scanners for fragile papers with large-format camera systems for oversized materials, multispectral imaging for faded or damaged documents, and calibration tools. A GIS-ready software suite then supports historical georeferencing, AI-based extraction of potential cadastral boundaries, OCR and handwriting recognition, and document management. The sequence runs from digitization, through processing and analysis using OCR and AI, to GIS visualization and integration. • Phase 4: Evaluation and adjustment The final phase evaluates the quality, completeness and applicability of the results, adjusting processes for subsequent projects where needed. The toolbox is accompanied by a handbook covering implementation guidelines, case studies, contextual research templates, stakeholder engagement, juridical frameworks, and training modules spanning technical skills, historical context and sustainable management. What to expect and what to watch Linking digitized archive material to modern cadastral data can lead to faster development of a land information system, better historical substantiation of land rights, and more inclusive administration that accounts for the rights of indigenous groups and women. The reasons for caution are equally real, and they are the same ones that make source criticism indispensable: certain groups lack representation in official sources, colonial data carries inherent bias,
About the authors Durk Haarsma is director of strategy & business development at Geomares and publisher of GIM International. He is also the Historical Insights Architect, providing strategic historical policy advice at the intersection of digital humanities, land administration and specialized media. Paula Dijkstra is director of Kadaster International, co-chair of the UN-GGIM Expert Group on Land Administration, and chair of the FIG Task Force on the Sustainable Development Goals (SDGs). Claudia Lindner is land administration advisor at Kadaster International, with expertise in participatory land rights mapping and geospatial technologies.
gaps in an archive require careful interpretation, and even periods of apparent data abundance have their own contextual baggage. None of these are arguments against using historical material; they are arguments for handling it methodically, and with the application of fit-for-purpose logic. Even when only limited material is available, it is still better than nothing, provided its limits are understood. The collaboration is the point The preliminary conclusion is straightforward: carefully selected and critically assessed geohistorical material can help accelerate the establishment of land registries in the Global South. But simply pouring available data into a system – even where funds and donors exist – is not enough. Assessment must come first, and it must be embedded in the methodology so that no step is skipped.
Map of Apomu, in the southwest of Nigeria. From Federal Surveys, Nigeria, digitized and archived at the University of Wisconsin Libraries, Madison, WI, 1966, scale 1:100,000.
The stronger recommendation is to reach beyond the boundaries of one’s own field and region. Faculties and institutes in the Global North are hunting for spatial data to support historical, economic and social research; land registries in the Global South are trying to expand their digital base to secure rights for citizens. That is where the win-win lies, and where funds can be unlocked that neither side could access alone. Linking digital cadastres to digital humanities initiatives points toward a fit-for-purpose, historically grounded model of land administration that strengthens rights, preserves heritage and contributes to the UN Sustainable Development Goals. The next steps are partnerships between universities and archives, the identification of suitable funds and development banks, a central accessible repository for geohistorical cadastral material, and pilot projects to test the toolbox in practice.
Issue 4 2026
49
From GeoAI to collaborative intelligence
Beyond the map By Dr Ahmed Abukhater
GeoAI is rapidly becoming one of the most important advances the geomatics industry has seen so far. However, its true value lies not in replacing human decision-making, but in augmenting it. The future of innovation extends beyond artificial intelligence toward collaborative intelligence, where human expertise, geospatial intelligence, real-time data and AI work together to support better operational decisions.
For decades, the geomatics industry has focused on capturing, managing and visualizing the physical world. From paper maps to GIS, remote sensing and digital twins, our industry’s mission has been to help organizations understand where things are and how they relate to one another, with some analytical tools to depict patterns and look for relationships. Today, however, a more profound transformation is underway: the evolution of geospatial artificial intelligence (GeoAI) into a broader ecosystem of collaborative intelligence. From maps to actionable intelligence The first era of GIS focused on mapping, visualization and data management. Organizations invested heavily in building spatial infrastructure providing digital representations of the world and improving access to spatial information. As GIS matured, the industry began to realize that it was not sufficient to merely create and publish maps. The real value of geospatial technology lies in its ability to unravel relationships, patterns and context that traditional systems otherwise could not. This evolution gave rise to location intelligence, where geography became a strategic asset rather than simply a visualization tool. There was a remarkable shift from displaying information to generating actionable intelligence by bringing data to life to connect people, places and activities. Organizations increasingly used geospatial technologies to support planning, infrastructure investment, emergency management, customer analytics and operational decision-making.
50
Issue 4 2026
From planning 2.0 to collaborative intelligence More than two decades ago, I argued that the future of planning would depend on what I called ‘Planning 2.0’: a collaborative environment where governments, businesses, citizens and stakeholders could participate in evidence-based decisionmaking. The objective was never to create better maps. The objective was to create a better environment for truly inclusive and collaborative decisions. Planning 2.0 recognized that intelligence and valuable knowledge is distributed among communities, citizens, subject-matter experts and decision-makers. In addition, it advocated for geospatial technologies to provide the common operating picture that allows these perspectives to be exposed, accessed, shared and amplified to better understand complex challenges. This concept remains as relevant today as it was then. Although technology has evolved since then, the idea remains the same: it seeks to transform data into intelligence, and
intelligence into collective action. What we increasingly call ‘collaborative intelligence’ today is a natural evolution of those early Planning 2.0 principles. The rise of cognitive infrastructure Today, we are witnessing the emergence of a new generation of systems that continuously perceive, analyse, simulate and learn from the environments in which they operate. I refer to these systems as ‘cognitive infrastructure’. Cognitive infrastructure combines GeoAI, digital twins, Internet of Things (IoT) sensors, cloud computing, simulation models and operational systems into a unified decision environment. Unlike traditional information systems that simply record events, cognitive infrastructure helps organizations anticipate events before they occur and evaluate alternative courses of action for optimization of outcomes. Evidence of the success of this approach has already been seen across multiple domains. During major disasters such as Hurricane Harvey, geospatial analytics, predictive modelling and collaborative decision-support
Perspectives
About the author
environments were used to help communities better understand evolving risks, prioritize resources and improve situational awareness. Utilizing integrated multi-modal emergency communication systems and targeted evacuation strategies, these communities relied on location intelligence to transform information into coordinated efforts to save precious lives that depended on timely decisions. These principles have also been applied in smart manufacturing, where sensor fusion combines vision systems, vibration monitoring, thermal imaging and IoT telemetry to create a common operating picture that provides real-time operational awareness. With the help of digital twins and AI models, it has become possible to identify anomalies before failures occur, optimize production throughput and support just-in-time operations. The goal was not to replace human operators, but to enhance their ability to make informed decisions in increasingly complex environments. In aviation, these cognitive systems can be similarly deployed to support predictive maintenance, operational optimization and disruption management. This has helped airports and airlines integrate geospatial intelligence, operational data and AI to improve passenger flow, optimize asset utilization and enhance resilience across highly complex and dynamic operational environments. In all these seemingly different applications, geospatial intelligence remains the common foundation. Location provides the context that integrates data, people and systems to better connect relationships, delineate outcomes and coordinate action.
Dr Ahmed Abukhater, PhD, GISP, AICP, is the founder and president of Digital Cities and professor at the University of Washington, USA. An award-winning author and TED speaker, he is an architect, environmental scientist and urban and regional planner by trade, renowned for his pioneering work in geospatial intelligence, aviation, smart cities, urban planning, digital transformation and AI-enabled decision systems. His groundbreaking work has been adopted by governments, corporations and academic institutions across every continent.
Beyond GeoAI The excitement surrounding GeoAI is well deserved. GeoAI is transforming how we analyse spatial data, identify patterns and generate insights at unprecedented speed and scale. It is a truly remarkable transformation. However, its greatest value can be unlocked when it is integrated with human intelligence, institutional knowledge, operational systems and community participation. The future will not be defined by autonomous systems making decisions independently of people. The most successful systems will augment human capabilities rather than replace them. They will help planners evaluate alternatives, support emergency managers during crises, assist engineers in optimizing infrastructure and enable leaders to make better-informed decisions grounded in real community input. GeoAI is transforming how we understand the world. Cognitive infrastructure is transforming how we manage the world. Collaborative intelligence is transforming how we decide the future of the world, here and now. For the geomatics profession, this represents both an opportunity and a responsibility. Our role is demonstrably expanding beyond mapping and spatial analysis. We are becoming choice architects of the decision environments that will shape the future of our cities, industries and societies. The future of geomatics will not be defined by maps, digital twins or artificial intelligence alone. It will be defined by our ability to transform geospatial intelligence into collaborative intelligence – enabling people, organizations and intelligent systems to make better decisions together, rather than replace one another.
Issue 4 2026
51
Real value lies not in data itself, but in what can be done with it
Making AI-enhanced geospatial intelligence accessible and actionable By Wim van Wegen, GIM International
Whereas the challenge in geospatial applications used to be data scarcity, today it is data overabundance. Success no longer depends on capturing more information, but on making it intelligible and actionable – and that is precisely why XphereLab has been built. Developed in Colombia by Cuatro Conceptos, XphereLab intensively utilizes geospatial data for tackling complex territorialplanning challenges and strategic decision-making. It translates questions posed in natural language into verifiable geospatial queries, turning complex data into maps, indicators and analysis that any stakeholder – from field technicians to local mayors – can interpret and apply in practice. At Cuatro Conceptos, data is the starting point, not the end goal. The true value of data is only unleashed when it is transformed into actionable knowledge that supports informed decisions about the territory. Planning and managing projects in a complex world requires more than data collection. Geospatial data must be turned into practical intelligence that helps anticipate scenarios, optimize processes and support decisionmaking across areas including land-use planning, engineering and infrastructure, cadastre, public utilities, environment and disaster risk management.
Every project begins with an assessment of the client’s objectives and requirements. This involves identifying the problem to be addressed, understanding its context, defining the intended use of the results, and determining the information needed to support decision-making. In many cases, clients require more than a standalone dataset or product; they need geospatial information that can be integrated into planning, operational or management processes. This project-driven approach enables Cuatro Conceptos to develop solutions that combine geospatial data, technology and domain expertise.
The XphereLab platform enables smarter, faster territorial planning through geospatial data, interactive visualization and AI.
52
Issue 4 2026
One example of such a solution is XphereLab. It intensively utilizes geospatial data for tackling complex territorial-planning challenges and strategic decision-making. To support disaster response, for example, it can instantly identify how many homes fall within a 100m buffer zone of an affected area and locate the nearest hospitals. By providing this information immediately, it relieves emergency responders of the need to gather data manually, allowing them to focus on assessing the situation and mitigating risk. Natural language XphereLab has been developed in response to a shift in the data landscape in Colombia. Two decades ago, the biggest challenge in the nation’s geospatial sector was obtaining reliable data. High-resolution satellite imagery was prohibitively expensive, and aerial photography was largely limited to the Agustín Codazzi Geographic Institute (IGAC), Colombia’s national mapping institute and one of the leading reference bodies in Latin America. Today, the challenge is the opposite; huge volumes of geospatial data are continuously generated by satellites, drones, aircraft, sensors and mobile devices. The question is no longer how to acquire information, but how to turn vast datasets into knowledge that supports better decisions.
Feature software. It was powerful, but so complex that only specially trained geospatial professionals could operate it. Through those experiences, he realized that the limiting factor in geospatial work was rarely a shortage of data, but rather the inability of non-specialists to make sense of what was available. Cuatro Conceptos has been shaped by not only these insights, but also by his ongoing relationship with Leica Geosystems, including the Leica TerrainMapper and Leica CityMapper sensors. In fact, acquiring the CityMapper prompted investment in an aircraft to carry it – a step that marked a turning point for the company’s airborne capabilities. Sensor quality makes a huge difference, according to Bolívar. Up until recently, he could only describe that difference to clients and partners. Today, thanks to XphereLab, he can use his mobile phone to show direct, side-by-side comparisons of imagery captured by a consumer drone against imagery from a CityMapper sensor.
Cuatro Conceptos operating an airborne sensor from Leica Geosystems.
Lidar and orthophotos For Fredy Bolívar, Cuatro Conceptos’ decision to build its operations around Hexagon and Leica Geosystems technology is linked not only to sensor performance but also to openness. He values systems that allow users to understand, adapt and extend the technology, rather than operating as a closed ‘black box’. This approach has supported the company’s R&D&I Unit in developing new methodologies and applications adapted to Colombia’s diverse geographic and operational challenges.
Moreover, as geospatial information becomes relevant across disciplines – ranging from engineering and agriculture to healthcare and public administration – the ability of translating data into practical answers has become increasingly important. Therefore, rather than focusing on data collection, the XphereLab platform is designed to help users explore and analyse geospatial information using natural language. Questions are transformed into concrete spatial operations, such as intersections, filters, area calculations or distances, executed directly on the underlying database. Behind the scenes, the system performs complex queries and geoprocessing tasks, making advanced spatial analysis accessible to specialists and non-specialists alike. Sensor quality makes a difference Before starting Cuatro Conceptos with his brother Edwin, Fredy Bolívar worked at the IGAC. His relationship with Leica Geosystems dates back roughly a decade, beginning with a GPS400 receiver running SKI-Pro, the commercial version of the scientific Bernese
Capturing data over the Ituango Hydroelectric Dam at 14,000ft (4,267m), in the mountainous terrain of Antioquia, Colombia.
Issue 4 2026
53
How XphereLab works Unlike systems such as Gemini or ChatGPT, the XphereLab AI is designed not to invent answers, according to the developers. That distinction is very important. If the available information isn’t clear or isn’t sufficient, the system won’t try to generate a plausible response. If it doesn’t know the answer, it simply says “I don’t know”. This allows the user to look for additional data and clarify the information before making a decision. That is critical, especially for governments and other organizations that rely on accurate information. For example, someone could ask the system “How many two-storey houses are there in my community?” If the necessary data exists about specific neighbourhoods, the AI will answer that question. But if someone asks “What colour is the bathroom in that building?” and reliable information is not available, the AI won’t make up an answer. Instead, it will say “I don’t have that information. We need more data to answer that question.” It is a significant advantage that the system doesn’t provide generic or fabricated answers, because it means users can trust that the responses are based on actual data. Another important benefit is that the platform is highly transferrable. The software does not need to be rebuilt for deployment in another region or country. The framework remains the same; it simply requires relevant local data, whether from Colombia or elsewhere. Therefore, the solution is scalable and can be expanded to serve different countries and communities.
Today, Cuatro Conceptos operates a fleet of three twin-engine aircraft equipped with TerrainMapper and CityMapper sensors. The company combines these technologies with its own Lidar ground control point methodology, developed for both urban and rural applications and validated by the IGAC, allowing accuracy verification. The acquisition strategy is adapted to each environment. In urban areas, CityMapper integrates Lidar, multispectral imagery and oblique photography to generate
54
Issue 4 2026
Lidar data captured with Leica CityMapper in Colombia. detailed 3D representations of buildings, infrastructure and urban density. In remote regions such as the Amazon, Guaviare and Vaupés, TerrainMapper enables efficient coverage of large areas with complex topography. Capturing Lidar data in Colombia’s mountainous and high-altitude environments requires technical and also operational challenges to be addressed. Steep slopes and complex terrain demand precise flight planning and careful control of point density to ensure accurate representation of the landscape. Missions must be supported by flight strategies designed to improve efficiency and safety. Flight operations at higher altitudes reduce exposure to risks in areas where physical access may be difficult or ground access may be restricted in security-sensitive areas. Accessible, operational intelligence The company recognizes that a point cloud, a digital terrain model and an orthophoto possess fundamentally different structures, resolutions and query mechanics. Therefore,
XphereLab does not attempt to force all geospatial inputs into a single data model, but instead stores each dataset in the optimal processing format. The platform then unifies how these assets are organized, georeferenced, documented and published within it. A key distinction lies in separating the source file from the visualizationoptimized product. The original dataset is preserved intact for deep analysis, quality control or reprocessing, whereas the viewer sees a streamlined version engineered for efficient consumption. This guarantees spatial accuracy without overloading the user’s hardware. When it comes to standards, rather than imposing a single schema, XphereLab adopts interoperable principles: clearly defined coordinate reference systems, complete metadata, spatial tiling, levels of detail (LODs) and standardized geospatial web services. The distributed storage and publishing infrastructure serves up massive datasets rapidly and transparently, even
XphereLab makes geospatial data easy to explore with AI and natural language, with every answer grounded in verified data.
Feature
About Cuatro Conceptos and XphereLab Cuatro Conceptos is a consulting firm specializing in geospatial solutions, with operations across Latin America. The company focuses on the production of cartographic products, the management and transformation of geographic information, and the development of technologies that support territorial planning and spatial decision-making. Its portfolio includes cartographic projects covering roughly 300,000km, alongside technical support for initiatives in land-use planning, water resource management, multipurpose cadastre, disaster risk management, geodesy, software development, and AI-powered geospatial applications. The company has also been involved in the implementation of Continuously Operating Reference Stations (CORS).
Pre-flight inspection of a Leica TerrainMapper’s optical assembly. on mobile devices. However, the platform’s true value lies not just in storing robust data, but in staging it so that each user receives only the specific information required at any given moment. In other words, XphereLab transforms complex inputs – point clouds, orthophotos and digital terrain models – into accessible, operational intelligence for land management. Anchored in real data XphereLab balances two essential principles: allowing users to interact with geospatial information through natural language while ensuring that responses are generated exclusively from verified data. It does not replace the quality standards and validation processes that have long defined professional GIS environments. Reliability still rests on three pillars: information quality, a wellstructured database, and professional review. Artificial intelligence does not exempt anyone from professional judgment, according to Bolívar; it merely raises the stakes for getting the data right. If XphereLab is fed with outdated or flawed data, it has the same risk of getting things wrong as any other geospatial system. The company helps decision-makers by structuring and cleaning client data first, so that parcels, neighbourhoods, hazard zones and land use regulations relate to one another exactly as institutional definitions require.
Over the past decade, Cuatro Conceptos has grown from a consulting firm into a Technological Development Center. Backed by a specialized team of over 150 professionals, it has operational capabilities unique to Latin America (including its own aircraft equipped with imaging sensors, laser scanners and multibeam systems), and a research output spanning scientific papers, books and patents. The Research & Development & Innovation (R&D&I) Unit is a strategic pillar of Cuatro Conceptos, which is officially recognized by the Colombian Government as the sole corporate actor in the national science and technology ecosystem for cadastre. This recognition validates the company’s capacity to lead innovation in this highly specialized field that is critical to territorial development. The unit is led by an executive management team coordinating eight PhDs and twelve Master graduates in geomatics and geography, backed by a research incubator built on partnerships with leading universities. Thanks to these partnerships, undergraduates and graduate students can do internships and theses in a real-world corporate setting, thus strengthening knowledge transfer and talent development. Grounded in applied research and technological development, the R&D&I Unit not only drives internal innovation, but also helps national governments build new methodologies, geospatial products, software and patented tools. The goal: providing practical answers to everyday land-management challenges, and strengthening the position of Cuatro Conceptos as a technical and scientific benchmark in geospatial science. A key component of Cuatro Conceptos’ activities is XphereLab, a geospatial platform developed in Colombia to support the analysis of complex territorial challenges. The platform combines geospatial data management with artificial intelligence (AI) to enable the visualization, querying, extraction, geoprocessing and three-dimensional analysis of geographic information. It also facilitates the integration and digital modelling of data from multiple sources, improving interoperability between datasets, technologies and systems. Through XphereLab, users can manage, integrate and analyse large volumes of geospatial information within a single environment. The platform is used to support decision-making in areas including infrastructure management, territorial planning, engineering, environmental management and disaster risk assessment, providing organizations with data-driven insights for planning and operational activities.
Issue 4 2026
55
By connecting previously isolated datasets, normalizing indicators and automating spatial analysis, XphereLab allows users to move directly from a planning question to an informed answer. Instead of manually creating spatial intersections, database joins or territorial analysis, users can focus on interpreting results and making decisions. However, while AI lowers the technical barrier to asking the question, it does not lower the bar for the answer. When the required information is not available, the platform does not generate assumptions or ‘plausible text’. Every answer can be traced back to the map, the records and the calculations behind it. If a user asks something the system cannot verify, it does not improvise; it returns an error or identifies the available data and guides users toward more relevant queries (see box). Towards smart territories The platform was originally designed to address challenges common to cities across Latin America, but the company has ambitions to expand its reach internationally. Its flexible architecture allows it to be adapted to different institutional and regulatory contexts without requiring a redesign of its core structure. Its technology-independent approach enables integration of diverse sources, including cadastral databases, Lidar, imagery and other geospatial datasets. Local adaptation focuses primarily on configuration, terminology and administrative rules, allowing the same analytical framework to support applications ranging from urban management and infrastructure monitoring to risk management and territorial planning.
The Cuatro Conceptos team.
56
Issue 4 2026
About the author Wim van Wegen serves as head of content at GIM International. An experienced editor and writer in the geospatial and hydrographic industries, he regularly contributes columns and feature articles, and speaks with renowned experts in the field.
The future of Cuatro Conceptos and XphereLab is guided by a clear mission: turning data into decisions, and decisions into smart territories. Having evolved over two decades, the company firmly believes and has proven in an innovative way that true value lies not in accumulating more information, but in making it accessible, verifiable and actionable for those tasked with critical landmanagement decisions. Cuatro Conceptos is actively developing new applied AI modules focused on predictive analysis, scenario simulation and automated risk management. These tools aim to forecast trends and support strategic planning across infrastructure, mobility, environmental conservation and climate resilience. Its objective is clear: to serve as bridge between technical complexity and executive decision-making throughout Latin America and beyond, aimed at democratizing access to geospatial intelligence and putting it at the service of communities, public authorities and strategic sectors.
Sponsored article
How BeeXact used automated mobile data collection and precision positioning to map Italy’s fibre network at scale
The role of mapping in digitizing a nation When a telecoms operator decides to upgrade the fibre-optic network running adjacent to a country’s road network, the first question is not ‘How do we build it?’, but ‘Where is everything now?’. In Italy, a country with one of Europe’s densest and oldest road networks, that question turned out to be a genuinely enormous undertaking – the kind of project that separates ambitious infrastructure mapping companies from merely capable ones. BeeXact, a Dutchbased mobile mapping specialist, is one of the companies that took it on. It did so by rethinking not just what data it needed to collect, but how it could collect that data fast enough, accurately enough and consistently enough to matter. The scale alone makes the Italian project remarkable. BeeXact was contracted to locate and classify fibre-optic infrastructure across Italy’s entire road network – a brief that, on paper, sounded almost impossibly broad. In practice, it meant putting more than 80 mapping vehicles on the road, five days a week, each one bristling with Lidar sensors, 360-degree cameras and precision positioning hardware. It all worked in concert to capture a continuous, centimetre-accurate picture of the country’s infrastructure corridor by corridor, street by street.
The problem with scale It is easy to underestimate how much harder a mapping project becomes once it involves 80 vehicles. A single, well-equipped survey vehicle, driven by a skilled technician, can produce excellent results almost by virtue of careful attention. But scale that up to a fleet and the entire calculus changes. Suddenly the project is not really about whether any one sensor can deliver accurate data – it’s about whether the whole system can deliver consistently accurate data, reliably, day after day and regardless of who is behind the wheel. That was the core challenge facing BeeXact. The company needed a positioning solution capable of delivering high-accuracy data over enormous distances, while also being simple enough to operate
A Lidar point cloud.
Issue 4 2026
57
reliably across a large fleet – much of it staffed by non-specialist operators rather than dedicated surveying experts. On top of that, the raw data volumes involved in a project of this size are staggering. Managing, synchronizing and processing that much information – from onboard cameras and Lidar units running continuously across dozens of vehicles – required more than good hardware. It required an entirely automated data pipeline capable of turning terabytes of raw sensor data into usable, classified infrastructure maps, without manual intervention slowing everything down. Sensor synchronization posed its own headache. Lidar and camera data is only as useful as the positioning information that ties each point and pixel to a precise place on the map. If the timing between sensors drifts even slightly, the result is misalignment: objects appearing doubled or blurred in the point cloud, a problem surveyors sometimes call ‘double vision’. At the scale BeeXact was operating on, that kind of error – multiplied across 80 vehicles and months of data collection – could have derailed the entire project. Building the solution To meet these challenges, BeeXact turned to OXTS, the UK-based precision positioning technology company known for its GNSS/INS systems, and built its mapping fleet around the RT3000 v4, OXTS’s flagship inertial navigation system. The numbers behind the RT3000 v4 explain why it became the backbone of the operation. Under RTK conditions, the unit delivers position accuracy of 1cm, heading accuracy of 0.04 degrees, and roll/pitch accuracy of 0.01 degrees. Such precision is more than sufficient for infrastructure-grade mapping, even when scaled across a large fleet of vehicles driven by operators without specialist surveying training. But raw accuracy was only part of the equation. Just as important was how cleanly the RT3000 v4 integrated with the rest of BeeXact’s sensor payload. Each vehicle combined the RT3000 v4 with Hesai Lidar units and Teledyne Ladybug5+ cameras – a six-camera, 360-degree imaging system – and getting all three data streams to talk to each other in perfect time was critical. The RT3000 v4 synchronized seamlessly with the Hesai Lidar via Precision Time Protocol (PTP) and with the Ladybug cameras via PPS/NMEA timing signals. This ensured every Lidar point and every camera frame
BeeXact mobile mapping vehicle.
58
Issue 4 2026
could be tied precisely to the vehicle’s position and orientation at the moment of capture. That kind of clean, dependable synchronization, replicated across more than 80 vehicles, was what made scaling the operation viable in the first place. The processing pipeline With the hardware side solved, BeeXact and OXTS turned their attention to processing. Collecting centimetre-accurate data is one thing; turning it into a usable, georeferenced deliverable for a client is another challenge entirely – particularly at a volume where manual processing simply is not an option. Together, the two companies built a custom data pipeline using OXTS’s command-line processing tool, which automated the application of nationwide GNSS corrections sourced from Leica’s Smartnet RINEX correction service. The result was a pipeline that could take raw positioning data from any of the 80-plus vehicles and generate highly accurate, corrected trajectories without a human having to intervene at any stage. From there, BeeXact used a software tool they had developed to combine the corrected geospatial data with the raw Lidar point clouds to produce fully georeferenced datasets. The camera imagery was then overlaid onto those point clouds, giving
◀ RT3000 v4 inertial navigation system.
OXTS product line-up.
Sponsored article
Part of Italy’s road network. BeeXact’s data analysts a rich, navigable combination of precise 3D geometry and real-world imagery. That overlay proved particularly valuable for the classification side of the project. Analysts could use the Streetview-style camera footage to visually identify and tag infrastructure features, then cross-reference them against the ranging data captured in the Lidar point cloud. This workflow made it dramatically faster to distinguish, catalogue and verify features across an entire national road network. Engineered for repetition What stands out about BeeXact’s approach is not just the accuracy it achieved, but also the fact that the whole system was engineered for repeatability. A single, wellexecuted survey is a fine achievement; a system that can execute that same survey correctly, thousands of times over, across dozens of vehicles and non-specialist operators, is something else entirely. That is the real engineering challenge in large-scale infrastructure mapping, and it’s where the combination of the RT3000 v4’s reliability and OXTS’s software pipeline proved decisive. By automating GNSS correction, sensor synchronization and georeferencing, BeeXact removed most of the points in the workflow where human error, inconsistency or bottlenecks could creep in. Data quality did not depend on which technician was driving a particular vehicle on a particular day. Instead, the system itself did the heavy lifting, freeing BeeXact’s team to focus on final classification and quality assurance rather than wrestling with raw data. According to René Dikken, head of innovation at BeeXact,
the RT3000 v4 impressed not just because of its accuracy, but because of its stability and reliability under sustained, heavy use – and because OXTS’s support team played a hands-on role in helping integrate the INS with the rest of the vehicle’s sensor suite. That kind of vendor partnership matters enormously on a project of this scale, where any weak link in the sensor chain can ripple outward into weeks of processing headaches. Results that scale beyond Italy The payoff has been substantial. BeeXact can now collect vast amounts of survey data using a proven hardware and software pipeline, with automation ensuring a consistent standard of data quality regardless of fleet size or operator experience. That consistency is what allows BeeXact’s client to make genuinely informed decisions about upgrading Italy’s fibre-optic infrastructure – decisions which depend on trusting that the underlying map is both accurate and complete. Perhaps just as significant is what the project has become for BeeXact beyond Italy. Rather than being a one-off achievement, the workflow built for this project – the RT3000 v4 fleet, the software command line correction pipeline, the BeeXact software integration – has become a reusable template. BeeXact is now applying the same approach to infrastructure mapping projects in other countries, treating the Italian rollout as proof that high-accuracy, fully automated mobile mapping can be scaled reliably, wherever the next contract takes the company.
A model for the next generation of mobile mapping The BeeXact project offers a useful case study for the mobile mapping industry more broadly, at a moment when infrastructure owners across Europe are grappling with exactly the same kind of problem. How can assets – fibre, utilities, road furniture, drainage – be mapped across entire regions or countries, quickly enough and cheaply enough to be commercially viable, without sacrificing the accuracy that makes the data useful in the first place? BeeXact’s answer was to treat the mapping problem as a systems problem, not just a hardware problem. Choosing accurate sensors was necessary but not sufficient. The real breakthrough came from building an integrated, automated pipeline where hardware, synchronization, correction and georeferencing worked together without requiring constant manual oversight. The RT3000 v4 sat at the centre of that system, precise enough to trust and reliable enough to scale – which, for a fleet of 80plus vehicles mapping an entire country’s infrastructure, turned out to be exactly what the job demanded.
More information To learn more about the project and the role OXTS had to play, head over to Hall B5 Stand #B5M039 at Intergeo or use this QR code.
Issue 4 2026
59
Visit our premium members!
B5.M032
B5.M047
C6.A125/C6.A114
B6.D015
B6.D046
B5.H059
B5.H039
B6.B036
C6.D121
C6.F158
C6.D149
B6.D040
B6.B006
B5.K031
B6.F053
C5.I114
B6.E066
B6.D035/B6.G033
B6.B010
B6.C010
B6.C010
B6.D019
B6.D022/B6.A018
C6.E115
B6.D065
C6.G118
B5.M039
B6.A039
C6.B103/C6.C103
B5.M046
B6.A049
B6.E053
B5.L034
B6.F049
B5.L049
Feature
Building a knowledge infrastructure for Florence’s historic river-city system
From the Arno to the digital twin By Grazia Tucci and Adele Meucci
The relationship between Florence and the Arno is marked by a persistent tension. The river has contributed to the development of the historic city, yet it has also exposed its inhabitants and cultural heritage to recurrent danger, most dramatically in 1966. Today, climate change and the responsibilities attached to a UNESCO World Heritage Site require this relationship to be reconsidered. A multi-sensor survey of the Arno’s historic urban reach is connecting the visible city, the submerged riverbed and the subsurface within a single spatial framework. The resulting high-resolution digital twin is intended not merely to document Florence, but to support hydraulic understanding, heritage conservation and responsible urban stewardship. The Arno has never played one single role in Florence. The river has sustained commercial and productive activities, influenced the city’s morphology and given structure to the sequence of bridges and public spaces that still characterizes the historic centre. Over time, however, the dialogue between city and river weakened. Embankments, road infrastructure and flood-defence works progressively established the Arno
as a hydraulic corridor: still decisive in the geography and image of Florence, but less closely connected to its everyday civic life. It has become necessary to reconsider the place of the river – but this does not mean overlooking the danger it represents. The flood of 4 November 1966 remains the most dramatic expression of this tension. Its aftermath transformed Florence into
an international laboratory for restoration, but also exposed the limits of a response centred primarily on recovery. The city proved capable of restoring many of its most celebrated works, while less visible collections, archives and parts of the resident productive fabric remained more fragile. The enduring lesson is that conservation cannot begin after a disaster. It must be embedded in the continuous observation
Figure 1: The pilot area extends from Ponte alle Grazie to Ponte Santa Trinita, with Ponte Vecchio at the centre of a dense relationship between river morphology, historic structures and public space. (Image courtesy: Tuscany Region – Regional Territorial Information Database, OFC 2023 5K – 20cm)
Issue 4 2026
61
of the processes that place the historic city at risk. This interpretation accords with the Historic Urban Landscape approach and with Florence’s Management Plan, which describes the World Heritage property as a living urban landscape in dialogue with a wider natural and cultural setting. The object of conservation is therefore not an isolated collection of monuments, but a system of relationships whose balance changes through time. Consequently, any attempt to bring the Arno back into the social and environmental life of Florence must begin with a more exact understanding of its behaviour. The urban reach is hydraulically complex. A total of 13 bridges and five weirs have influenced its hydrodynamics and morphodynamics, while structures of exceptional cultural value severely constrain the range of possible engineering interventions. The International Technical and Scientific Committee established for the 50th anniversary of the 1966 flood stressed the need for better monitoring and advanced three-dimensional modelling of the river as it passes through the city. A different use of measurement Surveying has always accompanied the development of historic cities. Its products have evolved from maps and cadastral records to dense point clouds and photorealistic 3D models, with each technological advance improving the completeness and metric reliability of urban
Figure 2: Permanent control points along the banks and bridges provide the common metric framework for static scanning, mobile mapping, UAV photogrammetry and subsequent monitoring campaigns. In black, the points of the reference network; in yellow, red and blue, the additional control points determined by traverse surveying. documentation. Yet even the most accurate model ordinarily represents a condition observed at a particular moment. The questions now being addressed in Florence require a different use of measurement. The hydraulic behaviour of a bridge depends on the geometry of its openings and the riverbed beneath them. The effects of thermal stress cannot be assessed without considering materials, exposure and urban form. Similarly, the significance of an observed deformation emerges only when it can be compared with previous surveys and interpreted against structural or environmental evidence. From representation to knowledge Accuracy therefore remains indispensable, although it is no longer the final objective. Geometry becomes the stable reference through which observations produced at different times, at different resolutions and by different disciplines can be interpreted together. A digital twin conceived on these terms is not simply a more realistic model. It is an evolving knowledge environment whose value depends on the traceability of the information it
Figure 3: Terrestrial and mobile point clouds are integrated with UAV geometry, USV bathymetry and ground-penetrating radar observations to construct a continuous but metrically traceable model.
62
Issue 4 2026
Feature
Figure 4.1 and Figure 4.2: The integrated dataset preserves the spatial relationship between the bridge superstructure, its piers, the adjacent urban fabric and the morphology of the riverbed.
contains and on the possibility of updating it without erasing the conditions under which earlier data were produced. This distinction is particularly important in Florence. Ponte Vecchio cannot be understood as an autonomous architectural object, because its behaviour is inseparable from the river and the structures that regulate the urban reach. Conversely, the Arno cannot be represented adequately as an abstract hydraulic channel, since its banks, bridges and adjoining buildings are part of the system through which water moves. The digital twin is intended to preserve this interdependence rather than simplify it. A geodetic network covering three domains The pilot area extends from Ponte alle Grazie to Ponte Santa Trinita, placing Ponte Vecchio at the centre of an environment where hydraulic vulnerability, architectural density and historical significance converge. The selected reach is sufficiently contained to permit high-resolution investigation, yet complex enough to test a method intended for broader application. The work brings together two related initiatives. Cultural Heritage Digitization and Resilience (CHEDAR) provides the wider framework for integrating advanced documentation with conservation and heritage management. Within the CHANGES programme, INTERCONNECTING focuses more specifically on immersive models capable of connecting survey data with microclimatic analysis and risk visualization around Ponte Vecchio. Rather than producing independent demonstrators, the two projects contribute to a shared spatial foundation, allowing city-scale processes and monument-scale evidence to be examined within the same reference system. The geometry had to cover three connected domains. Above water, the model describes the riverbanks, bridges and adjoining urban fabric. Below the surface, it reconstructs the morphology of the channel and the areas surrounding the bridge piers. Subsurface investigation adds information about buried structures and utilities whose presence may affect maintenance or future intervention. A geodetic network provides the metric
Acknowledgements The work was developed within the Cultural Heritage Digitalization and Resilience (CHEDAR) framework (a project of relevant international interest promoted under the ‘Legacy Expo 2020 Dubai’ programme and approved by the Italian Ministry of Universities and Research by Decree No. 237 of 27.12.2023) and through activities supported by the CHANGES programme, Spoke 7, Protection and Conservation of Cultural Heritage against Climate Changes, Natural and Anthropic Risks. INTERCONNECTING was developed by a consortium led by the ‘G. d’Annunzio’ University of Chieti-Pescara, in collaboration with the Polytechnic University of Bari and ASDEA. The contribution of the institutions and technical staff supporting field acquisition, data processing and scientific integration is gratefully acknowledged. The authors thank Microgeo Srl and Dynatech Srl for their consultancy and for providing the instruments, Renzo Maseroli and Donatello Donatelli for their assistance in the topographic network, and Società Canottieri Firenze for their help during the river surveys.
Issue 4 2026
63
structure required to combine these domains. Permanent vertices and targets were installed along the banks and on the bridges, then measured through GNSS RTK observations and total-station traverses. Expressed in ETRS89/ETRF2000, the network supports centimetric control while establishing a reference that can be reused in later campaigns. Its long-term role is as important as its initial accuracy. Without a stable datum, repeated surveys would document change without reliably distinguishing physical transformation from inconsistencies in registration. Mapping the urban fabric The exposed urban fabric was acquired through complementary static and kinematic techniques. The RIEGL VZ-600i supplied the principal high-accuracy datasets and was also operated from a boat, allowing the banks and lower parts of the bridges to be observed from the river. NavVis VLX 3 and XGRIDS Lixel L2 systems extended the survey through congested or difficult spaces near Ponte Vecchio and the Uffizi, where the continuity offered by SLAM-based acquisition was more valuable than a succession of isolated static stations. UAV photogrammetry completed areas that could not be read adequately from ground level. More than 2,600 images were collected during the test campaign, providing coverage of roofs, upper elevations and surfaces concealed by the dense urban fabric. The aerial dataset was not treated as a separate representation, but registered within the same control framework so that its radiometric and geometric contribution could strengthen the terrestrial surveys. Submerged observations The submerged domain required a different observation strategy. An uncrewed surface vessel equipped with single-beam and multibeam echosounders recorded the morphology of the channel, concentrating particular attention around the bridge piers and on features that may indicate changes relative to historical bathymetric data. Ground-penetrating radar surveys then extended the investigation beneath adjacent urban surfaces, including areas close to Ponte Vecchio and the Vasari Corridor. The purpose of this sensor combination was not simply to maximize coverage. Each
64
Issue 4 2026
About the authors Grazia Tucci is a full professor of Geomatics at the University of Florence and director of GeCO Lab, where she works on documentation, digital twins and heritage conservation. She led the digital replica of Michelangelo’s David for Expo Dubai and serves as vice president of CIPA Heritage Documentation. Adele Meucci is a PhD candidate in Heritage Science. She works on geomatics, digital twins and spatial information systems for documenting, monitoring and preserving cultural heritage and historic urban landscapes.
instrument observes a different physical condition and produces data with a distinct uncertainty structure. The integrity of the resulting model therefore depends upon retaining that distinction. A visually continuous surface can otherwise conceal discontinuities in resolution, acquisition date or reliability. Data quality, metadata and provenance must remain accessible if the digital twin is to support technical decisions rather than merely persuasive visualization.
geometry. A unified model can provide detailed boundary conditions for numerical simulation while repeated bathymetric surveys reveal changes in the channel and around the piers. It does not replace basinscale flood protection, but strengthens the evidence on which local scenarios and interventions must be assessed. This responds directly to a long-recognized weakness. The ITSC report identified gaps in reliable hydraulic data and argued that physical experimentation should be
Survey domain
Principal acquisition
Metric data
Resulting contribution
Geodetic framework
GNSS RTK and total station
24 station vertices and 25 targets; centimetric accuracy
Repeatable common reference in ETRS89/ ETRF2000
Urban fabric and bridges
RIEGL VZ-600i, NavVis VLX 3, XGRIDS Lixel L2
118 static stations; 4km trajectories
Registered point clouds of banks, façades and structures
Roofs and upper surfaces
UAV photogrammetry
Over 2,600 images; 1cm/pixel GSD
Dense geometry and radiometric information
Submerged channel
Single-beam and multibeam USV bathymetry
80,000m2 surveyed
Riverbed and bridgepier morphology
Subsurface
Ground-penetrating radar
7 profiles
Buried structures and utilities
Table 1: Acquisition summary Hydraulic knowledge and structural risk The most immediate application concerns hydraulic knowledge. The urban section of the Arno cannot be modified freely, nor can the behaviour of its bridges and weirs be inferred satisfactorily from simplified
combined with 3D hydrodynamic modelling. It also called for data to be collected, preserved and made accessible through an environment in which scientific knowledge and institutional responsibilities could converge.
Feature A second field concerns the slower environmental transformations that rarely produce a single catastrophic moment. Within INTERCONNECTING, the geometry of the Ponte Vecchio area supports microclimatic analysis of urban heat-island effects and thermal stress. Because the simulations are linked to the actual form of the historic fabric, their results can be read in relation to exposure, materials and spatial configuration rather than as generic environmental surfaces. The same principle informs the immersive visualization of structural risk. The recently published study on Ponte Vecchio translates nonlinear analysis and damage indicators into a navigable virtual environment, including seismic vulnerability and an extreme hydrodynamic loading scenario. Its value lies not in making the analysis spectacular, but in preserving the spatial relationships through which technical results acquire meaning. Damage can be read where it is expected to occur, allowing inspection and conservation priorities to be discussed within the geometry of the monument itself. From geometry to stewardship Such applications suggest a wider interpretation of the model’s social function. The Faro Convention places people and the values they associate with heritage at the centre of conservation, encouraging communities to participate in the processes through which heritage is recognized and sustained. A digital twin can contribute to this principle only when access is considered part of its architecture. A public interface cannot reproduce the full complexity available to specialists, but neither should it reduce the city to a photorealistic spectacle. It should reveal why a scenario matters, where uncertainty remains and how alternative decisions may affect the cultural and environmental system. This is particularly relevant to the Arno. Reconnecting the river with Florence is not solely a matter of redesigning its banks or increasing physical accessibility. It also requires a shared understanding of the river as an evolving environmental system whose risks, histories and civic meanings coexist. Through carefully differentiated interfaces, the same knowledge base could support hydraulic specialists, conservators and public authorities while also giving residents a clearer view of the processes shaping the riverfront.
Figure 5: The survey-based geometry supports immersive visualization of structural damage and environmental simulations, enabling analytical results to inform conservation and inspection strategies. Examples of the immersive VR interface and interaction functionalities: (a) access and navigation within the virtual environment; (b) visualization of damage patterns combined with the interaction panel, enabling time-step navigation, colour-map selection and inspection-oriented exploration of localized critical areas. (Image courtesy: Cantagallo, C. et al, 2026) The social dimension is therefore not an interpretative layer to be added after completion of the survey. It should influence which information is preserved, how uncertainty is communicated and whether the infrastructure remains usable after the projects that created it have ended. The original draft rightly identifies updateability as a decisive requirement: a digital twin that cannot incorporate subsequent monitoring or recover the history of its own data soon becomes another static record. Conclusion The Florence pilot shows how a digital twin can connect domains that are usually surveyed and analysed separately. The riverbed, the historic bridges and the surrounding urban fabric are brought into a common spatial framework without erasing the different scales and uncertainties
through which they were observed. Its significance does not rest on geometric detail alone. The model becomes valuable when later surveys can be compared with earlier ones, when simulations remain connected to measurable conditions and when technical evidence can be translated into responsible choices. For Florence, this offers a way to reconsider the relationship with the Arno without reducing the river either to a scenic backdrop or to a threat to be controlled. More broadly, it proposes a transferable method for historic river cities in which climate adaptation and heritage conservation can no longer be pursued separately. The survey is therefore not the end of the process. It establishes the basis through which measurement may evolve into knowledge, and knowledge into stewardship.
Further reading Galloway, G.E., Blöschl, G., García, M., Montanari, A., Seminara, G. and Solari, L. (2017), ‘Final Report of the International Technical and Scientific Committee of Florence 2016 on the Protection of Florence from Flooding’, Florence 1966–2016: Resilience of Art Cities to Natural Catastrophes, Atti dei Convegni Lincei 315, 119–133 Comune di Firenze (2022), Management Plan of the Historic Centre of Florence – UNESCO World Heritage Site. Comune di Firenze, Florence Tucci, G., Fiorini, L., Meucci, A. and Conti, A. (2025), ‘Integrated Geomatic Solutions for the Digital Twin of Florence: Protecting the Arno River and its Historic Urban Landscape from Climate Risks’, The International Archives of the Photogrammetry, Remote Sensing and Spatial Information Sciences, XLVIII-G-2025, 1463–1470 Cantagallo, C. et al. (2026), ‘Immersive Virtual Reality for Damage Visualization and Risk Management in Heritage Structures: Workflow and Application to Ponte Vecchio (Florence)’, Architectural Science Review, 1–16, DOI: 10.1080/00038628.2026.2696032 Council of Europe (2005), Framework Convention on the Value of Cultural Heritage for Society – Faro Convention, CETS No. 199
Issue 4 2026
65
Takeaways from the FIG Congress 2026 in Cape Town
South Africa welcomed the surveying world By Louise Friis-Hansen
Eight years after the FIG General Assembly elected Cape Town as host, and four years later than originally planned, the international surveying community finally gathered beneath Table Mountain from 23-29 May. Some 1,400 participants from more than 80 countries attended FIG Congress 2026 at the Cape Town International Convention Centre, under the theme ‘The Future We Want – The SDGs and Beyond’. Across four plenaries, an extensive technical programme, a milestone Young Surveyors Conference and a busy exhibition floor, the week made a consistent case: surveying and geospatial information is no longer a technical input but strategic public infrastructure for land governance, climate resilience and sustainable development. Originally scheduled for 2022 but postponed due to the COVID-19 pandemic, the FIG Congress was finally held in 2026 over seven days in a venue close to the Cape Town’s Waterfront district. Two General Assembly days framed the programme. Pre-congress activities Several pre-events preceded the congress, competing for city space with a large international marathon on 24 May. The programme included the Young Surveyors Conference, a Reference Frame in Practice seminar, half-day events on land value and cadastre in the age of AI and on the price effects of climate action, and an Esri workshop on GIS for land administration. The FIG leadership used the time for administrative meetings, seizing the special opportunity to meet in person. Opening ceremony and General Assembly The General Assembly drew representatives of 65 member associations and, with observers, more than 400 attendees. As usual at a FIG Congress, elections took place during the conference days for the new president of FIG (Michalis Kalogiannakis, Greece), three vice presidents (Winnie Shiu, Hong Kong SAR China, Stephen Djaba, Ghana, and for a two-year term Peter Ache, Germany) and the destination of FIG Congress 2030 (Qingdao, China).
66
Issue 4 2026
The FIG Congress was built around four plenary sessions. The Opening Ceremony on Monday combined a cultural dance performance with addresses from the City of Cape Town, the local organizers and FIG President Diane Dumashie, who described the gathering as one global family. Alderman James Vos spoke on building an economy of hope and inclusive growth. Dr Sindiswa Mzamo delivered a keynote on women, leadership and inclusive growth, and Minister of Land Reform and Rural Development Mzwanele Nyhontso held a formal speech before opening the exhibition jointly with the FIG president. Plenary sessions The week was structured around four plenaries. The first addressed strategic
leadership and sustainable policy. Andre Nonguierma made the case for continental geospatial governance in Africa. Mika-Petteri Torhonen noted that only 35% of land rights are formally registered globally and presented the World Bank’s call to secure one billion land rights within a decade. Paula Dijkstra, chair of the FIG SDG Task Force, launched an ‘Advocate-Innovate-Collaborate-Deliver’ framework, observing that over 70% of Sustainable Development Goal (SDG) targets depend on geospatial data. The second plenary turned to climate resilience across land, sea and the built environment. Ward Anseeuw (FAO) presented the first global ‘Status of Land and Governance’ report,
Report both the pupils and the school budget. Post-event survey results underline why such occasions matter: 73% of participants ranked networking as their main reason for attending, ahead of learning about new technology (42.5%).
The gala dinner created memories that will last long after the congress ended. Clarissa Augustinus set out 16 climate action areas in which surveyors already contribute, and Luigi Sinapi (IHO) explained how the S-100 standard supports an interoperable digital view of oceans and coasts. Nicholas Maclean challenged the profession to convert technical capability into trusted advice and better policy. The third plenary examined data, AI, remote sensing and digital twins, with contributions from Victor Khoo (Singapore Land Authority), ISPRS President Lena Halounova, James Norris (Ordnance Survey) and Craig Hill (Leica). The fourth closed on partnership and inclusion, featuring Clinton Heimann on decision-ready national geospatial systems, Nomfundo Ntloko on spatial justice in South Africa, Beth Roberts (Landesa) on women’s land rights, and Emmanuel Nkurunziza on regional partnerships through the Regional Centre for Mapping of Resources for Development (RCMRD). Technical programme and industry The technical programme spanned four days and ten commissions, mixing peer-reviewed papers with practitioner and government contributions. Land administration featured strongly, including dedicated sessions on the Framework for Effective Land Administration and the UN-FAO status report. Climate resilience and digital transformation ran as cross-cutting themes, alongside sustained attention to African contexts: informal settlements, rural tenure, restitution and
capacity development. A new element was the introduction of Commercial Talks for Diamond, Platinum and Gold sponsors, integrated into the main programme and well received as a bridge between industry innovation and professional practice.
President Diane Dumashie’s four-year term comes to an end this year. Young surveyors, networking and legacy The 10th FIG Young Surveyors Conference, held on 23 and 24 May, marked 20 years of the Young Surveyors Network (YSN) with keynotes, panels and a charity event supporting the FIG Foundation and the Sugarbird Project. Marcus Schmitt (USA) succeeded Shirley Tendai Chapunza (Zimbabwe) as YSN chair. A legacy project at a nearby school will re-establish a fruit garden lost during the pandemic, serving
Exhibition The exhibition was integrated into the heart of the FIG Congress, with coffee breaks, lunches and the welcome reception held in and around the stands. Diamond sponsors CHC Navigation, Esri, GEOSA and Trimble were joined at Platinum level by Alqotr, Leica Geosystems and SuperMap, with eSurvey, Hi-Target, RCMRD and ComNav Technology at Gold and 3Dsurvey and Multigeomatics at Bronze. First-time exhibitors reported that the value lay less in product display than in the quality of conversations and the insight gained into the needs of African and global markets. Conclusion FIG Congress 2026 closed with President Diane Dumashie’s final address, marking both the end of the week and of her four-year term focused on sustainability, climate action, diversity and the SDGs. Michalis Kalogiannakis of Greece will take over on 1 January 2027. The South African Geomatics Institute, the South African Geomatics Council and their partners delivered a professional and warmly hosted event, capped by traditional gifts and Chief attires for the outgoing and incoming presidents. SAGI President Peter Newmarch handed the FIG flag to Kari Strande, whose invitation points the community towards Stavanger, Norway, for the FIG Working Week from 23-27 May 2027.
The Power of Where: join FIG in Stavanger Everything happens somewhere. The FIG Working Week 2027 (23–27 May, Stavanger, Norway) under the theme ‘The Power of Where for the New Generations‘, addresses current topics relevant for surveyors, geospatial experts and related professions and is an event not to be missed. Explore how geospatial expertise shapes the Arctic, coast and ocean management, climate adaptation, smart cities, and resilient societies – plus dedicated topics across all ten FIG Commissions, from cadastre and land management to real estate valuation and construction economics. Do you have research, insights or a case study to share? Submit your abstract for peer review, regular presentation or poster and help shape the future of the profession. Peer review deadline: 1 October 2026 Regular and poster deadline: 1 November 2026
Incoming FIG President Michalis Kalogiannakis adressing the audience.
More information: www.fig.net/fig2027
Issue 4 2026
67
The importance of mentorship: from a father’s theodolite to doctoral research in surveying and mapping By Adamu Bala
My first encounter with a surveying instrument happened at home with my dad when I was less than 12 years old. I still remember asking, “Dad, what is that you are holding?” As a young and curious boy, I wanted to know why the instrument looked so mysterious. He jokingly replied, “It is a specialized type of camera that can see humans and even aliens from afar.” That “specialized camera” was what I later discovered to be an old T2 theodolite, and it became the first quiet signpost on my journey into surveying, teaching geomatics, research and mentoring others. My dad, Alhaji Bala Abdulrahman Jalo Mani, was a land surveyor who worked with the Office of the Surveyor General of Katsina State, Nigeria, until he retired a few years ago. Although he did not study to universitydegree level, his wish had always been for his children to receive a good education up to the highest academic qualification possible. Beyond education, he also wanted one of his children to inherit the profession he had practised and loved. Out of our large family, I happened to be the chosen one. While I was in secondary school, in agricultural science lessons we learnt about some surveying-related instruments such as tapes, chains, ranging poles and compasses. When the time came for me to prepare for the university entrance examinations, I was unsure what to study. Many of my classmates were choosing courses such as medicine and other trending science-related fields. As I often did, I went to my dad for advice. I still consider that one of the best decisions of my life. Never a lack of work My dad did not hesitate. He immediately told me, “I suggest you choose land surveying as your first choice.” He then added, “Look, Adamu, I know it is a difficult course and perhaps it will require you to do fieldwork in the bush. It is not a white-collar profession, but trust me, you will never lack a job to do. I may not have the connections
68
Issue 4 2026
Adamu Bala with his father, Alhaji Bala Abdulrahman Jalo Mani, on his wedding day in March 2014. His presence reflects the family support behind Adamu Bala’s professional journey. to secure you a job, but you will never lack work.” Those words stayed with me. Listening to my dad’s advice made me reflect on the Hausa proverb: “Whatever an experienced person sees while sitting, an amateur may not see even if they climb the tallest baobab tree.” Therefore, I chose to study land surveying – now known as geomatics – at Ahmadu Bello University in Nigeria, sat the entrance examinations and, a few months later, my name appeared on the first admission list published in one of the national dailies. When I saw my name, it was one of the happiest surprises of my life. I rushed back home, told my dad, accepted the offer and travelled to begin my studies.
Mastering the practicalities Because I was determined, and because my dad loved the course, I never missed a class. In fact, I often collected lecture notes from senior students even before a new semester began, and also attended extra tutorial sessions. From my dad’s frequent fieldwork, I knew land surveying was a practical course, so I made sure I mastered the instrumentation and computational aspects. I still remember how he taught me forward and backward computations and other elementary surveying calculations, and often took me along for cadastral surveys. One of the defining moments in my early training was my industrial attachment. My dad made sure I worked under Malam
Perspectives
About the author Adamu Bala’s induction as a Registered Surveyor by the Surveyors Council of Nigeria in February 2016: one of the tangible outcomes of his father’s mentorship. Hassan Rafukka, who had been his office colleague. Malam Hassan was an excellent teacher. He not only taught me fieldwork, but he also introduced me to computations, plotting, AutoCAD, Surfer and other software. That internship widened my understanding of the profession and made me love it even more. Motherly guidance and encouragement My mother also played a significant role in this journey. Through moral training, spiritual prayers and constant encouragement, she helped me remain diligent, disciplined and careful about the company of friends I kept. My father pointed me towards the profession, but my mother helped strengthen the values that allowed me to stay on the path. My dad additionally played a key role in my professional networking. I remember attending my first Nigerian Institution of Surveyors AGM/Conference in 2009 as a student, and later the FIG Working Week in 2013. Since then, I have remained consistent in attending professional events, presenting papers and volunteering. Joining the FIG Young Surveyors Network also expanded my professional network within and outside Nigeria. My dad’s prediction that I would not lack work came true in many ways. I secured my first job immediately after my national youth service. However, another part of his advice also became real. He had always wanted me to work in the state government where he had worked, partly because of his love for cadastral surveying. I applied, attended the interview and answered the questions satisfactorily. However, to our surprise, I did not get the job. The position was offered to other applicants with stronger connections. Personal turning point It saddened my dad but, for me, it was a turning point. I realized that I needed to train harder, improve myself and become more competitive. Within a few years, I passed the surveyors’ registration examination, became a full member of the Nigerian Institution of Surveyors, became more active in the Young Surveyors Network and secured a better job with a federal government research institute. I also acquired a Postgraduate Diploma in Education, a Postgraduate Diploma in Mining Engineering and later an MSc in Geomatics. With these qualifications and my professional experience, I secured a university lecturing position at my alma mater. Over the years, that foundation supported my progression into professional service, research and teaching, including the FIG-Survey Review Biennial Prize 2022 and xyHt magazine’s recognition as one of the 23 young geospatial professionals to watch. One lesson I have found extremely important is the value of keeping in touch with
Adamu Bala is a PhD researcher in surveying and mapping science and technology at China University of Geosciences, Wuhan, and a lecturer in geomatics at Ahmadu Bello University, Nigeria. His research focuses on land-use transitions, urban expansion and carbon sink dynamics, with broader interests in professional mentorship and geospatial capacity development. adamubala09@gmail.com
those from whom we have learnt, including my university lecturers, internship mentors, senior colleagues and even retired professors. In late 2022, I arrived in China for a fully funded PhD programme in Surveying and Mapping Science and Technology at China University of Geosciences, Wuhan. This has also been an eye-opener. I have met friends from different countries and travelled to many Chinese cities for conferences, workshops, summer schools, competitions and academic exchanges. Shaped by mentorship Since then, I have dedicated myself not only to research, but also to mentoring young professionals on how to become registered surveyors, apply for grants, and pursue international scholarships and other opportunities. I have delivered virtual presentations, used Facebook and created WhatsApp groups for one-on-one guidance, and helped more than 15 applicants to successfully win scholarships for postgraduate studies in geospatial and related fields. All this has been done voluntarily without any monetary expectation. Looking back, my journey from seeing a theodolite as a mysterious “camera” to becoming a PhD researcher in Surveying and Mapping Science and Technology has been shaped by mentorship, discipline, professional networks and family support. A mentor may not give you everything, but a good mentor can help you see possibilities that you may not yet see for yourself. I will forever be grateful to my dad for his mentorship, sacrifices and dedication, and I hope that by mentoring others, I can continue the legacy he started.
Adamu receiving the FIG– Survey Review Biennial Prize in Warsaw in September 2022 for best peer-reviewed paper.
Issue 4 2026
69
Behind the scenes of the industry’s leading event for technological discovery and personal networking
Closer integration at Intergeo: connecting ideas with practical solutions By Wim van Wegen, GIM International
In the runup to Intergeo 2026, we touched base with Prof Rudolf Staiger. As president of the German Association for Geodesy, Geoinformation and Land Management (DVW), he leads the organization responsible for this annual event, which is widely regarded as the world’s leading trade fair and conference for the geospatial sector. He explains the focus on reflecting the most relevant developments shaping the industry, and the visitor benefits of the ever-closer connection between the conference and the exhibition. He also singles out three not-to-be-missed highlights at this year’s edition.
Organizing an event like Intergeo involves a huge amount of effort. Can you give us a peek behind the scenes? The German Association for Geodesy, Geoinformation and Land Management (DVW) is a technical-scientific association of volunteers. We have a long history. Our first three-day conference, known as Deutscher Geodätentag, took place as early as 1872 in Eisenach. Since then, DVW has maintained this annual format: a three-day conference, field trips and a corporate exhibition. The exhibition has grown steadily, so since 1995 we have been organizing the event together with HINTE as our professional trade show partner. At the same time, the event was renamed Intergeo. For us, Intergeo is a year-round project rather than the three intensive days visitors experience in September. The preparation begins many months earlier and involves close collaboration between the DVW, HINTE, exhibitors, speakers, programme committees and many volunteers. One of the biggest challenges is curating a conference programme that reflects the most relevant developments shaping the geospatial industry. We work closely with experts from academia, government and business to identify emerging topics, attract leading international speakers and ensure that the programme combines scientific excellence with practical relevance.
70
Issue 4 2026
Which aspects of this year’s edition will most strongly reinforce the event’s reputation as the key gathering for the geospatial industry? We are proud that Intergeo has grown slowly and organically. There has never been a strict target, such as 30% growth over the next five years. In my opinion, that is a key point. It has always been important to us to provide a vendor-neutral platform for all market participants – what we now call ‘the geospatial community’. This naturally includes, first and foremost, all providers of hardware and software solutions, but equally all interested parties from academia and research, public administration and the private sector.
Today, as the global industry’s largest vendor-neutral industry conference and trade show, Intergeo is the place to discover the latest technologies and applications. At the same time, it also serves as a platform for personal networking at the trade show or during the conference. The choice of venue is crucial to Intergeo’s success. On the one hand, the location should be easily accessible for national and international guests; on the other hand, it should also be an attractive place where people can meet in a pleasant setting, for example, in the evenings or immediately before or after Intergeo.
At the Intergeo 2025 conference, Rudolf Staiger addressed the audience during the kickoff of the event on the Tuesday morning. (Image courtesy: Intergeo/Nico Herzog Fotografie)
Interview How essential is it that Intergeo accurately reflects the current state of the geospatial industry, and how do you achieve that in practice? Every leading event must set the pace and tone; otherwise, it will lose its leading role sooner or later. Every technology exhibition serves as a showcase for what will be put into practical use over the next two to five years. The exhibitors themselves set the topics. We proactively identify current and future themes. Our key tools for driving them forward are the stages or special exhibitions. For example, Campus Geoinnovation is a platform for education, training and professional development. The target audience includes students, recent graduates and anyone interested in continuing education and professional development. One of its goals is to highlight the appeal and relevance of the geospatial industry. As another example, this year we are hosting the Reality Capture Hub in Hall C5 for the first time. There, visitors can see and try out new methods for 3D visualization. Moreover, the various stages allow manufacturers and organizations to present their ideas, products and best-practice examples and open them up for discussion. The conference programme is even more closely integrated with the exhibition this year. How does that work? By further strengthening the connection between the conference and the exhibition, our aim is to create a seamless experience where participants can easily move between strategic discussions, practical applications and the latest technologies. The key themes of this year’s conference are: digital twins, Geo-AI, Earth observation, geodesy & BIM, geoinformation in public administration and technical surveying. The conference provides in-depth insights into the key topics shaping the geospatial industry, while the EXPO stages complement these discussions with real-world case studies, live demonstrations and best practices. At the same time, the exhibition allows visitors to experience the latest products and innovations first-hand and engage directly with technology providers. This closer integration creates a more dynamic learning experience and makes it easier for participants to connect ideas with practical solutions. In your view, what should visitors to Intergeo 2026 absolutely not miss? One thing visitors should definitely not miss is the keynote by Jack Dangermond, CEO and owner of Esri. This will take place on Tuesday morning and is accessible to all visitors. Secondly, the booth parties
Rudolf Staiger participating in the Intergeo 2025 press conference. (Image courtesy: Intergeo/Nico Herzog Fotografie)
About Rudolf Staiger Prof Rudolf Staiger has been president of the German Association for Geodesy, Geoinformation and Land Management (DVW) since January 2023, having already held various positions at DVW including heading the former working group ‘Surveying Instruments and Methods’ until 2010. Staiger previously served as president of the International Federation of Surveyors (FIG) from 2019-2022, as vice-president of FIG and as chair of Commission 5 (Positioning and Measurement). Over the last three decades, he has taught surveying engineering at the University of Essen and Bochum University of Applied Sciences in Germany, with a special interest in least squares adjustment, shortrange triangulation, laser tracking and laser scanning.
on Wednesday evening are legendary. And the third unmissable thing is Munich itself. Intergeo was last in Munich 20 years ago, together with the FIG Congress in 2006. Now, two decades later, we are back in town. Anyone who is a fan of Bavarian cuisine and brass-band music shouldn’t miss the world-famous Oktoberfest, which begins on the Saturday after Intergeo ends. And there are many other charming attractions and destinations in the city of Munich and the surrounding area, all the way to the Alps. Contrary to earlier announcements, you’ve reshuffled the host cities for the coming years. What will that mean in practice? Two years ago, we announced that Intergeo would be held exclusively in Frankfurt starting in 2028. A single venue offers many advantages, particularly logistical ones for exhibitors and visitors. We received a lot of positive feedback on this decision. However, there were also critical voices, which we hadn’t anticipated. Apparently, many people had already grown accustomed to the ‘travelling circus’ and had come to love it. So in the future, Intergeo will be held in Hamburg in odd-numbered years (2029, 2031, …), while we will alternate between Frankfurt and another major German city in even-numbered years (2028, 2030, …). All three cities offer excellent infrastructure and accessibility. They also differ in terms of tourism, thereby holding specific appeal for visitors. With this new concept of a limited number of locations, we are offering a compromise between logistical simplification and the desired geographical variety. Once the upcoming edition is over, what do you hope to look back on? I hope to look back on three inspiring days with satisfied exhibitors, enthusiastic visitors and many new ideas and partnerships. When people leave Intergeo, they are hopefully inspired and looking forward to coming back. Then we’ve done our job well.
Issue 4 2026
71
FIG President Diane Dumashie believes that land is a source of identity, security and opportunity.
FIG releases two new publications The International Federation for Surveyors (FIG) has added two new publications to its ever-growing list of industry-related literature: ‘Fit-for-Purpose Land Administration: Status, Success, and Scaling – FIG Publication No 87,’ and ‘Advancing Women’s Land Rights: A Call to Action through Ten Commitments for Surveyors and Other Land Professionals – FIG Publication 89’. A decade on, are land rights for all still within reach? For billions of people, insecure land rights mean a daily reality of vulnerability, exclusion and poverty. Ten years ago, FIG and the World Bank introduced a bold idea to change that: fit-for-purpose land administration (FFPLA) – a flexible, affordable and inclusive way to secure land rights at scale. The new publication from FIG Commission 7’s Working Group 7.2 asks: has it worked? The publication ‘Fit-for-Purpose Land Administration: Status, Success, and Scaling’ (FIG Publication No 87) draws on case studies from Africa, Asia and Latin America. The report tells a story of real progress and persistent challenges. Political will, smart partnerships and community trust have driven success stories in countries like Rwanda, Mozambique and Nepal. In just
72
Issue 4 2026
six years, for example, efforts supported by the Global Land Tool Network (GLTN) have documented data for over 400,000 households across six countries. Yet rapid urbanization, climate disasters and displacement are intensifying pressure on land systems, with women, young people and the rural poor bearing the brunt of insecurity. Weak institutions and fragmented data still stand in the way. Looking ahead, the publication explores how AI, blockchain and mobile technology could help close the gap. Its message is clear: secure land rights are not a distant dream, they are an achievable foundation for climate resilience, equality and peace by 2030. Whose rights are we leaving off the map? When land rights are recorded, women are too often left off the map. ‘Advancing Women’s Land Rights: A Call to Action through Ten Commitments for Surveyors and Other Land Professionals’ (FIG Publication 89) calls on surveyors and land professionals to change that, one commitment at a time. The timing could not be more urgent. According to the UN 2025 SDG Report, in 80% of countries with available data, fewer than half of women hold ownership or
secure tenure rights to land. Legal reform alone has not closed the gap. Written by FIG Commission 7 Working Group 7.5, and led by Marisa Balas with a large international team of contributing authors, the publication travels across Sub-Saharan Africa, Latin America and the Caribbean, the Middle East and North Africa, the Mekong, and the Pacific islands. Everywhere, the same story repeats: laws on paper do not guarantee rights in practice, held back by weak institutions, social norms and missing data. As FIG President Diane Dumashie writes in her foreword, land is “a source of identity, security and opportunity”, yet it remains out of reach for too many women. Structured around four intervention areas, the guide offers ten concrete commitments, giving surveyors a practical framework to turn principles into action and to ensure women are finally counted.
More information www.fig.net
Organizations The global geodesy supply chain connects geodetic observatories, data centres and analysis centres to deliver the foundational geodetic products used across modern society. (Image courtesy: UN-GGCE)
redundancy, dependable data flows, skilled personnel and coordinated continuity planning. Robustness prevents local failures from cascading through the system and degrading the services on which downstream users depend.
The state of geodesy: is our global geodesy supply chain fit for the future? The State of Geodesy 2026 report provides a comprehensive assessment of the global geodesy supply chain. While the system is operational and accurate, the report identifies a number of weaknesses affecting robustness. What can be done to improve this? Every GNSS position, satellite orbit, digital twin and authoritative geospatial dataset depends on a largely invisible global infrastructure. Ground geodetic observatories and satellites continuously measure the Earth’s shape, orientation and gravity field. Data centres preserve and distribute geodetic observations. Subsequently, analysis centres transform them into geodetic products like reference frames, Earth orientation parameters, gravity models and precise satellite orbits. Together, these elements form the global geodesy supply chain (GGSC). For the geospatial community, this supply chain is not an abstract scientific concept. It supports surveying, mapping, positioning, navigation, Earth observation, infrastructure monitoring, land administration and disaster response. Its products allow measurements collected by different technologies, organizations and countries to be combined consistently. Without a stable geodetic foundation, even the most advanced sensors and digital platforms cannot deliver reliable results over time.
Comprehensive assessment The State of Geodesy 2026 report – the first of its kind – provides a comprehensive assessment of this foundation. Based on 58 capabilities across six domains, it assigns the GGSC an overall maturity score of 2.3 out of 5. The system is operational and continues to produce accurate geodetic products, but it is not yet sufficiently robust. Governance and strategy score only 1.8, while weaknesses are also evident in financial management, infrastructure continuity and workforce development. This result deserves attention because the supply chain remains strongly dependent on voluntary and in-kind contributions. For more than a century, the International Association of Geodesy (IAG) and its scientific Services and Global Geodetic Observing System (GGOS) have coordinated much of the technical work. This is an extraordinary international achievement. However, scientific coordination alone cannot provide the formal mandates, sustainable investment, risk management and accountability required for critical global infrastructure. Robustness criteria A robust supply chain must continue delivering geodetic products at the required quality even when individual stations fail, funding changes, expertise is lost or external disruptions occur. It needs adequate geographic coverage,
The United Nations Global Geodetic Centre of Excellence (UN-GGCE) is helping to address these structural challenges. Its work includes the Joint Development Plan for Global Geodesy, a multilateral memorandum of understanding, capacity-development activities and support for stronger national and international coordination. By mid-2026, the memorandum had brought together 57 participants from government agencies, international organizations, academia and the private sector. Matching science with governance The principal message from the IAG and GGOS perspective is therefore clear: excellent science must now be matched by stronger governance. The existing technical system must be supported by clearer responsibilities, long-term investment and cooperation between governments, science and industry. Strengthening these arrangements will help move global geodesy from operational to robust – and safeguard the common foundation on which the entire geospatial community relies. By Martin Sehnal Director of IAG’s GGOS Coordinating Office, secretary of the IAG Communication and Outreach Branch (COB), and assistant secretary general of IAG
More information • State of Geodesy Report 2026, https://www.un.org/globalgeospatial/ sites/default/files/2026-05/ stateofgeodesy.pdf • IAG GGOS geodetic observations and products, https://geodesy.science/ ggos/ • UN-GGCE, https://www.un.org/ globalgeospatial/en/centre-ofexcellence/geodesy
Issue 4 2026
73
The front cover of Andy Weir’s novel Project Hail Mary. (Image courtesy: Ballantine Group)
Hail Mary: why spatial intelligence needs a universal language Andy Weir’s Book Project Hail Mary (which has recently also been made into a movie) revolves around a deceptively simple question: how can two intelligent beings communicate when they share no common language, history or culture? This is a powerful metaphor for one of today’s greatest challenges. In Project Hail Mary, the protagonist and the alien Rocky eventually succeed in communicating with one another – not by translating words, but by discovering universal concepts. Mathematics becomes their first bridge, physics the second. Shared observations of reality create trust long before they exchange stories. In society today, we increasingly communicate across disciplines rather than across planets. Climate scientists, engineers, urban planners, economists, humanitarian organizations and AI systems all produce enormous amounts of information, yet each speak their own language. Ironically, the more data we generate, the harder it becomes to create genuine shared understanding. Perhaps we have been searching for the wrong universal language. Transforming complexity into understanding For centuries, maps have quietly fulfilled exactly this role. Unlike text, maps transcend
74
Issue 4 2026
spoken languages. Rivers, coastlines, distance and direction require no translation. While every map is an interpretation, the grammar of spatial relationships is remarkably universal. Humans instinctively recognize patterns, connections and structures in space. That is why maps have always appeared whenever society faced complexity. They have helped us navigate oceans, manage disasters, understand disease outbreaks and plan cities. Their real strength has never been displaying data, but transforming complexity into shared understanding. Artificial Intelligence presents us with the same challenge. Foundation models are remarkably capable, yet they communicate through probabilities, embeddings and statistical reasoning that remain opaque to most people. They generate answers, but not always understanding. If AI is to become a trusted partner in decision-making, it must communicate in ways humans can intuitively interpret. Emergence of spatial intelligence This is where cartography enters a new era. For decades, maps have been interfaces between people and geographic information. Tomorrow, they may become interfaces between human intelligence and machine intelligence. Instead of asking people to understand the internal language of AI,
we should ask AI to communicate through spatial representations that humans have refined over thousands of years. Imagine AI revealing not only what it recommends, but why. Imagine uncertainty becoming visible instead of hidden in statistical values. Imagine knowledge graphs transformed into explorable spatial narratives where relationships can be understood rather than merely calculated. This is more than better visualization. It is the emergence of ‘spatial intelligence’ – a future in which maps become dynamic cognitive interfaces where human expertise and artificial intelligence meet, explain and build trust. In Project Hail Mary, survival depends on discovering a language that neither species owns but both can understand. As AI becomes embedded in every sector of society, we face a remarkably similar challenge. Perhaps the future of AI is not about teaching humans to think like machines. Perhaps it is about teaching machines to communicate like maps. By Georg Gartner
More information www.icaci.org
The best SLAM-based mobile scanner in its class. Emesent GX1 is an all-in-one mobile scanner combining SLAM, LiDAR, RTK, PPK and 360 panoramic imagery into a quick-to-deploy unit designed to accelerate survey operations.
See it live at INTERGEO 2026! Booth #B6-D040
Leica AP20 AutoPole and Leica TS20
No matter the job. No matter the challenge. You're ready for it.