Our annual guide
By Christina Wichmann
Editor in Chief
Medical Laboratory Observer’s annual reference guide, Clinical Laboratory Reference (CLR) is the industry’s only complete resource guide providing tables of critical values and high and low critical limits; cutoff concentrations for drug tests; critical values for therapeutic drug levels; adult reference intervals; and pediatric reference intervals. CLR also provides an extensive, alphabetical guide to tests, equipment, and services for the clinical lab market, along with company descriptions and contact information for ordering and pricing.
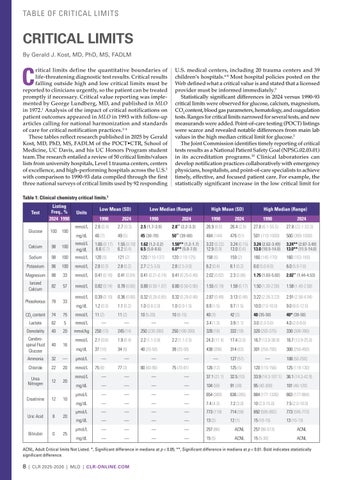
The tables of critical limits, critical values, and reference intervals help laboratorians interpret test results. Laboratory communication of abnormal test results is an essential aspect of patient care. Critical limits establish the upper and lower values that indicate when a patient’s medical condition may be precarious, requiring the immediate attention of the provider who ordered the test. A clinical laboratory critical value is a test result that falls significantly outside the normal reference interval and indicates a potentially life-threatening situation requiring immediate medical attention. Clinical laboratory reference intervals (also known as reference ranges) are the set of values used by healthcare providers to interpret laboratory test results. These intervals represent the expected range of values for a healthy population and help determine whether a patient’s test result is normal, low, or high. These decision tools assist in one of the top goals in healthcare: timely communication.
I want to thank our committed reviewers of these tables; without them this important resource would not be available:
• The tables of critical limits and values were reviewed and updated by Gerald Kost, MD, PhD, MS, FADLM of the POCT•CTR, School of Medicine, UC Davis, and his UC Honors Program student team. A new point-of-care testing critical limits table is included this year based on their research published March 2025 in “Visualization of Critical Limits and Critical Values Facilitates Interpretation” in Diagnostics.
• The cutoff concentrations for drug tests table was reviewed by Suhash Harwani, PhD, Senior Director of Science for Workforce Health Solutions at Quest Diagnostics. Fentanyl is newly added this year based on the “Mandatory Guidelines for Federal Workplace Drug Testing Programs— Authorized Testing Panels” published January 16, 2025, in the Federal Register.
• The critical values for therapeutic drug values table was reviewed and updated by Rajasri Chandra, MS, MBA.
• The table of reference intervals was reviewed and updated by Sean T. Campbell, PhD, DABCC, FADLM, Clinical Biochemist, Mount Sinai Hospital, Toronto, ON.
• The pediatric reference intervals table was reviewed and updated by Khosrow Adeli, PhD, FCACB, DABCC, FADLM, Head, Clinical Biochemistry, Hospital for Sick Children and Principle Investigator – CALIPER Program, along with Erin Brady, MLO Managing Editor. Lastly, I hope you enjoy reading “Top trends in the clinical lab” by Erin Brady. Five laboratory industry professionals provided their insights on the top trends they are seeing in the lab world around topics such as artificial intelligence, automation, data analytics, staffing challenges in rural laboratories, continued growth of point-of-care testing, and lab safety challenges.
For the online version of CLR, please visit www.clr-online.com.
For comments or feedback on CLR, please feel to reach out to me at cwichmann@ mlo-online.com.
Vol. 57, No. 7
PUBLISHER Chris Driscoll cdriscoll@endeavorb2b.com
EDITOR IN CHIEF Christina Wichmann cwichmann@mlo-online.com
MANAGING EDITOR Erin Brady ebrady@endeavorb2b.com
PRODUCTION MANAGER Edward Bartlett
ART DIRECTOR Kelli Mylchreest
AUDIENCE DEVELOPMENT/LIST RENTALS Laura Moulton | lmoulton@endeavorb2b.com
ADVERTISING SERVICES MANAGER Karen Runion | krunion@endeavorb2b.com
ADVERTISING
DIRECTOR OF SALES
EAST COAST/MIDWEST SALES, CLASSIFIEDS Carol Vovcsko (941) 321-2873 | cvovcsko@mlo-online.com
SOUTH/WEST COAST/ILLINOIS SALES Lora Harrell (941) 328-3707 | lharrell@mlo-online.com
MLO EDITORIAL ADVISORY BOARD
John Brunstein, PhD, Biochemistry (Molecular Virology) President & CSO PathoID, Inc., British Columbia, Canada
Lisa-Jean Clifford, COO & Chief Strategy Officer Gestalt, Spokane, WA
Barbara Strain, MA, SM(ASCP), CVAHP Principal, Barbara Strain Consulting LLC, Formerly Director, Value Management, University of Virginia Health System, Charlottesville, VA
Jeffrey D. Klausner, MD, MPH Professor of Preventive Medicine in the Division of Disease Prevention, Policy and Global Health, Department of Preventive Medicine at University of Southern California Keck School of Medicine. Donna Beasley, DLM(ASCP), Director, Huron Healthcare, Chicago, IL
Anthony Kurec, MS, H(ASCP)DLM, Clinical Associate Professor, Emeritus SUNY Upstate Medical University, Syracuse, NY
Suzanne Butch, MLS(ASCP)CM, SBBCM, DLMCM Freelance Consultant, Avon, OH
Paul R. Eden, Jr., MT(ASCP), PhD, Lt. Col., USAF (ret.), (formerly) Chief, Laboratory Services, 88th Diagnostics/Therapeutics Squadron, Wright-Patterson AFB, OH
Daniel J. Scungio, MT (ASCP), SLS, CQA (ASQ), Consultant at Dan the Lab Safety Man and Safety Officer at Sentara Healthcare, Norfolk, VA CORPORATE TEAM
CEO Chris Ferrell
COO Patrick Rains
CRO Paul Andrews
CDO Jacquie Niemiec
CALO Tracy Kane
CMO Amanda Landsaw EVP HEALTHCARE, CITY SERVICES & DIGITAL INFRASTRUCTURE Kylie Hirko 30 Burton Hills Blvd., Suite 185 Nashville, TN 37215 800-547-7377 | www.mlo-online.com
Medical Laboratory Observer USPS Permit 60930, ISSN 0580-7247 print, ISSN 2771-6759 online is published 10 times annually (Jan, Mar, Apr, May, Jul, Aug, Aug-CLR, Sep, Oct, Nov) by Endeavor Business Media, LLC. 201 N Main St 5th Floor, Fort Atkinson, WI 53538. Periodicals postage paid at Fort Atkinson, WI, and additional mailing offices. POSTMASTER: Send address changes to Medical Laboratory Observer, PO Box 3257, Northbrook, IL 60065-3257. SUBSCRIPTIONS: Publisher reserves the right to reject non-qualified subscriptions. Subscription prices: U.S. $160.00 per year; Canada/Mexico $193.75 per year; All other countries $276.25 per year. All subscriptions are payable in U.S. funds. Send subscription inquiries to Medical Laboratory Observer, PO Box 3257, Northbrook, IL 60065-3257. Customer service can be reached toll-free at 877-382-9187 or at MLO@ omeda.com for magazine subscription assistance or questions. Printed in the USA. Copyright 2025 Endeavor Business Media, LLC. All rights reserved. No part of this publication may be reproduced or transmitted in any
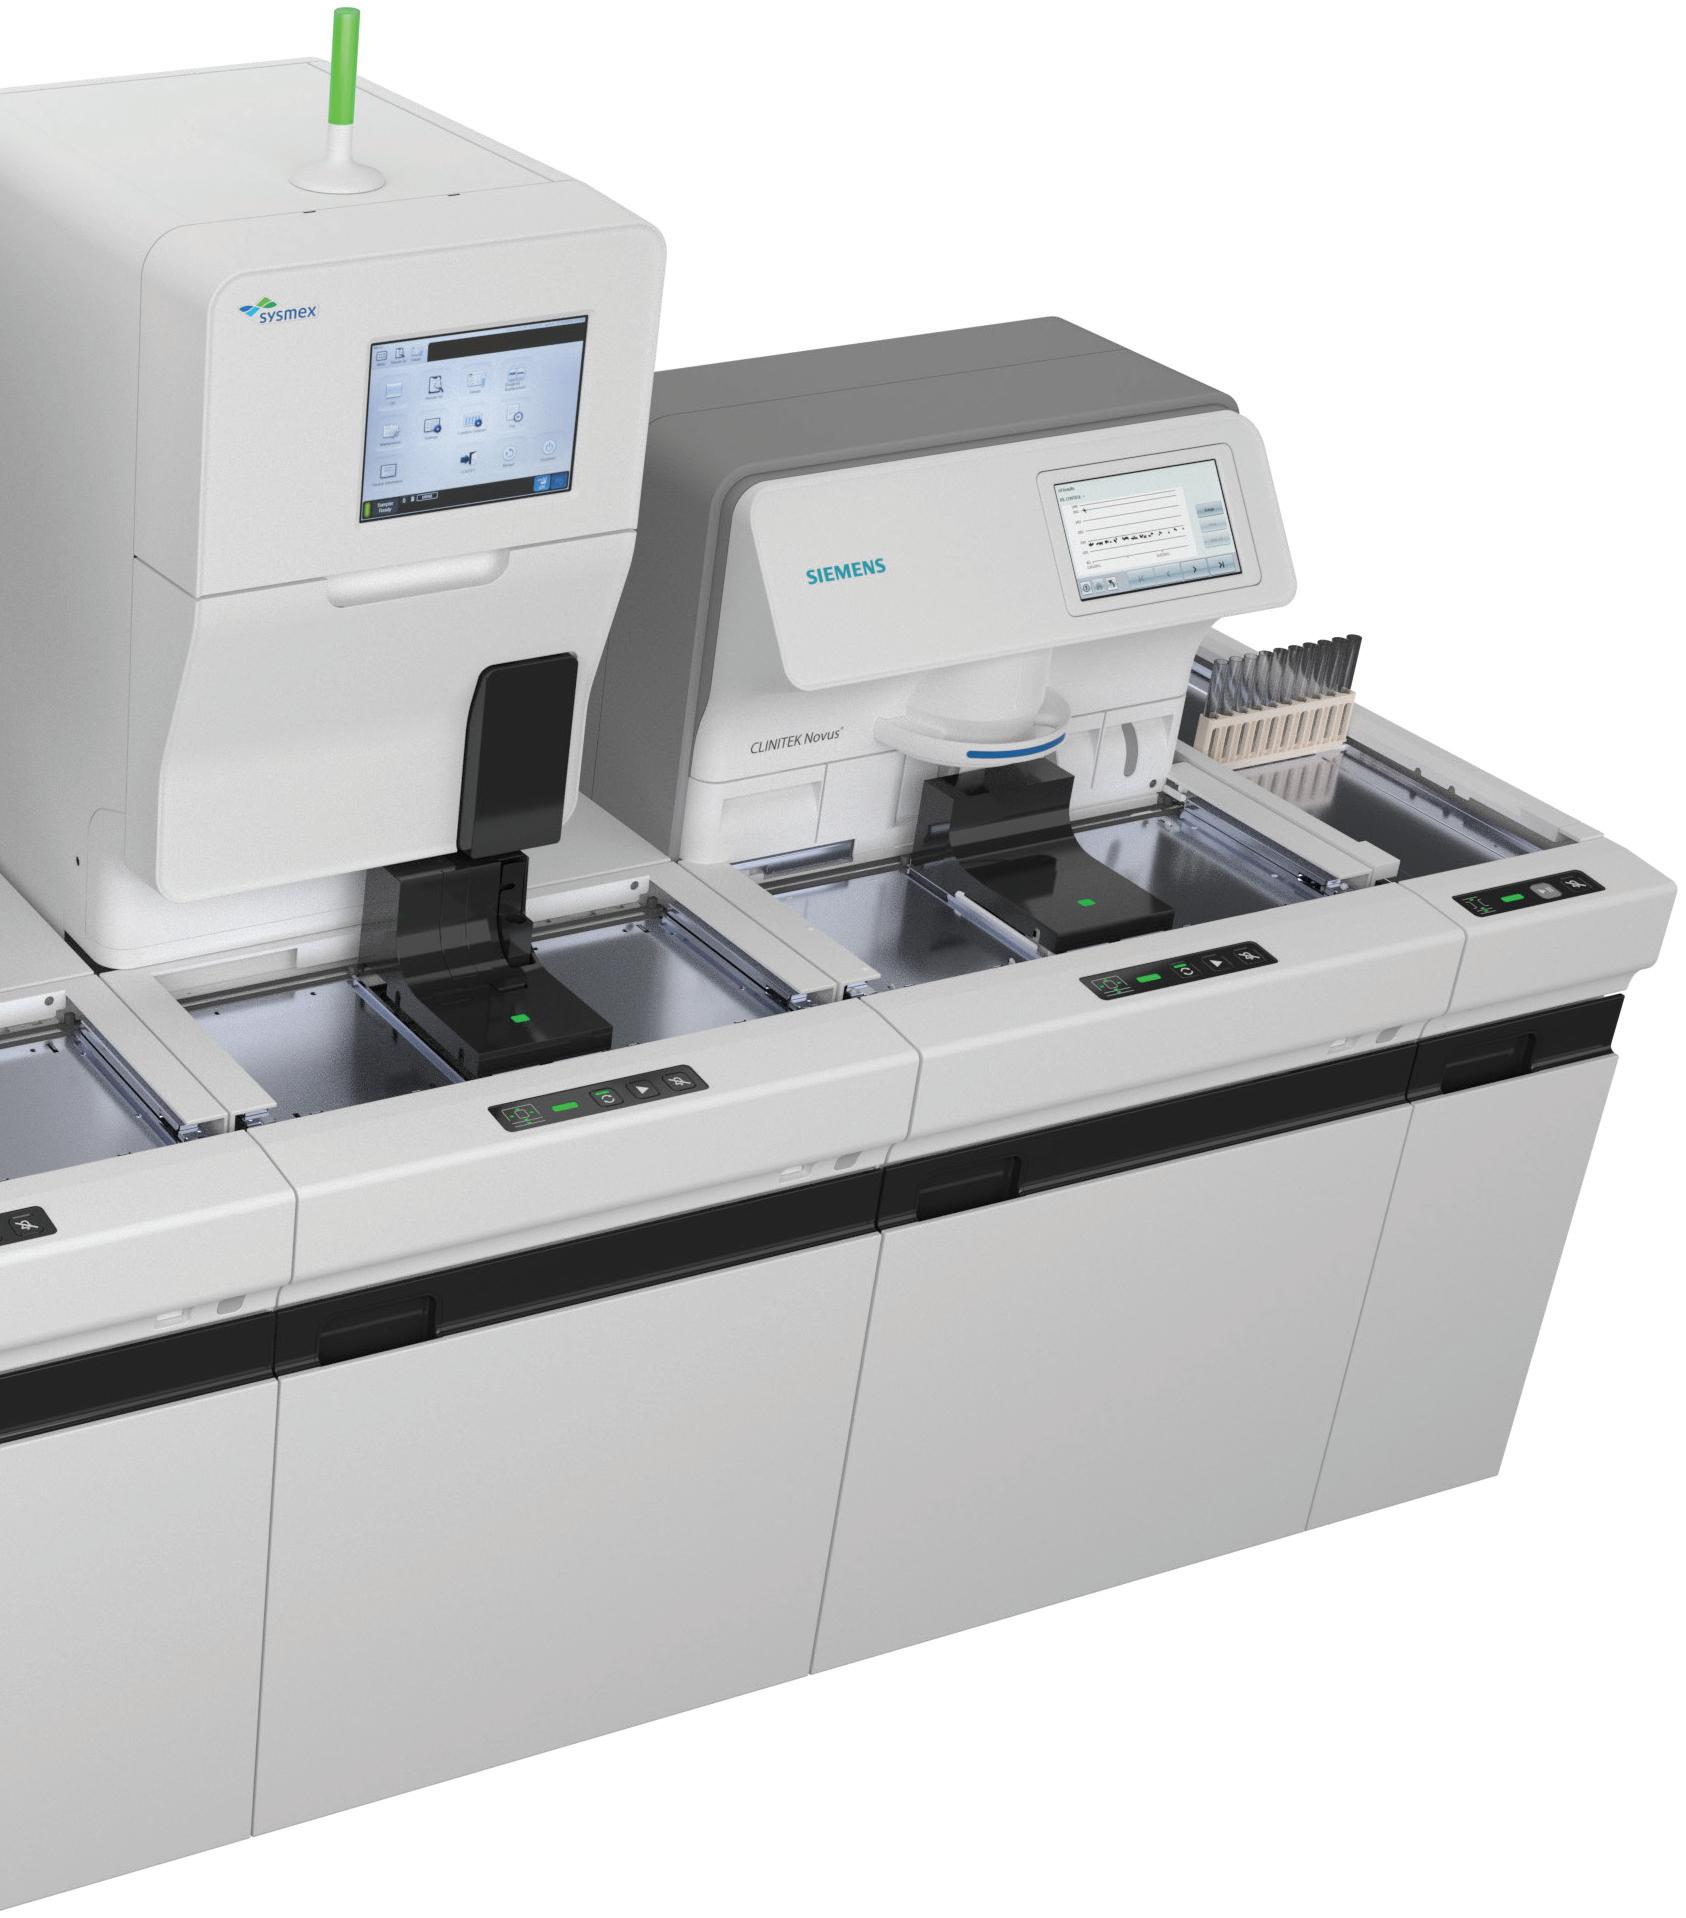
Sysmex UF-5000™ Automated Urine Particle Analyzer
Discover what automation is truly meant to be with the UN-2000™ Automated Urinalysis Solution. With fluorescent flow cytometry at its core, the Sysmex UN-2000 combines world-class reagent pad chemistry and state-of-the-art urine element identification to provide your lab with walkaway urinalysis testing. Siemens CLINITEK Novus® Automated Urine Chemistry Analyzer
Learn more at Sysmex.com/UA
86% of respondents report the UN-Series has improved urinalysis bench productivity* Our techs now have four to five extra hours to do other things, like time to look at body fluids or help somewhere else. They’re not stuck looking at urine all day.
Top trends in the clinical lab
2025 has been an eventful year for the clinical laboratory industry with the overturning of the U.S. Food and Drug Administration’s (FDA) Laboratory Developed Test (LDT) rule, the U.S. Department of Health and Human Services (HHS) restructuring and cuts, and the continued rise of artificial intelligence (AI). On top of that, staffing shortages and burnout continue to burden labs.
By Erin Brady
MLO asked professionals what trends they’ve been observing in labs so far this year. Here is what they said:
AI and automation
Lisa-Jean Clifford, President, Gestalt Diagnostics
We are experiencing the advancement and increase in adoption of digital pathology solutions to enhance pathologists’ workflows. There is also a focus on incorporating AI to improve accuracy and reduce fatigue for pathologists in their interpretation of cases. This also provides faster turn around times.
Another trend in AI automation is that for workflow optimization within the organization; with AI being used in administrative functions and analysis in business process improvement. Generative AI is being used, or at least piloted for use, by many organizations to help improve non-diagnostic work – more as an assistant in items like note taking, reporting, communications, etc.
We are also seeing a big push for cross-specialty communication and collaboration on patients both in the diagnosis and the treatment decisions for patients. This area will continue to evolve as a focus on things like enterprise imaging and data value continues.
Adapting to workforce challenges in rural clinical laboratories
Lynn Evans, Director of Human Resources, Interpath Laboratory
A key trend we’re observing across clinical laboratories in 2025 is the growing emphasis on workforce flexibility and remote-enabled operations—an especially important evolution for rural labs like ours. Our core reference laboratory in Pendleton, Oregon, manages a high testing volume with
limited staff, requiring our medical laboratory scientists (MLS) to maintain deep specialization in their disciplines. While this ensures accuracy and efficiency, it makes cross-training difficult, even though we recognize it as a best practice for long-term sustainability.
To help address these challenges, we’ve begun adopting digital imaging platforms that allow for remote review and analysis by qualified MLS professionals. This advancement has expanded our ability to recruit top-tier talent beyond our immediate geographic region—an enormous benefit in a rural setting where it can be difficult to attract and retain highly specialized laboratory staff. From an HR standpoint, this technology supports more flexible staffing models while maintaining the high standards required for diagnostic accuracy. As we continue to evolve, we’re focused on balancing specialization with gradual cross-training initiatives and leveraging technology to build a more agile, resilient workforce.
The 3 ‘As’ – Automation, Analytics, AI
Kim Futrell, MLS(ASCP), BSHI, Senior Strategic Marketing Manager, Orchard Software
In 2025, the push is for clinical laboratories to be more efficient than ever due to continued staffing shortages. The good news is that there are advances in technology helping that efficiency along. For instance, laboratories can expect to see continued advancements in automation, AI, and data analytics. Automation systems are being deployed to handle manual aliquoting and pre-analytical steps in assay workflows. These systems improve the quality and reliability of results, reduce processing time, and enhance test turnaround time.
AI is revolutionizing laboratory information systems (LIS) by enabling advanced diagnostics, predictive insights, and workflow optimization. AI-powered algorithms assist in automating sample tracking, quality control, and anomaly
detection, providing actionable insights to improve diagnostic accuracy and laboratory efficiency.
Data analytics tools are being integrated into LIS platforms to unlock valuable insights from laboratory data, helping laboratories make informed decisions and drive continuous quality improvement. These trends highlight the growing importance of technology in clinical laboratories, driving improvements in efficiency, accuracy, and patient care.
Continued regulatory & billing uncertainty
Laboratories also continue to face challenges related to billing and reimbursement. Regulatory scrutiny of laboratory billing practices has increased, with a focus on compliance risks and the potential for financial penalties. Laboratories must stay abreast of evolving legal and compliance considerations to avoid violations and ensure the financial health of their operations. Overall, clinical laboratories navigate a multifaceted regulatory environment that includes compliance with CLIA, HIPAA, and other federal and state laws, while also addressing billing and reimbursement challenges.
Continued growth in POCT
Driven by many factors, point-of-care testing (POCT) continues to gain traction. The ability of POCT to provide immediate results is crucial for timely medical interventions. The need to care for a growing geriatric population, increasing prevalence of genetic disorders, and the need for rapid disease diagnosis and prevention are likely to continue to boost the POCT market. Overall, the continued growth in POCT reflects its importance in improving patient care, reducing healthcare costs, and enhancing the efficiency of diagnostics. This often means that laboratories have to oversee and manage POCT, which can be a challenge.
Continued growth in personalized medicine
Personalized medicine is set to continue its rapid growth as well, transforming laboratories and the healthcare landscape. Personalized medicine tailors medical treatment to the individual characteristics of each patient, leveraging advancements in genomics, bioinformatics, and data analytics. Laboratories are increasingly adopting next-generation sequencing (NGS) technologies, enabling faster and more precise genetic testing for disease detection and treatment. The integration of artificial intelligence (AI) and machine learning (ML) is further enhancing the ability to analyze vast amounts of patient data, providing insights that drive personalized treatment plans. Additionally, the rise of mobile health apps and wearable devices is facilitating real-time data collection, improving the accuracy and effectiveness of personalized treatments. As personalized medicine continues to evolve, clinical laboratories will play a crucial role in delivering tailored diagnostics that ultimately improve patient outcomes.
Two lab safety trends in 2025
Dan
Scungio
, MLS (ASCP),
SLS, CQA
(ASQ), Owner, Dan The Lab Safety Man, Inc.
Personal electronic devices
Labs continue to deal with the use of personal electronic devices such as cell phones, ear buds, and fitness trackers.
These items present an infection control risk, but many in lab leadership do not understand the risks or they feel unable to fight the use of this technology. Unfortunately, that is a dangerous pathwaythere are already cases of laboratorians who have been hospitalized for using such devices in the department and bringing them home. Since the addiction to social media and these devices is strong, perhaps leaders should look at e-breaks rather than allowing these devices to continue to generate infection risks for their staff.
Specimen transport
With the pandemic well behind us, many labs are now being pressured by other departments to allow all respiratory specimens to be sent to the lab via the pneumatic tube system (PTS). Although COVID-19 is not as great a concern as it once was, the use of the PTS is still a known aerosol generating process. That means that those who open the tube carriers in the lab are at risk for airborne exposure. This includes influenza, tuberculosis, and even measles. Perform a risk assessment to determine the best practice for transporting respiratory specimens to the lab.
A clinical laboratory trend continues: Data rich and information poor
Barbara Strain, MA, CVAHP, Principal, Barbara Strain Consulting LLC
Laboratory testing is central to healthcare, with ~70% of EMRs containing test results and at least 70% of medical decisions rely on them. As pathologists and technologists reexamine test methods, their priority remains delivering precise, easily interpretable, and actionable data.
All future predications reference AI and it is certainly transforming laboratory diagnostics today. Though still emerging, AI can utilize large data lakes with laboratory and other types of raw test results with patient demographics, symptoms, vital signs, diagnosis, and physiological patterns, to enhance triage in Emergency Departments. With AI likely to also be standard in procedural areas and nursing practice assisting but not taking the place of human trained decision making.
The future of lab AI depends on collaboration among pathologists, technologists, and manufacturers to streamline test validation and development of new test. An AI raw data-driven tool could analyze patient demographics, genetic profiles, disease states, as well as specimen collection methods to automate equipment selection or onboard new test modalities—optimizing efficiency and accelerating precision in healthcare diagnostics. Conversely one article proclaims that AI and machine learning could predict new tests in search to make new diagnoses.1
REFERENCE
1. Cardozo G, Tirloni SF, Pereira Moro AR, Marques JLB. Use of artificial intelligence in the search for new information through routine laboratory tests: Systematic review. JMIR Bioinform Biotechnol 2022;3(1):e40473. doi:10.2196/40473.
TABLE OF REFERENCE INTERVALS
Specimen Test
S
S Vitamin B12 (WHO Recommendation)
S Vitamin D (25-OH)
B
Specimens: B, whole blood; P, plasma; S, serum. Reference intervals depend on test method and the demographics of the normal population used.
*Adult intervals (18Y-60Y). Age specific ranges apply for pediatric and/or geriatric populations.
Source: Burtis CA, Bruns DE. Tietz Fundamentals of Clinical Chemistry and Molecular Diagnostics. 7th ed. St. Louis, MO; Elsevier; 2015 and Rifai, N, Horvath AR, Wittwer, CT. Tietz Textbook of Clinical Chemistry and Molecular Diagnostics, 6th ed. St. Louis, MO; Elsevier; 2018 McPherson RA, Pincus MR. Henry’s Clinical Diagnosis and Management by Laboratory Methods. 22nd ed. Philadelphia, PA: Elsevier Saunders; 22nd ed; 2011. Revised 2025 by S. T. Campbell, PhD, DABCC, FADLM, Clinical Biochemist, Mount Sinai Hospital, Toronto, ON.
Albumin G1,2
Specimen Type: Serum
Instrument/Reagent: Abbott Architect
0−
ALT (Alanine
Aminotransferase)1,2
Specimen Type: Serum
Instrument/Reagent: Abbott Architect
1−
ALP (Alkaline Phosphatase)1,2
Specimen Type: Serum
Instrument/Reagent: Abbott Architect
1− <10 years 156−369 156−369
10− <13 years 141−460 141−460
13− <15 years 127−517 62−280
15− <17 years 89−365 54−128
17− <19 years 59−164 48−95
Bilirubin, total1 ,2
Specimen Type: Serum
Instrument/Reagent: Abbott Architect
0− <15 days 0.2−16.6 15 days− <1 year 0.1−0.7
1− <9 years 0.1−0.4 9− <12 years
Calcium1,2 Specimen Type: Serum
Instrument/Reagent: Abbott Architect
Carbon Dioxide CO21,2
Specimen Type: Serum
Instrument/Reagent: Abbott Architect
Chloride1,3
Specimen Type: Serum
Instrument/Reagent: Siemens ADVIA XPT/1800
0- <19 years 104-109
C−Reactive Protein- High Sensitivity (hsCRP)1,2
Specimen Type: Serum
Instrument/Reagent: Abbott Architect
Creatine Kinase (CK)1,3
Specimen Type: Serum
Instrument/Reagent: Siemens ADVIA XPT/1800
The information in this chart was updated by MLO Staff based on the CALIPER database1 and reviewed by Khosrow Adeli, PhD, FCACB, DABCC, FADLM, Head, Clinical Biochemistry at The Hospital for Sick Children and Principle Investigator of the CALIPER Program. The reviewed chemistries are comparable to those listed in MLO's original Pediatric Reference Intervals chart, last updated in 2022. For reference intervals obtained by other lab instruments, see the CALIPER database.1
Magnesium1,2
Specimen Type: Serum
Instrument/Reagent: Abbott Architect
and Female (mg/dL)
0- <15 days 1.99- 3.94
15 days to <1 year 1.97- 3.09
1 to <19 years 2.09- 2.84
Potassium1,3
Specimen Type: Serum
Instrument/Reagent: Siemens ADVIA XPT/1800
<1year 4.3-6.7
Protein, Total1,2
Specimen Type: Serum
Instrument/Reagent: Abbott Architect Age Male and Female (g/dL)
0− <15 days 5.3−8.3
Sodium Serum1,3
Creatinine (Enzymatic)1,2
Specimen Type: Serum
Instrument/Reagent: Abbott Architect
Specimen Type: Serum
Instrument/Reagent:
REFERENCES
Glucose (Random)1,3
Specimen Type: Serum
Instrument/Reagent: Siemens ADVIA XPT/1800
and
<19 years
High−Density Lipoprotein Cholesterol (HDL−C)1,2 Specimen Type: Serum
Specimen Type: Serum Instrument/Reagent:
Specimen Type: Serum Instrument/Reagent:
1. CALIPER Pediatric Reference Interval Database. CALIPER. Accessed May 20, 2025. https://caliper.research.sickkids.ca/#/.
2. Colantonio DA, Kyriakopoulou L, Chan MK, et al. Closing the gaps in pediatric laboratory reference intervals: a CALIPER database of 40 biochemical markers in a healthy and multiethnic population of children. Clin Chem 2012;58(5):854-868. doi:10.1373/clinchem.2011.177741.
3. Tahmasebi H, Higgins V, Woroch A, Asgari S, Adeli K. Pediatric reference intervals for clinical chemistry assays on Siemens ADVIA XPT/1800 and Dimension EXL in the CALIPER cohort of healthy children and adolescents. Clin Chim Acta. 2019;490:88-97. doi:10.1016/j.cca.2018.12.011.
4. Higgins V, Asgari S, Chan MK, Adeli K. Pediatric reference intervals for calculated LDL cholesterol, non-HDL cholesterol, and remnant cholesterol in the healthy CALIPER cohort. Clin Chim Acta. 2018;486:129-134. doi:10.1016/j. cca.2018.07.028.
The following section includes company descriptions with their essential laboratory products and contact information for ordering and pricing. Also available online at: CLR-online.com
ARKRAY USA
801 S Marquette Ave, #200 Minneapolis, MN, 55402, US
TEL: 952-646-3200
CORELAB@ARKRAYUSA.COM
HTTPS://www.arkrayusa.com
ARKRAY is a leader in the blood glucose monitoring market with a dominant market share in long term care. ARKRAY continues to evolve and innovate its product lines and programs to meet the changing needs of the industry including oral wellness innovations that benefit patients and provide health care professionals with new tools to care for them. For healthcare providers, this means access to cutting edge and reliable products combined with superior customer support. With products and programs that reach throughout the industry, ARKRAY has become the trusted source across the healthcare continuum.
CAROLINA LIQUID CHEMISTRIES CORP.
313 Gallimore Dairy Rd Greensboro, NC, 27409, US
TEL: 877-722-8910
CONTACTSALES@CAROLINACHEMISTRIES.COM
HTTPS://www.carolinachemistries.com
Carolina Liquid Chemistries (CLC) offers high quality, low-cost clinical chemistry analyzers for laboratories of all sizes along with a menu of over 80 different reagents for use on a variety of instruments. The CLC floor models consist of the CLC800, CLC1600, and the ultra-high-speed CLC6410. CLC also offers two benchtop chemistry analyzers: The EasyRA® performs urine drug screens and general chemistry tests, while the DZ-Lite™ c270 offers general chemistries, urine drug screens including fentanyl, and special chemistries including procalcitonin. Both are excellent for
laboratories in emergency departments, urgent care, and oncology practices. CLC offers a complete laboratory solution that also includes hematology and immunoassay analyzers. CLC continues to sell bar coded reagents for use on AU480® and AU680® analyzers along with affordable service contracts. CLC is veteran-owned.
CLINICAL SOFTWARE SOLUTIONS
PO Box 529
Queen Creek, AZ, 85142, US
TEL: 480-888-9447
CLIN1INFO@CLIN1.COM
HTTPS://www.clin1mobile.net
There’s nothing that gives us more pleasure than helping our client facilities become more successful by helping them manage their laboratory and patient information. We pride ourselves in the “personal touch” and try to go above and beyond to provide software and support that is unrivaled in the healthcare industry. With over 30 years of experience, we still delight in building innovative, intuitive software to keep our clients on the cutting edge of clinical software technology.
We see you as our partners in success because your success is our success.
DIASORIN
12112 Technology Blvd, Suite 130 Austin, TX, 78727, US
TEL: 512-219-8020
SUPPORT@LUMINEXCORP.COM
HTTPS://us.diasorin.com/en/moleculardiagnostics
See ad on inside back cover
Sample-to-Customizable Answers for Your Respiratory Testing
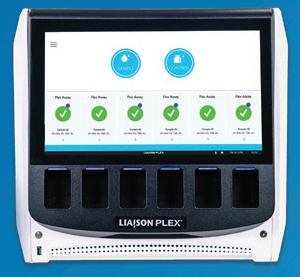
The LIAISON PLEX® System is uniquely designed to provide full flexibility in the customization of
syndromic panels and will allow clinical laboratory staff to overcome the constraint of the “one size fits all” approach for infectious disease syndromic diagnostics. This fully automated, easy to use, sample-toanswer system has a streamlined workflow and a room-temperature consumable. The operational handson time is only two minutes per sample and results are produced in less than two hours.
The LIAISON PLEX® Respiratory Flex Assay is the first assay cleared for use on our new LIAISON PLEX System. Testing for 19 pathogens commonly associated with respiratory infections—including 14 viral and 5 bacterial targets—the LIAISON PLEX Respiratory Flex Assay gives users the choice to process and pay for a specific subset of customized results based on patient needs. Compared to standard panel testing, this method can improve clinical utility while decreasing cost burdens on patients and healthcare systems. Through the application of panel testing, patient care and treatment can be optimized in support of diagnostic stewardship efforts, thus enabling proper patient therapies and reducing costly over-testing. Modernize your respiratory testing with sample-to-customizable answer capabilities—discover how the LIAISON PLEX Respiratory Flex Assay will address your lab’s current and future needs while battling the rising cost of patient care.
HARDY DIAGNOSTICS
1430 W McCoy Ln Santa Maria, CA, 93455, US
TEL: 805-346-2766
CUSTSERVICE@HARDYDIAGNOSTICS.COM
HTTPS://hardydiagnostics.com
See ad on page 15
Hardy Diagnostics is an FDA-licensed manufacturer of medical devices for microbiological testing with an ISO 13485 certified Quality Management System. The company manufactures and distributes thousands of products for the culture and identification of bacteria and
a variety of laboratory system solutions and services that improve patient care. Orchard serves more than 2,400 laboratories across the country, helping them improve efficiency, reduce errors, and enhance integration. Orchard’s cloud-based solutions are installed in physician groups and clinics, hospitals, independent reference labs, student health centers, veterinary labs, public health organizations, universities, and retail facilities.
Our Vision, Mission, & Values
Our team of expert employees are dedicated to making Orchard the LIS market leader in the physician office lab, public health lab, and reference lab markets, as well as a point-ofcare market leader in the ambulatory and hospital markets.
PROLINE LABORATORY FURNITURE
10 Avco Rd Haverhill, MA, 01835, US
BENCH@1PROLINE.COM
HTTPS://www.1proline.com
Proline Laboratory Furniture and Tables offers a modular design that al lows you to configure laboratory to meet your requirement. Offering multiple work surface choices including but not limited to Epoxy Res in, Stainless Steel and economical Chem-Guard chemical resistant work surfaces. Cabinets offer 90 percent ex tension slides with 150 pounds capacity. Economical laboratory tables with hanging cabinets and casters offering a truly modular ergonomic design.
PURITAN MEDICAL PRODUCTS CO
31 School St, PO Box 149 Guilford, ME, 04443, US
TEL: 207-876-3311
SALES@PURITANMEDPRODUCTS.COM
HTTPS://www.puritanmedproducts.com
A tradition of excellence Puritan is now in our 106th year of business. We founded our company on the principles of pride in achieving excellence and determination to succeed. Our customers know us as the swab experts, with a focus on quality, consistency, outstanding customer service, and our commitment to partnering with them in their pursuit of these same principles.
When you’ve been around since 1919, change is inevitable. While we’ve certainly grown, one thing that’s never changed at Puritan is our incredibly high standards. This commitment and attention to detail are why we have a worldwide reputation for consistent quality. In fact, we regularly go beyond for our own QC satisfaction because it is extremely important to us that every product we make is the best of its kind.
Our manufacturing facility is ISO certified and CE mark registered, so you can be certain we adhere to the strictest quality guidelines. We’ll deliver excellent products and services across our organization every time, on time. That’s our promise to you.
Order with confidence, knowing our products are manufactured, packaged, and shipped from our state-of-the-art facilities in Maine, USA.
SEKISUI DIAGNOSTICS LLC
1 Wall Street Burlington, MA, 01803, US
TEL: 781-652-7800
QUESTIONS@SEKISUI-DX.COM
HTTPS://www.sekisuidiagnostics.com
See ad on back cover
With over 40 years of experience, SEKISUI Diagnostics’ mission is to provide intelligent solutions to enhance life with science and improve the health of all people. We supply innovative medical diagnostics globally to physicians, hospitals, laboratories and alternate testing locations.
O ur product lines include clinical chemistry reagents, point-of-care
tests, blood collection tube materials as well as enzymes and specialty biochemicals.
STAFFREADY
421 W Main Ave, Suite 201 Spokane, WA, 99201, US
TEL: 877- 229-5230
SOLUTIONS@STAFFREADY.COM
HTTPS://www.staffready.com
Healthcare leaders face increasing demands, strict regulations, and limited resources. StaffReady simplifies workforce operations with cloud-based solutions for scheduling, compliance, and document control, all customized to fit your organization’s needs.
With over 20 years of healthcare and laboratory expertise, StaffReady helps centralize schedules, competencies, documents, policies, tasks, alerts, and communication. The result is streamlined operations and smoother inspections.
Our quality management tools help keep your teams efficient, compliant, and connected, regardless of your organization’s size or location. With StaffReady, work doesn’t have to feel like labor.
SYSMEX AMERICA, INC.
577 Aptakisic Rd
Lincolnshire, IL, 60069, US
TEL: 888-879-7639
COMMUNICATIONS@SYSMEX.COM
HTTPS://www.sysmex.com/us
See ad on page 5
A Portfolio of Solutions you need for the lab of tomorrow
Hematology Solutions
• As a global leader in hematology, we’re proud to offer labs of all sizes award-winning services and innovative solutions.
Hemostasis Solutions
• Our innovative portfolio of
hemostasis analyzers, reagents and controls are designed with quality and efficiency in mind. We provide advanced hemostasis technology across multiple platforms.
Urinalysis Solutions
• With fluorescent flow cytometry technology at its core, the Sysmex UN-Series offers an innovative urinalysis solution for any size laboratory.
Flow Cytometry Solutions
• Our comprehensive Flow Cytometry solutions include automated sample preparation, flow cytometers, filters, reagents, monoclonal antibodies and analytical software.
Informatics Solutions
• From highly secure test results and impactful performance metrics to quality control management, our software is designed to help your lab streamline its clinical and operational workflows so you can provide optimal patient care.
For more information about Sysmex solutions, visit www.sysmex.com/us
TECHCYTE
105 S State St, #401 Orem, UT, 84058, US
SALES@TECHCYTE.COM
HTTPS://www.techcyte.com
Techcyte is transforming the practice of pathology through a unifi ed, AI-powered digital platform that streamlines complex workfl ows, integrates with core lab systems, and enhances communication across the lab. Built to reduce ineffi ciencies and diagnostic variability, Techcyte aims to help pathologists and lab professionals deliver faster, more consistent diagnoses. By partnering with leading laboratories, scanner manufacturers, diagnostic hardware providers, and AI developers, together, we deliver a unifi ed digital pathology and diagnostics platform to labs and clinics around the world, furthering our mission to positively impact the health of humans, animals, and the environment.
EQUIPMENT & SERVICES
Automation & Workflow
Automation
clinical software solutions
Hardy diagnostics
See ad on page 15
LgP Lab automation
Barcode Products
clinical software solutions
Health care Logistics
See ad on page 34
Decapping & Recapping
LgP Lab automation
Information Systems & Software
Healthcare Information Systems clinical software solutions
Lab Software & Computer Systems
clinical software solutions
orchard software corporation staffReady
sysmex america, inc.
See ad on page 5
Laboratory Information Systems clinical software solutions
orchard software corporation staffReady
sysmex america, inc.
See ad on page 5
Next Generation
Sequencing Software
orchard software corporation
Sample Management Systems
clinical software solutions
sysmex america, inc.
See ad on page 5
Specimen Management Systems
clinical software solutions
Puritan Medical Products co
Lab Instruments & Analyzers
Analyzers
arkray usa
carolina Liquid chemistries corp.
Hardy diagnostics
See ad on page 15
sysmex america, inc.
See ad on page 5
Centrifuges
Hardy diagnostics
See ad on page 15
Health care Logistics
See ad on page 34
Dry Baths
Health care Logistics
See ad on page 34
Incubators
Hardy diagnostics
See ad on page 15
Health care Logistics
See ad on page 34
Microscopes & Accessories
Hardy diagnostics
See ad on page 15
Mixers & Shakers
Health care Logistics
See ad on page 34
Sample Stirrers
Health care Logistics
See ad on page 34
Slide Stainers
Hardy diagnostics
See ad on page 15
sysmex america, inc.
See ad on page 5
Staining
sysmex america, inc.
See ad on page 5
Staining & Coverslipping
sysmex america, inc.
See ad on page 5
techcyte
Water Baths
Health care Logistics
See ad on page 34
Lab Supplies & Consumables
Apparel
Hardy diagnostics
See ad on page 15
Health care Logistics
See ad on page 34
Furniture & Storage
Health care Logistics
See ad on page 34
Proline Laboratory Furniture
Glassware & Cleaning
Hardy diagnostics
See ad on page 15
Health care Logistics
See ad on page 34
Labels
Health care Logistics
See ad on page 34
Laboratory Supplies
Hardy diagnostics
See ad on page 15
Health care Logistics
See ad on page 34
Puritan Medical Products co
Needles
Health care Logistics
See ad on page 34
Pipettes & Tips
Hardy diagnostics
See ad on page 15
Health care Logistics
See ad on page 34
Reagents
carolina Liquid chemistries corp.
diasorin
See ad on inside back cover
Hardy diagnostics
See ad on page 15
Health care Logistics
See ad on page 34
KRoNus, inc.
See ad on inside front cover
seKisui diagnostics LLc
See ad on back cover
sysmex america, inc.
See ad on page 5
Test Tube Racks
Hardy diagnostics
See ad on page 15
Health care Logistics
See ad on page 34
Tubes
Hardy diagnostics
See ad on page 15
Health care Logistics
See ad on page 34
Urinalysis, Controls
arkray usa
Health care Logistics
See ad on page 34
sysmex america, inc.
See ad on page 5
Phlebotomy & Sample Collection
Phlebotomy Products And Supplies
Health care Logistics
See ad on page 34
Specimens, Storage Equipment
Health care Logistics
See ad on page 34
Quality & Compliance
Education, Proficiency & Accreditation
clinical software solutions staffReady sysmex america, inc.
See ad on page 5
Error Prevention
clinical software solutions
Health care Logistics
See ad on page 34
HIPAA Compliance
clinical software solutions
Health care Logistics
See ad on page 34
Individualized Quality Control Plan (IQCP) Implementation Tools
clinical software solutions
Quality Management Tools
clinical software solutions
Health care Logistics
See ad on page 34
orchard software corporation staffReady
sysmex america, inc.
See ad on page 5
Safety & Environment
Cleanrooms
Hardy diagnostics
See ad on page 15
Health care Logistics
See ad on page 34
Puritan Medical Products co
Safety Products
Health care Logistics
See ad on page 34
LgP Lab automation
Temperature Monitoring, Automated
Health care Logistics
See ad on page 34
Temperature Monitoring, Continuous
Health care Logistics
See ad on page 34
Waste & Hazardous Material
Health care Logistics
See ad on page 34
Water
Health care Logistics
See ad on page 34
Specialty Products & Services
Biochemistry Products & Services
arkray usa
carolina Liquid chemistries corp. diasorin
See ad on inside back cover
Blood Bank & Transfusion
sysmex america, inc.
See ad on page 5
Blood Bank, Instrumentation
Health care Logistics
See ad on page 34
sysmex america, inc.
See ad on page 5
Diagnostic Services & Products
Hardy diagnostics
See ad on page 15
Puritan Medical Products co
sysmex america, inc.
See ad on page 5
Kappa Light Chains carolina Liquid chemistries corp.
Manufacturing Services clinical software solutions
Health care Logistics
See ad on page 34
Puritan Medical Products co
Microbiology Products & Services
Hardy diagnostics
See ad on page 15
Health care Logistics
See ad on page 34
Puritan Medical Products co
Molecular Biology, Products & Services
Health care Logistics
See ad on page 34
Puritan Medical Products co
Pap Test Products
Puritan Medical Products co techcyte
Pathology Products & Services
Health care Logistics
See ad on page 34
Toxicology Products & Services
carolina Liquid chemistries corp. clinical software solutions
Health care Logistics
See ad on page 34
Urinalysis, Automated arkray usa
Health care Logistics
See ad on page 34
sysmex america, inc.
See ad on page 5
Virology Products & Services
diasorin
See ad on inside back cover
Hardy diagnostics
See ad on page 15
Puritan Medical Products co
TESTS
Clinical Chemistry/Biochemistry
Aldolase
carolina Liquid chemistries corp.
Alkaline Phosphatase (alp) carolina Liquid chemistries corp.
seKisui diagnostics LLc
See ad on back cover
Alt (ifcc)
seKisui diagnostics LLc
See ad on back cover
Amylase (amy), Serum carolina Liquid chemistries corp. seKisui diagnostics LLc
See ad on back cover
Aspartate Aminotransferase (ast) carolina Liquid chemistries corp. seKisui diagnostics LLc
See ad on back cover
Beta Hydroxybutyrate
seKisui diagnostics LLc
See ad on back cover
Cardiac Risk Assessment
carolina Liquid chemistries corp.
Cholesterol, total carolina Liquid chemistries corp.
Cholinesterase
seKisui diagnostics LLc
See ad on back cover
Clinical Free Fatty Acids (NEFA)
seKisui diagnostics LLc
See ad on back cover
C-Reactive Protein
carolina Liquid chemistries corp.
seKisui diagnostics LLc
See ad on back cover
Creatine Kinase Assays (CK)
carolina Liquid chemistries corp.
seKisui diagnostics LLc
See ad on back cover
CSF Test Kits
seKisui diagnostics LLc
See ad on back cover
Gamma-Glutamyl
Transpeptidase (GGT)
carolina Liquid chemistries corp.
seKisui diagnostics LLc
See ad on back cover
Glycated Serum Protein (GSP) Assay
seKisui diagnostics LLc
See ad on back cover
Haptoglobin Assays (HAPT)
seKisui diagnostics LLc
See ad on back cover
High-Density Lipoprotein, Direct
carolina Liquid chemistries corp.
seKisui diagnostics LLc
See ad on back cover
Homocyst(e)ine, Plasma Or Serum
carolina Liquid chemistries corp.
seKisui diagnostics LLc
See ad on back cover
Iron & Iron-Binding Protein Assays
carolina Liquid chemistries corp.
seKisui diagnostics LLc
See ad on back cover
Lactate (LAC)
carolina Liquid chemistries corp.
seKisui diagnostics LLc
See ad on back cover
Lipase, Serum (LIP)
carolina Liquid chemistries corp.
seKisui diagnostics LLc
See ad on back cover
Lipoprotein (a)
carolina Liquid chemistries corp.
seKisui diagnostics LLc
See ad on back cover
Lipoproteins & Apolipoproteins
carolina Liquid chemistries corp.
seKisui diagnostics LLc
See ad on back cover
Low-Density Lipoprotein
Cholesterol (direct)
carolina Liquid chemistries corp.
seKisui diagnostics LLc
See ad on back cover
Microprotein
seKisui diagnostics LLc
See ad on back cover
Phosphorus, Inorganic (PHOS)
carolina Liquid chemistries corp.
seKisui diagnostics LLc
See ad on back cover
Protein, total carolina Liquid chemistries corp.
Total Bilirubin (TBIL)
carolina Liquid chemistries corp.
seKisui diagnostics LLc
See ad on back cover
Triglyceride (TRIG)
carolina Liquid chemistries corp.
seKisui diagnostics LLc
See ad on back cover
Clinical
Beta-2 Microglobulin
seKisui diagnostics LLc
See ad on back cover
Endocrinology
Diabetes Mellitus
KRoNus, inc.
See ad on inside front cover
Diabetes Testing & Management
sysmex america, inc.
See ad on page 5
Glucose (GLU)
carolina Liquid chemistries corp.
HCG Ultra Combo
seKisui diagnostics LLc
See ad on back cover
Insulin
carolina Liquid chemistries corp.
Triiodothyronine (T3)
carolina Liquid chemistries corp.
Hematology
Blood diasorin
See ad on inside back cover
Health care Logistics
See ad on page 34
sysmex america, inc.
See ad on page 5 techcyte
Blood, Screening
sysmex america, inc.
See ad on page 5 techcyte
Cell Count
Health care Logistics
See ad on page 34
sysmex america, inc.
See ad on page 5 techcyte
Chloride, Serum or Urine
carolina Liquid chemistries corp.
Complete Blood Count
sysmex america, inc.
See ad on page 5 techcyte
Complete Blood Count & Diff
sysmex america, inc.
See ad on page 5 techcyte
Hemoglobin A1c
arkray usa
Reagents - Coagulation Assay
sysmex america, inc.
See ad on page 5
Hematology/Clinical Chemistry
D-Dimer, Automated carolina Liquid chemistries corp.
seKisui diagnostics LLc
See ad on back cover
Immunology/Serology
Acetylcholine Receptor
KRoNus, inc.
See ad on inside front cover
Antibody Screen
KRoNus, inc.
See ad on inside front cover
Autoantibody Testing
KRoNus, inc.
See ad on inside front cover
seKisui diagnostics LLc
See ad on back cover techcyte
Autoimmune & Complement Assays
carolina Liquid chemistries corp.
seKisui diagnostics LLc
See ad on back cover
Autoimmune Disease Testing
KRoNus, inc.
See ad on inside front cover
Complement, Components, Assays
carolina Liquid chemistries corp. seKisui diagnostics LLc
See ad on back cover
Enzyme Immunoassays
diasorin
See ad on inside back cover
seKisui diagnostics LLc
See ad on back cover
Free Kappa & Lambda Light Chains
carolina Liquid chemistries corp. seKisui diagnostics LLc
See ad on back cover
Immunoassays
carolina Liquid chemistries corp.
Hardy diagnostics
See ad on page 15
Immunodiagnostic Kits & Reagents
Hardy diagnostics
See ad on page 15
Neuroimmunological
Disorders, Autoimmune KRoNus, inc.
See ad on inside front cover
Microbiology
Antimicrobials, Assays
Hardy diagnostics
See ad on page 15
Aspergillus
Hardy diagnostics
See ad on page 15
Bacterial Vaginosis (sialidase) techcyte
Bacteriology Test Reports
Puritan Medical Products co techcyte
Candida diasorin
See ad on inside back cover
Hardy diagnostics
See ad on page 15 techcyte
Cryptococcus techcyte
Enterohemorrhagic E. Coli (ehec) Shiga Toxin, Eia techcyte
Escherichia Coli techcyte
Fungal/Mycology
Hardy diagnostics
See ad on page 15
Gram’s Stain
Hardy diagnostics
See ad on page 15 techcyte
Group A Streptococcus
Hardy diagnostics
See ad on page 15
Group B Streptococcus Colonization Detection Culture
Hardy diagnostics
See ad on page 15
H. Pylori
Hardy diagnostics
See ad on page 15
seKisui diagnostics LLc
See ad on back cover
Legionella Pneumophila
Urine Antigen
Hardy diagnostics
See ad on page 15
Methicillin-Resistant
Staphylococcus Aureus (MRSA) Culture Only Rare
Hardy diagnostics
See ad on page 15
Microbial Strain Typing
Hardy diagnostics
See ad on page 15
Microbiology & Culture
Hardy diagnostics
See ad on page 15
Puritan Medical Products co
Mycoplasma Pneumoniae Culture
Hardy diagnostics
See ad on page 15
Organism Identification
Hardy diagnostics
See ad on page 15 techcyte
Reference Bacterial Culture Identification
Hardy diagnostics
See ad on page 15 techcyte
Staphylococcus Identification, Methicillin Resistant
Hardy diagnostics
See ad on page 15
Strep A Antigen
Hardy diagnostics
See ad on page 15
seKisui diagnostics LLc
See ad on back cover
Strep A, Ultra
Hardy diagnostics
See ad on page 15
seKisui diagnostics LLc
See ad on back cover
Streptococcus (Group B) Culture, Genital
Hardy diagnostics
See ad on page 15
Puritan Medical Products co
Streptococcus Pneumoniae Antigen
Hardy diagnostics
See ad on page 15
Susceptibility Testing
Hardy diagnostics
See ad on page 15
Trichomonas Vaginalis, Rapid Testing
Puritan Medical Products co seKisui diagnostics LLc
See ad on back cover
Microbiology/Immunology
Babesia Microti Antibody Profile diasorin
See ad on inside back cover
Microbiology/Virology
Bordetella Parapertussis Detection diasorin
See ad on inside back cover
Bordetella Pertussis Detection diasorin
See ad on inside back cover
Infectious Disease diasorin
See ad on inside back cover
Hardy diagnostics
See ad on page 15
Puritan Medical Products co
Molecular Diagnostics
Nucleic Acid Amplification
Products & Detection Systems diasorin
See ad on inside back cover
Molecular Diagnostics/Genetics
Congenital Disease
diasorin
See ad on inside back cover
Factor V Leiden Mutation Analysis diasorin
See ad on inside back cover
Genetic & Genomic Testing
Puritan Medical Products co
Molecular Diagnostics/Pathology
Bladder Cancer, Fish techcyte
Urovysion(tm) FISH techcyte
Molecular Diagnostics/Virology
Adenovirus Dna, Qualitative, Rt Pcr diasorin
See ad on inside back cover
Pathology/Cytology
Cytology /Cytopathology techcyte
Fecal Occult Blood (ifob)
carolina Liquid chemistries corp.
Hardy diagnostics
See ad on page 15
seKisui diagnostics LLc
See ad on back cover
Gynecologic Pap Smear
Puritan Medical Products co techcyte
Gynecologic Pap Test (ImageGuided Or Non-Image Guided), Liquid-based Preparation techcyte
Gynecologic Pap Test, Liquidbased Preparation techcyte
Gynecologic Pap Testing
Puritan Medical Products co techcyte
Histology
Puritan Medical Products co techcyte
Immunocyt Monitoring For Bladder Cancer techcyte
Stool culture
carolina Liquid chemistries corp.
Puritan Medical Products co
Specialized/Other
Method Development & Validation
Hardy diagnostics
See ad on page 15
Point-of-care Testing, Clia Waived
Hardy diagnostics
See ad on page 15
Puritan Medical Products co
seKisui diagnostics LLc
See ad on back cover
Specimens
Puritan Medical Products co
Toxicology
Acetaminophen
seKisui diagnostics LLc
See ad on back cover
Alcohol Assays
carolina Liquid chemistries corp.
seKisui diagnostics LLc
See ad on back cover
Carbamazepine, Serum carolina Liquid chemistries corp.
Digitoxin, Serum carolina Liquid chemistries corp.
Drugs-of-abuse testing, Urine carolina Liquid chemistries corp.
Fentanyl
seKisui diagnostics LLc
See ad on back cover
Gabapentin, Serum
seKisui diagnostics LLc
See ad on back cover
Lamotrigine Tdm Assay
seKisui diagnostics LLc
See ad on back cover
Lithium, Serum
carolina Liquid chemistries corp.
seKisui diagnostics LLc
See ad on back cover
Methotrexate Assays
seKisui diagnostics LLc
See ad on back cover
Theophylline, Assay And Therapeutic Drug Monitoring (theo) carolina Liquid chemistries corp.
Topiramate, Serum
seKisui diagnostics LLc
See ad on back cover
Tricyclic Antidepressants, Serum carolina Liquid chemistries corp.
Valproic Acid, Assay And Therapeutic Drug Monitoring (VPA) carolina Liquid chemistries corp.
Zonisamide Tdm Assay
seKisui diagnostics LLc
See ad on back cover
Urinalysis
arkray usa
Health care Logistics
See ad on page 34
sysmex america, inc.
See ad on page 5
techcyte
Virology
COVID-19 diasorin
See ad on inside back cover
Hardy diagnostics
See ad on page 15
Puritan Medical Products co seKisui diagnostics LLc
See ad on back cover
Cytomegalovirus (CMV) diasorin
See ad on inside back cover
Dengue Fever diasorin
See ad on inside back cover
Enterovirus Testing diasorin
See ad on inside back cover
Epstein-Barr Virus (EBV) diasorin
See ad on inside back cover
Herpes Simplex Virus (HSV) diasorin
See ad on inside back cover
HHV6
diasorin
See ad on inside back cover
Influenza diasorin
See ad on inside back cover
Hardy diagnostics
See ad on page 15
Puritan Medical Products co seKisui diagnostics LLc
See ad on back cover
Mononucleosis
Hardy diagnostics
See ad on page 15
seKisui diagnostics LLc
See ad on back cover
Respiratory Syncytial Virus (RSV) diasorin
See ad on inside back cover
Hardy diagnostics
See ad on page 15
Puritan Medical Products co seKisui diagnostics LLc
See ad on back cover
West Nile diasorin
See ad on inside back cover
A
Acetaminophen ............................ 31
Acetylcholine Receptor ................ 29
Adenovirus Dna, Qualitative, Rt Pcr 31
Alcohol Assays 31
Aldolase 28
Alkaline Phosphatase (alp) 28
Alt (ifcc) 28
Amylase (amy), Serum 28
Analyzers ....................................... 27
Antibody Screen ........................... 29
Antimicrobials, Assays ................ 30
Apparel 27
Aspartate Aminotransferase (ast) 28
Aspergillus
Autoantibody Testing 29
Autoimmune & Complement Assays ......................................... 29
Autoimmune Disease Testing ..... 29
Automation ................................... 27
B
Babesia Microti Antibody Profile 30
Bacterial Vaginosis (sialidase) 30
Bacteriology Test Reports 30
Barcode Products 27
Beta-2 Microglobulin .................... 29
Biochemistry
Bladder
Blood
Blood
Blood, Screening 29
Bordetella
Bordetella
Carbamazepine, Serum 31
29
Centrifuges 27
Chloride, Serum or Urine ............. 29
Cholesterol, total .......................... 28
Cholinesterase .............................. 28
Cleanrooms 28
Clinical Free Fatty Acids (NEFA) 28
Complement, Components, Assays 29 Complete Blood Count 29
D
Digitoxin,
Drugs-of-abuse testing, Urine 31
Dry Baths 27
E
Education, Proficiency & Accreditation 28
Enterohemorrhagic E. Coli (ehec) Shiga Toxin, Eia 30
Enterovirus Testing 31
Enzyme Immunoassays ............... 29
Epstein-Barr Virus (EBV) 31
G
Gabapentin, Serum
(GLU) 29 Glycated Serum Protein (GSP) Assay