Devon's Q1 2023 Quarterly Report


Carmel by the Sea Greater Carmel Carmel Valley Pebble Beach Monterey Pacific Grove Seaside Marina Corral & San Benancio 2 4 6 8 10 12 14 16 18 TABLE OF CONTENTS
Affected by numerous external drivers, the Monterey Peninsula experienced a 9% reduction in real estate transactions from Q4 of 2022 and a 52% reduction from the same quarter last year.
The storms in Q1 made it very difficult to show property, let alone prepare a home for sale. This, combined with macroeconomic pressures such as high interest rates and geopolitical uncertainty left transactions at very low levels compared to previous quarters. Specifically, the number of high-priced sales throughout Carmel and Pebble Beach dropped total dollar volume and average sales price much more than usual.
With summer on the way, banking and financial concerns subsiding, and the potential for a drop in interest rates, we have already seen a better start to Q2.
Take a look at the following pages for more details on the nine markets that I track across The Monterey Peninsula
- Devon
Carmel - by - the - Sea



The average sales price was down 27% compared to last quarter which was largely driven by the 22% reduction in home sales over $5M, while year over year, the average sales price dropped less than 10%. Fewer high-dollar sales, in addition to the least number of sales transactions since Q2 of 2020 resulted in a 40% reduction in total sales volume for the quarter and a 48% reduction compared to Q1 of 2022. While the numbers were down for Q1'23, there were 21 new listings during the quarter, with 24% of those coming onto the market in the last half of March, showing promise for sales in the months ahead.




TOTAL SALES

$1M-$2M $2M$3M 2 4 50% 286% 143% 1% 0% 14
2 $1M-$2M 2
S A L E S B Y S E G M E N T 1 $5M+ 4 $2M-$3M 7 $3M-$5M
$46,073,026
New listings Transaction fell through compared

Q1'21 Q2 Q3 Q4 Q1'22 Q2 Q3 Q4 Q1'23 $5,000,000 $4,000,000 $3,000,000 $2,000,000 $1,000,000 $0
to 9 in Q4 '22 compared to 20 in Q1 ‘22 $3,000 000 AVERAGE SALES PRICE MEDIAN Q 1 A V E R A G E V S . M E D I A N O T H E R N U M B E R S O F N O T E ‘ 2 3 M A R K E T O V E R V I E W Homes Sold 14
Sales Price Days on Market
Total $ Sales vs Q4 ‘22 (27%) (8%) vs Q1 ‘22 vs Q4 ‘22 (23%)
vs Q1 ‘22 vs Q4 ‘22 (40%) (48%) vs Q1 ‘22 $3,107,500 $2,400,000
to 5 in Q4 '22
to 3 in Q1 ‘22
to 1 in Q4 '22 compared to 4 in Q1 ‘22
98% Average sale to list price $5,000,0001 $1,873,025 vs Q4 ‘22 (18%) (44%) vs Q1 ‘22
Average
$3,290,930 33
43%
Highest Sale Lowest Sale 21 8 Price Reductions compared
compared
compared
1
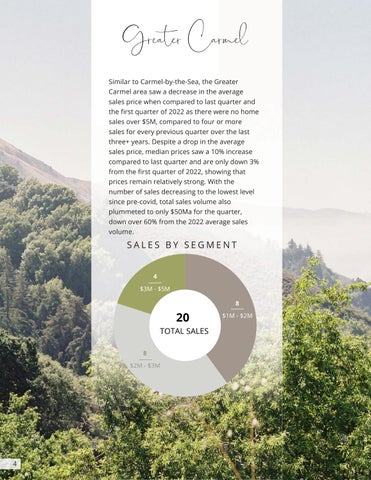
Greater Carmel


Similar to Carmel-by-the-Sea, the Greater Carmel area saw a decrease in the average sales price when compared to last quarter and the first quarter of 2022 as there were no home sales over $5M, compared to four or more sales for every previous quarter over the last three+ years. Despite a drop in the average sales price, median prices saw a 10% increase compared to last quarter and are only down 3% from the first quarter of 2022, showing that prices remain relatively strong. With the number of sales decreasing to the lowest level since pre-covid, total sales volume also plummeted to only $50Ma for the quarter, down over 60% from the 2022 average sales volume.


20 TOTAL SALES









S A L E S B Y S E G M E N T $3M$5M $5M+ $1M$2M 6 4 9 40% 40% 20% 0% 8 $1M-$2M 8 $2M-$3M 4 $3M-$5M 4

Average
$4,349,000
$50,367,500 Q1'21 Q2 Q3 Q4 Q1'22 Q2 Q3 Q4 Q1'23 $4,000,000 $3,000,000 $2,000,000 $1,000,000 $0 New listings Transaction fell through compared to 32 in Q4 '22 compared to 65 in Q1 ‘22 $2,650,000 AVERAGE SALES PRICE MEDIAN Q 1 A V E R A G E V S . M E D I A N O T H E R N U M B E R S O F N O T E ‘ 2 3 M A R K E T O V E R V I E W Homes Sold 20 Average Sales Price Days on Market $2,518,375 71 Total $ Sales vs Q4 ‘22 (27%) (8%) vs Q1 ‘22 vs Q4 ‘22 (23%) 43% vs Q1 ‘22 vs Q4 ‘22 (40%) (48%) vs Q1 ‘22 $2,575,000 $1,900,000 Highest Sale Lowest Sale 46 19 Price Reductions compared to 20 in Q4 '22 compared to 9 in Q1 ‘22 compared to 6 in Q4 '22 compared to 10 in Q1 ‘22 3 vs Q4 ‘22 (13%) (52%) vs Q1 ‘22
98%
sale to list price
$1,275,000
Carmel Valley






Carmel Valley had a slow fourth quarter, especially with higher-priced homes. There were only 11 sales this quarter (the lowest we've seen since pre-pandemic), and there were no sales over $2,500,000; a complete anomaly, as 19% of the sales in 2022 were over $2,500,000. Despite a much slower quarter, the average sales to list price rose to 100% compared to only 94% last quarter, and there was only one transaction that fell through during the quarter. With CV bearing most of the winter storms' brunt, we expect to see much more activity in Q2 and beyond.

727% 182% 91% 6
S A L E S B Y S E G M E N T 11 TOTAL SALES 1 <$1M 8 $1M-$2M 2 $2M-$3M

Average sale to list price $2,395,000
$16,639,500 Q1'21 Q2 Q3 Q4 Q1'22 Q2 Q3 Q4 Q1'23 $2,500,000 $2,000,000 $1,500,000 $1,000,000 $500,000 $0 New listings Transaction fell through compared to 15 in Q4 '22 compared to 21 in Q1 ‘22 $1,700,000 AVERAGE SALES PRICE MEDIAN Q 1 A V E R A G E V S . M E D I A N O T H E R N U M B E R S O F N O T E ‘ 2 3 M A R K E T O V E R V I E W Homes Sold 11 Average Sales Price Days on Market $1,512,682 40 Total $ Sales vs Q4 ‘22 (4%) (16%) vs Q1 ‘22 vs Q4 ‘22 (37%) 9% vs Q1 ‘22 vs Q4 ‘22 (25%) (54%) vs Q1 ‘22 $1,430,000 $1,349,000 Highest Sale Lowest Sale 22 10 Price Reductions compared to 11 in Q4 '22 compared to 3 in Q1 ‘22 compared to 4 in Q4 '22 compared to 6 in Q1 ‘22 1 vs Q4 ‘22 (21%) (45%) vs Q1 ‘22
100%
$275,000
Pebble Beach









The lack of high-priced sales also impacted the Pebble Beach market. With only four homes topping the $5M mark this quarter, the average sales price saw its lowest point since Q4 2020, landing at $3.85M, down 26% from last quarter and down 56% compared to Q1 2022. The decrease in average sales price. as Q4 '22 had six sales over $5M, and Q1 '22 had ten sales over $5M with four of those sales topping $25M. Despite lower prices, the number of sales transactions was on-par with last quarter and only slightly down from the first quarter of 2022.
21 TOTAL SALES









$2M-$3M 3 8 381% 238% 19% 95% 95% 5 $3M-$5M 4 $1M-$2M 8 $2M-$3M 2 $5M-$10M 2 $10M+ 8
S A L E S B Y S E G M E N T
96%
sale to list price $12,350,000 $1,500,000

$80,920,000 Q1'21 Q2 Q3 Q4 Q1'22 Q2 Q3 Q4 Q1'23 $10,000,000 $7,500,000 $5,000,000 $2,500,000 $0
to 20 in Q4 '22 compared to 30 in Q1 ‘22 $3,570,000 AVERAGE SALES PRICE MEDIAN Q 1 A V E R A G E V S . M E D I A N O T H E R N U M B E R S O F N O T E ‘ 2 3 M A R K E T O V E R V I E W Homes Sold 21 Average Sales Price Days on Market $3,853,333 26 Total $ Sales vs Q4 ‘22 (26%) (56%) vs Q1 ‘22 vs Q4 ‘22 (60%) (44%) vs Q1 ‘22 vs Q4 ‘22 (22%) (61%) vs Q1 ‘22 $2,500,000 $2,769,000
Lowest Sale
Price Reductions compared to 8 in Q4 '22 compared to 1 in Q1 ‘22 compared to 5 in Q4 '22 compared to 2 in Q1 ‘22
vs Q4 ‘22 5% (13%) vs Q1 ‘22
Average
New listings Transaction fell through compared
Highest Sale
30 5
2
Monterey








Unlike other markets across The Peninsula, Monterey had a very strong quarter with growth in all metrics across the board while the days on market continued to decline, showing continued demand for properties in the area. The average sales price increased 12% from the previous quarter and is on par with the average from Q1 of 2022 Sales in the $3M+ range also increased to 10% of the quarter's transactionsthe highest recorded amount since pre-covid, supporting the strength of the Monterey market.

29 TOTAL SALES






$1M-$1.5M <$800K $800K$1M 12 5 6 414% 72% 138% 103% 103% 69% 5 <$800K 3 $800K-$1M 12 $1M-$15M 4 $15M-$2M 3 $3M+ 2 $2M-$3M 10
S A L E S B Y S E G M E N T

99% Average sale to list price $3,880,000 $713,000 $43,344,444 Q1'21 Q2 Q3 Q4 Q1'22 Q2 Q3 Q4 Q1'23 $2,000,000 $1,500,000 $1,000,000 $500,000 $0 New listings Transaction fell through compared to 27 in Q4 '22 compared to 59 in Q1 ‘22 $1,200,000 AVERAGE SALES PRICE MEDIAN Q 1 A V E R A G E V S . M E D I A N O T H E R N U M B E R S O F N O T E ‘ 2 3 M A R K E T O V E R V I E W Homes Sold 29 Average Sales Price Days on Market $1,494,636 18 Total $ Sales vs Q4 ‘22 12% 1% vs Q1 ‘22 vs Q4 ‘22 (50%) (28%) vs Q1 ‘22 vs Q4 ‘22 2% (56%) vs Q1 ‘22 $1,285,000 $977,500 Highest Sale Lowest Sale 39 9 Price Reductions compared to 14 in Q4 '22 compared to 12 in Q1 ‘22 compared to 6 in Q4 '22 compared to 11 in Q1 ‘22 5 vs Q4 ‘22 (9%) (57%) vs Q1 ‘22
Pacific Grove









PG had a strong quarter with the average sales price increasing 20% compared to last quarter and remaining relatively flat as compared to Q1 2021. Median sales price also increased when compared to last quarter, up 29%, the largest increase across the nine markets I track. While prices remained strong, the days on market increased to 54, up 42% from last quarter and 70% from the first quarter of 2021. With strong pricing, I expect the PG market to continue its upward trajectory into Q2 and beyond this year.




12
$1.5M$2M $1M-$1 5M $800K$1M 4 8 10 S A L E S B Y S E G M E N T 438% 25% 125% 94% 94% 14 $1M-$15M 30 TOTAL SALES 8 $15M-$2M 4 $2M - $3M 2 $3M+ 2 $800K$1M

99% Average sale to list price $4,250,000 $851,000 $51,261,700 Q1'21 Q2 Q3 Q4 Q1'22 Q2 Q3 Q4 Q1'23 $2,000,000 $1,500,000 $1,000,000 $500,000 $0 New listings Transaction fell through compared to 23 in Q4 '22 compared to 35 in Q1 ‘22 $1,650,000 AVERAGE SALES PRICE MEDIAN Q 1 A V E R A G E V S . M E D I A N O T H E R N U M B E R S O F N O T E ‘ 2 3 M A R K E T O V E R V I E W Homes Sold 30 Average Sales Price Days on Market $1,708,723 54 Total $ Sales vs Q4 ‘22 29% (10%) vs Q1 ‘22 vs Q4 ‘22 42% 70% vs Q1 ‘22 vs Q4 ‘22 24% 2% vs Q1 ‘22 $1,482,500 $1,377,250 Highest Sale Lowest Sale 30 8 Price Reductions compared to 10 in Q4 '22 compared to 1 in Q1 ‘22 compared to 0 in Q4 '22 compared to 2 in Q1 ‘22 2 vs Q4 ‘22 3% 3% vs Q1 ‘22
Seaside had a dip in its average sales price to $732K this quarter, the lowest since Q2 2021, while the median sales price was little changed from last quarter, but is also down 9% from Q1 of 2021. The number of sales in the area also fell to the lowest level since the lockdown levels of Q2 2020 Despite these decreases, the average sales to list price remains strong at 99%, while 63% of the sales during the quarter sold at or above the list price. While other markets available inventory is on the rise heading into Q2, inventory in Seaside remains the lowest we've seen over the last three years.













$800K$1M $600K-$800K <$600K 6 15 5 24 TOTAL
5 7% 231% 115% 7% 15 $600-$800K 2 <$600K 6 $800K-$1M 1 $1M+ 14
SALES
S A L E S B Y S E G M E N T
Seaside

99% Average sale to list price $1,010,000 $530,000 $17,587,500 Q1'21 Q2 Q3 Q4 Q1'22 Q2 Q3 Q4 Q1'23 $1,000,000 $750,000 $500,000 $250,000 $0 New listings Transaction fell through compared to 28 in Q4 '22 compared to 57 in Q1 ‘22 $780,000 AVERAGE SALES PRICE MEDIAN Q 1 A V E R A G E V S . M E D I A N O T H E R N U M B E R S O F N O T E ‘ 2 3 M A R K E T O V E R V I E W Homes Sold 24 Average Sales Price Days on Market $732,813 32 Total $ Sales vs Q4 ‘22 (13)% (7%) vs Q1 ‘22 vs Q4 ‘22 (16%) 118% vs Q1 ‘22 vs Q4 ‘22 (28%) (48% vs Q1 ‘22 $710,000 $672,500 Highest Sale Lowest Sale
9 Price Reductions compared to 17 in Q4 '22 compared to 9 in Q1 ‘22 compared to 0 in Q4 '22 compared to 2 in Q1 ‘22 6 vs Q4 ‘22 (17)% (44)% vs Q1 ‘22
31
Marina


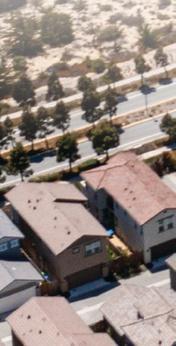
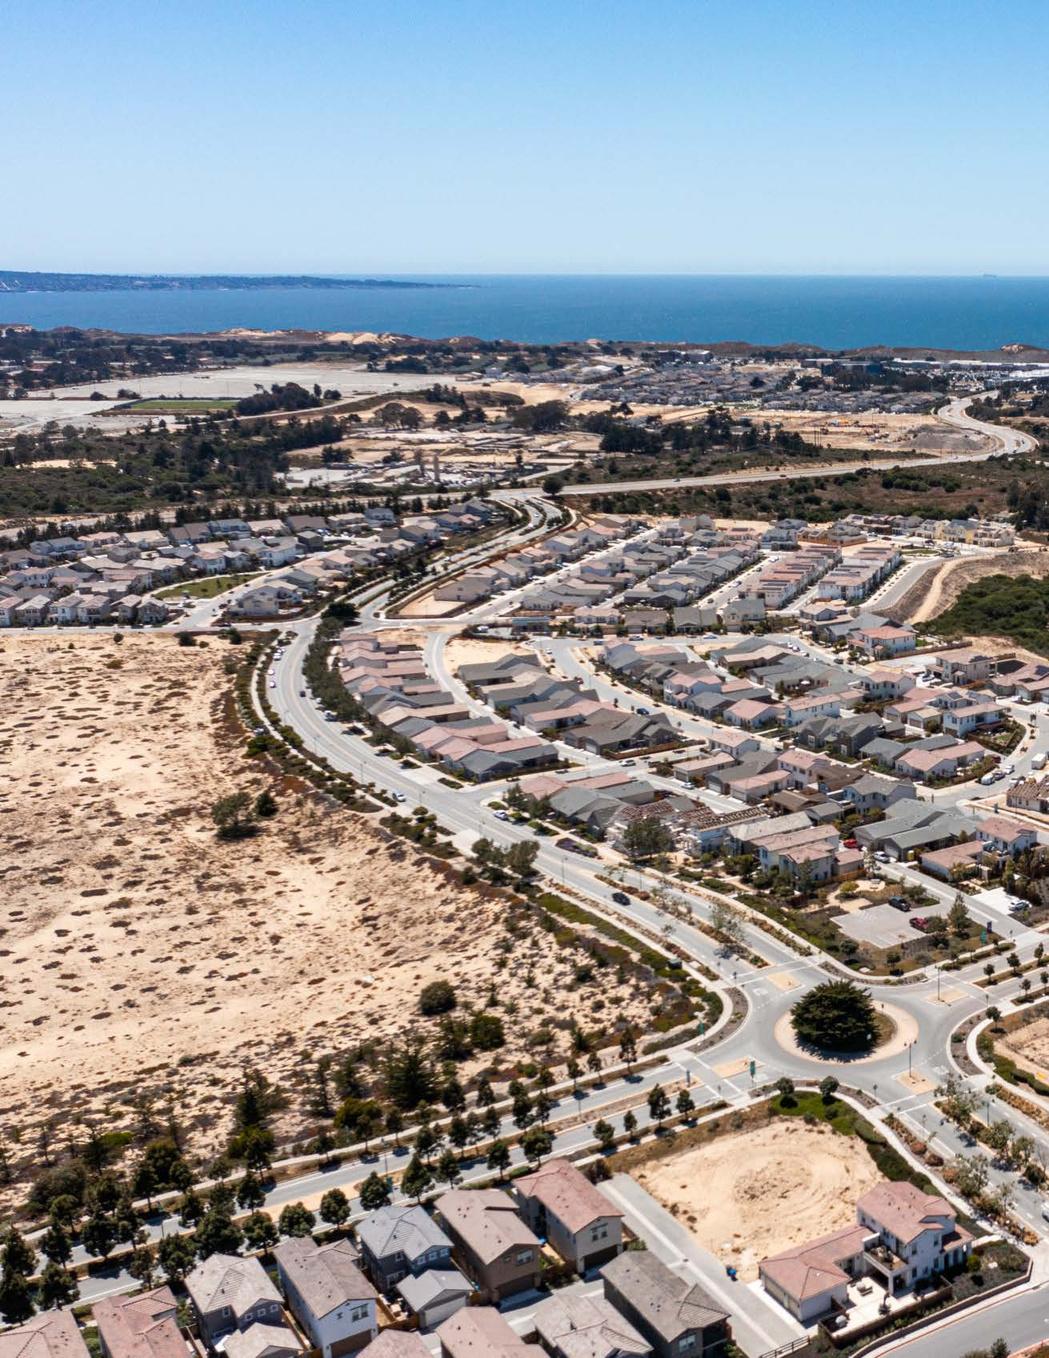
Marina had another strong quarter with a 5% (or less) change in average and median sales price compared to last quarter, and the same quarter in 2021. Despite these minimal changes, days on market jumped up to 65higher than we've seen over the last three years. Homes sold also dropped to a low of 25, the lowest over the last three years+. With that said, 18% of the 40 new listings during the quarter became available in the last two weeks of the quarter, which should lead to a more productive Q2.






16
S A L E S B Y S E G M E N T 40% 32% 28% 24
8 $600-$800K 10 $800K-$1M 7 $1M-$15M
TOTAL SALES

99% Average sale to list price $1,408,000 $670,000 $22,854,700 Q1'21 Q2 Q3 Q4 Q1'22 Q2 Q3 Q4 Q1'23 $1,000,000 $750,000 $500,000 $250,000 $0 New listings Transaction fell through compared to 29 in Q4 '22 compared to 46 in Q1 ‘22 $875,000 AVERAGE SALES PRICE MEDIAN Q 1 A V E R A G E V S . M E D I A N O T H E R N U M B E R S O F N O T E ‘ 2 3 M A R K E T O V E R V I E W Homes Sold 25 Average Sales Price Days on Market $914,188 65 Total $ Sales vs Q4 ‘22 0% 5% vs Q1 ‘22 vs Q4 ‘22 64% 225% vs Q1 ‘22 vs Q4 ‘22 (36%) (9%) vs Q1 ‘22 $850,000 $737,944 Highest Sale Lowest Sale 40 13 Price Reductions compared to 22 in Q4 '22 compared to 3 in Q1 ‘22 compared to 5 in Q4 '22 compared to 4 in Q1 ‘22 5 vs Q4 ‘22 (36%) (14%) vs Q1 ‘22
Corral&San Benancio

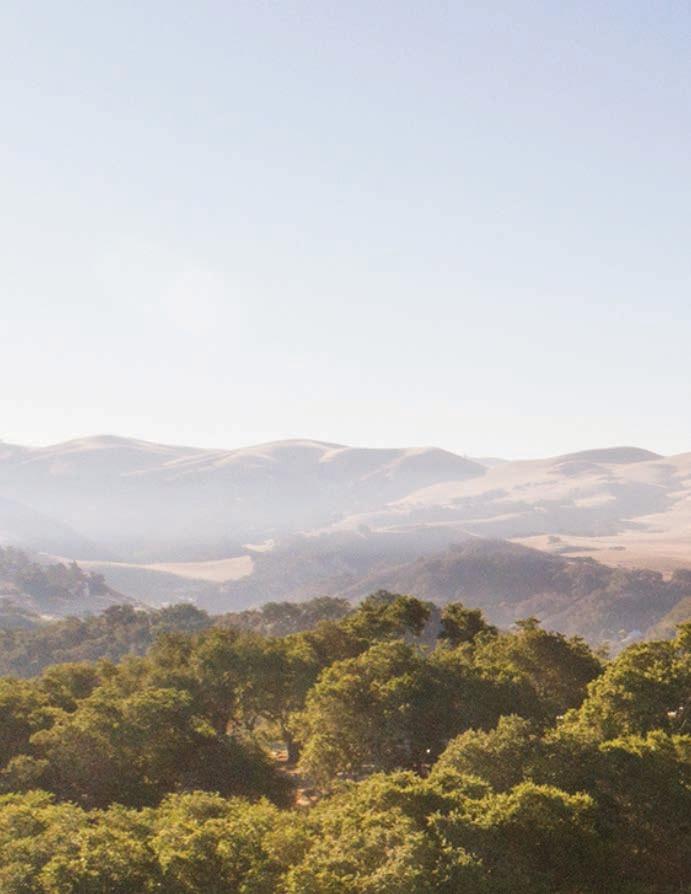
The 93908 area code had a very strong fourth quarter with the average and median sales prices increasing over 10% from Q4 of 2022. The number of homes sold also increased by 83% compared to last quarter, having a positive impact on the total volume of sales. While these metrics all showed signs of a strengthening market, the number of days on market jumped up 70% to 59 days, the highest since Q1 of 2021. With clearer skies in the forecast for Q2, I expect the days on market to return to its ~35 day average.

18
$1M$1.5 M $800K$1M 9 1 2 S A L E S B Y S E G M E N T 22 TOTAL SALES 333% 292% 208% 83% 83% 1 $600$800K 7 $800K$1M 8 $1M-$1.5M 5 $15M-$2M 1 $2M+

97% Average sale to list price $2,174,000 $740,000 $27,622,407 Q1'21 Q2 Q3 Q4 Q1'22 Q2 Q3 Q4 Q1'23 $1,500,000 $1,000,000 $500,000 $0 New listings Transaction fell through compared to 22 in Q4 '22 compared to 41 in Q1 ‘22 $1,235,000 AVERAGE SALES PRICE MEDIAN Q 1 A V E R A G E V S . M E D I A N O T H E R N U M B E R S O F N O T E ‘ 2 3 M A R K E T O V E R V I E W Homes Sold 22 Average Sales Price Days on Market $1,255,564 59 Total $ Sales vs Q4 ‘22 14% (12%) vs Q1 ‘22 vs Q4 ‘22 70% 35% vs Q1 ‘22 vs Q4 ‘22 109% (37%) vs Q1 ‘22 $1,249,500 $945,000 Highest Sale Lowest Sale 29 12 Price Reductions compared to 18 in Q4 '22 compared to 2 in Q1 ‘22 compared to 1 in Q4 '22 compared to 3 in Q1 ‘22 5 vs Q4 ‘22 83% (29%) vs Q1 ‘22

Devon Meeker \\ 650.759.4193 Devon@MaloneHodges.com DRE #02074131