2022 Annual Report
As we write this, the Monterey Peninsula is well into our fou h week of rain, wind, and storms. While the rain is welcome (the wind less so), it has impacted daily life and the real estate market as we sta 2023.
Following two years of extraordinary growth, the real estate market on the Monterey Peninsula has normalized. The number of transactions, total dollar volume and average sale prices all hit record highs beginning in the second half of 2020 which continued into the first half of 2022. However, beginning in the summer of 2022, the number of transactions and total sales volume has returned, for the most pa , to pre-COVID levels. The positive news is that while transaction volume is down from the previous two-year peak, home values on the Peninsula are holding up nicely.

With high interest rates, stock market volatility, and unfavorable economic forecasts, Q4 slowed both in terms of active buyers and the number of new listings. Buyers are now looking for “the right house,” in contrast to the COVID market, where they were more likely to accept homes that needed work or were not a pe ect match. Sellers also paused listing their homes given the above factors and lack of available inventory.
The following repo breaks out all nine of the markets we track with additional pe ormance detail. We hope you will find this repo informative.
As always, please be sure to contact us if there is anything we can do to help you, your friends and family, with real estate plans in our marketplace.





The trend of fewer transactions this qua er held true in Carmel-by-the Sea as Q4 saw only 17 sales, down 32% from Q3 2022 and down 48% from the same qua er in 2021, bringing us the lowest number of sales since Q2 2020. Although the number of sales fell, the highest dollar sale in 2022 occurred in Q4 at $13,700,000, skewing the average sales price up to its highest ever, at $4,524,882. Se ing that sale aside, the average sales price still would set a record at $3,951,438, up 22% from last qua er, and 9% from Q4 2021. However, despite the increase in average sales price, total sales volume for Q4 was at its lowest point since Q1 of 2021, as new listings fell to an all-time low of 11 for the qua er.





















Greater Carmel had 23 sales in the qua er and 55 total during 2022, the lowest of any full year since 2010. Although the average days on market ticked up to 55 days, a 38% increase over last qua er, homes that were well priced and move -in ready sold quickly, and above ask; Of the 23 sales during the qua er, six sold with an average of only six days on market, while the remaining 17 sales had an average of 72 days on market. Total sales volume of $519M during 2022 was down from the last two years, but still up substantially over every year prior to 2020. Average sales price also remained steady, with a 1% increase compared to Q3’22, and an 8% increase when comparing 2022 to 2021.





Carmel Valley had a slow fou h qua er with only 14 home sales - lower than every qua er since Q1 of 2017. For the year, units sold was down 35% and total sales volume down 31% versus 2021, which is likely a result the decrease in listings over the year, and especially in Q4 when there were only 15 new listings. While we saw average sale price dip at the end of the year, 2022 still set a yearly record for average sales price, coming in at $1,884,660, up 4% and 13% from the record breaking 2021 and 2020 sales years.









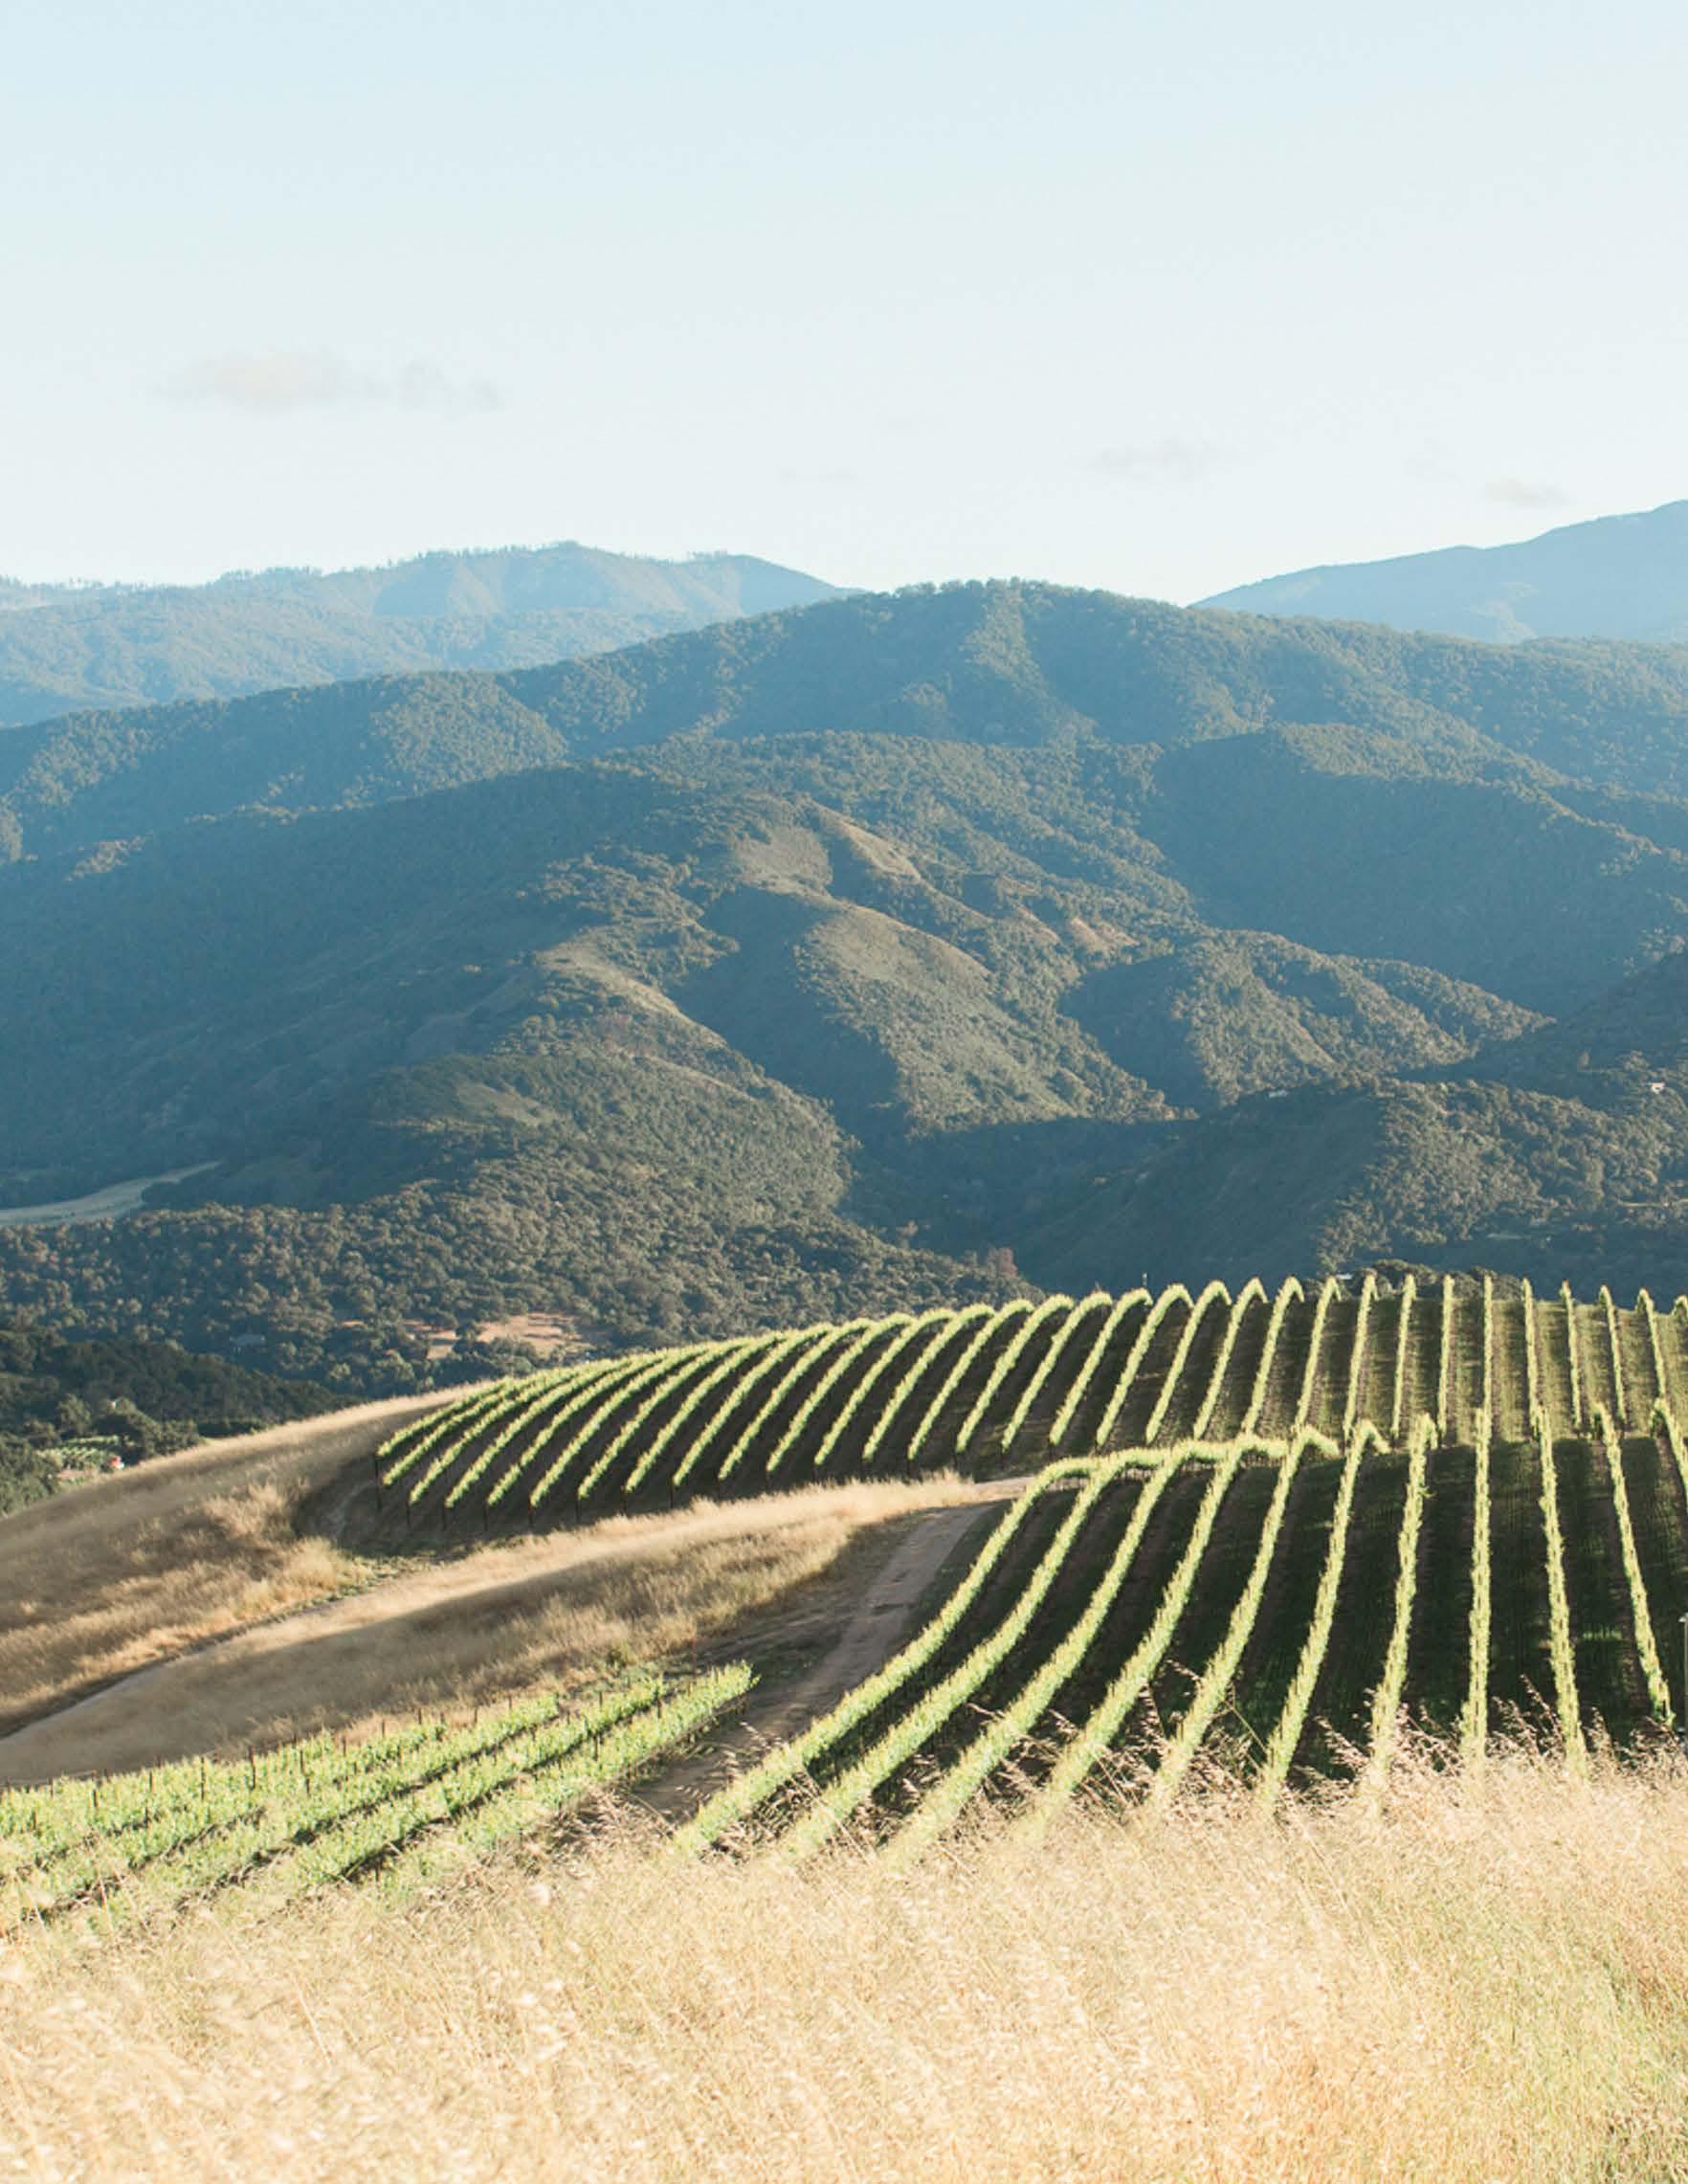














Pebble Beach had another strong qua er, and overall year with the Q4 average sales price increasing 16% from last qua er and 25% compared to 2021 as a whole. There were only 79 home sales for the year, which is the first-time sales fell to under 100 units since 2011. With the decrease in the number of sales, total sales volume for the year was down 24% from last year, yet the second highest on record. While the average sales to list price dipped to 95%, tight inventory, and low listings has kept pricing strong in Pebble Beach.









Monterey had a slow fou h qua er a er a strong sta to the year. Q4 produced the lowest number of sales, average & median sales prices, and sales volume for the year, while the yearly statistics were much stronger; 2022 saw the highest average sales price on record, and while the number of sales and total sales volume decreased, the average sales price for the year was 101% of list price. The average days on market for the year was also li le changed from the record se ing Covid years, at an average of 31 days for 2022 compared to 29 in 2021 and 44 in 2020.































Consistent with many markets across the Monterey Peninsula, Pacific Grove experienced a slower Q4, but had an overall strong 2022. The average sale price dipped to $1.42M in Q4, the lowest of the year and since Q2 of 2021, and had only 29 sales, tied with Q1 of 2022. Conversely, 2022 on the whole was another record se ing year with the highest average & median sales prices to date, along with 101% average sales to list price ratio. Average days on market also fell to its lowest point on record, landing at an average of 25 days, showing that the demand for housing remains strong overall.

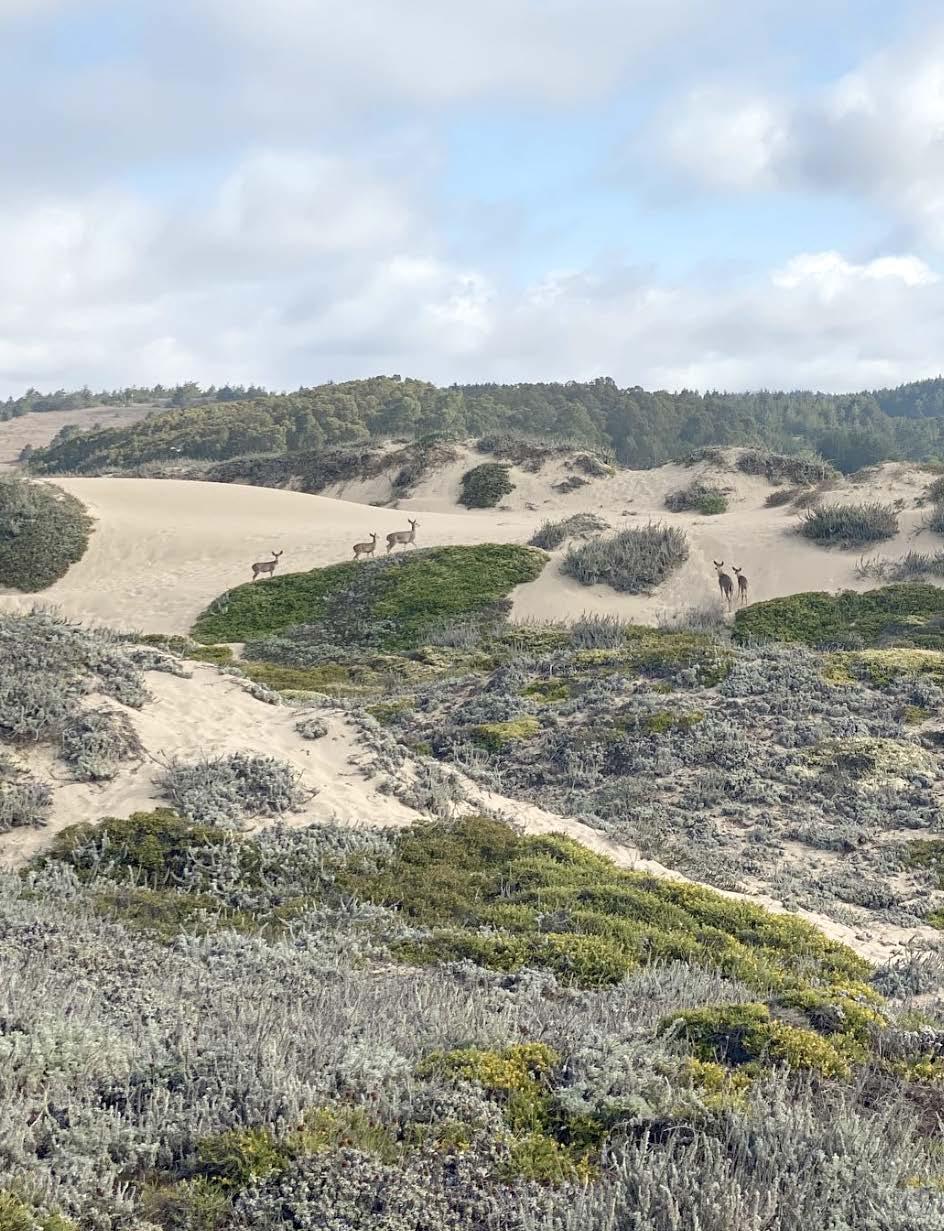

Seaside had a relatively stable Q4, as average sales price was up 8% from last qua er, while the median was down 5%. Average sales to list price also held steady at 100% of asking, despite a slight increase in days on market. The number of total sales decreased 28% from Q3 and 55% from the same qua er in 2021, but these trends are consistent with those across the Monterey Peninsula. Overall, the 2022 year had the highest average sales and median price on record. Sales between $600,000$800,000 remains the ‘bread and bu er’ of the Seaside market representing 52% of sales, but we did see an uptick in sales between $1.5M- $2M, as a few homes in the Bayonet & Black Horse golf course sold in Q4.













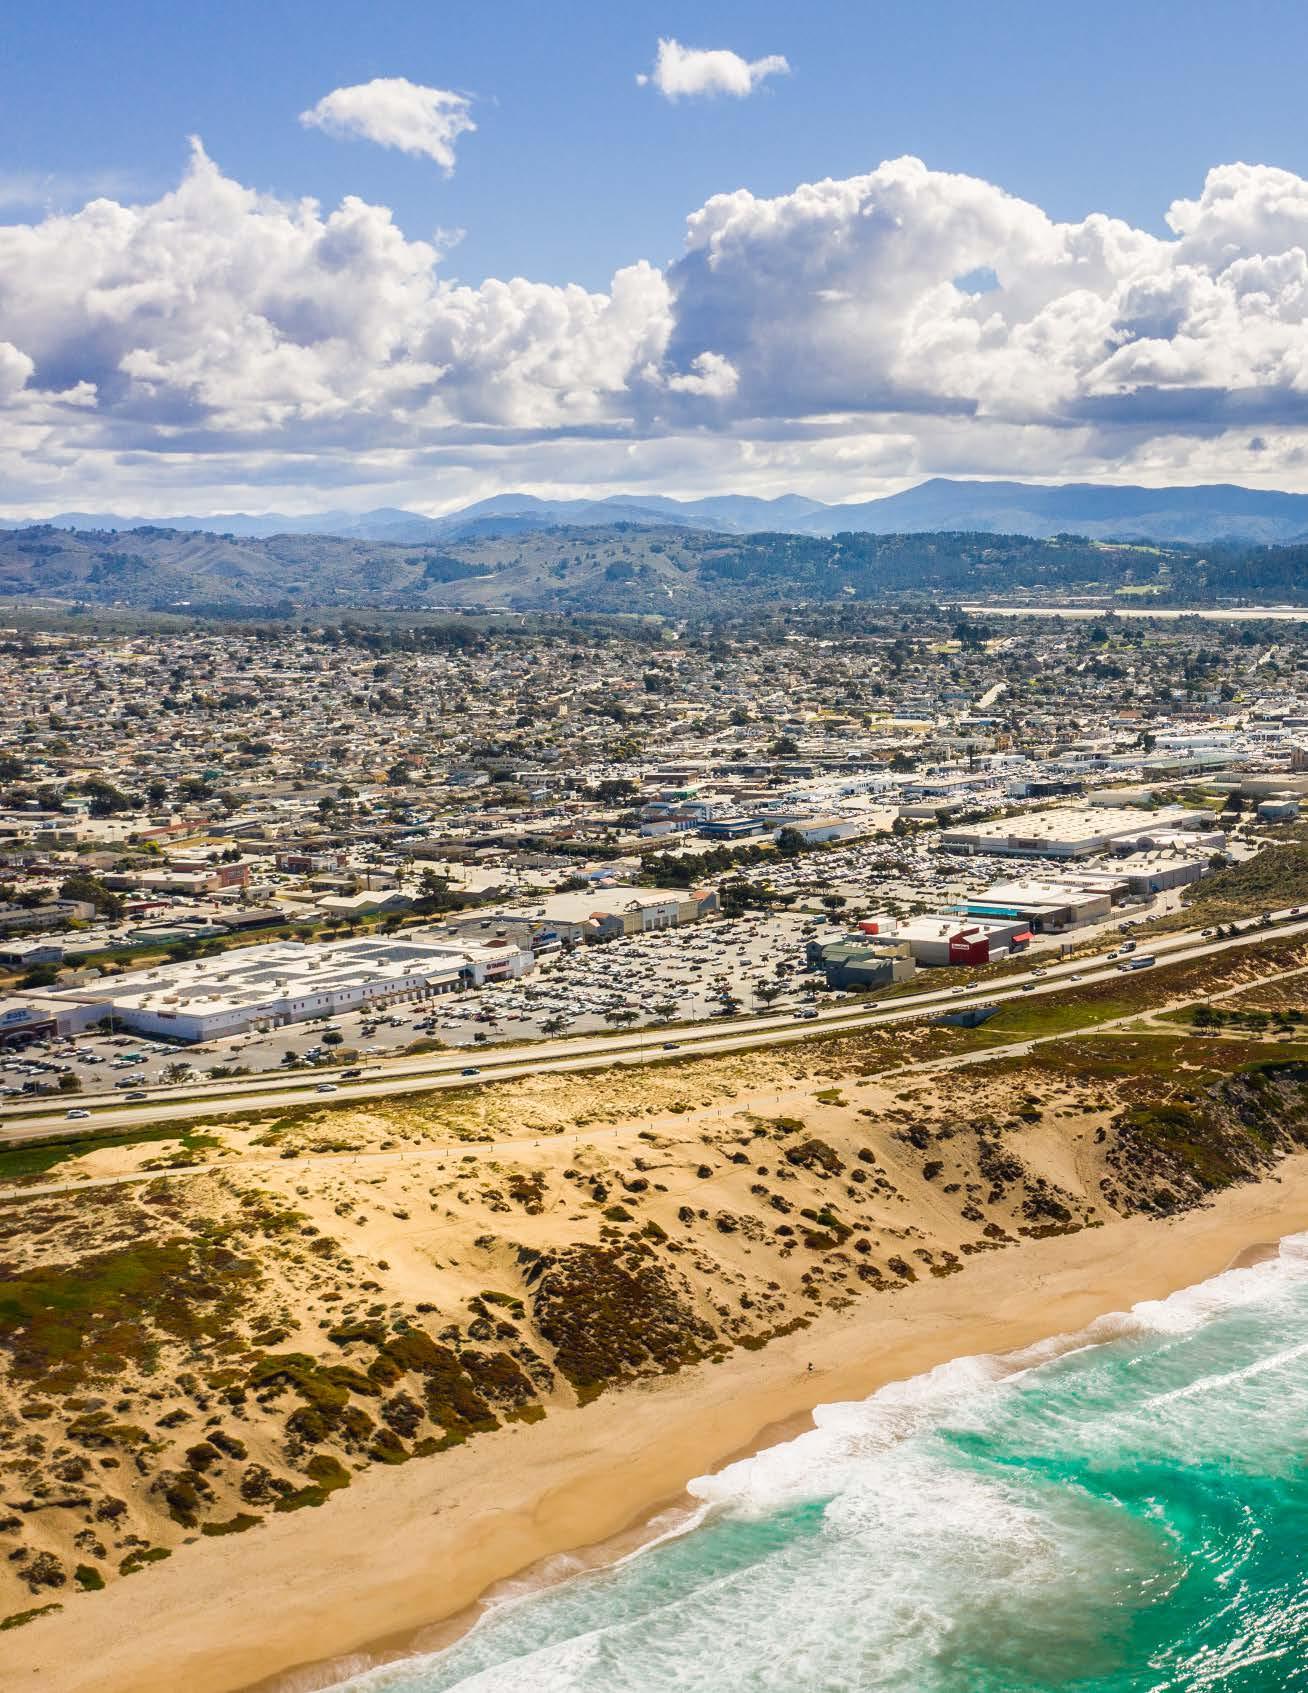

The Marina market held strong in Q4, experiencing a 5% (or less) change in average and median sales price, total sales volume and days on market compared to Q3. While the number of sales in the qua er dropped, the 39 Q4 sales was right on pace with the 2022 qua erly average. Like the rest of markets we track, 2022 as whole was an incredibly strong year with record breaking average and median sales prices, while total units and sales volume decreased. While days on market for the qua er and year did increase, the average of 40 days in Q4 and 28 for the ’22 year are indicative of a more ‘normal’ market.













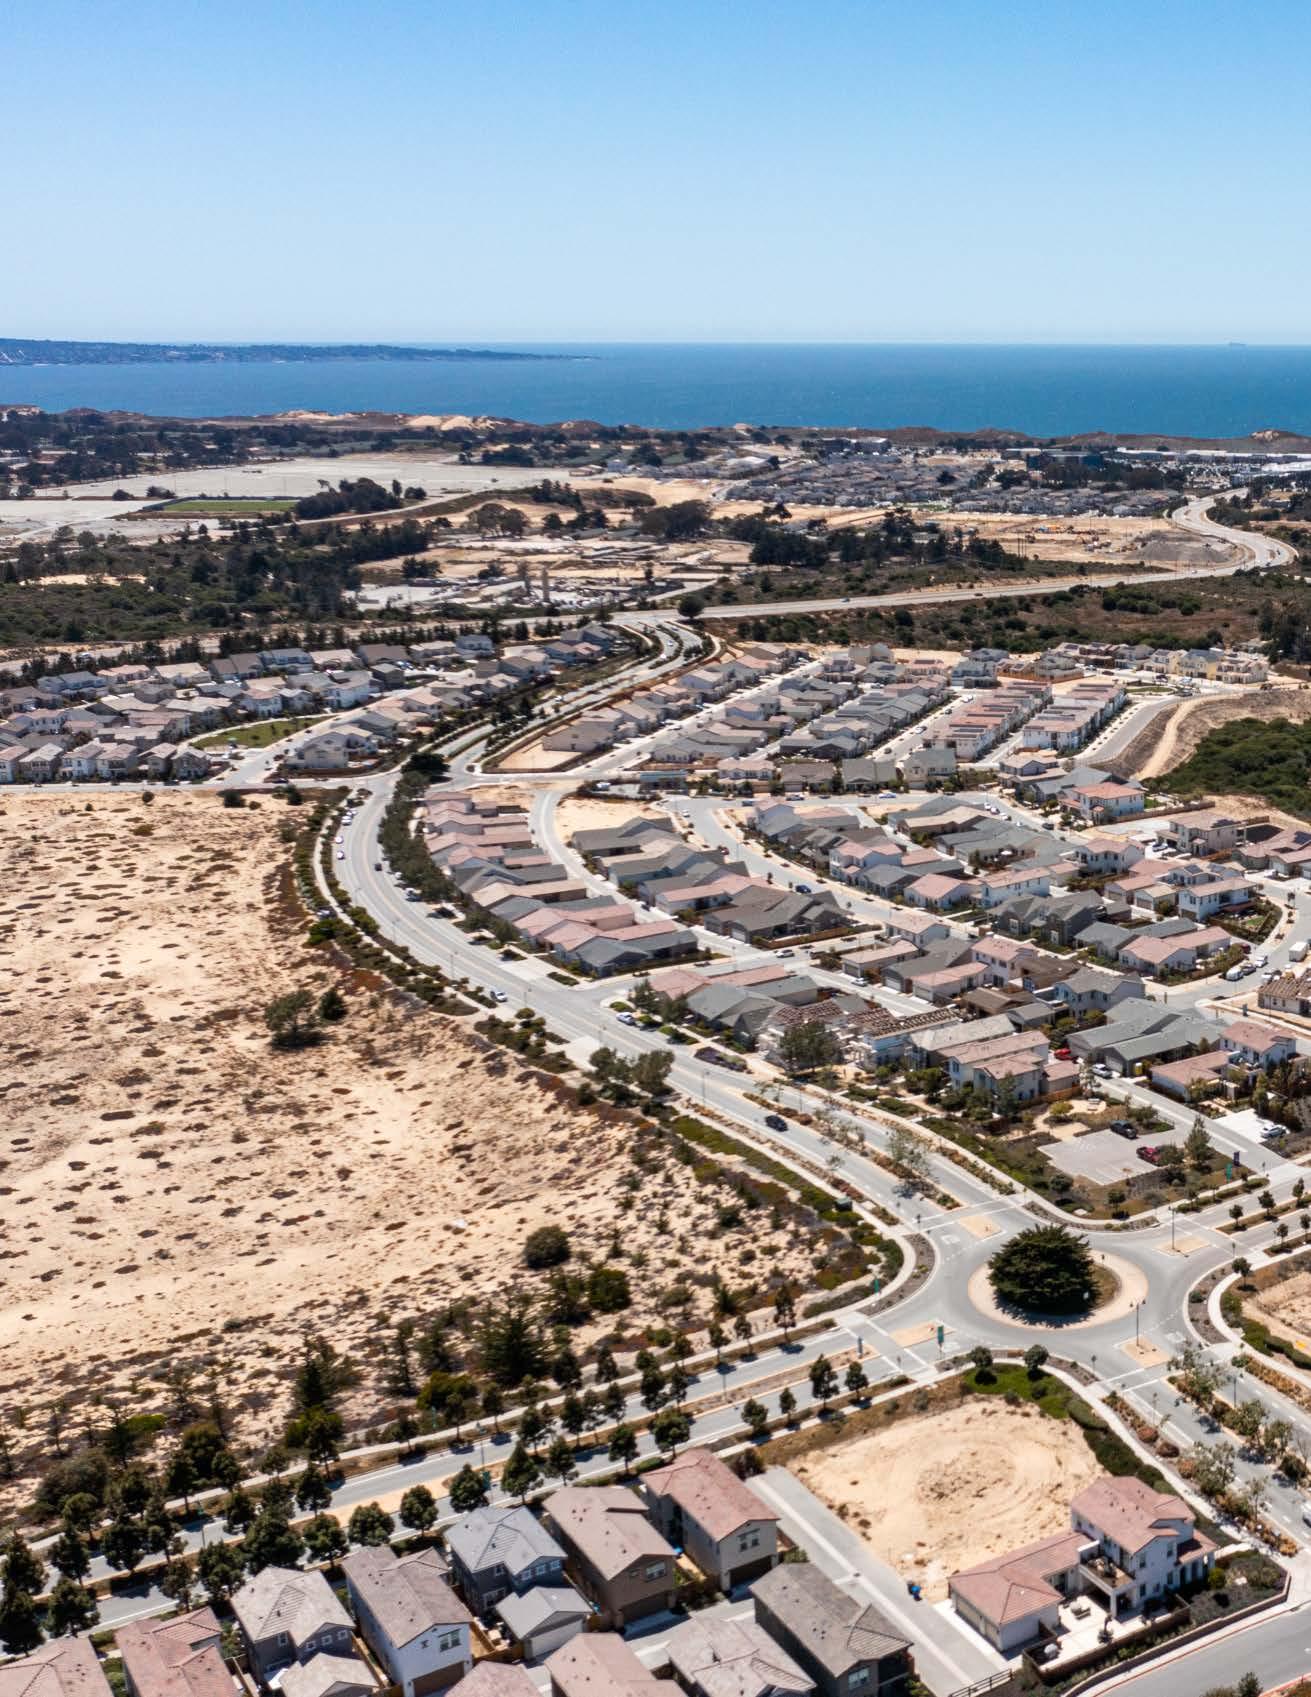

The 93908 area code had a slow fou h qua er with only 12 home sales – the lowest amount of the nine markets we track. For the year, units sold was down 41% and total sales volume down 33% versus 2021. While the average sale price dipped at the end of the year, like the other markets across the Monterey Peninsula, 2022 set a yearly record for average & median sales prices. While prices remained strong, the average sales to list price for the qua er dipped to 96% -- the second lowest sales to list price ratio across the Monterey Peninsula.


vs Q3 ‘22 -56% vs Q4 ’21 -65% vs Q3 ‘22 -16% vs Q4 ’21 -19% vs Q3 ‘22 61% vs Q4 ’21 -20% vs Q3 ‘22 -63% vs Q4 ’21 -72%

Malone Hodges \ 831.601.4740
Malone@MaloneHodges.com DRE#01471087
Devon Meeker \ 650.759.4193
Devon@MaloneHodges.com DRE#02074131