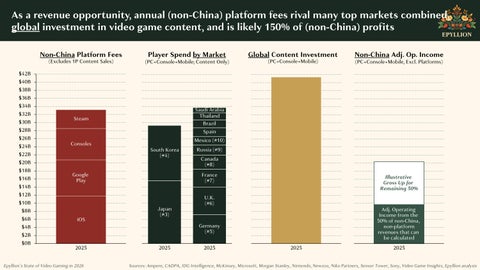
As a revenue opportunity, annual (non -China) platform fees rival many top markets combined, global investment in video game content, and is likely 150% of (non -China) profits Non -China Platform Fees
Player Spend by Market
(Excludes 1P Content Sales)
(PC+Console+Mobile ; Content Only)
Global Content Investment (PC+Console+Mobile )
Non -China Adj. Op. Income (PC+Console+Mobile , Excl. Platforms)
$42B $40B $38B $36B $34B $32B $30B
Saudi Arabia Thailand Brazil
Steam
$28B
Spain
$26B $24B
Mexico (#10)
Consoles South Korea (#4)
$22B $20B $18B $16B
Google Play
Russia (#9) Canada (#8)
France (#7)
Illustrative Gross Up for Remaining 50%
$14B $12B
U.K. (#6)
$10B $8B $6B
iOS
Japan (#3) Germany (#5)
$4B $2B $0B
Adj. Operating Income from the 50% of non -China, non-platform revenues that can be calculated
2025
Epyllion’s State of Video Gaming in 2026
2025
2025
2025
Sources: Ampere, CADPA, IDG Intelligence, McKinsey, Microsoft, Morgan Stanley, Nintendo,
2025 Newzoo , Niko Partners, Sensor Tower, Sony, Video Game Insights, Epyllion analysis