Grid Forward
The people and ideas powering Ontario’s energy transition
GrandBridge Evolves System Planning / 21
Alectra is Driving Innovation / 26
Distribution Sector is Evolving / 34




The people and ideas powering Ontario’s energy transition
GrandBridge Evolves System Planning / 21
Alectra is Driving Innovation / 26
Distribution Sector is Evolving / 34
As I begin my term as Chair of the Electricity Distributors Association Board of Directors, I look forward to collaborating with a strong board to continue advancing the value and impact of our sector.
After a slow start to spring, Environment Canada is forecasting a summer of historically high heat. While Ontarians look forward to warm, sunny weather, extreme temperatures reinforce the need to strengthen our systems to ensure they remain resilient, reliable, and ready to meet demand. An essential part of powering the energy transition.
LDCs continue to lead this transition through innovation in customer engagement, digital tools, and energy efficiency programs. At the EDA’s signature two-day event in March, a high-quality agenda of ENERCOM speakers challenged us to look beyond the status quo and offered valuable insights into the evolving geo-political landscape and its implications for utility operations. As my first official role as Chair, it was a privilege to host the EDA Awards Gala, where 14 utilities and individuals were recognized for demonstrating exceptional teamwork and impact, and showcasing how innovation is evolving our utilities to meet the needs of the future
While the Panel for Utility Leadership and Service Excellence (PULSE) report has yet to be released, Energy and Mines Minister Stephen Lecce offered a preview at ENERCOM. He noted a robust action plan focused on rethinking risk, standards, and financing models to support critical infrastructure investment. His emphasis on collaboration and a commitment to “get it right” is encouraging for our distribution sector.
The province’s second budget of its third-term didn’t address specifics related to our sector but included continued electricity rate relief through the Ontario Electricity Rebate and a commitment to review provincial infrastructure investments. It also called for federal action on Investment Tax Credits, though clarity on distribution eligibility is outstanding. The EDA continues to advocate for LDC eligibility.
The EDA also provided input on two key Ontario Energy Board (OEB) consultations. For the New Generation Rate Framework, recommendations focused on enabling timely, forward-looking infrastructure investment, modernizing incentive models, and including reforming or removing the productivity (X) factor. For the OEB’s Benefit-Cost Analysis Framework, we recommended clearer guidance on the Electricity Systems Test (EST), a revised implementation timeline to 2027, and updates to IESO-related requirements. We look forward to next steps from the OEB.
I wish you all a safe and enjoyable summer as we continue our work together.

Sincerely,
John Avdoulos
President and CEO, Essex Power Corporation and Chair of the Electricity Distributors Association
The Electricity Distributors Association (EDA) publishes The Distributor for its members and stakeholders. All rights to editorial content are reserved by the EDA. No article can be reproduced in whole or in part without the permission of the EDA.
PUBLISHED SUMMER 2026 FOR:
Electricity Distributors Association
3700 Steeles Avenue West, Suite 1100 Vaughan, ON L4L 8K8 www.eda-on.ca
EDA STAFF CEO’S OFFICE
Teresa Sarkesian, President and CEO
Natasha Galati, Executive & Administrative Assistant
POLICY, GOVERNMENT AND CORPORATE AFFAIRS
Ted Wigdor, VP, Policy, Government & Corporate Affairs
Derek Nardone, Director, Corporate, Government & Public Affairs
Brittany Ashby, Senior Regulatory Affairs Advisor
Rudra Mukherji, Senior Regulatory Affairs Advisor
Antonio Brieva, Senior Advisor, Government & Stakeholder Relations
Tina Wong, Senior Policy Advisor
MARKETING, COMMUNICATIONS AND MEMBER RELATIONS
Mike Chopowick, VP, Marketing, Communication & Member Relations
Marica Macura, Director, Member Relations
Lesia Kostecki, Senior Membership Services Advisor
Kimberly Hicks, Senior Manager of Communications & Marketing
Alec Mackinnon, Communications Coordinator
FINANCE AND ADMINISTRATION
Tamara Orlova, Chief Financial Officer
Arlene Klemmer, Accounting Clerk
Matthews Joseph, Senior IT Analyst
Chrissan Pascal, Business Support Specialist
PUBLISHED BY ANNEX BUSINESS MEDIA, 111 Gordon Baker Road, Suite 400, Toronto, ON M2H 3R1
(416) 442-5600
annexbusinessmedia.com
Agreement #: 43526108
ADVERTISING SALES
Media Edge
nanciep@mediaedgepublishing.com
Canadian Niagara Power showed first-hand that community is important with a donation to support hospice care in their community.
In March, they donated $25,000 to support the future home of Wilson House in Fort Erie. It is under construction and should be completed by the end of this year. The hospice will have ten beds and provide compassionate and dignified care within their own community.

In March, Alectra announced the sale of Newmarket-Tay Power (NT Power) to Alectra via a deferred payment structure that is first of its kind in the distribution sector. The sale followed a multi-year review that began in 2022 protects NT Power employees, maintains a local service presence and ensures competitive electricity rates as well as maintaining customer service and long-term capital investment.
Southwestern Ontario will be receiving local generation and storage capacity thanks to a co-developed solar and battery storage project of at least 2 MVac within GrandBridge Energy’s service area including Brantford, Cambridge, North Dumfries and County of Brant. The 80/20 ownership structure favouring GrandBridge will target IESO long-term procurement and local generation programs. In addition, the partners will look at virtual power purchase agreements and net metering, to relieve grid congestion and support growing demand.
Toronto Hydro announced a new pilot program in March designed to help local builders electrify up to six multiplex housing projects without complex service upgrades. The program is administered through its Multiplex PowerPlay allows projects to qualify for funding toward a smart energy load management system. This system continuously monitors the energy consumption within the building as an alternative to service upgrades by preventing electricity demand to exceed panel or service limits.
Read the media release

The Hydro One Limited Board of Directors announced the appointment of Megan Telford as Hydro One’s President and Chief Executive Officer (CEO) effective June 9. Telford replaces David Lebeter who will retire on June 9, but will stay on as a special advisor until October 10.
The Board offered a “heartfelt thanks to David for his exceptional leadership and for building a strong executive team.” Telford is a strong successor who joined the organization in 2020. She most recently held the role of Chief Operating Officer, but has held roles including health, safety and environment, strategy and system planning, distribution/transmission operations and indigenous relations and customer care.






Elexicon Corporation announced the appointment of Max Cananzi to its Board of Directors. Cananzi brings decades of leadership and sector experience, serving previously as President of Alectra Utilities Corp.
Alectra Inc. announced that Dr. Andrea Nuesser is appointed as President of Util-Assist Inc. in March. De. Nuesser succeeds Mark Henderson who has held the position since 2021. She is an accomplished leader and engaging strategist with a strong passion for shaping the future of energy. Previously she held leadership roles with Capgemini, Hydo One and Innovative Research Group.
Hydro One appointed Deb Hutton as their Government of Ontario nominee to its board.
Hutton is an experienced public service with a wealth of communications and public policy expertise.
The OEB has appointed Nancy Marconi as Chief Operating Officer. She joined the OEB in 2016 as Manager, Supply and Infrastructure Applications. Since then, she has moved into roles including Registrar and Executive Champion for Diversity, Equity and Inclusion. She is well positioned for this new role taking on responsibilities for the efficient and effective management of the operations of the OEB.
The OEB has appointed Prabhat Juneja to the role of Chief Corporate Services Officer, effective April 20. His appointment strengthens the OEB as they continue to protect the interests of consumers and support the delivery of affordable, secure, reliable and clean energy that enables economic growth across the province.

Niagara Peninsula Energy Inc. (NPEI) raised $14,000 for charity through its eBill Campaign in fall 2025. The campaign, which ran from September 1 to December 31, 2025, encouraged customers to paperless billing, with NPEI donating $10 for each enrolment. The funds will support Food4Kids Niagara in providing healthy food packages to elementary school students facing food insecurity on weekends and during the summer months.
The campaign, now in its second year, highlights NPEI’s ongoing commitment to community impact and environmental sustainability by reducing paper use. It demonstrates how small actions can add up to meaningful change.
The cities of Brampton and Mississauga will receive $28.6 million and $46 million respectively in capital renewal and system enhancement projects in 2026. In Brampton, investments will support reliable electricity service, accommodating continued growth and strengthen the city’s electricity grid. Brampton is one of the fastest growing cities in the province and as such has more electricity demand due to new housing, business development and increased use of electric vehicles. Mississauga’s large size and growth means a need for renewing aging infrastructure, meeting growing electricity demand and modernizing the grid to ensure reliable and safe service.
Read the media release

FLUSH TO FLOOR COVER
ULTRA-THIN STAMPED STEEL FLANGE

Here’s the solution for cost-savings and easy installation of a receptacle and low voltage connections in an existing floor.
Arlington’s FLBR5420 series RECESSED FLOOR BOX KITS have two low voltage openings, an ultra-thin stamped steel flange, and flush-to-the-floor in-use and blank covers.
The thin flange and recessed wiring device reduce trip hazards caused by plugs protruding from the box. And you can have power and low voltagein the same box without a divider. That’s convenience!
• Easy installation with hole saw – 24.5 cu inch box mounts to floor with four mounting wing screws
• UL Listed 20A tamper-resistant decorator-style receptacle
• SIX cover finishes/colors
• Includes ground clip


Blank cover when not in use
FLBR5420BRGC BROWN, POWDER-COATED ZINC COVER

In use with slotted cover
FLBR5420MBGC w/ BRASS-PLATED ZINC COVER


Plated Diecast Zinc Cover and steel flange




Toronto Hydro announced two investments to improve EV fast charging and modernize streetlights. Electric vehicle users will be excited to hear that Toronto Hydro has begun a new pilot program designed to give EV charging providers direct access to 480-volt power to simplify grid connections and offer more public EV fast charging sites. The program is designed to make the process of building EV fast charging infrastructure easier. Through this project, up to 10 local projects will be provided direct access to 1.5 MVA, 480-volt transformers. This eliminated the need for customer-owned step-down transformers.
Streetlighting in Toronto will be modernized thanks to a 10-year investment to improve safety, reliability and sustainability in Toronto neighbourhoods by 2035. The $577 million investment will fund energy-efficient LED streetlighting with smart lighting controls.
Through its AlectraCARES Community Support Program, Alectra Inc. provided $1 million in funding to addressing food and housing security, mental health support and health care services for those facing hardships within their service areas. AlectraCARES began in 2017 and supports non-profit organizations in addition to supporting regional health foundations.
HYDRO ONE RECEIVE ELECTRICITY CANADA’S SUSTAINABLE ELECTRICITY DESIGNATION
By earning Electricity Canada’s Sustainable Electricity Designation, it confirms that Hydro One meets rigorous third-party verified standards for sustainability. Hydro One supports a sustainable future and practices responsible actions to strengthen the grid for long-term growth, reduce environmental impact, and improve service for communities across Ontario. The utility joins Toronto Hydro, Hydro Ottawa and Oakville Hydro in receiving this designation.
TORONTO HYDRO
Toronto Hydro secured 12 megawatts (MW) of local flexible electricity capacity that’s equal to what is required to power 3,000 households. This hydro capacity was found through its Local Demand Response (LDR) Program used to maximize the efficiency of their grid during high peak demand. The LDR Program in addition to $600 million in capital investments supports short to medium term localized capacity constraints while they grow and reinforce their system.
On Earth Day (April 22) the City of Kitchener, the City of Waterloo, the Townships of Woolwich, Wilmot and Wellesley each received a $50,000 grant to support tree planting initiatives.
The grants help compensate for Enova Power’s tree trimming program while creating more green spaces for people live, walk and gather. Read
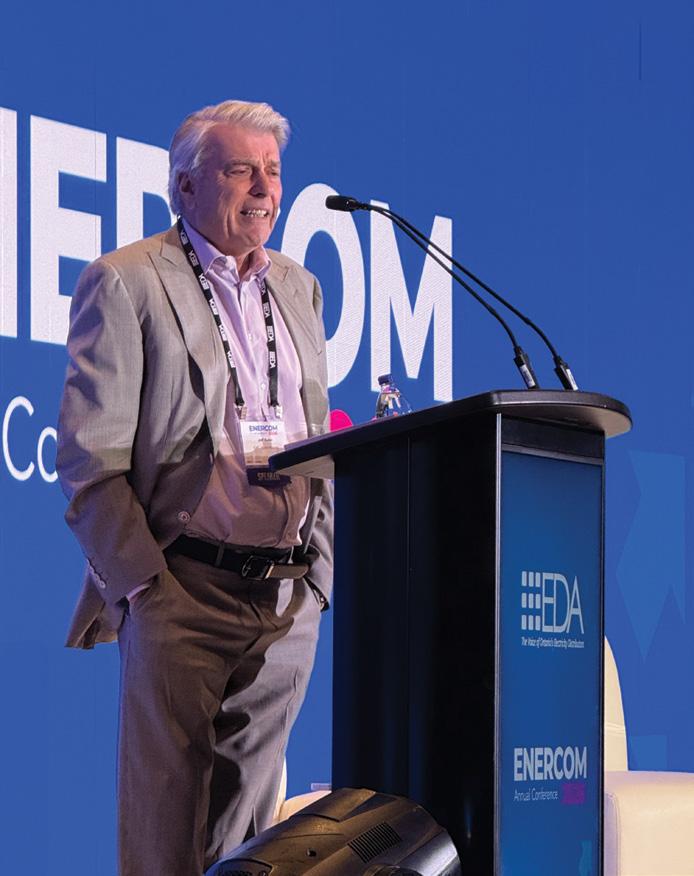
IESO President and CEO, Lesley Gallinger and Elexicon President and
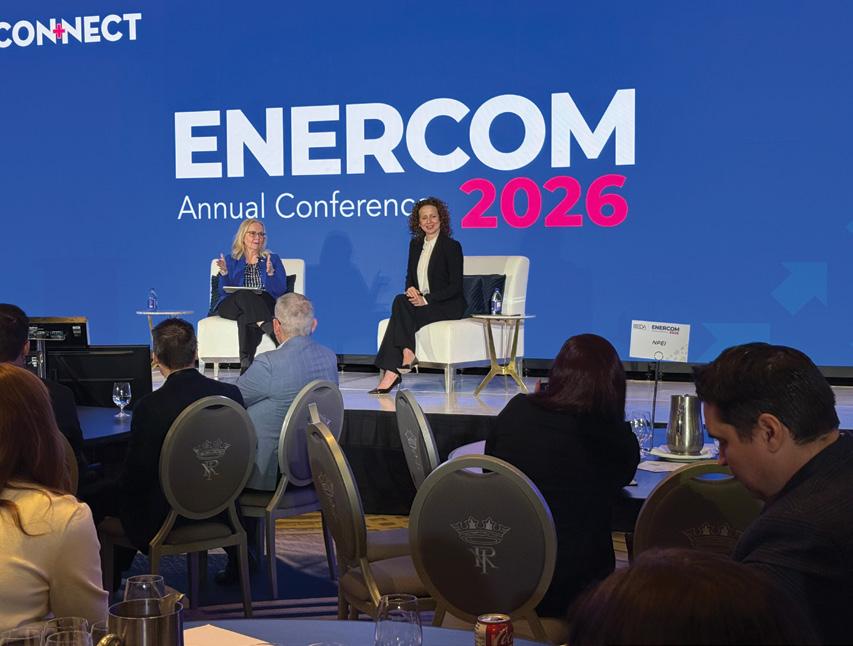
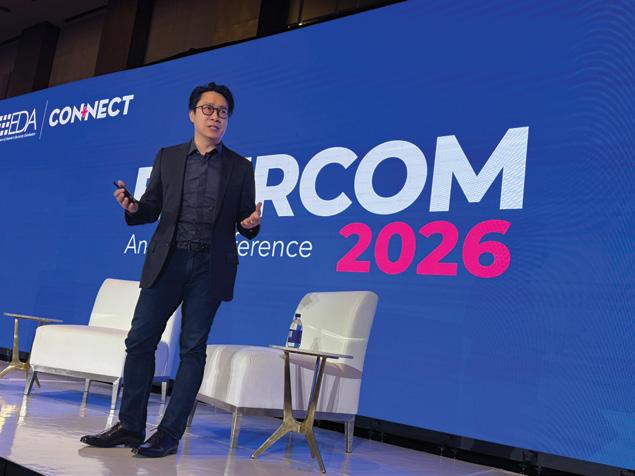
Energy Innovator and Founder/CEO of ThinkLabs AI, Joshua
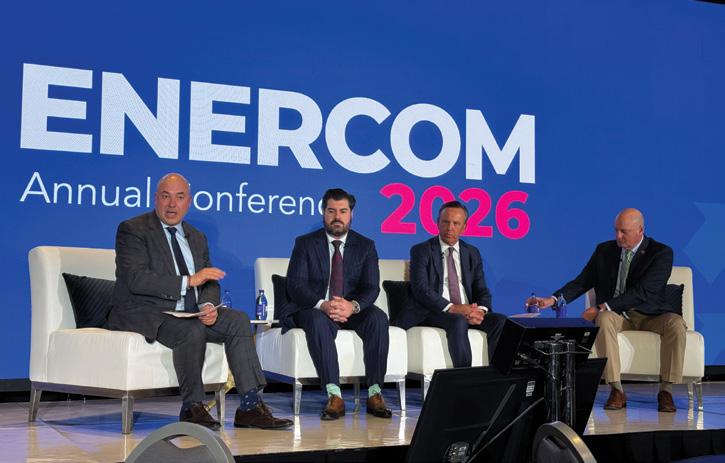
ENERCOM26 brought together an exceptional lineup of speakers who challenged perspectives and sparked new thinking across the sector.
The conference opened with Gitane DeSilva and Sean Mallen who explored the evolving Canada-United States (U.S.) relationship and underscored the need for preparedness amid uncertainty in U.S. leadership. Former CIBC Chief Economist Jeff Rubin delivered a candid economic outlook, describing the CUSMA renewal as “a dead man walking,” while noting the continued advantage of Canadian oil exports to the U.S. given the cost effectiveness of our oil from western Canada. Joshua Wong shifted the tone with an optimistic look at how AI is advancing autonomous grid intelligence in the distribution sector.
At lunch, Stephen Lecce, Minister of Energy and Mines shared an update on the PULSE review, emphasizing the importance of taking the time to get things right and outlining the need to reimagine how sector modernizing will be financed.
The afternoon focused on growing electricity demand with insights from the IESO’s Lesley Gallinger and Elexicon’s Amanda Klein. A deeper dive into financing followed, featuring GrandBridge Energy’s Sarah Hughes and Michael Fedchyshyn,
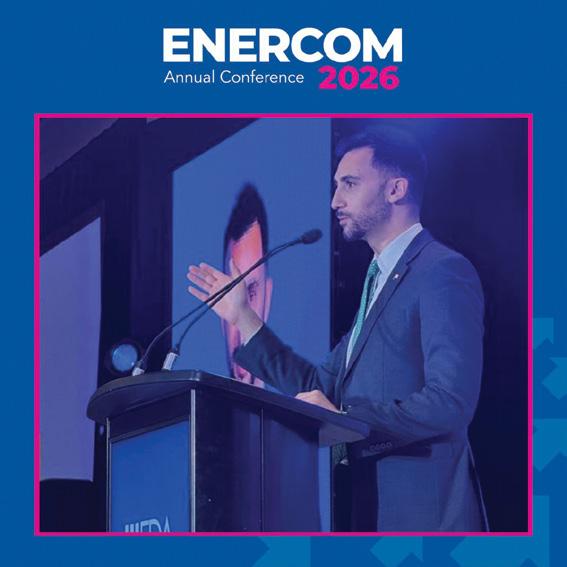
Minister of Energy and Mines,
outlining how the $8 billion Building Ontario Fund could support LDCs and enable access to capital.
ENERCOM closed with a dynamic cross-border panel featuring Scott Corwin, Justin Driscoll, and Mark Olsheski alongside Chris Benedetti. The discussion highlighted emerging opportunities from micro-grid and new technologies to sustainability. They also reinforced the need for solid strategic planning and system resilience in the face of extreme weather.
We look forward to welcoming you back in Toronto at ENERCOM27 from March 21-22, 2027.


People and Culture Excellence Award
Ontario’s local distribution companies (LDCs) came together to celebrate a year of innovation at the EDA Awards Gala, on March 23 at the Fairmont Royal York in Toronto. This year’s event highlighted the passion our members have for their work, as winners thanked their teams in between celebratory laughs and the occasional teary eye.
The EDA presented 12 awards – eight were presented to utilities and three individual categories to six people. Corporate awards included outstanding work in innovation, customer service, public relations, sustainability, and workplace culture.
The night was punctuated with passionate acceptance speeches and a sense of community. One of the first recipients of the night, Geraldine Guthrie, set the tone with an impassioned speech about the importance of collaboration and engagement of industry staff.
Building on that sense of community, each utility award winner brought team members to the stage to accept the award. In previous years, the stage may have been limited to Presidents and CEOs. This year, however, was the opposite, as the stage was packed with full teams.

Teresa Sarkesian, the EDA’s President and CEO, highlighted the importance of this event in her opening remarks.
“The EDA Awards Gala is a cherished tradition and a highlight of our year. It’s when our members and guests come together to celebrate the outstanding accomplishments and dedication of Ontario’s local distribution company community, the people who support customers and communities across the province every day,” Sarkesian said.
John Avdoulos, EDA Board Chair and President & CEO of Essex Power Corporation, hosted the Gala and emphasized the importance of the work Ontario’s LDCs are doing.
“We will continue to position Ontario’s utilities for success as we modernize. With that, we require updated regulatory changes and financial support to ensure we are providing Ontario with the most cost effective and reliable electricity system in Canada,” said Avdoulos.
LDC

Sam Oosterhoff, Associate Minister of Energy-Intensive Industries, was the Gala’s keynote speaker. The minister spoke optimistically about Ontario’s energy future, and the opportunities the energy is facing.
“If we do our jobs, and work together for affordable, reliable electricity, we can have a system that people think about in a good way,” said Oosterhoff.
The EDA thanks all members who submitted high quality award nominations and congratulates all LDCs for their exceptional performance this year.
Doane Grant Thornton Foundation
LDC Performance Excellence Award
Charitable Donations: Winner
Enova Power - The Foodbank of Waterloo Region
Nominees:
• PUC Services – St. Vincent Place Sault Ste. Marie
• Festival Hydro – HPHA Foundation
• OEC – United Way of Halton & Hamilton
• Hydro One – Sunnybrook Health Sciences Centre, Ross Tilley Burn Unit
The EDA and Doane Grant Thornton were proud to recognize the outstanding contributions made by the nominees and winner of the LDC Performance Excellence Award. Charitable donations to the winner’s and nominees’ selected charities were made possible through the generosity of the Doane Grant Thornton Foundation. This initiative reflects their belief in giving back and supporting causes that matter to the communities we serve.
Established to help us organize the collective efforts and significant contributions of our people across Canada, the Doane Grant Thornton Foundation provides additional financial support for local, national, and international causes that resonate with our people.
Our Greater Purpose Program allocates a percentage of Doane Grant Thornton’s annual net fees for donation back into our communities with the ultimate decision of which charities to support being made by our people.
Our Matching Program amplifies the effect of our people’s fundraising efforts by matching up to $2,500 to support local community initiatives.
Each year, we recognize colleagues who make significant or sustained contributions to charitable organizations or not-for-profits in their community through the CEO Community Service Awards.




See more winners from our 2026 Awards Gala on pages 38-39


With more than 40 years of experience, Tristar delivers integrated overhead and underground power distribution solutions that help Ontario’s local hydro utilities meet evolving customer needs.
From grid modernization and storm restoration to shoreline protection and hydro meter conversions, our work supports safe, reliable service across the province. As part of Aecon, Tristar is a trusted partner known for proven expertise, responsive delivery, and tailored solutions that strengthen system performance and customer confidence. We work alongside utilities to enhance reliability, improve service outcomes, and support the day to day demands of Ontario’s electricity distribution network.
Wayne Fernandes Vice President, Strategic Growth Tristar Electric Inc.
To learn more about our capabilities and track record visit aecon.com/tristar
By Bishoy Mansour, Utility Sales Specialist, ABB Canada
Most of Canada’s electrical grid infrastructure was designed to distribute energy in one direction: from the generation plant to the consumer. However, this traditional model no longer reflects how modern grids need to operate. With the rise of distributed energy resources (DER), electric vehicles and distributed generation, today’s grid must support bidirectional electricity exchange across multiple network points. According to
2.3 Demand Forecasts for the Three Scenarios
the Independent Electricity System Operator’s 2026 Annual Planning Outlook, Ontario’s population and electricity demand is projected to increase by roughly 65 per cent by 2050 due to electrification and economic growth, increasing the need for utilities to provide a reliable and resilient grid. These changes not only mean that Ontario needs more generation, but we also need a reliable, resilient and dynamic grid to accommodate modern energy needs.
Figure 1 indicates forecasted growth beginning in the reference year (2026) across all three demand scenarios, albeit at different rates, driven primarily by industrial automobile production, which includes emerging electric vehicle (EV) production and supply chain projects and project pipelines; strong interest from new commercial artificial intelligence service-providing data centres; incremental decarbonization/electrification projects across the economy; and higher population growth and household formation.
Figure 1 | Net Annual Energy Demand
As urbanization increases, utilities are expanding their underground infrastructure to enhance safety and reduce exposure to environmental risks.
The above chart indicates forecasted growth beginning in the reference year (2026) across all three demand scenarios, albeit at different rates, driven primarily by industrial automobile production, which includes emerging electric vehicle (EV) production and supply chain projects and project pipelines; strong interest from new commercial artificial intelligence service-providing data centres; incremental decarbonization/electrification projects across the economy; and higher population growth and household formation.
Consistent with previous APOs, Ontario is forecast to become dual peaking with summer and winter peaks reaching similar magnitude. The timing of occurrence depends on the scenario: early-2030s in the high-demand scenario; late-2030s in the reference scenario; and beyond 2050 in the low-demand scenario. This may be helpful to shape the design of future programs and procurements. Figure 2 indicates this timing, and the net seasonal peak demand, for the three demand forecast scenarios.
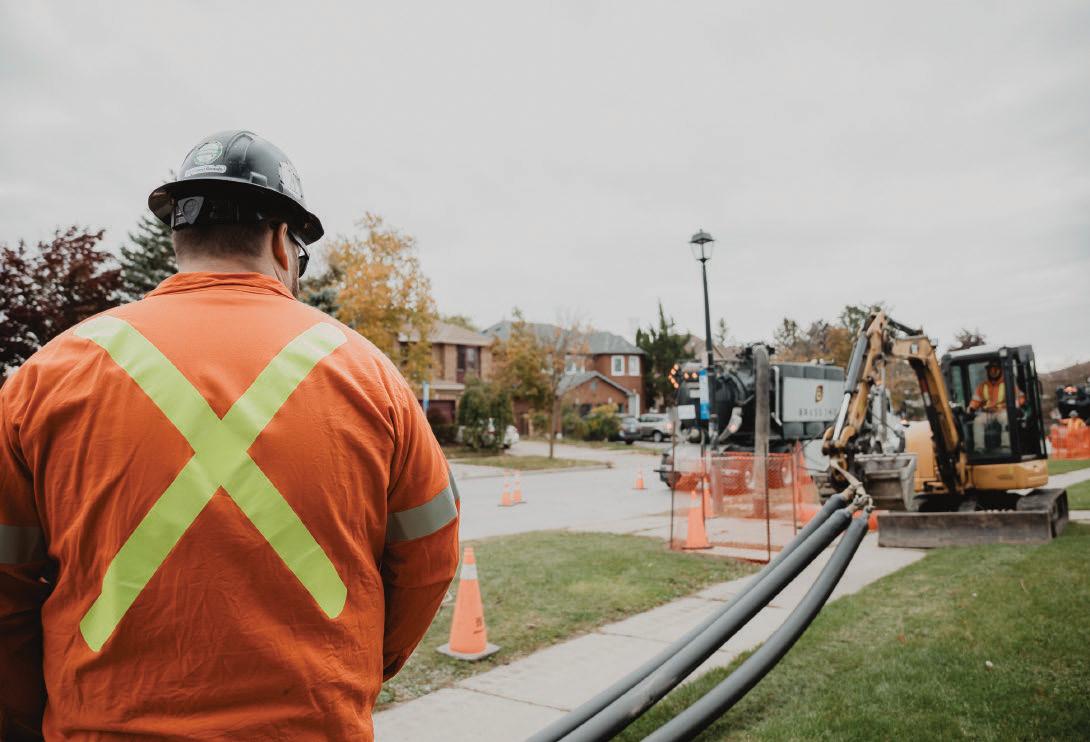
In Ontario, approximately 73% of distribution infrastructure remains overhead (Ontario Ministry of Energy, 2023), highlighting both the current system composition and the opportunity for targeted underground expansion. Recent investments, including the approval of a new underground transmission line connecting the Darlington Nuclear Generating Station to downtown Toronto (Ontario government, 2026), reflect a broader shift toward more resilient infrastructure solutions in high density areas. While this approach offers clear benefits, it introduces a critical visibility gap. Unlike overhead systems, these networks limit direct visual identification of equipment damage and fault indicators such as smoke, loss of indicator lights or service interruptions.
To tackle this challenge, Canadian utilities are investing in preventing outages and making the grid more resilient. This includes modernizing infrastructure with higher current carrying capacity to withstand greater loads, implementing rigorous asset management programs to replace aging equipment, investing in newer technologies and conducting comprehensive fault analysis to prevent failure. Yet as the grid grows and evolves and new factors come into play, the resiliency problem is growing faster than the solution.
The System Average Interruption Duration Index (SAIDI) is an accurate measure of the grid’s resilience. Not only does it count outages, but it captures what matters most: the duration. This approach prioritizes minimizing service interruption time rather than just frequency, recognizing that total hours of energy unavailability is the metric that truly impacts Ontarian’s lives and businesses.
From a prevention perspective, utilities analyze existing infrastructure, identify vulnerabilities and execute strategic upgrades. Equally important is the forwardlooking design process: increasing the margin of error, future-proofing designs and implementing new technologies. As the network grows and matures, new fault conditions emerge, stress levels escalate and environmental demands intensify, making speed and precision critical in fault response.
The System Average Interruption
Duration Index is an accurate measure of the grid’s resilience.
The visibility gap introduced by underground infrastructure is being addressed through technologies such as real-time SCADA systems, faulted current indicators with integrated communications and advanced grid monitoring solutions. These tools provide not only fault detection capabilities but also actionable data that enables more informed, data driven decisions to optimize grid performance and investment planning. As a result, utilities are better equipped to enhance resilience, reduce outage duration, deliver reliable service, particularly in critical moments when it matters most.
For Canada’s utilities, the path forward is clear: continued investment in resilience, greater adoption of digital technologies, and a sustained focus on what matters most to customers, dependable and uninterrupted energy. In doing so, utilities are not only modernizing infrastructure but building a grid that is prepared to meet future demands.
Sources
Independent Electricity System Operator. 2026 Annual Planning Outlook: ieso. ca/Sector-Participants/Planning-and-Forecasting/Annual-Planning-Outlook
Ontario Government. (2026). Ontario focused on economy by approving new Toronto transmission line: news.ontario.ca/en/release/1006901/ ontario-focused-on-economy-by-approving-new-toronto-transmission-line
Ontario Ministry of Energy. (2023). Energy vulnerability assessment for Ontario’s electricity distribution sector: ontario.ca/files/2024-05/ energy-vulnerability-assessment-for-ontarios-electricity-distributionsector-en-2023-05-23.pdf


By Bob Champagne, Head of Digital Innovation and AI Enablement; Goutam Ghatak, VP of Grid Modernization; and Frank Carnevale, Country Head, Canada, iGreenTree.ai
When a severe ice storm sweeps through central Ontario, hundreds of thousands of customers can lose power, echoing the scale of historical events like the 1998 ice storm. Ontario’s distribution utilities mobilize mutual aid, replace broken poles, and restring lines, a familiar scene that reflects how they have handled major weather events for decades.
But every storm leaves behind the same uneasy questions. How much of that damage was predictable? How many crews could have been better positioned before the first pole fell? How many customers received restoration estimates that turned out to be wrong, eroding trust at exactly the moment it mattered most?
Regulatory expectations are making these questions harder to defer. Across Canada and the U.S., regulators are placing increasing emphasis on resilience, reliability, and transparent communication around restoration times, while extreme weather is striking more frequently and with greater intensity.
Ontario LDCs have spent years refining reactive storm response: faster dispatch, more coordinated mutual aid, sharper customer communication. Those investments have paid off. But the next leap comes from moving upstream, using data and analytics to anticipate where failures will happen, pre position crews, and deliver restoration estimates that customers can reliably act on.
That shift does not require exotic technology. It requires integration. Weather
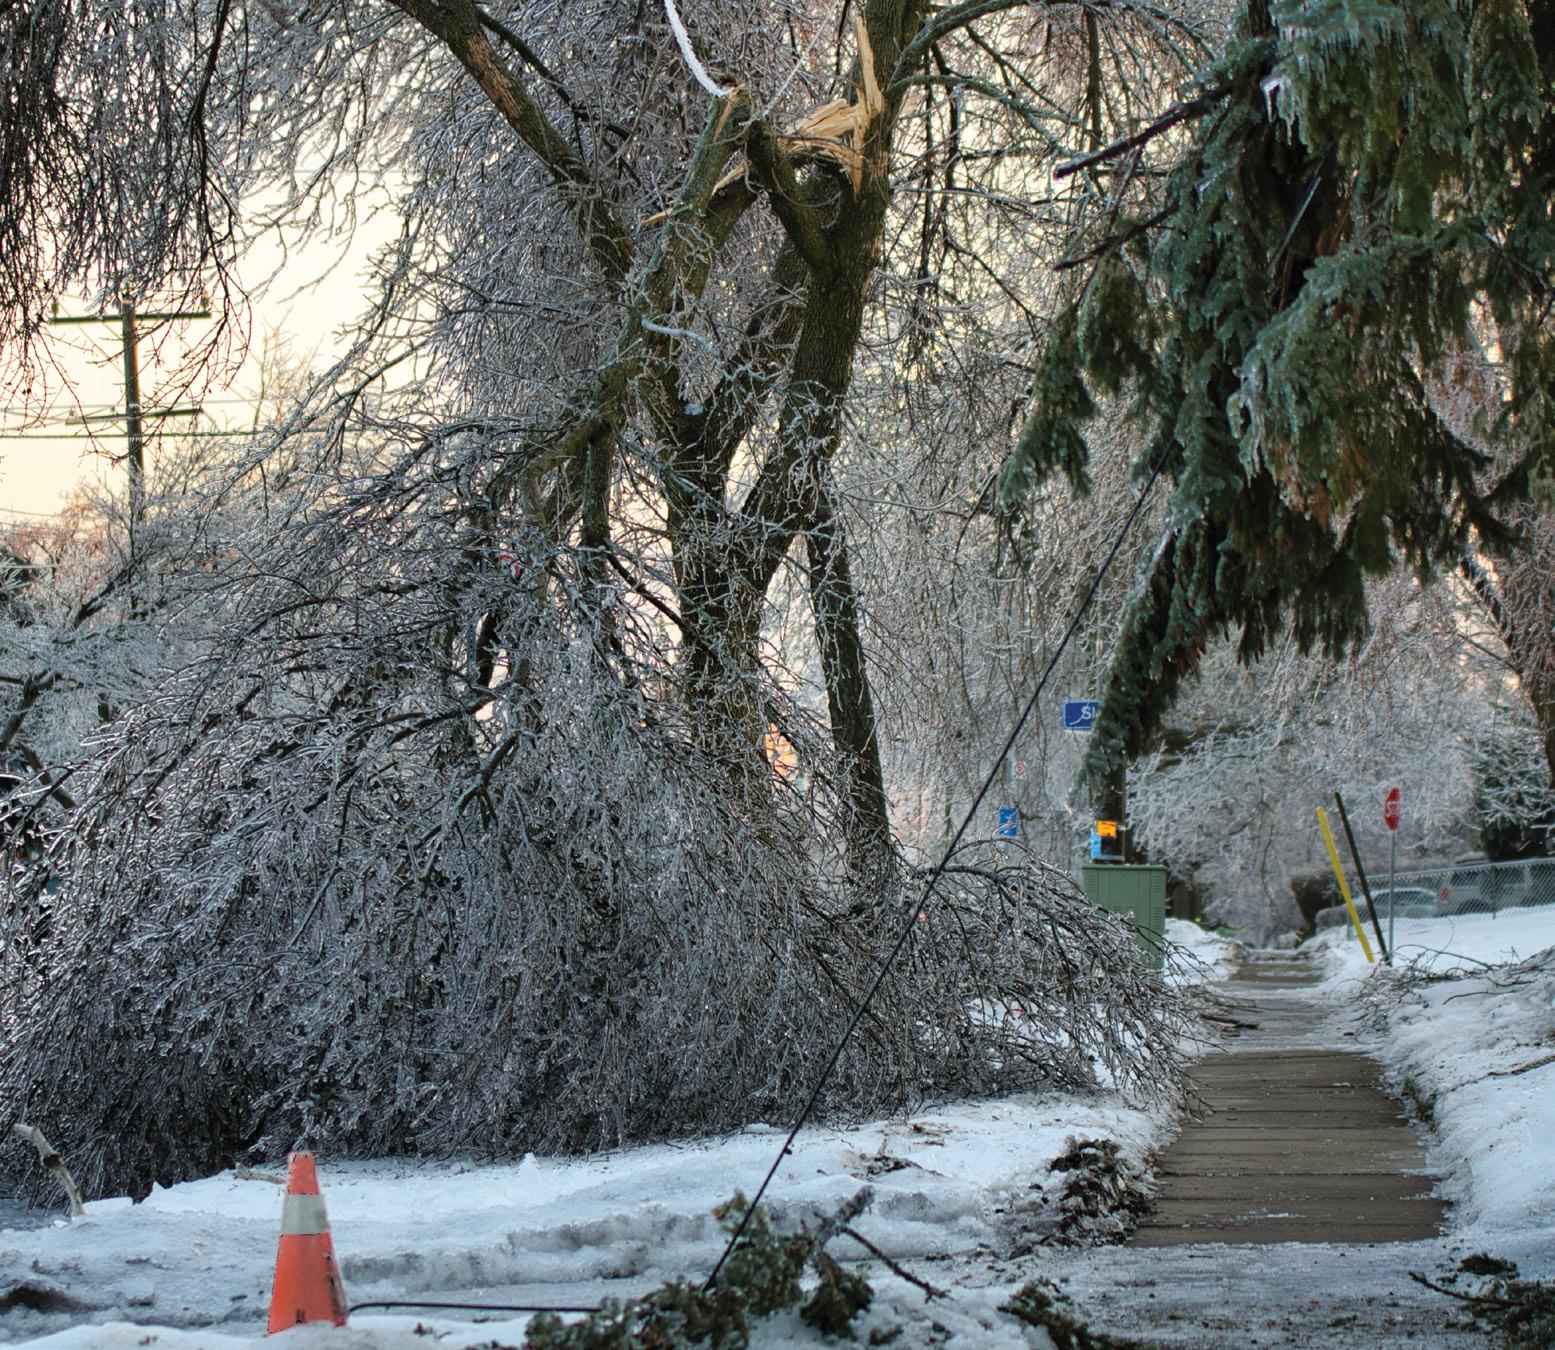
Across Canada and the U.S., regulators are placing increasing emphasis on resilience, reliability, and transparent communication around restoration times, while extreme weather is striking more frequently and with greater intensity.
forecasts must connect with historical outage patterns. Asset condition data should align with vegetation risk and network topology. Automated Meter Infrastructure (AMI) last gasp signals, Outage Management System (OMS) tickets, and Geospatial Information System (GIS) geometry can work together to pinpoint trouble before a customer calls. Supervisory Control and Data Acquisition (SCADA) telemetry can feed models that learn from every past storm. The pieces exist in many utilities already; they simply need to speak the same language, flowing through a unified data platform that sits safely between OT systems and enterprise analytics.
Utilities from coast to coast are using data and AI powered analytics to drive material improvements across every facet of their outage response ecosystem — from forecasting and crew staging to damage assessment, Estimated Time of Restoration (ETR) accuracy, and customer communications.
In the United States southeast, for example, one major utility now uses machine learning storm models on a cloud platform to predict likely damage and resource needs before severe weather hits, informing how and where they pre position crews and materials. In the Midwest, another utility has applied machine learning to its restoration time estimates, significantly improving the accuracy and consistency of the ETRs customers receive during events. A third utility has implemented a robust drone program which pushes live video feeds into its control centre, allowing operators to assess damage and validate switching options far faster than traditional field patrols alone. Strategies like these create a flywheel effect: better data and models improve planning and situational awareness, which improves decisions and customer experience, which in turn builds internal confidence to take on more ambitious analytics use cases. Over time, storm readiness becomes less about heroics in the control room and more about a system built around a continuous learning system that gets stronger with every event.
The results above are real, but so is the complexity behind them. Getting Operational Technology (OT) data out of an Advance Distribution Management System (ADMS) safely, without compromising operational integrity or crossing cybersecurity boundaries, is not a simple configuration task. Building a storm data platform that AMI, SCADA, GIS, and work management systems trust requires sustained data governance work. Training a crew pre positioning model that operators will act on, rather than override, takes time, iteration, and organizational trust building that no vendor roadmap accounts for.
do we have, and how good is it? Where are our OT to IT boundaries, and what can realistically cross them? What does our control centre’s leadership need to see, and what decisions do we want them to make that they cannot make today?
Those are the questions worth starting with. Not which platform, not which vendor, but what problem, for whom, and what “better” looks like in practice. From there, the architecture choices tend to become clearer, the integration work gets sequenced properly, and the analytics investments land on soil that is prepared to receive them.
Ontario’s distributors have built community trust in part through fast and capable storm response. The next chapter is about readiness, and readiness starts with knowing exactly where you stand today.

The utilities that have achieved transformational results did not get there by deploying technology alone. They got there by answering hard questions first: What data

By Daryn Thompson, Chair, EDA Commercial Member Steering Committee
Hello from the Commercial Members Steering Committee (CMSC) and the ever-growing list of Commercial and Commercial Plus members. I look forward to the next two years of collaborating with the EDA in my new role as CMSC Chair. I was also pleased to represent the CMSC at the March 2026 opening reception of the EDA’s AGM, ENERCOM and Awards Gala. The reception was sponsored by the CMSC.

As Chair, I hope to focus on delivering value to Commercial Members through their participation and helping them build stronger networks with the Ontario’s utilities. Neither of us can reach our objectives without the other. I acknowledge Peter Vickery, our Chair for the last two years and thank him for the enthusiasm and energy that he brought to the post.
I extend a thank you to our new EDA board representative Daniel Arbour, President and CEO of Oshawa Power, and thank John Avdoulos, President and CEO of Essex Power, our former representative. I wish him well in his new role as Chair of the EDA Board of Directors.
We have a busy time ahead of us. Our industry is continuing to undergo rapid changes while working to keep the lights on. It feels a lot like rebuilding a race car while it is racing around the track. The
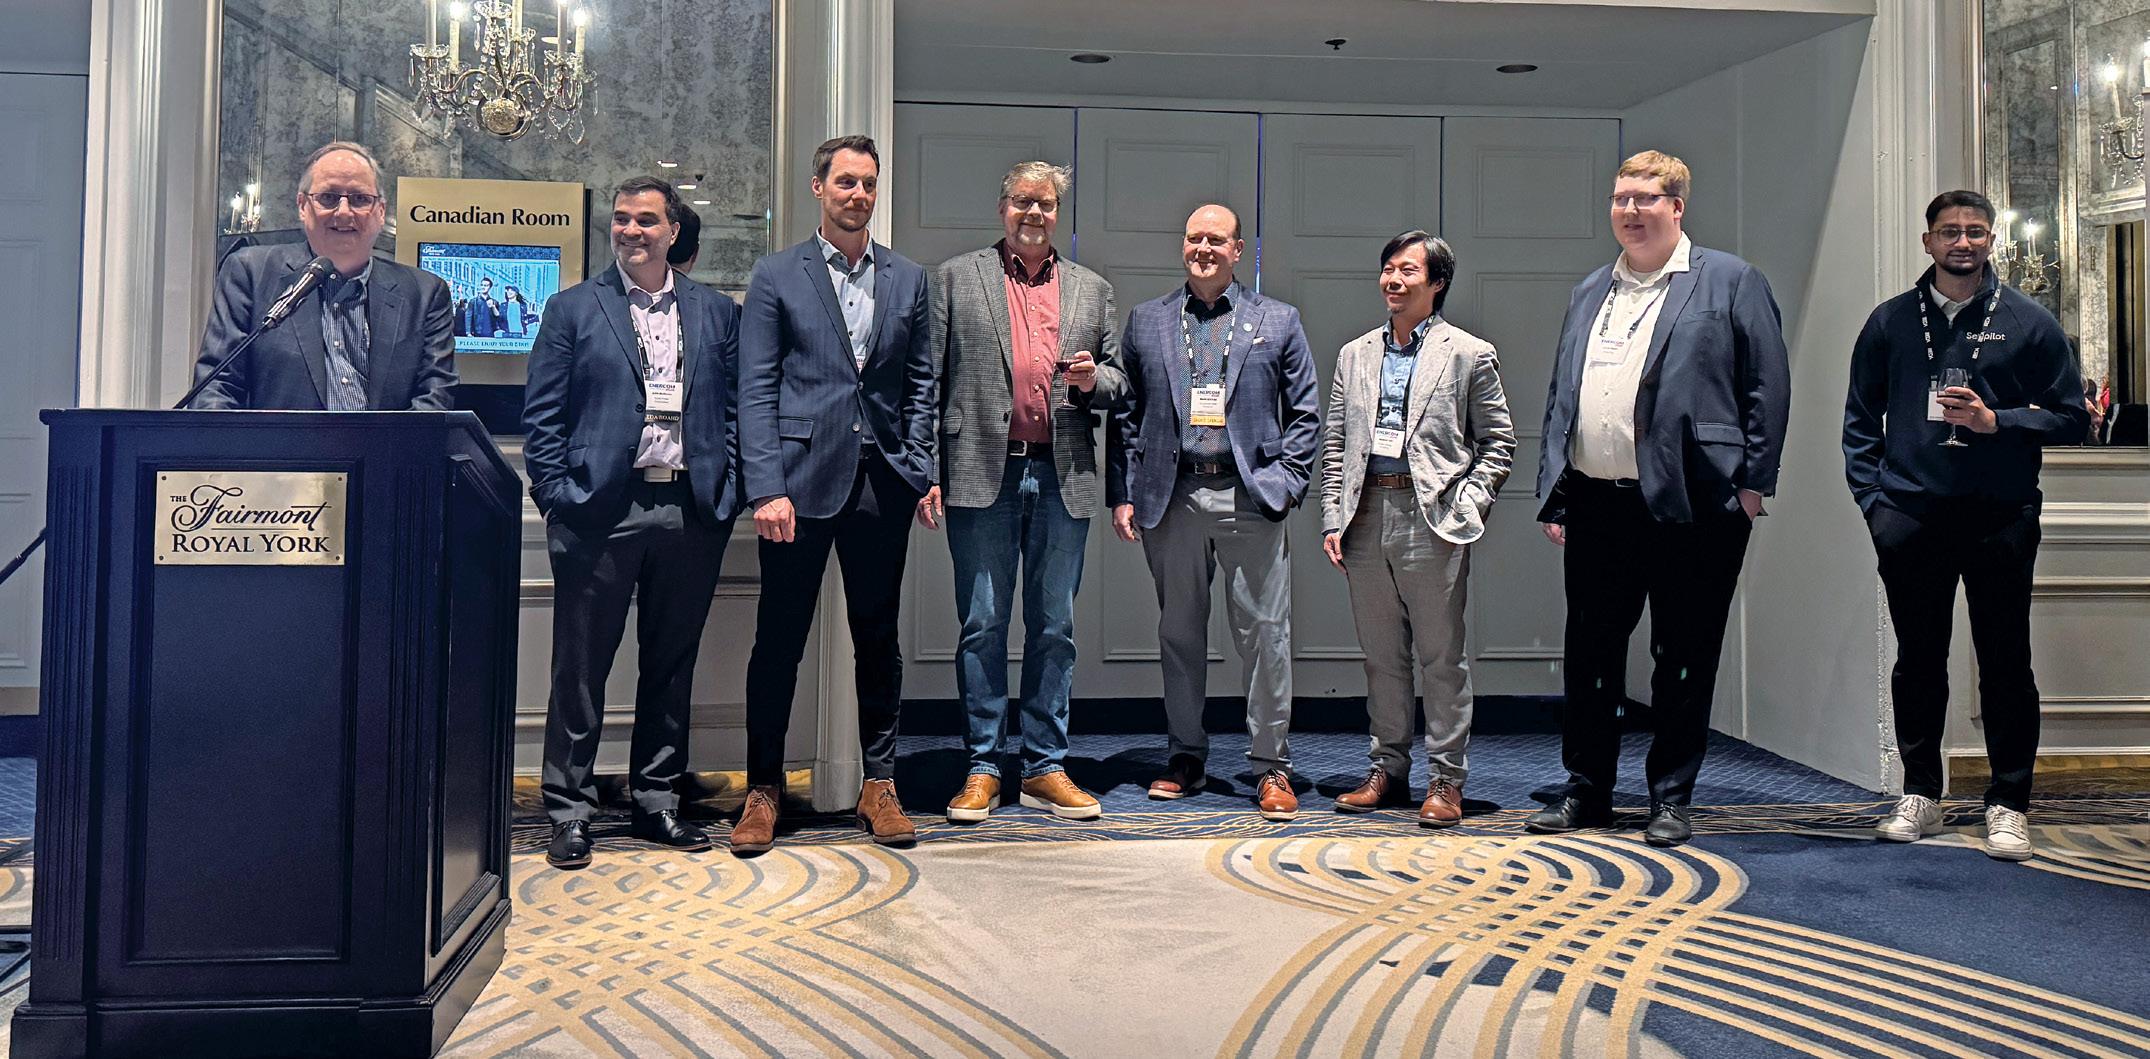
Commercial Members Steering Committes (L-R): Daryn Thompson, Chair; John Avdoulos, EDA Board Chair; Daniel Arbour, EDA Board Representative, Stephen Dow, Nevin Gilchrist, Andrew Lam, James Major, and Nathan Duarte.
process of electrification and the extraordinary demands on the system of new technologies will surely present obstacles that can only be resolved by the entire value chain. Through all, the commercial members are gearing up to take an active part in the process, be it consulting and services, line equipment and hardware, or business systems and software.
On behalf of the CMSC, I wish everyone a successful 2026 and I look forward to meeting as many EDA Utility and Commercial Members as I can over the next few years.
The Power Workers’ Union (PWU) takes great pride in representing the large majority (over 15,000) of the men and women who work in Ontario’s electricity production and delivery sector.
Our members work hard, 24 hours per day, 7 days per week to ensure that electricity customers have the power they need when they need it.
The PWU is the voice of electricity workers in Ontario. Since the initial electrification of homes and businesses in our province, the PWU has continuously worked to set and improve the standards for public and worker electrical safety. We continue to negotiate the best in sustainable wages, benefits and working conditions for the highly-skilled workers in our industry.
We work closely with our employers to help them build and operate vibrant, successful business operations in changing times and we work with government and regulators to foster electricity policy development that works for customers, electricity businesses and employees.
Take a look at the Power Workers’ Union – We think you’ll like what you see.
To learn more about us, please go to www.pwu.ca
FROM THE MEN AND WOMEN WHO HELP KEEP THE LIGHTS ON.


By Milind Jain, Grid Innovation Specialist
Ontario’s electricity system is entering a period of rapid transformation. Electrification, economic growth and rising peak demand are placing increasing pressure on local grids, challenging traditional approaches to system planning.
GrandBridge Energy is responding with the GridShare Capacity Auction Program, an innovative Non-Wires Alternative program that is redefining how capacity needs can be addressed by turning customers into active grid partners.
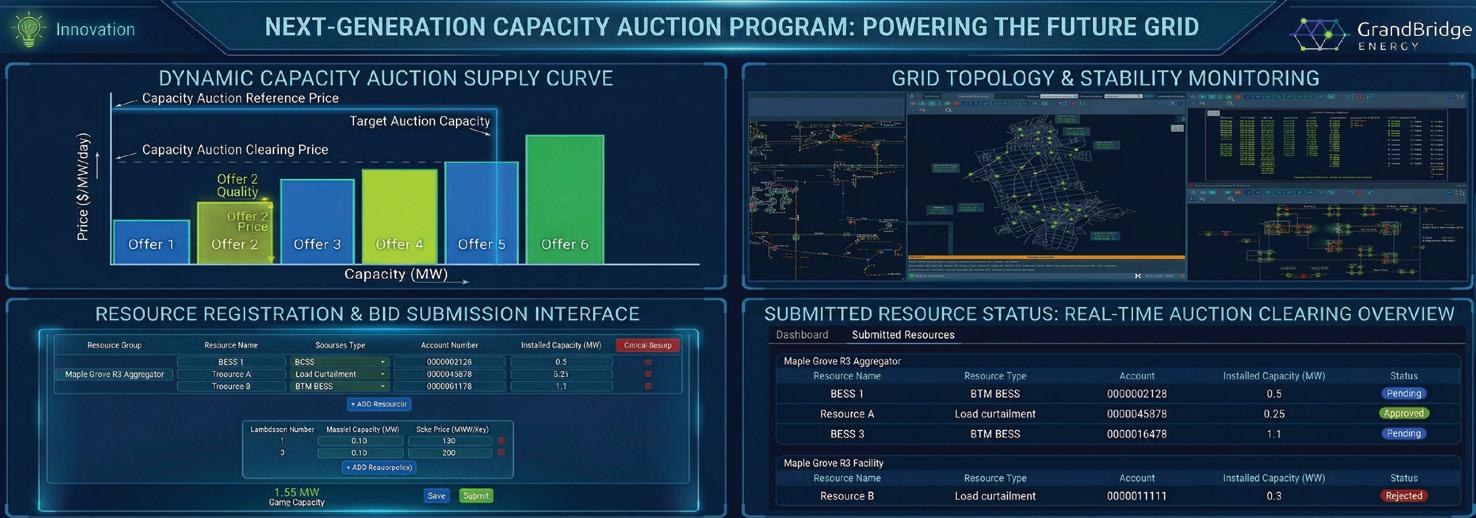
GridShare leverages demand response and behind-the-meter distributed energy resources (DERs) to unlock flexible capacity where and when it’s needed most. Rather than relying solely on new infrastructure, the program leverages existing customer assets, including load curtailment, generators and battery energy storage systems, to provide near-term relief to constrained areas of the grid.
The program has launched in Cambridge and North Dumfries, where capacity needs have been identified. Through partnerships with large commercial, industrial and institutional customers, GrandBridge Energy is targeting 5 MW of flexible capacity in 2026, scaling to 10 MW in 2027 and 20 MW by 2028.
For participating customers, the benefits extend beyond financial incentives. Customers play a direct role in improving grid reliability and resiliency, helping reduce outage risks while demonstrating leadership in Ontario’s energy transition. At the same time, they can unlock new value from existing assets, transforming them into revenue-generating resources that support the broader electricity system.
“Through GridShare, we’re working closely with our key accounts customers to deliver innovative energy solutions that enhance their experience,” said Lucas Prohaska, GrandBridge Energy’s Key Account Manager. “We’re seeing strong interest and engagement in this new solution.”
The timing for GridShare is critical. Between 2026 and 2028, many regions across Ontario are expected to face increasing capacity constraints as demand rises and electrification accelerates. Meanwhile, traditional infrastructure projects remain years from completion due to planning, regulatory approvals, procurement and construction timelines. GridShare is designed to bridge that gap, delivering immediate, flexible and scalable capacity while long-term solutions are planned and built.
GridShare is also breaking new ground from a regulatory perspective. It represents the first standalone application submitted under the Ontario Energy Board’s Non-Wires Solutions Guidelines for Electricity Distributors, supported by the associated Benefit-Cost Analysis Framework. This milestone marks a broader shift in how utilities can evaluate and deploy alternatives to traditional infrastructure, placing non-wires solutions on more equal footing within planning processes.
GrandBridge Energy is working with GridS2, a Canadian cleantech company based in the Greater Toronto Area, to support the development and implementation of the program, enabling the coordination of DERs in real time.
“As electrification accelerates, we need to think beyond traditional infrastructure solutions,” said Allen Chan, Manager of Engineering and Innovation at GrandBridge Energy. “GridShare allows us to unlock flexibility from within our community, supporting reliability today while we design and build tomorrow’s grid.”
As LDCs across Ontario face similar challenges, GridShare offers a practical blueprint for balancing system needs with an evolving energy landscape. More than a pilot, it reflects a broader shift in the role of utilities, from sole providers of infrastructure to orchestrators of distributed energy solutions.
Through GridShare, GrandBridge Energy is demonstrating that the future of the grid will be more flexible, more collaborative, and increasingly shaped by the customers it serves. Visit the GridShare page on grandbridgeenergy.com for more details.
As Ontario’s energy landscape evolves, Local Distribution Companies (LDCs) face increasing demands to modernize infrastructure, support electrification, and maintain cost-effective, reliable service. Transformers remain central to this effort—enabling safe, efficient voltage conversion across residential, commercial, and industrial applications. As LDCs evaluate procurement strategies, selecting the right transformer solutions is essential to meeting performance, efficiency, and long-term asset management goals.
A well-matched transformer must reflect the utility’s specific operating conditions, including voltage requirements, loading profiles, and space constraints. Liquid-immersed padmounted, pole-top, and small power transformers, particularly those within the 2.4kV to 46kV and 25kVA to 10,000kVA range, continue to serve as the backbone of local distribution systems. Units built to precise specifications help ensure safe integration, efficient performance, and longevity across both new developments and retrofit applications.
Energy efficiency is a rising priority as utilities seek to meet conservation targets and reduce system losses. Transformers built with amorphous steel cores offer significant reductions in no-load losses, making them especially valuable for LDCs pursuing aggressive efficiency standards. Alternatively, Cold Rolled Grain Oriented (CRGO) cores provide a reliable, cost-effective option for standard applications. The availability of both options gives LDCs the flexibility to align procurement decisions with regulatory goals, load patterns, and total cost of ownership considerations.
Customization remains critical, especially for LDCs managing legacy infrastructure or
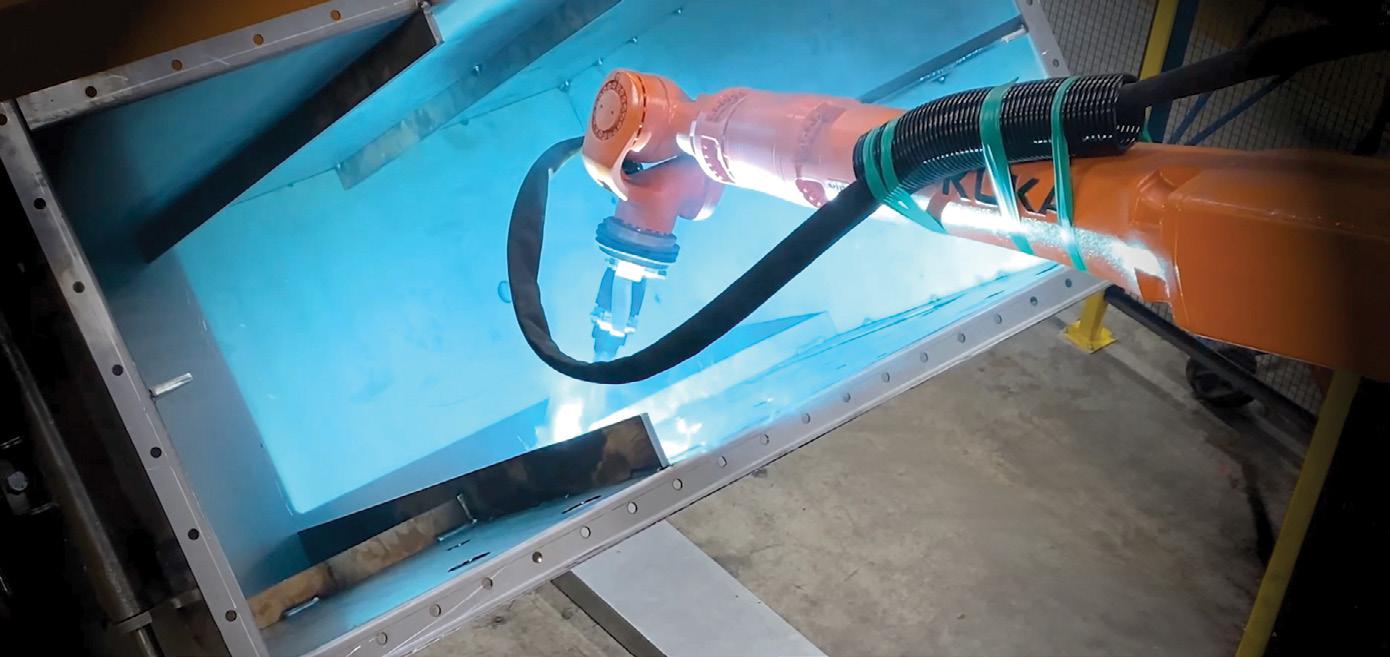
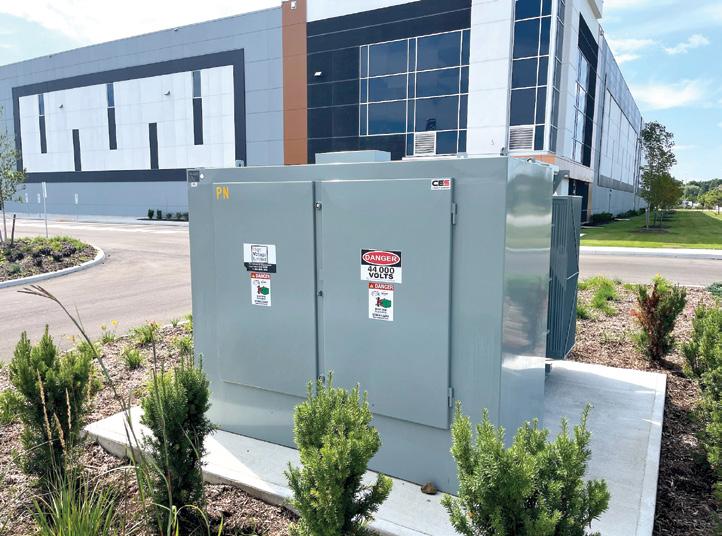
Transformers built with amorphous steel cores offer significant reductions in no-load losses, making them especially valuable for LDCs pursuing aggressive efficiency standards.
unique operating environments. Transformer suppliers that offer tailored, built-to-order units—including retrofit-ready and specialty designs—enable smoother grid upgrades without the cost and disruption of major system overhauls. CES Transformers, for instance, manufactures all units in Markham and offers engineering collaboration to meet utility-specific technical and spatial requirements.
Procurement logistics and responsiveness are also key considerations. LDCs benefit from suppliers with the production capacity and operational agility to meet demand surges, project timelines, and emergency replacements. CES currently produces over 10,000 transformers annually and has expansion plans underway to further increase throughput. Programs like slot capacity agreements help utilities secure build windows in advance, ensuring equipment availability even during peak periods.
Transformer lifecycle support is equally important. LDCs managing diverse and aging asset fleets across wide geographies need options for repair, refurbishment, and rewind to extend equipment life and preserve capital budgets. CES offers vendor-agnostic service capabilities that allow utilities to service existing transformers regardless of manufacturer, promoting operational continuity and better fleet management.
While suppliers like CES bring valuable local manufacturing, customization, and service capacity, the guiding principle for LDCs should be alignment between product capability and network need. As grid demands increase and technology evolves, the transformer procurement process becomes a key lever for advancing reliability, efficiency, and sustainability across Ontario’s energy transition.

By Nancy Marconi, Chief Operating Officer, Ontario Energy Board
Ontario’s energy system is evolving at unprecedented speed. Accelerating electrification, growing adoption of distributed energy resources (DERs) and rising expectations from commercial and industrial customers are reshaping how electricity infrastructure is planned and delivered across the province.
In response, the Ontario Energy Board (OEB) and Ontario’s electricity distributors are working together as strategic partners, combining regulatory leadership, operational expertise and digital innovation to enhance customer service and support economic growth. Central to this collaboration is a shared commitment to solutions that meet the diverse needs of today’s energy users.
A key example of this partnership is the OEB’s Centralized Capacity Information Map (CCIM), a powerful online tool developed with distributors to improve access to provincewide electricity system information.
Launched in January 2026, the CCIM is an online screening tool that provides a high-level view of available electrical load and DER hosting capacity across Ontario’s electricity distribution systems. The CCIM is designed to provide business intelligence to commercial and industrial customers, developers, municipalities and other system stakeholders with early insight into where new connection capacities may be feasible.

Nancy Marconi, Chief Operating Officer, Ontario Energy Board
The CCIM delivers on expectations set out by the Minister of Energy and Mines by providing easier, more streamlined access to consistent and detailed, provincewide information on load and DER hosting capacity. By consolidating data from electricity distributors, the CCIM provides a simplified and straightforward way of reducing uncertainty and enabling informed decision making early in the planning process.
Businesses are increasingly expecting greater predictability and proactive support as they plan expansions, electrify operations, deploy DERs or invest in EV infrastructure. The CCIM helps meet these expectations by providing access to critical grid capacity information earlier in the project lifecycle. The tool enables early-stage site screening for projects ranging from industrial facility expansions and new housing developments to EV charging stations and DER installations.

The Aird & Berlis Energy Group provides tailored, strategic counsel across the energy sector, guiding industry leaders through complex regulations with sharp insight, deep sector knowledge and practical, business-focused solutions.
By Ashley Trgachef
Ontario’s electricity system is amid rapid change and driving forces include electrification, population growth, and rising demand from homes, businesses and emerging industries. These aspects are reshaping how energy is produced, delivered and consumed. Local distribution companies (LDCs) are at the forefront of this transformation, ensuring the grid remains reliable, resilient and ready for a low carbon future.
Alectra Utilities is advancing this transition through a focused and strategic 2026 capital investment program. The plan is designed to
By upgrading distribution infrastructure and expanding feeder capacity, Alectra is supporting economic development across the communities it serves while enabling customers to adopt cleaner energy solutions with confidence.
strengthen reliability, modernize infrastructure and deliver long term value to more than one million residential, commercial and industrial customers. Each year, Alectra invests nearly $300 million— approximately $1 million every day—to renew aging assets and build new infrastructure that supports growing electricity needs.
These investments span all 17 communities Alectra serves, including Hamilton, Barrie, Aurora, Markham, Vaughan, Richmond Hill, Brampton, Mississauga, Guelph and St. Catharines. Each project is tailored to local conditions, whether addressing rapid growth, replacing end of life equipment or improving service reliability in neighbourhoods.
Alectra’s 2026 capital plan prioritizes targeted infrastructure investments
that directly enhance service reliability and responsiveness for customers across its service territory. These investments include upgrading aging equipment, reinforcing critical distribution assets and expanding system capacity to support continued growth.
As seen in previous capital programs, replacing end-of-life infrastructure and strengthening key feeder lines are essential to reducing outages and maintaining the high level of service customers expect.
In parallel, Alectra continues to expand the use of automation across its network. Advanced automated switching technologies allow system operators to isolate faults and restore power more quickly, significantly reducing outage duration and improving the overall customer experience.
These enhancements are particularly important as customers become increasingly reliant on electricity for everyday life, from powering homes and businesses to supporting electric vehicles and digital infrastructure.
Ontario’s energy transition is being shaped by several key factors, including electrification of transportation and heating, urban development, and the expansion of datadriven industries. Alectra’s 2026 investments are designed to proactively address these pressures by increasing system capacity and ensuring the grid can accommodate future demand.
By upgrading distribution infrastructure and expanding feeder capacity, Alectra is supporting economic development across the communities it serves while enabling customers to adopt cleaner energy solutions with confidence.
Importantly, these investments also position the grid to integrate distributed energy resources (DERs), such as solar generation and battery storage, which are becoming an increasingly important part of Ontario’s energy landscape.
Innovation remains a cornerstone of Alectra’s capital strategy. In addition to traditional infrastructure upgrades, the utility is deploying advanced technologies that improve efficiency, reduce costs, and minimize disruption for customers.
One example is cable rejuvenation, an innovative process that extends the life of
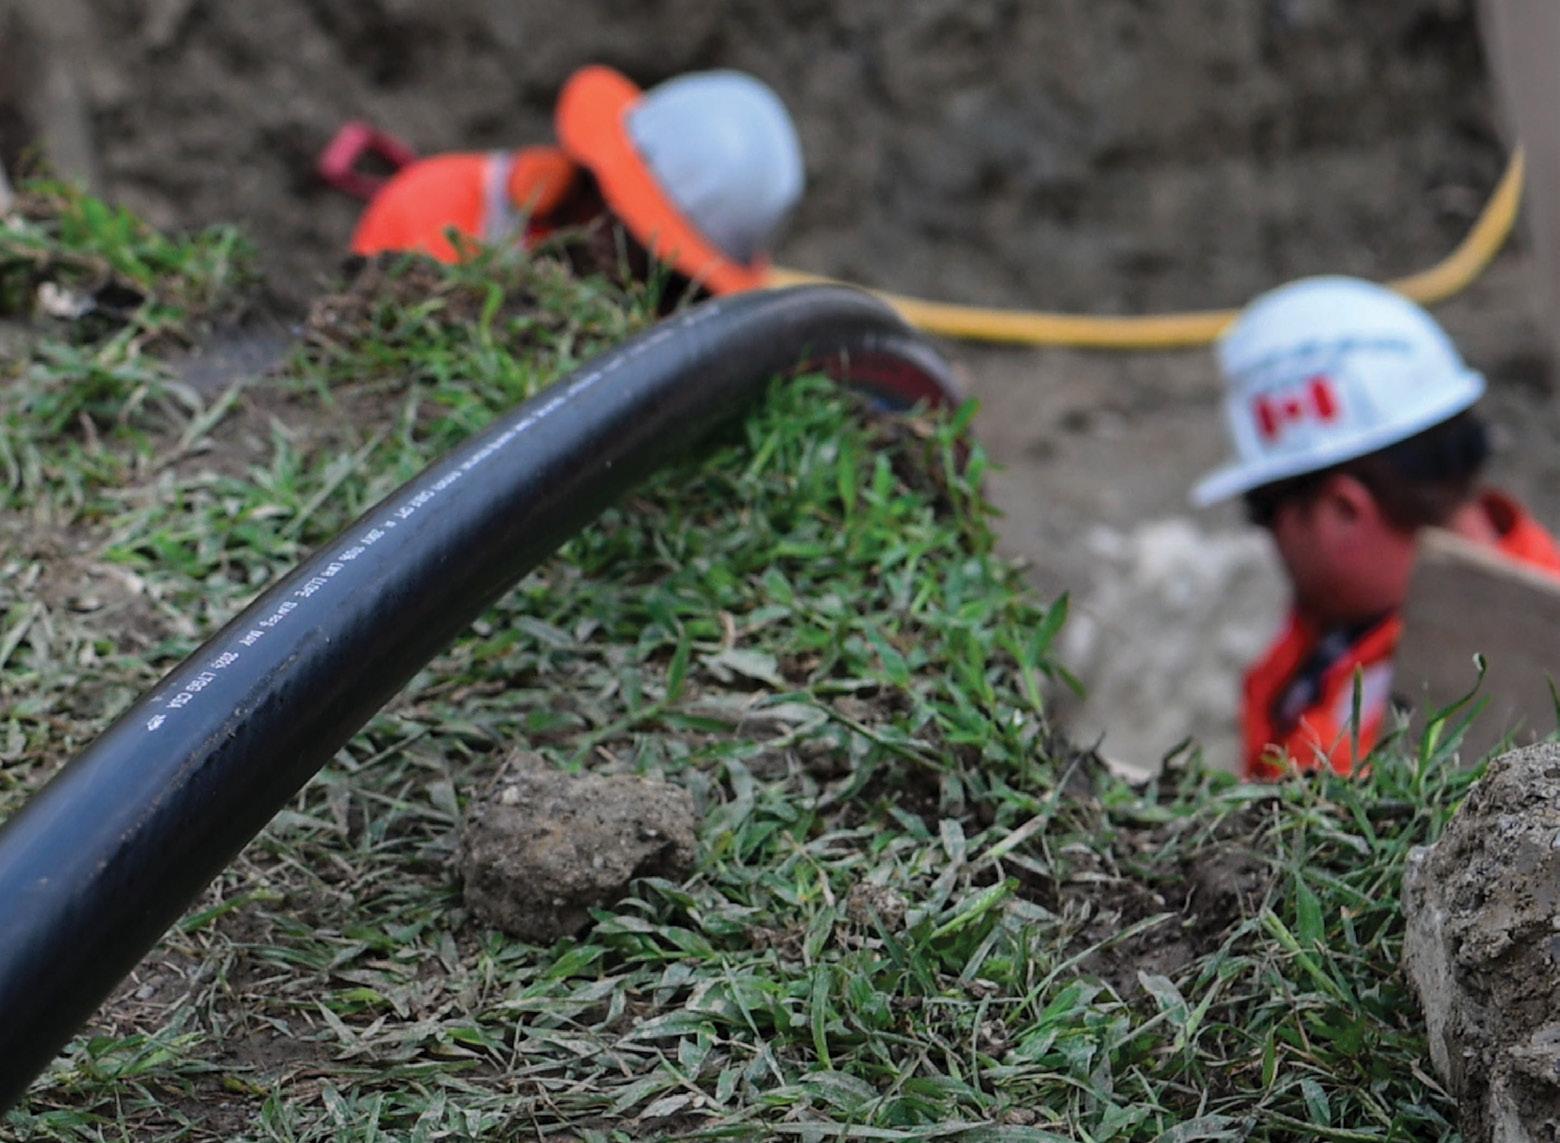
underground cables without the need for excavation. By injecting a specialized silicone-based fluid into aging cables, Alectra can repair weak points, reduce the risk of failure, and prevent outages.
This approach not only enhances reliability but also delivers environmental and cost benefits. Cable rejuvenation reduces the need for full cable replacement, minimizes construction impacts in communities, and contributes to greenhouse gas reductions by avoiding more carbon-intensive infrastructure work.
Alectra’s capital investments are designed to deliver tangible benefits at the local level. Across its service territory, projects are tailored to address the specific needs of each community, whether that means reinforcing infrastructure in high-growth areas, improving reliability in established neighbourhoods, or supporting new commercial and industrial developments.
Clear and proactive communication is also a key component of Alectra’s approach. Customers are kept informed through local media outreach, digital channels and targeted updates that provide visibility into projects happening in their communities.
This localized approach ensures that investments are not only technically effective but also responsive to the diverse needs of residential, commercial and industrial customers.
As Ontario continues to advance toward a more electrified and low-carbon future, the role of LDCs has never been more important. Alectra’s 2026 capital plan reflects a strong commitment to delivering safe, reliable and sustainable electricity while enabling the broader energy transition.
By investing in modern infrastructure, embracing innovation and prioritizing customer experience, Alectra is helping to build a resilient grid that supports economic growth, environmental goals and the evolving expectations of the communities it serves. To learn more about our plans, visit alectrautilities.com/improvingreliability.
By David Florio, Partner, Risk Services, Doane Grant Thornton
Recent shocks to the global energy market driven by increased fossil fuel prices are leading many to predict an increased focus on expanding our electricity networks. Even before these price shocks, demand for electricity was expected to grow, driven by trends ranging from AI data centres to industrial electrification. Local distribution companies (LDCs) will bear a significant portion of that burden and are looking for ways to adapt as they confront this challenge. Yet even in this landscape, one area of opportunity is often overlooked: internal controls. In some organizations, internal controls have a bad reputation; they’re seen as extra work that gets in the way of ‘getting things done.’ Truthfully, if they aren’t correctly tailored to your business and its risks, they can be.
However, when thoughtfully designed and effectively implemented, internal controls can help to safeguard your assets, ensure key reports are accurate and useful, reduce errors, streamline workflows, and free up resources for strategic initiatives.
Put simply, internal controls are the mechanisms an organization puts in place to increase the likelihood of achieving its business objectives and managing risks to an acceptable level. But it’s not simply the rules and regulations, the systems and paperwork of an organization; it’s the way that those things guide the actions of the employees tasked with executing the business’ mission. How can internal controls drive value?
Traditionally, internal controls have been seen as protective measures, such as regulatory compliance and risk mitigation, both of which are crucially important to any business. However, the implementation of strong internal control systems can also

Internal controls are the mechanisms an organization puts in place to increase the likelihood of achieving its business objectives and managing risks to an acceptable level.
improve business performance, including enhanced operational efficiency through process improvement and improved decision making driven by the availability of reliable and accurate data.
Internal controls can be broken down into five core components, each fundamentally connected with the others.
• Control environment: The set of standards, processes, and structures that provide the basis for carrying out internal control across the organization
• Risk assessment: A dynamic and iterative process for identifying and assessing risk to the achievement of objectives. Risk assessment forms the basis for determining how risks will be managed.
• Control activities: Actions established through policies and procedures that ensure management’s directives to mitigate risks to the achievement of objectives are carried out.
• Information and communication Information: Management obtains or generates and uses relevant and quality information from both internal and external sources to support the functioning of other components of internal control.
Communication: The continual, iterative process of providing, sharing, and obtaining necessary information
1. Internal communication is how information is disseminated throughout the organization and enables personnel to receive a clear message from senior management that control responsibilities must be taken seriously.
2. External communication enables inbound communication of relevant external information, and it provides information to external parties in response to its requirements and expectations.
• Monitoring activities: Used to ascertain whether the five components of internal controls are functioning.
Let’s look at some practical real-world examples of situations in which internal controls could have prevented activities that harmed an organization.
After years of consistently operating within annual budgets, an LDC begins to run deficits. The cause is clear—equipment is failing more frequently and costs to repair and replace are growing. The failures are affecting a wide range of equipment, including transmission lines, transformers, circuit breakers, and switchgears. This is the result of infrastructure not being updated and/or properly maintained for some time. It also reflects a lack of preparedness to manage external factors, including but not limited to extreme weather conditions.
How could internal controls have prevented this situation?
• Regular reviews of maintenance and equipment inspection schedules can help identify gaps in coverage and refresh risk assessments to match on the ground conditions. Those adjustments can better help identify deteriorating and aging equipment that requires updates and/or replacement.
• Implementing technology, such as AI tools and sensors to monitor the condition of the equipment could help in better predicting when failures could occur and preventative maintenance should be deployed.
Internal controls aren’t just about avoiding mistakes—they’re about enabling smarter, faster, and more confident business decisions.
In recent years, an electricity provider has seen significant turnover in its leadership roles while a change in government has led to new regulatory requirements throughout the industry. Without guidance from leadership, the compliance team has become complacent and allowed minor infractions to slip through the cracks. As a result, they’re incurring fines and potential lawsuits from a failure to comply with and meet environmental and safety regulations.
How could internal controls have prevented this situation?
• Implementing a formal compliance program to track regulatory requirements and regulatory changes.
• To the extent possible, implementing a system to enable automated compliance management will assist in the enhancement of the control environment and help mitigate the risk of missing updates to regulations.
• Periodic auditing and review of contractors engaged by the organization to validate that they are complying with regulatory requirement will also help mitigate the risk of non-compliance as outsourcing the work to contractors helps execute the processes but does not relieve the organization of its overall responsibility and accountability.
Traditionally, internal controls have been seen as protective measures, such as regulatory compliance and risk mitigation, both of which are crucially important to any business.
In each of the scenarios, a lack of internal controls led to a loss of value. In the case of the aging infrastructure, that meant having to spend more on maintenance and repairs, which could lead to underinvestment in other parts of the business. In the compliance case, the lack of controls led to an actual loss of funds. In both cases, there was a true loss to the organization.
According to The Chartered Professional Accountants of British Columbia (CPABC), organizations of any size can improve their control environment by:
• Mapping Processes: Document business and IT workflows.
• Identifying Risks: Pinpoint where things could go wrong.
• Designing Controls: Address identified risks with targeted measures.
• Formalizing Documentation: Ensure clarity and consistency.
• Monitoring Performance: Test controls regularly.
• Reviewing and Updating: Keep controls current with business changes
Internal controls aren’t just about avoiding mistakes—they’re about enabling smarter, faster, and more confident business decisions. At Doane Grant Thornton, we help organizations design and implement controls that go beyond compliance, creating systems that are tailored to your business to support long-term success.
Whether you’re scaling operations, or simply looking to improve performance, our advisory teams are here to help.
Ontario’s energy transition is developing rapidly. Customers are adding Distributed Energy Resources (DERs), installing EV infrastructure, and exploring demand response options in numbers that would have been hard to predict a decade ago. For local distribution companies (LDCs), this shift is creating a fundamental challenge: how can LDCs manage a grid built for one-way power flow when energy is increasingly moving in every direction?
With federal grant funding, Oshawa Power is working to develop a solution. In March, Oshawa Power received $400,000 through Natural Resources Canada’s Energy Innovation Program to advance our Distribution System Operator (DSO) initiative, titled Empowering Energy Transition: A Distribution System Operator Enabled Demand Response Program. The funding supports the design and development of the processes and tools needed to operate a local DSO market, including a benefit-cost analysis for deploying DSO as a non-wires solution.

This project goes deeper than traditional grid infrastructure planning. A local DSO market would equip LDCs like Oshawa Power with the tools to actively coordinate customer-owned DERs, including solar installations, battery storage systems, and EV chargers, and put them to work for the grid. Instead of simply accommodating the connection of these assets, utilities can integrate them into a managed system that delivers tangible benefits across our grid. From greater energy flexibility for businesses to the development of unique demand response programs for residential customers, local DSOs will improve grid stability across Ontario communities.
With benefits of grid modernization efforts traditionally concentrated in areas with newer infrastructure, one of the project’s key priorities is to reach traditionally underserved customers. Oshawa Power is deliberately designing this program to address that gap, developing DSO use cases that target customers who have historically had fewer options and less visibility in energy transition conversations.
To deliver this project, Oshawa Power will work alongside two key partners: GridS2, a leader in innovative energy transition solutions,
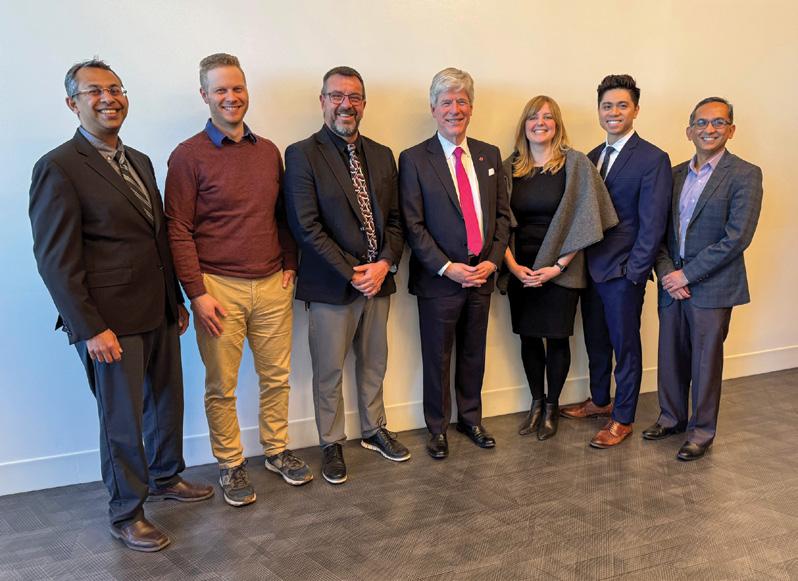
and Mike Weatherbee, Managing Director, Oshawa Power; Tim Hodgson, Minister of Energy and Natural Resource Canada; Janet Taylor, Manager, Sustainability and Partnerships and Jackson Quang, Project Manager, Oshawa Power and Nimish Bhatnagar, CEO, GridS2.
and Cambium Indigenous Professional Services, which brings critical expertise in Indigenous advisory services. The partnership reflects a core belief that a resilient and equitable energy future must be built with, not just for, all members of the community.
This project will build the foundation for Oshawa Power to operate a local DSO market when the regulatory and market conditions allow. What this project produces in the interim is equally valuable. Once complete, Oshawa Power will be equipped with rigorous analysis, documented processes, and innovative tools to move forward with confidence.
For LDCs witnessing the acceleration of the energy transition across Ontario, the DSO model provides one potential solution to the challenges it presents. Customers pursuing resilient and sustainable solutions deserve a local utility that is ready to integrate and enable a better energy future.

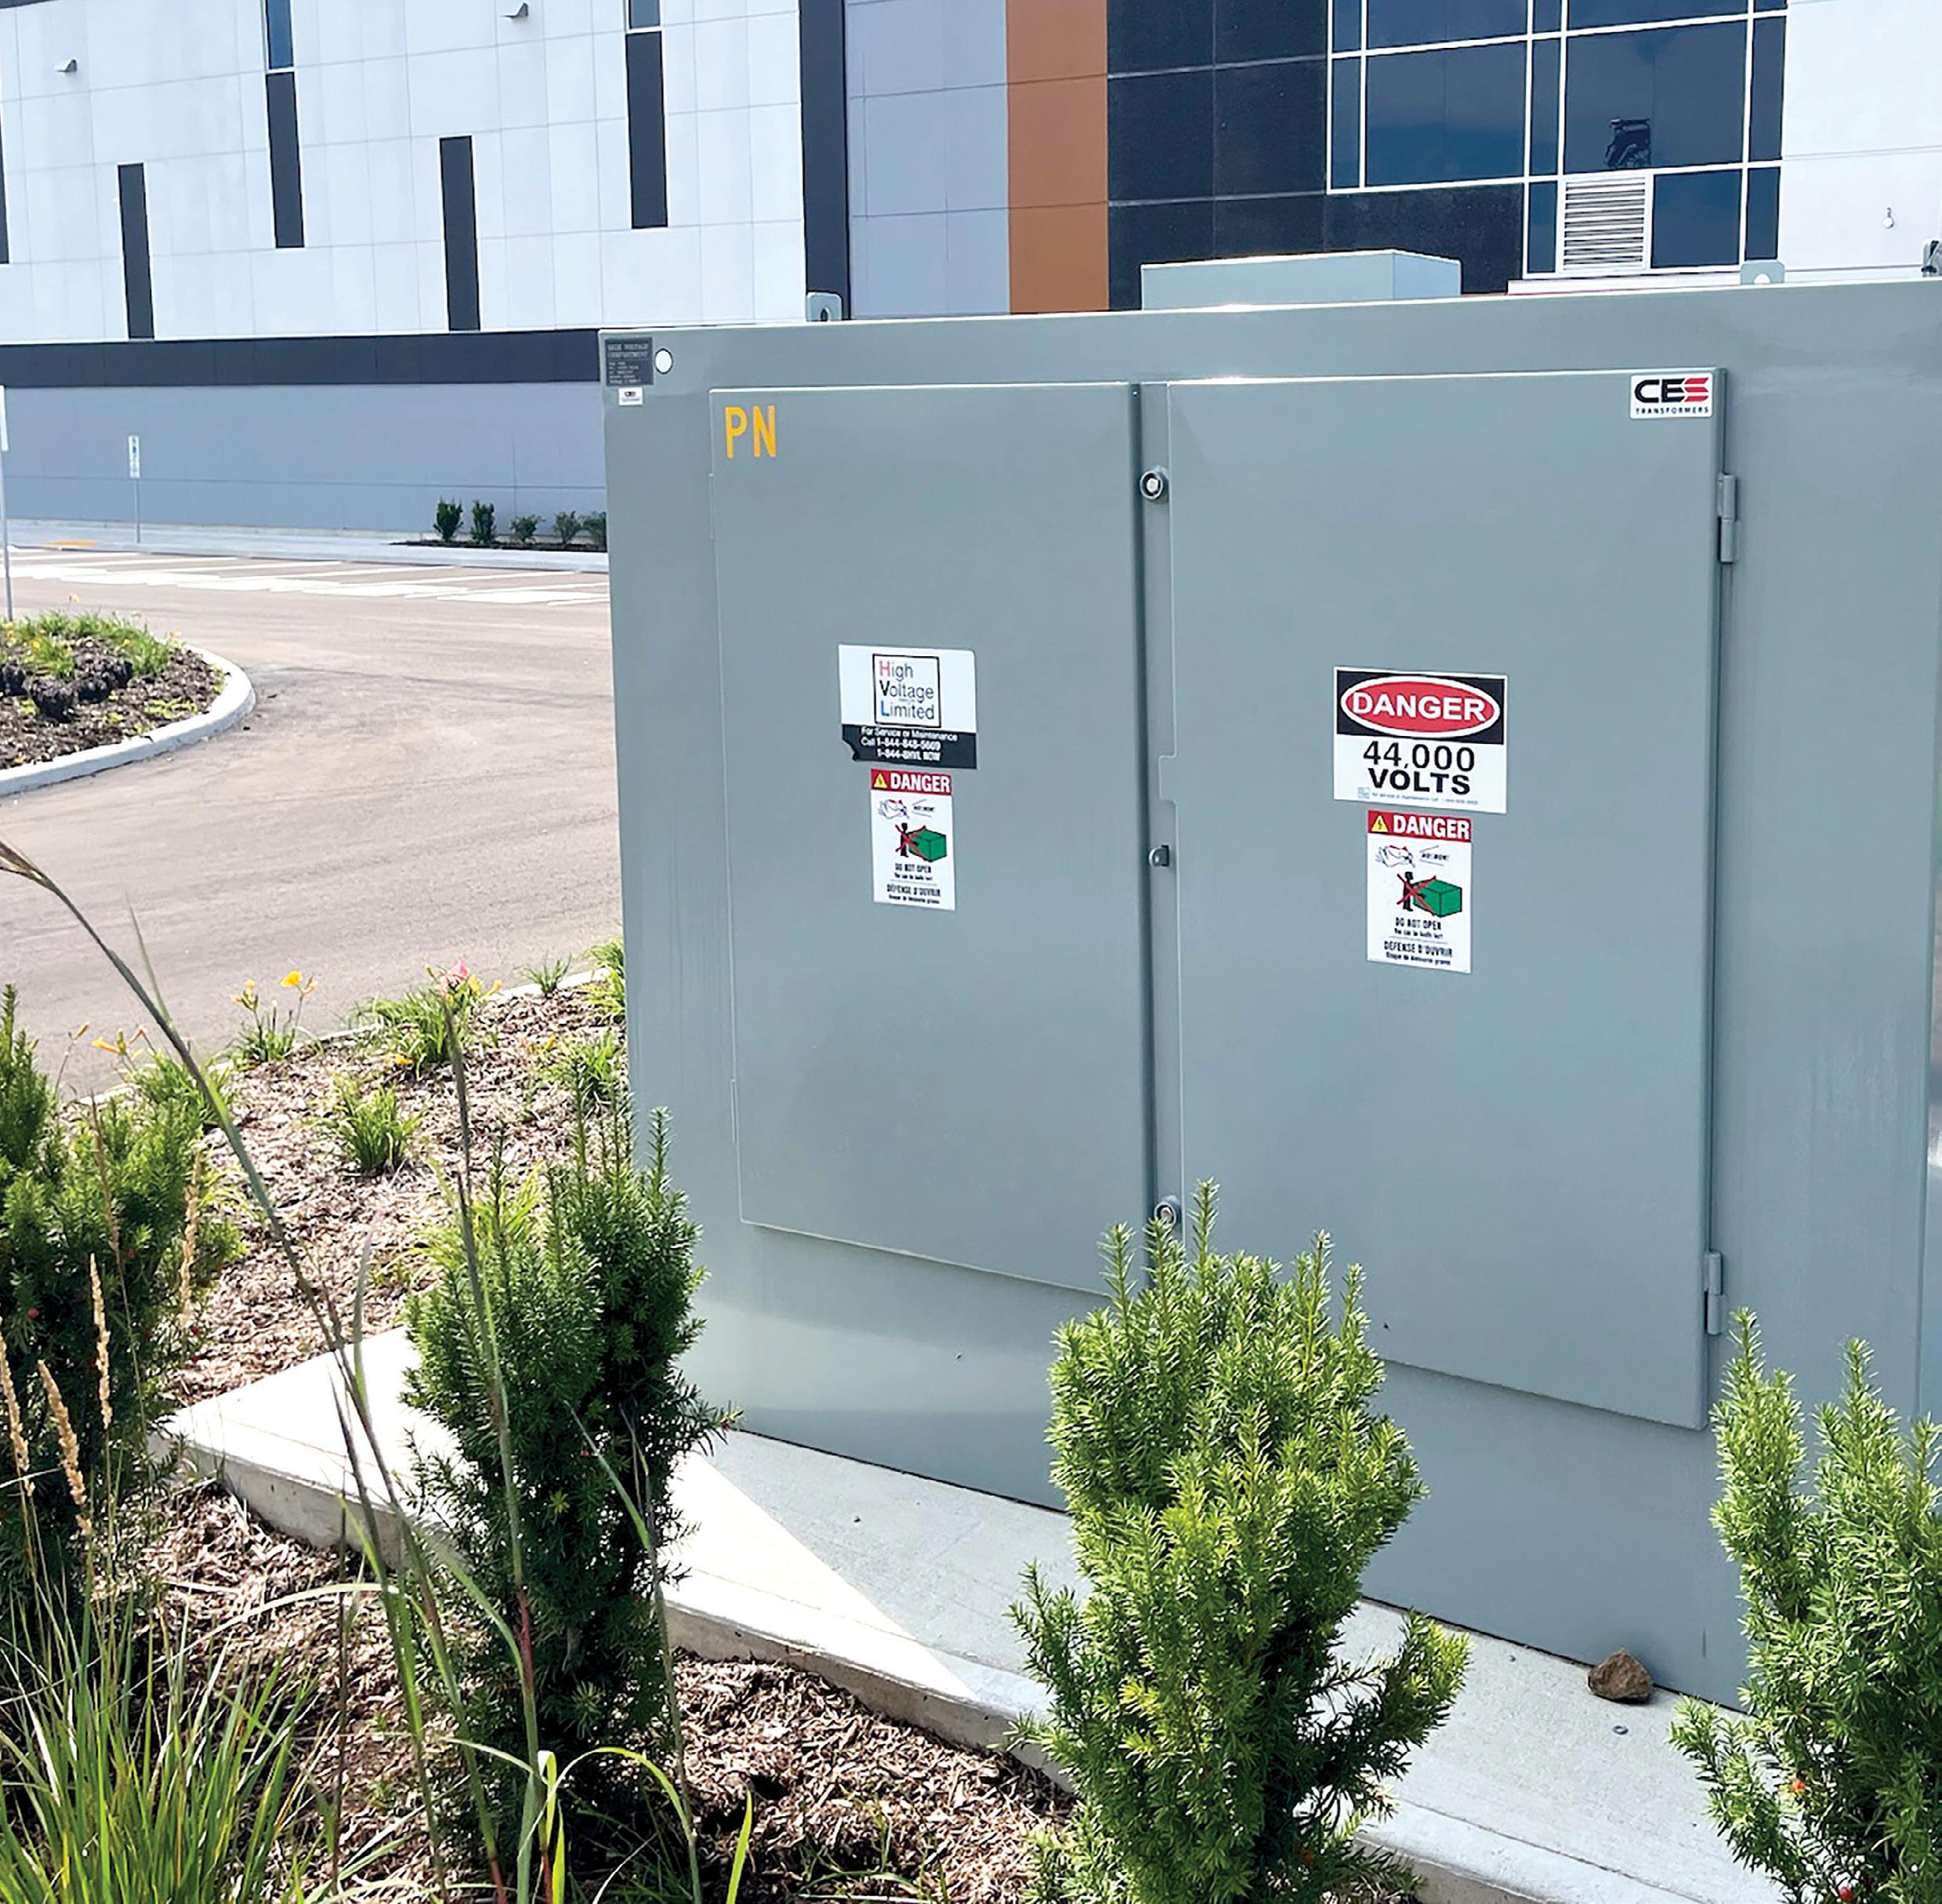
Custom transformer solutions empowering Ontario’s LDCs to deliver reliable, efficient, and future-ready power.
Ontario’s distribution networks are complex, with aging infrastructure and unique demands requiring flexible solutions. CES Transformers delivers fully customized, retrofit-ready designs to modernize your grid without costly overhauls or disruption.
Power your network with precision, reliability, and flexibility. Partner with CES Transformers, built in Ontario, built for your grid.
5900 14th Ave, Markham, Ontario, Canada L3S 4M4 (905) 474-0777 • cestransformers.com • info@cestransformers.com
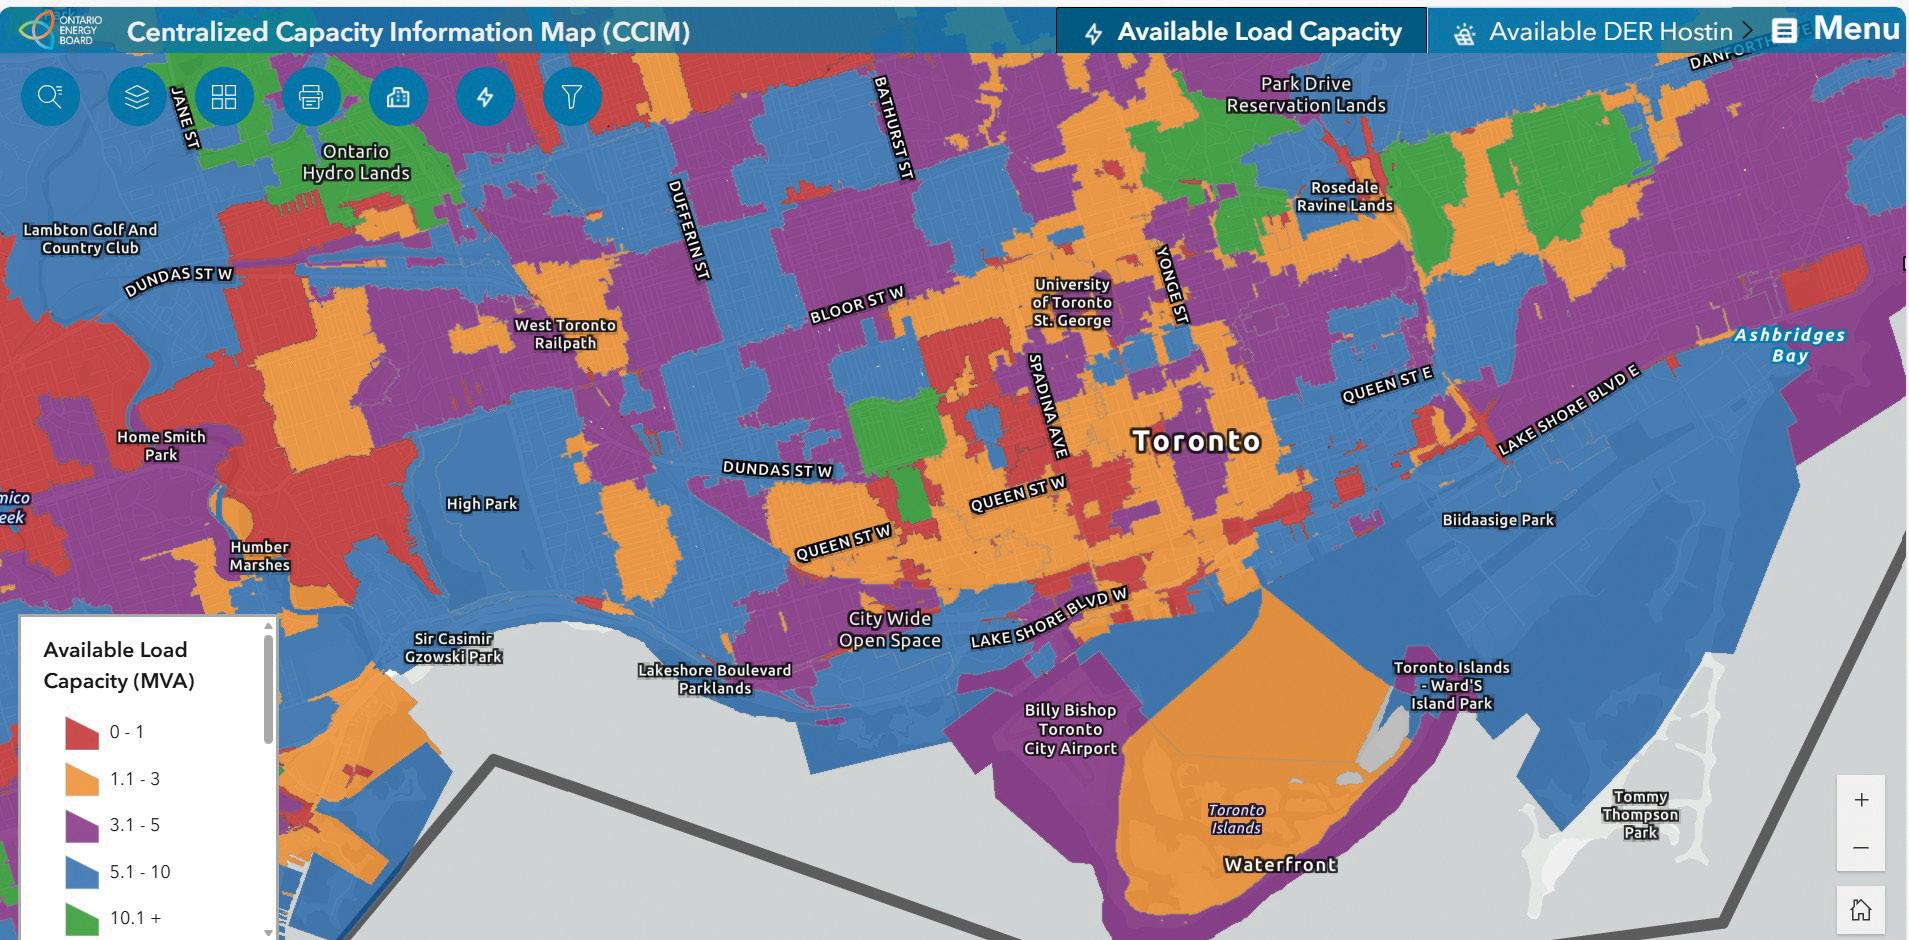
With this enhanced visibility, users can:
• Identify locations where existing grid capacity may accommodate new load or DERs
• Understand potential connection complexity early in the process
• Compare potential sites across distributor service territories using consistent information
• Reduce the need for multiple preliminary information requests This clarity supports more confident investment decisions, reduces planning risk and helps accelerate timelines in a fastmoving energy landscape.
Electricity distributors play a critical role in translating system information into practical customer solutions. Through the CCIM partnership, distributors contribute standardized data that enables earlier, more effective engagement with customers and stakeholders. The CCIM is designed as a starting point to help users explore possibilities, but it is not a substitute for working directly with a distributor. Because the map reflects system conditions at a specific moment and those conditions can change, connecting with a distributor early remains the best way to confirm feasibility and understand next steps.
Ontario’s electrification and economic growth objectives depend on timely, reliable access to grid capacity information. The CCIM supports a wide range of stakeholders, including:
• Commercial and industrial customers, who gain more confidence planning electrified operations and facility expansions
• Project developers and businesses, who can assess feasibility earlier
By consolidating data from electricity distributors, the CCIM provides a simplified and straightforward way of reducing uncertainty and enabling informed decision making early in the planning process.
on areas where new or expanded electricity demand can be connected easily
• Product and service providers, tailoring solutions to customer and system needs
• DER developers, assessing where solar, wind or battery projects can be hosted without major system enhancement
• Municipal planners and consultants, seeking high-level capacity insights for community growth or electrification strategies
• Utility planners, who benefit from a more holistic understanding of system constraints, emerging demand patterns and investment priorities across regions Together, these benefits help reduce barriers to investment, streamline early planning and support coordinated growth across Ontario.
Ontario’s energy transition requires strong partnerships and modern tools that support informed decision making. The OEB extends its appreciation to distributors for their meaningful collaboration, provision of data, active engagement and expertise throughout the development of the CCIM. Their contributions will remain essential as the CCIM is refined and updated over time. Together, we are powering Ontario’s energy future.
Unlock Operational Excellence with a Next-Gen CIS
SpryPoint is a next-generation, cloud-native CIS platform built for electric utilities navigating rapid industry change and evolving customer expectations. With industry expertise, advanced technology, and a process-focused design, the SpryPoint Platform streamlines the meter-to-cash lifecycle through a secure, SOC 2–certified solution, including SpryCIS, SpryEngage, SpryIDM, SpryWallet, and SpryMobile. Together, SpryPoint and Utilismart are partnering to deliver a fully integrated digital utility ecosystem that simplifies operations, improves efficiency, and enhances customer engagement.
Settlement Manager + SpryCIS: AutomatesIESO reporting, reduces manual effort, and ensures billing accuracy.
SmartMAP + SpryEngage: Powers real-time, personalized outage notifications.
ODS + SpryCIS/AMI:
Meridio + SpryMobile:
Streamlinesstaking, surveying, and field workflows end-to-end. Automatesmeter lifecycle management with functions like remote disconnects and on-demand reads.

ODS + SpryCIS/SpryEngage: Provides data integrity, interval analysis, and actionable insights to support billing, operations, and customer engagement.
The SpryPoint Platform combines decades of domain expertise, hundreds of successful CIS transformations, and process-focused design principles to architect a new generation of customer service, engagement, and operational software for electric utilities.
Ready to transform your utility operations? Email info@utilismartcorp.com to schedule a demo of SpryPoint and Utilismart solutions.
SmartMAP delivers real-time grid visibility and datadriven insights to help utilities improve efficiency, manage grid flexibility, and plan for future growth. It connects critical data across systems to empower engineering and operations teams with tools to optimize performance, enhance reliability, and support smarter grid expansion.



By Roy Hrab, Senior Manager, Policy Research, Power Advisory and Sarah Simmons, Director, Utilities and Innovation, Power Advisory

Last year, Ontario released its Integrated Energy Plan (IEP) Energy for Generations, building on the ideas laid out in the government’s 2024 energy policy vision document, Ontario’s Affordable Energy Future: The Pressing Case for More Power (Ontario’s Affordable Energy Future).
The IEP placed strong emphasis on customer choice, the evolving role of the distribution sector, and the deployment of distributed energy resources (DERs), catalyzing a range of new developments across policy, regulation, and program design.
A central theme of the IEP, and of Ontario’s broader energy policy, is empowering customers and enabling greater energy choice. As noted in the Minister of Energy and Mines’ foreword to the IEP:
The Independent Electricity System Operator (IESO) forecasts that Ontario will require 65 per cent more electricity by 2050.
“Our Plan will modernize the grid to support a smarter, more flexible system — one that can better integrate and manage new technologies like battery storage, smart devices, and distributed energy resources. This transformation will empower families, communities, and businesses to not only use energy, but to produce and store it, making them active participants in our energy future.”
The IEP fulfills the pledge made in Ontario’s Affordable Energy Future, which described a need “to provide greater clarity and predictability to Local Distribution Companies (LDCs) so that they can modernize their infrastructure to provide the energy and services that ratepayers need into the future.” It does this through providing a definition of grid modernization: “The paced, prudent, and cost-effective use of technologies and solutions that improve the efficiency, resilience, reliability, and capacity of electricity distribution systems. The purposes of said investments are twofold: to lower long-term costs for ratepayers and to better manage the availability of electricity to meet growing demand.”

With respect to DERs, the IEP states that “customers have limited options to be compensated for the benefits their DER provide to the grid, and many projects face barriers to participation. There is significant opportunity to guide DER investment to where it is most cost-effective and beneficial to local and system-wide needs.”
Further, the IEP notes the government will introduce a DER strategy aimed at:
1. strengthening grid resilience and efficiency,
2. empowering consumers, and
3. attracting investment and unlocking innovation.
This plan will include a review of the net metering framework as well as an examination of, “new cost-recovery models for DER investments by the Ontario Energy Board (OEB) to allow electricity distributors to recover costs across a broader area when the benefits of DER extend beyond a single project or community.”
The IEP emphasizes several opportunities for LDCs, customers and DERs. Previously, Ontario’s planning and policy direction focused primarily on the transmission system and transmission-connected generation. There is now a growing recognition of the distribution
sector’s critical role in meeting future system needs, improving the quality of service, and better empowering residential, commercial, and industrial customers to participate in the electricity system and manage their energy costs.
The Independent Electricity System Operator (IESO) forecasts that Ontario will require 65 per cent more electricity by 2050. Most of this new demand will be connected to the distribution system. While the exact timing, distribution and rate of demand growth is uncertain, this outlook requires significant infrastructure investment by LDCs and was recognized in the IEP:
“As electricity demand grows, driven by new housing, industrial expansion, and the electrification of vehicles and heating. LDCs are being asked to do more than ever before.
“To meet these growing demands, LDCs will need to strengthen their infrastructure, adopt new technologies, and deliver services more efficiently and affordably. This includes making significant capital investments in substations, transformers, and digital grid management tools.”
Building in anticipation of new loads (housing, businesses, data centres), electrification via fuel-switching, and more DERs require a more proactive approach to planning and investment. It will require evolution of the OEB’s approach to ratemaking, evaluating rate applications, cost allocation, and performance measurement. Clarity is needed on how the OEB will consider (and how it wants LDCs to consider) the costs and benefits of investments made to facilitate fuel-switching and the assessment of proactive investments, including the impacts on customers’ total energy bill rather than just electricity distribution rates. Guidance and consultation is required on how the OEB will examine options for LDCs to potentially socialize the costs of DER and NWS [Non-Wire Solutions] investments beyond their own service territories; and, how the OEB will incorporate its new objective “to support economic growth” (as contained in Bill 40, Protect Ontario by Securing Affordable Energy for Generations Act, 2025) into decision-making.
Moreover, there are several OEB and IESO processes related to DER valuation, compensation, integration into planning, streamlining connections, and enabling broader procurements and programs. For example, consultations include the OEB’s Next Generation Rate Framework, Distribution System Operator initiative and Phase 2 of the Benefit-Cost Analysis Framework as well as the IESO’s Local Generation Program and Enabling Resource Program DER Integration Project.
Ontario is embarking on a major expansion of the province’s electricity network. The IEP (and its directives) signals that a critical aspect of this undertaking involves the need for LDCs to expand their networks in advance of expected future growth. The province recognizes the need to provide better incentives and greater opportunities to those seeking to invest in distribution system expansion, grid modernization and DERs.
However, there is much work ahead. Many of the changes needed are in the early process of development. To capitalize on the potential opportunities arising from these initiatives, LDCs need to participate actively and react nimbly in a challenging environment featuring a dynamic, quickly evolving political, regulatory, program, and policy landscape, touching virtually every aspect of the electricity (and energy) sector.
By Miro Karlicic, Vice President, Business Development and Innovation, Utilismart Corporation
In Ontario, Local Distribution Companies (LDCs) are entering a new phase of digital transformation. Reliability and affordability remain essential, but consumer expectations are changing. Today’s consumers expect greater visibility, participation, and value from LDCs. In response, LDCs are becoming digitally enabled, consumer-focused organizations and gradually transforming into energy services companies.
The relationship between Ontario LDCs and consumers is shifting from a one-way service to a two-way partnership. Consumers are no longer just consuming electricity—they are becoming part of the system that delivers it.
While reliability and affordability remain priorities, more consumers are becoming active “prosumers” using technologies like solar PV and battery storage, particularly when incentives are accessible and program enrolment is straightforward. Clear value propositions and easy enrolment are key to increasing consumer engagement with LDCs. While most consumers continue to prioritize reliability and affordability, there is a sizeable and growing segment that can be encouraged to take a more active role in the energy system. With the right combination of opportunities, tools, and incentives, many consumers can evolve into “prosumers,” actively generating, storing, or managing their energy through technologies such as solar PV, battery storage, and flexible loads. This shift is not limited to early adopters. A broader base of consumers is willing to participate in conservation, demand response, and load control programs when the value proposition is clear and participation is simple. By providing intuitive digital tools, transparent program

Ontario’s LDCs are elevating consumer engagement by adopting next-generation technologies, tools, and processes, and this momentum will continue.
options, and meaningful incentives, LDCs are lowering the barriers to entry and unlocking this latent potential. In doing so, utilities are not only strengthening consumer engagement but also building a more flexible and resilient energy system.
Digital transformation and next-generation utility solutions are central to this evolution. Customer Information Systems (CIS), along with intuitive portals and mobile applications, provide consumers with greater visibility into their energy use, billing, and program participation.
Next-generation CIS platforms go far beyond billing, using automated workflows to improve service speed and consistency. They integrate with other LDC systems to deliver real-time data, operational efficiencies, and a more satisfying experience.
Artificial intelligence is further enhancing these capabilities. AIpowered chatbots and digital assistants interpret inquiries, connect information across systems, and provide fast, accurate responses while improving overall service efficiency. Expanded communication channels, such as text messaging and chat applications, enable consumers to engage with utilities in familiar, convenient ways.
Traditional communication channels remain important. Phonebased interactions continue to support collection notifications and consumers with accessibility needs. The focus is on ensuring communication channels are versatile and integrated across digital platforms, including next-generation CIS, to deliver a consistent and inclusive experience.
Ontario’s electricity demand is projected to grow by about 75 per cent by 2050, increasing from about 151 terawatt-hours (TWh) in 2025 to 262 TWh, driven largely by electrification and population growth (Independent Electricity System Operator, 2025 Annual Planning Outlook).
To respond to this accelerated growth, address transmission constraints, and align with Ontario’s continued focus on electrification, grid modernization, and the integration of distributed energy resources (DER), the electricity system is becoming more participatory. More prosumers are investing in DERs, while other consumers are engaging in conservation and preparing to participate in demand management initiatives as incentives become clearer and more accessible.
By tapping into these resources, utilities can access additional capacity during peak and constrained conditions, while also supporting broader system needs. At the same time, consumers and prosumers are compensated for their participation and gain value from their assets.
LDCs are working to boost participation in demand response and distributed energy programs by enhancing digital tools, simplifying processes, and designing incentives. Behind the scenes, a digital utility platform is emerging as a critical capability, integrating data across multiple disparate utility systems, providing visibility into grid capacity and constraints and enabling Distributed Energy Resource Management System (DERMS) capabilities. Together, these capabilities allow LDCs to monitor grid conditions and actively manage flexibility by dispatching storage and capacitors, managing EV charging, and controlling flexible loads to address local constraints, enhance reliability, and optimize overall system performance.
“Collaboration among LDCs through initiatives like the Grid Smart City Cooperative and PowerShare demonstrates how Ontario utilities can work together on procurement, technology evaluation, standardization, and shared services. By pooling knowledge and leveraging the strengths of multiple LDCs, we can engage consumers more effectively and consistently, create value for all participants, and accelerate the adoption of adaptive and flexible energy solutions,” said John Avdoulos, President and CEO of Essex Powerlines Corporation.
Developing these consumer engagement capabilities requires collaboration. With limited innovation funding, Ontario’s LDCs are increasingly working together, sharing knowledge, aligning investments, standardizing software platforms, and jointly developing solutions such as flexibility management.
Commercial entities and aggregators also play a key role. By aggregating distributed resources and supporting commercialization,

AI-powered chatbots and digital assistants interpret inquiries, connect information across systems, and provide fast, accurate responses while improving overall service efficiency.
they help maintain local grid reliability and flexibility while supporting broader provincial demand management objectives.
At the same time, LDCs are moving beyond the traditional “poles and wires” model. Through affiliated, unregulated entities, they are expanding into value-added energy services to offer a broader portfolio of solutions to consumers while maintaining a strong, reliable regulated core.
Ontario’s LDCs are elevating consumer engagement by adopting next-generation technologies, tools, and processes, and this momentum will continue.
The key to delivering a stronger consumer experience is embracing innovation that creates meaningful opportunities while fostering collaboration among LDCs to achieve measurable results. Balancing innovation and execution will define the next phase of transformation.
To foster active consumer participation, LDCs must design clear programs and incentives while collaborating regionally to standardize models, technologies, and rules, ensuring consistent consumer options across service territories. There is also an opportunity to coordinate with the regulator to support innovation and enable these capabilities at scale.
Through technology, collaboration, and a consumer-first approach, Ontario’s LDCs and consumers are building a more flexible, resilient energy future.
This transformation is already underway, and those LDCs that move early will be best positioned to shape Ontario’s energy future.



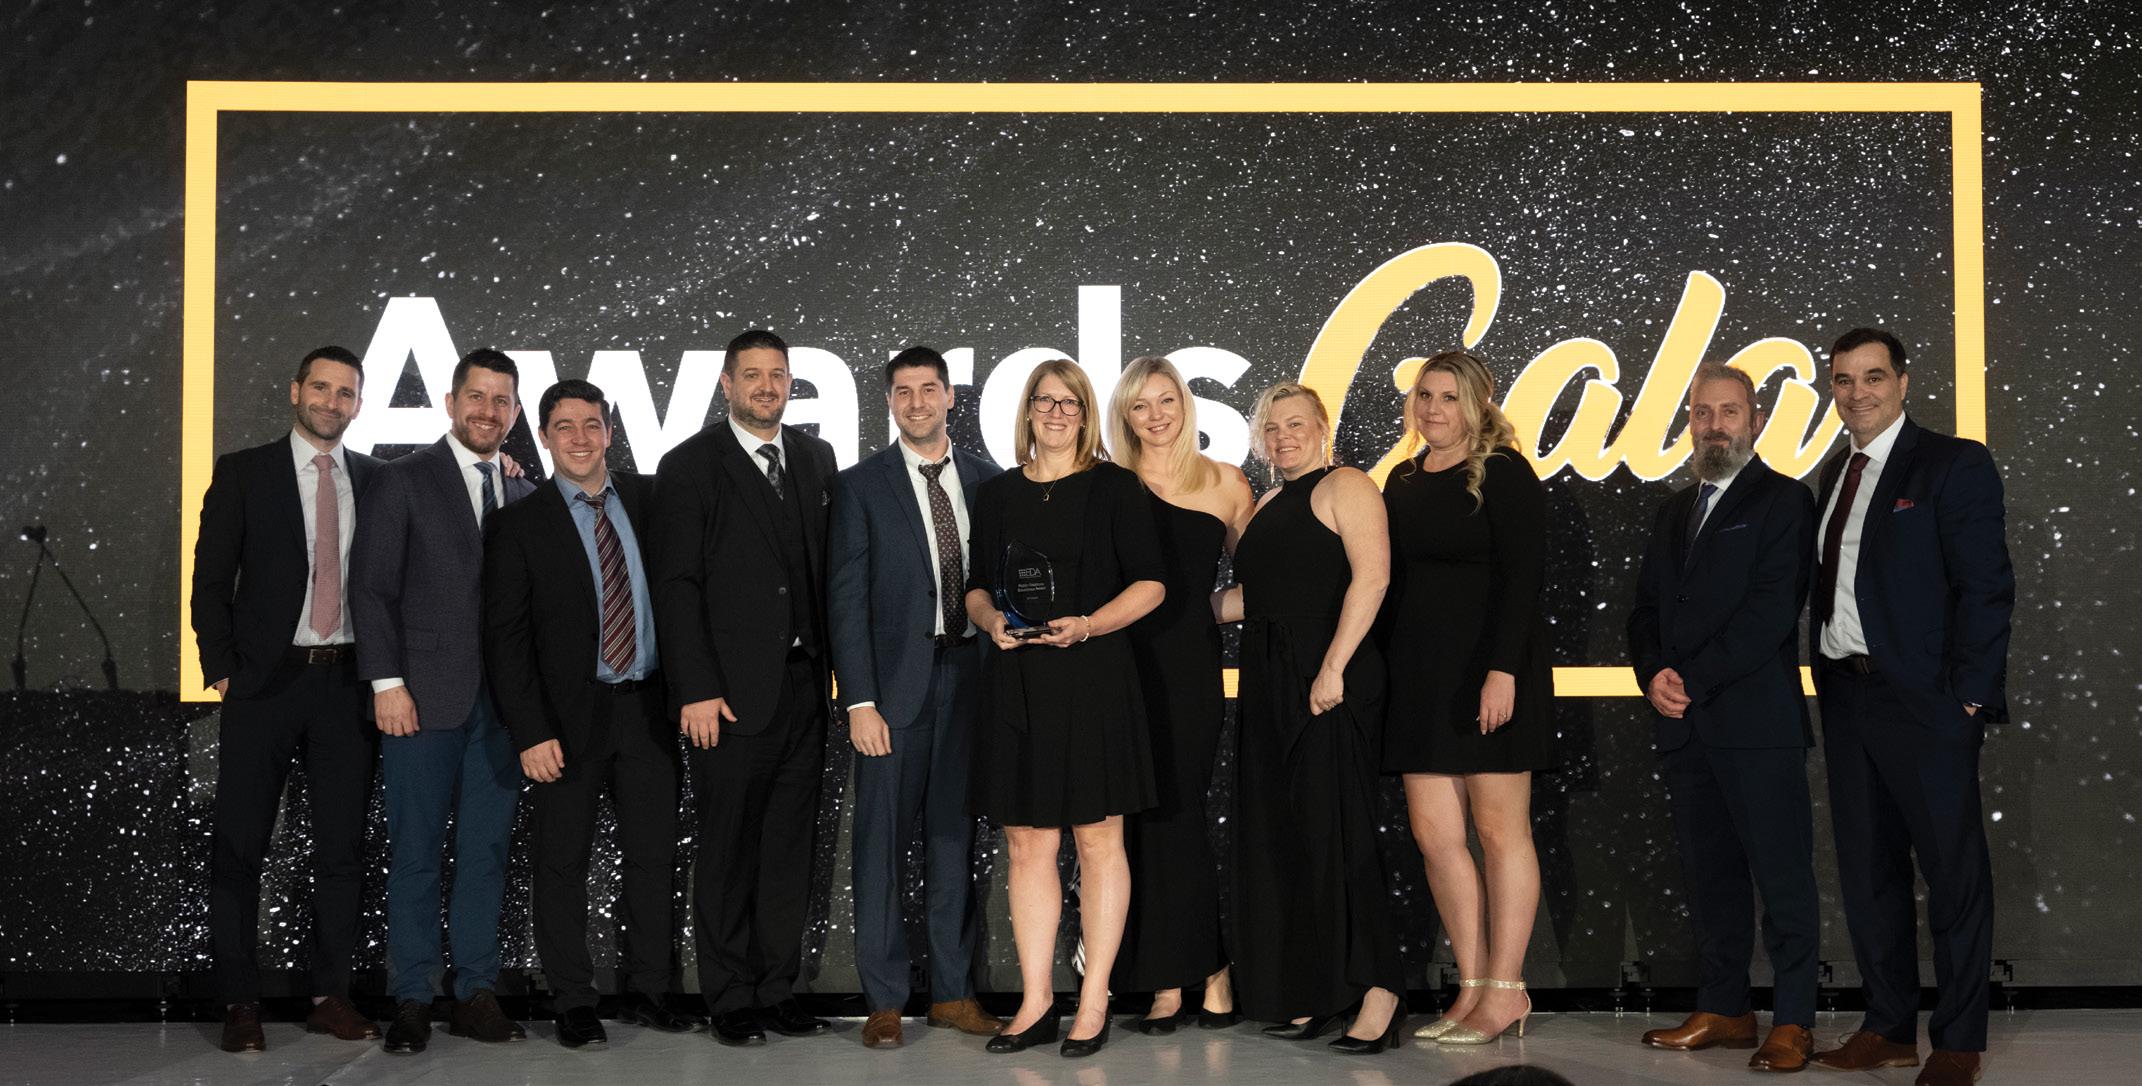

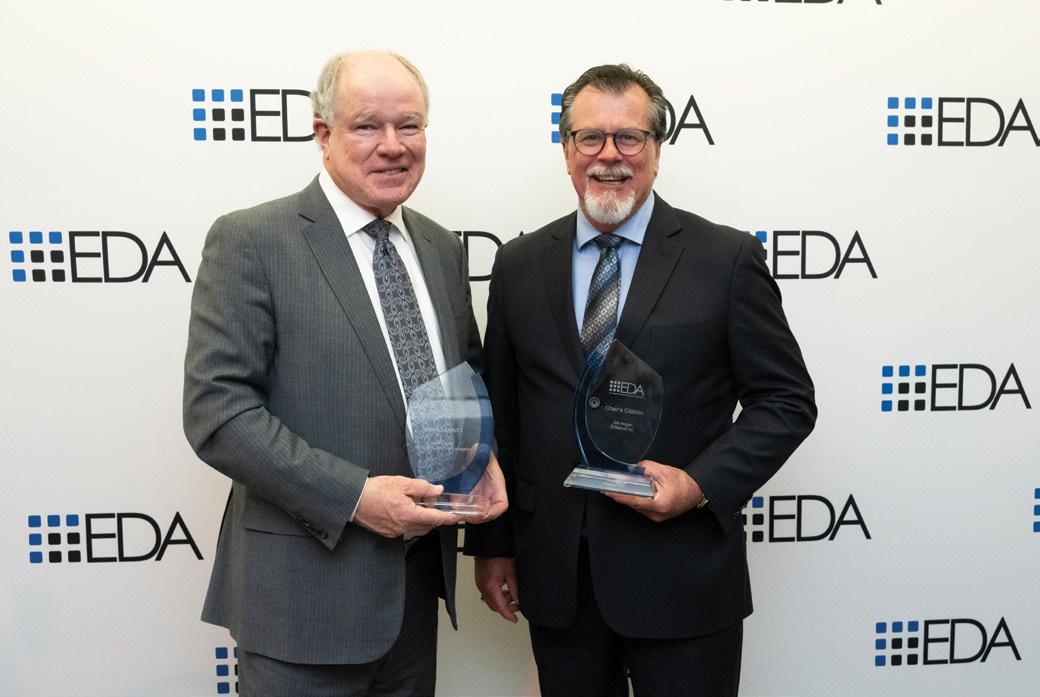

In March, EDA’s Derek Nardone, Director, Corporate, Government & Public Affairs, participated in an industry roundtable hosted by the Vaughan Chamber of Commerce, featuring Prabmeet Sarkaria, MPP (Brampton South) and Minister of Transportation.
The EDA brought key policy issues affecting LDCs, reinforcing the message that energy infrastructure is economic infrastructure. As communities grow and electrification accelerates, timely investment in the electricity grid will be essential to enabling new housing, supporting businesses, and powering the industries that drive Ontario’s economy.
The EDA has launched quarterly meetings with the Electricity Safety Authority (ESA) to strengthen alignment on key sector priorities.
The inaugural discussion covered a range of issues, including risk-based oversight, ESA modernization initiatives supported by Deloitte, rising concerns around copper theft, and opportunities for enhanced data collaboration with Ontario One Call.
This new forum will enable more proactive coordination and information sharing, supporting a more aligned and responsive approach across the sector.
The EDA’s Government & Public Affairs team held productive meetings with provincial representatives to highlight the critical role of LDCs in Ontario’s evolving energy transition.
In a meeting with Zee Hamid, MPP (Milton) and Associate Solicitor General for Auto Theft and Bail Reform, alongside Milton Hydro Distribution Inc., discussions focused on the role of local hydro utilities play in advancing electrification across communities.
A separate meeting with Tyler Allsopp, MPP (Bay of Quinte) and Parliamentary Assistant to the Minister of Economic Development, Job Creation and Trade, explored how the province and LDCs can work together to build a modern grid that meets growing demand while maintaining reliability and affordability for Ontarians.
The EDA’s President and CEO, Teresa Sarkesian, joined other energy sector leaders at Queen’s Park on March 26 for the release of Ontario’s 2026 budget, “A Plan to Protect Ontario”. The budget projects a $13.8 billion deficit for 2026-2027 and reinforces the province’s commitment to energy infrastructure investment as a driver of economic growth.
Many of the energy-related measures were previously announced within the Integrated Energy Plan in 2025. The budget continues electricity rate relief and commits to reducing duplication and streamlining electricity rate programs. Sarkesian also connected with Ministers during a postbudget meeting.

Earlier this year, the EDA submitted comments to the OEB on its Next Generation Rate Framework consultation.
Key recommendations include:
• Refocusing the framework on enabling timely, forward-looking infrastructure investment
• Updating incentive models, including reform or removal of the productivity (X) factor
• Improving benchmarking, inflation treatment, and cost recovery to better reflect actual conditions

Earlier this year, the EDA submitted comments on the OEB’s consultation on Spending Pattern Analysis (SPA) report prepared by Pacific Economic Group Research.
Some high-level findings include a lack of evidentiary foundation to support regulatory changes to Ontario’s performance-based regulatory framework. The contents of this submission were supported by Nexus Economics, retained by the EDA to conduct an independent expert assessment of the SPA report.
The EDA submitted comments to the Ontario Energy Board (OEB) in March on its Benefit-Cost Analysis Framework consultation. Key recommendations to address electricity system needs include:
• Providing more specific guidance for completing the Electricity Systems Test (EST) to ensure consistent application by LDCs
• Updating the implementation date to 2027 to allow distributors to incorporate new requirements into regulatory filings.
• Not requiring LDCs to consult with the Independent Electricity System Operator (IESO) or obtain a Letter of Comment for each EST until expectations, scope, and resourcing are clarified.
The EDA’s submission to the OEB on its Gas–Electric Information Sharing Framework consultation outlined 10 recommendations focused on building on and scaling existing processes. Highlights include:
• Supporting improved coordination and sharing
• Limiting any centralized data repository
• Leveraging existing processes where possible instead of creating new ones
• Engaging gas utilities in the annual provincial planning outlook process
• Clarifying roles and responsibilities


November 4 | Toronto Airport Marriott
HR professionals, managers, executives, and communicators will gather on November 4 at the Toronto Airport Marriott for People Connected 2026, a one-day symposium focused on strengthening today’s workforce. Bringing together top industry experts, the event will explore the issues shaping modern workplaces, from recruitment and retention to AI and automation, gender equity, and mental health. Attendees will gain practical insights on how to build resilient, inclusive teams while preserving institutional knowledge and supporting continuous learning. Through expert-led sessions and engaging presentations, participants will leave with actionable strategies they can implement immediately. The agenda also includes dedicated time to connect with peers, exchange ideas, and learn what’s working across the sector, along with breakfast and lunch.
Designed for those looking to strengthen teams and drive results, People Connected 2026 will inspire and leave you with takeaways to use immediately.
Take the next step toward a stronger, future-ready workforce. Seats are limited. Reserve your spot today visiting eda-on.ca/events.
Director’s Summit
May 5 | Aird & Berlis LLP, Brookfield Place, Toronto
People Connected
November 4 | Toronto Airport Marriott
EDIST 2027
January 18-21, 2027 | Westin Harbour Castle, Toronto
EDIST 2028
January 17-20, 2028 | Westin Harbour Castle, Toronto
EDIST 2029
January 15-18, 2029 | Westin Harbour Castle, Toronto
The Electricity Distributors Association (EDA) has a slate of exciting events planned through 2028. Mark your calendars and join us for upcoming conferences and our annual award Gala that showcase the best of Ontario’s electricity sector. For more information visit: eda-on.ca/ EVENTS.

May 5 | Aird & Berlis LLP, Brookfield Place, Toronto
District meetings offer an opportunity to regionally network with LDCs.
Western District Meeting
April 30 | ERTH Power Corporation, Ingersoll
Niagara Grand District Spring Technical Meeting
May 26 | Erie Beach Hotel, Port Dover
Western District Annual General Meeting
September 2 | FireRock Golf & Country Club, Komoka
Northwestern/Northeastern Districts Conference and Annual Meeting
September 15 to 17 | Delta Hotels Waterfront, Sault Ste. Marie
Western/Niagara Grand Districts Metering Exhibition Show
September 22 to 24 | Best Western Plus Lamplighter Inn & Conference Centre, London
Upper Canada/Georgian Bay Districts AGM
September 30 to October 2 | JW Marriott, Minnett
Niagara Grand District Annual General Meeting
October 7 | TBC

ENERCOM 2027
March 21-22, 2027 | Fairmont Royal York, Toronto
Awards Gala 2027
March 22, 2027 | Fairmont Royal York, Toronto
ENERCOM 2028
March 19-20, 2028 | Fairmont Royal York, Toronto
Awards Gala 2028
March 20, 2028 | Fairmont Royal York, Toronto















Serving the infrastructure, energy, gas and electricity distribution, and telecommunications sectors nationwide, we are trusted to deliver innovative and reliable solutions that not only meet client needs but consistently exceed expectations. From concept and design to engineering, comprehensive field and construction services, our integrated solutions deliver excellence on time and on budget, safely and with quality.
Visit OEC.CA to find out more or email us at info@oec.ca to get started.