Current World Environment
Volume 8, Number 3, (2013)
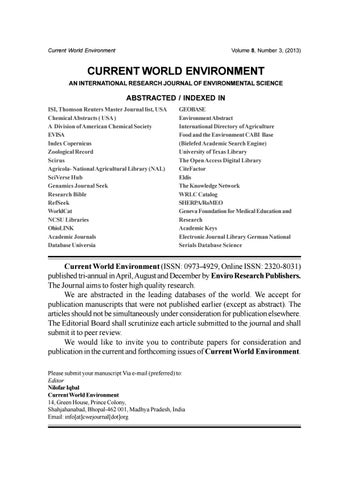
CURRENT WORLD ENVIRONMENT AN INTERNATIONAL RESEARCH JOURNAL OF ENVIRONMENTAL SCIENCE
ABSTRACTED / INDEXED IN ISI, Thomson Reuters Master Journal list, USA Chemical Abstracts ( USA ) A Division of American Chemical Society EVISA Index Copernicus Zoological Record Scirus Agricola- National Agricultural Library (NAL) SciVerse Hub Genamics Journal Seek Research Bible RefSeek WorldCat NCSU Libraries OhioLINK Academic Journals Database Universia
GEOBASE Environment Abstract International Directory of Agriculture Food and the Environment CABI Base (Bielefed Academic Search Engine) University of Texas Library The Open Access Digital Library CiteFactor Eldis The Knowledge Network WRLC Catalog SHERPA/RoMEO Geneva Foundation for Medical Education and Research Academic Keys Electronic Journal Library German National Serials Database Science
Current World Environment (ISSN: 0973-4929, Online ISSN: 2320-8031) published tri-annual in April, August and December by Enviro Research Publishers. The Journal aims to foster high quality research. We are abstracted in the leading databases of the world. We accept for publication manuscripts that were not published earlier (except as abstract). The articles should not be simultaneously under consideration for publication elsewhere. The Editorial Board shall scrutinize each article submitted to the journal and shall submit it to peer review. We would like to invite you to contribute papers for consideration and publication in the current and forthcoming issues of Current World Environment. Please submit your manuscript Via e-mail (preferred) to: Editor Nilofar Iqbal Current World Environment 14, Green House, Prince Colony, Shahjahanabad, Bhopal-462 001, Madhya Pradesh, India Email: info[at]cwejournal[dot]org
Current World Environment PAPERS
Volume 8, Number 3, (2013) CONTENTS
K.A. OBIRIKORANG, S. AMISAH and D. ADJEI-BOATENG
PAGE No. 331-339
Habitat Description Of The Threatened Freshwater Clam, Galatea Paradoxa (Born 1778) At The Volta Estuary, Ghana ATEF AL-KHARABSHEH and MOHAMAD ALATOUM
341-354
Effect of Agricultural Activities on Water Quality Deterioration of Mujib Basin, Jordan OMAR K. M. OUDA
355-364
Assessment of the Environmental Values of Waste-to-Energy in the Gaza Strip MAJEDA MB. AL-HADIDI, ATEF A. AL KHARABSHEH AND RAKAD A. TA'ANY
365-374
Impact of Over- Pumping on the Groundwater Quality of the Dead Sea Basin/ Jordan M. TAHIR SOOMRO, IQBAL M. I. ISMAIL
375-380
ABDUL HAMEED and MOHAMMAD ASLAM A Simple Electrochemical Approach for Determination and Direct Monitoring of Drug Degradation in Water MOHD RUSLI YACOB, SULEIMAN ALHAJI DAUDA,
381-389
ALIAS RADAM and ZAITON SAMDIN Household’s Willingness to Pay for Drinking Water Quality Service Improvement in Damaturu, Nigeria RAMIRO RAMIREZ NECOECHEA, ISABEL VALENZUELA MERAZ
391-394
and JOSE FRANCISCO HERNANDEZ RAMIREZ Mexico's Glaciers and their Close Disappearance: A Precise Thermometer of the Global Warming Advance on a Global Scale ABEDA BEGUM, M ZAHEER KHAN, ABDUR RAZAQ KHAN, AFSHEEN ZEHRA,
395-402
BABAR HUSSAIN, SAIMA SIDDIQUI and FOZIA TABBASSUM Current Status of Mammals and Reptiles at Hub Dam Area, Sindh / Balochistan, Pakistan SHADEMAN POURMOUSA
403-408
Efficiency of Chemical Treatments on Reduction of COD and Turbidity of Deinked Pulp Waste Water MAYSA M. HATATA, REEM H. BADAR, MOHAMMAD M. IBRAHIM and IBRAHIM A. HASSAN Respective and Interactive Effects of O3 and CO2 and Drought Stress on Photosynthesis, Stomatal Conductance, Antioxidative Ability and Yield of Wheat Plants
409-417
Current World Environment PAPERS
Volume 8, Number 3, (2013) CONTENTS
MAHSHID KARIMI and KAKA SHAHEDI
PAGE No. 419-428
Hydrological Drought Analysis of Karkheh River Basin in Iran Using Variable Threshold Level Method ASHWIN MODI and NIMESH P. BHOJAK
429-433
Study the Carbon Emission Around the Globe with Special Reference to India RATNA GHOSH, RESHMA XALXO and MANIK GHOSH
435-444
Estimation of Heavy Metal in Vegetables From Different Market Sites of Tribal Based Ranchi City Through ICP-OES and to Assess Health Risk MUSHTAQ HUSSAIN and T.V.D PRASAD RAO
445-454
Effect of Industrial Effluents on Surface Water Quality A Case Study of Patancheru, Andhra Pradesh, India VINOD KUMAR DUBEY, DHANANJAI SINGH and NEHA SINGH
455-461
Chemical Studies of Traffic Generated Dust and its Impact on Human Health with Associated Problems in Singrauli District of Madhya Pradesh, India A. S. MAHAKALKAR, R. G. GUPTA and S. N. NANDESHWAR
463-468
Bioaccumulation of Heavy Metal Toxicity in the Vegetables of Mahalgaon, Nagpur, Maharashtra (India) VIJAY KUMAR, NIRAJ UPADHYAY, SIMRANJEET SINGH,
469-472
JOGINDER SINGH and PARVINDER KAUR Thin-Layer Chromatography: Comparative Estimation of Soil's Atrazine MINU KUMARI, L.K MUDGAL and A.K.SINGH
473-478
Comparative Studies of Physico-Chemical Parameters of Two Reservoirs of Narmada River, MP, India DURRE SHAHWAR RUBY, AHMAD MASOOD and AMJAD FATMI
479-482
Effect of Aflatoxin Contaminated Feed on Growth and Survival of Fish Labeo Rohita (Hamilton) R.V. PRASAD, D.R. TRIPATHI and VINOD KUMAR
483-487
Assessment of Groundwater Quality in Saltaua Gopalpur, Block of Basti District, (U.P.) India V.H.WAGHMARE and U.E.CHAUDHARI Adsorption of Pb(II) from Aqueous Solution on Ailanthus Excelsa Tree Bark
489-492
Current World Environment
Volume 8, Number 3, (2013)
AUTHOR INDEX A. S. MAHAKALKAR ....................................... 463
K.A. OBIRIKORANG ........................................ 331
A.K.SINGH ...................................................... 473
KAKA SHAHEDI ............................................. 419
ABDUL HAMEED ........................................... 375 ABDUR RAZAQ KHAN ................................... 395
L.K MUDGAL .................................................. 473
ABEDA BEGUM ............................................. 395 M ZAHEER KHAN .......................................... 395
M. TAHIR SOOMRO ........................................ 375
AFSHEEN ZEHRA ......................................... 395
MAHSHID KARIMI .......................................... 419
AHMAD MASOOD .......................................... 479
MAJEDA MB. AL-HADIDI ............................... 365
ALIAS RADAM ............................................... 381
MANIK GHOSH .............................................. 435
AMJAD FATMI ................................................. 479
MAYSA M. HATATA ......................................... 409
ASHWIN MODI ............................................... 429
MINU KUMARI ............................................... 473
ATEF A. AL KHARABSHEH ........................... 365
MOHAMAD ALATOUM ................................... 341
ATEF AL-KHARABSHEH ............................... 341
MOHAMMAD ASLAM ..................................... 375 MOHAMMAD M. IBRAHIM ............................. 409
BABAR HUSSAIN .......................................... 395
MOHD RUSLI YACOB .................................... 381 MUSHTAQ HUSSAIN ..................................... 445
D. ADJEI-BOATENG ....................................... 331 D.R. TRIPATHI ................................................. 483
NEHA SINGH ................................................. 455
DHANANJAI SINGH ....................................... 455
NIMESH P. BHOJAK ....................................... 429
DURRE SHAHWAR RUBY ............................ 479
NIRAJ UPADHYAY ......................................... 469
FOZIA TABBASSUM ......................................... 35
OMAR K. M. OUDA ......................................... 355
IBRAHIM A. HASSAN ..................................... 409
PARVINDER KAUR ........................................ 469
IQBAL M. I. ISMAIL ......................................... 375 ISABEL VALENZUELA MERAZ ..................... 391
R. G. GUPTA ................................................... 463 R.V. PRASAD .................................................. 483
JOGINDER SINGH ......................................... 469
RAKAD A. TA'ANY .......................................... 365
JOSE FRANCISCO HERNANDEZ RAMIREZ..391
RAMIRO RAMIREZ NECOECHEA ................ 391
AUTHOR INDEX RATNA GHOSH .............................................. 435
T.V.D PRASAD RAO ....................................... 445
RESHMA XALXO ........................................... 435 REEM H. BADAR ............................................ 409
U.E.CHAUDHARI ........................................... 489
S. AMISAH ...................................................... 331
V.H.WAGHMARE ............................................ 489
S. N. NANDESHWAR ...................................... 463
VIJAY KUMAR ................................................ 469
SAIMA SIDDIQUI ............................................ 395
VINOD KUMAR DUBEY ................................ 455
SHADEMAN POURMOUSA .......................... 403
VINOD KUMAR .............................................. 483
SIMRANJEET SINGH ..................................... 469 SULEIMAN ALHAJI DAUDA .......................... 381
ZAITON SAMDIN ............................................ 381
Current World Environment
Volume 8, Number 3, (2013)
Enviro Research Publishers CURRENT WORLD ENVIRONMENT 14, Green House, Prince Colony,Shahjahanabad, Bhopal - 462 001 (India) EXCHANGE FORM We wish to recieve CURRENT WORLD ENVIRONMENT in exchange of our publication,
Name of Journal Frequency Subjects Covered Institution Address
: ______________________________________________________ : ______________________________________________________ : ______________________________________________________ : ______________________________________________________ : ______________________________________________________ ______________________________________________________ ______________________________________________________ : ______________________________________________________ : ______________________________________________________ : ______________________________________________________ : ______________________________________________________ : ______________________________________________________
Signature Name Designation Date E-mail
Enviro Research Publishers CURRENT WORLD ENVIRONMENT 14, Green House, Prince Colony,Shahjahanabad, Bhopal - 462 001 (India) SUBSCRIPTION FORM I/We wish to subscribe to CURRENT WORLD ENVIRONMENT. The filled in proforma is :
Subscriber's data : Name Address
: :
E-mail Signature Subscription
: : :
______________________________________________________ ______________________________________________________ ______________________________________________________ ______________________________________________________ ______________________________________________________ ______________________ Date ___________________________ Annual/ Life, Amount Rs./ US$ __________________ enclosed
Tick the relevant box : (Send invoice)
(Bill later on)
(Draft No.
Subscription Rates : See the inner page of the back cover.
Payments should be made through drafts in favour of
Enviro Research Publishers, Bhopal Nilofar Iqbal Editor, Current World Environment 14, Green House, Prince Colony,Shahjahanabad, Bhopal - 462 001 (India) E-mail: info@cwejournal.org
enclosed)
Current World Environment
Volume 8, Number 3, (2013)
Declaration about the ownership of
Current World Environment (Form IV) [See Rule 3] 1. 2. 3.
Place of Publication Periodicity of its Publication Printer's Name (Whether Citizen of India) Address
: : : : :
Bhopal Tri-annual Enviro Research Publishers Yes 14, Green House, Prince Colony, Shahjahanabad, Bhopal - 462 001 (INDIA)
4.
Publisher's Name (Whether Citizen of India) Address
: : :
Enviro Research Publishers Yes 14, Green House, Prince Colony, Shahjahanabad, Bhopal - 462 001 (INDIA)
5.
Editor's Name (Whether Citizen of India) Address
: : :
Nilofar Iqbal Yes 14, Green House, Prince Colony, Shahjahanabad, Bhopal - 462 001 (INDIA)
6.
Name & Address of the individual who own the
:
(Whether Citizen of India)
:
Nilofar Iqbal 14, Green House, Prince Colony, Shahjahanabad, Bhopal - 462 001 (INDIA) Yes
I, Nilofar Iqbal hereby declare that the particulars given above are true to the best of my knowledge and belief. Date : 31st of August, 2013 Place : Bhopal
-SdSignature of Publisher
Current World Environment
Volume 8, Number 3, (2013)
INSTRUCTIONS TO CONTRIBUTORS Current World Environment is a tri-annual research journal of Environmental Sciences and published thrice a year, i.e. in April, August and December. Submission of manuscripts containing original research work implies that they are not under consideration for publication elsewhere and that they had not been and will not be published in whole or in parts in any other journal. The following type of research communications are considered for rapid publication: 1. Brief Communications (a) Reports on exciting new results, not exceeding 800 words will be considered for rapid publication. (b) The manuscripts (in duplicate) should be type written, double spaced without any subheadings but with a short abstract of about 50 words. 2. Full Length Papers/Review Articles (a) Manuscripts should not be more than twelve typed pages (in duplicate) must be type written, double spaced with wide margins. (b) The arrangements of full length paper must be in the following sequence. An abstract (not exceeding 100 words), brief introduction, material and methods, results and discussion, acknowledgement (if any) and references. (c) The number of tables and figures is to be curtailed to a minimum, drawn on tracing paper and numbered consecutively, with stencil (Photostat copies will not be accepted). (d) References should be numbered sequentially as (1), (2), (3) etc. in order to their citation in the text. The style of references should be as under : Journal : Name of author(s), the journal, volume, page numbers and the year.
3.
4. 5.
6. 7.
8.
9.
Example : Connick, R. E. and Hugus, Z. Z.: J. Am. Chem. Soc., 75: 6012 (1988) Book : Author's name, title of the book, name and location of publisher, page and year of publication. Example : Greenstein J.P. and Winitz M., Chemistry of Amino Acids, 2: John Wiley, New York, 1009 (1961) It is obligatory that each author and co-author should be a subscriber to the ‘Current World Environment ’. Author(s) will be supplied 10 reprints free of cost. Photograph(s) if any (in duplicate) should be on a glossy paper and the line drawing(s) should be in black Indian ink on a tracing paper. Editorial Board reserves the right to condense or make necessary alterations in the script. Manuscripts should be strictly in accordance with the prescribed format of the Journal. Please refer the website for further details (www.cwejournal.org). If a subscriber does not get a particular issue of Current World Environment , he/ she must inform the editor before the publication of the next issue i.e. within a period of four months from the date of publication of that particular issue. The executive body of Current World Environment invites renowned researchers for its Editorial Board in its review cum screening annual meeting.
Manuscripts and other correspondence should be addressed to: Editor
NILOFAR IQBAL, 14, Green House, Prince Colony, Shahjahanabad, Bhopal - 462 001 (INDIA)
Editor: NILOFAR IQBAL, 14, Green House, Prince Colony,Shahjahanabad, Bhopal - 462 001 (India)
Current World Environment
Volume 8, Number 3, (2013)
EDITORIAL CUM ADVISORY BOARD Prof. (Dr.) Omar Abou-El Seoud, Instituto De Quimica, Universidad De SaoPaulo, (Brazil) Dr. Mervat El-Sayed Mohammed Faculty of Science, Cairo University, Cairo (Egypt) Prof. (Dr.) Ahmed Kadry Aboul-Gheit, Applied Catalysis in Egyptian Petroleum Research Institute, Process Development Department, Nasr City, Cairo, (Egypt) Dr. Khalid Mohd. Al Ghamdi, Department of Biological Sciences, King Abdul Aziz University, Jeddah (KSA) Dr. Eman Mohmoud Ebraheem Elgendy Nature Product and Photochemistry, Mansoura University, (Egypt) Dr. Sayed K. Goda Honorary Staff Member, Medical School, Southampton University, (United Kingdom) Dr. Abderrabba Mohd. Abdelmanef Molecular Physico-chemistry, Unit of IPEST (Tunisia) Dr. L.C. Ram Dy Director, Head, Environment Management Division, Central Fuel Research Institute, Dhanbad, Jharkhand, (India) Dr. Brahim Bessais Centre de Resherche et des Technologies de I’ Energee Laboratoure des Application Solarises, Groupe de Photo voltaique et des Materiaux, Semi-conducteurs, Hamman – Lif (Tunisia)
Dr. K.S. Khairou Department of Chemistry, Faculty of Applied Science, University Ai-Qura, Makkah AL-Mukarrama, (Saudi Arabia)
Gholamreza Asadollahfardi Faculty of Engineering, Kharazmi University, Tehran, Iran
Dr. Yasser M. Moustafa Central Analytical Laboratory, Egyptian Petroleum Research Institute, Nasr City, Cairo (Egypt)
Rana P. Singh, Professor & Ex-Dean School for Environmental Sciences, Babasaheb Bhimrao Ambedkar (A Central) University, Lucknow, India
Dr. Nour Sh. El-Gendy Egyptian Petroleum Research Institute, Cairo, (Egypt)
Dr. Pulak Das PhD (Ecology and Environmental Science) Geopetrol International Inc.,New Delhi
Dr. Godwin P. Kaaya University of Namibia, Department of Biology, Windhoek, (Namibia)
Dr. P. Dhevagi Department of Environmental Sciences Tamil Nadu Agricultural University Coimbatore, India
Prof. Mirza Barjees Baig Department of Agricultural Extension and Rural Society, College of Food and Agricultural Sciences, King Saud University, Kingdom of Saudi Arabia Dr. Amimul Ahsan Department of Civil Engineering, Faculty of Engineering, University Putra Malaysia (UPM), Malaysia. Dr. Martinez Lestard, Pablo Gustavo Argentina Dr.Nahla S. EL-Shenawy Faculty of Science, Suez Canal University, Egypt Dr. Fattaneh Daneshmand Malayeri Research Department, Tehran, Iran Dr. Mamoon M.D. Al-Rshaidat College of Marine Sciences, The University of Jordan Aqaba Branch, Aqaba , Jordan
Dr. Ibrahim. A. Hassan Centre of Excellence in Environmental Studies King Abdul Aziz University, Jeddah , KSA Dr. R. K. Somashekar Professor and Chairman Department of Environmental Sciences, Bangalore University, Bangalore, Karnataka, India Abdul Jabbar Al-Rajab, Ph.D. Environmental Pollution Unit, Environmental Research Center, Jazan University, Jazan, KSA Dr. Brajesh Dubey Environmental Engineering, School of Engineering, University of Guelph, Guelph, Canada Dr. More Nandkishor Associate Professor Department of Environmental Science School of Environmental Sciences, B B A Central University, Lucknow, India
Prof. Syed Iqbal Ali Environmental Engineering and Consulting, Chemical Engineering, Principal, Polytechnic, Aligarh Muslim University, Aligarh (India)
Dr. J. Malathi Department of Microbiology, Sri Shivani College of Pharmacy, Warangal, India
Dr. Venkatathri Narayanan Korea Institute of Ceramic Engineering & Technology, Seoul (South Korea)
Dr. Andrzej Kosoma Maria Curie Sklodowska University, Lubin, Poland
Professor Yinguang Chen, Ph.D State Key Lab of Pollution Control and Resources Reuse, School of Environmental Science and Engineering, Tongji University Shanghai , China
Dr. Foad Farhani Baghlani Iran Research Organisation for Science & Technology, (IROST) Tehran (Iran)
Dr. Lgnacy Kitowski State School of Higher Education in Chelm, Poland
Professor Armando da Costa Duarte Department of Chemistry & CESAM University of Aveiro, Aveiro, Portugal
Dr. Mohammad Azizul Islam Department of Chemistry, University of Rajshahi, Rajshahi, (Bangladesh)
Dr. Chamhuri Siwar Emeritus Professor, Institute for Environment and Devolopment (LESTARI), National University of Malaysia
Dr. Hiren B. Soni Department of Environmental Science & Technology (EST), Institute of Science and Technology for Advanced Studies and Research (ISTAR),S.P. University, Vallabh Vidyanagar, Gujarat, India
Dr. Mohammad Eid Shubair Biomedical Sciences, Gaza, Palestine
Nadeem Khalil Department of Civil Engineering Aligarh Muslim University, Aligarh
ASSOCIATE EDITORS Prof. (Dr.) Masood Alam, New Delhi (India) Prof. (Dr.) Siddiq Qureshi, Bhopal (India) Prof. (Dr.) Suman Malik, Bhopal (India)
Dr. M.N. Khan Bhopal (India) Dr. Meena Iqbal, Bhopal (India) Dr. H.C. Kataria, Bhopal (India)
Enviro Research Publishers assumes no responsibility for the statements, opinions and subject matter advanced by contributors. The Editorial Board in its work of examining papers received for publication is assisted in an honorary capacity by a large number of distinguished scientists, working in various parts of India and abroad. No part of this publication may be reproduced or utilized in any form or by any means, electronic or mechanical, including photocopying and recording or by any information storage or retrieval system, without permission in writing from the Publisher. Editor: Nilofar Iqbal Printed & Published by: Enviro Research Publishers, 14, Green House, Prince Colony, Shahjahanabad, Bhopal - 462 001 (India) Printed from: Shabd Printing Industries, Opp. Badi Kotwali, Bhopal - 462 001 (India)
Current World Environment
Vol. 8(3), 331-339 (2013)
Habitat Description of the Threatened Freshwater Clam, Galatea paradoxa (Born 1778) at the Volta Estuary, Ghana K.A. OBIRIKORANG, S. AMISAH and D. ADJEI-BOATENG Department of Fisheries and Watershed Management, Faculty of Renewable Natural Resources, Kwame Nkrumah University of Science and Technology (KNUST), Kumasi, Ghana. http://dx.doi.org/10.12944/CWE.8.3.01 (Received: August 20, 2013; Accepted: October 05, 2013) ABSTRACT This research was conducted to at two of the few remaining habitats of the threatened freshwater clam (Galatea paradoxa) at the Volta Estuary in Ghana to describe the current state of the clam habitat with respect to the physicochemical water parameters and the characterize the bottom sediment on which they thrive. The research was carried out over an 18-month period with the aim of facilitating the transplanting of juvenile clams from their natural habitats to portions of the estuarine environments with similar physicochemical and characteristics which will consequently lead to the conservation of the clampopulation and expansion of the clam habitat. The measured physicochemical water parameters were fairly similar at the two locations and exhibited temporal fluctuations which could be attributed to seasonal changes as well as anthropogenic activities within the catchment of the sampling locations.The results of the grain size analyses revealed very low sedimentological diversity and it was observed that the estuarine sediments fall under the sandy textural group (>95%) which characterized both sampling locations in the Estuary.
Key words: Galatea Paradoxa, Conservation, Volta Estuary, Ghana.
INTRODUCTION The freshwater clam, Galatea paradoxa (Born 1778) is a bivalve mollusc belonging to the family Donacidae (Purchon, 1963) and is usually restricted to the lower reaches of a few rivers in West Africa including the Volta inGhana (King and Udoidiong, 1991).It constitutes an important and affordable protein source to the riparian human communities of the Lower Volta,and has for centuries been the basis of a thriving artisanal fishery and a means of livelihood for between 10002000 people(Amador, 1997). The sale of harvested clams from the fishery is worth between 4.8 -9.6 million Ghana Cedis (US$ 3.31- 6.72 million) annually (Adjei-Boateng et al., 2012). Additionally, the shell of the clam has a number of important uses notably as source of calcium in animal feed, especially poultry feed, and in the manufacture of local paints. The shells are also used as an alternative to stone chippings in concrete and as
pavement material such as terrazzo floors and to overcome muddy conditions in village compounds in the southern parts of the Volta Region, Ghana. Unfortunately, the pervasive paucity of empirical data for species management and habitat loss through over-exploitation and the damming of the River have significantly reduced the population size of this species that was once abundant within this zone. The construction of the Akosombo and Kpong Hydroelectric Dams on the Volta River in 1964 and 1981 respectively have led to the subsequent absence of annual floods and the formations of sandbars which have gradually prevented the flow of saline water upstream into the River channel during high tides (UNEP, 2002). The changes in the flow regime have led to physicochemical changes in the water and consequently, there has been a gradual but massive shift in the habitat of Galatea paradoxa from the upper and mid-section of the lower Volta River
332
OBIRIKORANG et al., Curr. World Environ., Vol. 8(3), 331-339 (2013)
towards the Estuary with a substantial decline in abundance of the clam.The distribution of Galatea paradoxa is currently restricted to a very narrow stretch of the south Volta River, between AgaveAfedume (15 km from the Volta Estuary) and AdaFoah (10 km from the Estuary) (Amador, 1997), just a small fraction compared to the pre-dam period when the clam industry stretched as far as between Sogakope and Akuse (between 20 and 95 km from the Volta Estuary) (Lawson, 1963).Landings from the clam fishery have also drastically dwindled from 8000 tonnes a year (Lawson, 1963), prior to the construction of the Akosombo dam, to 1700 tonnes (Amador, 1997). As a result of the habitat alteration and over-exploitation of the clam resource, commercial extinction of the clam is imminent in Ghana with immense socio-economic consequences for villagers, especially women whose livelihoods depend on the fishery. Presently, there is the practice of culturing juvenile clams in the lower Volta River which involves transplanting the clams from their natural population in the Volta Estuary to individual or family-owned sites up-river for on-growing during the dry season. This practice ensures the provision of clams for domestic consumption and for sale during the clam fishing close season which spans the entirety of the dry season, from December to March each year (Prein andOfori, 1996, Brown 2006).The clam culture is, however, practiced on a very small scale by a few families and individuals although steps can be taken to ensure the intensification of this practice which will ultimately lead to an increase in the extent of the clam habitat and population. This research was therefore conducted to contribute to the description of the current clam habitat with respect to the physicochemical water parameters and bottom sediment characteristics to facilitate the transplanting of juvenile clams to portions of the estuarine environments with similar characteristics and consequently lead to the conservation of the Galatea paradoxapopulation and expansion of the clam habitat. This research will also provide vital baseline data of the essential for the management and conservation of the Estuary's clam population and serve as a basis for measuring future changes in the bottom sediment characteristics and physicochemical water parameters of the Estuary.
MATERIALS AND METHODS Study Area The study was carried out at two locations, Ada and Aveglo, both at the Volta Estuary, Ghana, over an 18-month period, from March 2008 to August 2009. Ada (Latitude 05째49' 18.6" N and 000째38.46' 1"E) and Aveglo (05째53 28.2" N and 000째 38' 24.7"E) respectively represent the southern and northern limits of the most active clam fishing grounds at the Volta Estuary (Figure 1). This study spanned over the major and minor rainy seasons as well as the dry season (the Harmattan) to give a detailed description of the physicochemical parameters and bottom sediment character of the Estuary and capture the seasonal fluctuations and trends. Climatology and Geology of the Study Area The climate of the study area lies within the dry Equatorial climatic region of Ghana, which also covers the entire coastal belt of the country. This region is the driest in the country and is referred to as the central and south-eastern coastal plains. The coastal lands of Ghana have two clearly defined seasons, the Dry season and the Rainy season. The Rainy season exhibits double maxima, the main one occurring between April and June and the minor one between September and October. June is normally the wettest month in the area.The southern part of the main Volta Basin, including the two study sites at the Estuary consists of mainly metamorphic rocks, including hornblende and biotite, gneisses, migmatites, granulites, and schist (UNEP, 2002).The relief of the riverbed leading to the Estuary as well as that of the surrounding areas of the Estuary is smooth with a very low gradient. Water depths, even at large distances from the coast are shallow and the flow of the Lower Volta River (105km long) is presently almost completely regulated by the Akosombo Dam with an average flow of 1150 m/s. Further modifications have been imposed by the Kpong Dam, situated25km downstream of the Akosombo Dam. This new flow regime between Kpong (95km from the Estuary) and the Estuary has resulted in a progressive growth of sandbars at the Estuary, which restricts flood discharge (into the sea) and tidal movement into the River(Pople and Rogoyska, 1969).
OBIRIKORANG et al., Curr. World Environ., Vol. 8(3), 331-339 (2013) Collection and Processing of Sediment Samples for Granulometric Analysis Surface sediment samples (0-5 cm) were collected on a monthly interval for 18 months using annon-contaminating stainless steel Ekman grab (Duncan and Associates, Cumbria, UK) deployed from a boat at the two locations from March 2008 to August 2009. Twenty (20) samples were collected from random and adequately-spaced out points at each sampling site according to the standard procedures described in USEPA's sediment sampling guide (USEPA, 1994) and stored separately in 500 ml pre-washed LDPE bottles. In the laboratory the sediment samples from each sampling point of the two locations were placed in separate ceramic mortars for drying at 80°C for 48hrs to a constant weight in a hot air oven (Phillips and Yim, 1981). All visible aquatic organisms and shell fragments, grass, leaves and roots when present were manually removed from the sediment samples prior to oven drying. The dried samples were disaggregated using an agate
333
mortar and pestle. The disaggregation was gently done in order to retain, as much as possible, the intrinsic grain sizes of the samples. 250g of each sample was subsequently storedfor the granulometric analyses which broadly adhered to the USEPA(1994) protocols. Granulometric Analysis of Sediments The granulometric analysis of the surface sediments from the two sampling sites was carried out following the procedures described in Cardoso et al., (2008). Grain size analysis was performed based on a series of sieves of different mesh sizes. The sieves were arranged such that the screen with the smallest mesh size was at the base and the largest at the top. A pan was placed below the series of sieves to collect the very fine particles. Sediment description was based on the following fractions; clay (<0.002mm), silt (0.002-0.02mm) and sand (0.02-2mm). The sand component was further broken down into further fractions; very fine sand (0.02-0.06mm), fine sand (0.06-0.2mm), medium sand (0.2-0.6mm), and coarse sand (0.6-2mm). The
Fig. 1: Map showing the sampling locations at Ada and Aveglo in the Volta Estuary in Ghana
334
OBIRIKORANG et al., Curr. World Environ., Vol. 8(3), 331-339 (2013)
Fig. 2 :Trends in physicochemical water parameters of the Volta Estuary from March 2008 to August 2009
OBIRIKORANG et al., Curr. World Environ., Vol. 8(3), 331-339 (2013) fraction retained in each sieve and the pan was weighed and expressed as a percentage of the total sediment weight. Physicochemical Water Parameters Monthly measurement of temperature, salinity, pH, pressure, total dissolved solids (TDS), conductivity and dissolved oxygen (DO) of the Volta Estuary were taken in-situ at both sites for the period using a Hanna HI 9028 multi-parameter probe (Hanna Instruments, Woonsocket, Rhode Island, USA) during high and low tides. Water samples were also collected each month at each sediment sampling point atthe two stations in a clean, 1-litre LDPE sample bottles, stored on ice at approximately 4ºC and subsequently analyzed in the laboratory within 12 hours for Nitrates and Phosphates using a Wagtech Photometer 7100 (Wagtech WTD, Tyne and Wear, UK). Statistical Analysis The Mann-Whitney non-parametric test was used to test for differences (p<0.05) in the measured physicochemical at the two sampling stations over the 18-month period.All descriptive statistics and graphs were executed using the GraphPad Prism 5 Software (Graphpad Software Inc, California, USA). RESULTS AND DISCUSSION Physicochemical Parameters of the Volta Estuary The pH of the water did not show any clear trends at both sampling stations over the sampling period. This lack of pattern is probably due to the fact that wind induced mixing could lead to a very homogeneous water mass and the fairly high carbonate content of the water would have effectively buffered any pH changes that could have resulted from biotic activity (Finlayson, 2000).pH for the Ada sampling station ranged between 6.18 in October 2008 and 8.50 in January 2009 and values were fairly constant from March to December 2008. At the Aveglo sampling station, pH values were similar to the values recorded at Ada over the sampling period although values were generally slightly lower during most of the sampling period. The pH values ranged between 6.23 in October 2008 to 7.28 in August 2009.
335
Temperature values over the 18-month period varied between a narrow range of 27.28°C and 29.59°C in September 2008 and June 2009 for the Ada sampling station and between 27.19°C and 29.62°C for the Aveglo sampling station. These values fell within the long-term-temperature range values from the Ada Synoptic Station which indicated that the minimum average temperature is 24ºC, whereas the maximum average is 31ºC.Dissolved oxygen (DO) values for the Ada sampling station ranged from a low of 1.52mg/l in September 2008 to 8.76mg/l in March 2008. The values dropped steadily from March to October 2008 after which there was a progressive increase to the end of the sampling period, although there were periodic drops during certain months. DO values at the Aveglo sampling station exhibited a trend similar to that of the Ada sampling station with values dropping steadily from March to October 2008 indicating a similar underlying factor responsible for the decline. DO values of the Aveglo portion of the Estuary ranged between 1.58 and 6.78mg/l. DO levels at both stations were reasonably high and fairly constant throughout but appeared to decline for both locations in July August and September 2008. The periods of low DO concentrations coincided with the peak of the rainy season, during which the estuary possibly might have received polluted run-off from the various metal fabrication factories, waste disposal sites and farming locations along the basin which could well have impacted negatively on the DO levels. Although the decline in oxygen levels can be attributed to anthropogenic factors, the amount of oxygen available for aquatic life also depends on a number of factors that affect the solubility of oxygen in water. These factors include salinity, temperature, atmospheric exchange, barometric pressure, currents, upwelling, tides and certain biological processes (Davis 1975). Salinity at the Ada sampling station was constant at 0.03 PSU throughout the periods of March 2008 to February 2009. Salinity values dropped to 0.02 PSU in March, 2009 and remained constant to August 2009 although April 2009 recorded a salinity value of 0.03 PSU. At Aveglo, salinity was similarly fairly constant at 0.03 for all the months from March to September 2008 except July of that same year, which recorded a slightly
336
OBIRIKORANG et al., Curr. World Environ., Vol. 8(3), 331-339 (2013)
higher value of 0.04. There was a drop in salinity from 0.03 to 0.02 PSU from April to August, 2009. The sudden drop in pH at the two stations could be attributed to the dredging of the Volta Estuary, initiated and carried out in April 2009 by the Volta River Authority (VRA) which aimed at breaking down sandbars created by heaps of sand at the Estuary. The dredging process may have caused the re-suspension of anoxic sediments leading to their oxidation, which results in the formation of sulphuric acid causing a lowering of the pH (Peltola and Astrom 2002). Levels of total dissolved solids (TDS) were fairly constant at Ada with values ranging between
31 and 35mg/l over the sampling period. TDS values at the Aveglo sampling station ranged from a low 27mg/l to a high of 42mg/l during the sampling period. Conductivity values similarly ranged from 52µs/cm in May and August 2009 to 70µs/cm in July 2008 for the Ada sampling station and from 54 and 84 µs/cm at Aveglo during the sampling period. At the Ada sampling station, the mean nitrate value over the sampling period was 0.15 ± 0.087.Higher levels of nitrate recorded in March 2008 (0.71mg/l) and March 2009 (0.93) might have been because of surface run-off from farms and animal pens as well as well as from surrounding refuse dumps as the two periods coincided with the onset of the major rainy season in Ghana. The
Table 1: Physico chemical Parameters of the Volta Estuary at Ada and Aveglo Sampling Station
Parameter
Ada
pH Temperature (°C) Salinity (PSU) DO (mg/l) TDS (mg/l) Conductivity (µS/cm) Total Alkalinity (mg/l) Nitrate (mg/l) Phosphate (mg/l) pH Temperature (°C) Salinity (PSU) DO (mg/l) TDS (mg/l) Conductivity (µS/cm) Total Alkalinity (mg/l) Nitrate (mg/l) Phosphate (mg/l)
Aveglo
RangeMean ± SD 6.18-8.50 27.28-29.59 0.02-0.03 1.52-8.76 27-35 52-70 30-70 0.18-0.93 0.15-0.57 6.23-7.28 27.19-29.62 0.02-0.04 1.58-6.79 27-42 54-84 30-70 0.14-0.96 0.03-0.35
6.94 ± 0.52 28.60 ± 0.80 0.027 ± 0.005 4.19 ± 1.93 30.06 ± 2.65 60 ± 5.16 44.38 ± 9.70 0.44 ± 0.23 0.27 ±0.11 6.85 ± 0.27 28.68 ± 0.69 0.028 ± 0.005 3.89 ± 1.80 31 ± 3.48 62.83 ± 7.62 44.16 ± 9.63 0.44 ± 0.23 0.18 ± 0.098
Table 2: Composition of the Bottom Sediment of the Two Sampling Stations Sampling Station
Composition
Range (%)
Mean ± SD (%)
Ada
Clay (<0.002mm) Silt (0.002-0.02mm) Sand (0.02-2mm) Clay (<0.002mm) Silt (0.002-0.02mm) Sand (0.02-2mm)
0.32-1.58 0.04-1.57 97.26-99.34 0.14-2.32 0.04-2.46 96.14-99.48
0.85 ± 0.36 0.54 ± 0.56 98.56 ± 0.68 0.95 ± 0.75 0.85 ± 0.76 98.20 ± 1.32
Aveglo
OBIRIKORANG et al., Curr. World Environ., Vol. 8(3), 331-339 (2013) major anthropogenic source of Nitrate might probably have come from N-P-K fertilizers applied to surrounding farmlands. Similar trends were observed at the Aveglo sampling station which recorded maximum and minimum Nitrate values of 0.70 mg/l and 0.96 mg/l in March, 2008 and March 2009 respectively. Phosphate levels in the Estuary ranged between 0.03 and 0.57mg/l during the period. Phosphate levels were higher at Ada than at Aveglo for almost all the months probably because of the proximity of that section of the Estuary to more human settlements and developments. The elevated levels of phosphate in the Estuary could come from sources such as wastewater effluents, detergents, fertilizers (NPK), soil run-off, and synthetic materials which contain organophosphates, such as insecticides and pesticides. The mean values as well as ranges of the measured physicochemical parameters are shown in Table 1. Spatial Variations and Temporal Trends in the Physicochemical Parameters With the exception of phosphate levels, no significant differences (p>0.05) were observed between the two stations as far as the levels of the studied physicochemical parameters were concerned. Phosphate levels were generally higher at the Ada sampling station probably due to anthropogenic effects. Ada, which is geographically closer to the Estuary, has over the past few years, experienced rapid demographic changes and population growth, and the establishment of more human settlements. The resulting domestic effluent discharges and surface run-off from the cultivated
337
fields and other land-based sources might have increased the phosphate levels of the estuarine waters at Ada.The temporal trends in the physicochemical parameters for both sampling stations over the 18-month sampling period are shown in and Fig. 2. Granulometric Analysis of the Sediment Samples The results of the grain size analyses revealed very low sedimentological diversity and it was observed thatthe estuarine sediments fall under the sandy textural group. This sandy substratum characterized both sampling locations in the Estuary. The granulometric analyses for the Ada sediments revealed the following composition: sand (between 97.26% and 99.34%). Mean silt and clay composition jointly constituted less than 3% of the sampled sediment - silt ranged between 0.04 and1.57% and clay, between 0.32 and 1.58% (Table 2). At the Aveglo station the results of the granulometric analysis was similar to the trend obser ved for the Ada sediments. The sand component was very dominant in all the subsamples and ranged between 96.14 and 99.48%. The clay and silt components of the sampled sediments ranged between 0.14-2.32% and 0.04-2.46%. Further analyses of the sand component of the sediment revealed that it was predominantly coarse sand (between 63.36% and 98.71%) (Table 3). CONCLUSION This research is a first approach in the efforts aimed at conserving and expanding the
Table 3: Particle Size Distribution of the Sand Component of the Estuarine Sediments Sampling Station
Particle Size Distribution
Range (%)
Mean ± SD (%)
Ada
Very Fine Sand (0.02-0.06mm) Fine Sand (0.06-0.2mm) Medium Sand (0.2-0.6mm) Coarse Sand (0.6-2mm) Very Fine Sand (0.02-0.06mm) Fine Sand (0.06-0.2mm) Medium Sand (0.2-0.6mm) Coarse Sand (0.6-2mm)
0.10-0.22 0.14-6.0 0.31-27.76 64.34-98.11 0.06-1.76 0.18-7.84 0.31-30.76 64.34-98.11
0.93 ± 0.62 2.35 ± 1.67 17.76 ± 7.25 77.34 ± 8.21 0.57 ± 0.47 2.95 ± 2.92 14.19 ± 9.82 80.53 ± 12.21
Aveglo
338
OBIRIKORANG et al., Curr. World Environ., Vol. 8(3), 331-339 (2013)
present clam habitat at the Volta Estuary through culture, to alleviate the fishing pressure on the remaining clam population. The results of this research can serve as reference data for stakeholder institutions like the Fisheries Commision, the District Assemblies and local authorities in their efforts to zone out potential clam culture sites and empower individuals and groups to engage in clam culture at the Lower Volta River.The development of clam culture will enhance economic activities in the lower Volta and improve the livelihoods of villagers and the general wellbeing of the communities.
ACKNOWLEDGEMENT The authors are grateful to the International Foundation for Science (IFS) for providing financial support (A/4421-1) to conduct this research work and the Department of Fisheries and Watershed Management of the Kwame Nkrumah University of Science and Technology, Kumasi for logistical support.
REFERENCES 1.
2.
3.
4.
5.
6.
Adjei-Boateng, D., Agbo, N.W., Agbeko, N.A., Obirikorang, K.A and Amisah, S. The current state of the Volta clam, Galatea paradoxa(Born 1778) fishery. Proceedings of the 16th Biennial Conference of the International Institute of Fisheries Economics and Trade (IIFET), Tanzania (2012). Amador, M.K. A review of the Volta clam, Egeriaradiatafishery in the Lower Volta. BSc. Thesis submitted to the Dept. of Fisheries and Watershed Mgt, KNUST, Kumasi, Ghana (1997). Brown, J. H. Shellfish culture in West Africa; economic and sustainable opportunities for artisanal fishing communities. Background paper for FAO/DFID SFLP Policy brief series, FAO, (2007). Canadian Council of Ministers of the Environment (CCME) (2007) Canadian water quality guidelines for the protection of aquatic life: Summary table. (Update 7.1, December, 2007). Cardoso, I., Granadeiro, J.P. and Cabral, H. Benthic prey quality in the main mudflat feeding areas of Tagus Estuary: Implications for bird and fish populations. Ciencias Marinas, aòo/, 34, (003):283-296, (2008). Davis, J.C. Waterborne dissolved oxygen requirements and criteria with particular emphasis on the Canadian environment. National Research Council of Canada, Associate Committee on Scientific Criteria for Environmental Quality, Report No. 13,
7.
8.
9.
10.
11.
12.
13.
NRCC 14100 (1975). Finlayson C.M., Gordon, C., NtiamoaBaidu, Y., Tumbulto, J. and Storrs, M. The hydrobiology of Keta and Songor lagoons: Implications for coastal wetland management in Ghana. Supervising Scientist Report 152. Supervising Scientist, Darwin, Australia, (2000). King, R.P. and Udoidoing, O.M. Perspectives in the development and conservation of freshwater fisheries resources of the Cross River, Nigeria.Transitional Nigerian Society of Biological Conservation, 2, 7-16 (1991). Lawson R.M. The economic organization of Egeriafishing industry on the Volta River. Proceedings of Malacological Society of London. 35: 273-287, (1963). Peltola, P. and Astrom, M. Concentration and leachability of chemical elements in estuarine sulphur-rich sediments, W. Finland.The Sci. of Total Environ., 284: 109122, (2002). Phillips, D.J.H and Yim, W.W-S. A comparative evaluation of oysters, mussels and sediments as indicators of trace metals in Hong Kong waters. Marine Ecology Progress Series , 6: 285-293 (1981). Pople, W. and M. Rogoyska, The effect of the Volta River hydroelectric project on the salinity of the Lower Volta River. Ghana J.Sci., 9(1):9â&#x20AC;&#x201C;20, (1969). Prein, M. and Ofori, J.K , Past initiatives for promoting aquaculture in Ghana, p. 1-3. In M. Prein, J.K. Ofori and C. Lightfoot (eds.)
OBIRIKORANG et al., Curr. World Environ., Vol. 8(3), 331-339 (2013)
14.
Research for the future development of aquacuiture in Ghana. ICLARM Conf. Proc. 42, 94 p (1996). Purchon, R.D. A note on the biology of E. radiata Lam (Bivalvia, Donacidae). Proceedings of the Malacological Society of London 35: 251-271 (1963).
15.
16.
339
United Nations Environment Programme (UNEP) Project Development Facility .Volta River Basin Preliminary Transboundary Diagnostic Analysis-Final Report, (2002). United States Environmental Protection Agency (USEPA) .Sediment Sampling. SOP#: 2016, (1994).
Current World Environment
Vol. 8(3), 341-354 (2013)
Effect of Agricultural Activities on Water Quality Deterioration of Mujib Basin, Jordan ATEF AL-KHARABSHEH and MOHAMAD ALATOUM Al-Balqa' Applied University and UNDP Office, Amman. http://dx.doi.org/10.12944/CWE.8.3.02 (Received: November 04, 2013; Accepted: December 15, 2013) ABSTRACT Mujib basin is located at the central part of Jordan, south of the Capital, Amman. The area is bounded by Zerqa basin in the north and Hasa basin in the south, while it extends to Azraq and Sirhan basins in the east and to the Dead Sea to the west. In the hills on the eastern edge of the Valley, the topography is rugged, scarp and steep canyon drops to elevation about 400 m below sea level (bsl) adjacent to the Dead Sea. The Mujib basin is semi-arid to arid, with low rainfall in most parts of the basin in winter and high temperatures in summer. In this study, the 24 water samples were analysed for their physical, chemical and biological characteristics. The analyses were done in November and February, before and after rainy season, respectively. About 12 water samples were collected from Mujib dam and Wadi Mujib and 12 from springs recharging Wadi Mujib and discharge their water from Upper Cretaceous aquifers (B2/A7). According to Langguth classification the surface water shows alkaline earth water with increased portion of alkalies and prevailing chloride. Four types of water were seen in the spring water; alkaline earth water with bicarbonate and chloride, alkaline earth water with increased portion of alkalies with prevailing bicarbonate, alkaline earth water with increased portion of alkalies with prevailing chloride and alkaline water with prevailing chloride. The chemistry of the water is originated from the dissolution of carbonate rocks and evaporates deposits such as Gypsum resulted from irrigation water. The high concentrations of Na+, Cl-, SO4- and NO3- could be attributed to the high probability of water contamination from agricultural activities. The average values for total coliform were ranged from 79 to 1600 MPN/100 ml and from 1.8 to 1600 MPN/100 ml for surface water and springs, before and after the rainy season, respectively. All studied springs have total coliform values exceed the permissible limit according to JS and WHO Guidelines. According to these values, it is not surprising to find high water contamination with total coliform caused by agricultural drainage to the surface water and springs, especially during summer period.
Key words: Mujib, Water Quality, Agriculture, Arid, Rainfall.
INTRODUCTION Surface water resources are distributed among 15 basins. The largest source of external surface water is the Yarmouk River at the Syrian border. Originally, the annual flow of the Yarmouk River was estimated at about 400 million cubic meter (MCM) (of which about 100 MCM are withdrawn by Israel). Total flow is now much lower than 400 MCM as a result of the upstream Syrian development works, which took place in the 1980's. The Yarmouk River accounts for 40 % of the surface water resources of Jordan, including water
contributed from the Syrian part of the Yarmouk basin. It is the main source of water for the King Abdullah Canal (KAC) and is thus considered to be the backbone of development in the Jordan River. Other major basins include Zerqa River Basin, Jordan River side wadis, Wadi Mujib, the Dead Sea side wadis, Wadi Hasa and Wadi Araba. Internally generated annual surface water resources are estimated at 400 MCM (WAJ Files). Jordan's groundwater is distributed among 12 major basins. The internally produced annual renewable groundwater resources (safe
342
KHARABSHEH & ALATOUM, Curr. World Environ., Vol. 8(3), 341-354 (2013)
yield) are estimated at 277 MCM. The baseflow of the rivers constitutes around 335 MCM, a large portion of which is of fossil origin, recharged during more humid climatic periods, and thus does not reflect present day recharge. Groundwater resources are concentrated mainly in the Yarmouk, Azraq, Amman-Zerqa and Dead Sea Basins (WAJ Files). Most of the basins are over-exploited. The annual deficit in the water balance is around 230 MCM. Over-extraction of groundwater resources has degraded water quality and reduced exploitable quantities, resulting in the abandonment of municipal and irrigation water well fields (Wadi Dhuleil). High nitrate contents are observed in East Mafraq and South of Amman. Several large springs (Salt, Mujib and Irbid areas) are affected by bacterial contamination, due to insufficient sewage water collection and treatment (Margane and Sunna. 2002). The main non-renewable aquifer presently exploited is the Disi aquifer (sandstone) in southern Jordan with a safe yield of 100 MCM for 100 years. Other non-renewable water resources are found Jafr basin, for which the annual safe yield is about 18 MCM. In total, it is estimated by the Water Authority of Jordan (WAJ) that the safe yield of fossil groundwater is 143 MCM. The agricultural water use is about 75 percent of the annual withdrawal, which estimated to about 1200 MCM, while the industrial and domestic percentages are 4 and 21 percent respectively including the use of treated wastewater. Due to limited and widely scattered sources of water, the construction of important water conveyance facilities was undertaken to meet the demand of the population, which is concentrated in some areas. Some shortages have been observed during the recent years, but they are generally limited to less than 10 percent of the demand. The potential for irrigated cultivation is estimated at around 840,000 ha. However, taking into consideration potentially available water resources, the irrigation potential is about 85,000 ha, including the area currently irrigated (JVA Files).
The main purposes of this study are to establish a base line assessment for water quality, to be comparable base for further monitoring, identify main threats that may pollute the water in Mujib River, investigate the effects of agricultural practices on the natural water system and find the interrelationship between the results of hydrochemical characteristics of the spring's waters and recent pollution levels of these springs. Wadi Mujib is a gorge enters the Dead Sea at 410 m below sea level (bsl). The Mujib Nature Reserve (MNR) is the lowest nature reserve in the world, located in the mountainous landscape to the east of the Dead Sea, approximately 90 km south of Amman. The 220 km2 reserve was created in 1987 by the Royal Society for the Conservation of Nature (RSCN) and is regionally and internationally important, particularly for the bird life that the reserve supports. It extends to the Karak and Madaba mountains to the north and south, reaching 900 m (asl) in some places. This 1300 meter variation in elevation, combined with valley's year round water flow from seven tributaries, means that Wadi Mujib enjoys a magnificent biodiversity that is still being explored and documented today. Hydrology Mujib basin is located in the central part of Jordan, south of the Capital, Amman. The basin drains approximately 6593 km2 of mainly plateau land to the east of the Dead Sea. The area is bounded by Zerqa basin in the north and Hasa basin in the south, while it extends to Azraq and Sirhan basins in the east and to the Dead Sea to the west. The majority of the basin east to the Jordan Rift Valley ranges between 700 and 900 m asl. In the hills on the eastern edge of the Valley, the topography is rugged, scarp and steep canyon drops to elevation about 400 m below sea level (bsl) adjacent to the Dead Sea. Fig. 1 shows location of Wadi Mujib Basin and location of the collected samples. The rainy season in Jordan begins in October and ends in May. The rest of the year is particularly dry with almost clear sky. The Mujib basin is semi-arid to arid, with low rainfall in most parts of the basin in winter and high temperatures in summer. Precipitation in the basin results primarily
KHARABSHEH & ALATOUM, Curr. World Environ., Vol. 8(3), 341-354 (2013) from frontal depressions entering from Mediterranean region in the west. During the rainy season, three to four frontal depression systems per month may cross the basin (Samawi and Sabbagh, 2005). These large frontal systems, which develop generally from December to March, become less active as they advance towards the eastern and southern part of the basin. A low depression, predominant over the center of the Red Sea, occasionally extends northwards at the beginning or end of the winter season, resulting in thunderstorms and short duration, heavy rainfall. Rainfall and temperature are spatially variable, primarily because of the high variable topography and thunderstor m activity. Thunderstorms are spatially likely at the beginning or end of the winter season, causing sharp peaks of flashy floods because of the high intensity of rainfall. Average annual rainfall decreases from over 300 mm near the western edge of the basin to less than 50 mm at the eastern edge. In wet years rainfall in the western part of the catchment can reach a maximum of almost 700 mm, whereas the minimum in dry years may be as low as 100 mm. Fig. 2 shows monthly rainfall for Wadi Wala station in Mujib basin. Discharge of Wadi Mujib Discharge of Wadi Mujib is measured at station CD0035 on daily basis at the downstream of Mujib dam. The discharge ranges from 0 in the drought times to a peak of 40 m3/sec in the year 1964/1965 (WAJ Files). It is clearly seen that most of the flood occurs during the winter season, which means that the springs are highly affected by the rainy season. During droughts, most of the spring water is used for irrigation purposes on both sides of the wadi. Aquifer Characteristics of Mujib Basin The most significant aquifers in the area are B2/A7 aquifer and Kurnub/Disi aquifer. Over most of the western part of Mujib dam surface water catchment the B2/A7 aquifer is at outcrop and thus receives groundwater recharge. In the westernmost part the B2/A7 aquifer is overlain by basalt, which acts as an aquifer as well, so that basalt and B2/A7 principally may form a combined aquifer. To the north of Wadi Mujib, strata dip generally in a
343
northeasterly direction (Margane and Hobler, 1994) so that here groundwater flow in most likely directed towards Wadi Wala. Below the A7, the Ajlun group formation A3 to A6 act as an aquitard, though thin intercalations of limestone are included in this sequence. The A1/2 aquifer is only relevant downstream of the dam and the respective water level is found at elevations considerably below the level of reservoir. This also applies for the kurnub/ disi aquifer. This aquifer is considered as a combined aquifer in all Mujib Catchment area because the Zerqa Group, which acts as an aquitard, separating the two units farther to the north is missing (Margane et al., 2008). Generally, groundwater flow in the kurnub/ disi is directed towards Wadi Mujib, which as the main collector of its outflow to the Dead Sea. Flow velocity in groundwater compared to those in surface water is significantly less. Whereas flow in surface water may reach several kilometers per day, flow in groundwater is in the range of few centimeters to meters per day. In Mujib Catchment Area, flow path is long enough for microbial constituents to have died off well before groundwater reaches Mujib dam so that bacteriological contamination along this flow path is not an issue. The aquifers are overexploited and sharp drawdown can be seen in all observation wells located in the basin (Fig. 3). Methodology of Water Analysis The examination of water quality is basically a determination of microorganisms, minerals and organic compounds contained in the water. Physical analyses; pH, turbidity & electrical conductivity, chemical analyses; cations (Na+, K+, Ca2+ & Mg2+), anions (Cl-, HCO3-, SO42-, NO3-, NO2- & PO43-), heavy metals (Br, Cr, Co, Ni and F), hardness and alkalinity and biological analyses; Eschericha coli and Total Coliform (MPN/100 ml) were performed on springs water samples to determine their water quality. These analytical techniques were performed according to the procedures mentioned in Standard Methods for the Examination of Water and Wastewater, 17th Edition (Clesceri et al., 2007). The analyses were done at the Labs of the Ministry of Water and Irrigation in Amman. Table 1
344
KHARABSHEH & ALATOUM, Curr. World Environ., Vol. 8(3), 341-354 (2013)
summarizes the analytical methods for the analyzed parameters. About 12 water samples were collected from Mujib dam and Wadi Mujib and 12 springs recharging Wadi Mujib and discharge their water from Upper Cretaceous aquifers (B2/A7). The samples were collected at the beginning of November 2009 before the rainy season begins in the driest period of the year and repeated in February 2010 after the rainy season to show variations in pollution levels during summer and winter. Tables 2 and 3 present the description of the collected samples (surface water and spring water). Table 4 shows the JS and WHO Guidelines for Table 1: Analytical methods used in determination of various parameters (Clesceri et al., 2007) Parameter*
Analytical Methods
pH EC Turbidity Total Hardness (Ca2+ & Mg2+) Total Alkalinity (CO32- & HCO3-) Cl-
Electrometric Method Laboratory Method Nephelometric Method EDTA Titrimetric Method, (0.01 M) EDTA Titration Method, (0.02 N) H2SO4 Ion Chromatographic Method, (0.0141 M) AgNO3 Ion Chromatographic Method Ion Chromatographic Method Ion Chromatographic Method Inductivity Coupled Plazma Ion Chromatographic Method Inductivity Coupled Plazma Inductivity Coupled Plazma Ion Chromatographic Method Ion Chromatographic Method Stannous Chlooride Multiple Tube Fermentation Multiple Tube Fermentation
Na + K+ Br Cr F Co Ni NO3SO42PO43Total Coliform E. Coli
*pH; EC; Electrical Conductivity, Ca2+; Calcium, Mg2+; Magnesium, CO32-; Carbonate, HCO3-; Bicarbonte, Cl -; Chloride, Na +; Sodium, K +; Potassium, Br: Bromide, Co: Copper, Cr: Chromium, F: Fluoride, Ni: Nickel, NO 3-; Nitrate, SO 42-; Sulfate, PO 43-; Phosphate.
drinking water. Statistical analyses of the physical, chemical and biological analyses are presented in Table 5. RESULTS AND DISCUSSION The quality of water deals with its chemical, physical and biological constituents. Natural groundwater contains many chemical species in the dissolved state. These constituents occur as a result of many physical and chemical processes on geological formation and from many chemical reactions in the atmosphere. Furthermore, the nature of these constituents is a function of the type of rocks, and its distribution, as well as physical and chemical constraints of many weathering processes. The determination of minerals, organic compounds and microorganisms is important to examine the water quality. The Jordanian Standards (JS) and the World Health Organization (WHO) Guidelines for drinking water are mainly considered to evaluate the springs' water suitability for drinking purposes. Most prominent factors that affect quality of the recharge area of the springs are the unplanned land use around the recharge sources of the springs. High slopes of the catchment area accelerate the pollution rate and make the springs directly influenced by the pollutants along the recharge area of the springs. The geological formation of the Upper Cretaceous Limestone rocks that cover the catchment area of the springs also increases the pollution rate due to the presence of joints, faults and massive cliffs through it. Physical Parameters The values of average of pH for the different springs were ranged from 7.67 to 8.80 and from 7.15 to 8.01 for surface water and springs, respectively. The increasing of bicarbonate concentration in water helps pH-value to decrease. The existence of limestone in Amman Wadi Es-Sir Formation (B2/A7) may raise the pH-value (Stone and Thomforde, 1977). In all studied water samples the pH-values are acceptable for drinking water according to JS and WHO Guidelines. According to the Subramanian classification (1999), the water samples could be classified as hard water.
KHARABSHEH & ALATOUM, Curr. World Environ., Vol. 8(3), 341-354 (2013)
345
The values of average of Electrical Conductivity (EC) for surface water and springs samples were ranged from 660 to 2030 (Us/cm) and from 831 to 2470 (Us/cm), respectively. There is a positive relation between EC and dissolved
salts in water. Most of springs in the study area are located within agricultural areas that affect the springs' water quality since high value of EC could be attributed to the drainage water. So, there are no continuous pollution sources in the vicinity of the
Table 2 : Description of the surface water location in Wadi Mujib Basin.
Table 3 : Description Location and types of spring in wadi mujib basin.
Sample location No.
Sample No.
1 2 3 4 5 6
6 7 8 9 10 11
Central Mujib Dam Lower Mujib Dam Upper Wadi Mujib Upper Mujib Dam Lower Wadi (Mixing of Mujib and Hidan) Central Wadi Mujib
Spring Name
Aquifer Type
Dafali Saniat Albania Makbuleh Arafat Rashah
Faulty Contact Faulty/ hot water Faulty Contact Faulty
Table 4: The Jordanian standards (JS) and WHO Guidelines for drinking water (WAJ Files) Jordanian Drinking Water Standards (JS No. 286/2001) Parameter
pH EC (Us/cm) Turbidity (NTU) Ca+2 (mg/l) Mg+2 (mg/l) T.H (mg/l) as CaCO3 HCO3- (mg/l) Alkalinity (mg/l) Cl- (mg/l) NO3- (mg/l) PO4-3 (mg/l) SO4-2 (mg/l) Na+ (mg/l) K+ (mg/l) Br (mg/l) Cr (mg/l) Co (mg/l) F (mg/l) Ni (mg/l) T.C (MPN/100ml) E. Coli
Permissible Limit
Max Allowable Concentration(in case no better source is available)
6.5 750 1 100 100 300 100 100 200 45 200 200 10 0.03 0.02 0.5 1 0.03 0
8.5 2300 5 500 500 500 500 500 250 70 500 400 50 0.05 0.05 1 1.5 0.05 1.1 0
WHO Guidelines 1995
6.5-8.5 750-1500 5 75-200 150 100-500 125-350 100-500 250 50 250 200 10-50 0.05 0.05 0.5-1 1 0.05 0 0
Sample 12
Sample 11
Sample 10
Sample 9
Sample 8
Sample 7
Sample 6
Sample 5
Sample 4
Sample 3
Sample 2
134.5 ±305 123.5 ±17.5 165 ±35 110 ±28 136 ±6 373.5 ±16.5 265 ±20 173 ±5.20 159.5 ±28.5 306 ±2.89 306.5 ±16.26 306 ±8.49
Sample 1
0
0
0
0.4 ±0.08 0
0
0
0
0.13 ±0.13 0.15 ±0.15 0.76 ±0.64 0
Alkalinity Ammomg/L as -nium mg/l as CaCO3 NH4
Location Desptn
163.91 ±4.09 150.65 ±21.35 201.3 ±42.7 134.2 ±34.2 153 ±4.9 455.65 ±20.15 323.35 ±24.35 211 ±6.35 172.62 ±12.82 373.3 ±3.52 374 ±19.80 373.3 ±10.32
Bicarbonate mg/L
0.36 ±0.08 0.21 ±0.21 0.151 ±0.07 0.39 ±0.11 1.45 ±0.025 0.13 ±0.13 0.69 ±0.19 1.33 ±0.12 0.92 ±0.06 0.37 ±0.02 0.31 ±0 0.24 ±0.34
mg/L
Bromide
66.87 ±4.135 65.2 ±5.9 382.57 ±287.37 64.43 ±9.32 109.32 ±3.72 105.5 ±5.2 116.2 ±1.2 138.7 ±1.50 105.91 ±0.50 105.6 ±3.81 101.7 ±2.97 113.7 ±2.97
Calcium mg/L
78.91 ±22.59 77.25 ±20.05 109 ±18.8 84.50 ±25.21 421.58 ±29.28 39.94 ±6.21 126.37 ±46.17 477.5 ±67.84 244.26 ±6.05 53.6 ±4.50 53.68 ±0.60 76.35 ±15.06
Chlo-ride mg/L
0
0
0
0
0
0
0
0
0
0
0
0
Chro -mium mg/L
0
0
0
0
0
0
0
0
0
0
0
0
Cop-per mg/L
798.5 ±115.5 794 ±122 990.5 ±105.5 788 ±128 2010 ±20 874.5 ±24.5 1224.5 ±148.5 2420 ±28.87 1515.5 ±13.5 933 ±5.77 859.5 ±40.31 1050.5 ±54.45
Electrical Cond.. Us/cm
Table 5: Water Quality of Wadi Mujib Basin before and after Rainy Season.
24.5 ±24.5 126.5 ±-93.5 464.65 ±455.35 58.9 ±51.1 1600 ±0 214.5 ±135.5 0 0.81 ±0.03 0 ±0.08 185 ±55 79 0.67 ±41.11 89.5 ±57.28 865 ±1039.45
±0.017 0.61 ±0.014 0.675 ±0.035
0.71 ±0.01
0.93
0.50 ±0.03 0.54 ±0.05 0.61 ±0.04 0.56 ±0.03 0.735 ±0.02 0.55 ±0.03
Escherichia Fluoride coli MPN mg/L /100mL
346 KHARABSHEH & ALATOUM, Curr. World Environ., Vol. 8(3), 341-354 (2013)
Magn-esium mg/L
23.5 ±5.4 23.55 ±6.25 29.8 ±4.5 24.3 ±6.3 44.35 ±1.05 32.86 ±1.24 43.98 ±6.53 50 ±1.96 46.15 ±-0.35 35.02 ±0.97 30.55 ±2.05 39.65 ±2.76
Hardness mg/L as CaCO3
270.5 ±35.5 279 ±-42 339 ±49.5 276.5 ±46.5 466.5 ±3.5 415 ±2 490.5 ±27.5 546 ±0.58 531.5 ±42.5 429 ±1.73 392 ±11.31 470.5 ±6.36
Table 5 continue
0.01 ±0 0.01 ±0.01
0
0
0.01 ±0.01 0.02 ±0.01 0
0
0
0
0
0
Nickel mg/L
1.53 ±1.12 1.01 ±0.80 3.68 ±1.23 0.92 ±0.50 1.98 ±0.45 5.64 ±0.76 27.5 ±1.8 0 ±0.77 3.19 ±1.19 18.7 ±1.62 27.3 ±3.54 22.75 ±1.50
Nitrate mg/L
0
0
0
0
0
0
0
0
0.21 ±0.21 0
0
0
Nitrite mg/L
0.02 ±0.03 0.05 ±0.04
0.02 ±0.02 0
0
0.14 ±0.07 0.07 ±0.02 0.2 ±0.12 0.09 ±0.03 0.03 ±0.03 0.02 ±0.02 0
8.79 ±0.59 8.02 ±1.37 7.43 ±0.78 8.02 ±1.37 15.47 ±0.57 3.13 ±0.39 3.91 ±0 19.55 ±0.66 9.39 ±0.40 3.13 ±0.23 3.33 ±0.28 4.11 ±0.28
Ortho PotasPhosphmg/L -orusmg/l as PO4 59.12 ±10.59 60.65 ±13.45 71.74 ±5.96 60.15 ±12.75 228.32 ±2.69 47.6 ±5.5 72.9 ±15.2 291.9 4.01 137.9 ±2.9 42.8 ±2.42 36.59 ±1.00 50.7 ±3.11
Sodium -sium mg/L
150.25 ±31.65 141 ±34.35 185.5 ±5 154.55 ±44.15 259.22 ±22.58 53.5 ±5.5 189.1 ±50.9 249.1 ±46.30 274.09 ±12.01 93.6 ±11.09 64.81 ±10.88 133 ±18.38
Sulfate mg/L
540 ±0 839.5 ±760.5 910 ±690 295 ±55 1600 ±0 975 ±625 1 ±0 1 ±0 635 ±285 1600 ±721.69 835 ±1081.87 1600 ±0
Total MPN /100mL
6.12 ±3.82 17.93 ±12.27 8.2 ±207 22.9 ±16.4 3.65 ±1.50 4.54 ±1.83 2.38 ±2.02 10± 0.49 4.87 ±0.76 3.2 ±0.42 1.61 ±0.86 15.27 ±17.73
7.995 ±0.17 8.24 ±0.37 7.95 ±0.28 8.34 ±0.47 8.28 ±0.07 7.97 ±0 7.56 ±0.01 7.39 ±0.14 8.35 ±0.07 7.8 ±0.12 7.4 ±0.86 7.83 ±0.22
Turbidity pH Coliforms NTU unit
KHARABSHEH & ALATOUM, Curr. World Environ., Vol. 8(3), 341-354 (2013) 347
348
KHARABSHEH & ALATOUM, Curr. World Environ., Vol. 8(3), 341-354 (2013)
Fig. 1: Location Map of Wadi Mujib and the Collected Samples.
Fig. 2: Monthly rainfall (mm) for rainafall station WADI WALA (CD0006)
KHARABSHEH & ALATOUM, Curr. World Environ., Vol. 8(3), 341-354 (2013)
349
recharge area of this spring and this may explain its low value of EC. The addition of excess of agricultural fertilizers to the soil increases the value of leached chemical pollutants to springs' water represented by the nitrogenous, phosphates or organic fertilizers. Total Dissolved Solid (TDS) (mg/ l) = A* EC (Us/cm). Since, A is a factor and its range (0.55-0.8)). Fig.'s 4 and 5 show the variation of electrical conductivity for surface water and spring water before and after rainy season.
Fig. 3: Declination in Groundwater Levels of Mujib Basin.(Arainbeh Well No. 14).
The values of average of turbidity for water samples were ranged from 2.15 to 39.3 NTU and from 0.36 to 27.8 NTU for surface water and springs,
Electrical Conductivity
2100
Electrical Conductivity after rain Us/cm
1800 1500 1200 Electrical Conductivity before rain Us/cm
900 600 300 0 Sample 1
Sample 2
Sample 3
Sample 4
Sample 5
Sample 6
Fig. 4: Electrical Conductivity of Surface Water in Wadi Mujib
Electrical Conductivity
2500
Electrical Conductivity after rain Us/cm
2000 1500 Electrical Conductivity before rain Us/cm
1000 500 0 Sample 6
Sample 7
Sample 8
Sample 9
Sample 10
Sample 11
Fig. 5: Variation of Electrical Conductivity for the Springs in Wadi Mujib
350
KHARABSHEH & ALATOUM, Curr. World Environ., Vol. 8(3), 341-354 (2013)
respectively. All studied springs have turbidity values within permissible limit of JS and WHO Guidelines accept sample no.12 (Rashah spring). It was clear that the turbidity was increased after rainy season, which means that the springs are directly influenced by the recharge water. Chemical Parameters The values of average of the total hardness for water samples were ranged from 230 to 574 mg/l and 384 to 547 mg/l for surface water and springs, respectively. All the studied springs have total hardness values within permissible limit of JS and WHO guidelines. According to Freeze and Cherry (1979), all samples are classified as hard and very hard water . All the concentrations of calcium were higher than magnesium concentration for all studied water samples; this probably due to the dissolution of limestone involves the following equilibria: CaCO3 CO32- + H2O
Ca2+ + CO32HCO3- + OH-
So, the prominent mineral result from the dissolution process of the limestone rocks is the
1 2 3 4 5 6 7 8 9 A B C
Fig. 6: Trilinear Presentation of the chemical Composition of the Surface Water Analyses.
calcium. Since, the main constitute of the geological formation in the study area is the limestone and partly dolomite. All the studied samples have calcium and magnesium values in (mg/l) within permissible limit of JS and WHO Guidelines. The classification of very hard water could be attributed to the presence of limestone rocks in their geological formations, in addition to the presence of pollutant sources presented by agricultural activities near the recharge sources of the catchment area. The relative amount of each of carbonate and bicarbonate in the studied springs' water depends upon their pH value. The carbonate concentration in all studied springs is equal to zero but there is bicarbonate due to pH value, which is less than 8.3. This pH value is the permissible limit for bicarbonate to be available in water but not for carbonate which present when the pH lies between 8.3 and 10. So, in all studied springs the total alkalinity values is represented by CaCO3 concentrations. The alkalinity values range from 106 to 200 mg/l and from 173 to 390 mg/l for the surface water and springs, respectively. There is a positive relation between EC and total alkalinity. Relatively high values of bicarbonate for the studied samples are primarily the result of dissolution of limestone and marl which mainly 1 2 3 4 5 6 7 8 9 A B C
Fig. 7: Trilinear Presentation of the chemical Composition of the Spring Water Analyses.
KHARABSHEH & ALATOUM, Curr. World Environ., Vol. 8(3), 341-354 (2013) contribute in the studied springs' geological formation. HCO3 ranges from 148 to 185 mg/l and 211 to 475 mg/l for the surface water and springs, respectively. In addition to the ions dissolution during the path of springs' water to the surface, the leaching of domestic and municipal drainage water to the spring source increase its bicarbonate value. All studied samples have total alkalinity values within permissible limit of JS and WHO Guidelines. The average values for chloride were ranged from 56 to 450 mg/l and from 33 to 594 mg/ l for surface water and springs, respectively. The relatively high values of chloride could be attributed to the effect of agricultural activities at the recharge area of the sources. The dissolution of rocks and soils in the study area is also may contribute in considerable amount of chloride constituents for the springs' water. Most of the studied samples have chloride concentrations within permissible limit of JS and WHO Guidelines accept two samples. The average values for nitrate were ranged from 0.28 to 4.9 mg/l and from 0.2 to 29.8 mg/l for surface water and springs, respectively. This could be attributed to contribution of excess nitrogen fertilization due to agricultural activities in some areas. The high concentrations indicate high probability of the presence of organic matter resulting from agriculture. Other sources of nitrate are decaying of root nodule bacteria and legume plants results from the agricultural areas expanded in the catchment area. All samples are located within the permissible limits of JS and WHO. The phosphate concentration in both surface water and spring water is negligible. KĂślle (2003) defined that if the phosphate concentrations higher than 100 Âľg/l then it could be considered as a pollution indicator. Organic waste, excrements or wastewater can have a direct impact on the phosphate concentrations in the groundwater. PO4 concentration ranges from 0.02 to 0.23 mg/l and from 0.02 to 0.04 for surface water and springs, respectively. The average values for sulfate were ranged from 107 to 286 mg/l and from 48 to 329
351
mg/l for surface water and springs, respectively. The sulfate composition is contained in spring water as a result of chemical weathering of some of the sedimentary rocks. All studied samples have sulfate values within permissible limit of JS and WHO Guidelines. The average value of sodium were ranged from 47 to 231 mg/l and from 35 to 299 mg/l for surface water and springs, respectively. Relatively high concentrations may be found in brines and hard water and this explains the positive relation between total hardness (Ca2+ & Mg2+), sodium and EC. All studied samples have sodium values within permissible limit of JS and WHO Guidelines. The average values for potassium were ranged from 6 to 16 mg/l and from 3 to 9 mg/l for surface water and springs, respectively. The high values of potassium could be attributed to the agricultural activities represented by the addition of fertilizers to soils presented in the recharge areas of these springs. The potassium content of natural water is usually less than sodium, calcium and magnesium since, in nature it is adsorbed by clay minerals such as smectite. All studied springs have potassium values within permissible limit of JS and WHO Guidelines. Heavy Metals Bromide is a naturally present constituent in some groundwater and in coastal water due to saltwater intrusion; it contributes to the formation of toxic tap water disinfections by products. It is also a component of crude oil extraction brines and is used in making fumigants, flame proofing agents, dyes and sanitizers. No information on potential health impacts for bromide was identified in standard government and academic sources. The maximum allowable concentration (MAC) of 0.05 mg/l for chromium in drinking water was set based on health considerations. Trivalent chromium, the most common natural state of chromium, is essential in humans and animals for efficient lipid, glucose and protein metabolism. It is considered to be non-toxic. However, if it is present in raw water, it may be oxidized to hexavalent
352
KHARABSHEH & ALATOUM, Curr. World Environ., Vol. 8(3), 341-354 (2013)
chromium during chlorination. Concentrations of total chromium in drinking water are usually well below the MAC. Chromium is not considered a contaminant of concern in the Northwest Territories. Chromium is a metal found in natural deposits as ores containing other elements. The greatest use of chromium is in metal alloys such stainless steel; protective coatings on metal; magnetic taps; and pigments for paints, cement, paper, rubber, composition floor covering and other materials. Its soluble forms are used in wood preservations. The aesthetic objective (AO) for copper in drinking water is 1.0 mg/l. This was set to ensure the water tastes okay and to minimize staining of laundry and plumbing fixtures. Copper is an essential element in human metabolism, and deficiencies result in a variety of clinical disorders, including nutritional anemia in infants. Although large doses of copper may result in adverse health effects, the levels at which this occurs are much higher than the aesthetic objective (AO). Copper occurs in nature as a metal and in minerals. It is reddish metal that occurs naturally in rock, soil, water, sediment and air. Its unique chemical and physical properties have made it one of the most commercially important metals. Since copper is easily shaped or molded, it is commonly used to make pennies, electrical wiring and water pipes. Copper compounds are also used as an agricultural pesticide and to control algae in lakes and reservoirs. It is an essential element for all known living organisms, including humans. However, very large single or long-term intakes of copper may harm the health. The maximum acceptable concentration (MAC) for fluoride in drinking water is 1.5 mg/l. Fluoride-containing compounds are added to drinking water to help prevent dental cavities. Fluoride can occur naturally in surface waters. Groundwater can also contain high concentrations of fluoride due to leaching from rocks. Fluoride can be present in plant and animal tissues. Some communities, such as Yellowknife, add fluoride to the water to help prevent tooth decay. Fluoride is one of many of the earths naturally occurring elements. Fluoride is found in varying amounts of soil, water, plants and most foods and is the 13th most abundant element in the earths crust. Recommended fluoride usage is one of the most effective ways humans can prevent tooth decay.
The primary source of nickel in drinking water is leaching from metals in contact with drinking water, such as pipes and fittings. However, nickel may also present in some groundwater as a consequence of dissolution from nickel ore-bearing rocks. All studied samples have heavy elements within permissible limit of JS and WHO Guidelines. Classification of Hydrochemical Characteristics of Surface Water and Springs Using Piper Diagram The water samples of the studied springs in the study area were plotted on Piper diagram (1944). Piper (1944) found a trilinear diagram that permits the classification of the water according to Langguth (1966) diagram. According to Langguth classification the surface water shows alkaline earth water with increased portion of alkalies and prevailing chloride (Fig. 5). Four types of water were seen in the spring water; alkaline earth water with bicarbonate chloride, alkaline earth water with increased portion of alkalies with prevailing bicarbonate, alkaline earth water with increased portion of alkalies with prevailing chloride and alkaline water with prevailing chloride (Fig. 6). The chemistry of this water is originated from the dissolution of carbonate rocks and evaporates deposits such as Gypsum. The high concentrations of Na+, Cl-, SO4- and NO3- could be attributed to the high probability of water contamination from agricultural activities. The Cl? concentration may be associated with the same source of Na+ (Mazor et al., 1993). The chemistry of these types of water shows the following ionic order: Ca2+ > Na+ > Mg2+ > K+ HCO3- > SO42->Cl- > NO3- > PO4Biological Parameters The coliform group of bacteria is the principal indicator of suitability of water for domestic, industrial or other uses. Coliform group density as a criterion of the degree of pollution and thus of sanitary quality (Sawyer and McCarty, 1978). This group is a natural part of the microbiology of the
KHARABSHEH & ALATOUM, Curr. World Environ., Vol. 8(3), 341-354 (2013) intestinal tract of warm blooded mammals; including man and present in the gut and feces of warm blooded animals generally include organisms capable of producing gas from lactose in a suitable culture medium at 44.5¹0.2°C. It can also be found in soil, other animals, insects, etc. Coliform bacteria are not pathogenic (disease causing) organisms, and are only mildly infectious. For this reason, these bacteria are relatively safe to work with in the laboratory. If large numbers of coliforms are found in water, there is a high probability that other pathogenic bacteria or organisms, such as Giardia and Cryptosporidium, may be present. The total coliform group is relatively easy to culture in the lab, and therefore, has been selected as the primary indicator bacteria for the presence of disease causing organisms (Metcalf and Eddy, 1991). For the detection of bacteria of the Coliform Group, here we use the Multiple-Tube Fermentation procedure as a Most Probable Number (MPN) index. The average values for total coliform were ranged from 79 to 1600 MPN/100 ml and from 1.8 to 1600 MPN/100 ml for surface water and springs, respectively. All studied springs have total coliform values exceed the permissible limit according to JS and WHO Guidelines. According to these values, it is not surprising to find high water contamination with total coliform caused by agricultural drainage to the surface water and springs. Of all contaminants in drinking water, human and animal feces present the greatest danger to public health. E. coli are naturally occurring fecal coliforms found in human and animal intestines. While the strain of E. coli known as E. coli 0157:H7, which contaminated the water in Walkerton, Ontario, is very harmful and potentially deadly, most strains of E. coli are relatively harmless. The reason E.coli is relied on so heavily as a measure is that it is a good indicator of the bacteriological safety of drinking water. It is the only species in the coliform group that is exclusively found in the intestinal tract of humans and other warm-blooded animals and it is excreted in large numbers in feces. If E. coli is found in the water, it
353
means that human or animal faces that can harbour a number of other pathogenic, or disease causing, organisms have contaminated the water. The maximum acceptable concentration (MAC) of E. coli in drinking water is zero. If E. coli is detected in drinking water, a boil water advisory is generally issued right away. According to JS and WHO Guidelines, all samples are classified polluted with E. coli. This is due to the human and agricultural activities surrounding Wadi Mujib and the springs. Water Quality Criteria for different Purposes The water resources criteria deposit the intended water use such as domestic, irrigation and industrial purposes. The suitability of the water quality for domestic and irrigation purposes will be determined below. The suitability of the springs' water for domestic purposes was determined by comparing the constituents' concentrations with drinking water standards of Jordan (2001) and WHO Guidelines (1993). Chemically, there is no problem to use the surface water and springs for domestic purposes after mixing with each other. But, biologically, most of the samples were polluted with total coliform and E. coli, so the water should be treated before using for domestic purposes. Recommendations 1. It is important to plan three protection zones around the recharge areas of springs and the surface water of Wadi Mujib and Mujib dam. This will decrease the dangers of pollutants as follows: a. Protection zone 1: Stop irrigation activities in the first 100 m or as the geomorphic conditions of the area requires. b. Protection zone 2: this zone begins at the boundary of zone 1, it is recommended to have 200-500 m (according to the topography) planted by trees using drip supplemental irrigation systems. c. Protection zone 3: this zone begins at the boundary of zone 2, it is recommended to have 500 m (according to the topography) planted by vegetables and fruits using drip irrigation systems. 2. Encourage the farmers to use drip irrigation system to save more water and decrease
354
KHARABSHEH & ALATOUM, Curr. World Environ., Vol. 8(3), 341-354 (2013) the effects of drainage salt water on the soil surface and springs. This could be applied through establishing a pilot project on drip irrigation systems with the private sector or with NGO's to assure the efficiency of this system in MNR.
ACKNOWLEDGMENT The authors would like to express their thanks to the Royal Society for the Conservation of Nature/ Amman for the support of this research.
REFERENCES 1.
2. 3. 4.
5. 6. 7.
8.
9.
10.
Clesceri, L. S., Greenberg, A. E. and Trussell, R. R. Standard methods for the examination of water and wastewater. Seventeenth Edition, Washington-USA: American Public Health Association, American Water Works Association and Water Pollution Control (2007). Freeze, R. A. and Cherry, J. A. Groundwater. Englewood Cliffs: Prentice-Hall Inc . (1979). Jordanian Drinking Water Standards (JS), No. 286, Amman, Jordan (2001). Jordan Meteorological Department, Annual Report of the Jordan Meteorological Department, Amman, Jordan (2005). JVA Files. Jordan Valley Authority, Amman, Jordan. Kรถlle, W. Wasseranalysen-richtig beurteilt. 315 p, Weinheim: WILEY-VCH Verlag (2003). Langguth, H. R., Grundwasser verhaltisse in Bereich des Velberter Sattels Des Minister for Ernhrung, Landwirtschaft and Forsten. PP 52-127, Dusseldorf: NRW (1966). Margane, A. and Saunna, N., Proposal for a National Guidline for the Delineation of Groundwater Protection Zones, Technical Cooperation Project 'Groundwater Resources Management', Technical Report No. 1, prepared by BGR and MWI, BGR archive no. 0125645, 161 p., Amman (2002). Margane, A. and Hobler. M., Groundwater Resources of Northern Jordan, Vol. 3: Structural Features of the Main Hydrogeological Units in Northern Jordan, Technical Cooperation Project 'Advisory Services to the Water Authority of Jordan', BGR and WAJ, BGR archive no. 118702: 13, 57 p., Amman (1994). Margane, A., Borgstedt, A., Subah, A., Hajali, Th., and Hamdan, I., Delineation of Surface Water Protection Zones for the Mujib Dam,
11.
12.
13.
14.
15.
16.
17.
18. 19.
Technical Cooperation Project 'Groundwater Resources Management', Water Authority of Jordan', BGR and WAJ, BGR archive no. 0126002: 132 p., Amman (2008). Mazor, E., Drever, J. I., Finley, J. and Huntoon, P. W. Hydrochemical implications of groundwater mixing: an Example from the Southern Laramie Basin, Wyoming. Water Resources Research, 29 (1): 193-205 (1993). Metcalf and Eddy. Wastewater Engineering: Treatment, Disposal, Reuse. Third Edition, 127 p, US: McGraw-Hill. (1991). Piper, A. M. A graphic procedure in the geochemical interpretation of water analyses. Trans. Am. Geophys. Union, 25: 914-928 (1944). Samawi, M. and Sabbagh, N. Application of Methods for Analysis of Rainfall Intensity in Areas of Israeli, Jordanian and Palestinian Interest, Jordan Meteorological Department and Ministry of Water and Irrigation, Amman, Jordan (2005). Sawyer, C. N., McCarty, P. L. and Parkin, G. F. Chemistry for Environmental Engineering. Fourth Edition, pp 493-515, US: McGraw-Hill (1978). Stone, N., M. and Thomforde, H., K.. Understanding your fish pond. Water Analysis Report. University of Arkansas at Pine Bluff, USA (1977). Subramania, S. M. Environmental chemistry and analysis. Indian Institute of Technology Madras (1999). Water Authority of Jordan Files (WAJ Files). Water Authority of Jordan, Amman-Jordan. WHO. World Health Organization Guide Lines, Amman, Jordan (1995).
Current World Environment
Vol. 8(3), 355-364 (2013)
Assessment of the Environmental Values of Waste-to-Energy in the Gaza Strip OMAR K. M. OUDA Department of Civil Engineering, Prince Mohamed Bin Fahd University, Al Khobar, Kingdom of Saudi Arabia. http://dx.doi.org/10.12944/CWE.8.3.03 (Received: October 26, 2013; Accepted: November 17, 2013) ABSTRACT The Gaza Strip faces a chronic solid waste (SW) management and electricity shortage problem as a result of fifty years of political instability in the area coupled with a high population growth rate, an unhealthy economic condition, and limited land and energy resources. The option to develop a waste to energy (WTE) facility to manage SW and to alleviate the electricity shortage has not been previously investigated for the Gaza Strip. This paper assesses the potential environmental and economic benefit of a WTE facility on the context of two scenarios: Mass Burn and Mass Burn with Recycling up to the year 2035. The analysis shows a potential to generate approximately 77.1 Megawatts (MW) of electricity based on a Mass Burn scenario and approximately 4.7 MW of electricity based on a Mass Burn with Recycling scenario. These values are approximately 10.3% and 0.63% respectively of the projected peak electricity demand of 751 MW in 2035. The research identifies the potentially significant environmental benefit of developing WTE facilities within the Gaza Strip. The Mass Burn with Recycling scenario shows a potential greenhouse gases emission reduction of approximately 92 thousand metric tons carbon equivalent (MTCE) per year, and landfill area savings of about 94 % in comparison to complete landfilling in 2035. Further investigation is recommended to evaluate the socio-economic impacts and technical feasibility of the development of WTE facilities for the Gaza Strip.
Key words: Gaza Strip, Waste-to-Energy, Solid Waste, Greenhouse Gases, Landfill.
INTRODUCTION The Gaza Strip is located in the Middle East bounded by the Mediterranean Sea to the West, Egypt to the South and Israel to the North and West, and has a total area of 365 km2. It is 45 km in length and 5 to 7 km in width in the north to a maximum of 12 km in width in the South as, as shown in Fig 11. The Gaza Strip's population was about 1.65 million in 2010 with a population density of about 4,520 capita per square kilometer, which is the highest population density in the world2, 3. Three decades (1967 to 1994) of Israeli military occupation and two decades of political instability have caused a complete deterioration of the solid waste (SW) and electricity system infrastructure in the Gaza Strip4. The electricity peak demand was approximately 360 MW in 2012 which was partially supplied
through the following three resources: the Gaza Power Plant (GPP) providing about 100 MW, 120 MW purchased from Israel and 22 MW purchased from Egypt6,7. The deficit between electricity demand and supply causes eight to twelve hours of scheduled power outages per day. These disruptions have caused great hardships to human life, including the proper functioning of education and health institutions, and the operation of water and sewage systems. Power outages also hinder the economy, especially businesses in the industrial and agricultural sectors7. The SW management system in the Gaza Strip is simple and includes the collection of refuse and disposing of it in open landfill sites or open dumpsites. There are three open landfills and dumping sites in the Gaza Strip. These facilities
356
OUDA , Curr. World Environ., Vol. 8(3), 355-364 (2013)
are overloaded and have exceeded their storage capacities. SW generation was estimated to range from 0.4 to 0.6 kg/capita/day in rural areas and refugee camps, and 0.9 to 1.2 kg/capita/day in cities4, 8. This situation caused serious public health and environmental problems, specifically to groundwater aquifers, which are already in poor condition 4 . The shor tage of available land resources to construct new landfills, and limited energy sources coupled with high population growth has resulted in extra stress to the SW management and to electricity systems in the Gaza Strip. The option to develop WTE facilities to manage the solid waste problem and to alleviate the electricity shortage has not been previously investigated in the Gaza Strip. This research aims to assess the potential environmental and economic benefit of developing waste to energy (WTE) facilities in the Gaza Strip on the context of two scenarios: Mass Burn and Mass Burn with Recycling up to the year 2035. The research reviews SW management and the electricity demand vs. supply in the Gaza Strip; estimates the potential contribution from waste-to-energy facilities to electricity peak demand in the Gaza Strip, and calculates the greenhouse gases emission reduction and landfill area saving for the two scenarios. Municipal Solid Waste Sector The current main issues with SW management are identification and selection of the most appropriate SW treatment technologies and disposal methods in selected areas22. In developing countries, the issues are additional complicated due to poor SW management and limited financial and technical resources. SW management in the Gaza Strip is in a state of disarray due to years of occupation and undesirable economic conditions. Municipalities handle SW in urban and rural areas while United Nations (UN) manages SW collection and disposal associated with the eight refugee camps in the Gaza Strip. Most of SW is collected by temporary workers using donkey carts and push carts4. The Gaza Strip's SW composition includes 60.8% organic materials, 16.1% plastics, 8.4% paper, 3.8% textile, 2.3% glass, 2.8% metals, 0.8% wood, and 5% other 10 . The Gaza Strip's municipalities utilize open dumpsites within the city boundaries as transfer stations which pose a direct
risk to soil and groundwater quality in the area. For example, Gaza City municipality uses around 150 donkey carts for waste collection. The collected waste is shipped to open transfer sites within the city boundary. From this point, approximately 20 vehicles transport the waste to the Jahr El Deek landfill located south of Gaza City10. Currently there are three landfills in Gaza Strip: Jahr El Deek, Deir El Balah, and Rafah. The three landfills are currently exceeding their maximum storage capacities10. The Jahr El Deek Landfill serves Gaza City and Northern Gaza communities. It is located southeast of Gaza City and contains about 3 million tons of waste so far, and does not have any environmental protection measures such as liner systems or leachate control. Deir El Balah's landfill is located east of Deir El Balah City and serves the Central Gaza Strip communities. It has been constructed as a sanitary landfill with support from the German government and contains about 300 thousand tons of waste as of 2012. Rafah Landfill is located east of Rafah City and serves the Southern Gaza Strip communities. Its design does not incorporate any environmental protection measures and contains about 1.6 million tons of waste as of 201210. The municipalities collect the waste collection fees from households and companies. The SW sector has been supported by foreign donors since 1994. The total grants provided since 1994 was about 72 million Euros for the West Bank and Gaza Strip. Most of the grants were spent on infrastructure projects for waste collection, transport, disposal, and capacity development10. The private sector runs SW recycling systems for valuable materials such as plastic and metals. Most of valuable materials are recovered from the waste streams prior arrival to the landfills. Plastic materials are recycled at four plastic factories in the Gaza strip where plastic materials are used to produce plastic bags and pipes. Metals are segregated from the waste stream and exported to Israel10. The recycling system is not regulated and is solely implemented by the private sector without any governmental involvement and is driven by the recycled materials' high financial value. There are a few waste composting initiatives in the Gaza Strip including a pilot project in Rafah City, south of Gaza Strip, established by the Palestinian Friends Society, an Non Government Organization (NGO), and another small pilot project at Beit Lahia north of the Gaza
OUDA , Curr. World Environ., Vol. 8(3), 355-364 (2013) Strip financed by CRIC, which is an Italian NGO and managed by United Nations Development Program10. The high population growth rate and the population density in the Gaza Strip has added significant pressure on Gaza's land resources which has limited land availability for new landfills or expansion of the existing landfills. Electricity Sector The Gaza Strip has been completely dependent on Israel for its electricity supply since 1967. Following the establishment of the Palestinian National Authority (PNA) in 1994; the first attempt towards electricity independency and selfsufficiency was taken through the establishment of the Palestinian Electricity Company (PEC) and the construction of the Gaza Power Plant (GPP) which was completed in 20029. The GPP has a production capacity of 140 MW and it operates on industrial diesel fuel. Industrial diesel is imported from Israel and the PEC is completely dependent on Israel for the transfer of the spare parts required for operation of the power plant that is supplied from Israeli or foreign companies7. The political instability of the area and Israeli control of diesel and the spare parts supply have limited the production efficiency and supply capacity of the GPP. Recently a marine offshore gas field has been discovered off the shores of Gaza, which has the potential to supply all the energy demand of the Gaza Strip5,6. The field has never been developed due to political instability in the area. PNA is planning to increase the diversity of its electricity resources through the utilization of renewable energy sources, such as solar, wind, biomass and Waste to Energy, to meet its future energy demands. Currently renewable resources provide about 18% of total energy consumption in Palestine, mainly solar energy9. The review of the Gaza Strip's electricity system and the SW service shows that the existing landfills have exceeded their capacities and electricity shortage is a chronic problem. These issues are expected to get worse with time due to a high population growth rate in the Gaza Strip with an average of 3.25% in the last two decades, which will result in substantial increases in electricity demand and SW generation. Available options to generate electricity to reduce the gap between electricity demand and supply are very limited as a
357
result of the current political situation and limited fuel sources. Sanitary landfilling is an expensive option due to the land resource limitations in the Gaza Strip resulting from a high population growth rate and density. Waste to energy systems can reduce the amount of SW deposited in landfill sites by up to 90% depending upon material composition and degree of recovery11, which in turn can reduce the area required for landfilling by about 90%. Research Mothodology Two scenarios were developed to assess the potential contribution of WTE facilities to meeting the total electricity demand in the Gaza Strip up to the year 2035: Mass Burn and Mass Burn with Recycling. The Mass Burn scenario implies full utilization of SW for WTE production. Mass Burn with Recycling assumes removal of recyclable materials from the waste stream and utilizing the remaining SW for WTE production. The year 2012 was chosen as the starting year for forecasting. The MSW production rate was assumed to be 0.9 kg/capita/day for the forecasted period. The SW contents were considered as per UNDP-PAPP 2012, mentioned in Section 1. The caloric energy content of the various types of waste is presented in Table 1 12, 13. These values were used to calculate the total energy content per kilogram of the Gaza Strip's SW for the two scenarios. There are a number of developed and emerging technologies that are able to produce energy from waste, however the most widely proven and used WTE technology is the process of producing energy in the form of heat and/or electricity from waste sources via combustion14, 15,16. Research literature has identified a combustion efficiency of 25% to 30% for existing WTE facilities in different places across the globe 18,19 . A combustion efficiency of 25% will be assumed in calculating the WTE for the Gaza Strip. Greenhouse gases emission reduction for the two scenarios was calculated following US EPA methodologies as reported in US EPA 2006. Greenhouse gases emission reduction compared to landfilling for recycling and combustion in Metric Ton Carbon Equivalent per ton of materials (MTCE/ ton) are presented in Table 2. These values were used to calculate the greenhouse gases emission reduction per ton of Gazaâ&#x20AC;&#x2122;s SW for the two scenarios
358
OUDA , Curr. World Environ., Vol. 8(3), 355-364 (2013)
up to year 2035. Sizing of the landfill area requires estimates of the rate at which wastes are discarded at and the density of these wastes within the landfill. The SW density in a landfall ranges from 500 kg/ m3 to 700 kg/m3, with a reasonable average estimate of about 600 kg/m313. WTE reduces the amount of SW deposited at landfill sites by 90% on terms of volume reduction and 80% in terms of mass11, 13,17. Incineration also minimizes leachate and methane formation and odor emissions11. The thickness of the landfill is typically in the order of 3 m depth13. Using these values, the area landfill area requirements were calculated for the two WTE scenarios. RESULTS AND DISCUSSIONS The Gaza Stripâ&#x20AC;&#x2122;s population was about 1.65 million in 2010 and had an average historical growth rate ranging from 3.0% to 3.5% for the last two decades2,3, and a population density of about 4,520 capita per square kilometer. The population is expected to continue growing at this rate given the cultural norms of Palestinian reproductive behavior and the social and religious culture of the area. The forecasted population in the Gaza Strip based on growth rate of 3.25% up to the year 2035 is presented in Fig 2. In 2035, the population of the Gaza Strip is expected to reach 3.4 million which is about twice the 2010 population of about 1.65 million. The 2012 electricity peak demand in Gaza Strip was as high as360 MW for a population of1.65 million. The electricity peak demand was forecasted up to the year 2035 based on projected population growth and the per capita electricity demand. The electricity peak demand in Gaza strip is expected to reach 550 MW and 750 MW by the years 2020 and 2035; respectively, as shown in Fig 3. It should be noted that the population and electricity peak forecast results are in general agreement with the UN estimate as presented in the UN report titled: Gaza in 2020 A livable place6. SW Generation Forecast Results The forecasted increase of the Gaza Stripâ&#x20AC;&#x2122;s population is substantial, and will come with huge increases in the quantity of generated SW.
The forecasted annual generation of SW up to year 2035 is presented in Fig 4. The 2010 SW quantity was approximately 505 thousand tons and is estimated to reach about 1.124 million tons in 2035. This is a substantial amount of SW and should be managed wisely. Taking into consideration that the existing landfills in the Gaza Strip have already exceeded their capacity and the limited land resources in the area, management of the MSW following the current practices will result in huge environment and financial consequences. The MSW generated in the Gaza Strip contains many valuable materials such as paper, plastics, metals, glass and textile products that can be sold at attractive market prices. Recycling is already practiced in the Gaza Strip on a wide scale, where most plastics and metals are recycled as discussed in Section 1.1. The forecast to 2035 for the potential amount of recyclable materials is presented in Figure 5. The values on the figure below show a huge potential for recycling in the Gaza Strip. The current recycling practices are not regulated and are conducted by the private sector mainly. Recycled materials are typically removed from the waste stream at source. The high potential for recyclable materials warrants further investigation in order to assess the value of developing a materials recovery facility in the Gaza Strip. The decision to recycle these materials or to mass burn them will require further investigation to determine the financial and environmental merits and disadvantages of both approaches. WTE Energy Production Forecast Results The energy content of Gaza Strip MSW was calculated based on the caloric content of SW materials (Table 1), and the SW composition as presented in Section 2. Table 3 shows the energy contents of different materials in kW per kilogram (kg) of MSW. Two sets of values of the energy content per kg of SW were calculated for the Mass Burn scenario and Mass Burn with Recycling scenario, and found to be 2.41 kWh/Kg and 0.43 kWh/Kg respectively. The large difference between the energy content of the two scenarios was a result of removing the materials that have high energy contents (plastic, paper, wood, and textiles) from the Mass Burn scenario and considering them for recycling purposes.
OUDA , Curr. World Environ., Vol. 8(3), 355-364 (2013) The electricity production potential for the two scenarios is presented in Figure 6. The Mass Burn with recycling scenario results shows a potential to produce about 4.7 Megawatt (MW) of electricity from SW by the year 2035. This value forms about 0.63% of the estimated 751 MW peak electricity demand in 2035. The Mass Burn scenario shows the potential to produce about 77.1MW of electricity from SW by the year 2035, which is about 10.3% of the 751MW peak demand in 2035. Environmental Values Landfills are major source of greenhouse gases, which contribute about 3.4% to 3.9% of
Fig 1:The Gaza Strip Location Map12
359
global greenhouse gases emissions21. During SW decomposition, large quantities of methane and carbon dioxide are produced, and released into the atmosphere. Methane is 21 times more detrimental as greenhouse gases than is carbon dioxide19, 21. The potential reduction in greenhouse gasses for processing of waste using the Mass Burn with Recycling and Mass Burn scenarios in comparison to landfilling were calculated. The calculations were completed under the consideration of the net greenhouse gases reduction potential for the various components of SW as presented in Table 2 and the Gazaâ&#x20AC;&#x2122;s SW composition. Table 4 presents the greenhouse gases reduction per ton of Gazaâ&#x20AC;&#x2122;s SW. Two values of the greenhouse gases reductions per ton of SW were calculated for the Mass Burn with Recycling scenario and Mass Burn scenario. The results show the potential to reduce greenhouse gases emissions based on Mass Burn with recycling scenario of about 0.34 MTCE per ton of SW material and about 0.08 MTCE per ton of SW materials based on Mass Burn scenario. The greenhouse gases reduction potential in comparison to landfilling for the two scenarios is presented in Fig 7. Fig 7 shows that applying a comprehensive recycling program as part of Mass Burn with Recycling scenario will ultimately result in a reduction of greenhouses gases emission of about 93 thousand MTCE in 2035. The Figure also shows that Mass Burn scenario will ultimately reduce greenhouse gasses by about 32 thousand MTCE in comparison to projected landfill emissions in 2035. The
Fig 2: Gaza Strip Population Forecast Results
360
OUDA , Curr. World Environ., Vol. 8(3), 355-364 (2013)
Fig 3: Gaza Strip Peak Electricity Demand Forecast Results.
Fig 4: The Gaza Strip MSW Generation Forecast Results
Fig 5: MSW Recycled Materials Forecast Results.
OUDA , Curr. World Environ., Vol. 8(3), 355-364 (2013)
Fig 6: Electricity Production potential for the two Scenarios.
Fig 7:Greenhouse gases emission reduction potential for the two scenarios.
Fig 8: Landfill area requirements complete landfilling and for the two scenarios.
361
362
OUDA , Curr. World Environ., Vol. 8(3), 355-364 (2013)
greenhouse gases emission reductions in Mass Burn scenario is primarily due to the thermal conversion of the landfill methane gas to carbon dioxide through incantation. Methane is 21 times more detrimental than carbon dioxide from the global warming perspective19 The potential land saving in comparison to landfilling for Mass Burn with Recycling and Mass Burn scenarios was calculated up to the year 2035 and presented in Fig 8. The figure shows a need for about 22.5 hectare (ha) per year of landfill area for complete landfilling of SW in 2035. This will add a tremendous pressure on Gazaâ&#x20AC;&#x2122;s limited land resources. The implementation of Mass Burn scenario will reduce the landfill area requirement to about 2.2 ha while the Mass Burn with Recycling scenario will reduce yjr landfill area requirement to about 1.4 ha in 2035. In a region like the Gaza Strip, where land resources are very limited, reduction in the area of land needed for landfilling is extremely important. Conclusion and Recommendations The Gaza Strip faces both a serious electricity shortage and SW management problems as a result of thirty years of military occupation and 20 years of political instability coupled a high population growth rate and an unhealthy economic condition. Currently, 28% of Gazaâ&#x20AC;&#x2122;s electricity demand is supplied by the GPP plant, with the gap between electricity supply and demand being Table1: Energy content of different types of wastes12,13. Type of waste
Mixed Paper Mixed Food Waste Mixed Green Yard Waste Mixed Plastic Rubber Leather Textiles Demolition Softwood Waste Hardwood Coal Fuel, Oil Natural Gas
Energy Content (Btu/lb) 6800 2400 2700 14000 11200 8000 8100 7300 6500 12300 18300 23700
partially bridged by imported electricity from the neighboring countries. The MSW system is in poor condition resulting from 50 years of neglect and poor management. The option to develop a WTE facility to manage the solid waste problem and to alleviate the electricity shortage has not been previously investigated for the Gaza Strip. This research aims to assess the potential environmental values of waste to energy (WTE) facility in the Gaza Strip considering two scenarios: Mass Burn and Mass Burn with Recycling up to the year 2035. The potential electrical power contributions to the Gaza Strip were assessed by conducting a quantitative forecast analysis of potential WTE electricity production up to the year 2035 for two scenarios: Mass Burn and Mass Burn with Recycling. The Mass Burn with Recycling scenario analysis shows a potential power production of about 4.7 Megawatt (MW) of electricity from MSW in 2035. The Mass Burn scenario results show potential production of 77.1 MW, which results in about 10.3% of the electricity peak demand projected in 2035. There is a substantial difference between the potential electricity productions of the two scenarios as the Mass burn scenario can produce 16 times more power than the Mass Burn with recycling scenario. The results also suggest that there is a significant potential environmental benefit to the Gaza Strip from a WTE facility. An analysis of the potential reduction in greenhouse gases emission shows a potential emission reduction of 32 thousand MTCE per year and 92 thousand MTCE per year for the Mass Burn scenario and Mass Burn with Recycling scenario; respectively, in comparison to the landfilling option to 2035. Furthermore, the landfill area saving for Table 2: Net greenhouse emission reduction in MTCE per ton of material20
Materials
Paper Plastic Glass Wood Textiles Organic Others (Mixed MSW)
Recycling versus Landfilling
Combustion versus Landfilling
1.01 0.41 0.50 0.54 1.97 0.12 0.60
0.34 -0.26 0.43 0.08 0.10 0.12 0.18
OUDA , Curr. World Environ., Vol. 8(3), 355-364 (2013)
363
Table 3: Gaza Strip's MSW Energy Contents.
Material
Waste Composition %
Energy Content (Btu/lb)
kWh/Kg in Material
kWh/Kg in Waste HHV
Paper Plastic Glass Wood Textiles Organic Others
8.4 16.1 2.3 0.8 3.8 60.8 5.0
6800 14000 0 7300 8100 2400 5200
4.39 9.05 0.00 4.73 5.20 1.55 3.36
0.35 1.43 0.00 0.03 0.17 0.28 0.15
Total Energy for Mass Burn with Recycling scenario (kWh/kg) Total Energy contents of Mass Burn scenario (kWh/kg)
0.43 2.41
Table 4: Net greenhouse gases reduction in MTCE per ton of SW material for the two scenarios. Materials
Paper Plastic Glass Wood Textiles Organic Others TOTAL (MTCE/ton of SW
Waste Composition %
Mass Burn with Recycling (MTCE/ton of SW)
Mass Burn (MTCE/ton of MSW)
8.4 16.1 2.3 0.8 3.8 60.8 7.8
0.08 0.07 0.01 0.00 0.07 0.07 0.03 0.34
0.03 -0.04 0.01 0.00 0.00 0.07 0.01 0.08
Mass Burn and Mass Burn with Recycling scenario is about 90 % and 94 % respectively in comparison to landfilling. Further investigations are recommended to compare the two scenarios with respect to financial, social, and technical criteria. Further site specific environmental studies should also be conducted including the potential impacts
on groundwater and soil from the current practice of landfilling. The socio-economic studies should consider WTE production costs, recycling values, job creation, and human capacity-building opportunities. The technical studies should be focused on determining optimum WTE technologies to be implemented in the Gaza Strip.
REFERENCES 1.
2.
Ouda O. K., Optimization of Agricultural Water Use: A Decision Support System for the Gaza Strip, Institute of Hydraulic Engineering, Stuttgart University, pp.150 (2003). PCBS Palestinian Central Bureau of Statistics, Population in the Palestinian territory 1997-202. Ramallah, Palestine
3.
(1999). PCBS Palestinian Central Bureau of Statistics, On the Eve of the International Population Day 11/07/2012, (2011). Available online at http://www.pcbs.gov.ps/ Por tals/_pcbs/PressRelease/ int_Pop_2012e.pdf. Accessed on May 15th,
364
4.
5.
6.
7.
8.
9.
10.
11.
12.
13.
OUDA , Curr. World Environ., Vol. 8(3), 355-364 (2013) 2013. El Baba , M. Y.; De Smedt, F., Solid Waste Management and Practices in Gaza Strip (Palestine). 6th International Perspective on Water Resources & Environment. Izmir, Turkey (2013). UN, the Humanitarian Impact of Gazaâ&#x20AC;&#x2122;s Electricity and Fuel Crisis. United Nations, Office for the Coordination of Humanitarian Affairs (2012a). UN, Gaza in 2020 A livable Place?, A report by the United nations Country Team in the occupied Palestinian territory (2012b). Gisha, Electricity Shortage in Gaza: Who turned Out the Lights? Position Paper, GishaLegal Centre for Freedom of Movement (2010). Al Hmaidi, M., The development of a strategic waste management plan for Palestine, Review of the current situation: handling, transportation and disposal of waste, Negotiations Support Unit. Negotiations Affairs Department. Palestine (2002). PNA, Energy Sector Strategy, Palestinian National Plan 2011-2013. Palestinian National Authority, Ramallah, Palestine (2011). UNDP-PAPP, Final report for Feasibility Study and Detailed Design for Waste Management in the Gaza Strip, UNDP-PAPP, DHV ENFRA TECC (2012) Young, G. C., Municipal Solid Waste to Energy Conversion Processes: Economic, Technical, and Renewable Comparisons, first ed., John Wiley, Hoboken, New Jersey (2010). Ouda, O. K. M.; Cekirge, H. M.; Raza, S. A., An assessment of the potential contribution from waste-to-energy facilities to electricity demand in Saudi Arabia. Energy Conversion and Management, 75 402â&#x20AC;&#x201C;406. (2013). Gilbert, M.M.; Wendell, P.E., Introduction to Environmental Engineering and Science, Chapter 9: Solid Waste Management and Resource Recovery, Third Edition, Pearson
14.
15.
16.
17. 18.
19.
20.
21.
22.
Education Inc. ISBN-13: 978-0-13-2339346 (2008). UNEP, United Nations Environmental Program, International Source Book on Environmentally Sound Technologies for Municipal Solid Waste Management. Osaka/ Shiga (1996). ASME American Society of Mechanical Engineers, Waste-to-Energy: A renewable Energy Source from Municipal Solid Wastes, White paper submitted to the Congress (2008). Cheng, H.; Hu,Y., Review Municipal solid waste (MSW) as a renewable source of energy: Current and future practices in China, Bioresource Technology, 101, 38163824. (2010). Rogoff, M. J.; Screve, F., Waste to Energy, second ed., Elsevier, New York (2011). Kathirvale ,S.; Yunus, M. N. M.; Sopian , K.; Samsuddin, A. H., Energy potential from municipal solid waste in Malaysia. Renewable Energy, 29, 559-567 (2003). Psomopoulos,C. S.; Bourka, A.; Themelis, N. J., Waste-to-energy: A review of the status and benefits in USA, Waste Management, 29, 1718-1724 (2009). US EPA, Solid Waste Management and Greenhouse Gases, A life-Cycle Assessment of Emission and Sinks. 3rd ed., Washington, US, (2006). Al Ansari M.S, Improving Solid Waste Management in Gulf Co-operation Council States: Developing Integrated Plans to Achieve Reduction in Greenhouse Gases, Modern Applied Science, 6(2), (2012), Doi:10.5539/mas.v6n6p60. Abu Samah M. A.; Abd Manaf L.; Aris A.Z.; Sulaiman W.N.A., Solid Waste Management: Analytical Hierarchy Process (AHP) Ppplication of Selecting Treatment Technology in Sepang Municipal Council, Malaysia , Current World Environment , 6(1), 1-16 (2011)
Current World Environment
Vol. 8(3), 365-374 (2013)
Impact of Over- Pumping on the Groundwater Quality of the Dead Sea Basin/ Jordan MAJEDA MB. AL-HADIDI1, ATEF A. AL KHARABSHEH1 and RAKAD A. TA'ANY1 1
Department of Water Resources and Environmental Management, Faculty of Agricultural Technology, Al-Balqa' Applied University, As Salt19117Jordan. http://dx.doi.org/10.12944/CWE.8.3.04 (Received: October 07, 2013; Accepted: November 05, 2013) ABSTRACT This study deals with the water quality evaluation of the groundwater resources in the Dead Sea basin in Jordan. The study area is located in central part of Jordan and covers an area of about 6874 km2. The importance of this study is to identify the different environmental conditions associated with the increase of population, depletion of groundwater and irrigation activities. The main objective of this study is to investigate the impact of over-pumping on the groundwater quality of the Dead Sea Basin. The total abstraction from the basin in 2011 was 81.1 MCM while the safe yield is 57 MCM, with an over-pumping rate of 142 % of safe yield.Five hundred water samples of 180 groundwater wells from different locationswere collected and analyzedfor their physical and chemical properties. The analyzed water samples weresubject to cluster analysis using SPSS software. The results showed that, there are two types of groundwater were concluded according to Langguth; Alkaline earth waters with increased portion of alkalis and prevailing chloride characterized the first type. About 90% of the groundwater samples fall within this type. The percentage of earth alkaline ions is higher than that of the bicarbonate. The chemistry of the first type shows the flowing ionic order:Ca+2<Mg+2<Na+ andCa+2< HCO3-. The second type was characterized by alkaline water with prevailing chloride. This type represents about 10% of the total water samples in the Dead Sea basin, with ionic ratio as: Ca+2<Mg+2<Na+ and (Ca+2 +Mg+2)< (HCO3-+SO4-2). Few samples slightly exceeded the level of chloride (300 mg/l). Three clusters were determined and the whole were classified as very hard based on hardness. According to the USA Salinity Diagram, two clusters were determined, the first and second clusters were classified as high salinity hazard with low sodium hazard (C3-S1) and the third one is classified as very high salinity hazard with low sodium hazard (C4-S1). That means these are not suitable for irrigation purposes.
Key words : Ground water, Irrigation, Salinity Hazard, Dead Sea basin.
INTRODUCTION The gravest environmental challenge that Jordan faces today is the scarcity of water. Indeed, water is the decisive factor in the population/ resources equation. Whereas water resources in Jordan have fluctuated around a stationary average, the country's population has continued to rise. A high rate of natural population growth, combined with periodic massive influxes of refugees, has transformed a comfortable balance between population and water in the first half of this century into a chronic and worsening imbalance
in the second half. The situation has been exacerbated by the fact that Jordan shares most of its surface water resources with neighboring countries, whose control has partially deprived Jordan of its fair share of water. Current use already exceeds renewable supply. The deficit is covered by the unsustainable practice of overdrawing highland aquifers, resulting in lowered water tables and declining water quality. Jordan has a climate ranging from Mediterranean to Arid with approximately 80 % of the country receiving less than 100mm of rainfall
366
AL-HADIDI et al., Curr. World Environ., Vol. 8(3), 365-374 (2013)
annually. Evaporation ranges from around 2000 mm / year at the north west of the country to more than 5000 mm / year in Ma'an in the south. The renewable freshwater resources are of the order of 750-850 million cubic meters (MCM) with approximately 65 % derived from surface water and 35 % from groundwater sources. Current demands for water are of the order of 955 MCM,1. Attempts to investigate the effect of over-pumping on the groundwater quality in the Dead Sea basin, it would highlight the actual status and quality of water in the basin. Also to help the decision-makers to manage and planning for future policies of the basin. Therefore, that it maintains the sustainability of water resources for future generations andreduce the risk resulting from possible deterioration of water quality that may have resulted from over-pumping. MATERIALS AND METHODS Description of the Study Area Dead Sea Basin is located in the central part of Jordan and covers an area of about 6874 km2 2 . The basin lies between coordinates 187664.679 and 256455.773 E and 997532.173 and 1147942.807 N (according to Palestine Belt). Jordan valley, Jordan side valleys and AmmanZarqa basin from the north, Jafer basin from the south, Azraq basin from the east, bound the basin. The major cities situated in the basin are Madaba, Karak and Tafila, Fig 1. Most of the population in the basin area concentrated at the south of the capital. The population activity has been increased in these areas over the past decade, which led to overpumping of groundwater to meet water demand in addition to extensive agricultural activities, which deteriorate the groundwater quality in the basin and reflected negatively on the environmental situation and per capita share of water. The area is affected by the Dead Sea transform system, with elevation ranging from 1260 above the mean sea level(msl) in the northern and southern part of the study area to about 180 (msl) near the Dead Sea. Three main topography features are found in the study area, the plateau feature, highlands toes in the far eastern part, and steep slopes and sharply elevation in the highlands along the Dead Sea escarpment,3. There are several wadis running along the study area, these are Wadi
Mujib, Wadi Heedan, Wadi Hasa, Wadi Issal, Wadi Numera, Wadi Ibn Hammad, and Wadi Zarqa Main. The surface water flows westward to the Dead Sea in the lower aquifer, and discharges as thermal water in Zarqa main. The agricultural activities in the study area is affected by climate, topography, soil lesser extent, and availability of supplementary moisture supply, in the recent decades. Many agricultural activities had been developed in the area. Climate The study area lies within the bioclimatic region; its climate is characterized as semi-arid to arid. A high topographical gradient towards the Dead Sea occurred in the study area combined with a high relief, which effect the climatic parameter distribution specially rainfall in the area.The absolute daily temperature ranges from 42ยบ C in May to around -2ยบ C in January, average annual wind velocity range from 6 - 8 km/hr, the maximum sunshine hours 14 hr/day with minimum of 5 hr /day in winter and the dry bulb temperature is 33ยบ C4. Geological Setting The geology of the Dead Sea Basin is affected by a Graben structure formed by subsidence accompanied by block faulting. It is located within the rift valley that accompanies the Dead Sea transform, the basin was formed due to left-lateral displacement along the segmented Dead Sea transform5. Also it contains a thick accumulation of sedimentary rocks of more than 8000 m thickness, the rock formation in the eastern part of the Dead Sea ranges in ages from Cambrian to lower tertiary, Fig 2. A subsidence accompanied by block faulting, formed the Dead Sea Basin Graben structure. A horizontal displacement approximately 107 km left lateral strike-slip occurred along the Dead Sea rift during the formation of the Dead SeaJordan Valley rift, several tectonic Graben structures were formed along N-S, NW-SE and NE-SW, three trends fault trends were recognized in the study area Fig 2.2. The E-W trending faults are normal to the graben faults, they are noticeable on the eastern block, the E-W trending faults were construct as normal faults then they activated as strike-slip faults5. Precipitation Precipitation is the main source of
AL-HADIDI et al., Curr. World Environ., Vol. 8(3), 365-374 (2013) groundwater recharge in the Dead sea basin. Precipitation occurs mostly in winter months (October â&#x20AC;&#x201C; mid May) with a maximum appears during December to February and a minimum precipitation in October and May. The mean annual rainfall varies from on area to another, it ranges from 345 mm in Mushaqqar area in the extreme north, near Amman, decreasing to less than52 mm in the western part along the Dead Sea coast (GhorSafi area), the rainfall decreases rapidly from highlands towards the west, when moving from north to west, temperatures increased, amounts of rainfall decrease, and evaporation increased. Mushaqqar station has the highest amount with 345 mm and Ghor-Safi is the lowest4. The analysis of precipitation, showed that 90% of the mean annual rainfall occurs in winter, whereas only 10% occurs in spring and summer, Fig 3. Hydrogeology Six aquifer complexes are distinguished in Dead Sea Basin from top to bottom, (WAJ, 2012): Amman - Wadi Sir (B2/A7) aquifer, Hummar (A4) aquifer, Naur Aquifer (A2) aquifer, Kurnub (K) Sandstone aquifer, Zarqa (Z) group aquifer and Rum group (Disi) aquifer. Groundwater resources within the Dead Sea Basin are found in two different aquifer complexes as shown in Table 1, the upper limestone aquifer complex and the lower sandstone aquifer complex, these two aquifers are separated from each other by a major aquitard6. Methodolgy Five hundred water samples of 180 groundwater wells from different locations (Heidan, Swaqa, Lajjoun, Qatraneh, Qastal and Wala) were collected and analyzed for their physical and chemical properties.The water samples were preserved and analyzed in the laboratory of the Department of Water Resources and Environmental Managements at the Faculty of Agricultural Technology of Al-Balqaâ&#x20AC;&#x2122; Applied University, for Physical parameters such as pH, electrical conductivity EC and chemical parameters such as calcium Ca +2 , magnesium Mg + , sodium Na + , potassium K+, chloride Cl-, nitrate NO3-, carbonate CO3- bicarbonate HCO3-2, and sulfate SO4-2.Results of chemical analysis of selected wells are shown in appendices2. The analytical techniques were performed according to standard method for the
367
examination of water and wastewater7. In addition to the analyzed water samples, historical data were collected from open files of the Ministry of Water and Irrigation(MWI) and were determined in this study. Classification of the analyzed groundwater samples of the Dead Sea Basin was done according to8. Each water sample was plotted on9, Fig 1.The classification of Langguth is based on the measured concentration of the four major cations (sodium, potassium, magnesium and calcium) and the four major anions (bicarbonate, sulphate, chloride and nitrate).The samples were plotted on Trilinear diagram. The suitability of the groundwater for domestic purposes was determined by comparing the constituent with the Jordan and World Health Organization (WHO) Standards for drinking water. While the suitability of groundwater for irrigation purposes in the study area were determined using 11 diagram. The analyzed water samples weresubject to cluster analysis using SPSS software. RESULTS AND DISCUSSIONS It was believed that water quality would be the worst during the summer. The reason for this was that summer is the peak travel season12. This can result in more pollutants, such as increased carbon dioxide emissions. When it rains, this pollution is brought down from the atmosphere in the precipitation and is washed into storm drains, which empty into streams and lakes. Water near farms and places where animals are kept may have a lowered water quality. Pesticides, fertilizer, and manure would be washed into the water by rain. Pesticides contain chemicals that could be detrimental to the health of the local wildlife. Fertilizers and manures contain increased amounts of nitrates, phosphates, ammonia, and other chemicals. When fertilizers and manures enter streams, they increase the levels of these elements in the water, making the water quality worse. Water quality damage is blamed partly on the growth of the Jordan population and urban expansion in general and in the Dead sea in par ticular.which is reflected by the severe
368
AL-HADIDI et al., Curr. World Environ., Vol. 8(3), 365-374 (2013)
abstraction from the groundwater aquifers of the Dead sea basin. Water used for irrigation can vary greatly in quality depending upon type and quantity of dissolved salts. Salts are present in irrigation water in relatively small but significant amounts. They originate from dissolution or weathering of the rocks and soil, including dissolution of lime, gypsum and other slowly dissolved soil minerals. These salts are carried with the water to wherever it is used. Physical Parameters The chemical analysis data of101 water samples were subjected to descriptive statistical analysis tests, the resultsare presented in Table 2, descriptive statistical analysis was carried out using SPSS 16.0 and Microsoft Excel software by combining the historical data with the recent analyzed data.
The physical measurements of the groundwater samples showed that, the average electrical conductivity (EC) values range between 983 and 1430 ĂŹS/cm. All wells drilled in Wala area have the highest EC, while the EC wells of Swaqa area have the lowest values of EC.Low mineralization indicates that the weathered zone has been highly leached of soluble minerals or groundwater is likely derived from relatively recent direct recharge.A higher evaporation rate in the central and southern parts of the area, frequent occurrences of caliches, and salt accumulation in the soils further reduce potential for fresh rainwater infiltration into the groundwater.
Fig. 1. Location map of the study area
Fig. 2. Geological Map of The study area within Jordan Geology2.
Fig. 3. Distribution of Mean monthly rainfall (mm) in the basin2.
Fig. 4. Variation of EC with time for the period 2003-2011.
AL-HADIDI et al., Curr. World Environ., Vol. 8(3), 365-374 (2013) The mean values of EC were clearly higher in Wala No.5 compared to the other wells, (Table 2), it can be concluded that EC of Qatraneh well No.9 is more consistent and varied less from the mean. Figure 4 illustrates variation of EC with time for representative wells in the study area.The reason for increasing EC appears to be due to extensive exploitation of groundwater in the region, this caused discharge to exceed recharge. An increase of over-pumping rate from 110,208 m3 to 195,600 m3 due to increasing in population growth near the vicinity of wells in south Amman.In addition to the expansion of cultivated land and extensive irrigation. The value of EC decreased in January and February were recharge occurred which leached the soluble minerals. High amount of EC exhibits large amount of salts dissolved in water, this is not desired because it makes water unsuitable for drinking purposes. The average values of historical pH measurements range from 6.94 in Lajjoun wells to 7.63 in Heidan wells which indicate that the groundwater is slightly alkaline. Low bicarbonate values are associated with high pH measurements and vice versa.Large scale environmental activities in carbonate rock in Amman Wadi Es-Sir limestone formation (B2/A7) may raise the pH-value 13 . 14 classified water according to the pH value, Table 3. According to Subramanian the water could
Fig. 5. Trilinear Diagram of Major Ions for water sample in the study area
369
be classified into two groups, the first is as soft water in Lajjoun area and the second is hard water in Qatraneh, Heidan, Swaqa, and Wala. The mean values of pH in Table 2 were clearly higher in Heidan No.5 compared to the other wells. A sharp decrease in pH value for Wala No.13 in 2006 and Wala No.14 in 2005, which is properly due to variation in groundwater contamination. In all studied water samples the pH-values are acceptable for drinking water according to JS and WHO Guidelines, 2011. Chemical Parameters The average values for total hardness ranges from 365.4 mg/l in Swaqa to 442.7 mg/l in Wala. All the concentrations of calcium were higher than magnesium for all studied water samples; this probably due to the dissolution of limestone involves the following equilibrium15: CaCO3
Ca2+ + CO32
CO32- + H2O
HCO3- + OH-
Fig. 6. Classification of Irrigation Water Based on Salinity and Sodium Adsorption Ratio.
370
AL-HADIDI et al., Curr. World Environ., Vol. 8(3), 365-374 (2013) Table 1. Aquifers and aquitard within the study area5. Group
Formation
Balqa
B2b (Al Hasa Phosphorite) B2a (Amman Silicified Limestone) A7 ( Wadi Es Sir) A1-2 ( Nau'r) A4 ( Hummar) K (Kurnub) Z (Zarqa) Rum
Ajlun
Kurnub Zarqa Rum
Hydrogeology
Upper Aquifer Aquitard Lower Aquifer
Table 2. Descriptive statistical analysis of groundwater wells in the Dead Sea Basin. Well Name
Heedan No.13 Heedan No.2 Heedan No.5 Wala No.4 Wala No.5 Qatraneh No.24 Qatraneh No.9 Swaqa No.1A Qastal 5B
ClE C TH as Mg+2 NO3K+ Na + SO4-2 HCO3- as Ca+2 CaCO3 (mg/l) (mg/l) (µS/cm)CaCO3 (mg/l) (mg/l) (mg/l) (mg/l) (mg/l) (mg/l) (mg/l) 330 331 279 301 324 285 293 320 204
98 123 104 128.7 87 103.3 91.84 124 145 132 84.47 164 79 140 80 133 70 92
1127 1086 952 1100 1329 1190 1002 1025 787
Table 3. Type of water according to pH range14. Type of water
pH range
Soft water Hard water Sea water Water affected by acidic pollutants Water in equilibrium with atmosphere
5.3-7.4 7.5-8.8 8.9-9.2 2.2-4.8 5.6
Table 4. Classification of water according to total hardness (mg/l) as CaCO315 Water Classification
Total hardness Concen-tration in (mg/l) as CaCO3
Soft Moderately soft Slightly hard Moderately hard Hard Very hard
0-50 50-100 100-150 150-200 200-300 > 300
404 402 362 397 546 395 358 386 307
38.6 20.7 34.5 22.85 35.11 20.8 40.8 7.7 44.0 7.89 44.7 4.9 39 .0 1.36 41.1 0.86 31.8 15.1
5.61 6.9 4.9 4.1 4.9 4.3 3.1 2.35 6.8
pH
72 102 79.2 95.9 61.7 90 94.9 146 102.1 286 106.3 138 88.7 96.5 77.25 85.36 48.9 32
7.65 7.46 7.82 7.7 7.52 7.7 7.62 7.46 7.7
Table 5. Classification of water Use Irrigation Based on Salinity and Sodium Adsorption Ratio (SAR) Cluster Cluster -1 Cluster -2 Cluster -3
EC (µS/cm)
SAR
Class
966 1329 2832.5
1.82 2.13 4.5
C3-S1 C3-S1 C4-S1
Table 6. Classification of Irrigation Water Based on Sodium Percentage (Todd, 1980) Water Class Excellent Good permissible Doubtful Unsuitable
Sodium Percentage
EC (us/cm)
<20 20-40 40-60 60-80 >80
<250 250-750 750-2000 2000-3000 >3000
AL-HADIDI et al., Curr. World Environ., Vol. 8(3), 365-374 (2013) So, the prominent mineral result from the dissolution process of the limestone rocks is the calcium, since, the main constitute of the geological formation in the study area is the limestone and partly dolomite. According to15, all samples are classified very hard water Table 4. The classification of very hard water could be attributed to the overpumping of the wells in the catchments area in addition to the presence of dissolved calcium and magnesium salts originated from limestone rocks. The mean values of total hardness in Table 2 were clearly higher in Wala No.5 compared to the other wells.The increase in total hardness with time due to over-pumping of the aquifer from the vicinity near these areas and a subsequent lowering of the water table.The decrease in total hardness in winter month due to the recharge of the basin directly from rainfall. All the studied samples have total hardness values in within permissible limit of JS and WHO Guidelines10. The average level for calcium ranges from 76.45 mg/l in Swaqa to 112 mg/l in Wala which has maximum values of calcium, which is due to the cationic exchanges with sodium. While low values is due to the reverse cationic exchanges with sodium.The concentration of calcium in the groundwater was characterized by significantly weaker changeability. The mean values of calcium in Table 2 were clearly higher in Wala No.5 compared to the other wells. Average values of magnesium range from 36.96 mg/l in Heidan to 45.1 mg/l in Qatraneh.The ratio of Mg/Ca for all wells is below 1 which indicate that the sources of solute in the shallows aquifers is the dissolution of soluble minerals. The mean values of magnesium in Table 2 were clearly higher in Qatraneh No.24. It can be concluded that concentration of magnesium for Wala No.4 is less consistent and varied less from the mean.The concentration of magnesium are within permissible limit of JS and WHO Guidelines10. Values of sodium range from 67.75 mg/l in Heidan to 123.77 mg/l in Qatraneh.Relatively high concentrations may be found in brines and hard water and this explains the positive relation between total hardness (Ca2+and Mg2+), sodium
371
and EC such as in Qatraneh area. The high Na content in some samples is derived from cation exchange process between Ca-HC03water and sodium rich zeolites. Sodium is usually released to the water, and calcium ions will be fixed by zeolites.The concentration of sodium in all 500 samples are within the permissible limits of (JS) and (WHO) guidelines15. The average values of potassium range from 2.71 mg/l at Swaqa to 5.05 mg/l at Heidan.Lower value of potassium is due to greater resistance to its weathering and fixation in the formation of clay minerals.While high concentrations result from the presence of silicate minerals from igneous, metamorphic rocks and agricultural activities represented by the addition of fertilizer to soil present in the recharge areas of these wells, fertilizing with potassium nitrate and manure The average values for chloride ranged from 113.66 mg/l in Heidan to 191.69 mg/l in Qatraneh which is the same as sodium.The dissolution of rocks and soils in the study area is also may contribute in considerable amount of chloride constituents for the wells, variations in chlorinity are caused by changes in lithology, residence time of water and pollution. Average bicarbonate value of water in terms of CaCO3 varied from 279 to 340 mg/l, the maximum value of bicarbonate (340 ppm) is recorded in Wala. The concentration of bicarbonate is the highest in all cation and anions. pH value is an important factor in maintaining the carbonate and bicarbonate levels in water. Since the observed pH value is below 8.5; the carbonate values are not detectable for groundwater samples. Bicarbonate was the dominant anion that imparting alkalinity to groundwater, this is supporting the alkaline pH in the study area. The high values of bicarbonates are produced from the dissolution of limestone and marl which mainly contribute in the studied well geological formation. Classification of Water Samples Using Piper Diagram The classification of Langguth is based on the measured concentration of the four major
372
AL-HADIDI et al., Curr. World Environ., Vol. 8(3), 365-374 (2013)
cations (sodium, potassium, magnesium and calcium) and the four major anions (bicarbonate, sulphate, chloride and nitrate). The dominant cations are calcium plus magnesium and chloride is the dominant anions for all wells in the basin.
Ca+2>Mg+2>Na+ (Ca +Mg+2)>(HCO3-+SO4-2)
The Piper plot cations triangle shows that there is an increased in the proportion of calcium and magnesium on the expense of sodium. In the Piper anions triangle there is a clearly defined trend of decreased in bicarbonate and carbonates with increased in chlorideandsulphate, Figure 5. Two types were concluded:
Domestic Water The suitability of the groundwater for domestic purposes was determined by comparing the constituent with the Jordan and World Health Organization (WHO) Standards for drinking water. According to WHO standards, water with total dissolved solids (TDS) of less than 1000 mg/l is acceptable for human consumption. According to Jordan standards, water with TDS less than 1500 mg/l is acceptable for human consumption. The water with a TDS less than 1000 mg/l all satisfy the WHO standard for maximum sodium concentration (200 mg/l), sulphate concentration (250 mg/l) and bicarbonate concentration (350 mg/l as CaCO3). Few samples slightly exceeded the level of chloride (300 mg/l). No water samples exceeded the guidelines concentration of nitrate (50 mg/l).
Type 1 The type of this water is Alkaline earth waters with increased portion of alkalis and prevailing chloride. About 90% of the groundwater samples fall within this type. Chloride is the major anions and has an average percentage of about 56% in the analyzed water samples. The percentage of earth alkaline ions is higher than that of the bicarbonate. The chemistry of water shows the flowing ionic: Ca+2>Mg+2>Na+ Ca+2> HCO3Cl->SO4-2>HCO3This water type is characterized by relatively high salinity, samples are characterized by the dominance of Cl + SO4 over HCO3, and calcium is the dominant cation in the chemical facies of most groundwater samples, followed by Mg and Na. The chemistry of this type originated from the weathering, leaching of sedimentary rocks, and the dissolution of salt deposits. Type 2 The type of this water is alkaline water with prevailing chloride. This type represents about 10% of the total water samples in the Dead Sea basin. It characterized by high sodium percentage of about 32%. This type shows low medium salinity and classified as Na-SO4 type. The reason of high sodium percentage and lower alkaline ions in this water is due to ion exchange capacity of the sodium rich clay layers when floodwater percolate through the basalt rock the ionic order of this type is:
+2
Irrigation Water The salinity hazard and sodium adsorption ratio (SAR) were used to evaluate the suitability of groundwater for irrigation purposes in the study area. Wilcox, at the USA Salinity Laboratory (1954) developed a diagram classifying the waters into 3 groups based on their electrical conductivity (EC) and SAR .The sodium adsorption ratio (SAR) is expressed as :
Where, the concentration of the constituents is expressed in meq/l. All the water under consideration has been plotted on a Wilcox diagram, Figure 6. All groundwater samples plot in irrigation classes C3-S1 and C4-S1. Low â&#x20AC;&#x201C;sodium (S1) can be used for irrigation on almost all soils with little danger of the development of a harmful level of exchangeable sodium. High salinity water (C3) cannot be used in soils with restrictive drainage. Very high salinity (C4) water will not be recommended for irrigation. Combining the two hazards, sodium and salinity, the water of the Dead Sea Basin falls into two main classes. Cluster 1
AL-HADIDI et al., Curr. World Environ., Vol. 8(3), 365-374 (2013) and Cluster II classified as (C3-S1) and Cluster IIIclassified as (C4-S1).The water of class (C3-S1), theoretically can be used with caution, Table 4 . In addition, sodium concentration is an important factor in classifying irrigation water.
5.
The sodium content is usually expressed in terms of sodium percent and is defined as:
6.
Where, all ionic concentration are expressed in meq/l, Table 5, shows the classification of irrigation water according to16.
7.
CONCLUSIONS This study has concluded the following results: 1.
2.
3.
4.
The physical measurements of the groundwater samples showed that, the average electrical conductivity (EC) values range between 983 and 1430 ĂŹS/cm. All wells drilled in Wala area have the highest EC, while the EC wells of Swaqa area have the lowest values of EC. Low mineralization indicates that the weathered zone has been highly leached of soluble minerals or groundwater is likely derived from relatively recent direct recharge. The water samples related to the total hardness value in (mg/l) as CaCO3 were classified as very hard water according to freeze and cherry classification. The high increase of potassium concentration for the last years, at Wala well No.13 and Wala well No.14 is due to urban expansion in the vicinity of these wells in south Amman this led to agricultural activities represented by the addition of fertilizer to the soil present in the recharge areas.
8.
9.
373
The average values of historical pH measurements range from 6.94 in Lajjoun wells to 7.63 in Heidan wells, which indicate that the groundwater is slightly alkaline. Low bicarbonate values are associated with high pH measurements and vice versa. Based on chemical analysis and historical data major elements (cations and anions) of the groundwater in the study area are within permissible limit of Jordan standards (JS) and World Health Organization (WHO) Guidelines. Piper Classification showed that there are two types of groundwater in the study area is earth alkaline water with increased portions of alkalis with prevailing sulfate and chloride, the order of abundance is:Ca+2<Mg+2<Na+ for cations and Cl-<SO4-2< HCO3- for anions. The second type is of alkaline water with prevailing chloride. This type represents about 10% of the total water samples in the Dead Sea basin. This type shows low medium salinity and classified as Na-SO4 type. The water of the Dead Sea Basin falls into two main classes. Cluster 1 and Cluster II classified as (C3-S1) and Cluster III classified as (C4-S1).The water of class (C3-S1), theoretically can be used with caution. Very high salinity (C4) water will not be recommended for irrigation. Deteriorating of groundwater quality and declining of groundwater levels will threaten the groundwater resources in the future. ACKNOWLEDGEMENTS
The authors acknowledge the assistance of the Water Authority of Jordan represented by Dr. Khair Al-Hadidi for his continuous support and providing us with the historical data needed in this study. Also much gratitude to Dr. Hazem Shareef Hassan for his help in statistical analysis, which are used in this study.
374
AL-HADIDI et al., Curr. World Environ., Vol. 8(3), 365-374 (2013)
REFERENCES 1.
2.
3.
4.
5.
6.
7.
El Naqa, A. Al Momani, M.; Kilani,S. , A. and Hammour, N., Groundwater Deterioration of Shallow Groundwater Aquifers Due to Overexploitation in Northeast Jordan. Clean, 35(2), 156 – 166 (2007). Ministry of Water and Irrigation (MWI). Water Information System Hydrological, geological and hydrogeological data bank. MWI, Water Resources and Planning Directorate, Amman, Jordan (2012). Executive Action Team (EXACT). Overview of Middle East Water Resources of Palestinian, Jordanian, and Israeli Interest.Water Data Banks Project, Multilateral Working Group on Water Resources, Middle East Peace Process (2005). JMD (Jordan Meteorological Department), Annual Report, Ministry of Transport. Amman, Jordan (2010). Sawarieh, A. Heat sources of the groundwater in the Zara-Zarqa Ma’in-Jiza area, Central Jordan, PhD thesis, University of Karlsruhe, Germany (2005). Al-Raggad, M. GIs-Based Groundwater Flow Modeling and Hydro geological Assessment of the Northern Part of the Dead Sea Groundwater Basin, a tool for Groundwater Managements, PhD thesis, University of Jordan. Jordan (2009). APHA (American Public Health Association), Standard Methods for the Examination of Water and Wastewater (2000).
8.
9.
10.
11.
12.
13.
14.
15.
16.
Langguth, H. R. Groundwasser verhaltisse in. Bereich des. velbertersatües Der‘Minister for Ernährung land. Wistschaft and Förstern. NRW, Dusseldorf, 127p. Germany (1966). Piper, A. M. Graphical procedure in geochemical interpretation of water analysis. Trans-American Geophysical Union, 25: 914-928 (1944). World Health Organization (WHO), Guidelines for Drinking water quality, GenvaSwitzerland (2011). WILCOX, L.V., Classification and use of irrigation waters. US Dept. Agri. Circ. 969. Washington, D.C., USA. 19p (1955). Christie, L., Summer travel: Fares, room rates spike. Retrieved April 18, 2008, from CNNMoney.com Web site: http:// m o n e y. c n n . c o m / 2 0 0 5 / 0 5 / 0 2 / p f / travel_summer_trends_2005/index.htm (2005). Stone, N., M. And Thomforde, H., K. Understanding your fish pond. Water Analysis Report. University of Arkansas at Pine Bluff, USA (1977). Subramania, S. M. Environmental chemistry and analysis. Indian Institute of Technology Madras. India (1999). Freeze, R. A. and Cherry, J.A., Groundwater Book. Englewood Cliffs, NJ, Prentice Hall, Inc., 590 pp., USA (1979). Todd, D. K. Groundwater hydrology third edition, John Wiley and Sons, Third Reprint. Inc. India. 535p (2007).
Current World Environment
Vol. 8(3), 375-380 (2013)
A Simple Electrochemical Approach for Determination and Direct Monitoring of Drug Degradation in Water M. TAHIR SOOMRO1*, IQBAL M. I. ISMAIL1, 2, ABDUL HAMEED1 and MOHAMMAD ASLAM1 1
Center of Excellence in Environmental Studies, King Abdulaziz University, P.O. Box 80216, Jeddah 21589, (Saudi Arabia). 2 Chemistry Department, Faculty of Science, King Abdulaziz University, P.O. Box 80203, Jeddah 21589, (Saudi Arabia). http://dx.doi.org/10.12944/CWE.8.3.05 (Received: July 23, 2013; Accepted: August 27, 2013) ABSTRACT
The application of electrochemical techniques for the determination of pharmaceutical drugs in water is reported here. The experiment is designed for use in undergraduate chemistry courses. Two most commonly used pharmaceutical drugs e.g., ibuprofen (IBP) and paracetamol (PCM) were investigated for their identification and electrochemical investigations using cyclic votlammetry (CV) and square wave (SQW) voltammetry. The major objective of this communication is to enable students to get familiar and use sophisticated electrochemical techniques. A detailed protocol for the detection of IBP and PCM is presented in this work. The developed protocol was used to study sunlight photocatalytic degradation of IBP and PCM in photocatalytic degradation experiments carried out in the presence of ZnO based photocatalyst. This easy and efficient approach can easily be included in undergraduate chemistry courses.
Keywords: Pharmaceutical Drug, Ibuprofen, Paracetamol, Wastewater, Cyclic Voltammetry, Square Wave Voltammetry, Determination, Degradation .
INTRODUCTION Most pharmaceuticals are persistent in wastewater especially the effluent from pharmaceutical industries and also from hospital wastes. Considerable attention has been already devoted for the removal of these pharmaceuticals from wastewater. Ibuprofen (IBP) and paracetamol (PCM) are two important pharmaceutical drugs which are regularly used to cure from fever, migraine, and diseases resulted from inflammatory disorder1-4. Fig 1 shows the chemical structure of IBP and PCM.
H N
O
O
OH
Ibuprofen
Paracetamol
Fig.1: Structure of IBP and PCM.
It is reported that presence of IBP and PCM and their metabolites in wastewater have adverse effects on environment due to the ecotoxicity potential and their exposure could also be very harmful to human health5, 6. Therefore their detection and removal from wastewater play vital role in wastewater treatment methodologies. Several methods have been described in literature regarding detection of IBP and PCM using conventional or novel techniques. Such techniques include spectrophotometry, spectrofluorimetry, GCMS, HPLC, electrophoresis and etc1-4, 7-12. In addition electrochemical techniques are also widely use for determination of IBP and PCM in wastewater12, 13. But unexpectedly only limited number of reports are found in literature illustrating the methods for removal of IBP and PCM from wastewater5, 6.
376
SOOMRO et al., Curr. World Environ., Vol. 8(3), 375-380 (2013)
In the present work students are introduced to the electrochemical detection of IBP and PCM in water. Instrumentation for electrochemical measurements as compared with other available techniques is cost effective, simple and easy to handle. Sensitivity and fast analysis are additional advantages. Cyclic voltammetry is one of the very versatile and most regularly used electrochemical technique in fundamental research. On the other hand square wave (SQW) voltammetry affords high sensitivity with fast analysis time and this is because of zero background charging current. An excellent material for supplementary reading is suggested to acquire necessary understanding of CV and SQW voltammetry14-20. Both, CV and SQW voltammetry were employed to examine IBP and PCM in water. The sunlight photocatalytic environmental remediation is regarded as the cheap and clean alternative of currently expensive technologies as it leads to the complete mineralization of pollutants essentially in water purification21-23. Using cyclic voltammetry the sunlight photocatalytic degradation of pharmaceutical drugs were also studied. The method is novel and provide us opportunity to observe the complete mineralization of IBP and PCM present in wastewater. Using cyclic voltammetry the information of degradation product and mechanism of degradation, as a result of photocatalytic degradation, is also obtained. The work is purposefully designed to develop a easy protocol for determination and removal of pharmaceuticals drugs present in wastewater using electrochemistry. EXPERIMENTAL Reagents and Solutions Ibuprofen (IBP) and paracetamol (PCM) tablets were purchased from local market in Jeddah, Kingdom of Saudi Arabia. Before cyclic voltammetric measurements IBP and PCM were purified by means of re-crystallization procedure. 5-10 g of IBP tablet was taken and grinded using pestle and mortar. A fine powder obtained was further added in 60-80 mL of acetone in 100 mL beaker. After that a continuous stirring was carried
out using glass rod for approximately 10-20 minutes so that maximum amount of IBP dissolve in acetone. Then the mixture was filtered and acetone evaporated on hot plate at 40 ยบC until thick liquid obtained. Finally the beaker was kept in vacuum oven for 2-3 hours to obtain purified crystals of IBP. For purification of PCM followed the same procedure. Potassium chloride (BDH), potassium ferricyanide (HiMedia), sodium acetate (Sigma), and acetic acid (Sigma) were used as received from the supplier without further purification. Milli-Q water was used throughout the study for making sample solutions. Stock solutions of 100 ppm of IBP and PCM were made in ethanol and used for further dilution using acetate buffer. All solutions were made in acetate buffer of pH 4.7 and concentration 0.25 M. All glassware were cleaned carefully, rinsed at least three times with double distilled water and oven dried at 100 ยบC before use. ZnNO3 (HiMedia), KOH (Loba Chemie), and ammonium metavanadate (NH 4VO 3, Loba Chemie) were purchased for synthesis of ZnO based photocatalyts. The ZnO based vanadium impregnated photocatalyst was synthesized by wet impregnation techniques using ammonium metavanadate as precursors for V6+ ions. The ZnO used in the preparation of impregnated catalyst was synthesized by hydrolyzing Zinc nitrate solution by KOH. The hydrated gel after filtration and drying was calcined at 500oC in muffle furnace. After impregnation the impregnated catalyst was again calcined for optimum surface geometry. Apparatus and Procedure A VSP multi-channel potentiostat (Biologic Science Instrument, USA) provided with Ec-lab Software was used for carrying out all voltammetric measurements. A Glassy carbon (GC) working electrode with a diameter of 3 mm, a platinum (Pt) counter electrode, and a Ag/AgCl reference electrode were purchased (Biologic Science Instrument) and used as received. The electrochemical cell of maximum capacity of 10-20 mL equipped with gas bubbler and gas outlet
377
SOOMRO et al., Curr. World Environ., Vol. 8(3), 375-380 (2013) 12
10
Current / µΑ
assembly was used. All voltammetric measurements was accomplished using usual procedure such as by immersing working, counter and reference electrodes in an electrochemical cell. All experiments were performed at ambient temperature. The 30 ppm sample solutions of IBP and PCM were tested for their identification. Variable scan rate from 10-500 mV/s was employed using cyclic voltammetry. The square wave voltammetric parameters are as follows: pulse height 25 mV, pulse width 50 ms, and step height 10 mV. All cyclic voltammograms presented were recorded against Ag/AgCl reference electrode and all potential values are in volts vs. Ag/AgCl reference electrode.
8
6
4
2
0
-2 0.0
0.4
0.8
1.2
1.6
Potential / V vs. Ag / AgCl Fig. 2: Cyclic Voltammograms of 30 ppm IBP in 0.25 M acetate buffer of pH 4.7 at sweep rate of 100 mV/s with number of repeated scan, n=3. -2
1.5x10
Sunlight Photocatalytic Degradation To study the photocatalytic degradation 50 ppm solution of IBP in simple Milli-Q water was used. 100 mg vanadium impregnated ZnO powder was added in 100 mL solution of IBP and stirred for 30 minutes to get the homogenous dispersion. After that the solution was exposed to sunlight. For cyclic voltammmetric measurements 10 mL of IBP was taken at different period of time and diluted using acetate buffer and Milli-Q water. The photocatalytic degradation of PCM was also studied followed the above mentioned procedure.
-2
8
1.0x10
Current / mA
Current / µΑ
6
-3
5.0x10
0.0
-5.0x10⁻³ 0.0
Voltammeric Response at Bare Glassy Carbon Electrode Fig 2 shows the characteristic cyclic voltammogram of IBP recorded at bare glassy
0.8
1.2
1.6
2
0
-2
0.0
0.2
0.4
0.6
0.8
1.0
Potential / V vs. Ag / AgCl Fig. 3: Cyclic Voltammograms of 30 ppm PCM in 0.25 M acetate buffer of pH 4.7 at scan rate of 100 mV/s with number of repeated scan,n=3. An inset graph showing cyclic voltammogram of PCM scanned between 0 V to + 1.5 V vs. Ag/AgCl. Paracetamol Ibuprofen
10
8
6
4
2
0 0.0
RESULTS AND DISCUSSION
0.4
Potential / V vs. Ag / AgCl
4
-4
I delta / µΑ
The working electrode was pretreated (activated) by performing 10 cycles in 0.1 M H2SO4 between 0 V to 2 V at 100 mV/s. The working electrode surface was cleaned first using diamond paste and then with alumina paste by manual procedure. After that the polished electrode was rinsed with double distilled water and immersed in 5% HNO3 solution for 5 second then rinsed again with double distilled water and air dried before use. No deterioration of working electrode was detected during voltammetric measurements. The background current was also measured in absence of pharmaceutical drugs in acetate buffer.
0.4
0.8
1.2
1.6
E step / V vs .Ag / AgCl Fig. 4: Square-wave Voltammograms of 30 ppm IBP (red) and 30 ppm PCM (black) in 0.25 M acetate buffer of pH 4.7. The square wave voltammetric parameters are: pulse height 25 mV, pulse width 50 ms, and step height 10 mV.
SOOMRO et al., Curr. World Environ., Vol. 8(3), 375-380 (2013)
The absence of reduction peak on the reverse scan indicating that the formation of highly reactive intermediate product upon oxidation which reacted either with solvent or dimerized quickly into a dimer. The electrochemical oxidation of IBP fits into an EC reaction that is electron transfer reaction followed by homogeneous chemical reaction. A-e=B B → Product
...(1) ...(2)
The characteristic cyclic voltammogram obtained for PCM is represented in figure 3. To obtain a well defined peak the potential was scanned between 0 V to +1 V. An inset graph in figure 3 also recorded for the potential range of 0 V to +1.5 V just to confirm that there is no other peak for PCM. The cyclic voltammogram of PCM is interpreted as quasi reversible process, with “∆E ≥” 100 mV/n, coupled with a slow chemical reaction i.e., an EC reaction.
10
8
I delta / µΑ
carbon electrode. The applied potential range was 0 V to +1.5 V vs. Ag/AgCl reference electrode. An irreversible oxidation peak was observed for IBP at around +1.29 V during a forward scan.
6
4
2
0
0.0
0.4
0.8
1.2
1.6
E step / V vs .Ag / AgCl Fig. 5: Square wave voltammograms of mixture of IBP and PCM in 0.25 M acetate buffer of pH 4.7. The square wave voltammetric parameters are: pulse height 25 mV, pulse width 50 ms, and step height 10 mV. 0
0 min 60 min 120 min
5
Current / µΑ
378
0
5
0
-5
From the cyclic voltammograms of IBP and PCM one can also deduce that the oxidation of PCM is easier than IBP. The potential difference in peak position is found to be 800 mV which allows easy identification of IBP and PCM in same solution. Overlapped square wave (SQW) voltammograms over one another are shown in figure 4 obtained for IBP and PCM. Square wave voltammogram for a mixture of IBP and PCM was also recorded and is shown in figure 5. As expected the peaks of IBP and PCM are clearly resolved and identified without
0.0
0.4
0.8
1.2
Potential / V vs .AgCl Fig. 6: Cyclic voltammetric study of sunlight photocatalytic degradation of 30 ppm IBP in water. The cyclic voltammogram was taken in 0.25 M acetate buffer of pH 4.7. 14 12
0 min 60 min 120 min
10
Current / µΑ
Electrochemically well defined response depends on many factors and some of them are electrode material, supporting electrolyte, and solvent decomposition potentials (i.e., potential window). Because water oxidize itself when potential applied further than +1.23 V and due to this water decomposition background current the working range (potential) is restricted to +1.5 V when using glassy carbon as working electrode. So beyond +1.5 V the oxidation or reduction peak, if any, is obscured.
8 6 4 2 0 -2 0.0
0.4
0.8
1.2
Potential / V vs .AgCl Fig. 7: Cyclic voltammetric study of sunlight photocatalytic degradation of 30 ppm PCM in water. The Cyclic voltammogram was taken in 0.25 M acetate buffer of pH 4.7.
SOOMRO et al., Curr. World Environ., Vol. 8(3), 375-380 (2013) any problem and letting us analysis of mixture from wastewater. To obtain a well define square wave voltammogram optimization studies were also done. The optimal values of square wave voltammetric parameters were obtained and are as follows: pulse height 25 mV, pulse width 50 ms, and step height 10 mV. All square wave voltammograms were recorded using such parameters. Voltammetric Study of Sunlight Photocatalytic Degradation in water Sunlight photocatalytic degradation offers a new alternative against persistent organic pollutants present in wastewater. During the CV analysis of the degradation products in the photocatalytic degradation studies it was observed that CV is a powerful alternative of other analytical techniques such as UV-Visible spectroscopy and HPLC for monitoring the degradation products. The sunlight photocatalytic degradation of IBP and PCM are shown in figure 6 and figure 7. The studies were carried out in different time intervals. The complete degradation and/or mineralization of IBP and PCM were observed in about one hour. No side products or metabolites were detected in cyclic voltammetric investigations. The complete mineralization of pharmaceutical drugs into inorganic ions also evidenced from the increase of the background current in cyclic voltammograms of IBP and PCM.
379
CONCLUSION The protocol demonstrated above is successfully applied for the determination of IBP and PCM in water using cyclic voltammetry and SQW voltammetry. Sunlight photocatalytic degradation study of IBP and PCM was also carried out using cyclic voltammetry. Cyclic voltammetry is very useful for identification of pharmaceutical drugs. On the other hand for quantitation square wave voltammetry is more superior than CV and can be easily used for that purpose. The developed protocol gives students an understanding about electrochemical instrumentation used for pharmaceutical drug determination in wastewater. In addition, students also learned about novel method for removal of pharmaceutical drug from wastewater. As a result students received experience in both electrochemistry and method development. ACKNOWLEDGMENT For carrying out the work the Ministry of Higher Education (MOHE) and King Abdulaziz University (DSR) are highly appreciated for their technical and financial support.
REFERENCES 1.
2.
3.
4.
5.
6.
Miner D. J., Rice J. R., Riggin R. M. and Kissinger P. T., Analytical Chemistry, 53, 2258 (1981). Motoc S., Manea F., Pop A., Pode R. and Burtica G., Advanced Science, Engineering and Medicine, 3, 7 (2011). Hamoudová R. and Pospíšilová M., Journal of Pharmaceutical and Biomedical Analysis, 41, 1463 (2006). Wangfuengkanagul N. and Chailapakul O., Journal of Pharmaceutical and Biomedical Analysis, 28, 841 (2002). Escher B. I., Baumgartner R., Koller M., Treyer K., Lienert J. and McArdell C. S., Water Research, 45, 75 (2011). Ort C., Lawrence M. G., Reungoat J., Eaglesham G., Carter S. and Keller J., Water
7.
8. 9. 10.
11. 12.
Research, 44, 605 (2010). Kachoosangi R. T., Wildgoose G. G. and Compton R. G., Analytica Chimica Acta, 618, 54 (2008). Ghoneim E. M. and El-Desoky H. S., Bioelectrochemistry, 79, 241 (2010). Whelan M. R., Ford J. L. and Powell M. W., J Pharm Biomed Anal, 30, 1355 (2002). Khoshayand M. R., Abdollahi H., Shariatpanahi M., Saadatfard A. and Mohammadi A., Spectrochimica Acta Part A: Molecular and Biomolecular Spectroscopy, 70, 491 (2008). Ternes T. A., Trends in Analytical Chemistry, 20, 419 (2001). Manea F., Motoc S., Pop A., Remes A. and Schoonman J., Nanoscale Research
380
13.
14. 15.
16. 17.
SOOMRO et al., Curr. World Environ., Vol. 8(3), 375-380 (2013) Letters, 7, 331 (2012). Stefan-van Staden R.-I., Mashile T., Mathabathe K. C. and van Staden J. F., Instrumentation Science & Technology, 37, 197 (2009). Chen A. and Shah B., Analytical Methods, 5, 2158 (2013). Bard A. and Faulkner L., Electrochemical methods: fundamentals and applications, Wiley (2001). Heinze J., Angewandte Chemie International Edition in English, 23, 831 (1984). Kissinger P. T. and Heineman W. R., Journal of Chemical Education, 60, 702 (1983).
18. 19. 20.
21.
22. 23.
Mabbott G. A., Journal of Chemical Education, 60, 697 (1983). Krause M. S. and Ramaley L., Analytical Chemistry, 41, 1365 (1969). Wang J., Bollo S., Lopez Paz J. L., Sahlin E. and Mukherjee B., Analytical Chemistry, 71, 1910 (1999). Hameed A., Montini T., Gombac V. and Fornasiero P., Photochemical & Photobiological Sciences, 8, 677 (2009). Fatin S., Lim H., Tan W. and Huang N., Int. J. Electrochem. Sci, 7, 9074 (2012). Reddy S., Kumara Swamy B. E., Vasan H. N. and Jayadevappa H., Analytical Methods, 4, 2778 (2012).
Current World Environment
Vol. 8(3), 381-389 (2013)
Household’s Willingness to Pay for Drinking Water Quality Service Improvement in Damaturu, Nigeria MOHD RUSLI YACOB1, SULEIMAN ALHAJI DAUDA2, ALIAS RADAM2 and ZAITON SAMDIN3 1 Faculty of Environmental Studies, University Putra Malaysia, 43400 UPM Serdang, (Selangor). Faculty of Economics and Management, University Putra Malaysia, 43400 UPM Serdang, (Selangor). 3 Faculty of Forestry, Universiti Putra Malaysia, 43400 UPM Serdang,(Selangor).
2
http://dx.doi.org/10.12944/CWE.8.3.06 (Received: August 05, 2013; Accepted: September 24, 2013) ABSTRACT Human existence depends largely on availability of water both in high quality and sustainable supply. Improved quality drinking water has the ability to improve our standard of living, reduces mortality rates and morbidity associated with water born diseases. Damaturu have witnessed unprecedented increase and influx of population due to its new status by been made the capital of Yobe State in 1991, provision of safe drinking water thus became a matter of serious concern and this led to prevalence of water borne diseases like diarrhea and other gastro intestinal disorder. Yobe State has embarked on the construction of “Damaturu regional water supply project” which promises 100% access to portable water to Damaturu. The general objective of the study is to assess the household’s willingness to pay for an improved quality drinking water. Choice experiment approach was used, and four attributes of drinking water quality were identified namely; tap water quality (TWQ), Tap water supply (TWS) tap water pressure (TWP) and Price. Conditional logit model (CLM), involving randomized sampling of 300 respondents was carried out. The results were found that respondents with higher level of education are more willing to pay. Identifying the mix of attributes and their prices based on respondents’ drinking water quality demand preferences would help policy makers to know and provides the households with a preferred and affordable drinking water and also facilitates effective tariff structure for cost recovery and sustainability.
Key words: Choice Experiment, Water Quality, Household Preference, Choice Modeling, Willingness to Pay, Conditional Logit Model.
INTRODUCTION Water is fundamental human need; human life and existence of all eco system depends largely on the availability of water both in high quality and sustainable quantity supply, safe water is the water delivered to the consumers that can be used directly for drinking, cooking, and washing. It is the responsibility of authority at all levels to review, inspect, monitor and evaluate on continues basis the water supplied to the community, using constantly updated water standard John (1990). Tap
water in most of the developing countries is unsafe for direct drinking and the supply services are commonly unreliable Vasquez et al., (2009). Damaturu like most of the municipalities in Nigeria, tap water quality and sustainable supply services remained a matter of serious concern to the authorities, because government capacity to provides the growing population with the safe drinking water is not commensurate with the population growth, household’s are left to cater for their sources of water as such a lot of valuable time and limited resources are been inefficiently
382
YACOB et al., Curr. World Environ., Vol. 8(3), 381-389 (2013)
allocated towards sourcing for and improving the quality of drinking water. Damaturu in Nigeria, like other cities in developing countries, the tap water quality is still remaining unsafe and harmful for direct household consumption. The common problem in society on high mortality rates and morbidity is on increase as a result of water borne diseases such as cholera, diarrhea and other gastro intestinal diseases (Emeka et al., 2008, Oruanye et al,. 2010 and Akinsola et al,. 2007). Improvements in the water quality supplied by the municipalities would result in higher cost of such services which would have to be borne by the users and acceptability of any additional charges should be investigated Genius et al., (2008). Thus the rationale for this study is to assess the household’s preferences for varying attributes of water quality and estimates their willingness to pay for drinking water quality improvement. This paper is organized into five sections. Section one is the introduction, followed by section two which describes the location of study. Section three explains the methodology and sources of data used in study. The empirical results are presented in section four, while the last section offers some discussion and concluding comments with regard to drinking water service improvement. Study area Damaturu town is the capital of Yobe State and the local government headquarters of Damaturu. It is located between longitude110 44' 40'’ N and latitude 110 57' 40'’ E in the north eastern part of Nigeria, it has total area of about 400 km2. However, the main urban area of Damaturu occupies only an area of about 20 km2 (Babalola et al., 2010). Damaturu has no industrial establishment; it is dominated by agrarian economy that produces mainly beans, millet, groundnut, gum Arabic, cotton etc. Damaturu town rose from obscure local government area to the status of state capital in 1991, when Yobe State was created out of Borno State. These sudden change in status brought about an increase in the population from less than ten thousand (10,000) persons before 1991, to a population of about two hundred and twenty five thousand eight hundred and ninety five (225,895) population in 2011, Babalola et al., (2011).
Damaturu is not drain by any river it is a water deficit region, the rainfall ranges between 400mm to 800mm with an annual mean of 750mm with very low surface water during rainy season, hence absence of surface water resources. The town main sources of drinking water are from underground water resources which are usually accessed through drilling of boreholes and artesian wells Emeka et al., (2008). Water supply to Damaturu has been grossly inadequate because of the expanding population and increase in commercial activities. At present the total water supply is about 10,000 m2/day extracted from 29 production wells and the discharge of each well ranges from 80 to 325m 2/day. The projected demand of water to Damaturu presently is over 89,120m 2 /day Mohamed et al., (2008). This problem must be addressed with a quantitative approach rather than a qualitative approach alone. Yobe state government has embarked on the construction of a Water project in Damaturu named; “Damaturu region water supply project” which was targeted upon completion to provide 100% rate of access to improved quality drinking water to the Damaturu metropolitan. Presently the main source of water supply is groundwater wells within taps in 10-15%. However, recent report by the State government indicated that 45% of residential houses in Damaturu are being connected to Yobe State Water Corporation services.
Fig .1(a): Political map of Nigeria, showing Yobe state top left. www.mapsofworld.com
YACOB et al., Curr. World Environ., Vol. 8(3), 381-389 (2013)
Fig .1(b): Political Map of Yobe state showing Damaturu, the study area with postal code number 620.
383
Fig.1(c): Map of Damaturu metropolitan showing the position of the proposed wellfields A,B and C for the proposed Damaturu region water supply project
Table 1: Drinking Water Attributes and Levels Attributes
Levels
Tap water Quality (TWQ) TWQ1 TWQ2 TWQ3
Non Satisfactory Satisfactory Very Good
Total Supply of Water (TSW) TSW 1 TSW 2 TSW 3 Tap Water Pressure (TWP) TWP 1 TWP 2 TWP 3 Water Bill Price (P)
Regular Irregular Very Irregular Low Medium High N200 N250 N300 N400
Descriptions Tap water quality refers to the drinking water with high quality; safe for direct human consumption, ideally it should be colorless, tasteless, odorless and compatible with standard of drinking water quality. This refers to the total supply of water to the households from the Yobe State Water Corporation measured in terms of rate supply of water to the household. Tap water pressure refers to the pressure with which Moderate the water gushes out from the tap, so as to reduce Low wasting of time. Water bill refers to household monthly water bills charged by Yobe state Water corporation, presented as amount increase over the current bill.
Note: Italics present the status quo attribute levels METHODOLOGY Sampling Procedure and Survey Design The survey was carried out between June and August 2011 involving a random sample of
300 household in Damaturu metropolitan. The task of the interview was carried out by five trained enumerators to conduct a face to face interview. At the beginning of each interview session, respondents were told that they have been randomly selected for survey with the purpose of
384
YACOB et al., Curr. World Environ., Vol. 8(3), 381-389 (2013)
assessing their willingness to pay for drinking water quality improvement. At the beginning of each interview session, respondents were informed about the purpose of their been randomly selected for the survey aiming at assessing their willingness to pay for their drinking water quality improvement and their participation would help to improve policy making.
option implies no improvement and no additional cost, it has been included to avoid ‘forced choice’. The respondents faces six choice sets and for each set there are three options in which they were ask to choose any one, with each alternative having various bundles of attributes and at various prices, attributes and their level as presented in Table 1. Model specification
Choice Experiment (CE) method is consistent with Random Utility Model (RUM). For the fact that individuals are assumed to choose the alternatives which maximizes their utility, we can apply probabilistic models to choose between the different alternatives available in each choice set; therefore a good is valued in terms of its attributes. In each choice set attribute representing three alternative management options include a status quo option. A status quo was often included to account for forced choice, Hensher et al., (2005) likewise in all the choice sets prices were introduced and thus, willingness to pay estimates for changes in attributes levels can be derived from marginal utility estimates Poirer et al,. (2010). Bateman et al., (2002) mentioned that choice experiment involves of five important stages namely: selecting attributes, determining levels, choosing experimental design, constructing choice sets and measuring preference. Attributes for water quality improvement was determined following consultation of relevant literatures and the discussion with focus group which was found to be related to tap water. The concept of tap water quality, supply and pressure were adopted and percentage increase over the current water bill stood for the price. The questionnaire consisted mainly of four parts: choice experiment questions, attitudinal questions, perception question, and sociodemographic questions respectively. The choice experiment part was presented to the respondents with six choice sets which consist of two management option usually with status quo or opt out option, each with price as the percentage increase over the current bills charged by the Yobe State Water Corporation, taken at an average of N200 at flat rate charges. Status quo
Conditional logit is one of the methods in discrete choice analysis. If respondent “n”, is faced with a choice among “j” alternatives in a choice set, the attributes in the choice sets may either be in qualitative or quantitative term of alternative “i” in the choice set as faced by the respondent n as the vector Xin. The probability (Pin) that respondent “n” chooses alternative “i” in the choice set as faced by the respondent depends on the attributes of alternative “i” compared with other alternatives (i.e Xin relative to all Xjn; j ≠ I). In this case, there are three alternatives: management option 1, 2 and status quo and the probability can be presented by a parametric function of general form as follows: ...(1) Where; = probability of respondent n choosing alternative
.
= a vector of observable characteristics of alternative i accessible to respondent
.
= a vector of observable characteristics of alternative j accessible to respondent
.
In this case, f is the function that relates the observed data with the choice probabilities. This function is specified up to some vector of taste parameter β to be estimated. These parameters can be interpreted by estimating the marginal value of the each water attributes in the respondent’s choice set, Mohd Rusli et al., (2008). The estimation of the Random Utility Model would be obtained when we specify the distribution on the error term, and to develop the conditional logit model, by McFadden (1974) and Train (2003). It was assumed that all the error term in the choice set are
YACOB et al., Curr. World Environ., Vol. 8(3), 381-389 (2013) independently and identically Distributed IID with all Weibull distribution, the conditional logit model can be developed. Thus, the probability of household n choosing alternative i can be specified as follows: ...(2)
By assuming that Vin is linear in parameters, the functional form of the respondents’ systematic component of utility function can be expressed as: ...(3) Where X are variables and βs are coefficients to be estimated. If a single vector of coefficient β that applies to all the utility functions associated with all the alternatives is defined and the parameter µ=1, Train ( 2003) Swait and Louviere (1993) the equation (3) can then be rewritten as: ...(4)
Where; = respondent n choice probability of alternative
. and
attributes of
and
= vector describing the .
β = vector of coefficient Then, the next step is to estimate the choice probability and to calculate the welfare measure. The ratio of an attribute’s coefficient and the price coefficient represents the marginal implicit price of the attributes. This ratio represents the implied change in the implicit price of the attributes relative to a current situation as in the equation below:
...(5)
385
RESULTS AND DISCUSSION Demographic and Socio-economic Characteristics A result of the respondent demographic profile is presented in Table 2. Ages of the respondent’s ranges from 23 to 70 year olds with the mean age of 41year olds. Male are majority which represent 96.7% from the total samples. In terms of respondent educational background, the result found that illiterates (9.0%), primary school (13.0%), university level (18.0%), secondary school 65 (21.7%) and polytechnic /college 115 (38.3%) having the highest number of attendants respectively. Respondent employment indicates that those employed at the formal sector constituted 82.3%, unemployed respondents are 5.7% of the total respondents, women who engages in home duties are only 3.0%, retired personnel constituted 4.3%, and those employed in informal sector or self employed constitutes 4.7%. Meanwhile, total number of the people living in the household two people representing 12.3% of the total respondents, to the highest which has from six people and above which is 96 households which constituted 32% of the total respondents. Gross monthly household income indicates that households earning below N16,000 are low income earners and they represents the smallest number 21 respondents which represents only 7%. The middle income earners are those earning between N16,001 to N34,000 they represent the largest percentage of 73.0% and 20.0% contributed by respondents with high income earners of their gross monthly household income is above N34,000. The Choice Experiment Table 3 shows the empirical results of choice experiments (CE) for the drinking water quality service improvement in Damanturu Nigeria. The CL results are presented for the simple model (Model 1) and interaction model (Model 2) of water quality services attributes. In CL simple model, however, it was found that the coefficient TWP3 is
386
YACOB et al., Curr. World Environ., Vol. 8(3), 381-389 (2013) Table 2 : Socio-Demographic profiles of respondents (N=300) Variables
Definitions and Coding
Freq (%)
AGE GEN
Age in years (mean) Gender (1; male 0; female) Male Female Education level Illiterate Primary school Secondary school Polytechnic/College University Employment ((1; employed 0; others) Employed Unemployed Home duties Retired Others Household Number (mean) 2 persons 3 persons 4 persons 5 persons 6 persons & above Monthly gross household income (N) Less than N16,000 N16,001-N34,000 More than N34,000
41.88
EDU
EMP
HHOLD
HINC
not significant. This is because the TWP3 level is to higher related to base level, hence, less favored by respondents. This is a possible explanation why it may have occurred. Meanwhile, all coefficients for attribute levels TWQ2, TWQ3, TWP2, TWS1, TWS2 and Price attribute levels are significant at the 1% level. The overall coefficients for the attributes levels (except Price) are positive, indicating that the chosen base level has the smallest contribution to utility. In such exercise, there are possibilities of improving model fit and examining where the sources of the inaccuracies may be occurring. First, it can be improved by the inclusion of socioeconomic factors and respondent visits at characteristic attributes in order to account for heterogeneity of preferences. The respondentsâ&#x20AC;&#x2122;
290 (96.7) 10 (3.3) 27 (0.9) 39 (13) 65 (21.7) 115 (38.3) 54 (18) 247 (82.3) 17 (5.7) 9 (3.0) 13 (4.3) 14 (4.7) 4.33 37 (12.3) 58 (19.3) 70 (23.3) 39 (13.0) 96 (32.1) 21 (7.0) 219( 73.0) 60 (20.0)
socio-economic information included age, gender, education levels, occupation, income, place of origin and membership of environmental group. Second, the socio-economic variables can be interacted with main attributes and can be used in order to avoid the singularities problem. These interactions help to generate a rich data set about the specific influences of choice on each level used in the model. However, in interaction model, the log-likelihood ratio value has a small rise from the simple model, indicating that a model specification has been small improved. Improvements in the model are also evidenced by the increase in the Pseudo-R2 statistic from 0.135 to 0.142. However, in a comparison of the CL interaction model with the CL simple model, it can be seen that variables TWS1 and TWP1 have
YACOB et al., Curr. World Environ., Vol. 8(3), 381-389 (2013)
387
Table 3 : Results for Conditional Logit Model Variable
Conditional Logit Model 1 Model 2 Simple Model Interaction Model β) β) Coefficient (β Coefficient (β
TWQ2
1.5831*** (0.1387) 1.8832*** (0.1683) 0.2521)*** (0.1154) 1.4654*** (0.1527) 0.7334 (0.2744) 1.1732*** (0.3154) -0.8574*** (0.1849)
TWQ3 TWS1 TWS2 TWP1 TWP3 PRICE TWQ2_EDU TWQ3_EDU TWP1_GEN TWP3_GEN N (Observations) Log likelihood R2 Adjusted R2
1500 -1424.751 0.135 0.133
0.9689*** (0.2414) 1.1125*** (0.2690) 0.2627** (0.1158) 1.4826*** (0.1532) 2.2845*** (0.8639) 2.5235*** (0.7366) -0.8799*** (0.1855) 0.3594*** (0.1156) 0.4509*** (0.1241) -2.3390*** (0.8811) -1.4497*** (0.7321) 1500 -1412.831 0.1426 0.1395
Note: Standard errors in parentheses * Significance at 10% level, **significance at 5% level and *** significance at 1% level
Table. 4: Marginal Rate of Substitution (%) for Drinking Water Quality Improvement Variable CL Simple CL Interaction Model (%) Model(%) TWQ2 TWQ3 TWS1 TWS2 TWP1 TWP3
184.63*** 219.63*** 29.40** 170.91*** 8.55 136.83***
110.11*** 126.43*** 29.86** 168.49*** 259.61** 286.77***
changed; an estimated coefficient TWS1 which significant at 1% in simple model reduce to 5% significant level and TWP1 tends to be significant at 1%. This indicates that there are strong relationships affected by the interaction variables to primary attributes. The variables of TWQ2_EDU and TW3_EDU were significance and indicates that a higher level of education contributes positively to support the drinking water quality improvement. The contribution gender variable (GEN_TWP1 and GEN_TWP3) towards drinking water pressure were more preferred.
388
YACOB et al., Curr. World Environ., Vol. 8(3), 381-389 (2013)
The payment vehicle for drinking water quality service improvement simply uses an increase in water billing price, measured as a percentage (%). The household is required to trade off how many percent (%) he or she is willing to pay as an increase in the water price they pay to obtain and enjoy a varying mix of water service attributes. The attributes for the water billing price (PRICE). Thus, the marginal values can be calculated from the marginal rate of substitution between an attribute coefficient and the coefficient for the price parameter. MRS are estimated and reported in Table 4. The marginal rate of substitution of the tap water attributes for each level and it was translated as percentage increase over the current water bill that the households are willing to pay for the improvement in their water quality attributes, TWQ2 and TWQ3 have a marginal values of 185% and 220% as a percentage increase over the current water bills respectively, TWS1 and TWS2 have the marginal values of 29% and 171% as a percentage increase over the current water bills respectively, similarly, TWP1 and TWP3 are having a value 8% and 137% percentage increase over the current water bills respectively. With the exception of TWP1 all the parameter level are statistically significant at least at 10% level, this explains the fact that household are not willing to pay more for any water pressure level below the status quo at TWP2. The marginal rates of substitution between the tap water attributes for each level and for the interacting variables it is been presented as a percentage increase over the current water bills which households are willing to pay for their drinking water quality improvements. TWQ2 and
TWQ3 have marginal values standing at 110% and 126% and TWS1 and TWS2 have marginal value equivalent to 30% and 168% increase over the current water bills, TWP1 and TWP3 stood at amazingly high values of 259% and 286% increases over the current water bill respectively. Inclusion of socio-demographic characteristics of households to the simple model was justified to take care of the heterogeneity in the preferences of the householdswere interacted with the main attributes (TWQ2_EDU, TWQ3_EDU, TWP1_GEN and TWP3_GEN). The result of the model that interacted with the main attributes have improves the model fit, there is an improvement in the log likelihood of the interaction model. This implies water quality attributes and levels included in the model with interactions have avails the households with more choice options than the simple models. CONCLUSION The result of this study which to the authorsâ&#x20AC;&#x2122; knowledge is the first of its kind in the study area proves the willingness of households in Damaturu to pay more than what they have been paying in order to get improved quality drinking water. Similar to finding by Whittington et al., (1991) in Onitsha Nigeria where households are paying more than the authorized tariff to get safe drinking water from other sources. Provision of safe drinking water will be a timely intervention by the government towards poverty and health related diseases reduction which will eventually improve the living standard of people in Damaturu.
REFERENCES 1.
2.
Akinsola. R.O, Garba. B.M.I. and Godowoli.I Bacteriological analysis of bore-hole water in Federal Polytechnic Damaturu. Chemclass journal. pp214-217 (2007). Babalola., A. Tsenbeya., H. Busu., I. and Majid., M.R. Practice and Challenges of solid waste Management in Damaturu, Yobe State, Nigeria. Journal of Environmental Protection December 2010, http://www.sci Rp.org/journal/jep (2010).
3.
4. 5.
Babalola. A and Busu. I ,Selection of landfield sites for solid waste treatment in Damaturu town using GIS technique. Journal of environmental protection 2, 1-10 (2011). http://www.Scr Rp.org/journal/jep. Bateman, I.J., Carson., R.T., Day, B., Hanemann, M.,N., Hett, T., Jones-Lee, M., Loomes, G., Maurato, S., ĂŚzdemiroglu, E., Pearce, D. W., Sugden, R., and Swanson, J., Economic Valuation with stated Preference
YACOB et al., Curr. World Environ., Vol. 8(3), 381-389 (2013)
6.
7.
8. 9.
10.
11.
12.
13.
14.
Techniques: A Manual, Cheltenham: Elgar (2002). Casey J.F, Kahn J.R, and Rivas. A. Willingness to pay for improve water Service in Manaus, Journal of Ecological Economics 58, 65-372 (2006). Cholera death toll rises to 352. Tribune Newspaper 26th August . www.tribune.com.ng/index ...10239-choleradeath-toll-rises-to-352 (2010). Damaturu Yobe State: (www.nipost gov.ng/ post) map viewed on 28/12/2011 Dawoud., M.A and Raouf., A.R.A : Groundwater Exploration and Assessment in Rural Communities of Yobe State, Northern Nigeria. Water Resources management, 23:3, 581-601 (2010). Dol:10.1007/s11269-008-9289-x Emeka., D.O and Weltime., O.M : The Trace of Elements Determinations in Municipal Water Supply in Damaturu Metropolis, Yobe State, Nigeria. Bayero Journal of Pure and Applied Sciences, 1:1 (2008). Genius. M, Hatzaki.E, Kouromichelaki.E.M, Kouvakis.S, Nikiforaki.S, Tsagaraki.K.P, Evaluating consumersâ&#x20AC;&#x2122; willingness to pay for improved portable water quality and quantity, Water resources management 22: 18251834 (2008). Hala, A.A, and Carlsson, F. Evaluating the Welfare Effect of Improved Quality Water Using Choice Experiment Method. Department of Economics, Gothenburg University, Working Paper in Economics Number. 131 (2004). Hensher. D, Shore.N and Train.K Householdsâ&#x20AC;&#x2122; willingness to pay for water services attributes. Environmental & resource economics 32: 509-531 (2005). John D Zuane P.E , Hand book of Drinking water quality. John Willey and Sons, Inc. USA
15.
16. 17.
18.
19.
20.
21.
22.
23.
24.
389
(1996). Louviere,J.J, Hensher,D.A, Swait.J.D, and Adamowicz,W. Stated choice methods:Analysis and applications. Cambridge, United Kingdom, Cambridge University Press (2001). Map of Nigeria, www.mapsofworld.com viewed on 22/12/2011s Mc Fadden, D. Conditional Logit analysis of Qualitative Choice Behavior: Frontier in Economics: 15: 447-470 (1974). Mitchell R.C and Carson , USA.Using survey to value public goods. Washington DC (1989). Oruonye., E.D and Medjor., W.O. Microbial analysis of Municipal Water Supply in Damaturu, Yobe State, Nigeria. Nigerian Journal of Microbiology. 24(1): 2106-2109 (2010). Poirier. J and Fleuret. A , Using a choice experiment method for valuing improvement in water quality: a simultaneous application for four recreation site of river basin. Viewed on 10/4/2012. Congress.afse.fr/docs/2010/ 920347papiermultiside.pdf (2010). Train, K.E , Discrete choice method with simulation. Cambridge, United Kingdom Cambridge University Press (2003). Mohd Rusli, Y., Alias, R., and Shuib, A. Economic Valuation of Marine Park Ecotourism Malaysia: The case of Redang Island Marine Park. Universiti Putra Malaysia Press (2008). Yobe State government of Nigeria ,Final water supply and sanitation policy, Yobe printing corporation, pp 22 (2010). Whittington. D, Lauria. D, T and Xinming Mu: A study of water vending and willingness to pay for water in Onitsha, Nigeria. World Development 19: 2/3, pp. 179-198. Great Britain (1991).
Current World Environment
Vol. 8(3), 391-394 (2013)
Mexico's Glaciers and their Close Disappearance: A Precise Thermometer of the Global Warming Advance on a Global Scale RAMIRO RAMIREZ NECOECHEA1*, ISABEL VALENZUELA MERAZ2 and JOSE FRANCISCO HERNANDEZ RAMIREZ3 1
Departamento De Producción Agrícola Y Animal, Universidad Autónoma Metropolitana, Xochimilco, Calzada Del Hueso 1100, Col. Villa Quietud, Delegación Coyoacán, C.P. 04960, México. 2 Universidad Juárez Del Estado De Durango, Constitución 404 Sur Zona Centro, C.P. 34000 Durango, Dgo. México. 3 Facultad De Estudios Superiores Zaragoza, UNAM. Batalla 5 De Mayo S/N Esq. Fuerte De Loreto, Col. Ejército De Oriente, México. http://dx.doi.org/10.12944/CWE.8.3.07 (Received: September 16, 2013; Accepted: October 20, 2013) ABSTRACT Maxican glaciers of the Iztaccihutl, Orizaba's peak (Citlaltepetl) and pococatepetl will disappear in the next 10 to 35 years, warms a study from the National Autonomous University of Mexico (UNAM) (Lorenzo 1964)
Key words : Mexico's Glaciers, Global Warming, Iztaccihuatl.
INTRODUCTION Mexican glaciers of the Iztaccihuatl, Orizaba's peak (Citlaltepetl) and Popocatepetl will disappear in the next 10 to 35 years, warns a study from the National Autonomous University of Mexico (UNAM) (Lorenzo 1964). Mexico's Glaciers focalize an unusual global interest, on one hand; they are the only one in latitude 19° north and exist due to the mountains that allocate then have heights higher than 5000 meters. International organization studying global climate change (World Glacier Monitoring Service and World Meteorological Organization), among others, consider the analysis of their behavior as one of the best global climate indicators of climate change (White 1954). In this context, our glaciers became the most exact global climate measure tools in their latitude. On the other hand, some are located over
active volcanoes and therefore, there is the chance that an eruptive reactivation generates volcanic detritus flux events that can result catastrophic, as an example of this: in 1985, The Nevado del Ruiz in Colombia (mountain of similar height to Popocatepetl), had a relatively small eruption and generated an event that buried almost 20 thousand people from the near town of Armero. In Mexico having similar circumstances is impossible, given the distance of the population to the glaciers, never the less the volcanoes with glaciers are studied closely. The best studied is the Popocatepetl's; it's eruption on December 1994 awoke great interest in the glacier behavior, combined with the eruptive activity (Delgado 1997). Likewise the glaciers in Mexico, there is the risk that in the next years countless ice reserves in Latin-American mountains disappear. The information becomes worrisome for both of the tropics, only in Peru there's been more
392
RAMIREZ NECOECHEA et al., Curr. World Environ., Vol. 8(3), 391-394 (2013)
than 145 lost glaciers in the last decades; Peru is the Latin-America country with the most ice bodies in the heights.
glaciers are also withdrawing, but may live longer, even though its ice bodies are very vulnerable since they are thin and exposed to high temperatures.
Bolivia is in the same situation; it registered the nearly total extinction of the ice body of the Chacaltaya Mountain and left almost waterless the La Paz and Los Altos Cities.
The Popocatepetl This volcano presents and will present even more seracs due to the eruption presented since 1994, which accelerated the glacier melting to near extinction, the glaciers threatened by global warming and volcanic activity are Ventorrillo's and Northeast glaciers, the last one has diminished it's extension to almost disappearance; meanwhile the North glacier's characteristic fissures have deepened importantly until diminishing the glacier thickness and extension in more than 50%.
The first Mexican glacier inventory was made by Dr. Jose Luis Lorenzo (1959) who pointed that in 1958 the total glacier area in the Popocatepetl was 0.89 Km2; the second inventory (in 1982), determined 0.56 Km2, and the third inventory (in 1996), 0.53 Km2. In 2000 it had the 30% of the 1958 registered area and 44% was lost between 1996 and 2000. The ablation-accumulation cycle broke since 1996, given that the glaciers only lost mass and didn't recover ice. In visited sites in 1995 the ice had a thickness of 40 meters; in 2000 only 4. This allowed documenting the accelerated extinction of the Popocatepetl glaciers on the late 2000 (Delgado 1997). The ice remnants that are still visible, scarcely fulfill the glacier characteristics, and are seracs only (independent blocks of ice), that hang unstably and keep melting without the characteristic glacier movement. It's worth mentioning that the Popocatepetl extinction is due to three factors: Global Climate Change, Big population centers influence and eruptive activity. Even if these glaciers were close to disappearing due to the first two, the acceleration occurred due to the eruptive activity. To quantify the climate change and the population centers influence in this process studies are being conducted on Citlaltepetl (Palacios 1996) andthis investigation raises questions on the possible future impact of the end of the ice bodies, as a consequence of eliminating a source of aquifers recharge and the danger the seracs represent, along with the eruptive activity for mountaineers. The Mexican glaciers refuse to die, but will irremissibly extinguish. It's important to document this phenomenon, including its causes. The current results reflect great withdraw, for instance, Iztaccihuatl has a 20% glacier area loss in 24 years. It is predicted that it will disappear between 2020 and 2025 of earlier if the regions temperature keeps increasing. The Citlaltepetl
The Iztaccihuatl The problem with this volcano is altitude, its glaciers are below the 5200 meter bench mark, that it's the peak of the mountain, at this height the snow bodies are highly vulnerable to tropic climate degradation. The temperature of the ice bodies is near 0°C, and the atmosphere temperature is higher, therefore not cold enough to preserve them; so, the ice bodies could disappear at any moment. The Iztaccihuatl glaciers were twelve 40 years ago, and had the following names: Head glacier Neck glacier Ayolotepito glacier North glacier Northeast glacier West glacier Northwest glacier Oriental Center (Huilango) glacier Ayolocoor Piedra Lisa glacier Southeast glacier Atzintli glacier San Agustin glacier Of which Head and Neckand San Agustin are already gone, the rest of the ones over the 4800 AMSL benchmark are in great degradation. Of these the biggest which are the Ayolotepito, Ayoloco or Piedra Lisa, Atzintli and Oriental Center have shrunk in more than 50% of the frozen water storage capacity compared to which they had 40 years ago.
RAMIREZ NECOECHEA et al., Curr. World Environ., Vol. 8(3), 391-394 (2013) The Citlaltepetl The future for the Citlaltepetl of Orizaba's Peak is a bit more encouraging, even though no precise estimation is available, it's been calculated its glaciers can live until around 2040, because they are located at 5700, which allows more ice accumulation. Even with this fact, there are glaciers that are mostly gone, since only some remnants are left and are basically the occidental side of the volcano, these are: Bull glacier Beard glacier Northeast glacier West glacier Southwest glacier In the oriental side the oriental and east glaciers have survived but are on clear degradation. Meanwhile the glaciers of the north face, which are the Jamapa and Chichimeco ones, will subsist for the longest due to their ice volumes which are quite important. However, the thickness of the ice sheetsof about 10 meters and with a maximum of 40, and a temperature near 0 Celsius degrees, are still very vulnerable in tropical conditions. The Threat The issue is that with the melting of the ice bodies, the waters drain to the lakes, or form lagoons contained by moraines (natural damns made by eroded rocks and accumulated by glaciers). However, these rock and ice deposits in their interstice suffer fusion due to climate warming and, as a result are weakened by natural damns, which represent a danger, since if they overboard or collapse a disaster could occur which more likely
393
won't happen, since in Mexico the glaciers are too small, their gradual melting and their farness from the populated centers. Even though the solution would be to drain it, on the long run -with the disappearance of the glaciers-, the centers wouldn't count with water to feed the hydroelectric systems, and neither for direct human consumption and even less for livestock activities and agriculture. In Mexico's case, gradual but constant ice body melting is present that show a warning that in the next three decades the Iztaccihuatl, Orizaba's peak and Popocatepetl glaciers can disappear as a consequence of global warming. In conclusion the lack of water contribution from the glaciers will create supply problems in towns such as San Rafael, Tlalmanalco, Amecameca, Ozumba, San Pedro Nexapa, because they are the principal establishments highly dependent of the waters generated by the Iztaccihuatl and Popocatepetl glaciers, affecting considerably the porcine, dairy and poultry production of the zone. The Iztaccihuatl and Popocatepetl oriental flow threatened the Puebla's valley aquifers recharge and the free rolling of superficial waters. The disappearance of these glaciers is in synthesis a clear warning of the meaning that has and will have the global warming and its impact over macro and micro ecosystems in the side of the volcanoes of which important livestock production depend, such as porcine, wool, poultry and cattle and a great mass of human population, 4.5 million inhabitants (Aguirre 2012) closest to the volcano of which 7,000,000 stand in a high risk zone in case of Popocatepetl's eruptive activity, however the main threat is to protect against gases and ashes produced by low eruptive activity 25,000,000 people who live around the Popocatepetl in cities on Mexico and Puebla.
REFERENCES 1. 2.
Aguirre Arvizu A. “Popocatepetl puts Mexico in alert”ContenidoNo. 588 ,pag 76-83 (2012). Delgado Granados, H. “The glaciers of Popocatépetl volcano (Mexico): changes and
3.
causes.”Quatermary international, 43/44: 5360, (1997). Lorenzo, J.L. “The Glaciers of Mexico.”Geophysics Institute Monographs,
394
4.
5.
RAMIREZ NECOECHEA et al., Curr. World Environ., Vol. 8(3), 391-394 (2013) U.N.A.M, 1; (1959). Lorenzo, J.L. “The Glaciers of Mexico” (Second edition). Geophysics Institute Monographs , U.N.A.M, 1; (1964). Palacios, D. and Vaquez-Selem, L. “Geomorphic effects of the retreat of Jamapa
6.
Glacier, Pico de Orizava volcano.Mexico.”Geografiska Annaler, 77A: 19-34 (1996). White, S. E. “Neoglacial to recent glacier fluctuations on the volcano Popocatepetl, Mexico.” Journal of Glaciology, 27(96); 359363, (1981).
Current World Environment
Vol. 8(3), 395-402 (2013)
Current Status of Mammals and Reptiles at Hub Dam Area, Sindh / Balochistan, Pakistan ABEDA BEGUM*1, M ZAHEER KHAN2, ABDUR RAZAQ KHAN3, AFSHEEN ZEHRA2, BABAR HUSSAIN4, SAIMA SIDDIQUI4 and FOZIA TABBASSUM2 1
Department of Environmental Science, Federal Urdu University of Arts, Science and Technology, Karachi, Pakistan. 2 Department of Zoology, Faculty of Science, University of Karachi, Karachi, Pakistan. 3 Halcrow Pakistan (Pvt) limited, Karachi, Pakistan. 4 Department of Zoology, Federal Urdu University of Arts, Science and Technology, Karachi, Pakistan. http://dx.doi.org/10.12944/CWE.8.3.08 (Received: October 01, 2013; Accepted: November 02, 2013) ABSTRACT During the present study in 2012, a total of twenty four mammalian species were recorded belonging to 5 orders and 10 families; out of these, 8 species are less common, 2 species are rare, while 14 species are common in Hub Dam area. Twenty five reptilian species belonging to 3 orders and 12 families were also recorded from the area. Three species of mammalian Urial (Ovis vignei), Chinkara/Indian Gazelle (Gazella bennettii) and Jungle Cat (Felis chaus), one reptilian species Common Krait (Bungarus caeruleus) were recorded as rare from the study area during 2012. During the present study, nine mammalian species Wild Goat/Sindh Ibex (Capra aegagrus), Urial (Ovis vignei), Chinkara/Indian Gazelle (Gazella bennettii), Indian Hedgehog (Paraechinus micropus), Cape Hare (Lepus capensis), Little Indian Field Mouse (Mus booduga), House Shrew (Sorex thibetanus), Balochistan Gerbil (Gerbillus nanus) and Indian Gerbil (Tatera indica) and two reptilian Warty Rock Gecko (Cyrtodactylus kachhensis kachhensis) and Banded Dwarf Gecko (Tropiocolotes helenae) were recorded from the area. As regards threats to mammals and reptiles, these are affected by disturbance. Efforts are being made to conserve the important mammals and reptiles particularly in the protected area especially at Hub Dam.
Key words: Mammalian and Reptilian Fauna, Rare Species, Status, Protected Areas.
INTRODUCTION It is also an important area for Urial and Sind Ibex15. In the Khirthar Protected area Complex (KPAC), total of 33 species of mammals has so far been recorded15. Asia is rich in habitats and biodiversity, and correspondingly rich in turtle species 12 . According to IUCN (2009), there are now 1,677 reptiles species have been included on the IUCN Red List, with 293 added in 2009. In total, 469 are
threatened with extinction and 22 are already Extinct or Extinct in the wild. Pakistan has 179 species of reptilian fauna consisting of turtles, tortoises, crocodile, gavial, lizards and snakes21. Auffenberg et al., (1989, 1991), Boulenger (1890), Ghalib et al. (1981), Iffat and Auffenberg (1988), Khan (2006), Khan and Mirza (1977), Khan and Nazia (2003), Khan et al. (2005), Mertens (1969), Minton (1966), Rahman et al. (2002), Rahman and Papenfuss (2005) and Iffat (2006, 2009) have contributed some work in the field of herpetofauna of Pakistan.
396
BEGUM et al., Curr. World Environ., Vol. 8(3), 395-402 (2013)
Hub dam (25° 15"N 67° 07´E) was constructed on Hub River in 1981, at a distance of 56 km North of Karachi in Sindh - Balochistan provinces border6. Main Dam is 15,640 meters (m) long of which 10,240 m lies in Sindh while rest in Balochistan13. Hub Dam was declared as a Wildlife Sanctuary in 1972 to conserve waterbirds and the indigenous fish Mahsheer (Tor putitora)13. Before the creation of the dam, this area was famous among anglers as the habitat of Mahaseer, a game fish6. The dam is situated in an area of semi arid and desert with sedimentary rocks. There are a few small islands in the midst of the reservoir. Hub River originates in Kirthar Range of eastern Balochistan and enters the Arabian Sea just west of Karachi. The Hub River separates the provinces Balochistan and Sindh, each of which receives water by a canal from Hub Dam reservoir18. The water level in the reservoir fluctuates widely according to rainfall in the water catchment area which extends over 3410 sq. miles. The topography of the upper catchment is sub - mountainous to hilly and plain. The area is generally barren with sparse vegetation at certain locations. The catchment of the Hub reservoir is wholly rain fed. The dam is relatively shallow with maximum depth of 9.6 m. The water has relatively high concentration of dissolved salts of sulphates, sodium and chloride and dissolved oxygen which results into high greater primary and secondary production. The climate of the area is predominantly arid and with an average annual rainfall of less than 200 millimeters (mm). The temperature often exceeds 36 Celsius (°C) during summer6. A Forest Plantation and Recreational Park of about 80 ha has been established by Balochistan Forest Department6. Khan et al., (2012a), reported about the fauna and the environmental conditions of Hub Dam Wildlife Sanctuary area of KPAC, and reported to have encountered 16 species of mammals, 160 species of birds, 23 species of reptiles, 03 species of amphibians, 29 species of fishes, and 25 species of plants13. The objective of the present study was to determine the habitat and current status of the mammals and reptiles at Hub Dam Wildlife Sanctuary.
MATERIAL AND METHODS Study Areas Area near Spill way (N 25° 17´ 23.2, E 67° 05´ 55.6), having rocky slopes with spare vegetation and reservoir area, Main Dam area (N 25° 14´ 35.5, E 67° 06´ 45.8), wetland area, Hub Canal (N 25´ 14´ 26.6, E 67° 06´ 48.6), rocky, agricultural and plain area, Shallow water area towards Khar Center (N 25° 14´ 55.3, E 67° 08´ 56.3), agricultural, marshes and rocky, Usman Qalandria (N 25° 17´ 38.5, E 67° 05´ 94.2), rocky and plain area, Robo Khaskheli Goth (N 25° 17´ 48.4, E 67° 10´ 12.2), rocky, flat and plain area, Robo Goth (N 25° 14´ 48.1, E 67° 09´ 32.5), rocky and plain area, Rest House Side (N 25° 15´ 40.1, E 67° 05´ 54.8), rocky and wetland area, Plantation Area (N 25° 16´ 32.3, E 67° 06´ 39.1), forest, rocky and wetland area and Bund Murad (N 26° 05´ 77.4, E 69° 09´ 39.0), rocky and wetland area. Mammals and Reptiles Various methods or survey techniques have been employed for the observation of mammals and reptiles. For the identification of reptiles, Minton (1966)16 was used. Mammalian survey: For observing mammals, field trips were mostly arranged early in the morning and different direct and indirect observation methods were applied. For diurnal mammals, direct observation methods were used while for nocturnal large mammals, indirect observation methods such as, observing pug marks, fecal material, territory marking signs etc., were used. Most of the small mammals, like rodents, lagomorphs etc., were directly observed in the day time whereas for nocturnal small mammals different live traps were used. Reptilian survey To study the reptilian fauna, field visits were carried out between 10:00 am to 3:00 pm. Stone turning, looking at and through bushes, observing large trees keenly, walking along streams, and turning scattered debris accumulated under trees were various means used to find lizards and snakes. Fast moving Agamid lizards were collected by striking with stick. Some specimens were pulled out with the help of long forceps from
BEGUM et al., Curr. World Environ., Vol. 8(3), 395-402 (2013) crevices in stones while a few were collected by hand from under the stones. RESULTS AND DISCUSSION 24 species of mammals belonging to 5 order and 10 families were recorded during the present study (Table 1), which include the key species such as Sindh Ibex or Sind Wild Goat (Capra aegagrus) , Urial (Ovis vignei) (Fig. 2), Chinkara (Gazella bennettii) (Fig. 3), along with Red Fox (Vulpes vulpes), Indian Fox (Vulpes bengalensis), Jungle Cat (Felis chaus), Indian Hare (Lepus nigricollis), Indian Jackal (Canis aureus), Five striped palm Squirrel (Funambulus pennanti) and Cairo Spiny Mouse (Acomys cahirinus) which were sighted and counted during the present study. On the basis of percentage composition and species richness, order Rodentia was dominant (10 species) followed by Sciuridae, Hystricidae and Soricidae (1species each) and
Muridae (7species), next order Carnivora represented (6 species) followed by Felidae (1species), Canidae (3 species) and Herpestidae (2 species), Artiodactyla represented 3 species by Bovidae, Insectivora 2 species by Erinaceidae, Lagomorpha 2 species by Leporidae, and Chiroptera 1 species by Pteropidae (Fig4). During the present investigation the order of dominance is as follows: Rodentia > Carnivora > Artiodactyla > Insectivora = Lagomorpha > Chiroptera. Three species of mammals viz. Urial, Chinkara / Indian Gazelle and Jungle Cat were recorded as rare from the study area during 2012. Sixteen species of mammals belonging to 6 orders and 10 families were recorded from the study area13. Nine species of mammals recorded during the present study viz. Wild Goat/Sindh Ibex (Capra aegagrus), Urial (Ovis vignei), Chinkara/Indian Gazelle (Gazella bennettii), Indian Hedgehog
Fig. 2. Urial (Ovis vignei) (source: Sindh Wildlife Department). Fig. 1. Satellite image of Study Areas
Fig. 3. Chinkara (Gazella bennettii)
397
Fig. 4. Percentage contribution of different families of mammals
398
BEGUM et al., Curr. World Environ., Vol. 8(3), 395-402 (2013)
Fig. 6. Saw Scaled Viper Fig. 5. Indian Spiny - tailed Lizard
Fig.7. Percentage contribution of different familie of Reptiles (Paraechinus micropus), Cape Hare (Lepus capensis), Little Indian Field Mouse (Mus booduga), House Shrew (Sorex thibetanus), Balochistan Gerbil (Gerbillus nanus) and Indian Gerbil (Tatera indica) were not recorded previously13. The common species of the mammals found in the Keenjhar lake include Palm Squirrel (Funambulus pennanti), Indian Gerbil (Tatera indica), Indian Desert Jird (Meriones hurrianae), House Mouse (Mus musculus), House Rat (Rattus rattus), Asiatic Jackal (Canis aureus) and Indian Porcupine (Hystrix indica)14. During the present study, all these species of Sindh were observed as a common species from the area. One main specie Indian Pangolin (Manis crassicaudata), although previously recorded from the area, was not recorded or reported during the present study while it was reported as a less common during the Study in 2007-201013. There is lot of disturbance to the wild animals due to movement of local people in the area15. During the present study, the main threats to the mammals of Hub Dam were documented viz; habitat degradation, weak enforcement of wildlife laws and lack of public awareness.
A Total of twenty seven reptilian species was recorded from Karachi areas including 3 turtles, 9 lizards and 15 snakes12. In Pakistan, reptiles are a blend of Palaearctic, Indo- Malayan and Ethiopian forms4. 23 species of reptiles were reported from Hub Dam area13. During the present study, 25 species of reptiles belonging to 3 order and 12 families were recorded from the study area (Table 2). Marsh Crocodile (Crocodylus palustris), Brilliant Agama (Trapelus agilis), Indian Spiny â&#x20AC;&#x201C; tailed Lizard (Uromastix hardwickii) (Fig.5), Indian Monitor Lizard (Varanus bengalensis), Indian Cobra (Naja naja), Indian Fringed toed Lizard (Acanthodactylus cantoris), Indian Desert Monitor (Varanus griseus) Indian Sand Boa (Eryx johnii), Common Krait (Bungarus caeruleus) and Saw Scaled Viper (Echis carinatus) (Fig.6) are the important species of reptiles of the area. On the basis of percentage composition and species richness, order Squamata was dominant (23 species) followed by Gekkonidae (6species), Agamidae (5species), Uromastycidae, Lacertidae, Typhlopidae and Viperidae (1 specie each), Varanidae, Boidae, Colubridae and Elapidae (2 species each), while Chelonia and Crocodilia represented 1 specie by Emydidae and Crocodylidae respectively (Fig7). During the present investigation the order of dominance is as follows: Squamata > Chelonia = Crocodilia One of the reptilian specie Common Krait (Bungarus caeruleus) was recorded as rare from the study area. The common species of reptiles of the area include Spotted Indian House Gecko
Order
Artiodactyla Artiodactyla Artiodactyla Insectivora Insectivora Chiroptera Carnivora Carnivora Carnivora Carnivora Carnivora Carnivora Lagomorpha Lagomorpha Rodentia Rodentia Rodentia Rodentia Rodentia Rodentia Rodentia Rodentia Rodentia Rodentia
S. No.
01 02 03 04 05 06 07 08 09 10 11 12 13 14 15 16 17 18 19 20 21 22 23 24
Bovidae Bovidae Bovidae Erinaceidae Erinaceidae Pteropidae Canidae Canidae Canidae Herpestidae Herpestidae Felidae Leporidae Leporidae Sciuridae Soricidae Hystricidae Muridae Muridae Muridae Muridae Muridae Muridae Muridae
Family Capra aegagrus Ovis vignei Gazella bennettii Paraechinus micropus Hemiechinus collaris Rousettus egyptiacus Canis aureus Vulpes bengalensis Vulpes vulpes Herpestes edwardsi Herpestes javanicus Felis chaus Lepus capensis Lepus nigricollis Funambulus pennanti Suncus murinus Hystrix indica Rattus rattus Mus booduga Mus musculus Acomys cahirinus Gerbillus nanus Tatera indica Meriones hurrianae
Scientific Name
Status
Wild Goat/Sindh Ibex L/C Urial R Chinkara/Indian Gazelle R Indian Hedgehog L/C Long eared or Desert Hedge hog C Egyptain Bat L/C Asiatic Jackal C Indian Fox L/C Red fox C Indian Grey Mongoose C Small Indian Mongoose C Jungle Cat R Cape Hare L/c Indian Hare L/c Five striped palm Squirrel C House Shrew C Indian Porcupine C Roof Rat / House Rat L/c Little Indian Field Mouse C House mouse C Cairo Spiny Mouse L/c Balochistan Gerbil C Indian Gerbil C Desert Jird C
Common Name
Table 1. List of Mammals Recorded from Hub Dam Area winter √ √ √ √ √ √ √ X √ √ √ √ √ √ √ √ √ √ √ √ X √ √ √
summer √ √ √ √ √ √ √ √ √ √ √ X √ √ √ √ √ √ √ √ √ √ √ √
BEGUM et al., Curr. World Environ., Vol. 8(3), 395-402 (2013) 399
Emydidae Crocodylidae Gekkonidae Gekkonidae Gekkonidae Gekkonidae Gekkonidae Gekkonidae Agamidae Agamidae Agamidae Agamidae Agamidae Uromastycidae Lacertidae Typhlopidae Viperidae Varanidae Varanidae Boidae Boidae Colubridae Colubridae Elapidae Elapidae
01 02 03 04 05 06 07 08 09 10 11 12 13 14 15 16 17 18 19 20 21 22 23 24 25
Chelonia Crocodilia Squamata Squamata Squamata Squamata Squamata Squamata Squamata Squamata Squamata Squamata Squamata Squamata Squamata Squamata Squamata Squamata Squamata Squamata Squamata Squamata Squamata Squamata Squamata
Family
S.NO Order Hardella thurjii Crocodylus palustris Cyrtodactylus kachhensis Tropiocolotes helenae Eublepharus maculatus Hemidactylus brooki Hemidactylus leschnaultii Hemidactylus flaviviridis Trapelus megalonyx Trapelus agilis Laudakia nupta Calotes versicolor Noveumeces schneiderii Saara hardwickii Acanthodactylus cantoris Typhlops porrectus Echis carinatus Varanus bengalensis Varanus griseus Eryx johnii Psommophis candanura Platyceps rhodorachis Platyceps vertromaculatus Naja naja Bungarus caeruleus
Scientific Name Brahminy River Turtle Marsh Crocodile Warty Rock Gecko Banded Dwarf Gecko Fat tailed Gecko Spotted Indian House Gecko Bark Gecko Yellow-bellied House Gecko Afghan Ground Agama Brilliant Agama Yellow-headed Agama Common Tree Lizard Orange Spiny-tailed Lizard Indian Spiny-tailed Lizard Indian Fringed-toed Lizard Slender Blind Snake Saw Scaled Viper Indian Monitor Lizard Indian Desert Monitor Indian Sand Boa Indian Sand Snake Cliff Racer Glossy bellied Racer Indian Cobra Common Krait
Common Name
Table 2. List of Reptiles Recorded from Hub Dam Area
L/c R L/C L/C L/c C L/c C L/c L/c L/c C L/c L/c C L/c L/c L/c L/c L/c L/c L/c L/c L/c R x x x x x x x x x x x x x x x x x x x x x x x
x
x
x x
x
x
Status summer winter
400 BEGUM et al., Curr. World Environ., Vol. 8(3), 395-402 (2013)
BEGUM et al., Curr. World Environ., Vol. 8(3), 395-402 (2013) (Hemidactylus leschnaultii), Yellow-bellied House Gecko (Hemidactylus flaviviridis), Common Tree Lizard (Calotes versicolor) and Indian Fringed-toad Lizard (Acanthodactylus cantoris). Two reptilian species viz. Warty Rock Gecko (Cyrtodactylus kachhensis kachhensis) and Banded Dwarf Gecko (Tropiocolotes helenae) were recorded during present study but not reported previous by13. The key species of the Haleji Lake. include; Indian Monitor (Varanus bengalensis), Desert Monitor (Varanus griseus), and Spiny-tailed Lizard (Saara hardwickii), while Marsh Crocodile (Crocodylus palustris) is recorded as a threatened species 14. During the present study, these all species of Sindh were recorded from the present selected areas. All mammalian species were reported during summer except Jungle Cat; and Indian Fox and Cairo Spiny Mouse were not able to report during winter while most of the reptilian species were reported during summer and Marsh Crocodile, Common Tree Lizard, Indian Spiny-tailed Lizard, Indian Monitor Lizard and Indian Fringed-toed Lizard were reported during winter (Table 1& 2). Changes in land use practices, habitat modification, hunting, unregulated fishing, overexploitation, conflicts with Wild Boars, Jackals, Fox spp. and snakes with local community, and
401
trapping of mongoose spp., Cobra, Dhaman and Monitor lizard, etc. were major threats to the wildlife of the reservoir and surroundings19. During the present study, the unregulated fishing, overexploitation, and hunting have been observed but no sever threats are observed for reptiles species. Like Khar Center, here in the Karchat area local communities have been using the same point for the collection of drinking water and due to the movement of people in the area, wild animals have been disturbed. There is competition for grazing between the domestic livestock and the wild animals. There is a lot of disturbance to the wild animals due to movement of local people in the area. CONCLUSION On the basis of observations, the threats to the mammals of Hub Dam were documented viz; Habitat Degradation, Weak Enforcement of Wildlife Laws and lack of Public Awareness. No severe threats to the reptiles of the area were reported. It is concluded that the area is rich in diversity. It is suggested that the management plan of the reservoir should be implemented in its true letter and sprit. Public awareness programmes may be taken up for the conservation and sustainable utilization of the natural resources.
REFERENCES 1.
2.
3.
4.
5.
Auffenberg, W., Rahman, H., Iffat, F. and Perveen, Z., A study of Varanus flavescens (Sauria Varanidae). Bombay Nat. Hist. Soc. 86:286-307 (1989). Auffenberg, W. and Rahman, H. 1991., Studies on Pakistan Reptiles. Pt. I. The genus Echis (Viperidae). Bull. Florida Mus. Nat. Hist. 35(5): 263-314 (1991). Boulenger, G.A., Fauna of British India, including Ceylon and Burma: Reptile and Batrichia, London (1890). Fatima F. Distribution and status of freshwater turtles in Sindh. Ph.D. Thesis, Department of Zoology, University of Karachi (2008). Ghalib, S.A., Rahman, H., Iffat, F. and Hasnain, S.A., A Checklist of Reptiles of Pakistan. Rec. Zool. Surv. Pakistan. 8:37-59
6.
7.
8.
9.
10.
(1981). Ghalib, S.A., Hasnain, S.A. and Khursheed, S.N., Observations on the Avifauna of Hub Dam. Pak.J. Zool. 32(1): 27 â&#x20AC;&#x201C; 32 (2000). Iffat, F. and Auffenberg, W., New Reptile Records for Pakistan, Agama minor. Sauria. 19:61 (1988). IUCN., Extinction Crisis Continues Apace (2009). Khan, M.S. and Mirza, M.R., An annotated Checklist and key to the Reptiles of Pakistan Part II: Sauria (Lacertilia). Biologia. 23:41-64 (1977). Khan, M.Z. and Nazia, M., Current Population Status of Diurnal Lizards of Karachi, Pakistan. Russian Journal of Herpetology. 10(3):207210 (2003). Khan, M.Z., Hussain, B. and Ghalib, S.A.,
402
11.
12.
13.
14.
15.
BEGUM et al., Curr. World Environ., Vol. 8(3), 395-402 (2013) Current Status of the Reptilian Fauna along Karachi Coast with Special Reference to Marine Turtles. J. nat. hist. wildl. 4(2):127-130 (2005). Khan, M.S., Amphibians and Reptiles of Pakistan. Kriegar Publishing Company, Malabar, Florida. pp. 311 (2006). Khan, M.Z., Hussain, B., Ghalib. S.A, Zehra. A., and Mahmood, N., Distribution, pollution status and environmental impacts on reptiles in Manora, Sandspit, Hawkesbay and Cape Monze Areas of Karachi Coast. Canadian Journal of Pure and Applied Science. 4(1):1053-1071 (2010). Khan, M.Z., Begum, A., Ghalib. S.A, Khan. A.R., Yasmeen. R., Siddqui. T.F., Zehra. A., Abbas, D., Tabassum. F., Siddqui. S.,Jabeen. T. and Hussain. B., Effects of Environmental Pollution on Aquatic Vertebrate Biodiversity and Inventories of Hub Dam: Ramsar Sites. Canadian Journal of Pure and Applied Science. 6(2): 1913-1935 (2012a). Khan, M.Z., Abbas, D., Ghalib. S.A, Yasmeen. R., Siddqui. S., Mehmood Nazia., Zehra. A., Begum, A., Jabeen. T., Yasmeen, G. and Latif, T.A, Effects of envirobmental pollution on aquatic vertebrates and inventories of Haleji and Keenjhar lakes: Ramsar Sites. Canadian Journal of Pure and Applied Science. 6(1):1759-1783 (2012b). Khan, M.Z., Ghalib. S.A, Khan. A.R., Zehra. A., Yasmeen. R., Hussain. B., Siddqui. S., Abbas, D., Fatima. F., Begum, A., Jabeen. T.,
16.
17.
18.
19.
20.
21.
22.
Tabassum. F., and Hashmi. M.U.A., Current Habitat, Distribution and Status of the Mammals of Khirthar Protected Area Complex, Sindh.7(2):2347-2356 (2013). Minton, S.A., A Contribution to the Herpetology of West Pakistan. Bull. Amer. Mus. Nat. Hist. 134:24-184 (1966). Mertens, R., Die Amphibian and reptilian, West Pakistan. Stuttgarter Beiter Natur Kunde. 197:1-96 (1969). Qaimkhani, M.I., Kamil, M., Ambrat & Khan, G., Water irrigation chemistry of underground water in hub valley KarachiPakistan. Journal of Chemical Society of Pakistan. 27(6): 585589 (2005). Rais, M., Khan, M.Z., Abbass, D., Akber, G., Nawaz, R and Saeed â&#x20AC;&#x201C;ul-Islam, A Qualitative Study on Wildlife of Chotiari Reservoir, Sanghar, Sindh, Pakistan, Pakistan J. Zool.,43(2)237-247 (2011). Rehman, H., Ahmad, S.I. and Fakhri, S., Home Range and Growth Rate of Fringe toad Sand Lizard (Acanthodactylus cantoris) at Hawksbay area, Karachi. Rec. Zool. Surv. Pakistan. 14:49-54 (2002). Rehman, H. and Iffat, F., A Revised Checklist of Reptiles of Pakistan. Records Zool. Surv. Pak. 13: 1- 7 (1997). Rehman, H. and Papenfuss, T.J., An up-todate Checklist of Reptilian Fauna of Balochistan. J. nat. hist. wildl. 4:131-136 (2005).
Current World Environment
Vol. 8(3), 403-408 (2013)
Efficiency of Chemical Treatments on Reduction of COD and Turbidity of Deinked Pulp Waste Water SHADEMAN POURMOUSA Department of Wood and Paper Science and Technology, Faculty of Agriculture and Natural Resources, Karaj Branch, Islamic Azad University. Karaj, Iran. http://dx.doi.org/10.12944/CWE.8.3.09 (Received: August 07, 2013; Accepted: November 05, 2013) ABSTRACT The effect of poly aluminum chloride with cationic or anionic polymers in treatment of deinked waste water has been studied. The experiments were carried out in jar tests with poly aluminum chloride dosages range of 5-20 mg/l, cationic or anionic polymers dosages range of 13 mg/l, pH range of 7.2-8.2, rapid mixing at 100rpm for 2minute, followed by slow mixing at 40 rpm for 10minute and settling for 20minute. The effectiveness of poly aluminum chloride with cationic or anionic polymers were measured based on reduction of turbidity and chemical oxygen demand. The combination of poly aluminum chloride with cationic or anionic polymers is found to give the increase efficiency of purification in the treatment of the deinked waste waters.it can achieve almost66.82 % of turbidity and 63.04 %ofchemical oxygen demand reduction at an optimum dosage of 15mg/l poly aluminum chloride with 3mg/l cationic polymers andpH of 8.2.Theresult suggests that the waste water purified can be used for internal process applications but for injection it to environments goals can be passed biological treatments.
Key words: Deinked waste water, Chemical treatments,Turbidity, Chemical Oxygen Demand, Efficiency.
INTRODUCTION The pulp and paper industry is one of the oldest industrial sectors in the world. It is a highly capital, energy and water intensive industry with highly polluting process and requires sustainable investments in pollution control methods and equipment. In the pulp and paper industry, a huge amount of water flowsthrough different processes. For environmental and economic reasons, the plant recycles the water as much as possible. Before recycling the water is purified to a certain degree. The chemical treatment is one of purification methods.The dosing control of chemicals is very demanding because the quality of water may fluctuate considerably and the effects of chemicals on the purification stage1.
The pulp and paper waste water contains a large amount of pollutants characterized by Biochemical Oxygen Demand (BOD),Chemical Oxygen Demand (COD), suspended solids (SS), toxicity and colorants which cause bacterial and algal slime growth, thermal impacts, scum formation, color problems and a loss of both biodiversity and aesthetic beauty in the environment2. Several researches have been studied on biological, chemical and physicochemical treatment of pulp and paper mills waste water 3, 4.based on Thompson et al, the pulp and paper mills waste water have low BOD/COD ratio usually between0.02-0.07. Morais et al believed that the low ratio of BOD/COD makes the biological treatment methods inappropriate for pulp and paper mills waste water5.
404
POURMOUSA., Curr. World Environ., Vol. 8(3), 403-408 (2013) Methods for the Examination of water and waste water (APHA 1998)8.
Waste water treatment of pulp and paper mills consumed the large amount of chemicals using alum, ferric chloride, ferric sulphate and lime through chemical processes6. So it seems that physic- chemical processes should be interesting method for treatment of the pulp and paper mills waste water because of they are economic and based on the coagulation - flocculation process of small particles followed by an adjusted settling time7.
All chemicals used analytically pure chemicals is commercial grade products. Anionic flocculants provided with the commercial cod of GFLOC A190 from Aquatech Company. Cationic flocculants obtained with the commercial cod of NUFLOC F10 from GIG Company. Poly aluminum chloride(PAC) provided from Iranian chemistry Company. Deion water was used to make all solutions.The chemicals were diluted to a concentration of 0.1 Percentages. Then the diluted solution was added to waste water samples.Table 2 shows the important properties of the chemicals that used in research.
Deinked pulp waste wateris one of the pulp and paper conventional effluents that have especially distinctions. The recycling rate of waste papers has steadily increased decades as parts of the effort to preserve forest resources and reduce the cost of municipal waste treatment. In this work, the effect of chemicals (poly aluminum chloride with cationic or anionic polymers) investigated on deinked pulp and paper mill waste water in order to reduction of COD and turbidity and the measurement of maximum efficiency purification.
Coagulation and flocculation tests were conducted using a conventional jar test apparatus. In each run, one liter samples were poured into six jars. Different dosages of chemicals(at first polyaluminum chloride and then cationic or anionic polymers ) were then added and the coagulation began with rapid mixing of 100 RPM for 2 min, followed by slow stirring of 40 RPM for 10 min. the flocks formed were then allowed to settlefor 20 min. The end of sedimentation was set at a time when no appreciable flock settlement was observed. Finally, supernatant was withdrawn with a plastic syringe from near 2 cm below the liquid- air interface for chemical analysis. All the experiments were
MATERIALS AND METHODS The waste water was collected from the waste water treatment plant of tissue producing mill of white mixed waste papersat Iran. The samples were taken at overflow of physical treatment stage of plant facility. Waste water samples were characterized and the analyses in Table 1. The parameters were measured based on Standard
Table1: Waste water samples were characterized and the analysed Distinction Unit Equalization tank Overflow of physical Treatment
pH
COD
Turbidity
TSS
TDS
Conductivity
7.02 7.07
mg/l >5000 3562.33
FTU >1000 117.23
mg/l 4500 1546
mg/l 4100 2670
ms/cm 3.40 3.07
Table 2: The important properties of the chemicals used in research. Chemicals
Commercial name
Company
pH 1mgr/l
Cond Âľ s/cm
TDS mg/l
Abbreviation at research
Poly aluminum chloride Cationic polymer Anionic polymer
PAC
Iranian chemistry.CO GIG Aquatech
4
75.5
3710
Pac
5.7 8
121.5 222
60.8 153.4
cat ani
NUFLOC F10 GFLOC A190
Treatments
Fig. 3. Comparison of COD Efficiency at the different pH. blank
COD mg/l
4000 3500 3000 2500 2000 1500 1000 500 0
70 70
60 60
50 50
40 40
30
30
20
20
10
10
0
0
COD efficiency (%)
120 100 80 60 40 20 0
Turbiidity (FTU)
5 pac + 2 ani
5 pac + 2 ani
10 pac + 1 ani
10 pac + 2 ani
15 pac + 2 ani
20 pac + 2 ani
15 pac + 3 ani
blank
5 pac + 1 Cat
5 pac + 2 Cat
10 pac + 1 Cat
10 pac + 2 Cat
15 pac + 2 Cat
20 pac + 2 Cat
15 pac + 3 Cat
COD mg/l 4000 3500 3000 2500 2000 1500 1000 500 0
blank
blank
5 pac + 2 ani
5 pac + 2 ani
10 pac + 1 ani
10 pac + 2 ani
15 pac + 2 ani
20 pac + 2 ani
15 pac + 3 ani
blank
5 pac + 1 Cat
5 pac + 2 Cat
10 pac + 1 Cat
10 pac + 2 Cat
15 pac + 2 Cat
20 pac + 2 Cat
15 pac + 3 Cat
Turbiidity (FTU) 120 100 80 60 40 20 0
5 pac + 2 ani
5 pac + 2 ani
10 pac + 1 ani
10 pac + 2 ani
15 pac + 2 ani
20 pac + 2 ani
15 pac + 3 ani
blank
5 pac + 1 Cat
5 pac + 2 Cat
10 pac + 1 Cat
10 pac + 2 Cat
15 pac + 2 Cat
20 pac + 2 Cat
15 pac + 3 Cat
COD efficiency (%)
POURMOUSA., Curr. World Environ., Vol. 8(3), 403-408 (2013) 405
Fig. 1. Effect of chemical treatment on COD reduction at different pH. Treatments
Treatments Fig. 2. Effect of chemical treatment on Turbidity improvement at different pH.
406
POURMOUSA., Curr. World Environ., Vol. 8(3), 403-408 (2013)
Turbidity was measured by a turbid meter manufactured by Eutech (Model 2100A). Turbidity was measured by putting 10 mL of sample into turbidity cell and places it in turbidity meter to measure turbidity.Chemical Oxygen Demand was determined by the potassium dichromate method.
RESULTS AND DISCUSSION Waste water distinctions at equalization tank and Overflow of physical Treatmentsummarized in Table 1. Table 2 shows the important properties of the chemicals that used in the research.Comparison of results were made for treatments based on turbidity and chemical
blank
5 pac + 2 ani
5 pac + 2 ani
10 pac + 1 ani
10 pac + 2 ani
0 15 pac + 2 ani
10
0 20 pac + 2 ani
20
10 15 pac + 3 ani
20
blank
30
5 pac + 1 Cat
40
30
5 pac + 2 Cat
50
40
10 pac + 1 Cat
60
50
10 pac + 2 Cat
60
15 pac + 2 Cat
70
20 pac + 2 Cat
70
15 pac + 3 Cat
Turbidity efficiency (%)
Waste water samples were treated by different dosages of poly Aluminum Chloride and
Cationic or Anionic polymers at three replications. The average ofdataobtained with SPSS software 16 .efficency of each treatment calculated via differences of inlet and outlet to inlet of each treatment.
Treatments Fig. 4. Comparison of Turbidity Efficiency at the different pH.
60 50 40 30 20 10
Treatments Fig. 5: Comparison of COD and Turbidity Efficiency at the pH=7.2
blank
5 pac + 2 ani
5 pac + 2 ani
10 pac + 1 ani
10 pac + 2 ani
15 pac + 2 ani
20 pac + 2 ani
15 pac + 3 ani
blank
5 pac + 1 Cat
5 pac + 2 Cat
10 pac + 1 Cat
10 pac + 2 Cat
15 pac + 2 Cat
20 pac + 2 Cat
0 15 pac + 3 Cat
Efficiency (%)
70
Turbidity efficiency (%)
carried out at ambient temperature of 23 -25 0c.Decrease or increase of pH from control position to designed plan by adding of H2SO4 and NaOH was done.
407
POURMOUSA., Curr. World Environ., Vol. 8(3), 403-408 (2013)
the best results for COD reduction, take place at injection of 15 mg/l poly aluminum chloride with 3 mg/l cationic or anionic polymerstowaste water at PH: 8.2.at this position the performance efficiency of each treatment for COD reduction from 3562.33mg/l at blank samplesreached to1316.671317.83mg/l where is equal to 63.0262.01%performance efficiency of COD removal respectively (Fig 1& 3).COD removal at pH: 7.2 take place with low efficiency at treatments. But the performance of COD removal increased at pH: 7.7and 8.2. Atthis range of pH,have not differences significantlyexcept at first treatments.
oxygen demand at variation of pH conditions are shown in Fig of 1 to 7. In order to design the best treatment for removal of COD and turbidity improvement, the research continued at three range of pH.The impact of different dosages of poly aluminum chloride with cationic or anionic polymers at three range of waste water pH, on chemical oxygen demand reduction, turbidity improvement and performance efficiency are shown at Fig 1 to 7.
blank
5 pac + 2 ani
5 pac + 2 ani
10 pac + 1 ani
10 pac + 2 ani
15 pac + 2 ani
20 pac + 2 ani
15 pac + 3 ani
blank
5 pac + 1 Cat
5 pac + 2 Cat
10 pac + 1 Cat
10 pac + 2 Cat
15 pac + 2 Cat
20 pac + 2 Cat
80 70 60 50 40 30 20 10 0 15 pac + 3 Cat
Efficiency (%)
Based on figures, the impact of chemicals was utilized on quality of waste water clarification.
Treatments
Treatments Fig. 7. Comparison of COD and Turbidity Efficiency at the pH=8.2
blank
5 pac + 2 ani
5 pac + 2 ani
10 pac + 1 ani
10 pac + 2 ani
15 pac + 2 ani
20 pac + 2 ani
15 pac + 3 ani
blank
5 pac + 1 Cat
5 pac + 2 Cat
10 pac + 1 Cat
10 pac + 2 Cat
15 pac + 2 Cat
20 pac + 2 Cat
70 60 50 40 30 20 10 0 15 pac + 3 Cat
Efficiency (%)
Fig. 6. Comparison of COD and Turbidity Efficiency at the pH=7.7
408
POURMOUSA., Curr. World Environ., Vol. 8(3), 403-408 (2013)
According to the figures, the best treatments for turbidity improvement take place attreatment of 15 mg/l poly aluminum chloride with 3 mg/l cationic polymers to waste water at pH: 8.2.at this position the performance efficiency of the treatment for turbidity improvement reached from 117.23FTU reached to 38.9 FTU that is equal 66.82%turbidity improvement efficiency (figures 2 & 4).Turbidity improvement at pH: 8.2 take place with high efficiency at treatments compared to other pH. The trend of variations at the treatments showed, the behavior of polymers is very sophisticated at different levels of poly aluminum chloride injection. So cannot tell which kind of polymers is better than other.it seemed the application of each polymers depended to anionic and cationic traces at deinked pulp waste water effluent. The efficiency of performance at high levels
of chemical consumption and upper pH goes better than low levels. The turbidity improvement efficiency was better than COD Reduction performance at all conditions (Fig 5-7). CONCLUSION Reduction of COD and turbidity has been studied using different dosages of poly aluminum chloride with cationic or anionic polymers at three range of pH. The results showed that the combination of poly aluminum chloride and polymers is more effective at coagulation and flocculation process.it can achieve 63.04 % of COD and 66.82% of turbidity reduction at the optimum dosages of 15 mg/l of polyaluminum chloride with 3 mg/l cationic polymers. The waste water at this purification quality level can be used for internal process goals but without biological treatments it can't be inject to environment and outdoors applications.
REFERENCES
1.
2. 3.
4.
Esko , k.juuso.,Dynamic simulation of water treatment in pulp and paper industry, control engineering laboratory, depts. Of process engineering, 90014, University of Oulu, Finland (2009). Pokhrel ,D. and Viraraghavan.T., Total Environment., 333:37-58 (2004). Rintala, J., Martin,J.L.S., and Lettinga,G.,Water Sci: Technol., 24:149-160 (1991). Rintala, J., and Puhakka,J.A.P.,A review.Bioresour.Thechnol., 47: 148 (1994).
5.
6. 7.
8.
Thompson,G., J.Swain,M.Kay and Forster.C.F., Bioresour.Technol.,77: 275-286 (2001). Stephenson,R.J., and Duff,S.J.B., Water Res. 30: 781-792 (1996). Kadhum M. shabeeb, Haydar A. Abdulbari, Ali A. Abbas., Al-Qadisiya J.for Eng. Sci, 4, NO:4 (2011). APHA, Standard Methods for the Examination of Water and Waste Water 20 th Edn.,American Public Health Association,Washengton, DC (1998).
Current World Environment
Vol. 8(3), 409-417 (2013)
Respective and Interactive Effects of O3 and CO2 and Drought Stress on Photosynthesis, Stomatal Conductance, Antioxidative Ability and Yield of Wheat Plants MAYSA M. HATATA1, REEM H. BADAR1, MOHAMMAD M. IBRAHIM1,2 and IBRAHIM A. HASSAN1,3* 1
Department of Botany, Faculty of Science, Alexandria University, 21526 El Shatby, Alexandria, Egypt. 2 Faculty of Science, King Saud University, Riyadh, KSA. 3 Centre of Excellence in Environmental Studies (CEES), King Abdelaziz University, P.O.Box 80216, Jeddah 21589, KSA. http://dx.doi.org/10.12944/CWE.8.3.10 (Received: November 10, 2013; Accepted: December 02, 2013) ABSTRACT Effects of O3, Doubled CO2 Concentration and drought stress on wheat (Triticum aestivum L.) plants were studied in open-top chambers (OTC). Under doubled CO2 concentration, grain yield and biomass increased, the SOD activity, and carotenoid (Car) content also increased while relative conductivity yield parameters significantly decreased. But under Elevated O3 concentration, the SOD activity, Carotenoids decreased. The final result was decreased grain yield and plant biomass. Interactive effects of doubled CO2 and O3 concentrations on soybean were mostly counteractive. However, the beneficial effects of concentration-doubled CO 2 is more than compensate the negative effects imposed by doubled O3 and the latter in its turn partly counteracted the positive effects of the former.
Key words: O3, CO2, Drought stress, Photosynthesis, Lipid peroxidation, Antioxidative ability, Growth and Yield.
INTRODUCTION Two aspects of global climate change that directly influence plant physiology, growth and productivity; increasing in concentrations of ambient ozone (O 3 ) and carbon dioxide (CO 2 ) 1,2. Atmospheric CO2 is projected to continue rising to at least 550 ppb by 20503. The current annual average (O3) is predicted to continue increasing by 0.5-2% per year over the next century, mainly due to increases in precursor emissions from anthropogenic sources4,5. Greenhouse effect is one of the important concern in present global change and the increase of concentrations of greenhouse gases is the main reason which resulted in the enhancement in the
greenhouse effect. CO 2 is the most important greenhouse and carbon source for plant photosynthesis. O3 in troposphere is essentially a pollutant6 and it restricts the growth of plant severely. The concentrations of CO 2 and O 3 have been increased continually and the responses of plant to them are regarded increasingly. Ozone diffuses into the leaf apoplast via the stomata where it is rapidly converted into other reactive oxygen species (ROS) that signal a diverse metabolic response (Long and Naidu, 2002; Kangasjarvi et al., 2005; Hassan, 2006). Stress may promote the formation of harmful reactive oxygen species (ROS) which have the capacity to initiate chlorophyll bleaching, lipid peroxidation, protein oxidation, and injury to nucleic acids (Kangasjarvi
410
HATATA et al., Curr. World Environ., Vol. 8(3), 409-417 (2013)
et al., 2005). The effect of CO2 and O3 on plant growth and productivity has been determined separately for a large number of plant species, but very little work has focused on their interactive effect2,6,7,8.
importance of the accumulation of photosynthetic pigments which could change during exposure to multiple stresses, and this is the novelty of this experiment was a study of triple interaction of the mentioned factors.
The studies on combination effects of CO2 with temperature, moisture6,7 and effects of O3 with SO 2 or NO 2 8,9 on plant have been reported. Interactive effects of CO2 and O3 on winter wheat10, potato11, 12, aspen and birch13. However, the research on interactive effects of CO2, O3 and drought, are seldom15. Although many studies addressed the effects of CO2, O3 and /or drought stress on plants in the developed world, no such study, to the best of knowledge, was conducted in developing world.
MATERIALS AND METHODS
In this paper, respective and interactive effects of doubled CO2 and O3 concentration on wheat yield and biomass production, Photosynthesis, stomatal conductance, antioxidative ability and cell membrane lipid peroxidation of leaves in the context of free radical biology were studied in open-top chambers (OTC). Though several previous studies report evocation of oxidative stress by water deficit stress in case of wheat4,9,26 at individual level, information on their comparative response to same degree of stress in terms of their stress sensitivity and functional variation is lacking. In order to fill this gap of knowledge, this study was undertaken to evaluate oxidative response to O3, CO2 and/or drought singly and in combination of wheat plants. The hypothesis behind the work was the sensitivity of plants to water stress might be associated with different abilities for their carbon fixation, and also these stresses may affect to the net assimilation through their impact on stomatal conductance as well as antioxidant enzymes. Therefore the aims of the present study were to describe interaction of enhanced O 3, elevated CO2 and water stress on growth, seed yield, photosynthetic activities, photosynthetic pigments, antioxidant enzymes such as glutathione (GR ), Peroxidase (POD), superoxide dismutase (SOD) and ascorbate Peroxidase (APX) as well as molecular biomarkers in durum wheat (Triticum aestivum L.) plants. Moreover, to study the
Plant materials, growth conditions and Experimental design Grains of wheat (Triticum aestivum L.) plants were sown in pots with 20x20cm2 filled with soil collected from top soil in the field. There were five plants/pot. They were transferred to four OpenTop Chambers (OTCS)19 when second foliage leaf appeared. The treatments were: (a) control (FA), (b) O3 without CO2 (O3), (c) FA with CO2 (CO2), (d) O3 and CO2 (O3 +CO2). The experiment was split plot Latin square, one chamber was equipped with charcoal filter (FA) and the other was ventilated with FA + Target O3 (78 ppb/h) and the third was ventilated with FA +Target CO2 (450 ppm), while the fourth OTC was supplied with O3 (78 ppb) and CO2 (450 ppm). There were 12 pots/chamber. Pots were distributed in a completely randomized block design (CRBD). Half of pots were irrigated to the field capacity while the other half was water-stressed to 0.5 MP10, 12. They were rotated within each chamber every week. Biomass and grain yield 5 plants per pot were harvested for determination of grain and seed yield and yield attributes. The grains harvested were air-dried and the shoots, leaves and roots were dried at 80Cfor 72h. Number of grains per ear was counted. Yield per ear, yield per plant, and 1000-grain weight were determined. Stomatal conductance and Net photosynthetic measurements Net CO2 assimilation rate (A) and stomatal conductance (gs) were measured using Infrared Gas Analyzer (IRGA,ciras-1PP System, Hitchin UK). Measurements were carried out on ten attached leaves per treatment on weekly basis.
HATATA et al., Curr. World Environ., Vol. 8(3), 409-417 (2013) Measurement of Photosynthetic Pigments Photosynthetic pigments, chlorophyll a & b and carotenoids were extracted and from flag leaves and were determined by UVspectrophotometer (LKB, UK.)35, 36. Antioxidant enzymes assays Extractions of antioxidant enzymes from the leaves of the four treatments were performed21. Leaves were cut from each treatment and immersed in liquid nitrogen and kept in a deep freezer at 80°C until the analyses were performed at University of Newcastle, UK. Samples were weighed and ground at about °C in 25 m Tris-HCl buffer containing 3 mM MgCl2, then the homogenates were centrifuged at 20 000 for 15 min (Centrifuge17 S/RS, Heraeus Sepatech). The supernatants were used for the enzyme assays and the results were expressed on protein basis35. All assays were performed using a final volume of 1 mL, with at least duplicate assays undertaken on each sample. Moreover, the assays were end-point determinations. SOD (EC 1.15.1.1) activity was monitored21. The extraction mixture contained 50 mM phosphate buffer solution (pH 7.8), 13 mM Lmethionine, 63 lM nitro blue tetrazolium and 2 lM riboflavin. The ability of the extract to inhibit the photochemical reduction of nitro blue tetrazolium was determined at 560 nm (Schimadzu UV-1201 spectrophotometer). The amount of the extract resulting in 50% inhibition of nitro blue tetrazolium reaction is defined as one unit of SOD activity. Catalase (EC, 1.11.1.6) activity was assayed in enzyme extract reaction mixture containing 50 mM phosphate buffer (pH 7.4). The reaction was started by adding 10 mM H2O2, and the reduction in absorbance was determined at 240 nm14, 36. GPX (EC, 1.11.1.7) activity was determined by adding 50 mM phosphate buffer (pH 6.1), 1% H2O2 and 1% guaiacol to the extract, and the absorbance was determined at 470 nm.
411
APX (EC, 1.11.1.11) activity was determined according to Maehly & Chance (1954). The reaction mixture contained 50 mM potassium phosphate, 0.5 mM ascorbate, 0.1 mM ethylenedimethyl tartaric acid (EDTA) and 0.1 mM H2O2, and the absorbance was determined at 290 nm.Protein concentrations of leaf extracts were determined as described earlier26,37. Data analysis Data were subjected to three-way analysis of variance (ANOVA), using O3, CO2 and drought treatments as factors, followed by a least significant difference test, and P values ≤ 0.05 were considered significant (using the STATGRAPHICS statistical package, Package 3, UK) based on plot means. RESULTS Effects on visible injury symptoms Visible injury symptoms appeared on the upper surface of flag leaves as point brown spots and by the end of experiment. Number of injured leaves were increased by 2-fold due to exposure to O3, while exposure to both CO2 and O3 increased it by 31% (Table 1). There was no significant effect (p > 0.05) of either CO2 or drought stress and their interaction on number of injured leaves and on degree of injury. Degree of injury increased by 6-fold when exposed to O3 and 4-fold due to exposure to both O3 and CO2. Drought stress and CO2 protected plants against toxic effects of O3. Plants exposed to D had 39% less leaf injury while exposure to both CO2 and D had 50% lower leaf injury than plants exposed to O3 alone (Table 1). Effect on growth and yield O3 had greater effect on the numbers of ears per plant and the number of grains per ear than drought as these parameters was reduced by 20 and 26% respectively (Table 2). However, CO2 caused increased by 26% and 18% in these parameters respectively. Moreover, the percentage reduction in 1000 grain weight due to O3 (40%) was greater than that due to drought(29%),CO2 alone increased it by 23%,interaction between stresses was less than additive. O3 and Drought caused
412
HATATA et al., Curr. World Environ., Vol. 8(3), 409-417 (2013) O 3 and drought caused reduction in net photosynthetic rates (A) by 70% and 80%, respectively. On the other hand, CO2 increased net photosynthetic rates A by 6%. Interaction between O3 and CO2 decreased it by 8%, while O3 and drought decreased it to 12%. Exposure of Wheat plants to O3 and drought simultaneously had the greatest decline effect on the net photosynthetic rates A by 88%. Drought had more pronounced negative effects than those other parameters. CO2 mitigates toxic effects of drought and O3, it mitigated O3 and reduced its toxicity by to 23 % and drought to 19 %. Interactions between different treatments were less than additive.
significant reductions in all yield parameters measured in this experiment (Reductions reached maximum of 63% in dry mass and 54% in 1000 grains weight). Effect on stomatal conductance and photosynthetic rates It was clear that both O3 and drought had the greatest negative effects on stomatal conductance (gs) caused reduction by 41 and 50% respectively (over the entire period the experiment) (Fig.1). Moreover, interaction between O 3 and drought was great reduction more than additive (58% reduction). On the other hand CO2 had a synergistic effect it caused increases to 12%, while it ameliorates toxic effects of O3 and drought when applied with other stresses. The interactive effects of CO2 and O3 are contradictory caused greater reduction in gs than CO2 and drought by 17 and 11%, respectively. Interactions between different treatments were less than additive (21% reduction). After 10 weeks O3 and drought exposure negative impacts were evident for Wheat plants revealed a 58% decline in stomatal conductance (gs).
Effects on antioxidant enzymes A significant increase was observed in POD by 1.5-fold in Wheat plant treated with elevated CO2; in contrast, elevated CO2 had a reducing effect on GR and SOD by 11and 9 %, respectively. There was no significant (Pd≤0.05) effect of all treatments on APX. O3 caused increases in activities of GR, POD by 18 and 36 % respectively, while SOD was decreased by 11%. Drought had more pronounced effect on these enzymes as it caused increases by
It was clear that O3 and drought had the greatest effect on net photosynthetic rates (A) (Fig.2).
Table 1: Effect of CO2 and O3, drought, singly and in combination on foliar injury symptoms of Wheat leaves in year 2005. (Means not followed by the same letter in each row are significantly different ≤0.05) (n=40). from each other at P≤ Parameter
FA
O3
CO2
O3+ CO2
D
O3+D
Number of injured leaves Degree of injury
3a
18 c
4a
14 bc
5a
10 c
6a
15b
0.14a
0.82d
0.12a
0.52 c
0.15a
0.61c
0.56c
0.43b
CO2+D O3+CO2+D
Table 2: Effects of different treatments on yield parameters of Wheat (Triticum aestivium L.) plants grown under field conditions in open top chambers(OTCS).FA (346 ppm CO2 + CFA); O3(ambient CO2+75 ppb O3 7hd-1(10.00-17.00 h); elevated CO2 (702 ppm1CO2 +CFA) elevated CO2 +O3 (elevated CO2+78 ppb O3 7hd-1). Plants were harvested 70 d after transfer to open top chamber (OTCs). ≤ 0.05;** P < 0.01;*** P < 0.001). (*mean P≤ Parameter no. of ears /plant no. of grains /ear 1000 grain Wt (g) Dry mass of grain/g
FA 3.72* 41.5* 56.7** 3.98**
O3
CO2
3.02** 4.68** 33.6** 49.86*** 34.1** 61.3** 1.92*** 4.26**
D 3.00** 31.5** 30.6** 1.80*
O3+CO2 CO2 +D 3.32* 39.4* 46.10* 2.31**
3.52* 40.03* 44.3* 4.01**
O3+D O3+D+CO2 2.79* 30.21** 28.2*** 1.72*
2.92* 32.5** 30.03** 1.79*
413
HATATA et al., Curr. World Environ., Vol. 8(3), 409-417 (2013) 21% in POD while GR and SOD were decreased by 11 and 15%, respectively. The antioxidant enzymes; GR and SOD were significantly decreased in Wheat plants exposed to elevated CO2 + elevated O3 by 15 and 50%, respectively
than in plants grown under normal conditions. CO2 followed the same pattern of O3. Interaction between O3, CO2 and drought and their multiple interactions were less than additive.
Table 3: Activities of glutathione reductase(GR).guaicol peroxidase (POD),superoxide dismutase (SOD) and Ascorbic peroxidase (APX) in extract Wheat leaves (70 DAP) Treatment
GR activity (nmol cm-2S-1)
POD activity (nmol cm-2S-1)
SOD activity (µ cm-2)
APX (µ cm-2)
Control O3 D CO2 O3+C02 O3+D CO2+D O3+D+CO2
0.28 0.33 0.25 0.25 0.24 0.25 0.27 0.30
5.62 7.63 6.80 8.21 5.82 4.39 5.03 6.12
4.61 4.12 3.92 4.23 2.35 2.02 2.21 2.98
0.32 0.29 0.30 0.34 0.31 0.29 0.32 0.30 C
gs (mol m-2 S-1)
0.6
O3
0.5
D
0.4
CO2
0.3
O3 +CO2
0.2
O3 +D
0.1
CO2 + D O3 + D +CO2
0
4 5 6 7 8 9 10 Duration of expose (weeks) Fig. 1:Effects of different treatments on stomatal conductance (gs) mmol m-2s-1 of Wheat plants grown under field conditions in open top chambers(OTCS). Values are means of 10 replicates ± 1SE. An arrow indicates data of re irrigation of water -stressed plants.
µ Mole m-2 S-1) A (µ
1
2
3
30 25 20 15 10 5 0 1
2 3 4 5 6 7 8 9 10 Duration of expose (weeks) Fig. 2: Effects of different treatments on net photosynthetic rates (A) µmol m-2 s-1 of Wheat plants (Triticum aestivum L.) grown under field conditions in open top chambers(OTCS).
414
HATATA et al., Curr. World Environ., Vol. 8(3), 409-417 (2013) DISCUSSION
The results support the previous reports22,23,24,25 that biomass and yield of crop plant were significantly increased under high CO2 level but decreased under high O3 level. In our case, the increased yield and biomass under doubled CO2 were more than sufficient to eliminate the doubled O 3 -induced yield decrease as shown in the treatment of the combination of doubled CO2 and O3 concentration. It is known that enriched CO2 increases photosynthesis 1,12 by providing more carbon source. This is the basis for the increase in yield and biomass. The increased photosynthesis also provides more reducing power and more biosynthesis of chlorophyll and carotenoids as well as enhancement of antioxidants concentrations. This would enhance the resistance of the plant to environment stresses, such as exposure to high O3. The enhancement of the antioxidative ability is especially important since O3 itself is a strong oxidant. Enriched CO 2 also decrease stomata conductance of the leaves. This would reduce the flux of O3 into leaves though stomata. Take these two factors together, the effect of enriched CO2 in amelioration of the harmful effect of O 3 is reasonable. O3 as a strong oxidant, is highly injurious to the plant tissues. It inhibits photosynthesis1,2,12, decrease yield and biomass production35,36,38. It directly attacks the cell membranes inducing increase in lipid peroxidation and ion leakage. By inhibiting photosynthesis, the biosynthesis of the antioxidants or active oxygen scavengers may also be affected. The imbalance between the generation and scavenge of active oxygen would decrease the stress resistance of the plant. It is interesting to note that when plants exposed to O 3 was less than 20 days, they responded in a way that it induced higher SOD activity, higher chlorophyll and carotenoids content. This indicates that small dosage O3 or a short duration of exposure might not result in damage but induce acclimation response of the plant. But soon the accumulated dosage had increased to the level that intolerable to the plant and became
injurious as indicated by the fast decrease in SOD activity, pigments content and increase in MDA accumulation and ion leakage3,5,31. The decrease in the anti-oxidative ability and increased production induced by high O3 exposure is an indication of senescence. This is consistent to the fact that the plant exposed to doubled O3 shed their leaves 7-8 days earlier than others. It was found in the present study that elevated CO2 confer some protection against O3, and it was clear that stress caused by CO 2 predisposed leaves to injury caused by O3 and not vice versa and this explain how they interact to alleviate foliar injury39. In the present study, increased GR concentration and POD activity in ambient air can be interpreted as response to oxidative stress imposed by O3 (Chernkova et al. 2000). However, the lack of significant changes in activities of SOD and AA in ambient air, which also observed in other O3 studies40, differed from studies where activities of these enzymes increased in response to O341. The variability in the response of antioxidants to elevated O 3 and CO 2 among studies reflects differences in the magnitude of the perceived oxidative stress, the species-specific mechanisms involved in responses to changes in redox status, the plant capacity to cope with additional stress(s), experimental protocols and environmental conditions. Therefore, further studies are needed to further the understanding of the response of antioxidant metabolism to elevated O3, CO2 and drought singly and in combination17,18,24,25,27,30. CONCLUSIONS Ozone exposure reduced corn grain yield in response to O3 damage during the flowering process. Both O3 and CO2 had a major impact on physiological processes that are independent on PAR absorption. Therefore, radiation use efficiency (RUE) in response to gases treatments, in wheat, was significantly increased in response to CO2 enrichment and significantly reduced in response to O3-induced stress. While water use efficiency (WUE) was reduced in O3- stressed plants grown under water stress and elevated CO2. Similar results were observed for the control treatment and the
HATATA et al., Curr. World Environ., Vol. 8(3), 409-417 (2013) high-O3/enriched-CO2 treatment, indicating that the damaging effect of 03 air pollution was counteracted by the beneficial effect of CO2 enrichment without any interactive effects between the two gases for the measured variables except for grain yield, during the first wheat experiment, where the CO2enriched environment more than overcame the O3induced stress. Stomata closed under water stress treatment and decreased influx of O3 and CO3, which would affect growth, yield and physiology of
415
both crops. Closure of stomata is beneficial as less O3 influx but reduction in CO2 influx would reduce photosynthetic rates of both crops and hence lowering yield ACKNOWLEDGEMENTS Part of this work was funded by a fellowship grant from UNESCO to RHB. Thanks to Late Prof Adel Aal (Alexandria University) for his suggestions and help at early stages of the work.
REFERENCES 1.
2. 3.
4.
5.
6.
7.
8.
9.
Hassan, I.A. Interactive effects of O3 and CO2 on growth, physiology of potato (Solanum tuberosum L.). World J. Environ. & Sustainable Development, 7: 1 – 12 (2010). Rich, S. Ozone damage to plants. Annu. Rew. Phytopathology. 2:253-266 (1964). Solomon, S D. Qin, M. Manning, M. Marquis, K. Averyt, M. M. B. Tignor, H. L. Miller, Jr., and Z. Chen, Eds. Climate Change 2007: The Physical Science Basis. Cambridge University Press, 996 pp (2007). Solomon, S., G. K. Plattner, R. Knutti, and Friedlingstein, P. Irreversible climate change due to carbon dioxide emissions. Proc. Natl. Acad. Sci. USA, 106, 1704–1709 (2009). Solomon, S. K. Rosenlof, R. Portmann, J. Daniel, S. Davis, T. Sanford, and G. K. Plattner, Contributions of stratospheric water vapor to decadal changes in the rate of global warming. Science, 327, 1219–1223, (2010). Amunason, R. G. Seasonal changes in the pigments carbohydrates and growth of red spruce as affected by expose to ozone for two growth seasons. New Physiol. 118:127137, (1991). Bender, J. Response of cellular antioxidants to ozone in wheat flag leaves at different stages of plant development. Environ Pollut. 84:15-21, (1994). Drake, B.G., Leadley, P.W. Canopy photosynthesis of crops and native plant communities exposed to long-term elevated CO2. Plant Cell Environ, 14:853-860, (1991). Pooter, H. Interspecific variation in the growth response of plants to an elevated ambient
10.
11.
12.
13.
14.
15.
16.
17.
CO2 concentration. Vegetatio, 104,77-97, (1993). Idso, S.B., Allen, S.G., Anderson, M.G. Atmospheric CO 2 enrichment enhances survival ofAzolla at high temperatures. Environ Exp Bot, , 29:337-341, (1989). Polley, H.W., Hohnson, H.B., Mayeus, H.S. Carbon dioxide enrichment improves growth, water relations and survival of droughted honey mesquite (Prosopis glandulosa) seedlings. Tree Physiol, 16:817823, (1996). Olszyk, D.M., Effects of sulfur dioxide and ambient ozone on winter wheat and lettuce. J. of Environ, 15:363-369, (1986). Osamu, I., Effects of NO2 and O3 alone or in combination on kidney bean plants (phaseolus vulgaris L.): Growth, partitioning of assimilates and root activities. J. Exper. Bot., 36(4): 652-662, (1985). Maehly A.C., Chance B. The assay of catalase and peroxidase. In: Methods of Biochemical analysis, pp. 357–424. Ed. D. Glick. New York: Interscience (1954). Rudorff, B. F. T., Mulchi, C. L., Lee, E. H., et al., Effects of enhanced O3 and CO2 enrichment on plant characteristics in wheat and corn. Environ. Pollut., 94:53-60, (1996). Lawson, T., Craigon, J., Black, C.R. Effects of elevated carbon dioxide and ozone on the growth and yield of potatoes grown in opentop chambers. Environmental pollution, ,11(3): 479-491, (2001). Noormets, A., McDonald, E.P., Dickson, R.E, Kruger, E.L., Sober A, Isebrands J.G and
416
18.
19.
20.
21.
22.
23.
24.
25.
26.
HATATA et al., Curr. World Environ., Vol. 8(3), 409-417 (2013) Karnosky D.F. The effect of elevated carbon dioxide and ozone on leaf- and branch- level photosynthesis and potential plant-level carbon gain in aspen. Trees, 15(5):262-270 Lindroth, R. L., Kopper, B. J., Parsons, W. F. J., et al., Consequences of elevated carbon dioxide and ozone for foliar chemical composition and dynamics in trembling aspen (Populus tremuloides) and paper birch (Betula papyrifera). Environmental Pollution, 115(3): 395-404, (2001). Mulchi, C. L.,Slaughter, L., Saleem, M., et al., Growth and physiological characteristics of soybean in open-top chambers in response to ozone and increased atmospheric CO2. Agriculture Ecosystems and Environment. 38:107-108, (1992). Wang C.Y, Gao S.H. The structure and performance of open top chamber (OTC). Advances in Environmental Science, 3(2): 19-31, (1994). Li J.S., Wang H.C., Wang W.Y. et al., Effect of drought on the permeability and membrane lipid composition from maize leaves. Acta Phytophysiologia Sinica, 9(3): 223-229 (1983). Lee E.H., Upadhyaya, A., Agrawal, M., Rowland R. A. Mechanism of ethylenediurea (EDU) induced O3 protection: re-examination of free radical scavenger systems in snap bean exposed to O3. Environmental and Experimental Botany, 38, 199 –209 (1997). Dhindsa, R.S., Matowe W. Drought tolerance in two Mosses: correlated with enzymatic defence against lipid peroxidation. J. Exp. Bot., 32:79-91, (1981). Wang A.G., Luo G.H., Quantitative relation between the reaction of hydroxylamine and superoxide anion radicals in plants. Plant Physiology Communications, (6): 55-57, (1990). Haim D, Rabinowitch and Sklan D., Superoxide dismutase: a possible protective agent against sunscald in tomatoes (Lycopersicon esculentum Mill). Planta, (148): 162-167 (1980). Taie, W, Basahi, J. & Hassan.I.A . Impact of ambient air on physiology, pollen tube growth and pollen germination in pepper (Capsicum annuum L.). Pakistan J. Botany,
27.
28.
29.
30.
31.
32.
33.
34.
35.
36.
37.
45(3): 2314 – 2322, (2013). Zhang X.Z., Chen FHG., Wang R.F. et al., Experimental technique of plant physiology.Liaoning Technology Publishing Company, China. pp: 145-148, (1994). Hao J.J, Liu Y.J., Experimental technique of plant physiology. Liaoning Technology Publishing Company, China. pp:71-74 (2001). Uocking PJ, Mcyar C.P. Effect of CO 2 environment and nitrogen stress on growth and partitioning of dry matter and nitrogen in wheat and maize. Aust J Plant Physci, 18: 339, (1991). Kch, K. E., Jones, H P., Avignc, W. T. Growth, dry matter partitioning and diurnal activities of RUBP carboxylase in cirtus seedlings maintained at two levels of CO2. Plant Physiol, 67: 447, (1986). Havelke V. D. Ackerson R. C. Boyle M. G. CO2enrichment effect on soybean physiology I. Effects of long-term CO2 exposure. Crop Sci., 24:1146, (1984). Yoshida. Z. Effects of CO2 enrichment at different stages of panicle development of yield of rice.Crop nutr, ,19:311 - 316, (1973). Admos, R. M., A re-assessment of the economic effect of ozone on US agriculture. JAPCA, 39:960-968 (1989). McKee, I.F., Mulholland, B.J., Craigo, J., Black, C.R., and Long, S.P. Elevated concentrations of CO2 protects against and compensate for O3 damage to photosynthetic tissues of field-grown wheat. New Phytol., 146: 427 – 435 (2000). Noormets, A., McDonald, E.P., Dickson, R.E, Kruger, E.L., Sober A, Isebrands J.G anKarnosky D.F. The effect of elevated carbon dioxide and ozone on leaf- and branch- level photosynthesis and potential plant-level carbon gain in aspen. Trees, 15(5): 262-270 (2011). Ojanpera, K., Patsikka, E., and Ylaranta, T. Effects of low ozone exposure of spring wheat on net CO2 uptake, Rubisco, leaf senescence and grain filling. New Phytologist 138, 451–460 (1997). Hassan, I.A. Physiological and biochemical response of potato (Solanum tuberosum L. Cv. Kara) to O3 and antioxidant chemicals:
HATATA et al., Curr. World Environ., Vol. 8(3), 409-417 (2013)
38.
39.
possible roles of antioxidant enzymes. Annals of Applied Biology, 146: 134 – 142 (2006). Hassan, I.A., Basahi, J.M., Ismail, I.M. Gas exchange, chlorophyll fluorescence and antioxidants as bioindicators of airborne heavy metal pollution in Jeddah, Saudi Arabia. Curr World Environ, 8(2) 203 – 213 (2013). Vorne, V., Ojanperä, K., De Temmerman, L., Bindi, M., Högy, P., Jones, M.B., Lawson, T. and Persson, K. Effects of elevated CO2 and
40.
41.
417
O3 on what and corn quality in the European multiple-site experiment “CHIP- Project”. Eurp. J. Agron., 17: 369 – 381 (2002). Azevedo, R.A., Alas, R.M., Smith, R.J. and Lea, P.J. Response of antioxidant enzymes to transfer from elevated CO2 to air and O3 fumigation, in the leaves of wild-type and a catalse deficient mutant of barely. Physiol. Plant, 104: 280 – 292 (1998). Chernikova, T., Robinson, J.M., Lee, E.H. and Mulchi, C.L. O3 tolerance and antioxidant enzyme activity in soybean cultivars. Photosynthtica Research, 64: 15 – 26 (2000).
Current World Environment
Vol. 8(3), 419-428 (2013)
Hydrological Drought Analysis of Karkheh River Basin in Iran Using Variable Threshold Level Method MAHSHID KARIMI and KAKA SHAHEDI Department of Watershed Management, Sari Agricultural Sciences and Natural Resources University, Sari, Iran. http://dx.doi.org/10.12944/CWE.8.3.11 (Received: November 05, 2013; Accepted: December 17, 2013) ABSTRACT Drought is an important phenomenon in recent years which caused a lot of problems for most of areas in Iran. Drought lead to water scarcity for people and this problem becomes one of the important challenges for the country. Karkheh River basin is one of the considerable water resources field in Iran and it is located in west parts of Iran. Current paper tries to take one step ahead toward scientific and practical drought management in Karkheh basin by analyzing hydrological drought. In this paper using daily discharge time series of 13 hydrometric stations which are located in the basin and also applying threshold level method, dry periods were extracted and results were analyzed. Results showed that the most volume and the most duration of drought in threshold level of 70% mostly happened within 1998-2000 and 2006-2008. Also the results of the frequency analysis of drought parameters indicted that for maximum deficit volume series Weibull distribution and Generalized Pareto Distribution (GP) in accordance with 77% of stations and for maximum duration series, GP distribution in accordance with 54% of stations had the most consistency. Based on this consistency, return period of droughts were also computed and the possibility of drought predictions in future was determined.
Key words: Hydrological Drought, Variable Threshold Level, Karkheh, Deficit Volume, Drought duration.
INTRODUCTION Drought event is the most critical environmental phenomenon that has special hydrological and meteorological characteristics in each area (Samiei et al., 2006)1. In one general explanation drought means unnatural scarcity of rainfall in long-term periods. This introduction is meaningful when the scarcity leads to lack of moisture in soil, decrease in water flow and interruption of human activity, plants and animal's life (Khazaei et al., 2003)2. Different types of drought are meteorological, hydrological, agricultural and socio-economic (Hisdal and Tallaksen 2000 3; Mishra and Singh 20104; Van Loon and Van Lanen 20125; Liu et al., 20126 and Choi et al., 20137). Among these different types of drought, investigation of the hydrological drought is too
important due to dependence of most of the activities (including industrial, water and power plants) to surface water resources (Vasilides et al., 2011)8. In this research hydrological drought is investigated. One of the most common quantitative explanations of hydrological drought is based on introducing a threshold level which less than that for river flow is considered as hydrological drought (Tallaksen 2000)9. Low amount of rainfall, its improper distribution and also occurred droughts in recent years, caused great problems in the field of water resources for most of the areas located in Iran. One of these areas which are influenced by drought is Karkheh river basin. According to the location of this basin in some provinces and also its important role as a large water resource for wide areas of the
420
KARIMI & SHAHEDI, Curr. World Environ., Vol. 8(3), 419-428 (2013)
country, drought can cause socio-economic problems. The results of hydrological drought's analysis can be useful for proper water resources management, better planning for water supply and demand and applying every kind of program and consistent practices regarding intensity and duration of droughts. MATERIALS AND METHODS Study area Karkheh River basin is located in west part of Iran. This basin is located between 46 06-49 10 E longitudes and 30 58-35 04 N latitude. To investigate the hydrological drought, daily discharges of hydrometric stations located in this basin were obtained from Water Resources Management Organization of Iran called Tamab. According to the investigations, 13 hydrometric stations which are located on the main tributaries in this river basin were selected. Maximum and minimum length of existing data for these stations was 54 and 20 years period, respectively. Figure 1 shows the location of study area and hydrometric stations and Table 1 illustrates the characteristics of the stations. The threshold level method Threshold level method has been one of the most practical methods to analyze drought and water scarcity. In another word, this method is the base of the explanation of drought characteristics and water scarcity. In this method if the amounts of the discharges are less than a specific amount of threshold level, drought and water scarcity will be happened (Bonacci 1993)10. It is possible to select threshold level with different methods and this selection is related to the kind and water scarcity condition of study area (Zelenhasic and Salvai 1987)11. In this research proper threshold level for extracting hydrological drought periods was chosen using flow duration curve which shows the relationship between daily discharges and the probability of their occurrence P ( X ≥ x ) . Threshold level can be defined as 70-95% of daily flow duration curve (Hisdal et al., (2002)12, (2004)13, Engeland et al., (2004)14, Andreadis et al., (2005)16, Fleig et al., (2006)16 ,Tallaksen et al., 200917; Wong et al., (2011)18 and Van Loon and Van Lanen 2012) and in this study 70% level was chosen. Threshold
level also can be considered constant or variable during a year as changes seasonally, monthly or weekly. In constant threshold level method a flow duration curve for total statistical period is drawn and for total time series of discharge just one threshold level is considered. But in a variable threshold level method, a flow duration curve for each month is drawn separately and for each month a threshold level is determined. This matter leads to an increasing in the accuracy of flow deficit investigation during months with low and high discharges and at last the prediction of drought for future years in comparison with constant threshold level method would be more accurate and proper. Duration of suite (drought duration di) and its aggregation (deficit volume or severity Si) are suggested as point drought parameters (Vrochidou et al., 201319; Giuntoli et al., 201320). Considering daily discharge time series (QK), it is possible to present the relationship between the parameters as:
..(1)
..(2) Where DQ means daily discharge deficit (m3/s), Si is deficit volume of drought i (1000 m3) and 86.4 is the transformation coefficient that is related to the transformation of time scale. Hydrological drought analysis using daily time series faces with two problems. First problem is dependency between droughts and other one is existence of minor droughts during a long-term period drought in which the amount of flow for a short-term period exceeds the chosen threshold level. This issue results in the separation of a great drought to small and dependent ones during a longterm drought To solve this problem some pooling procedures must be applied. Pooling procedures include Moving Average (MA), Sequent Peak Algorithm (SPA) and the Inter event Time Criterion (IT- Criterion) (Tallaksen et al., 199721; Hisdal et al., 2004; Fleig 200422; Fleig et al., 2006; Pandy et al., 2008)23. In the last method for removing minor droughts and pooling dependent ones, some coefficients like α±, dmin and tc are used. α is such a
421
KARIMI & SHAHEDI, Curr. World Environ., Vol. 8(3), 419-428 (2013) coefficient that is used for removing minor droughts. If in a drought deficit volume becomes less than the product of α coefficient and maximum volume multiplication (Si<αSmax), it will be removed and its amount is usually considered between 0.005-0.01. is the minimum time interval which the minor droughts with the equal duration or less than that would be removed (di ≤ d min ) and is usually considered less than 5 days. is named critical time and if two dependent drought phenomenon occur with time interval (ti < tc) they will be pooled. In conditions, duration and deficit volume would be pooled (Spool, dpool) and they were computed as: ...(3) ..(4) Finally in the current research for excluding minor droughts and pooling dependent ones IC method was applied. According to Fleig (2004) amount of á is equal to 0.005 and dmin and tc are considered 2 and 5 days, respectively. For frequency analysis (shiau 200624) Easyfit software was used. Probability distributions such as Gamma, Weibull, Log-Normal, Johnson, Gumbel and Generalized Pareto were evaluated to fit to annual maximum series of deficit volume and drought duration. Then the best distributions were selected based on Chisquare test (Zelenhasic and Salvai 1987). According to probable occurrence derived from
probability distribution Ft(x), different return periods of drought parameters were computed as: ...(5)
RESULTS Number of all occurred droughts in all stations is 1616 events. The largest number of drought occurrence is belong to station 21-169 which equals 206 cases and the least is related to station 21-157 equal to 54 cases (Fig 2). Results of the variable threshold level method showed that in 1954-1967 Period, hydrological drought was observed in most of the stations. In 1968, 1974, 1982, 1987, 1992, 1994 and 1995 hydrological droughts were not occurred in most of the stations and the Karkheh River basin faces with wet years at these years. During 19962008 drought was happened in all stations (Fig 3). Average of deficit volumes and drought duration are 9.058 Mm3 and 36 days, respectively. The largest and lowest values of deficit volume are related to stations 21-411 and 21-163 and are 98.35 and 0.72 Mm3, respectively. For drought duration, the largest and lowest values are 52 and 26 days which belong to stations 21-411 and 21-167, respectively. Figure 4 and Figure 5 show average deficit volume and average drought duration in all
Table 1: Characteristics of selected hydrometric stations in Karkheh River basin Code
Hyd. St.
Longitude
21-105 Sangsurakh 48°23' 21-109 Firuzabad 47°72' 21-115 Doab 47°54' 21-127 Polechehr 47°26' 21-131 Khersabad 46°44' 21-133 Doabmerk 46°47' 21-143 Ghurbaghestan 47°15' 21-157 Dartoot 46°41' 21-163 Tang-siab 47°12' 21-167 Dehno 48°47' 21-169 Kakareza 48°16' 21-171 Sarabseyed Ali 48°13' 21-411 Seymareh 47°26
Latitude (m)
Height (m2)
Area
River
Years with data
34°32' 34°212' 34°222' 34°212' 34°312' 34°332' 34°142' 33°452' 33°232' 33°312' 34°432' 33°482' 33°112'
1800 1450 1410 1280 1320 1290 1230 950 880 1770 1530 1520 530
320 845.6 7769.3 10867.5 1439.2 1244.7 5312.9 2589.3 565 265.6 1145 776.6 28954/3
Gamasiab Toserkan Gamasiab Gamasiab Abmerk Gharesou Gharesou Abchenareh Darehdozdan Horrood Horrood Doabaleshtar Seimareh
1969-2008 1954-2008 1969-2008 1954-2008 1974-2008 1954-2008 1956-2008 1988-2008 1974-2008 1988-2008 1355-2008 1954-2008 1982-2008
422
KARIMI & SHAHEDI, Curr. World Environ., Vol. 8(3), 419-428 (2013) distribution, droughtsâ&#x20AC;&#x2122; return period was obtained using Eq. 5 (Table 3).
stations, respectively. The most proper probability distributions for annual maximum series of deficit volume and drought duration were determined in each station (Table 2). Then there are two kinds of drought analysis for each station including one is based on deficit volume series and another is based on drought duration. After determination of the best
DISCUSSION According to the results of variable threshold level method in this research, there was drought in most of the years in all stations. In fact based on threshold level explanation, drought was occurred in most of the years even for a short period. As observed the most and the least deficit volumes
Table 2: The most suitable probability distributions of drought time series Code
21-105 21-109 21-115 21-127 21-131 21-133 21-143 21-157 21-163 21-167 21-169 21-171 21-411
Station
Suitable distribution for Deficit volume Duration
Sangsurakh Firuzabad Doab Polechehr Khersabad Doabmerk Ghurbaghestan Daroot Tang-siab Dehno Kakareza Sarabseyed Ali Seymareh
Weibull Weibull Gamma Gen. pareto Gen. pareto Gen. pareto Gamma Gen. pareto Gamma Weibull Weibull Weibull Gen. pareto
Johnson Gamma Gamma Gen. pareto Gen. pareto Gen. pareto Gen. pareto Johnson Gen. pareto Gamma Johnson Johnson Gen. pareto
Table 3: Return period of the most severe and longest drought events
Code
1 2 3 4 5 6 7 8 9 10 11 12 13
21-105 21-109 21-115 21-127 21-131 21-133 21-143 21-157 21-163 21-167 21-169 21-171 21-411
Station
The most severe drought Deficit Date of Return volume occurrence period (Mm3)
Sangsurakh 60.04 Firuzabad 15.85 Doab 93.52 Polechehr 273.08 Khersabad 5.66 Doabmerk 67.98 Ghurbaghestan 203.99 Daroot 9.08 Tang-siab 7.23 Dehno 10.59 Kakareza 48.52 Sarabseyed Ali 53.03 Seymareh 1161.45
2007 2008 2008 2008 2007 2007 2008 2002 2005 1998 2007 1999 2008
33 25 20 100 50 50 50 25 50 38 25 21 50
Longest drought Duration Date of Return (day) occurrence period (year) (year) 332 365 281 365 285 365 365 365 330 259 203 352 365
2007 2007 1980 2000 2008 2007,2008 2008 2008 2005 1999 1998 1999 2008
33 17 25 50 100 25 50 13 50 50 33 21 25
KARIMI & SHAHEDI, Curr. World Environ., Vol. 8(3), 419-428 (2013)
Fig.1: The location of study area and hydrometric stations
Fig. 2: Number of drought events during study period in all stations
423
424
KARIMI & SHAHEDI, Curr. World Environ., Vol. 8(3), 419-428 (2013) drought intensity is higher than upstream stations. In comparison with the upstream stations, downstream parts of the basin with associated problems such as water exploitation, water demanding for agricultural and industrial usages,
Deficit volume (mm3)
Deficit volume (mm3)
70 60 50 40 30 20 10
16 14 12 10 8 6 4 2 0
1969 1972 1975 1978 1981 1984 1987 1900 1993 1996 1999 2002 2005 2008
1954 1958 1962 1966 1970 1974 1978 1982 1986 1990 1994 1998 2002 2006
0
Time (Year) Firuzabad
180 160 140 120 100 80 60 40 20 0 1969 1972 1975 1978 1981 1984 1987 1900 1993 1996 1999 2002 2005 2008
Deficit volume (mm3)
400 350 300 250 200 150 100 50 0 1954 1958 1962 1966 1970 1974 1978 1982 1986 1990 1994 1998 2002 2006
Deficit volume (mm3)
Time (Year) Sangsurakh
Time (Year) Doab
Deficit volume (mm3)
12 10 8 6 4 2 0 1977 1983 1986 1989 1991 1993 1996 1998 2000 2002 2004 2006 2008
Deficit volume (mm3)
Time (Year) Polechehr
Time (Year) Khersabad
80 70 60 50 40 30 20 10 0
1954 1958 1962 1966 1970 1974 1978 1982 1986 1990 1994 1998 2002 2006
were related to Seymareh and Tang-siab stations, respectively. In addition the most and the least drought durations were related to Seymareh and Dehno stations (Figures 4 and 5). Since Seymareh station is located in downstream of the basin, its
Time (Year) Doabmerk
425
KARIMI & SHAHEDI, Curr. World Environ., Vol. 8(3), 419-428 (2013) experience the occurrence of severe water scarcity (Asadi et al., 200925).
35
250
Deficit volume (mm3)
200 150 100 50 0
30 25 20 15 10 5 2008
2006
2004
2002
2000
1998
1996
2008
2006
2004
2002
Time (Year) Dehno
Deficit volume (mm3)
80 70 60 50 40 30 20 10 0 1985 1958 1961 1964 1967 1970 1973 1976 1979 1982 1985 1988 1991 1994 1997 2000 2003 2006
Deficit volume (mm3)
Time (Year) Tang saib
2000
1988
2007
2004
2001
1998
1995
1992
1989
1986
1983
1980
1977
1974
0
1998
2
1996
4
1994
6
1992
8
16 14 12 10 8 6 4 2 0 1990
10
80 70 60 50 40 30 20 10 0 1954 1958 1962 1966 1970 1974 1978 1982 1986 1900 1994 1998 2002 2006
12
Time (Year) Kakareza
1994
Time (Year) Dartoot
Deficit volume (mm3)
Deficit volume (mm3)
Time (Year) Ghurbaghestan
1992
1988
1956 1960 1964 1968 1972 1976 1980 1984 1988 1992 1996 2000 2004 2008
0 1990
Deficit volume (mm3)
Generally results showed that the most deficit volume and the least drought duration in most
of the stations were occurred after 1998. In addition Asadi et al., (2009), Kariminazar et al., (2010)26 and Byzedi et al., (2012)27 presented this year as a dry year in their study.
Time (Year) Sarabseyed Ali
426
Deficit volume (mm3)
KARIMI & SHAHEDI, Curr. World Environ., Vol. 8(3), 419-428 (2013)
1400 1200 1000 800 600 400 200 2007
2005
2003
2001
1999
1996
1990
1985
1983
0
Time (Year) Seymareh
21-411
21-171
21-169
21-163
21-157
21-143
21-133
21-131
21-109
21-109
21-105
100 90 80 70 60 50 40 30 20 10 0
Station Fig. 4: Average deficit volume of hydrological drought in stations 60 50 40 30 20 10
Station Fig. 5: Average drought duration of hydrological drought in stations
21-411
21-171
21-169
21-163
21-157
21-143
21-133
21-131
21-109
21-109
0 21-105
Avg Drought volume (mm3)
Avg Deficit volume (mm3)
Fig. 3: Deficit volume during study period for threshold level Q70 in all stations
KARIMI & SHAHEDI, Curr. World Environ., Vol. 8(3), 419-428 (2013) The results indicated that the most drought periods were occurred in summer which sometimes lasted until mid-summer and even first days of fall. It seems that the main reason of river surface runoff reduction is the decrease in precipitation and in the following, increasing in the water demand. Yarahmadi (2009)28, Fleig et al., (2006) and Wong et al., (2011) reached to the same results as what is observed here. As it was illustrated deficit volume and drought duration have somehow direct relationship with each other and their changing trend has the same direction. Also Byzedi (2009)29 showed the same results in his work. According to the results of derived probability analysis of drought parameters and using variable threshold level method, suitable probability distributions for drought time series were determined in each station. Among all of the distributions, Weibull and GP for maximum series of deficit volume and GP distribution for maximum series of duration had the most fitness. Also Felig et al., (2006) achieved to the same results. According
427
to this fact that the statistical distributions for deficit volume and drought duration are not necessarily the same in each station and based on two kinds of analysis, some differences were observed in return periods. The results showed that drought return period based on duration analyzing was more than return period of deficit volume in most of the years but their changing trend was the same (Table 3). The reason of this matter is that in some years, dry period with the most deficit volume had not the most duration, because in some years the drought period with maximum deficit volume had not maximum duration. Also Byzedi (2009) showed the same results in his work. Droughts with less intensity have more probable occurrence and less return period (Less than 5 and 10 years) (Hisdal and Tallaksen 2000). According to the results it was observed that the stations in Karkheh River basin were not free from hydrological drought. So drought is a vital issue which should be considered and the results of hydrological drought analysis are useful for proper water resources management, better planning for water supply and demand.
REFERENCES 1.
2.
3.
4.
5.
Samiei M., Saghafian B., Mahdavi M., Analysis Regional Hydrological Drought Severity in Tehran Province Watersheds, Journal of Natural Resources. 56(1): 27-39 (In Persian) (2006). Khazaei M. R., Telvari A., Jabbari A., Frequency Analysis of Hydrological Drought (Case study; Gharehsou Watershed), Journal of Geography and Development. 1(2): 45-56 (In Persian) (2003). Hisdal H., Tallaksen, L. M., Drought event definition. Technical Report to the ARIDE Project No.6: Supplement to Work Package 2 Hydro-meteorological Drought Activity 2.1 Event Definition, 1-41(2000). Mishra A. K., Singh V. P., A review of drought concepts, Journal of Hydrology. 391(1–2): 202–216 (2010). Van Loon A. F., Van Lanen H. A. J., A processbased typology of hydrological drought. Journal of Hydrology and Earth System Sciences, 16: 1915–1946 (2012).
6.
7.
8.
9.
Liu L., Hong Y., Bednarczyk C. N., Yong B., Shafer M. A., Riley R., Hocker J. E., Hydroclimatological drought analyses and projections using meteorological and hydrological drought indices: a case study in Blue River Basin, Oklahoma, Water resources management. 26: 2761–2779 (2012). Choi M., Jacobs J. M., Anderson M. C., Bosch D. D., Evaluation of drought indices via remotely sensed data with hydrological variables, Journal of Hydrology. 476: 265273 (2013). Vasiliades L., Loukas A., Liberis N. A., Water balance derived drought index for Pinios River Basin, Greece, Water resources Management. 25:1087–1101(2011). Tallaksen L. M., Streamflow drought frequency analysis. In: Drought and Drought Mitigation in Europe (Ed. by Vogt J. V., Somma F.). Kluwer Academic Publishers the Netherlands.103-117 (2000).
428 10.
11.
12.
13.
14.
15.
16.
17.
18.
19.
20.
KARIMI & SHAHEDI, Curr. World Environ., Vol. 8(3), 419-428 (2013) Bonacci O., Hydrological Identification of Drought, Hydrological Processes. 7: 249262 (1993). Zelenhasic E., Salvai A., A Method of Streamflow Drought Analysis, Water Resources Research. 3(1):156-168 (1987). Hisdal H., Tallaksen L. M., Frigessi A., Handling Non-Extreme Events in Extreme Value Modelling of Streamflow Droughts, in: FRIEND 2002 – Regional Hydrology: Bridging the Gap between Research and Practice, IAHS Publ. 274: 281–288 (2002). Hisdal H., Tallaksen L. M., Clausen B., Peters E., Gustard A., Hydrological drought characteristics, in: Hydrological Drought. Processes and Estimation Methods for Streamflow and Groundwater, edited by: Tallaksen L. M., Van Lanen H., Developments in Water Science 48: Elsevier Science B.V, 139–198 (2004). Engeland K., Hisdal H., Frigessi A., Practical Extreme Value Modeling of Hydrological Floods and Droughts: A Case Study, Extremes 7(1): 5–30 (2004). Andreadis K. M., Clark E. A., Wood A. W., Hamlet A. F., Lettenmaier D.P., Twentiethcentury drought in the conterminous United States, Journal of Hydrometeorology. 6: 985– 1001(2005), doi:10.1175/JHM450.1. Fleig A. K., Tallaksen L. M., Hisdal H., Demuth S. A., Global Evaluation of Streamflow Drought Characteristics, Journal of Hydrology and Earth System Sciences. 10: 535–552 (2006). Tallaksen L. M., Hisdal H., van Lanen H. A. J., Space-time modelling of catchment scale drought characteristics. Journal of Hydrology, 375: 363–372 (2009). Wong W. K., Beldring S., Engen-Skaugen T., Haddeland I., Hisdal H., Climate Change Effects on Spatiotemporal Patterns of Hydroclimatological Summer Droughts in Norway, Journal of Hydrometeorology. 12:1205–1220 (2011). Vrochidou A. E. K., Tsanis I. K., Grillakis M. G., Koutroulis A. G., The impact of climate change on hydrometeorological droughts at a basin scale, Journal of Hydrology. 476: 290–301 (2013). Giuntoli I., Renard B., Vidal J. P., Bard A.,
21.
22.
23.
24.
25.
26.
27.
28.
29.
Low flows in France and their relationship to large-scale climate indices, Journal of Hydrology. 482: 105–118 (2013). Tallaksen L. M., Madsen H., Clausen B., On the definition and modeling of stream flow drought duration and deficit volume, Hydrological Sciences Journal. 42(1): 1533(1997). Fleig A., Hydrological Drought – A Comparative Study Using Daily Discharge Series from around World, M.Sc. Thesis. Institute fur Hydrologic, University Freiburg, Germany. 144 (2004). Pandey R. P., Mishra S.K., Ramasastri K. S., Stream flow Drought Severity Analysis of Betwa River System (India), Water resources management. 22:1127–1141 (2008). Shiau J. T., Fitting drought duration and severity with two-dimensional copulas, Water resources management. 20: 795–815 (2006). doi:10.1007/s11269-005-9008-9. Asadi E., Mirabasi Najafabadi R., Malekpoor A., Fakherifard A., Dinpajou Y., Hydrological Drought Monitoring Using the Run Theory, (Case study; Aji-chai Watershed in East Part of Azerbaijan Province), The 2nd National Conference on Drought Impacts and Management Strategies, Isfahan. (In Persian) (2009). Kariminazar M., Moghadamnia A. R., Mosaedi A., Investigation of Climatic Factors Affecting Drought, Journal of Soil and Water Conservation Research. 17(1):145-158 (In Persian) (2010). Byzedi M., Siosemardeh M., Rahimi A., Mohammadi K., Analysis of Hydrological Drought on Kurdistan Province, Australian Journal of Basic and Applied Sciences. 6(7): 255-259 ISSN 1991-8178 (2012). Yarahmadi J., Frequency Analysis of Hydrological Drought in Gambarchay Watershed Using Model Series detail, The 2nd National Conference on Drought Impacts and Management Strategies, Isfahan. 1-7 (In Persian) (2009). Byzedi M., Saghafian B., Analysis of Hydrological Drought based on Daily Flow Series, The 2 nd National Conference on Drought Impacts and Management Strategies, Isfahan. (In Persian) (2009).
Current World Environment
Vol. 8(3), 429-433 (2013)
Study the Carbon Emission Around the Globe with Special Reference to India ASHWIN MODI1 and NIMESH P. BHOJAK1,2 1
1,2
BBA Department, Hemchandracharya North Gujarat University, Patan, India. Department of Hospital Management, Hemchandracharya North Gujarat University, Patan, India. http://dx.doi.org/10.12944/CWE.8.3.12 (Received: November 16, 2013; Accepted: November 30, 2013) ABSTRACT India was the third largest CO2 emitter in the world in 2009, following China and the United States and slightly ahead of Russia. This is due to increased coal consumption, which represented 67% of the emissions increase from 1990 to 2009. This paper represent the carbon emission in the globe and to know the carbon emission produce by the different country specific as developed and developing economy and study the contribution of the India in the carbon emission in the globe also check out the growth of the carbon emission in India.
Key words: Carbon Emission, Green House Gas.
INTRODUCTION Global warming is the increase in the usual temperature of Earth's atmosphere and oceans since the late 19th century. Since the early 20th century, Earth's mean surface temperature has increased by about 0.8 °C (1.4 °F), with about twothirds of the increase occurring since 1980. Warming of the climate structure is unambiguous, and scientists are certain that it is primarily caused by increasing concentrations of greenhouse gases produced by human activities such as the burning of fossil fuels and deforestation. The amount of CO2 produced when a fuel is burned is a function of the carbon content of the fuel. The heat content or quantity of energy created when a fuel is burned is a function of primarily the carbon (C) and hydrogen (H) content of the fuel. Heat is produced when C and H combine with oxygen (O) during burning. Because natural gas is mainly methane, or CH4, it has relatively high energy content relative to other fuels, and thus a relatively low CO2 to energy content. Water and different elements such as sulfur and non-combustible elements in some fuels reduce their heating values and increase their CO2 to heat contents. Different fuels emit different amounts of carbon dioxide in relation to the energy they
produce. To measure up to emissions across fuels you must compare the amount of CO2 emitted per unit of energy output or heat content. Literature Review Kala Seetharam Sridhar [2007] This Study has initiated how urban areas can become growth centers for an economy. Following this, the relationship between urbanization and climate change has also been discussed here. In this, first highlighted how cities contribute to climate change and provided a description of the carbon footprint of Indian cities. It represents issues such as the reverse impact of climate change on the ecology and the economy of a city. Based on the above, Study also make a case for developing urban infrastructure to enable low carbon urban growth and summarize some of the mitigating strategies cities in India have been adopting to adapt to climate change. Raphael Calel [July 2011] This paper looks at the history of climate science, at how the economics of emissions trading developed, and at the development of international institutions to address climate change. From this historical outlook it appears that climate change was a problem in
430
MODI & BHOJAK., Curr. World Environ., Vol. 8(3), 429-433 (2013)
need of a solution, and that emissions' trading was a result in search of bigger and bigger problems to solve. The political pressure to reach an international climate agreement was building rapidly in the 1990s, and the resulting marriage of climate change and carbon markets occurred before the quality of the match could be adequately assessed. Axel Michaelowa[July2012] The development of scenarios for supply and demand on international carbon markets shows that there is a strong tendency towards a supply overhang in the period 2013-2020. It can easily reach several billion credits if new market mechanisms are introduced without a concurrent raise of demand through stricter emission commitments for industrialized countries or the shift of advanced developing countries from being a seller to becoming a buyer of credits. The CDM can easily be smashed by a long-term price slump due to a constant supply overhang. Background of the Study There is importance of energy both in the development of the Indian economy and in India's growing emissions of carbon dioxide. Although carbon emissions in India remain low in per capita terms, total emissions are growing and will continue to grow with industrialization. The purpose and goal of this proposal is to Study the carbon emission around the globe with special reference to India. To fulfill the above purpose we also focus on the other concept like Green House Gas Emissions by Gas,
Carbon Emission based on Developed and Developing countries, and carbon emission different country wise with specific focus on India as developing country. Global Carbon Emissions At the global scale, the key greenhouse gases emitted by human activities are: Global Greenhouse Gas Emissions by Gas
Fig. 1: Source: IPCC (2007); based on global emissions from 2004. Details about the sources included in these estimates can be found in the Contribution of Working Group I to the Fourth Assessment Report of the Intergovernmental Panel on Climate Change
Global Carbon Dioxide (CO2) emissions from fossil-fuels 1900-2008
Fig.2 : Source of data: Boden, T.A., G. Marland, and R.J. Andres (2010). Global, Regional, and National Fossil-Fuel CO2 Emissions. Carbon Dioxide Information Analysis Center, Oak Ridge National Laboratory, U.S. Department of Energy, Oak Ridge, Tenn., U.S.A. doi 10.3334/CDIAC/00001_V2010.
MODI & BHOJAK., Curr. World Environ., Vol. 8(3), 429-433 (2013) Carbon dioxide (CO2) Fossil fuel use is the primary source of CO2. The way in which people use land is also an important source of CO2, especially when it involves deforestation. Land can also remove CO2 from the atmosphere through reforestation, improvement of soils, and other activities. Methane (CH4) Agricultural activities, waste management, 2008 Global CO2 Emissions from Fossil Fuel Combustion and some Industrial Processes (million metric tons of CO2)
431
and energy use all contribute to CH 4 emissions. Nitrous oxide (N2O) Agricultural activities, such as fertilizer use, are the primary source of N2O emissions. Fluorinated gases (F-gases) Industrial processes, refrigeration, and the use of a variety of consumer products contribute to emissions of F-gases, which include hydro fluorocarbons (HFCs), per fluorocarbons (PFCs), and sulfur hexafluoride (SF6). Black carbon (BC) Black carbon (BC) is a solid particle or aerosol, not a gas, but it also contributes to warming of the atmosphere. Its carbon emissions of 593 million tones carbon dioxide (MtCO2) or 2.8% of global emission in 1990 almost tripled to 1 548 MtCO2 or 5.4% in 2009. This growth rate is much higher than the world's average; India's emissions between 1990 and 2009 grew by a CAGR of 5.2% vis-Ă -vis 1.7% for the world.
Fig. 3: Source: National CO2 Emissions from Fossil-Fuel Burning, Cement Manufacture, and Gas Flaring: 1751-2008.
In 2008, the top carbon dioxide (CO2) emitters were China, the United States, the European Union, India, the Russian Federation, Japan, and Canada. These data include CO 2 emissions from fossil fuel combustion, as well as cement manufacturing and gas flaring. Together, these sources represent a large proportion of total global CO2 emissions.
Fig.4 : Source: EPA.gov/climatechange/emissions/globalghg.html
432
MODI & BHOJAK., Curr. World Environ., Vol. 8(3), 429-433 (2013)
Fig.5 : Source:Energy Information Administration, Us Department of Energy Carbon Emission in India [2009-2035] [MtCO2]
Fig. 6: Source: IEA, 2011a Emissions and sinks related to changes in land use are not included in these estimates. However, changes in land use can be important global estimates indicate that deforestation can account for 5 billion metric tons of CO2 emissions, or about 16% of emissions from fossil fuel sources. Tropical deforestation in Africa, Asia, and South America are thought to be the largest contributors to emissions from land-use change globally. In areas such as the United States and Europe, changes in land use associated with human activities have the net effect of absorbing CO2, partially offsetting the emissions from deforestation in other regions. India's per-capita carbon emissions could reach 2.34 (tCO2/capita), which is higher than at present but still substantially lower than the world average of 4.25, with China's per-capita CO 2 emissions at 7.39 and the United States' at 12.03 in
2035. The 450 Scenario projects that they would be 1.43 (tCO2/capita) for India, 3.59 for China, 5.98 for the United States and 2.52 globally. It is important to mention that India's percapita carbon emissions of 1.37 tonnes carbon dioxide (tCO2/capita) were much lower than those of other countries in 2009. The world average was 4.29 (tCO2/capita), compared to China at 5.14 and the United States at 16.90. The WEO 2011 NPS assumes that in 2035, when India is projected to be the world's most populous nation with 1.511 billion people Under the NPS, India's carbon emissions increase to 3 535 MtCO2 in 2035 at a CAGR of 3.2%, responsible for 8% of global emission of 43 320 MtCO2. Emissions from coal combustion would be 2 227 MtCO2 or 63% of India's total emissions. Under the 450 Scenario, India's emissions growth
MODI & BHOJAK., Curr. World Environ., Vol. 8(3), 429-433 (2013) would slow to a CAGR of 1.3%, reaching 2 159 MtCO2 in 2035. The share of coal-based emissions would decrease to 51%, decreasing dramatically to 1 093 MtCO2, which is near to the same level as in 2009. Such projections of a massive increase of carbon emissions in India raise concerns about their impact on global climate change. CONCLUSION The Globe has increase the carbon emission day to day for the sustainable development. All developed and developing
433
country has done immense growth of carbon for the fulfillment of the need of the population. India has substantially low per-capita energy consumption and per-capita carbon emissions in comparison with other countries. India must expand its energy supply to provide universal access to modern energy and maintain economic growth with reducing the carbon emission. India's growing dependence on foreign energy sources has serious policy implications for its energy security; and its coal-centered energy mix and rising carbon emissions will create serious challenges for India's sustainable development.
REFERENCES 1.
2.
3. 4. 5.
UNEP, UN-Habitat, World Bank, Draft International Standard for Determining Greenhouse Gas Emissions for Cities, Rio de Janeiro, Brazil (2010). Chakravarty Shoibal, Ananth Chikkatur, Heleen de Coninck et al . Sharing global CO2 emission reductions among one billion high emitters. PNAS Early Edition (2009). International Energy Agency .World Energy Outlook (2008). Forum of Indian Regulators â&#x20AC;&#x153;Policies on Renewablesâ&#x20AC;?. November (2008). UNFCCC, 2011. Report of the Conference of the Parties serving as the meeting of the Parties to the Kyoto Protocol on its sixth session, held in Cancun from 29 November to 10 December 2010. Conference of the Parties serving as the meeting of the Parties to the Kyoto Protocol. Decision 3/CMP.6: Further guidance relating to the clean
6. 7. 8. 9.
10.
development mechanism, FCCC/KP/CMP/ 2010/12/Add.2, March 2011 Energy Information Administration, US Department of Energy (www.eia.doe.gov) World Bank, India. (http://go.worldbank.org/ C6H9E76S60) Ministry of New and Renewable Energy, Govt. of India (mnes.nic.in) UNFCCC, Report of the Conference of the Parties serving as the meeting of the Parties to the Kyoto Protocol on its first session, held at Montreal from 28 November to 10 December 2005. Addendum.UNFCCC/ KPCMP/2005/8/Ad1, http://unfccc.int/ resource/docs/2005/cmp1/eng/08a01.pdf ETAP .The Carbon Trust Helps UK BusinessesReduce their Environmental Impact, Press Release (2007), http:// ec.europa.eu/environment/etap/pdfs/ jan07_carbon_trust_initiative.pdf
Current World Environment
Vol. 8(3), 435-444 (2013)
Estimation of Heavy Metal in Vegetables From Different Market Sites of Tribal Based Ranchi City Through ICP-OES and to Assess Health Risk RATNA GHOSH1, RESHMA XALXO1 and MANIK GHOSH2 1
*Department of Home Science (Division of Nutrition), Ranchi University, Ranchi - 834001, India. 2 Birla Institute of Technology, Mesra, Ranchi - 835215, India. http://dx.doi.org/10.12944/CWE.8.3.13 (Received: November 03, 2013; Accepted: November 28, 2013) ABSTRACT Inductively Coupled Plasma - Optical Emission Spectrometry (ICP-OES) was used to estimate and evaluate the levels of heavy metals in vegetables collected from various sites of Ranchi city (tribal dominated population) followed by health risk assessment by determining Metal Pollution Index (MPI), Daily intake of metal (DIM) and Health Risk Index (HRI). The concentration levels of Pb, Cd and Ni in vegetables were found to contain beyond than the permissible PFA limit. All sites showed quite a few higher concentrations of Lead (Pb), than the permissible PFA limit. Among thirteen vegetables, Beet, Cucumber, Pea, Beans, Lady's finger, Corriender leaves and Tomato showed high levels of Pb in vegetables collected from all sites. Health Risk Index was also found > 1 for Cd, Co and Pb. Health Risk Index for Cadmium was 1.64 and 2.38 in Cucumber from Site-6 and Site-8 respectively. In Spinach it was 2.19 and 2.15 respectively for Site-6 and Site-8. Health Risk Index for Pb was > 1 in Cucumber (All sites; 3.54 in Site-8), Pea (All sites except Site10; 2.45 in Site-7), Beans (All sites; 1.38 in Site-9), Lady's finger (All sites; 2.03 in Site-7), and Tomato (All sites except Site-10; 2.79 in Site-8). Lead and cadmium were among the most abundant heavy metals in the selected vegetables. The excessive content of these heavy metals in food may causes number of diseases. HRI more than 1 is considered to be not safe for human health. In present study, HRI indicates considerable risk and negative impact on human health.
Key words: Vegetables, ICP-OES, Health Risk Index (HRI), Metal Pollution Index (MPI), Ranchi, Tribal.
INTRODUCTION Heavy metals are important environmental pollutants, particularly in areas with high anthropogenic pressure. Their presence in the plants, atmosphere, soil and water, even in traces, can cause serious problems to all organisms. The presence of heavy metals in sewage sludge, used as agricultural fertilizer is a major problem for crop and environmental qualities and their impact on human health, because most of the heavy metals are persistent due to their immobile nature (Devkota et al., 2000; Itanna, 2002; Keller et al., 2002; McBride, 2003). The transfers of metals from bio solids to soil and subsequently to plants pose potential health risks because they can enter the
food chain and the environment (Ghaedi et al., 2008). Plant uptake is one of the major pathways by which sludge-borne heavy metals enter the food chain (Chaney, 1990). Inputs of heavy metals to agricultural soils generate negative impact on soil fertility and accumulate in the human food chain (McLaughlin et al., 1999). Food contamination by heavy metals depends both on their mobility in the soil and their bioavailability. Though some of the mobility and bioavailability factors are easy to measure, determination of the food risk contamination is tricky. Regulation, handling and bioremediation of hazardous materials require an assessment of the risk to some living species other than human being, or assessment of hazard to the entire ecosystem. Heavy metal accumulation in
436
GHOSH et al., Curr. World Environ., Vol. 8(3), 435-444 (2013)
soils is of concern in agricultural production due to the adverse effects on food quality (safety and marketability), crop growth (due to phytotoxicity) (Ma et al., 1994; Msaky and Calvert, 1990; Fergusson, 1990) and environmental health (soil flora/fauna and terrestrial animals). The mobilization of heavy metals into the biosphere by human activity has become an important process in the geochemical cycling of these metals. This is acutely evident in urban areas where various stationary and mobile sources release large quantities of heavy metals into the atmosphere and soil, exceeding the natural emission rates (Nriagu, 1989; Bilos et al., 2001) and it is often caused by accidental releases of chemicals or the improper disposal of hazardous waste. Increased inputs of metals and synthetic chemicals in the terrestrial environment due to rapid industrialization coupled with inadequate environmental management in the developing country like India, has led to large-scale pollution of the environment. These chemicals in the terrestrial environment clearly pose a significant risk to the quality of soils, plants, natural waters and human health. Heavy metal content of soil is of major significance in relation to their fertility and nutrient status (Gowd et al., 2010). However, high concentrations of these metals become toxic. Other metals, which are not included in the group of essential elements, such as Pb or Cr, may be tolerated by the ecosystem in low concentration, but become harmful in higher concentrations. Soluble metal compounds and metals held in exchange complexes are considered to be available to vegetation uptake. Prolonged exposure to heavy metals such as cadmium, copper, lead, nickel can cause deleterious health effects in humans (Reilly 1991). In this study, we estimated the concentrations of Cd, Co, Cr, Cu, Pb, Ni and As in vegetables collected from different market sites of Ranchi city (tribal dominated population). The study was conducted around Ranchi (23°21' N latitude 85°20' E longitude and 729 m (2,392 ft) above the sea level) city in Jharkhand eastern plains of India. Various small scale industries situated in this city. A large area around industries have no access to clean water resources, so farmers use treated and
untreated wastewater for irrigation. The long term uses of treated and untreated wastewater for irrigation may also increase the uptake and accumulation of the heavy metals in the vegetables. From the cultivated sites these vegetables are supplied to the wholesale vegetable market and the rest enter the local markets. The levels of contamination were compared with the PFA and ASTDR guidelines to assess the potential hazards of heavy metals to public health. The hypothesis behind the present study is that the irrigation with waste water, transportation and marketing site of vegetables in contaminated environment may elevate the levels of heavy metals in vegetables through surface deposition. MATERIALS AND METHODS Study Area Thirteen vegetables were collected randomly from the different market sites of urban and suburban area of Ranchi, Jharkhand to estimate the total heavy metal content in these samples. Ranchi City (23°21' N latitude 85°20' E longitude and 729 m (2,392 ft) above the sea level) is Capital of Jharkhand, India. Eight Road side Markets viz. Site-1 (Lalpur Market), Market Site-2 (BIT More Market), Site-3 (Daily Market), Site-4 (Kanke Road Market), Site-5 (Booti More Market), Site-6 (RIMS Market), Site-7 (Morabadi Stadium Market), Site-8 (Bahu Bazar Market) and two organized Markets i.e. Site-9 (Reliance Mart and Site-10 (Big Bazar) were demarcated for vegetable purchasing. A report related to Site-1 to Site-4 has already been discussed in one of the previous study (Ghosh et al., 2011). The present study was focused on Site-5 to Site-10 only. Sampling The freshly mature vegetables were brought to the laboratory and washed primarily with running clean tap water to remove the soil particles. After removing the extra water from the surface of vegetables with blotting paper, samples were cut into pieces, packed into separate bags, and kept in an oven until a constant weight was achieved. Sample were dried in oven at 70 °C for 48 h and then ground to powder. The grinded samples were passed through a sieve of 2 mm size and then kept at room temperature for further analysis.
437
GHOSH et al., Curr. World Environ., Vol. 8(3), 435-444 (2013) Analytical Procedure Digestion Dried and sliced vegetable samples were grounded into powder with an electric blender and stored in polythene bags until analysis. Approximately 0.5 grams of samples were digested in replicate (along with a blank) with 7 ml HNO3 and 0.5 ml H2O2 in a MultiwaveTM 3000 Microwave digestion system (Anton Paar). This is an industrial type microwave oven which can be equipped with various accessories to optimize the sample digestion. In this case, pre cleaned HF-100 vessels were used in an 8-position rotor. A pressure / Temperature (P/T) Sensor Accessory, which simultaneously measures temperature and pressure for one vessel, was also used. All vessels temperature were monitored with the IR Temperature Sensor Accessory. This device gives thermal protection to the reactions in all of the vessels by measuring the temperature remotely on the bottom surface of each vessel liner during the digestion process. The digestion program consisted of 30 minutes of heating and 15 minutes of cooling as shown in Table 2. The samples were completely dissolved, resulting in clear solution. After cooling, the digested sample was filtered using WhatmanÂŽ Quantitative Filter paper, Ashless Grade No. 44 and the filtrate was finally maintained to 100 ml with Millipore water.
grade (AR) including Standard Stock Solutions of known concentrations of different heavy metals. Heavy metal concentrations of vegetable samples were estimated by Inductively Coupled Plasma Optical Emission Spectrometer (ICP-OES) (Model Optical 2100DV ICP-OES, Perkin Elmer, USA) with argon laser. The Spectral range was of 160 nm to 900 nm and resolution of 0.009 nm at 200 nm. The instrument was fitted with UV sensitive dual backside - illuminated CCD array detector. Concentrations of heavy metals were calculated on a dry weight basis. All analyses were replicated six times. To assess the contamination level of heavy metals, mean, median, minimum, maximum and standard deviation of vegetable samples were performed by using Microsoft Excel (Version 2007). Data Analyses Metal Pollution Index (MPI) To examine the overall heavy metal concentrations in all vegetables, metal pollution index (MPI) was computed. This index was obtained by calculating the geometrical mean of concentrations of all the metals in the vegetables (Usero et al, 1997). MPI (Âľg/g) = (Cf1 x Cf2 x . . . x Cfn)1/n Where, Cfn = concentration of metal n in the sample.
All reagents used were Merck, analytical Table 1: Common Name and Botanical Name of vegetables used in study S.No.
Common Name
Botanical Name
Family
Veg. Category
1 2 3 4 5 6 7 8 9 10 11 12 13
Spinach Corriander Cabbage Beet root Carrot Radish Ginger Potato Bean Pea Cucumber Lady's finger Tomato
Spinacia oleracea Coriandrum sativum Brasssica oleracea Beta vulgaris Ductus carrotus Raphanus sativus Gingiber officinalis Solanum tuberosum Phaseolus vulgaris Pysum sativum Cucumis sativus Abelmoschus esculentus Lycopersicum esculentum
Chenopodiaceae Apiaceae Brassicaceae Amaranthaceae Apiaceae Brassicaceae Zingiberaceae Solanaceae Fabaceae Fabaceae Cucurbitaceae Malvaceae Solanaceae
Leafy Leafy Leafy Roots and Tubers Roots and Tubers Roots and Tubers Roots and Tubers Roots and Tubers Legumes Legumes Others Others Others
438
GHOSH et al., Curr. World Environ., Vol. 8(3), 435-444 (2013)
Estimate Daily Intake of Heavy Metals Data of the average diet per person per day were collected from a survey .The average daily vegetable intake was calculated by conducting a survey where 50 people having average body weight of 60 kg and age group 18 years to 70 years were asked for their daily intake of particular vegetable from the each experimental area in every sampling. Daily intake was calculated by the following equation: Daily intake of metal (DIM) = Cmetal x Dfood intake / Baverage weight Where, C metal, D food intake and Baverage weight represent the heavy metal concentrations in vegetables (Âľg g-1), daily intake of vegetables and average body weight respectively (Singh et al., 2010). Health Risk Index (HRI) The health risk index was calculated as the ratio of estimated exposure of test vegetables and oral reference dose (Cui et al., 2004). Oral reference doses (RfDo) were 4 x 10⁻² and 1 x 10⁻³ mg kg-1 day-1 for Cu and Cd, respectively (USEPA, 2002) and 0.004, 0.02 and 1.5 mg kg-1 day-1 for Pb, Ni and Cr, respectively (USEPA, 1997). Estimated exposure is obtained by dividing daily intake of heavy metals by their safe limits. An index more than 1 is considered as not safe for human health (USEPA, 2002). Therefore, Health Risk Index = DIM/RfDo, Here, RfDo (Oral Reference Dose) represents safe levels of exposure by oral for life time Statistical Analysis Concentrations of heavy metals were calculated on a dry weight basis. All analyses were replicated six times. To assess the contamination level of heavy metals, mean, median, minimum, maximum and standard deviation of vegetable samples. The Metal Pollution Index of the vegetables of different sites (Site-1 to Site-10) were subjected to two way analysis of variance (ANOVA) test for assessing the significance of differences in heavy
Table 2: Microwave digestion program for the sample preparation Step
1 2
Power (W)
Ramp (min)
Hold (min)
Fan
1000 0
15 0
15 15
1 3
metal concentrations due to different sites, irrigation practices, environmental pollutants, etc. All analysis was performed by using Microsoft Excel (Version 2007) and GraphPrism 5. RESULTS AND DISCUSSION Concentration levels of heavy metals In present study, the concentration range of various heavy metals such as Cadmium (Cd), Cobalt (Co), Copper (Cu), Chromium (Cr), Nickel (Ni) and Lead (Pb) in different vegetables collected from road side market and organized market were estimated. The mean concentrations of Cd, Ni and Pb found in vegetables collected from local markets were summarized in graphical form (Fig 1 to 3). All sites showed quite a few higher concentrations of Lead (Pb), than the permissible PFA limit. Among thirteen vegetables, Beet, Cucumber, Pea, Beans, Lady's finger, Corriender and Tomato showed high levels of Pb in vegetables collected from all sites. Within the selected vegetables, the highest concentrations of Pb were noticed in Peas collected from Site-5 followed by Site-7 and Site-8. Cadmium (Cd) was found in fair amount in Cucumber collected from Site-6 and Site-8 and Spinach from Site-6. Nickel (Ni) was found to be in higher concentrations in Pea and Beans collected from all sites. Lady's finger also contains fair amount of Ni. The concentration levels of these three heavy metals (Pb, Cd and Ni) in vegetables were found to contain beyond than the permissible PFA limit. The high contamination found in vegetables might be closely related to the pollutants in irrigation water, farm soil or due to pollution from the highways traffic (Igwegbe et al., 1992; Qiu et al., 2000). The concentration of Cadmium (Cd) ranges from 0.116 ppm to 2.150 ppm in various vegetables. The maximum concentration of Cd
GHOSH et al., Curr. World Environ., Vol. 8(3), 435-444 (2013) 2.150 ppm was found in spinach collected from Site-8, while minimum concentration 0.116 ppm was found in Pea collected from Site-5. Cd concentration was found to be significantly higher (P<0.001) in Cucumber and Spinach in both Site-6 and Site-8 in comparison to all other sites. Health Risk Index (HRI) was found more than 1.64 and 2.38 in Cucumber from Site-6 and Site-8 respectively. In Spinach the HRI was 2.19 and 2.15 respectively for Site-6 and Site-8 (Fig 4). HRI more
439
than 1 is considered as not safe for human health (USEPA, 2002). Acute doses of Cadmium can cause severe gastrointestinal irritation, vomiting, diarrhea, and excessive salivation, and doses of 25 mg of Cd/kg body weight can cause death. Low-level chronic exposure to Cd can cause adverse health effects including gastrointestinal, hematological, musculoskeletal, renal, neurological, and reproductive effects. The main target organ for Cd following chronic oral exposure is the kidney (ATSDR 1999a).
Fig. 1: Mean concentration (n=6) of Cadmium (Cd) in all vegetables collected from Site-5 to Site-10 in comparison to PFA Standard Limit. Cd concentration was found to be significantly higher (P<0.001) in Cucumber and Spinach in both Site-6 and Site-8 in comparison to all other sites.
Fig. 2: Mean concentration (n=6) of Nickel (Ni) in all vegetables collected from Site-5 to Site-10 in comparison to PFA Standard Limit. Nickel was found to be significantly higher (P<0.001) in Pea and Beans of Site-5 and Site-6 respectively in comparison to Site-10
440
GHOSH et al., Curr. World Environ., Vol. 8(3), 435-444 (2013)
The Cobalt (Co) content varies from 0.300 ppm to 1.466 ppm. The lowest concentration 0.300 ppm of Co was observed in Carrot collected from Site-5. On the other hand, Beet from Site-7 showed highest concentration of Co i.e. 1.466 ppm but was less than what observed in Site-3 (1.633 ppm) (Ghosh et al, 2011). Health risk index was found more than 1 in Cabbage (All sites except Site-5; 1.46 in Site-6), Tomato (Site-6, 8 and 10), Potato (Site-9 and Site-10; 1.57 in Site-10) and Spinach (Site-7 and Site-10) (Fig 5). Higher concentrations of Co were observed in Beet of Site-3 and Spinach
of Site-4 which were significantly higher (P<0.05) than all other sites (Ghosh et al, 2011). Overdose of Co may lead to angina, asthma, cardiomyopathy, polycythemia and dermatitis. The safety limit for human consumption of Co is 0.05 to 1 mg/day in humans (ATSDR 1994). Present investigation reveals that Copper (Cu) varies from 3.933 ppm to 22.300 ppm. The highest concentration of Cu was found in Tomato collected from Site-8 (22.300 ppm), while lowest concentration 3.93 ppm was recorded in Potato
Fig. 3: Mean concentration (n=6) of Lead (Pb) in all vegetables collected from Site-5 to Site-10 in comparison to PFA Standard Limit. Pb concentration was found to be significantly higher (P<0.01) in Pea of Site-5 in comparison to all other sites.
Fig . 4: Health Risk Index (HRI) for Cadmium (Cd) in all vegetables collected from Site-5 to Site-10. (HRI Cd > 1 in Cucumber of Site-6 & Site-8; Spinach of Site-6)
GHOSH et al., Curr. World Environ., Vol. 8(3), 435-444 (2013) collected from Site-7. Chromium (Cr) concentration varies from 0.266 to 7.833 ppm. The highest concentration of Cr was found in Tomato collected from Site-6 (7.833 ppm), while lowest concentration 7.833 ppm was recorded in Radish and Cabbage collected from Site-7. The presence of Nickel (Ni) ranges from 0.200 to 5.833 ppm in various vegetables. Peas from Site-5 and Beans from Site6 showed high content of Nickel 5.833 ppm, while Ginger from Site-5 contains low value of Ni 0.200 ppm. Nickel was found to be significantly higher
441
(P<0.001) in Pea and Beans of Site-5 and Site-6 respectively in comparison to Site-10. Excess intake of Ni leads to hypoglycemia, asthma, nausea, headache, and epidemiological symptoms like cancer of nasal cavity and lungs. During the present study, the concentration of Lead (Pb) content varies from 0.466 ppm to 12.066 ppm. High concentration of Pb was found in Peas collected from Site-5 (12.066 ppm) but less than what observed in Site-1 (13.733
Fig. 5: Health Risk Index (HRI) for Cobalt (Co) in all vegetables collected from Site-5 to Site-10. (HRI Co > 1 in Potato and Cucumber of Site-9; Potato of Site-10; Raddish, Spinach, Cabbage of Site-7; Tomato of Site-6, Site-8 & Site-10)
Fig. 6: Health Risk Index (HRI) for Lead (Pb) in all vegetables collected from Site-5 to Site-10. (HRI Pb > 1 in Cucumber, Beans and Lady finger of all Sites; Pea of Site-5, Site-7, Site-8 & Site-9; Cabbage of Site-6; Tomato of all Sites except Site-10)
442
GHOSH et al., Curr. World Environ., Vol. 8(3), 435-444 (2013)
ppm) (Ghosh et al, 2011). The concentration of Lead was found to be significantly higher (P<0.01) in Tomato, Pea and Cucumber of Site-5 in comparison to Site-2, Site-3, Site-9 and Site-10. Spinach collected from Site-10 showed low concentration of Pb (0.466 ppm). Health risk index for Pb was found more than 1 in Cucumber (All sites; 3.54 in Site-8), Pea (All sites except Site-10; 2.45 in Site7), Beans (All sites; 1.38 in Site-9), Lady's finger (All sites; 2.03 in Site-7), and Tomato (All sites except Site-10; 2.79 in Site-8) (Figure 6). Todd (1996) emphasized that most of the accumulated Lead is sequestered in the bones and teeth. This causes brittle bones and weakness in the wrists and fingers. Lead that is stored in bones can reenter the blood stream during periods of increased bone mineral recycling (i.e., pregnancy, lactation, menopause, advancing age, etc.). Mobilized lead can be redeposited in the soft tissues of the body and can cause musculoskeletal, renal, ocular, immunological, neurological, reproductive, and developmental effects (ATSDR 1999b). Metal Pollution Index (MPI) is suggested to be a reliable and precise method for metal pollution monitoring. Among different vegetables pea showed highest value of MPI followed by Cucumber. Seven vegetables out of thirteen showed higher MPI i.e. more than 2. These were pea, cucumber, tomato, beans, spinach, lady finger and cabbage. Higher MPI suggests that these vegetables may cause more human health risk due to higher accumulation of heavy metals in the edible
portion. Metal Pollution Index of various vegetables from all sites (Site-1 to Site-10) was reported in Figure 7. Site-6 and Site-8 can be classified as high risk sites as the MPI of all vegetables were higher than 1. Among the vegetables Pea, Beans. Beet and Cucumber were found to be highly contaminated with the heavy metals. The results of the Anova (Two-Factor without Replication) suggests that in case of vegetables, the P value (1.12E-38) was found to be less than the significance level (0.05), and F (50.513) was more than F crit (1.843) i.e. there is significant difference between MPI among the vegetables. Similarly, in case of Sites, the P value (4.65E-10) was less than the significance level (0.05), so we can reject the null hypothesis that the means are equivalent. F (9.017) was observed more than F crit (1.968) so we can reject the null hypothesis i.e. there is a significant difference between MPI among the Sites. CONCLUSION The heavy metals not only affect the nutritive values of vegetables but also have deleterious effect on human beings using these food items. The value of HRI more than 1 indicates considerable risk of negative impact on human health. National and International regulations on food quality have lowered the maximum permissible levels of toxic metals in human food; hence, an increasingly important aspect of food quality should be to control the concentrations of trace metals in food (Radwan et al., 2006). The residues of the
Fig. 7: Metal Pollution Index of various vegetables for all sites (Site-1 to Site-10)
GHOSH et al., Curr. World Environ., Vol. 8(3), 435-444 (2013) heavy metals still appear as pollutants in vegetables as well as in the environment. Their occurrence and long-range transport at local, regional and global scales has been recently investigated. In developing countries heavy metal contamination is receiving increasing attention from the public as well as governmental organization. There are few major pathways for human exposure to heavy metal contamination in vegetables. Data here demonstrates that Pb, Cd and Co in vegetables may pose health risk to consumer. The present study provides additional data on heavy metals contamination in Ranchi, Jharkhand. It is suggested that regular survey of
443
heavy metals should be done on all food commodities in order to evaluate whether any health risks from heavy metal exposure do exist, to assure food safety and to protect the end user from food that might injure their health. ACKNOWLEDGEMENT The authors are thankful to the Head, Department of Pharmaceutical Sciences, Birla Institute of Technology, Mesra for providing the facilities to carry out this work and Dr. Sanjay Swain, Central Instrumentation Facility, Birla Institute of Technology, Mesra Ranchi for his constant help during the analytical work.
REFERENCE 1.
2.
3.
4.
5. 6.
7.
Agency for Toxic Substances and Disease Registry (ATSDR), Toxicological Profile for Zinc and Cobalt, US Department of Health and Human Services, Public Health Service, 205-88-0608 (1994). Agency for Toxic Substances and Disease Registry (ATSDR), Toxicological Profile for Cadmium and Nickel, Agency for Toxic Substances and Disease Registry, US Department of Health and Human Services, Public Health Service, 205-93-0606 (1999a). Agency for Toxic Substances and Disease Registry (ATSDR)., Toxicological Profile for Lead, Agency for Toxic Substances and Disease Registry, US Department of Health and Human Services, Public Health Service, 205-93-0606 (1999b). Bilos, C., Colombo, J.C., Skorupka, C.N., Rodriguez Presa, M.J., Source, distribution and variability of airborne trace metals in La Plata City area, Argentina. Environ. Pollut. 111: 149-158 (2001). Chaney, R..L., Public health and sludge utilization, Biocycle 30: 68-73 (1999). Devkota, B., Schmidt, G.H., Accumulation of heavy metals in food plants and grasshoppers from the Taigetos Mountains, Greece, Agric. Ecosyst. Environ. 78: 85-91 (2000). Fergusson, J.E., The Heavy Elements:
8.
9.
10.
11.
12.
Chemistry, Environmental Impact and Health Effects. Pergamin Press, Oxford, pp. 382-399 (1990). Ghaedi, M., Shokrollahi, A., Kianfar, A.H., Mirsadeghi, A.S., Pourfarokhi, A., Soylak, M., The determination of some heavy metals in food samples by flame atomic absorption spectrometry after their separationpreconcentration on bis salicyl aldehyde 1,3 propan diimine (BSPDI) loaded on activated carbon. J. Hazard. Mater. 154: 128-134 (2008). Ghosh, R., Xalxo, R., Gope, M.C., Mishra, S., Kumari, B., Ghosh, M., Estimation of Heavy Metals in locally available vegetables collected from road side market sites (1-4) of different areas of Ranchi City. PHARMBIT XXIII and XXIV: 68-73 (2011). Gowd, S.S, Reddy, M.R,. Govil, P.K., Assessment of heavy metal contamination in soils at Jajmau (Kanpur) and Unnao industrial areas of the Ganga Plain, Uttar Pradesh, India. J. Hazard. Mat. 174: 113-121 (2010). Igwegbe, A.O., Belhaj, H., Hassan, T.M., Gibali, A.S., Effect of a highways traffic on the level of lead and cadmium in fruits and vegetables grown along the roadsides. J. Food Safety 13: 7-18 (1992). Itanna F., Metals in leafy vegetables grown in Addis Ababa and toxicological
444
13.
14.
15.
16.
17.
18.
19.
GHOSH et al., Curr. World Environ., Vol. 8(3), 435-444 (2013) implications, Ethiop. J. Health Dev. 6: 295302 (2002). Keller, C,. McGrath, S.P,. Dunham, S.J,, Trace metal leaching through a soil grassland system after sewage sludge application. J. Environ. Qual. 31: 1550-1560 (2002). Ma, Q.Y., Traina, S.J., Logan, T.J., Effect of aqueous Al, Cd, Fe(II), Ni and Zn on Pb immobilization by hydroxyapatite. Environ. Sci. Technol., 28: 1219-1228 (1994). McBride, M.B., Toxic metals in sewage sludge-amended soils: has promotion of beneficial use discounted the risks. Adv. Environ. Res. 8: 5-19 (2003). McLaughlin, M.J., Parker, D.R., Clarke, J.M,. Welch, R.M,. Graham, R.D., Sustainable field crop systems for enhancing human health: agricultural approaches to balanced micronutrient nutrition. Field Crops Res. 60: 143-163 (1999). Msaky, J.J., Calvert, R., Adsorption behavior of copper and zinc in soils: influence of pH on adsorption characteristics. Soil Sci., 150: 513-522 (1990). Nriagu, J.O., A global assessment of natural sources of atmospheric trace metals. Nature, 338: 47-49 (1989). Qiu, X.X., Huang, D.F., Cai, S.X., Chen, F., Ren, Z.G., Cai, Y.C., Investigation on vegetables pollution and the pollution sources and its control in Fuzhou, Fujian Province (China). Fujian J. Agric. Sci. 15: 1621 (2000).
20.
21.
22.
23. 24.
25.
26.
Radwan, M.A., Salama, A.K., Market basket survey for some heavy metals in Egyptian fruits and vegetables. Food Chem. Toxicol. 44: 1273-1278 (2006). Reilly, C., Metal contamination of food, 2nd edn. Elsevier Applied Science, London, p. 110 (1991). Singh, A., Sharma, R.K., Agrawal, M., Marshall, F.M., Health risk assessment of heavy metals via dietary intake of foodstuffs from the wastewater irrigated site of a dry tropical area of India. Food Chem. Toxicol. 48: 612 (2010). Todd, G.C. Vegetables grown in mine wastes. Environ. Toxicol. Chem. 19: 600-607 (1996). USEPA (US Environmental Protection Agency), Exposure Factors Handbook, Office of Research and Development. National Center for Environmental Assessment. US Environmental Protection Agency. Washington, DC. http://www.epa.gov/ncea/ pdfs/efh/front.pdf (1997). USEPA (US Environmental Protection Agency), Region 9, Preliminary Remediation Goals. http://www.epa.Gov/region09/waste/ sfund/prg (2002). Usero, J., Gonzalez-Regalado. E., Gracia. I., Trace metals in the bivalve mollusks Ruditapes decussates and Ruditapes phillippinarum from the Atlantic Coast of Southern Spain. Environ. Int. 23: 291-298 (1997).
Current World Environment
Vol. 8(3), 445-454 (2013)
Effect of Industrial Effluents on Surface Water Quality A Case Study of Patancheru, Andhra Pradesh, India MUSHTAQ HUSSAIN1 and T.V.D PRASAD RAO2 1
Department of Chemistry, Deccan College of Engg & Tech, India. 2 P.G. College Osmania University, Hyderabad, India. http://dx.doi.org/10.12944/CWE.8.3.14
(Received: November 03, 2013; Accepted: December 12, 2013) ABSTRACT In order to assess the surface water quality a total of forty two surface water samples were collected in pre-monsoon and post-monsoon seasons of 2008, 2009, 2010 and were analyzed for electrical conductivity, pH, total dissolved solid, Na, K, Ca, Mg, HCO3, Cl, and SO4. The chemical classification of surface water has been studied using L-L diagram, given by Langelier and Ludwig (1942)1, surface water of both the seasons belongs to sodium Cl+SO4 type. The results show that surface water is affected by industrial effluents which have high concentration of BOD, COD, Na, Ca, Mg, K, Cl, SO4 and HCO3. However the three years of study shows that the surface water pollution in Bolaram and patancheru industrial development areas has significantly reduced, due to fact that the emission of effluents are treated regularly for the last few years.
Key words: Surface water, Industrial effluents, Three years, Water pollution, Electrical conductivity.
INTRODUCTION Surface water is usually rain water that collects in surface water bodies, like oceans, lakes, or streams. Surface water can become contaminated in many ways, one of which is direct recharge can come from industries sources. A change in the water chemistry due to surface water contamination can negatively affect all levels of an ecosystem. It can impact the health of lower food chain organism and consequently the contaminated surface water can also affect the health of animals and humans when they drink or bathe in contaminated water or for aquatic organism when they ingest contaminated sediments. Degradation of water quality or depletion of water resources and loss of aquatic biodiversity are prominent features of the environmental landscape requiring urgent attention at global and national level1. The effluents of the industries gave a great deal of influence on the pollution of the water bodies, these effluents can alter the physical, chemical and biological nature of the receiving water body2. In
the present study area there are about 400 (large and small) industries, and since 1977 these have been engaged in the manufacture, production, and processing of pharmaceuticals, paints and pigments, metal treatment and steel rolling, cotton and synthetic yarn, and engineering products. Most of them use various inorganic and organic chemicals as raw materials. These industries discharging their waste effluents directly into the streams. The Study Area The Patancheru and Bolaram Industrial Development Areas (IDA) (78째08'-78째23' east longitude and 17째30'-17째42' north latitude) of the Medak district are located about 35 km from Hyderabad, Andhra Pradesh (A.P.), India; the location is shown in Fig. 1. The study area form the part of the Nakkavagu watershed. Surface water sampling 1. Kazipally lake 2. Gandigudem lake
446 3. 4. 5. 6. 7.
HUSSAIN & RAO, Curr. World Environ., Vol. 8(3), 445-454 (2013) Asanikunta Kistareddy pet lake Palma vagu Pedda vagu Nakka vagu
The Pamulavagu, Peddavagu and Nakkavagu streams, while carrying industrial effluents also acts as diffuse sources of contamination along their courses to the confluence with the Manjira River. Apart from this, streams tanks both of medium and small size form the other surface water bodies of patancheru and bolaram industrial areas. METHODOLOGY Hydrochemical sampling procedure The objective of sampling is to collect a portion of material small enough in volume to be transported conveniently and handled in the laboratory while still accurately representing the material being sampled (APHA, 1992)3. Samples, however, have to be handled in such a way that no significant change in composition occurs before the tests are made.
A total number of 42 surface water samples were collected for physico-chemical analysis in two successive pre-and post-monsoon seasons of 2008, 2009, 2010. The water samples were collected and stored in 1 liter capacity clean plastic bottles. Before collection of samples, the bottles were properly washed. Prior to collecting the samples, the containers were rinsed by the water to be sampled. The major ion analyses were carried out at National Geophysical Research Institute, (NGRI) Hyderabad. Analytical techniques for major ions The water samples were analyzed as per the standard methods of APHA (1992). Values of pH were measured by a portable digital water analyses kit with electrodes. The instrument was calibrated with buffer solutions having pH values of 4 and 9. Total dissolved solids (TDS) were calculated by summing up the concentrations of all the major cations and anions. The values of electrical conductivity (EC) were measured by portable kit with electrodes.
S.No
1 2 3 4 5 6 7
Kazipally Tank Gandigudem Asanikunta Kistareddy Pet Palma Vagu Pedda Vagu Nakka Vagu
Sample 8.14 7.25 8.39 8.3 7.85 8.21 8.41
PH 27400 20500 33800 17000 26700 26700 30100
EC 17810 13100 21600 11050 17200 15870 20150
TDS
Kazipally Tank Gandigudem Asanikunta Kistareddy Pet Palma Vagu Pedda Vagu Nakka Vagu
Sample
3593 4613 4110 1590 3630 2290 4350
TH 890 551 757 459 564 489 445
HCO3 6704.9 6200 11214.2 5593 7213 6633 7570
Cl 3983.3 1700 1767.3 679 3219 2756 4950
SO4 4001.9 2856 6183.9 3361 4563 5006 4990
Na 575.3 204 395.9 249 275 213 362
K
7.67 7.35 8.5 7.64 7.8 8.5 8.6
PH 24200 16700 29300 14900 22700 19400 23800
EC 15500 10735 18900 9500 14400 12450 15250
TDS 3070 3550 3610 1460 2590 1980 3490
TH 645 458 615 412 544 521 414
HCO3
5700.3 5008.1 9900 4907.1 5643 4903 6023
Cl
3456.2 1423 1545 520.3 2759 2458 3679
SO4
3956 2311 5432 2902.5 4090 3631 4067
Na
431 187 307 210 255.1 186 307
K
Table 2:Physico-chemical characterization of surface water of post-monsoon 2008 IN mg/L
EC in Âľs/cm all other parameters in mg/L Except pH
1 2 3 4 5 6 7
S.No
Table 1: Physico-chemical characterization of surface water of pre-monsoon 2008 IN mg/L
878 997 787 311.9 528 428 760
Ca
1005 1300 915.8 329.3 816 516 990
Ca
215 258 400 165.2 309.6 223 389
Mg
263 331.8 444.9 188 388 245 458
Mg
HUSSAIN & RAO, Curr. World Environ., Vol. 8(3), 445-454 (2013) 447
7.98 7.76 7.01 7.54 7.58 7.85 7.83
PH 22600 14900 25300 15600 19300 18200 26800
EC 14500 9600 16250 10005 12521 11650 17050
TDS 3693 3940 3720 1250 2450 2060 3730
TH 458 506 654 601 745 711 487
HCO3 6200 4690 8734 4991 4300 4519 5680
Cl 2750 875.4 1434 579 3110 1956 4250
SO4 3300 1932 4320 3041 3418 3601 4563
Na 275 180 304 202 115 179 275
K
PH
7.65 7.85 6.94 7.98 7.94 7.91 7.43
Kazipally Tank Gandigudem Asanikunta Kistareddy Pet Palma Vagu Pedda Vagu Nakka Vagu
21100 10000 21800 12800 15000 12300 19800
EC 13400 6350 13902 8150 9750 7900 14001
TDS 2760 1920 2670 1230 2160 1710 2880
TH 798 429 550 512 678 751 425
HCO3 4989 3012 7021 4121 3852 2889.1 5720
CL
2536.4 654 1342 432.3 1784 1347 3100
SO4
3546 1472.5 4031 2409.1 2511 2039.1 3500
Na
376 105 254 159 221 139 250
K
Table 4: Physico-chemical characterization of surface water of post-monsoon 2009 in mg/L
Kazipally Tank Gandigudem Asanikunta Kistareddy Pet Palma Vagu Pedda Vagu Nakka Vagu
Sample
Sample
1 2 3 4 5 6 7
S.No
Table 3:Physico-chemical characterization of surface water of pre-monsoon 2009 IN mg/L
201 197 232 132.5 298 218 309
Mg
350 290.8 405 120.1 279 205 387
Mg
775 445 686 276.1 375 328 645
Ca
900 1100 823 304.9 523 489 856
Ca
448 HUSSAIN & RAO, Curr. World Environ., Vol. 8(3), 445-454 (2013)
Kazipally Tank Gandigudem Asanikunta Kistareddy Pet Palma Vagu Pedda Vagu Nakka Vagu
Kazipally Tank Gandigudem Asanikunta Kistareddy Pet Palma Vagu Pedda Vagu Nakka Vagu
20800 13200 22100 12300 16300 13200 24900
EC 13300 8518 14000 7850 10420 8450 15180
TDS 4403 3330 3210 1000 2050 1700 3410
TH 550 489 858 650 547 540 415
HCO3 5963.4 4290 6560 3453 4110 3100 5880
CL 1871.3 722.4 1350 868.5 2019 1839 3550
SO4 2600 1600 3815 2300 3063 2234 3909
Na 750 150 235 120 79 89.9 289
K
7.21 7.31 7.81 7.56 7.44 7.91 7.65
PH 12600 8000 16400 8000 11000 10600 19100
EC 8150 5050 10500 5200 7050 6750 12500
TDS 1530 1400 2250 974 1450 1390 2880
TH 575 358 560 505 682 510 425
HCO3
2976 2434.2 5112 2401.9 2625 2743 5720
CL
1645.3 401 1018 319.2 1214 1058 3100
SO4
2078.5 1198 2711 1410.1 1921.3 1831.4 3500
Na
210 87 231.1 141 121 87 250
K
Table 6: Physico-chemical characterization of surface water of post-monsoon 2010 in mg/L
7.77 7.56 7.11 7.47 7.23 7.45 7.35
PH
Table 5: Physico-chemical characterization of surface water of pre-monsoon 2010 in mg/L
156 134.2 190.2 111.9 217 176 309
Mg
463.6 250.8 320 97.6 239 193 375
Mg
356 341.9 587.4 205.9 225 267 645
Ca
1600 920 770 240 428 365 750
Ca
HUSSAIN & RAO, Curr. World Environ., Vol. 8(3), 445-454 (2013) 449
450
HUSSAIN & RAO, Curr. World Environ., Vol. 8(3), 445-454 (2013)
Langelier and Ludwig (L-L) diagram of pre-monsoon and post-monsoon 2008
pH ELECTRICAL CONDUCTIVITY
20
POST 2009
15
PRE 2010
10
POST 2010
5
POST 2009 PRE 2010 POST 2010
KAZIPALLY TANK
NAKKA VAGU
PEDDA VAGU
PALMA VAGU
KISTAREDDY PET
ASANIKUNTA
GANDIGUDEM
KAZIPALLY TANK
0
PRE 2009
SURFACE WATER
SURFACE WATER
Na
K 800
PRE 2008
PRE 2008
700
POST 2008
POST 2008
600
PRE 2009
500
POST 2009
400
PRE 2010
300
POST 2010
6000 5000
PRE 2009
4000
POST 2009
3000
PRE 2010
2000
POST 2010
1000
mg/L
7000
200 100
0
SURFACE WATER
SURFACE WATER
NAKKA VAGU
PEDDA VAGU
PALMA VAGU
KISTAREDDY PET
ASANIKUNTA
GANDIGUDEM
KAZIPALLY TANK
NAKKA VAGU
PEDDA VAGU
PALMA VAGU
KISTAREDDY PET
ASANIKUNTA
GANDIGUDEM
0 KAZIPALLY TANK
mg/L
NAKKA VAGU
PRE 2009
PEDDA VAGU
25
POST 2008
PALMA VAGU
POST 2008
KISTAREDDY PET
30
PRE 2008
ASANIKUNTA
PRE 2008
GANDIGUDEM
35
pH UNTIS
MS
40
10 9 8 7 6 5 4 3 2 1 0
451
HUSSAIN & RAO, Curr. World Environ., Vol. 8(3), 445-454 (2013)
Ca
Mg 1800
PRE 2008
PRE 2008
1600 POST 2008
1400
PRE 2009
1200
PRE 2009
POST 2009
1000
POST 2009
800
PRE 2010
mg/L
POST 2008
PRE 2010
600
POST 2010
POST 2010
400 200
POST 2010
2000
SURFACE WATER
SURFACE WATER
SO4
TDS 25000
POST 2008 PRE 2009
PRE 2008 POST 2008
20000
4000
mg/L
POST 2009 PRE 2010
3000
POST 2010
PRE 2009 15000
POST 2009 PRE 2010
10000
2000
SURFACE WATER
SURFACE WATER
NAKKA VAGU
PEDDA VAGU
PALMA VAGU
KISTAREDDY PET
ASANIKUNTA
GANDIGUDEM
NAKKA VAGU
PEDDA VAGU
PALMA VAGU
KISTAREDDY PET
0
ASANIKUNTA
0 GANDIGUDEM
5000
KAZIPALLY TANK
POST 2010
1000
KAZIPALLY TANK
mg/L
NAKKA VAGU
POST 2010
KAZIPALLY TANK
NAKKA VAGU
PEDDA VAGU
PALMA VAGU
KISTAREDDY PET
ASANIKUNTA
GANDIGUDEM
KAZIPALLY TANK
0
PRE 2010
NAKKA VAGU
4000
POST 2009
PEDDA VAGU
PRE 2010
PALMA VAGU
6000
PRE 2009
KISTAREDDY PET
POST 2009
POST 2008
ASANIKUNTA
8000
PRE 2009
PRE 2008
GANDIGUDEM
POST 2008
mg/L
10000
1000 900 800 700 600 500 400 300 200 100 0
mg/L
PRE 2008
5000
PEDDA VAGU
HCO3
Cl 12000
6000
PALMA VAGU
SURFACE WATER
SURFACE WATER
PRE 2008
KISTAREDDY PET
ASANIKUNTA
GANDIGUDEM
KAZIPALLY TANK
NAKKA VAGU
PEDDA VAGU
PALMA VAGU
GANDIGUDEM
ASANIKUNTA
KISTAREDDY PET
0 KAZIPALLY TANK
mg/L
500 450 400 350 300 250 200 150 100 50 0
452
HUSSAIN & RAO, Curr. World Environ., Vol. 8(3), 445-454 (2013) BOD PRE 2008
25000
PRE 2008
25000
POST 2008
20000
POST 2008
PRE 2009
20000
POST 2009 15000 PRE 2010 10000
mg/L
PRE 2009 15000
POST 2009 PRE 2010
10000
POST 2010
POST 2010 5000
5000
NAKKA VAGU
PEDDA VAGU
PALMA VAGU
KISTAREDDY PET
ASANIKUNTA
NAKKA VAGU
PEDDA VAGU
PALMA VAGU
KISTAREDDY PET
ASANIKUNTA
GANDIGUDEM
KAZIPALLY TANK
SURFACE WATER
GANDIGUDEM
0
0
KAZIPALLY TANK
mg/L
COD 30000
SURFACE WATER
Variation of various parameters are graphically represented as The concentrations of Ca ++, Mg ++, Cl -, HCO3 and total hardness were determined by volumetric method. Ca++ and Mg++ were determined by EDTA titration. For HCO3-, HCl titration to a methyl orange point was used. Chloride was determined by titration with AgNO3 solution. Flame emission photometry has been used for the determination of Na+ and K+. In this method water sample is atomized and sprayed into a burner. The intensity of the light emitted by a particular spectral line is measured with the help of a photoelectric cell and a galvanometer. Sulphate was determined by gravimetric method. -
RESULTS AND DISCUSSION The analytical data of successive pre-and post-monsoon seasons for surface water sample corresponding to June 2008 and November 2008, June 2009 and November 2009 June 2010 and November 2010 are given in table 1, 2, 3,4,5,6. Classification of surface water The chemical classification of surface water has been studied using L-L diagram, given by Langelier and Ludwig (1942)4 for both, premonsoon and post-monsoon of 2008 seasons. Surface water samples have been plotted to discern any conspicuous changes in the overall chemical behavior of surface water during the two major seasons of the year. Both the plot belongs to pre and post-monsoons of 2008 indicate there are no
major changes in the chemistry of surface water samples. Surface water of both the seasons belongs to sodium Cl+SO4 type. Physico-chemical attributes of surface water The properties of surface water of the area under study, in terms of fundamental parameters, such as, pH, total dissolved solids, Electric Conductivity, COD and BOD are given below. Hydrogen Ion Concentration (pH) The pH values were measured at well sites, are lies in the range of 7.25 to 8.41 and 7.35 to 8.0 during pre-monsoon 2008 and post-monsoon 2008, respectively .The surface water thus is mildly acidic to slightly alkaline in nature. Electrical Conductivity Seasonal variations showed higher value of EC in pre-monsoon 2008 and lower value in post-monsoon due to dilution with rain water. The values obtained were very much higher than the permissible limits. The conductivity was recorded in different seasons from minimum of 17 mS Cm-1 to a maximum of 33 mS Cm-1 in pre- monsoon 2008 season and from minimum of 14.9 mS Cm-1 to a maximum of 29.3 mS Cm-1 in post- monsoon 2008 season.. Total Dissolved Solids (TDS) In water, total dissolved solids are composed mainly of carbonates, bicarbonates,
HUSSAIN & RAO, Curr. World Environ., Vol. 8(3), 445-454 (2013) chlorides, phosphates and nitrates of calcium, magnesium, sodium, potassium and manganese, organic matter, salt and other particles5. At high flows, the TDS values tend to be diluted by surface runoff and for most rivers there are an inverse correlation between discharge rate and TDS6. As expected, the maximum total dissolved solids were observed during the pre-monsoon season of 2008 (21600 mg/l) than the post-monsoon (18900 mg/l), this is due to dilution factor during the rainy season. Higher level of TDS during pre-monsoon season is more likely due to the influence of industrial activities such as effluent addition to the surface water. Waters with high total dissolved solids (TDS) are unpalatable and potentially unhealthy. COD and BOD COD pointing to a deterioration of the water quality caused by the discharge of industrial effluents7. The COD in the surface water ranges from 3100-27000 mg/l in pre-monsoon 2008 and from 1450-14500 mg/l in post monsoon 2008. High BOD level indicates decline in DO, because the oxygen that is available in the water is being consumed by the bacteria leading to the inability of fish and other aquatic organism to survive in the river8. The BOD in the surface water ranges from 2400-20200 mg/l in pre-monsoon 2008 and from 660-12500 mg/l in post monsoon 2008. Temporal variation trends of major ions in surface water Data of concentration of major ions of preand post-monsoon 2008, pre-and post-monsoon 2009, and pre-and post-monsoon 2010 are given in Table. The concentration values of all the samples are discussed in detail. •
•
In pre-monsoon seasons of 2008, 2009 and 2010, the concentration of Na ranges from 2856 to 6183.9 mg/l, 1932 to 4563 mg/l and 1600 to 3909 mg/l, respectively. In postmonsoon seasons of years 2008, 2009 and 2010 the observed ranges are 2311 to 5432 mg/l, 1472 to 4031 mg/l and 1198 to 3500 mg/l respectively. Potassium ranges from 204 to 575.3 mg/l, 115 to 304 mg/l and 79 to 750 mg/l in premonsoon samples whereas in postmonsoon seasons it ranges from 186 to 431
•
•
•
•
•
453
mg/l, 105 to 376 mg/l and 27 to 250 mg/l, respectively. Concentration of Ca ranges from 329.3 to 1300 mg/l, 304.9 to 1100 mg/l and 240 to 1600 mg/l in pre-monsoon samples and from 311.9 to 997 mg/l, 276.1 to 775 mg/l and 205.9 to 645 mg/l in post-monsoon samples. Magnesium values range from 188 to 458 mg/l, 120.1 to 405 mg/l and 97.6 to 463.6 mg/l in pre-monsoon periods and from 165.2 to 400 mg/l , 132.5 to 309 mg/l and 111.9 to 309 mg/l in post-monsoon. Bicarbonate ranges from 445 to 890 mg/l, 458 to 745 mg/l and 415 to 858 mg/l in premonsoon seasons of years 2008, 2009 and 2010, whereas in post-monsoon seasons of above years it ranges from 412 to 645 mg/l, 425 to 798 mg/l and 358 to 682 mg/l respectively. Chloride, in corresponding sampling periods, ranges from 5593 to 11214 mg/l, 4300 to 8734 mg/l, 3100 to 6560 mg/l and 4903 to 9900 mg/l, 2899 to 7021 mg/l, 2401 to 5720 mg/l respectively. The concentration of SO4 in corresponding seasons ranges from 679 to 4950 mg/l, 579 to 4250 mg/l, 722 to 3550 mg/l and 520 to 3679 mg/l, 432 to 3100 mg/l, 319 to 3100 mg/l, respectively. CONCLUSIONS
Surface water has the highest concentration of cations and anions. Surface water is affected by industrial effluents which have high concentration of Na, Ca, Mg, K, Cl, SO 4 and HCO3.These parameters are in more than desirable limits which could be the result of direct dumping of effluents into the water bodies. The industrial effluents are let into the stream directly during rainy days thus leading to accumulation of elements in surface water, which together with rain water, flow down to Nakkavagu stream and join the major drainage system and these water in due course percolate down to join ground water reservoir. The effect of industrial pollution thus can be seen along Nakkavagu and its adjourning areas. The three years of study shows that the surface water pollution in Bolaram and patancheru
454
HUSSAIN & RAO, Curr. World Environ., Vol. 8(3), 445-454 (2013)
industrial development areas has significantly reduced, due to fact that the emission of effluents are treated regularly for the last few years. The low reduction in surface water pollution may be due to rainfall dilution.
ACKNOWLEDGEMENT The author thanks Dr V. Balaram, Head Geo-chemistry Division, National Geo-physical Research Institute (NGRI) Hyderabad for his support
REFERENCES 1.
2.
3.
4.
5.
M. Alkins-Koo, F.Lucas, L. Maharaj, S.Maharay, D. Phillip, Ecological indicators, 8:709 (2008). Sangodoyin, A.Y. Ground water and surface water pollution by open refuse dump in Ibadan, Nigeria, Journal of discovery and Innovations, 3(1): pp 24-31 (1991). APHA :Standard methods for the examination of Water and Wastewater, 16th edition, APHA, Washington, D.C (1992). Langeliar, W.F. and Ludwig, H.F. Graphic method for indicating the mineral character of natural water. Jour. Amer. Waterworks. Assoc., 34 (3), pp.335-352 (1942). Mahananda, Mohanty, B.P. and Beheva, N.R. Physico-Chemical analysis of surface and ground water of Baragarh District, Orissa,
6.
7.
8.
India, IJRRAS, 2(3) (2010). A.H. Charkhabhi and M. Sakizadeh â&#x20AC;&#x153;Assessment of spatial variation of water quality parameters in most polluted branch of the Anzali wetland, Northern Iran,â&#x20AC;? Polish J. of Environ. Study, 15 , 395-403, (2006). Mamais, D; D.Jenkins & P. Pitt . A rapid physico-chemical method for the determination of readily biodegradable soluble cod in municipal waste water. Water Research, 27(1) 195-197 (1993). H. Pathak and S.N. Limaye , Study of seasonal variation in ground quality of sagar city (India) by Principal Component Analysis. E Journal Of Chemistry, 8( 4) 2000-2009 (2011).
Current World Environment
Vol. 8(3), 455-461 (2013)
Chemical Studies of Traffic Generated Dust and its Impact on Human Health with Associated Problems in Singrauli District of Madhya Pradesh, India VINOD KUMAR DUBEY1, DHANANJAI SINGH2 and NEHA SINGH3 1
Department of Chemistry, SGS Govt. P.G. Autonomous (NAAC Accredited) College, SIDHI-486661 (M.P.) India. 2 SMS (Agronomy) Krishi Vigyan Kendra, SIDHI-486661 (M.P.) India. 3 Applied Chemistry Division, Department of Chemistry, SGS Govt. P.G. Autonomous (NAAC Accredited) College, SIDHI-486661 (M.P.) India. http://dx.doi.org/10.12944/CWE.8.3.15 (Received: November 19, 2013; Accepted: December 05, 2013) ABSTRACT The traffic generated dust now become a problem for urban people. Rate of dust fall in urban areas of Singrauli was estimated during two consecutive years (2011 and 2012) through recommended methods. The levels of dust fall in Singrauli during both years remained the highest (37.56 and 41.32 g/m2/month) respectively, with high traffic density. Among the locations, Waidhan showed with the highest rate of dust fall while Shakti nagar showed the lowest. Metallic analysis of dust fall in Singrauli was made through atomic absorption spectrophotometer. All the investigated metals except Ni were found high in all the dust fall samples of all the location and dust sample collected during 2012 showed high content of heavy metals than 2011. Data regarding impact of air pollution on human health exhibited that the percentage of pulmonary disease, eye irritation and headache in the urban area of Singrauli was found the highest than any other and 55 % of effected people were those who practiced trade while being directly exposed to the pollutant without any protective measures.
Key words : Singrauli, Dust fall, Heavy metals, Traffic Density, Human Health.
INTRODUCTION Certainly dust deteriorates the ecological condition and can be defined as the fluctuation in any atmospheric constituent from the value that would have existed without human activity (Tripathi and Gautam, 2007). Environmental degradation exerts significant pressure on human health; unfortunately these aspects are closely associated with the hazards to the environment and human caused by transport specially road transport (Dora and Phillips, 2000). The impact of dust pollution on health and the economy have resulted in measures to mitigate emissions of the most harmful pollutants such as particle pollution (acids, organic chemicals, metals and soil/dust particles) and ozone which affects the respiratory system. Despite national and
international interventions and decreases in major pollutant emissions the health impact of air pollution are not likely to decrease in years ahead unless appropriate action is taken. Health problems linked to air pollution ranges from minor eye irritation to upper respiratory symptoms, chronic respiratory diseases such as asthma, cardiovascular diseases and lung cancer. The atmospheric dust loading has been increasing over the last years due to global warming, increasing desertification and human activities (Derbyshire, 2007). The dust pollution affects not only environmental but also affects biogeochemical cycles of the earth (Tegen, 2006). The study area (Singrauli) is located in the mountainous region of Singrauli district surrounding in North Sonbhadra district of Uttar
456
DUBEY et al., Curr. World Environ., Vol. 8(3), 455-461 (2013)
Pradesh and in south Chhatishgarh and east Chhatishgrah and west Sidhi district of M.P. Most emerging industrial capital of Madhya Pradesh state of India. It lies approximately 24°11' 59'' North latitude and 82°40' 31'' East longitude and 365 meters elevation above the sea level. The present municipal corporation area limits approximately 22 Km2. populations about 2 lakh. There is number of Asia's big coal mines, thermal power generating unit in public/private sectors both and number of associated minor and major industries based on coal run by Govt. and private basis and hence people activity in road transport specially also increasing day by day and resulting into dust pollution. MATERIAL AND METHODS Dust fall collection and metallic anyaliss Dust fall measurement was carried out for two complete years (2011 and 2012) by recommended standard method (Robert, 1986). Dust fall containers/collectors of standard size and shape i.e. 20-22 cm. mouth diameter Jars, 16 cm base diameter and 25 cm. height were used and heavy traffic road were chosen for the sampling. Dust fall containers were installed at five locations
on Morba chauk near bus stop, near Shakti Nagar Chauk, Waidhan market Chauraha, Waidhan Vindhya Nagar road near bus stop and Mahajan turning point. After a period of one calendar month, the collectors were taken off, covered with plastic lid and brought to the laboratory analysis (Farid et. al., 2002), the sample were analyzed for heavy metals through atomic absorption spectrophotometer (model 2380 Perkin Elmer). Traffic counting The Vehicles passing along the selected road were collectors for 12 peak hours form 8 AM to 8 PM for three consecutive days of every month and average was taken form 10 busiest road of the Singrauli Municipal area for the period of two years i.e. 2011-2012. In traffic counting, buses, trucks, wagons, cars, motorbikes, autorickshaws, were counted separately (Khan, 1996, Hamidullah et al. 1998). Impact on Human Health For determining the impact of dust pollutants on human, a questionnaire was prepared and distributed among those who were directly
Table 1: Average rate of dust fall (g/m2/month) during two consecutive years on different Location at Singrauli S. No.
1. 2. 3. 4.
Total dust fall in 2011 Average Standard Deviation
Location
Near Waidhan Bus stop Morba Chauk Bus stop Waidhan Market Road Shakti Nager road
45.28 44.66 41.73 35.22
Total dust fall in 2012 Average Standard Deviation
0.32 0.28 0.67 0.43
48.76 46.89 45.18 38.35
1.78 1.82 1.85 1.46
Table 2: Average content of heavy metals (mg/g) in dust fall collected from Singrauli No. Location 1. 2. 3. 4.
Near Waidhan bus stop Morba Chauk bus stop Shakti Nager road Waidhan Market Road Total Mean
S.D.* = Standard Deviation
Mn/S.D.* 10.9 12.3 11.3 14.7 12.3
1.1 0.2 1.3 0.5 0.52
Cu/S.D.
Pb/S.D.
2.8 0.1 6.9 4.6 0.3 3.7 3.2 0.4 3.4 5.7 0.1 5.8 4.07 0.022 4.95
0.2 0.1 0.4 0.7 0.35
Ni/S.D. 2.3 1.7 2.6 2.2 2.2
0.1 0.1 0.0 0.3 0.16
Zn/S.D. 11.2 10.3 8.8 10.5 10.2
0.1 0.1 0.4 0.0 0.2
457
DUBEY et al., Curr. World Environ., Vol. 8(3), 455-461 (2013) exposed to the pollutants on the selected road using random sampling methods. Data was also collected form different hospitals of Singrauli/Waidhan/Jayant/ Shakti nager/Vindhya nager about different cases registered in different disease categories data was collected on monthly basis and then an average was calculated (data of the male patient was only taken). Dust fall affect not only the air quality of cities but also public health (Harrison et al., 1997). Dust fall can lead to disease such as tonsillitis, allergy, pneumonia, asthma and eye irritation etc. (Chung et al., 2008, De Langueville et al. 2010, and Chung et al., 2003). Statistical Analysis Standard deviation, values of the means, maximum and minimum values were calculated for
a comparison of site categories. To determine the significance of the samples, a paired t-test was performed for the comparison of dust fall collected over two year. Relationship among the two variables was assessed, using correlation coefficient and linear relationship (Steel and Torrie, 1980). RESULT AND DISCUSSION Total 48 samples from each sampling station, were collected and studied on monthly basis form January 2011 to December 2012. The annual average rate of dust fall, average traffic density and increasing percentage of dust fall per annum are shown in (table 1) and (fig. 1-5). Heavy metals compositions of dust fall and its impact on human health were shown in (table 2 and 3) and fig. 4 and 5.
Table 3: Showing correlation coefficient between data collected from different hospitals and questionnaires about different diseases categories Heart Patient
ENT Patient
Blood Pressures Patient
Chest/lung/ Asthma Patient
Eye irritation Patient
Headache Patient
0.82***
0.71***
0.42*
0.69**
0.35ns
0.56**
*, **, ***, ns = slightly, highly, very high, non significant respectively Average rate of Dust Fall 100 90 Percentage of dustfall
80 70 60 50 40 30 20 10 0 Near Waidhan Bus stop
Morba Chauk
Waidhan
Shakti Nagar
Bus stop
Market Road
Road
Nake of location Fig .1: Average rate of dust fall (g/m2/month) on different location of Singrauli during two consecutive years (2011-2012)
458
DUBEY et al., Curr. World Environ., Vol. 8(3), 455-461 (2013)
Percentage of overall dustfall
Overall average rate of Dust Fall 100 90 80 70 60 50 40 30 20 10 0 Durig 2011
During 2012
Duration of year Fig. 2: Overall average rate of dust fall (g/m2/month) on different locations during 2011 and 2012
100 Rate of dustfall g/gm2/month
90 80 70 60 50 40 30 20 10 0 Shakti Nagar Road
Waidhan
Morba Chauk Near Waidhan
Market Road
Bus stop
Traffic density Million / month
Overall average dust fall during two years
190216 212018 227010 212018
36.78 43.45 45.77 47.02
Bus stop
Fig. 3 :Traffic density and dust fall relation
DUBEY et al., Curr. World Environ., Vol. 8(3), 455-461 (2013) During 2011 average rate of dust fall (Fine and large particles) was in the range of 35.22-45.28 g/m2/month and during 2012 it changed to 38.3548.76 g/m2/month with near Waidhan bus stop the largest average rate of dust fall and Shakti nagar road showing the least.
Statistical analysis using t-test indicated that all the locations showed significant (P< 0.001) high rate of dust fall during 2012 than 2011 (table 1). Overall average rate of dust fall on different locations of the city Singrauli during both years was found 36.78-47.02 g/m2/month lowest to highest respectively.
Metals Concentration in mg/g
14 12 10 8 6 4 2 0 Mn
Zn
Pb
Cu
Ni
Heavy Metals Fig . 4: Comparison of average content of heavy metals in dust fall during 2011 and 2012 80 70 60 50 40 30 20 10 0 Heart
Nose Throat
459
Blood Pressure
Chest/ Eye Headache lungs/ imition Asthma Fig . 5:Percentage of the people suffering in different diseased during two consecutive year (2011-2012)
460
DUBEY et al., Curr. World Environ., Vol. 8(3), 455-461 (2013)
Where as Waidhan bus stop standing with the highest dust fall and Shakti nager road with the lowest (fig. 1). The higher amount of dust fall at Waidhan bus stop was attributed to the high traffic mobility and population density as it is the busiest road of the city, other factors like construction of road, lack of proper arrangement of the vehicles parking, presence of goods stores, and lack of awareness about air pollution and dusty weather condition of the area are adding more dust pollution to the atmosphere of Singrauli. Due to above facts and figure the site was expected to be the most polluted area as compared to the other site. The finding of (Beg. et al., 1987 and Khan et al., 2002) also supported the above mentioned facts. Moreover average rate of dust fall on all the locations during 2011 and 2012 was found to be 41.72 and 44.79 g/m2/month respectively (fig. 2) which might be due to climate changes, global warming, increasing population and increasing rate of bomb blast and fires in the city or increasing rate of traffic density unfortunately, these aspects are closely associated with the hazards to the environment and human health caused by transport particularly, road transport, the above views were also supported by (Dora and Phillip, 2000). Furthermore the rate of dust fall positively correlated with the number of vehicles passing along different road of the city as the number of vehicle increased the rate of dust fall also increased (fig. 3). The lowest rate of dust fall at Shakti nagar road, might be due to the slowest and lowest moving traffic, because Shakti nagar is the main market of Singrauli due to rush of pedestrians peoples walk and shop on the road due to which no clear space for driving is available. The average content of Mn in traffic generated dust collected during 2011-2012 was found 10.9 to 14.7 mg/g. with Waidhan market road the largest content and Waidhan bus stop road showing the least. The mean value of Mn in dust fall were observed higher than the critical level of 5 mg/g. (Rhue and Kidder, 1983). The overall average concentration of Mn was found to be 12.3 mg/g. which were the highest among all the observed
metals (table 2). This spurious variation of Mn is difficult to explain but it might be due to contamination of road dust/soil of the area. The Copper metal was found highest at Waidhan market road sample and lowest at Waidhan bus stop (table 2). The toxic metal Pb was present highest at Shakti nagar road sample lowest at waidhan bus stop road. The high concentration of Pb (lead) was correlated with high traffic density. Ni concentration was found highest at Shakti nagar road lowest at Morba Chauk near bus stop. Zn was found highest at Shakti nagar road (8.8 mg/g) lowest (10.3 mg/g) at Morba Chauk near bus stop; its value shows an inverse relationship with traffic density. The level of all the investigated metals were found high during 2012 with respect to 2011 (fig. 4). The level of all these metals except Ni remains higher at all the location. The positive correlation of some metals with number of vehicle may indicate the exhaust of the vehicles as the emanating sources. However with the exception of lead (Pb) other metals are not normally found in gasoline and disease, the sources of these metals are both mobile and stationary. For determining health impact of dust fall, questionnaires survey indicated that the percentage of people suffering form cardiac disease was 12 % and 16 % , ENT disease 40 % and 44 %, blood pressure 50 % and 53 %, pulmonary disease 55 % and 60 %, eye irritation 60 % and 66 % and headache 62 % and 68 % during 2011-2012 respectively (fig. 5). Total average data taken from different hospitals of Singrauli during 2011 and 2012. Correlation coefficient between the data's collected from different hospitals and questionnaires about different diseased categories table no. 3 indicated that cardiac patients and ENT patients showed significant relationship while eye irritation case exhibited non-significance relationship. The reported different diseases in the urban area of Singrauli might be due to different factors like, high traffic density, use of disease /petrol oil and emission from tyres are the Maine cause of air pollution particularly dust fall and its heavy metals contamination fig. 5.
DUBEY et al., Curr. World Environ., Vol. 8(3), 455-461 (2013) CONCLUSION In this study it has been concluded that atmosphere of the Singrauli city is highly polluted because of high rate of traffic generated dust, it was also noticed that main causes of dust fall pollution are the vehicle movement and winds. Result reported that rate of dust fall significantly
461
increase from 2011 to 2012. Result also exhibited that majority of the people of Singrauli city particularly those who were directly exposed to the dust fall pollutants are badly affected due to traffic generated pollutants and they were mostly suffering from different diseases, this is in agreement with the reports of public health in connection with the degrading air environment of Singrauli.
REFERENCES 1.
2.
3.
4.
Ara. F. Zm. Iqbal and M. S. Qureshi , Detemination of heavey metals contaminations of trees and soil due to vehicular emission in Karachi city, Kar Univer. J.Sci. 24(1) 80-84 (1996). Benneth, B. G., Exposure commitment assessment of environmental pollutions. monitoring and assessment Research centre, London, Brit. Med. Journal (1) 454458, (1981). Bruneckreef, B. Air Pollution from lorry traffic and lung infection in children living near motorways epidemiology ;8(3) 298-303, (1997). Cacciola R. R., M. Sarva and R. P. Olosa , Adverse respiratory effect and allergic susceptibility in relation to particulate air pollution, Flirting with disaster Allergy, 57, 281-286, (2002).
5.
6. 7.
8.
9.
Cheng, M. F. Scho, H F. Chiu, T. N. Wu, P.S. Chen and C. Y. Yong , Consequences of exposure to Asian dust storm event on daily pneumonia hospital admission in Taipei, Taiwan, Journal of Toxical, Environ, Health A., 71 (19) 1295-98, (2008). Derbyshire, E., Natural miner genie dust and human health, Ambio 36, 73-77, (2007). Farid, U. K., B. Shakila, G.G. Ejaz and M. Ahmad , Air pollution in Peshawar, Pak J. Sci. Ind. Res. (95), 1-6, (2002). Livingstone, A. E. et al., People living near inner city main road have more asthma needing treatment, case control study, British Medical Journal, 312, 676-677, (1996). Hock, G. B. Et. al., Association between mortality and indicators of traffic related air pollution in the Netherlands, Journal of Lancet, 360, 1203-1219, (2002).
Current World Environment
Vol. 8(3), 463-468 (2013)
Bioaccumulation of Heavy Metal Toxicity in the Vegetables of Mahalgaon, Nagpur, Maharashtra (India) A. S. MAHAKALKAR1, R. R. GUPTA2 and S. N. NANDESHWAR3 1
Sevadal Mahila Mahavidyalaya,Sakkaradara Square, Nagpur - 09, India. 2 Mohota Science College,Sakkaradara Square, Nagpur - 09, India. 3 Sevadal Mahila Mahavidyalaya,Sakkaradara Square, Nagpur - 09, India. http://dx.doi.org/10.12944/CWE.8.3.16 (Received: October 03, 2013; Accepted: November 17, 2013) ABSTRACT Mahalgaon is a village in Kamptee Taluka, Nagpur district of Maharashtra state, India. Most of the village formers from this village are engaged in vegetable cultivation and the village serves as one of the main supplier of vegetables required in the Nagpur market. All the fields and farms of this region are irrigated by the Nag river water which is highly polluted by urban waste and heavy metals. The purpose of this study was to study the bioaccumulation of heavy metals i.e. Cu, Mn, Fe, Zn, Ni and Pb in Water, Soil and Vegetables irrigated by Nag River water and to evaluate the level of bioaccumulation of the metals by the different vegetables. For this study five farms were selected in the Mahalgaon region. Each farm was situated near the bank of Nag River. The sampling was carried out according to grab method as given in APHA for the sampling of water, soil and vegetables. The concentration of heavy metals (Cu, Mn, Fe, Zn, Ni, Pb) were analyzed using Atomic Absorption Spectrophotometer (AAS). It was found that in water the concentration of Iron and zinc was highest whereas conc. of Nickel and lead was lowest. The concentration of Fe and Zn in the soil samples was very high compared to the WHO/FAO maximum permissive limits while the concentrations of Cu and Mn were slightly above the permissible limits. The concentration of Pb and Ni were below the detection limits in soil. On the other hand in all the vegetables, the concentration of heavy metals was higher than the WHO/FAO permissible limits. the soil-plant transfer factor of different heavy metals shows the following order- TFZn> TFFe>TFCu>TFNi>TFMn>TFPb.
Key words: Bioaccumulation, Heavy Metals, Temasna, Nag River, Vegetables.
INTRODUCTION Mahalgaon is a village in Kamptee Taluka, Nagpur district of Maharashtra state, India1. Nag River is the main river which flows through the city and passes through Mahalgaon village hence it is the easiest and cheapest source of water for irrigation to the villagers on the bank of this river. The river serves as the drainage for the city and is highly polluted by urban waste and heavy metals2. Most of the village formers are engaged in vegetable cultivation and the village serves as one of the main supplier of vegetables required in
the Nagpur market. All the fields and farms are irrigated by the Nag river water. Although trace quantities of certain heavy metals such as Chromium, Cobalt, Cupper, Manganese, Zinc etc. are essential micronutrients for higher animals and plant growth but their high concentration may cause health problem3,4 hence lot of work has been carried out to assess heavy metal bioaccumulation in different vegetables and plants 5,6,7,8,9,10,11,12 which show that heavy metals are non-biodegradable and persistent environmental contaminants which are deposited on the surfaces and then absorbed into the tissues
464
MAHAKALKAR et al., Curr. World Environ., Vol. 8(3), 463-468 (2013)
of vegetables. Plants take up heavy metals by absorbing them from contaminated soil. By consumption of vegetables heavy metals enter the food chain8 and if consumed in high concentration it may lead to the chronic accumulation of heavy metals in the kidney and liver of humans causing disruption of biochemical processes leading to cardiovascular, nervous, kidney and bone disease8,13. The purpose of this study was to study the bioaccumulation of heavy metals i.e. Cu, Mn, Fe, Zn, Ni and Pb in Water, Soil and Vegetables irrigated by Nag River water and to evaluate the level of bioaccumulation of the metals by the different vegetables. These are the most toxic heavy metals in water, soil and vegetables. MATERIAL AND METHODOLOGY Analytical reagent (AR) grade chemicals and distilled water were used throughout the study. The sampling was carried out according to grab method as given in APHA for the sampling of water14, soil and vegetables. Five farms were selected in the Mahalgaon region for study purpose. Each farm was situated near the bank of Nag River.
water sampling were plastic bottles which were thoroughly washed with nitric acid followed by double distilled water. 2ml nitric acid was added in 1 liter water sample for the digestion of heavy metals and it was stored at cold temperature till the further analysis. The concentration of heavy metals (Cu, Mn, Fe, Zn, Ni, Pb) were analyzed using Atomic Absorption Spectrophotometer (AAS SL-243 ELICO). Soil sampling Soil samples were collected from five sites. Each farm was first subdivided into five parts (four cornors and one centre) and then soil was collected from all the five spots and mixed together to get a composite soil sample from one field. Likewise all the five samples were collected. Sampling was carried out by using plastic equipment instead of metal tool to avoid any cross contamination. The samples were collected in a self locking polythene bags and were sealed so as to avoid any kind of loss or leakage. The soil samples were air dried and then disaggregated with mortar and pestle and dried samples were finely powdered to 2mm thick sieve to make the sample homogeneous.
Water sampling Water samples were collected from five sites along Nag River at Mahalgaon. All the sampling sites were adjacent to the farms which were selected for study purpose. Sampling was made in the summer 2013. The containers used for
Vegetables The vegetables selected for heavy metal analysis were Brinjal (Solanum Melongena), Flower, Bathua (Chenopodium Album), Chawli (Vigna Catjang), Spinach (Spinacia Oleraceae). All this are the common vegetables which are repeatedly consumed by peoples of this area. Grab method was used for collecting vegetable samples.
Table 1: Concentration (mg/l) of Heavy Metals in water samples.
Table 2: Concentration (mg/g) of Heavy Metals in Soil samples.
Sites Cu
Mn
Fe
Zn
Ni
Pb
Site
Cu
Mn
Fe
Zn
Ni
Pb
1 2 3 4 5 Min Max Ave
0.91 0.92 0.9 0.91 0.91 0.9 0.92 0.91
4.67 4.65 4.66 4.69 4.68 4.65 4.69 4.67
4.62 4.6 4.63 4.62 4.63 4.6 4.63 4.62
0.51 0.53 0.51 0.5 0.5 0.5 0.53 0.51
0.23 0.25 0.24 0.22 0.21 0.21 0.25 0.23
1 2 3 4 5 Min Max Ave
0.42 0.4 0.43 0.44 0.41 0.4 0.44 0.42
0.69 0.67 0.68 0.7 0.71 0.67 0.71 0.69
11.08 11.09 11.09 11.06 11.08 11.06 11.09 11.08
2.85 2.86 2.88 2.84 2.82 2.82 2.88 2.85
0.11 0.09 0.13 0.1 0.12 0.09 0.12 0.11
0.083 0.084 0.081 0.085 0.082 0.081 0.085 0.083
0.63 0.65 0.61 0.63 0.63 0.61 0.65 0.63
465
MAHAKALKAR et al., Curr. World Environ., Vol. 8(3), 463-468 (2013) The plant samples were put through a three step washing sequence, which involved agitating and rinsing first in 0.1% teepol for 15 seconds, followed by 0.1% HCl for 15 seconds and lastly three separate washes in deionised water.
The clean vegetable samples were air dried, weighed and placed in a dehydrator at 70 °C for 48-72 hours depending on sample size. Dried samples were weighed and mechanically ground using a stainless steel grinder (<1 mm) for digestion.
Table 3: Concentration (mg/g) of Heavy Metals in Vegetables
Site-I
Site-II
Site-III
Site-IV
Site-V
Average
Vegtables
Cu
Mn
Fe
Zn
Ni
Pb
Brinjal Flower Bathua Chawli Spinach Brinjal Flower Bathua Chawli Spinach Brinjal Flower Bathua Chawli Spinach Brinjal Flower Bathua Chawli Spinach Brinjal Flower Bathua Chawli Spinach Brinjal Flower Bathua Chawli Spinach
0.002 0.002 0.001 0.003 0.002 0.001 0.001 0.002 0.003 0.003 0.002 0.001 0.004 0.002 0.001 0.002 0.003 0.004 0.002 0.002 0.003 0.003 0.001 0.001 0.003 0.002 0.002 0.002 0.0022 0.0022
0.005 0.004 0.002 0.001 0.004 0.002 0.003 0.002 0.002 0.001 0.004 0.002 0.003 0.003 0.002 0.001 0.002 0.003 0.004 0.003 0.003 0.006 0.003 0.003 0.002 0.003 0.0034 0.0026 0.0026 0.0024
2.35 2.21 1.68 2.63 2.43 1.93 2.43 2.22 2.65 1.2 1.34 2.52 2.37 2.64 2.44 3.04 1.95 2.07 2.63 2.43 1.34 1.36 1.82 2.67 1.78 1.99 2.095 2.032 2.63 2.056
1.06 1.1 1.69 0.83 1.52 0.98 1.15 1.1 0.86 1.04 1.46 0.65 1.88 0.83 1.36 1.11 1.24 1.04 0.82 1.46 1.43 0.93 1.43 0.85 1.26 1.208 1.014 1.428 0.838 1.328
0.005 0.004 0.004 0.003 0.006 0.003 0.007 0.008 0.002 0.007 0.005 0.004 0.006 0.003 0.003 0.006 0.006 0.004 0.002 0.005 0.006 0.005 0.002 0.003 0.005 0.005 0.0052 0.0048 0.0026 0.0052
0.001 0.002 0.001 0.001 0.004 0.002 0.003 0.001 0.001 0.003 0.001 0.001 0.001 0.002 Nil 0.004 0.001 0.003 0.001 0.002 0.002 0.002 0.002 0.001 0.001 0.002 0.0018 0.0016 0.0012 0.002
Table 4: Soil-plant Transfer factor (TF) of vegetables Veg. Brinjal Flower Bathua Chawli Spinach
TFCu
TFMn
TFFe
TFZn
TFNi
TFPb
0.0048 0.0048 0.0048 0.0052 0.0052
0.0043 0.0049 0.0038 0.0038 0.0035
0.179 0.189 0.183 0.237 0.185
0.358 0.356 0.501 0.294 0.466
0.045 0.047 0.043 0.024 0.047
0.0241 0.0217 0.0193 0.0145 0.0241
466
MAHAKALKAR et al., Curr. World Environ., Vol. 8(3), 463-468 (2013) Table 5: Permissible limits of heavy metals given by IS/WHO/FAO15
Heavy Metals
Cu
Mn
Fe
Zn
Ni
Pb
Water (ml/l) Soil (mg/g) Crops (mg/g)
0.05-1.5 0.270 0.001
0.01-0.5 0.003
0.03-1.0 0.003
5.0-10.0 0.600 0.001
0.2 0.075 0.001
0.1-0.1 0.006 0.001
Fig.1: Concentration of Heavy metals in soil samples
Fig. 2: Comparison of Heavy metal concentration of different vegetables with the permissible limit A portion of the dry vegetable powder material was digested in a mixture of HNO3 and perchloric acid (HClO4). The extracts were analyzed for various elements using AAS. RESULT AND DISCUSSION The concentrations of the heavy metals (ml/l and mg/g) in water, soil and vegetables are given in tables 1, 2, 3 respectively. Fig. 3: Transfer factor of Heavy metals from oil to vegetables
In water the concentration of Iron and zinc was highest whereas concentration of Nickel and lead was lowest.
MAHAKALKAR et al., Curr. World Environ., Vol. 8(3), 463-468 (2013) Table 2 shows that the city farm soil were moderately enriched in Cu, Mn and Ni, but strongly enriched with Fe and Zn may be due to anthropogenic contributions. The concentration of Cu, Mn, Fe, Zn, Ni, Pb in soil varied from 0.40-0.44; 0.67-0.71; 11.06-11.09; 2.82-2.88; 0.09-0.13; 0.0810.085 mg/g respectively at different sites. Similar results are also reported by Tomar et. al, 2000. The order of accumulation of Metals in both soil and vegetables samples was Fe > Zn > Mn > Cu > Ni > Pb. Transfer factors for heavy metals from soil to vegetables: Table 4 show the Transfer Factor (TF) of Cu, Mn, Fe, Zn, Ni and Pb from soil to plant, which is one of the key components of human exposure to metals through the food chain. Transfer factors were determined to quantify the relative difference in bioavailability of metals to plants or to identify efficiency of plant species to accumulate a given metal. These factors were based on the root uptake of metals and discount the foliar absorption of atmospheric metal deposits. The degree of accumulation shows that Zn is higher than Fe. The soil-plant transfer factor of different heavy metals shows the following order- TFZn> TFFe>TFCu>TFNi>TFMn>TFPb.
467
higher concentration than permissible limits given by IS/WHO/FAO15. The concentration of Pb and Ni was below detectable limits and concentration of Cu and Mn was slightly above the permissible limits. CONCLUSION The concentration of Fe and Zn in the soil samples were very high compared to the WHO/ FAO maximum permissive limits while the concentrations of Cu and Mn were slightly above the permissible limits. The concentration of Pb and Ni were below the detection limits in soil. On the other hand in all the vegetables, the concentration of heavy metals was higher than the WHO/FAO permissible limits. From the above study it was found that bioaccumulation of heavy metals in all the vegetables vary with the vegetable. The soil-plant transfer factor of different heavy metals shows the following order - TFZn> TFFe>TFCu>TFNi>TFMn >TFPb. The soil-plant transfer factor for Cu was highest in Chawli and spinach, TF of Mn was highest in Flower, TF of Fe was highest in Chawli, TF of Zn was highest in Bathua, TF of Ni was highest in Flower and spinach, TF of Pb was highest in Brinjal and Spinach. ACKNOWLEDGEMENT
When table 1, 2, 3 were compared with the table 5 to access the concentration of heavy metals with reference to their permissible limits in water, soil, vegetables it was found that Fe and Zn were in very high conc. Presence of these metals in
This study was sponsored through University grant commission (UGC), Delhi, India and Dr. Pravin Charde, Principal, Sevadal Mahila Mahavidyalaya, Nagpur for which the authors are extremely grateful.
REFERENCES 1. 2, 3.
4.
^ "Nag River Basin". ^ "Heritage status for Nag river". Yusuf, A. A., Arowolo, T. O. and Bamgbose, O., "Cadmium, Copper and Nickel levels in vegetables from industrial and residential areas of Lagos city, Nigeria", Global Journal of Environ Science, 1(1), 1 - 6 (2002). H.K. Pandey*, Seema Gakhar and Gourav Chawla, Heavy metal toxicity in ground water of khajuwala area Located in bikaner division of western rajasthan, Curr World Environ , 1(1), 41-44 (2006).
5.
6.
John O. Jacob, Samuel E. Kakulu, Assessment of Heavy Metal Bioaccumulation in Spinach, Jute Mallow and Tomato in Farms within Kaduna Metropolis, Nigeria. American Journal of Chemistry , 2(1): 13-16 (2012). Vandana Parth, N.N. Murthy and Praveen Raj Saxena, Assessment of heavy metal contamination in soil around hazardous waste disposal sites in Hyderabad city (India): natural and anthropogenic implications, E3 Journal of Environmental
468
7.
8.
9.
10.
11.
MAHAKALKAR et al., Curr. World Environ., Vol. 8(3), 463-468 (2013) Research and Management , 2(2). pp. 027034, (2011). Amiya Tirkey, P. Shrivastava and A. Saxena, Bioaccumulation of Heavy Metals in Different Components of two Lakes Ecosystem, Curr World Environ , 7(2), 293-297 (2012) S.A. Iqbal and H.C. Kataria, Study of heavy metal contamination in Halali Dam water of Vidisha District near Bhopal (M.P.) India with reference to human health, Curr World Environ , 1(1), 61-64 (2006). O.D. Opaluwa, M. O. Aremu, L. O. Ogbo, J. I. Magaji, I.E. Odiba and E.R. Ekpo, Assessment of Heavy Metals in Water, Fish and Sediments from UKE Stream, Nasarawa State, Nigeria, Curr World Environ , 7(2), 213220 (2012). Sumantrao B. Bikkad and Sunil R. Mirgane, Assessment of heavy metals in ground water of Aurangabad Industrial areas, Curr World Environ , 3(1), 131-134 (2008). Kachenko, A. G. and Singh, B., "Heavy metals
12.
13.
14.
15.
contamination in vegetables grown in urban and metal smelter contaminated sites in Australia", Water, Air and Soil Pollution, 169, 101 - 123 (2006). U.A. Awode, A. Uzairu, M.L. Balarabe, G.F.S. Harrisson and O.J. Okunola, Assessment of Peppers and Soils for Some Heavy Metals from Irrigated Farmlands on the Bank of River Challawa, Northern Nigeria. Sharma, R. J., Agrawal, M. and Marshall, F. M., "Heavy metals in vegetables collected from production and market sites of a tropical urban area of Indian", Food and Chemical Technology, 47, 583 - 591 (2009). APHA, Standard Methods for the Examination of Water and Wastewater. 16th Edition. American Public Health Association. New York (1992). FAO/WHO, Codex Alimentarius Commission. Food additives and contaminants. Joint FAO/ WHO Food Standards Programme, ALINORM 01/12A, pp:1-289 (2001).
Current World Environment
Vol. 8(3), 469-472 (2013)
Thin-Layer Chromatography: Comparative Estimation of Soil's Atrazine VIJAY KUMAR2, NIRAJ UPADHYAY2, SIMRANJEET SINGH1, JOGINDER SINGH1 and PARVINDER KAUR1 1
Department of Biochemistry, Lovely Professional University, Punjab, India. 2 Department of Chemistry, Lovely Professional University, Punjab, India. http://dx.doi.org/10.12944/CWE.8.3.17 (Received: September 17, 2013; Accepted: October 23, 2013) ABSTRACT
Herbicide atrazine is a broad spectrum herbicide, used worldwide to protect the crops from weeds, but overuse of atrazine have caused the huge environmental problems from few decades. So it is very essential to study and develop the lab based analytical methods, which are important for the detection of atrazine in environment as well as in biological media. In this study we have collected the soils samples from farm fields and extracted the atrazine by Soxhlet method. Also we have extracted the atrazine from formulated grade considered as standard/pure sample in our study. Both extracted/standard and atrazine samples were characterized by UV and FTIR analysis. Further thin layer chromatography was run to check the purity of soil extracted sample.
Key words: Atrazine, Analytical Methods, TLC, UV, FTIR. INTRODUCTION Atrazine (2-chloro-4-ethylamino-6isopropylamino-striazine), is probably the most commonly used chlorinated herbicide in the world1 .Atrazine is a selective systemic and most popular herbicide introduced in 1958 by J.R. Geigy. It has a range of trade names including Marksman, Coyote, Atrazina, Atrazol and Vectal. Atrazine is used for the pre and post-emergence control of annual and broad leaved weeds and perennial grasses; it inhibits photosynthesis and interferes with other enzymic processes.1,2 It is mainly absorbed through the plant roots, but can enter through the foliage, and accumulates in the apical meristems and leaves. Globally, atrazine is used in the production of maize, sorghum, sugar cane, pineapples, chemical fallows, grassland, macadamia nuts, conifers, and for industrial weed control, with its biggest market in maize production2 . The structure and physicochemical properties of atrazine are mentioned in Table 11,2 . As per literature atrazine having quite persistent in environment and is toxic to various
living organisms2 Number of methods have been described for the determination of atrazine in environment and biological media including, water and soils3-7 Here we have reported the TLC based study, in this study, we have collected the atrazine contained soils samples from farm fields and extracted the atrazine from these soils samples by Soxhlet method. Also we have extracted the atrazine from formulated grade considered as standard/pure sample in our study. Both extracted/ standard sample and atrazine samples were characterized by UV and FTIR spectroscopy. Further thin layer chromatography was run to check the purity of soil extracted sample. EXPERIMENTAL TLC plates were prepared by pasting silica slurry on glass plates and dried at 150°C for 3 hours. TLC study was done in solvent system methanolwater (80:20). The soil samples were collected in zip bags from Phagwara City located in the North region of the India and Formulated atrazine, Tagtaf - 50 (Atrazine 50% WP) packets was purchase from local market. This sample area is representative of
470
KUMAR et al., Curr. World Environ., Vol. 8(3), 469-472 (2013)
the agricultural region, mainly wheat, maize and paddy crop. The samples were collected at depths of 0-10, 10-30 and 30-50 cm from ten different points in an area of one hectare, and mixed to compose a single sample, for each depth. The sample was airdried for three days, gently ground to pass through a 2 mm sieve and stored in a desiccator to be employed in the experiments. Soxhlet apparatus was set for the extraction of atrazine. Extraction time was 6 hrs at a rate of 4 cycles per hour for 5.0 g of the soil sample mixed with 2 g of Na2SO4, 200 ml of acetone was used for the extraction. The extract was evaporated to 10-15 ml by using a rotary evaporator {fig 1(b)}. Pure atrazine was extracted from formulated grade of atrazine by the liquid/solid phase extraction, using acetone. Further extracted atrazine passed through column to get the pure form, finally this obtained atrazine has been recrystalized using acetone/water in combination. This purified form characterized by UV and FTIR study and used as standard sample.
RESULTS AND DISCUSSIONS Randomly 10 soils samples were taken under study from the soil samples were obtained from twenty different collection points at depths ranging from 0 to 20 cm, and mixed thoroughly. Before use, the soils were air-dried and sieved through a 2.0 mm screen. The physical characteristics of the soils are presented in Table 2. In the FTIR data (extracted from formulated grade currently used as pure sample after purification) the main peaks were observed in the region of 32003400cm-1 due to of secondary N-H stretching frequency and C=N and heterocyclic ring near 1450-1650cm-1 due to stretching frequency8-10 .In UV analysis λmax were observed at 225nm and 260nm π-π* and n-π* bands as in Fig 1, because of ring transitions9-11 After running 10 TLC of extracted atrazine samples from soil {Fig1(a)}, Rf values have been calculated and 2 ways ANNOVA was applied (using
Table 1: Structure and physicochemical properties of Atrazine. Chemical structure
Molecular weight(g/mol)
Solubility (mol/L)
Log KOW
Henry's law constant (atm m3/mol)
215.68
7 mg/100 mL in water at 25°C
2.2041 at 25°C
1.093291 e-007 at 25°C
Table 2. Chemical and Physical Characteristics of the Soils. Soils 1 2 3 4 5 6 7 8 9 10
Silt % 9.1 8.8 8.2 8.7 7.8 8.3 8.5 7.4 8.9 8.6
Clay % OM % 7.8 8.4 7.1 7.5 8.5 7.4 7.8 7.2 8.1 7.4
1.2 2.2 2.4 1.7 1.9 1.4 2.9 1.6 2.9 2.6
pH
CEC
4.9 5.1 4.2 4.5 4.7 4.4 4.9 4.3 3.9 4.8
4.3 3.9 4.1 4.5 2.9 4.6 5.1 4.1 3.4 4.4
OM = Organic Matter and CEC = Cation-Exchange Capacity (mequiv./100 g)
Origin 7.1 software). The following statistical data have been observed, as tabulated below. A linear results regression analysis of the values (samples) indicated an almost non linear fit of the data (r = 0.50). Therefore, t = 4.95134, p = 1.03165E-4 and at the 0.05 level, the two means are significantly different and results are significant12-15 For the comparative observed values of samples and standard were complies approximate 75 i.e. F Statistic = 74.75 with slope, but -3.123 through origin. After setting a linear fit setting on samples of atrazine the observed equation was, Y = 0.480X + 0.472 and R2 = 0.5043. It has been observed that there was high level of variations among the samples as compared to standards13-17
471
KUMAR et al., Curr. World Environ., Vol. 8(3), 469-472 (2013) CONCLUSION On the basis of these results, it is difficult to equate pesticide applications on soil thin-layer chromatography with field rates. It can be seen that the methodology applied to classify the mobility of the herbicide atrazine was efficient and showed
advantages in simple lab based methods to predict quantitatively the leaching and amount of decomposition of herbicides. A linear results regression analysis of the values (samples) indicated an almost linear fit of the data (r = 0.50) with low precision.
Table 3. Statistical analysis of observed TLC plates Rf values. Data A B
Mean
Variance
N
R
SD
P
0.765 0.00183 0.844.66667E-4
10
0.95043
0.00712
<0.0001
Fig. 1. Comparative TLC spots of sample and standard of atrazine (a), Soxhlet setup for the etraction of atrazine from soils (b) and UV-visible spectra (in methanol) of extracted atrazine from formulated form of atrazine (c).
472
KUMAR et al., Curr. World Environ., Vol. 8(3), 469-472 (2013)
Fig. 2. Comparative TLC spots of sample and standard of atrazine (a), and linear fit plot for samples of atrazine (b).
REFERENCES 1. 2.
3. 4. 5. 6. 7. 8. 9.
TB Hayes, A Collins, M Lee, M Mendoza and A Vonk, PANS, 99, 5476 (2002). Environmental Protection Agency (EPA), Interim Reregistration Eligibility Decision for Atrazine, U.S. Environmental Protection Agency, Washington, DC, (2003). S Navarro, N Vela, C Garc?a and G Navarro, J. Agric. Food Chem, 51, 7359 (2004). Z. Vryzas and E. Papadopoulou-Mourkidou, J. Agric. Food Chem, 50, 5026, (2002). E. Turiel, A Martin-Esteban and P Fernandez, Anal. Chem, 73, 5133 (2001). S. Stipicevic, S. Fingler, L Zupancic-Kralj and V Drevenkar, J. Sep. Sci, 26, 1237 (2003). MEC Queiroza and FM Lançasb, J. Env. Sci Health, Part B, 35, 467 (2000). http://webbook.nist.gov/cgi/ cbook.cgi?ID=C1912249&Mask=80. Donald L. Pavia, Gary M. Lampman, George S. Kriz, and James R. Vyvyan, Introduction to Spectroscopy, 4th Ed. 2009 Brooks/Cole, Cengage Learning, Nelson Education Ltd
10.
11. 12.
13. 14. 15. 16. 17.
Canada. Silberstein RM, Webster FX and Kiemle DJ, 2005 Spectroscopic Identification of Organic Compounds, 7th Ed. 2005, Johan Willy & Sons Inc. M. Cea, P. Cartes, G. Palma, M.L. Mora, R.C. Suelo Nutr. Veg, 10, 62 (2010). E. Gonza´lez-Pradas, M. VillafrancaSanchez, F. Del Rey-Bueno, M.D. Uren˜aAmate, M. Ferna´ndez-Pe´rez, Pest Manag Sci, 56, 565 (2000). M. H. Guermouche, D. Habel, S. Guermouche, J.AOAC Int. 82, 244 (1999). R. J. Vanhaelen-Fastré, M. L. Faez, M. H Vanhaelen, J. Chromatogr, 868, 269 (2000). B. Simonovska, S. Andrensek, I. Vovk, M. Prosek, J. Chromatogr, 862, 209 (1999). R. K. Sarin, G. P. Sharma, K. M. Varshney, S. N. Rasool, J. Chromatogr, 822, 332 (1998). J. Stuart Hunter, J. Assoc. Off. Anal. Chem, 64, 574 (1981).
Current World Environment
Vol. 8(3), 473-478 (2013)
Comparative Studies of Physico-Chemical Parameters of Two Reservoirs of Narmada River, MP, India MINU KUMARI1, L.K MUDGAL1 and A.K.SINGH2 1
Department of Zoology, Govt. P.G. Girls College Motitabela, Indore - 452001, M. P., India. Department of Animal Reproduction and Gynaecology, Veterinary College Mhow, Indore, M. P., India.
2
http://dx.doi.org/10.12944/CWE.8.3.18 (Received: November 10, 2013; Accepted: November 28, 2013) ABSTRACT The present study was carried out for a period of one year from January 2012 to December 2012 to enumerate the various Physico-chemical parameters of Narmada River at Indra Sagar Dam and Omkareshwar Dam. Water samples were taken from sampling stations every month and were analyzed as per standard methods. At Punasa Dam Maxima of Chloride and Sulphate were observed during June, BOD and T.D.S in August, Total hardness in November, Temperature in May and PH was highest in March and April. At Omkareshwar Dam Maxima of BOD and Total hardness were recorded in October, Chloride in November, Sulphate in August, T.D.S and Temperature in July, Maxima of PH was recorded in February.
Key words: Narmada River, BOD, T.D.S, Omkareshwar Dam, Punasa Dam, Total hardness.
INTRODUCTION Narmada is originated from eastern Madhya Pradesh at Amarkantak (Situated at 20째40', 80째45' E), flows towards west and finally joins Arabian sea at Broach (Situated at 21째43', 72째57' E).Dams, built to change natural flow regimes, are one of the most significant human interventions in the hydrological cycle. The construction of dam results in physical, chemical and biological changes to natural ecosystems. The construction of a series of dams in Narmada basin is continuously bringing about changes in microclimate of the region. A free flowing river, when arrested behind dams, is subjected to different ecological dynamics and biogeo chemical cycles. The reservoirs created behind the dams are different aquatic ecosystems compared to a free flowing river. Reservoirs act as thermal regulators so that seasonal and short-term fluctuations in temperature, that are characteristic of many natural rivers, are regulated. The chemical composition of water released from reservoirs can be significantly different to that of inflows. Changes occur in pH and salinity as well as in the concentration of nutrients The changes caused by
dams directly and indirectly influence a myriad of dynamic factors that affect habitat heterogeneity and successional trajectories and, ultimately the ecological integrity of river ecosystems (Ward and Stanford, 1995). MATERIAL AND METHOD The present study was conducted at two selected sampling stations viz., Indra Sagar Dam (Punasa) = S1,Omkareshwar Dam (Omkareshwar) = S2 in the Narmada River for the period of one year from January 2012 to December 2012 by taking the samples monthly with a view to assess the nature and degree of pollution. The sampling was done usually in morning hours between 8 a.m. to 11 a.m. and samples were collected from just below the water surface. At each of the station, three types of water samples-first from 200 m upstream, second from the confluence and third from 200 m downstream- were collected, for all physicochemical analysis. In the analysis of the physico- chemical properties of water, standard method prescribed in
BOD Chloride Temperature Ph Sulphates T.D.S Total hardness
1 2 3 4 5 6 7
0.74 18.3 20.2 8.1 4.4 186.3 124
Jan 0.9 22.1 27.9 8.3 2.2 201.6 130
Feb 1 19.3 27.5 8.4 4.9 206.6 149.3
Mar 0.97 28.5 29 8.4 4.5 188.3 151.3
Apr 1.4 23.3 30 8.1 5.4 206 148.6
May 1.33 43.3 26 8.2 5.5 242.3 145.3
Months Jun 0.6 20 26.1 8.2 5.2 269 97.3
Jul 1.5 23 26.1 7.9 1.6 287.6 136.6
Aug 0.8 20 25.8 7.8 3.9 239.6 163.3
Sep 0.9 21.6 28.8 7.9 2.4 160.6 156.6
Oct
0.7 21.5 25 8.3 4.8 209.3 187.3
Nov
1 21.8 24 8.1 2.5 196 180
Dec
Name of Variant at(S2)
BOD Chloride temperature Ph Sulphates T.D.S Total hardness
S. No
1 2 3 4 5 6 7
1.1 22.3 23.0 8.2 1.6 177.6 157.3
Jan 0.8 24 22.4 8.4 1.6 183.0 108.6
Feb 0.8 25.4 27.4 8.4 2.7 164.6 161.6
Mar 0.7 23.1 30.0 8.1 3 175.3 117.3
Apr 0.8 21.8 30.0 8.2 2.4 182.0 190.6
May 1.0 25.6 29.0 8.2 2.7 184.6 106.6
Months Jun
0.9 22.3 30.1 8.2 2.9 204.3 101.3
Jul
1.1 20.8 27.1 8.0 2.9 220.6 114.1
Aug
1.2 18.8 25.0 7.9 1.9 201.6 143.6
Sep
1.4 24.2 24.9 8.1 1.3 160.3 203.3
Oct
1.0 26.1 25.0 7.9 2.4 190.6 183.3
Nov
0.9 23.6 24.3 8.1 1.4 186.6 195.3
Dec
Table 2: Monthly variations of values of physico chemical parameters At Omkareshwar Dam (S2) from January 2012 to December 2012.
Name of Variant at (S1)
S. No.
Table 1: Monthly variations of values of physico chemical parameters at Punasa Dam (SI) from January 2012 to December 2012.
474 KUMARI et al., Curr. World Environ., Vol. 8(3), 473-478 (2013)
KUMARI et al., Curr. World Environ., Vol. 8(3), 473-478 (2013) limnological literature were used. Temperature and pH were determined at the site while total hardness, chlorides, sulphates, BOD and T.D.S. were determined in the laboratory. The physico-chemical parameters were determined adopting methods given by APHA (2002) and Golterman (1991). Temperature Temperature is one of the most important
475
parameters that influence almost all the physical, chemical and biological properties of water and thus the water chemistry. It never remains constant in rivers due to changing environmental conditions. In present study the temperature of river water ranged between 20.0 & 30.3 degree (Fig-1). The minimum temperature was recorded in the month of January at S1 and maximum was recorded in the month of July at S2. Maximum values of water
Fig 1: Monthly variations of values of temperature (degree celcius) of water during January 2012 to December 2012 at different stations.
Fig 2: Monthly variations of values pH of water during January 2012 to December 2012 at different station.
Fig 3: Monthly variations of values of TDS (mg/lit) of water during January 2012 to December 2012 at different station.
476
KUMARI et al., Curr. World Environ., Vol. 8(3), 473-478 (2013)
temperature were observed in summer season and minimum in winter season. These types of observations, in river Narmada, have also reported by Palharya and Malviya (1988). pH value pH is one of the most important factors in measuring water quality. It indicates the concentration of hydrogen ions. Natural waters
generally have been found to range from pH 5.5 to 8.6 because of the presence of bicarbonates and carbonates of alkaline earth metals. The water in river Narmada was always alkaline during the period of present study like most of the other Indian rivers as reported by Mitra (1982). The lowest pH i.e., 7.4 was observed at S2 in the month of April and highest, 8.8 at S2 in January , February and at S1 in November (Fig-2). The similar pH ranges were
Fig 4: Variations of values of Total hardness (mg/lit) of water during January 2012 to December 2012 at different stations.
Fig 5: Monthly variations values of Chloride (mg/lit) of water during January 2012 to December 2012 at different stations.
Fig 6: Monthly variations of values of Sulphates (mg/lit) of water during January 2012 to December 2012 at different stations
KUMARI et al., Curr. World Environ., Vol. 8(3), 473-478 (2013)
477
Fig 7: Monthly variations of values of BOD (mg/lit) of water during January 2012 to December 2012 at different stations. also recorded by Gautam et al., (2000) in river Ganga at Rishikesh , Sharma et al., (2004) in pond, Verma (2006) in river Narmada. Total dissolved solids (TDS) The TDS content of fresh water generally ranges from 10 to 500 mg/lit. The maximum permissible limit of TDS for drinking water is 500 mg/lit. In present study TDS, 136 mg/lit was the lowest value recorded at S2 in May and 360 highest value recorded at S1 in August (Fig-3). Verma (2006) noted that in Narmada water 990 mg/lit TDS was the highest value recorded in August and 123 mg/ lit was the lowest value noted in September. Total hardness In present investigation the lowest value of total hardness 92.0 mg/lit recorded at S1 and S2 both in July and February, March respectively and Highest, 208 mg/lit at S2 in October (Fig- 4). Highest value In post monsoon might be due to settlement of anions and cations. Similar result was also reported by Zahoor et al., (2012). Chloride Chloride is one of the major inorganic anion in water and waste water. It is stored in most fresh water algal cells. Contamination of water from domestic sewage can be monitored by chloride essays of the concerned water bodies. In present study the values of chloride varied between 15.30 mg/l to 50.0 mg/l with minimum in September at S2 and Maximum in June at S1 (Fig-5) . High values of chloride was seen in summer months. Present
summer increases in chloride are in conformity with the earlier observations of Harshey et al., (1982). Sulphate The sulphate ion, SO4- is usually second to carbonate as the principal anion in freshwaters, although chloride sometimes surpasses it. Atmospheric sources of sulphate have increased with man's industrial activities. Man now contributes about ten times more SO 2 than the annual contribution from volcanoes. In present study the values of sulphate varied between 0.43 mg/l to 7.1 mg/l with minimum in October at S2 and Maximum in April at S2 (Fig-6).This finding matched with observation of Verma (2006) in Narmada River. Biological oxygen demand (BOD) The biochemical oxygen demand, abbreviated as BOD, is a test for measuring the amount of biodegradable organic material present in a sample of water. The acceptable BOD level in the raw water meant for treatment is 3 mg/lit while more than 2 mg/lit BOD indicated the non suitability of river water for domestic use as per Indian standards. In the present investigation the BOD was very low, 0.40 mg/lit, at S1 in November and was high, 2.14 mg/lit at S2 in May (Fig-7). In the present study usually the BOD values were obtained maximum in summer months at all sampling stations, which might be due to high temperature, this intern promotes microbial activities and minimum BOD values obtained in winter might be due to low temperature and sufficient amount of water in the river. Similar observations were confirmed by many other workers such as Pathak and Mudgal (2005).
478
KUMARI et al., Curr. World Environ., Vol. 8(3), 473-478 (2013) REFERENCES
1.
2.
3.
4.
5.
6.
APHA., Standard method for examination of water and waste water, American Public Health Association Inc., ; New York 22nd Ed (2002). Gautam A., Khanna, D. R. and Sarkar, P., Diurnal variation in the physico-chemical characteristics of the Ganga water at Rishikesh during winter season. Indian J. Environ & Ecoplan., 3(2) : 369-371 (2000). Golterman, H. L., Physiological limnology: an approach to the physiology of lake ecosystem. Elsvier Scientific Publication Comp. Amsterdam. Oxford, New York, 249277 (1991). Harshey, D.K., Patil, S.G. and Singh, D.F., Limnological studies on a tropical fresh water fish tank of Jabalpur. Indian I. The abiotic factors. Geobios new Reports, 1(2): 98-102 (1982). Mitra, A.K., Chemical characteristics of surface water at selected gauging stations in the river Godavari, Krishna and Tungabhadra, Ind. J. Environ. Hlth., 24(3): 165-179 (1982). Palharya J.P. and Malviya, S., Pollution of the river Narmada at Hoshangabad in
7.
8.
9.
10.
11.
Madhya Pradesh and suggested measures for control. In Ecology and Pollution of Indian rivers. (Ed. R.K. Trivedy), Asian Publishing House, New Delhi, pp. 54-85 (1988). Pathak, S.K. and Mudgal, L.K., Biodiversity of zooplankton of Virla reservoir, Khargone (M.P.) India, P. 317-321. In : Arvind Kumar (ed.) Biodiversity and Environment. A.P.H. Publishing Corporation ,New Delhi (2004). Sharma, A., Mudgal, L. K. Sharma, A. and Sharma, S., Fish diversity of Yashwant sagar Reservoir Indore M. P. Him J. environ. zoology. 18(2) 117-119pp (2004). Verma, D.,. Studies of water pollution of the river Narmada in western zone. Ph. D. Thesis, Devi Ahilya Vishwavidyalaya, Indore (M.P.) India, pp. 1-137 (2006). Ward, J.V. and Stanford, J.A.,. Ecological connectivity in alluvial river ecosystems and its disruption by flow regulation. Regulated Rivers: Research and Management, 11, 105-119 (1995). Zahoor, P., Sharma, S. Tali, I. Siddique, A. and Mudgal. L. K., Evaluation of Physicochemical parameters of Narmada river, MP, India. Researcher; 4 (5) (2012).
Current World Environment
Vol. 8(3), 479-482 (2013)
Effect of Aflatoxin Contaminated Feed on Growth and Survival of Fish Labeo Rohita (Hamilton) DURRE SHAHWAR RUBY1, AHMAD MASOOD2 and AMJAD FATMI3 1
Department of Zoology, B.S College, Danapur, Patna, Bihar, India. 2 Department of Botany, H.D Jain College, Ara, Bihar, India. 3 Department of Zoology, Govt. P.G College, Dholpur, Rajasthan, India. http://dx.doi.org/10.12944/CWE.8.3.19 (Received: August 03, 2013; Accepted: September 17, 2013) ABSTRACT Effect of aflatoxin contaminated feed on growth, survival and behaviour of the fish Labeo rohita was evaluated. There was a significant decrease in the growth rate and survival percentage of the fish with the increase in the amount of aflatoxin contaminated feed in the food of the fish.
Key words : Aflatoxin, Labeo Rohita, Growth rate.
INTRODUCTION Aflatoxin is the metabolic by product of mols Aspergillus flavus and Aspergillus parasiticus.It is a toxic compound and the cause of high mortality in livestock, poultry and in some cases of human beings (Reed and Kasali.,1987, Montessano et al.1995). Toxicogenic A. Flavus . produces Aflatoxin B1 and B2 whereas A. Parasiticus produces Aflatoxin G1 and G2.Aflatoxin B1 is classified as group I carcinogen by international agency for research on cancer. Effect of aflatoxin on fishes and other animals have been reported by many workers. Nunez et al. (1991) reported hepatocellular adenoma and hepatocellular carcinoma in Rainbow trout when exposed to aflaroxin B1.Caguan et al. (2004) reported loss of appetite, low survival percent and decreased mean total biomass in tilapia when fed with aflatoxin contaminated feed. Faisal et al . (2008) reported spermatotoxic effect of aflatoxin in male wister rat. Labeo rohita a common Indian carp is widely distributed in Indian rivers and ponds. It is very important as a human food for its high quality flesh. In the present investigation effect of aflatoxin on growth rate , survival percentage and
behavioural changes of Labeo rohita has been evaluated in order to explore the effect of toxin in the fish. MATERIALS AND METHODS The fish Labeo rohita was collected from river sone near Ara. 72 fishes measuring about10 20 cm and weighing about 30 - 50 gm were selected and kept in twelve aquaria measuring 31 x 21 x 11 . Six fishes were kept in each aquarium. Three aquaria containing six fishes each were kept as control and nine aquaria containing six fishes each were kept as experimental set. Four feeds were employed as follows: 1.
2.
3.
Feed I or good feed contained 0% moldy feed or unmixed feed. Feed I were given to control. Feed II contained 10 % moldy feed and 90% good feed. Feed II were given to first set of experimental fishes comprising aquaria 2A, 2B and 2C. Feed III contained 50% good feed and 50% moldy feed. Feed III were given to second set of experimental fishes comprising three aquaria 3A, 3B and 3C.
480 4.
RUBY et al., Curr. World Environ., Vol. 8(3), 479-482 (2013) and at 6.00 pm at a feeding rate of 4% of the body weight .
Feed IV contained 100% moldy feed. Feed IV was given to fourth set of fishes comprising three aquaria 4A, 4B and 4C.
Data gathered were initial and final individual length and weight, average body length gain and average body weight gain, specific growth rate, survival percentage and behavioural changes.
Moldy feed were prepared in laboratory. The commercial fish feed was first sprinkled with small amount of tap water to make the feed moist and then infected with cultured Aspergillus flavus by mixing 10 ml of cultured Aspergillus flavus. The inoculation was made in a transfer chamber to avoid contamination. The mixed feed was then covered with a plastic sack. The infected feed was kept in a condition which is favourable for the growth of mold. Required amount of moldy feed and good feed were weighed carefully for each treatment and then mixed thoroughly. The fish were fed a day after and and daily there after two times a day at 8.00 am
RESULTS AND DISCUSSION Body Weight and Body Length Body weight gain in aflatoxin treated fishes showed significant decrease(p>0.05) as compared to control or fishes given feed I or mold free feed. The average body weight gain in the fishes treated with feed IV was 60.3 gm as compared to 79.5 gm in fishes fed with feed I. The growth rate,Specific
Table 1: Mean along with their standard errors (S.E.) and coefficient of variation of body length in different groups of fishes showing the effect of aflatoxin contaminated feed. Feed
I
Body Length (Initial)
11.1 ±.05 Body Length (final) 20.9 ±.15 Average Body length gain 9.8 % Body Length Gain 88.2%
II
III
IV
Total mean±S.E.
C.V. %
10.9 ±0.25 18.5 ±0.22 7.6 69.7%
11.0 ±0.29 16.8 ±0.16 5.8 52.7%
11.8 ±0.19 16.2 ±0.24 4.4 37.2%
11.2 ±0.17 13.3 ±0.91
3.1 13.6
Table 2: Mean along with their standard errors (S.E.) and coefficient of variation of Body weight in different groups of fishes showing the effect of aflatoxin contaminated feed. Feed Body weight (Initial) Body weight (Final) Average Body weight gain % Body weight Gain Growth rate Specific growth rate
I
II
III
IV
Total mean±S.E.
C.V. %
41.2 ±.66 120.7 ±.63 79.5 192.9 0.88 88%
40.4 ±1.53 113.2 ±0.60 72.8 180.1 0.80 80%
42.3 ±1.67 108.5 ±1.02 66.2 156.5 0.73 73%
41.6 ±1.58 101.9 ±0.93 60.3 144.9 0.67 67%
41.3 ±0.43 111.07 ±0.00
1.67 6.33
Table 3: Survival Percentage and coefficient of variation percentage of Survival in different groups of fishes showing effect of aflatoxin contaminated feed. Feed Survival %
I
II
III
IV
Total mean±S.E.
C.V.%
100
83
61
44
72±10.63
29.5
RUBY et al., Curr. World Environ., Vol. 8(3), 479-482 (2013) growth rate and percent body weight gain was also high in fishes fed with feed I and decreased gradually with increase in percentage of moldy feed in the food reaching its minimum in those fishes which were given feed IV or 100 percent moldy feed(Table II). The average body length gain and percent body length gain was also significantly lower(p>0.05) in fishes fed with feed II, II and III as compared to fishes given feed I or mold free feed(Table I). These results agree with the findings of Jantrarotai and lovel (1990) in Oreochromis aureaus, Roges et al. (2002) in Oreochromis nilotius, Nguyen et al. (2002) in Juvenile NileTilapia and Zaki et al. (2012) in Clarius lazera. Joner et al. (2000) reported that aflatoxin reacts negatively with different cell protein which leads to inhibition of carbohydrate and lipid metabolism and protein synthesis. So the decrease in growth rate in experimental fish may be due to disturbance in metabolic process of carbohydrates, lipids and proteins by aflatoxin . Cheeke and shull (1985) reported that aflatoxin causes loss of appetite. Thus the decrease in average weight gain and body length increase may also be due to loss of appetite. Also it might be due to utilization of glutathione enzymes for detoxification process under the condition of Stress Devegowda et al. (1998). Glutathione enzymes are partly consist of methionine and cystein and hence this process of
481
detoxification decreases availability of methionine resulting in poor growth in the fish. Swimming, Feeding and Opercular Movement The fishes fed with aflatoxin containing feed depicted less swimming, mostly off feed and greater opercular movement as compared to those fish group which were given aflatoxin free diet. Thus the present finding are in agreement with those of Boshy et al. (2008) and Caguan et al. (2004)in Nile tilapia. Aflatoxin causes loss of appetite thus creates weakness resulting in less agility and off food behavior in fishes as a result of aflatoxin. Aflatoxin induces stress and thereby increases oxygen demand resulting in greater opercular movement in fishes received aflatoxin containing food. Survival Percentage Survival percentage decreased with increase in aflatoxin containing feed. The fishes which were given aflatoxin free diet or feed I showed hundred percent survival whereas minimum survival ie forty four percent was found in those fishes which were fed with feed IV(Table III). Thus the present findigs are in agreement with those of Caguan et al. (2004).The decreased survival percentage was probably due to impaired liver function, loss of appetite and decreased immunity as a result of aflatoxin.
REFRENCES 1.
2.
3.
4.
5.
Jantrorotai. W; Lovell,R.T. Subchronic toxicity of diatary aflatoxin B1 to channel cat fish. Journal of Aquatic animal health 2: 248-254. In chickens. Mycopathologia, 104: 33-36 (1990). Joner A. Mycotoxine (http : // www. Ansci cornell . edu / courses / as625 / 1999 term / toner / aflatoxin. Html) (2000). Cheeke. P.K ; Shull. L.R. Natural Toxicant in feeds and poisonous plants. Abi. Publishing company. ING. West Port. Connecticut, (1985). Nguyen, A.T; Grizzle,J.M; Lovoll,R.T; Manning,B.B; Rottinghaus, G.E. Growth and hepatic lesions of Nile tilapia fed diet containing aflatoxin B1. Aquaculture, 217 : 311-319 (2002). Roges, J.B; yanong, R.P.E. Molds in fish and aflatoxin (http \ edie. 1 fas. Vtrl.edu. \ FA095)
6.
7.
8.
9.
(2002). Zaki, M. S. Effect of aflatoxin on endocrine status in cat fish (Clarius lazera).Life sci. j. 9(1): 419-422 (2012). Caguan, A .G; Tayaban,R.H ; J.R. Somga; Bartolome,R.M. Effect of Aflatoxin Contaminated feed in Nile tilapia (Oreochromis niloticus L.). In Proceeding of the 6th International symposium on tilapia in aquaculture (R.B. Remedios, G.C. Imir and K. Fitzsimons. eds.). :172-178 (2004). Boshy EL, M.E; Ashram, A.M.M.EL; Nadia A. Abdel-Ghany. Effect of diatary beta-A, 3, glucagon on immunomodulation on diseased oreochromis niloticus experimently infected with Aflatoxin B1. 8th International symporium on tilapia in aquaculture, (2008). Montesano,R; Hainut,P; Wild,C.P.
482
10.
11.
RUBY et al., Curr. World Environ., Vol. 8(3), 479-482 (2013) Hepatocellular carcinoma : From gene to public health review.J.Nat. Cancer Inst.89:1844-1851, (1997). Devegoda ,G; Raju,M.L.N.V; Afzali, N; Swamy, H.V.L.N. Mycotoxins picture world wide: Novel solution for their counteraction. In T.P. Lyons and K.A. Jacques(Eds) Biotechnology in the feed Industry,pp241255.Proc.ofAlltechâ&#x20AC;&#x2122;s 14, the Annual Symposium. Nottingham. U.K, (1998). Nunez. J. D.H; Duimishra, J. R. Ultra structure of hepato cellular neoplasms in aflatoxin B1 (AFB1) initiated rainbow trout (Oncorhychus mykiss). Toxicol Pathol. 19 (i) 11-21, (1991).
12.
13.
Reed,J.D;Casali,O.B. Hazards to livestock consuming aflatoxin contaminated meal in Africa. In: ICRISAT proceeding of international workshop on aflatoxin contamination in ground nut. 6-9 Oct.1987, (1987). Faisal. K ; perisamy , V. S. ; Sahabuddin ,S ; Radha , A ; Anandhi ,R; Akbarsha , M. A. Spermatotoxic effect of aflatoxin B1 in rat : extrusion of outer dense fibers and associated axonemal microtubule doublets of sperm flagellum . J. Soci. Repro. Fert. 135 : 303 - 310, (2008).
Current World Environment
Vol. 8(3), 483-487 (2013)
Assessment of Groundwater Quality in Saltaua Gopalpur Block of Basti District, (U.P.) India R.V. PRASAD, D.R. TRIPATHI1 and VINOD KUMAR2 1
Department of Chemistry, Kisan P.G. College Babhnan, Gonda (U.P.), India. 2 Department of Zoology, Kisan P.G. College B abhnan, Gonda (U.P.), India. http://dx.doi.org/10.12944/CWE.8.3.20 (Received: August 08, 2013; Accepted: September 30, 2013)
ABSTRACT The present study was carried out to assess the ground water quality of various location of Saltaua Gopalpur block of Basti district during June-July 2013. Total 10 water samples were collected from hand pumps at different locations in and around Saltaua Gopalpur block. The water samples were analyzed for their physico-chemical characteristics, viz .pH, turbidity, chloride, total hardness, fluoride, nitrate, Iron and free chlorine. On comparing the results against water quality standards and standard values recommended by World Health Organization (WHO), it is found that most of the water samples are very hard and unsuitable for drinking purposes.
Key words: Ground water quality, Drinking water standards, Saltaua Gopalpur, Total hardness.
INTRODUCTION Water is a one of the most important renewable natural resources. Approximately 71% of the earth's surface is covered with water. Fresh water is found as underground water in large reservoirs surrounded by rock called aquifers. This ground water has long been considered as one of the purest forms of water available in nature to meet the overall demand of rural and semi urban people1. In India most of the population is dependent on ground water as it is the only source of drinking water supply2. The quality of ground water is the resultant of all the processes and reaction that act on the water from the moment it condensed in the atmosphere to the time it is discharged by a well as spring and varies from place to place and with the depth of the water table3. The groundwater is believed to comparatively cleaner and free from pollution than surface water2. But during last decade, it is observed
that ground water gets polluted drastically because of increased human activities 4-7. Consequently number of cases of water born diseases has been seen which are the causes of health hazards8-11. Therefore monitoring the quality of water is one of the essential issues of drinking water management12. Considering the above aspects an attempt has been made under the present study to assess the physico-chemical properties of ground water in Saltaua Gopalpur block of Basti district. MATERIAL AND METHODS Study Site Saltaua Gopalpur block is situated in the north part of the district Basti. It is 15 km. away from the district head quarter. It has a geographical area of 216.90 km2, it is bounded by 26.81 oN latitude and 82.76 oE longitude. The normal annual rain fall varies from1050 mm to 1200 mm.
484
PRASAD et al., Curr. World Environ., Vol. 8(3), 483-487 (2013)
Sample Collection A total 10 samples from different places which were minimum 2-3 km between one and another location was maintained in order to carry out a broad study on the quality of water in this area. The sample collection area has been assigned as sample points.
Sampling places
Site
1 2 3 4 5 6 7 8 9 10
Aama Atara Baheriya Belhara Rehar Jungle Narayanpur Bhugania Saltaua Bazar Kanthui Saltaua Village
S1 S2 S3 S4 S5 S6 S7 S8 S9 S10
RESULT AND DISCSSION The various physico-chemical parameters examined showed considerable variations in different samples. The observations are depicted in table-2.The findings and their comparison with WHO13 and BIS14 health based drinking guidlines are presented in table-3. The data revealed a considerable variation in the water samples with respect to their chemical composition.
Table 1. Sampling places in the Saltaua Gopalpur Block. S.No.
The sample was collected in plastic bottles which were cleaned with acid water, followed by rinsing twice with distilled water. The analysis of water was done by using Himedia water testing kit.
pH is affected not only by the reaction of carbon dioxide but also by organic and inorganic solute present in water. Any alteration in water pH is accompanied by the change in other physicochemical parameters15.pH varies from 7.0 to 7.5. This shows that all samples are existed within the minimum and maximum tolerable limit of WHO and
Table 2 : Physico-Chemical quality of ground water of Saltaua Gopalpur Block. → Sampling Site→ Parameters ↓
S1
S2
S3
S4
S5
S6
S7
S8
S9
S10
pH Turbidity (NTU) Chloride (mg/lit). Total Hard (mg/lit.) Fluoride (mg/lit.) Nitrate (mg/lit.) Iron (mg/lit.) Free Chlorine
7.1 5 50 325 1.0 90 1.0 Nil
7.0 5 20 200 0.5 40 0.3 Nil
7.1 6 20 275 0.4 45 0.5 Nil
7.1 5 70 375 0.8 10 0.8 Nil
7.5 5 10 250 1.0 10 0.5 Nil
7.3 5 60 550 0.3 45 0.9 Nil
7.2 5 220 750 0.5 95 1.0 Nil
7.0 6 20 350 0.6 10 0.7 Nil
7.2 5 20 350 0.8 30 0.8 Nil
7.1 5 10 375 0.5 10 0.6 Nil
Table 3 : Comparison of water with drinking water quality standards. S. No
Parameters
1 2 3 4 5 6 7 8
pH Turbidity (NTU) Chloride (mg/lit.) Total Hardness (mg/lit.) Nitrate (mg/lit.) Fluoride (mg/lit.) Iron (mg/lit.) Free Chlorine
WHO
6.5-8.5 5 250 300 50 1.5 0.3 -
BIS
6.5-8.5 5 250 300 45 1.5 0.3 -
Range Min.
Max.
7.0 5 10 200 10 0.3 0.3 Nil
7.5 6 220 750 95 1.0 1.0 Nil
Mean
SD
7.16 5.2 50 3751 38.5 0.64 0.71 -
0.15 0.42 63.42 62.02 32.06 0.25 0.23 -
PRASAD et al., Curr. World Environ., Vol. 8(3), 483-487 (2013) BIS. The water samples were found to be slightly basic in nature16-18. The turbidity varies from 5-6 NTU. This shows that most of the samples are existed within permissible limit of WHO & BIS. Chloride varies from 10-220 mg/lit. All the water samples are under the permissible limits as of WHO19-20. Chloride is not harmful to human at low concentration but could alter the taste of water at concentration above 250mg/lit21. Hardness is very important in decreasing the toxic effect of poisonous element22. Hardness is measured in terms of total hardness and calcium hardness. Total hardness varies form 200-750 mg/ lit mostly exceeds the maximum permissible limits of WHO22-25. Hardness although has no health effects it can make water unsuitable for domestic and industrial use1. Nitrate varies from 10-95 mg/lit. Although only two samples S1 and S7 exceeds the permissible limit and shows high concentration20. Nitrate indicates the pollution in ground water due to agricultural activities, sewage percolation beneath the surface22,26,27. Presence of nitrate in water indicates the final stage of mineralization28. The major natural resource of fluoride is amphiboles, apatite, fluorite and mica. It's concentration in natural waters generally should not exceed 10mg/lit1. The factor responsible for ground water contamination with fluoride are geological factors such as weathering of minerals, rock dissolution and decomposition. Containing fluoride over a long period of time resulting in the leaching it into ground water4. An anthropogenic factor such as industrial process liberates higher concentration of fluoride into atmosphere. The concentration of fluoride in the studied water samples varies from 0.3 to 1.0mg/lit20. High fluoride concentration causes dental fluorosis and
485
more skeletal fluorosis 29 whereas the low concentration or absence of fluoride in drinking water results in dental caries in children particularly when the fluoride concentration is less than 0.5 mg/lit30. The values of iron in study area varies from 0.3 to 1.0 mg/lit. Which are higher than the tolerable value except sample S6. This may be due to soil origin and age old iron pipes used in the area16,31. The storage of iron causes a diseases called "anaemia" and prolonged consumption of drinking water with high concentration of iron may be lead to liver diseases called as haemosiderosis. The free chlorine was found to be absent in all the samples. CONCLUSION The analysis of the physico-chemical parameters of ground water from ten different locations in Saltaua Gopalpur block shows that the pH, turbidity, chloride and fluoride were within permissible limit. Highly exceeded value of total hardness, nitrate and iron were reported at some locations of study area. The observed standard deviation for the parameters shows that the deviation in the total hardness (162.02), chloride (63.42) and nitrate (32.06) are of moderately high range. From this it is concluded that various parameter concentration are varying highly in different location of Saltaua Gopalpur block. ACKNOWLEDGEMENTS The authors are thankful to Dr. Ram Prasad Ex-vice chancellor, Barkatullah University, Bhopal (M.P.), for providing academic inputs. Also thankful to Dr. T.A. Qureshi, (Ex.H.O.D) Deptt. Of Applied Aquaculture, Barkatullah, University, Bhopal, M.P. and to Prof. V.B. Upadhayay, D.D.U. Gorakhpur University, Gorakhpur (U.P. ), for their valuable suggestions.
486
PRASAD et al., Curr. World Environ., Vol. 8(3), 483-487 (2013) REFERENCES
1.
2.
3.
4.
5.
6.
7.
8.
9.
10.
11.
12.
Nirmala B., Suresh Kumar B.V., Suchetan P.A. and Shetprakash M., Seasonal variations of Physico -chemical characteristics of ground water sample of Mysore city, Karnataka, India. Int. J. Env.sci.,1(4),43-49, (2012). Agrawal R, Physico -chemical analysis of some ground water samples of Kotputil town Jaipur, Rajasthan. Int. J.che. Env. Pharm. Res., Rajasthan, 2,111-113, (2010). Shyamala R., Santhi M. and Lalitha P., Physico-chemical analysis of borewell water samples of elungupalayam area in Coimbatore District, Tamilnadu, India. E.J. Chemistry, 5(4), 924-927 (2008). Jamal A.A., Physico-chemical studies in Uyyakondan channel water of river Cavery., Poll. Res.,17(2),111 (1998). Murhekar G.H., Determination of physic chemical parameters of surface water sample in and around Akot city, Int. J. Res. chem. Env. 1(2),183-187 (2011). Singh V.,Physico-chemical examination of water, sewage and Industrial effluents, Res.J.Chem.and Env.10(3), 62-66 (2006). Mishra A. and Bhatt V., Physico-chemical and Microbiological analysis of under ground water in V.V. Nagar and Nearby Places of Anand District, Gujarat, India. E-J chem., 5(3), 487-492 (2008). Desi P.V., water auality of Dudhsagar river at Dudhasagar, Goa,India. Poll.Res., 4,377-382 (1995). Elizabeth K.M.and Naik P.L.,Effect of polluted water on human health, Poll.Res., 24(2), 337 (2005). Muller E.E, Ethlers M.M. and Grabow, The occurrence of E. coli. 0157:H7 in South Africa water sources intended for direct and indirect human consumption, water Res., 35, 30853088 (2001). Aremu M.O., Gav,B.L., Opaluwa O.D., Atolaiya B.O., Madu P.C. and Sangari D.U., Assessment of physico-chemical contaminants in waters and Fishes from selected rivers in Nasarawa State, Nigeria. Res. J.Chem. Sci., 4, 6-17 (2011). Shama S., Iffat N., Mohammad I.A.and Safia A., Monitoring of physic -chemical and
13. 14. 15. 16.
17.
18.
19.
20.
21.
22.
23.
microbiological analysis of under ground water sample of district Kallar Syedan, Rawalpindi-Pakistan. Res. J.Chemi.Sci.,1 (8), 24-30 (2011). WHO, International Standard for drinking water, 3rd ed, Geneva, (2008). BIS, Specification for drinking water. Bureau of Indian Standards, New Delhi, 171-178 Wetzel R.G., Limnology, W.B. Saunders Co.,Philadelphia. USA, 743 (1975). Behra B., Das M. and Rana G.S., Studies on ground water pollution due to iron content and water quality in and around Jagdalpur, Bustar District, Chattisgarh, India. J. chem. Pharma Res.,4(8),3803-3807 (2012). Dharmaraja J., Vadivel S. and Ganesh Karthick E., Physico -chemical analysis of ground water samples of selected district of Tamilnadu and Kerala. Int.J. Scint. Tech. Res, 1(5). 92-95 (2012). Parihar S.S., Kumar A., Kumar A., Gupta R.N., Pathak M., Shrivastav A. and Pandey A.C., Physico-chemical and microbiological analysis of under ground water in and around Gwalior city., M.P., India. Res.J.Recent sci.,1(6),62-65 (2012). Bundela P.S.,Sharma. A,Pandey A.K., Pandey P. and Awasthi A.K., Physicochemical analysis of ground water near municipal solid waste dumping sites in Jabalpur, M.P.India. Int,J. Plant, animal Env. Sci. 2(1), 217-222 (2012). Arya S., Kumar V., Minakshi and Dhaka A., Assessment of underground water quality : A case study.of Jhansi city,U.P.India. Int. Multidis.. Res.J.,1(7),11-14 (2011). Hauser B.A., Drinking water chemistry : A Laboratory manual. Lewis Publishers, A CRC Press company : Boca Raton, FL.,71(2001). Rajankar P.N, Wate S.R., Tambekar D.H. and Gulhane. S.R., Assessment of ground Water Quality using water auality Index (WQI) in wardha district. J. Env. Sci. sustaina., 1(2), 49-54 (2013). Meenakshi, Garg V.K, Kavita, Renuka and Malik A., Ground water quality in some villages of Haryana, India : focus on fluoride
PRASAD et al., Curr. World Environ., Vol. 8(3), 483-487 (2013)
24.
25.
26.
27.
and fluorosis. J. Hazar. Mater,106B, 85-97 (2004). Veeraputhiran V. and Alagumuthu G., A report on fluoride distribution in drinking water, Int.J. Env.Sci., 1(4), 558-566 (2010). Poonam, Kumar R. and Yadav A., Ground water quality in Mohenderagarh Town, Haryana, India. Int.J. Pharm. Chem.Sci, 2(1), 226-228 (2013). Jawad A, Shereideh A.L., Abu S.A., Rukah. Y.and Al Qadat K., Aquifer ground water quality. Science of the total Environment, 128, 69-81 (1998). Taiwo A.M., Adeogn A.O., Olatunde K.A. and Adegbite K.I., Analysis of ground water quality of hand dug wells in peri-urban area of Obantoko, Abeokuta for selected physic chemical parameters. Pecific J. Sci Tech., 12 (1) 527-534 (2011).
28.
29.
30.
31.
487
Nema P., Rajgopalan S. and Mehta C.G., Quality and treatment of Sabarmati river water Ahmedabad, J.I. W.W.A., 16(1), 99-107 (1984). Ravindra K. and Garg V.K., Appraisal of ground water quality for drinking purpose in Hisar city (India) with special reference to fluoride. Int. J. Env. Hlt. Res, in press (2005). Patil N., Ahmed A., Sureshbabu H., Kottureshwar N.M., Jayashree M. and Nijalingappa J., Study on the physico chemical characteristics of ground water of Gulbarga city, Karnataka, India. Int.J. Appli. Biopharm. Tech., 1(2), 518-523 (2010). Rajgopal, Ground water quality assessment for public policy in India. 1st annual report, Deptt. of Geography, IOWA University, IOWA, 10-11 (1984).
Current World Environment
Vol. 8(3), 489-492 (2013)
Adsorption of Pb(II) from Aqueous Solution on Ailanthus Excelsa Tree Bark V.H.WAGHMARE and U.E.CHAUDHARI Department of Chemistry, Mahatma Fule Arts, Commerce and Sitaramji Chaudhari Science Mahavidyalya Warud, District - Amravati, India. http://dx.doi.org/10.12944/CWE.8.3.21 (Received: November 04, 2013; Accepted: December 10, 2013) ABSTRACT The potential to remove Pb (II) from aqueous solutions through adsorption using Ailanthus Excelsa tree bark was investigated. The effects of pH, contact time, initial concentration and adsorbent dosage on the adsorption of Pb (II) were studied. The different experimental conditions were investigated in this study. It was observed that the amount of Pb(II) adsorbed increases rapidly initially, then system approaches equilibrium within 360 minutes. The extent of Pb (II) removal increased with increase in time and adsorbent dosage. The reaction kinetics was studied using different models. Langmuir and Freundlich adsorption model is used for the mathematical description of the adsorption equilibrium and isotherm constants are evaluated. Equilibrium data fitted very well to the Langmuir and Freundlich model.
Key words : Adsorption, Ailanthus Excelsa, Pb (II) removal, Langmuir and Freundlich Isotherms INTRODUCTION At present lead pollution is considered a worldwide problem because this metal is commonly detected in several industrial wastewaters 1 . Undoubtedly, industrial waste based adsorbents offer a great promise for commercial purposes. Solid wastes are a vexing societal problem mandating attention to recycling. Recycled product quality is not always high or recycle may not be feasible. However, conversion of solid wastes into effective low-cost adsorbents for wastewater treatments could decrease costs for removing lead. Water used in industry creates a wastewater that has a potential hazard for our environment because of introducing various contaminants such as heavy metals into soil and water resources. Heavy metal ions are nowadays among the most important pollutants in surface and ground water2. The safe and effective disposal of industrial wastewater is thus a challenging task for industrialists and nvironmentalists. The important toxic metals are Cd, Zn, Pb and Ni. Nowadays, with the exponential increase in population, measures for controlling heavy metal emissions into the environment are
essential. Lead causes many serious disorders like, anemia, kidney disease, nervous disorders, and even death3 There are numerous methods currently employed to removal of metals from aqueous environment. Some of these methods are chemical precipitation and sludge separation, chemical oxidation or reduction, ion exchange, reverse osmosis, membrane separation, electro chemical treatment, evaporation and adsorption.Among all these, adsorption is the most promising technique and economically feasible alternative for metal removal. Adsorption method offers the advantages of low operating cost and minimizing secondary pollution. Plant material is easily available and relatively; inexpensive an investigation of its use as a adsorbent seems most appropriate Earlier researchers used different plant materials such as Sawdust of Dalbergiasissoo, babhul Bark , Mangifera indica (mango), coconut fibers and Madicago sativa (alfalfa) for metal removal from wastewater In the present work, the Pb (II) ions
490
WAGHMARE & CHAUDHARI , Curr. World Environ., Vol. 8(3), 489-492 (2013)
adsorption capacity of Ailanthus Excelsa tree bark (AETB) was studied by a batch technique. The effect of pH, concentration of Pb(II) ions, contact time and adsorbent dose on percentage of adsorption has also been investigated. MATERIALS AND METHODS Preparation of Adsorbent Ailanthus Excelsa (AETB) tree bark was collected from a local farm. It was cut in to small segment and dried in sunlight until almost all the moisture evaporated. Then it was ground to get desired particle size of 100 to 200 micron. It was then soaked 2 hours in 0.1M NaOH solution to remove the lignin content. Excess alkalinity was then removed by neutralizing with 0.1 N HCl. The AETB was then washed several times with distilled water till the washings are free from color and turbidity. The washed AETB was oven dried at 200 C for 24 hrs and stored for the study. Preparation of solutions All the reagents used were of AR grade. Pb (II) solution Stock Pb (II) ions solution (1000 mg/L) was prepared by dissolving 0.331 gm of A.R. grade Pb(NO3)2 in 1000 ml distilled water. The solutions of lower concentrations were prepared by dilution of appropriate volume of stock solution. 0.1M Sodium Thiosulphate solution was preapared by dissolving 1.5810gm of A.R. grade Sodium Thiosulphate in 1000 ml distilled water. Dithizone 50ml 3% dithizone solution in choloroform RESULTS AND DISCUSSION Effect of pH The pH of feed solution was examined from solutions at different pH, covering a range of 2.0-6.0. There was continuous increase in percentage removal with increase in pH and reached 53.5 % at pH 6. The increase in percentage removal may be attributed to higher degree of ionization of metal ion at higher pH and the reduced competition of H+ ions with the metal ions for adsorption sites. The removal of Pb (II) ions
decreases rapidly bellow pH 4. At pH< 4.0, H+ ions compete with Pb (II) ions for the surface of the adsorbent which would hinder Pb(II) ions from reaching the binding sites of the adsorbent caused by the repulsive forces. At pH grater than 4. For this reason the maximum pH value was selected to be 4.5. Effect of contact time The effect of contact time on the amount of Pb (II) ions adsorbed was investigated using 10 and 20 mg/L initial concentration of Pb (II) ions with 0.5 and 1 gm/ (AETB) at pH 4.5. The effect of contact time and metal concentration on the percent removal of Pb (II) ions by AETB ispresented. The results indicate removal of Pb (II) ions increases with increase in contact time and equilibrium was attained in about 360 min. The extent of removal of Pb(II) by AETB was found to increase, reach a maximum value with increase in contact time. Effect of adsorbent dose The effect of adsorbent dose on the removal of Pb(II) ions was investigated using 10 mg/L of initial Pb (II) concentration at initial pH 4.5. The adsorbent dose was varied from 200mg to 1g/ L. It is observed that the removal of Pb (II) ions increases with an increase in the adsorbent dose. Removal of Pb (II) ions increases with increase of adsorbent dosage. The percentage removal increases from 30 to 70% by increasing the adsorbent dosage from 200mg to 1 g/L. Adsorption Isotherms Equilibrium isotherm equations are used to describe the experimental adsorption data. The parameters obtained from the different models provide important information on the sorption mechanisms and the surface properties and affinities of the adsorbent. The most widely accepted surface adsorption models for single-solute systems are the Langmuir and Freundlich models. The correlation with the amount of adsorption and the liquid-phase concentration was tested with the Langmuir and Freundlich isotherm equations. Linear regression is frequently used to determine the best-fitting isotherm, and the applicability of isotherm equations is compared by judging the correlation coefficients.
491
WAGHMARE & CHAUDHARI , Curr. World Environ., Vol. 8(3), 489-492 (2013) Table 1: Langmuir and Freundlich isotherm parameters for Pb (II) ions uptake by AETB Pb(II) Con. Conc. 20mg/L
Freundlich Constants K 4.898
1/n 1.169
Freundlich isotherm The sorption data of nickel ions sorption onto AETB was also fitted to Freundlich isotherm, in the following linear form log qe = log Kf + 1/n log Ce
...(1)
Where, qe is the amount of metal ion adsorbed per gram of adsorbent (mg/g). Ce is the equilibrium concentration of metal ion in solution (mg/L). Kf and 1/n are Freundlich constants, indicating the adsorption capacity and adsorption intensity, respectively. Straight lines were obtained by plotting log qe against log Ce, which show that sorption of nickel ions obeys Freundlich isotherm well. The Kf and 1/n values were calculated from intercept and slop of the plot respectively and presented in Table 1. The correlation coefficient R2> 0.923 and the values of n were higher than 1.0, indicating that adsorption of Pb (II) ions on AETB follows the Freundlich isotherm. Langmuir isotherm The Langmuir isotherm is valid for sorption of a solute from a liquid solution as monolayer adsorption on a surface containing a finite number of identical sites. Langmuir isotherm model assumes uniform energies of adsorption onto the surface without transmigration of adsorbate in the plane of the surface. The Langmuir isotherm is represented in the linear form as: Ce / qe = 1/ b Q0 + Ce / Q0
R2 0.923
Langmuir Constants Q0 22.72
b 0.018
R2 0.944
Q0 and b is Langmuir constants related to the capacity and energy of sorption respectively. A plot of Ce/ qe versus Ce should indicate a straight line of slope 1/ Q0 and an intercept of 1/ (b Q0). The values of Qo and b and correlation coefficient obtained from the Langmuir model are shown in Table 1. The correlation coefficient R2 > 0.944 suggests that adsorption of Pb (II) ions onto AETB follows the Langmuir isotherm. The maximum monolayer capacity obtained from the Langmuir is 22.72 mg/g. CONCLUSION Adsorption of Pb (II) ions, from aqueous solutions using AETB studied. The following results were obtained: • These studies show that Ailanthus Excelsa tree bark is an inexpensive adsorbent for Pb (II) removal from aqueous solutions. • The adsorption of Pb (II) ions on AETB was dependent on the pH, initial Pb (II) ions concentration, quantity adsorbent dose and contact time. • pH 4.5 was used as the optimum pH. • The equilibrium time for the adsorption of Pb (II) ions on AETB from aqueous solutions is estimated 360 minutes. • The adsorption process of Pb (II) ions can be described by Langmuir isotherm and Freundlich isotherm model • The amount of Pb (II) ions adsorbed increased with increase initial Pb(II) ions concentration. • Kinetic of Pb (II) ions adsorption obeyed the pseudo-second-order model.
REFERENCES 1.
2.
Davydova S., Heavy metals as toxicants in big cities, Microchemical Journal, 79, 133– 136, (2005) Brinza L., Nygård C.A., Dring M.J., Gavrilescu
M., & Benning L.G., Cadmium tolerance and adsorption by the marine brown alga Fucus vesiculosus from the Irish Sea and the Bothnian Sea, Bioresource Technology,100,
492
3.
4.
5. 6.
WAGHMARE & CHAUDHARI , Curr. World Environ., Vol. 8(3), 489-492 (2013) 1727â&#x20AC;&#x201C;1733,(2009) Karthika C., Vinnilamani N., Pattabhi S., & Sekar M.,Utilization of Sago Waste as an Adsorbent.(2010) Removal of Pb(II) from Aqueous Solution: Kinetics and Isotherm Studies, International Journal of Engineering Science and Technology, 2(6), 1867â&#x20AC;&#x201C;1879. Sannasi P. and Salmija S., Oriental Journal of Chemistry, 27(2), 461-467, (2011) Zavvar Mousavi H., Seyedi S.R., Int. J. Enviro. Sci. Tech., 8(1), 195-202, (2011).
7.
8.
Kafia M., Shareef Surchi, Agricultural Wastes as Low Cost Adsorbents for Pb Removal: Kinetics, Equilibrium and Thermodynamic,International Journal of Chemistry , 3(3); (2011) Kuchekar R Shashikant , Gaikwad B Vishwas , Sonawane V Dadasaheb and Lawande P Shamarao , Adsorption of Pb (II) ions on Tamarindous indica seeds as a low cost abundantly available natural adsorbent , Pelagia Research Library, 2(6),281-287, (2011)