
Power/Practice/Place:
Responding to Vulnerability, Philly to Baltimore
In the Spring of 2023, a cohort of nine students from city planning and landscape architecture were guided by professors Rebecca Popowsky and Frederick Steiner through a joint city planning and landscape architecture design studio that focused on climate-driven changes on the transportation corridor between Philadelphia and Baltimore. Though this corridor was within the Northeast, one the most well-studied megaregions in the United States, none of the Penn’s previous megaregion studios had focused on the area. With the support of the multi-institutional research initiative, Cooperative Mobility for Competitive Megaregions (CM2), we contributed research on the future of transportation and landscape infrastructure networks in this understudied corridor.
Through the lenses of Power, Practice and Place, we explored rail, road, and water connections between Philadelphia and Baltimore: their vulnerability due to flooding and sea level rise and the ecological, social and spatial implications of that vulnerability. We were also tasked to co-design structures that address the challenges of interdisciplinary collaboration within the university, with hope that the process would illuminate the potential for analogous collaborative models in professional practice. Research methods borrowed from journalism and ethnography that Professor Popowsky had developed over the past three years in her seminar Unruly Practices were integral to the creation of the studio syllabus.
Divided into five sections -- the Map, the Story, the Charrette, the Trip and the Project -- this book is an attempt to share what we experienced in the studio through various fragments of works in progress.
THE MAP

THE MAP
The studio framework began with an exercise called The Map, where we were tasked with creating a physical model that represented existing conditions in the Baltimore-Philadelphia Corridor we would study for the rest of the semester.
Professor Rebecca Popowsky proposed that our studio tackle the first exercise by assigning ourselves roles typically found in an office setting. The roles included Project Managers, Data Managers, Expert Builders, and Sharers. Though most of the roles were familliar and easily fit into this process of creating The Map, the Sharer role was an experiment in what would happen if there was a dedicated role that focused on the act of collaboration itself. Beyond sharing specific skills, the Sharers attempted to cultivate a collective mission and vision within the studio.
The following maps were integral to the initial understanding of the region and the creation of the physical model presented at the mid-term charrette.
WATERSHED-LEVEL LANDCOVER


MSA-LEVEL INFRASTRUCTURE


4FT SEA LEVEL RISE - PHILADELPHIA 4 FT SEA LEVEL RISE - WILMINGTON


MOST PREVALENT RACE BY COUNTY
REFERENCES
MSA-Level Landcover
Dewitz, J., and U.S. Geological Survey, 2021, National Land Cover Database (NLCD) 2019.
Products (ver. 2.0, June 2021): U.S. Geological Survey data release, https://doi. org/10.5066/P9KZCM54.
MSA-Level Infrastructure
Sea level rise: Four feet of sea level rise, NOAA SLR viewer v3.0 : https://coast.noaa. gov/slr/#/layer/slr.
Data from 2021 update of Sweet, W.V., R.E. Kopp, C.P. Weaver, J. Obeysekera, R.M. Horton, E.R. Thieler, and C. Zervas, 2017: Global and Regional Sea Level Rise Scenarios for the United States. NOAA Technical Report NOS CO-OPS 083. NOAA/ NOS Center for Operational Oceanographic Products and Services.
Contaminated sites: U.S. EPA. Enforcement and Compliance History Online [dataset]. Facility Registry Service (FRS) Facilities and linkages. https://echo.epa.gov/tools/ data-downloads#downloads
Energy infrastructure: EIA Energy Infrastructure and Resource Maps, U.S. Energy Atlas. https:// atlas.eia.gov/pages/
4ft Sea Level Rise - Philadelphia
Sea level rise: Four feet of sea level rise, NOAA SLR viewer v3.0 : https://coast.noaa. gov/slr/#/ layer/slr. Data from 2021 update of Sweet, W.V., R.E. Kopp, C.P. Weaver, J. Obeysekera, R.M. Horton, E.R. Thieler, and C. Zervas, 2017: Global and Regional Sea Level Rise Scenarios for the United States. NOAA Technical Report NOS COOPS 083. NOAA/NOS Center for Operational Oceanographic Products and Services. Contaminated sites: U.S. EPA. Enforcement and Compliance History Online [dataset]. Facility Registry Service (FRS) Facilities and linkages. https://echo.epa.gov/tools/ data- downloads#downloads
Energy infrastructure: EIA Energy Infrastructure and Resource Maps, U.S. Energy Atlas. https:// atlas.eia.gov/pages/
4ft Sea Level Rise - Willmington
Sea level rise: Four feet of sea level rise, NOAA SLR viewer v3.0 : https://coast.noaa. gov/slr/#/ layer/slr. Data from 2021 update of Sweet, W.V., R.E. Kopp, C.P. Weaver, J. Obeysekera, R.M. Horton, E.R. Thieler, and C. Zervas, 2017: Global and Regional Sea Level Rise Scenarios for the United States. NOAA Technical Report NOS CO- OPS 083. NOAA/NOS Center for Operational Oceanographic Products and Services.
Contaminated sites: U.S. EPA. Enforcement and Compliance History Online [dataset]. Facility Registry Service (FRS) Facilities and linkages. https://echo.epa.gov/tools/ data- downloads#downloads
Energy infrastructure: EIA Energy Infrastructure and Resource Maps, U.S. Energy Atlas. https://atlas.eia.gov/pages/cebf469e9fc149eea7e3ff77c311b1db
Most Prevelant Race by County
Racial majority by census tract, 5-year ACS 2016-2020. Data from: Steven Manson, Jonathan Schroeder, David Van Riper, Tracy Kugler, and Steven Ruggles. IPUMS National Historical Geographic Information System: Version 17.0 [dataset]. Minneapolis, MN: IPUMS. 2022. http://doi.org/10.18128/D050.V17.0
THE STORY

This was an assigned exercise aimed to grow an understanding of the Philadelphia-Baltimore Transportation Corridor through student-led interviews with key informants identified by the studio professors and journalist Jared Brey. Following a 3-hour long workshop with Jared on interview strategies, we interviewed public servants, practitioners, and researchers over the first few weeks of the semester. When possible, a city planning student was paired with a landscape architecture student to carry out these semi-structured interviews. We further built on the story through meeting people on our weeklong studio trip to Baltimore.
Rather than synthesizing the interviews and our studio trip through words, we were tasked with creating at least three artifacts in response to the stories we heard. Along with each artifact, we submitted a brief statement describing their intent.
This booklet lists the people we were in conversation with, whiteboard diagramming on how we strategized interviewing some of them and the resulting artifacts from the stories we heard.
THE STORY
CONVERSATION PARTNERS


 Petra Messick NEC Infrastructure Planner Amtrak
James Garland Assistant Director of Transportation Houston-Galveston Area Council
P. David Bramble Managing Partner, Co-founder MCB Real Estate
Steward T.A. Pickett Plant Ecologist Cary Institute of Ecosystem Studies
Isaac Hametz Baltimore Program Director The Nature Conservancy
Amy Verbofsky Manager, Healthy and Resilient Communities DVRPC (Delaware Valley Regional Planning Commission)
Kara Oldhouser Sustainability Director Amtrak
Josh Neiman Vice President, Multifamily Development MCB Real Estate
Renée Hamidi Executive Director The Valleys Planning Council
Petra Messick NEC Infrastructure Planner Amtrak
James Garland Assistant Director of Transportation Houston-Galveston Area Council
P. David Bramble Managing Partner, Co-founder MCB Real Estate
Steward T.A. Pickett Plant Ecologist Cary Institute of Ecosystem Studies
Isaac Hametz Baltimore Program Director The Nature Conservancy
Amy Verbofsky Manager, Healthy and Resilient Communities DVRPC (Delaware Valley Regional Planning Commission)
Kara Oldhouser Sustainability Director Amtrak
Josh Neiman Vice President, Multifamily Development MCB Real Estate
Renée Hamidi Executive Director The Valleys Planning Council


 Michael B. Kelly Executive Director Baltimore Metropolitan Council
Bill Swiatek Principal Planner WILMAPCO (Wilmington Area Planning Council)
David Smith Head of Vertical Development MAG Partners
Brian Traylor Director, Major Stations Planning and Development Amtrak
Kelly Flemming Environmental Resilience and Landscape Design Program Director The Neighborhood Design Center
Morgan Grove Research Forester US Forest Service
Lena Denis Geospatial Data, GIS, and Maps Librarian Johns Hopkins University
Briony Hynson Deputy Director The Neighborhood Design Center
Brad Rogers Executive Director South Baltimore Gateway Partnership
Mike Middleton Executive Director South Baltimore 7 (SB7) Coalition
Ethan Abbott Project Manager Rails-To-Trails Conservancy
Kim Lane Executive Director Pigtown Main Street
Donzell Brown Executive Director Environmental Justice Journalism Initiative
Dan Campo Program Director & Associate Professor, Graduate Program in City & Regional Planning Morgan State University
Michael B. Kelly Executive Director Baltimore Metropolitan Council
Bill Swiatek Principal Planner WILMAPCO (Wilmington Area Planning Council)
David Smith Head of Vertical Development MAG Partners
Brian Traylor Director, Major Stations Planning and Development Amtrak
Kelly Flemming Environmental Resilience and Landscape Design Program Director The Neighborhood Design Center
Morgan Grove Research Forester US Forest Service
Lena Denis Geospatial Data, GIS, and Maps Librarian Johns Hopkins University
Briony Hynson Deputy Director The Neighborhood Design Center
Brad Rogers Executive Director South Baltimore Gateway Partnership
Mike Middleton Executive Director South Baltimore 7 (SB7) Coalition
Ethan Abbott Project Manager Rails-To-Trails Conservancy
Kim Lane Executive Director Pigtown Main Street
Donzell Brown Executive Director Environmental Justice Journalism Initiative
Dan Campo Program Director & Associate Professor, Graduate Program in City & Regional Planning Morgan State University


Cut
Artist: Ben Regozin
Illustrated in detail to us throughout the trip and interviews was the role of highways destroying neighborhoods by cutting through them, isolating them, and disconnecting them from each other.
Wire boxes
Artist: Zoe Kerrich
KeyInformant(s):PetraMessick

Motivated by Petra’s description of aligning of different systems related to the 10-mile stretch between NYC and NJ. In our interview, she said (edited for clarity):
Once we build a new tunnel under the Hudson River and expand infrastructure in New Jersey, we will also have to expand Penn Station itself. Penn Station, New York has 21 tracks...There’s not really any excess capacity... We basically have to increase the bucketforthatnewstreamoftrainsflowingintoManhattan.And sothat’saninterestingandverychallengingprojectinwhichwe’re nowdealingwiththeurbanscale.Andlayering,ataverylocallevel all the systems that we have to cram into this basically an entire blockofManhattanandportionsof2adjacentblocks.It’sreal.It’s tracksforthetrains.It’salltherealsystems.It’sallthesystemsthat supportthestation,liketheventilationplants,severalofthem,to vent the station in the case of a fire. It’s electrical substations. It’s baysfortruckstobringgoodstotheretailofthestation,andthen it’s structural support for massive skyscrapers that will be built above the station and then carving out civic space. And enough publicspace[sothatthe]stationhasapresenceatthestreetlevel, and that we have light and air that could potentially reach the platform.Andpotentially,greenspaceontheblockaswell,anda proper interface with the surrounding district. So that’s all like... urban planning, or station planning. [There are] all the last mile considerationsconnectingbikes,pedestrians,hiredcars,andthe connections to the subway to connections to New York City bus system, [which is] all hyperlocal. But then it’s within the context ofthisintercityrealcorridorthatprimarilyservesWashingtonto Boston,butalsoconnectstoFloridaandChicago,andalltheother placesthatAmtrakserves.
How do you capture essential pieces of your work that are intangible -- like, that the HVAC needs to work (but it’s not in the details of where it should or shouldn’t be). These wire pieces only fit together and balance because of the spaces between the framework, and because of how little substance there is to them. The wire was surprisingly hard to bend into the standard corners -- the changes of direction necessary to have planes of a cube required that I wrap each corner with focus (something that I did not always achieve).
Patches
Artist: Cece McCrary
Key Informant(s): Steward T.A. Pickett
Dr. Steward Pickett referenced “patches” during our interview, referring to the patch-corridor-matrix model. The Patchcorridor-matrix is an ecological model that conceptualizes landscape fragmentation. For this artifact, I decided to take this quite literally, creating patches made of natural materials to represent these spaces in the landscape. Likewise, there is a corridor of twigs connecting two of these patches, while a third remains isolated from the others. Intersecting these patches is a different kind of corridor—one forged with metals. The piece is meant to highlight how these types of transportation corridors can isolate habitats from one another. However, simultaneously, transportation corridors have the potential to connect rather than sever. As corridors, they could have a place in the patchcorridor-matrix model.
Patch Dynamics

Artist: Riddhi Batra
Key Informant(s): Steward T.A. Pickett
Steward Pickett mentioned the concept of ‘patch dynamics’ in relation to our study of ecology. As someone with a limited knowledge of ecological systems, this made me curious about the patterns that underlie habitat (re)-construction, and how they can serve as references for reimagining future infrastructure. This artifact presents historical, present, and future land cover imagery for the Delaware River Basin – a key region intersecting with our study area. The 6 layers, starting from the bottom, display the DRB in the years 1700, 1800, 1900, 2000, and two Global Change Analysis Model (GCAM) scenarios for 2100– the first assuming the RCP 4.5 model estimated by the IPCC as moderate - where emissions peak around 2040 and then decline; and the second assuming “business-as-usual” without specific carbon or climate mitigation efforts1. These models have been developed by the USGS and for the purpose of this prompt, show the differences in habitat fragmentation and the number of different “patches” that appear as a result. It led me to further think about how humanmade patches interact with natural ones, and what might be some ways to plan and design with the purpose of creating positive interdependencies.
1 Dornbierer,
Long-term database of historical, current, and future land cover for the Delaware River Basin (1680 through 2100): U.S. Geological Survey data release, https://doi.org/10.5066/ P93J4Z2W.
J.M., Wika, S., Robison, C.J., Rouze, G.S., and Sohl, T.L., 2021,
Barriers to Somewhere
Artist: Simps Bhebhe
KeyInformant(s):BillSwiatek
Bill Swiatek on barriers to engagement and community apprehension in historically divested communities: “Respond to that community where it is” and “Come with mindset that you don’t have all the answers you are there to understand and support what those needs are.”
This art piece portrays a maze and serves as a commentary on the challenges of navigating through historically racist community barriers. Rather than seeing these barriers as insurmountable obstacles, the maze represents a process of finding a way through. To progress, we need to keep moving in the right direction, even if that means changing course, turning around, or taking a new path.


Ultimately, this piece speaks to the importance of actively participating in the process of overcoming these barriers. We must be willing to navigate through discomfort and challenge ourselves to rewrite the wrongs of the past. By staying focused on our goals and persevering through the maze, we can emerge on the other side with a renewed sense of purpose and the knowledge that we can overcome any obstacle that stands in our way.
Melt
Artist: Alex Cartwright
KeyInformant(s):KaraOldhouserandMorganGrove
Heat is the silent killer, responsible for more annual deaths than any other meteorological phenomena. The planet is steadily warming and raising the level of heat stress on people and infrastructure. Sustained high temperatures cause rail tracks to warp and catenary lines to sag, as well as put a substantial energy demand on electric grids. Amtrak already has policies in place that force trains to reduce speeds when rail temperature thresholds are exceeded. Unless steps are taken to cool or shade the tracks and catenary lines, Amtrak and other passenger rail operators are sure to experience more schedule disruptions and infrastructure degradation.
This model captures the influence of heat on two materials while suggesting the forms of powerlines and rail track. Heat was raised by several of our key informants as the greatest climate threat for people and infrastructure in the Mid-Atlantic region over the ensuing decades. reroute and/or refashion what currently exists along the corridor.
Silicone cast rainstorm
Artist: Zoe Kerrich
KeyInformant(s):MorganGrove
This artifact is a response to Morgan Grove’s statement that urban green stormwater infrastructure is insufficient alone to address high-intensity rainstorms (cloud burst events). As he said (edited for clarity):

This idea of many green infrastructure systems [is] Because the rate at which water falls from the sky far exceeds what the system can handle. So, we have to confront the fact that we have these micro bursts -- they’re highly unpredictable -- spatially, temporally, and up the magnitudes, and a lot of the EPA screen infrastructure is designed for suburban systems where you have [large areas of undeveloped land]. If you draw a graph, you have lots of [high] and low performance [systems]. And that works fine, right, maybe in the suburban areas. But in urban areas we need we have small areas. We need high performance. We don’t have the systems. You need to design those systems.
Here, I was looking for a porous material (pantyhose) to demonstrate semi-permeability to a material that could pour slowly and cast in-place (silicone). Interestingly, I was so sure this silicone mold cure had failed day-of, but two days later, it was such a surprise to see that the silicone poured over the pantyhose slope and the excess that pooled on the tarp below and both cured in place.
Feed the Soil
Artist: Cece McCrary
KeyInformant(s):IsaacHametz
I was inspired by the words of Isaac Hametz’s mentor: “Feed the soil, not the plants.” To me, this symbolizes the value of slow, meaningful work. Building healthy, fertile soil takes time—weeks, months, and even years of contributing organic matter, practicing little or no till. I believe this mindset can also be applied to any project that shapes one’s physical environment. Building trust and fostering relationships with communities takes time and care.
In this piece, the soil feeds you! The idea manifests itself in two ways. First, and most obviously, the piece is supposed to resemble soil while also being edible—pecan brownie topsoil on top of pecan shortbread bedrock, topped with rosemary and thyme garnish. In another sense, the soil feeds you by providing you with this good in the first place. The flour, the cocoa powder, the almond extract, the butter, and every other element in this dish is made possible by topsoil.

The Roots
Artist: Yining Wang
KeyInformant(s):IsaacHametz
“Baltimore flood risk plan is poorly conceived. Emphasis on infrastructure can deemphasize the impact on human beings.”
—Isaac Hametz
The artifact “Roots” is consisted with three: the flood plane, the rail line and the root structure. The roots structure which is made of copper wires is a new attempt for the design of the railway structure. Just as the roots of the trees, the wires present the a solid structure that deal with the heavy flood and transfer the cold temperature to the ground the level during the hot days.
Barrier, Connection, Development
Artist: Yining Wang
KeyInformant(s):KaraOldhouser
During the interview, Kara Oldhouser mentioned several challenges:
• Density within the Northeast region
• Managing upstream development-nor managing storm water properly, risk of hurricanes…
• Multi-model transit centers/ connectivity between systems
• Alternative fuel types of displace the diesel
• Environmental stressors amongst communities around the rail
The black rail road and yellow high way of the artifact cut the community and ecosystem into several parts, but the station bring the economic development at the same time. This artifact also contains a proposal to add connection such as trial systems, pedestrian bridge and other public transportation to connect different communities with ecosystem, and resolve the barrier caused by the railway and highway for the habitat.
Flow
Artist: Jules Venuti
KeyInformant(s):MichaelB.Kelly
In conversation, Kelly used the example of Ellicott City, MD’s annual flooding to describe climate change’s impact on the state of Maryland and how locals perceive the risk. Ellicott City was founded as a milling town due its proximity to the Patapsco River. Flow depicts a water mill at odds between two currents. Flowing water once generated economic activity for the area, now it inundates the city’s core in flashes on an annual basis. What was once a strength for Ellicott City has become its greatest weakness. How can we capitalize on our existing weaknesses to strengthen the region into the future?
Erode
Artist: Jules Venuti
KeyInformant(s):KaraOldhouser
Erode is a quite literal take on rail line vulnerability between Baltimore and Philadelphia, specifically the bridge across the Susquehanna River in Northeast Maryland. Erode depicts a train line over a suspended line of infrastructure that hollows at the center, splaying at either ends of its foundation. Through the creation process, the splay itself began to resemble the Greek symbol π which curiously reinforces erosion in SLR and flash flood vulnerable areas as destructive and compounding, π is a mathematical constant with a never-ending decimal representation. The curve can either represent another symptom of the infrastructure’s erosion, or an opportunity to reroute and/ or refashion what currently exists along the corridor.
Adapt-in-Place

Artist:
Riddhi Batra
KeyInformant(s):KaraOldhouser
In our interview with Kara Oldhouser, Sustainability Director at Amtrak, we learnt about Amtrak’s strategy to “adapt-in-place” in response to sea-level rise along the Northeast Corridor. This stood out to me as a huge design and planning constraint, one that has emerged from decades, if not centuries, of anthropocentric practices that have imposed human-made systems so far onto natural ones that even our imaginations have a hard time realigning towards a more symbiotic approach. The artifact I made for this prompt symbolizes the idea of the Amtrak rail line (the metal rods) embedded into the ground (the plaster base) – so much so that the communities and ecosystems surrounding it seem to be faced with no option but to move around the line.
This model captures the influence of heat on two materials while suggesting the forms of powerlines and rail track. Heat was raised by several of our key informants as the greatest climate threat for people and infrastructure in the Mid-Atlantic region over the ensuing decades. reroute and/or refashion what currently exists along the corridor.

Suspense
Artist: Jules Venuti
KeyInformant(s):BrianTraylor
An abstract take on one of AMTRAK’s approaches to master planning priority station development and rehabilitation, I.e., ground leasing. Specifically, Suspense models the relationship between AMTRAK owned land and the ground leases it engages in with private real estate developers to plan for the rippling commercial demand and activity that encircles major rail stations. The plaster base represents AMTRAK land while wood rods embody partnerships and AMTRAK’s relationship with other private parties. Moreover, it imagines the physical separation between land and structure and how future development along the AMTRAK corridor will adapt through evolving relationships and structures.
Platform on legs
Artist: Zoe Kerrich
KeyInformant(s):BrianTraylor
Brian Traylor described how Hurricane Ida flooded the rail yard at 30th St station -- “after Hurricane Ida, the station needed a lot of cleaning.” The hazards of this flooding can have large detrimental impacts on rail infrastructure -- yet from a layout perspective, it makes total sense that this box of space so close to the river would flood. This piece contains no details identifying the platform as 30th St station, and looks as if it could be a proposal for elevating properties out of harm’s way from nuisance and storm surge flooding. But the station is already elevated -- the problem is that so much critical infrastructure is below, as is the necessary design for a train station.
Invisible connections
Artist: Alex Cartwright
KeyInformant(s):KellyFlemingandBrionyHynson
What does collaborative design between community and practitioner look like? Does community engagement build agency, or relegate residents to the role of reviewer? Designers and planners can be invisible connections between residents, local government agencies, non-profit organizations, community groups, and a neighborhood vision that emerges from the neighborhood itself.
This model is a reflection on our studio’s discussion with Kelly Fleming and Briony Hynson at the Neighborhood Design Center in Baltimore. Kelly and Briony put forth the phrase “invisible connector” when framing the work of the Neighborhood Design Center.


Hollow Egg

Artist: Ben Rregozin
KeyInformant(s):DavidBramble
When meeting with David Bramble’s firm, MCB, we were pitched a vision of the identity of Baltimore through the lens of their acquisition of property of the Inner Harbor. The presentation depicted the Inner Harbor as holding the entire city on its shoulders. There was discussions of a “starchitect” that would be doing the redesign and it made the process seem disengaged from the constellation of neighborhoods that would be utilizing the space.
Build Networks

Artist: Riddhi Batra
Key Informant(s): Mike Middleton, Donzell Brown, Kim Lane and Ethan Abbott
Overheard during our meeting with representatives of the South Baltimore Gateway Partnership, this idea forms the basis for much of our research in the past few weeks. What relationships exist within the Northeast Corridor? What areas, communities, or ecologies have greater access to resources, and which of them stand to be studied and strengthened? How can establishing links and sharing existing resources guide the region towards a more sustainable, equitable future?
Top: “Nobody Asked You! And They Won’t, Until You Tell Them To.” by Petition for a Vote (c. 1975).
Bottom: “The MAD Coloring Book” by Mary M. Rosemond (1972).

Highway to Nowhere
Artist: Nicole Cheng
Key Informant(s): Mike Middleton, Donzell Brown, Kim Lane and Ethan Abbott
The “Highway To Nowhere” was first mentioned by David Bramble as an important infrastructural marker of racist disinvestment in Baltimore’s Black neighborhoods. The structure was “designed to connect the downtown business district to interstates surrounding Baltimore, and officials used eminent domain to demolish nearly 1,000 homes in the 1960s and ’70s, cutting a wide swath through predominantly middle class neighborhoods in majority-Black west Baltimore. But construction of the thoroughfare was never finished — partly because residents in whiter, more affluent communities successfully campaigned against it — and the endeavor became largely pointless1.”

I created a clay sculpture as an expression of the fight between two forces–the government and community opposition to expressway construction. The University of Baltimore Special Collections & Archives hosted an exhibit in 2012, Stop The Road! Records from the Road Fights, and used organizational records of the Movement Against Destruction (MAD) from the archives to tell the story of this opposition. “Founded in 1968 as a coalition of 25 neighborhood and community groups, MAD’s leaders included George and Carolyn Tyson, Barbara Mikulski, Walter Orlinsky, Norman Reeves, and Parren Mitchell2.”
1 Skene, Lea. 2023. “Baltimore to Invest in Black Communities Ravaged by Highway.” AP News. February 23, 2023. https://apnews.com/article/baltimore-01bb5c649318 4a47718b7a3593c55277.
2 Bell, Laura. 2019. “Stop The Road! Records from the Road Fights.” Exhibits from the Archives, University of Baltimore. 2019. https://ubarchives.omeka.net/exhibits/ show/movement-against-destruction/exhibit-about.
Images sourced from the Movement Against Destruction Records at the University of Baltimore Special Collections & Archives.
Similarly Unique
Artist: Simps Bhebhe
KeyInformant(s):DonzellBrown
“There is a saying that the black people who ended up in Baltimore were the people who ran out of gas”. Donzell speaking to the ties of Maryland with the South and the differing cultural relationships of black people in Maryland compared to the black communities further north and east.
This model is a commentary on the shared yet differing challenges that black people face in America. It highlights the need to respect the unique histories, conditions, and mindsets of each community, even if they are subject to similar struggles. Rather than assuming that all black communities, individuals, and challenges are the same, we must acknowledge and embrace the diversity that exists within these communities.
Zero Sum Game
Artist: Nicole Cheng
Key Informant(s): Mike Middleton, Donzell Brown, Kim Lane and Ethan Abbott

Listening in on a panel arranged by Brad Rogers from the South Baltimore Gateway Partnership the term that characterized the mentality of communities within this “city of neighborhoods” was described as a zero sum game. Communities are distrustful of the government and were described to operate on a scarcity mindset, where resources going to one neighborhood would mean resources unavailable and taken away from another.
This performance piece is an interpretation of the tension felt between communities, where people are expected to build relationships while fighting each other.

Full Eggs

Artist: Ben Regozin
KeyInformant(s):KellyFleming
Contrasted with some of the developer meetings and interviews we had meetings with nonprofits as well as community members. Overlooked in the developers’ narratives, save for David Bramble, the most disinvested neighborhoods form and keep important bonds. I remember at our meeting with the Neighborhood Design Center, Kelly Flemming mentioned a neighborhood that wanted to maintain privacy or be harder to discover. This reflects acts of protection, self-interest, or autonomy, and understanding value and worth which already exists in these neighborhoods. Mike Middleton spoke lovingly about his neighborhood that he grew up in and its this value that gets lost in the narratives of historic and current racism and disinvestment.
The Black Butterfly
Artist: Nicole Cheng
KeyInformant(s):DavidBramble
The Black Butterfly was mentioned as a shorthand for racial inequity at a meeting with David Bramble at MCB Real Estate and again once or twice during the trip. It was coined by Lawrence T. Brown in his book of the same name, which is “a reference to the fact that Baltimore’s majority-Black population spreads out like a butterfly’s wings on both sides of the coveted strip of real estate running down the “center of the city”1. The term “White L” is used to describe the white neighborhoods that run down the center of the butterfly.
These two drawings depict the Black Butterfly and White L using different methods. One drawing uses tape to delineate the shape for the charcoal and is then neatly colored in, whereas the White L in the other drawing is erased out from a ground of black.

What is the ground you start from and what stories are unearthed as a result of it?
 1 Brown, Lawrence T., TheBlackButterfly:TheHarmfulPoliticsofRaceandSpaceIn America. Baltimore, Maryland: Johns Hopkins University Press, 2021.
Daylighting


Artist: Cece McCrary
KeyInformant(s):ChristopherStreb
One of my favorite moments of our Baltimore trip was stomping around a speck of woods in Druid Park with Chris Streb. At the end of our trek, we stopped in a grove of pines to discover a storm drain grate—and down this dark hole was a stream. You could hear the stream clearly, and barely see the sunlight reflect off the water’s surface. Behind the grate, the stream almost looked like it was in a jail cell, or locked in a cage. Chris told us that this stream would eventually be daylighted.
This piece reflects on this very moment. I wanted to recreate the feeling of looking past the darkness and the iron to sense what had been buried and lost. The term “daylighting” refers to the process of unearthing buried, hidden streams— quite literally bringing daylight back to the streams. I wanted to inverse this idea to highlight that light—or value—within the stream itself. Streams provide some of the most rich, diverse ecosystems in the United States. Its ecosystem benefits are boundless. The act of daylighting insinuates that we are saving the stream—when in reality, the stream saves us.
Coastal plain fall line
Artist: Alex Cartwright
The fall line between the Piedmont and the Atlantic Coastal Plain is one of the most defining natural features of Northeast Megaregion below New York City. The result of an eons long mosh pit between Earth’s plates, the fall line drives patterns in soils, vegetation, and hydrology that shape the Mid-Atlantic. Over the past 250 million years, Pangea ripped apart and the Atlantic Ocean opened, establishing the conditions for differential erosion between the metamorphic Piedmont and the sedimentary coastal plain.
Historical Paradigms
Artist: Simps Bhebhe
This artifact was inspired by my reflection of our time in Baltimore in general. We learned a lot about historic perceptions that persist and influence the present. Maryland is one of only two megaregion states that was part of the confederacy. On the ground in Baltimore the reality of racial segregation still divides community’s interconnectivity and connection between neighborhoods (separated by highways and railway lines or lack of public transport routes). The transport system is underinvested in, and a Governor stopped a light railway system plan from being implemented.
This artifact serves as a commentary on the lack of progress in the development of black communities and the ongoing struggle for integration in America. The chair, as a symbol, represents the deeply ingrained racism that has become normalized and is now viewed as the status quo. It underscores the fact that true progress can only be achieved by confronting and dismantling these entrenched attitudes and biases.

THE TRIP

THE TRIP
Our understanding of the segment of the Northeast Megaregion between the Philadelphia and Baltimore metropolitan statistical areas is rooted in both people and place.
To engage with legacies of infrastructural planning and design in the region, we visited the Architectural Archives at Penn, and spent a week in Baltimore. Two major projects that supported the establishment of the practice Wallace-McHarg, the Inner Harbor and the Plan for the Valleys, guided some of our study at the archives and in Baltimore.
Additionally, we visited a string of sites along the I-95 corridor to better understand the landscapes, connections, and differences between these major cities. As our work in the studio was part of larger research efforts of the Cooperative Mobility for Competitive Megaregions (CM2) consortium, we joined researchers and practitioners in Austin, TX at the close of our studio process to present our findings.
JANUARY FEBRUARY MARCH 1.12 Studio Begins 2.2 Penn Archives 2.6-2.10 Baltimore 2.27 Mid-review
APRIL MAY 4.30 I-95 sites 5.17-5.19 CM2 4.13 3/4 Review 5.4 Final Review 3.23 I-95 sites
THE ARCHITECTURAL ARCHIVES AT PENN
Our visit to the Architectural Archives of the University of Pennsylvania allowed us the unique opportunity to view original work by Ian McHarg, David Wallace, Robert Todd, and Narendra Juneja. Their work informed both our understanding of the legacies of planning and development in Baltimore and the history of geospatial systems at multiple scales.
Bill Whitaker pulled many hand rendered maps and perspectives that jumped through scales giving the studio examples of visual representations of space that would help us articulate physical these major scale shifts later in the semester.
 Architectural Archives
Studio at 3600 Market
Architectural Archives
Studio at 3600 Market


 Left: [Above] Bill Whitaker at the Architectural Archives speaking with the studio group. Image courtesy of Rebecca Popowsky. [Bottom] A landscape study drawing by Narendra Juneja of development suitability in Baltimore. Image courtesy of Ian L. McHarg Collection, The Architectural Archives, University of Pennsylvania.
Above: [Top] The class studying original drawings from the Wallace, McHarg, Roberts and Todd plan for the Inner Harbor at the Penn Archives. Image courtesy of Rebecca Popowsky. [Bottom] A drawing by Thomas Todd for the Inner Harbor plan of the USS Constellation. Image courtesy of Ian L. McHarg Collection, The Architectural Archives, University of Pennsylvania.
Left: [Above] Bill Whitaker at the Architectural Archives speaking with the studio group. Image courtesy of Rebecca Popowsky. [Bottom] A landscape study drawing by Narendra Juneja of development suitability in Baltimore. Image courtesy of Ian L. McHarg Collection, The Architectural Archives, University of Pennsylvania.
Above: [Top] The class studying original drawings from the Wallace, McHarg, Roberts and Todd plan for the Inner Harbor at the Penn Archives. Image courtesy of Rebecca Popowsky. [Bottom] A drawing by Thomas Todd for the Inner Harbor plan of the USS Constellation. Image courtesy of Ian L. McHarg Collection, The Architectural Archives, University of Pennsylvania.
STUDIO TRIP TO BALTIMORE
In February of 2023, the studio spent a week in Baltimore. We spoke with groups working on planning and landscape efforts in the city and surrounding region. The trip had many scheduled meetings with a spectrum of people that both impact and are impacted by physical and political landscape of Baltimore.
We spoke with developers and community leaders and used a lot of time sharing our findings and thoughts in studio meetings between these meetings. We were given a tour of Baltimore by Dan Campo. There was ample time to explore independently as well.
 1. Johns Hopkins Archives
2. Mike Kelly
3. The Valleys
4. MCB Real Estate
5. Neighborhood Design Center
1. Johns Hopkins Archives
2. Mike Kelly
3. The Valleys
4. MCB Real Estate
5. Neighborhood Design Center
1 3 4 5 2 6
6. South Baltimore Gateway Partnership


 Left: [Top] Visiting the archives at John Hopkins to view historic maps of Baltimore. Image courtesy of Rebecca Popowsky. [Bottom] Talking with Josh Neiman from MCB Real Estate at their Yard 56 site.
Above: View south on South Calvert Street at the intersection of South Calvert and Redwood in Baltimore. Image courtesy of Riddhi Batra.
Left: [Top] Visiting the archives at John Hopkins to view historic maps of Baltimore. Image courtesy of Rebecca Popowsky. [Bottom] Talking with Josh Neiman from MCB Real Estate at their Yard 56 site.
Above: View south on South Calvert Street at the intersection of South Calvert and Redwood in Baltimore. Image courtesy of Riddhi Batra.

 Left: Talking with Josh Neiman from MCB Real Estate at their Yard 56 site.
Above: Visiting the graffiti alley behind the Neighborhood Design Center. Image courtesy of Riddhi Batra.
Left: Talking with Josh Neiman from MCB Real Estate at their Yard 56 site.
Above: Visiting the graffiti alley behind the Neighborhood Design Center. Image courtesy of Riddhi Batra.


 Left: [Top] USS Constellation docked in the Inner Harbor. [Bottom] Taking a break near the marina in the Inner Harbor.
Above: [Top] Visiting Nick’s Fish House for a lunch on the Middle Branch. [Bottom] A segment of a boardwalk, protected shoreline, and historic bridge near the Middle Branch.
All images courtesy of Rebecca Popowsky.
Left: [Top] USS Constellation docked in the Inner Harbor. [Bottom] Taking a break near the marina in the Inner Harbor.
Above: [Top] Visiting Nick’s Fish House for a lunch on the Middle Branch. [Bottom] A segment of a boardwalk, protected shoreline, and historic bridge near the Middle Branch.
All images courtesy of Rebecca Popowsky.


 Above: Group discussion in the hotel lobby at Hotel Indigo. Image courtesy of Rebecca Popowsky.
Right: [Top] Baltimore’s Museum of Public Works. Image courtesy of Julius Venuti. [Bottom] Visiting the construction site for underground drinking water reservoirs in Druid Hill Park. Image courtesy of Rebecca Popowsky.
Above: Group discussion in the hotel lobby at Hotel Indigo. Image courtesy of Rebecca Popowsky.
Right: [Top] Baltimore’s Museum of Public Works. Image courtesy of Julius Venuti. [Bottom] Visiting the construction site for underground drinking water reservoirs in Druid Hill Park. Image courtesy of Rebecca Popowsky.
Following the week in Baltimore, groups and individuals began narrowing down sites of focus for the remainder of the semester. In order to explore sites chosen as well as discover new locations of possible intervention, some studio members mapped out sites to visit along I-95 between Philadelphia and Baltimore.
Many of these sites proved to be difficult to access. Significant hunches being followed included post industrial sites within flood zones, marshes and areas to possibly support marshes in the future, and sites cut by I-95 that could be reconnected. There was a focus on the delegation of this space, its vulnerabilities, potentials, and current land use.

I-95 SITE VISITS


 Left: Views from the DuPont Environmental Education Center of Delaware Nature Society at the Russell Peterson Wildlife Refuge. Images courtesy of CeCe McCrary.
Above [Top]: An asphalt plant in Wilmington, De, sited between the Christina and Delaware Rivers. Image courtesy of CeCe McCrary. [Bottom] Jaw bone of a deer, found near the Koppers Superfund Site. Images courtesy of Zoe Kerrich.
Left: Views from the DuPont Environmental Education Center of Delaware Nature Society at the Russell Peterson Wildlife Refuge. Images courtesy of CeCe McCrary.
Above [Top]: An asphalt plant in Wilmington, De, sited between the Christina and Delaware Rivers. Image courtesy of CeCe McCrary. [Bottom] Jaw bone of a deer, found near the Koppers Superfund Site. Images courtesy of Zoe Kerrich.


 Left: [Top] Abandoned farm building at the Augustine Wildlife Area in Middletown, DE. Image courtesy of CeCe McCrary. [Bottom left] Green frog at Augustine Wildlife Area. Image courtesy of Zoe Kerrich. [Bottom right] Zoe documenting said frog. Image courtesy of CeCe McCrary.
Above: Road closure during heavy rain south of Wilmington. Image courtesy of CeCe McCrary.
Left: [Top] Abandoned farm building at the Augustine Wildlife Area in Middletown, DE. Image courtesy of CeCe McCrary. [Bottom left] Green frog at Augustine Wildlife Area. Image courtesy of Zoe Kerrich. [Bottom right] Zoe documenting said frog. Image courtesy of CeCe McCrary.
Above: Road closure during heavy rain south of Wilmington. Image courtesy of CeCe McCrary.
CM2 SUMMER CONFERENCE
Hosted by University of Texas at Austin, our work on the Northeast Megaregion is part of a larger effort by a consortium of universities researching mobility within the Megaregions of the United States. As representatives from the University of Pennsylvania, we joined researchers from University of Texas at Austin, Louisiana State University, Texas Southern University, and regional practitioners for a conference to share our research and results.


 Above: Rebecca Popowsky presenting studio work at the CM2 Conference. Image courtesy of CM2.
Right: [Top] CM2 conference attendees. Image courtesy of CM2. [Bottom] Studio members at Barton Creek Greenbelt in Austin. Image courtesy of Alex Cartwright.
Above: Rebecca Popowsky presenting studio work at the CM2 Conference. Image courtesy of CM2.
Right: [Top] CM2 conference attendees. Image courtesy of CM2. [Bottom] Studio members at Barton Creek Greenbelt in Austin. Image courtesy of Alex Cartwright.
THE CHARRETTE

THE CHARRETTE
The midreview used the format of a charrette instead of a crit as a way to create a more collaborative and generative learning space. Landscape architecture student Nicole Cheng used adrienne maree brown’s book Emergent Strategy as a guide for how the midterm charrette could be structured. This book, along with Patrick Flynn’s Rethinking The Crit, were introduced by professor Rebecca Popowsky as key to her thinking when putting the syllabus for the studio together.
Two readings proposed were to the voluntary reading group by Ben Regozin and Nicole spoke to performance and were important to feeding thought on the charrette. We created this reading group in an attempt to study. The group discussion that week included Ben and Nicole, as well as Zoe Kerrich, Alex Cartwright, Julius Venuti and Simps Bhebhe.
Readings/Media for that week:
A podcast episode of Millennials Are Killing Capitalism where Hanif Abdurraqib & Fred Moten discuss “Building a Stairway to Get Us Closer to Something Beyond this Place”.
A chapter from Collective Actions: Audience recollections from the first five years, 1976 - 1981 on “Audience Recollections”. Translated & edited by Yelena Kalinsky.
Patrick Flynn, “Rethinking the Crit,” in Rethinking the Crit: New Pedagogies in Design Education (London: Routledge, 2022), 1–24.


How can the charrette be an alternative to the crit?
With a majority of the students in the studio without experience with crits and the conventional set up of an architecture studio, could this be an opportunity to unlearn faster?
It is difficult to know what is important to learn in professional education without having much or any professional experience in the field prior to entering graduate school. This seems to favor a tutor-led model... and yet this has not demonstrated to work well for students across the board...
How can the studio be set up to encourage collaboration? Is this possible within the university?

adrienne maree brown, Emergent Strategy: Shaping Change, Changing Worlds (Chico: AK Press, 2017), 141.


 RIDDHI CECE
SIMPS
NICOLE ZOE
BEN
YINING ALEX
JULES
LAND ACKNOWLEDGMENT
The University of Pennsylvania is located on land that is part of the traditional territory of the Lenni-Lenape people, in the Lenapehoking, the ancestral and spiritual homeland of the Indigenous Lenape diaspora. We acknowledge the Lenni-Lenape as the original people of this land and their continuing relationship with this territory, despite the history of Indigenous removal, dispersal, and erasure. We are also cognizant of the Indigenous history in our studio sites, and the displacement, dispossession, and expulsion that have taken place there.
Our studio study area covers parts of the ancestral territories of the following tribes:

Accomack
Anacostan
Cayuga
Chesapeake
Chicoteague
Choptank
Choptico
Cuttatawomen
Doeg
Haudenosauneega
Confederacy
Lenni-Lenape
Lumbee
Manahoac
Massawomeck
Matapeake
Mohawk
Mohican
Moneton
Monocan
Monongahela Culture
Moraughtacund
Munsee Lenape
Nanticoke
Occaneechi
Occohannock
Onawmanient
Oneida
Onondaga
Osage
Ozinie
Patawomeck
Patuxent
Piscataway
Pissaseck
Pocomoke
Rappahannock
Sekakakwon
Seneca
Shawnee
Susquehannock
Tockwogh
Transquaking
Tuscarora
Wicocomico
We will take seriously the tasks of learning this history of settlercolonialism on our sites of design, and striving to understand the impact of land dispossession and federal policies such as Termination on the lives and experiences of these Indigenous communities, and on their relationship to this land.
We also recognize and support the ongoing struggle for sovereignty and self-determination faced by indigenous groups both here and across the world. Through our research and design work, we will strive to act in a reparative way for these historic harms, with humility but compassion, and to seek avenues for decolonizing the power relations that have been perpetuated over the last two centuries.
Map of ancestral territories of indigenous peoples across the Megaregion by Cece McCrary.


 Alex and Ben performing tug of war as part of Nicole’s performance piece.
Nicole reading out the land acknowledgment as part of the introduction to the charrette.
Students and guest Laurel McSherry looking at the model of the Megaregion.
Close up of model. Images courtesy of Rebecca Popowsky and Simps Bhebhe.
Alex and Ben performing tug of war as part of Nicole’s performance piece.
Nicole reading out the land acknowledgment as part of the introduction to the charrette.
Students and guest Laurel McSherry looking at the model of the Megaregion.
Close up of model. Images courtesy of Rebecca Popowsky and Simps Bhebhe.
Students Simps and Nicole discuss their projects under the theme of ‘Culture’ with guests Thabo Lenneiye and Julie Donofrio.

Students Zoe, Riddhi, Yining and Jules discuss their projects under the theme ‘Infrastructure’ with guest Bob Yaro and Professor Steiner.

Students Cece, Alex and Ben discuss their projects under the theme ‘Nature’ with guests Laurel McSherry and

 Artifacts by Simps and Nicole and maps by Julius Venuti hanging in the ‘Culture’ corner.
Sarai Williams. Images courtesy of Rebecca Popowsky.
Artifacts by Simps and Nicole and maps by Julius Venuti hanging in the ‘Culture’ corner.
Sarai Williams. Images courtesy of Rebecca Popowsky.
with modifications made on site of the charrette
exploratory discussion

table
nature infrastructure
initial artifacts
culture
specific discussion
table
+ executive summary + land acknowledgment + overview maps
satellite map [specific] projector

THE PROJECT

TABLE OF CONTENTS
Structures and Areas of Collaboration
Megaregion Futures in Seven Generations by Nicole Cheng, Ben Regozin, Zoe Kerrich, Simps Bhebhe, Cece McCrary
City Gorgeous by Simps Bhebhe
Quagmires by Cece McCrary
Disturbance Regimes by Zoe Kerrich
Resilience Proving Ground by Ben Regozin
Hover Middle Branch by Julius Venuti
Cherry Island Wetland Park by Alex Cartwright, Cece McCrary, Yining Wang
A Manifesto for Place: Transportation and Ecology along the Philadelphia-Baltimore Megaregion by Riddhi Batra

Megaregion Futures in Seven Generations
by Nicole Cheng, Ben Regozin, Zoe Kerrich, Simps Bhebhe, Cece McCrary

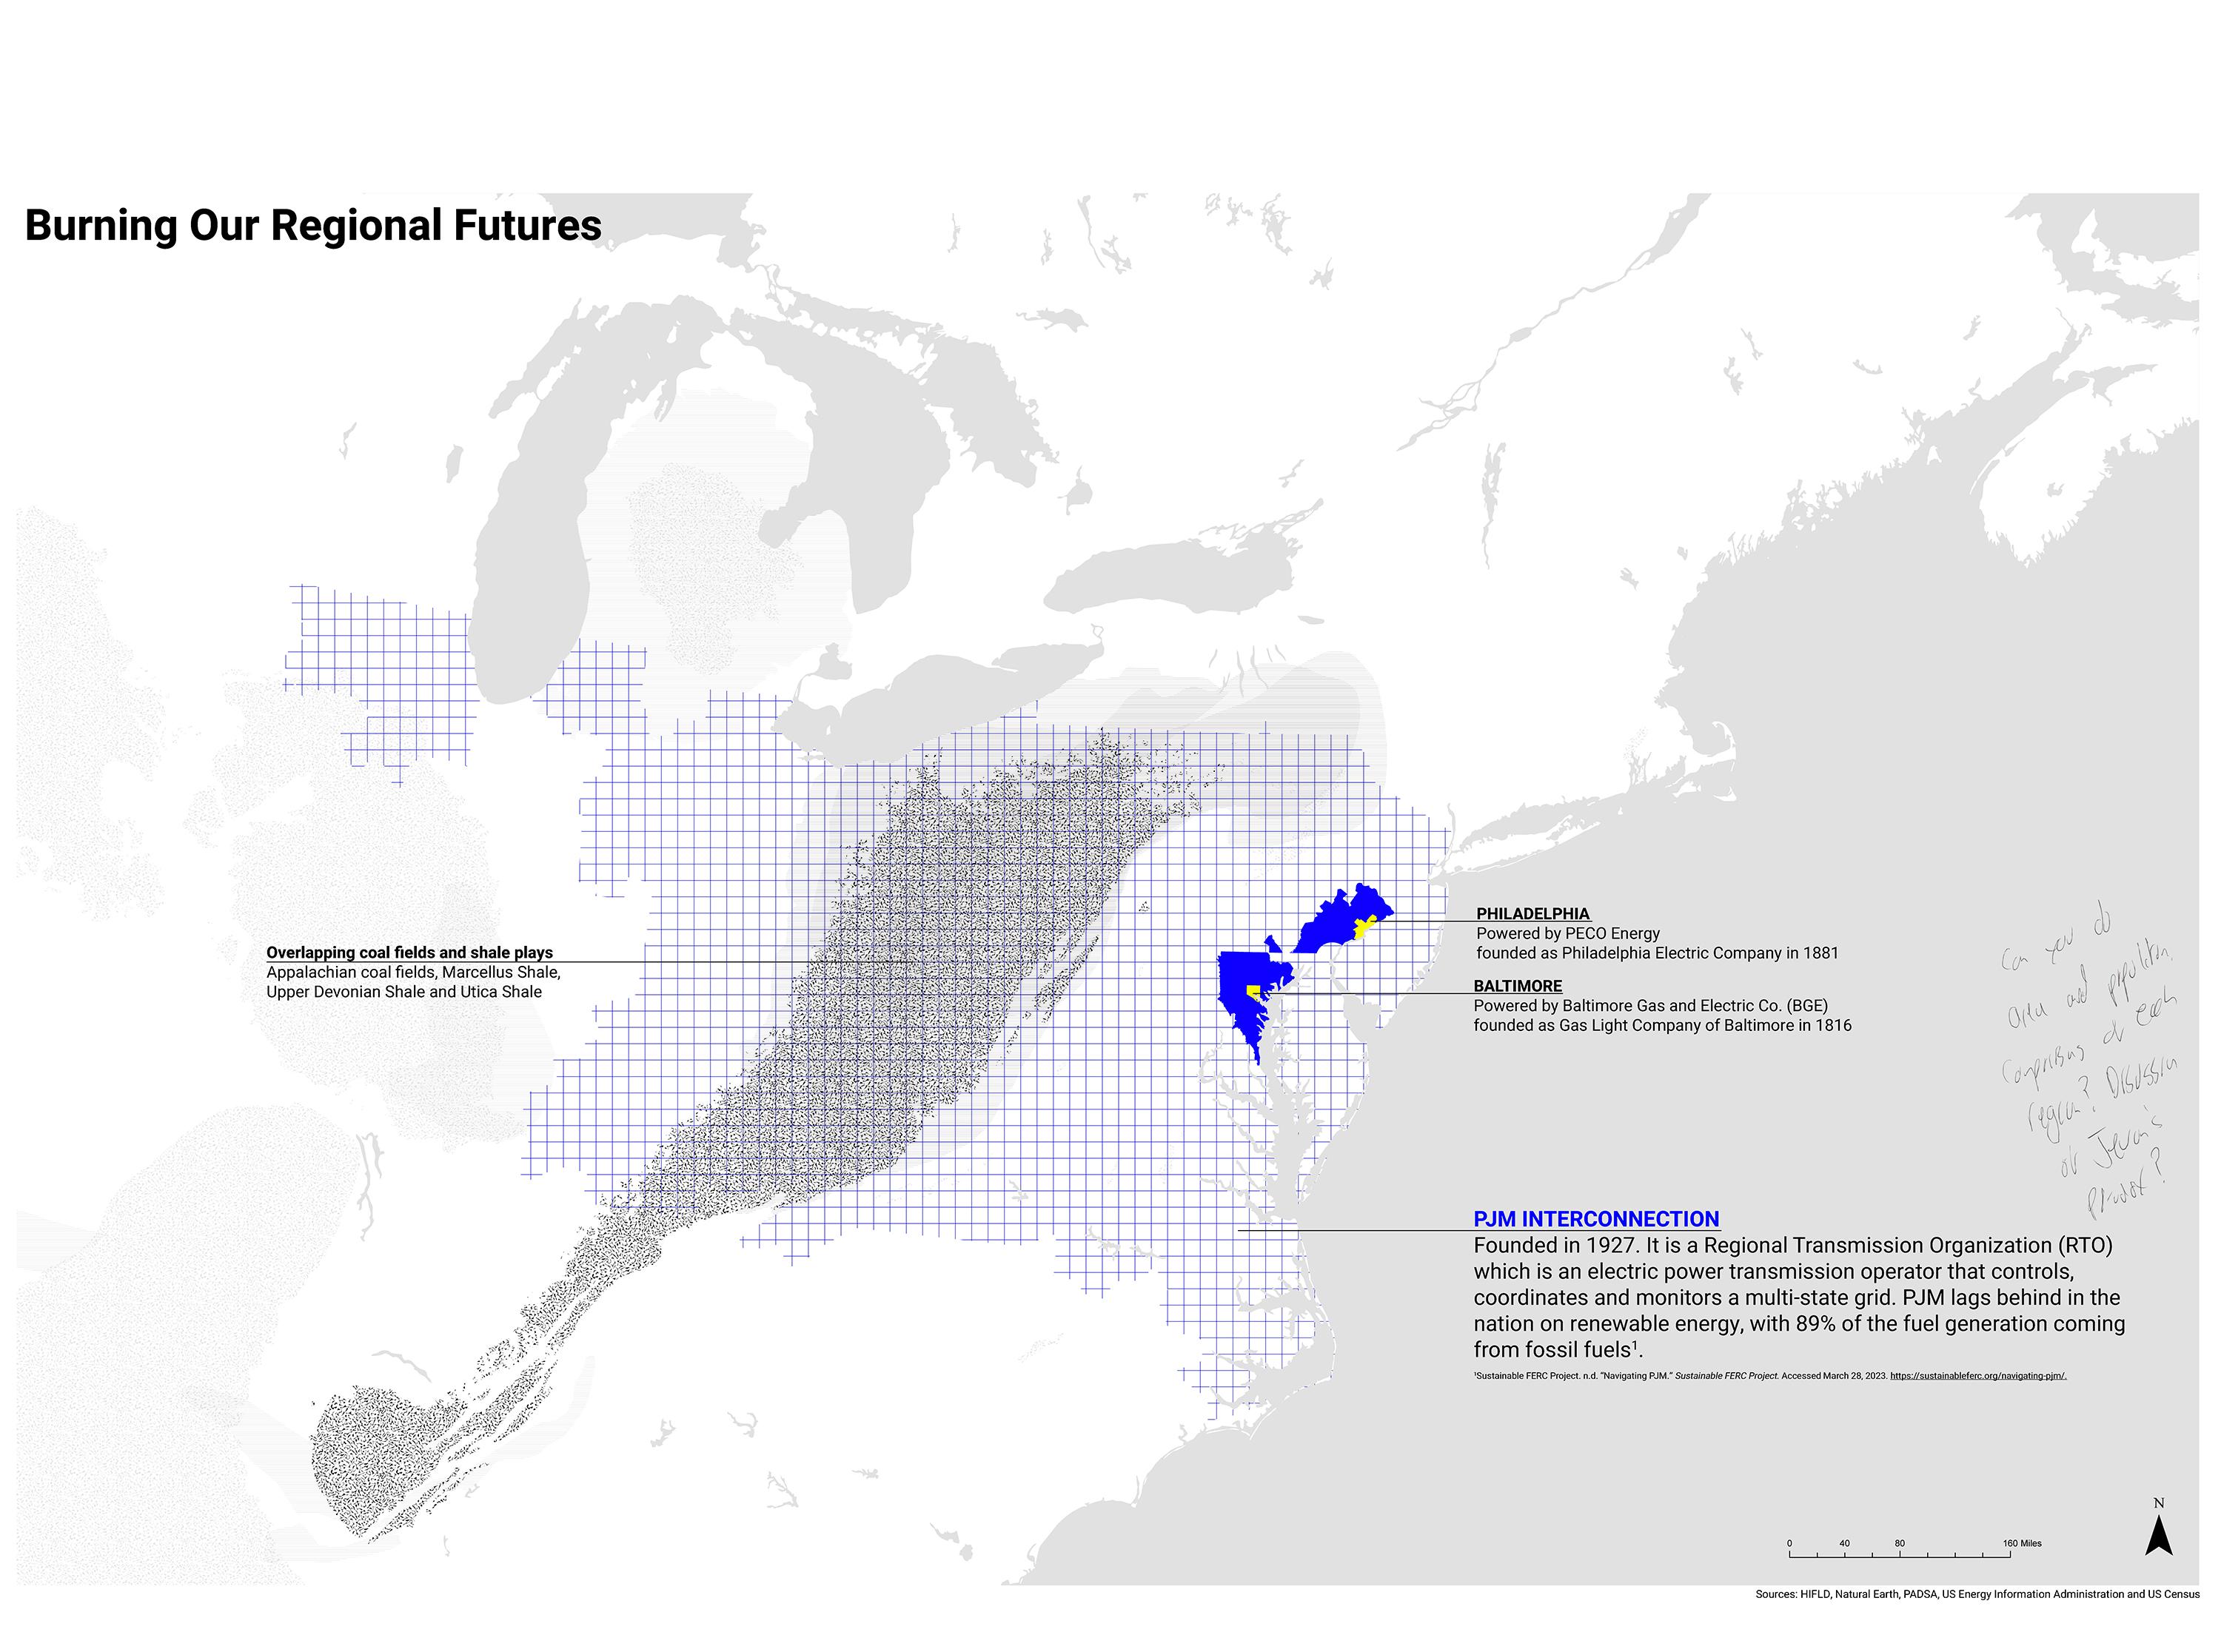
This project began by focusing on regional energy infrastructure and a time horizon of seven generations. Mapping visualized spatial relationships within energy infrastructure and a timeline documented energy history seven generations into the past. The rest of the studio was invited to add events to the collective timeline and add to a collective map of research sites. What emerged from these studies was two-fold: an interest in the power of drawing and an immense sense of possibility for the future.


I first experimented with drawing as a method of collaboration during the three-quarter review. A 15-minute drawing exercise which prompted participants to make mental maps of energy infrastructure across scales— from their homes to neighborhoods and finally the larger Megaregion. From this, I developed the idea for a series of participatory drawing exercises to engage ideas of energy seven generations into the future. The result was five participatory drawing exercises with one focusing directly on understanding and reimagining regional energy infrastructure. The types of skills engaged with each student were unique to the questions and skills both found exciting to share with each other. Each collaboration emphasized the ability to think together through drawing, regardless of the person’s confidence in expressing their ideas in this way.


Multiple copies of each exercise were presented in a 30-minute drawing session at the final studio review where guest critics became students of the studio. Three students performed as teachers for the duration of the workshop to guide the new students on the drawing exercises. Gathered around two tables, people collaborated on the drawing exercises and were in constant conversation. At the end of the session, drawing participants proactively asked for space to share their thoughts on the exercises and the drawings were pinned up alongside their respective projects.
 “Sharing the Power” worksheet created in collaboration with Simps Bhebhe completed by workshop participants.
Excerpt from Disturbance Regimes zine created with Zoe Kerrich. Completed by workshop participant Frederick Steiner.
“Healing Grounds” worksheet created in collaboration with Ben Regozin. Completed by workshop participant Kelly Fleming.
“Sharing the Power” worksheet created in collaboration with Simps Bhebhe completed by workshop participants.
Excerpt from Disturbance Regimes zine created with Zoe Kerrich. Completed by workshop participant Frederick Steiner.
“Healing Grounds” worksheet created in collaboration with Ben Regozin. Completed by workshop participant Kelly Fleming.

 Excerpt of “Taking Back Power” worksheet created to work through restructuring the regional energy system. Completed by workshop participant Sharon Hayes.
“Rights of Nature” worksheet created in collaboration with Cece McCrary and completed by workshop participants.
Excerpt of “Taking Back Power” worksheet created to work through restructuring the regional energy system. Completed by workshop participant Sharon Hayes.
“Rights of Nature” worksheet created in collaboration with Cece McCrary and completed by workshop participants.
City Gorgeous
by Simps Bhebhe


 Indication of racially integrated cities on a US Census Map of Metropolitan and Micropolitan Statistical Areas and maps of racial demographics across Baltimore and Philadelphia.
Planning Process Questions
Who do we think has nothing to do with this plan? How can we make it relevant to them?
How can this planning intervention be used to activate societal collaboration?
Discussion Questions for Planners
What planning instruments do we have that can help repair past harm?
What would need to change and/ or be created to help planners make more inclusive and equitycentered plans?
Planning Process Questions
What would be different about our planning processes if we started with the most vulnerable in our society?
How are we prioritizing planning agendas? What ways does this priority generate equity?
Discussion Questions for Planners
What amenities are in your neighborhood that you could not imagine living without?
If community building became a central aspiration for all members of society, what do you think would be different about the planning practice?
Planning Process Questions
Who is the most important participant(s) in the planning process? Is this participant(s) at the focus the best way to foster equity?
Will this intervention perpetuate the status-quo or will it generate more diversity?
Discussion Questions for Planners
What do you think we would we see in society if our officials actually represented the demographics of its community at large.
How is the current status-quo of governance creating the society you want to live in and/or how is the current status-quo not doing that?
Planning Process Questions
Would this planning intervention meet your satisfaction if it were happening in your community? Why? If not, why should it be satisfactory for this neighborhood?
Is this planning intervention as a whole, ticking off a task or is it drawing us closer to a world you want to live in?
Discussion Questions for Planners
Assuming people are resistant to change, what can planners do to help community members be more adaptable to change?
When plans are not driven by logic but the powers of external stakeholders - how should planners respond?
Planning Process Questions
Does your planning intervention take into account the values of the community you are planning for? If so how and which ones?
What ways does your plan make people of different ethnicities/religions/socioeconomic backgrounds feel welcome? Is that founded solely on your opinion?
Discussion Questions for Planners
What does genuine community engagement involve? How can stereotyping be limited?
What type of characteristics in the built environment creates psychological safety and what makes you feel welcomed in a space?
Planning Process Questions
Can you name and identify the values driving and guiding your planning intervention?
What have we learned about people in our community in this planning process? How is this learning reflected in our plan?
Discussion Questions for Planners
In a context where a community has been subject to prejudice planning practices. What do you think planners and communities need to know upfront?
When trust is a barrier to community participation where should planners start?
Quagmires by Cece McCrary

Quagmire is a word with two meanings —one is a soft, boggy area of land that gives way underfoot, such as a wetland, or an awkward, complex, or hazardous situation. The term quagmire is therefore an appropriate descriptor of the state of both a vital and characteristic landscape of the Baltimore-Philadelphia megaregion: marshes. Home to thousands of different species of plants and animals, this landscape faces an existential threat in the megaregion if the natural rate of marsh regeneration does not keep pace with project sea level rise. Quagmires asks the question: how will we value and protect these landscapes moving forward?
Regional Landscapes
The Northeast region of the United States is bookended by expansive, contrasting landscape features. To the west of the Baltimore-Philadelphia megaregion rests the Appalachian Mountains, which are considered one of the oldest mountain ranges on Earth. The range is said to be 480 million years old— older than trees, older than the first footsteps on land1 .
I have a very personal connection with the mountains. Myself, my cousins, my aunts, my mom, and my grandma spent our summers growing up going to a summer camp that’s on the southern tip of the mountain range. Three generations can tell the same stories of that place-- we all swore our feet brushed the top of the fabled snapping turtle in the lake, we each fell asleep to the sound of bullfrogs at night. And that’s only three generations worth of experiences-- how many other families have shared a connection through this landscape, on a mountain range that’s older than trees?
Coming down from the mountains, moving east, is an area that has a rich and extensive agricultural past and present. This is reflected in the land cover map presented earlier. The creation of this particular landscape required extensive deforestation— from when the first European colonies were established to the late 1800s, the Northeast saw the razing of nearly two thirds of its forests. Subsequently, this massive deforestation event led to substantial sediment loads that helped shape the scope of the tidal marshes we see today2.
1 Dietrich, Emily. “6 Striking Facts about the Appalachian Mountain Range.” Medium, November 8, 2021. https://copyfrog.medium.com/6-striking-facts-aboutthe-appalachian-mountain-range-aacad14978ab.
2 Matthew L. Kirwan, A. Brad Murray, Jeffrey P. Donnelly, D. Reide Corbett.
Marshes Today, Marshes Tomorrow
Today, tidal marshes make up roughly 280,000 acres in the Chesapeake Bay3 and 165,000 acres in the Delaware Bay4 —both of which abut the Baltimore-Philadelphia megaregion. There are dozens of different organizations that have worked toward restoring, maintaining, and protecting these ecosystems—from state agencies like the New Jersey Department of Environmental Protection, to national entities such as the U.S. Fish and Wildlife Service, to non-profits like the Chesapeake Bay Foundation. As efforts within these landscapes continue, the threat of climate change looms.
Marshes are inherently dynamic systems, regenerating decade after decade, shifting as the result of both erosion and sediment accumulation. However, it is uncertain as to whether the rate of accretion can keep up with the rate of sea-level rise. Furthermore, there is little consensus as to how much of these ecosystems are threatened. Some studies point to 20% to 90% loss of marshes in the Mid-Atlantic, while other studies argue that the rate of regeneration will keep up with rising waters5. Regardless of the uncertainty, there is one strategy that is recognized as both viable and necessary: in order to outpace sea-level rise, marshes will need to be able to shift inland and upslope, which requires protected and unimpeded migration corridors. Ultimately, these findings have resulted in a reflection on what drives land conservation, the inherent rights of nature, and regional collaboration.
Concluding Thoughts
Regional land conservation has largely been an anthropogenic undertaking. The Appalachian Mountains, for example, are preserved for the famed Appalachian Trail. Quagmires, boggy areas that give way underfoot, do not provide such utility. And while wetlands in general provide humans with numerous ecosystem services, this still leads to an entirely anthropogenic
“Rapid wetland expansion during European settlement and its implication for marsh survival under modern sediment delivery rates.” Geology 2011;; 39 (5): 507–510. doi: https://doi.org/10.1130/G31789.1
3 “Wetlands.” Chesapeake Bay Foundation, 2023. https://www.chesapeakebay.net/issues/whats-at-risk/wetlands.
4 Smith, Joseph. “Characterizing Delaware Bay Tidal Marshes.” Joseph Smith, PhD, 2020. https://www.smithjam.com/characterizing-delaware-bay-tidal-marshes/.
5 Popkin, Gabriel. “Marshes on the Move.” Science, June 18, 2021.https:// www.science.org/doi/10.1126/science.372.6548.1254.
decision-making process of what land should be saved and what can be paved. We have been planning at a landscape scale in this region for hundreds of years—starting with the first axe swing. If our actions helped make these landscapes that so many species rely upon today for survival, then how much are we responsible for its preservation? Can we decide to protect landscape simply because it exists?
The tackle box pictured on the cover of this section represents many concepts related to this idea. Planners often refer to utilize a “tool box” of strategies to carry out their work. In his book A Sound County Almanac, Aldo Leopold once said: “Man’s invention of tools has enabled him to make changes of unprecedented violence, rapidity, and scope.” The tackle box is the antithesis of this idea. Fishermen fill tackle boxes with baits and lures, items that mimic nature to catch fish. By filling this tackle box with natural materials found at the marshes in our study area, I hope to demonstrate the need to reevaluate the strategies we use in regard to regional landscape planning to reflect the need to both work with nature and recognize the abundance within it as well. A recurring theme in our studio has been the rejection of the idea that ecosystems are blank canvasses on which we place our infrastructure—taking away the land’s agency. By placing a mirror at the top of the tackle box, buried within stand and organic matter, I hope to demonstrate the agency of the marshes. Even as you peer at the marshes, they are looking back at you, too. Our actions are reflected in these landscapes, our reflections intertwined.
My research has guided my interaction with and contribution to my classmates and their projects throughout the duration of the studio. This has manifested in various ways, depending on the project itself, but at the forefront has been to advocate for protection of these migration corridors to make way for these dynamic ecosystems in the face of rising seas.
CREATURES OF THE MARSH

human (Homo sapiens) american oystercatcher (Haematopus palliatus) arctic tern (Sterna paradisaea) black skimmer (Rynchops niger) black-crowned night-heron (Nycticorax nycticorax) clapper rail (Rallus crepitans) common tern (Sterna hirundo) fosters tern (Sterna forsteri) glossy ibis (Plegadis falcinellus) great egret (Ardea alba) gull-billed tern (Gelochelidon nilotica) little blue heron (Egretta caerulea) marsh wren (Cistothorus palustris) marsh hawk (C. hudsonius) osprey (Pandion haliaetus) royal tern (Thalasseus maximus) tricolored heron (Egretta tricolor) willet (Tringa semipalmata) yellow-crowned night heron (Nyctanassa violacea) black rail (Laterallus jamaicensis) least tern (Sternula antillarum) red knot (Calidris canutus) roseate tern (Sterna dougallii) saltmarsh sparrow (Ammodramus caudacutus) seaside sparrow (Ammodramus maritimus) least shrew (Cryptotis parva) diamondback terrapin (Malaclemys terrapin) rainbow snake (Farancia erytrogramma) loggerhead turtle (Caretta caretta) big bluet (Enallagma durum) needham’s skimmer (Libellula needhami) salt marsh skipper (Panoquina panoquin) checkered white (Pontia protodice) maritime sun ower borer moth (Papaipema martima) seaside goldenrod borer moth (Papaipema duovata) spartina borer moth (Photedes inops) barred owl (Strix varia) chuck-will’s-widow (Antrostomus carolinensis) prothonotary warbler (Protonotaria citrea) red-shouldered hawk (Buteo lineatus) white-eyed vireo (Vireo griseus) wood duck (Aix sponsa) eastern narrow-mouthed toad (Gastrophryne carolinensis) willow ycatcher (Empidonax traillii) american bittern (Botaurus lentiginosus) american black duck (Anas rubripes) blue-winged teal (Anas discors) common gallinule (Gallinula galeata) great blue heron (Ardea herodias) pied-billed grebe (Podilymbus podiceps) sora (Porzana carolina) swamp sparrow (Melospiza georgiana) virginia rail (Rallus limicola) black tern (Chlidonias niger) king rail (Rallus elegans) eastern cottontail (Rallus elegans) meadow jumping mouse (Zapus hudsonius) american mink (Neovison vison)
muskrat (Ondatra zibethicus) (Procyon lotor) southern bog lemming (Synaptomys cooperi) virginia opossum (Didelphis virginiana) water shrew (Sorex palustris) blue-spotted salamander (Ambystoma laterale) northern leopard frog (Lithobates pipiens) northern spring peeper (Pseudacris crucifer) red-backed salamander (Plethodon cinereus) spotted turtle (Clemmys guttata) wood turtle (Glyptemys insculpta) blanding’s turtle (Emydoidea blandingii) wild turkey (Meleagris gallopavo) bu ehead (Bucephala albeola) canvasback (Aythya valisineria) hooded merganser (Lophodytes cucullatus) ruddy duck (Oxyura jamaicensis) tundra swan (Cygnus columbianus) belted king sher (Megaceryle alcyon) northern gannet (Morus bassanus) sanderling (Calidris alba) snowy egret (Egretta thula) bald eagle (Haliaeetus leucocephalus) eastern screech owl (Megascops asio) carolina chickadee (Poecile carolinensis) eastern bluebird (Sialia sialis) northern cardinal (Cardinalis cardinali long-tailed shrew (Sorex dispar) red fox (Vulpes vulpes) striped skunk (Mephitis mephitis) river otter (Lontra canadensis) white tailed deer (Odocoileus virginianus) beaver (Castor) delmarva fox squirrel (Sciurus niger cinereus) eastern grey squirrel (Sciurus carolinensis) ribbed mussel (Geukensia demissa) bay scallop (Argopecten irradians) eastern oyster (Crassostrea virginica) blue crab (Callinectes sapidus) marsh ddler crab (Minuca pugnax) horseshoe crab (Limulidae) knobbed whelk (Busycon carica) common grass shrimp (Palaemonetes vulgaris) sea nettles (Chrysaora
moon jelly sh (Aurelia aurita) lion’s mane (Cyanea capillata) marsh periwinkle (Littoraria irrorata) hellbender
black rat snake
copperhead
american
american
atlantic menhaden
atlantic sturgeon
black drum
cromis) brook trout (Salvelinus fontinalis) bull shark (Rhinoptera bonasus) cownose ray
leucas) mummichog
northern pu er
pumpkinseed (Lepomis gibbosus) red drum (Sciaenops ocellatus) striped bass
saxatilis) white perch
americana)
chesapeakei)
(Cryptobranchus alleganiensis)
(Pantherophis obsoletus)
(Agkistrodon contortrix)
eel (Anguilla rostrata)
shad (Alosa sapidissima)
(Brevoortia tyrannus)
(Acipenser oxyrhynchus oxyrhynchus)
(Pogonias
(Carcharhinus
(Fundulus heteroclitus)
(Sphoeroides maculatus)
(Morone
(Morone


Disturbance Regimes
 by Zoe Kerrich
If we begin by taking Gottman’s1 view of the Northeast Megaregion as an economic hinge – hinging either across the Atlantic Ocean or trans-continentally -- throughout the growth of the Megaregion, then we can experience the degraded, contaminated, and abandoned lands that scatter throughout its urban regions as the cost of growth, the cost of “doing business.” Efforts to re-use sites that are now contaminated generally fall into two categories: brownfield and superfund remediation. Superfund sites receive federal funding and strategy, and are sites deemed as highly hazardous to human health and the environment. Brownfields, everything else. The landscapes of the Northeast Megaregion, and specifically the areas between and in Philadelphia and Baltimore, are littered with these sites. The once Steel Belt, now Rust Belt, includes these two cities, unlike the other major Northeast Megaregion cities of Boston, New York, and D.C.
Remediation aims to restore landscapes to a usable state – suitable for re-use, safe for humans and the environment. Remediation requires the removal, storage, and management of contaminated materials. The contamination must be contained somewhere, somehow. For Superfund sites, EPA evaluates the effectiveness of implemented remediation strategies every five years. For the Koppers Superfund Site in Newport, Delaware, 10 review cycles from now will likely see the site inundated with four feet of sea level rise. In fifteen review cycles, almost certainly. When EPA remediates sites, solutions generally fall into one of two categories; removal or storage. At Koppers, EPA intends to build a landfill of contaminated materials, capped above with a geotechnical nonpermeable layer, capped below by a naturally-occurring lowpermeability layer of clay. Walls for the landfill will extend at least 10 feet below the upper limit of the clay layer. Will this hold up with sea level rise? What if EPA decides to instead remove the material, ship it to a landfill designated as suitable for accepting hazardous waste? The material (the soil, the left behind creosoteimbued railroad ties) would likely be shipped to a landfill in West Baltimore, in an industrial area next to a majority Black, poor neighborhood. Is that restoration? To make the contamination “some else”’s problem?
Butler2 pushes us to ask, whose life is (normatively) “grievable?” Do
1 Gottmann, Jean. 1964. Megalopolis:The Urbanized Northeastern Seaboard of the United States. The MIT Press.
2 Butler, Judith. 2009. Frames of War: When Is Life Grievable? London: Verso Books.
we grieve the loss of health experienced by neighborhoods exposed to contamination? If we frame communities as “contaminated” and “uncontaminated,” where do we see state power? And from Shotwell 3: Who are your ethical entanglements with – who are you responsible for?
These industrial, degraded, contaminated, abandoned lands have worked so hard to contribute to the Northeast Megaregion – do we care for them? These “working landscapes” that we’ve worked “to the bone” – what does reciprocal care look like for these landscapes, that have provided so much, already? The Koppers Superfund site is contaminated because railroad ties and telephone poles were once produced here – imbued with creosote to last longer and resist degradation, as these wood products connected human communities through transportation and electricity networks. Koppers is present on your block, at 30th St. Station, with you as take Septa regional rail or Amtrak along the Northeast Corridor. And where are the coal fields and forests that the creosote of Koppers came from? Those landscapes are at Koppers, just as Koppers is present in preserved wood products that connect us.
The landscapes of and from Koppers are not just products or entanglements from industry. We can focus on human activity, networks, and production. And we can see the American eel that lies in Hershey Run, the creek that runs along the eastern edge of the Koppers site, that EPA will re-route to facilitate placement of the contaminant landfill. These eels (and all eels) begin life in the Atlantic ocean, in the Sargasso sea, at the confluence of four major ocean currents. And these eels (and all eels) will return to the Sargasso sea to reproduce, returning to the salt of the ocean after a lifetime in freshwater rivers, streams, and creeks.
The Koppers site is difficult for humans to access – across Amtrak’s railroad tracks, with no direct roads. Hanif Abdurraqib and Fred Moten describe the experience of music, of art, and of language as building a stairway to get us closer to something beyond this place4. Here, we ask – can we, removed from or present at
3 Shotwell, Alexis. 2016. Against Purity: Living Ethically in Compromised Times. Minneapolis: University of Minnesota Press.
4 “Building a Stairway to Get Us Closer to Something Beyond This Place.” n.d. Millennials Are Killing Capitalism. Accessed April 10, 2023. https://millennialsarekillingcapitalism.libsyn.com/hanif-abdurraqib-fred-moten-building-a-stairwayto-get-us-closer-to-something-beyond-this-place.
Koppers, build a stairway to get us closer to the places and places that Koppers has been and will be? Can we generate care for this working landscape, which has worked so hard? Koppers is not the only working and abandoned landscape of the Northeast Megaregion, but what if we just start here.


Resilience Proving Ground
 by Ben Regozin
The Resilience Proving Ground is a speculative futuring project that, by looking back at over a century of military weapons testing on a site between the size of Baltimore and Philadelphia, proposes a century long timeline which would both make visible the former land use as well as the strategies to mend it.


This story is told through multimedia output. An oral history train car tells the story of the site to passengers on the Amtrak between the Edgewood and Aberdeen stations. As the narrative is spoken, a video is projected onto a model of the site fading between what that ride looks like now, different velocity tests of water, oil, and sound as well as personally shot footage where these tests occur in life.
In the narrative, the site remains a proving ground, but instead of in service to weapons, chemical, and radiation testing, it would be utilized to test remediation, adaptation, and new infrastructure strategies, hopefully leading to developments that could be used across the world. The project proposes serious action to a threat to the country as well as reflection on our government’s own responsibility and history of military force.


B
SHORELINE 0 FT 50 FT 100 FT 150 FT 200 FT Hover Middle Branch
SECTION THROUGH “SOFT”
by Julius Venuti
Hover Middle Branch is a two-part scenario that encompasses the social, economic, and environmental processes that are essential to sustainably developing communities along the Baltimore and Philadelphia transportation corridor, an underexamined stretch of the Northeast Megalopolis. The scenario was born out of “sampling” two existing plans.
The first part of this proposal samples the phenomenal work done by the South Baltimore Gateway Partnership in creation of the Reimagine Middle Branch Plan. This scenario does not intend to replace, discount, or undermine the work done by and for the Middle Branch community, rather it seeks to consider a novel alternative that places the Middle Branch of the Patapsco River at the forefront of megaregional planning and development between Philadelphia and Baltimore.
The second part of this proposal samples the final site plan powered by Stonewall Capital for the firm’s ONE Westport development on the Westport waterfront site. A great amount of involvement and effort from designers, the Middle Branch community, and the developers of the site was placed into this site plan. That said, this plan is not compatible with the transit scenario presented in this project and has been adjusted to suit the megaregional transit component that drives this scenario plan. Thank you to every perspective and partner that created the vision that Hover Middle Branch builds upon.
Part 1: Reimagining Water Transit
This scenario builds on the third chapter of Reimagine Middle Branch, entitled Transform Barriers into Connections . The first part of this scenario considers the recommendations for water transit in the Middle Branch, which is to “Collaborate with MTA & DOT (Charm City Circulator) to improve transit to goods and services, local employers such as Port and industrial firms nearby, and regionally, including water transit” (Volume 1: Design Vision, pg. 101). It also considers the map that indicates potential water transit boarding locations and routes in the Middle Branch(Volume 1: Design Vision, pg. 75). To develop an intervention that addresses the recommendation for water transit, this part of the scenario instead suggests implementing a hover craft service that stops between the Baltimore Peninsula development in Port Covington and the ONE Westport waterfront development in Westport. This route could be extended to serve both Fort McHenry and the downtown core via Canton Waterfront Park.
MEGAREGIONAL EARNINGS IMPACT
MEGAREGIONAL JOBS CREATED (IN-DIRECT)

DIRECT ECONOMIC OUTPUT DIRECT EARNINGS DIRECT JOBS CREATED
MEGAREGIONAL ECONOMIC IMPACT (�GDP)
�2.83MM �891.6k 6 �2.3MM �4.87MM 23 A B C D Baltimore Peninsula FKA Port Covington Cherry Hill South Baltimore Federal Hill Locust Point Canton Fells Point Inner Harbor Westport Light RailLink LightRailLink To Hunt Valley To BWI Airport To Morgan State University To Curtis Bay CityLinkSILVER CityLink SILVER Potential Hover Landings Pilot Hovercraft Route Potential Hovercraft Route Proposed Light Rail Spur Proposed Ferry Route Proposed Ferry Ports HMIDDLE BRANCH O V E R
Part 2: ONE Westport Design Intervention

ONE WESTPORT
WhatisONEWestport?
PROPOSED REVISIONS OF ONE WESTPORT
PROPOSED REVISIONS OF ONE WESTPORT
WESTPORT - BALTIMORE
Issues
• A 43 acre parcel on the Westport Waterfront, i.e., the western shore of the middle branch of the Patapsco River in South Baltimore City.


A combination of for-sale townhouse, multi-family apartments (affordable and market-rate), senior apartments, retail, office, public parks, waterfront promenade, and a multi-purpose public recreation field.
ONEWestportMission
• To create a new development that complements and supports the exisiting communities in the middle branch of the Patapsco River.
To develop the site with multiple developers from around the country.

To re-develop and re-vitalize homes and businesses in the exisitng community by integrating the area into the site design.
• To upgrade the existing light rail station and create an active multi-modal hub for all of Westport and the middle branch communities.
EXISTING SITE CONDITIONS
Existing CSX freight rail line and light rail line propose a significant barrier between waterfront re-development and the existing community.


Current development plan proposes a railroad crossing as primary connection to the existing Westport community.
• Current development plan proposes a large dock landing and “hard” shoreline to support it in the mixed-use commercially focused district. The prioritized uses of commercial/retail spaces have not identified.
ProposedSolutions

• Create a pedestrian bridge from the intersection of Cedley Street and Kent Street to the east-side sidewalk of New Kloman Street. Connect to the north entrance of a new elevated lightrail station. Bridge the intersection of Cedley Street and Maisel Street with a pedestrian bridge to the south entrance of the new elevated lightrail station.
Convert the “hard” shoreline and dock in commercial district with a continuous “soft” shoreline that is accessibile from commercial area and proposed African-American Heritage Trail.
• Design and orient commercial spaces in-line with projections for employment growth in South Baltimore. Prioritize arts/entertainment, health/medical, and information sectors.

I-295
PROPOSED BY ONE WESTPORT


Shoreline Townhouses Relocated
“Soft” Shoreline Preserved

AA Heritage Trail Supported by Waterfront Park
Hovercraft Landing

Pedestrian Bridges
Elevated Light Rail Station

These proposed revisions seek to address the existing barriers between the Westport waterfront site and the community. Through the creation of pedestrian bridges and an elevated light rail station the existing community will no longer have to rely on using the CSX railroad crossing parallel to Kloman Street, currently the only access point to the site. The revisions also incorporate a hovercraft landing, extending the waterfront’s “soft” shoreline, and setting proposed residences back from the waterfront by moving the proposed public park to the shoreline. A SOUTH-FACING SECTION THROUGH KENT STREET - WESTPORT, BALTIMORE
PROPOSED REVISIONS OF ONE WESTPORT
Unregulated Coal Ash Land Fills Shoreline Townhouses Relocated “Soft” Shoreline Preserved Existing Westport Community 4’ Sea Level Rise (NOAA) 100-Year Flood Plain (FEMA) CSX Freight Rail Line MTA LightRail Link Line Existing Kloman Street Existing Kloman Street ONE Westport Development (Divided up by Parcel) 300 Multifamily Homes 275 Townhomes 350 Multifamily Homes 30,000 SF of Retail Space Commercial Office Space 250 Multifamily Homes 400 Multifamily Homes A B C D E F Proposed Kloman Street I-295 I-95 WATERVIEW AVE ANNAPOLIS RD CEDLEY ST KENT ST MAISEL ST I-95 LEGEND LEGEND LEGEND C A B C D E F I-295 I-95 WATERVIEW AVE ANNAPOLIS RD CEDLEY ST KENT ST MAISEL ST
I-95 WATERVIEW AVE ANNAPOLIS RD CEDLEY ST KENT ST MAISEL ST B A LEGEND
LEGEND
0FT EXISTING CONDITIONS PROPOSED ADDITIONS / CHANGES 25FT 50FT 25FT 20FT HEAVY FREIGHT RAIL EXISTING KLOMAN ST 20FT PLATFORM 10’ SIDE WALK 6’ 12% NEW KLOMAN ST 25’ 15’ LIGHT RAIL TRACK 30’ CEDLEY STREET PLATFORM 75FT 100FT WESTPORT SECTIONS
Cherry Island Wetland Park
 by Alex Cartwright, Cece McCrary, Yining Wang
Cherry Island, the land mass bounded by the Delaware River, Brandywine River, and Shellpot Creek, was once almost entirely wetland. Over the last two centuries Shellpot Creek has been redirected, filled, and cast aside. Today, Cherry Island Marsh is all but forgotten, buried under refuse, roads, and sewage, and is mostly disconnected from its life source. Wetlands persist on the site, but much of the wetland habitat has been lost and that which remains is degraded.
Like much of the Atlantic Coast, this site will experience inundation due to sea level rise. The primary design condition considered in this project is 4ft of sea level rise around the year 2100, based upon the latest report from NOAA. In this scenario, the banks of the Brandywine Creek will overflow and the low-lying areas of the former Cherry Island Marsh that have not been elevated will be inundated, including many current commercial and industrial land uses such as the Norfolk Southern Edgemoor Railyard, an asphalt plant, chemical manufacturing along the Brandywine, the Howard Young Correctional Institution, and portions of the Hay Road Power Complex. The Amtrak maintenance facility is not projected to be persistently inundated but is currently, and will increasingly be, threatened by storm surge and is already in the 100-year and 500-year floodplains.
Sea level rise threatens the future of vital salt marsh habitat throughout major estuaries in the northeast like the Chesapeake and the Delaware with studies predicting 20% to 90% total wetland loss. The Mid-Atlantic in particular is experiencing sea level rise at a faster rate than the rest of the country due to land subsidence. Furthermore, Delaware is the lowest state in the United States, with almost a quarter of the land area in the state designated as wetlands. When the seas rise, where will these marsh go? Cherry Island has the potential to host substantially more marsh habitat than it currently does and can be designed to allow for successful migration of mashes in the future.

Data and other materials analyzed for this project include historical topographic maps, histories and ethnographies of the Wilmington area, geology and soils, land cover and land use, transportation networks, flora and fauna comprising persisting ecosystems, and state and federal policies that interface with infrastructure and environment in the region.
 Industrial Landscapes of the Delaware Bay
Marsh Resilience to Sea Level Rise in the Delaware Bay
Industrial Landscapes of the Delaware Bay
Marsh Resilience to Sea Level Rise in the Delaware Bay
Site Analysis
The analysis for this project began through investigations of historical USGS topographic maps, which trace the disappearnace of Cherry Island Marsh as Shellpot Creek was rerouted and the area was diked and developed. Further analysis included site visits as well examining the presence of existing wetlands, land ownership, and predicted sea level rise impacts in a four feet rise scenario, estimated to occur between 2070 and 2100.


Several section drawings were produced to better understand the topography and the interaction between infrastructure and land cover.

Proposed Interventions
The analysis led to the development of several site interventions that restore hydrologic and ecosystem connectivity, while planning for a future where people can visit and engage with the site. Removal of noxious land uses in the historic creek path and the re-establishment of Shellpot Creek are the first interventions proposed. The construction of a porous freeway base under I-495 and the elevation of the freight rail yard and lines allow for habitat connectivity and increased resilience for these assets. Subsequent land bridges built over the freeway allow for safer relationship between wildlife and vehicles and additional habitat connection.
These proposals are replicable at other sites that are situated near shorlines where transit infrastructure faces flood vulnerability and has displaced habitat and ecosystems. Funding through BIL programs such as PROTECT and the Wildlife Crossings Pilot Program specifically targets interventions such as those included in this project.

Biomaterial Used In Infrastructure Construction


Kinetic Bio-Bench
A Manifesto for Place: Transportation and Ecology along the Philadelphia-Baltimore Megaregion
 by Riddhi Batra
The Journey From Philadelphia to Baltimore is Skewed Towards Automobiles
total annual trips
land ethics, and megaregional research from CM2 and the University of Pennsylvania. It uses data from the US Census Bureau and National Household Travel Survey.
The Amtrak Northeast Corridor has faced more than $120 million of losses from 2006-2019 due to flooding, landslides, increased heat, and wildfires. Furthermore, incentivized by federal policies and private lobbies, the private automobile remains the cheapest and quickest option for travel between Philadelphia and Baltimore.
PHILADELPHIA TO BALTIMORE IS SKEWED TOWARDS AUTOMOBILES
Amtrak Bus Regional Rail Car (P) 1h 14m / $84 (P) 2h 10m / $30 (P) 3h 30m / $20 (P) 2h 30m / $18 (O) 1h 07m / $43 (O) 1h 50m / $30 (O) 3h 27m / $18 (O) 1h 50m / $18 2.2% 97.2% 6 million total annual trips trips by car trips by rail 0 5 10 15 20 Miles Total trips with destinations as Philadelphia or Baltimore Trips between Philadelphia and Baltimore ORIGIN-DESTINATION FLOWS BY NHTS ZONE 33,765,450 - 343,309,775 343,309,775 - 1,245,552,990 1,245,552,990 - 3,502,709,360 3,502,709,360 - 6,009,189,280 Total Annual Trips
Regional Rail Car (P) 3h 30m / $20 (P) 2h 30m / $18 (O) 3h 27m / $18 (O) 1h 50m / $18
by car
by rail 0 5 10 15 20 Miles Total trips with destinations as Philadelphia or Baltimore Trips between Philadelphia and Baltimore ORIGIN-DESTINATION FLOWS BY NHTS ZONE 33,765,450 - 343,309,775 343,309,775 - 1,245,552,990 1,245,552,990 - 3,502,709,360 3,502,709,360 - 6,009,189,280 Total Annual Trips
trips
trips
The Regional Rail Gap: Newark DE to Perryville, MD

For a person taking Regional Rail, the journey from Philadelphia to Baltimore has 4 parts:


• SEPTA train from Philadelphia to Newark
• DART bus till Elkton
• Cecil County Bus till Perryville
• MARC train to Baltimore
Along this Corridor, 2 transit agencies provide regional service- the Southeast Pennsylvania Transportation Authority (SEPTA) and Maryland Area Rail Commuter (MARC), and 3 MPO’s are in-charge of transportation investment planning - the Delaware Valley Regional Planning Commission (DVRPC), Baltimore Metropolitan Council (BMC), and Wilmington Area Planning Council (WILMAPCO).
Right-of-Way is owned by Amtrak, CSX, and Norfolk Southern, and leased to regional transit agencies. SEPTA and DelDOT / WILMAPCO have an agreement for SEPTA’s operations of the Wilmington Line in Delaware.
Existing Plans and Opportunities
How Can We Close This Gap?


1
2
An “Econological” Cost-Benefit Analysis Climate Change Vulnerabilities in Scenarios 1 and 2 SECTION THROUGH AMTRAK NEC AT LITTLE ELK CREEK, ELKTON, MD -3 TO +22 FT LITTLE ELK CREEK OTTER POINT CECIL COUNTY YMCA INCREASED WATER LEVELS WITH 4’ SLR 80 FT AMTRAK NEC TRACKS ELEVATION: 22 FT SECTION THROUGH AMTRAK NEC NEAR ROUTE 40, ELKTON, MD 22 TO 32 FT THIN PATCHES OF FORESTED LAND PUROCLEAN OF ELKTON FOOD PROCESSING PLANTS / DRIVING SCHOOL / SPORTS ACADEMIES 80 FT AMTRAK NEC TRACKS The Coastal Squeeze Critical Marsh Habitat Migration Impedance in Scenarios 1 and 2 ELEVATION: 32 FT
SECTION THROUGH CSX FREIGHT RAIL LINES, ELKTON, MD 100 TO 150 FT FORESTED LAND FORESTED + AGRICULTURAL LAND AGRICULTURAL LAND 50 FT CSX FREIGHT TRACKS ELEVATION: 150 FT
Continue Regional Rail Along Northeast Corridor
SCENARIO
SCENARIO
SCENARIO 3
Scenario 3 Shift RR to Freight Line
No Action Alternative
Shift Rail Operations to Parallel Frieght Rail Tracks
Rather than conforming to a rigid form of collaboration that is typically seen in a studio, where the professor assigns people to discrete teams and sites, we spent the second half of the semester free to collaborate how we wished. This encouraged a variety in modes of collaboration and allowed people to be more experimental in the projects they were involved in. The results of this freedom was evidenced in the wide range and scope of projects that emerged and relationships that people formed in the studio.
While we can never fully capture what it was like to be immersed in the studio, hopefully the fragments shared in this book have helped you get closer to what it was like to be there.
Lead Designer, Writer and Editor
Nicole Cheng
Designer(s) and Writer(s)
Zoe Kerrich and Ben Regozin
Bookbinder(s)
Nicole Cheng and Ben Regozin
Special Thanks to Weitzman School of Design Staff

Eric Barratta, Patrick Bransfield, Kate Daniel, Kaitlin Mosley and Joshua Zerangue
Charrette Participants, Reviewers and Baltimore Trip Participants
Ethan Abbott
Eugenie Birch
David Bramble
Jared Brey
Donzell Brown
Dan Campo
Julie Donofrio
Lee Farmer
Chris Feinman
Billy Fleming
Kelly Fleming
Jamaal Green
Erick Guerra
Renee Hamidi
Sharon Hayes
Mike Kelly
Kim Lane
Thabo Lenneiye
Laurel McSherry
Mike Middleton
Josh Neiman
Rashida Ng
Brad Rogers
Christopher Streb
Sarai Williams
Bob Yaro
Cooperative Mobility for Competitive Megaregions (CM2)
U.S. Department of Transportation-supported research consortium
University of Texas at Austin, University of Pennsylvania, Texas Southern University, Louisiana State University
Rebecca Popowsky
Frederick Steiner
Cover images courtesy of Rebecca Ropowsky, Riddhi Batra and Eric Sucar.
