
“It’s no coincidence that ‘aspiration’ means both hope and the act of breathing. When we speak, we use the breath in our lungs to give our thoughts a physical form. The sounds we make are simultaneously our intentions and our life force.”
—from Exhalation by Ted Chiang

2
PANORAMA 2024
Welcome to the 32nd edition of Panorama!
Panorama is a curation of work from students of the Department of City and Regional Planning at the University of Pennsylvania’s Weitzman School of Design. In this year’s edition of Panorama, we want to ask the question, “What’s in a future?” Who takes stock of the present and shapes change? What ideas and images move us forward?
As planners, preservationists, designers, and urbanists, we find ourselves studying the past with our eyes on the future. Panorama features student work that grapples with this condition by exploring topics and offering recommendations on local and global scales. Through writing, map making, and design, students explore topics such as affordable housing policy, free speech on public transit, Urban Outfitter’s use of the phrase “urban renewal,” federal energy policy, and much, much more.
Panorama 2024 also features studio work from the Weitzman School’s Fall ’23 semester, including recommendations for Philadelphia’s summer of 2026, when the city will host games for the FIFA World Cup, the MLB All Star Game, and the nation’s 250th anniversary celebration; strategic planning for the intersection of land use and mass transit in Bogota, Columbia; urban design for climate resiliency in St. Croix, U.S. Virgin Islands; and design for equity and trauma informed planning at West Philadelphia’s Sayre High School.
This edition of Panorama aims to open dialogue about the critical issues that all of us, planners or not, witness in our everyday lives, be it social inequity, housing crises, underfunded transit systems, or accelerating climate change. The future of planning is shaped when we share our work, have open conversations, and move forward together. We have thoroughly enjoyed bringing together this edition of Panorama and we hope that when you turn the last page, you feel challenged, informed, and hopeful for our future.
With hope, and in solidarity,
Dr. Lisa Servon
Kevin
and
Erica
Penn Presidental Professor and Chair of the City & Regional Planning Department
Bailey Bradford
Katie Hanford
Revathi V. Machan
Claudia Schreier
Jeff Tseng
Jonathan Zisk
Panorama Editorial Staff
WHAT’S IN A FUTURE?
3
Meet the Panorama 2024 Editoral Team

Katie Hanford, Copy Editor
Bailey Bradford, Design Editor
Bailey (he/him) is a second-year Master of City Planning student with a focus in Sustainable Infrastructure and Transportation Planning. He is passionate about the role of transportation accessibility and equity in building safe, climate-resilient, and vibrant communities. Prior to becoming a graduate student, he developed paid digital media campaigns for clients such as the Georgia Democratic Party and Voto Latino. When not browsing bus network maps, he is probably deep in a new dinner recipe or playing Beyoncé’s Renaissance on loop.
Katie is a second-year Master of City Planning student concentrating in Housing, Community and Economic Development. After studying anthropology as an undergraduate, Katie worked for a few years in the nonprofit sector, focusing on youth development and community support. Katie is interested in the intersection of culture, power, and community-led design, specifically how communities come together to create urban space that fits their needs. When not people-watching, Katie spends her time playing/listening to all things heavy, watching ‘90s romcoms and finding the best food and drink deals Philly has to offer.


Revathi V. Machan, Content Editor
Revathi (she/her) is a first year Master of City Planning student concentrating in Housing, Community, and Economic Development. Prior to coming to Penn, she studied landscape design and environmental policy. Currently she is exploring the intersection of data and design to drive connection between communities through human-centered infrastructure and greener public spaces. When not lost between lines of code and/ or plans, you can find her working on tattoo commissions, upcycling her clothes (or wrecking them—depending on your perspective), and exploring new places in the city.
4


Jeff Tseng, Design Editor
Claudia Schreier, Copy Editor
Claudia (she/her) is a first-year Master of City Planning student with a focus in Smart Cities. Prior to coming to Penn, she worked in the clean tech and coastal resilience fields. Claudia is passionate about emerging technologies that promote equity and sustainability in the city. She holds a BS in Oceanography from the University of Delaware (Go Blue Hens!). Outside of school, Claudia is slowly completing her mission to enjoy a cold brew at every independent coffee shop in Philadelphia.
Jeffery is a first-year Master of City Planning student concentrating in urban design and pursuing a certificate in Real Estate Design and Development at the Wharton School. He is an aspiring urban designer, landscape architect, planner, and future developer aiming to enhance the quality of life and connection between people and the environment in the public realm. He hopes that through sustainable design and development, we can combat the environmental impacts and injustices experienced by contemporary urbanism. When he’s not worrying about real-world problems, you can find him at the Penn gym playing pickup basketball with his mates.

Jonathan Zisk, Content Editor

Jonathan is a second-year Master of City Planning student concentrating in sustainable transportation and infrastructure planning. He comes to Penn with experience working at the School District of Philadelphia and at Philadelphia’s Office of Community Empowerment and Opportunity. Jonathan has an English degree from Reed College in Portland Oregon and also attended Deep Springs College in California. He believes that cities are remarkable spaces for sustainable and equitable life and wants Chestnut and Walnut Streets to be permanently closed to cars. If you have any questions, you can find him in Clark Park at 6:30pm every Wednesday.
IN A FUTURE? PANORAMA 2024
WHAT’S

6 08 Embracing Diversity:“Little ASEANs” in Greater Taipei by Tao Chen 30 What Happens When You Have a Picture of the Entire World? by Jonathan Zisk 80 Absorb, Adapt, Thrive by Elaina Geiger 94 Energizing Progress by Laura Frances 116 Bogotá: Equity & Expansion Fall ‘23 Studio 52 Philadelphia 2026: A Legacy Planning Framework Fall ‘23 Studio 16 Am I Clean Yet? by Revathi V. Machan 38 In Love with the Details by Brianna Belo 88 Flooding in Ghana’s Volta Region by Sylvanus Narh Duamor 108 Corredores Viales & Fare Capping by Leo Wagner 130 Between Data & Experience by Alexa Ringer 72 Stabilizing a City through Seed by Bakari Clark Table of Contents
WHAT’S IN A FUTURE? 7 PANORAMA 2024 142 Stop Requested by S. Amos 156 Navigating Smart City Pilots by Emmy Park & Laura Frances 202 A Place for All? by Katie Hanford 216 Industrial Legacies & Open Space by Junyi Yang 228 Tu fu, an exile in Berlin by Nissim Leibovitz 170 Climate Resiliency in the U.S. Virgin Islands Fall ‘23 Studio 144 Free Speech in Transit by Leah Martins-Krasner 164 Echoes of Bias by Shuai Wang 214 Left Foot, Right Foot by Revathi V. Machan 220 Sayre High School Fall ‘23 Studio 230 Urban Renewal: “What’s in a Name?” by Claudia Schreier 190 Staring Down Speculators by Elam Boockvar-Klein
Diversity Embracing
 by Tao Chen
“Little ASEANs” in Greater Taipei
by Tao Chen
“Little ASEANs” in Greater Taipei
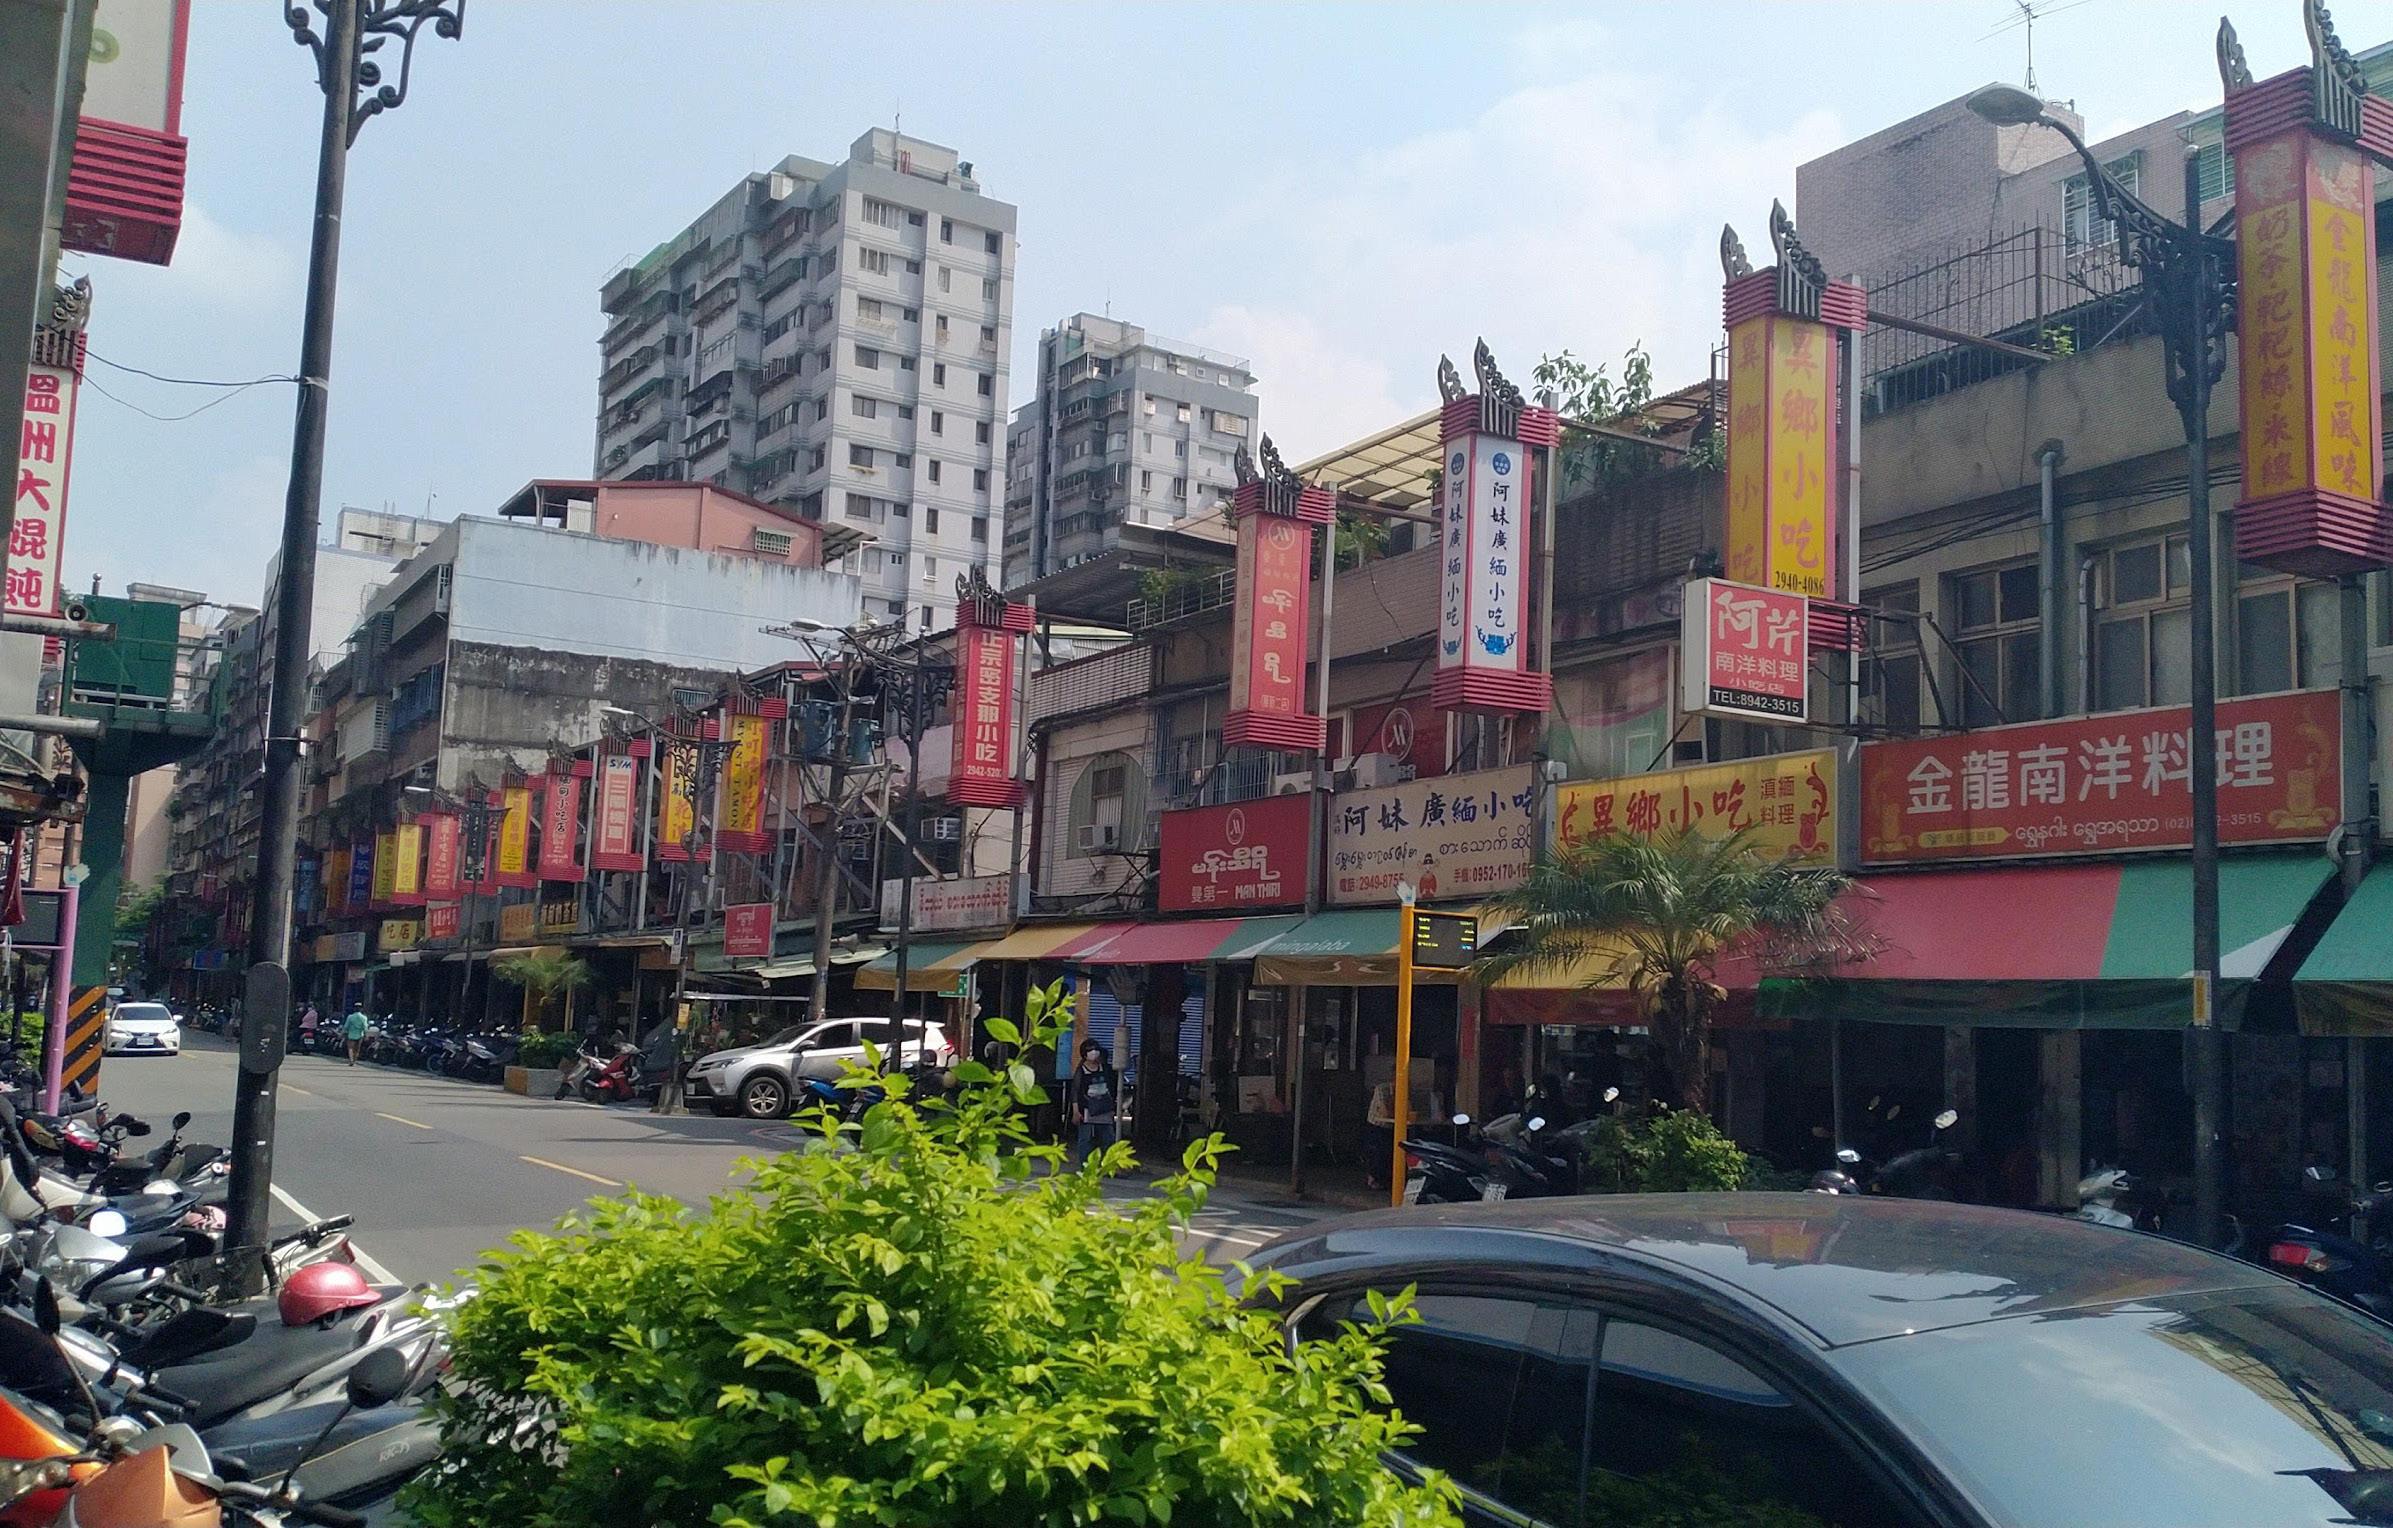
The tapestry of Taiwan’s cultural and urban landscapes is in a state of profound transformation. The growing presence of Southeast Asian communities and the government’s encouragement of inclusivity contrasts with historical efforts by the post-World War II occupying regime to impose a homogeneous “Chineseness.” 1 The emerging Southeast Asian communities challenge traditional Confucian-Taoist-Buddhist paradigms and are prompting Taiwanese society to reevaluate the perceived monoethnic environment entrenched during decades of Kuomintang (KMT) rule. Nowhere is this metamorphosis more evident than in the vibrant “Little ASEANs”2 that have flourished throughout Greater Taipei, reshaping both the physical urban landscape and bringing new vitality into neighborhoods.
Much like Chinatowns and Asian Strip Malls in the US, the presence of Southeast Asian establishments such as stores, restaurants, churches, and services in Greater Taipei offer a comforting sense of familiarity and cultural affirmation for different diaspora groups.3 They serve as a home away from home to the growing diaspora population, catering to the diverse needs and desires of their clientele. These services are particularly important in the context of Taiwan’s aging (and shrinking) population and the reluctance of Taiwanese youth to engage in certain sectors like manufacturing and caregiving.4
...emerging Southeast Asian communities challenge traditional Confucian-Taoist-Buddhist paradigms and are prompting Taiwanese society to reevaluate the perceived monoethnic environment...
During my visit to Mie Ayam Indostar, a modest eatery near Taoyuan Station (a city just southwest of Taipei), the often bustling crowds of Javanese factory workers and caregivers for Taiwan’s rapidly aging population were noticeably absent on a quiet Thursday afternoon. Run by a lovely mother-son duo, this establishment represents a part of Taiwan’s burgeoning “new resident” (新住民) population, a term encompassing foreign spouses, migrant workers, and their children, who have embraced Taiwan as their home.
Mie Ayam Indostar offers a straightforward menu, albeit at relatively higher prices compared to the norm in Taiwan (where a typical bento box would cost less than $100 TWD, or $3.25 USD). Nonetheless, customers appreciate the authentic flavors and warm atmosphere when they visit after work, as evidenced from glowing reviews on platforms like Google Maps5 and
IN A FUTURE?
WHAT’S
9 PANORAMA 2024
TikTok.6 The addition of a grocery section at the back further enhances the restaurant’s appeal, providing aa sense of home for Indonesians longing for familiar products.
While Mie Ayam Indostar primarily caters to the Indonesian community, the restaurant also strives to reach out to Taiwanese customers. With the rise of online food influencers and the convenience of delivery apps like UberEats, more and more Taiwanese locals are showing interest in exploring the rich flavors right in their own neighborhood. Over at Cres-Art Philippine Cuisine in Taipei’s “Little Manila” within Zhongshan District, Imelda, the owner, shared with me how she has seen a growing number of Taiwanese patrons keen on indulging in Filipino delicacies. As I savored my halo-halo (a Filipino cold dessert), Imelda also mentioned the necessity to diversify her customer base, especially as an increasing number of Filipino workers seek employment in the regions south of Taipei.
These “Little ASEAN” areas and their culinary establishments not only help different diaspora groups maintain their identities, but also foster the formation of new ones. Just like Asian malls in the United States that foster a sense of “Pan-Asian” Asian-American identity where diverse backgrounds
10 EMBRACING DIVERSITY: “LITTLE
GREATER TAIPEI
Little Myanmar, or Nanyang Sightseeing Food Street in Zhonghe District, New Taipei (photo by Tao Chen)
ASEANS” IN

converge, Little ASEANs have played a similar role for Taiwan’s “New Immigrants.” This is especially evident in the grocery stores and other services found within these communities, where offerings transcend Southeast Asian boundaries, including goods from Vietnam, Indonesia, the Philippines, Thailand. Additionally, remittance-sending and package delivery services cater to the needs of the diverse Southeast Asian countries represented.
Little ASEANs serve as a powerful reminder that vibrant communities do not emerge in isolation but are the result of a complex interplay of historic dynamics and deliberate policies implemented by various levels of government. The establishment of Taipei’s Little Manila, for instance, can be traced back to the founding of St. Christopher’s Church by American parishioners, which held the distinction of being the sole English-speaking Catholic church in Taipei for many decades. This unique institution acted as a magnet for the Filipino community, creating a nurturing environment that fostered a strong support network and provided a sacred space where cultural and religious practices could thrive and be preserved.7
Similarly, the presence of “Little Myanmar” in New Taipei’s Zhonghe district and the significant Burmese-Thai community in Taoyuan’s Longgang district can be attributed to the historical ties between the KMT and northern Myanmar and Thailand. Following their defeat in the Chinese Civil War, thousands of KMT troops crossed the border from the southwestern Chinese province of Yunnan and seized control of the northern Burmese provinces.
WHAT’S IN A FUTURE?
11
2024
English and Tagalog signs at the King Wan Wan Shopping Center (Tao Chen)
PANORAMA

12
Indonesian, Burmese, and Thai items at a grocery store in New Taipei’s “Little Myanmar” (photo by Tao Chen)
EMBRACING DIVERSITY: “LITTLE ASEANS” IN GREATER TAIPEI
There, they sustained themselves through the opium trade and laid the foundation for what would later become known as the Golden Triangle. After being evacuated in 1960 to Taiwan, these soldiers and their families were resettled in Zhonghe and Longgang, where their unique heritage and experiences continue to shape the fabric of these communities.8
These days, Southeast Asian stores are seamlessly integrated into the urban fabric of Taipei, in many cases extending beyond designated “Little ASEAN” areas. Near Taipei Main Station, at the western end of the underground Taipei City Mall,9 an array of Indonesian restaurants, telecom services, and grocery stores has flourished, even outnumbering Taiwanese establishments in the vicinity. This “Indonesia Street” has helped reinvigorate an otherwise struggling mall.
Moreover, malls like the King Wan Wan Shopping Center in Zhongshan District have transformed into thriving business hubs for diverse Southeast
These communities epitomize resilience, adaptability, and extraordinary journeys.
Asian communities, empowering Taipei’s Filipino community in the face of persistent challenges of migrant worker discrimination and racism.10 The increasing popularity of Vietnamese cuisine has led to the proliferation of Vietnamese restaurants and food carts throughout Taiwan, reflecting both the significant Vietnamese community and the growing Taiwanese appreciation for the flavors of Vietnam. So much so, even FamilyMart, a Japanese convenience store chain with over 3,600 locations in Taiwan (second only to 7-Eleven’s 6,500), has recently introduced a dedicated “Southeast Asian” section to cater to the diverse tastes and preferences of its customers.11
The Little ASEANs of Greater Taipei illuminate the historical forces shaping social and cultural landscapes. These communities epitomize resilience, adaptability, and extraordinary journeys. It is crucial to recognize the deliberate policies and historical ties that underpin their formation. Policymakers globally should prioritize embracing and supporting diverse communities, respecting and celebrating their unique needs, aspirations, and cultural identities. Moreover, it is essential to acknowledge and cater to the distinct groups within diaspora communities to ensure that their individual needs are fully met. The presence of Little ASEANs in Greater Taipei stands as a testament to the transformative power of embracing diversity, challenging traditional notions of identity, and offering invaluable lessons to policymakers worldwide, spanning all levels.
A FUTURE?
WHAT’S IN
13
PANORAMA 2024
Endnotes
1 Karvelyte, Kristina. 2022. “The Chineseness of Urban Cultural Policy in Taiwan.” Asian Studies Review 168-185.
2 The Association of Southeast Asian Nations
3 Lung-Amam, Willow S. 2017. “Mainstreaming the Asian Mall.” In Trespassers?: Asian Americans and the Battle for Suburbia, by Willow S. Lung-Amam, 98-137. Berkeley: University of California Press, p. 99
4 Hsueh, James C T. “Taiwan Heading into Its Super-Aged Era.” East Asia Forum, March 4, 2023.
5 Mie Ayam Indostar · Yanping Rd, Taoyuan District, Taoyuan City, Taiwan 330.
6 TikTok. “X I N L IIDTW on TikTok.” Accessed February 22, 2024. https://www.tiktok. com/@xinli_78/video/7224862354352246022.
7 Lin, Eric. 1999. Taipei’s “Little Philippines” St. Christopher’s Catholic Church. December. Accessed February 19, 2024.
8 阿美米干(A-Mei Migan). n.d. 異域孤軍大事記 (Major Events of the Lonely Army in a Foreign Land). Accessed February 20, 2024. https://amay.com.tw/about/ourheritage/.
9 One of many underground malls linking metro stations in Taipei
10 Lin, Yumei. “Southeast Asian Migrant Workers in Taiwan: Human Rights and Soft Power | New Perspectives on Asia | CSIS,” September 28, 2023.
11 陳立儀 (Li-Yi Chen). 2023. 首波40店搶先開賣!全家便利商店南洋酸辣燙「馬 尚煮」強勢登台 冬蔭功湯+10款海味食材自由配 (“First Wave of 40 Stores Launch Sales! FamilyMart Introduce Southeast Asian Spicy Hot Pot ‘Tom Yummy’ - Tom Yam Kung + 10 Seafood Ingredients for Customization”). United Daily News. November 8. Accessed February 22, 2024.

About the Author
Tao Chen is a Master of City Planning candidate at the University of Pennsylvania’s Stuart Weitzman School of Design, concentrating in housing, community, and economic development. His primary interest lies in the intersection of climate resilience, global development, and post-conflict recovery.
14 EMBRACING
GREATER TAIPEI
DIVERSITY: “LITTLE ASEANS” IN

WHAT’S IN A FUTURE?
15 PANORAMA 2024
A bowl of mie ayam bakso (Indonesian noodles with diced chicken and beef meatballs) at the aptly named Mie Ayam Indostar near Taoyuan Station (photo by Tao Chen)
Am I Clean Yet?
Perceptions of Sanitation and Cleanliness in Colonial Systems
 by Revathi V. Machan
Cleanliness is next to godliness, or so they say. In a post-pandemic era, where hand sanitizer is our holy water, and Clorox wipes our sacrament, there has been a renewed effort to build cleaner cities. Beneath these seemingly noble intentions, however, lurks a dark history rooted in racial prejudice and social control that has codified our urban planning ideologies. Exploring the intertwined history of sanitation and planning, this piece delves into the story of how sanitary reform reshaped not only our cities but also our perceptions of cleanliness, citizenship, and belonging.
Let’s start at the beginning (of urban planning). Sanitary reform essentially birthed urban planning, making sanitation theorists the first iteration of urban planners. The concept was a byproduct of the Industrial Revolution and the rapid growth it brought to cities with no regulations for sewerage, housing, water systems, and other aspects of public health. When people are packed together like sardines in poorly constructed buildings with no established sanitation systems, diseases, such as tuberculosis and cholera, like to run rampant.1 And death generally follows.
Enter, the filth theory – the idea that filthy physical conditions associated with the urban informal settlements fostered diseases. 2 At the time, it was also believed that poor living conditions created individuals of poor constitution, i.e., the poor, the sickly, and the disabled suffered those conditions because of the physical environments they lived in. European health officials took this unique opportunity to remove a city of all its ills – physical and social – through spatial reorganization. This particular concept refers to a collection of different practices that would sanitize an area of physical congestion and environmental ills by removing informal settlements, creating a grid street system, and establishing waste management practices.3 After all, it’s much easier to sanitize a city than it is to tackle systemic inequalities, right? So, off the sanitationists went, clearing out those pesky informal settlements and creating grid street systems like some sort of urban Marie Kondo, tidying up our cities one eviction at a time. This implementation of sanitary measures spatially cleansed history, systems, and power. And by proxy, cleansed people of their cultures, identity, and agency.
“This implementation of sanitary measures spatially cleansed history, systems, and power. And by proxy, cleansed people of their cultures, identity, and agency.”
IN A FUTURE?
WHAT’S
17 PANORAMA 2024
“Cleaning” the Colonies
The Progressive Movement entered the scene shortly after the filth theory era, sweeping across Europe and the Americas in the early 1900s. Orderly and efficient planning principles based on the “scientific” principles of sanitation were believed to be the most efficient way to cure all physical and social ills. In spaces already established like Europe and the U.S., there was a lack of opportunity to put these theories into practice. Although there were still areas of Europe that underwent demolition and reconstruction, like Paris and Manchester, these changes paled in comparison to those implemented in the colonies. Sanitation theory maintained that a limited physical space caused social ills in a population – if you were white and living in Paris. In colonies, it was a different story. It was believed that the only way to manage the “cesspools of filth” was to sanitize the lands, in which “sanitizing” meant completely destroying and “lands” meant the settlements of the poor, minorities, or colonized (which in a colony means all of the settlements). Colonial cities were “laboratories” for much more extreme versions of sanitary reform,4 but also stages for shows of socio-political and economic power over colonized populations.5 As is standard to colonization lore – these demonstrations of colonial power and sanitary environments were rooted in racist ideologies.
Colonists developed the delightful notion that people of color were considered inherently dirty because of any variance that othered them –different waste management practices, resource distribution systems, and spatial organizations. In fact, colonists that entered tropical territories would often “[turn] their new tropical frontier into a desolate human-waste land, imagining everything “brownwashed” with a thin film of germs.”6 Lovely. All these variances were in one way or another inferior to the systems that had been developed by the colonists. The systems that existed in colonial cities were simply different from what Europeans had established in their cities, such as the grid streets in Paris7 and sewer system in London.8 No matter how well-built any of the native systems were, their status as “other” belittled them and sullied them in the eyes of colonizers. Of course, this demanded colonial interference to civilize and cleanse those systems.
Colonial Interference Strategies
Strategy #1: Demolition
In Delhi, colonial officials tore down nearly three-fourths of the city to remove the “[congested area’s] evil influence upon civilized society.”9 What was really removed were spatially established social systems for markets, healthcare, and sanitation. These clearances were meticulously regulated,
18 AM I CLEAN YET?
observed, and calculated, but were determined entirely by colonial administration. The demolitions did offer a solution to the health and safety concerns of the city, but the lack of distinction between areas of disease and areas that presented political challenges (rebellions and disloyal factions) is telling of the true purpose - to establish dominance over the Delhiites.10 Because nothing says civilization like destroying indigenous systems and imposing your own, right?
Strategy #2: Preservation
When the French colonized Morocco in 1912, Protectorate Hubert Lyautey wanted to develop the colonizers’ settlements around the established city. “The vulnerable, formalized bodies of the American colonialists demanded sanitary quarantine.” 11 The French quite literally drew lines in the sand between their new establishments and local settlements, tastefully referred to as “sanitary corridors.” 12 All of the “dirty” Moroccans were clustered together away from the development and technology that the French brought into Morocco – but only for sanitary reasons.13 Black Moroccans could and were encouraged to live within the white settlements but only if they assimilated wholly to the French ideologies and culture. Of course this was just an option and Moroccans could make their own choices. I guess “preservation” and sugar-coated assimilation tactics also say civilization.
Though colonialism was implemented differently across the world, one of the main recurring themes was that colonizers were entering dirty, congested, unplanned spaces that were directly due to the nature of the natives. I’m not sure if you, my Reader, are aware of the basic tenets of statistics, but let me inform you. Cause and correlation are not the same thing. Whether or not colonizers knew this, they didn’t care. Their main goals was to establish power and control in these spaces, using whatever guise they could use.
The violent spatial reorganization14 and the establishment of a racial hierarchy reinforced ideas of social differentiation and segregation between the Indians and the British.15 The system of preservation in Morocco established segregation and hierarchies where Europeans obtained infrastructural benefits in the name of creating a safe, hygienic space for themselves. Through many similar repeated processes across the world, sanitary reform took the ideology of “race is tied to cleanliness” and institutionalized it. Creating a clear precedent “based in science” for all those who came after to refer to as a blueprint for colonization and urbanization.
Immigration to the U.S.
Apart from the legal codification of sanitary reform, the idea of race being dirty became codified into the identities of many colonized cultures over
WHAT’S IN A FUTURE?
19 PANORAMA 2024

time. Cleanliness wasn’t just next to godliness, but also next to whiteness. The way sanitary reform was implemented blurred the lines of what was being sanitized. It wasn’t just the physical environment or lived practices that were dirty. Every group that looked different from the ruling class began to hold a warning sign of being filthy. Minorities were considered sullied by the act of existing. The connotation of their unrefined, and irrational, and uncivilized ways followed their identity regardless of where they went, especially in their immigration to the United States. As people of color began migrating to the U.S, one thing was made clear: the only way to address this dirtiness was to assimilate completely to Western (read: white) ideologies or forever be marked as dirty, uncivilized, and unworthy. This was seen throughout the entire immigration process, from before an immigrant even stepped into the country all the way to several generations of assimilation later.
Before an Immigrant Even Stepped into the U.S.
The 1880’s saw a dramatic increase in the number of immigrants arriving on U.S. shores.16 People were coming from all corners of the globe for
20 AM I CLEAN YET?
“Bracero workers being fumigated at Hidalgo Processing Center,” photograph by Leonard Nadel, Texas, 1956. Smithsonian Museum of American History.
the land of opportunity and fresh starts. If those immigrants had been able to get those opportunities as easily as I was able to write that sentence, we could’ve ended the paper here. Alas.
The federal government established a law around then that required immigrants to undergo medical examinations by U.S. Public Health Service (PHS) medical officers.17 The goal here was “to prevent loathsome or dangerous contagious disease” from entering the country by conducting these inspections – a goal established by the federal agency.18 The goal interpreted by PHS officers on the ground was “to prevent the entrance of undesirable people –those ‘who would not make good citizens.’” 19 Of course, the inherent goodness of an individual is easily and immediately visible to a racially-biased, officious government official. Naturally, the origin of the immigrant would determine how violating the medical inspection would be. Standard procedure would dictate that the PHS physician would conduct a visual check of prospective immigrants to find any obvious physical signs of physical or mental illness. 20
Non-Europeans (Latin American and Asian immigrants) faced many more medical obstacles to gain entry. 21 Stripped, showered, disinfected, searched for lice. At some immigration stations, Mexican immigrants would be required to strip naked, bathe, and then be sprayed with gasoline or other pesticides (sometimes containing DDT) to kill lice before they even underwent the physical examination. 22 You know how it is, get fumigated to get initiated— the real motto of the PHS. DDT, by the way, is the pesticide that was nationally banned in 1972 because it was so toxic and persistent in the environment that it was killing off the bald eagles. Also a known carcinogen. Migrant workers who commuted across the border as part of the 1943 Bracero Program for their work were subject to this kind of treatment daily. 23 Sanitation became a violating and necessary part of assimilation.
After an Immigrant Stepped into the U.S.
Cleanness being the only way to enter and assimilate to the country was hammered in early on and quickly became an involuntarily accepted condition of many different immigrant cultures in the U.S. The large waves of immigration sparked much fear in U.S. nativists – who could’ve guessed. 24 Immigrants either had to assimilate, repent, or be punished. Assimilate
German Jewish immigrants who arrived in the early 1800s spent decades seeking respectability by Americanizing their self-image. The construction of their synagogues – the most noticeable representation of the community – exhibited more Christian and cruciform qualities over time. And as their architecture assimilated to the surrounding community, so did their
IN A FUTURE?
WHAT’S
21 PANORAMA 2024
congregations. Traditional practices like chanting, praying in German vernacular, and participatory congregations evolved into singing hymns, praying in English, and observer-based congregations – reformed to Protestant practices of worship. 25 German Jews not only Americanized themselves, but they also distanced themselves from orthodox Russian Jews that entered the U.S. in the 1900s. The “distinctive language, un-American appearance, and ‘backward ways’” of the Russian Jews created a divide formed by the inherited ideology that refusing to assimilate was a threat to the community. 26
Repent
Hindu and Indian immigrants that moved into San Francisco in the early 1900s were simply considered “culturally ‘unassimilable,’” a condition that was determined by a discrete and profound analysis of their homeland: “a land under a ... threefold curse that of the caste system, of gaunt-eyed famine, and of poison-breathing plague.”27 Maybe I can put down “descendent of land cursed threefold” on my Hinge profile as my fun fact. Accusations like this weren’t always disputed by the community. In public newsletters, some Indians acknowledged the “backwardness and superstitions” that had become ingrained into the Hindu culture through British colonization. 28 These traits were accepted as truth - not a fault of their own but something to be ashamed about regardless. The public nature of these admissions was another indicator of the level of their penitence – maybe if they bowed their head enough in apology, the Americans would look right past them and allow them to exist peacefully.
Punished
“Immigrants and minority communities have long been stigmatized as “dirty,” perpetuating discrimination in policies from immigration to housing. Understanding these issues’ roots is key to building truly clean, equitable, and inclusive cities.”
Chinese immigrants who entered the U.S. in the late 1800s often congregated in Chinese-only neighborhoods, using these carved out spaces to hold onto their culture, traditions, and systems – power to them. 29 One of the consequences of this non-assimilation was extreme ostracism. During the third wave of the bubonic plague in the 1900s, entire Chinese communities were quarantined or forcibly inoculated on the basis that their living
22 AM I CLEAN YET?
PANORAMA 2024
WHAT’S IN A FUTURE?
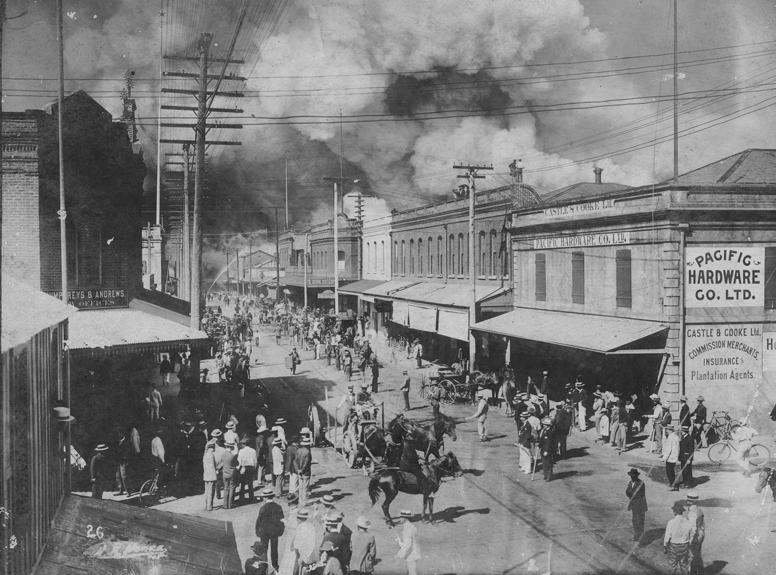
conditions (and inherently them) were dirty, carriers of disease and plague.30 When the first victims of the plague died in Honolulu’s Chinatown, eight entire blocks went under lockdown, trapping 10,000 Chinese, Japanese, and Native Hawaiian people.31 After the first German (white) woman became infected and died, the city’s public health officials decided that even more drastic actions were necessary. They burned down every house in Chinatown that they suspected of harboring victims of the plague.32 The fire burned for 17 days and left 4,500 Chinatown residents homeless.33 Residents of Honolulu’s Chinatown had refused to assimilate or repent for their otherness and were punished for it.

The first step toward lightening the White man’s burden is through teaching the virtues of cleanliness. , 1899. Photograph. (Source: US Library of Congress)

23
Several Generations of Assimilation Later
Throughout U.S. immigration waves, many immigrants faced overcrowded, underfunded living conditions, a recurring theme for immigrant and minority communities. During the peak of tenement housing, immigrants, barred from various neighborhoods, resorted to living together to save money as rents soared due to predatory landlords. In Los Angeles, male Chinese immigrants bunked together to cut costs.34 In NYC, Sicilian immigrants played housing Tetris, fitting four families into a four-bedroom apartment to afford rents consuming 30 to 50% of their incomes.35 Meanwhile, Mexican and Puerto Rican immigrants in Chicago struggled for decent housing, often forced into overcrowded, unsanitary conditions, further policed for their plight.36 This cycle didn’t end with tenement housing’s decline. Cue the American suburbs post-World War II, where government-backed mortgage programs like the Federal Housing Administration (FHA) touted homeownership as a path to prosperity—reserved, of course, for white folks!37 These policies explicitly excluded people of color, perpetuating segregation, and limiting opportunities.38 White families fled to the suburbs faster than you can
24 AM I CLEAN YET?
Fires in Honolulu’s Chinatown (Source: Hawaii State Archives)
say “white flight”, leaving minority and immigrant communities stranded in disinvested, impoverished inner-city neighborhoods.
Notice the parallels between early immigrant struggles and those of later inner-city dwellers, blamed for their living conditions while facing systemic barriers. Ever hear someone criticize a city for being “unclean”? Maybe it’s time to ponder why it’s unclean in the first place.
Today, the legacies of discriminatory housing policies endure, shaping America’s spatial wealth distribution. Communities of color still confront barriers to safe, affordable housing, perpetuating cycles of poverty and segregation reminiscent of past injustices.
So, as we embark on yet another quest to build cleaner cities, let’s not forget the lessons of the past. Cleanliness might be next to godliness, but it’s definitely next to a whole lot of racism and social inequality. The historical connection between sanitation, urban planning, and racial prejudice underscores their enduring legacy today. Sanitary reform has been tainted by racism and social control, reshaping cities to the detriment of marginalized communities. As we strive for healthier cities post-pandemic, we must confront this legacy head-on. Environmental justice, equity planning, and dismantling systemic racism must be at the forefront of urban planning. Immigrants and minority communities have long been stigmatized as “dirty,” perpetuating discrimination in policies from immigration to housing. Understanding these issues’ roots is key to building truly clean, equitable, and inclusive cities.
Endnotes
1 “Causes of Illness and Disease - The Effects of Industrialization.” BBC News. Accessed March 11, 2024.
2 Troen, Ilan. “Urban Reform in Nineteenth Century France, England, and the United States.” Tel Aviv University, 1988, 1-18.
3 Ibid
4 Hosagrahar, Jyoti. “Sanitizing Neighborhoods.” In Indigenous Modernities: Negotiating Architecture and Urbanism, New York: Routledge, 2005. 83-113
5 Njoh, A.J. Urban Planning and Public Health in Africa: Historical, Theoretical and Practical Dimensions of a Continent’s Water and Sanitation Problematic. 1st ed. Routledge, 2012.
6 Anderson, Warwick. “Excremental Colonialism: Public Health and the Poetics of Pollution.” Critical Inquiry 21, no. 3 (1995): 640–69.
7 Chapman, Brian. “Baron Haussmann and the Planning of Paris.” The Town Planning Review 24, no. 3 (1953): 177–92.
8 Otter, Christopher. “Cleansing and Clarifying: Technology and Perception in Nineteenth‐Century London.” Journal of British Studies 43, no. 1 (2004): 40–64.
9 Hosagrahar, Jyoti. “Sanitizing Neighborhoods.”
10 Ibid.
11 Anderson, Warwick. “Excremental Colonialism.”
12 Wright, Gwendolyn. “Tradition in the Service of Modernity: Architecture and Urbanism in French Colonial Policy.” Journal of Modern History (1987): 291-316.
IN A FUTURE?
WHAT’S
25 PANORAMA 2024
Donna. From Sicily to Elizabeth Street: housing and social change among Italian immigrants, 1880-1930. (Texas Tech University, 1984), Chapter 5.
Rodríguez, Alexa. “‘Imperial Circuits’ and the Boundaries of a City: Puerto Rican Migration during the Mid-Twentieth Century,” Journal of Urban History 0, no. 0 (2023).
36 Gioielli, Robert. “The Tyranny of the Map: Rethinking Redlining,” The Metropole, 2022, accessed February 10, 2023.
37 Ibid.
38 Scott Markley, “Federal ‘redlining’ maps: a critical reappraisal,” Urban Studies 61, no. 2 (2023): 195-213.
About the Author

Revathi (she/her) is a first year Master of City Planning student concentrating in Housing, Community, and Economic Development. Prior to coming to Penn, she studied landscape design and environmental policy. Currently she is exploring the intersection of data and design to drive connection between communities through human-centered infrastructure and greener public spaces. When not lost between lines of code and/ or plans, you can find her working on tattoo commissions, upcycling her clothes (or wrecking them – depending on your perspective), and exploring new places in the city.
13 Ibid. 14 Archer, John. “Colonial Suburbs in South Asia, 1700-1850.” In *Visions of Suburbia*, edited by Roger Silverstone, 26-54. London: Routledge, 1997 15 Hosagrahar, Jyoti. “Sanitizing Neighborhoods.” 16 “Medical Examination of Immigrants at Ellis Island.” Journal of Ethics, American Medical Association. Accessed February 26, 2024. 17 Ibid. 18 Ibid. 19 Ibid. 20 Ibid. 21 Ibid. 22 Ibid. 23 Nadel, Leonard. Bracero workers being fumigated at Hidalgo Processing Center. Photograph. Washington DC, 1956. 24 Moffson, Steven. “Identity and Assimilation in Synagogue Architecture in Georgia, 1870-1920.” Perspectives in Vernacular Architecture, 151-165. 25 Ibid. 26 Library of Congress, “Building Communities: Chinese Immigration and the United States Capitol,” Classroom Materials, accessed March 2, 2024. 27 Sen, Arijit. “Architecture and World Making: Production of Sacred Space in San Francisco’s Vedanta Temple.” South Asian History and Culture (2010): 76-102. 28 Ibid. 29 “That Rotten Spot.” Distillations Podcast, Science History Institute. Accessed February 20, 2024. 30 Ibid. 31 Ibid. 32 Ibid. 33 Ibid. 34
Gabaccia,
35
26 AM I CLEAN YET?
27 PANORAMA 2024
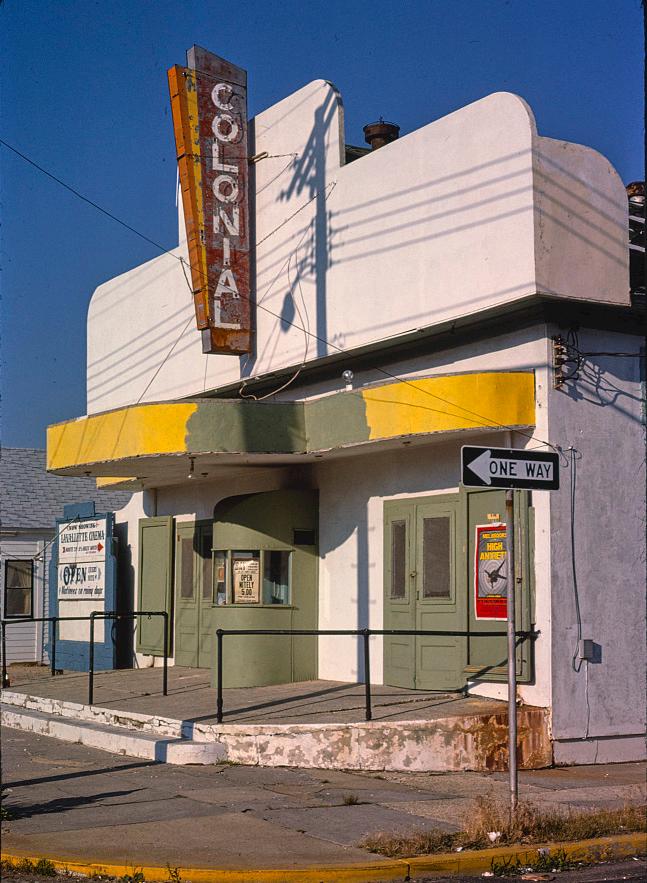
Margolies, John. Colonial Theater, angle 2, Seaside Heights, New Jersey. United States New Jersey Seaside Heights, 1978. Photograph. WHAT’S
IN A FUTURE?
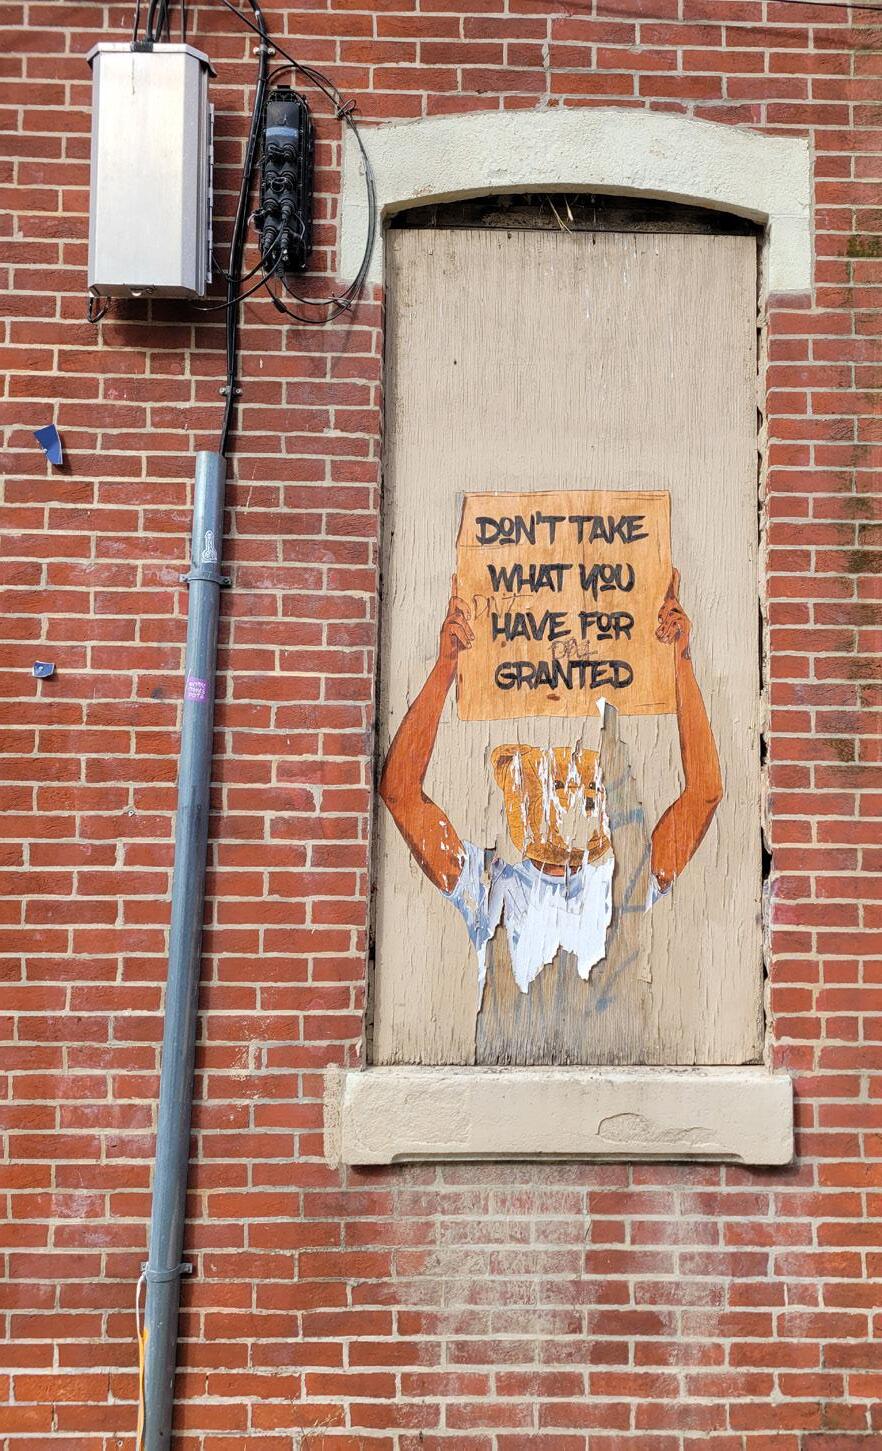
Window to Another World
by Kamya Khandelwal
The artwork depicts an intriguing contrast between the industrial and ethereal in Philadelphia’s Mantua neighborhood. Crafted for a site planning class, this photomontage frames a vibrant sky within the urban structure, hinting at a hidden dimension in the cityscape—a profound reminder of beauty beyond the visible.

About the Author
Kamya is an architect and urban planner with a knack for designing cities that feel like home and playgrounds for the child in everyone. Her tools are a love for design, data, and a keen ear for community needs. Off-duty, you’ll find her immersed in music, expressing life through photography and art, or enjoying a swim. Recently, swing dancing has caught her fancy - life’s all about balance, right? With a deep affection for the sea, I’m eager to merge my design work with marine conservation and climate resilience initiatives down the line.

IN
FUTURE? 29 PANORAMA 2024
WHAT’S
A
What Happens When You Have a Picture of the

Google Streetview, Ed
Ruscha,
and the optics of urban change
Entire World?
by Jonathan Zisk
In 2014, Google subtly introduced a new feature to Streetview: the ability to toggle between different dates of panoramic imagery. The results were nothing short of extraordinary. Via any internet browser, Streetview users could suddenly watch the world change before their eyes. Google’s tweak to their user interface dropped a visual time machine into our laps, and the city planning world has only scratched the surface of this tool’s potential. Streetview’s innovation comes in the form of scale and access. Its panoramic images of streetscapes are more extensive and accessible than any made before, yet follow in the path of conceptual precursors who displayed the power of capturing and recapturing urban panoramas. Ed Ruscha’s Sunset Strip project is preeminent among those. Ruscha made regular panoramas of Los Angeles’ Sunset Boulevard for over 40 years, and in doing so captured the evolution of the street’s changes, from the mundane to the monumental. Ruscha’s Sunset Strip project is an illustration of the potential that Streetview has granted to its millions of daily users, with uses from data mining and machine learning to urbanist activism and gaming. All of these uses are enabled by the trove of information that exists in sharing photographs of our built environment.
An attempt to photograph the world: Google’s temporal streetscapes
Besides a fascination with technical achievement, a curiosity for the world, and Silicon Valley hubris, it is unclear why Google undertook Streetview. Streetview spun out of a Stanford engineering project and began by trying to photograph every street in San Francisco using Google founder Larry Page’s personal car. Early results were merely “interesting,” but didn’t gain internal buy-in until the project was greenlit in 2005 and began development towards becoming a true Google product – the product being offered was a panoramic photograph that covered every road on earth.1
In 2010, Google engineers celebrated the fifth anniversary of the project and explained that “the idea of driving along every street in the world taking pictures of all the buildings and roadsides seemed outlandish at first, but analysis showed that it was within reach of an organized effort at an affordable scale, over a period of years—at least in those parts of the world where political systems make it possible.”2 Google does a poor job of articulating the utility of Streetview. Whether more extensive explanations are for internal use only, or if they go fully unarticulated is unclear. However, Google’s dedication to the project can only be explained by their recognition of the immense potential inherent in having an image from everywhere in the world.
Google Streetview has established a monumental data set of the built WHAT’S IN A
31
FUTURE?
PANORAMA 2024
environment. By the project’s 10th anniversary in 2015, it had taken 220 billion images and driven over 10 million miles across 100 countries.3 Vast swaths of the world are now available for exploration, research, and enjoyment from behind any computer or smartphone.
On top of their already unprecedent services, Streetview’s 2014 inclusion of historical images richened its offerings. In a blog post to announce the change, Google project manager Vinay Shet wrote that, “[t]his new feature can also serve as a digital timeline of recent history, like the reconstruction after the devastating earthquake and tsunami in Onagawa, Japan. You can even experience different seasons and see what it would be like to cruise Italian roadways in both summer and winter.”4
Though announced as a glorified software update, accessible historic Streetview imagery should be considered a notable moment in human history – Google gave its users the ability to visually go back in time and see how the world around us has changed. Almost two decades into Streetview, the project is robust as ever, with high-trafficked cities receiving new Streetview updates every few years. Any internet user, without paying extra or even having a Google account, can access this trove of temporal streetscapes. The results of the tool have been predictably diverse and ingenious.
Since its widespread rollout, Google Streetview has been used for day-to-day navigation, for data mining to assess urban environmental, social, and infrastructural conditions,5 for public health audits,6 for study of the behavioral psychology of navigation,7 and for use by artists who plumb its depths to select readymade images out of street scenes.8 Each of these uses capitalizes on Streetview’s tremendous trove of data to shape how we view the world.
Google Streetview images are used widely in city planning offices for existing conditions analyses and have become pervasive on social media for their ability to depict changes in urban policy. Housing advocates regularly engage with the effects of zoning reform on housing supply by sharing before and after images of increased density in urban spaces. These Streetview image pairings optimistically depict the speed with which urban spaces can change to address pervasive social issues. The images encourage viewers to think about the built environment as the product of tangible policy and social decisions, rather than as an unchangeable condition of city life.
“Streetview image pairings optimistically depict the speed with which urban spaces can change to address pervasive social issues.”
32
A PICTURE OF THE ENTIRE WORLD
Gamers study the built environment
However unexpectedly, online gaming has proven to be among Google Streetview’s most popular uses. Online gamers use the game GeoGuessr to study the non-monumental, under-appreciated quirks of our built environment, especially of the industrial vernacular architecture that lends our cities, towns, and rural highways unique characteristics.
Alton Wallen, a Swedish software engineer, launched GeoGuessr in 2013. The game taps into Google Streetview in order to use its imagery for fun.9
In each round, GeoGuessr randomly selects locations in Streetview and gives players the opportunity to guess where they are on a world map. The game was long a site for curious players to attempt an unbeatable and entertaining challenge. After all, there is no way to identify the location of any spot in the world. However, in the last few years, especially over the course of the Covid19 Pandemic, GeoGuessr players took up the challenge of getting better at the game than anyone imagined would be possible.
GeoGuessr has blossomed into a streaming juggernaut, with millions watching live game play and YouTube recordings of players who deftly sift through the forensics of a streetscape and pinpoint themselves across billions of possible locations around the globe. Professional Geoguessr player GeoRainbolt has gained prominence on TikTok by showcasing his ability to pinpoint Streetview imagery after seeing an image for less than a second.10
The game now has over 40 million accounts and the GeoGuessr community is one of the greatest forces for studying and cataloguing vernacular architecture across the globe, all for the purposes of satisfyingly navigating rounds of a competitive video game. Players study the way different countries
 Photo by Matt Sylvester on Unsplash
WHAT’S IN A FUTURE? 33 PANORAMA 2024
and regions erect bollards, tile their roofs, and string their telephone wires.11 In short, they are filtering the mountains of information contained in Streetview and identifying traits that make each part of the world stand out as simultaneously interconnected and unique.
While GeoGuessr pros catalogue and memorize the ways that different regions mark roadways and design cityscapes, they are inadvertently unveiling the limitless potential for how we can construct our built environment. Knowing that streets do not have to be built the way that we’ve always built them is a powerful idea. By facilitating a study of our differences, GueGuessr uses Streetview to help us see the built environment as a collaborative, progressive project.
Streetview’s predecessors
Google was not the first to try and take a picture of everywhere in the world. Urban panoramas have captured the curiosity of audiences for centuries, from Meiji Japan12 to 20th Century New York City,13 but technological advances have allowed temporal repetitions of these panoramas to showcase the dynamism of cities.
Prominent among Streetview’s predecessors is Ed Ruscha’s Sunset Strip project, which entailed the recapturing of panoramic images along Los Angeles’ Sunset Boulevard roughly every five years from the 1960s to the
70
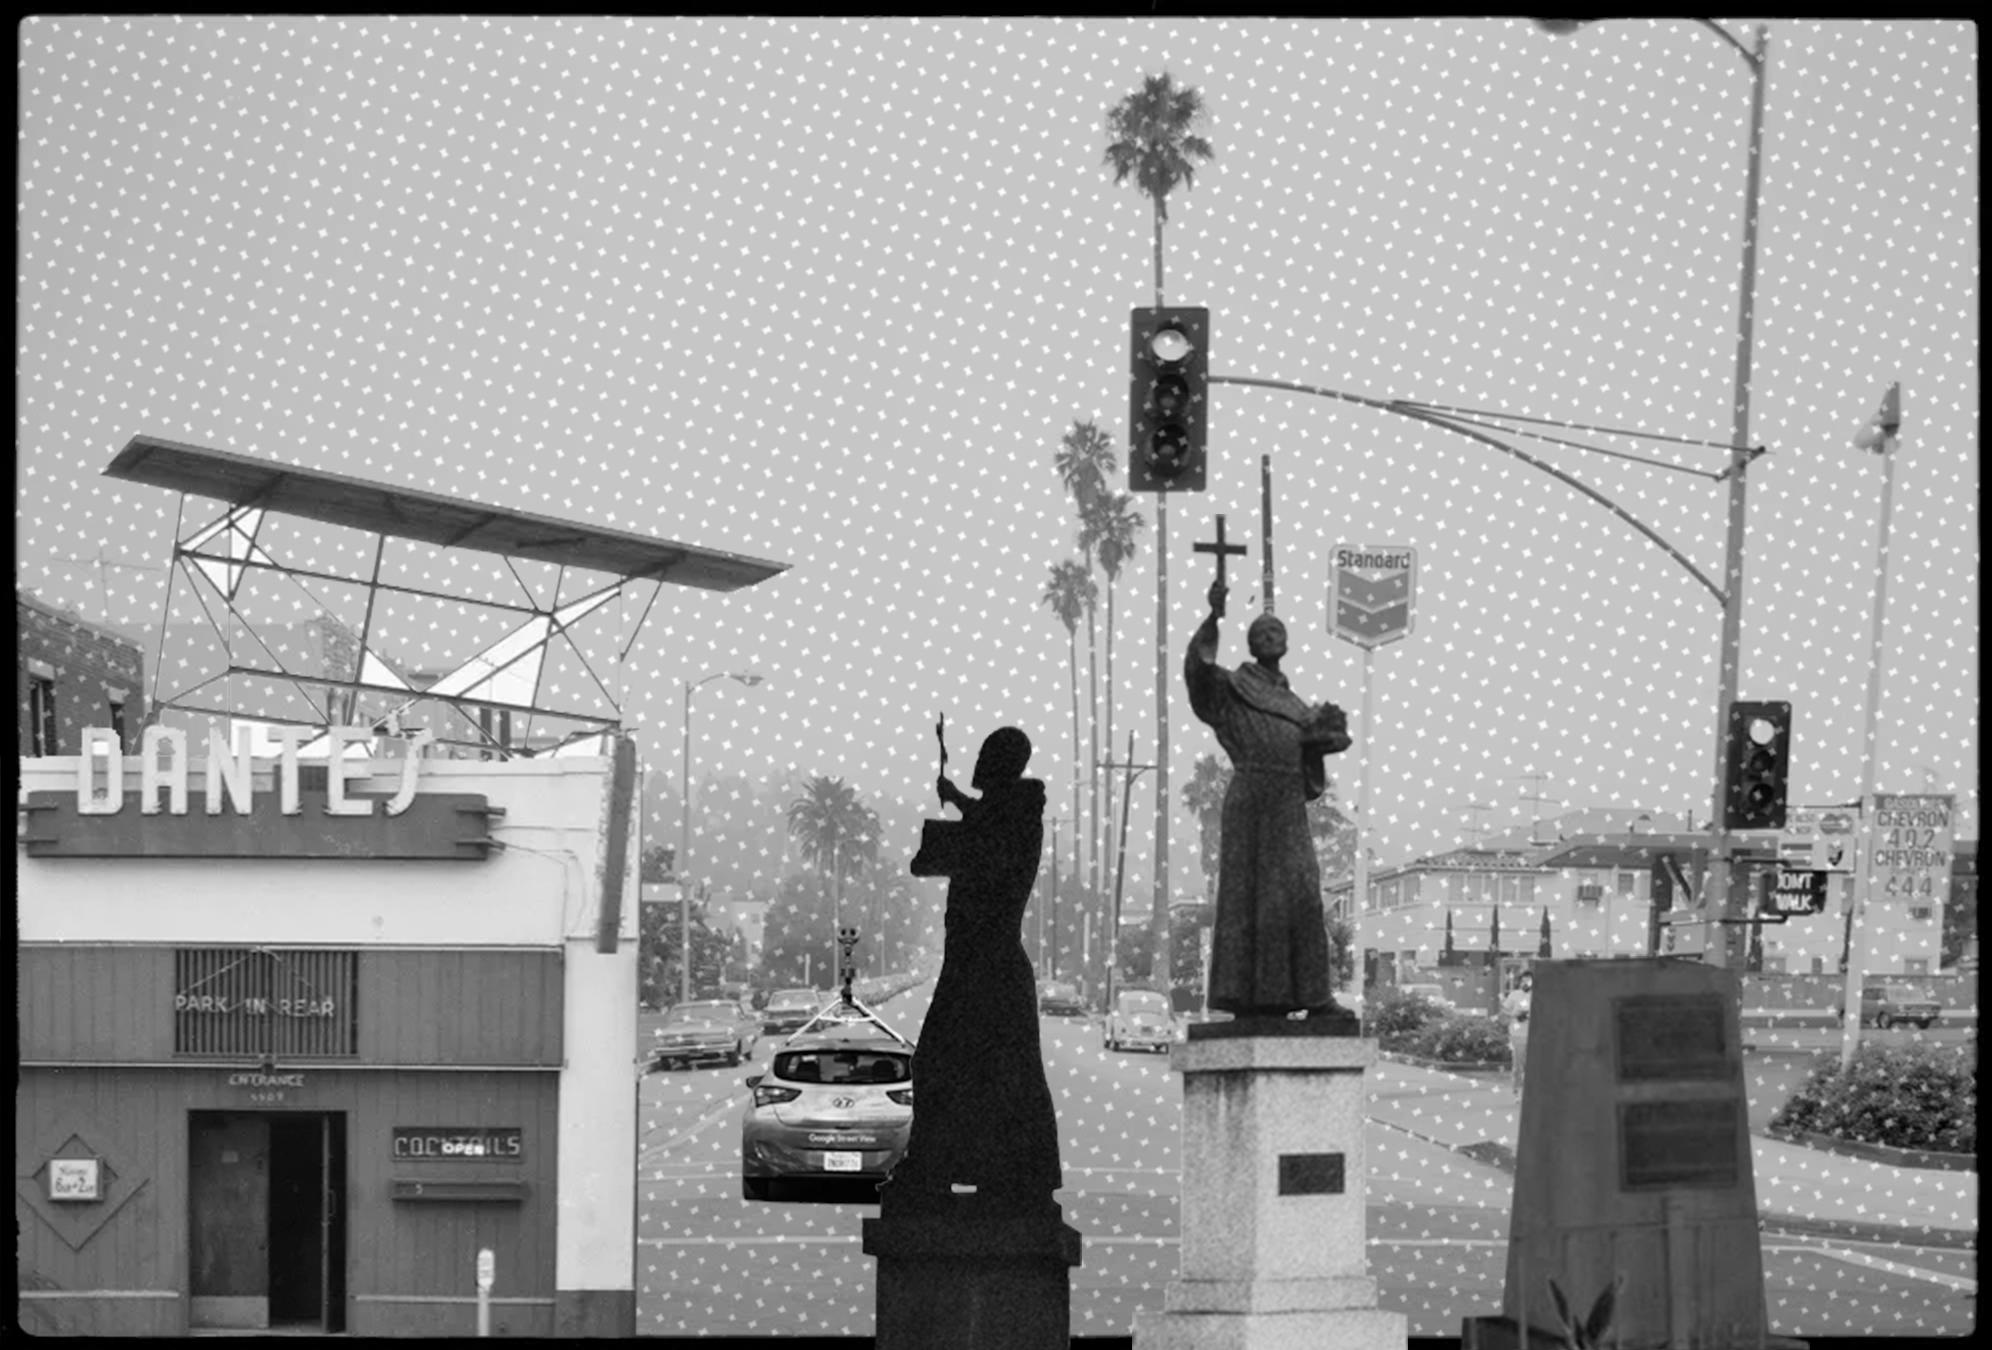 Years of change in Los Angeles (Design by Jonathan Zisk)
34 A PICTURE OF THE ENTIRE WORLD
early 2000s.14 Ruscha, an American pop artist and conceptual photographer, approached the city with a deadpan aesthetic that proved invaluable for studying the modern American built environment. Ruscha’s work serves as a conceptual bridge between modernist street photography and the maximalist technocratic advancement of Streetview. Ruscha’s geographically-constrained Streetview-style project shows the dynamism that our cities hide in plain sight and contextualizes the generational scope of urban change.
In 1966, Ruscha published the first and only official installment in his Sunset Strip project, an enigmatic book called Every Building on the Sunset Strip. The book consists of a single accordion page which unfurls 25 feet to reveal a panorama spanning one and a half miles of street frontage on both sides of Sunset Boulevard. The book is simultaneously a parody of Robert Frank’s road trip photography and a mesmerizing work of postmodern realism. Every Building is a landmark depiction of American space: the Sunset Strip, with all of its star-studded hangouts, Hollywood billboards, and rough around the edges allure. Ruscha took to his project assiduously, manually stitching each photo together, labeling side streets and alleys along the way, leaving no piece of land out of the image.15
“Temporal streetscapes are an ingenious tool for depicting the shape of our built environment as a continuous negotiation between cultural preservation and progress.”
Aside from its humorous presentation, Every Building is an achievement in conceptual art that displays an urban environment through consistent, transparent editorial choices. Ruscha photographed a discrete stretch of roadway with such careful consistency that he eventually mechanized the process for reproduction on an industrial scale. Every Building makes an artistic advance by limiting the impact of the artist’s hand in order to represent the world with as few modifications as possible.
Ruscha’s 1966 project was the seed for a generational attempt to document changes in the built environment. After publishing Every Building, he kept the project going, rephotographing Sunset Boulevard for the next forty years.16 The project now includes twelve incarnations of Every Building, each one displaying the subtlest and most dramatic changes alike that occurred along the street in the time elapsed.
By recapturing Every Building, Ruscha turned his original project from a onetime conceptual achievement into a temporal streetscape whose significance gained complexity with each iteration. Rusca’s sequential panoramas
35 PANORAMA 2024
WHAT’S IN A FUTURE?
visually accelerate the pace of urban change and allow viewers to see the city evolve before their eyes.
Stitching together Ruscha and Streetview
To illustrate the utility of Ruscha’s Sunset Strip project, I hoped to recreate one of the era’s iconic images of Los Angeles using Ruscha’s panoramas – Robert Frank’s photograph of a statue on the Sunset Strip, as included in his landmark 1958 book, The Americans The Americans was a tremendous influence for Ruscha, who modeled some of his own first photography projects on Frank’s, especially his 1963 Twentysix Gasoline Stations 17
To my initial dismay, the statue photographed by Frank had been removed by the time Ruscha could photograph it. However, its absence underscores the treasure trove hidden in Ruscha’s work. Ruscha didn’t have the chance to photograph the statue, but he photographed the widened boulevard and parking lots that remained in its absence.
The statue, it turns out, was moved just a few blocks away, to a park in front of Los Angeles Union Station. Google Streetview captured it many times up until 2019. However, the statue was missing in all following images from that location.
By setting out on a foolhardy project to capture the world, much as Ruscha did for the Sunset Strip, Google Streetview captures the often-overlooked social and political movements etched into our built environment. The statue in question was a likeness of Father Junipero Serra, the principal architect of Spain’s California mission system, which systematically repressed non-European cultures in the territory and converted native people to Catholicism. In June 2020, indigenous activists tied ropes around the statue’s neck and pulled it to the ground.18
Ruscha’s work exists in a nexus between conceptual art, historical documentation, and urbanism. Associating his work with Google Streetview allows for an optimistic approach towards navigating the optics of urban change. Collective distaste and distrust for change in the built environment is an essential force for keeping cities equitable and functional, yet the same impulses are often the greatest barriers to making more sustainable transportation systems, building denser housing, and beautifying communal spaces. Temporal streetscapes are an ingenious tool for depicting our built environment as a productive negotiation between cultural preservation and progress. Every city is the manifestation of a collection of an untold number of decisions that shape the dimensions, character, and orientation of space. Temporal streetscape allows us to see this cycle in action.
36
A PICTURE OF THE ENTIRE WORLD
Endnotes
1 Olanoff, Drew. “Inside Google Street View: From Larry Page’s Car To The Depths Of The Grand Canyon.” TechCrunch (blog), March 8, 2013. 2 Ibid.
3 Google Maps Street View. “Celebrate 15 Years of Exploring Your World on Street View.” Accessed December 9, 2023.
4 Shet, Vinay. “Go Back in Time with Street View.” Google, April 23, 2014.
5 Li, Xiaojiang, and Carlo Ratti. “Mapping the Spatial Distribution of Shade Provision of Street Trees in Boston Using Google Street View Panoramas.” Urban Forestry & Urban Greening 31 (April 1, 2018): 109–19.
6 Smith, Cara M., Joel D. Kaufman, and Stephen J. Mooney. “Google Street View Image Availability in the Bronx and San Diego, 2007–2020: Understanding Potential Biases in Virtual Audits of Urban Built Environments.” Health & Place 72 (November 1, 2021):

About the Author
Jonathan Zisk is a second-year Master of City Planning student concentrating in sustainable transportation and infrastructure planning. He comes to Penn with an English degree from Reed College in Portland Oregon. He believes that cities are remarkable spaces for sustainable and equitable life and wants Chestnut and Walnut Streets to be permanently closed to cars.
102701. 7 Berners-Lee, Ben. “The Semiotics of Digital Cartography at the Geoguessr Interface: A Practice-Oriented Case Study.” New Media & Society, March 31, 2023. 8 Ingraham, Allison L. Rowland and Chris. “How Google Street View Became An Art Form.” Fast Company, May 25, 2017. 9 Browning, Kellen. “Siberia or Japan? Expert Google Maps Players Can Tell at a Glimpse.” The New York Times, July 7, 2022, sec. Business. 10 Condon, Ali. “Man Who Can Pinpoint Exact Locations from Tiny Details in Photos Explains How He Does It.” UNILAD, April 26, 2023. 11 “Plonk It,” Plonk It, accessed November 12, 2023, https://www.plonkit.net. 12 Kusahara, Machiko. “The Panorama in Meiji Japan: Horizontal and Vertical Perspectives.” Early Popular Visual Culture 18, no. 4 (October 1, 2020): 400–421. 13 Gleason’s Pictorial. Gleason. Frederick, 1852. 14 “Sunset Over Sunset.” https://www.sunsetoversunset.org. 15 Baca, Miguel de. “On Ed Ruscha’s Books, Los Angeles, and Peripatetic Flow.” Art in Print 9, no. 2 (2019): 46–50. 16 Sunset Over Sunset. 17 Wolf, Sylvia, Ed Ruscha and Photography. First edition. New York: Whitney Museum of American Art, 2004. 18 Miranda, Carolina. “At Los Angeles Toppling of Junipero Serra Statue, Activists Want Full History Told.” Los Angeles Times, June 21, 2020.
FUTURE? 37
WHAT’S IN A
PANORAMA 2024
In Love
with the Details
Anecdotes on memory and an argument for beauty as a right

photos and words by Brianna Belo
WHAT’S IN A FUTURE?


I’ve noticed I’m mesmerized by the sidewalk on the corner of 34th & Market
in the same way that I’m enthralled by the long walkways in the Gardens of Versailles or the streetscapes in Paris.
It’s the detail that I find incredibly charming.
39
2024
Philadelphia, PA (left) and Versailles, FR (right)
PANORAMA
When moving back to Philadelphia from Paris I lived in a haze for the first 3 months of my return.
The fog began to lift for me only when I made my first visit to my neighborhood’s coffee shop.
I vividly remember walking into Two Sisters Coffee. Upon stepping inside I was greeted by the warm scent of baked spices—cinnamon, nutmeg and cardamom. My eyes rested on freshly baked sourdough bread and a lingering scent of roasted coffee stirred my consciousness.
I was instantly transported back to late mornings at French cafes and the daily strolls on which I was greeted with enticing smells wafting from patisseries.
In August of 2022 I moved to Paris to attempt living nomadically. I decided to make the City of Light my first stop. I chose Paris to be closer to my sister, but I had an additional semi-conscious motive to this move as well. After living in DC for nearly 8 years I was ready for something different, but I wasn’t sure what. Feeling restless from the confinement of COVID and heavy from the work of BLM, I was searching for a life that felt lighter—even if just for a little while. Brittany, my twin sister, had been living in Paris for 3 years at this point, steadily building her career in styling and editorial direction.
 Paris, FR
40 IN LOVE WITH THE DETAILS
The twin cities
Philadelphia and Paris have long held an interconnected relationship with one another. In some spaces Philadelphia is known as one of Paris’ sister cities, and Michelin’s “Le Guide Vert” has even crowned Philly the “Frenchest” city in America (the same guide asserts Philadelphia is a “perfect compromise between American excess and European spirit”). However, this title is not a recent accomplishment but rather a culmination of shared ideologies that have shaped the character of both nations.1 Following Independence in 1776, French revolutionaries remained in Philadelphia—motivated by idealism—to assist in the establishment of the nascent United States. 2 Beyond shared, foundational ideologies, French architecture and art transformed Philadelphia’s popular cultural and urban landscape, leaving an indelible imprint on our city. Many of Philadelphia’s anchoring monuments—City Hall, The Philadelphia Museum of Art, The Parkway, The Benjamin Franklin Bridge, and even the Philadelphia Zoo were designed by French architects or native Philadelphians trained in some form at Paris’ École des Beaux-Arts.
In hindsight, it comes as no surprise that Britt landed there permanently—as France’s fingerprints were left all over Philadelphia and inherently, our childhood.
Growing up in Philadelphia, I adored my hometown’s prestigious landmarks for their beauty and the memories I’d attached to them—fireworks on the Parkway, trips to the Zoo, and summer movie nights at the Delaware riverfront back lit by the Benjamin Franklin bridge are top of mind examples. I was even convinced I would live in the Art Museum someday. My sister and I developed a deep affection for our home, nurtured by the pride instilled in us through formative experiences throughout Philly.
Beyond Paris’ foundational connection to Philadelphia, the City of Light served as a haven for African Americans seeking respite from physical, intellectual, and spiritual violence of racism in the U.S. This relationship has long existed but further solidified when African American troops were commissioned to fight alongside French soldiers in both World Wars because they were excluded from serving on frontlines with white Americans. Fighting in company with the French forged bonds and invited cultural exchange between the two groups. African Americans were awarded medals for their bravery and invited into French homes, creating a lived experience that was nearly
WHAT’S IN A FUTURE?
41 PANORAMA 2024
unfathomable on U.S. soil at the time. It was also during this time that Black soldiers introduced their French comrades to Jazz, igniting France’s love of the genre and African American creativity.3 France garnered a reputation as a place where Black Americans could “just be” and prolific African American visionaries and activists began to seek refuge, find solace and inspiration in Paris’ embrace.4 Figures such as Richard Wright, James Baldwin, Langston Hughes, Beauford Delaney, Josephine Baker, W.E.B DuBois, Loïs Mailou Jones,

Paris, FR
“I needed Paris…It was a feast, a grand carnival of imagery, and immediately everything there seemed to offer sublimation to those inner desires that had for so long been hampered by racism back in America. For the first time in my life I was relaxing from tension and pressure.”
- Gordon Parks, Voices in the Mirror: An Autobiography
alongside notable Philadelphians like Henry Ossawa Tanner and Julian Able, were among those who selected the city to develop their craft and advance their ideologies. The contributions and philosophies of these individuals empowered African American expression and advocacy, particularly at a time when it faced suppression in the United States. Local historians and African-American expats alike celebrate Black culture’s ubiquity throughout the city. With an awareness of this context, Paris felt like the ideal place to slow my pace and make room for ease in my life.
On my walks to and from Britt’s apartment – 20 minutes each way—I’d slow my pace and marvel at the streets, stopping at the windows of patisseries and forgoing headphones in order to take in the honks of scooters, or the sounds of petit voices playing in the parks I passed by.
One morning we set out on a walk that became a 2 hour stroll through Montmartre. The streets were empty and our pace was leisurely. I savored the sense of wonder that I felt as I discovered this new place, lingering on corners and in corridors. We ended at my sister’s favorite café, Two Doors Coffee. When stepping inside, as the shop was lit with soft morning light, I was greeted with echoes of Cleo Sol’s “23” and an aroma of freshly ground espresso. This walk allowed me to reclaim a childlike moment with my sister.
42 IN LOVE WITH THE DETAILS
We were close growing up, our younger years full of long days of play and longer conversations about everything and nothing.
It was in Paris that for the first time, since childhood, I was able to experience what it meant to just be—to linger and mosey.
Savoring small details
Back in Philadelphia, Two Sisters led me to once again be mesmerized by the details of a place —exposed brick and steel beams boasted the building’s original architecture, and the space itself held a warm hum of chatter. The baristas were busy fulfilling orders while the cafe’s in-house baking staff were pulling pastries from a stone fire oven.
As I settled into my seat and continued to take in my surroundings, I fell into the same trance I’d felt during my travels when my eyes were drawn to the way a light hit a surface, a texture, or art hidden in plain sight. This space in my home city evoked the same sense of wonder and curiosity.
I recalled this first long walk with my sister in Paris, one of many walks where I inspected nearly every corner, sidewalk, and wall searching for new intricacies I’d never noticed before.

IN A FUTURE?
WHAT’S
43 PANORAMA 2024


44 IN LOVE WITH THE DETAILS
Philadelphia, PA
I’d call each outing “a little adventure” and take photos, savoring the small details of my surroundings. I loved my photo walks because they grounded me and put my nervous system at ease.
I continued the practice of photo walks when I moved back to Philadelphia.
Over time I found myself beginning to obsess over the beautiful intricacies of this city that I was born in—realizing my hometown had as much to offer as the streets of Paris when I looked closely.
Photo walks were quite sensory—they brought forward a slow, unraveling sense of relief—like kneading bread, sculpting clay or flowing through a yoga sequence. I could breathe deeper and connect more to the environment around me.
The sensations I’d felt on my photo walks often revisit at random moments when I walk around Philadelphia. A cool gust of air would trigger a memory and suddenly I’d feel that same sense of freedom I felt exploring autumnal Paris or Menorca. I liken these senses to cravings. In the same way that the smell of roasting herbs may evoke a taste for one of my mother’s staple recipes, or the light hitting red bricks on rowhomes makes me long for golden hours spent at French cafes watching the light cast shadows of building facades.

WHAT’S IN A FUTURE?
Paris, FR
45 PANORAMA 2024
Today, as a city of neighborhoods, it is difficult not to find yourself reflected in some facet of Philadelphia. Though not perfect, and often threatened, the city has somehow managed to maintain much of its deeply rooted character. Philadelphia is expressive, rebellious, resistant, and dynamic —it bucks at uniformity, perfection, and sterility, instead insisting that you come as you are, with no heirs and no agendas. Here, you can tap into identities you may have tucked away in less cosmopolitan spaces and invest in facets of yourself that might have been challenging to explore in less accessible cities.
As I reflect on Paris’ impact on me, I now do not find it surprising that Paris and Philadelphia are considered sister cities, and that the City of Light has a legacy of attracting people of color from the States to its streets.
Like Paris, Philadelphia often acts as a mirror for who you are, a challenger and catalyst, helping you embrace dormant factions of yourself.
In the same way that Philadelphia’s boastful architecture pays homage to its French influences, Philly’s whispers, snickers and nuances do the same—as if the dialogue between Paris and her kid sister have never stopped. Together, they point at you and ask you who you are. This time abroad revealed to me how different environments can uncover hidden facets of my personality. Searching for my environment’s intricacies helped me notice my own by deepening my connection to my innate curiosity and rekindling my admiration for creative expression in urban landscapes.
“[Philadelphia is] a very human city..with a strong human identity that you can see when walking or cycling in its neighborhoods.”
—Philippe Orian, Editor-In-Chief of the Michelin Green Guide5
Savoring these details was therapeutic. Photo walks allowed me to be more present, and became a key strategy in the rehabilitation of my mental health. I felt as though the built environment had loved notes dispersed for me to find.
Our brains process senses, emotions, and memories in tandem. For instance, smell is closely linked to memory storage and emotional recall. Therefore, landscapes and places can trigger memories and evoke values through their physical attributes. Even if memories are created elsewhere, landscapes can become vessels to revisit what is not immediately tangible. By paying attention to the sensory experiences provided by our surroundings,
46 IN LOVE WITH THE DETAILS
such as what we see, hear, smell, and feel, it can help us remember that we share common human experiences. Mindfulness in the natural world can serve as a way to connect with and understand one another better.
This single coffee shop spurred an internal dialogue I am still mulling over to this day:
Similar to music, food, and poetry, our physical landscapes communicate to the soul and to the mind.
Physical landscapes have the power to hold memory, ease or even disrupt our sense of being.
For this reason, in the same way that I am fascinated by the sidewalk on 34th street, I find myself fascinated by the language of our built environment.
Beauty is a right
These anecdotes remind me that beauty is a right, and beauty is justice.
Architecture and design are often posed as luxuries—indirectly communicating that beauty is only for those who can afford it.
My love for urbanism is not attributed to Paris or Philadelphia alone. I will not over-romanticize the legacies of these cities. France and other imperial nations have colonial histories that I hope reparative planning will address, while Philadelphia has enduring histories of divesting and policing communities of color.
But before Paris I was not conscious of the hypervisibility and weight I felt as a Black woman in America.
The weight can feel heavy on your shoulders—much of the time.
It is difficult to admit that before Paris, I didn’t know what many Black Americans meant when they said they felt like they couldn’t breathe.
It wasn’t until I felt what it was like to expand, breathe and stretch out—free of weight, that I understood what it meant to breathe without burden attached.
I argue that for me (as for many)—the city’s emphasis on beauty awakened a demand for beauty that already existed inside of me. The same way it provided an environment that pulled out the prolific work and sentiments that were gestating in the Josephine Bakers and James Baldwins that have paved the way for my generation.
Black people saw ourselves reflected in the urban, social, and cultural fabric of the City of Light—and time spent there has imprinted a call to pull that forth, to continue creating and revitalizing, leaving our mark on tangible and intangible landscapes.
A FUTURE?
WHAT’S IN
47
PANORAMA 2024


48 IN LOVE WITH THE DETAILS
Paris, FR (top and bottom right) and Versailles, FR (bottom left)
It is my love for Philadelphia that calls me to critique it. Growing up in this city I noticed disparities across neighborhoods and counties before I understood what they were. I have always remembered how that made me feel.
Not everyone in is provided the same opportunities to sit in a sense of awe and wonder, to dream, and to soak in the beauty of the environment around them.
Those living in neighborhoods heavily impacted by inequity, discrimination, and structural violence are often told by their environments that they are not enough, and that they must strive, adapt and assimilate to achieve a better quality of life.
Some of us have chosen to leave the U.S—while some have come back—revived and willing to reshape what tried to assimilate or contort us. There is no one way to heal from the generational and internal ruptures caused by systemic racism.

It is my love for Philadelphia that calls me to critique it.
As a Black woman I am still finding my way and recovering my voice, and as a planner and designer I am constantly looking for the ways in which my identity is both reflected in and shaped by the environment. So far, I know that I aspire to help craft external landscapes that mirror our internal worlds.
As a result, I continue to ask myself questions like “what prevents us from designing as if beauty is a universal right?”, “how are we using coded language to police public life in the way we design?”, “what uncomfortable realities are we overlooking in this field?”, “how can we transform the internal (individuals) and external (communities—physically and socially) environment at the same time?”, and “in what ways can we promote healing in design processes and outcomes?” I am insistent on continuously evaluating my biases in this field, and the impact of this work on the human psyche. I care deeply about the subtle and obvious ways in which we are creating opportunities for shared experiences that leave emotional imprints and ease in our collective memory.
I look to human-centered design principles, joy, liberation and the frameworks of anti-racism, restorative justice, radical imagination, to design a
IN A FUTURE?
WHAT’S
49 PANORAMA 2024
world that reminds community members they are worthy of all they dream of, and that resources and peace need not be withheld from them.
Space for deep, expansive breaths was the propellant of my predecessors.
I believe we need more architects, planners and designers who are willing to play with the built environment, and leave love notes that remind people that their humanity is welcome.
So finally, I am reminded that I want to be a designer who makes sidewalks sparkle, because joy is an act of defiance and resistance.

50 IN LOVE WITH THE DETAILS
Paris, FR
Endnotes

About the Author
Brianna (Bri) Belo (she/her) is a first year Master of City and Regional Planning Candidate in the Housing, Community and Economic Development concentration and is pursuing a certificate in Urban Design. Bri is a native Philadelphian who is passionate about understanding the ways in which the built environment impacts the human psyche and how it can be used as a tool for healing, reconciliation and social cohesion.
IN A FUTURE?
WHAT’S
3 Virok and Cooper
Chernick,
in
Obscura, August 24, 2020.
Prihar, Asha.
at WHYY, May 10,
1 Virok, Christina, and Lauren Cooper. “France and the French.” Encyclopedia of Greater Philadelphia, March 17, 2022. 2 Haas, Kimberly. “Je t’aime, Jawn Française! New Book Explores Philly’s Inner Francophile.” Hidden City Philadelphia, July 16, 2021.
4
Karen. “The Hidden Histories of Black Americans
Paris.” Atlas
5
“Michelin Is Coming to Town with Its First-Ever Philadelphia Tourism Guide.” Billy Penn
2023.
51 PANORAMA 2024
Tre Ambroise
Bailey Bradford
Shefali Gupta
Katie Hanford
Sidney Kuesters

Jiahang Li
Alec Pompeo
Kathleen Scopis
Samantha Shasanya
Yang Yang
STUDIO A Legacy Planning Framework DELPHIA 2026
PHILA-
WHAT’S

In the summer of 2026, Philadelphia will attract visitors from around the world for the FIFA World Cup, the nation’s semiquincentential, and the MLB All-Star Game—how can the city leverage the mega-events of 2026 to make an equitable, long-term impact for Philadelphians?
53 PANORAMA 2024
IN A FUTURE?
250 Years in the Making
As the city where the Declaration of Independence was signed in 1776, it’s only natural that the nation’s birthdays should be celebrated in Philadelphia. Every 50 years, the city hosts a major commemoration for the occasion, with each event leaving a major mark on the city. The 1876 Centennial Exposition brought us Fairmount Park as well as the 1776 Bicentennial iconic imagery that would come to define the Sixer’s brand.
In the summer of 2026, Philadelphia will be host to three megaevents—six FIFA World Cup games, the semiquincentennial (America’s 250th), and the MLB All Star Game. Philadelphia 250, a non-profit leading efforts to plan for the semiquincentennial in Philadelphia, is planning to commemorate the occasion year-round in select gateway neighborhoods throughout the city. The World Cup alone is anticipated to bring in $500 million in economic impact and 500,000 visitors. How can Philly be positioned to thwart the challenges and seize the opportunities posed by an event of this scale? 2026 can be an opportunity to showcase Philadelphia’s dynamic culture and leverage investments to make a long-term, equitable impact throughout the city. Mega-event planning is a complex and fraught process. Traditional mega-events, while being helpful in bringing notoriety and grandeur to host cities, face numerous issues after the fact, including soaring costs in infrastructure and development planning, temporary uses for new physical developments and questionable profitability for host cities. Host city expenses often soar over initial projections, even in the magnitude of billions of dollars. Modern host cities are thinking about how they can prioritize the building of reusable infrastructure and introducing policies that will far outlast the event they are hosting. Philadelphia should be incorporating these strategies while planning for the events of 2026.
This Fall 2023 studio explored the complexities of planning for mega events and prepared toolkits addressing a variety of areas—from administrative burden, to economic development, to cycling and waste management. These projects aim to ensure that 2026 will leave a lasting positive memory for Philadelphians and the city’s local organizations, communities, and agencies alike, while staying realistic about what can be accomplished in the short time before 2026.
How can Philly be positioned to thwart the challenges and seize the opportunities posed by an event of this scale?
PHILADELPHIA
FRAMEWORK 54
2026: A LEGACY PLANNING

WHAT’S IN A FUTURE?
55 PANORAMA 2024
Above: Citizens Bank Park from Lincoln Financial Field, venues for the FIFA World Cup and MLB All Stars game respectively (photo by Bailey Bradford)

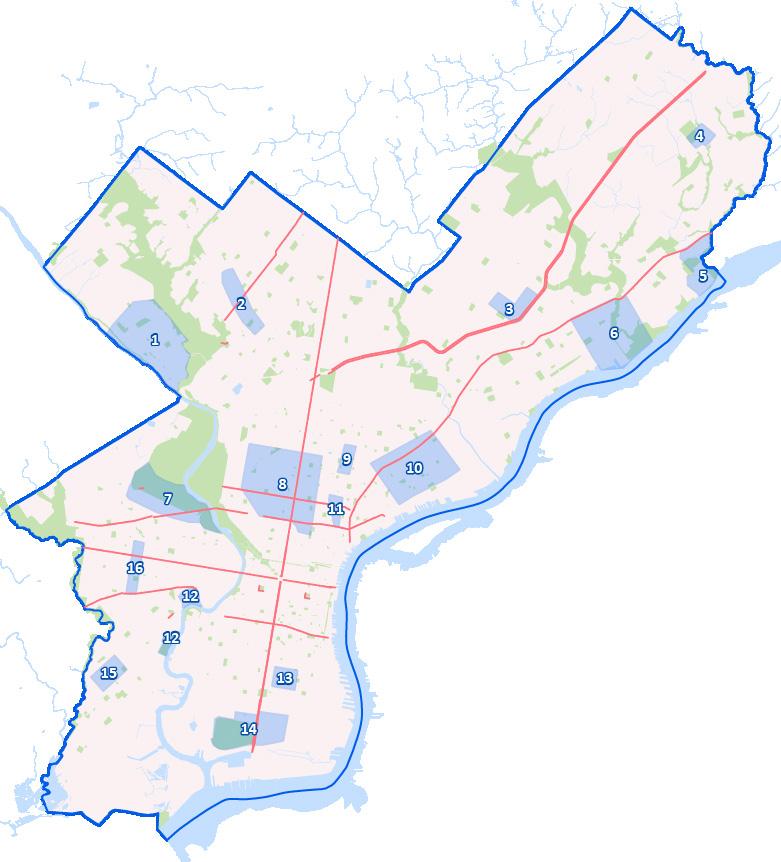
Recognizing Roots
The key to successful Gateways lays in leveraging existing community assets around the city. While the following details one path towards selecting potential Gateway areas, Philly’s best resources for planning these events are found with its community leaders and local organizations.
A foundation for Philadelphia’s success in 2026 will be the promotion of Gateways to ensure that the influx of visitors, their spending power, and greater investments are distributed throughout the city as opposed to areas that will already see high visitor traffic, like Center City and the Stadium District.
Figure 1 highlights selected Gateway districts around Philadelphia. While designated cultural sites cluster around Center City, Fairmount Park, and Germantown, the 250th presents an opportunity to highlight other sites
1. Manayunk / Roxborough 2. Germantown 3. Oxford Circle 4. Benjamin Rush State Park 5. Glen Foerd 6. Tacony 7. West Fairmount Park 8. Strawberry Mansion 9. Centro de Oro 10. Richmond Street 11. American Street 12. Schuylkill Riverwalk 13. Lower Moyamensing 14. Stadium District 15. Elmwood Park 16. 52nd Street PHILADELPHIA 2026: A LEGACY PLANNING FRAMEWORK 56
Figure
1 Selected Gateway Districts
recognized within local communities. 250th celebrations should be built by, and belong to, all Philadelphians. Nobody knows Philly neighborhoods better than those who live there. Because of this, it is crucial to involve local organizations and community leaders not only as stakeholders, but as creators and collaborators. During PHILADELPHIA250’s Sunset Social event, we invited attending local organizations and community leaders to talk about where they participate in resources across the city. The selected Gateway districts closely reflect those conversations.
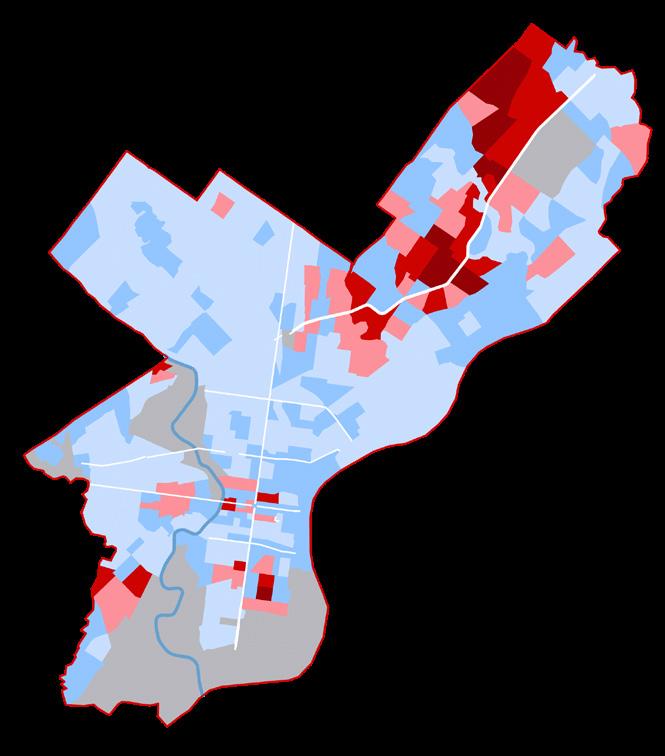
Philadelphia’s vibrant immigrant cultures also should play a significant role in planning for 2026. Figure 2 highlights were immigrants are settling in the city. the spread of residents born outside of the US. Engaging communities with a strong immigrant presence allows for more inclusive activities to be offered throughout the year. Some communities that may be highlighted include Oxford Circle, Lower Moyamensing, and Elmwood Park.
Celebrate, Locally
In 2026, Philadelphia will be welcoming the world as it hosts the most popular sporting event in the world, the FIFA World Cup. In many communities around the world, the return of the tournament every 4 years is associated with the community gathering in an open space, sharing food and drinks, and anxiously watching their country perform on the greatest international stage. We want to make this kind of event possible for communities in Philadelphia. However, the current event permitting process in Philadelphia makes it incredibly difficult and expensive to organize such events and ensure equitable access to vendors. Additionally, open space within which to host these events is often needlessly limited.
Event Permitting Processes are Too Complicated
Philadelphia’s event permitting process is messy at best. For a community organization to host an event in a public space in Philadelphia, the
Less than 10% More than 40%
Figure 2
IN A FUTURE?
Share of Foreign Born Residents by Census Tract
WHAT’S
57 PANORAMA 2024
entity may have to get as many as 8 different permits housed within several different city departments. Timelines often do not match the needs of a last-minute event such as a World Cup celebration. To showcase these complexities, we created a Decision Tree, shown in Figures 3, 3.a, and 3.b.
Vendor accessibility to events is limited. Beyond it being complex to simply host events in the city, the process to have vendors at such events hosts a unique set of barriers. Vendors in Philadelphia are spatially restricted to events hosted within certain areas of the city, and if they are welcome, are not met with good access to business opportunities or operating permits. While a vendor portal does exist for the city, the portal hosts lacks several key aspects such as: appropriate availability Special Vending Licenses, accessible and far-reaching communication methods, and accessibility to the public. Many neighborhoods lack the open space to host community events. Even if communities had all of the resources necessary to host the events they wish, the availability of space is not guaranteed. Many neighborhoods around the city have limited access to open and green spaces, meaning that they need to either shut down a street or use spaces farther away. In order to properly address the inadequate event hosting environment in the city, we need to sufficiently answer the question: “Where can we celebrate?”
How Philadelphia can Streamline Event Planning
Given these current challenges, the following table features our reccomendations to Mayor Parker’s administration to make events easier to plan and manage in 2026 and beyond:
A LEGACY
Streamline event permitting processes:
Consolidate applications into one system, like a single PDF or a website walkthrough. L&I’s Building Permit Navigator could also be used as a template for a web-formatted permitting process.
Solidify permit and service fees and make them publicly available.
Shorten and streamline permit submission timeframes to allow for last-minute celebrations in the event of World Cup wins.
Establish comprehensive vendor support within existing City portal:
A clear information guide (NYU Street Vendor serves as a great case study)
Live vendor matchmaking capabilities
FRAMEWORK 58
PHILADELPHIA 2026:
PLANNING
• Up to 1,000

Figure 3
This Decision Tree (DT) showcases the hassle, expense and repetition involved in planning an event in Philadelphia.
Do you require vendors to have their own insurance? Will

Figures 3.a (right and 3.b (bottom)
what is the training of this person?
• Average age of attendees
• What measures are in place to prevent service of alcohol to minors?
• Does applicant have valid liquor license?
• Will there be an open bar?
• Will alcohol be served by the drink?
• Is BYOB allowed?
• Estimated alcohol gross receipts
REPEAT INFORMATION TRACKER
• Event coordinator/applicant name
• Organization name
• Address of organization
• Phone number
• Email
• Name of event
• Type of event
• Event location
Sample DT closeup, summarization of DT by repeated of information collection WHAT’S IN A
• Event description
• Date of event
• Event start and end time
• Estimated attendance
• Will there be alcohol?
• Will there be amplified sound?
• Will there be food vendors?
• Will there be tents?
• Will there be stages?
ent Appli Continue on with this app YES NO equi Fi out St St eet Closu e Appli ation Continue on with this app Continue on with this app Wi al oholic es be sold or sampled? endors; omple Appli epa ag with this app Continue on with this app Continue on with this appomple ent Ope ations Permit Continue on with the Wi this ent include taging or ther tructu es? aging and/ emp Submit plan identi ying oposed lo ation/use ents and Wi ent el ated or mutructu es? Submit enginee ed wings and inspections bensed engineer Continue on with this app electri al ork ormed and inspec ed a Philadelphi Continue on with this app YES NO out this table oilet/Holding Continue on with this app Continue on with this app Comple PHL Fi Depa tment EMS Special ent Appli ation Continue on with this app ach sani ation plan view P vide de ails Continue on with this app appli ys prior YES NO unauthori ehicles thletic field oads? A ou a local BID or tablished Communit g? YES NO ed Sponsoring O Applicant Name be closed (___ ___ ___ and ___) NEEDED IN ORM ION Name E E tion (include add or in ersection) Date(s) ent Se -up time ood handling ta time E ent ta and end time ood ope spa SpaDetails supplie /manufactu Details ents/ including dant ating Descri tion ound at ent (soi e) Sne ection details Gri ling or ooking permi ed? Details electrical vi ood ation including fuel permi ed Applicant Name Sponsoring NEEDED INFORMA IONOFFICE OF SPECIAL T HERE) Rules and R ul tions: ents la er than 10 10 eet, app equi Name ent T ent L tion Date(s) Hours ent (including pa ticipants and spect ors) NEEDED INFORMA ION Fi earms or ammunition Fi k ood endor Inflatables ni cutle Mechanical amusement rides Mo ts Open aintba ock climbing /body pie cing /skiing ding equi a bar or nigh Does the applicant hi naming Is liquor liability equi ender? not, aining person? g g pla o Detailed and floor plan including: Si and location xits oposed cupant load Ar ement the seating and locations heating and electrical equipment ax email appli mail checkdependent dependent Special rules app wing par which enhouse Squa ypes popar depending on$500 TRACKER ees paid $253 $485 $116 ent $635 $50 per location $100 or holding tank $635+ ees dependent on otal endees (in addition ees) including holding ank appli gan ation name dd ation Name ent p Da ent and end time Wi the be amplified sound? Wi the be ood endors? ages? IIIII IIIII III IIII III III Celebrate, Locally Philadelphia Permit Decision Tree Will your event occur at Fairmount Park? YES NO Is your event in less than 90 days? Fill out Parks and Recreation Event Application Continue on with this app YES NO Pay $75 for this app fee Pay $25 for this app fee Will this event require road closures? YES NO Fill out Streets Department Street Closure Application Continue on with this app Will food or beverages be distributed? YES NO Continue on with this app Will alcoholic beverages be sold or sampled? Fill out Health Department Special Events Application Provide a list of vendors; have each vendor complete Vendor Application YES NO Prepare and submit the Continue on with this app submit the prior to NO have ehicles fields, e roads? Continue on with this
RECREATION ION mail check OFFICE OF SPECIAL EVENTS APPLICATION (START HERE) Apply via PDF, pay online via API SITE FEE STRUCTURE
app
Below fees are daily rates for non-”A” parks, depending on estimated attendance: Events & Festivals:
attendees: $3,000
1,001 and
$4,000
3,001-5,000 attendees: $6,000 Non-Affiliated Group Events:
Up to 150 attendees: $150
151-250 attendees: $250
251-500 attendees: $500
Up to 1,000 attendees: $1,500 Individual events: Tree NEEDED INFORM Name of event Type of event Location Date(s) Hours of event Estimated attendan (including participants spectators) Event coordinator Address Phone number Email NEEDED INFORMATION Insured company name (applicant) Contact name Address Phone Email Event name Event website Event description Venue name Venue address Event start and end date Coverage start and end date Is event outdoors? How many years has it been under present management? During this time, has insurance had any claims regarding this event? Type of event Is seating assigned? Describe event type Maximum daily attendance Total attendance Gross revenue Expenses Will the events include any of the following:
Aircraft • Animals (other than pet contests)
Camping
Cattle drives
Childcare operations
Firearms or ammunition
Fireworks
Food vendor
Inflatables • Knives/cutlery • Mechanical amusement rides • Motorsports • Open water exposure • Paintball • Parade • Rock climbing walls • Rodeos • Tattooing/body piercing • Temporary skating/skiing / snowboarding structure
Trail rides
•
3,000 attendees:
•
•
•
•
•
•
•
•
•
•
•
•
•
•
any of the events occur in a bar or nightclub? Does the applicant hire any subcontractors for the event? Do these subcontractors own insurance naming you as additional insured? Who is responsible for providing security? Is liquor liability required? If so:
Will alcohol be served by a licensed bartender? If not,
•
IIIIIII IIIII IIIII IIII IIII III IIII IIIII III III IIII IIII II III IIII II II
59 PANORAMA
FUTURE?
2024
A public database of vendors with current eligibility status
Live chat support
Expand usable and event-ready open space:
Leverage current public spaces by conducting thorough assessments of their use, accessibility, and amenities.
Scale up the PHS LandCare Program to encompass additional neighborhoods, broadening its impact on transforming vacant lots into vibrant community spaces. Consider factors such as population density, community engagement, and cultural significance to guide the targeted growth of the program.
Explore Collaborative Grant Programs to encourage community-led initiatives for transforming vacant spaces
Bike Philly
2026 will bring an estimated 500,000 visitors from around the world, with the climax of all of these events will coinciding with July 2026—already the busiest month for cycling in any given year. The events of 2026 coincide with the goal set by the Kenney administration to build 40 miles of protected bike lanes. Despite a concerted effort to increase safety, 2023 has been the deadliest year on record in regard to cycling fatalities. 11 cyclists have been killed by collisions with cars in 2023—the deadliest year on record for cyclists in Philadelphia.1
As the Indego bike share system continues to grow quickly, it’s critical for the Parker administration to prioritize investments that can maximize the quality of the “hub and spoke” bicycle network to complement this growth and ensure cyclists’ safety. How can Philadelphia’s bike infrastructure—both Indego and the street network—be prepared to give visitors a safe and comfortable experience by bike?
Growth in Cycling is Transforming Urban Transportation
As public transit in the US has struggled to recover ridership in the wake of the pandemic, bike and e-scooter sharing systems across the country have broken ridership and expansion records. 2 Cycling in Philadelphia, and its bikeshare system Indego, have taken part in this national trend of growth. Indego has already surpassed it’s pre-pandemic peak at 353,000 in Q3 2023, featuring a surge in e-bike use.3
“We are proud to announce the City ... is on track to reach our Vision Zero goal of 40 miles by 2025.”
—Mayor Kenney in May 2023 press release
2026: A LEGACY
PLANNING FRAMEWORK 60
PHILADELPHIA
Indego rides surpass pre-pandemic high, by rides in Q3 (July–September), 2019–2023
Bulding the Confidence to Cycle Through Cognitive Mapping
Cycling is one of the few modes of transportation where perceptions of comfort and safety can outweigh time and cost in making the choice.4 Infrastructure design choices make a massive impact on both of these fronts. Promoting separated bike lanes over conventional lanes, which are demarcated by paint alone, go far in making cycling safer and giving a more cycling-skeptical population the confidence to ride.
High-quality, protected infrastructure can only go so far without network connectivity. Many people who are unfamiliar with where they’re at might jump to Google Maps, enter their destination, and get a point A to point B output. This is what’s known as the turn-to-turn method—you follow step by step, trusting that it gets you from point A to point B.
However, this doesn’t really give you the genuine confidence to navigate a new city. Even if a process is strictly point A to B, people often rely on landmarks, other people, and route quality or comfort to guide their decisions. This is known as wayfinding orientation, which engages other ways of imagining our landscape beyond a strict spatially accurate geography. Residents and visitors alike acquire a richer understanding of how to get around—a process known as cognitive mapping—through receiving both wayfinding orientation and turn-by-turn directions.5
Making an Impact Through Enhanced Indego Wayfinding
How can we maximize the quality and accessibility of information available at an Indego station? Most signage at Indego stations is purely advertising, which is key for the system to maintain a healthy revenue stream, but does nothing to enhance the bike share experience. A handful of Indego stations have included supplementary signing in addition to advertising. We propose to enhance these signs in the following ways to maximize information
0 100,000 200,000 300,000 Q32019 Q32020 Q32021 Q32022 Q32023
Type Electric Standard
Bike
Figure 4
by
Number of Rides
IN A FUTURE? 61 PANORAMA 2024
Bike Type Electric Standard Q3
Year
WHAT’S


 Figure 5
FRAMEWORK 62
Side A (left) and Side B (right) of proposed enhanced Indego signage PHILADELPHIA 2026: A LEGACY
PLANNING
accessibility and quality, based on precedent in SEPTA Metro and the Mexico City Metro system design that grew out of the Mexico 1968 Olympics.6
Side A: putting you and your location in context
Bicycle and charging icon stands out prominently on top
Area name takes prominence over cross street
Iconography prioritized over English phrases for non-English speakers
Side B: giving you the confidence to navigate the city’s bicycle network
Directions & time give indications of length and direction of bike ride
Subway-style bike map flips traditional road hierarchy
SEPTA Metro branding included to foster bike share & transit connectivity
ShopLegacy Philly
In 2026, residents & visitors will visit neighborhood gateways across the City, with many visiting iconic eateries, shops, and venues. 2026 offers a unique time for the City to celebrate the historical and cultural impact of legacy businesses and their multigenerational contribution of shaping the City. But how can the City recognize legacy small businesses in 2026 and leave-inplace long-term strategies to support them?
“Legacy Businesses” are small businesses with a long-standing presence in their community, recognized for their cultural & economic significance. Legacy businesses face multiple challenges in today’s business landscape— changing technology and consumer preferences & neighborhood demographics, a lack of succession planning, and rising operational costs. Despite their historical significance, legacy businesses must innovate and need support to thrive while preserving their legacies.
Promote & Celebrate Commerical Corridors Foster Connections & KnowledgeSharing Avoid Displacement & Commercial Closure Support Transition & Succession Planning
WHAT’S IN A FUTURE? 63 PANORAMA
2024

Showcasing legacy businesses throughout 2026 & after this program can help support legacy businesses and increase economic opportunity in local commercial corridors. Legacy businesses are neighborhood anchors that have helped to shape the City’s unique identity.
Make it a Philly Thing!
Philadelphia’s neighborhood gateways, iconic eateries, shops, and venues are places loved by both residents and visitors alike. By strategically showcasing local businesses in 2026, Philadelphia can maximize these significant events’ economic and cultural opportunities.
Strategies to showcase Philadelphia’s legacy businesses could include defining periods of time or particular tools where resources and attention are dedicated to shining a light on these businesses. For example, a ShopLegacy Month could be a dedicated period during which a community or city celebrates and recognizes long standing local businesses that have played a pivotal role in shaping the area’s history, culture, and economy. The Department of Commerce would sponsor booths at events like the “Christmas Village” in Dilworth and LOVE Parks and then provide grants for establishments to manage the spaces and bring on and support local businesses.
The African Cultural Art Forum is a community store offering a range of products produced by Black crafters, makers, and other creatives (photo by flickr/7beachbum, CC BY 2.0)
64
PHILADELPHIA 2026: A LEGACY PLANNING FRAMEWORK
To supplement these seasonal impacts, a tool such as Passport ‘26 initiative supporting legacy small businesses in Philadelphia serves as a dynamic initiative to celebrate the city’s rich cultural heritage and stimulate economic vitality—educating individuals about cultural contributions, incentivizing repeat visits through discounts, and fostering intra-corridor collaboration.
Legacy Playbook
A Legacy Business Program is a small business development initiative that aims to recognize, support, and promote long standing businesses that have played a significant role in the cultural and economic history of the City. Although Philadelphia does not have a one-stop shop for legacy businesses, the Department of Commerce already offers several resources for small businesses. Envisioning a legacy business program in Philadelphia would primarily center on rebranding existing tools to consider legacy businesses & to consider additional tools to distinctly support legacy businesses.
The Legacy Business Register can be implemented before 2026. The recommendations for setting up the register involve simple tasks, such as confirming criteria and nomination processes, incorporating language into a new section of the City of Philadelphia website, and developing application documents by drawing inspiration from successful models for information reimagining.
Budgeting for this program will depend on the incentives offered by the City of Philadelphia to registered legacy businesses and the program’s duration.
ShopLegacy Philly
would be administered as an active registry and one-stop resource program under Philadelphia’s Department of Commerce within the Office of Neighborhood Economic Development. Creating a register will require grappling with a few key considerations, including how to define a legacy business, prioritization of commercial corridors in the Neighborhood Preservation Initiative (NPI) priority communities, and when to rebrand existing tools or create new tools.
By strategically showcasing local businesses in 2026, Philadelphia can maximize these significant events’ economic and cultural opportunities.
Looking to Peer City Legacy Business Programs
Boston and San Fransisco are strong case studies to demonstrate what resources could be created with ShopLegacy Philly. In 2015, San Francisco’s Office of Small Business established a registry anf resource program
WHAT’S IN A FUTURE?
65 PANORAMA 2024
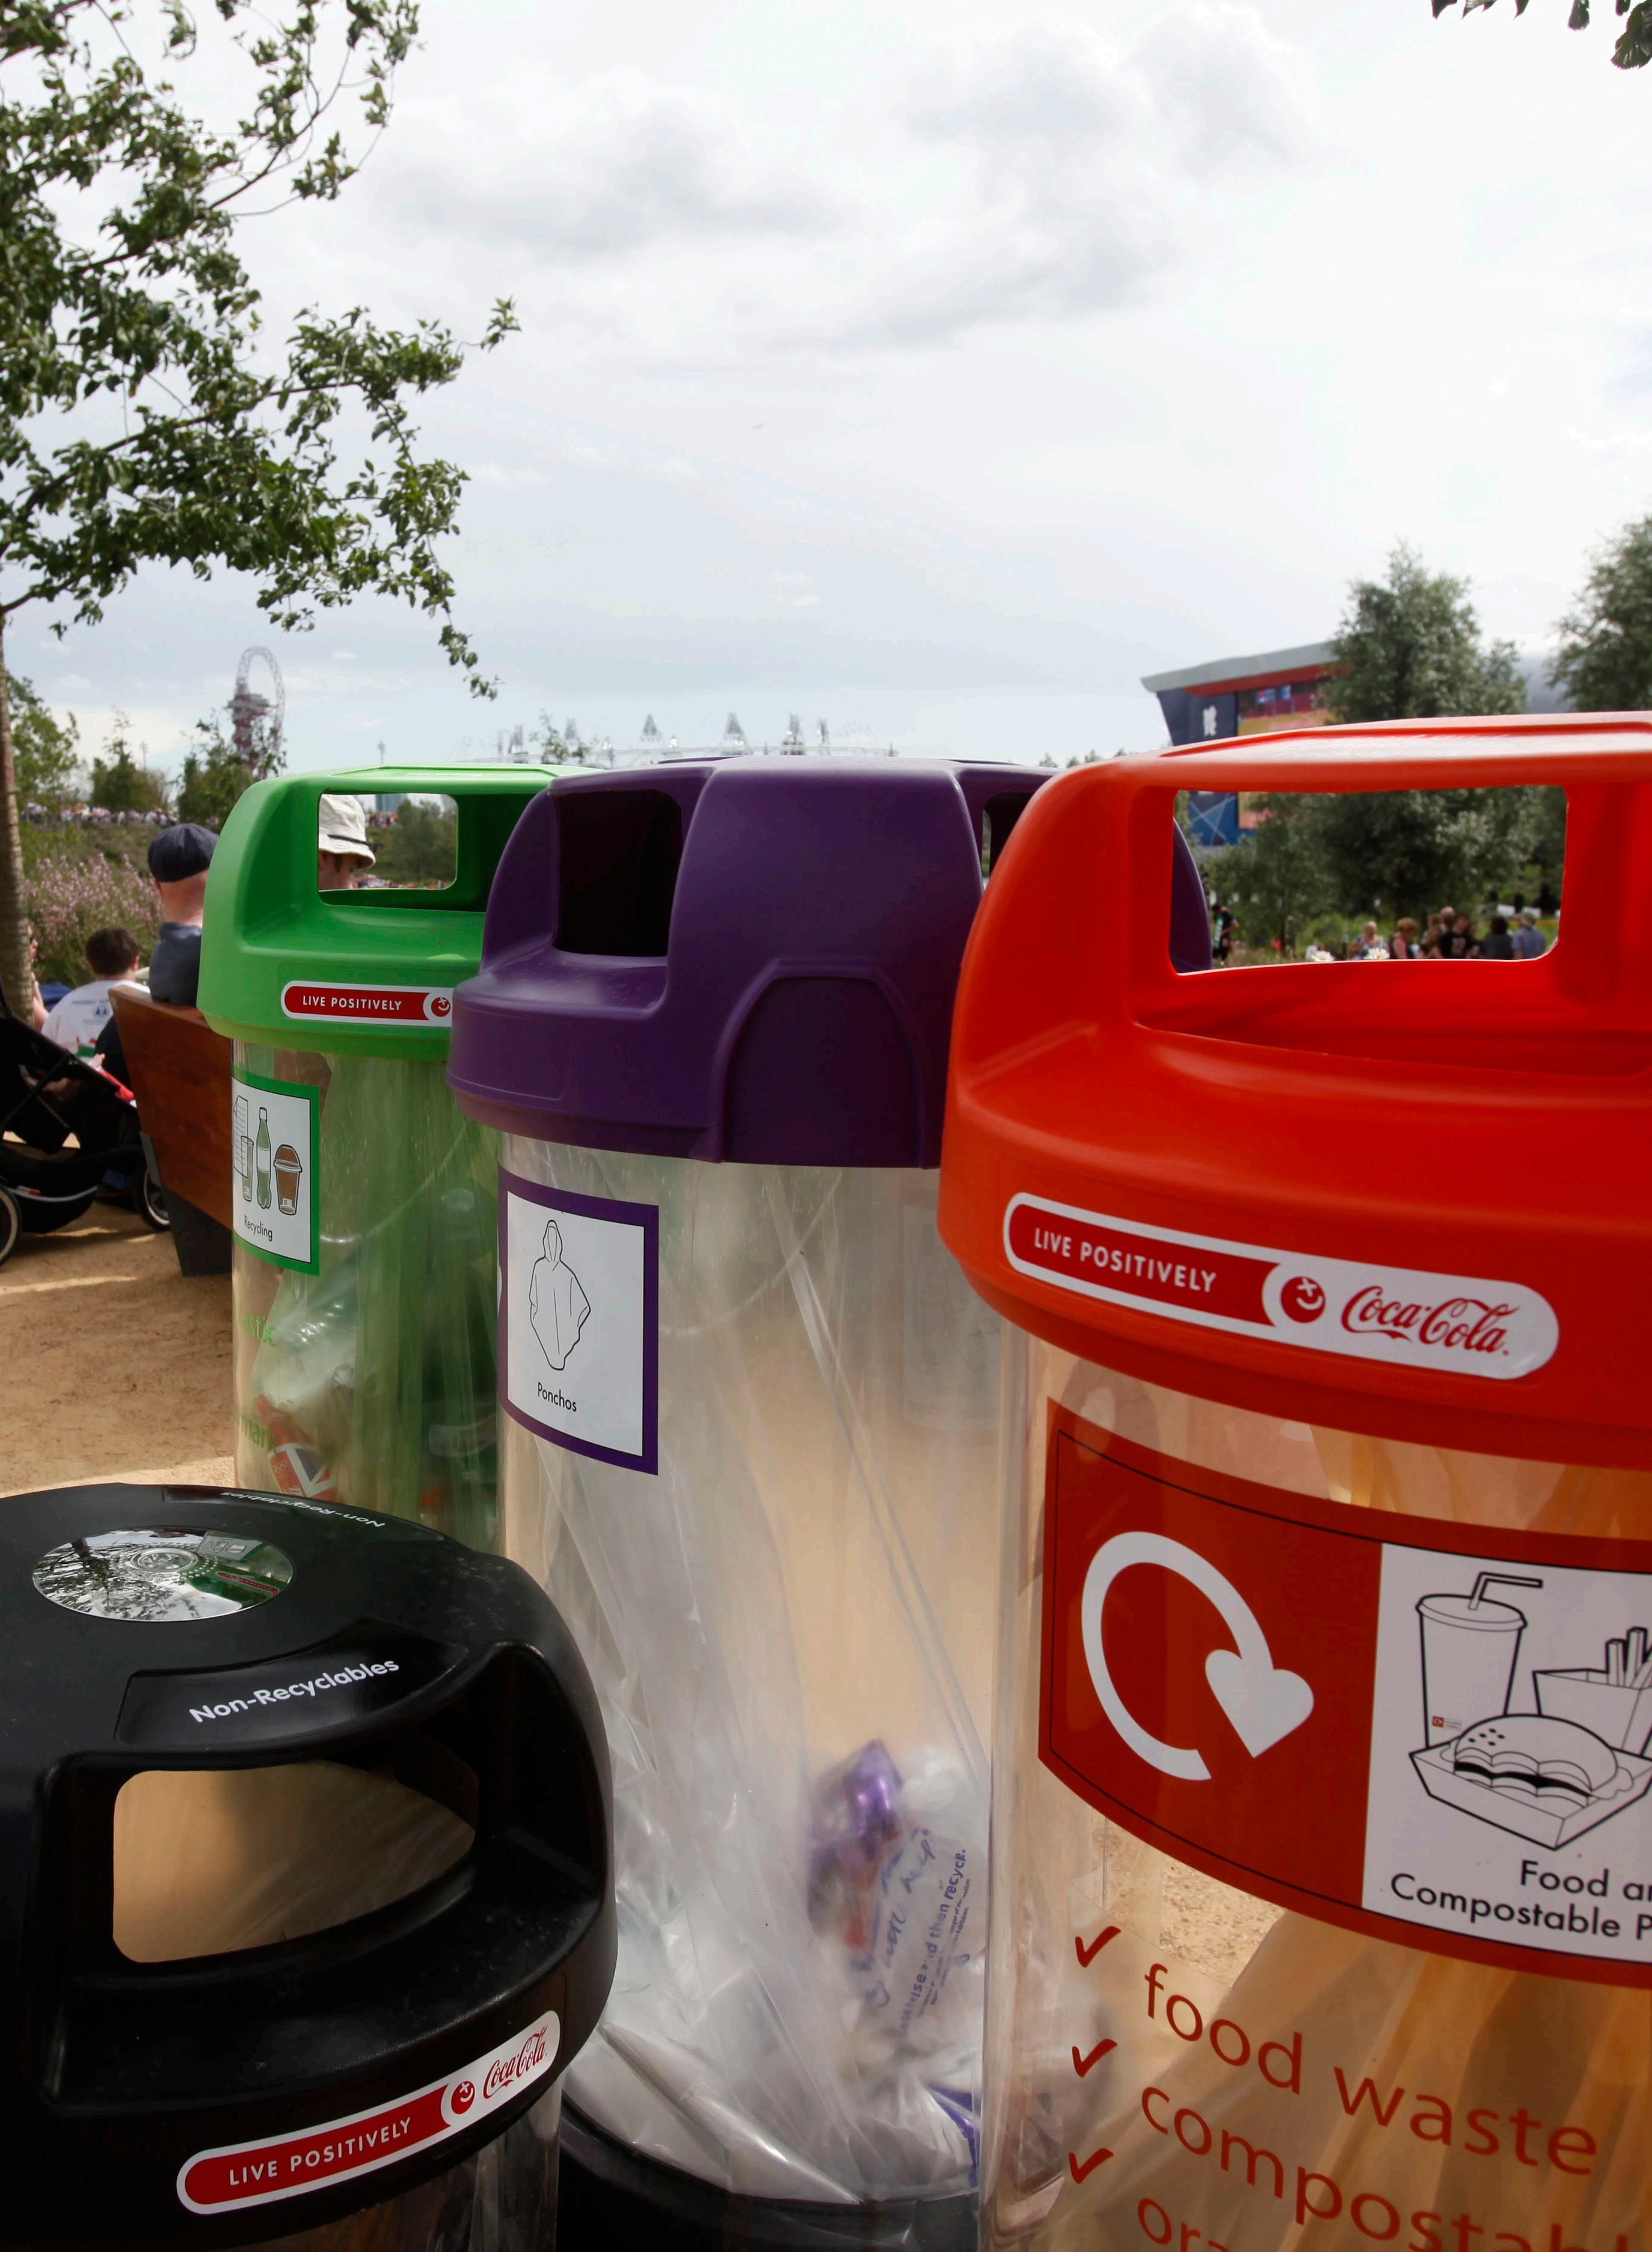
66
The 2012 London Olympics waste management strategy is a strong model for future mega-events (Photo by UK Department for Media, Culture, and Sport; CC BY-NC 2.0)
WHAT’S IN A FUTURE?
for long-standing businesses, becoming the first municipal legacy business program in the U.S. Since 2015, many cities have recognized the value of long-standing businesses in preserving their cultural and economic heritage & have adopted/adapted the San Francisco model to their cities. By supporting these businesses through incentives, recognition, and resources, municipal legacy business programs connect small business development with historic preservation.
Since 2015, cities across the United States have created legacy business programs that reflect a need to register & offer resources. These include legacy business registers, a directory to promote cultural resources and data keeping, and legacy business programs to administer technical and financial resources.
Step to Zero Waste
In 2026, Philadelphia has an opportunity to take a huge step forward in achieving its goal of being a zero-waste city by 2035, as outlined in the 2017 Litter and Zero Waste Action Plan. With Semiquincentennial commemorations, FIFA World Cup soccer games, block parties, watch parties, street festivals, and parades, neighborhoods around the city will be abuzz with people and activities! Our studio group explored how the city can leverage the citywide events taking place in 2026 to educate, create buy-in, and develop trust about the importance of moving the city toward the zero-waste goal. Visitors will see Philadelphia as a sustainable 21st century city. Residents will take pride in a clean, forward-thinking city that is leading the way in developing creative innovation solutions to waste management.
Reaching zero-waste is critical for Philadelphia for several reasons:
Environmental Justice
Importance to Residents Climate Change Fiscal Savings
Zero-Waste in Philadelphia
Like more than 90 cities across the United States, Philadelphia has a zero waste goal. Set in 2017 by the Zero Waste and Litter Cabinet (ZWLC), Philadelphia will divert 90% of its waste away from landfills and incinerators by 2035. Cities across the country have identified dozens of focus areas to reach their goal. Many of the strategies are unique to the locale. Philadelphia
67 PANORAMA 2024
identified four zero waste focus areas.
With Philadelphia’s rich calendar of events each year, the ZWLC created a Zero Waste Events Program that made a system for waste diversion during events. Through a collaborative effort between city departments, event planners could opt-in to the zero waste events program. Opting in would trigger a bundle of services including volunteers, 3-stream waste bins, best practices tips, and use of a tool to calculate waste diversion rates.
“Philadelphia spends more than $48 million annually to address illegal dumping and litter.”
—Keep Pennsylvania Beautiful report
This Program effectively ended when the ZWLC was disbanded in 2020. However, zero-waste concepts are alive and well in Philadelphia. Both private businesses and the city are engaging in both zero-waste and circular economy efforts, including composting at 50 city recreation centers, the 2021 plastic bag ban, and zero-waste refill service The Rounds. 2026 is a perfect time to recreate, expand, and improve this program.
Waste diversion has many benefits, including lessening the use of incinerators that cause health issues like asthma, heart disease, and high blood pressure in surrounding communities. Additionally, Zero Waste efforts are critical to curbing he heavy fiscal and quality of life impacts caused by illegal dumping. Philadelphia spends more than $48 million annually to address these issues.
Recommendations
Our studio group has created six recommendations that we encourage the Parker Administration to implement for how events can help the city reach zero-waste. These were formulated by researching waste diversion in Philadelphia, studying international best practices, and talking with Philadelphia waste advocates.
Mayor-Elect Parker campaigned on creating a cleaner and greener Philadelphia. By pursuing zero-waste events, a cleaner and greener city will be on display for visitors and residents alike for the events of 2026, a legacy that could last for decades to come.
PHILADELPHIA
FRAMEWORK 68
2026: A LEGACY PLANNING
WHAT’S IN A FUTURE?

Reccomendation Description
Reestablish the Zero-Waste Litter Cabinet
Create Neighborhood Nodes for Recycling and Composting
Implement Actions that Maximize Waste Diversion at Events
Create Community Jobs by Establishing a Zero-Waste Events
Encourage Event Organizer Participation
Mayor-Elect Parker pledged on the campaign trail to revive the Zero-Waste Litter Cabinet that was eliminated in 2020. We encourage the next administration to keep this promise, and to prioritize discretionary funding to ensure the program continues.
Since the passage of the Bipartisan Infrastructure Law, there are now new funding streams for municipalities to invest in their recycling and composting infrastructure. We recommend that the city use grant funding to create neighborhood-scale waste diversion centers in neighborhoods that have been most impacted by Philadelphia’s waste issues.
We recommend the city go beyond its previous actions in encouraging waste diversion at events. Our recommendations include investing in new waste bins and branding, refillable water stations, connecting event organizers with sustainable vendors, and encouraging the city to partner with existing green businesses.
The 2017 Zero-Waste and Litter Action plan utilized volunteers to educate residents. We recommend that the city use this role as a job program to develop a greener economy. By adding this program into Philadelphia’s existing WorkReady program, the city can boost youth employment in the neighborhoods that need it most.
Event organizers used to need to opt-in to being a zero-waste event to receive support from the city. We recommend that the city require large events to participate. Furthermore, the city should make it easier and provide incentives for small events to participate.
Figure 6
Step to Zero Waste Reccomendations
69 PANORAMA 2024

70
2026: A LEGACY PLANNING FRAMEWORK
Mural in East Passyunk, Philadelphia (Photo by Bailey Bradford)
PHILADELPHIA
WHAT’S IN A FUTURE?
1 Brunet, Nicole. 2023. “10th Bicycle Death makes 2023 the highest year on record.” Bicycle Coaltion of Greater Philadelphia 2 U.S. Department of Transportation. 2023 “Bikeshare and E-scooter Systems in the U.S.” Bureau of Transportation Statistics 3 Indego. 2023. “Data.” rideindego.com. 4 Geller, Roger. 2006. “Four Types of Cyclists.” 5 Schwering, Angela. 2017. “Wayfinding Through Orientation.” Spatial Cognition & Computation 17(4), 273–303. 6 Byrne, Emmet. 2014. ” Radiant Discord: Lance Wyman on the ’68 Olympic Design and the Tlatelolco Massacre.” Walker Art Center 71 PANORAMA 2024
Endnotes
Stabilizing a City Through a Seed
the History of Neighborhood Stabilization and Community Gardens
 by Bakari Clark
As gardeners, the winter season holds much excitement when planning what is to come from the upcoming months. Many of us hold in high regard this time of year, as we ask ourselves the questions, ‘What worked last year?’ ‘How should I rotate my crops this year?’ ‘Are sweet potatoes and beans actually companion plants?’ and of course, lest we not forget, ‘How can I attract pollinators?’ All of these questions hold the ability to open one’s eyes to the ecological systems that are achieved within sustainable agriculture and how it may be practiced on a community scale.
Living in Philadelphia, I have found that sustainable agriculture is a practice that must be embraced and supported on a neighborhood, city, and state scale. With organizations ranging from the Green Guerillas to the Pennsylvania Horticultural Society, community agriculture systems are created when residents who hold a desire to grow are afforded an opportunity to nurture their skills in a sustainable manner. In cities where cultural diversity stands as an undeniable asset, these community agriculture spaces represent more than just a garden. They also act as a means of preservation and connectivity to the parts of ourselves we value the most—and as planners, this is what we yearn to find. Furthermore, as keen observers and seekers of these great means of community development, planners must always ask ourselves, ‘How did this system come to be?’
Industrialization and 19th Century Community Food Systems
At the turn of the 19th century, industrialization would influence the surge of urban populations around the world, leaving planning for local food systems to community residents and stakeholders. In U.S. cities such as Chicago and New York, European immigration and rural-to-urban migration patterns would create densely populated, and oftentimes unregulated, living conditions for the urban poor. In response to the poor living conditions that many families faced, U.S. Settlement Houses arose as a solution. These institutions would provide food assistance and education programs that taught neighborhood children about healthy foods through developing school gardens, fed local residents through community kitchens, and taught immigrant women how to cook locally grown produce.1 The latter can be seen in The Settlement Cookbook compiled by Lizzie Black Klander, one of the best selling cookbooks to be published at the time, which aimed to teach
Planners must always ask ourselves, ‘How did this system come to be?’
IN A FUTURE?
WHAT’S
73 PANORAMA 2024
immigrant women the proper etiquette for serving and cooking family meals. In addition to the urban community agriculture initiatives, the Progressive era was pivotal for U.S. communities located in the rural south as well. In the late 19th century, rural African American communities would begin developing mutual aid networks, such as the Farmer’s Improvement Society, that centered around community development and economic mobility. Developed in 1890, by Robert Lloyd Smith, the Farmer’s Improvement Society (FIS) began as an agrarian uplift movement for rural African Americans in Texas following Reconstruction.³ A period where sharecropping often characterized the reality for many African American communities, these self improvement ideologies and community lending institutions would create socioeconomic momentum for participating African American residents. As a result, throughout the Progressive era, local African Americans would go from owning only two percent of land in 1870 to owning 31 percent of Texas’ agricultural land by 1910.⁴ In addition to land ownership, residents would also benefit from FIS establishing its own school in 1906, known as the Farmer’s Improvement


74 STABILIZING A CITY
Image taken at Farmer’s Improvement Society College in Ladonia, Texas (Source: The Texas Collection, Baylor University, Texas)

Society College, which would act as a work-study institution for highschoolers– teaching young men practical agricultural and business skills and teaching young women important household skills, such as cooking, gardening, and sewing.5
20th Century Community Food Systems Planning
While the 19th century demonstrated innovative solutions for addressing economic disparities and food inequality amongst both the urban and rural community food systems, throughout the 20th century community agricultural practices would be used as a means of neighborhood stabilization. In the early 20th century, U.S. cities would continue to use urban gardening as an avenue for feeding low-income families during World Wars I, II, and throughout the Great Depression.6 During these decades of economic despair, urban commercial districts would be left blighted from a lack of investment necessary for maintaining them. As a result, women living within urban communities would take on the role of cleaning and maintaining these commercial areas. One of the ways they would practiced their roles as community caretakers were through transforming vacant lots into landscaped gardens.7 While the use of gardens during this time focused more towards landscaping as a mechanism for revitalization, gardens would become a mechanism for achieving both social and environmental justice in the latter half of the century.
WHAT’S IN A FUTURE?
75 PANORAMA 2024
Image taken in 1917, of young children who are a part of Chicago’s Settlement housing gardening program, as they pose with fresh produce in hand (Sourced: Chicago Daily News)
This reality is most prevalent in the evolution of New York City’s community garden network, known as the GreenThumb Program. The history of this initiative begins in the 1970s, following a time when economic decline and blight plagued the landscape of many neighborhoods throughout New York City. As an act of mobilization, community stakeholders, such as Liz Christy,

From grassroots organizing to being the foundation for city-wide programs, the correlation between neighborhood stabilization and the evolution of community gardens still remain relevant today.
and community organizations, such as the Green Guerillas, would take a radical stance in addressing this disinvestment.8 Through the use of seed “bombs”–a combination of seeds, soil, fertilizers, and glass Christmas ornaments–vacant lots were transformed into inviting green spaces.9 It would be these acts of early community resistance that the foundation for New York City’s illustrious community garden network would be developed into what is now known as the GreenThumb Initiative. This Garden Preservation program is now one of the largest community garden networks in the nation with roughly 550 community gardens preserved and over 20,000 garden members.10
Another city that is well known for its community garden network is Seattle, Washington, where its P-Patch Program offers community members in all neighborhoods an opportunity to grow produce using organic practices. Organized by community members in the early 1970s, the P-Patch Programs’ found its name after the Picardo Farm, which is the land that the first community garden was built upon. Due to the gardens’ ability to successfully act as a community asset, the city would develop this program into Seattle’s own “publicly administered organic community garden program.” Today, this garden network holds 90 community gardens on roughly 15 acres of land.11
The Outcome of the Environmental Movement
These efforts of local environmental organizing would come just a decade before federal and state policies would address the deterioration of natural resources through national efforts to preserve and conserve environmental assets.12 Through the use of public institutions such as land trusts, open
76 STABILIZING A CITY
spaces and natural environments, landscapes in both urban and rural areas would be preserved for the ecological benefits they provide to surrounding ecosystems. This was a win for community gardens, seeing as land trusts are often used as avenues for community gardens to find permanent uses within the urban fabric across the U.S.. Today, cities such as Philadelphia partner with local nonprofits to help preserve community gardens that are valued by local residents, yet face the pressures of encroaching development. Organizations such as Neighborhood Garden Trust (NGT) initiate this work through partnering with cities to secure long-term leases or land ownership over the property that the community garden sits on, creating a greater opportunity for the preservation of green spaces, natural resources, and long-lasting community food systems.13
Conclusion
Community gardens serve as an anchor in developing local food systems. From grassroot organizing to being the foundation for city-wide programs, the correlation between neighborhood stabilization and the evolution of community gardens still remain relevant today. Under the protection of organizations such as the Neighborhood Garden Trust and GreenThumb, communities are able to see the preservation of their gardens and their ability to create a sense of place. Furthermore, as the garden season begins again, community gardens will, once more, begin the cycle of evolving into a place of history, health, and sovereignty. Allowing residents from all cultures and walks of life the opportunity to connect to their local environment and food.
WHAT’S IN A FUTURE?
77 PANORAMA 2024
Endnotes
1 Domenic Vitiello and Catherine Brinkley, “The Hidden History of Food System Planning” Journal of Planning History vol.13, no.2 (May 2014): 99-100.f
2 Layla Schlack, “The Settlement Cookbook: 116 Years and 40 Editions Later,” TASTE, July 14, 2022.
3 Andrea Roberts, “The Farmers’ Improvement Society and the Women’s Barnyard Auxiliary of Texas: African American Community Building in the Progressive Era,” Journal of Planning History 16, no. 3 (2017): 225
4 Andrea Roberts, “The Farmers’ Improvement Society and the Women’s Barnyard Auxiliary of Texas: African American Community Building in the Progressive Era,” Journal of Planning History 16, no. 3 (2017): 225
5 Mason-Gray, Jov-van-ta. “The Farmer’s Improvement Society College, 1906-1947.” East Texas History.
6 Domenic Vitiello and Catherine Brinkley, “The Hidden History of Food System Planning” Journal of Planning History vol.13, no.2 (May 2014): 101.
7 Isenberg, Alison. “Chapter 1. City Beautiful or Beautiful Mess? The Gendered Origins of a Civic Ideal” In Downtown America: A History of the Place and the People Who Made It, 24. Chicago: University of Chicago Press, 2004.
8 “History of the Community Garden Movement : NYC Parks.” History of the Community Garden Movement.
9 Hauck-Lawson, Annie. “My Little Town- A Brooklyn Girl’s Food Voice.” Essay. In Gastropolis Food & New York City, 77–78, n.d.
10 “History of the Community Garden Movement : NYC Parks.” History of the Community Garden Movement.
11 Hou, Jeffrey, Julie M. Johnson, and Laura J. Lawson. “Greening Cities, Growing Communities: Learning from Seattle’s Urban Community Gardens.” University of Washington Press and the Landscape Architecture Foundation 29, no. 2 (January 1, 2010): 48–51.
12 Daniels, Thomas L. “A Trail across Time: American Environmental Planning from City Beautiful to Sustainability.” Journal of the American Planning Association 75, no. 2 (March 27, 2009): 186.
13 “Preservation.” Neighborhood Gardens Trust. Accessed February 19, 2024. https://www.ngtrust.org/preservation/.
About the Author
Studying to become an environmental planner, Bakari’s belief in the power of planning for equitable and ecological community development is the framework for much of her work. Bakaris planning career began at Temple University, where she received her bachelors in Community Development. During her time at Temple, she worked at an urban farm called Philly Forest, where her passion for sustainable urban agriculture grew. Today, much of her academic work looks at how to nurture community food systems by highlighting the successes and challenges of providing people adequate access to affordable, cultural, and healthy food.

78 STABILIZING A CITY

WHAT’S IN A FUTURE?
79 PANORAMA 2024
Community garden in Kingsessing, Philadelphia (Photo by Jonathan Zisk)
Absorb, Adapt,

Exploring the Potential of Sponge Cities for Climate Resilience
by Elaina Geiger
Thrive
Cities around the world are faced with adapting to a changing global climate. Whether it’s extreme heat or high levels of precipitation, urban spaces are evolving to sustain these new, more extreme environmental challenges.
At the same time, cities are growing in size and population, with a predicted 5 billion people living in cities by 2030.1 Cities may account for this influx of residences by physically expanding their infrastructure, oftentimes using materials such as asphalt and concrete to do so. These materials are considered to be impervious, and in the event of high rainfall, these surfaces can cause high quantities of stormwater runoff that could lead to overloaded systems and flash flooding.
For example, San Diego, a drought-prone city in California that averages about 10 inches of rain a year, experienced four inches of rain in one week in February 2024, 2 resulting in overloaded stormwater systems that led to to severe and dangerous flooding.3 Materials like concrete and asphalt are also known to absorb as much as 95% of the sun’s energy, which is then radiated into the surrounding environment, making cities hotter.4 In order to combat climate change and create resilient cities, an alternative to these impervious materials must be found.
Sponge Cities and their Design
A “sponge city” is an urban planning model recently created in China that uses green infrastructure to manage flooding and urban heat in cities vulnerable to environmental threats. These cities contain an abundance of natural green spaces such as forests, lakes, and parks that are intended to absorb rain and prevent flooding.5 They can also use tools and technology such as green roofs, green facades, and swales to create more absorbent surfaces in place of the typical impermeable materials used for these structures. This concept has been popular in cities around the world struggling with environmental challenges that are exacerbated by climate change. On a smaller scale, Toronto, Canada, has an eco-roof incentive, encouraging homes and buildings to opt for green roofs to help mitigate stormwater management.6 There has been an abundance of media coverage surrounding cities taking concepts from sponge city projects to gradually implement into their urban environment as this issue becomes more pressing for some regions around the world. The term “sponge city” is meant to reflect the city’s ability to capture water, much like a reservoir, and absorb it rather than repel it. Because these cities are holding water within the natural and sustainably-built environment instead of losing it to evaporation, they are also more resilient to drought and dry spells.
Another benefit to sponge cities is that structures and implemented design solutions can clean rainwater in the absorption process. Using
IN A FUTURE?
WHAT’S
81 PANORAMA 2024
permeable roads to collect rainfall not only prevents the collection of littered or larger materials from being swept up into the stormwater runoff, but can also filter out smaller particles in the process of seeping into the ground or green spaces. For example, Lingang Park in Shanghai uses sponge city infrastructure to both retain rainwater from runoff and purify the water through eco-engineering. The park is divided into four quadrants that consist of wetlands, ponds, and floating islands. The sponge park is placed between two rivers where water is pumped from one river through the sponge park, into the other. Water is pumped into the park through a skimmer that removes surface debris from the runoff, which then travels through filtration ponds containing aquatic plants that help to purify the water. According to an engineer with the China Construction Technology Consulting firm, the system can purify “up to 15,000 cubic meters of water per day, as the water quality rises from Grade V to Grade III when it flows back to the river.” 7 For context, water quality that ranks Grades I to III are suitable for all applications, whereas Grade V water is unsafe to use for any purpose.8
Sponge cities are developed using design methods that have minimal negative impacts on the environment, including Low Impact Development (LID) and Water Sensitive Urban Design (WSUD).9 These initiatives refer to systems that use natural processes when managing stormwater in order to protect water quality and the associated ecosystem.10 Each of these initiatives include a set of principles that can be applied to urban design methods to create climate-resilient cities such as sponge cities. With flooding being one of the most serious water-related issues that China faces in today’s climate, the

82
A view of Dandong New District from Dengtashan Park (Photo by Ajew)
ABSORB, ADAPT, THRIVE

country has launched a pilot program using a combination of these principles to broadly implement sponge city principles. The aim is to have 80 percent of urban areas embedded with “sponge facilities to absorb and reuse at least 70 percent of rainwater.” 11 There are currently 30 metropolises that are participating in the campaign to make Chinese cities “spongier.”
Case Study: Xiamen, China
An example of a sponge city’s design implementation is in Xiamen, China. In 2015, the city was selected as an early-stage pilot for environmentally sustainable flood control methods to be applied to a city susceptible to water-related issues. Studies have shown that the city experiences varying precipitation patterns, with a decrease in the number of annual precipitation days, yet an increase in the average precipitation intensity. According to China’s Climate Risk and Resilience (CRR) plan, Xiamen’s sponge city initiatives prioritize environmental aspects such as runoff and water quality, rainwater utilization rates, and wastewater recycling rates. The plan has established the goal of “building a comprehensive and holistic water system that helps prevent and cope with water-related disasters”. The city has also outlined a set of objectives to guarantee an “improved water environment” split into six different systems, including pollution prevention and control, river and lake water network construction, garden and green space construction, drainage and waterlogging prevention, road traffic construction, and sponge community construction.¹2
To highlight a particular goal, the sponge community construction objective highlights two recommendations to achieve an effective and successful sponge city: the reconstruction of the old community, and the construction
IN A FUTURE? 83 PANORAMA 2024
Rooftops in Shanghai (Photo by kafka4prex/Flickr)
WHAT’S
of the new community. Through the reconstruction of the old community, it was important to planners to improve upon the infrastructure in a way that does not entirely strip its heritage, but instead improves the efficiency and sustainability of existing structures. This includes increasing the permeable pavement rate in reconstruction to no less than 40% of surfaces in the sponge city without digging up roads with a cultural or historical significance. The construction of the new community requires that all new roads and squares in all residential areas are to be paved with permeable pavement, with the rate for new construction not less than 70 percent. Permeable concrete is an important aspect of sponge cities, as it allows for water from precipitation to pass directly through, therefore reducing the stormwater runoff that may occur in the event of a major rainfall. Permeable pavements also prevent pollutants from travelling into stormwater systems, absorbing them upon contact, rather than having them swept up with stormwater runoff into sewage systems.

“In planning these projects, there must be equitable access to services and opportunities, participation in decision-making processes, and the acknowledgement of vulnerable groups”
In 2015, regions of Xiamen that were prone to flooding and other water-related issues were chosen as the pilot projects of sponge city construction, including the Yangtang residential area. This 620,000 m2 area previously consisted of villages, bare soil, farmland, and ponds, but due to a housing demand in the city, the area was converted into a residential community. In the face of development, the area experienced many urban water-related issues such as surface runoff pollution and road water accumulation. In order to combat these issues, the construction objectives included source reduction and intermediate transfer of stormwater runoff, as well as a complex underground pipe network to control the flow of water under and around the community. Facilities such as sunken green spaces, biological retention zones, and green roofs were also included in the development of this pilot sponge city project.
84 ABSORB, ADAPT, THRIVE
Continuing Challenges and Opportunities
Despite the environmental benefits that sponge cities can provide for urban areas faced with extreme effects of climate change, there are also some challenges that must be considered before a wide implementation of this concept. In planning these projects, there must be equitable access to services and opportunities, participation in decision-making processes, and the acknowledgement of vulnerable groups.13 An impact assessment conducted for Baicheng City, another sponge city pilot project in China, shows that although the sponge city program has enhanced distributional equity, there is a need to achieve procedural justice for disproportionately affected communities when it comes to the decision-making process. The issue of underrepresented communities being left out of the planning process is broader than just sponge cities, and conceptual planning must incorporate justice into policy and design. Also, there are some central contradictions surrounding the environmental and economic agendas of a sponge city, and whether or not the effort is an excuse for new investment in the urban construction and financial innovation fields. This development may offer local government more opportunities for private investors to profit off of infrastructure projects for sponge cities. It might also justify the “direct intervention of the government in financing and construction through a local expansion agenda”.14 Although this may not necessarily be true for all cities implementing a sponge city design, it is worth
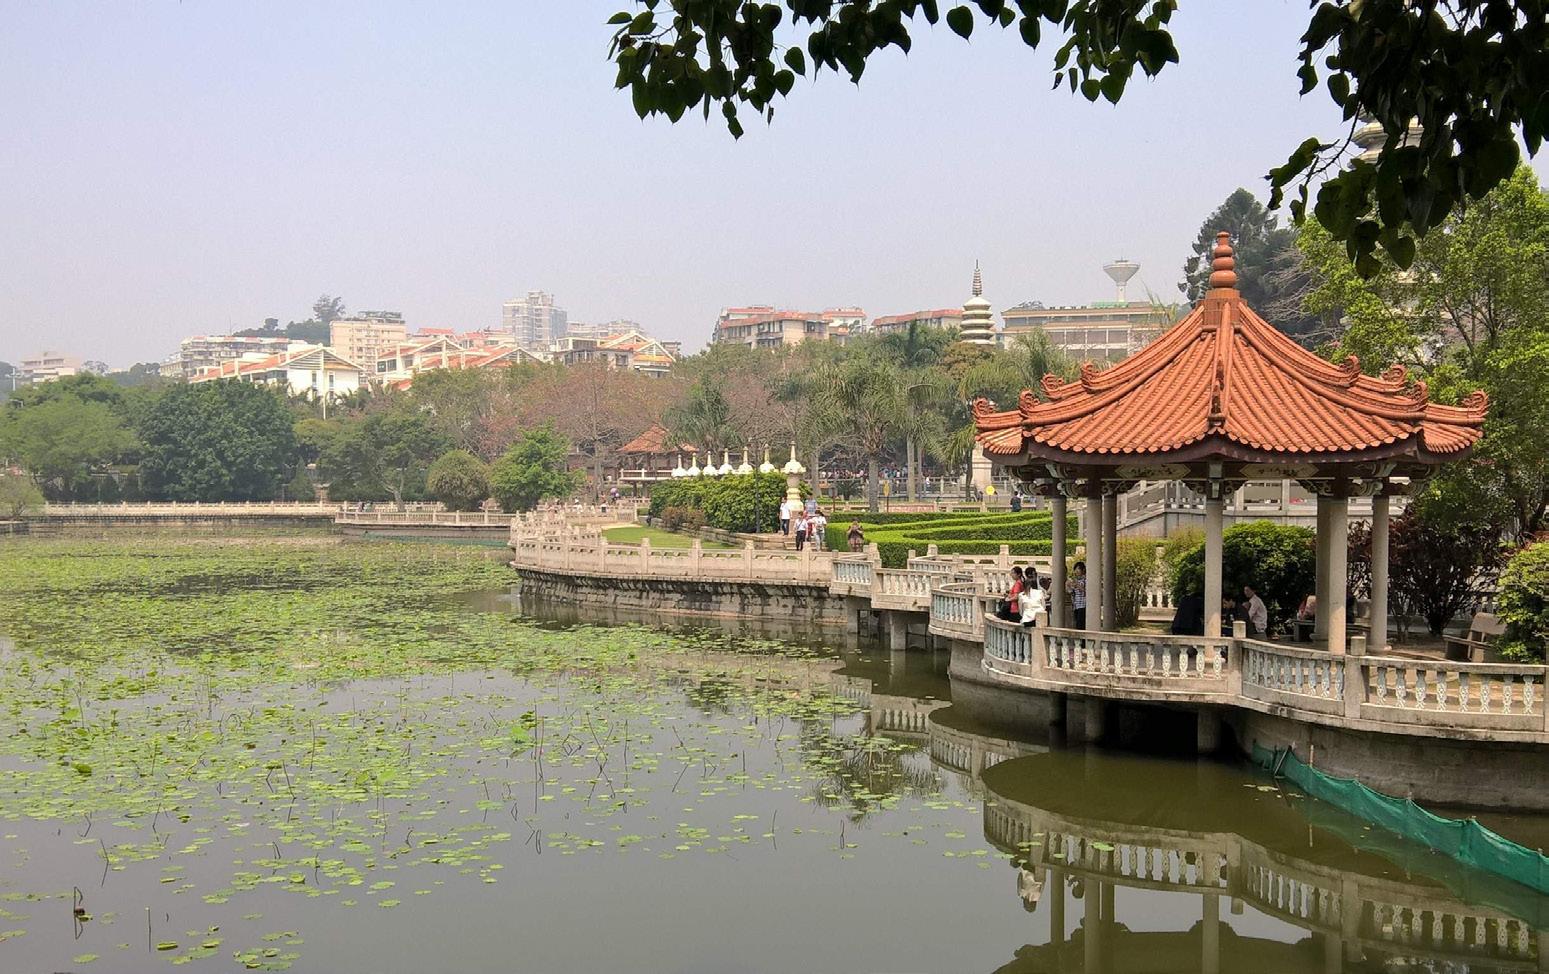 Xiamen, China (Photo by Felix Wong)
WHAT’S IN A FUTURE? 85 PANORAMA 2024
considering to ensure that the development is in good faith, as well as transparent and honest. It is difficult to find any clear results of how the implementation of sponge city systems have improved or changed the built environment of Xiamen, or any city for that matter. There is yet to be an update of the success of these concepts nearly 10 years after first mention of sponge cities in a city’s climate action plan, and few other cities have followed in Xiamen’s footsteps. There are aspects of sponge cities that many cities have adapted, such as green roofs and rain gardens, but not many places have taken on the challenge in developing a large-scale region into a sponge city by definition. This could be due to a lack of sufficient proof or information on the environmental benefits that sponge cities provide.
Overall, a main challenge that cities around the world face with the escalation of the climate crisis is how to be responsive to shocks like changing weather, extreme conditions, and other climate hazards. New designs and concepts like sponge cities can help to solve the issue of cities being unprepared for future conditions. These concepts, while their implementation outcomes are uncertain, may have an important place in building climate-resilient cities across the globe.

86 ABSORB, ADAPT, THRIVE
Endnotes

About the Author
Elaina Geiger is a first-year Master of City Planning student studying Land Use and Environmental Planning. After graduating from the University of Pittsburgh as an environmental engineering student in April of 2023, Elaina has continued to explore her passion for the natural environment and how it can best coincide with the environment that we build. In her free time, you can find her walking around Philly, with a coffee in hand and headphones blasting Taylor Swift, in search of her favorite street in the city.
1 TheWorldCounts.com. “World Urban Population.” Last modified February 23, 2024. 2 Carol, John. “The atmospheric river has passed over LA and San Diego, with another storm behind it,” NPR, February 6, 2024. 3 Rivas, Alexis and Dorfman, Mike. “San Diego city leaders said stormwater system was vulnerable months before rainstorm,” NBC San Diego, January 29, 2024. 4 Zafra, Mariano. “The floor is lava: How concrete, asphalt and urban heat islands add to the misery of heat waves,” Reuters, July 31, 2023 5 Harrisberg, Kim. “What are ‘sponge cities’ and how can they prevent floods?” United Nations Framework Convention on Climate Change, April 11, 2022. 6 City of Toronto, “Green Roofs,” City of Toronto 7 Yi, Xing. “Sponge city,” China Daily, Last updated October 29, 2021. 8 Yu, Jiawen et al. “A Comparative Study of Water Quality and Human Health Risk Assessment in Longevity Area and Adjacent Non-Longevity Area,” National Library of Medicine, October 4, 2019. 9 Climate Risk and Resilience in China (CRR). “Xiamen: Adapting to Climate Change with Sponge City Construction,” Climate Cooperation China, July 7, 2020. 10 OW US EPA, “Nonpoint Source: Urban Areas,” Overviews and Factsheets, September 15, 2015. 11 Yi, Xing. “Sponge City” 12 Climate Risk and Resilience in China. 13 Wang, Sisi et al. “Sponge City and social equity: Impact assessment of urban stormwater management in Baicheng City, China,” Urban Climate, Volume 37, May 2021. 14 Cai, Hongru. “Decoding Sponge City in Shenzhen: resilience program or growth policy?” Massachusetts Institute of Technology, 2017.
FUTURE? 87
WHAT’S IN A
PANORAMA 2024
Flooding in
Ghana’s Volta Region
An Analysis Using GIS
 by Sylvanus Narh Duamor
On September 15, 2023, the Volta River Authority (VRA) began a controlled release of water from the Akosombo Dam to prevent it from potentially overtopping. The spillage led to flooding in low-lying areas along the river, including Mepe, Battor, Sogakope, Mafi, Adidome, Ada, and other communities. About 35,900 residents were displaced as a result of the flooding, according to UN, Ghana.1 Using GIS, I try to understand how and why the flooding occurred in those areas
The Akosombo Dam is one of the largest hydroelectric dams in Africa. It was constructed to generate electricity for the whole of Ghana and its eastern neighbors, including Togo and Benin. Since the time of the dam’s construction, the VRA has been forced to conduct several spillages to safeguard the dam’s integrity and prevent devastating consequences–the most recent spillage occurring in 2010. 2 The impact of the flooding incident that occurred in 2023 was particularly alarming. In addition to being displaced, many of those affected also lost their possessions and livelihoods, as the water inundated their homes and farms. Furthermore, important infrastructure such as roads, bridges, and schools were damaged. The impacts also extended to biodiversity and ecosystems in areas both upstream and downstream of the dam.
Reports indicate that the impacts of the spillages carried out by the VRA have only been increasing–the impacts of each spillage being more severe than the ones before. There are a few factors that have contributed to this. Statistics show that there has been a surge in the total annual rainfall over the past few decades.3 This implies that more water will be drained into the Volta Lake

A FUTURE?
WHAT’S IN
89 PANORAMA 2024
Akosombo Dam spillage (Source: Myrna Machuca-Sierra)
each year until a change in rainfall pattern occurs. A further implication is that the spillages will become more frequent in the coming years. Also, the amount of water that is spilled may depend on the spillage of the Bagre Dam in Burkina Faso (which also has severe impacts on communities in the northern part of Ghana). Another factor that has contributed to the increasing degree of the impacts of the spillages is increasing population in communities downstream and the accompanying settlement expansion along the river. As more people settle in these communities, more people become vulnerable to flooding and are consequently affected by it. The trends of increasing annual rainfall and increasing vulnerable population form a grave combination.
The public and other critics have blamed the VRA for flooding the communities downstream. The VRA, on the other hand, absolves itself from the allegation, indicating that it was a necessary action to prevent a more devastating impact that would be felt not only by the communities downstream, but also by the entire country.4 Many have argued that the VRA could have been more proactive in providing timely information about potential spillages. Others also argue that there has been inadequate monitoring and evaluation of past and current trends of water accumulation at the dam, and no plan for mitigation. The question of how to address the increasing population in communities downstream is another critical matter. These are very important contentions that the VRA, NADMO, the government, and other agencies must grapple with. My aim in this study was to understand how and why communities such as Mepe and Battor experienced the greatest impact during the most recent flooding incident through GIS.
I began by delineating Ghana’s watersheds using Arc Hydro in ArcGIS Pro using Digital Elevation Model (DEM) data on Africa gathered from the USGS website.5 The watershed analysis revealed that there are 81 streams/rivers in Ghana. However, these account for only major rivers and streams. There were other smaller streams that drain into the ones mapped here.
The results showed that almost all the streams and rivers north of the Akwapim-Togo Ranges drain into the Volta River, and the outlet of all the water upstream was the Akosombo Dam. The lake formed as a result of the dam is considered the largest artificial reservoir in the world based on surface area.
The VRA spilled water at a rate of 183,000 cubic feet per second. Reports indicated that low-lying areas along the river, including Mepe, Battor, Sogakope, Mafi, Adidome, and Ada were flooded due to the dam spillage, and satellite images show that these areas are essentially located in wetlands, which are prone to flooding. By mapping the elevation of those areas, I found that they were only five meters above sea level and were also lower than all the areas through which the waters passed before reaching them, making them the most susceptible areas to the incoming spilled water. Battor and Mepe,
90 FLOODING IN GHANA’S VOLTA REGION
WHAT’S IN A FUTURE?

being the first of the low-lying communities, were hit the hardest. By using GIS to map the areas that were impacted by the spillage, we now have a better understanding of how and why the flooding occurred at Mepe, Battor, Sogakope, Mafi, Adidome, Ada, and other communities.
Three main interconnected factors were identified: first, the Akosombo Dam is the faucet to the largest man-made water reservoir in the world (by area) and opening this faucet to release 183,000 cubic feet per second implied flooding downstream. Second, the areas that were impacted were areas that
Figure 2
91
2024
Lake Volta watershed shown in Ghana, highlighting streams that act as drainage for the watershed.
PANORAMA
were low-lying. Third, the areas that experienced the greatest impact were low-lying areas situated along the river that were closest to the dam (since the water would accumulate in these areas first before spreading downstream). This explains why Mepe and Battor were impacted the most. From a planning perspective, this requires delicate planning measures that safeguard the lives and livelihoods of the people living in these areas while preserving these ecologically sensitive zones.

 Figure 3
92 FLOODING IN GHANA’S VOLTA REGION
Flood risk down river of the Akosombo Dam.
Endnotes
1 UN Ghana. 2023. UN in Ghana reaffirms its support to Ghana in the wake of the Akosombo dam spillage disaster. November 06. Accessed February 21, 2024.
2 JoyOnline. 2023a. Spillage of water from Akosombo Dam and the way forward. October 25. Accessed February 11, 2024.
3 Amoako, Clifford, and Frimpong Boamah. 2015. “The three-dimensional causes of flooding in Accra, Ghana.” 109-129.
4 JoyOnline. 2023b. Akosombo Dam spillage: ‘We didn’t sleep on duty’ – VRA absolves itself of blame. Octorber 23. Accessed February 11, 2024.
5 Verdin, K.L. 2017. “Hydrologic Derivatives for Modeling and Applications (HDMA) database: U.S. Geological Survey data release,.”

About the Author
Sylvanus Narh Duamor is a first-year Master of City Planning student in the Land Use and Environmental Planning concentration. Sylvanus is passionate about promoting land use and environmental planning through research and practice, with a special focus on advancing environmental sustainability through climate adaptation and resilience and energy policy. He aims to provide constructive contributions to local, regional and international development planning efforts.
IN A FUTURE?
WHAT’S
93 PANORAMA 2024
EnergLegal Reforms for Transmission Siting Inspired by Maine’s NECEC Project
izing Progress
 by Laura Frances
Large interstate transmission lines are critical for an affordable and efficient clean energy transition, but existing legal frameworks, or lack thereof, make it difficult to site and build them. Federal law leaves siting decisions up to states despite most modern transmission projects’ interstate and international nature. This legal vacuum deepens pathways for local opposition to delay and blocks projects that are critical to achieving the nation’s 2050 carbon-zero goals.
All carbon-zero ambitions in the U.S. are currently infeasible. According to Princeton’s 2021 Net Zero America study, the power grid is at capacity, and to reach carbon-zero in the next 26 years, the country will need to increase its transmission capacity by 2 to 5 times.1 Adding capacity is not the only hurdle. Critical infrastructure nodes such as power plants and transformers are too old to handle the increased capacity and demand. More than 70% of the grid is over 25 years old (2017), 2 and all power plants will need to be replaced by 2050.³
On the flip side, this forced overhaul of our grid has a silver lining. The grid needs to be radically transformed to accommodate our clean energy future. The grid was built to facilitate the top-down flow of fossil fuel energy across the country, with no regard for negative externalities. By comparison, the transition to clean energy demands a bottom-up approach, where distributed clean energy generators – from windy seashores off Alabama to sunny pitched rooftops on New Hampshire cabins – give and take energy from the grid.
In Maine, bare-knuckled legal battles over the New England Clean Energy Connect (NECEC) transmission line project exemplify the challenges ahead. The project was nearly abandoned after an embattling series of legal challenges despite receiving federal and State permits, largely completing the project’s construction, and offering an array of local economic development perks. Despite the projects’ value for clean energy, its opponents expressed valid and urgent legal arguments – a clean energy transition does not need to destroy natural systems, take advantage of the precarious status of tribal lands, or usurp public input.
A green transition must mean a democratic transition.
A green transition must mean a democratic transition. Ordinary citizens can now be energy generators, and nearly 6 million homeowners already are.⁴ Everybody has an unprecedented stake in how the energy grid is built from the ground up. Transmission line siting and permitting need democratic reforms that allow us to keep up with the demand for clean energy distribution while keeping the public involved in projects that are built to serve the
IN A FUTURE?
WHAT’S
95 PANORAMA 2024
public. As author Gretchen Bakke artfully wrote in her book, The Grid, “The grid is built as much from law as from steel.”5 The grid’s legal frameworks must be rapidly reformed to stop gap the current vacuum and ensure a smooth and equitable green transition across the country.
Current Federal Framework
A robust power grid is foundational to the nation’s energy security. How we define robustness is evolving as the grid shifts towards renewable energy sources. To streamline this evolution, the Energy Policy Act of 2005 authorized the Secretary of Energy to establish national interest corridors to alleviate electricity transmission congestion.6 According to the Federal Energy Regulatory Commission (FERC), the provision allows the Commission to expedite siting processes and permitting in select corridors.
“The grid is built as much from law as from steel.”
—Gretchen Bakke, The Grid
However, legal ambiguity muddles these efforts.7 In 2009, after FERC granted such permits for projects in the Southwest, a coalition of petitioners led by the New York State Public Service Commission appealed to the U.S. Fourth Circuit Court of Appeals in Richmond, Va., and the court agreed: FERC cannot assert its power to override transmission siting denials made by states. However, the court’s dissent opined, “that FERC’s authority may be limited does not even suggest that Congress would not have authority to grant applications in some situations in which states had denied them.”8 In 2010 the respondents appealed the case; however, the Supreme Court let the decision stand without comment.9 The legal limits on the federal government’s scope of influence even in ‘national interest corridors’ have impacted developer confidence in pursuing these crucial infrastructure projects for fear of unfettered legal fees and other hold-ups.
The grid is arguably the largest machine in the world; however, it is intensely local. The scale of the nation’s grid is in focus as we transition to renewables because of the seasonal, daily, and hourly mismatches between where power is generated and where it is needed. Moving electricity thousands of miles can happen nearly instantly across high voltage direct current wires. It is possible to optimize how energy is generated and distributed, even across the country’s diverse topography. However, to get there, at least 275,000 miles of new transmission lines need to be built.10
Building hundreds of thousands of miles of new transmission and updating nearly all the existing infrastructure requires coordinated resource allocation and legal pathways to siting and permitting. It is critical to study
96 ENERGIZING PROGRESS: LEGAL REFORMS FOR TRANSMISSION SITING
cases like those in Maine to identify new legal pathways and reforms that govern how we build and manage our grid. We need to be able to permit a clean energy transition that is not mutually exclusive with protecting natural ecosystems or respecting local preferences to secure our energy future.
Case Study: The New England Clean Energy Connect (NECEC)
Compared to the rest of the country, New England is disproportionately dependent on burning fossil fuels to power its electric grid.11 To rapidly decarbonize its grid, in 2016 the Massachusetts legislature passed an act that requires utilities to dramatically increase the amount of electricity sourced from hydropower by 1.2 Gigawatts (GW) and from wind power by 1.6 GW.12 Geographically, Massachusetts’s long and curving coastline is well suited for wind power production.13 However, offshore wind quickly became a political pariah.
Local opposition swiftly rejected projects and strung up legal arguments against turbine installation. 14

In 2018, Massachusetts refocused on its hydropower ambitions instead. The State put forth a request for proposals (RFP) to procure the mandated 1.2 GW. From the start, the RFP process was riddled with controversy. Firstly, RFP responses were reviewed by a panel that included the State’s three distribution utilities: National Grid, Unitil, and Eversource Energy. Suspiciously, Power lines St. Lawrence Seaway, Canada. Canada Saint Lawrence Seaway, 1964 (photo by Bernard Gotfryd Bernard)
WHAT’S IN A FUTURE?
97 PANORAMA 2024
the winning proposal was a joint bid between Hydro-Quebec and Eversource Energy, one of the panelists. The fact that a profit-maximizing corporation had a hand in selecting itself for a lucrative project is not necessarily to say the committee selected the wrong proposal amongst the dozens submitted. It is to say, however, that the bid was incomplete and arguably should have been disqualified. The project hinged on an outstanding permit to bury the transmission wires under the White Mountains in New Hampshire that was ultimately denied.
Embarrassed by misplaced confidence, Massachusetts shifted to an alternative plan to deliver clean energy from Hydro-Quebec in partnership with Central Maine Power Maine (CMP). Wary of looming legal challenges, the project undertook an 18-month comprehensive analysis, and in 2019, CMP’s New England Clean Energy Connect (NECEC) won the Maine Public Utilities Commission’s project approval. This endorsement granted a Certificate of Public Convenience and Necessity (CPCN), which allowed the construction of an electric transmission line from the Maine/Quebec border to Lewiston, Maine. In Lewiston, the deal included a $300 million investment in a new substation that would generate local jobs and would secure Mainers preferential energy rates from clean sources.15
While the deal claimed to “address the twin challenges of climate change and energy affordability,” Mainers did not accept the notion that the energy from Hydro-Quebec was “clean.” 16 Locals claimed the energy would, in fact, be riddled with closed-door corruption, foreign beneficiaries, exploited tribal lands, and significant forest loss to such a degree that it undermined any potential upside.17
CMP was already in hot water with its Maine customers that year for botching the rollout of a new payment system and sending unexpectedly inflated invoices.18 Furthermore, CMP is a subsidiary of Avangrid, the U.S. subsidiary of Iberdrola, a Spanish utility company. So not only was CMP a distrusted foreign utility company, it was set to partner with another foreign utility in Canada. Hydro-Quebec’s reputation was not much better back home than it was in Maine– When they constructed the dams in the mid-1990s, thousands of acres of tribal land were flood flooding displaced wildlife, hunting game, farmland, and local development opportunities. At least five First Nations in Quebec and two Indigenous tribes in New England opposed NECEC, arguing the project is inequitable and unjust.19
Furthermore, the project’s ecological impact was also a non-starter for many locals. For explanatory purposes, the 147-mile transmission line is effectively divided between new and upgraded corridor segments. The approved plan called for 53 miles of a new transmission corridor from the Canadian border to the Forks Plantation area. By using a high-voltage
98 ENERGIZING PROGRESS: LEGAL REFORMS FOR TRANSMISSION SITING

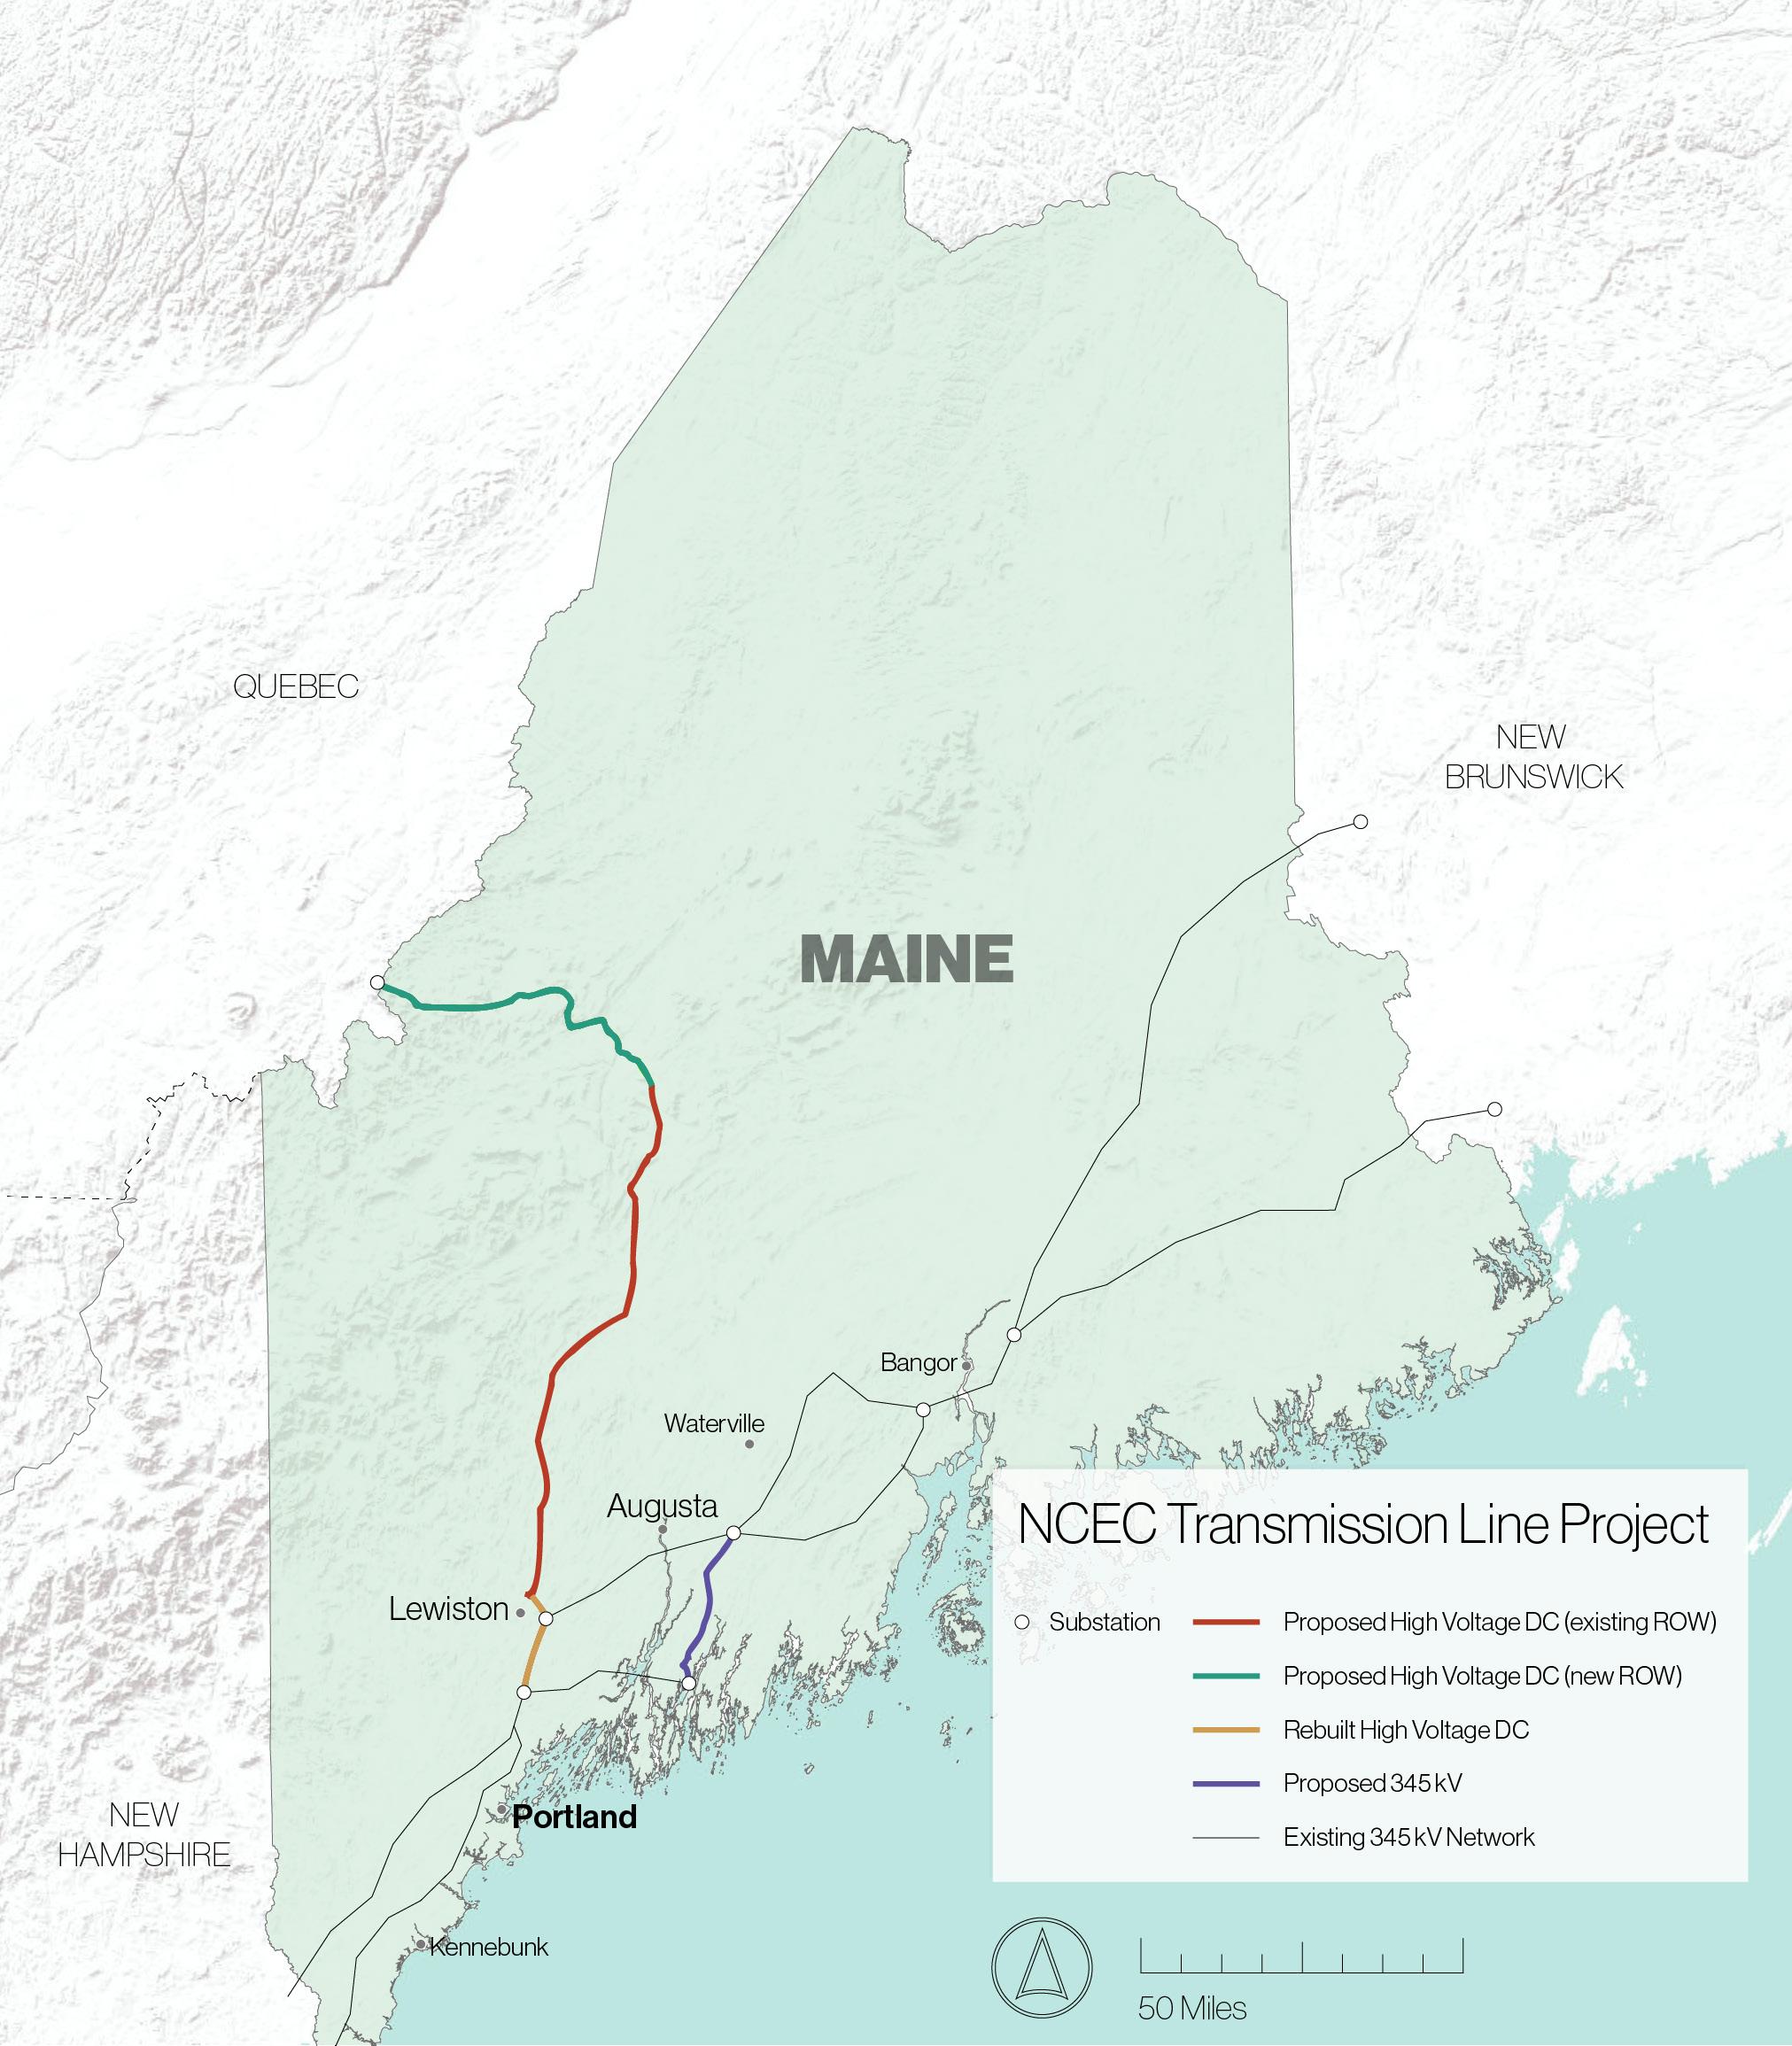
direct-current (HVDC) line, the proposed corridor would measure about 170 feet wide compared to typical 400-foot wide corridors. The remaining 94 miles of the proposed corridor would widen existing “rights-of-way”. In the following months, NECEC started construction spending $450 million to cut 124 miles of line corridor and erected over 100 transmission poles. 20 While the project was seemingly full steam ahead, tumultuous parallel narratives were unfolding between the courts, the public, and the transmission developers.
Legal Challenges and Citizens’ Opposition
Maine residents were determined to find a way to have a say in the NECEC project from day one. From filing over 1,000 public comments to
WHAT’S IN A FUTURE?
1
Figure
99 PANORAMA 2024
Map of NCEC Transmission Line Project
persistently appealing state and local court rulings to suspend project permits, Mainers steadfastly charged up the growing ‘Stop the Corridor’ campaign. While legal challenges and appeals played out in the courts, the public comments evolved into the state’s most expensive ballot initiative campaign in history.
The public referendum aimed to set a retroactive precedent that would not only stymie NECEC’s development but any other projects that intended to leverage legacy leases and land use permits without a 2/3 majority vote in the legislature. On November 2, 2021, 59% of Mainers voted in favor of

We cannot wait for a breakthrough technology to emerge and hyper-accelerate our phasing out of fossil fuels to generate electricity. To surmount this challenge, it is imperative that we establish a national streamlined regulatory framework that fosters efficiency, consistency, and collaboration across jurisdictions.
the referendum and formally challenged NECEC’s constitutionality. To avoiding the need for legislative approval, the NECEC immediately filed to block this retroactive application of the Initiative. 21
The Superior Court denied NECEC’s complaint and kept the Initiative alive, nothing that the complaint was resolved by existing law and that, because of the separation of powers, the Court had no say in legislative affairs. However, the Superior Court Justices offered a historical review of vested rights through the lens of the Maine and U.S. Constitutions and ultimately contended with NECEC that “vested rights are properly viewed as arising from the Maine Constitution’s due process law.” This meant that the Initiative would retroactively interfere with NECEC’s “constitutionally-protected vested rights,”22 and that the NECEC had secured a pathway forward.
This report was not the end of the road for NECEC. The project’s opposition argues that when NECEC continued construction throughout the legal battles, it tried to generate a vested rights claim artificially. Superior
100 ENERGIZING PROGRESS: LEGAL REFORMS FOR TRANSMISSION SITING

Court Justice Michael A. Duddy ordered a jury trial and put the fate of the trials in the hands of nine ordinary citizens - a strategic nod to the people’s desire to secure their voice in Maine’s energy future. In March 2023, the jury unanimously issued a verdict in favor of the project, finding that the construction was undertaken in reliance on the PUC permit and “according to a schedule that was not created or expedited for the purpose of generating a vested rights claim.” In other words, they ruled that the public referendum was unconstitutional. After that, Maine DEP and other regulators lifted their suspensions, and the line was back on track to complete construction and deliver clean energy to the region. For now, the jury sealed the fate of the project, and the ‘Stop the Corridor’ campaign officially closed its books. 23
Recommendations for Reform
The siting and permitting of transmission lines is the Achilles heel of our energy future. 24 We need to decarbonize our economies in the next quarter century, but the protracted and resource-intensive process for siting and permitting transmission lines remains a significant obstacle. We cannot wait for a breakthrough technology to emerge and hyper-accelerate our phasing out of fossil fuels to generate electricity. To surmount this challenge, it is imperative that we establish a national streamlined regulatory framework that fosters efficiency, consistency, and collaboration across jurisdictions.
U.S. Senator Joe Manchin (D-WV) tried to address this issue by introducing the Building American Energy Security Act of 2023 earlier this year. 25
Emphasizing the need for swift action, Manchin noted, “In the United States, it often takes between five and ten years — sometimes longer — to get critical energy infrastructure projects approved, putting us years behind allies like Canada, Australia, and more recently the E.U., who each have policies designed to complete permitting in three years or less.”26 Among its primary functions,
WHAT’S IN A FUTURE?
101 PANORAMA 2024
Source: Michael Surran
 Source: Fré Sonneveld
the bill sets maximum timelines for permitting reviews, establishes a statute of limitations on court cases, and creates a national energy infrastructure priority list.
Regrettably, the bill overlooks a crucial dimension: environmental protection in project prioritization. Though local opposition campaigns often halt projects for reasons unrelated to environmental concerns, environmental protection still lies at the heart of many critical legal battles. The bill must incorporate these considerations into its evaluation matrix to establish a siting and permitting framework capable of assuaging local opposition. The legal battle in Maine exemplifies this, as even though NECEC would have qualified as a national energy infrastructure priority project under the bill’s current language, it faced six years of intense opposition that nearly prevented it from happening at all.
The legal climate around vested rights continues to complicate matters. Using the NECEC precedent, legacy energy operators may invoke vested rights to propagate infrastructure incongruent with the technological demands of the clean energy transition. This underscores the critical need to get legislative efforts like the Building American Energy Security Act right. It also underscores the importance of more constructive public lobbying. It is shortsighted to dismiss every opposition campaign as mere self-interested NIMBYism. Advocacy initiatives like ‘Stop the Corridor’ can encourage developers to create more equitable and sustainable projects. However, the current judicial process tends to reward battles based on technicalities for quick political wins, rather than providing a platform for judiciously considered reforms aimed at mutually beneficial solutions.
102 ENERGIZING PROGRESS: LEGAL REFORMS FOR TRANSMISSION SITING
We must empower the public to participate through a ranked-choice voting system, allowing them to prioritize the dimensions shaping a critical energy infrastructure project. Siting decisions will render trade-offs, so putting forth either or siting processes will fail to keep up with the demands of the energy transition. Reforms can allow for dimensionality in siting decisions so that local concerns and national interests can progress concurrently. For instance, if Mainers had the opportunity to rank their concerns and priorities, the Public Utility Commission could have brokered a more favorable agreement from the outset. This approach would provide the FERC with more actionable directives derived directly from the public’s preferences and concerns to shape a project’s direction. By moving past zero-sum strategies, public campaigns could more effectively broker and demand accountability for community benefits agreements and other win-win scenarios.
We stand at a critical inflection point in building the future we want to live in.
By directing public input toward shaping future decisions rather than relying on them ex post facto, we can create a more effective framework for achieving a clean energy future. This approach ensures that the public’s priorities remain integrated into energy projects, even as they change over time, fostering a sustainable and responsive energy infrastructure. Federally streamlined regulatory frameworks that enforce democratic established best practices for energy infrastructure siting and permitting could have been an influential arbiter in Maine and potentially across the country. Considering the need to build 275,000 more miles of transmission lines in the coming decade, the opportunity to reform this process has never been more promising.
We stand at a critical inflection point in building the future we want to live in. Two things can be concurrently true: The public has a vested right to clean, affordable energy security, and it is in our best interest to leverage existing assets to propel us toward a clean energy future that enhances our capacity for innovation, not just for 2050 but for centuries to come.
IN A FUTURE?
WHAT’S
103 PANORAMA 2024
Endnotes
1 Larson et al., Net-Zero America: Potential Pathways, Infrastructure, and Impacts, Final Report Summary, Princeton University, Princeton, NJ, 29 October 2021.
2 Bakke, Gretchen. The Grid: The Fraying Wires Between Americans and Our Energy Future, Bloomsbury, New York, NY, 2017.
3 Net-Zero America
4 “How Much Solar Energy Do US Homes Produce?,” USAFacts.
5 The Grid.
6 Energy Policy Act of 2005, Public Law 58, U.S. Statutes at Large 119 (2005): 5941143.
7 OP US EPA, “Summary of the Energy Policy Act,” Overviews and Factsheets, February 22, 2013.
8 Piedmont Envtl. Council v. FERC, 558 F.3d 304
9 Power, & Power. (2010, January 27). Supreme Court declines review of FERC Power Line Siting Authority case. POWER Magazine.
10 Larson et al., Net-Zero America, Princeton Univ., 29 Oct. 2021.
11 (2021, March 1). New England Power Grid 2022–2023 Profile. ISO New England.
12 Massachusetts General Court. (2016). Chapter 188: An Act to promote energy diversity.
13 National Renewable Energy Laboratory. (2022). Wind Speeds [Image]. U.S. Department of Energy. Retrieved from https://www.energy.gov/sites/default/files/ MAP%202.jpg
14 Benjamin Storrow, “4 Lawsuits Threaten Vineyard Wind,” E&E News by POLITICO, March 29, 2023.
15 “Maine Public Utilities Commission Approves New England Clean Energy Connect — New England Clean Energy Connect.” New England Clean Energy Connect, 11 Apr. 2019.
16 Ibid.
17 “Indigenous Communities Speak Out on New England Clean Energy Connect (CMP Corridor) and Related Hydroelectric Projects,” Arctic Museum, accessed March 5, 2024.
18 Linehan, Josh. “CMP Misled the Public, Mismanaged Rollout of New Billing System.” Kennebec Journal and Morning Sentinel, 23 June 2019.
19 Hayes, Emily. “First Nations Oppose NECEC; Accuse Hydro-Québec of Energy Injustices.” RTO Insider, 14 June 2023.
20 NECEC Transmission LLC, DOE Docket No. PP-438, Presidential Permit (DOE Jan. 14, 2021)
21 “Maine Voters Reject Quebec Hydropower Transmission Line,” Reuters, November 3, 2021, sec. Americas.
22 NECEC Transmission LLC, et al. v. Bureau of Parks and Lands, et al., 2022 ME 48, BCD-21-416 (Me. 2022).
23 NEWS CENTER Maine Staff, & Sharp, D. (Associated Press). (2023, April 20). Developers have right to finish $1B power line, jury says. NEWS CENTER Maine.
24 Constantino, Sara, and Elke U. Weber. “Decision-making Under the Deep Uncertainty of Climate Change: The Psychological and Political Agency of Narratives.” Current Opinion in Psychology, vol. 42, Dec. 2021, pp. 151–59.
25 Building American Energy Security Act of 2023, S.1399, 118th Cong. (2023-2024).
26 “Manchin Moves Ball Forward on Permitting Reform.” U.S. Senate Committee on Energy And Natural Resources, 2 May 2023.
104 ENERGIZING PROGRESS: LEGAL REFORMS FOR TRANSMISSION SITING
WHAT’S IN A FUTURE?


About the Author
Laura Frances (she/her) is a second-year Master of City Planning student concentrating in Smart Cities. She is most interested in how to leverage technology to make cities more climate resilient and energy efficient. Before her time at Penn, Laura managed digital equity programs for a new national non-profit and before that started an innvoation consultancy called Built Interest that worked as owners’ representatives to develop alternative real estate products from hyper-local food halls in Toronto to zero-carbon coworking in Berlin.
105 PANORAMA 2024
Surreal Streets
by Kamya Khandelwal
As my attention drifted away in the classroom, my imagination took over, painting a vivid cityscape where the ordinary mingled with the magical. A burger strolls the streets, a shark swims among the stars, and a shape-shifter (Mystique from X-Men) watches over all. In blue and purple, this artwork blends reality and fantasy, born from a contemplative, blue day.
106

Corredores Viales
 by Leo Wagner
a Truly Integrated Transit
Creating
Network in Mexico City Fare Capping &
4.5 million riders traveled on Mexico City’s expansive metro network every day in 2019. Despite the metro’s impressive usage, which is operated by the Secretaría de Movilidad (SEMOVI), its ridership is dwarfed by that of the region’s other public transit services, including formalized bus routes and cable cars, as well as informal, private microbuses known as peseros, which carry about two-thirds of the city’s total public transport users.1 In order to take broader control of the region’s transit network, SEMOVI is integrating informal services into a unified “Movilidad Integrada” scheme with a common wayfinding system and farecard. This transformative change includes the incorporation of the city’s informal transportation system as well with the creation of corredores viales minibuses to replace operator-run peseros 2
The corredores viales represent a dramatic shift away from the informal pesero system, which operates with a relatively low degree of government oversight. Whereas pesero drivers earn a living from individual passenger fares and are often given a daily passenger quota by the owner of their vehicles, corredores viales offer a more formalized, reliable system. Operators of corredores viales receive a regular salary from a company operating SEMOVI-determined routes on concession, and drive vehicles that meet stringent safety standards.3 The potential outcome is a transformation of Mexico City’s vast informal transport system into one with more consistent wayfinding and infrastructure and improved passenger experiences.
Integrating fares between existing and recently formalized services is a critical part of SEMOVI’s mission of unifying the region’s transportation modes. Since January 2022, several of the corredores viales have already started taking the Movilidad Integrada fare payment system, with a fare of MXN$8, or USD$0.47.4
The solution
Despite the revolutionary introduction of corredores viales, the lack of free transfers between modes of transport hinders the attractiveness of the new system to many riders. This limits the potential benefits of this transport re-formalization initiative, as total fares can pile up when riders transfer between services. Today, passengers already strategically limit transfers or even use peseros for their entire journeys to avoid having to pay costly second fares, which encourages long, convoluted trips.
The introduction of fare capping on SEMOVI’s services could rectify this issue. Without fare capping, transferring between transit services presents a significant financial and psychological barrier to passengers. For those with more resources, paying separate fares for each service is another reason to opt out of public transit and drive alone or use a ride-hailing service. For those of more limited means it increases the financial burden of transit and
A FUTURE?
WHAT’S IN
109 PANORAMA 2024
can also induce long walks at the beginning or at the end of journey to avoid subsequent fare costs. These resulting changes to travel behavior would limit access to opportunity and further complicate already-arduous commutes.5
Fare-capping is a system where the total amount that a person pays for their travel on public transport within a certain time frame is limited to a specific amount, regardless of the transit mode used. The goal of fare-capping is to make a person’s travel behaviors mode-agnostic so that they can take the fastest combination of transit modes to reach their destination with a capped total fare price and integrated ticketing system. Once a fare-capping limit is reached, any additional journeys taken within the same period are free of charge.6
Fare capping makes public transport more affordable and accessible, particularly for low-income and frequent travelers who may otherwise be deterred by the high costs of multiple journeys. It creates a more equitable system where everyone pays the same fare regardless of how many trips they make within a certain period. This system is especially important considering the geography of public transport users in Mexico City.
In Mexico City, wealthier residents often live in parts of the urban core that are well served by the Metro system, particularly in its western half. Poorer residents frequently live outside of the urban core in surrounding municipalities and in the region’s east, which is less well served by metro lines. Travelers in the these area soften make transfers from peseros to terminal metro stations, which are often the network’s busiest stations.7
Public transit agencies in many cities around the world are turning to fare capping as a strategic planning initiative to increase ridership and fare equity, including elsewhere in Latin America. Santiago, Chile’s Red Metropolitana de Transporte system automatically applies fare-capping for its riders, with a daily limit on the amount a person pays for travel on buses, suburban trains, and the metro. As in Mexico City, these buses are principally concession operations run by private operators on state-determined routes. The distance-based fare structure means that, while bus fares off-peak are higher than metro fares and the reverse is true at rush hour, one pays only the
Fare capping makes public transport more affordable and accessible, particularly for low-income and frequent travelers who may otherwise be deterred by the high costs of multiple journeys.
110 CORREDORES VIALES & FARE CAPPING

111 PANORAMA 2024
Graphic by Jonathan Zisk
difference between the two fares when transferring modes for a total fare of CLP$800, or approximately USD$0.84.8
Fare capping in context
To address the complications associated with pesero formalization, SEMOVI should pilot a fare-capping transfer system in Mexico City. The fare capping scheme would allow passengers to transfer between the city’s Metro or BRT and corredores viales and pay only the fare of the more-expensive mode. If beginning on a cheaper mode, a passenger’s transit payment card would deduct only the difference in fare when transferring to the more-expensive one, while beginning on a more-expensive mode would allow free transfers to the cheaper mode.
The fare-capping system would likely reduce the financial burden on riders who transfer from a metro or BRT terminal onto peseros that serve many of the city’s lower-income neighborhoods.9 Many riders already make these transfers, but may hesitate to pay a third, separate fare for a BRT, microbus, or formalized bus route that would get them closer to their destination. For routes that parallel a metro line, ridership on the metro may increase as passengers adjust their travel behavior by boarding a pesero between two stations and transferring to the metro at the nearest station.
Eventually, this fare capping system could encompass all microbus routes (as opposed to just the few corredores viales currently equipped for integrated payment) and include transfers between all state-operated transit systems. This would increase the financial and logistical accessibility of all transit in Mexico City and in the surrounding State of Mexico.
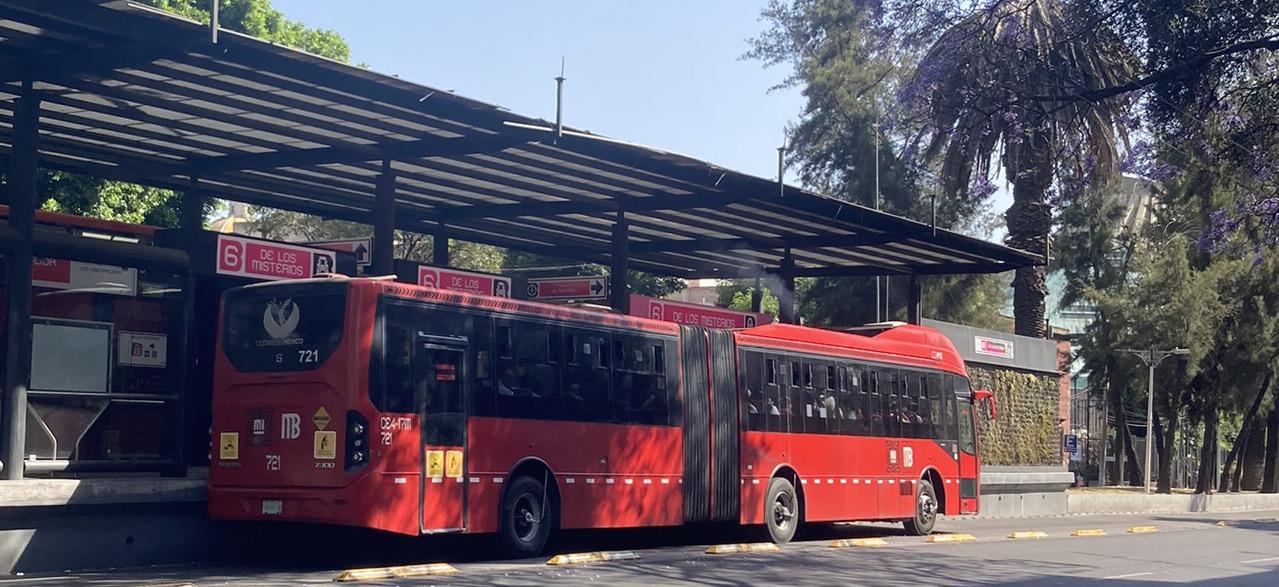 BRT in Mexico City (photo by Leo Wagner)
112 CORREDORES VIALES & FARE CAPPING
Navigating financial structures
Fare capping stands to drastically affect ridership patterns across the region, especially where multiple forms of transit currently overlap in key corridors. Where fare capping could help riders switch to high-order metro or BRT services, existing pesero routes could even be put out of business. Any fare capping pilot should be designed to balance the financial constraints of the region’s formal and informal transit services.
By embracing existing conditions of informality, pragmatic and budget-conscious interventions can bring about real change to riders’ experiences with the system.
In 1981, the mayor of Mexico City revoked the licenses of private bus concessionaires and consolidated them with one operator. The result was a drastic reduction in the number of bus routes by over 75% and a 50% reduction of total bus trips taken in the city by 1994.10 The current network of informal peseros emerged in the wake of that transition, and have become a backbone of the region’s mass transit system.
Realizing all the potential benefits of fare capping for the region’s transit network requires a combination of increased state subsidies for less profitable, concession-based routes and improved service on formalized, higher-order transit lines. Subsidies for corredores viales should reflect overall ridership and transfer information data. Concessionaires of routes that are vulnerable to fare capping should be given priority access to operation of new corredor vial routes. Service hours that are made available as a result of fare capping could be reinvested on different routes in neighborhoods further from higher-order transit. This would allow faster, mode-agnostic public transit journeys from point to point throughout the metropolitan area, with higher frequencies on routes further from the city center and reduced modal redundancies. The service adjustments enabled by fare capping could be used to contract new routes with existing, private corredores viales operators. This fare capping scheme and its associated benefits would require careful and phased implementation to appease diverse stakeholders. SEMOVI’s existing corredores viales initiative has already been met with resistance from private transit operators.11 Private pesero companies could potentially lose revenue due to reduced fares and changes in service provision. Ensuring compliance with the new fare system and addressing potential issues with farecard
IN A FUTURE?
WHAT’S
113 PANORAMA 2024
integration will require significant coordination and cooperation between different levels of government and private transportation companies. SEMOVI will need to carefully consider these challenges and its passengers’ needs during the system’s rollout.
Going further
Fare capping for SEMOVI’s could serve as a model for growing ridership in other large cities throughout Mexico, as well as elsewhere in Latin America. By embracing existing conditions of informality, pragmatic and budget-conscious interventions can bring about real change to riders’ experiences with the system. Within Mexico City, SEMOVI’s distinct modal governing bodies have resulted in disparate investment schemes. During recent expansion of the Cablebús cable car system and Metrobús BRT system, there has been comparative neglect and disinvestment in the city’s metro system.12 While newer technologies have lower construction costs per kilometer than the Metro, the latter has a high passenger capacity and is critical to connecting different parts of the city efficiently and affordably.13 The introduction of fare capping can create a mode-agnostic system so network planning can be focused on the best mode for the envisioned ridership of a transit line and existing infrastructure in the area. Fare-capping can be a transformative first step in SEMOVI’s reintegration of Mexico City’s transit modes to avoid excessive focus on single modal expansion projects.
Conclusion
The immense benefits of SEMOVI’s public transport re-formalization initiative can be further improved through the inclusion of a fare-capping scheme in Mexico City’s transit network. The implementation of this system for microbuses will create a network driven by passenger needs, rather than individual operator profit. At the same time, it is important to acknowledge SEMOVI’s existing capacity constraints, and any attempt at fare capping should assume a continuation of the private operator concession scheme currently used to operate re-formalized routes.
The proposed fare-capping initiative is just one step in the formation of a multimodal, efficient transit network, whose various components work together to produce a system which uses the right transit mode for the envisioned ridership a line is expected to have and its expected role in the network. SEMOVI can thus serve as a regulatory body, ensuring that at the passenger level cross-city, high-capacity lines and last-mile microbus connections are all part of a seamless experience.
114 CORREDORES VIALES & FARE CAPPING


Endnotes
About the Author
Leo Wagner is a second-year Master of City Planning student concentrating in Sustainable Transportation and Infrastructure Planning, originally from the Washington, DC area. He is passionate about creating more environmentally sustainable and equitable cities through intelligent land use and transportation planning decisions, with a particular focus on urban planning in Latin America and Francophone Africa.
1 García, Ana Karen. “9 datos sobre el transporte público concesionado en la CDMX.” El Economista, 3 Sept. 2019.
2 “Adiós a los micros en estos 4 corredores de CDMX; los cambiarán por autobuses nuevos.” El Financiero, 7 June 2022.
3 Beyer, Scott. “Peseros: A Look Inside Mexico City’s Private Bus Network.” The Catalyst, 16 Oct. 2019.
4 Infobae. “Transporte concesionado podrá pagarse con Tarjeta de Movilidad Integrada en CDMX.” Infobae, 16 Jan. 2022.
5 García, Ana Karen. “9 datos sobre el transporte público concesionado en la CDMX.” El Economista, 3 Sept. 2019.
6 ared Brey, “Fare-Capping Policies May Increase Transit Ridership,” Governing, November 8, 2023.
7 Guerra, Erick. Urban Transport and Land Use in Developing Cities [presentation]. December 1, 2022. University of Pennsylvania: CPLN 5500, Philadelphia, PA, United States.
8 Red Movilidad. Conoce las tarifas. Retrieved May 8, 2023.
9 Mendelson, Zoe. “Mapping Mexico City’s Vast Informal Transit System.” Fast Company, 29 Mar. 2016.
10 Erick Strom Guerra, “The New Suburbs: Evolving Travel Behavior, the Built Environment, and Subway Investments in Mexico City” (Ph.D., United States -- California, University of California, Berkeley), accessed March 8, 2024.
11 Serrano, Lizbeth. “Mi Ruta, la aplicación móvil para microbuseros de la CDMX.” Gluc, 11 Aug. 2020.
12 Oscar Lopez, “Mexico City’s Crumbling Metro System Casts Shadow on Mayor’s 2024 Ambitions,” The Guardian, January 26, 2023, sec. World news.
13 Fadlala Akabani, “Electromobility and Economic Development in Mexico City,” Mexico Business, October 5, 2022.
WHAT’S IN A FUTURE?
115 PANORAMA 2024
Photo by Leo Wagner
EQUITY & STUDIO
EXPANSION
Cycles of Transportation & Housing Sprawl in Bogotá, Colombia

Teresa Chang
Michael Dunst
Xiayuanshan Gao
Jared Jackson
Jia Yang Kwok
Alexa Ringer
Naomi Tariku
Brianna Thornhill
Yining Zhang
Ann Zhang
Evan Zhao
Ke Zhou

As Bogotá continues to invest in transportation infrastructure, land values have increased, pushing informal settlements to the urban edges. How can Bogotá rethink its invesments to end the cycle of growth and sprawl? How can it ensure equitable access to public transit for residents who need it most, even as development pushes them farther from its reach? WHAT’S
FUTURE? 117 PANORAMA 2024
IN A
A City the TransMilenio Shaped
Bogotá is perhaps best known for its revolutionary and world-renowned TransMilenio, a rapid bus system that moves subway-level volumes of passengers at a fraction of the cost. This bus system can certainly claim the name, transcending national and international expectations of urban bus systems by providing dedicated rights-of-way separated from regular traffic; covered stations where passengers pay before the bus arrives to speed up passenger boarding; a comprehensive system, network, and hierarchy of buses to move millions of people around a city as big as New York but without a single subway. It elevates buses to a high-speed, infrastructure-rich amenity rather than the frustrating experience for the carless.
But even as Bogotá’s transportation system has grown, it has continually struggled to keep pace with a city characterized by dense, informal settlements on its mountainous, southern periphery. These communities, some with a population in the hundreds of thousands, are densely populated yet lack adequate transit options, leaving residents unable to access—without an extremely long commute—higher paying jobs in the city center, education, or other amenities of city life. Bogotá’s challenge of mismatched land use and transportation is emblematic of many large Latin American cities.
As TransMilenio, conventional buses, cable cars, and plans for a subway in Bogotá have grown, land values have increased in the city center and informal settlements have spread to the urban edges of forests, wetlands, and farmland. So, how can Bogotá rethink its housing and transportation plans to end the cycle of growth and sprawl?
How can it ensure equitable access to public transit for residents who need it most, even as development pushes them farther from its reach?
Our challenge was to focus on the intersection of land use and transportation planning at a city scale, and to propose concepts that illustrate how Bogotá and other major Latin American cities can begin to marry land use and transportation planning together. We developed four broadly defined policy and design recommendations, interwoven together as a single vision. Each intervention focuses on providing affordable housing, high-capacity transportation, and addressing health & safety issues frequently found at the intersection of these spaces.
Bogotá’s challenge of mismatched land use and transportation is emblematic of many large Latin American cities.
118 EQUITY & EXPANSION: CYCLES OF SPRAWL IN BOGOTÁ
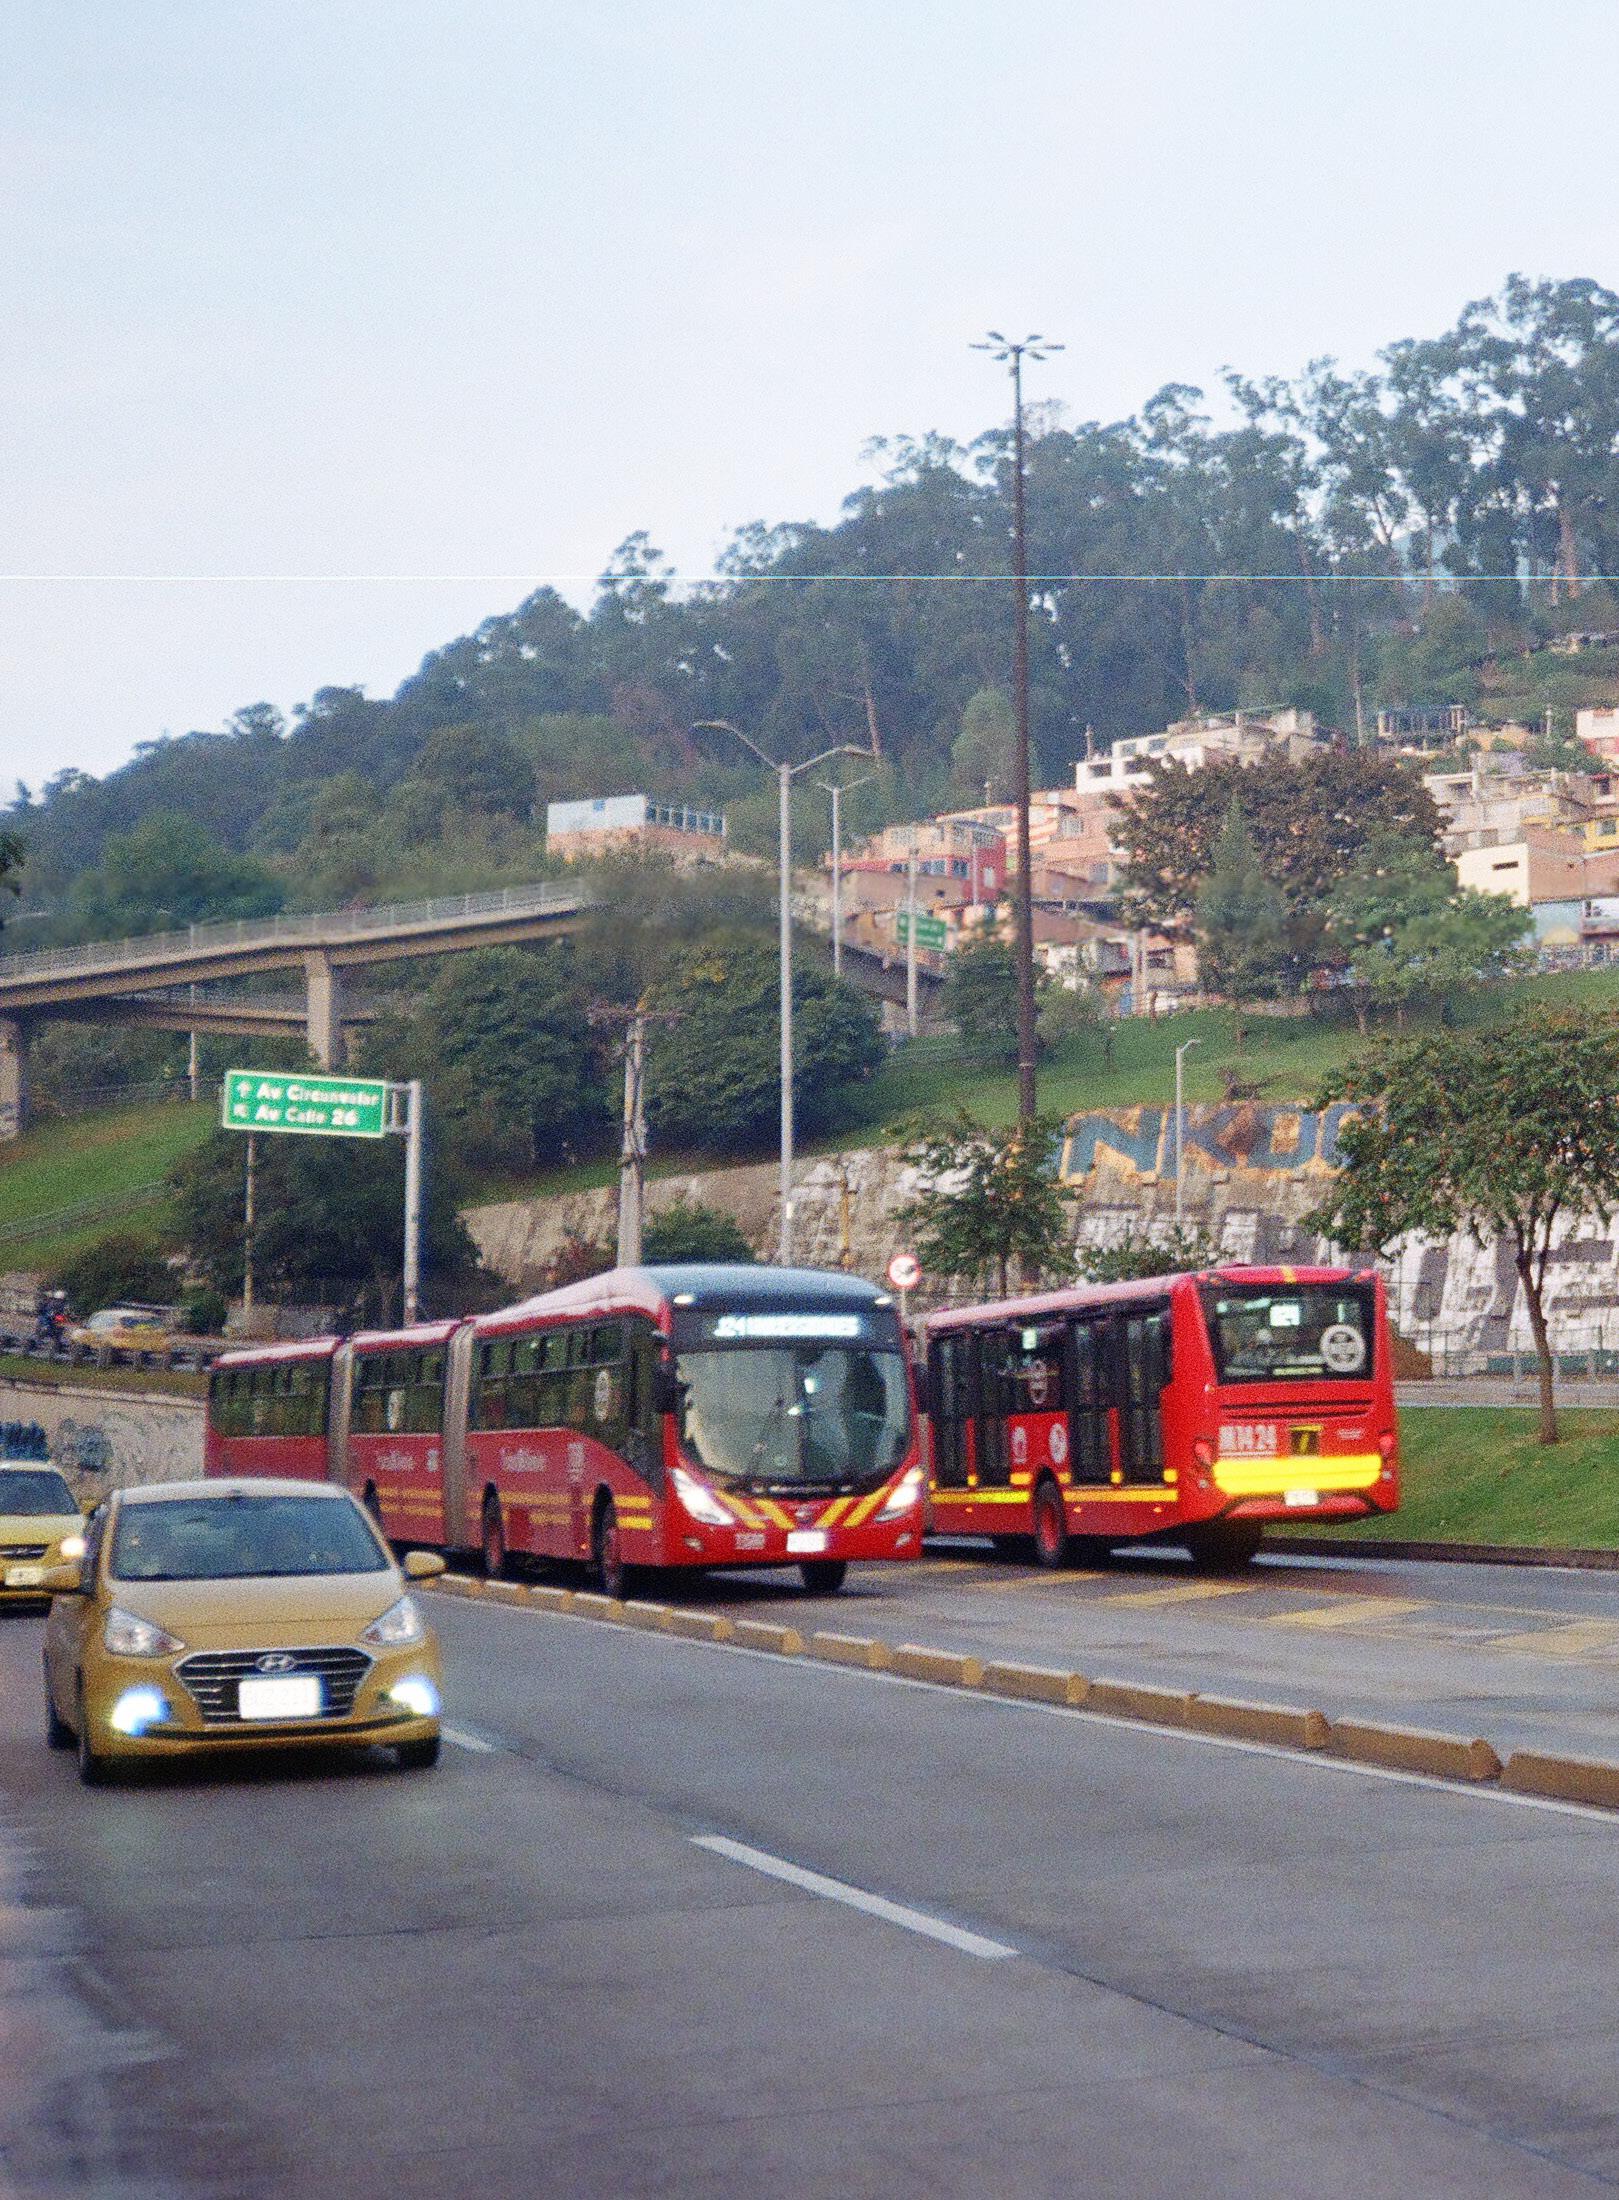 Previous page: Ciudad Bolivar, informal settlements (photo by Michael Dunst)
Above: TransMilenio Buses (photo by Alexa Ringer)
Previous page: Ciudad Bolivar, informal settlements (photo by Michael Dunst)
Above: TransMilenio Buses (photo by Alexa Ringer)
119 PANORAMA 2024
WHAT’S IN A FUTURE?
0–3,000
3,001–6,000
6,001–9,200
9,201–13,000
13,001–18,000
18,001–27,000
27,001–38,000
38,001–52,000
52,001–80,000
80,001–121,000
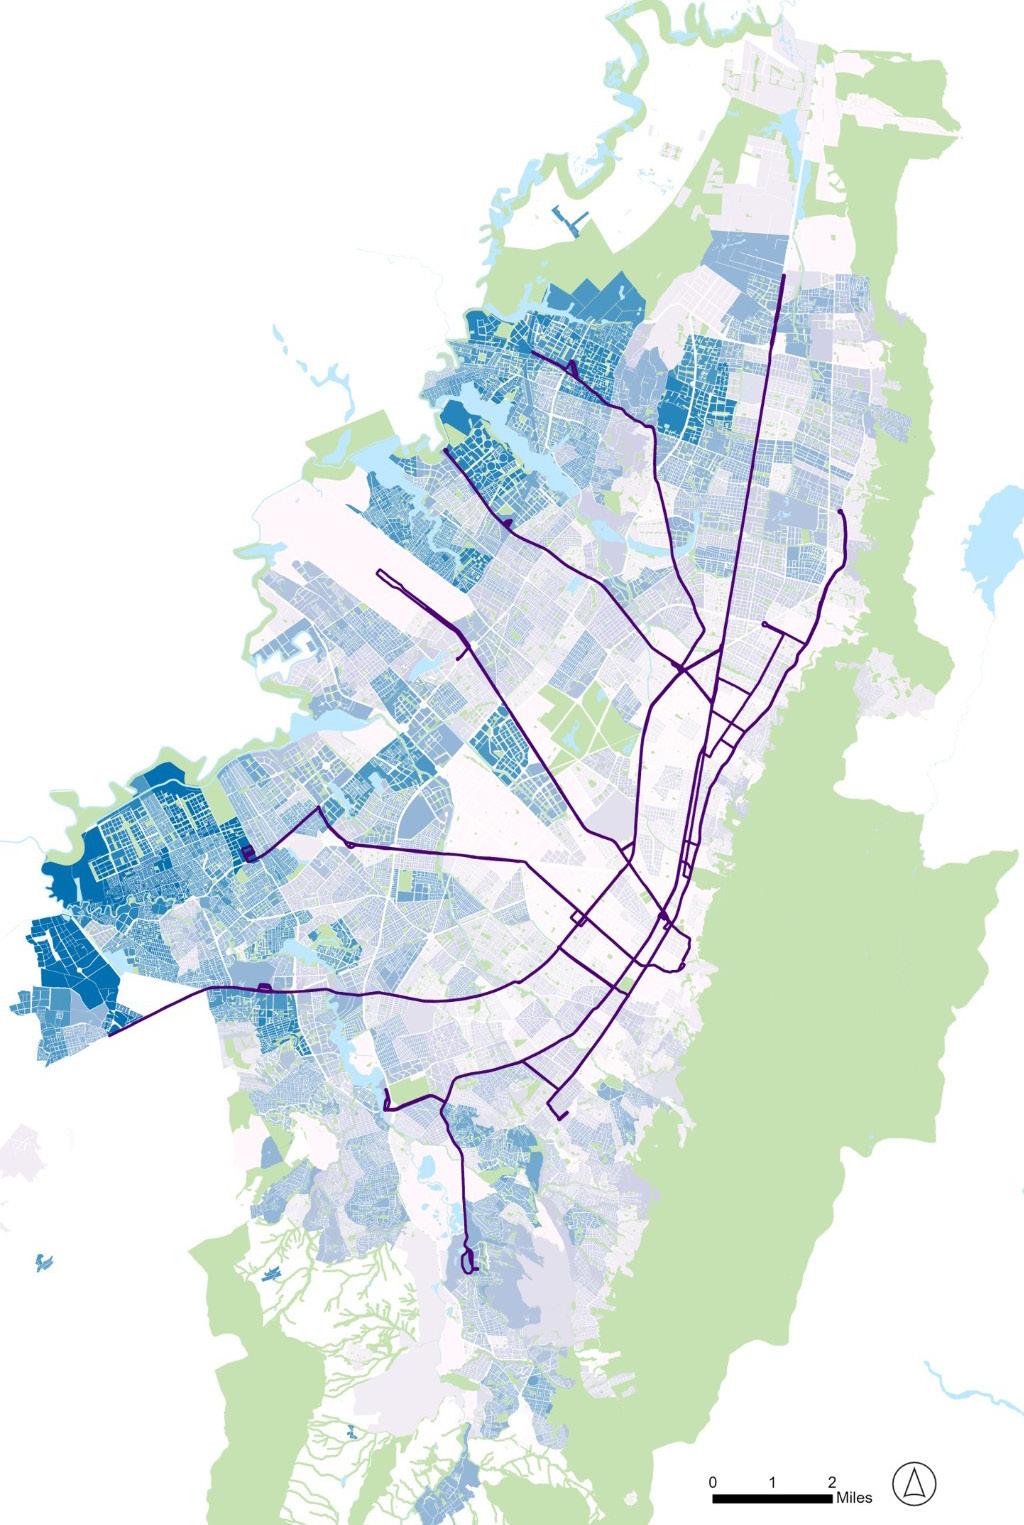
 Figure 1
Population access to the TransMilenio system
Figure 1
Population access to the TransMilenio system
120 EQUITY
EXPANSION: CYCLES
SPRAWL IN BOGOTÁ
&
OF
These recommendations, while not all-encompassing, show how cities like Bogotá can break the cycle of sprawling, unaffordable, and unsustainable outward growth by integrating land use and transportation planning.
Inclusive Futures Safety for Women Transit Oriented Growth
Our Vision
Low Emission Corridors
We envision a Bogotá where its most vulnerable residents can access transportation, job opportunities, social housing, and community development. Within this planning framework, we have developed the following goals:
• Integrate housing and transportation planning into a cohesive process
• Develop housing strategies that provide reliable access to high-capacity transit
• Improve safety outcomes for the most vulnerable transit users
Our Studio Process
Through city-wide data analysis of household travel surveys and census data, we identified city-wide trends that illustrated many of the challenges experienced daily by Bogotá residents. We also visited housing developments and rode the TransMilenio to understand the existing relationship between housing and mass transportation. Through the lens of these transit corridors and housing developments, we developed recommendations that can be applied to future housing and transportation projects throughout the city.
Interventions
As previously mentioned, our interventions are meant to highlight a process and approach by which the city can weave housing and transportation planning methods together. As the city begins construction for a new metro system and other TransMilenio expansion projects, we hope for these initiatives to serve as guiding principles, aiding planners in more effectively integrating housing and prioritizing equity.
IN A FUTURE? 121 PANORAMA 2024
WHAT’S
Inclusive Futures – A Housing Evaluation Toolkit
The housing toolkit was created because large-scale residential developments were found to be disconnected from the city’s transportation system. These developments, encircled by highway-like roads or fences, have effectively cut off residents from public transit access and essential services such as jobs, childcare, and other amenities. The toolkit’s primary objective is to establish a comprehensive evaluation framework that adheres to industry standards, with the aim of promoting inclusivity and setting a new standard for housing development. Drawing inspiration from Oregon Metro’s vision, the toolkit seeks to define housing as a diverse range of quality, physically accessible, and affordable choices that provide residents with access to opportunities, services, and amenities.
To apply the toolkit in diverse scenarios, three key capacities have been identified for the toolkit. Firstly, the toolkit will be used to evaluate the

122 EQUITY & EXPANSION: CYCLES OF SPRAWL IN BOGOTÁ
Ciudad Verde Social Housing Development Outside of Bogota, population: 250,000 (Photo from site visit)
four sites that the studio group visited while in Bogota. Beyond site evaluation, the toolkit’s potential extends to influencing future housing and transportation policy and development. We hope that governments leverage this evaluation toolkit, offering incentives to developers for its widespread use. Lastly, the toolkit will serve as a practical tool for our classmates, enabling them to evaluate their interventions and demonstrating how this evaluation can inform future developments.
Four criteria—transit equity, jobs, social services, and community— were used to evaluate existing mega-housing projects and can be used to evaluate future developments integration with the network of city infrastructure.
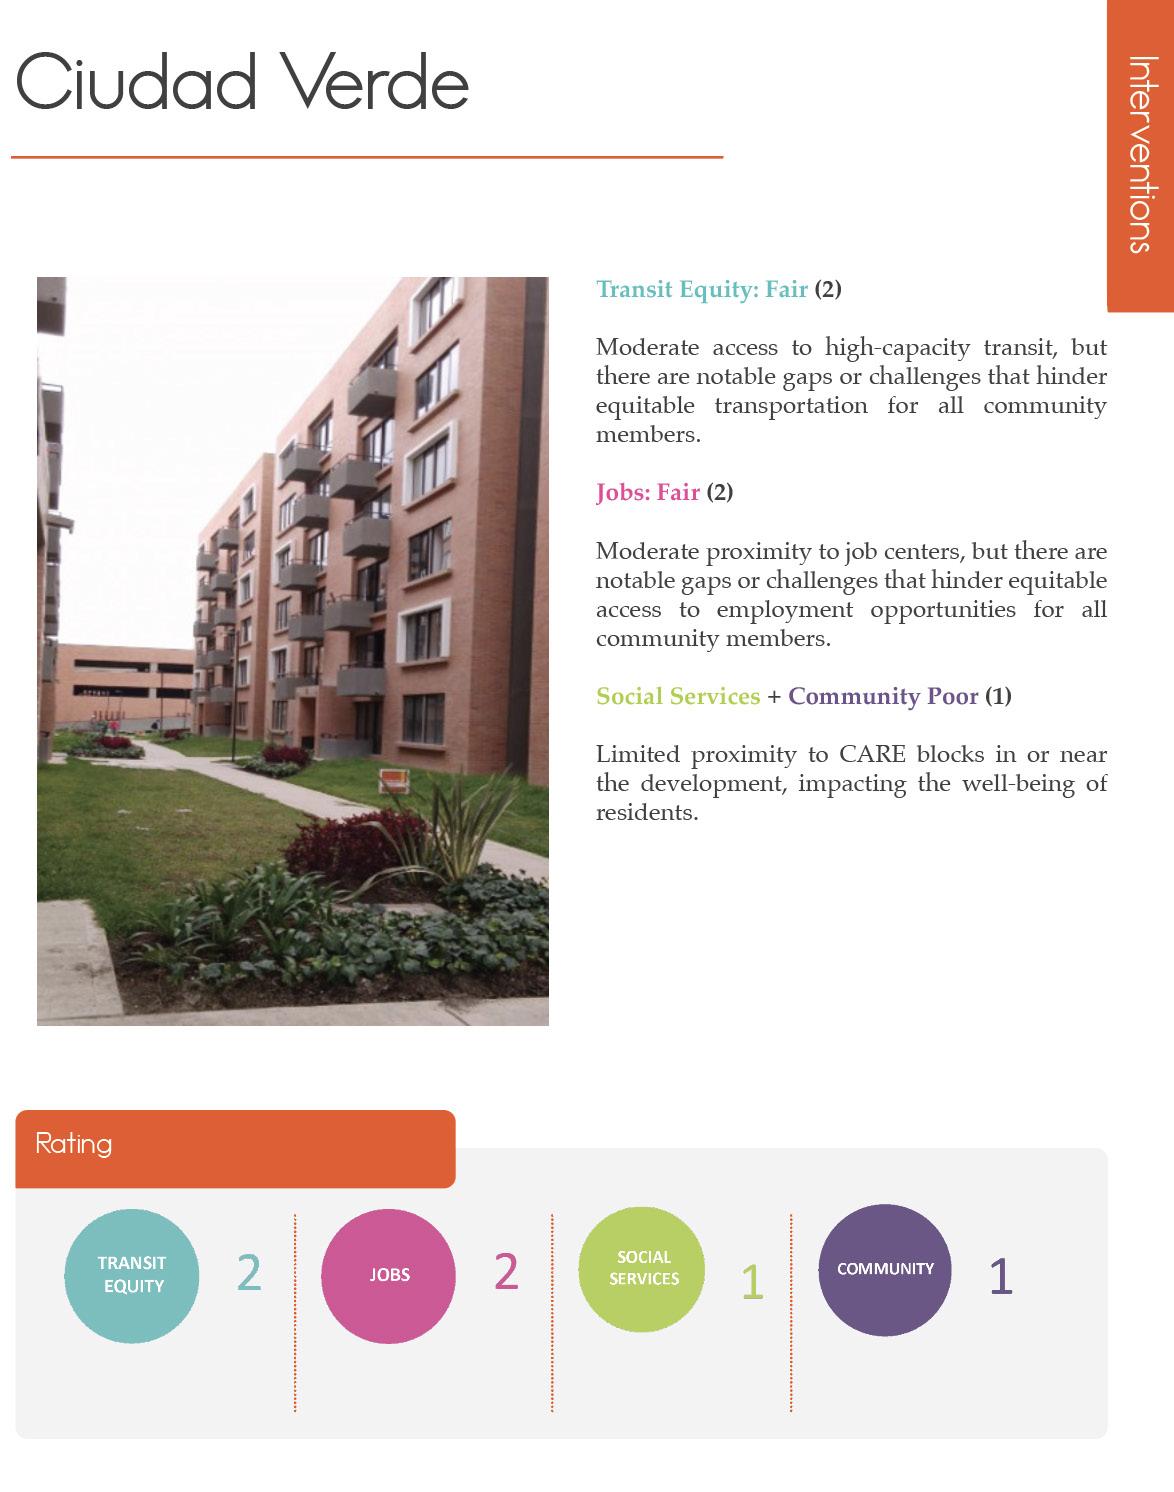
 Figure 2
WHAT’S IN A FUTURE? 123 PANORAMA 2024
Toolkit evaluation of Ciudad Verde
Maximizing the Metro—A Strategy for Transportation Oriented Development
While some of the mega development projects promise space for hundreds of thousands of people, they are located at the periphery of the city. These communities, while great steps towards meeting demand, do not improve on the inequity of travel times. One of the largest investments Bogotá will be making to address its overcrowded transportation network is building a metro system. With Line 1 on its way to becoming reality, we determined that it is crucial that the city align its housing plan with this generational investment. In a city with growth as high as it is, nearly any land opened for development near the metro will be in high demand. Therefore, we have created a multi-layered plan for how Bogotá can create synergy between its transportation and housing goals.
We recommended the following:
1. Three typologies of strategic development near transportation
2. Tax increment financing districts to fund affordable housing developments
3. Redevelopment mixed use templates for three proposed metro stations
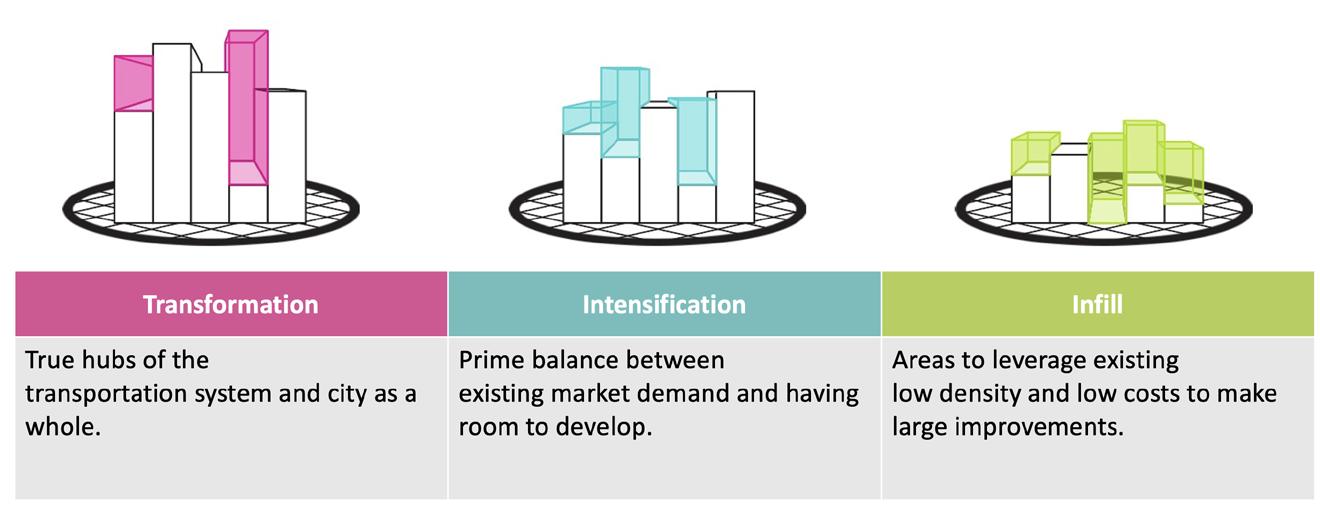
Low Emission Corridors—Reimagining High-Capacity Corridors with Cleaner Air and Less Traffic
TransMilenio corridors are not just characterized by innovative buses, but a flurry of movement as all modes of transportation compete for space along the major arterials, including trucks, motorcycles, buses, pedestrians, and cyclists. Motorcycle use has grown immensely due to its affordability
Figure 3
Three Transit Oriented Development Strategies
124 EQUITY & EXPANSION: CYCLES OF SPRAWL IN BOGOTÁ
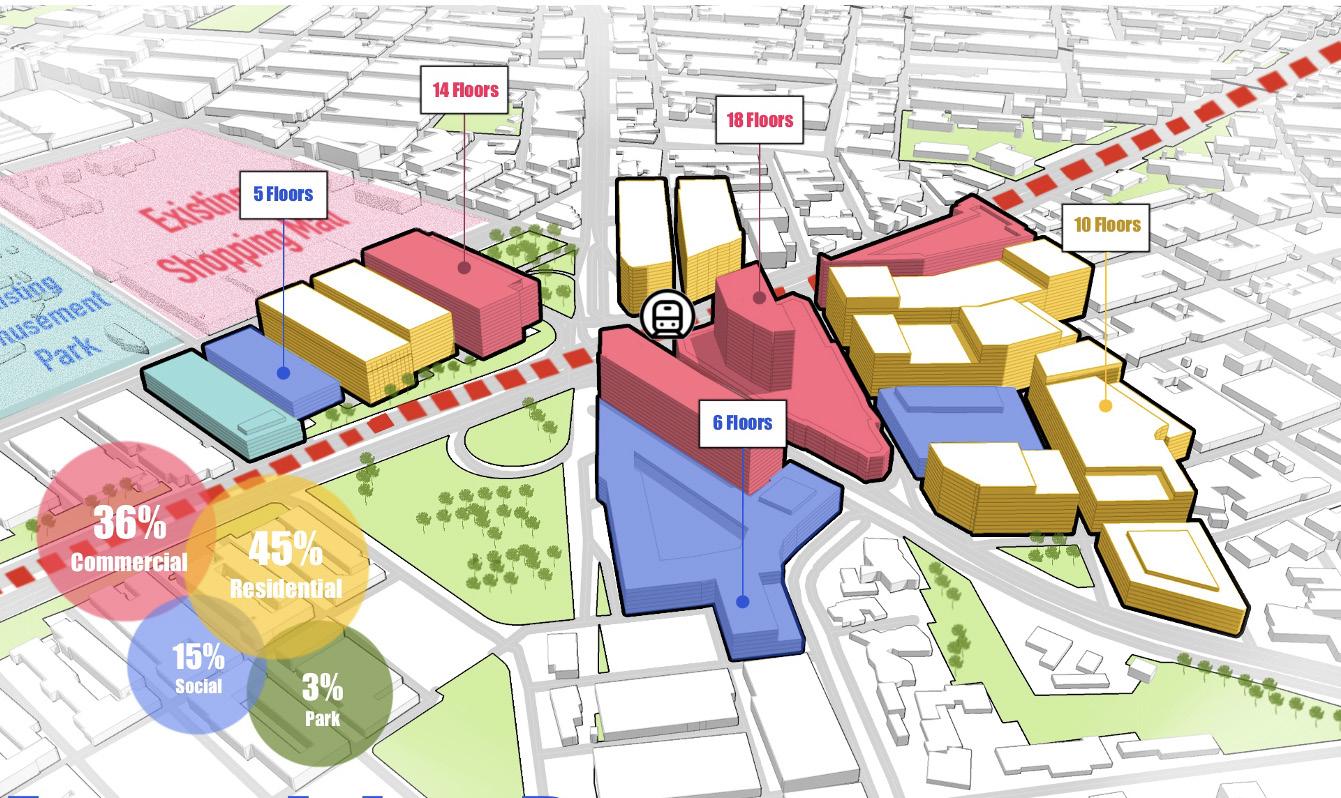
but has resulted in poor air quality along these high-use corridors. Poor air quality along certain TransMilenio corridors causes environmental justice impacts to the most vulnerable road users and lowest-income residents.
We recommend developing a corridor with no gas-powered vehicles and limited pollution. This proposed corridor reimagination is similar to low emission zones, as seen in London; however, this is a corridor where people can travel with healthier and greener environment, not to worry about the pollution created by gas cars and motorcycles. We propose implementation in two phases, the first prioritizing the most suitable areas for road redesign and the second emphasizing highly congested areas.
There are four elements to these proposed Low Emission Corridors:
1. Street redesign typologies to reduce traffic lanes
2. Incentives for electric vehicles and e-motorcycle sharing systems
3. Retrofitting gas stations as clean mobility hubs
4. Integrating bicycle infrastructure along TransMilenio corridors
Integrating cycling and the TransMilenio
Beyond these priority low-emission corridors, we propose that Bogotá retrofit the entire TransMilenio network to better incorporate bicycle use since many low-income residents use bicycling as a first and last mile connection. Although there is extensive bicycle infrastructure in the city, much
Figure 4
Example metro station scenario at Avenida Boyacá with denser, mixed uses, featuring over 6,500 housing units and 18,000 new residents
WHAT’S IN A FUTURE? 125 PANORAMA 2024
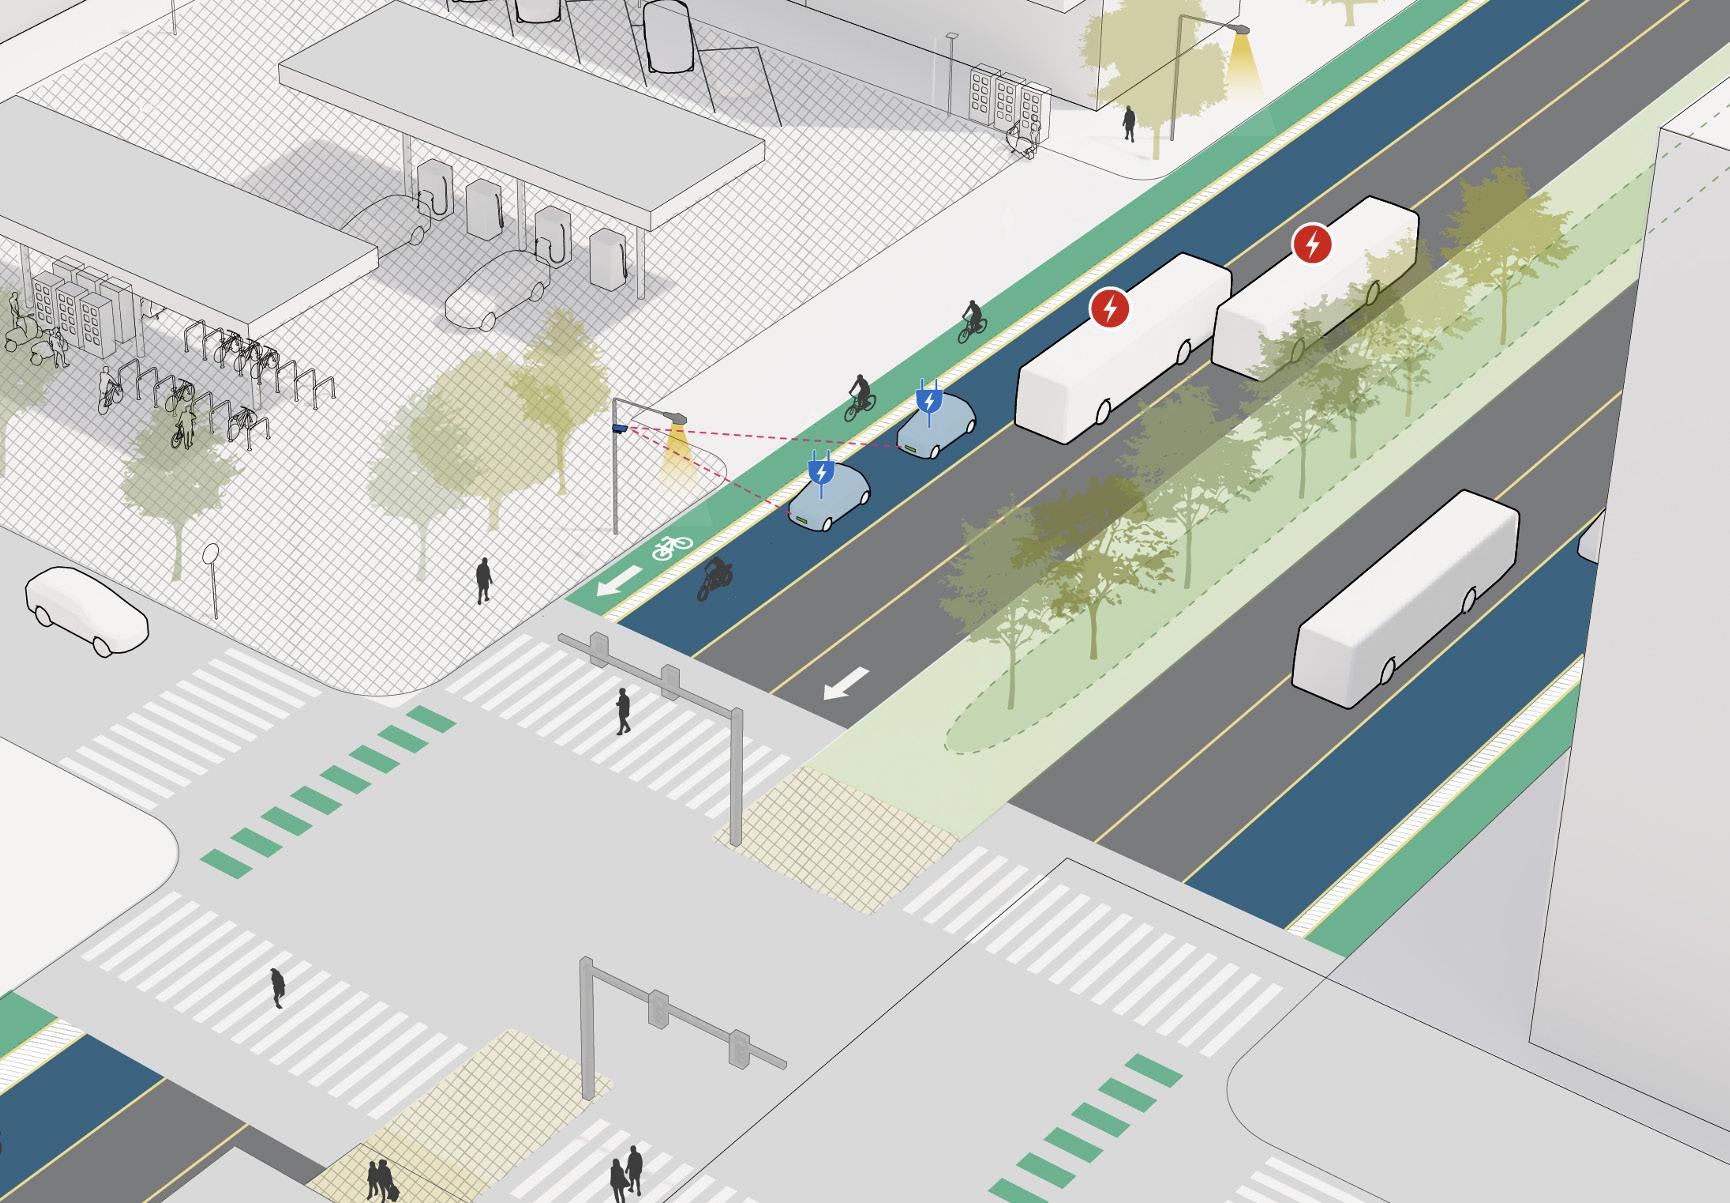
E-Motorcycle Sharing System
EV Policy & Purchase Incentives
EV-Only Lanes Mobility Hub
of this inadequately serves cyclists trying to access TransMilenio or simply traverse along these critical arterial roads.
Whether retrofitting unused green medians, reducing general traffic lanes, or simply banning cars in the densest, central areas, intentionally integrating bicycle infrastructure can complement expansion and improvements to the high-capacity network. Reinventing the typologies of bicycle infrastructure as it relates to high-capacity transit can accelerate bicycle usage and reduce car dependence.
Although electric vehicle use is rising, possibly improving air quality, the cost is still unattainable for most Bogotanos. We propose permanent street closures, recapturing green space, and overall street design improvements to make bicycle usage as safe and pleasant as possible.
Figure 5
126 EQUITY & EXPANSION:
SPRAWL
BOGOTÁ
Four elements of proposed Low Emission Corridors
CYCLES OF
IN

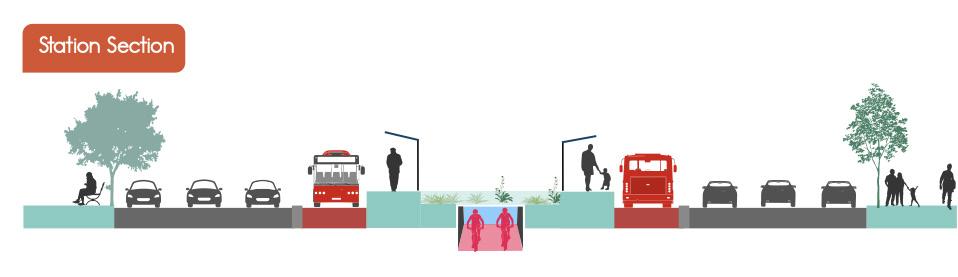
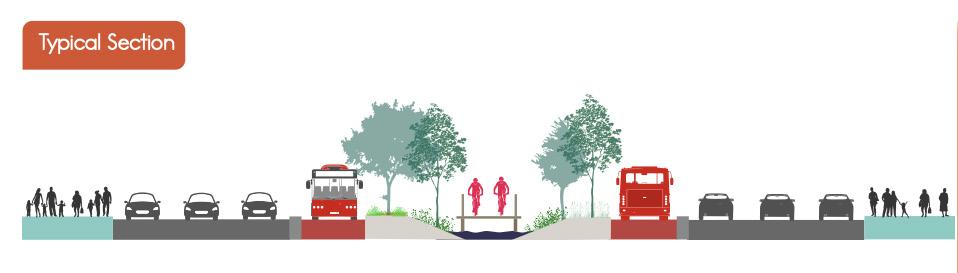
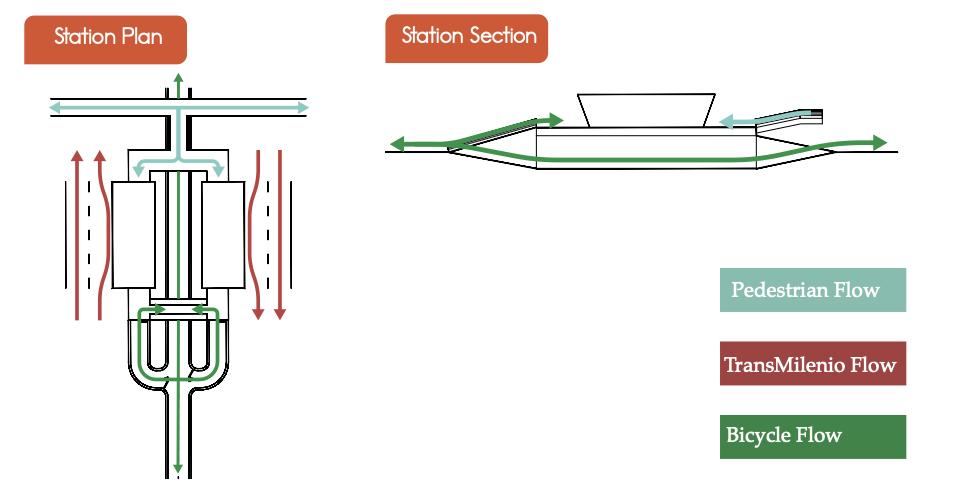
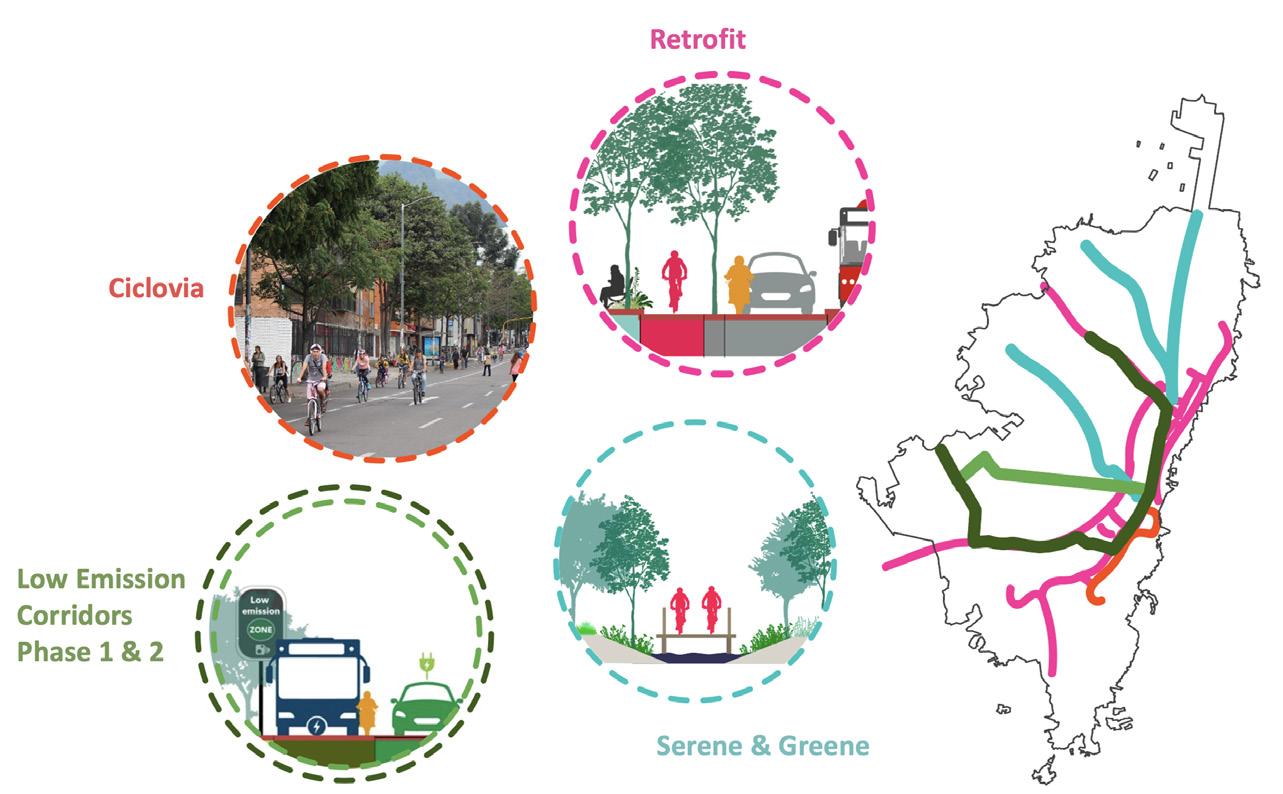 Figure 6 (top) Proposed Greenways along TransMilenio Corridors,
127 PANORAMA 2024
Figure 7 (bottom) Citywide, Long Term Bicycle Facility Vision,
WHAT’S IN A FUTURE?
Viaje a Gusto—Addressing Gender-Based Violence and Fear On and Around Transit
Viaje a Gusto (“Travel At Ease”) a comprehensive program designed for enhancing both physical safety and subjective feeling of safety on public transit, especially for women and other vulnerable passengers, through a series of infrastructure improvements and social campaigns.
Women are disincentivized to take transit because they face a higher percentage of assaults, especially sexual assaults, when traveling on TransMilenio and around Bogotá. Complementing the previous projects on infrastructural changes, Viaje a Gusto is designed to shape a safer and better experience in Bogotá, particularly for women passengers and pedestrians. As the caretakers of most households, women deserve to be taken care of at home, at the workplace, and when traveling.
Though the program prioritizes women’s experiences, it is designed for all whose safety may be potentially at threat when traveling, and eventually
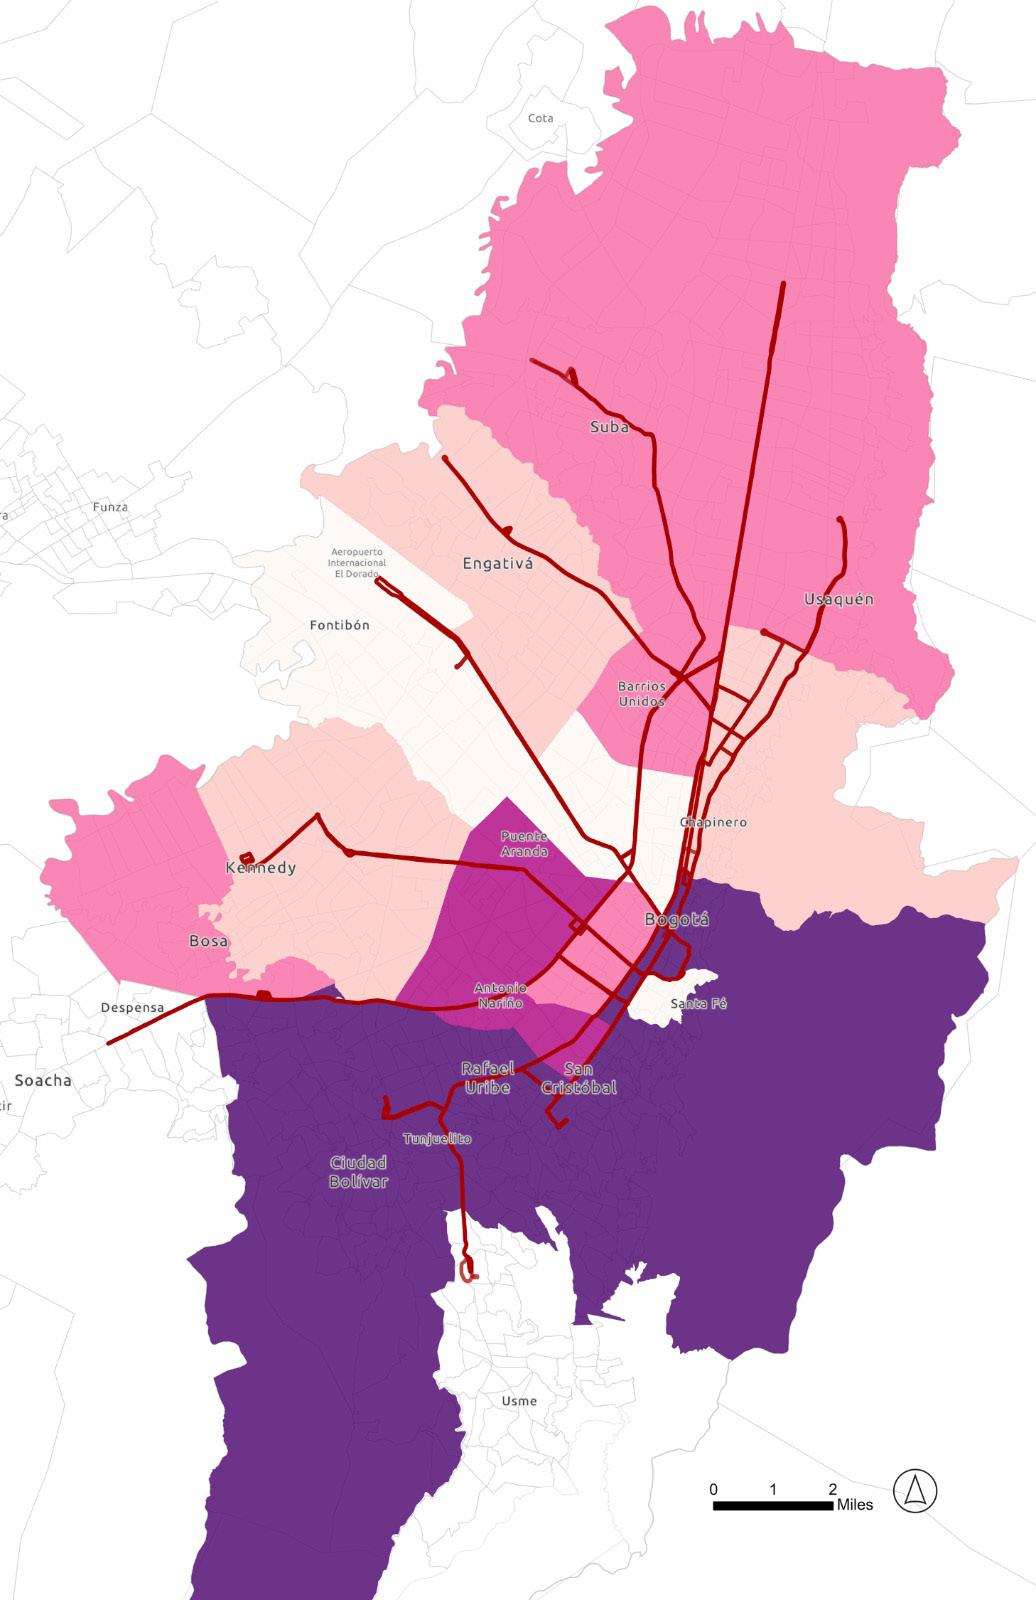

More than of population consider Transmilenio unsafe 60%
Figure 8
Characterizing perceptions of safety on TransMilenio
Percent of population who feel unsafe on TransMilenio < 62% 63–66% 67–69% 70–74% > 74% TransMileno Routes 128 EQUITY & EXPANSION: CYCLES OF SPRAWL IN BOGOTÁ
WHAT’S IN A FUTURE?
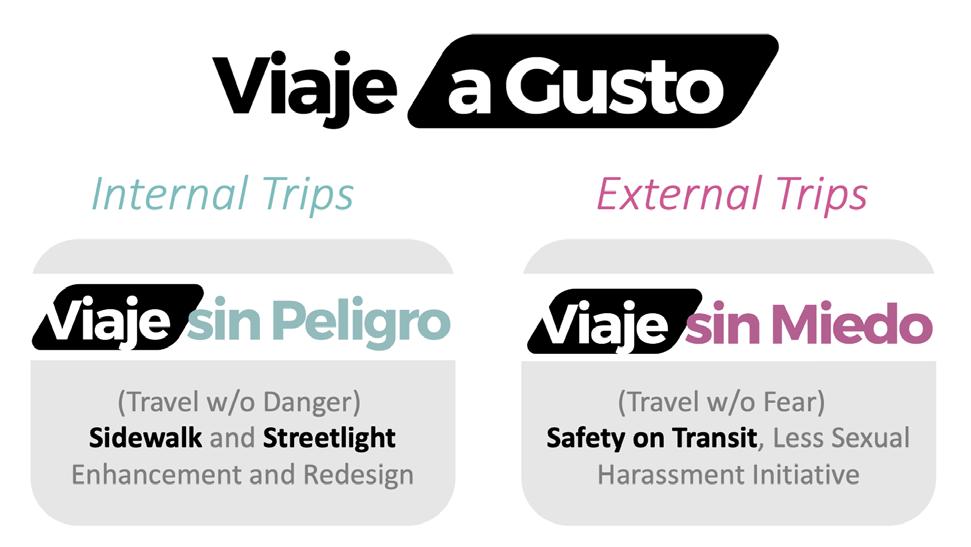
everyone traveling in the city. According to the Household Travel Survey (2019), walking is the primary mode for trips made by womens. Walking is also the primary mode for internal trips, while Bogota’s transit system is the primary mode for external trips. Therefore, Viaje a Gusto is designed to revolve around walking as the key mode to internal trips and public transit to external trips. Three strategies are targeted at internal trips:
• Sidewalk enhancement
• Streetlight enhancement
• Permeability through Natural Surveillance
While three strategies are targeted at external trips:
• Priority seating and waiting area for women
• Social campaign
• Text reporting system
Conclusion
Bogotános face immense challenges moving around the city, but growth outward, single use developments, and a tenuous connection between housing and transportation could exacerbate the very mobility challenges they intend to alleviate. Bogotá must pause to evaluate the relationship between housing and transportation policy and design, and how this impacts the lives of people daily at a human scale.
Centering equity, sustainability, and the belief that every Bogotáno deserves access to high quality housing and transportation has led to our recommendations. Whether addressing housing inadequacies, enhancing transit options, or dismantling the barriers preventing them from flourishing, these recommendations are meant to highlight the importance of seamlessly integrating housing and transportation planning with future growth.
Figure 9
Campaign to improve internal and external trips for women
129 PANORAMA 2024
Between Data & Experience
What We Can Learn from Biking In Bogotá
 by Alexa Ringer
Bogotá, Colombia is a world class city for buses.
TransMilenio is one of the first successful and scalable bus rapid transit systems in the world, and now the rapidly growing city is planning for two metro lines, mountainous cable car systems, and additional bus system improvements.
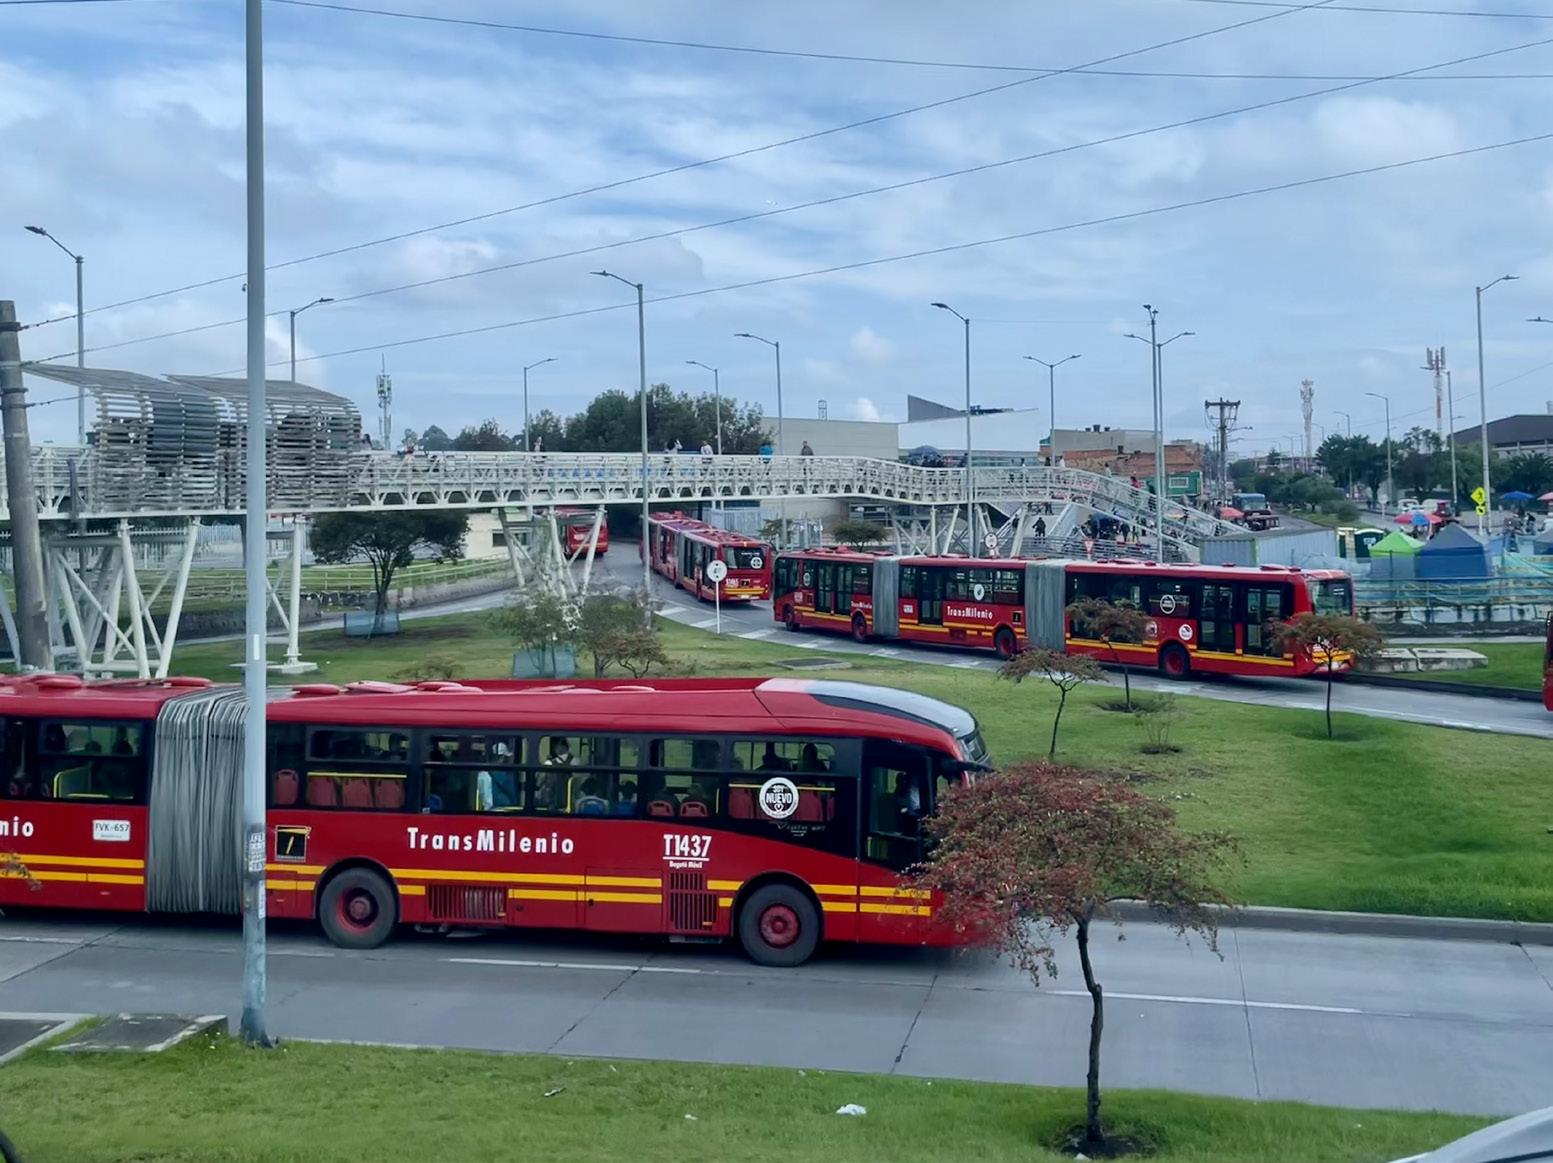
Bogotá, Colombia is a world class city for bikes.
Hailed as the bike capital of the world, Bogotá boasts some of the highest ridership numbers in the world, with 7% - and growing - of all commutes being done by bike.1 Every Sunday, the city shuts down its major BRT thoroughfares and opens the space to cyclists and pedestrians, an urbanist fantasy. The culture of biking is woven into the urban fabric.
So, Michael and I hopped on the bikes despite Bogotá’s characteristically gloomy skies, unlocking the city by embracing a sense of adventure, abandoning (trip) planning, and living in the moment on chaotic unknown streets. We downloaded the bike share app and set off to grab a bike share on a cloudy day. We could pick from a myriad of bikes, whether a regular bike, an e-bike, or even one with a child seat, a clear effort to incorporate primarily
WHAT’S IN A FUTURE?
TransMilenio (photo by Michael Dunst)
131 PANORAMA 2024
female caretakers into cycling infrastructure. Starting in the center of the downtown area, the route felt incredibly safe as a two-way bike lane protected from regular traffic by small cinder blocks. The general traffic lane next to it was so narrow that cars inched by at a snail’s pace. This was easy for about two blocks.
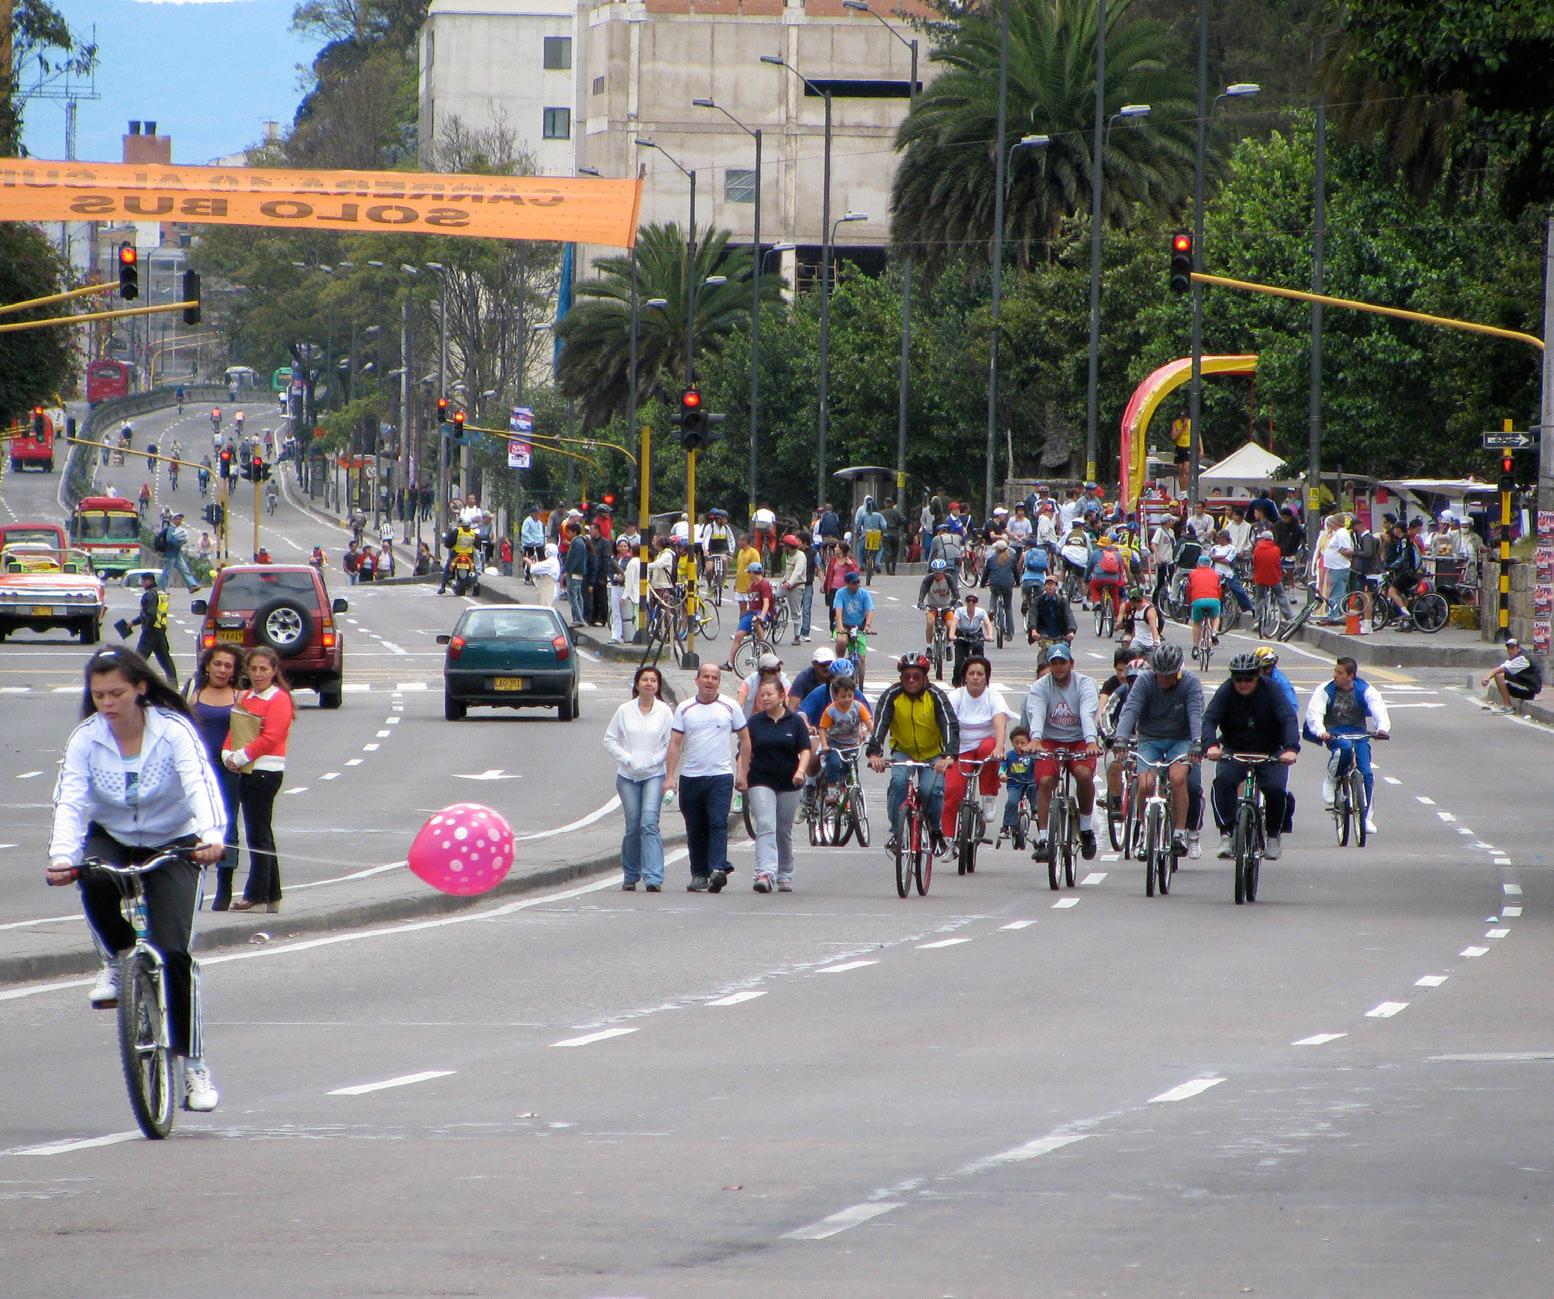
Then the route merged. Divided by low concrete barriers, the cycle track continued onto a major road. Dark clouds loomed overhead, threatening rain, but in a city that rains every day, this did not stop us. The tree-lined verdance of downtown shifted quickly into a concrete-heavy road and the air was thick with motorcycle fumes that we inhaled. The track was alive with cyclists in both directions, despite frequent instances of pedestrians darting across the track.
We spontaneously turned left, and the bike infrastructure disappeared even though cyclists remained. Boldly riding next to regular traffic, we passed one of the main Bus Rapid Transit (BRT) corridors, devoid of any clear
Ciclovia occurs every Sunday, where major roads, including TransMilenio Corridors, are exclusively for pedestrians and cyclists7
132 EQUITY AND CYCLING IN BOGOTA
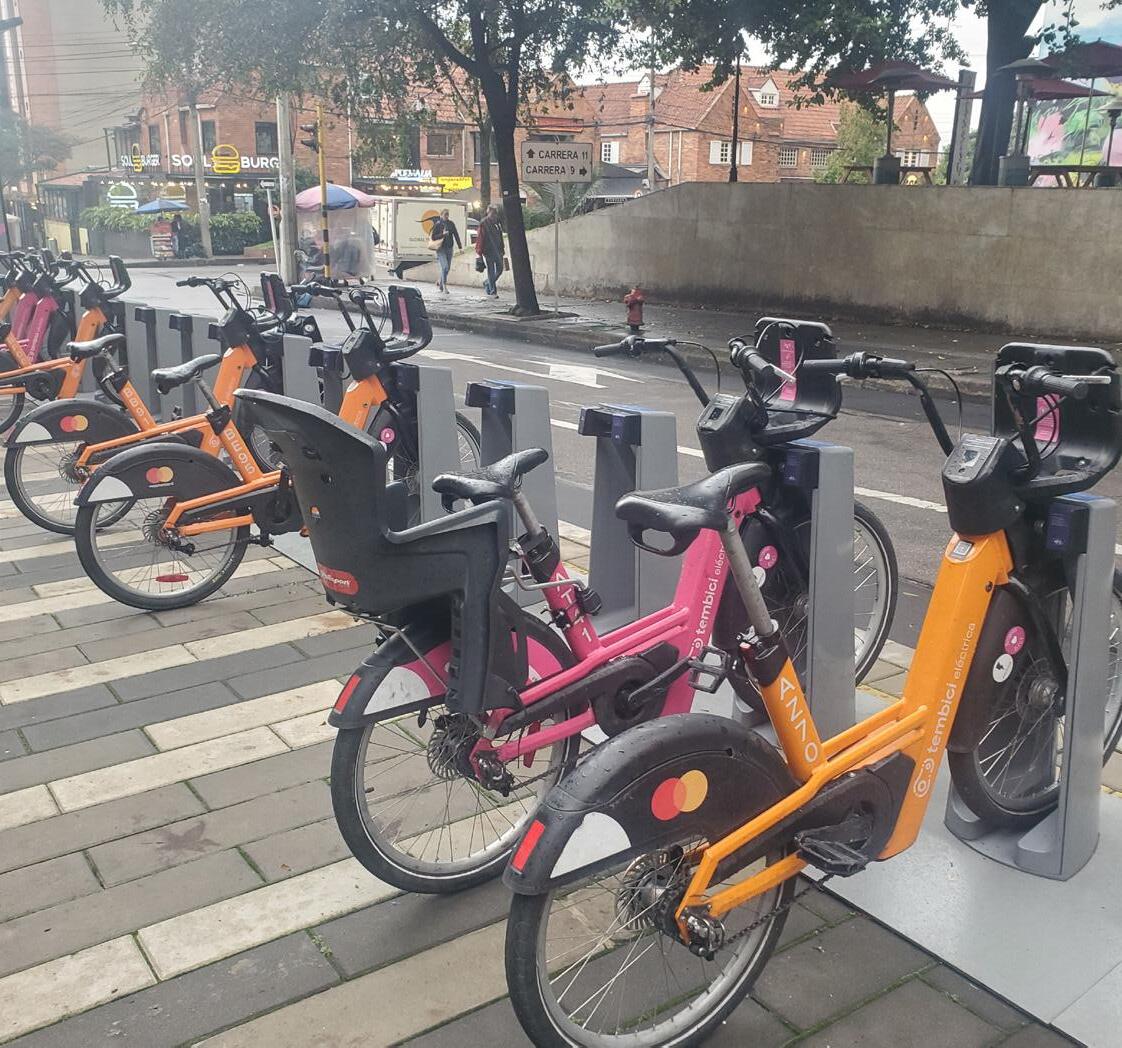

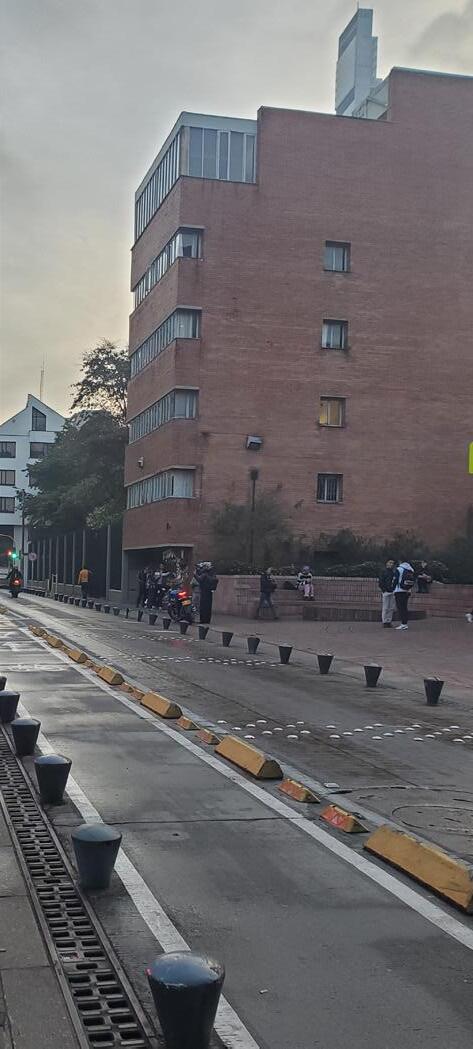
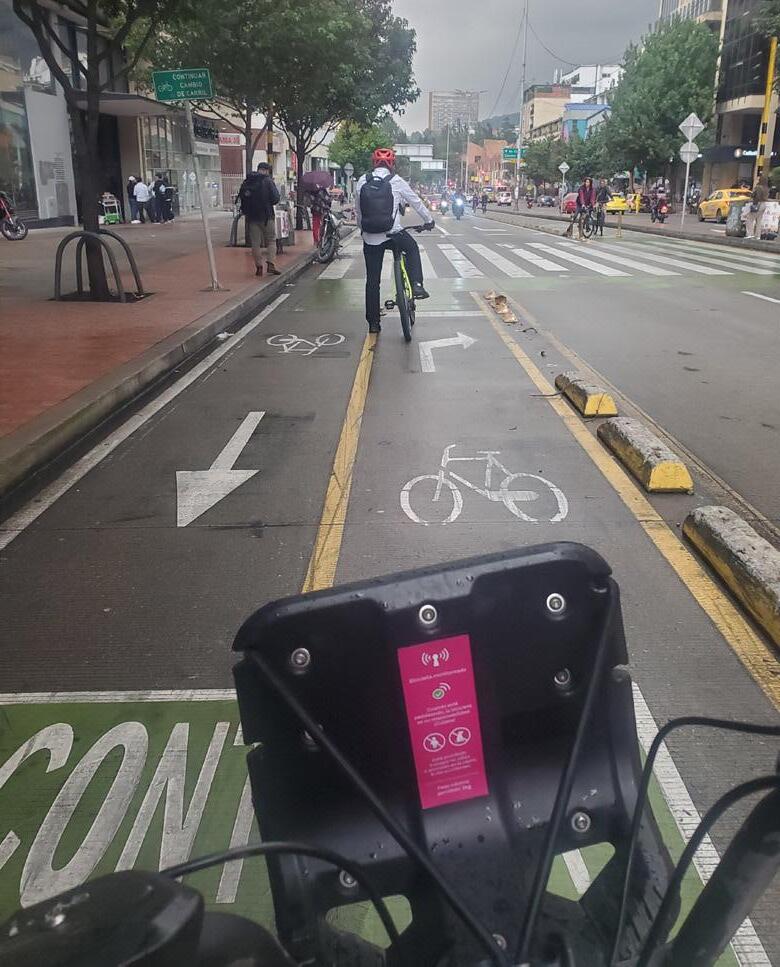

133
2024
WHAT’S IN A FUTURE?
PANORAMA
place to go. These high-capacity buses, known locally as TransMilenio, carry about 2 million passengers a day, 400,000 more than daily ridership on New York City’s buses, and in a city without a subway. These buses are embedded into the city infrastructure with two dedicated right-of-way lanes in each direction, full stations & amenities, and a comprehensive hierarchal system of dedicated busways (“trunk) and local (“feeder”) buses along the network.
The BRT network is the economic lifeblood of the city. Yet, the configuration of high-capacity transit roads in Bogotá is different than American roads, often dominated by a single mode. The network is not exclusive to transit and is in fact shared by all modes as a major artery, resulting in poor air quality, noise, and an awing sense of anarchy. Realizing we were in over our heads, we turned back.
Turning onto a street parallel from the original main road, we saw something resembling a bicycle path. With relief, we sped up, bouncing along the path. With no curb ramps transitioning the elevated sidewalk to the street at crossings, we literally flew into the air at intersections. Barriers were placed right in our path, leading us to zoom around them while trying to
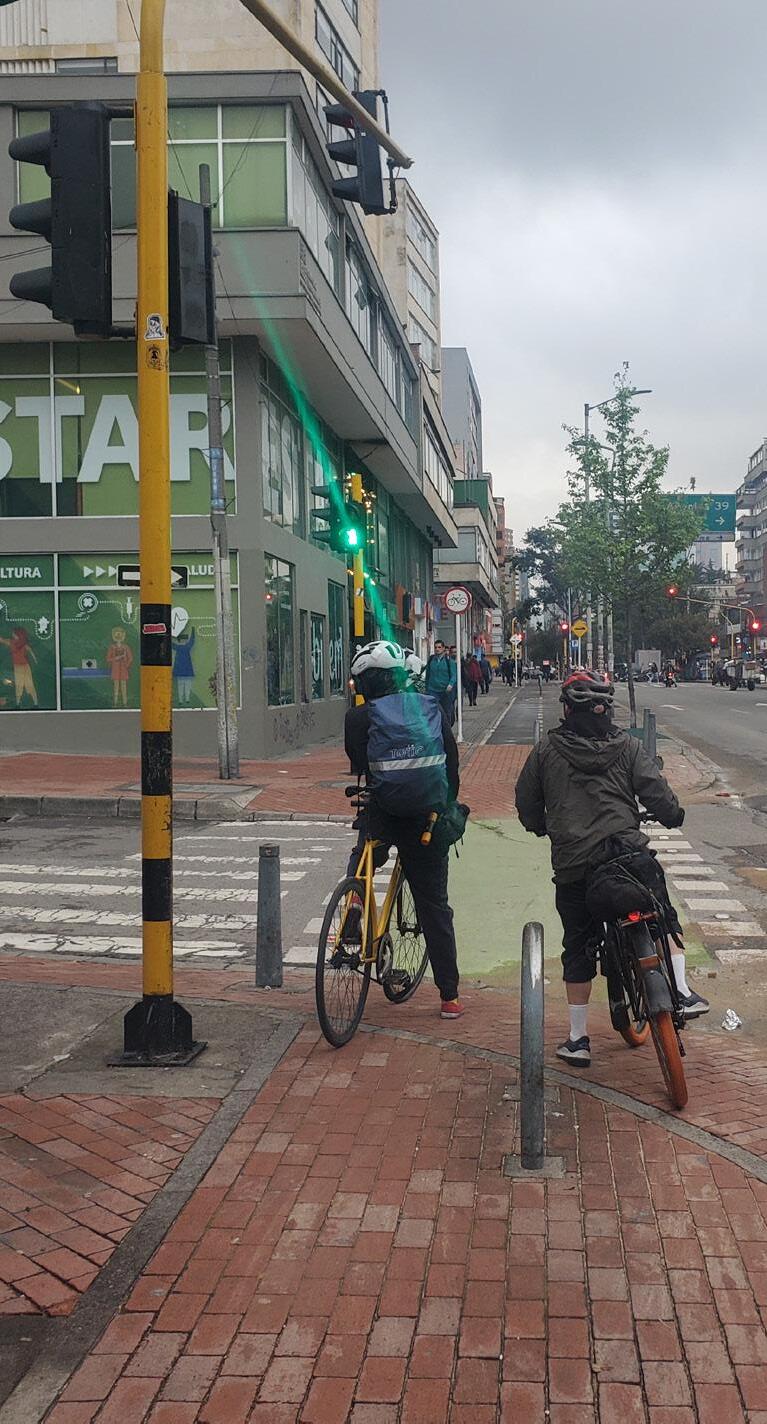
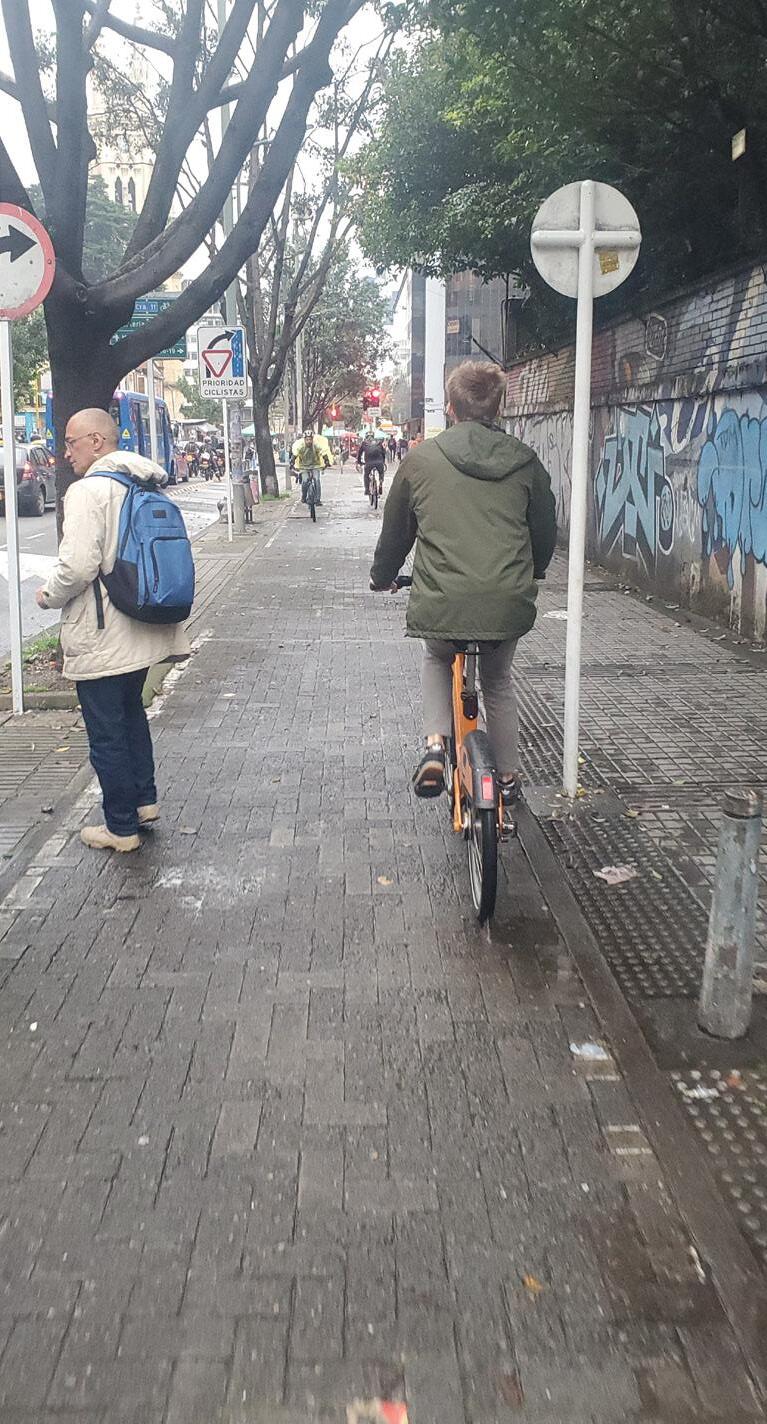
134 EQUITY AND CYCLING IN BOGOTA
avoid pedestrians not paying attention to us. We whizzed past informal bicycle shops smartly placed next to the trail with cyclists of all kinds weaving around us.
Arriving out of breath back at the station, our ride had revealed a lens to the city previously hidden. Although the tip of the iceberg, we had been able to briefly glimpse the chaotic, uncomfortable, and fragmented experience of Bogotá’s daily cyclists.
Despite the various levels of chaos we experienced during our ride, we were riding in a vacuum as tourists, sucking up only what was easily accessible and in our safe purview. However, the broader story of this network - and that of the people who use it every day - needs to be told. With more data digging, it became clear that Bogotá is not world class at integrating bicycle and bus infrastructure, with the most vulnerable citizens bearing the burden of those consequences. 16% of all crashes involving cyclists are on TransMilenio routes, which are just 3% of Bogotá’s roads. Most crashes involving cyclists are near BRT terminals and more than 50% of cyclists are in the socioeconomically lower classes.
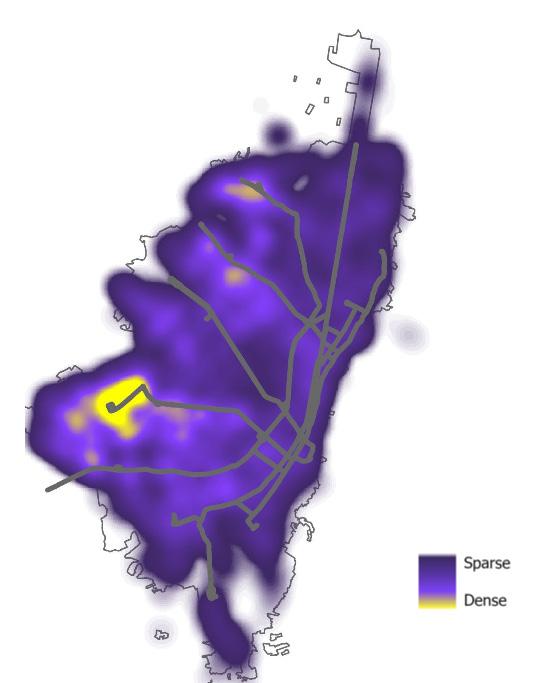

WHAT’S IN A FUTURE?
Figure 1
135 PANORAMA 2024
Concentration of Crashes Involving Cyclists Overlaid with TransMilenio Corridors
Arriving out of breath back at the station, our ride had revealed a lens to the city previously hidden. Although the tip of the iceberg, we had been able to briefly glimpse the chaotic, uncomfortable, and fragmented experience of Bogotá’s daily cyclists.
Despite the various levels of chaos we experienced during our ride, we were riding in a vacuum as tourists, sucking up only what was easily accessible and in our safe purview. However, the broader story of this network - and that of the people who use it every day - needs to be told. With more data digging, it became clear that Bogotá is not world class at integrating bicycle and bus infrastructure, with the most vulnerable citizens bearing the burden of those consequences. 16% of all crashes involving cyclists are on TransMilenio routes, which are just 3% of Bogotá’s roads. Most crashes involving cyclists are near BRT terminals and more than 50% of cyclists are in the socioeconomically lower classes.
Cycling for All?
Integrating bicycle and bus infrastructure in Bogotá can address many of the city’s transportation equity challenges. A majority of the population lives at the urban periphery in the lowest socioeconomic classes, many without cars. For those living beyond the city boundary, past the service of the transportation system, dependence on illegal buses to bring them to the TransMilenio terminal stations is essential. Bicycle access to TransMilenio terminals in the urban edges is critical to help low-income residents affordably reach the rapid transit system, which brings them the opportunity of higher paying work closer to the city center.
Ultimately, the infrastructure, while it exists, is inadequate. Bicycle paths at grade with sidewalks are quite common bicycle infrastructure along the BRT corridors, comprising the infrastructure on seven out of twelve
Bridges over the wide TransMilenio corridors are uncomfortable and meant for pedestrians, but shared by cyclists. By forcing pedestrians and cyclists to share the same path, cyclists are figuratively and literally pushed out of the way.
136 EQUITY AND CYCLING IN BOGOTA
WHAT’S IN A FUTURE?
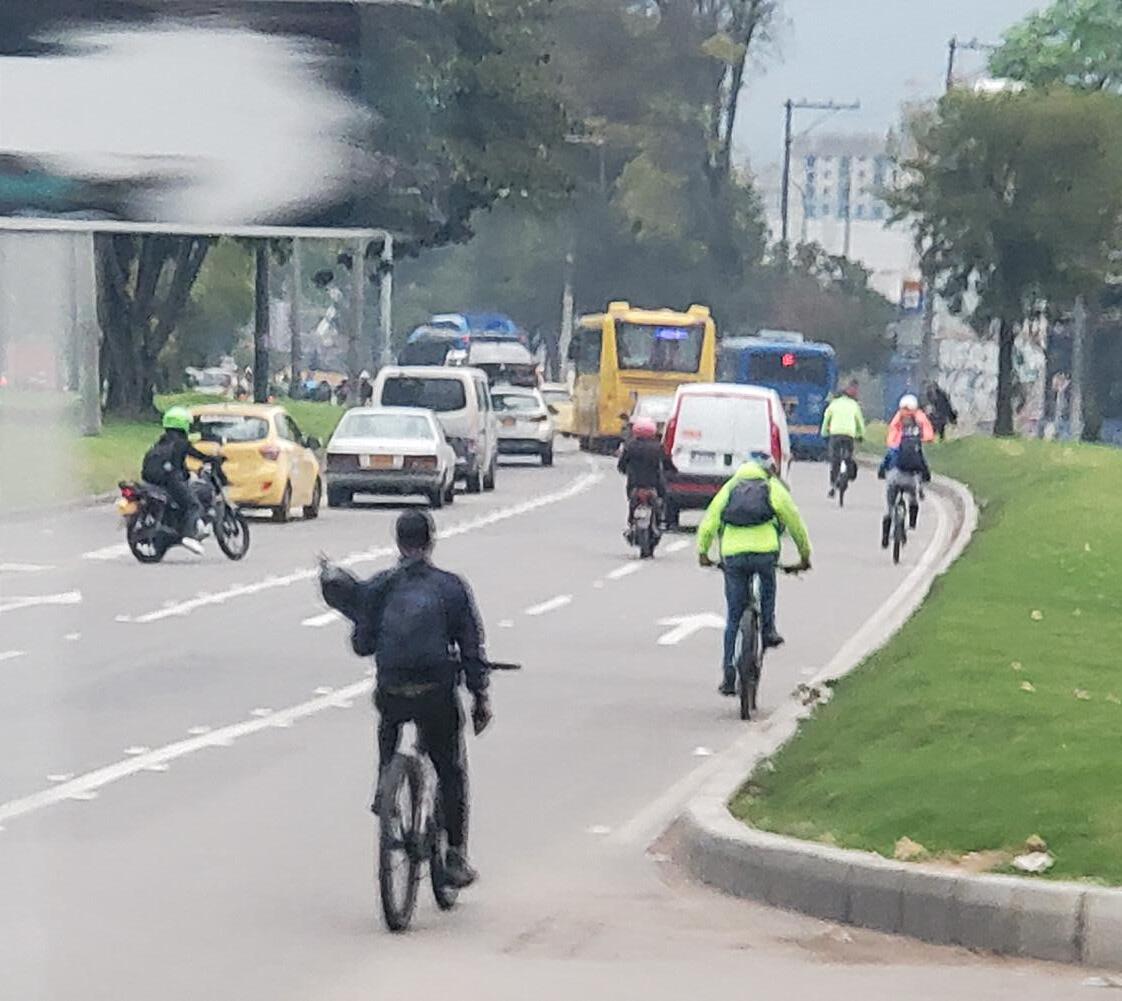

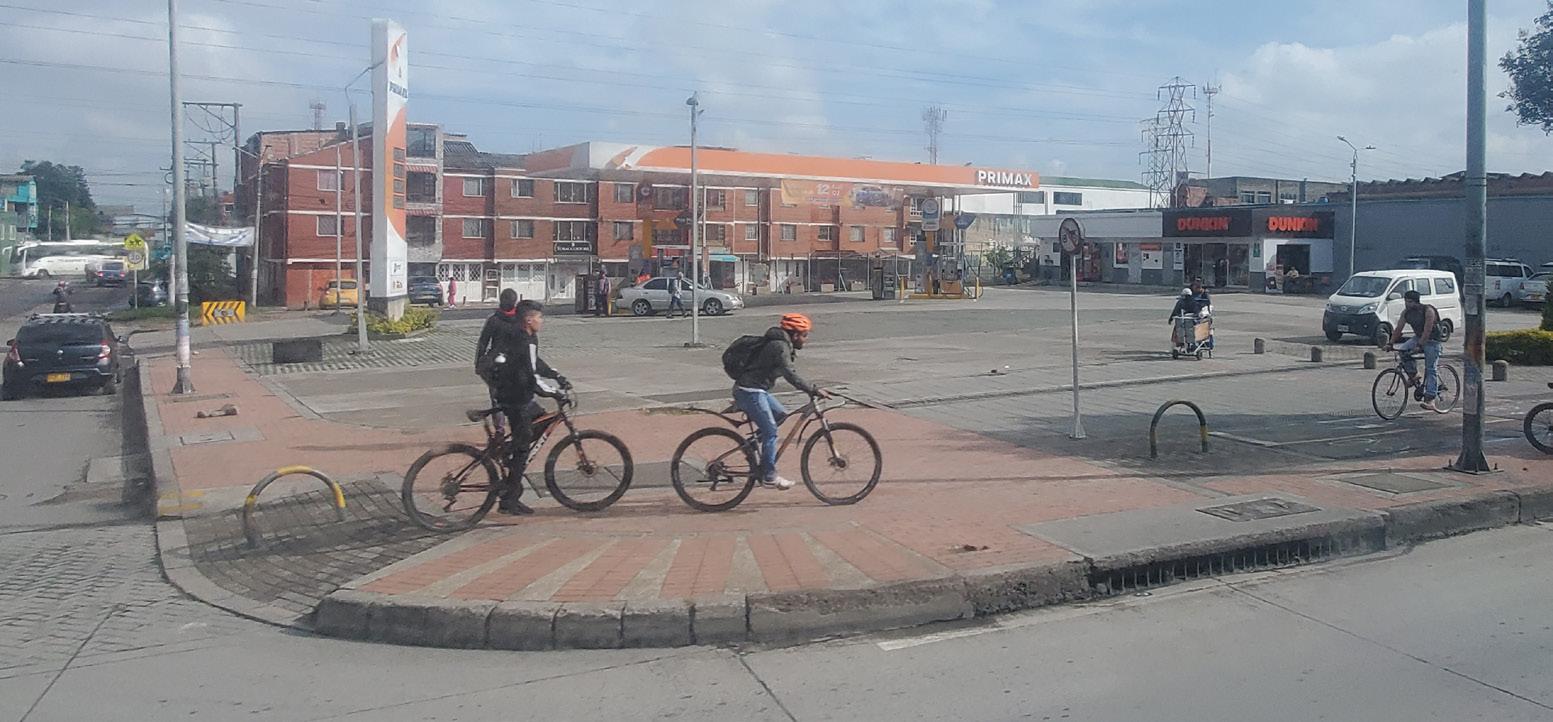
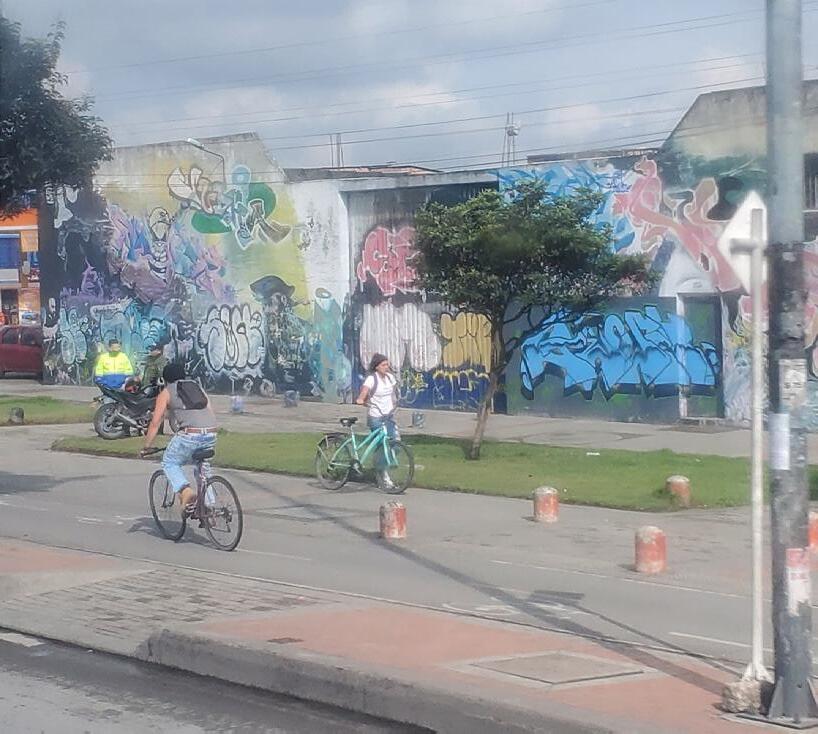
 Snapshots of bicycle life along or across TransMilenio corridors
137
PANORAMA 2024
For Bogotá to reach its ambitious goals of having 50% of all modes be by bike (the date by which remains to be announced), integrating the two modes is essential. The city is still growing, sprawling in an unplanned fashion up into the southern mountains; planned mega-developments are consuming farmland and wetlands in the west and north of the city with multilane highways and insular bicycle networks that lead nowhere. As Bogotá densifies and grows, creating neighborhoods at the scale and population of some mid-sized American cities, islands of infrastructure are no longer adequate.
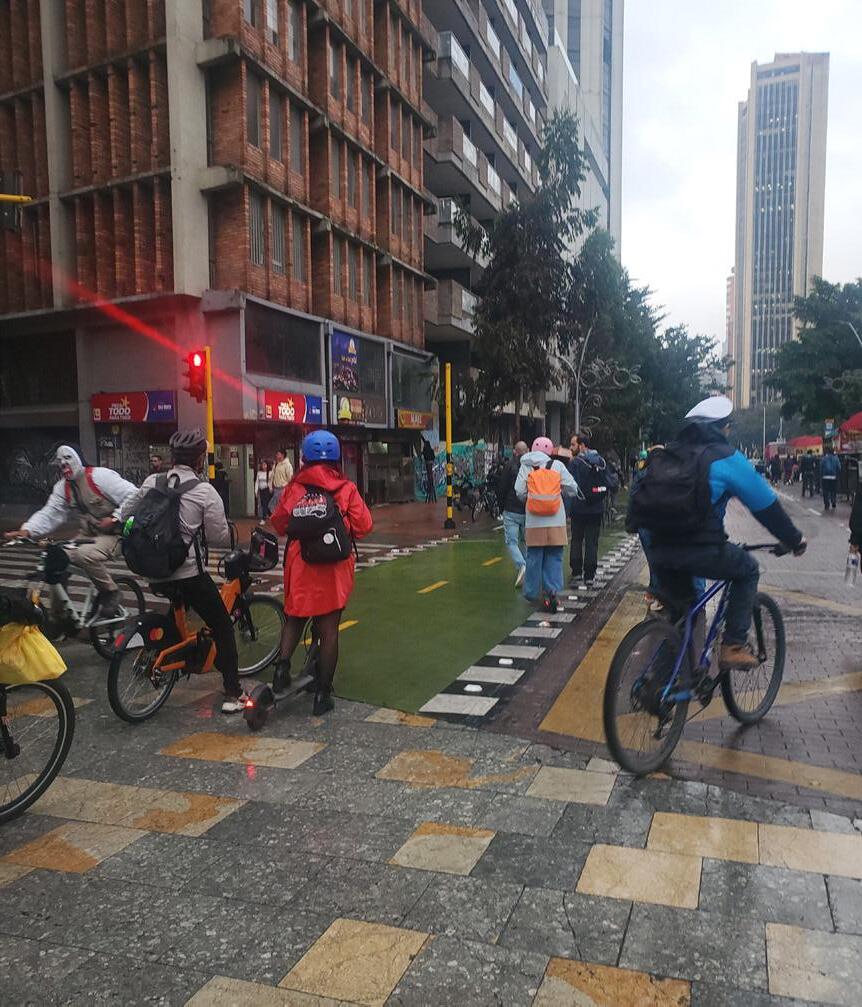
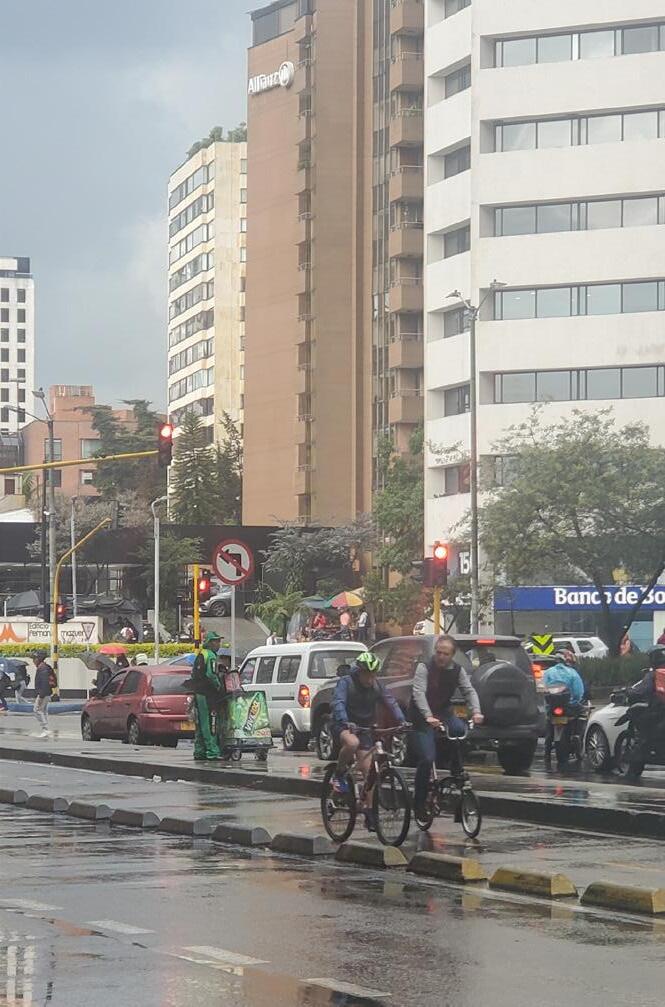
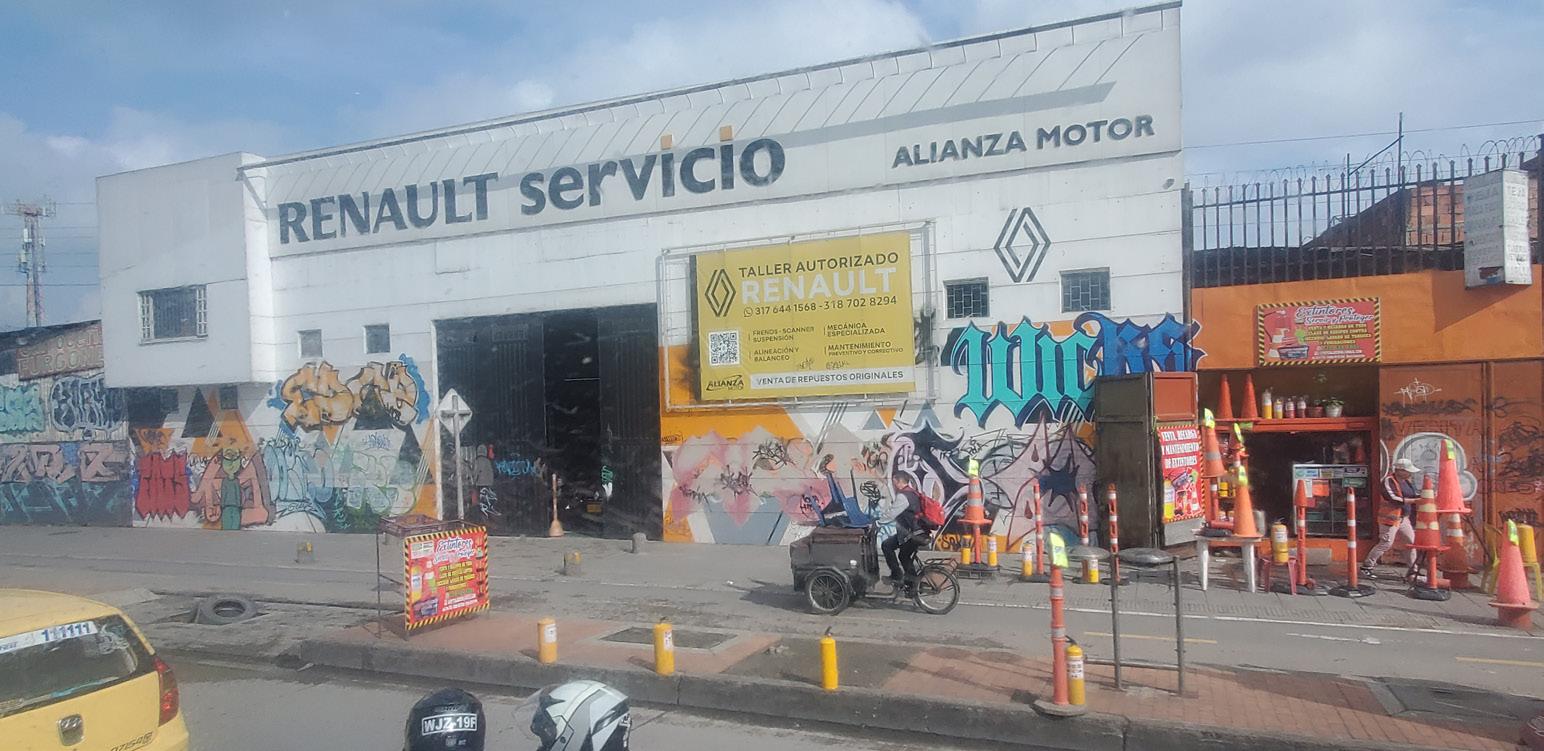 Bicycle infrastructure in downtown (top) and on its periphery (bottom)
138 EQUITY AND CYCLING IN BOGOTA
As planners who also bike, what perspective can we contribute?
While Bogotá has a revolutionary bus rapid transit system, most of its population is poor and lives on the urban periphery just beyond TransMilenio access. As we discovered in our studio, TransMilenio keeps expanding to provide access, which results in informal housing even further on the city edges beyond the system. The cycle of catch-up is unsustainable for a flat-rate transit system and results in a sprawling metropolis where the utility of a bicycle diminishes with ever-increasing distances. The poorest and most vulnerable citizens move further away, away from access, away from opportunity, away from connections. The complex and interdependent relationship between housing and transportation in Bogotá results in a lack of equitable access to both affordable housing and quality transportation for the people that live on the periphery.
We rode in the center of the city, but this was likely not reflective of how most Bogotá residents bike around. These two insights showcase a glaring gap between our limited tourist experience and a slice of data. Our data analysis and bus rides revealed only a glimpse of the inequities on the outskirts where we were unable to venture. These stories remain invisible to us as planners, and as cyclists we must imagine those lived experiences as viscerally frustrating, often life-threatening, and full of exploration for individuals gaining freedom through bicycles and buses.
There is no clear answer here, but questions must persist throughout planning practice as we learn about communities that aren’t ours and attempt to serve the public good. How can we fill in the gaps between data and personal experiences? How far is too far to venture from safe zones to understand the reality experienced by millions? How do we really know what it’s like to cross the labyrinth of mega infrastructure we create if we don’t try it ourselves? How can we have impact on a city at a variety of scales, from planning revolutionary infrastructure to enabling a person to hop on their bike and ride to the nearest bus stop?
The cycle of catch-up is unsustainable for a flat-rate transit system and results in a sprawling metropolis where the utility of a bicycle diminishes with ever-increasing distances.
A FUTURE?
WHAT’S IN
139
PANORAMA 2024
Endnotes
1 Bogotá Household Travel Survey, 2018
2 Kimmelman, Michael. “How One City Tried to Solve Gridlock for Us All.” The New York Times, December 7, 2023.
3 Ibid.
4 Analysis performed by A. Ringer using Bogotá Crash Data and Household Travel Survey, 2018
5 Flannery, Lee. “Bogotá Commits to the Bicycle.” Planetizen News, August 13, 2020.
6 Kimmelman
7 Garcia, Nati. Ciclovia de domingo. Photograph. Bogotá, Colombia, August 12, 2009. Bogotá, Colombia.

About the Author
Alexa Ringer (she/her) is a New Yorker, a cyclist, an environmental planner, and a board game enthusiast. She’s worked on multiuse trail planning, energy transition planning, and at a bike shop. If she can’t bike it, hike it, or take public transit, she’s mad about it.
140 EQUITY AND CYCLING IN BOGOTA
WHAT’S IN A FUTURE?

Abandoned bicycle at a TransMilenio bus stop
141 PANORAMA 2024
Stop Requested
by S. Amos


About the Author
S. Amos is a Philadelphia-based poet deeply interested in the cognitive dissonance of social science within the built environment, the heart in its rib cage, and the humanity in society.
Base cash fare /
Are you going to 20th Street? /
Move back /
It’s early and I’m doing my best
To feel rested after rest
To make room to have none and constantly think about
Is someone sitting there? /
Guns, germs, steel, the end of the world, the class that’s next
I don’t have it today /
Did someone say once that it would all work out?
Was the bus supposed to be here by now? /
Caution /
Can you cut the air on? /
There’s just this urgency of doubt
That gets stirred up every time things start to shake
That keeps God in the routes
Excuse me /
Doors are closing /
Detour /
Thank you /
Tugging, pulling, pressing on, seems to take
Counterfeit energy, dopamine placebo, deep fakes
That always keep me from where I’m meant to be going
Silently reminding me we do not control the breaks
It’s okay, I’ll take the next stop /
*The wettest cough you’ve ever heard* /
Bus is turning /
Sorry /
Back door
Such a certainty of knowing
Even though the cracks are showing
Earth is revolving, but how can we be sure?
It’s a large haul to be towing, but just as I start growing–
WHAT’S IN A FUTURE?
143 PANORAMA 2024
Free Speech

Advertising’s Challenges with Free Speech on Public Transit
by Leah Martins-Krasner
144
in Transit
The work of public transit agencies is far more complicated than moving people from point A to B. Agencies constantly investigate better technologies and invest in taking transportation to new heights of comfort, safety, and appeal. Planners are especially attuned to thinking innovatively about transit. Beyond planning transit routes, we ask, how should it look, and feel?
How is transit designed for relaxation and security? What should people be thinking about in transit? This essay explores a related question: what is the role of advertising in public transportation and how should it be managed?
Given how advertising shapes experiences in transit, it is critical to understand how advertising fits within the mission of transit agencies, what that means for advertisements posted, and how that intersects with legal issues like free speech. Examining a case in Philadelphia, Pennsylvania where the Southeastern Pennsylvania Transportation Authority (SEPTA) contends with free speech issues as a jumping off point, this paper considers how transit agencies manage issues and plan for a better future.
SEPTA V. Center for Investigate Reporting
In 2018, SEPTA received an application from the Center for Investigative Reporting (CIR), a nonprofit investigative news organization, to advertise on SEPTA’s buses.1 After the application was rejected, CIR, in collaboration with the American Civil Liberties Union and others, contended that rejection, on the basis of SEPTA’s advertising standards, were in violation of the First Amendment of the U.S. Constitution2 3.The circumstances around the rejection were the kickoff to another chapter in the long debate about restricting free speech.
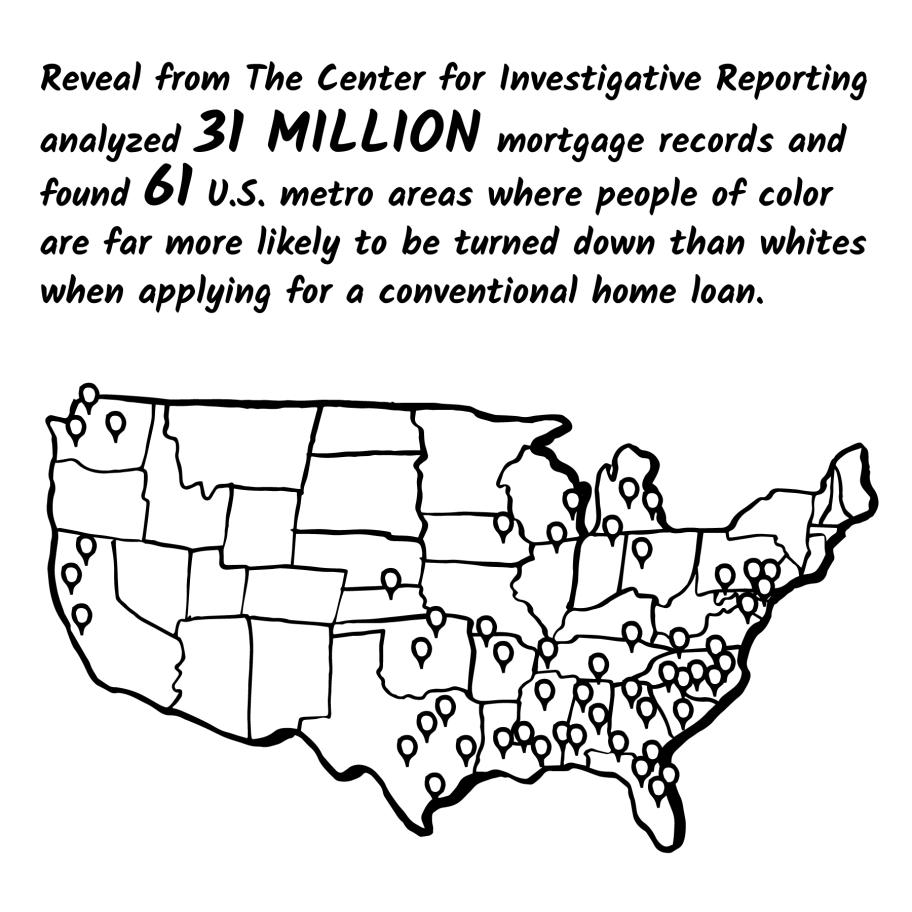
IN A FUTURE?
WHAT’S
Figure 1
145 PANORAMA 2024
CIR comic advertisement on discriminatory lending policies
Following an intense investigation, CIR found racial disparities in access to home loans in sixty-one cities, including Philadelphia. It found that African Americans and Latinos are denied mortgages more often than white applicants. CIR intended to run an ad campaign to publicize the findings using SEPTA to reach communities most impacted by the discriminatory lending practices.4 When CIR applied, SEPTA had several advertising policies to manage over 2,500 vehicles and 200 stations. SEPTA’s process included review by a communications consultant against twenty-two categories of unacceptable topics.5 These policies were built off existing legal precedent relating to transit advertising and potential violations of free speech. After review, if an application violated SEPTA’s policies, SEPTA’s general counsel made the final approval.6

SEPTA denied CIR’s proposal based on the violation of two policies.7 CIR’s proposal was said to be (1) political in nature by discussing home loan disparities, and (2) expressing or advocating an opinion related to economic or social issues, such as racial disparities. Recognizing the conflict with free speech, CIR sought an injunction to the U.S. District Court of the Eastern District of Pennsylvania.8 CIR’s argument was centered around SEPTA’s policies violating free speech in three ways. 9 They claimed that SEPTA’s policies:
1. Are vague and therefore not consistently applicable
2. Allow SEPTA to discriminate against certain viewpoints
3. Were unreasonable even considering special circumstances for places like public buses
Figure 2
FREE SPEECH IN TRANSIT 146
CIR comic advertisement on discriminatory lending policies
The Court decided that SEPTA had legal standing to limit free speech, however, parts of SEPTA’s policies were unconstitutional due to the lack of consistent and reasonable use in practice. The Court removed elements of SEPTA’s policy deemed problematic and sustained the application’s rejection.10 A year later, the case was appealed and the ruling was reversed due to SEPTA’s policies being incapable of reasonable application, forcing SEPTA to accept CIR’s application.11
The First Amendment
“Congress shall make no law… abridging the freedom of speech…”12
While simple, the First Amendment’s protection of free speech is far more complicated in practice.
The First Amendment protects many kinds of speech, including several that are relevant to advertising on public transit. There is broad scrutiny on policies that restrict free speech. However, certain contexts, termed ‘nonpublic forums,’ refer to government-owned property that is used for specific purposes.13 Nonpublic forums can include public transit, like SEPTA vehicles, and restrictions on content are legal if they fit the specific purposes of the space. Additionally, the law protects against limitations on points of view, such as opinions or ideologies. Even in nonpublic forums, no law can discriminate by allowing one view and not another.14 In this context, agencies are obligated to ensure that no viewpoints are being allowed over others, meaning views must restrict evenly across topics. Therefore, SEPTA can restrict content if it fits the purpose of the space and does not restrict anyone’s viewpoints.
Applying this framework to advertising standards adds another dimension of complexity. Advertising is considered commercial speech, which the government can restrict it if it does not pass a four-part test to ensure:15 (1) the ad is true and not misleading; (2) there is government interest in restricting ad content; (3) the regulations address that interest; and (4) the regulation is not overly restrictive.16 Loose interpretations of this test have led to lawsuits against agencies that now frame contemporary advertising policies. In Lehman v. Shaker Heights, the Supreme Court case decided that transportation operators can refuse political advertisements but cannot pick and choose which political opinions to restrict.17 This precedent allows for restrictive policies, and was followed by another case detailing that policies could not be considered content neutral if too much power was given to officials in the approval process.18
Third Circuit Court of Appeals
The Third Circuit of Appeals review of the SEPTA case presents the
A FUTURE?
WHAT’S IN
147 PANORAMA 2024
application of these principles. The Court found that they only need to assess if SEPTA’s policies were capable of reasoned application. While CIR contended that the policies restricted viewpoints, the Court held that viewpoint discrimination is irrelevant if a content restriction itself is illegal.19 They site Minnesota Voters Alliance v. Mansky, which requires all content-based limitations on government-controlled property to have reasoned applicability, meaning the limitation is applied consistently, adequately, and reasonably. 20 The manner of producing a reasonable application strategy for regulations is left vague, only that it requires “sensible basis for distinguishing what may come in and what must stay out.”21
In their appeal, CIR argued that the policy’s phrasing is unconstitutional under Mansky. Indeed, this is evident in SEPTA’s testimony, where the phrases political and political in nature were interpreted inconsistently. 22 When discussing if something was a ‘matter of public debate’ SEPTA held that the process involves making common sense judgements based on what is being debated in society overall. However, when the Court compared CIR’s rejection to allowing an advertisement related to Black Lives Matter, it became clear
“Indeed, with reasonable restrictions, agencies can post ads contributing to the continued dialogue that makes cities the dynamic places that they are.”
that ‘matter of public debate’ was not applied consistently. 23 SEPTA still held that the policies were legal, insisting that they demonstrated clear guidelines and a robust review infrastructure.
To interpret ‘reasonable application’ the Court quotes Rosenberger v. Rector, where the word ‘reasonable’ implies regulations are “designed to confine the ‘forum to the limited and legitimate purposes for which it was created.’”24 Thus, restrictions are only reasonable within the stated purpose of SEPTA’s advertisement program: “raise revenue… in a manner that provides for the safety, efficiency, and comfort of [its] passengers.”25 Ultimately, the Court determined that SEPTA’s policies did not have reasonable application and reversed the lower court’s ruling. They consider that SEPTA could not apply consistent decision-making logic for hypothetical advertisements. Likewise, though SEPTA had review procedures, giving general counsel final decision-making power leaves opportunity for inconsistencies. Lastly, the District Court’s striking of problematic language from the original policies makes them functionally broader and harder to be reasonably applied. 26
FREE SPEECH IN TRANSIT 148
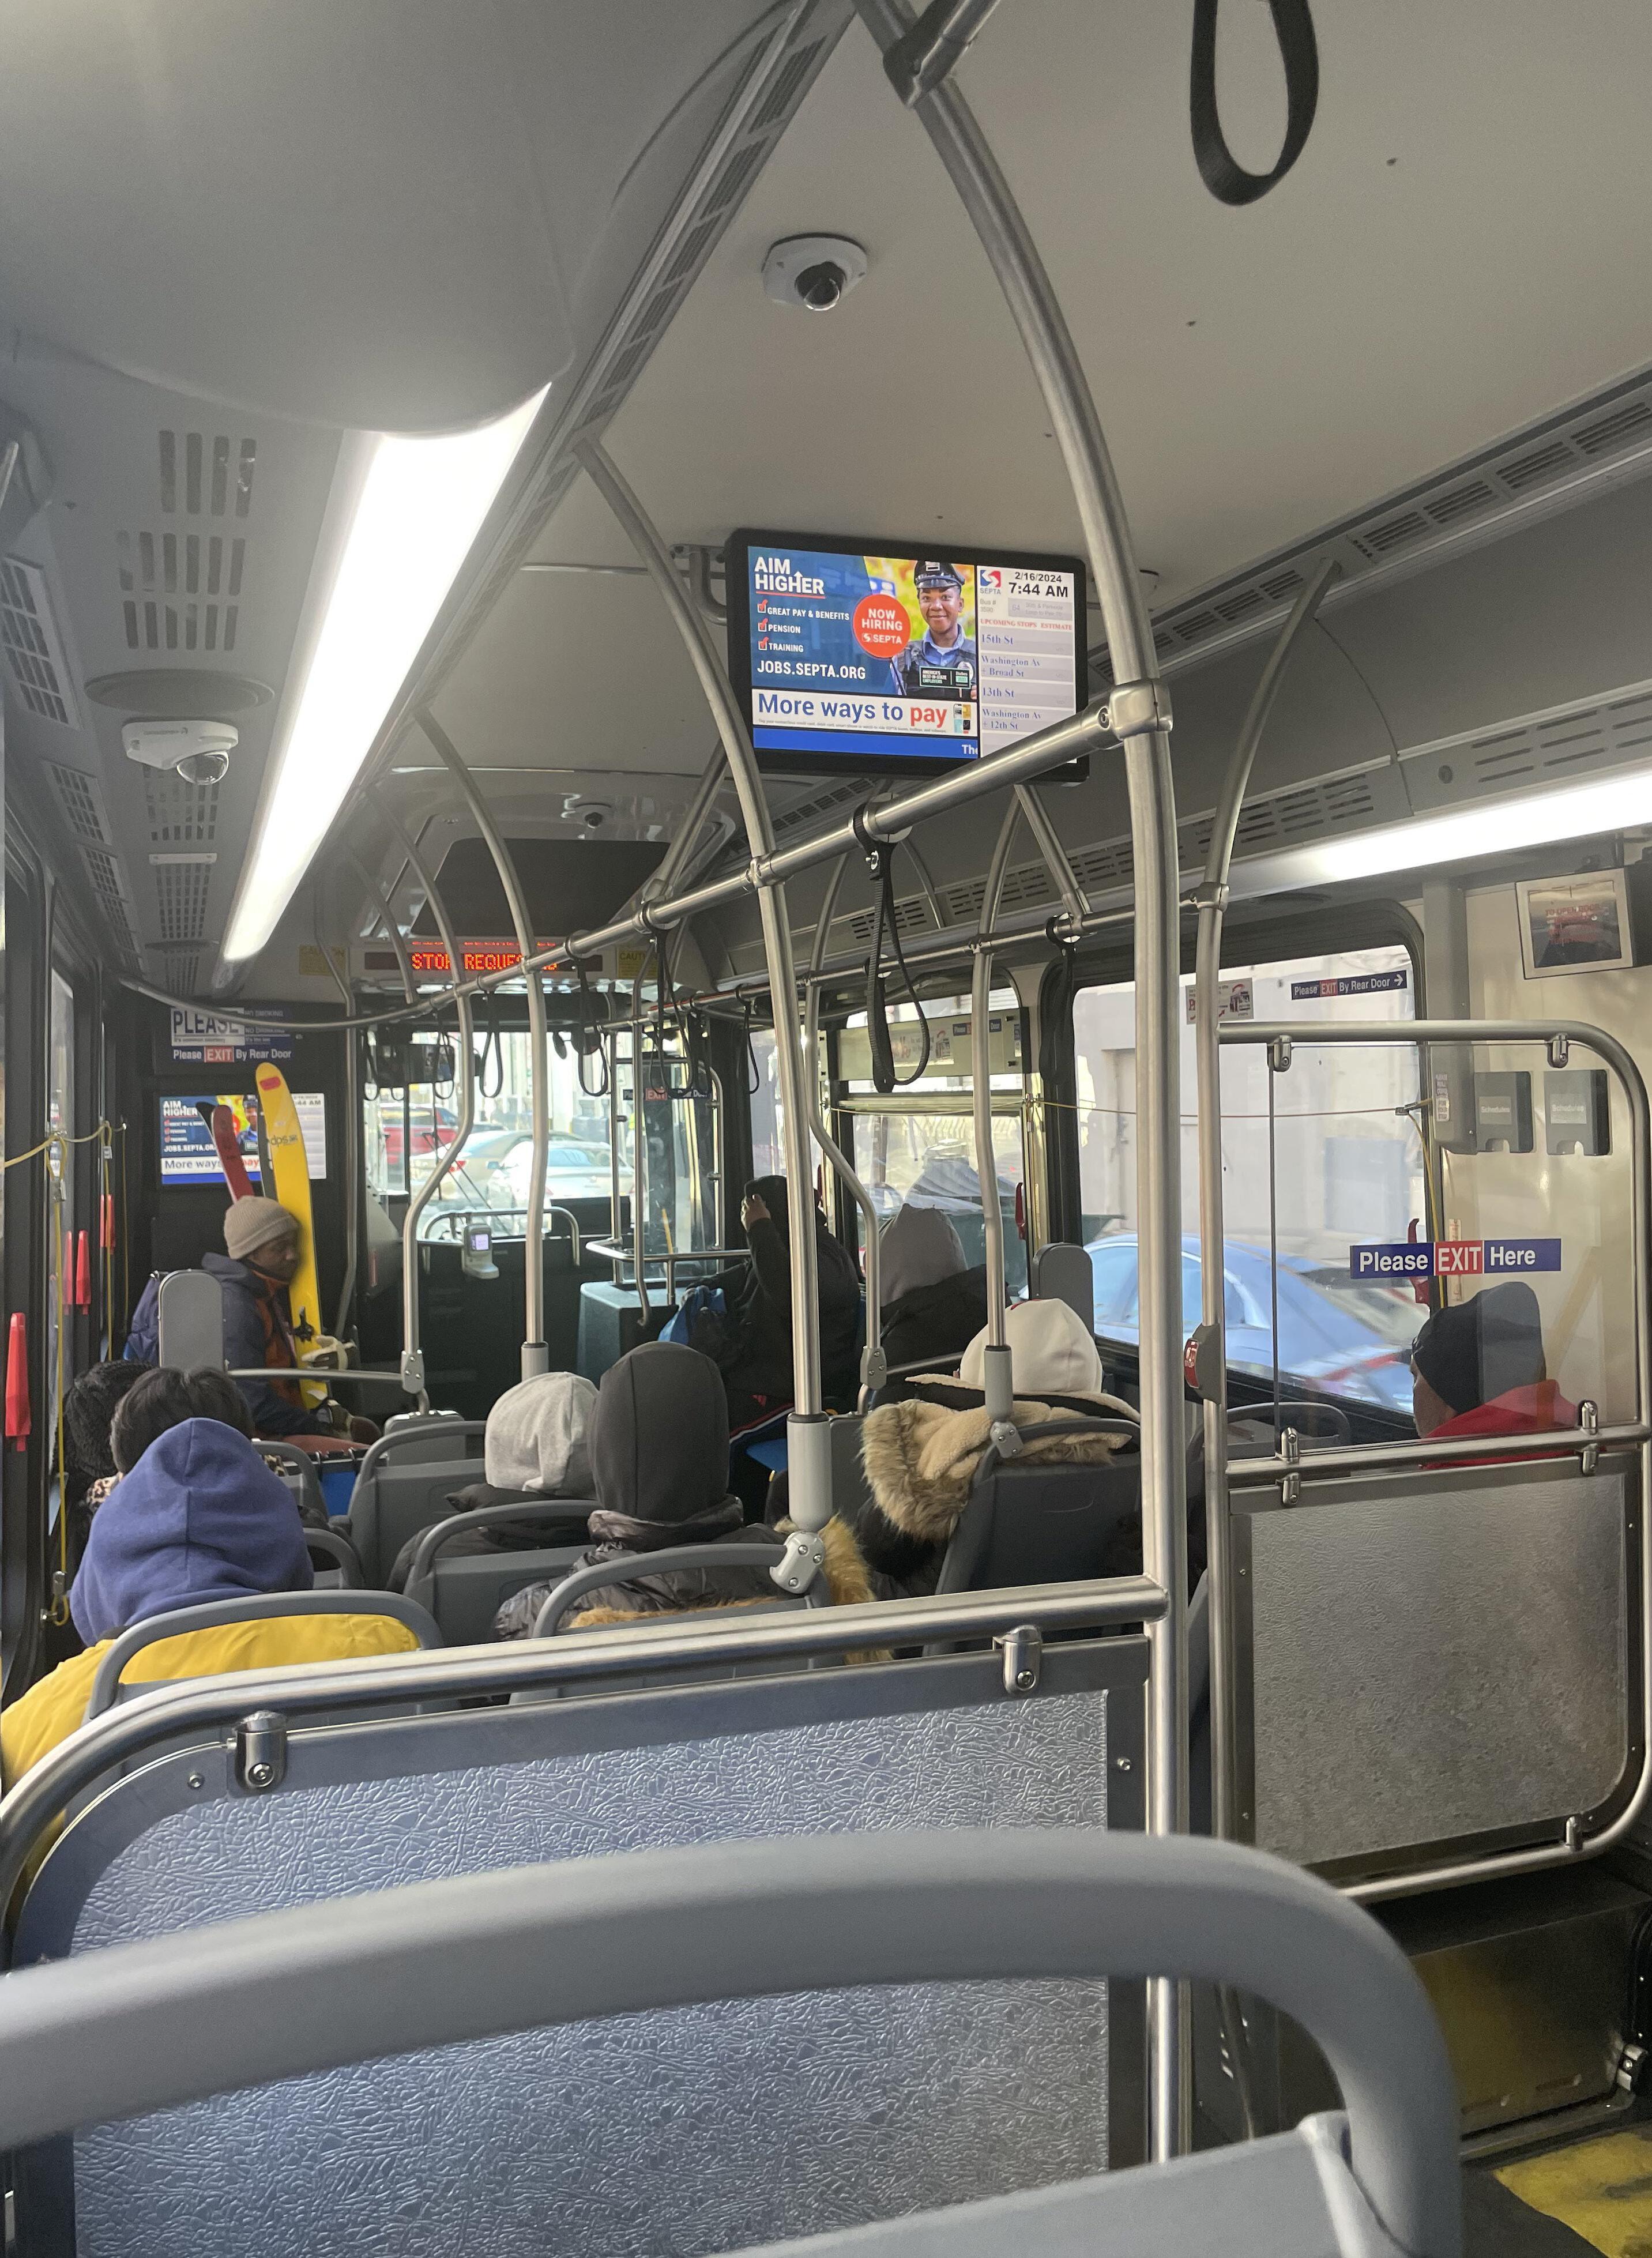
IN A FUTURE? 149 PANORAMA 2024
WHAT’S
Analysis & Conclusion
Freedom of speech limitations have a place on public transit, but it is indeed a balancing act. This brings up a critical question for planners: what is the role of advertising on public transit?
One could consider that commercial advertising has no place on public transit. After all, it is often a public service that may not have a place to support commerce. However, I believe many planners would not find this rational. Commercial language is everywhere, on people’s clothes, phones, the street, etc. Therefore, it is reasonable for agencies to leverage it for revenue. Additionally, ad space for governments or nonprofits present unique opportunities to reach wide swaths of audiences. Further, one could argue everything is political. Even innocent topics, such as animal shelters, could be steeped in politics, bringing up issues of funding, animal rights, etc. Some topics are more inflammatory than others; however, anything can be rationalized as “political in nature”.
Thus, the starting point is not necessarily whether public transit should have ads, but how planners can deal with the reality that advertisements both bring up sensitive topics and bring in significant revenue. In this context, how should advertising programs be planned? This requires answering three questions: (1) how should transit look and feel, (2) how reasonable restrictions can be designed, and (3) how to legally enforce the restrictions.
Public Transit’s Look & Feel
Many planners might aim for transit that feels comfortable and secure. Indeed, the advertisements you see impact that security, with topics stirring all sorts of emotions. Yet, in many ways, these are inescapable facets of daily life. Negative advertisements are simply another way in which humans experience the world and it is not necessarily a planner’s job to decided what should or should not be posted in this regard. Moreover, planners might view public transit as part of the city’s nervous system. Riders typically understand that nervous system and the larger city that lives around it. Thus, advertisements and those experiences of public transit are a facet of city life and censoring them can have legal ramifications and dampens the reality of city living, all the good and bad parts of it.
However, legal frameworks that limit speech do have a place in this story. Speech that shares opinions that people dislike or disagree with are one thing, but inflammatory or morbid speech is another. Indeed, transit being a nonpublic forum means that its purpose is to get people to where they need to go safely, which certain topics can jeopardize. Therefore, allowing content restrictions in the name of safety means agencies can do their jobs free of interruptions. Indeed, with reasonable restrictions, agencies can post ads
FREE SPEECH IN TRANSIT 150
contributing to the continued dialogue that makes cities the dynamic places that they are.
Designing Restrictions
As the case demonstrates, designing advertising policies is difficult. To plan fool-proof policies, agencies need to start by thinking about the four part test of restricting commercial speech. It is easy to ensure that advertisements are true and that they fit the space’s purpose. There is a grey area when it comes to determining if a regulation reaches no further than necessary. Certainly, bans of ‘political’ topics are nonsensical due to the fact that anything can be perceived as political. Assuming that one does not attempt such a ban, my opinion holds that the burden of agencies is to ban topics that

How do organizations ensure that bans on topics are not going too far? An allout ban has legal precedent, but previous cases show that even the most well-intentioned policies can overreach.
are morbid or incite violence. Therefore, I would not suggest implementing a blanket ban on political topics, but rather on topics with the potential for violence or that detail morbidity.
Enforcing Restrictions Legally
The meat of this discussion is choosing the mechanism for implementing restrictions. This is where SEPTA struggled and where other agencies will run into future issues. Many policies leave significant room for officials to let their opinions sway objectivity. Relying on one or two staff members is flawed. The adoption of descriptive and clear guidance should be accompanied by plurality of opinions, reflecting the diversity of transit users.
Continuing the hypothetical banning of inflammatory topics, one should rely on a committee of SEPTA employees where the general counsel is only one voice among many. This committee could assess issues more accurately and troubleshoot to avoid burdensome lawsuits that drain valuable resources.
IN A FUTURE?
WHAT’S
151 PANORAMA 2024
Certainly, the committee structure could also lack objectivity, but it would likely stand up better in a court, saving the agency’s time, money, and reputation....
As with other government agencies, transit agencies and the efforts of the individuals who run them are more than getting people from A to B. Public transit is an essential element of city life, another place where the daily positives and negatives of any city are laid bare. This does not mean that we should allow terrible things to be advertised, but that careful guidance should be put in place to respect people’s security and wellbeing in the process. The law, while complex, allows for those kinds of restrictions on public transit and, if done sensitively, transit advertising can support the long term interests of agencies and their riders.

FREE SPEECH IN TRANSIT 152

About the Author
Leah Martins-Krasner (she/her) is a second-year Master of City Planning student with a focus in transportation planning and advocacy. Her interests include building transportation equity and supporting communities to ensure they are reflected in public spaces. Prior to graduate school, Leah worked at the Local Initiatives Support Corporation, building the capacity of community-based organizations in New York. She holds a BA in Planning and Public Policy from Rutgers University.
WHAT’S IN A FUTURE?
1 American Civil Liberties Union. “ACLU Sues Philadelphia Area Transit System for Banning Ads on Housing Discrimination.” ACLU, accessed November 27, 2023. 2 Ibid. 3 Ctr. for Investigative Reporting v. SEPTA, 337 F. Supp. 3d 562 U.S. District Court, Eastern District of Pennsylvania, 2018. Complaint for Declaratory and Injunctive Relief. 4 American Civil Liberties Union. “Philly Public Transportation Censors Rides Along With You.” ACLU. Accessed November 20, 2023. 5 Ctr. for Investigative Reporting v. SEPTA, 337 F 6 Id. 7 Id. at 2 8 Ctr. for Investigative Reporting v. SEPTA, 337 F 9 Id. at 12 10 Ctr. for Investigative Reporting v. SEPTA, 975 F.3d 300, 2020 U.S. App. LEXIS 29034, 2020 WL 5509709 (United States Court of Appeals for the Third Circuit September 14, 2020, Filed) 11 Ctr. for Investigative Reporting v. SEPTA, 975 F.3d 12 U.S. Congress. “Amendment 1 - Freedom of Religion, Press, Expression.” Constitution Annotated. Accessed November 26, 2023. 13 Ibid. 14 Ibid. 15 Legal Information Institute. “Commercial Speech.” Cornell Law School. Accessed November 29, 2023. 16 Herring, Norman, and D’Auri, Laura. 1998. “Restrictions on Speech and Expressive Activities in Transit Terminals and Facilities.” Transportation Research Board. 17 Ibid. 18 Ibid. 19 Ctr. for Investigative Reporting v. SEPTA, 975 F.3d, at 25 20 Harvard Law Review. “Minnesota Voters Alliance v. Mansky.” Harvard Law Review. 21 Ctr. for Investigative Reporting v. SEPTA, 975 F.3d, at 26 22 Id. 23 Id. 24 Id. 25 Id. at 25 26 Id.
Endnotes
153 PANORAMA 2024
Kisumu Collage
by Kamya Khandelwal
In the last semester, I was part of the Kenya studio led by David Gouverneur, Thabo Lenneiye, and Karli Molter. As one of the first exercises for the studio, we were asked to create a 36”x36” collage, and I decided to center mine around the critical topic of public health, because it stands as one of the most pressing and urgent issues in both African and other Global South countries. This choice naturally guided my focus throughout the semester towards addressing public health challenges, especially within informal settlements.
154

155
2024
PANORAMA
Smart City Navigating
Pilots
A Roadmap for City Planners
 by Emmy Park and Laura Frances
The term “smart city” often conjures images of futuristic landscapes with biometric sensors and autonomous vehicles ruling the streets. In actuality, contemporary smart cities have a simpler aim: leverage data and technology to improve the quality of public services. But the simplicity of the concept is complex in execution. Pilot programs can be an effective way to experiment and see whether a new technology is worth the effort and resources required to deploy city-wide. But, as we saw in our exploratory analysis of Philadelphia’s curb management pilot, even small-scale pilots come with their own set of challenges.
Curbs are a seemingly small-scale slice of cities. However, curbs are an essential space that serve a wide and often unpredictable range of uses - loading, unloading, parking, paying, dining, and charging. At its best, we see efficient shared use of space and plenty of availability for vehicles and people to flow in and out. At its worst, we see double parking, vehicles continuously circling the block, buses backed up, and bicyclists put in the path of danger. Despite the need for innovation, the curb is still largely managed by parking meters and parking attendants issuing paper tickets. As cities look to solve their problems with the help of technology, smart curb management is rising to the top of the list.
In March 2022, the City of Philadelphia’s Office of Innovation and Technology (OIT) launched a six-month Smart Loading Zone (SLZ) pilot to meet unmet demand for loading zones spurred by rideshare apps, set a new data standard, and convert fines into fees1. The pilot required drivers to book and pay for curb time via a third-party app at 20 SLZs in Center City2. In response to this Request for Proposals, the winning tech vendor pitched a future full of sensors and big data. When the vendor’s technology was not ready to live up to the city’s ambitious goals, the scope of the pilot was reduced to a reservation app just for commercial truck drivers. While this could create an additional revenue stream from reservation fees and potentially reduce instances of illegal parking and the time delivery trucks spend searching for parking, it was all on a much smaller scale that the city originally planned.
As cities continue to push for more smart city solutions, planners can advocate for pilot designs that realistically consider what the city will accommodate and the tech vendor can deliver.
Curious about OIT’s SLZ pilot, we reached out and offered to do exploratory data analysis. From the outset, it was clear that the vendor was
IN A FUTURE?
WHAT’S
157 PANORAMA 2024
only able to capture data on a small portion of truck drivers using the curb and would not provide enough information to inform a management strategy for all loading demand at the curb. As we began our analysis and compared our work to other smart curb management studies, we noticed a recurring problem with these pilots. Pilots’ original research designs are often misaligned in their stated objectives and tech vendors overpromise what they can deliver. Additionally, we noticed that too many pilots try to isolate the curb from actual users that already rely upon access to the curb, such as rideshare drivers and local businesses. As cities continue to push for more smart city solutions, planners can advocate for pilot designs that realistically consider what the city will accommodate and the tech vendor can deliver. We propose three guiding questions for planners to consider before launching a smart city pilot.
1) Are the goals of the pilot aligned with the capacity of the vendor?
Tech companies come to cities with silver-bullet software and applications concepts. They pitch solutions to grave and urgent challenges - like gun violence and flood mitigation - where the inaction is consequential. It’s understandable, then, that cities can fall prey to these tech-based solutions. But when each city has unique issues and needs, how could one technology offered by one vendor address them all? Pilot programs can adapt these technologies to cater to a city’s specific goals. However, before diving head-first into these pilots, cities need to come with their goals defined and remain committed to those goals when negotiating with vendors. From there, cities need to verify that the vendor’s data collection and processing capacities are publicly available, reliable, and usable. Otherwise, planners may end up needing to justify pricey technologies with lackluster results.
In the case of OIT’s pilot, the vendor tried to deploy unproven technology that may have worked in a lab but failed in the streets. The city made the most of it, but the incomplete pilot design only produced data on how long trucks booked loading space in a few key commercial locations. This is not the same as understanding the parking demand or curb usage as a whole. Furthermore, much of the data was also proprietary and unreliable.
The following questions address how to mitigate mismatch between the pilot’s goals and the vendor’s capacity:
• What is the primary goal of the pilot? What issues is the pilot aiming to address? Who is most affected by these issues?
• Can all the goals be achieved with one pilot?
• What information does the city need to get out of the pilot’s data?
Will this data be publicly accessible, reliable, and usable?
158
NAVIGATING SMART CITY PILOTS


WHAT’S IN A FUTURE? 1200 Chestnut St. (#20) 900 Walnut St. (#4) 900 Walnut St. (#5) 1000 Walnut St. (#6) BROADSTREET WALNUT STREET CHESTNUT STREET 1300 Chestnut St. (#21) 600 Walnut St. (#1) 700 Walnut St. (#2) 800 Walnut St. (#3) 900 Walnut St. (#7) 900 Walnut St. (#8) 1000 Walnut St. (#9) 900 Walnut St. (#10) 900 Walnut St. (#11) 1000 Walnut St. (#12) 1200 Samson St. (#15) 1200 Samson St. (#14) 1000 Chestnut St. (#19) 900 Chestnut St. (#18) 800 Chestnut St. (#17) 800 Samson St. (#13) 600 Chestnut St. (#16)
Aerial
Map: Google Earth PHILADELPHIA’S 2022 SMART LOADING ZONES MAP
Figure 1
159 PANORAMA 2024
Map of Philadelphia’s 2022 Smart Loading Zones
• Does the city have the internal capacity to analyze the data or resources to outsource its analysis?
• What is the prevailing hypothesis about the data? How might this skew its analysis?
• What are the pilot’s negotiable and non-negotiable parameters and constraints?
2) What is the geographic scope of the pilot’s end goal?
After defining the purpose and objectives of a pilot, the next step is to determine the specific location where the pilot will be conducted and if that geography can be generalized to the end goal. If the original location does not accurately represent the scope of the end goal of the project, then this data cannot be broadly applied. In order for the pilot to demonstrate how a new technology will improve public service delivery, the pilot’s geography must be representative of the whole city.
Philadelphia is a mix of urban and suburban, residential and commercial, low-density and high-density areas. The pilot was limited to Center City, the commercial heart of Philadelphia, where its high-density land use and busy streets are unique compared to the rest of the city. How reliably could data on a curb surrounded by shops, hospitals, and office buildings represent a curb surrounded by single family housing? To successfully extrapolate the results from a small-scale pilot to the rest of a city, we offer a few questions to help develop a critical and granular lens:
How reliably could data on a curb surrounded by shops, hospitals, and office buildings represent a curb surrounded by single family housing?
• What is the pilot’s geographic scope? What are the geography’s characteristics (ex. land use, zoning, traffic conditions, pedestrian counts, and future plans)?
• Are the people who will use and be affected by the technology represented in the pilot?
• How may the area’s historical uses and urban design affect the technology’s implementation strategy or the study’s performance metrics?
• Does the pilot need to serve the whole city? Is it useful to invest in the pilot if it focuses on a narrower field of study?
160 NAVIGATING SMART CITY PILOTS
3) Is the pilot’s technology able to operate with other smart city initiatives?
Public space in the city is multifunctional and ever-changing. As new technologies are perpetually introduced into the streetscape, it is important for planners to consider how they can be used to support one another. When countless wires and signals cross, if planners need to navigate a graveyard of unused technology when designing pilots, it can quickly become an insurmountable mess. Planners can demand that technology vendors play nice with one another and create a smart network throughout the city.
Given the SLZ pilot’s original goals to tackle a wider range of curb uses, there was a missed opportunity to work with a vendor or group of vendors who could address more than truck loading. For example, Center City is a hub for hospitality and nightlife, but there were no smart passenger loading zones in the pilot. There are existing passenger pick-up and drop-off (PUDO) zones in the pilot’s study area. These are spots on select street corners for rideshare users to safely get in and out cars and reduce double parking. If the SLZ pilot included existing PUDO zones, it could have been an interesting opportunity to see if the vendor’s curb management technology could work for both passenger and commercial loading zones. We pose the following questions to help planners develop a smart network rather than a single smart feature:
• How are current challenges and needs going to change? Does the study area overlap with other city initiatives that may interfere with the pilot?
• Is the vendor’s tech deployable or is the pilot a testing ground for them to tinker with their product or service? Does the contract’s costs reflect the vendor’s readiness?
• What is the vendor’s internal capacity to deliver throughout the pilot and beyond? If the pilot is a success, what is the commercial lifespan of the technology?
• Does the city have the capacity to manage and resources to maintain the technology beyond the pilot period?
Smart Pilots for Smart Cities
Pilots can be an effective tool for cities to innovate. But pilots can also fall victim to flash-pan demonstrations of technologies that do not ultimately serve the public. Particularly in curb management, but other sectors too, tech companies are capitalizing on cities’ willingness to take on pilots, even when the pilot design is less comprehensive than originally intended. That being said, pilots, even when imperfect, are not a universal waste of time or
IN A FUTURE?
WHAT’S
161 PANORAMA 2024
resources, and can still offer insights on how to make cities more resilient, insightful, and productive.
Pilots are experiments, and experiments require some degree of methodological rigor. While Philadelphia’s SLZ pilot may not have answered all of OIT’s original questions, it’s still a helpful look into how to monetize and optimize commercial loading in Center City. While, on one hand, it’s exciting to see Philadelphia put forth ambitious initiatives to transform how it delivers public services, it would be equally exciting to work with a vendor that strikes a balance between innovation, feasibility, and utility from the start and throughout implementation.
No matter the scale, analyzing pilots for the good, the bad, and the ‘what’s next’ is essential to making the most of every pilot, for the city that deployed the original scheme and all the others considering doing the same. Ultimately, a good smart city pilot pairs data and technology with a realistic and grounded hypothesis of how to make a city better, even if it is just one curb at a time.
Endnotes
1 “Smart Loading Zones: Programs and Initiatives.” City of Philadelphia, October 3, 2022.
2 “Frequently Asked Questions: Programs and Initiatives.” City of Philadelphia.

About the Authors
Emmy Park (she/her) is a reformed engineer and secondyear student in the Master of City Planning program. She focuses on transportation planning and the impact of infrastructure on how we experience our cities.
Laura Frances (she/her) is a second-year Master of City Planning student concentrating in Smart Cities. She is most interested in how to leverage technology to make cities more climate resilient and energy efficient. Before her time at Penn, Laura managed digital equity programs for a new national non-profit and before that started an innvoation consultancy called Built Interest that worked as owners’ representatives to develop alternative real estate products from hyper-local food halls in Toronto to zero-carbon coworking in Berlin.

162 NAVIGATING SMART CITY PILOTS
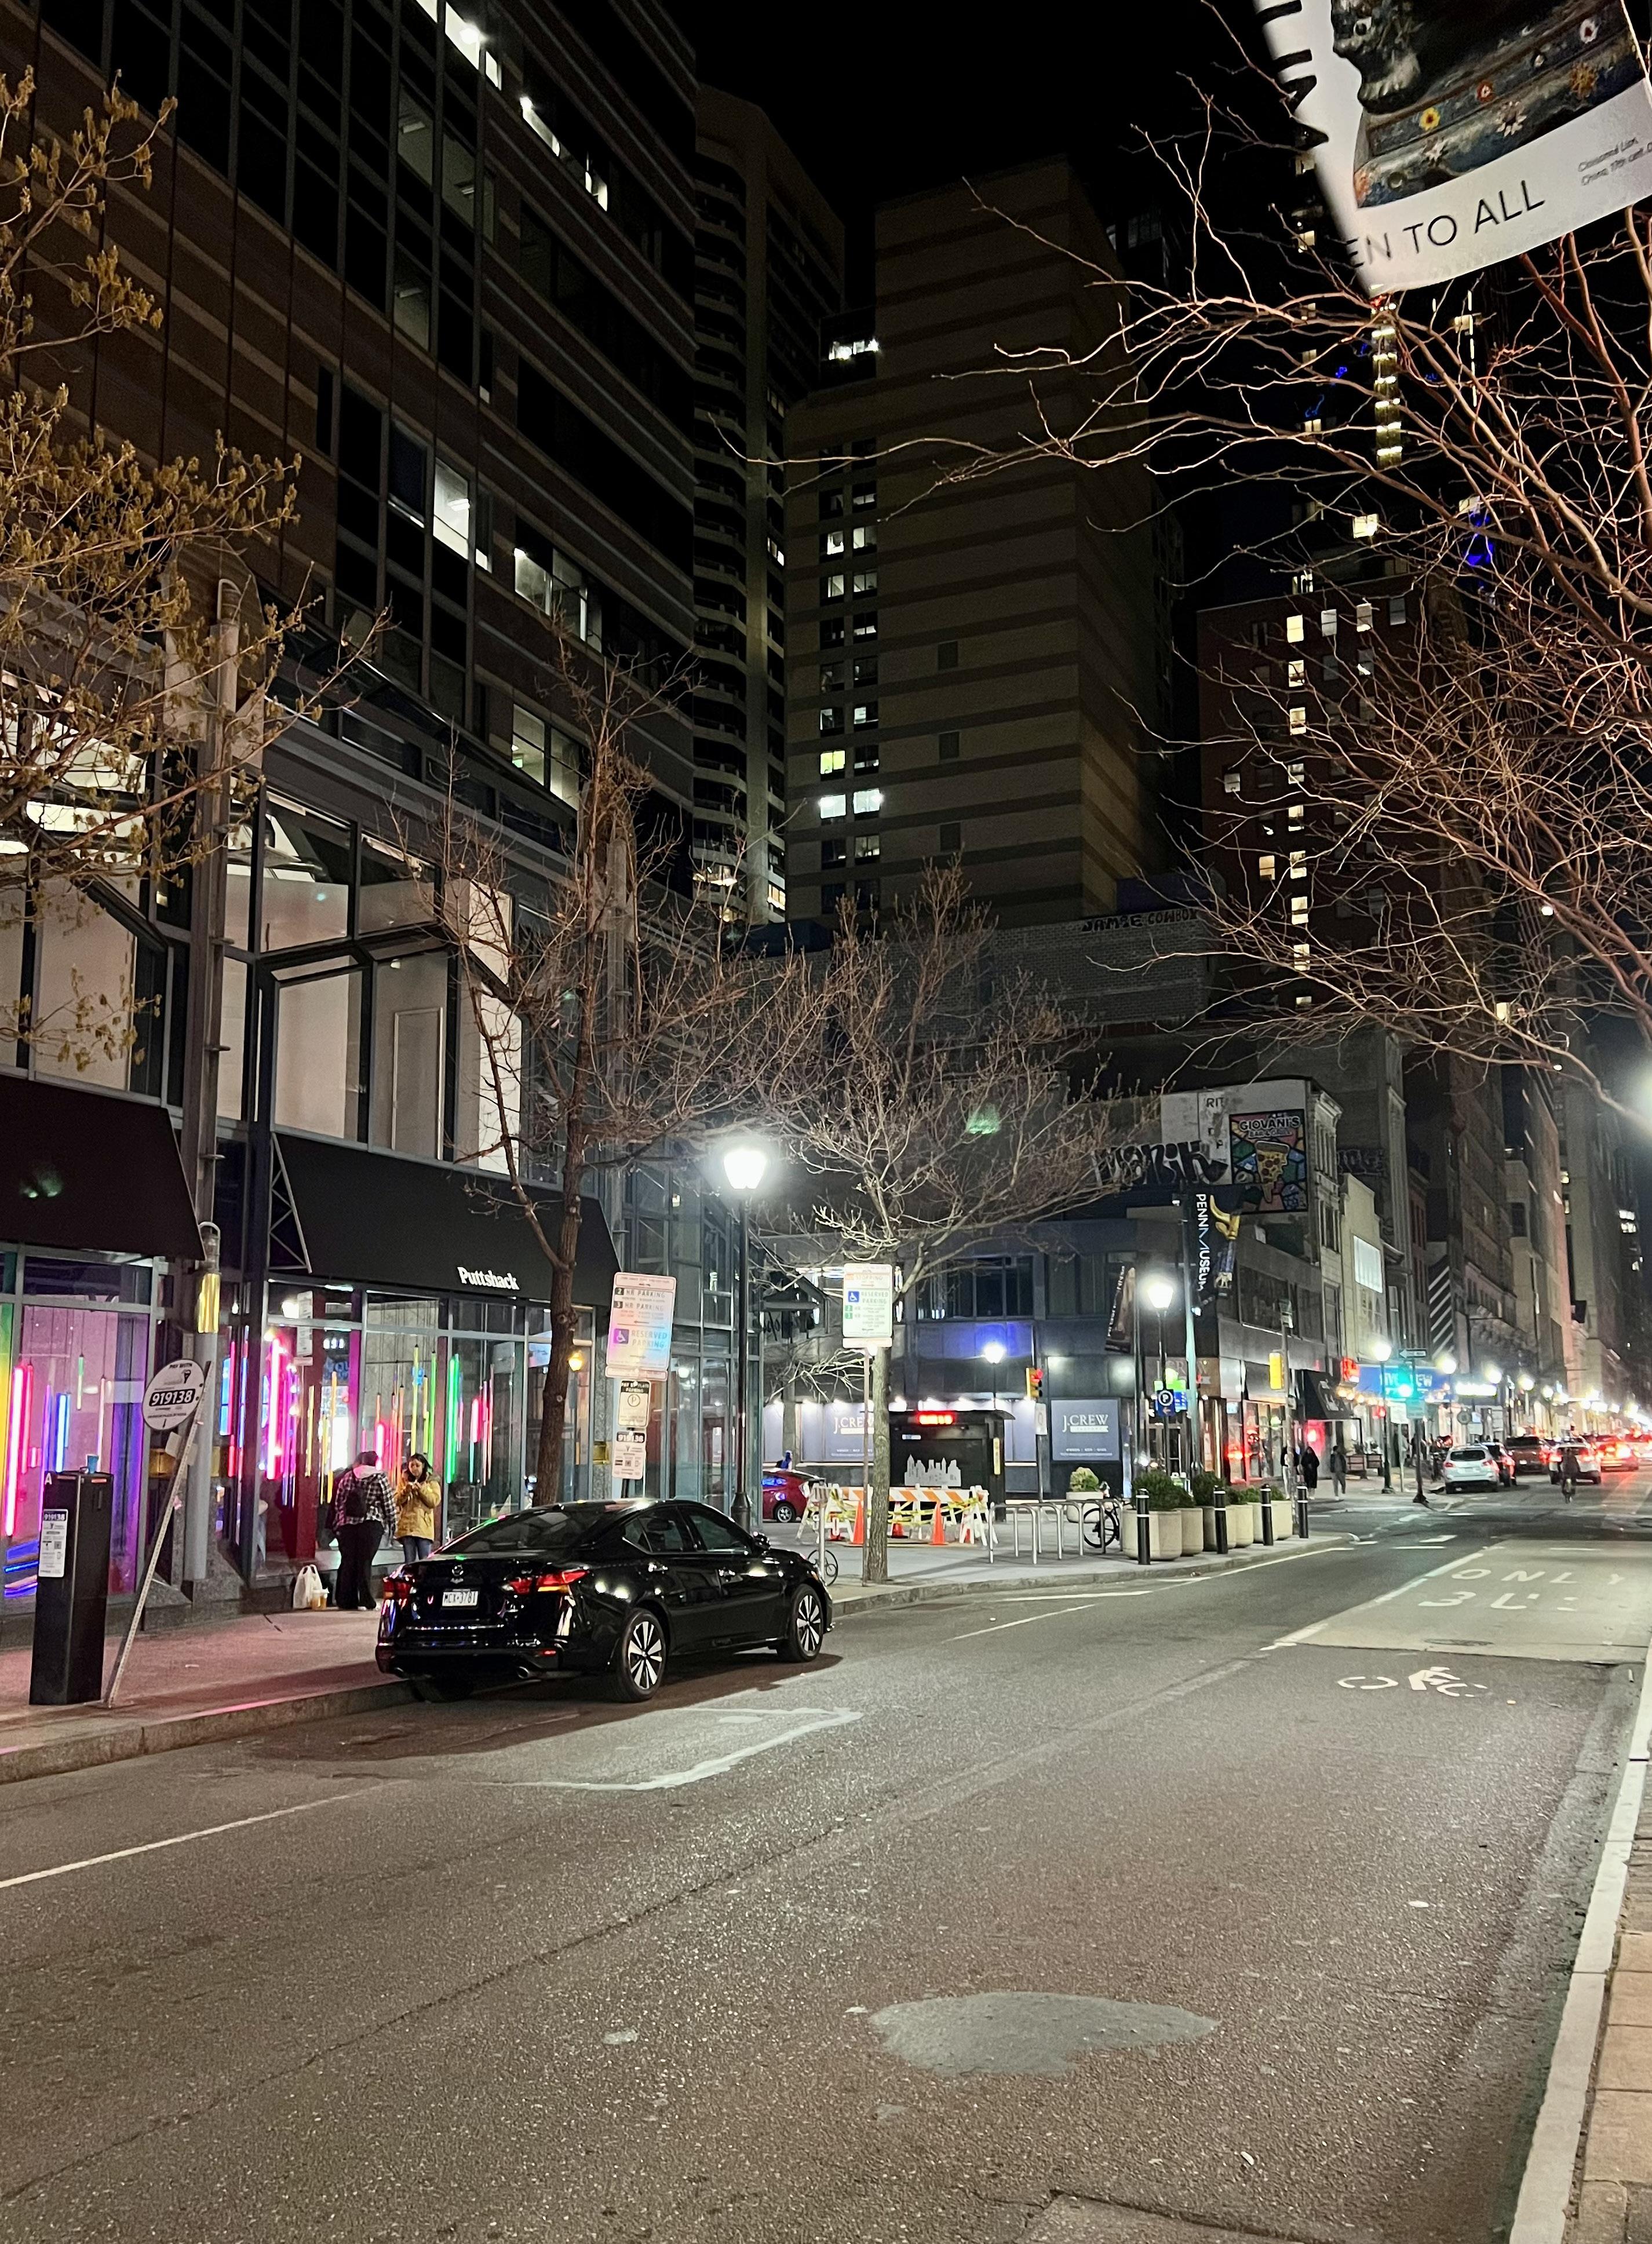
FUTURE? 163 PANORAMA 2024
WHAT’S IN A
Echoes of Bias
The Challenges and Opportunities for AI in City Planning
 by Shuai Wang

“Hey ChatGPT, picture a doctor for me.”
After entering the same prompt 10 times, the outcome was startlingly uniform – white and mostly men, as seen in Figure 1. In fact, 63.9% of the US physicians and doctors are white, and 37.1% are female in 2021, according to American Medical Association (AMA).1 A significant proportion of image generated models powered by Artificial Intelligence (AI) portray an ideal of white masculinity.
It’s not just about doctors - this trend of an overrepresentation of white males spreads across AI’s portrait of various professions and industries. AI has reinforced the racial and gender disparities even more by creating images depicting individuals as white and male, particularly in scenarios involving authoritative roles, such as managers and CEOs. 2
What does this tell us? It’s simple yet profound – our AI mirrors our biases. The algorithms, fed with past data, often replicate societal stereotypes. AI aims to perform recurring data analysis and pattern-matching based on past reliable patterns and rule-based algorithms.3 Here’s the real kicker – as these AI models weave their way into city planning and governance, these biases don’t just linger – they amplify. It is essential to apply AI in city planning and governance with caution to ensure it minimizes the risks of biases and fosters urban innovation and social inclusivity.
WHAT’S IN A FUTURE?
Images of doctors created by ChatGPT using DALL-E.
165 PANORAMA 2024
Challenges Facing AI in City Planning
Applying AI in city planning and governance presents biases and a simplification of real-world issues. All data are inherently biased and have limitations as they are created by humans with either direct collection or indirect selection from human-placed items like sensors. As a consequence, the output result from the algorithm, in resemblance to the input, is likely to be biased as well. For instance, the labels of pictures on ImageNet dataset contain biases of people, as the input label data divides the images of humans into categories that can be discriminative, subjective and stereotypical.4 With the preset bias of people in the image labeling data, any algorithm that uses ImageNet as a data source can generate results that reinforce biased information. If biased personal data are widely used in city planning, governance, and operations, it is very likely to pose a threat to already vulnerable groups.
In addition, many social issues and challenges are too complex to be solved only with data or to be simply put into an algorithm. Plenty of urban problems cannot be captured by quantitative or qualitative data, as real-life problems consist of immeasurable factors. The risk and impact of AI in city planning can trace back to the 1970s in NYC. A computer-based analysis by the RAND corporation led to the closure of 13 fire companies in the Bronx, particularly in the South Bronx, while adding fire companies in the more affluent, predominantly white North Bronx (Figure 2).5 This decision was based on flawed data and analysis, which overlooked the existence of the river when calculating the travel time for a company from Harlem to respond to a fire in the South Bronx. The closures, combined with landlords’ neglect, resulted in devastating fires and the destruction of nearly 80% of housing in the South Bronx, displacing over 250,000 people. This underscores the risks of biased data and flawed algorithmic decisions in city planning, reinforcing the need for careful, unbiased AI application in such critical areas. There can only be a certain number of variables in one dataset, which also limits the ability of the algorithms to cover all the possible factors perfectly. Therefore, considering the potential consequences and challenges facing the application of AI in cities, it is necessary to use regulations to monitor the usage of AI.
All data are inherently biased.
Harnessing AI for Smarter City Planning
While the risks of using AI should be carefully monitored, AI has extensive opportunities and potential to enhance evidence-based decision-making in city planning and governance. By using the high quality and large quantity
166 ECHOES OF BIAS
It is essential to use AI in cities with caution and care.
of existing training data, AI can contribute to informed and efficient decision-making. For instance, AI can be used to survey feedback from residents to measure their satisfaction with services or their feelings about local development impacts.6 This could help to identify areas where face-to-face, in-depth conversations are needed, which could further benefit from AI-supported pattern detection.7 Furthermore, AI can facilitate the optimization of urban systems and service operations. For example, AI is applied to identify that females are less likely to use bike share services compared to males, with data of bicycle infrastructure, land use, built environment characteristics, and public transit services.8 The installation of bicycle racks, off-street bike routes and benches significantly increase bike share ridership among women, which can be further applied to minimize gender gap and inform future policy-making.9 Therefore, AI can benefit city planning and operations with data-driven decision-making, such as improving efficiency, equity and innovation.
AI practice in city planning, governance and operations should be regulated in a way that balances their benefits and harms, to minimize bias and to commit to innovation. The New York City AI Strategy intends to foster a thriving AI ecosystem and ensure the appropriate use of AI technology.10 The strategy aims to reduce potential biases by enhancing transparency, accountability,
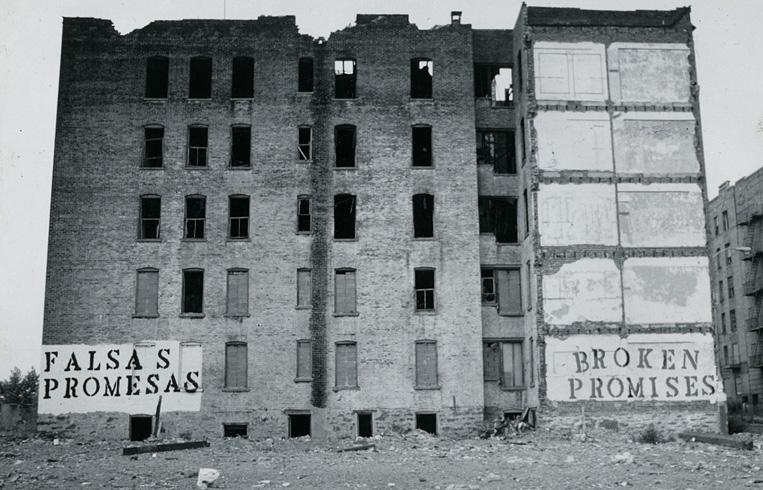
Stencils painted on Charlotte Street buildings, South Bronx, 1980 (Source:
John Fekner)
WHAT’S IN A FUTURE? 167 PANORAMA 2024
and public engagement in the development and deployment of AI solutions. Moreover, regulating the use of AI does not mean stopping innovation in technology. In the New York City AI Strategy, the city supports ongoing AI literacy and skill-building needs by having robust educational infrastructure in place, and particular investment in place in public and public-interest resources.11 In this way, by regulating the use of AI, cities can foster a culture of innovation while ensuring the privacy and inclusion of their citizens.
In conclusion, the essence of data bias and the simplification of real urban phenomena using AI can threaten social equity and diversity. Meanwhile, AI offers great opportunities and potential to improve public engagement and evidence-based decision-making. As a result, it is highly essential to use AI in cities with caution and care, such as minimizing bias and enhancing innovation. Collaboration among various stakeholders in city development, such as planners, developers, policymakers, and researchers, should be encouraged to allow more transparency and up-to-date practice in AI. With the shared goal to implement AI more inclusively, cautiously and innovatively, the technology can contribute to the public good in the future.
Acknowledgments:
Special thanks to Professor Allison Lassiter, Claudia Schreier and Christina Mitchell for their feedback on editing this article. The foundational version of this article is from the coursework for Prof. Allison Lassiter’s Introduction to Smart Cities.

168 ECHOES OF BIAS

About the Author
Shuai is a Master of City Planning student concentrating in Smart Cities. With a name intriguingly embedding “AI”, he’s passionate about exploring the power of urban technology in the built environment. Prior to Penn, he studied in the UK and China, where he contributed to active travel policies and community engagement. Travelling has been a significant part of his life. Seeing firsthand how cultures, lifestyles and food interact across different places, he’s more determined to uncover the hidden dynamics that drive the development of cities.
Endnotes 1 Association of American Medical Colleges, 2023. 2022 Physician Specialty Data Report. 2 Luccioni, A. S., Akiki, C., Mitchell, M., & Jernite, Y., 2023. Stable bias: Analyzing societal representations in diffusion models. 3 Broussard, M., 2018. Machine Learning: the DL on ML, in: Artificial Unintelligence: How Computers Misunderstand the World. MIT Press. 4 Crawford, K. & Paglen, T., 2019. Excavating AI: The Politics of Images in Machine Learning Training Sets. 5 Susaneck, A., 2024. Segregation by Design. TU Delft Centre for the Just City. 6 Sanchez, Tom, 2022. AI in Planning: Why Now Is the Time. American Planning Association. 7 Ibid. 8 Wang, K. and Akar,G., 2019. Gender gap generators for bike share ridership: Evidence from Citi Bike system in New York City. Journal of Transport Geography. 76, 1-9. 9 Ibid. 10 New York City Mayor’s Office of the Chief Technology Officer., 2021. AI Strategy. 11 Ibid.
WHAT’S IN A FUTURE? 169 PANORAMA 2024
CLIMATE RESILIENCY
St. Thomas South Shoreline Resilience Plan, Virgin Islands

Brooke Acosta
Shreya Bansal
Devon Chodzin
Jose Fernandez
John Holmes
Suzie Kazar
Hongyi Li
Yinan Li
Tiffany Luo
Brenna Schmidt
Qianyun Wei
Chris Xu
STUDIO

IN A FUTURE? 171 PANORAMA 2024
WHAT’S
The Studio : Introduction
St. Thomas is an island with a rich history and beautiful natural scenery. The island is the site of centuries of cultural mixing with Indigenous, African, European, and American influences, making the culture of the US Virgin Islands unique, even within the Caribbean. Additionally, the lush green mountains rising dramatically out of white sand beaches make St. Thomas a postcard view of paradise.
It’s no wonder then, that in addition to being a beautiful place to live, St. Thomas is a major destination for visitors. Whether they are stopping by on a cruise or making a longer stay on the island, tourists are the main driver of St. Thomas’ economy. In many ways, the tourism industry makes life on the island possible for the 40,000 residents who call it home. However, climate change is worsening environmental threats that make life on the island increasingly precarious. As the planet warms, hurricanes will get stronger, routine rainfall will become more severe, drought will become more common, and seal level rise will threaten the shores of St. Thomas. The island has already begun to feel the impacts of these threats in recent year. In order to protect the island’s cultural resources, natural beauty, and communities, it is imperative to plan for a more resilient St. Thomas in the face of these worsening environmental threats. This plan focuses on the island’s south shore, which is home to some of its most critical cultural, economic, and ecological resources. With thoughtful planning, the government of the US Virgin Islands can secure a future where these resources are protected and residents do not fear worsening environmental threats.

172
Frenchtown Waterfront (Source: Studio)
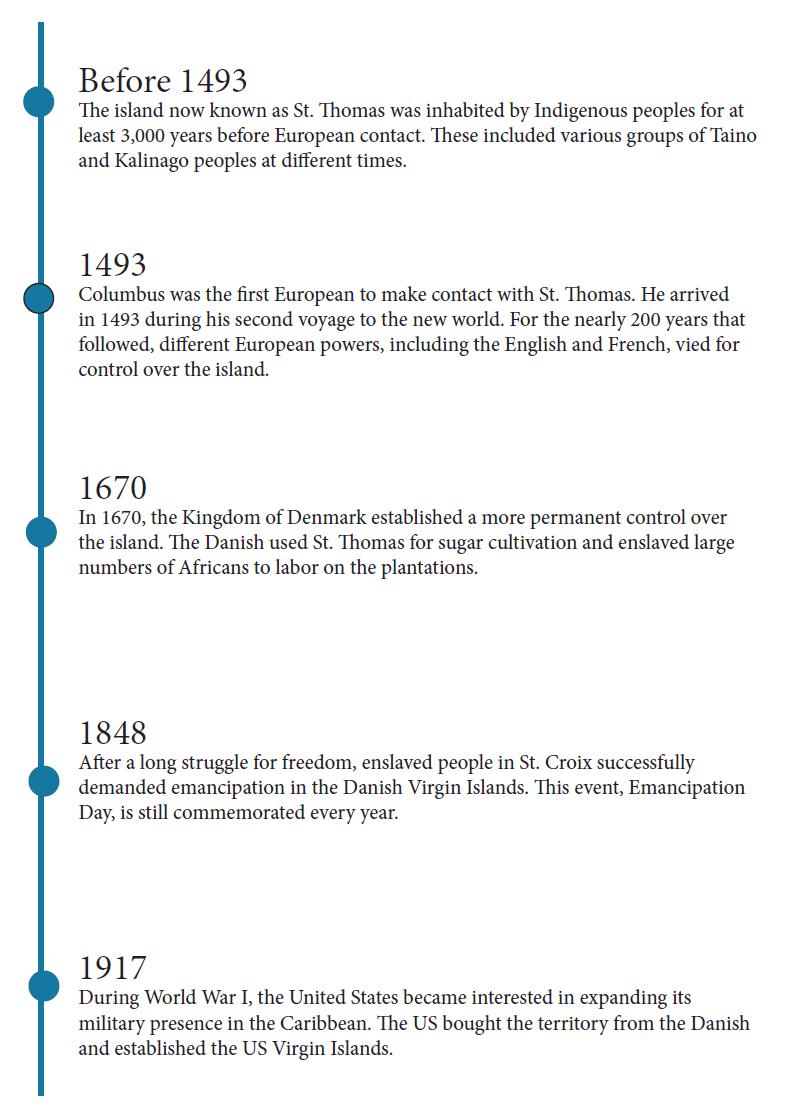
As a small island territory with a complicated colonial past and present, USVI faces unique challenges
Figure 1
USVI historical timeline
173 PANORAMA 2024
WHAT’S IN A FUTURE?
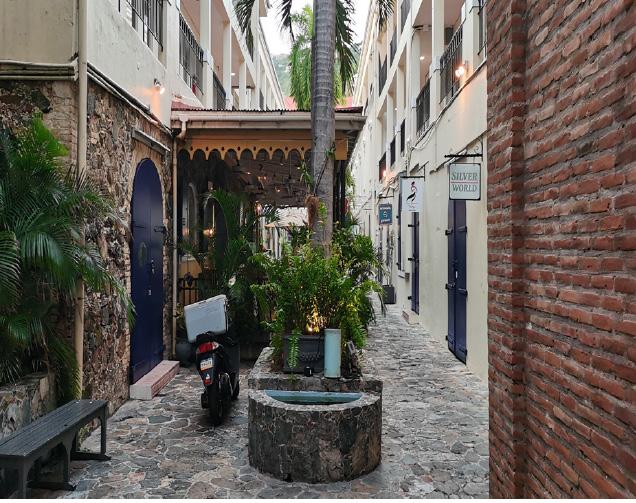
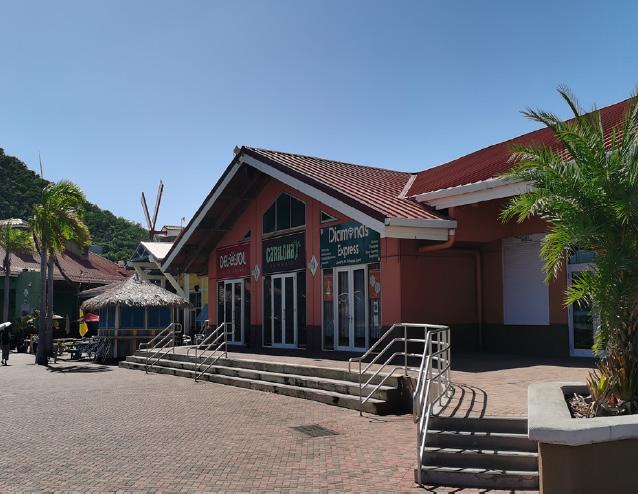
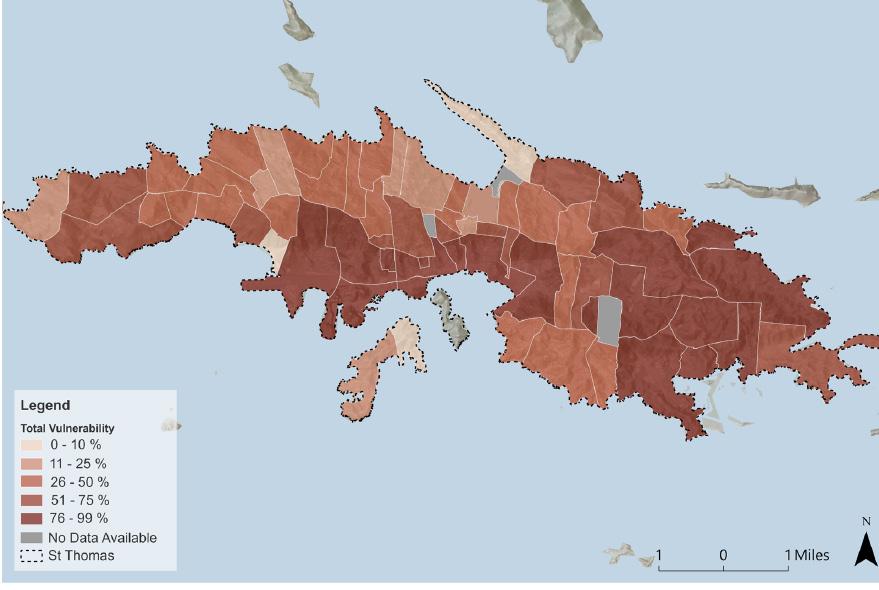 Figure 2
Total Vulnerability Index, All Estates (Sources: Studio, NOAA, UVI)
Charlotte Amalie Historic District (Top)
Figure 2
Total Vulnerability Index, All Estates (Sources: Studio, NOAA, UVI)
Charlotte Amalie Historic District (Top)
174
Crown Bay Shopping Center (Right)
WHAT’S IN A FUTURE?
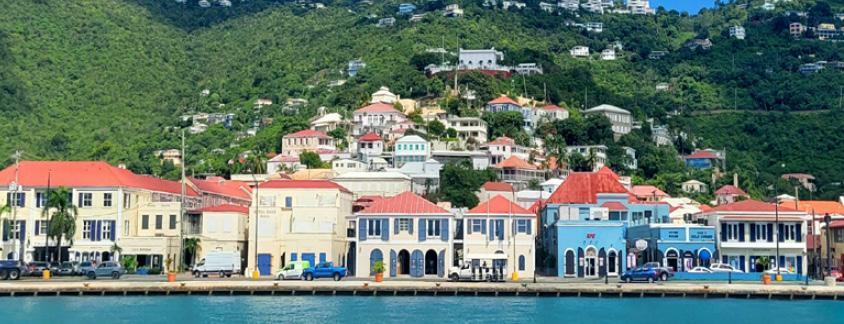
Threats Description
Drought
Stormwater Management
St. Thomas is particularly vulnerable to drought. The island has limited desalination capacity, little groundwater, and no rivers. Therefore, residents are highly reliant on rainwater. Many homes have their own rooftop collection systems and cisterns for water storage. When cisterns run dry, residents have to pay for expensive refills from private water companies. Climate change is worsening periods of drought, straining this fragile system.
Inadequate stormwater infrastructure causes relatively frequent disruptions on St. Thomas. Guts are the system of channels, some natural, some engineered, that carry stormwater from the island’s interior out to the sea. These guts are frequently overwhelmed by the volume of stormwater, causing localized flooding to roadways, residential areas, and other infrastructure.
Hurricanes
Sea Level Rise
St. Thomas is located right in Hurricane Alley and therefore vulnerable to significant destruction from high winds and storm surge during hurricanes. This was the case in 2017 when Hurricanes Irma and Maria hit USVI back-toback, causing $11 billion in damages across the territory. While major hurricanes may not hit St. Thomas every year, it takes many years to rebuild in the aftermath of one.
While much of the mountainous island lies well above sea level, many of the island’s vital cultural and economic resources are clustered in low-lying areas near the shoreline. Therefore, sea level rise represents an existential threat to life on St. Thomas.
Charlotte Amalie Waterfront Seawall (Source: Studio)
175 PANORAMA 2024
Geographic Context
Turpentine Run and Mangrove Lagoon are located on the southeastern shores of St. Thomas, encompassed fully by the Jersey Bay Watershed, which is the largest on St. Thomas. Rainfall flows through Turpentine Run and the Nadir Gut out into Mangrove Lagoon. This area is located close to major roads, commercial centers, and transportation hubs.
Upstream, Turpentine Run and the Nadir Gut flow past various industrial and commercial properties, including the Heavy Materials rock quarry, automotive service shops, waste disposal bin sites, and the Bovoni Landfill. These land uses pollute the water, which ultimately ends up in the ecologically-sensitive Mangrove Lagoon.
As it flows downstream, Turpentine Run and the Nadir Gut travel through multiple residential neighborhoods. These include Mariendal, Estate Bovoni, and Estate Nadir. Rainfall events can cause destructive, repetitive flooding to the people who live in these communities, forcing homeowners into costly repairs and retrofits. These neighborhoods are also some of St. Thomas’s most socially vulnerable, so such home improvements have an outsized financial burden.
 Figure 3
Strategies Overview for Turpentine Run and Mangrove Lagoon
Figure 3
Strategies Overview for Turpentine Run and Mangrove Lagoon
176

IN A FUTURE? 177 PANORAMA 2024
WHAT’S
Figure 4
Strategy 1: Water Quality and Flooding Figure 5

Strategy 2: Connectivity

178

Mangroves serve special ecological, and cultural functions for St. Thomas
Goals
1. Mitigate flood impact to communities surrounding Nadir Gut
2. Protect Magrove Lagoon from pollution
3. Create green communit assets
4. Facilitate meaningful connection points within and between communitie Vision
A vibrant and well-connected community equipped with the tools and resources necessary to prepare for and recover from future flood events.
6
Figure
Strategy 3: Community Building
179 PANORAMA 2024
WHAT’S IN A FUTURE?
Climate Stress in USVI
We acknowledge that USVI is under immense climate stress. Following the hurricanes in 2017 and the pandemic in 2020, as well as the continued climate change crisis, it is clear that the islands must become more resilient. One way to achieve this goal is to use data to help plan and manage resources.
Through this project, we want to answer several questions. How can data analytics help St. Thomas with climate and environmental planning? What does a systemic and localized data framework look like for St. Thomas? How can local agencies leverage data to better understand and respond to climate change and help vulnerable communities?
To manage this, St. Thomas needs a robust plan and a network of realtime updates to be prepared and resilient.
Currently the island has over 600 datasets that contain information around demographics and climatic stressors, but these are stored across the internet in various sources. DPNR, the planning agency of the island aims to digitize some of its processes to save time and make them more efficient.
Aftermath of Hurricanes Irma and Maria in 2017 (Source: NBC News)

180

St. Thomas overlaid with impacts of climate change (Source: Studio)
Opportunities Description
High volume of projects
Public request for guidance
Efficiency at DPNR
Disasterrecovery fund
Federal Funding
Construction projects in St. Thomas are at a historic volume. These include projects in coastal zones and on shorelines
The public has requested for guidance and regulations to be more resilient
DPNR needs to approve or deny permits efficiently and in accord with best practices for minimized climatic losses.
In the wake of the 2017 hurricanes, there is significant funding available to help make St. Thomas much more climate resilient.
The Bipartisan Infrastructure Law offers funds and subsidies on building out data-driven processes.
Better data handling needed
Barriers
Standardization of data
Localized data needed
Capacity
St.Thomas and the USVI could benefit from a efficient one-stop solution for data handling
Description
There is lack of standardized data colleciton, processing and sharing across various arms of the USVI govenrment and its partners
There is a need for sufficient placed-based data which can speak to the pain points of specific areas
DPNR currentyl requries additional capacity due to the prolonged duration of permit approval process .
WHAT’S IN A FUTURE?
2024
PANORAMA
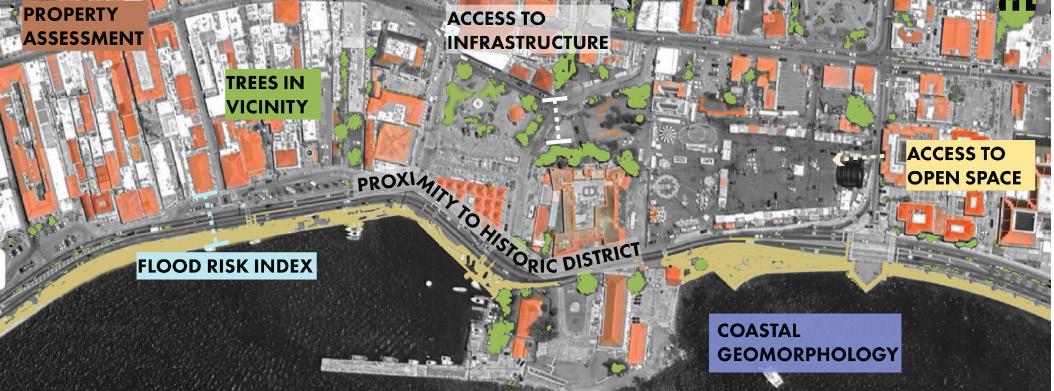
USVI Open Data Portal
An open data portal for the USVI would not only be a technological advancement, but also a crucial step towards fostering transparency, accountability, and informed decision-making. By providing a centralized platform for data sharing, the portal can significantly enhance the accessibility of information and foster collaboration across USVI departments
How can an open data portal help combat climate challenges?
Beyond the immediate benefit of understanding current conditions, such as helping the frontline community by exploring the intersection of building footprints and social vulnerability scores, the open data portal has the potential to revolutionize how stakeholders, including government agencies, researchers, and the public, engage with data. The open data portal serves as a critical tool for interdepartmental collaboration within the USVI, specifically in the context of climate adaptation. Breaking down data silos and facilitating the exchange of climate-related information among various government departments can lead to more holistic and integrated climate policymaking.
Permitting Dashboard
In the dynamic landscape of regulatory processes, DPNR recognizes the need for innovation and efficiency in managing development permits. In response to this imperative, the introduction of an online permitting dashboard is poised to revolutionize the traditional paper-based permitting system, providing not only streamlined processes but also fostering climate resilience and environmental awareness.
Why does USVI need the Permitting Dashboard?
The DPNR division of Coastal Zone Management (CZM) is facing challenges due to a surge in construction project requests in the coastal zone and shoreline areas. The increased demand, coupled with the need for guidance on flooding, erosion, and coastal risks, has overwhelmed the understaffed and technically-lacking permit review program. Furthermore, the program is grappling with short-term opportunities for federal funding but lacks the expertise to effectively evaluate land and water permit applications, hindering the ability to protect coastal zones and implement habitat restoration projects.
Need for more localized data (Source: Studio)
The Government of the USVI, National Oceanic and Atmospheric Administration (NOAA), DPNR, Port Authority, and UVI are among the many stakeholders who are actively trying to bridge the data gap to address climate issues.
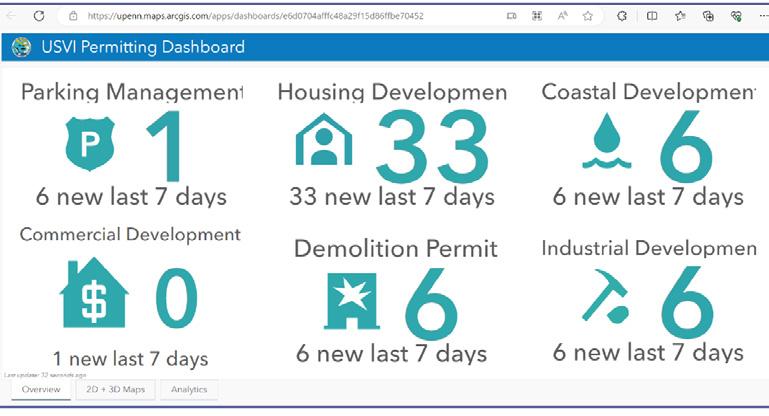
Middle)
Permit Application Overview
2D +3D Visualization of permit applications and existing conditions
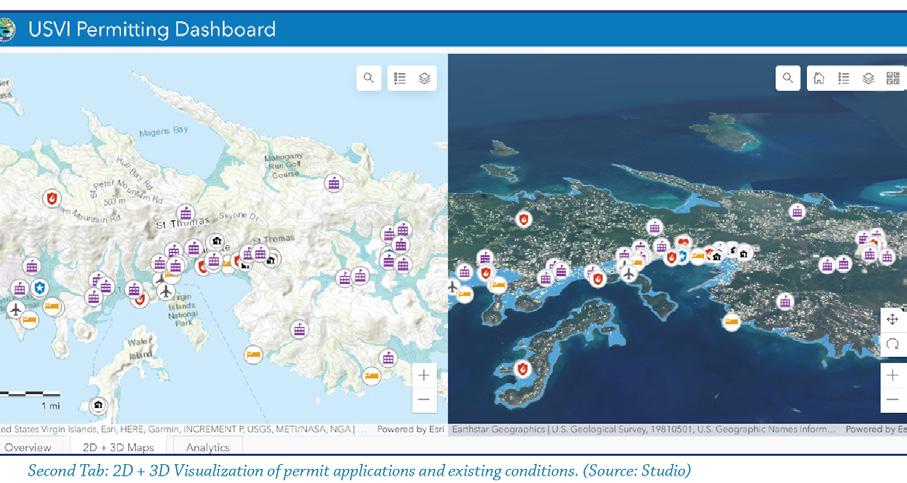

Business as usual and proposed scenario
(Source: Studio)
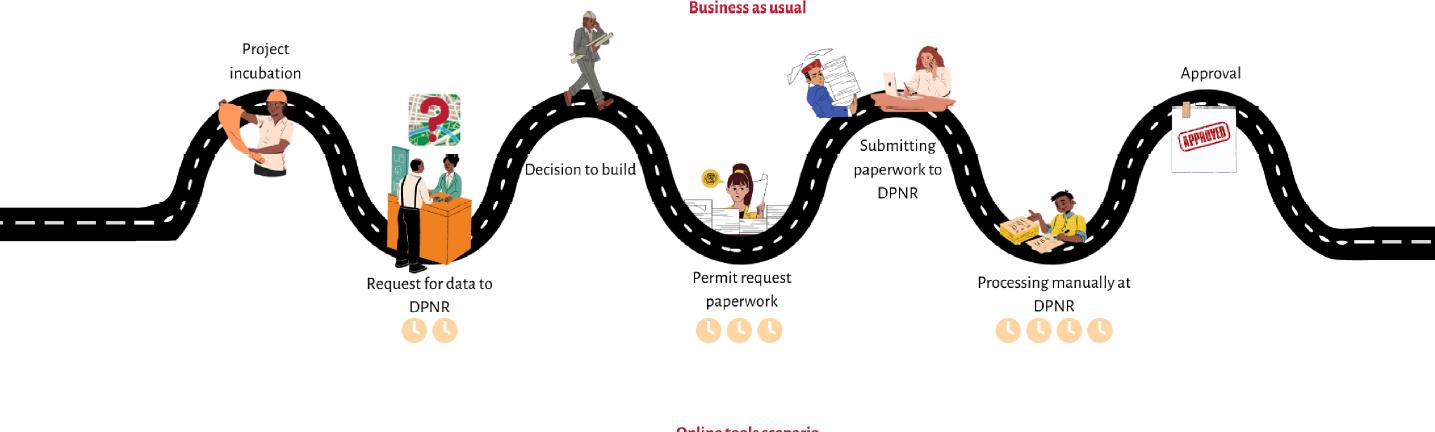

WHAT’S IN A FUTURE?
Figure 7 & 8 (Left and
Figure 9 (Bottom) Data Analytics
Figure 10
PANORAMA 2024
Port and Frenchtown
The study area for this project consists of the Crown Bay cruise terminal and cargo port and the historic neighborhood of Frenchtown. It is located on the south shore of the island, between Lindbergh Bay to the west and Charlotte Amalie to the east. This area is critical to the economic and cultural vibrancy of St. Thomas.
Both the cruise terminal and the cargo port are major drivers of the island’s economy. The Crown Bay cruise terminal is one of two cruise terminals
Tourism
Tourism, trade, and other services are the primary economic activities of the Virgin Islands. For St. Thomas, tourism accounts for over 50% of its GDP and 60% employment. The island welcomes 2 million visitors per year.
Freight
While the cruise terminal plays as the gateway for tourists, the cargo facilities are the hub for freight. Crown Bay Cargo Port Facility (Crown Bay) handles containerized and general cargo. This port is a vital link to the USVI economy as most of its foods, materials, and other goods are imported..
Short of Cargo Capacity
In 2020, the US Department of Transportation granted VIPA $21.9 million for modernizing and expanding the cargo terminal at Crown Bay. The project will rehabilitate several pieces of existing port infrastructure, including the bulkhead, concrete apron, and several cargo storage facilities. VIPA will also expand the port facilities eastward into a currently unused lot. This land will be used for additional cargo storage facilities, including more cold storage capacity.

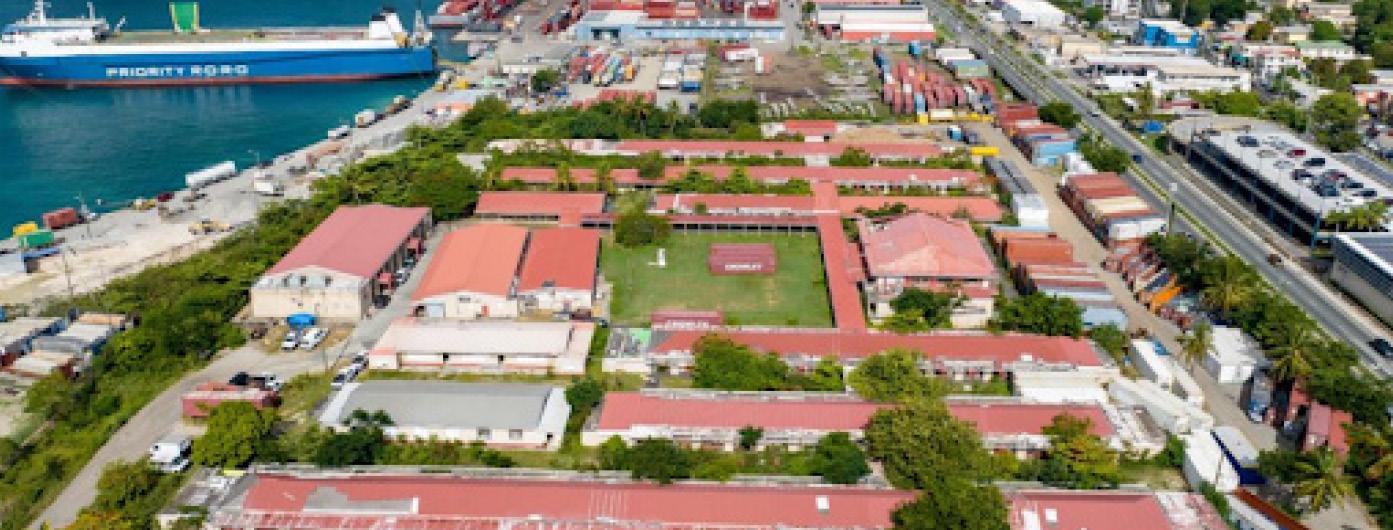
184
Site for Future Cargo Facility Expansion (Source: VIPA)
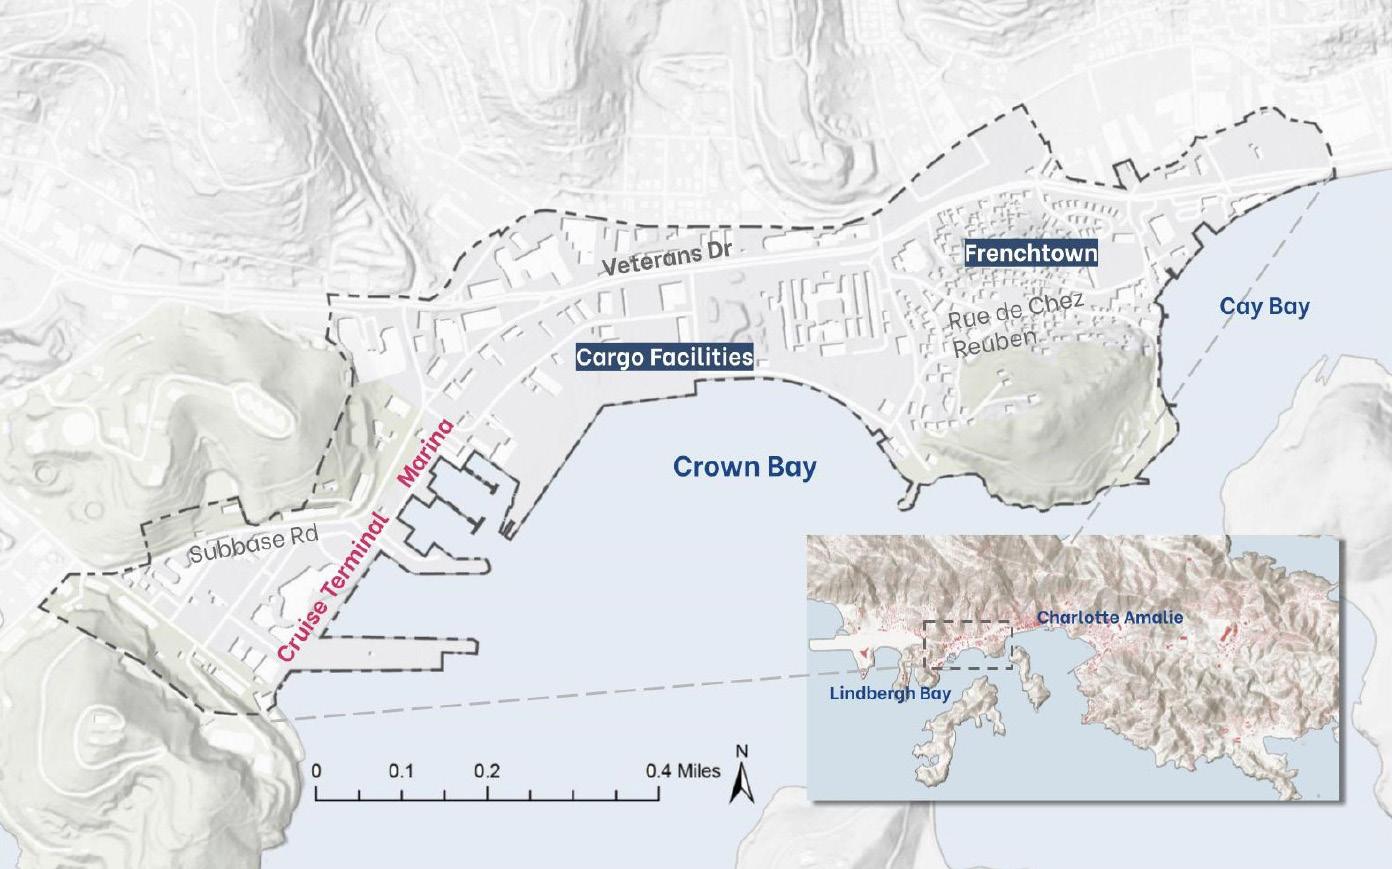
on St. Thomas. Owned by the Virgin Islands Port Authority (VIPA), the terminal handles all of Royal Caribbean’s cruise ships docking on the island. Since tourism makes up more than 50% of the island’s GDP and employment, the economic importance of the Crown Bay cruise terminal cannot be overstated. Similarly, the cargo port is essential to the island’s economy. All goods coming to or leaving the island come through this port, and since St. Thomas is heavily reliant on imports, life on the island depends on the port’s functions. Additionally, the port serves as a transshipment link for goods going to other Caribbean destinations, bringing added economic benefits to St. Thomas.
In the eastern half of the study area, Frenchtown is an important cultural resource for the island. One of the oldest neighborhoods on St. Thomas, it is a living piece of the island’s history. The area has a distinct character and is home to historic homes, several local businesses, a neighborhood history museum, and Saint Anne’s Chapel. WHAT’S
FUTURE?
IN A
Figure 11
PANORAMA 2024
Project Site Area
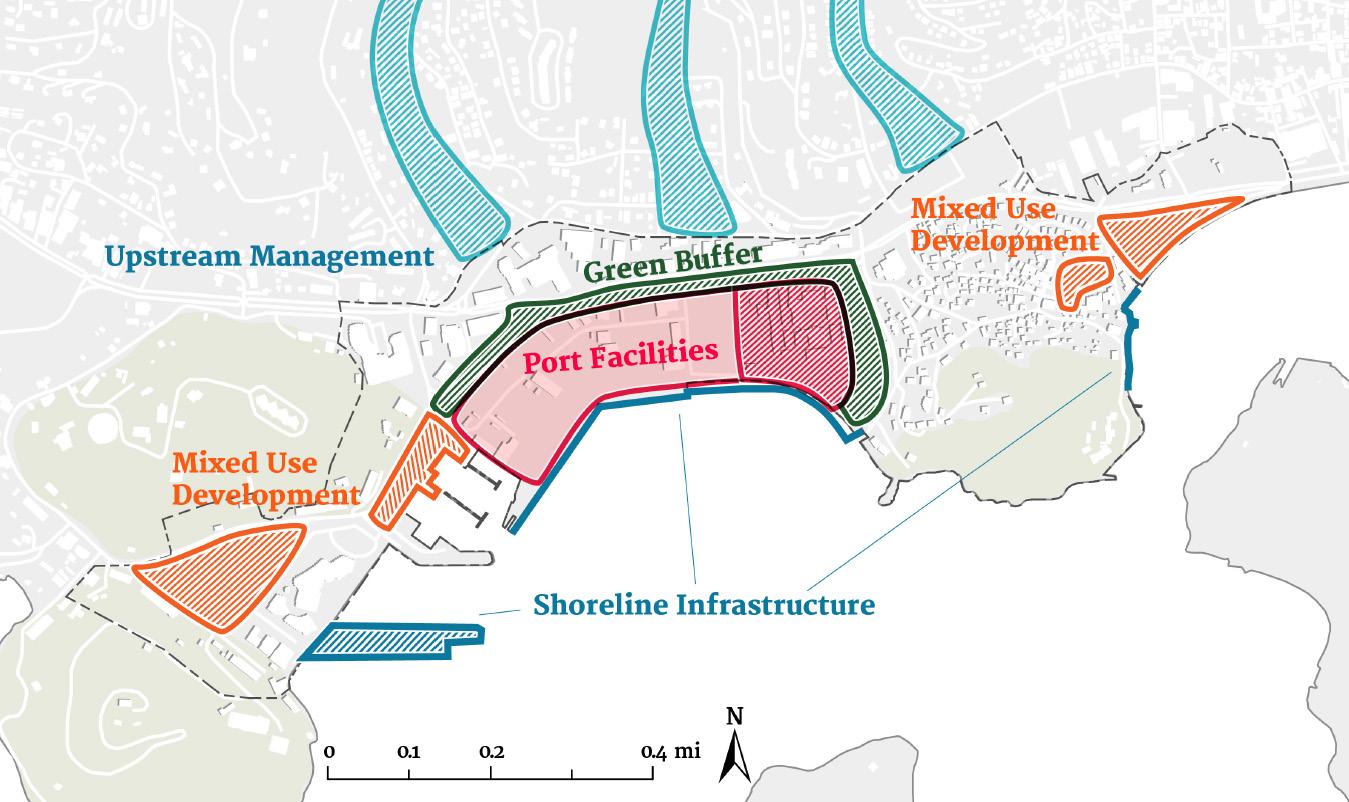
1. Strengthen Coastal Resiliency


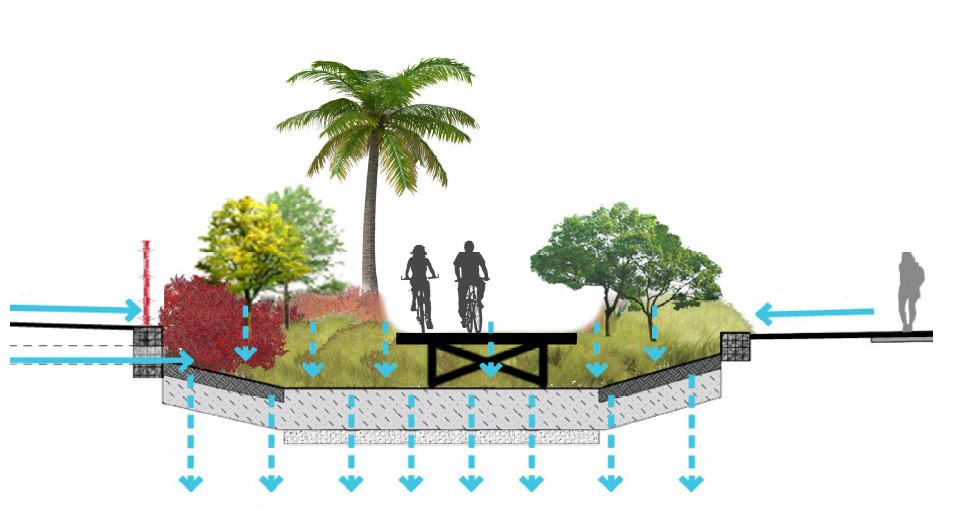
Increase the Capacity of Drainage

During severe rain events, these bioswales will retain water and allow it to safely drain without impacting port operations.
3. Buffer Zone to Defend Upstream Flood
Increase the Capacity of Drainage
Figure 12
Port Improvement Areas
2. Upstream Management
Maintain Vegetative Cover Along the Guts
In 2020, the US Department of Transportation granted VIPA $21.9 million for modernizing and expanding the cargo terminal at Crown Bay. The project will rehabilitate several pieces of existing port infrastructure, including the bulkhead, concrete apron, and several cargo storage facilities. VIPA will also expand the port facilities eastward into a currently unused lot. This land will be used for additional cargo storage facilities, including more cold storage capacity.
This project will bring many benefits to St. Thomas. First, the existing port infrastructure is in serious need of maintenance. At four decades old, the cargo terminal is due for restoration at baseline. Additionally, much of the port’s infrastructure was damaged in the 2017 hurricanes and has yet to be fully repaired. Second, expanding the port’s cargo capacity will strengthen the


 Lindbergh Bay Postcard circa. 2023
WHAT’S IN A FUTURE?
Figure 13
187
Lindbergh Bay Environmental Threats and Hazards
PANORAMA 2024
island’s economy. In addition to being able to more effectively serve the cargo needs of residents, the added capacity will enable the port to handle more transshipment of goods being shipped throughout the Caribbean.
Storm Surge and Flood Zone
Climate challenges are the most urgent and devastating problems for the port area at current stage. In the short term, flood and storm surge are the major climate challenges. And in the long term, the port is also facing the threaten of Sea Level Rise.
If storms hit St Thomas, the port is extremely vulnerable under storm surge. Storm surge would inundate most of the port facilities and may destroy most of the infrastructure and storages, which are crucial to disaster recovery. Climate change has also brought more frequent and severe flood to the island. And the entire port is located in high risk flood zone. When heavy rainfall or high tide strikes, the port is under the risk of both coastal and stream flood. Beyond flood and storm surge, sea level rise is like the sword of Damocles haning over the port.
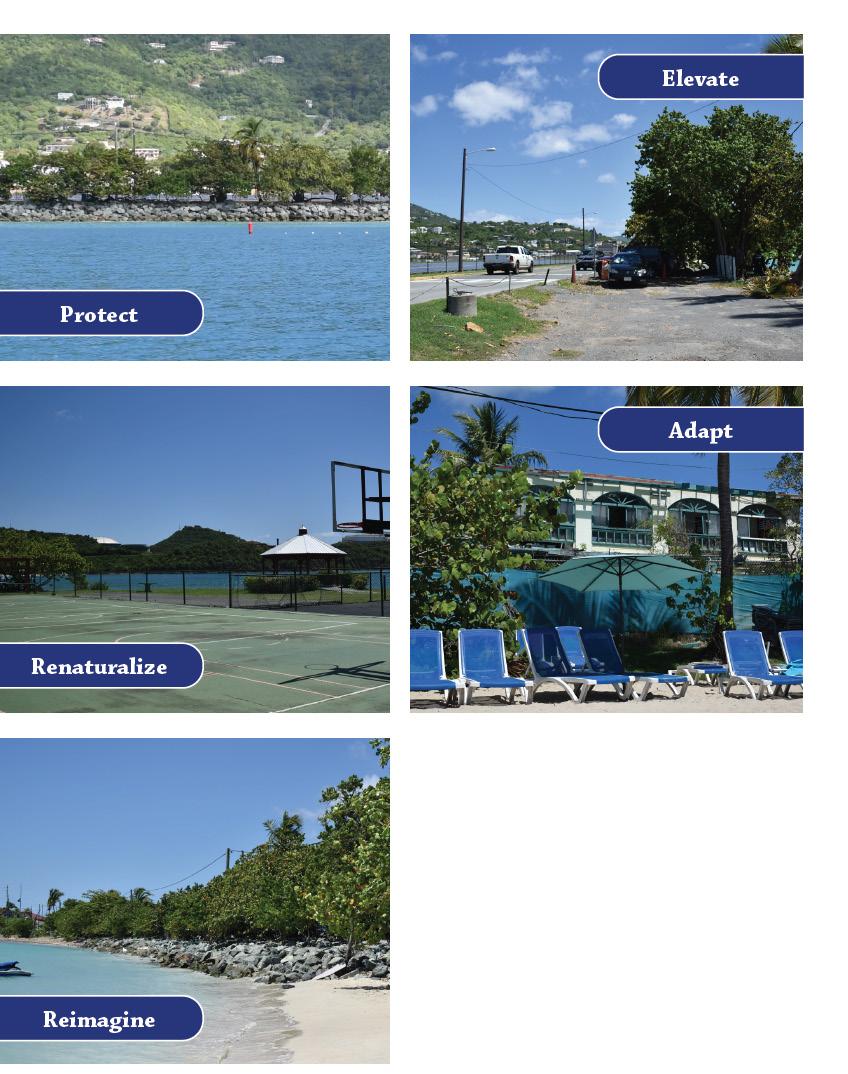
188
Lindbergh Bay, Airport Road, VIPA Park, Former Beachcomber Hotel, Lindbergh Bay Beach (Source: Studio)
In 30-year scenario, the port seems to be safe with only two section of the shoreline will be under high risk: the dock of the cruise terminal and the east shoreline of Frenchtown. But as global warming continues, the port is exposed to higher risk of SLR, which brings a devastating impact after 50 years. Majority of the cargo port and the east end of Frenchtown will all be submerged under sea water.
In review, we propose five different projects to improve the resiliency of Lindbergh Bay. While some projects require further preliminary engineering and feasibility studies, projects like Adapt and Reimagine can feasibly be completed in the next five years. As Lindbergh Bay continues to move into the future, these projects are meant to pay homage to the history of this gateway to St. Thomas while also preparing it for evolving climate change conditions.
Funding Resilience
Due in part to the disasters experienced by St. Thomas, the Virgin Islands now has access to unprecedented federal funding that can be used to rebuild a better and more resilient island. The majority of recent federal funding arrived as hurricane relief, with a total of $8.52 billion obligated to date. The Virgin Islands also received more than $750 million in pandemic relief funding and more than $205 million from the Bipartisan Infrastructure Law. While there is significant federal funding available, St. Thomas has limited capacity for planning and data collection for decisionmaking. Though it’s a small territory, the U.S. Virgin Islands are expected to act as a state government with a much smaller population. There is now a need to rebuild in a thoughtful way, but the structure of federal funds can make it easiest to rebuild in the same way that things were before. However, that will not set up St. Thomas for long-term success and resilience in the face of worsening climate events such as storms or droughts.

WHAT’S IN A FUTURE?
189 PANORAMA 2024
Charlotte Amalie sail boat (Source: Studio team)
An Analysis of Vacant Land in Philadelphia
Staring Down the Speculators
 by Elam Boockvar-Klein
While working at Habitat for Humanity Philadelphia, a realtor approached us to see if we were interested in acquiring vacant parcels owned by one of her clients. She sent a list of more than 100 different addresses, all vacant properties scattered throughout North Philadelphia, all owned by the same company. As a non-profit developer, we ultimately did not have the capacity to acquire properties on the private market. We politely declined. But as a soon-to-be-planner, this experience perked my interest. I could not help but wonder: who are the people who own all of this vacant land, what are their motives, and where is said land located in Philadelphia?
Neglected Vacant Land is Harmful
Research across the board has shown the harms caused by the concentration of vacant land—particularly neglected vacant land—in a given community. According to a recent BillyPenn article, studies have shown that these properties are associated with poor mental and physical health, drive down surrounding property values, and contribute to violent crime.1 Moreover, vacant land is fertile ground for the crisis of illegal dumping plaguing many parts of the city.
These quality-of-life issues also have negative fiscal impacts. Neglected vacant properties often carry high maintenance costs and unpaid taxes, which diverts funding from other potential neighborhood-enriching uses. It’s clear how this vicious cycle might continue; vacant land contributing to a poor quality of life and starving public resources, in turn begetting fewer dollars invested in the neighborhood, leading to more vacancy, so on and so forth.
To be clear, not all vacant lots are created equal. Many are turned into vibrant greenspaces, particularly in predominantly black communities that lack the same access to parks as their wealthier, whiter counterparts. 2 The Pennsylvania Horticultural Society alone manages more than 10,000 lots on an annual basis. But from my time at Habitat for Humanity looking at land all over the city, it is safe to assume that where there is a high concentration of vacant land, there is also a high concentration of neglected vacant land—and all of the negative externalities that come with it.
Unfortunately, this crisis in a post-industrial urban context is not unique to Philadelphia. Detroit, Cleveland, and Baltimore—just to name a few – all have similar challenges. Identifying patterns and solutions in one city could provide insight into how to remedy the same problem in others.
Defining Philadelphia’s Speculators
Who, then, owns the vacant land in Philadelphia? Of the city’s 40,000
IN A FUTURE?
WHAT’S
191 PANORAMA 2024
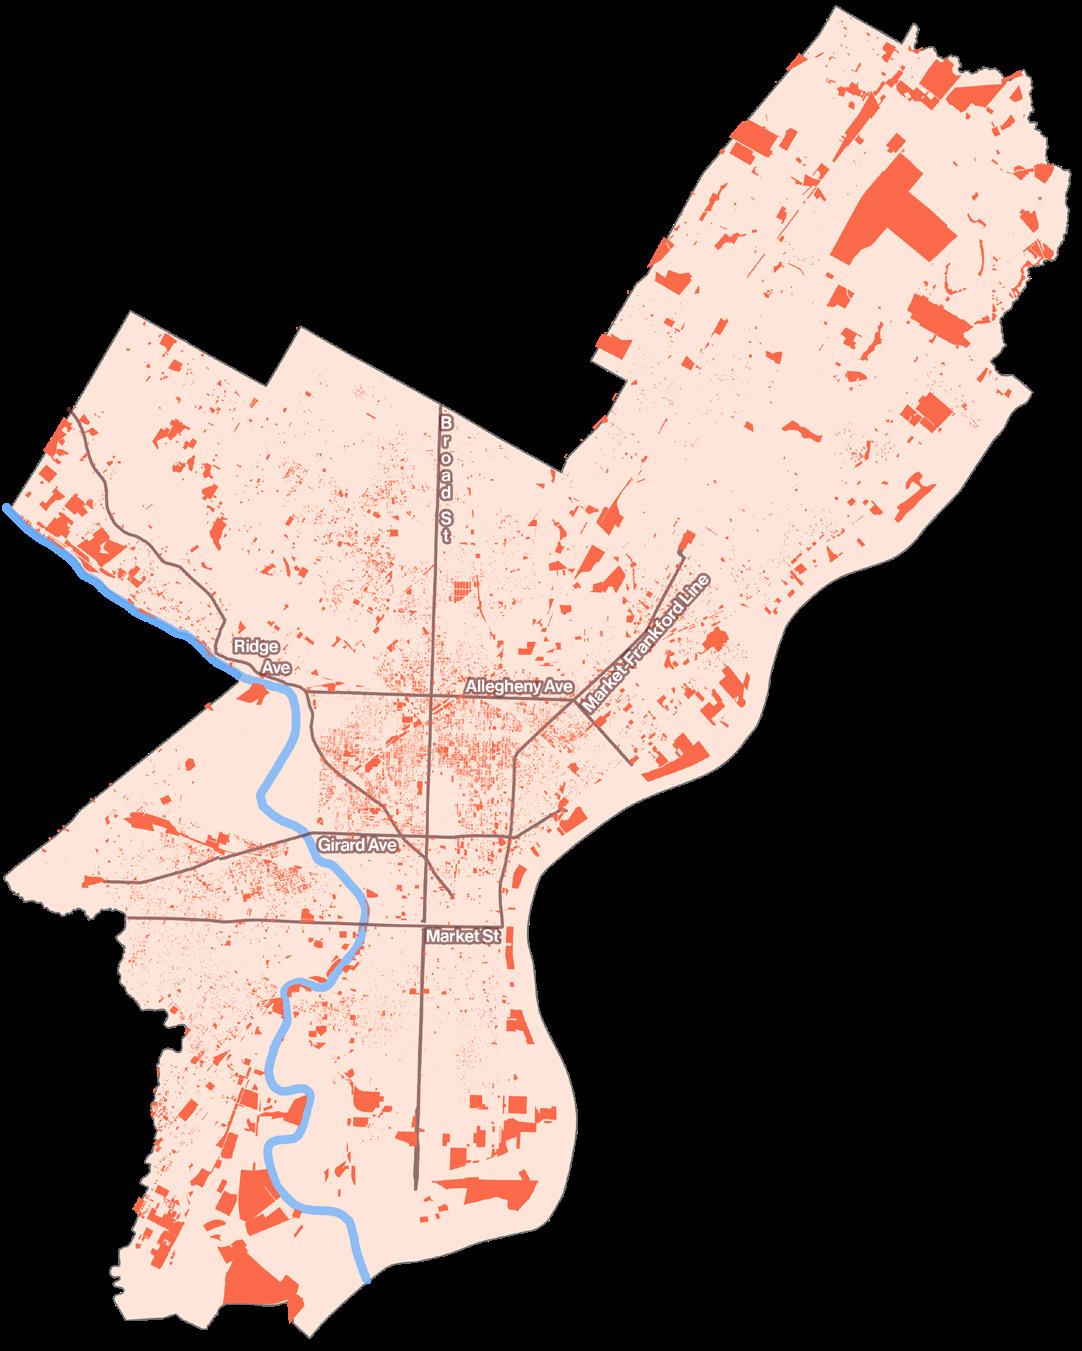
vacant lots, about a quarter are publicly-owned, primarily by the city’s land bank – the Philadelphia Redevelopment Authority.3 The rest, nearly 30,000 properties, are privately-owned. The profile of private vacant landowners varies dramatically, from individuals to small developers to churches and academic institutions. But based on our experience with the realtor, I specifically wanted to understand patterns of speculative vacant landownership within the city. In doing so, we could identify the private actors disproportionately responsible for the negative neighborhood externalities of vacant land.
Dubbed ‘land banking,’ speculative land ownership entails an investor purchasing a parcel, waiting for land values to rise, and then selling at the precise moment when the market is hottest.4 Though the land itself may have a tangibly negative effect on the neighborhood in the intervening years, if all goes according to plan, the speculator still turns a profit. For this project, I wanted to figure out who was profiting off of Philadelphia’s struggling neighborhoods, and precisely which neighborhoods were viewed as speculatively profitable.
As such, what follows is an in-depth analysis of what I term “speculated vacant land,” or vacant parcels owned by speculators. For the purposes of this study, Philadelphia’s speculators are defined as those companies or
1
Figure
Philadelphia’s Vacant Landi
192 STARING DOWN THE SPECULATORS
Vacant Parcels
individuals that own 10 or more vacant parcels within the city. Roughly based on the City’s definition of large landlords,5 this threshold assumes a certain level of scale—that a speculator’s business requires they have a critical mass of parcels in their portfolio to remain profitable and minimize risk. That said, it is impossible to impose speculative intentions on every single company that owns more than 10 vacant properties in Philadelphia. Nonetheless, this definition casts a wide net to capture the lion’s share of speculated vacant land in the city.
Philadelphia’s Bleeding Heart
Using data from Philadelphia’s Office of Property Assessment, Figure 1 shows where vacant land of all types lies across the city. Smack in the middle of the map, North Philadelphia is visually home to the highest concentration of vacant parcels. This represents the bleeding heart of the city, where neighborhoods are pockmarked with empty lots—and left to face the externalities that come with them. Moving outwards, large vacant parcels puncture the city’s
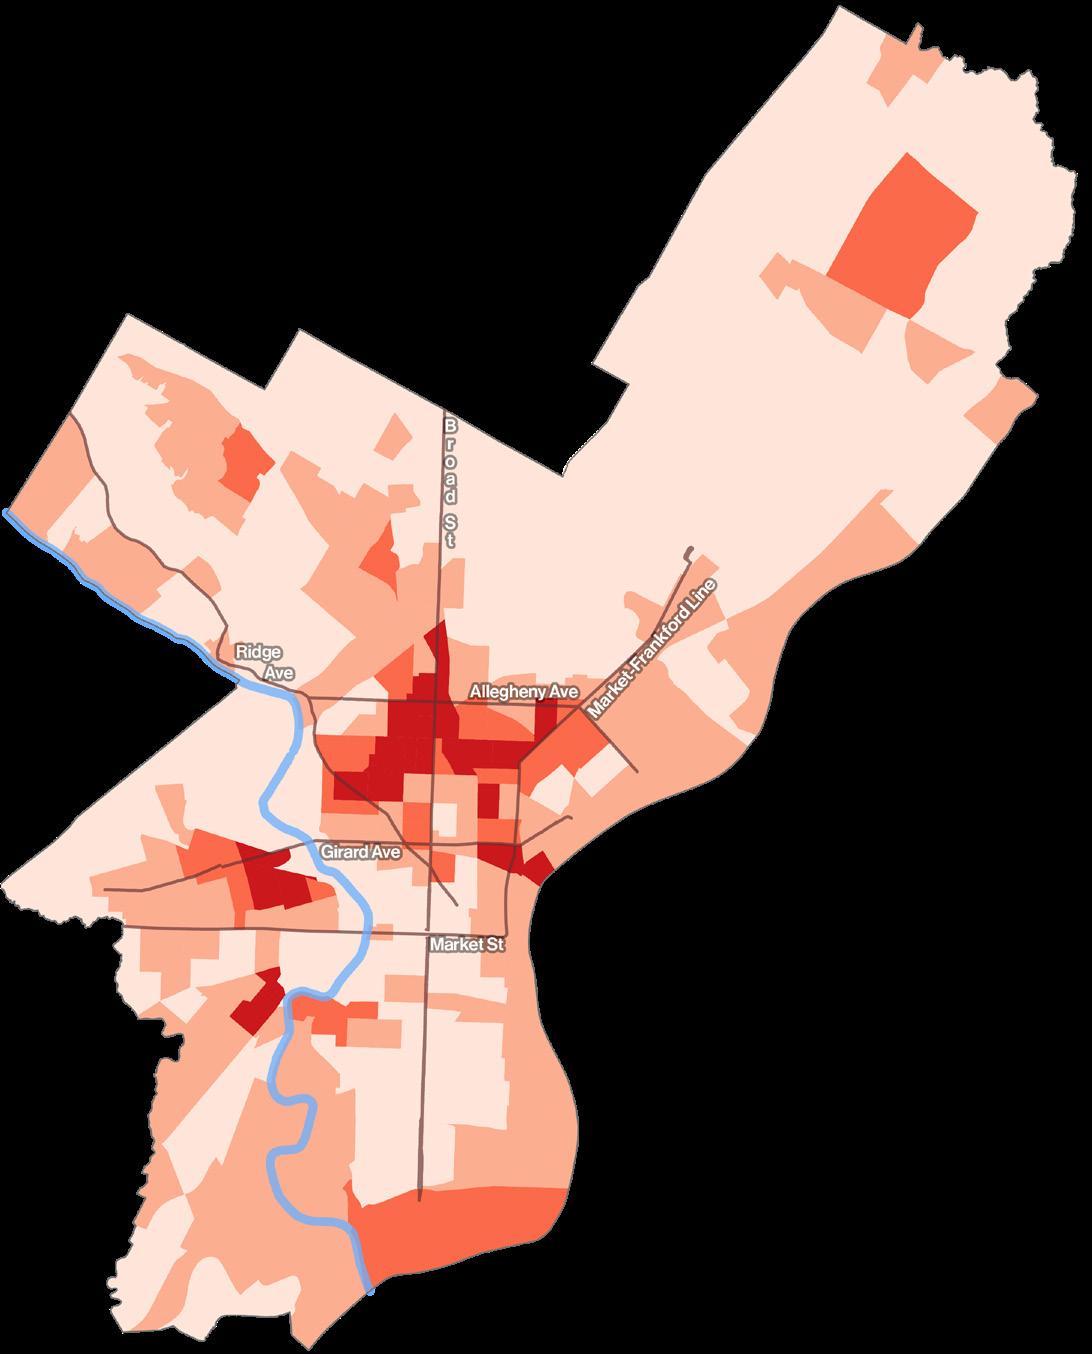
IN A FUTURE?
WHAT’S
Figure 2
% Speculated Parcels (By Census Tract) <0.5% 0.5–2% 2–4% 4+% 193 PANORAMA 2024
Concentrations of Philadelphia’s Speculated Vacant Landii
perimeter, likely representing old industrial uses that have yet to be adapted. Unsurprisingly, as shown in Figure 2, speculated vacant land is concentrated in that same bleeding heart of the city. The census tracts with the highest shares of speculated vacant parcels, more than 4% of the total number of lots, congregate between Girard and Allegheny Avenues in North Philadelphia. Put together, the city’s health—and thus that of the neighborhoods therein – are deeply negatively impacted by this vacancy reality. Having identified where speculated land was located, I then wanted to understand what could be learned about the trajectories of those neighborhoods –what made them susceptible to speculative investment?
Predicting the Presence of Speculated Vacant Land
Speculators generally aim to own land that will increase in value over time. Land is only valuable insofar as it is profitable for a developer to build on it – and thus there is demand from potential tenants/buyers to use that building. And it will only increase in value when there is more competition to build on that property. As such, I hypothesized that speculators in Philadelphia own most of their land adjacent to neighborhoods with hot development markets. With nearby development pressures, proximate vacant land might become increasingly appealing for developers, and thus see its value rise.
To assess this hypothesis, I utilized new construction building permit data from Philadelphia’s Department of Licenses and Inspections as a proxy for the strength of the development market in neighborhoods across the city. The dataset accounts for projects from 2016 to the present day. The more building permits approved, the greater the development activity – and thus the greater potential value of vacant land nearby.
This represents the bleeding heart of the city, where neighborhoods are pockmarked with empty lots—and left to face the externalities that come with them.
Visually examining the correlation between concentrations of building permits and speculated vacant land shows a clear rippling pattern in Figure 3. Let’s picture we are smack in the middle of the city at City Hall. If we move outward in concentric rings, the nearest neighborhoods with hotspots -- Callowhill, Northern Liberties, and Brewerytown to the north; Point Breeze and Pennsport to the south -- show a high concentration of construction, but little speculated land. These neighborhoods have seen significant development in
194 STARING DOWN THE SPECULATORS
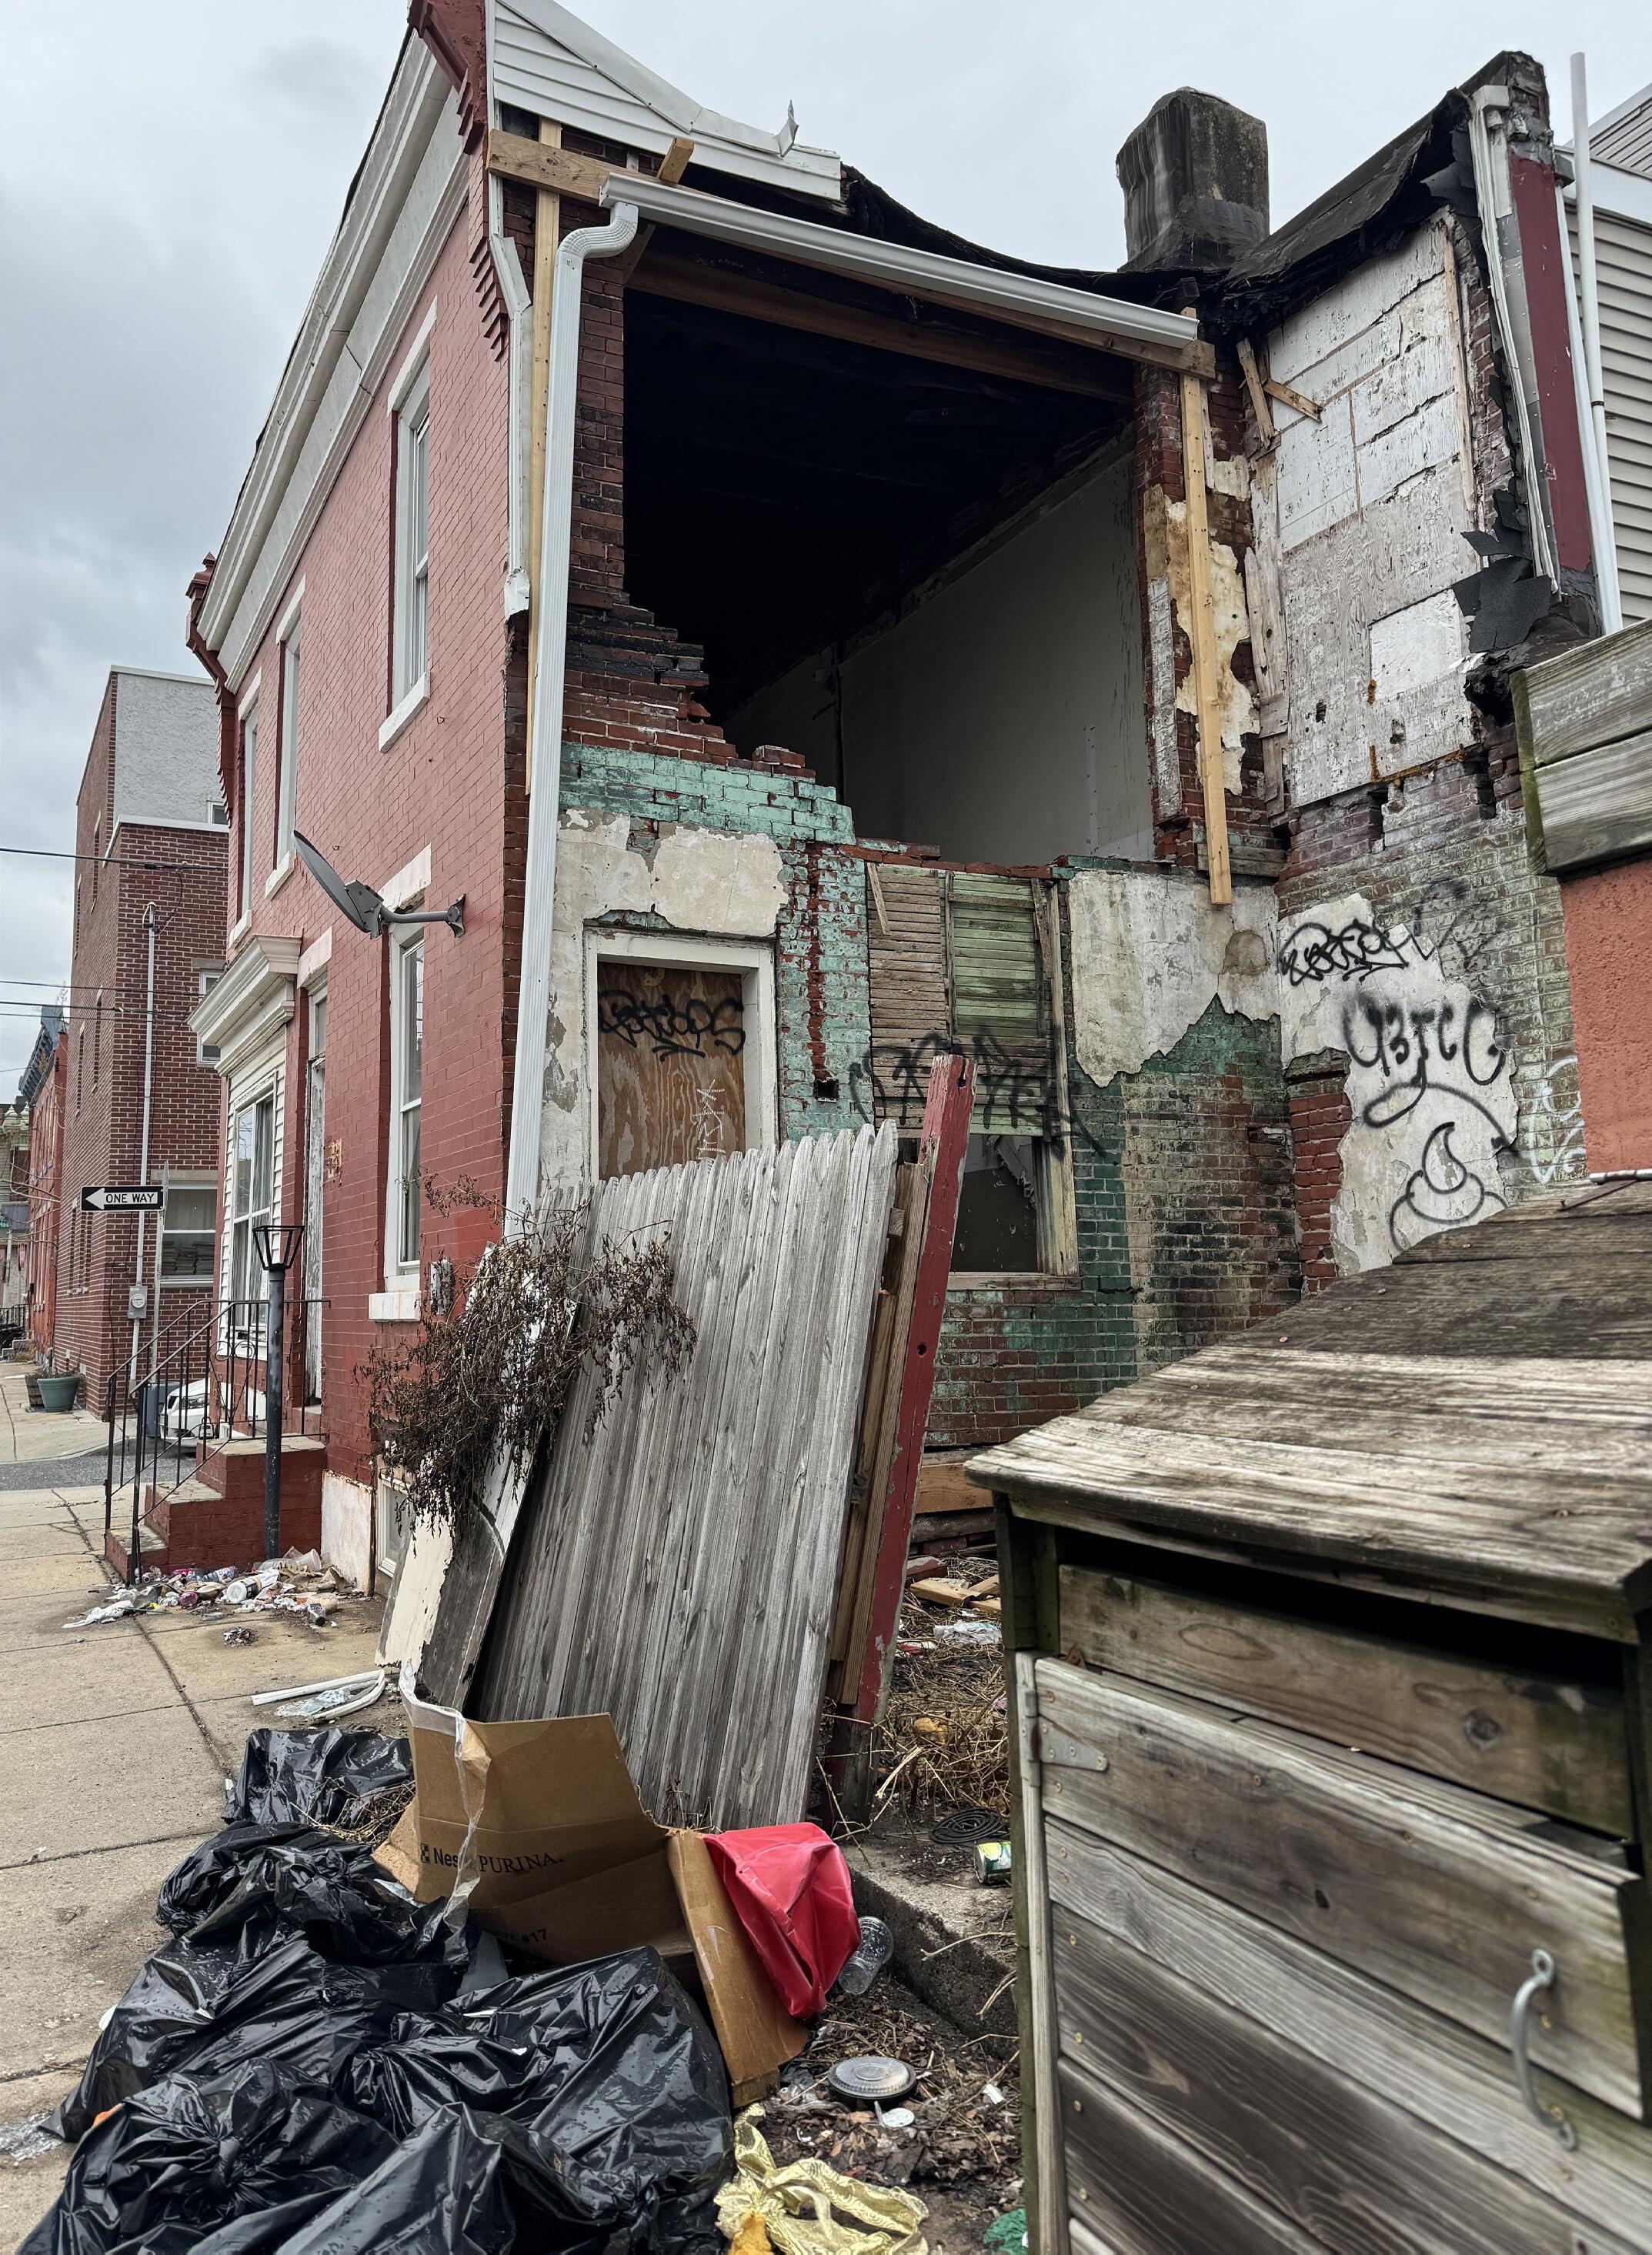
WHAT’S IN A FUTURE? Va cant lot in Olde Kensington, Philadelphia (Photo
Bradford) 195 PANORAMA 2024
by Bailey
Figure 3
Comparative Hot Spot Analysis of Speculated Vacant Land and New Constructioniii

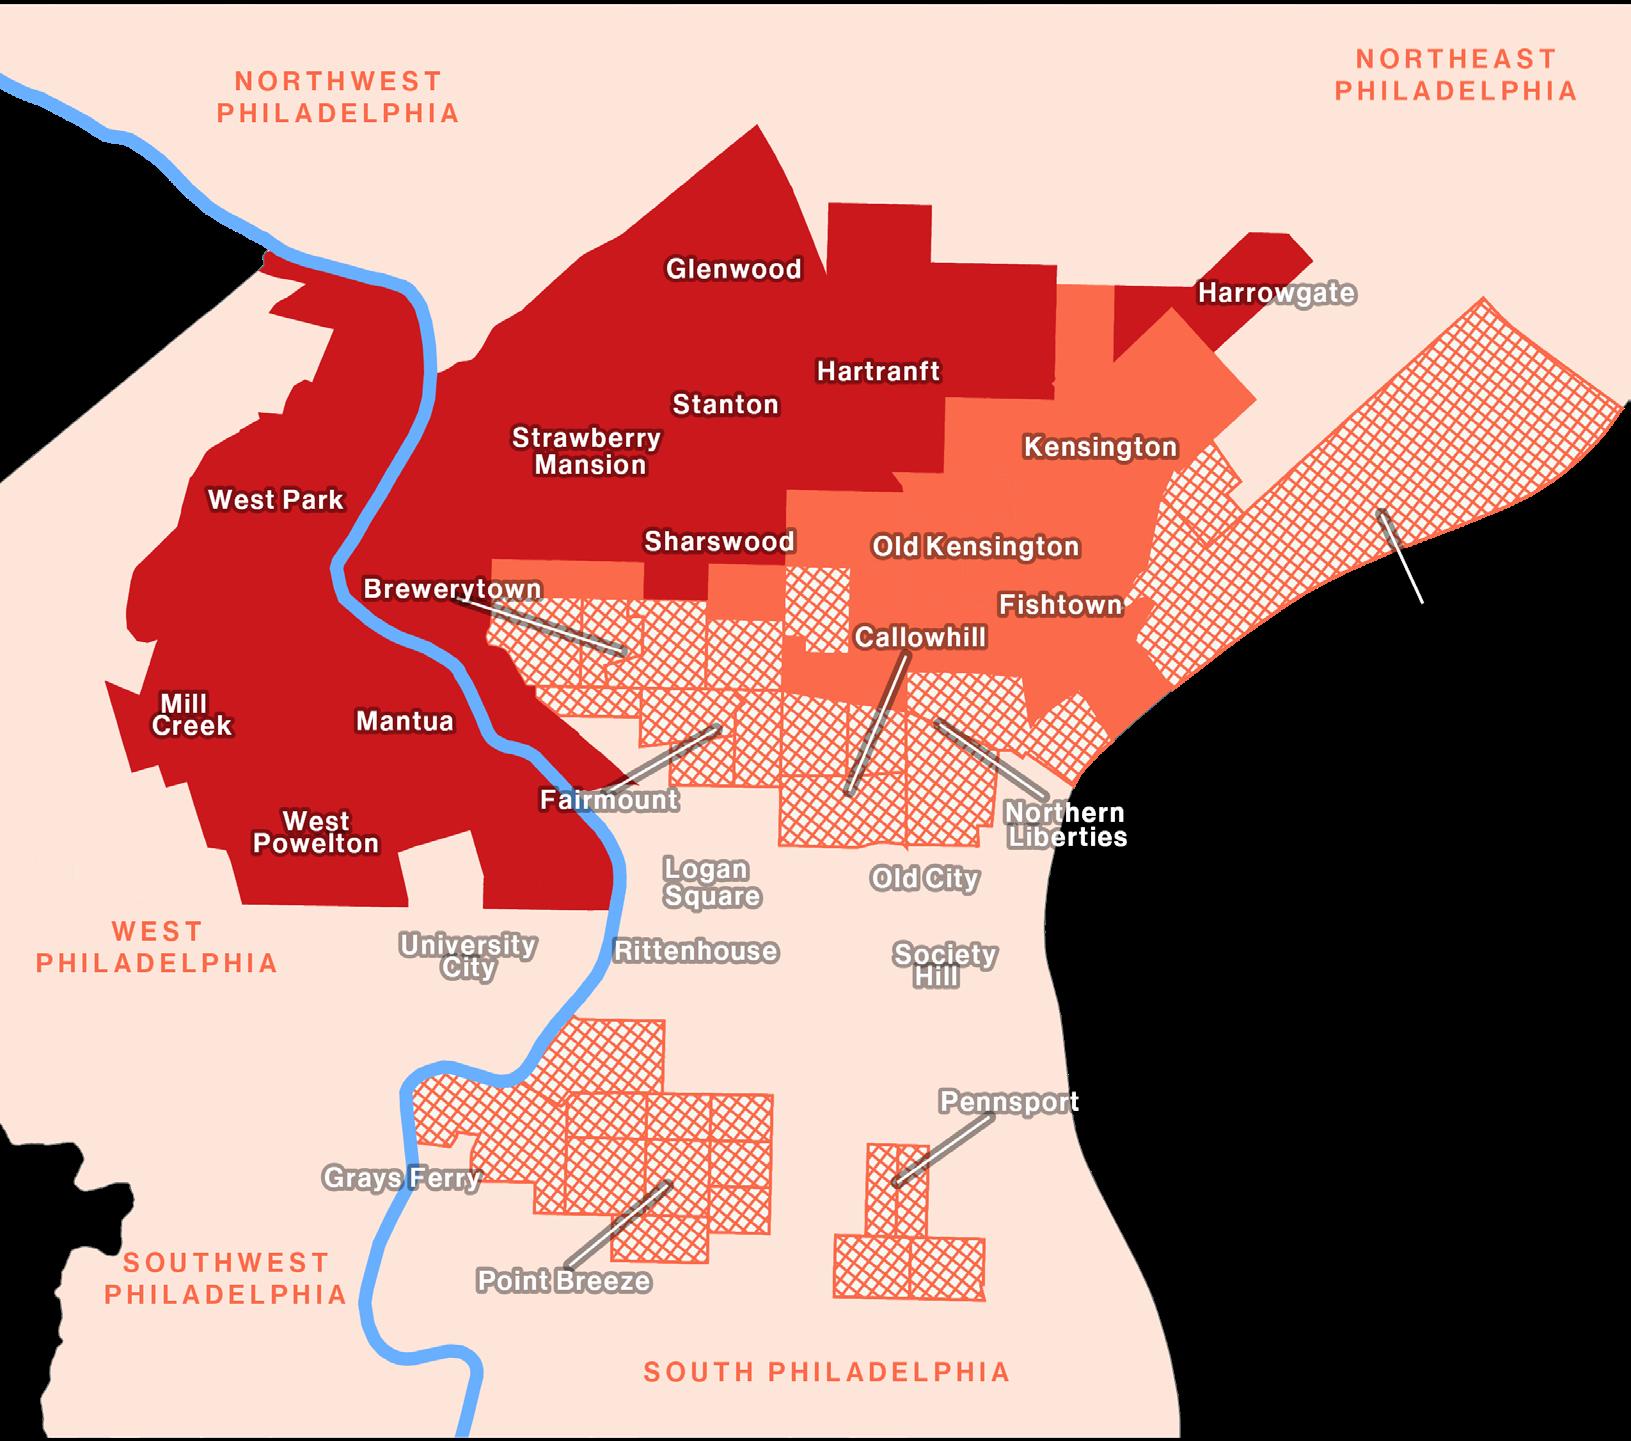
Hot Spot Analysis: New Construction (NC) vs. Speculated Land (SVL)
NC not hot; SVL hot
NC and SVL hot

NC hot; SVL not hot
NC and SVL not hot
196
STARING DOWN THE SPECULATORS
the last decade or more, leaving minimal vacant land at this point.6
From Northern Liberties, moving north along the corridor of the Market Frankford Line, a handful of neighborhoods represent concentrations of both new construction and speculated land—Old Kensington, Kensington, and parts of Fishtown. These neighborhoods have only recently seen high rates of construction, and given their industrial histories, still have a critical mass of vacant land.7 As prime areas of land ownership for speculators, land values have risen dramatically in these parts of the city in recent years.
Put together, this pattern suggests a clear correlation between concentrations of new construction and speculated vacant land. Where buildings are disproportionately being built, speculators disproportionately own land. Importantly, the directionality of the relationship between the two works both ways: just as the current concentration of development helps predict hot spots of speculative land ownership, so too can the current concentration of speculated vacant land suggest a potential future of concentrated new development. Empty land, after all, is a prerequisite to ground-up construction.
The Next Big (Neighborhood) Thing
So where in the city are speculators being truly speculative—where there is not yet a construction boom, but nonetheless a hot spot of speculated vacant land?
As showcased by the deep red color in Figure 3, instead of continuing northeast along the Market-Frankford Line, speculation appears to be concentrated to the west along Girard and Allegheny Avenues. Strawberry Mansion and Stanton in North Philly, along with Mantua and Powelton just across the Schuykill River, show high concentrations of speculated land, though they have not experienced high rates of new development in recent years. Speculators’ behavior provides a peak into the possible future in store for these parts of the city. Adjacent to the new construction hot spots of Fishtown, Old Kensington, and Brewerytown, these neighborhoods appear to pose the greatest profit-making potential for landowners. As explained earlier, that profit –predicated on increased land value – is only possible insofar as it is desirable to build on those parcels.
By following the established logic between patterns of speculated vacant land and new construction, we can predict where construction might move in the coming years. And if speculators’ desired future comes to fruition, it will be important to ensure existing residents benefit from the potential newfound development in their neighborhoods.
The ‘Land Hoes’ of Philadelphia
IN A FUTURE?
WHAT’S
197 PANORAMA 2024
When that realtor approached us at Habitat for Humanity Philadelphia, I specifically wanted to figure out who her client was. What’s more, I wondered how many similar speculators were operating in Philadelphia. To that end, I attempted to identify the largest of them – those that own more than fifty vacant parcels throughout the city. However, identifying the scale of any single company’s portfolio is notoriously difficult. Property owners typically have numerous names associated with their parcels, using separate entities to reduce legal liability. That way, if something goes awry at one property, others owned by the same company would not be affected financially. To get around this tricky reality, I sorted parcels by owners’ mailing addresses rather than name, assuming that each separate legal entity would be connected to the same company office.

However, identifying the scale of any single company’s portfolio is notoriously difficult. Property owners typically have numerous names associated with their parcels, using separate entities to reduce legal liability. That way, if something goes awry at one property, others owned by the same company would not be affected financially.
This strategy successfully unveiled the city’s largest speculators. All told, just fifteen companies own more than 50 vacant parcels in Philadelphia, each hiding behind a plethora of LLC names. Together, they own more than 2,000 parcels, or more than 35% of all speculated vacant parcels throughout the city.
Perhaps most astonishingly, one mailing address stood out from the rest: 25 South 19th Street. With 643 parcels attached to that address, this company owns more than 3 times that of the next highest speculator. They’ve got 77 different LLC names associated with that address, some out of an SNL skit: ‘Land Ho,’ ‘Stable Genius,’ and ‘Turf Wizard,’ just to name a few. While they laugh behind closed doors, real Philadelphians are harmed by their business model. And yet they will likely make immense profit, without ever having to
198 STARING DOWN THE SPECULATORS
pay for the negative externalities caused by that land sitting vacant.
As it turns out, 25 South 19th Street was the client whose realtor reached out to us at Habitat for Humanity. It would’ve been a cruel twist of fate for an organization like ours to help a company like theirs turn a profit.
Learning from Detroit: The Land Value Tax
Through a seemingly mundane tax policy change, Detroit, the poster child of post-industrial urban vacancy, is leading the charge to address the challenges posed by a surplus of speculated vacant land. In the years following the Great Recession of 2009, the Motor City saw a surge in speculative land purchasing. Like Philadelphia, much of that land remains vacant today.8 This reality is in part because Detroit’s current property tax system unintentionally encourages vacancy and abandonment. Taxes are almost entirely driven by the assessed value of a property’s building, rather than the land underneath it. Without assessed structures atop their vacant parcels, Detroit speculators pay as little as $30 in property taxes per year, even though their business practice has a huge potential payoff.9
Through his proposed land value tax (LVT), Mayor Mike Duggan wants to change this regressive system where speculators turn a profit and homeowners foot the tax bill. First promoted by Henry George in the late 1800s, the
WHAT’S IN A FUTURE?
199 PANORAMA 2024
LVT shifts the property tax burden from the building to the land underneath it. By placing a greater tax burden on the land, the theory holds, landowners would be incentivized to turn their land into productive uses quickly—or else face high holding costs. Amidst a national housing shortage, the policy has gained renewed traction today, viewed as a tool to spur housing development. And while implemented at a small scale in towns throughout the country, Detroit would be the first major American city to experiment with the LVT.10
To minimize the prevalence of speculated vacant land, Philadelphia should follow Detroit’s lead, adopting a stronger land value tax to disincentivize speculative land investment—and minimize the negative externalities that come with it. Like Detroit, Philadelphia’s property tax is made up of two components: a tax on the building, and a tax on the land. But the math is skewed; 76% of an owner’s property tax bill comes from the value of a building, with just 24% derived from the assessed value of land.11 What if the tax bill breakdown was 50-50, or 75-25 in reverse? Either way, a stronger tax on land value would reduce the profitability of speculative land ownership in Philadelphia. In doing so, speculators would be less likely to exploit a neighborhood’s struggles for company gain—and instead would be incentivized to turn parcels into productive uses for residents.
Philadelphia has considered the land value tax before. Just two years ago, Councilmember Derek Green held a hearing on the LVT, advocating for a shift to a 50-50 property tax breakdown between land and building.12 But it has not received any further attention from political decision-makers since that time. It is time to re-ignite the conversation. Ultimately, the LVT represents an opportunity for Philadelphia to pioneer much-needed tax reform to address our city’s crisis of vacant land. Without it, the company with offices at 25 South 19th Street—among others—will continue to shape the futures of some of our city’s most vulnerable neighborhoods.

About the Author
Elam Boockvar-Klein (he/him) is currently pursuing a Master’s in City Planning from the University of Pennsylvania, where he examines the transformative possibilities associated with equitable development. At every stage of his career, he has been grounded by a belief in the power of the intersection of community organizing, urban planning, and real estate development to work towards reparations for marginalized neighborhoods.
200 STARING DOWN THE SPECULATORS

Endnotes
1 Ben Seal, “A Philly environmental leaders’ grand vision to turn vacant lots into a new park system,” BillyPenn, August 27, 2023
2 Laurence Ukenye and Natalie Kerr, “40,000 vacant lots: how Philadelphia’s lack of green space worsens gun violence,” The Temple News, May 27, 2022.
3 Ibid.
4 Stephen Hoskins, “Everybody Works But the Vacant Lot: How Speculators Profit From our Thriving Cities,” Robert Schalkenbach Foundation, accessed February 2024.
5 “Rental Improvement Fund,” Philadelphia Housing Development Corporation, accessed February 2024.
6 Jake Blumgart, “Northern Liberties grows up as high rises for families come to Philly’s most gentrified neighborhood,” The Philadelphia Inquirer, January 13, 2023.
7 Jake Blumgart, “Philadelphia’s hottest new neighborhood? Underneath the elevated train tracks n Fishtown and Kensington,” The Philadelphia Inquirer, December 28, 2023.
8 Conor Dougherty, “The Georgists Are Out There, and They Want to Tax Your Land,” New York Times, November 12, 2023.
9 Ibid. 10 Harrison Clanton, “Detroit, MI: A Case Study in Taxing Land Instead of Property,” Bipartisan Policy Center, December 6, 2023. 11 Josie Faass, “How a land value tax could make Philadelphia a more equitable city,” WHYY PlanPhilly, October 3, 2020. 12 Taylor Allen, “A ‘progressive’ approach to taxing land gains traction in Philly Council,” WHYY PlanPhilly, May 4, 2021.
Map sources
i Office of Property Assessment Properties & Assessments Dataset, Department of Records Property Parcels Dataset, OpenDataPhilly
ii Ibid.
iii Office of Property Assessment Properties & Assessments Dataset, Department of Records Property Parcels Dataset, Licenses & Inspections Building and Zoning Permits, OpenDataPhilly.
FUTURE?
WHAT’S IN A
201
2024
PANORAMA
A Place
for All?
Squatting, Homesteading, and Adverse Possession in New York
 by Katie Hanford
In 1984, Rolando Politi, an Italian artist who emigrated to the US in 1980, decided to squat in 539 East 13th Street in Manhattan’s Lower East Side. Like many buildings on that block, 539 had been abandoned and burned out for the insurance money. New York’s Department of Housing and Preservation (HPD) owned the property and had boarded it up with tin, a typical practice of the time. 1 Politi and some friends were working construction next door when they heard that the drug dealers who were using 539 had been chased out by the police. The group decided then was their chance: they entered the building and officially secured residence, putting up a notice stating their intention for a homesteading project and placing large spikes in the front door. 2
Members of 539 began rehabilitating the building, replacing rotten joists, windows, water heaters and other infrastructure to ensure it was a sound place to live.3 The organization took over three more dilapidated HPDowned buildings on the block.
The squat community grew quickly as people from all walks of life came together for a common purpose: securing safe, livable and affordable housing. During their rehabilitation efforts, members of the squat continually petitioned the City to be recognized under legal homesteading programs and attempt to secure more capital for larger improvements. What should have been a simple process under the City’s dying Homesteading Act became a highly publicized and protracted legal battle, setting the stage for the future of squatting in New York City.
“Squatting”—the act of occupying a property that one does not own— has a long and storied history, one whose morality and legality has adjusted along with the concept of property and an individual’s right to it.
“Squatting”—the act of occupying a property that one does not own—has a long and storied history, one whose morality and legality has adjusted along with the concept of property and an individual’s right to it. Its legal counterpart, known as adverse possession, was brought to the U.S. as a part of English common law. The act of squatting found a cultural foothold in the economically struggling New York City of the 1970s and ‘80s, when a large number of abandoned buildings were occupied by creatives, anarchists and other low-income people in desperate need of affordable housing they could call their own.
The East 13th Street Homesteaders (ETSH) were largely responsible for turning the tide of legal action in favor of squatters’ rights, if only
IN A FUTURE?
WHAT’S
203 PANORAMA 2024
momentarily. These squatters and their peers helped revitalize areas of New York whose physical building stock had long been ignored by public and private interests. By rehabilitating these properties and putting care into their surrounding neighborhoods, squatters unwittingly became catalysts for city-sponsored gentrification. The history of this movement - and the policy and legal decisions brought in reaction to it - showcases how the concept of adverse possession has been manipulated and stripped of its ability to enact “public good.” If interpreted differently, New York City’s affordable housing crisis might have been culled by a larger fleet of equitable and organic community-led housing.
Urban Disinvestment and the Capital Gap in NYC
Understanding the history of squatting in New York City requires an understanding of large-scale disinvestment in urban cores throughout the mid-20th century. In New York City and beyond, the 1950s and ‘60s saw foundational middle-class tax bases leaving cities in droves for the promise of home ownership and open space in the newly created American suburbs. This left cities like New York with a paradox: they remained metropolitan centers, attractive as economic hubs in a job sense but uneven when it came to housing markets. Neoliberal policies—including “processes of privatization of state property and services, [a] shift to entrepreneurial urban governance, and… market-based solutions to social problems” – began to take the place of robust public services.4
Combined with the disappearing tax base, these neoliberal practices forced the City to choose where to invest and how to make the most of its vanishing funding. Low-income areas of cities were affected first, as the “rent gap” caused “land with run-down, outdated buildings on it to be worth less than it would be empty. Because the buildings, run-down, out of fashion, and full of tenants without much capacity to pay, detract from the potential value of the land, the owners have an incentive to let the buildings decay and push the tenants out.”5 This tactic led to widespread decline in low-income areas of New York - including the Lower East Side and large swaths of Brooklyn – due to landlord neglect and even arson. This downturn was tacitly supported by a lack of City investment in upkeep of these areas and ineffective punishment of neglectful private landowners.6 These trends would continue through the 1970s and 1980s.
Throughout this period, New York City made desperate attempts to lure capital back to the city and avoid defaulting on the loans taken out to replace their vanishing tax base. As the “rent gap” swallowed more neighborhoods, the City foreclosed on and auctioned off properties to recover delinquent taxes to earn back some capital.7 The auction plan largely backfired,
204 A PLACE FOR ALL?: SQUATTING, HOMESTEADING, AND ADVERSE POSSESION IN NEW YORK
as the City soon realized reselling these properties either led to more delinquency or more speculation, neither of which improved the landscape of neighborhoods, nor brought in the liquid capital the City was so desperate to gain. Therefore, the City continued acquiring properties that it could neither sell nor maintain. By 1988, the City owned nearly 10,000 buildings and 130,000 units of housing, only 50% of which was habitable.8 Low-income housing was impacted first and hit hardest. Low-income residents were faced with a housing crisis as livable and non-neglected affordable housing dwindled. This is where squatting came in. Low-income residents, artists and others attempting to create pathways to affordable housing took advantage of the City’s abandoned properties, moving in and rehabilitating them with whatever capital and labor they could gather. Squatting in New York City was not a new concept; there had been widespread movements throughout the 20th century, often featuring largely ethnic lower-income communities who took over buildings in order to provide for their families and fight against the beginnings of urban disinvestment.9 By the 1970s, there had been a few “successful movements,” defined by their ability to gain legitimate legal and fiscal support from the City, which ultimately came in the form of homesteading. City- and government-supported homesteading programs turned the “sweat-equity” squatting movements of the 1960s into legitimated revitalization efforts. New York’s first homesteading program was funded by HPD In 1974 and stewarded by the nonprofit Urban Homesteading Assistance

WHAT’S IN A FUTURE?
A warehouse in Williamsburg (photo by Katie Hanford)
205 PANORAMA 2024

Board (UHAB). Through this program, homesteaders would acquire clear titles to homes after rehabilitating the buildings and living in them for three to five years.10
Local and federal programs required homesteaders to have steady incomes on top of their rehabilitation efforts to qualify for the promised low-interest loans. Consequently, these programs favored moderate-income homesteaders as the safest investment, even though their motivations were more often centered around profit than those of low-income homesteaders seeking affordable shelter. Squatting seemed to be the only viable housing option for the City’s most vulnerable populations.
Adverse Possession and the East 13th Street Squats
Modern conceptions of squatting often paint the act as immoral and lazy, a way to “freeload” on hard-working landowners. However, the idea of squatting was not always deemed immoral; its legal history is rooted in the connection between utilitarian notions of property and public good, with underused property seen as more of a moral blight than a non-owner’s decision to occupy the property without permission.11 Adverse possession’s cultural and legal definition changed with new perceptions of property. The U.S.’s doctrine pulls from Lockean-influenced English common law, defined as a “method of acquisition of title to real property by possession for a statutory period under certain conditions.” 12 Adverse possession has five key elements a claimant must prove to win rights to the occupied land. The claimant’s possession must be open and continuous for a statutorily-mandated period, must occupy the entire
206 A PLACE FOR ALL?: SQUATTING, HOMESTEADING, AND ADVERSE POSSESION IN NEW YORK
Multi-use shop space in Brooklyn (photo by Katie Hanford)
area, must be at odds with the title holder’s interests, and must be notorious.13 Various cases and applications of this law over the last 200 years have pulled the concept farther from its inception, as state-level legal interpretations have focused more on property line disputes than the notion of abandoned land as a moral blight.
By the 1980s, homesteading as a concept had all but been abandoned by New York as land values in disinvested areas rose along with the promise of profitable development. Closed-door sales between small-time landlords throughout the 1970s had driven up land values without addressing any needed physical improvements14, making the concept of homesteading a less attractive pull for the cash-strapped City. Instead, New York looked to expanding “affordable housing” in partnership with established community organizations and nonprofits as a development-oriented solution to decades of disinvestment.15
With economic and political pressure mounting, the East 13th St. Squatters turned to adverse possession as their last-ditch effort to cement community control of their homes. The prospect of the squats in lucrative neighborhoods turning into permanent community-run housing made the City squirm.
East 13th Street Homesteaders v. Lower East Side Coalition Housing Development (1995)
Facing eviction pressures with no clear way out, the squats pursued a legal battle that would define the future of homesteading in New York City. ETSH reached 10 years of occupying their series of squats in 1994 and finally met the statutory requirement for adverse possession established in the State of New York.16 In adverse possession cases, government-owned land is generally protected when it is held for public use.17 However, “when government land is held for private or proprietary use, it is open to appropriation via adverse possession.” 18 New York’s law clarifies that state-owned property is not automatically tagged for public use and many felt the City gave up its right to designate these buildings for “public use” when it entered into auction tactics in the early 1980s.
There is a sad yet perfectly suited irony in the fact that New York, itself a relatively “low-income” geographic area (and therefore a dangerous loan recipient) trying to claw its way back to solvency, attempted to stop its own citizens from doing the same. It was not as though the City was against squatting, either: during this time, the City (under Mayor Giuliani’s leadership) had actually encouraged small businesses to squat in its abandoned buildings, hopeful that economic flows would revitalize the neighborhoods the City had
IN A FUTURE?
WHAT’S
207
2024
PANORAMA
left destitute.19
To make their claim of adverse possession, ETSH needed to prove all five elements in addition to the City’s acting as a private landlord and a continuous occupation by members of ETSH across all four buildings. ETSH argued that the collective – not singular residents – was claiming possession. They also utilized the idea of “useful labor,” including the installation of new doors, windows, utility systems, etc., to speak to the original spirit of adverse possession as an open and notorious use going against the landowner’s intent, which they argued was disinvestment and latent ownership. 20 The City was represented through the Lower East Side Coalition Housing Development (LESCHD), a nonprofit set up to develop a $4 million affordable housing project at the debated site. 21 The Homesteaders had originally intended to work with LESCHD to create this affordable housing until they realized their lack of income flows would disqualify them from remaining in their homes. 22
The City disputed the plaintiffs’ claims by calling their identities and a general concept of “public good” into question. They questioned squatters’ need for affordable housing, arguing that squatters did not show valid proof of eventual homelessness if evicted from the squats. They argued that having a profit-seeking motive for these buildings did not disqualify the project from serving the public good. Finally, they cited urban renewal and slum clearance rhetoric when discussing how the City had been trying to remove the squatters, all of which was still “legally considered a public good.”23 These tactics were a way for the City to house a cultural attack within legal language and showcased
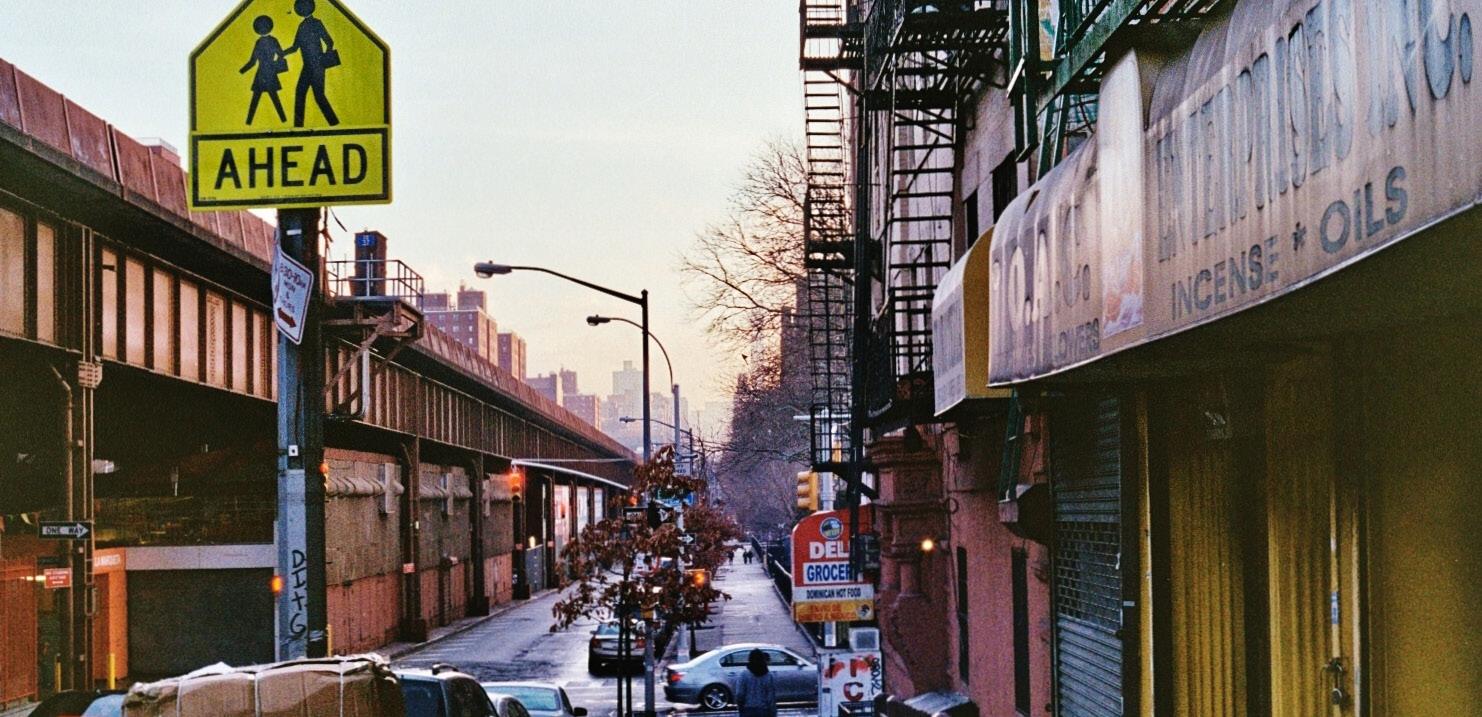 Photo 3: Graffiti on a residential building in Harlem; By Katie Hanford
208 A PLACE FOR ALL?: SQUATTING, HOMESTEADING, AND ADVERSE POSSESION IN NEW YORK
Harlem (photos by Katie Hanford)
the law’s ineptitude at keeping up with changing norms and knowledge. How was it that 30 years after disastrous urban renewal projects, the defendants could still legally cite actions in their spirit as serving the “public good?” What is the role of the law in understanding the intersection of historical context and future impacts development has on a neighborhood?
In October 1995, the New York Supreme Court granted ETSH an injunction that halted eviction processes and found the squatters’ act of possession “legally intelligible and effective, and the law legitimated their property claims.”24 The victory was short-lived: after an appeal from the City, New York’s State Appellate Court overruled the decision in August 1996, citing that ETSH could not have established continuous occupation because the City had resealed the buildings multiple times between 1984 and 1994. 25 The reversed ruling did not mark the end of squatters’ attempts to prove adverse possession, but this case was the closest they came to achieving that goal.
The legacy of the case marked a turning point in the resistance movement, as the chance that squatting could be seen as a legitimate claim to property influenced the City to negotiate the transfer of a small number of squats to residents in the coming years.
26 However, “success” in this case was a bitter pill to swallow: only 11 of the dozens of initial squats were transferred to resident ownership in the early 2000s.
27 Legal backlash to this small victory followed suit. In 2008, an amendment to New York’s Real Property Actions and Proceedings Law was enacted to shield property owners by significantly increasing the burden of proof for adverse possessors, effectively criminalizing adverse
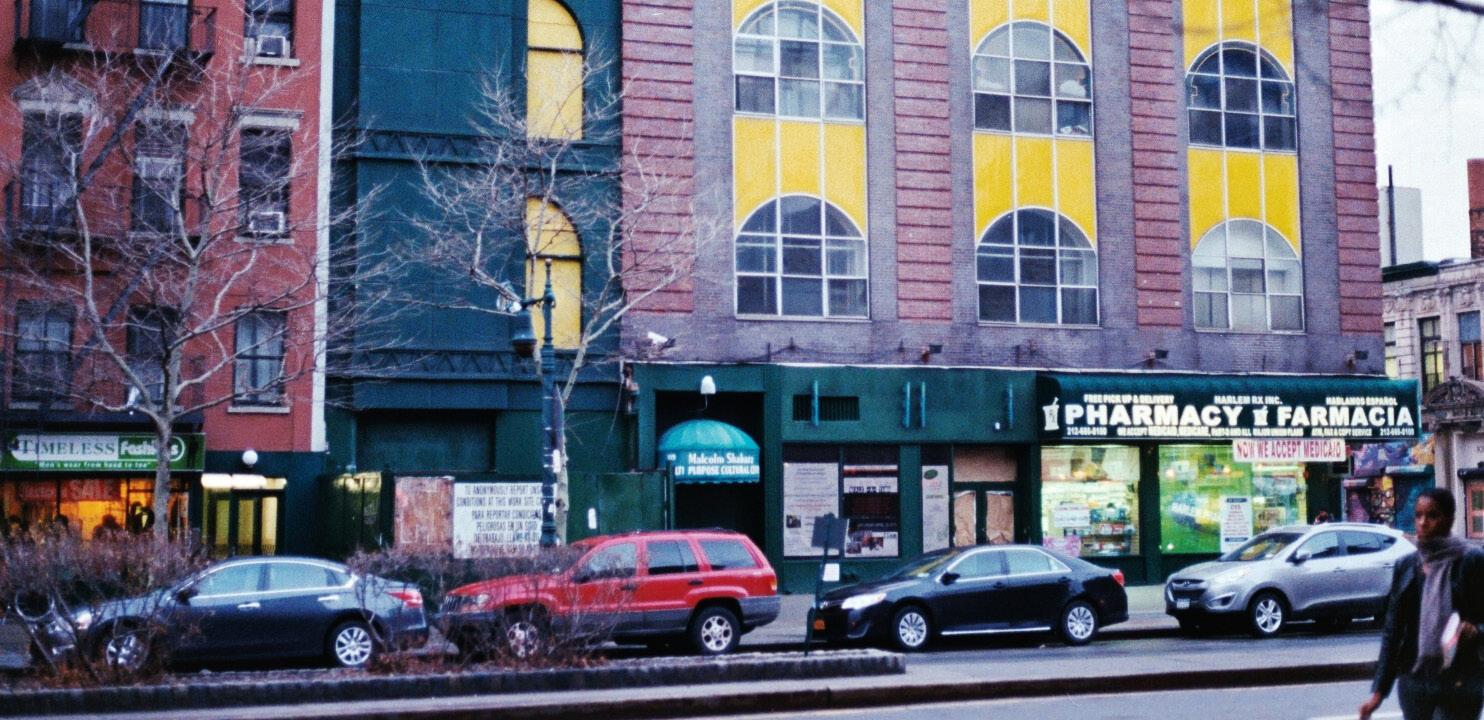
WHAT’S IN A FUTURE?
209 PANORAMA 2024
possession claims. 28 This shift was a direct reaction to the near-success of squatters’ rights in the 1990s and aimed to prevent further claims that could challenge property values in a city bouncing back from financial turmoil. The amendment brought an effective end to the public-serving spirit of adverse possession in New York moving forward, providing further proof that the law does not – and never will – exist in a sociopolitical vacuum
What About Public Good?: Adverse Possession’s Modern Misinterpretation
In the legal battle of East 13th Street Homesteaders v. Lower East Side Coalition Housing Development (1995), New York City asserted that squatters’ occupation jeopardized safety and sanitation, framing their defense around the ambiguous concept of “public good.” This defense failed to consider that squatters often represented the very segment of the public most in need of support for humane living conditions and affordable housing. How should the

By neglecting the promotion of community well-being and failing to regulate private rights in the public interest, the city’s actions underscored the need for legal interpretations that prioritize vulnerable populations.
concept of “public good” be attended to in the legal system when the definition of the public is subject to political influence?
At the time of this case, the City was interested in converting the squats into “affordable housing.” In reality, New York City’s attempts to reclaim squats reflected a desire to control the destiny of these properties to maximize private profit, as the affordable housing solutions the City proposed would revert to market rates after 15 years. 29 This temporary view of affordable housing unmasked the City’s approach to solvency: one that hinged on replacing existing low-income communities with higher-income residents in the near future.30 Which public was the City actually trying to serve?
Dozens of squats existed in New York at the time, with varying levels of community organization and rehabilitation processes in motion. If the initial ruling in the ETSH case had stood, other squats could have followed in
210 A PLACE FOR ALL?: SQUATTING, HOMESTEADING, AND ADVERSE POSSESION IN NEW YORK
legally sound footsteps to achieve ownership of their sweat equity projects, putting the power of property ownership in the hands of those who would never have had enough capital to achieve ownership through traditional structures. Landowners – both private and public – were afraid of this reality. A precedent set on the original understanding of adverse possession – to uphold property as a public good - would have turned a profit-oriented housing market on its head. Although it is speculation to argue that this shift would have made landlord delinquency more difficult and led to the revitalization of squats’ neighborhoods, this reality was not impossible. It simply required the City to trust in its vulnerable populations to remake spaces to fit their own needs—and to back this trust with access to capital flows and City-supported rehabilitation programs.
Despite its financial issues, New York held a powerful position as a global city with interest from major economic forces. It makes sense that, at a time where public services were largely being gutted in favor of private investment, the City favored strategies that attracted investors interested in large-scale, profit-oriented development—and the always-attendant higher property taxes—as a clear path to solvency. A city potentially alienating capital-backed investors in favor of rolling the dice on low-income interventions in a crumbling housing stock would have been a risky move, at best. But it is also a City’s job to serve its population, regardless of class, color and creed.
New York was in a position to revolutionize a city government’s relationship with its public, and it backed down from that chance. The law fell in line with the City’s private-profit vision, cementing the notion that legal proceedings are influenced by specific sociopolitical contexts. The Court of Appeals understood recognized how this case could embolden squats across the city to pursue possessor claims. The idea of adverse possession was twisted to meet financial goals instead of the public interest it had been designed to support, all allowed by the false objectivity of the law.
By neglecting the promotion of community well-being and failing to regulate private rights in the public interest, the city’s actions underscored the need for legal interpretations that prioritize vulnerable populations. Imagine a world in which the tension between private property (and private profit) and public good had tilted further in favor of genuine efforts to promote public health, safety, and welfare, and had recognized the public good that the squatters represented—community, increased safety, economic activity and revitalization to neighborhoods that had otherwise been subject to systematic disinvestment for over two decades. Imagine a world in which the Court of Appeals that overruled the trial court’s fact-based findings of continuous occupancy (a rare move for an appellate court that does not itself make factual findings from evidence introduced in the lower court) would have accepted that ETHS
IN A FUTURE?
WHAT’S
211 PANORAMA 2024
had made a legally legitimate claim to the East 13th Street properties. If the City of New York and its courts had recognized the importance of adverse possession’s original interpretation to upholding the notion of public good instead of being captive to a politics that catered to private property and capital, the housing affordability crisis in New York today would look a bit different.
Endnotes
1 Starecheski, Amy. Ours to Lose: When Squatters Became Homeowners in New York City. The University of Chicago Press, 2016 2 Ibid. at 47 3 Kois, Dan. “The East Village Standoff I Missed.” Curbed, 16 Jan. 2023. 4 Starecheski at 24 5 Starecheski at 47 6 Ibid. 7 Hirsch, Eric, and Peter Wood. “SQUATTING IN NEW YORK CITY: JUSTIFICATION AND STRATEGY.” Review of Law & Social Change, vol. 26, no. 605, 1987, pp. 605–617 8 Ibid. 9 Starecheski at 54 10 Ibid at 68 11 Gardiner, Brian. “Squatters’ Rights and Adverse Possession: A search for equitable application of property laws.” Indiana International & Comparative Law Review, vol. 8, no. 1, 1997, pp. 119–158, https://doi.org/10.18060/17807 12 Ibid. at 122 13 Ibid. at 122 14 Ibid. at 48 15 Starecheski at 90 16 O’Shea, Sara. “Property Owners Beware: Adverse Possession in New York Is Still Alive and Well.” HLS | Hollis, Laidlaw & Simon, 9 Dec. 2021 17 Johnson v. M’Intosh 18 Starecheski at 94 19 Gardiner at 144 20 Starecheski at 98 21 Gardiner at 143 22 Starecheski at 93 23 Ibid. at 96 24 Id. 25 Starecheski at 113 26 Ibid. at 117 27 Kois 28 O’shea 29 Ibid. at 89 30 Starecheski at 48
212 A PLACE FOR ALL?: SQUATTING, HOMESTEADING, AND ADVERSE POSSESION IN NEW YORK


About the Author
WHAT’S IN A FUTURE?

Katie Hanford (she/her) is a second-year Master of City Planning student concentrating in Housing, Community and Economic Development. She is interested in the intersection of culture, power, and community-led design, specifically how arts communities come together to create urban space that fits their needs. When not people-watching, Katie spends her time playing/listening to all things heavy, watching ‘90s romcoms and finding the best food and drink deals Philly has to offer.
213 PANORAMA 2024
Left Foot, Right Foot
 by Revathi V. Machan
Excuse me sir!
Tell me which way is home please
To the left, nothing but white concrete barricades
To the right, plains of black asphalt
Amma says when she was young, the world was in color. Nana tells me about the trees that grew where the black plains live now.
I look ahead and I see, Children playing hopscotch in the street
But in a step, in a breath, its gone. A mirage of memories and morning dew, Sliced through with the headlights of the 6am rush
Excuse me ma’am!
Tell me which way is home please.
Left foot, right foot, left foot, right foot.
Amma said this was the safe sidewalk, Nana said dont stray.
They said that the trees made it bumpy and people forgot where their trashcans were, but that it’s ok
I look ahead and I see
A dandelion grown through a crack in the street
But in a step, in a breath, Im gone. Left to live on as a mirage of memories and dandelion seeds Sliced through with the grill of a truck.
Amma and Nana!
Tell me which way is home
IN A FUTURE? 215 PANORAMA 2024
Please WHAT’S
Industrial Legacies & Open Space
 by Junyi Yang
Lead Contamination Level of Philadelphia’s Green Spaces
by Junyi Yang
Lead Contamination Level of Philadelphia’s Green Spaces
With a long industrial history, present-day Philadelphia still contends with soil contamination despite the closure of most of the industries. Among the various pollutants lingering in the soil, lead stands out as one of the most challenging contaminants to remediate due to two primary factors. Firstly, lead found in soil can originate from multiple sources. Before standards were established to regulate lead levels in industrial products, lead was commonly found in paints, gasoline, metals, and other materials; not only associated with industries but also prevalent in people’s daily lives. Lead from these sources dissolved in the topsoil and accumulated over time. Unlike other heavy metal pollutants, lead exhibits exceptional stability in the soil, adhering tightly to the surface of organic particles. It does not dissolve in water but can adhere to skin and clothing upon contact. Due to these factors, lead contamination is a widespread issue in post-industrial, aging cities. This problem is particularly severe for younger age groups, as children often come into contact with soil during outdoor play. According to CDC standards, “a blood lead level of 5 micrograms per deciliter (μg/dL) is the blood lead reference value, which means the maximum blood lead amount that can be considered “normal” for the human body. However, for children, the CDC employs a blood lead reference value of 3.5 micrograms per deciliter (µg/dL).”
Lead contamination is particularly severe for younger age groups, as children often come into contact with soil during outdoor play.
1 Research conducted by the University of Pennsylvania’s Center of Excellence in Environmental Toxicology (CEET) in 2018 revealed that “3.2% of the 37,584 children screened by the Philadelphia Public Health Department had Elevated Blood Lead Levels (EBLLs) between 5-9 µg/dL.”2 This result indicates that more than 1,200 children in Philadelphia have a blood lead level that is almost double that of the CDC’s lead reference value.
The purpose of this online dashboard tool is to assist individuals, particularly parents with young children, in assessing the lead levels in Philadelphia’s green spaces. The assessing standard is based on EPA’s regulation that states “400 ppm for lead in bare soil in play areas,” and the lead data utilized in this tool is sourced from the CEET sample base3. Users can either input an address into the search box or explore the list of green spaces. When searching by address, the tool will automatically identify the nearest park and the route to it, while searching by park name will zoom in on the selected park. In all instances, the chart at the bottom right of the screen will display the lead level of the selection and compare it to the EPA’s 400 ppm standard.
IN A FUTURE?
WHAT’S
217 PANORAMA 2024
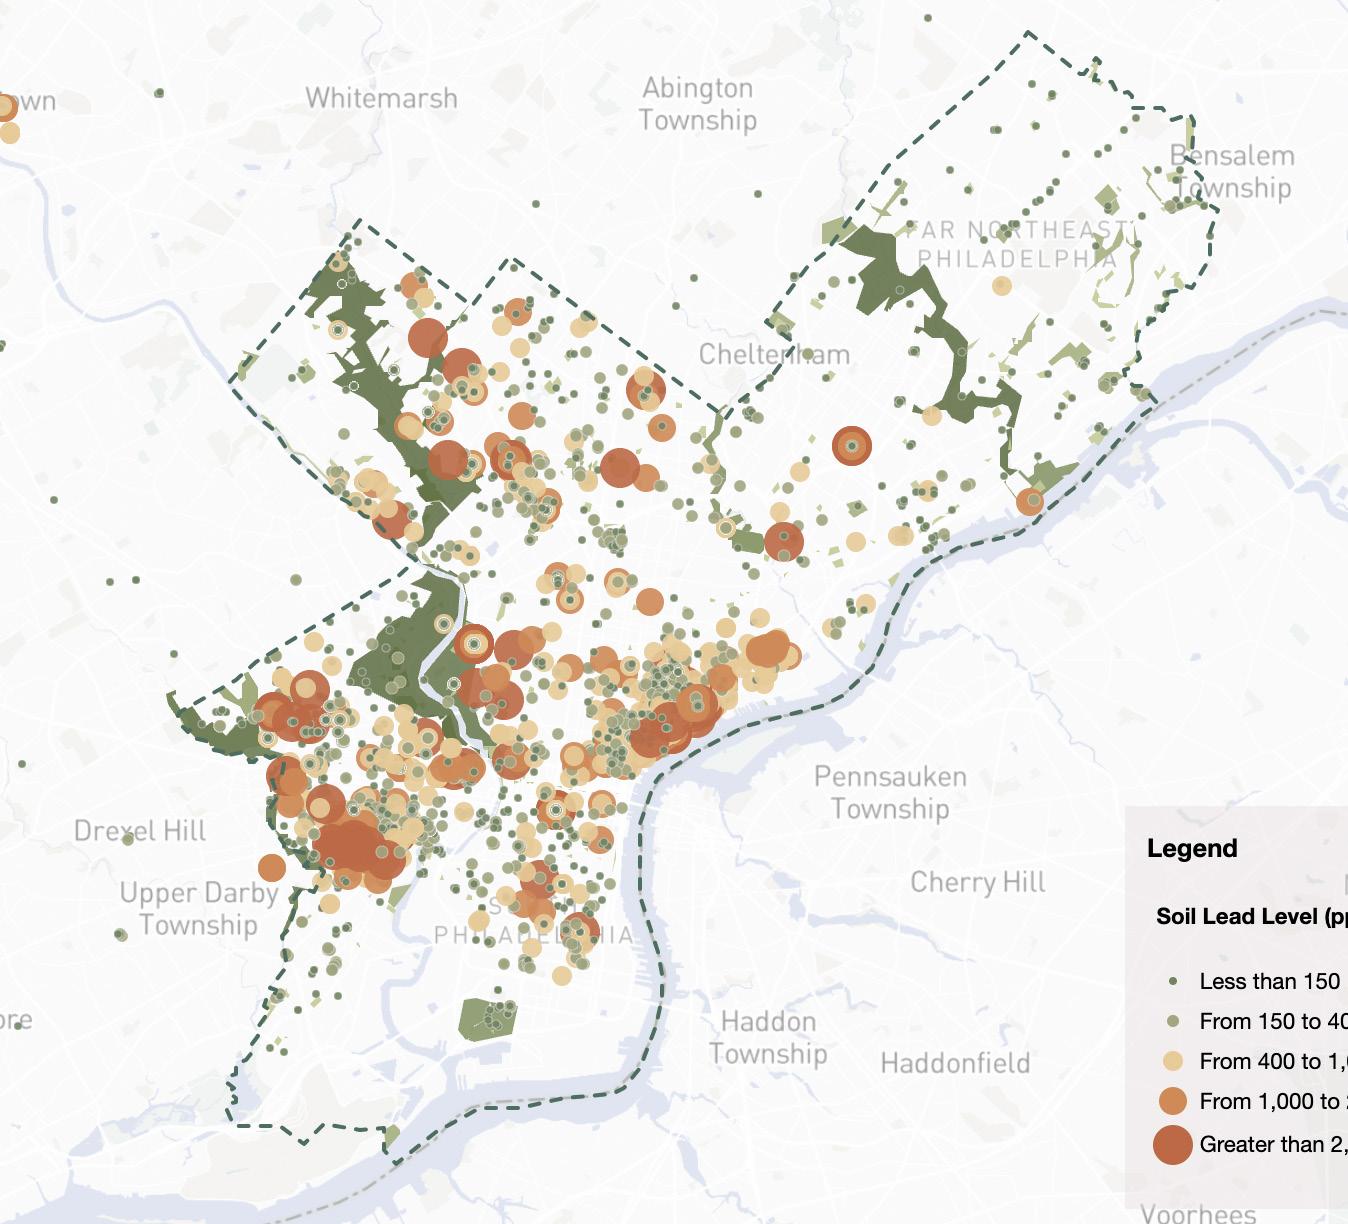
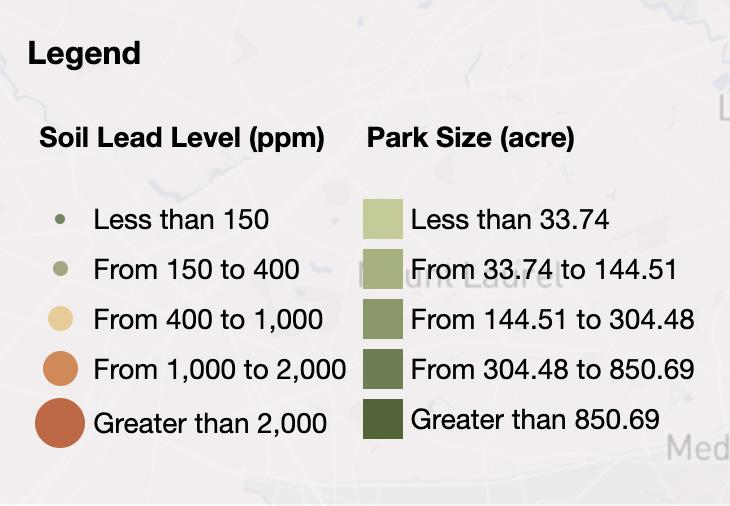
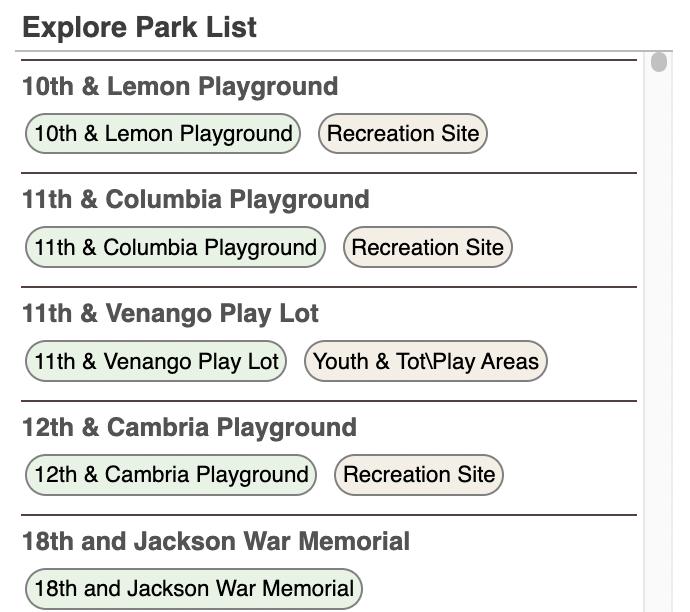
INDUSTRIAL
Figure 1
Dashboard depicting Soil Lead Levels in Philadelphia Parks
218
Figure 2 (left) List of Philadelpiha parks and uses
LEGACES & OPEN SPACE
Figure 3
Park Lead Level Display can be used to determine where Philadelphia parks fall in lead levels in comparison to EPA’s assessment standard

Endnotes

Explore more at: bit.ly/PhillyLeadDashboard

1 Centers for Disease Control and Prevention. “Guidelines for the Identification and Management of Lead Exposure in Pregnant and Lactating Women.” CDC, Accessed February 20, 2024.
2 Center of Excellence in Environmental Toxicology. “Lead Soil Contamination Mapping.” University of Pennsylvania, Accessed February 15, 2024.
3 Agency for Toxic Substances and Disease Registry. “Safety Standards for Lead in Soil.” CDC, Accessed February 12, 2024.
About the Author

Junyi is a second-year student at the University of Pennsylvania pursuing a dual degree in Master of Landscape Architecture and Master of City Planning with a concentration in Smart Cities. With a B.S. in Molecular Environmental Biology and a B.A. in Landscape Architecture from UC Berkeley, she has a professional background in design, planning, and data analysis for research and design firms. She believes in the potential of multi-discipline collaborations and is always prepared to learn new things. Her current work and interests range from front-end web development, urban spatial analytics, and parametric modeling to urban design, planning, and landscape design.
A FUTURE?
WHAT’S IN
219 PANORAMA 2024
SAYRE HIGH SCHOOL STUDIO
A Trauma-Informed Planning Approach

Kyle Arbuckle
Sofia Fasullo
Roshini Ganesh
Samiriddhi Khare
Frances Murray
Emmy Park
Mimi Tran

Sayre High School has made headlines in the recent years for experiencing indoor temperature far hotter than any other school in Philadelphia.1 This negative press could lead many in Philadelphia to write off Sayre as just another “underperforming” school. However, Sayre is part of a larger history of racialized and spatialized trauma enacted by the city of Philadelphia on West Philadelphia.
IN A FUTURE? 221 PANORAMA 2024
WHAT’S
Why We Are Doing This Project
For this project, we were presented with a pressing issue: how can we help Sayre become an anchor institution in the Cobbs Creek neighborhood? We sought to assist internal and external communication flows regarding existing resources. Our resource guide is meant to buttress work being done by a Landscape Architecture studio looking to improve the physical conditions of the gravel courtyard in the middle of the school.
This work comes at a time when the city of Philadelphia is being adversarial toward teenagers. In the past year, the city has passed a curfew, restricted unsupervised access to the mall after 2 pm, and banned ski masks with threat of a fine up to $2,000.² Many businesses have policies of not allowing anyone to enter their business with a backpack on. With only a few green spaces surrounding Sayre, students are left without third spaces in a city that is criminalizing them because of the actions of others.
We are not inventing any resources, we are just amplifying work that is already being done. We ultimately hope this information hub can contribute to Sayre students’ dreams beyond high school with resources on job training, advocacy tools, and college information.
Sayre High School in West Philadelphia (Source: Google Earth)
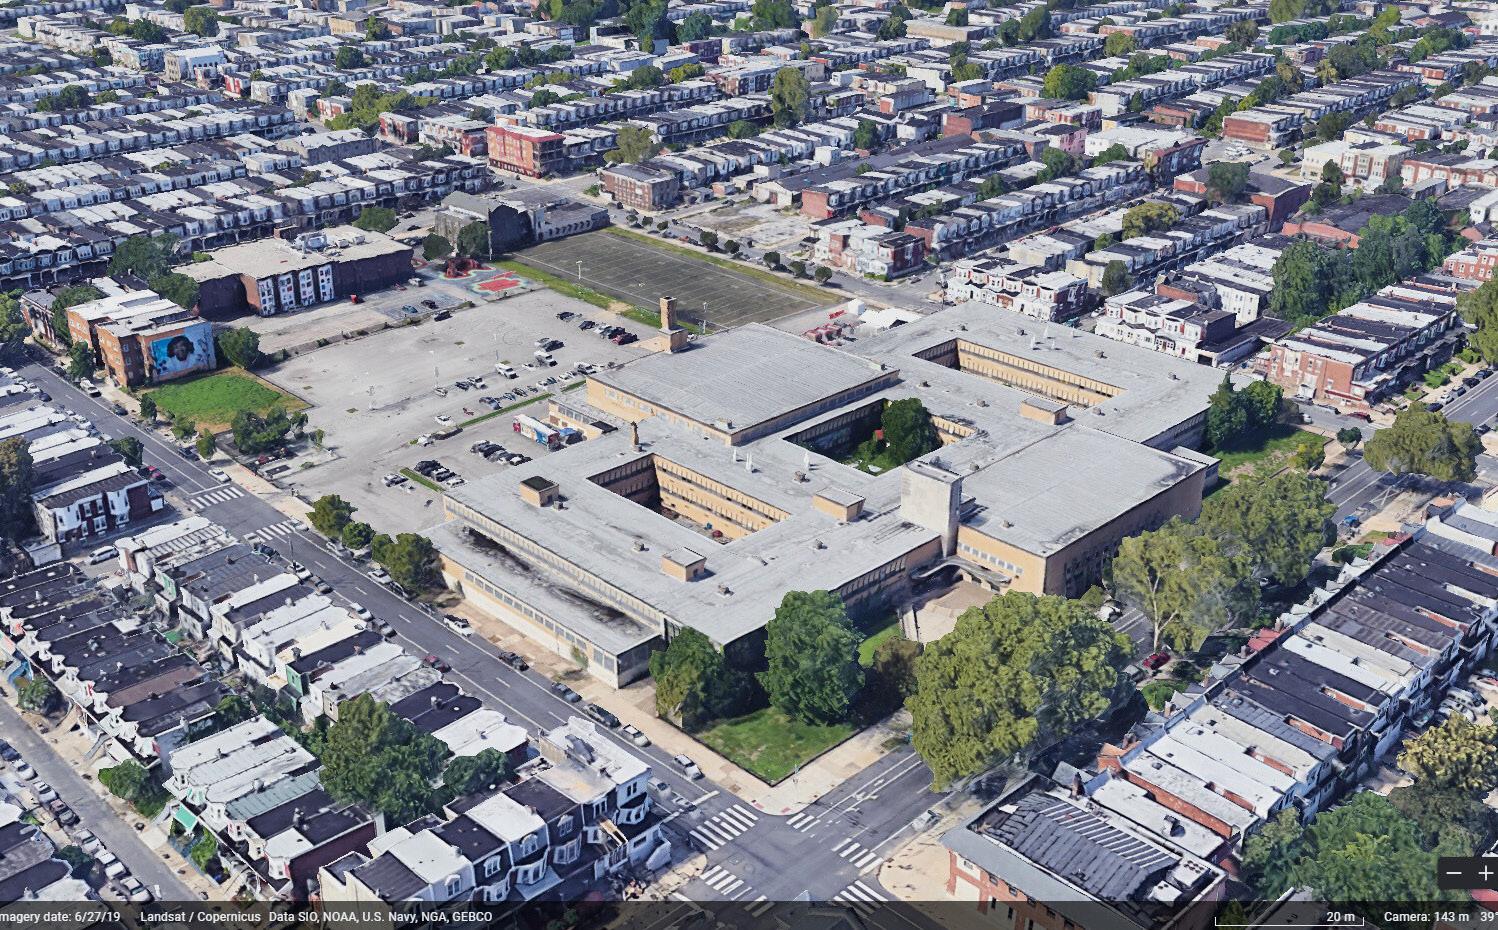
TRAUMA-INFORMED PLANNING FOR SAYRE HIGH SCHOOL 222
Sayre’s Local Context
Sayre High School is located in the Cobbs Creek neighborhood, a short distance away from two of the most prominent acts of racialized violence by the city, the site of the 1985 MOVE bombing and of the 2020 murder of Walter Wallace Jr. by Philadelphia Police. Overpolicing persists in the area as Cobbs Creek residents represent a disproportionate number of those stopped or arrested by police compared to the city as a whole. More directly affecting Sayre High School, the School District of Philadelphia currently only spends 6 percent of its $4 billion budget on public high schools like Sayre.
While Cobbs Creek is a lush park just to the west of Sayre High School, the area directly surrounding Sayre lacks adequate green space. Our analysis found that while there is greenery surrounding Sayre, it is more often shrubbery, rather than tree cover or grass, which does comparatively less to mitigate heat. The area around Sayre is 7 degrees hotter than the rest of Philadelphia. The landscape studio’s courtyard project seeks to address by including greenery in its plans.
Sayre’s location and the studio’s West Philadelphia study area WHAT’S
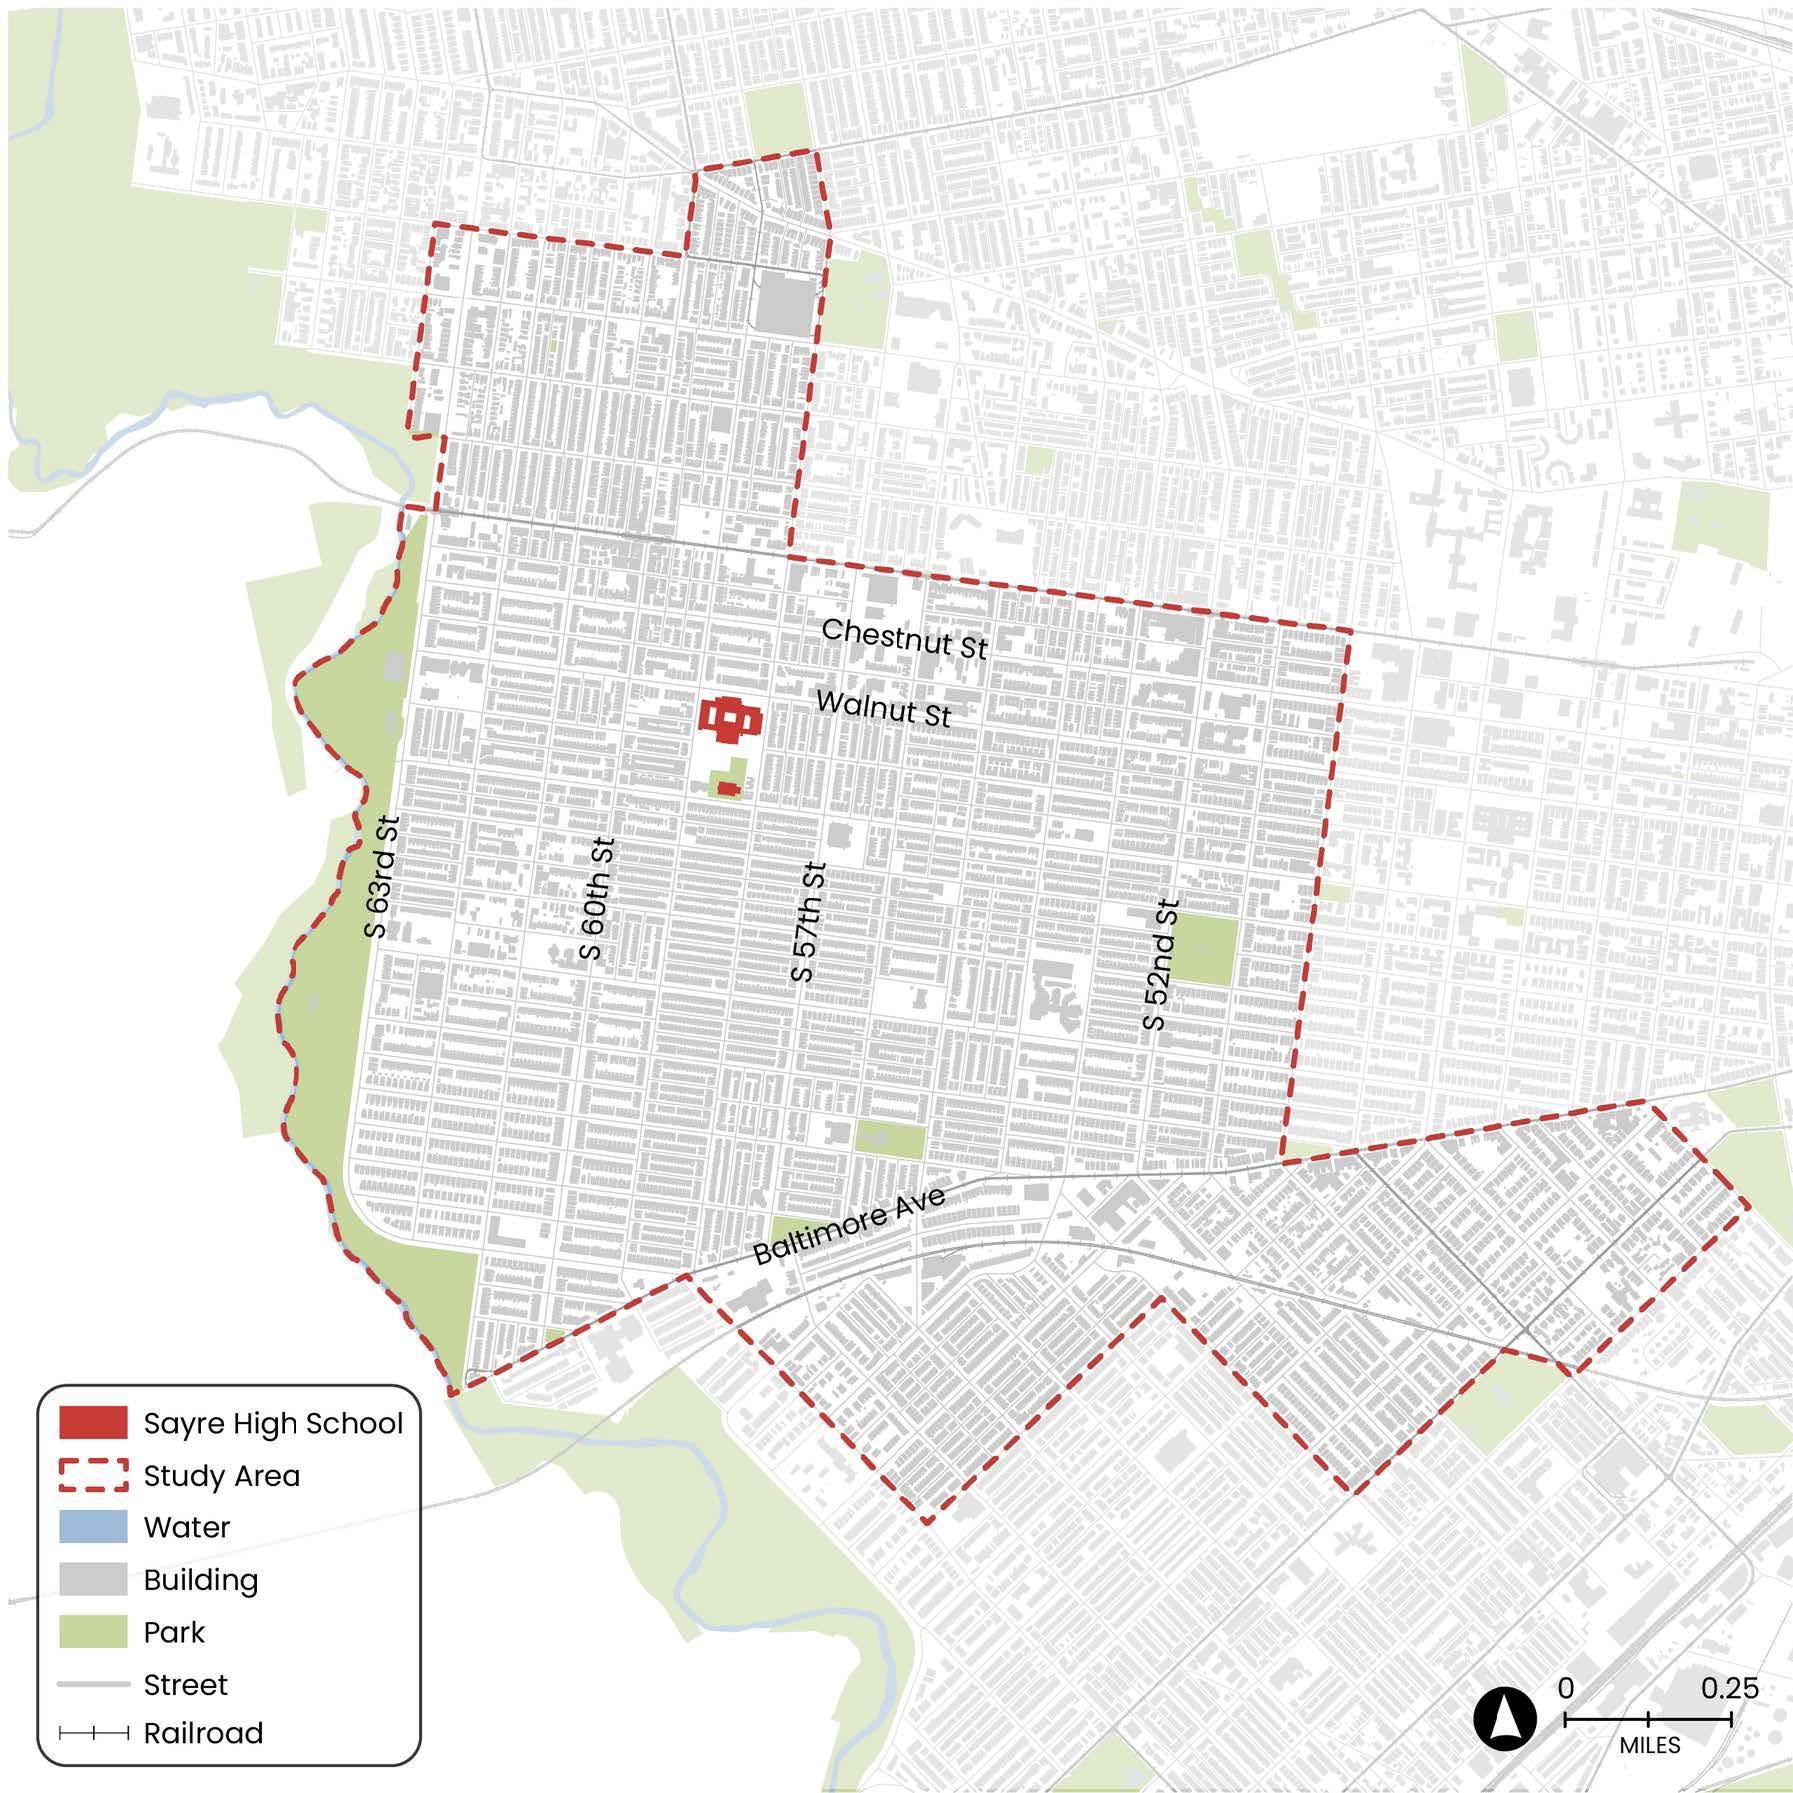
223 PANORAMA 2024
IN A FUTURE?
Trauma-Informed Planning
We entered this project with a mantra of not reenacting further trauma. We had to contend with the idea that we are part of the elite, Ivy League institution that is hoarding resources from communities like those at and surrounding Sayre High School. Wealso wanted to be cognizant of the history of racialized violence and poverty in the area, and intended to do no harm. A major aim of this studio was to blend some key principles of social work with city planning, in particular the two principles of a “strengths-based approach” and “centering lived experience.”³
We sought to focus on building up the strengths of Sayre, rather than focusing on its difficulties. Further, we did not want to be prescriptive with our project and lose focus of what students and staff at Sayre expressed as their desires.
Lastly, almost one-half of Sayre High School’s student body has an Individualized Education Plan (IEP), a federal program designed to address the needs of students experiencing severe mental health challenges or intellectual disability. We could not ignore that these students often experience trauma in an even harsher way than others, and the heat of the school and the area could only exacerbate this issue. We hopeed to complete this project alongside Sayre, not for them.
Steps to Engagement
Conducting outreach sessions at Sayre High School
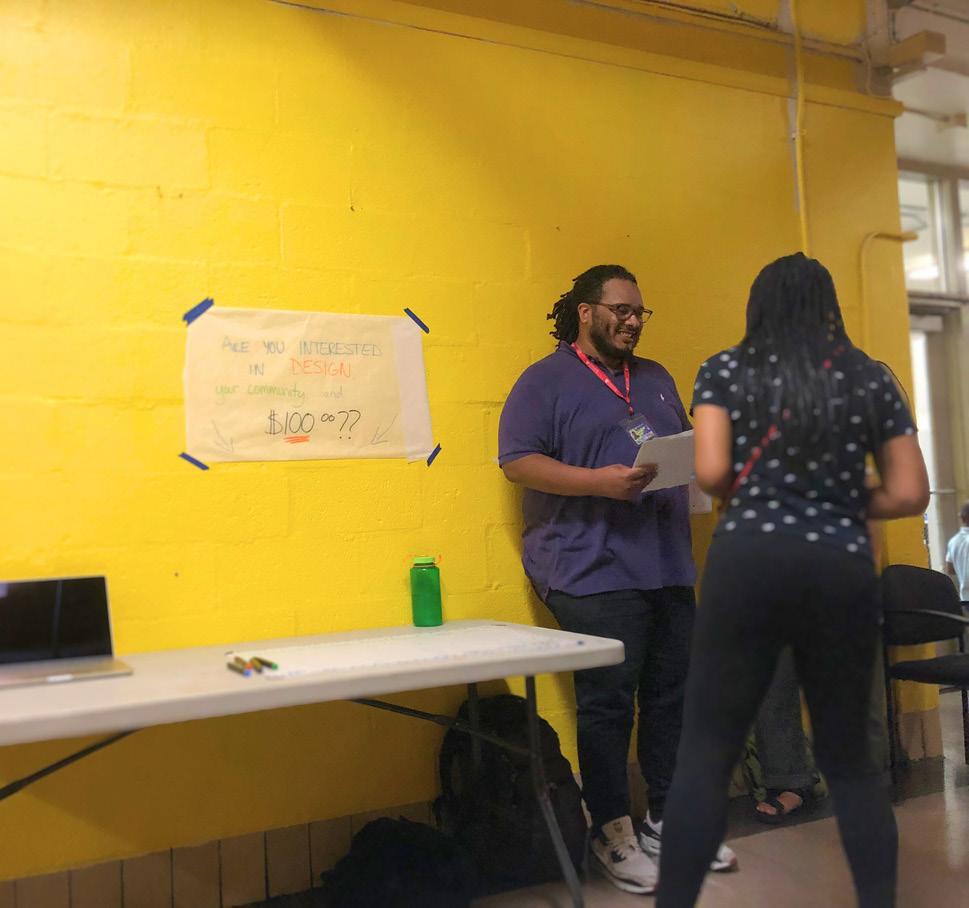
1. 2. 3. 4. Who do we need to engage? What are goals for engagement? How do we want to engage? What did we learn from engagment? TRAUMA-INFORMED PLANNING FOR SAYRE HIGH SCHOOL 224
Feedback from engagement
A key part of developing this guide was engaging with the people of Sayre High—students, teachers, administrators, and more. We needed to understand what the community thinks of their school and what they hope their school could be. This is only the beginning of the engagement with the Sayre – as the school-community plan progresses, planners should build upon what we’veheard to create a plan guided by the community itself.
Following is a summary of some of what we heard during our engagement process:
Feedback from Teachers & Administration
Challenges
Communication breakdown
Lack of teacher/ student morale
Limited staff capacity and space
Disaster-recovery fund
School Infrastructure Concerns
Safety and security concerns
Feedback from Students
Challenges
Students Feel Tired & Bored
Mixed Opinions of Teachers & Staff
Sports & CTE
Unavailable to 9th Graders
Few Affordable or Appealing Food Options
Class Schedules
Opportunities
Student Ambition & Entrepreneuralism
Available Classroom Space for Activities
Many Potential Community Partners
Invested Teachers & Staff
Opportunities
Close-Knit Student Community
Students Want Diverse Learning Opportunities
Students Want More Variety of Activities
Student Ambition & Entrepreneurialism
WHAT’S IN A FUTURE? 225 PANORAMA 2024
Recommendations
Our recommendations for Sayre are split into three categories that closely follow the received from out outreach, including for school infrastructure, staff support, and studewnt support. This strengths-based approach is inteded to build on what people love about Sayre to elevate the school and the community that suports it. TRAUMA-INFORMED
Recommendations for School Infrastructure
Create open space during non-school hours
Create space for student rest at school
Bus students to after school activities
Recommendations for Staff Support
Develop clear channels for internal communication
Hire additional staff to lead school programming
Build staff capacity for grant applications
Recommendations for Student Support
Improve school lunches & add more food options
Invest in school spirit (e.g. a yearbook, pep rallies)
More sports and arts activities
Invest in school beautification & sustainability
Increase variety of classes (music, languages, etc.)
226
PLANNING FOR SAYRE HIGH SCHOOL
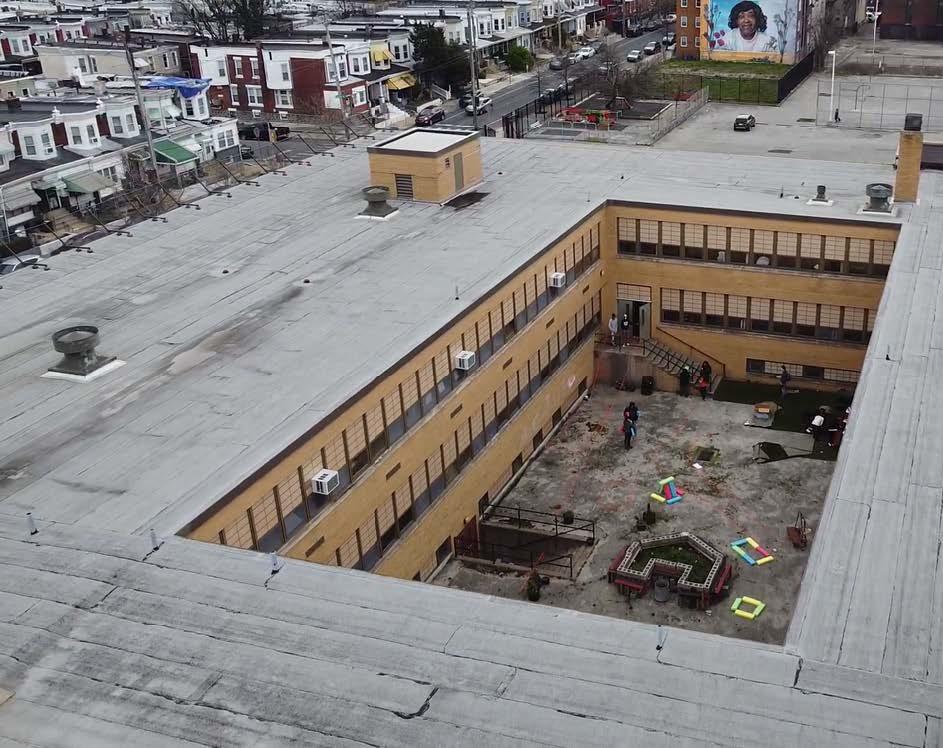
 Sayre courtyard (above) and school garden (below)
WHAT’S IN A FUTURE? 227
Endnotes 1 “100 Philadelphia Schools to Dismiss Early Tuesday, Wednesday Because of Extreme Heat,” August 30, 2022. 2 Anne McCormick, “Philadelphia Ski Mask Ban Becomes Law: What You Need to Know - WHYY,” December 15, 2023. 3 Huiting Xie, “Strengths-Based Approach for Mental Health Recovery,” Iranian Journal of Psychiatry and Behavioral Sciences 7, no. 2 (2013): 5–10.
PANORAMA 2024
Tu Fu,
an exile in Berlin, writes poetry some mornings in a small cafe
 by Nissim Lebovits
Because the body is a shard of bone-white porcelain, a man writes ‘Onion shoots on a cool spring morning.’
Writes ‘onion shoots’ and not ‘the night rain is an ache, this city a permanent bruise.’
As if the pen could resurrect, the windows be anything but an empty mirror. As if his hair weren’t a crisp image
of pain and lead his unending hymn. & the soles of his feet are still stricken with the dust of his north. & this city tries
daily to peel shut the skins of his eyes. Says surrender. Says submit.
Because the body is a house of exile, a man writes ‘Onion shoots on a cool spring morning.’
Poet’s Note:
Tu Fu, considered among the greatest of the classical Chinese poets, was forced into exile in the 8th century CE by what remains the bloodiest revolution in Chinese history. In this poem, I imagine him not in China, but a refugee in contemporary Berlin, subject to the convulsions of our century in which more than 1% of the world’s population is currently displaced. I was interested in exploring his sense of place: how this would be inflected by his uprootedness; how his real experiences of an unfamiliar city would map onto the imagined cities of literature; and whether, for him, literature would serve as an adequate homeland in exile—or only serve to emphasize the tragedies of homelessness.

About the Author
Nissim is a second-year MCP (‘24) from Philadelphia. He studies environmental planning and data at Weitzman and tries to make space for writing in his free time.
IN A FUTURE? 229 PANORAMA 2024
WHAT’S
What’s in a Name?
 by Claudia Schreier
Urban Renewal:
There are perhaps very few clothing companies more successful or synonymous with ever changing fashion trends than Urban Outfitters (UO). Started in 1970, the first store owned by the company was located in West Philadelphia, providing college students with an affordable option to shop for unique pieces. While UO has evolved over time to carry today’s popular trends and brands, the company has provided a continuous retail space for the young and the stylish. Nowadays, it’s at a relatively high price point. With shoppers continuing to prioritize sustainability in fashion, it’s now profitable to get into the resale market. Secondhand platforms like Depop, Vinted, and even eBay have exploded with vintage and secondhand resale in the last ten years, so it’s no wonder that UO is getting into the market. Aside from developing Nuuly, an online clothing rental and resale marketplace, UO has another secondhand resale label called “Urban Renewal.” 1 The label is “UO’s way of making old new again,” in which they source vintage or landfill-bound clothes and sell them, both in stores and online. 2
To some, the name Urban Renewal may be inspired by UO’s commitment to circular fashion, aiming to extend the life of pieces and keep them out of landfills, but Urban Renewal was not first used as a brand name or fashion term. Instead, it describes the practice of a top-down planning approach that changed the landscape of many American cities, including Philadelphia, by demolishing existing structures and redeveloping entire neighborhoods, pricing residents out and replacing mostly poor residents with wealthy ones.
The Legacy of Urban Renewal in Philadelphia
Urban Renewal has its roots in the post-WWII American city, where there was a nationwide program instituted to maintain cities and remove what was known as blight, a term usually attached to working class and Black communities. Planners and developers co-opted this term—originally used by botanists to describe various plant diseases—as a moving force that would transform what they saw as “healthy” communities into areas with crime and poverty. Planners used disease terminology to describe working-class Black and Brown communities, ultimately justifying3 people who lived in “redevelopment” areas.
In Philadelphia, the Society Hill Urban Renewal project is one of the first examples of such displacement. In the 1950s, the neighborhood was one of the poorest parts of the city. By 1970, after historic building renovation, demolition of other buildings, and new apartment construction, Society Hill was one of the most expensive and coveted parts of the city to live in.4 These efforts did not account for residents who suddenly could no longer afford to live in the area. While new apartments were built, including the Society Hill Towers, many of the properties were not affordable. Around one third of the original
IN A FUTURE?
WHAT’S
231 PANORAMA 2024
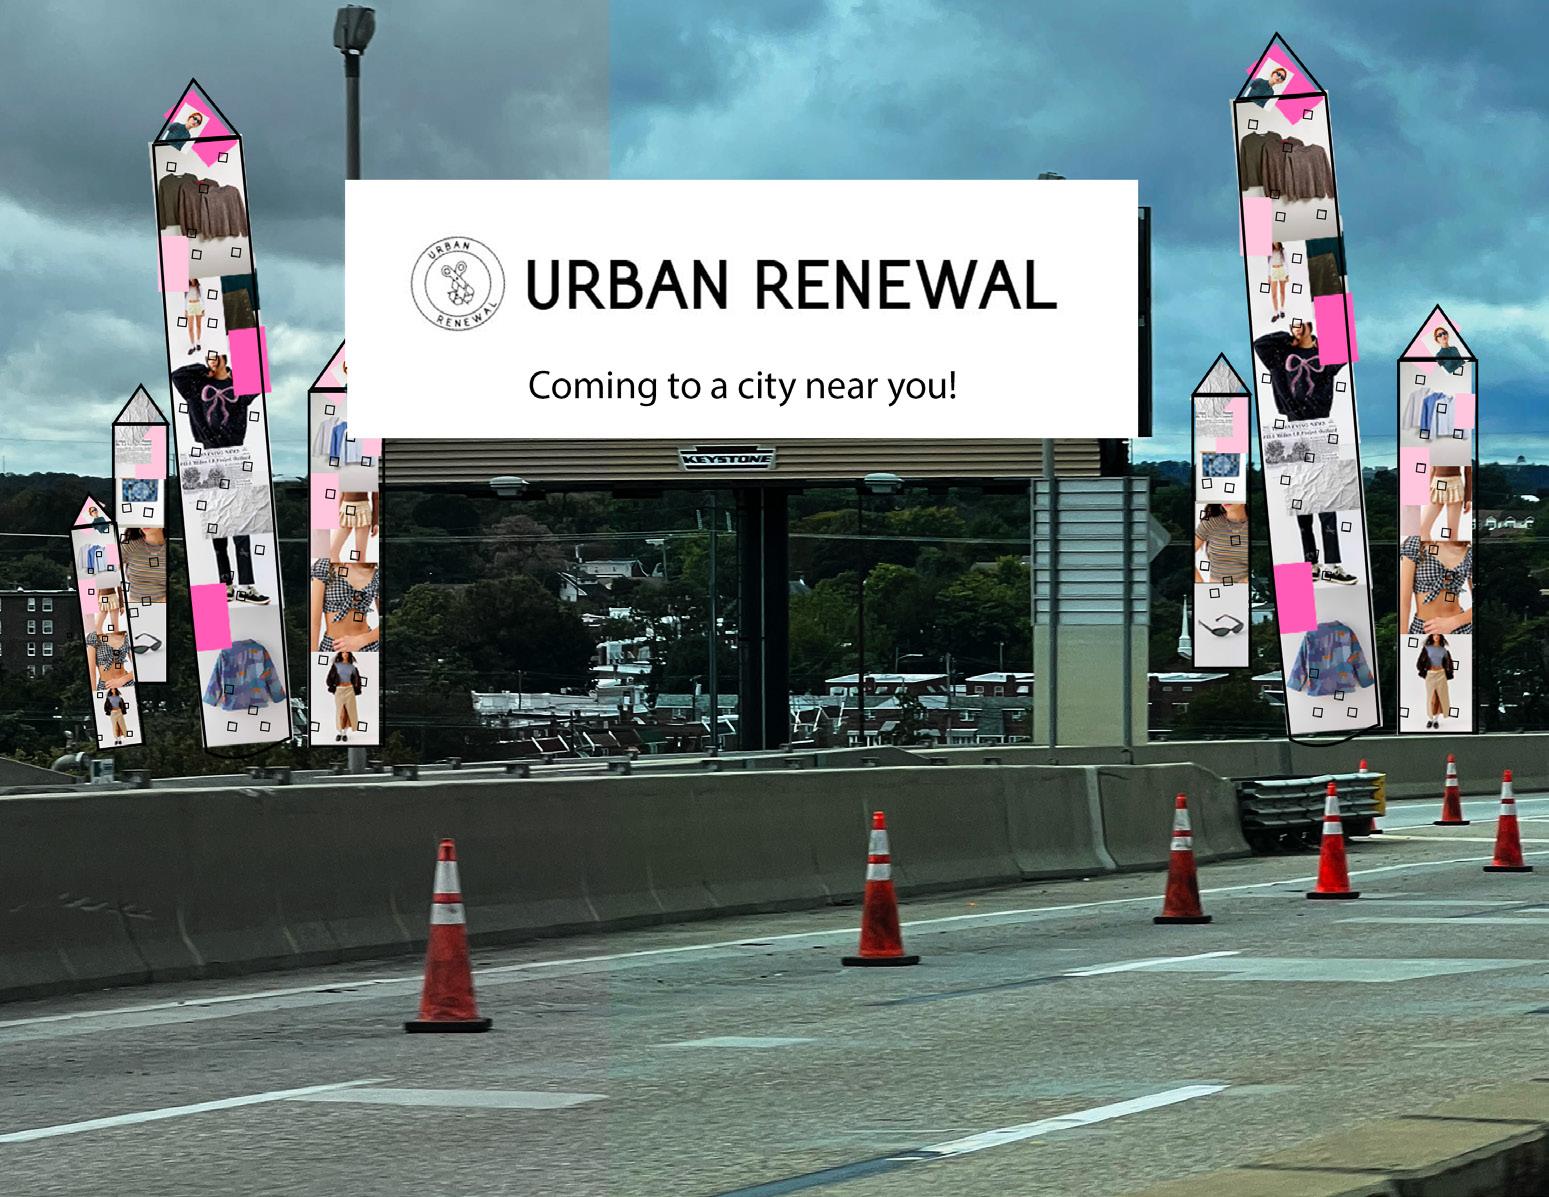
residents, predominantly Black and Eastern European, were displaced. Institutional expansion in West Philadelphia—led by a coalition of universities including Drexel, the University of Pennsylvania, and Penn Medicine—razed Philadelphia’s Black Bottom, a neighborhood that extended from 34th St to 40th St along Market.5 Using eminent domain and propelled by the Federal Housing Act of 1949, these institutions displaced as many as 5,000 residents from the Black Bottom, offering compensation that was well below market rate for owners and no relocation assistance to renters.6 The area was then rebranded as “University City,” created to serve students and members of these universities. Local shops were replaced with businesses that catered to students, including the original Urban Outfitters store, then called “Free People.”
The legacy of Urban Renewal in West Philadelphia impacts residents to this day, spurring an affordable housing crisis and continued displacement. The UC Townhomes—the only community benefit to come from agreements surrounding the development of University City—is one such example. After the landowner decided not to renew the contract that provided affordable 70
URBAN RENEWAL: WHAT’S IN A NAME? 232
High Fashion High Rises (Collage by Claudia Schreier.)
affordable housing units for 40 years, as well as a massive amount of activism and protesting surrounding the Townhomes, residents moved out and the building was slated to be demolished by the end of 2023.7
So what does Urban Outfitters have to do with this?
The resale process employed by the “Urban Renewal” label is ironically similar to renewal planning practices. For the label, the company says that each “garment is uncovered and sold in its original glory or remade into a totally unique look.” Thinking about the high prices of the “Urban Renewal” line, many shoppers cannot afford this type of secondhand, curated vintage shopping experience. This process is also not that different from a planning group leveling an area they deemed undesirable, building luxury apartments, and selling to rich, white families.
It’s also likely that UO benefitted from, and may not even exist without, Urban Renewal and university expansion. Their first physical store was built in 1970 and located in West Philadelphia at 43rd and Locust Streets, directly adjacent to the edge of the University of Pennsylvania campus and in the new University City neighborhood8. University expansion effectively razed the surrounding neighborhood up to 40th Street, but the effects extend farther than the edge of Penn’s campus. The expansion of Penn displaced thousands through eminent domain and increases in housing costs. This cleared the way for the rich, white student clientele to move in and shop at places like the original UO store.
Perhaps the name “Urban Renewal” is an indicator that UO is engaging in a new type of “thrift store gentrification.”9 According to the 2023 URBN Impact Scorecard, “Urban Renewal” recirculated over 50,000 pairs of denim and upcycled deadstock fabric into over 80,000 styles.10
While keeping pieces out of the landfill is good, the price of some of these pieces could be almost ten times the price of a similar item found in a local Goodwill. While shopping secondhand is a sustainable alternative to fast fashion, resellers online can make a huge profit for curating vintage, taking the digging-through-bins search out of thrifting. What was once $5 shirt at Goodwill is now a “vintage Y2K coquette fairycore” listing for $50 on Depop.
It’s also likely that UO benefitted from, and may not even exist without, Urban Renewal and university expansion.
This phenomenon of resellers buying cheaper secondhand and marking pieces up on vintage and resale sites leaves many shoppers, especially
FUTURE?
WHAT’S IN A
233 PANORAMA 2024
low-income shoppers, with limited options in the thrift store. Curated resale may be sourced from lower-priced thrift stores that rely on donations, and the market is not accessible to many at such a high price point. Of course there will always be a surplus of clothes in Goodwill donation centers, but as the curated market becomes more popular, those high-quality “good finds” that thrifters used to discover on the average trip to the store may be instead sourced to lines like “Urban Renewal.” This leaves the local Goodwill and Salvation Army racks littered with Shein and other fast-fashion.
Urban Renewal and “Urban Renewal”
UO is a company that is regularly trenched in scandal (ex. racist hiring policies, racist code words for suspected shoplifters, and numerous offensive apparel designs), but for a retail giant that has its roots in a small store in West Philadelphia, naming a label “Urban Renewal” is irresponsible and tone-deaf.11 Philadelphia is a city where today, thousands do not have access to permanent housing, and it is a city where gentrification makes home ownership and even renting an apartment unattainable for many. The name “Urban Renewal” could sting, a reminder of the collective loss that many Philadelphians have suffered for decades.
In the face of this housing crisis, critiquing a name for a clothing label might seem silly, but it’s a clear marker that the company is not thinking introspectively about their impact in this city, and certainly not when URBN’s portfolio is doing so well fiscally.12 Despite the steep prices, the “Urban Renewal” label could not be more successful. It’s gained popularity since it was introduced in the early 1980s, with consumer opinions about sustainability causing the market to explode. Additionally, with Gen Z becoming a dominant consumer base, thrifting and secondhand is more popular than ever. Jumping into the resale and curated vintage market has been a lucrative move for the company, as it is estimated that the US secondhand apparel market is going to be worth around $70 billion within the next couple of years, up from $39 billion in 2022. UO even opened up a new store in 2021 in Herald Square, New York City, carrying only vintage and upcycled clothes. Can you guess what it’s called?
URBAN RENEWAL: WHAT’S IN A NAME? 234
WHAT’S IN A FUTURE?
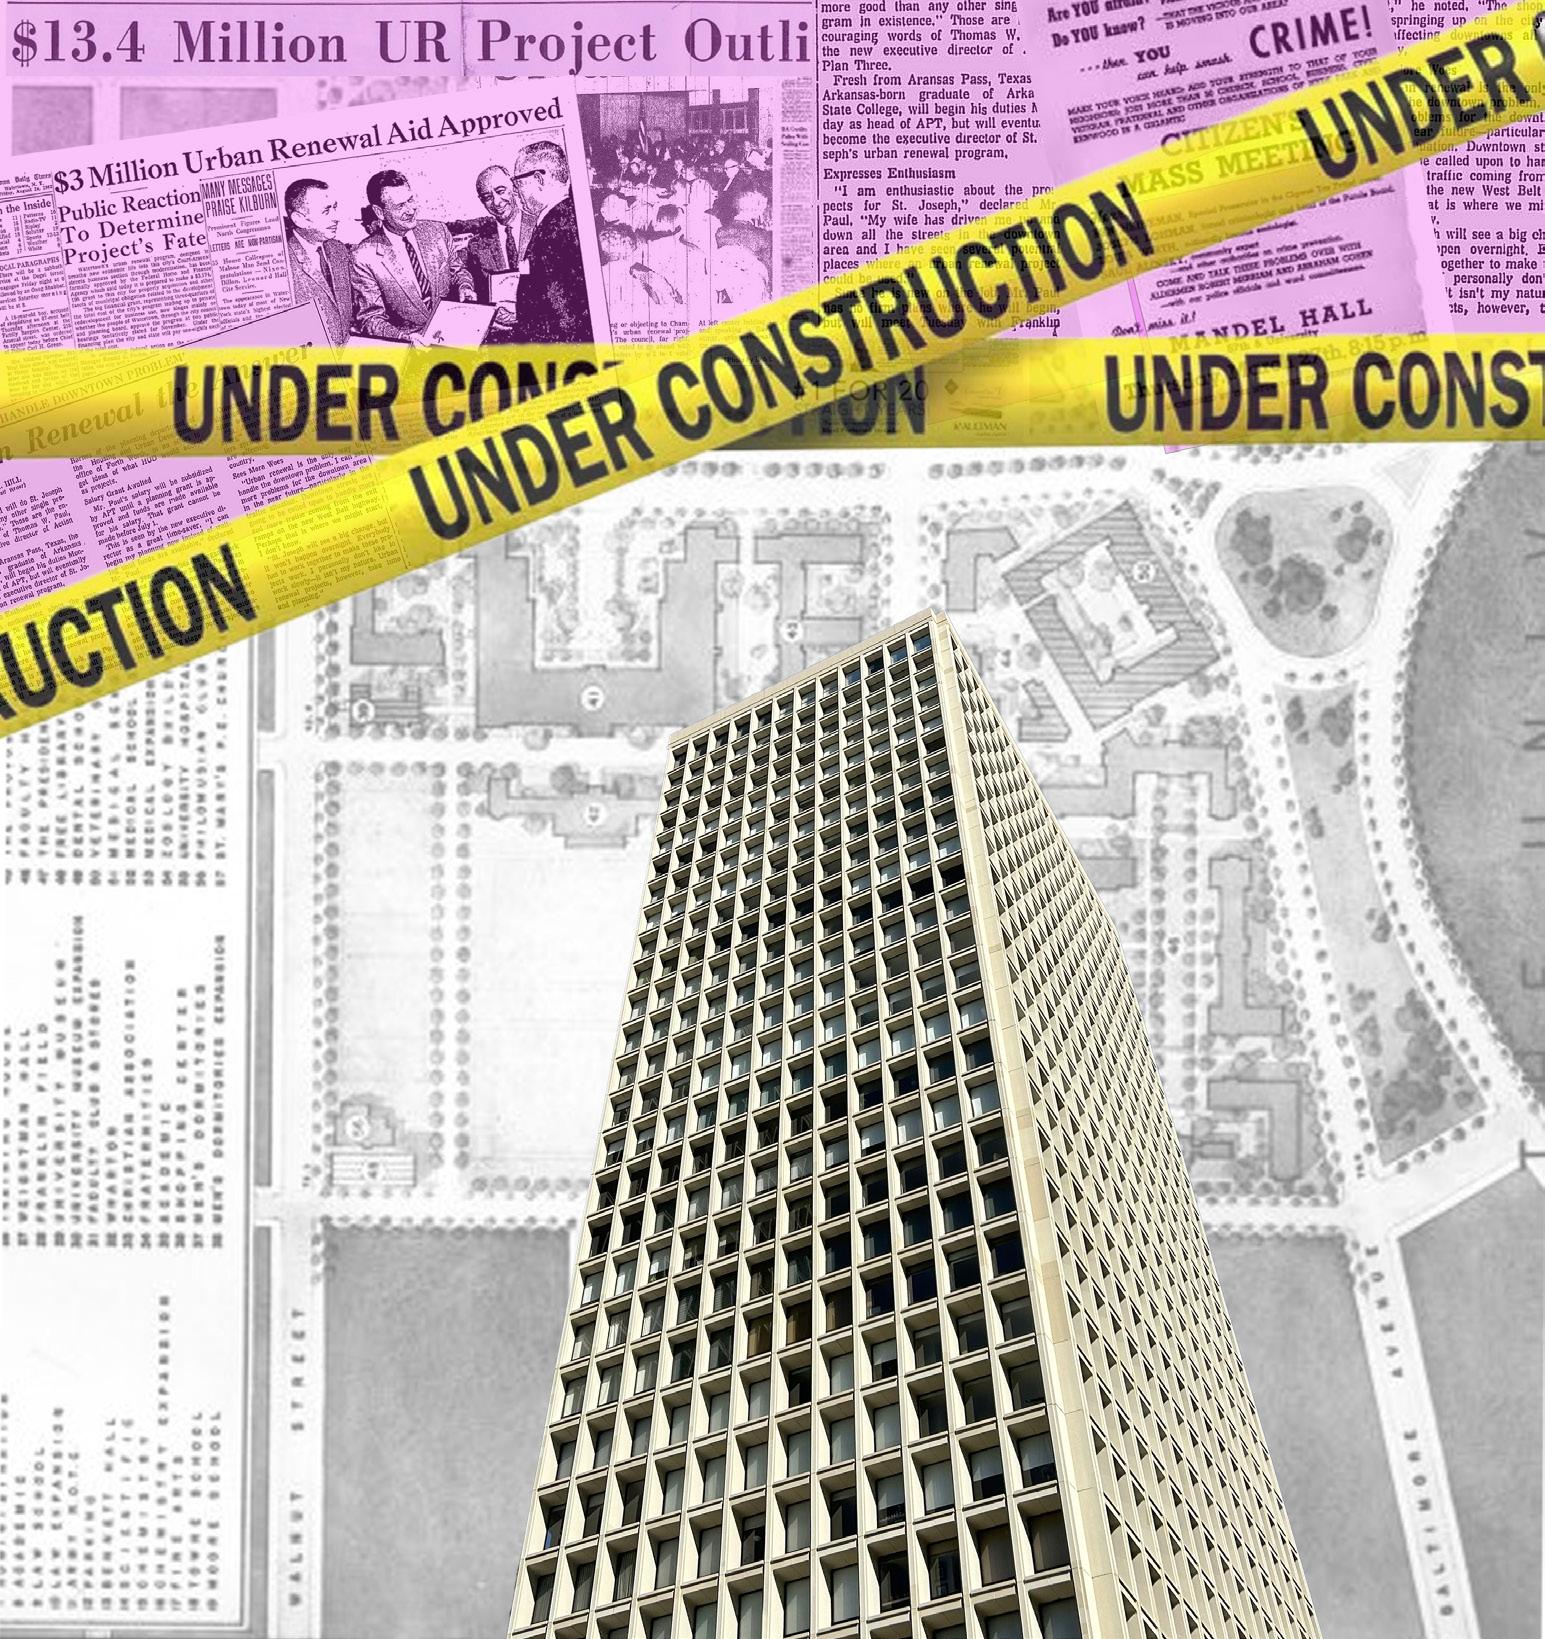
The expansion of Penn displaced thousands through eminent domain and increases in housing costs. This cleared the way for the rich, white student clientele to move in and shop at places like the original UO store.
235 PANORAMA 2024
Philadelphia’s Urban Renewal Legacy: Society Hill Towers and University Expansion Plans (Collage by Claudia Schreier)
Endnotes
1 “Clothing Rental + Resale Marketplace.” Nuuly.
2 “UO in Progress.” Urban Outfitters.
3 Moore, Justin Garrett. “Why We Need a New Word for ‘Blight.’” Medium, October 27, 2022.
4 Blumgart, Jake, and Jim Saksa. “From Slums to Sleek Towers: How Philly Became Cleaner, Safer, and More Unequal.” WHYY, March 12, 2018.
5 “Black Bottom.” SEGREGATION BY DESIGN.
6 Ibid.
7 Moselle, Aaron. “End of an ERA: West Philly’s UC Townhomes Slated for Demolition.” WHYY, November 9, 2023.
8 Tsai, Jasmine. “Urban Outfitters Founder Returns to Birthplace of Popular Chain.” The Daily Pennsylvanian, February 15, 2005.
9 Kornelija. “Depop Gentrification and the Middle-Class Superiority Complex.” Medium, December 10, 2020.
10 “2022–2023 Impact Scorecard.” URBN.
11 Wong, Venessa. “Black Women Who Worked at Anthropologie Describe a ‘Whitewashed’ Company That Made Them Feel Undervalued.” BuzzFeed News, June 24, 2020.
12 “Here’s Why Urban Outfitters (URBN) Is Thriving in the Industry.” Yahoo! Finance.

About the Author
Claudia Schreier (she/her) is a first-year Master of City Planning student with a focus in Smart Cities. Prior to coming to Penn, she worked in the clean tech and coastal resilience fields. Claudia is passionate about emerging technologies that promote equity and sustainability in the city. She holds a BS in Oceanography from the University of Delaware (Go Blue Hens!). Outside of school, Claudia is slowly completing her mission to enjoy a cold brew at every independent coffee shop in Philadelphia.
URBAN
IN A NAME? 236
RENEWAL: WHAT’S

WHAT’S IN A FUTURE?
237 PANORAMA 2024
Thrift store in Philadelphia (photo by Katie Hanford)
“Truth is a matter of the imagination”
—from The Left Hand of Darkness by Ursula K. LeGuin
WHAT’S IN A FUTURE?
