
Behavior Towards Environment (OCBE): Mediating Role of Workplace Spirituality (WPS) and Organizational NonEngagement-Destructive Method for Velocity Estimation of Small Caliber Projectile Behaviors of Precast Reinforced Concrete Drainage Pipes under Static Load Using Finite Element Model
Digital Medium as a Facilitator of Appliances Buying Decisions in NOIDA
A Study on Material Properties of Structural Light Weight Concrete with Micro-reinforcement
The Opinions of Parents in Choosing Tutorial Schools for Students in Samutsakhon Province in ImpactsThailandofTraining and Quality Culture on the Satisfaction of Patients and Administrative Staff: A Study in Saudi Arabia Public Hospitals
Green Cloud Computing and Environmental Impact Management for an IT Infrastructure A Workable Alternative for Achieving Sustainable Growth in the Service Industry for the Case of Youth owned Businesses in Kelantan Peninsula of Malaysia
Volume 13 Issue 6 (2022 ) ISSN 2228-9860 eISSN OrganizationalImpacthttp://TuEngr.comCODEN:1906-9642ITJEA8ofGreenHRMonCitizenship
Comparison of the Microbiota of the Reproductive Tract and the Mammary Gland of Cows with and without Inflammation Using 16S rRNA Sequencing Skin Disease Stratification based on Regression with Fuzzy C -mean Adversarial Tunicate Algorithm (RFAT)
Quality of Education in the Application of E-Learning in Vocational Education Secure IoT Architecture in Mobile Adhoc Network Against Malicious Attacks Using Blockchain-based InfluenceBATMAN of Varieties and Elicitors on Biomass and Bioactive Compound Yield of Centella Asiatica Growing in ThePathumthaniEffectof
Impacting Students’ Happiness of Higher Educational Institutio ns: A Comparative Analysis of Pre and During Pandemic Scenario
Social Capital and Competitive Advantage: Empirical Evidence from Travel and Tourism Industries in Saudi Arabia Morphokinetic Development Parameters of Cattle Pre-Implantation Embryos in vitro. Rapid Calculation of Well Productivity in Gas condensate PsychologicalReservoirs&Physical and Social Factors
The Integrating 3D Building with 3D GIS Platform for Facility Management Bromelain as a Potential Material in Future Chemotherapy: A Review
Implementation and Evaluation of an Optimal Algorithm for Neural Networks Association in Machine Learning


Professor Dr.Toshio YOSHII (EHIME University, JAPAN)
Board on Engineering, Technologies, and Applied Sciences:
Professor Dr. Chuen Sheng Cheng (Yuan Ze University, TAIWAN )
Emeritus Professor Dr.Mike Jenks (Oxford Brookes University, UNITED KINGDOM )
Scientific and Technical Committee & Editorial Review
Assistant Prof.Dr. Zoe D. Ziaka (International Hellenic University, GREECE)
©2 022 International Transaction Journal of Engineering, Management, & Applied Sciences & Technologies.
Editorial Board:
Professor Dr.Mikio SATOMURA (Shizuoka University, JAPAN)
International Editorial Board
Dr.Azusa FUKUSHIMA (Kobe Gakuin University, JAPAN)
Dr. Foong Swee Yeok (Universiti Sains Malaysia, MALAYSIA)
Dr.Arslan Khalid (Shandong University, CHINA )
Assistant Prof.Dr. Akeel Noori Abdul Hameed (University of Sharjah, UAE)
Assistant Prof.Dr. Rohit Srivastava (Indian Institute of Technology Bombay, INDIA)
Associate Prof. Dr. Truong V.B. Giang (Vietnam National University, Hanoi, VIETNAM)
Associate Prof. Dr Ahmad Abdulwahid Dhannoon (University of Mosul, IRAQ)
Assistant Prof. Dr.Muhammad Yar Khan (COMSATS University, PAKISTAN )
Editor in Chief Ahmad Sanusi Hassan, PhD UniversitiProfessor Sains Malaysia, MALAYSIA Executive Editor
Associate Prof. Dr. Fatemeh Khozaei (Islamic Azad University Kerman Branch, IRAN)
Dr. Mazran bin Ismail (Universiti Sains Malaysia, MALAYSIA)
Assistant Prof. Dr. David Kuria (Kimathi University College of Technology, KENYA)
International Transaction Journal of Engineering, Management, & Applied Sciences & Technologies
Associate Prof. Dr. Paulo Cesar Lima Segantine (University of São Paulo, BRASIL)
Professor Dr.Dewan Muhammad Nuruzzaman (University Malaysia Pahang MALAYSIA)
Associate Prof.Dr. Sillapaporn Srijunpetch (Thammasat University, THAILAND)
Dr.Viktor S. Kukhar (Ural State Agrarian University, Yekaterinburg, RUSSIA)
Boonsap Witchayangkoon, PhD Associate ThammasatProfessorUniversity, THAILAND
Professor Dr.Chuen-Sheng Cheng (Yuan Ze University, TAIWAN)
Professor Dr.Masato SAITOH (Saitama University, JAPAN)
Professor Dr.Hitoshi YAMADA (Yokohama National University, JAPAN)
Professor Dr.CH V K N S N Moorthy (Vasavi College of Engineering, INDIA)
Associate Prof. Dr. Kurt B. Wurm (New Mexico State University, USA)
Associate Prof.Dr. Junji SHIKATA (Yokohama National University, JAPAN)
Assoc. Prof. Dr. Mohamed Gadi (University of Nottingham, UNITED KINGDOM)
Professor Dr.Sergei Shlykov (Stavropol State Agrarian University, R USSIA)
Professor Dr.I Nyoman Pujawan (Sepuluh Nopember Institute of Technology, INDONESIA)
http://TuEngr.com
Professor Dr.Neven Duić (University of Zagreb, CROATIA)
Dr.Yasser Arab ( Dhofar University, OMAN )
Dr. Salahaddin Yasin Baper (Salahaddin University Hawler, IRAQ)


i 22 International Transaction Journal of Engineering, Management, & Applied Sciences & Technologies. :: International Transaction Journal of Engineering, Management, & Applied Sciences & Technologies Volume 13 Issue 6 (2022 ) ISSN 2228 9860 http://TuEngr.com eISSN 1906-9642 FEATURE PEER -REVIEWED ARTICLES Green Cloud Computing and Environmental Impact Management for an IT Infrastructure 13A6A A Workable Alternative for Achieving Sustainable Growth in the Service Industry for the Case of Youth-owned Businesses in Kelantan Peninsula of Malaysia 13A6B Comparison of the Microbiota of the Reproductive Tract and the Mammary Gland of Cows with and without Inflammation Using 16S rRNA Sequencing 13A6C Skin Disease Stratification based on Regression with Fuzzy Cmean Adversarial Tunicate Algorithm (RFAT) 13A6D Social Capital and Competitive Advantage: Empirical Evidence from Travel and Tourism Industries in Saudi Arabia 13A6E Morphokinetic Development Parameters of Cattle PreImplantation Embryos in vitro. 13A6F Rapid Calculation of Well Productivity in Gas-condensate Reservoirs 13A6G Psychological & Physical and Social Factors Impacting Students’ Happiness of Higher Educational Institutions: A Comparative Analysis of Pre and During Pandemic Scenario 13A6H The Integrating 3D Building with 3D GIS Platform for Facility Management 13A6I Bromelain as a Potential Material in Future Chemotherapy: A Review 13A6J Implementation and Evaluation of an Optimal Algorithm for Neural Networks Association in Machine Learning 13A6K The Opinions of Parents in Choosing Tutorial Schools for Students in Samutsakhon Province in Thailand 13A6L


Associate
Structural
The of
Effect
ii Impacts of Training and Quality Culture on the Satisfaction of Patients and Administrative Staff: A Study in Saudi Arabia Public Hospitals 13A6M Impact of Green HRM on Organizational Citizenship Behavior Towards Environment (OCBE): Mediating Role of Workplace Spirituality (WPS) and Organizational Engagement 13A6N Non-Destructive Method for Velocity Estimation of Small Caliber Projectile 13A6O Behaviors of Precast Reinforced Concrete Drainage Pipes under Static Load Using Finite Element Model 13A6P Quality of Education in the Application of E-Learning in Vocational Education 13A6Q Secure IoT Architecture in Mobile Ad-hoc Network Against Malicious Attacks Using Blockchain-based BATMAN 13A6R Influence of Varieties and Elicitors on Biomass and Bioactive Compound Yield of Centella Asiatica Growing in Pathumthani 13A6S
Micro-reinforcement 13A6U
Concrete
Editor
Digital Medium as a Facilitator of Appliances Buying Decisions in NOIDA 13A6T
A Study on Material Properties of Light Weight with ContactProfessors: Dr.Ahmad Sanusi Hassan (Editor-in- Chief), School of Housing, Building and Planning, UNIVERSITI SAINS MALAYSIA , 11800 Minden, Penang, MALAYSIA. Tel: +60- 4- 653-2835 Fax : +60- 4- 657 6523, Sanusi @ usm.my , @ TuEngr.com Professor Dr.Boonsap Witchayangkoon (Executive Editor) , Thammasat School of Engineering, THAMMASAT UNIVERSITY, Klong Luang, Pathumtani, 12120, THAILAND. Tel: +66 2 5643005 Ext 3101. Fax: +66 2 564 3022 DrBoonsap @ gmail.com, Editor @ TuEngr.com ManagingTUENGROfficeGroup, 88/244 Moo 3, Moo Baan Saransiri, Klong#2, KlongLuang, Pathumtani, 12120, THAILAND. Tel/WhatsApp: +66 995535450. Postal Paid in MALAYSIA /THAILAND. Side image s are Chil li Pepper s. For details: https://en.wikipedia.org/wiki/Chili_pepper


Green Cloud Computing and Environmental Impact Management for an IT Infrastructure
*Corresponding Authors (Email: ssylviagrace @gmail.com, drmeeragandhii @gmail.com).
Page | 1
Keywords: Carbon footprint; Green computing; Green information technology; Eco friendly enterprise; Green scheduling Abstract
©2022 International Transaction Journal of Engineering, Management, & Applied Sciences & Technologies ISSN 2228 9860 eISSN 1906 9642 CODEN:
Paper ID: 13A6A Volume 13 Issue 6 Received 15 January 2022 Received in revised form 23 April Accepted202229 April 2022 Available online 05 May 2022
ITJEA8
This study aims to make computers increasingly energy efficient as feasible and bring novel concepts to computer technology that deal with energy. Ecofriendly information technology (IT) is expected to quickly become a fact and an authorised government structure. As a result, green IT is interested in the complete development of individuals and the community as a whole, rather than only environmental policies. The c ollaboration will be investigated in this area in order to maximise profitability. The significance of green computing for IT, infrastructure, enterprises, and organizations is investigated in this work. Disciplinary: Carbon Footprint , Green Computing , Green Information, Green Economy.
©2022 INT TRANS J ENG MANAG SCI TECH. Cite This Article: Grace J. S., and Meeragandhi, G. (2022). Green Cloud Computing and Environmental Impact Management for an IT Infrastructure. International Transaction Journal of Engineering, Management, & Applied Sciences & Technologies, 13(6), 13A6A, 1 8 http://TUENGR.COM/V13/13A6A.pdf DOI: 10.14456/ITJEMAST.2022.106
1 Introduction
J Sylvia Grace1*, G Meeragandhi1* 1 Department of CSE, Sathyabama Institute of Science and Technology, Chennai 119, INDIA.
Sotheby green IT offers significant advantages in terms of enhancing organisational efficiency, particularly regarding waste minimization, improved production pace, and extra sustainable use of natural resources. It sets a new tie in between the environment and the going effort and needs of the business. Murugesan [32] and Lamb [33] have characterised green IT in different ways. Green IT, according to Murugesan [32], is "the examination of core design practices, which encompass not only the manufacture and usage of computer peripherals and equipment, as well as the removal of data processing equipment and facilities which including computer displays, printers, CPUs, and certain other parts." It fundamentally seeks to maintain almost no environmental impact, either directly or indirectly, through following sustainable development and conservation ideals. Carbon efficiency is a hot topic in green IT, especially from the standpoint of International Transaction Journal of Engineering, Management, & Applied Sciences & Technologies http://TuEngr.com


Green IT plans include corrective actions including substituting displays with green displays, repurposing IT infrastructure, re engineering operating methods, and disposing of unwanted IT equipment. Among the other projects are incorporating marketing compliance into the workplace, constructing a massive business infrastructure, utilizing green power, blending nanocomposites in green computing, increasing biomimicry, eventually, driving global legislation.
http://TuEngr.com Page | 2 business strategy. The second portion of this article delves into green business issues like administration, practices, infrastructure, analytics, and analytics.
Green IT techniques are classified into two types: active and passive, all of which significantly reduce carbon emissions. Aggressive IT plans include identifying, determining, and enrolling elements that aid in the transformation of the IT industry together into greener framework. Holistic approaches seek for and implement ecologically acceptable business models, thus they passionately embrace transnational economic marketplaces, globalisation, and sustainable green economies. The main disadvantage of proactive methods is that they influence the IT industry's personnel, equipment, and infrastructure by bringing about quick, unanticipated changes. Reactive tactics, on the o ther hand, entail implementing the required modifications as soon as possible in response to external green impacts. To reduce carbon emissions, the IT industry, for example, must follow the government's norms and regulations. Changes based on client requests, freelancing, and competitive challenges are all part of a proactive strategy. The green IT industry is made up of both active and passive components.
Profiting at the expense of the environment is not an option because it pertains to no individual organization or system, and mindful ethical behavior should be addressed. As Yousif [31] points out, "real collaboration between programmers, politicians, scientists, industrialists, and clients is essential to achieve greener smart technolo gy (ICT)." Furthermore, the emphasis of the dispute has switched in recent years to climate variability and its consequences. The emphasis here, on the other hand, is on ecologically fair trade based on the conventional patterns that "a positive synergisti c, by inference, is an ecologically sustainable firm." When it comes to enhancing company efficiency and effectiveness, low energy consumption is the priority. In terms of quality, a smart data hub, for instance, minimizes operational expenses while still being environmentally beneficial. Aside from lowering carbon pollution, adopting green a company needs an assessment of critical physical property and equipment, infrastructure, furnishing, and administrative equipment. To improve company efficiency, standard business practises, transparency, analytics, enterprise solutions, tools, data stores, technology, and other elements are all used.
Cloud services, which are at the core of an information technology (IT) business, use a lot of brown energy. A cloud service can use anything from ten to one hundred megawatts of electricity, not to mention additional operational costs. Brown energy can be replaced with green energy to solve the situation. Energy from the wind The location of data centres [1] is crucial to increasing green energy usage. Wu et al. [1] proposed two solutions to the challenge of brown energy usage
2 Lit e rature Review
http://TuEngr.com Page | 3 against cloud networking expenses in data centre deployment. A green data centre (GDC) is difficult to design [2]. This same Internet of Things (IoT) is indeed a rapidly expanding industry that connects intelligent objects that converse to each other and consume a significant amount of energy. The problems of a green IoT were highlighted by Arshad et al. [3], as well as the design solutions employed to limit energy consumption between IoT devices. The information, application, and control surfaces were detached in the recommended SD EHN paradigm for continuous improvements, culminating in green energy usage throughout 5G networks. Siddiqui et al. [5] developed a knowledge based usage technique to prolong the life of edge devices while reducing energy consumption. Conti et al. [6] employed a retraining learner based strategy to determine the network initiation policy which reflected in the fewest job losses. The value of optimising battery management was also emphasized. Several businesses now sell their services via GDCs. In green energy activities, however, GDCs confront practical obstacles like temporal changes, grid pricing, and delay constraints. Yuan et al. [7] demonstrated a time aware task scheduling sensor that monitors temporal variations and organises all accepted assignments. A modelling theorem for job denial and execution rates was also devised. Szymanski and colleagues [8] Multimodal IoT and an app collaborative data stream were presented for exceptional results, cyber espionage, and confidentiality in an environmentally friendly setting. Fraternali and colleagues [9]evaluated the performance of Eurora, a fully functioning next generation ultragreen supercomputer, under a variety of workloads. Three different types of sensor clouds were presented by Zhu et al. [10] to incorporate huge amounts of data in a green environment. PSC, ASC, as well as SSC, are surveillance and control that sense, transmit, as well as share huge amounts of data, in that order. Tang et al. [11] examined the benefits of employing C RAN within the cloud and reviewed new strategies for obtaining a greener and more flexible C RAN. Yang and Chien [12] used three data centre overall price of ownership models to analyse cost effectiveness and proposed a new technique for rendering computations more affordable. Zhang et al. [13] suggested a novel energy efficient green Wi Fi management architecture. Customers may migrate to that same access point for reduced total energy usage, according to their suggested reinforcement learning aided uplink self management algorithm. Xu and colleagues. [14] suggested a secure methodology for delivering secure information to edge nodes, reducing energy usage in green cities. Canali et al. [15] presented a novel pricing structure termed collaboration computing, data exchange, and migratory energy to cut pollution in a software defined datacenter (JCDME). When allocating virtual content, their model is used to determine energy consumption while accounting for processing and transfer costs. Hou et al. [16] suggested a greener resistance to extreme virtual network embedding strategy enabling participative edge computing for green areas. Lyu et al. [17] presented an innovative paradigm that combines cloud computing, edge technologies, and the Internet of ThingsTheir lightweight demand and admission system addresses scaling c hallenges in mobile edge computing while also meeting latency and energy consumption criteria in IoT devices. Between 2006 and 2014, Zhang et al. [18] used the DEA Malmquist approach to assess green productive efficiency across
Chinese food firms to propose an ecological sustainability configuration for the food processing industry. Mobile edge computing [19] was applied in virtual cellular systems using machine to machine interaction for decreased energy usage and efficient computer resource allocation. A cloud network infrastructure design was proposed [20] that results in effective cognitive broadcasting sharing and reuse, leading to low brown energy utilization.
3 Green IT Storage facilities for data Human intervention, whether acknowledged or unnoticed, has an effect on the environment, which would be hurt in the process of building a profitable business. The effects of digital could be seen all around us. Computers within schools and hospitals, as well as household gadgets, are becoming more common, as is the usage of social media or blogging, as well as Global positioning in automobiles. Modern tech has always been a huge success. In clustering big groups of people together Technology and overhauling are indeed part of a holistic green IT strategy. Processes, and encourages people to have a positive, environmentally conscious mindset. Green IT seeks to examine and resolve challenges in these areas. Green IT is governed either by the primary idea of monetary, ecological, and social balance. Green IT plans, regulations, and aspects into account and alter from organisation to organisation. Green IT is proactive, connecting individuals together over a mutual goal that creates wealth and humanity while reducing environmental impact. processes and encourages individuals to have a positive, environmentally conscious mindset. Green IT aims to investigate and address issues in these areas. Companies that adopt policies that are in line with climate change, according to the Harvard Business Review, stand to benefit from more opportunities and profits than the majority. This strategy has nothing to do with feeling good or complying with regulations; rather, it is directly tied to stock exchange share prices. Similarly, purchasing, leasing, or carrying out major transactions in accordance with environmental conservation guidelines generates additional revenues following are some of the specific ways that a comprehensive green IT strategy can help businesses: 1) Investing in energy saving devices; 2) Utilise the most advanced power management technology practices; 3) Looking into ways to improve green performance to find out what works and what does not. provide new commercial possibilities; 4) Consolidating servers utilising virtualization technologies; 5) Improving the design of data centers; 6) Using thin clients to save electricity on the GPU; 7) Methods and supplies for recycling. 8) Minimizing the amount of paper used; 9) Encouraging people to work from home.
http://TuEngr.com Page | 4
Table 1 : Major environmental impacts
Measures and Stats New key performance indicators (KPIs) will be used to evaluate carbon related outcomes.
Communication devices With the increasing amount of transactions, the number and use of numerous pieces of technology that are fundamental aspects of datacentres grows. Architecture More devices necessitate greater infrastructures and space for storage.
The following are some of the technical and social hurdles that a low carbon economy must overcome:1)The subjective nature of greener IT, which is truly context dependent, as well as the extent of a person's self confidence;
Servers in data centres A ser ver inside a data centre is fundamentally a virtual server that manages computing workloads.
Going green means acting on data in order that coming generations would have enough resources to dwell in comfort which is at least as good as, if not better than, that of the current generation. Making the most of a company's IT resources is essential for environmental
3.1 The Green Vision of Information Technology and the Green Economy
5) Uncertainty caused by a multitude of catalysts and regulatory regimes;
3)The deficiency of methods employed and assessments;
2) The qualitative nature of ecofriendly IT, which is open to interpretation, as well as the extent of a person's motives;
http://TuEngr.com Page | 5
A green vision is a comprehensive worldwide strategic vision for green businesses. Greening the business and visualising improvements in its operations, as well as analysing the cost of implementation, are all part of this objective. All employees, from fr eshmen to the CEO, can affect these changes, and they must, by necessity, engage everyone, especially when it comes to ideas and panel discussions Clients must also show a willingness to adapt. No trend line can accurately describe an organization's operational behaviour, which resembles a curve with behaviour highs and lows, particularly when it comes to cutting emissions. Strategic priorities for the smooth completion of green firms must be developed, adopted, executed, and completed, as well as obstacles handled. Different departments in a typical organisation, for example, deal with the stress and strain of increased work and responsibility. These stress areas can be identified, and ways for resolving them in the form of business issues can be establishe d with the organization's greening. Carbon reduction is more of a shift in people's attitudes than it is the sole responsibility entity or society. Such a transition is often represented in action, and it is strongly tied to concomitant alterations in practises and ideals.
4 Result a nd Discussion
4) The lack of understanding of the driving forces behind the green movement;
Risk administration Deals with the hazards involved with not managing emissions.
IT Scope: Significant environmental variables Devices for end user A vast share of hardware components collaborates quickly.
6) The absence of foresight upon this role of carbon emissions related to employees.
http://TuEngr.com Page | 6 sustainability. End user optimization, resource utilisation, virtualization, and CEMS installation are all part of this. The study of producing sustainable IT truly smart by offering resource s in order to grasp and adapt to events is known as environmental intelligence. To make the network more secure, it concentrates on deep learning, intelligent systems, and machine learning. Table 2: Analysis of My Carbon Footprint . Equipment Mode Power(Watts) Wii Console off 1 standby 8.50 Game 15 Laptop I Idle+ON 27 ON+Busy 46.0 Mobile Charging 3 Electri Equipment Charger ON+Busy 34 PC I ON+Busy 128 Monitor 53 Laptop II Idle+ON 29 ON+Busy 49 PC II Idle+ON 152 Monitor 62 TV OFF 1.1 ON+Busy 427 Washing Machine ON+Busy 568 AC ON+Busy 900 Microwave Idle+ON 4.30 ON+Busy 1269 Table 3: Consumption of energy during software development Power Consumer Software Team Control Card Fan Electric Moter Industrial Application Power Consumption per faculty(W) Development :2500 4 1000 <1000 Support:1500 Possible power saving per faculty(%) 65 1 80 10 60 Power consumption for developmentyear(KW/Yr)per 3.5 0.9 0.4 0.6 0.7 Power consumption for operation year(KW/Yr)per 2.9 450 250 90000 <90000 Total consumptionpoweroveryears(KW/Yr)1+10 32.8 4500 25000 950000 <950000 Normalized consumptionpower(%) Negligible <0.8 <0.8 90 <Electric motor 5 Conclusion This article has discussed the functioning of greener IT firms that are environmentally friendly and reduce carbon emissions & freight costs. Green computing aims to reduce the environmental impact of computers by reducing contaminants in the atmosphere, water, and land. This section also looks at a person's carbon footprint as well as a computing center's carbon impact. 6 Availab ility o f Data and Material By contacting the respective authors, data can be made available.
[3] R. Arshad, S. Zahoor, M. A. Shah, A. Wahid, and H. Yu, “Green IoT: An investigation on energy saving practices for 2020 and beyond,” IEEE Access, vol. 5, pp. 15667 15681, 2017.
[15] W. Hou, Z. Ning, and L. Guo, “Green survivable collaborative edge computing in smart cities,” IEEE Trans. Ind. Informat., vol. 14, no. 4, pp. 1594 1605, 2018.
[17] J. Zhang, X. Qu, and A. K. Sangaiah, “A study of green development mode and total factor productivity of the food industry based on the industrial Internet of Things,” IEEE Commun. Mag., vol. 56, no. 5, pp. 72 78, [18]2018.M.
[2] P. Sharma, P. Pegus II, D. Irwin, P. Shenoy, J. Goodhue, and J. Culbert, “Design and operational analysis of a green data center,” IEEE Internet Comput., vol. 21, no. 4, pp. 16 24, 2017.
[19] D. Zeng, J. Zhang, L. Gu, S. Guo, and J. Luo, “Energy efficient coordinated multipoint scheduling in green cloud radio access network,” IEEE Trans. Veh. Technol., vol. 67, no. 10, pp. 9922 9930, 2018.
http://TuEngr.com Page | 7 7 References
[11] F. Yang and A. A. Chien, “Large scale and extreme scale computing with stranded green power: Opportunities and costs,” IEEE Trans. Parallel Distrib. Syst., vol. 29, no. 5, pp. 1103 1116, 2018.
[1] Y. Wu, M. Tornatore, S. Ferdousi, and B. Mukherjee, “Green data center placement in optical cloud networks,” IEEE Trans. Green Commun. Netw., vol. 1, no. 3, pp. 347 357, 2017.
[9] C. Zhu, H. Zhou, C. M. V. Leung, K. Wang, Y. Zhang, and T. L. Yang, “Toward big data in green city,” IEEE Commun. Mag., vol. 17, no. 11, pp. 14 18, 2017.
Li, F. R. Yu, P. Si, and Y. Zhang, “Green machine to machine communications with mobile edge computing and wireless network virtualization,” IEEE Commun. Mag., vol. 56, no. 5, pp. 148 154, 2018.
[8] F. Fraternali, A. Bartolini, C. Cavazzoni, and L. Benini, “Quantifying the impact of variability and heterogeneity on the energy efficiency for a next generation ultra green supercomputer,” IEEE Trans. Parallel Distrib. Syst., vol. 29, no. 7, pp. 1575 1588, 2018.
[6] S. Conti, G. Faraci, R. Nicolosi, S. A. Rizzo, and G. Schembra, “Battery management in a green fog computing node: A reinforcement learning approach,” IEEE Access, vol. 5, pp. 21126 21138, 2017.
[5] F. Siddiqui, S. U. J. Lee, A. Abbas, and A. K. Bashir, “Optimizing lifespan and energy consumption by smart meters in green cloud based smart grids,” IEEE Access, vol. 5, pp. 20934 20945, 2017.
[4] X. Huang et al., “Software defined energy harvesting networking for 5G green communications,” IEEE Wireless Commun., vol. 24, no. 4, pp. 38 45, Aug. 2017.
[7] H. Yuan, J. Bi, M. Zhou, and A. C. Ammari, “Time aware multi application task scheduling with guaranteed delay constraints in green data center,” IEEE Trans. Autom. Sci. Eng., vol.15, no.3, pp. 1138 1151, 2018.
[12] Y. Zhang, C. Jiang, J. Wang, Z. Han, J. Yuan, and J. Cao, “Green Wi Fi implementation and management in dense autonomous environments for smart cities,” IEEE Trans. Ind. Informat., vol. 14, no. 4, pp. 1552 1563, [13]2018.Q. Xu, Z. Su, Q. Zheng, M. Luo, and B. Dong, “Secure content delivery with edge nodes to save caching resources for mobile users in green cities,” IEEE Trans. Ind. Informat., vol. 14, no. 6, pp. 2550 2559, 2018.
[14] C. Canali, L. Chiaraviglio, R. Lancellotti, and M. Shojafar, “Joint minimization of the energy costs from computing, data transmission, and migrations in cloud data centers,” IEEE Trans. Green Commun. Netw., vol. 2, no. 2, pp. 580 595, 2018.
[16] X. Lyu et al., “Selective offloading in mobile edge computing for the green Internet of Things,” IEEE Netw., vol. 32, no. 1, pp. 54 60, 2018.
[20] D. Cheng, C. Jiang, and X. Zhou, “Heterogeneity aware workload management in distributed sustainable datacenters,” in Proc. 28th Int. Conf. Parallel Distrib. Process. Symp., vol. 14, no. 8, pp.1 10, 2014
[10] J. Tang, R. Wen, T. Q. S. Quek, and M. Peng, “Fully exploiting cloud computing to achieve a green and flexible C RAN,” IEEE Commun. Mag., vol. 55, no. 11, pp. 40 46, 2017.
[22] G. Li, D. Zhang, Y. Li, and K. Li, “Toward energy efficiency optimiza tion of pktgen DPDK for green network testbeds,” China Commun., vol. 15, no. 11, pp. 199 207, 2018.
[31] S. Murugesan, “Harnessing green IT: Principles and practices,” IT Prof., vol. 10, no. 1, pp. 24 33, 2008.
[29] K. Sierszecki, T. Mikkonen, M. Steffens, T. Fogdal, and J. Savolainen, “Green software: Greening what and how much?” IEEE Softw., vol. 31, no. 3, pp. 64 68, 2014.
Sylvia Grace J is a Research Scholar, Department of CSE, Sathyabama Institute of Science and Technology,Chennai 119, India. She got her Master’s in Computer science and Engineering. Her researches are Cloud Computing, Linguistic Computing, Green Clouds and Greener Technologies Dr.Meeragandhi G is a Professor, Department of CSE, Sathyabama Institute of Science and Technology, Chennai 119, India. She got her Master’s and PhD degrees in Computer Science and Engineering. Her research focuses on Cloud computing, Network security and Artificial Intelligence
[26] R. Y. Zhang and J. K. White, “Toeplitz plus Hankel matrix recovery for Green’s function computations on general substrates,” Proc. IEEE , vol. 103, no. 11, pp.1970 1984, 2015.
[32] J. Lamb, Greening of IT: How Companies Can Make a Difference for the Environment. Lebanob, IN, USA: IBM Press, 2009. [33] J. Lash and F. Wellington, “Competitive advantage on a warming planet,” Harvard Bus. Rev., vol. 1, pp. 95 102, Mar. 2007.
[21] J. Mi, K. Wang, P. Li, S. Guo, and Y. Sun, “Software defined green 5G system for big data,” IEEE Commun. Mag., vol. 56, no. 11, pp. 116 123, 2018.
http://TuEngr.com Page | 8
[28] K. W. Cameron, “My IT carbon footprint,” Computer, vol. 42, no. 11, pp.99 101, 2009.
[34] J. C. Moody and B. Nogrady, The Sixth Wave. Sydney, NSW, Australia: Random House Australia, 2010.
[23] Z. Ning, X. Kong, F. Xia, W. Hou, and X. Wang, “Green and sus tainable cloud of things: Enabling collaborative edge computing,” IEEE Commun. Mag., vol. 57, no. 1, pp. 72 78, 2019.
[25] S. Sarkar and S. Misra, “Theoretical modelling of fog computing: A green computing paradigm to support IoT applications,” IET Netw., vol. 5, no. 2, pp. 23 39, 2016.
[30] Y. Yousif and M. Keynote, “Towards green ICT,” in European Research Consortium for Informatics and Mathematics News ERCIM, vol. 79. Dublin, Republic of Ireland: The Economic and Social Research Insti tute, 2009, pp. 3 4.
[27] B. Unhelkar, Green IT Strategies and Applications: Using Environmental Intelligence, 1st Ed , Boca Raton, FL, USA: CRC Press, 2011.
[24] Karmokar and A. Anpalagan, “Green computing and communication techniques for future wireless systems and networks,” IEEE Potentials, vol. 32, no. 4, pp. 38 42, 2013.


Abstract As part of the study's primary goal, it looked to examine the Malaysian youth's decision making process when it comes to deciding which service sector businesses to pursue. Participants in the study ranged in age from 20 to 30 years old and lived in the Malaysian state of Kelantan. It is the goal of the research to identify the jobs that Kelantan's young people are interested in and to present them with a variety of possibilities in the service sectors. HI Hospitality Fast Foods & restaurants, TI Textile industries, BC beauty clinics, and SB sustainability were the focus of the study. To collect the information, we used a Likert Scale to rate the youngsters. The Smart PLS SEM model was used to evaluate the variables in the data. Hotels, textiles, and beauty salons are chosen to be the most important independent variables for the steady growth of the economy, according to this study's findings Disciplinary: Entrepreneurship and Business.
©2022 INT TRANS J ENG MANAG SCI TECH. Cite This Article: Uthamaputhran, S., Thoti, K.K., Zaato, S.G., Hasan, H.B., Isa, Y.Z.B.M. (2022). A Workable Alternative for Achieving Sustainable Growth in the Service Industry for the Case of Youth owned Businesses in Kelantan Peninsula of Malaysia. International Transaction Journal of Engineering, Management, & Applied Sciences & Technologies, 13(6), 13A6B, 1 11. http://TUENGR.COM/V13/13A6B.pdf DOI: 10.14456/ITJEMAST.2022.107
Keywords: Economics; SectormanagementBusiness;Service;Socialmediafear
1 Introduc tion Retail commerce was rising the growth by.8 percent in 2019 and 0.8% in 2020. Convenience store growth in 2019 is accountable for the Ministry of Finance's (MoF) forecast of growth in 2020. The development of 5G technology will increase competition, improve coverage, and improve network quality for home internet services. When it comes to taking part in IR4.0, Malaysia will be more prepared to exploit modern technologies such as AI, robotics, virtual reality, big data, the International Transaction Journal of Engineering, Management, & Applied Sciences & http://TuEngr.comTechnologies
Page | 1 ©2022 International Transaction Journal of Engineering, Management, & Applied Sciences & Technologies ISSN 2228 9860 eISSN 1906 9642 CODEN: ITJEA8 A Workable Alternative for Achieving Sustainable Growth in the Service Industry for the Case of Youth-owned Businesses in Kelantan Peninsula of Malaysia
Sathiswaran Uthamaputhran1* , Kiran Kumar Thoti1*, Solomon Gbene Zaato1, Hazriah Binti Hasan1, Yusrinadini Zahirah Binti Md. Isa1 of Entrepreneurship and Business (FEB), Universiti Malaysia Kelantan, MALAYSIA. Corresponding Authors (Email: sathiswaran@umk.edu.my, kiran.kt@umk.edu.my, 3solomon.gz@umk.edu.my). ID: 13A6B Volume 13 Issue 6 Received 23 December 2021 Received in revised form 20 April Accepted202227 April 2022 online 05 May 2022
1Faculty
Paper
Available

http://TuEngr.com Page | 2
Internet of Things, and software engineering to their fullest potential. The demand for construction related services, such as those for the East Coast Rail Link (ECRL) and Bandar Malaysia. By focusing on three major sectors, the Economic Planning Unit today unveiled its 12th Malaysia Plan (2021 2025), which sets out the government's goals for the country's economic growth. " The six least developed states would receive a minimum of 50% of the Total Basic Development Expenditure. Government agencies will cooperate more closely to ensure that specific programs and development efforts are as effective as possible. It is possible to bridge infrastructural and amenity gaps while also setting up new economic opportunities in less developed regions. By 2025, the government aims to achieve an average annual GDP growth rate of 5.6 percent for the Northern (4.3%), Central (4.1%), Southern (5.1%), Eastern (6.5%), and Sabah (6.4%) areas. In other words, Goals are set for RM5,560 in Northern Malaysia; RM9,290 in Central Malaysia; RM8,480 in Southern and Eastern Malaysia; and RM5,210 in Sabah and Sarawak by 2025 for family income. Penang, Perak, Perlis, and Kedah are in Malaysia's northern region. Selangor, Melaka, and Negeri Sembilan are all part of Malaysia's business area. The eastern area includes the southern state of Johor. Initiatives that target key growth nodes and hotspot areas, attract quality investment and enhance the business ecosystem will help realise this priority area, as will efforts that enhance strategic collaboration and coordinati on among the countries of Southeast Asia's East ASEAN Growth Area, which includes Brunei Darussalam, Indonesia, Malaysia, the Philippines and the Indonesia Malaysia Thailand growth triangle (BIMP EAGA). 120 cities are predicted to attain sustainable city status by 2025, compared to 75 cities in 2019, based on the Malaysian Urban Rural Sustainable Development Indicators Network (MURNInets), while 14 cities will execute the Green City Action Plan under the IMT GT and BIMP EAGA Platform by 2025. By the year 2040, around 85 percent of the world's population will be living in urban regions. Promoting effective urban planning and governance, together with a focus on environmentally friendly and resilient urban development, as well as the emergence of sustainable city societies. It is hoped that by repairing 2,800 kilometres of roads and providing electricity to 99 percent of rural households and an extra alternative water supply and reticulation system to 98 percent of rural families, the government can close the development gap in rural areas. As stated in this report, the federal government also hopes to reduce economic gaps between rural and urban areas by a factor of 0.67:1. Tradition has become an integral component of daily life in many civilizations. Additionally, culture may help local communities generate revenue and improve their quality of life by bringing in tourists and sales tax revenue. When we use the word "cultural," we are referring to the informal collection of shared norms, beliefs, and behaviours that make up human civilizations. Individuals and society both benefit from a strong sense of culture. According to Throsby, our more globalised society has a profound effect on human behaviour (2001). To be effective, explanatory activities must take int o consideration all factors that affect market development and management practises and structures in general. To put it simply, culture is the sum of a society's way of life, as well as everything of human thought and behaviour that may be handed on via education. We tend to think about
For the Kelantan region's tourism business, the ECERDC has executed and created high impact projects that have had a substantial effect. Ecotourism, cross border travel, and arts and culture tourism are all possible in Kelantan. Kelantan might receive help from the addition of experiential tourism goods to attract more visitors, especially foreign tourists. With its rich cultural past and a particular set of values, Kelantan's natural riches are well complimented. As a gateway to both Thailand and Indochina, Kelantan is a major player in the area. From Jeli's Bukit Bunga, the Kelantan Tourism Trail begins at Tumpat, and the construction of the Kampung Laut Heritage Village in Kota Bharu City Centre would turn the city's centre into one of Kelantan's most prominent tourist destinations. Gua Musang is a famous ecotourism destination because of its beautiful waterfalls and the world's largest flower, the Rafflesia. IMT GT Plaza in Bukit Bunga on the Thai Malaysian border will enhance cross border trade and tourism in Kelantan. The 'R&R Stop
http://TuEngr.com Page | 3 cultural phenomena in terms of things like dance, music, food, and clothing when discussing them (Alshammari and Mir, 2021; Vandenhaute et al., 2022; Rha & Lee, 2022). Therefore, the concept of culture in this context is excessively narrow and specialised, while the social scientist's definition is more expansive. In Kelantan, Malaysia, the average monthly household income is RM2,536 based on Census Data 2009, which is lower than in other states. They have explanations for w hy a cultural product is no longer in demand or is experiencing a decline in a particular market. As well as supply constraints and other barriers to production, product availability culture an inability to get raw materials, an unwillingness to adopt new manufacturing processes or technology, a lack of financial resources, and poor quality control systems in the manufacturing process are all examples of supply limits. Development and economic growth need the existence of a well functioning infrastructure. Inadequate infrastructure will impede the growth of the state's economy. Known for its diverse cultural activities, Kelantan has a variety of local customs and cuisines. It is possible that performing arts like shadow puppetry, top spinning, kite flying, o r woodcarving s like Mak Yong and Dikir Barat may boost the economy of Kelantan by attracting tourists. Batik and Songket fabric, are two of Malaysia's best in Kelantan's cottage industries. The states may generate cash while safeguarding their cultural and historical heritage for future generations via a range of local cultural economy items. ECER was created by the government to facilitate and attract investors to the east coast. To attract investors, ECER covers the states of Kelantan, Pahang, and Mersing in the state of Johor. ECER's study discovered five economic development clusters that are driving the local economy forward. Tourism (oil and gas), manufacturing (agricultural goods), and education are all examples of economic clusters (educational insti tutions). Improved rural accessibility and infrastructure were critical to closing the urban rural development gap in the United States. Phases III and IV of the East Coast Expressway, an expansion of the current central spine federal highway, an upgrade o f an existing coastal highway, and brand new road development all support this assertion. This study's major purpose is to evaluate which sorts and how much contribution cultural economies make to a given region's overall economy considering the above.
2
Abo ut Kelantan
According to Walsh et al. (2022), food insecurity among private sector service employees in Finland and the validity of the Household Food Insecurity Access Scale (HFIAS) instrument.
http://TuEngr.com Page | 4
DESIGN: This cross sectional research used electronic questionnaires (2019) and data from the national registry to gather information on food insecurity and other background variables from Finnish private sector employees (2018 2019). Using logistic regression, we found the factors that contribute to food insecurity. Rotated principal part analysis and Cronbach's alpha to evaluate the validity of the HFIAS. According to (Vandenhaute et al. 2022), The COVID 19 epidemic had a particularly devastating effect on the food service industry. In this research, customers' attitudes, and feelings about the transparency of COVID 19 related safety measures are examined, and predictors of consumers' intents and behaviour about visits to restaurants and bars after they are reopened are identified (Coram, 2021) By additionally interviewing food service establishments, this research can make comparisons between the two populations it is trying to reach. During and between outbreaks of illness, this research included 1697 individuals from the public and 780 enterprises in Belgium. The results show that customers place a high value on safety measures when returning to restaurants and bars, despite the expectations of company owners. The perceived relevance of sanitary measures and the frequency of earlier visits have a detrimental impact on customers' propensity to return and behaviour when they do return (positively). This research shows the relevance of adhering to safety regulations as a means of attracting clients while a business is reopening. We also found that food service firms and the government need to be more honest in their communication.
In the year of our Lord 2021, when it comes to current events, social media has played a crucial role in distributing information swiftly. As of December 2019, COVID 19 (coronavirus disease 2019, or COVID 19) has evolved into a more transmissible and dangerous threat globally. People are afraid because of the epidemic's global expansion, particularly those who work in various organisations daily. Shocking news had a greater impact on social media users, both constructively and destructively. A systematic questionnaire to gather information from 630 people working in the service industry to conduct the study. According to the findings of this study, fear in the workplace has a detrimental influence on employee performance. The moderating effect of the
Masjid Kampung Laut, a 400 year old mosque in Kota Bharu, Malaysia, is undergoing rehabilitation and relocation efforts. This is an initiative to build a Kelantan heritage monument to preserve the mosque's historical, cultural, and architectural features. Two new commercial complexes, Laman Waris and Laman Seni are near the mosque. The complexes will be a "must see" attraction in Kota Bharu, Kelantan since they will serve as a showcase for local companies and their goods and services.
3 Review of Literature
Over' bazaar has a large variety of things to choose from. Facilities provided to tourists include restaurants, bathrooms, and prayer rooms. In recognition of its historical significance, the quaint Tumpat village of Kampung Laut has been named a 'Kampung Warisan,' or "Heritage Village."
Sources: • Secondary: The data were collected from the official website of Malaysia, Astro TV and Journals
4 Research Methodology
http://TuEngr.com Page | 5 COVID 19 vaccination on the link between social media fear and employee performance by this investigation. According to this study, the China Censor Board should verify the accuracy of the news to lessen employee anxiety over COVID 19. Controlling unneeded and unauthorised content about sensitive topics would help the telecommunications industry prevent mental illness and improve worker productivity.
• Primary: The data collected through the ordinal and nominal scale i.e., 5 point Likert scale Strongly disagree to strongly agree
The research objective is to study the young generation selection options for career selection in Service Sector: Hotel Industries (Fast foods, restaurant business), Textile Industries, Beauty clinics for Sustainable Business Growth for entrepreneur options in Kelantan, Malaysia Location.
• Dependent Variable: Sustainable (SB) Hypothesis: Hotel Industries, Textile Industries, and Beauty Clinic have moderate impacts on the sustainable growth o f entrepreneur growth on Kelantan youth in Malaysia
Table 1 shows basic detail of all variables. Shmueli et al. created the PLS predict algorithm (2016). PLS path model estimates were generated and evaluated using training and holdout data.
Table 1: MV Descriptive (Number of Observations Used for all data is 300)
The four variables Hotel Industries, Textile Industries, Beauty Clinics, and Sustainable all have substantial means and medians. Three industries are the greatest options for Kelantan's future for Kelantan's young people.
5 Data Analysis & Results : Smart PLS - SEM Testing
Mean Median Min Max SD Excess Kurtosis Skewness BC1 4.283 5.000 1.000 5.000 0.933 2.106 1.461 BC2 4.327 5.000 1.000 5.000 0.894 3.168 1.675 BC3 4.367 5.000 1.000 5.000 0.920 2.894 1.697 BC4 4.300 5.000 1.000 5.000 0.907 2.703 1.571 BC5 4.317 4.000 1.000 5.000 0.870 3.701 1.732
As Katzner (2009) argues, culture has a significant impact on economics. Cultural industries in Kelantan, Malaysia, face a variety of challenges, including a lack of funding and infrastructure. Investment in industries, excellent agricultural land and productivity, the availability of resources in the surrounding region, and the availability of both skilled and unskilled labour are the economic aspects that might be considered.
• Testing of Hypothesis: The variable evaluated using the structure question modelling method using Smart PLS Variables: • Independent Variables: Hotel Industries (HI), Textile Industries (TI), Beauty Clinic (BC)
HI1 4.367 5.000 1.000 5.000 0.879 3.237 1.706 HI2 4.300 5.000 1.000 5.000 0.907 2.607 1.544 HI3 4.337 5.000 1.000 5.000 0.870 3.230 1.658 HI4 4.387 5.000 1.000 5.000 0.882 3.320 1.750 HI5 4.320 5.000 1.000 5.000 0.870 3.101 1.616 SB1 4.347 5.000 1.000 5.000 0.916 2.822 1.656 SB2 4.283 5.000 1.000 5.000 0.933 2.106 1.461 SB3 4.327 5.000 1.000 5.000 0.894 3.168 1.675 SB4 4.367 5.000 1.000 5.000 0.920 2.894 1.697 SB5 4.300 5.000 1.000 5.000 0.907 2.703 1.571 TI1 4.300 5.000 1.000 5.000 0.907 2.607 1.544 TI2 4.337 5.000 1.000 5.000 0.870 3.230 1.658 TI3 4.387 5.000 1.000 5.000 0.882 3.320 1.750 TI4 4.387 5.000 1.000 5.000 0.882 3.320 1.750 TI5 4.393 5.000 1.000 5.000 0.894 3.566 1.816
http://TuEngr.com Page | 6
Mean Median Min Max SD Excess Kurtosis Skewness
BC = Beauty Clinic, HI = Hotel Industry, SB = Sustainable, TI = Textile Industries. Table 2: R Square: R Square R Square Adjusted Sustainable 0.993 0.993
Exogenous and endogenous variables are both modelled using R square statistics (Table 2), which explains the variation in each one (s). The R Square of a variable Y by X1, X2, and X3 is 0.623, for example. This means that X1, X2, and X3 may account for 62.3% of the change in Y. This graph by looking for any arrows that point to the dependent variable (endogenous). To be considered sufficient, the variation explained by an endogenous construct must have an R2 value of at least 0.10, according to Falk and Miller (1992). Endogenous latent variables, according to Cohen (1988), should have R2 values of 0.26 (substantial), 0.13 (moderate), and 0.02 (insignificant) (weak). For endogenous latent variables, Chin (1998) advised R 2 values of 0.67 (substantial), 0.33 (moderate), and 0.19 (low) (weak). A general guideline suggests that in marketing related academic research, R2 values of 0.75, 0.50, or 0.25 for endogenous latent variables might be considered considerable, moderate, or weak. In our tests, the R2 value was 0.993, which was found to be statistically significant. 99% of Kelantan's young people feel that the Hotel, Textile, and Beauty sectors are the best avenues for long term development.
Table 3: Outer loading: Beauty Clinic Hotel Industry Sustainable Textile Industries BC1 0.932 BC2 0.949 BC3 0.958 BC4 0.967 BC5 0.813 HI1 0.987 HI2 0.941 HI3 0.959 HI4 0.958 HI5 0.967 SB1 0.989 SB2 0.939 SB3 0.958
http://TuEngr.com Page | 7
Beauty Clinic Hotel Industry Sustainable Textile Industries SB4 0.960 SB5 0.972 TI1 0.933 TI2 0.946 TI3 0.954 TI4 0.965 TI5 0.905
Table 3, f our variables have significant outer loading values, and all factor values are more than 0.60. Latent variables' movement toward visible variables is tracked by these indicators in reflective models. Thus, they illustrate the significance of each variable or item that may be seen in defining the construct or variable under consideration. Normal loading is more than 0.6.
Table 6, validity is proved when all the items in one specific test measure are consistent with the underlying concept. The mean squared loadings of each indicator linked with a construct are used to compute the AVE. C onvergent validity is set up when the AVE is greater than 0.50.
An internal consistency or reliability metric known as Cronbach's Alpha is a measure of how closely linked the elements in a construct are to each other. Results (Table 4) may range from zero to one but can also be negative. For example, if the polarity of certain score items is flipped with respect to the polarity of others, the mean of all inter item correlations may be negative: items' polarity should always be aligned. Cronbach's Alpha may also arise. Cronbach’s Alpha for Construct Reliability and Validity scores that are more than 0.90 are considered strong.
Table 4: Cronbach’s Alpha Analysis: Cronbach's Alpha rho_A Composite Reliability Average Variance Extracted (AVE) Beauty Clinic 0.957 0.965 0.968 0.857 Hotel Industry 0.980 0.983 0.984 0.927 Sustainable 0.981 0.982 0.985 0.929 Textile Industries 0.968 0.993 0.975 0.885
Table 6: Latent Variable Covariance Beauty Clinic Hotel Industry Sustainable Textile Industries Beauty Clinic 1.000 0.600 0.993 0.693 Hotel Industry 0.600 1.000 0.547 0.982 Sustainable 0.993 0.547 1.000 0.651 Textile Industries 0.693 0.982 0.651 1.000
Table 5: Latent Variable Correlations: Beauty Clinic Hotel Industry Sustainable Textile Industries Beauty Clinic 1.000 0.600 0.993 0.693 Hotel Industry 0.600 1.000 0.547 0.982 Sustainable 0.993 0.547 1.000 0.651 Textile Industries 0.693 0.982 0.651 1.000
Table 8: Cross Loadings
Beauty Clinic Hotel Industry Sustainable Textile Industries BC1 0.932 0.489 0.939 0.582 BC2 0.949 0.530 0.958 0.629 BC3 0.958 0.459 0.960 0.563 BC4 0.967 0.574 0.972 0.678 BC5 0.813 0.785 0.745 0.800 HI1 0.559 0.987 0.509 0.961 HI2 0.636 0.941 0.569 0.933 HI3 0.569 0.959 0.524 0.946 HI4 0.590 0.958 0.547 0.954 HI5 0.521 0.967 0.473 0.929 SB1 0.981 0.577 0.989 0.680 SB2 0.932 0.489 0.939 0.582 SB3 0.949 0.530 0.958 0.629 SB4 0.958 0.459 0.960 0.563 SB5 0.967 0.574 0.972 0.678 TI1 0.636 0.941 0.569 0.933 TI2 0.569 0.959 0.524 0.946 TI3 0.590 0.958 0.547 0.954 TI4 0.571 0.980 0.525 0.965 TI5 0.804 0.814 0.797 0.905
Table 7: Discriminant Validity: Fornell Larcker Criterion Beauty Clinic Hotel Industry Sustainable Textile Industries Beauty Clinic 0.926 Hotel Industry 0.600 0.963 Sustainable 0.993 0.547 0.964 Textile Industries 0.693 0.982 0.651 0.941
If the path model holds dimensions that are conceptually identical (e.g., emotional satisfaction, cognitive satisfaction, and loyalty), Henseler et al. (2015) recommend a threshold value of 0.90; an HTMT value over 0.90 indicates a lack of discriminant validity. However,
http://TuEngr.com Page | 8
Table 9: Heterotrait Monotrait Ratio (HTMT) Beauty Clinic Hotel Industry Sustainable Textile Industries Beauty Clinic Hotel Industry 0.631 Sustainable 1.022 0.554 Textile Industries 0.712 1.014 0.644
Validity of discrimination is proved if the square root of the difference between the two groups equals 1. An object's AVE correlation with all other objects is larger than the object's AVE correlation with its root. The values in Table 7 are all quite high.
An object should have more weight on its own parent build than on any other construct, according to cross loadings Table 8. Discriminant validity is a problem if an item is a good fit for a different construct than its parent construct. As a result, the item may be cross loading onto another concept, which might have a negative impact on discriminant validity. Since all variables have values more than or equal to 0.10, the factors may now be evaluated.
Table 10: Path Testing & Hypotheses Testing: Total Effect: SampleOriginal(O) Sample(M)Mean Standard(STDEV)Deviation T (|O/STDEV|)Statistics P Values Beauty Clinic Sustainable 0.986 0.987 0.013 75.731 0.000 Hotel Industry Sustainable 0.378 0.372 0.037 10.271 0.000 Textile Industries Sustainable 0.339 0.331 0.047 7.285 0.000
To test the hypothesis, we compute the one tailed p value as sociated with the path coefficient (i.e., 1 95 percent). There is a chance that falls into the zero sampled normal distribution; therefore, this number may be thought of as the probability that it falls into that distribution. The area under the curve on the left side of the picture may be decided by taking the whole figure's area to be 1. Assumption is accepted if P value is less than or equal to 0.05, Table 10 all hypotheses are thus accepted. Instead of using the P value, the T ratio (sometimes referred to as a "T value," "T statistic," or "t statistic") is used to compare a threshold value (such as 1.64 or 1.96) to the associated T value.
Figure 2: Path Testing Smart PLS SEM Model
Figure 1: Factor Analysis Using Smart PLS SEM
http://TuEngr.com Page | 9 researchers might consider HTMT 0.85 as a threshold when the route model's constituents are more conceptually different (Henseler et al. 2015), see Table 9.


As can be seen, the outcomes of the hypothesis testing using P values and confidence intervals were the same for both tests. For hypothesis acceptance, the criteria P 0.05 is employed instead of P 0.01 for P values. It is unusual for a P value to be precisely 0.05, therefore employing either criterion likely to have the same impact. In our example, both criteria lead to the same outcome. 6
8 References
Alshammari, A. S., Mir , N. Q. (2021). A Systematic Review of Business Models for Sustainable Innovation. International Transaction Journal of Engineering, Management, & Applied Sciences & Technologies, 12(10), 12A10S, 1 9. http://doi.org/10.14456/ITJEMAST.2021.208
Henseler, J., Ringle, C. M., & Sarstedt, M . (2015). A new criterion for assessing discriminant validity in variance based structural equation modeling. Journal of the academy of marketing science, 43 (1), 115 135. Rha, J. S., & Lee, H. H. (2022). Research trends in digital transformation in the service sector: a review based on network text analysis. Service Business, 1 22.
Coram, V., Louth, J., Tually, S., & Goodwin‐Smith, I. (2021). Community service sector resilience and responsiveness during the COVID‐19 pandemic: The Australian experience. Australian Journal of Social Issues, 56(4), 559 578.
7
Availability of Data and Material Data can be made available by contacting the corresponding author.
http://TuEngr.com Page | 10
Conclusion E collaboration and other domains where multivariate statistics are used have seen PLS continual SEM's rise. Powerful and user friendly PLS SEM software solutions are one of the causes behind this. It is also possible to think about statistical tests like nonparametric comparisons of means as examples of PLS SEM analyses (Kock, 2013). In PLS SEM, researchers often use P values to evaluate hypotheses, where each hypothesis relates to a route in a mathematical model. The researcher's earlier knowledge of the path's direction and the sign of the corresponding coefficient may decide whether P values are one tailed or two tailed (Kock, 2015a). We looked at the advantages and disadvantages of using confidence intervals over P values when doing hypothesis testing. As a starting point for our conversation, we drew on an illustration. Each of the four latent variables in this illustration was a hotel or beauty clinic, a textile or industry, and a sustainable business (SB). Confidence intervals and P values have comparable consequences in terms of hypotheses being accepted, according to our findings. In fact, the results were identical to those predicted by our model. Using one tailed P values at the 0.05 level of significance, we found that sustainable growth in our model had the same effect as random variation.
http://TuEngr.com Page | 11
Vandenhaute, H., Gellynck, X., & De Steur, H. (2022). COVID 19 Safety Measures in the Food Service Sector: Consumers' Attitudes and Transparency Perceptions at Three Different Stages of the Pandemic. Foods, 11(6). DOI:10.3390/foods11060810 Walsh, H. M., Nevalainen, J., Saari, T., Uusitalo, L., Nappila, T., Rahkonen, O., & Erkkola, M. (2022). Food insecurity among Finnish private service sector workers: validity, prevalence and det erminants. Public Health Nutr, 25(4), 829 840. DOI:10.1017/S1368980022000209
Dr. Kiran Kumar Thoti is a Senior Lecturer in the Faculty of Entrepreneurship and Business, Universiti Malaysia Kelantan, and an Associate Professor, KLH Business School, Koneru Lakshmaiah Education Foundation. He earned a Doctor of Philosophy in Human Resource Management from Universiti Malaysia Kelantan, Malaysia. His research area is main ly in Human Resource, Entrepreneurship, Information Technology and Marketing Management.
Dr. Sathiswaran Uthamaputhran is a Senior Lecturer in the Faculty of Entrepreneurship and Business, Universiti Malaysia Kelantan. He got a Doctor of Philosophy in Entrepreneurship from the University of Aberdeen, the United Kingdom. His interest is in internationalization, Entrepreneurship and Enterprise
Solomon Gbene Zaato is a Ph.D. Candidate in Entrepreneurship and Lecturer in the Faculty of Entrepreneurship and Business (FEB), Universiti Malaysia Kelantan. He attained a Master of Philosophy and MBA in Entrepreneurship from Kwame Nkrumah University of Science and Technology (KNUST Ghana). His interests are in Entrepreneurship, Enterprise/ Small business Management and Success, and Social Entrepreneurship.
Dr. Hazriah Hasan is a Senior Lecturer of the Faculty of Entrepreneurship & Business in Universiti Malaysia Kelantan (UMK). She graduated her Bachelor of Economics (Islamic Economics) with Honors from International Islamic University Malaysia with She graduated from Universiti Teknologi MARA, Malaysia with her MBA and Doctoral degrees. She masters in Islamic Economics and Finance. Her research focuses on Islamic Wealth Management and Philanthropy. She possessed a Professional Certificate in Islamic Finance from INCEIF University and leads Islamic Endowment Unit in the university.
Dr. Yusrinadini Zahirah Md Isa @Yusuff is a Senior Lecturer in the Faculty of Entrepreneurship and Business, Universiti Malaysia Kelantan. She obtained her Bachelor of Business Administration with honors from International Islamic University Malaysia, Master of Science in Management and PhD in Entrepreneurship and Management from Universiti Utara Malaysia. Her area of interest is Management, Entrepreneurship, particularly Women Entrepreneurs and small business management.


International Transaction Journal of Engineering, Management, & Applied Sciences & Technologies http://TuEngr.com
Abstract Inflammatory diseases of the mammary gland and reproductive tract of cattle cause the greatest economic damage to dairy farming. Analysis of the relationship between the microbiota of these loci in animals without pathology and with mastitis and endometritis will provide new knowledge about the etiology of inflammatory diseases. This study performed sequencing of 16S rRNA variable regions , to determine and compare the composition of the mammary gland and the reproductive tract microbiota of cattle in normal conditions and inflammation. This research comprised 81 animals from five agricultural organizations of the Sverdlovsk oblast (Ural region, Russia), located in different areas. In each, 4 groups of experimental animals were formed: Group 1 animals with no pathology, i.e. without signs of inflammation of the mammary gland and reproductive tract (NP); Group 2 animals with signs of the mammary gland inflammation, but without signs of the reproductive tract inflammation (M); Group 3 animals with signs of the reproductive tract inflammation, but without signs of the mammary gland inflammation (E); Group 4 animals with signs of inflammation of the mammary gland and reproductive tract (EM). Samples of biological material (mammary gland secretion, cervical swabs) were obtained from each cow of all experimental groups; for further studies, the method of pooled sample for 16S rRNA metagenomic analysis was used. A comparison was made of the microbiota of the mammary gland and the reproductive tract of cattle with and without inflammatory processes. Disciplinary: Microbiology & BioScience.
Page | 1 ©2022 International Transaction Journal of Engineering, Management, & Applied Sciences & Technologies ISSN 2228 9860 eISSN 1906 9642 CODEN: ITJEA8 Comparison of the Microbiota of the Reproductive Tract and the Mammary Gland of Cows with and without Inflammation Using 16S rRNA Sequencing O.V. Sokolova1*, N.A. Bezborodova1, М.V. Bytov1, V.D. Zubareva 1, I.A. Shkuratova1, О.S. Zaitseva1, N.A. Martynov1 1FSBSI, «Ural Federal Agrarian Scientific Research Centre, UrB of RAS», Ekaterinburg, RUSSIA. * Corresponding author (Email: nauka_sokolova @mail.ru). Paper ID: 13A6C Volume 13 Issue 6 Received 15 January 2022 Received in revised form 23 April Accepted202230 April 2022 Available online 06 May 2022 Keywords: 16S MetagenomicsrRNA,; Holstein cattle, ReproductiveMammaryMicrobiota;gland,tract; Cow genotyping; Bacteroidetes; .
©2022 INT TRANS J ENG MANAG SCI TECH. Cite This Article: Sokolova, O.V., Bezborodova, N.A , Bytov, М.V., Zubareva, V.D., Shkuratova, I.A., Zaitseva, O.S., Martynov, N.A. (2022). Comparison of the Microbiota of the Reproductive Tract and the Mammary Gland of Cows with and Without Inflammation Using 16S rRNA Sequencing International Transaction Journal of Engineering, Management, & Applied Sciences & Technologies, 13(6), 13A6C, 1 12 http://TUENGR.COM/V13/13A6C.pdf DOI: 10.14456/ITJEMAST.2022.108

http://TuEngr.com Page | 2 1 Introduction
2
The study was conducted within the framework of the Russian Foundation for Basi c Research (grant № 20 416 660004) “Molecular genetic and phenotypic characteristics of the reproductive tract microbiota of cattle”. The object of research was 81 animals from 5 agricultural organizations of the Sverdlovsk oblast (Ural region, Russia). In each of the agricultural organizations 4 groups of experimental animals were formed: Group 1 animals with no pathology, i.e. without signs of inflammation of the mammary gland and reproductive tract (NP); Group 2 animals with signs of the mammary gland inflammation, but without signs of the reproductive tract inflammation (M); Group 3 animals with signs of the reproductive tract inflammation, but without signs of the mammary gland inflammation (E); Group 4 animals with signs of inflammation of the mammary gland and reproductive tract (EM).
Materials and Methods
16S rRNA gene amplicon sequencing library preparation has significantly expanded the knowledge of bacterial communities (microbiomes) and revealed bacteria that were not previously known to exist because they could not be cultivated in vitro. In cattle, the study of the diversity of the main milk microbiota was carried out mainly by comparing milk samples from healthy and mastitis cows, since thi s disease is considered one of the most common diseases of dairy cattle, which cannot be fully controlled [1;2]. The mammary gland in cattle is the main reservoir of infectious pathogens, which include Staphylococcus aureus, Streptococcus agalactiae, Streptococcus dysgalactiae, Mycoplasma spp. and Corynebacterium bovis. Opportunistic pathogenic bacteria such as Escherichia coli, Klebsiella pneumoniae, Klebsiella oxytoca, Enterobacter aerogenes, Streptococcus dysgalactiae and Streptococcus uberis can also become a causative agent of infection [3]. The study of the mammary gland microbiota will allow us to assess its role in the occurrence of inflammatory diseases and to identify new strategies for the prevention of mastitis. [4]. A c omparison of t he reproductive tract microbiota of cattle was carried out between animals with no pathology and with postpartum inflammatory diseases. Escherichia coli , Trueperella pyogenes, Prevotella spp., Fusobacterium necrophorum , Bacteroidetes spp. and Firmicutes spp. are predominant taxons associated with postpartum uterine diseases. However, the same bacterial species were found in the uterus of healthy cows [4]. The fact that affected and healthy cows carry similar pathogens indicates that uterine diseases are connected with the extensive growth of certain bacteria and the response of the immune system, but more research needs to be done on this issue [5].
Currently, the composition and characteristics of the microbiota of the mammary gland and the reproductive tract of cattle are widely described using the 16S rRNA sequencing method. However, this method has not been used to determine the general bacterial etiology of the inflammatory process in these loci of the animal organism. In addition, it is known that there are territorial differences in the microbiota structure of productive animals, which must be considered while planning treatment and preventive measures.
2.1 Bioinformatics and Statistical Analysis
OTU data sparseness was assessed individually for each sample using the Usearch program: the number of detected bacterial OTUs reaching a plateau with an increase in the number of sequences indicates a high quality of sampling, which is sufficient to compare the diversity of OTUs. The taxonomic structure of the microbiological composition of biomaterials was established by the ratio of the number of taxon specific reads to the total number of sequences reads. Thus, the relative abundance of taxa (expressed as a percentage) was obtained. Comparison of the relative abundance of different bacterial taxa (phylum, family and at the level of OTUs) was carried out using a paired Mann Whitney test for non parametric data on unrelated measurements in the STATISTICA v.12 program (Statsoft, USA) between samples of milk and cervical swabs from
Samples of biological material (mammary gland secretion, cervical swabs) were obtained from each cow of all experimental groups in compliance with aseptic regulations. For further studies, the method of pooled sample was used, as a result of which 39 samples were obtained: mammary gland secretion (n=19), cervical swabs (n=20), from which total DNA was isolated and the 16S rRNA gene was sequenced. A comparison was made of samples of the mammary gland secretion between the groups: NP M, NP ME and samples of cervical canal swabs between the groups: NP E, NP ME, as well as a comparison of groups with an inflammatory process among themselves.RNA extraction and 16S rRNA sequencing. The isolation of total DNA from biological samples was performed by the standard phenol method [7]. Based on the obtained DNA preparations, the library for sequencing was prepared using the commercial “Big DyeTM Terminator Cycle Sequencing Kit” (Applied Biosystems, USA) in strict accordance wit h the manufacturer's recommendations. Amplification of the 16S rRNA gene was performed using universal bacterial primers 16S 8 f B (5' AGRGTTTGATCCTGGCTCA 3') and 16S 1350 r B (5' GACGGGCGGTGTGTACAAG 3').
The resulting sequences were analyzed using the UPARSE pipeline in Usearch v.10.0 [8]. The UPARSE pipeline includes the ratio of paired read sequences, filtering sequences by quality, trimming them to the required length, merging identical sequences, excluding single sequences, excluding chimeras. OTU (operational taxonomic unit) clustering was carried out using the UPARSE OTU algorithm, taxonomic assignment of sequence reads was carried out with the joint use of SINTAX [9], the 16S RDP v.16 simulator and BLAST + 2.12.0 [10].
The sequencing of the prepared library was performed on the Illumina MiSeq outsourced platform at the Genomics Center for Collective Use of the Institute of Chemical Biology and Fundamental Medicine, Siberian Branch, Russian Academy of Sciences (Novosibirsk). The search for similar sequences in nucleotide databases was performed using Blast programs (http://blast.ncbi.nlm.nih.gov/Blast.cgi), and alignment was performed using the ClustalW program (http://www.ebi.ac. uk/Tools/msa/clustalw2).
http://TuEngr.com Page | 3
The results of high throughput sequencing are available from the NCBI GenBank at the links: OK048814 OK050076 (bovine mammary gland secretion microbiota) and OK0037659 OK039186 (bovine cervical swabs microbiota).
Supplementary material in the form of tables is available on request addressed to the correspondingComparisonauthor.of the results of the bacterial composition genotyping of mammary gland secretions samples from cows with no pathology (NP) and cows with mastitis (M) using the Mann Whitney test (p value < 0.05) indicates a number of statistically significant differences. Thus, a difference was found in the relative abundance of members of the Neisseriaceae family, which was predominant in animals with no pathology (Figure 1), but their abundance is generally extremely low (<1%). The species of other representatives of Neisseriaceae, such as Kingella denitrificans , Neisseria perflava, Neisseria macacae, Snodgrassella alvi, Uruburuella suis had also been established.
http://TuEngr.com Page | 4 animals of all experimental groups; samples of milk and cervical swabs in the aggregate from each agricultural organization. The obtained results were expressed in medians (M), minimum and maximum values. β biodiversity indices were calculated using the Usearch program. 3 Results and Discussion
Comparison of the genotyping results of cervical swabs and mammary gland secretions from cows with no pathology and with inflammation of the reproductive tract and/or mammary gland using the Mann Whitney test (p value < 0.05) indicates a number of differences in the microbiota composition. Thus, a difference was found in the relative abundance of representatives of the Peptoniphilaceae family (40 OTUs) and belonging to this family species Peptoniphilus indolicus in animals from groups NP and E, respectively (Figure 1).
Comparative analysis of obtained genotyping data of the bacterial composition of mammary gland secretion samples from cows with no pathology (NP) and cows with mastitis (M) using the Mann Whitney test (p < 0.05) revealed a number of statistically significant differences. A difference was found in the relative abundance of members of the Neisseriaceae family and it appeared to a greater extent in animals with no pathology. Species investigation of this bacteria family revealed presence of Neisseria oralis, which according to previous data was found in humans’ gingival plaque and its role in pathological or normal microflora in cattle has not been studied [11]. The species of Neisseriaceae representatives, such as Kingella denitrificans , Neisseria perflava , Neisseria macacae , Snodgrassella alvi , Uruburuella suis had also been established.
Our work revealed a significant difference (p=0.0449) in the relative content of Ruminococcus bromii in the mammary gland secretion of healthy animals. In the studies of Klieve A.V. et al. Ruminococcus bromii is defined as the dominant population of the bacterial community in the rumen of cattle, influencing the efficiency of starch utilization [12]. Asnicar Francesco and colleagues in their work showed that thi s type of bacteria belongs to specific microorganisms of the human microbiome involved in vertical transmission from mother to infant [13]. Thus,
Ruminococcus bromii is a part of a symbiotic microflora involved in the digestion process and probably plays an important role in the colonization of the gastrointestinal tract of newborn calves through colostrum consumption.
Comparison of the genotyping results of cervical swabs and milk samples obtained from animals with no pathology and with reproductive tract and/or mammary gland inflammation using
Figure 1:. Statistically significant differences in genotyping results of cervical swabs and mammary gland secretions from animal groups: NP M (beige), NP E (pink), NP EM (green), non significant (no color) (p value<0,05). NB: unc unclassified. After we raised the threshold of statistical significance to 0.05 < p value < 0.1 [14], the number of other bacteria was determined with s tatistically significant differences in relative abundance among groups of samples. Following differences were observed by comparison of the phylum Candidatus Saccharibacteria , the families of Aerococcaceae, Saccharinadaceae , Streptococcaceae, Peptoniphilaceae and Moraxellaceae and OTUs belonging to certain bacterial species such as Psychrobacter pasteurii , Facklamia miroungae, Coprococcus catus that were determined in mammary gland secretion samples from animals with no pathology, however was not found in samples from animals with mastitis. Differences were in OTUs in samples from animals with no pathology (Enterococcus faecalis, Coprococcus catus), compared to animals with signs of endometritis and mastitis (Peptoniphilus indolicus, Helcococcus ovis). Psychrobacter pasteurii , Helcococcus ovis and Peptoniphilus indolicus bacteria were the most abundant in the EM group of OTUs, in contrast to bioassays of animals with mastitis ( Figure 2).
http://TuEngr.com Page | 5

http://TuEngr.com Page | 6 the Mann Whitney test (p value <0.05) revealed a number of differences in the microbiota composition. A difference was found in the relative abundance of bacteria of the family Peptoniphilaceae and the species Peptoniphilus indolicus in animals from groups NP and E, respectively. A statistically significant difference was established in the relative abundance of bacteria of the Aerococcaceae family in the normal flora compared with animals with signs of mastitis. In studies by Wu H. et al., the bacterium Aerococcaceae is classified as the most common taxon of the microbiota of milk and airborne dust on farms [15]. Differences were observed when comparing the microbiota composition of mammary gland secretion samples by phylum of bacteria, such as Candidatus Saccharibacteria . Representatives of these taxonomic groups are symbiotic microorganisms involved in the fermentation of cellulose in the rumen [15]. The microbiota of the mammary secretion of animals without organ pathology is represented by bacteria: Facklamia miroungae , Coprococcus catus , Enterococcus faecalis. These bacteria may originate from environmental components that contaminate the teat’s skin (such as bedding, feces) [16]. It is known that the bacterium Coprococcus catus is a representative of the intestinal microflora of animals and humans. The presence of Coprococcus catus in bioassays indicates non compliance with sanitary and hygiene standards [17]. Peptoniphilus indolicus (M = 2.67), Helcococcus ovis (M = 2.31) were present in the microbiota of milk samples during inflammation, and the latter was found only in the bacterial composition of samples from cows with simultaneous inflammation of the mammary gland and reproductive tract. Both microorganisms identified by us are associated with the occurrence of mastitis in cows. Peptoniphilus indolicus is etiologically associated with the development of the so called "summer" acute mastitis in Europe and belongs to the group of pyogenic bacteria [18, 19]. Helcococcus ovis was first identified in sheep with subclinical mastitis in Spain and the United Kingdom in 1999, in later reports the causative role of this pathogen in clinical mastitis in cows was revealed [20, 21]. Our studies confirm the significance of Helcococcus ovis and Peptoniphilus indolicus in the pathogenesis of mastitis in cows in the Sverdlovsk region, which coincides with the data of other authors.
Bacteroides plebeius is part of the gut microbiota and has been most commonly found in human feces [22], however, there is evidence of Bacteroides as a genital microbiota biomarker for predicting the pathogenesis of reproductive disorders in cows. [23].
Ruminococcus faecis (Mediterraneibacter faecis) is a representative of the Clostridia class and was found by foreign scientists in the microbiota of the bird's intestines [24], therefore, the question of its role in the reproductive tract microbiota of cows remains open. Pseudoflavonifractor phocaeensis refers to representatives of the bacterial community of the digestive tract of cattle. The data obtained indicate a significant relationship between the microbiota of the gastrointestinal tract and the colonization of the reproductive tract of animals, which can be explained by the presence of a hematogenous route of microorganism transmission [25].
http://TuEngr.com Page | 7
Differences are also observed when comparing types, families and OTUs.
Analysis of the relative abundance showed that the main predominant operating taxonomic units in the group of cows with inflammation of the reproductive tract were Porphyromonas levii, Parvimonas micra, Peptostreptococcus anaerobius, Casaltella massiliensis, Moraxella osloensis, in comparison with the group of animals without pathology . On the contrary, there was a significantly higher abundance of OTUs belonging to Butyrivibrio proteoclasticus, unc_Bacteroidales, Flintibacter butyricus (Sporobacter termitidis), Alistipes finegoldii, Kineothrix alysoides, Sporobacter termitidis,
Figure 2:. Statistically significant differences in genotyping results of cervical swabs and mammary gland secretions from animal groups: NP M (blue), NP EM (green), M EM (yellow), non significant (no color) NB:(0,05<p-value<0,1).uncunclassified.
An increase in the relative abundance of Bacteroidetes (M=19.26), Veillonellaceae (M=0.53) in cervical swabs of cows from the EM group and Porphyromonadaceae (M=2.47), Peptoniphilaceae (M=11.58) in cervical swabs of cows from the group M was established by comparison with animals with no pathology. The relative abundance of unc_Bacteroidales, unc_Bacteroidetes , unc_Bacteria , Muribaculaceae, unc_Deltaproteobacteria was significantly higher in the microbiota of cervical swabs of cows without pathology of the reproductive tract. The relative abundance of Bacteroidaceae (M = 2.17) was significantly higher in the microbiota of cervical swabs of cows with simultaneous inflammation of the reproductive tract and mammary gland, in comparison with animals with endometritis (group E).

http://TuEngr.com Page | 8
As a result of the research, a difference was found in the relative abundance of Bacteroidetes (M=19.26), Veillonellaceae (M=0.53) in the cervical swabs of cows from the EM group and Porphyromonadaceae (M=2.47), Peptoniphilaceae (M=11.58) in cervical swabs of cows from group M
Figure 3:. Statistically significant differences in genotyping results of cervical swabs and mammary gland secretions from animal groups: NP M (pink), NP E (green), E EM (violet), non significant (no color) (0,05<p value<0,1).
Bacteroides caecigallinarum, Agathobacter ruminis plautii, Anaerotignum faecicola, Emergencia timonensis, unc_Firmicutes, Lachnotalea glycerini in the microbiota of cervical swabs of animals without signs of inflammatory reproductive pathology . A comparative analysis of the E group and the EM group revealed a significant increase in the relative abundance of Kineothrix alysoides, unc_Bacteroidales, Bacteroides plebeius in the microbiota of cervical swabs in case of simultaneous inflammation of the reproductive tract and mammary gland in cows ( Figure 3).
NB: unc unclassified.

Conclusion
http://TuEngr.com Page | 9 changing upwards in comparison with healthy animals. In the microbiota of cervical swabs of cows without pathology of the reproductive tract, the abundance of unc_Bacteroidales, unc_Bacteroidetes , unc_Bacteria , Muribaculaceae, unc_Deltaproteobacteria was significantly higher. In the microbiota of cervical swabs of cows with simultaneous inflammation of the reproductive tract and mammary gland, there was a significantly higher relative abundance of Bacteroidaceae (M = 2.17) in comparison with animals with endometritis (group E).
For instance, Streptococcaceae (M=66.43) was the predominant family in the taxonomic profile of cows with mastitis, and in cows of the second group, there were statistically significantly more representatives of the Peptoniphilaceae (M=8.62) and Moraxellaceae (M=0.44) families. It is noteworthy that members of the Peptoniphilaceae are anaerobic acidogenic bacteria, and members of the Moraxellaceae family are described as a component of the milk microbiota of Holstein cows and are also stably present in bedding and in airborne dust [26]. It is known that possible seasonal fluctuations in the occurrence of mastitis are mainly associated with a change in the microbiota composition of the housing facilities for animals, namely, bedding and air, which, when in contact with the teats of the mammary gland, affect the milk microbiota [26].
4
The microbiota of cervical swabs of animals with no pathology was characterized by the presence of Bacteroides plebeius , Ruminococcus faecis ( Mediterraneibacter faecis) and a higher relative abundance of Pseudoflavonifractor phocaeensis , in contrast to cows with signs of inflammation of the reproductive tract.
16S rRNA based analysis of microbiota allowed f or the determination of taxonomic profiles of biosamples of mammary gland secretions and cervical swabs of cattle, including the detection of difficult to culture and uncultivatable bacterial species. In this study, a comparative analysis of the microbiota of animals with no pathology and with inflammatory processes was carried out. For the first time, the species diversity of the microbiota composition of animals with different physiological statuses was shown, however, the changes, that bacterial microbiota undergoes during disease and remission, require further research. Moreover, common bacteria were found in
Certain differences were found in the microbiota composition of the mammary gland secretion of cows with mastitis and with simultaneous inflammation of the mammary gland and reproductive tract.
Among the bacteria for which an interrelation in the relative abundance in milk samples and cervical swabs of cows during inflammation has been established Turicibacter sanguinis , Staphylococcus aureus, Peptostreptococcus anaerobius , Peptoniphilus indolicus , Helcococcus ovis are described as infectious agents provoking the inflammatory process [18 21, 27, 28]. The rest of the bacteria, such as Sporobacter termitidis, Clostridium saudiense, Romboutsia timonensis , Bacteroides tenuis, Butyrivibrio proteoclasticus , Facklamia tabacinasalis, Fusobacterium necrophorum, Cutibacterium acne are representatives of the gastrointestinal microflora or saprophytic microorganisms living in the external environment.
[4] Rault, L., Lévêque, P. A., Barbey, S., Launay, F., Larroque, H., Le Loir, Y., Germon, P., Guinard Flament, J., & Even, S. (2020). Bovine teat cistern microbiota composition and richness are associated with the immune and microbial responses during transition to once daily milking. Frontiers in microbiology , 11, 602404. DOI: 10.3389/fmicb.2020.602404
[10] Camacho C , Coulouris G , Avagyan V , Ma N , Papadopoulos J , Bealer K , Madden T L. (2019). BLAST+: architecture and applications. BMC Bioinformatics 10, 421. DOI: 10.1186/1471 2105 10 421
The authors would like to thank Marsel Kabilov for sample sequencing and raw data preprocessing (Institute of Chemical Biology and Fundamental Medicine SB RAS).
6 Acknowledgments
[2] Hagnestam Nielsen C, Ostergaard S. (2009). Economic impact of clinical mastitis in a dairy herd assessed by stochastic simulation using different methods to model yield losses. Animal., 3(2), 315 328. DOI:10.1017/S1751731108003352
[11] Kahler C M. (2021). Neisseria species and their complicated relationships with human health. Microbiology Australia . 42(2), 79 83. DOI: 10.1071/MA21024
http://TuEngr.com Page | 10 inflammation of the mammary gland and reproductive tract of cows, which gives reason to assume a common etiology of the inflammatory processes of these organs. 5
[3] Hoque, M.N., Istiaq, A., Clement, R.A. et al. (2019). Metagenomic deep sequencing reveals association of microbiome signature with functional biases in bovine mastitis. Sci Rep 9, 13536. DOI: 10.1038/s41598 019 49468 4
[12] Klieve A V , O'Leary M , McMillen L , Ouwerkerk D (2008). Ruminococcus bromii, identification and isolation as a dominant community member in the rumen of cattle fed a barley diet. Journal of applied
[5] Jeon S.J., Vieira Neto A., Gobikrushanth M ., Daetz R ., Mingoti R.D ., Parize A.C .B., de Freitas S. L., da Costa A N L., Bicalho R C., Lima S ., Jeong K C., and Galvão K N . (2015). Uterine microbiota progression from calving until establishment of metritis in dairy cows. Appl. Environ. Microbiol 81, 6324 6332. 10.1128/AEM.01753 15.
[7] Sambrook J., Fritsch E F , Maniatis T (1989). Molecular Cloning: A Laboratory Manual. 2nd ed. (New York: Cold Spring Harbor Laboratory Publ.) pp.1659. [8] Edgar R C. (2013). UPARSE: highly accurate OTU sequences from microbial amplicon reads. Nature Methods. 10(10), 996 998. DOI: 10.1038/nmeth.2604
[1] Esteban Blanco, C, Gutiérrez Gil, B, Puente Sánchez, F, et al. (2020). Microbiota characterization of sheep milk and its association with somatic cell count using 16s rRNA gene sequencing . J Anim Breed Genet.; 137, 73 83. DOI: 10.1111/jbg.12446
[9] Edgar R C. (2016). SINTAX: a simple non Bayesian taxonomy classifier for 16S and ITS sequences. bioRxiv. DOI: 10.1101/074161
Availability o f Data and Material Information can be made available by contacting the corresponding author.
[6] Moore, S. G., Ericsson, A. C., Poock, S. E., Melendez, P., & Lucy, M. C. (2017). Hot topic: 1 6S rRNA gene sequencing reveals the microbiome of the virgin and pregnant bovine uterus. Journal of dairy science, 100(6), 4953 4960. DOI: 10.3168/jds.2017 12592
7 References
[25] Laguardia Nascimento M., Branco K. M., Gasparini M.R ., Giannattasio Ferraz S. , Leite L.R ., Araujo F. M., Salim A.C. , Nicoli J.R. , de Oliveira G.C. , Barbosa Stancioli E .F. (2015). Vaginal Microbiome Characterization of Nellore Cattle Using Metagenomic Analysis. PLOS ONE. 10(11), e0143294. DOI: [26]10.1371/journal.pone.0143294NguyenQ.D.,TsurutaT., Nishino N. (2020). Examination of milk microbiota, fecal microbiota, and blood metabolites of Jersey cows in cool and hot seasons. Animal Science journal = Nihon chikusan
[22] Ito T ., Sekizuka T ., Kishi N., Yamashita A. , Kuroda M . (2019). Conventional culture methods with commercially available media unveil the presence of novel culturable bacteria. Gut Microbes. 10(1), 77 91. DOI: 10.1080/19490976.2018.1491265
[14] Naumova N , Alikina T , Tupikin A , Kalmykova A , Soldatova G , Vlassov V , Kabilov M. (2020). Human gut microbiome response to short term bifidobacterium based probiotic treatment. Indian Journal of Microbiology . 60(4), 451 457. DOI: 10.1007/s12088 020 00888 1
[21] Liu K , Deng Z , Zhang L , Gu X , Liu G , Liu Y , Chen P , Gao J , Han B , Qu W. (2022). The first report and biological characteristics of Helcococcus ovis isolated from clinical bovine mastitis in a Chinese dairy herd. Frontiers in veterinary science. 8, 756438. DOI: 10.3389/fvets.2021.756438
http://TuEngr.com Page | 11 microbiology. 103(6), 2065 2073. DOI: 10.1111/j.1365 2672.2007.03492.x
[13] Asnicar F ., Manara S ., Zolfo M. , Truong D.T ., Scholz M. , Armanini F. , Ferretti P ., Gorfer V. , Pedrotti A , Tett A , Segata N. (2017). Studying Vertical Microbiome Transmission from Mothers to Infants by Strain Level Metagenomic Profiling. mSystems. 2(1), e00164 16. DOI: 10.1128/mSystems.00164 16
[15] Wu H., Nguyen Q.D ., Tran T .T .M. , Tang M.T ., Tsuruta T ., Nishino N . (2019). Rumen fluid, feces, milk, water, feed, airborne dust, and bedding microbiota in dairy farms managed by automatic milking systems. Animal Science Journal. 90(3), 445 452. DOI: 10.1111/asj.13175 [16] Krivonogova A.S ., Donnik I.M. , Isaeva A.G ., Moiseeva K. V. (2020). Methodology for compiling a microbial resistance passport for dairy farms. Agrarian Bulletin of the Urals. 200(9), 42 47. DOI: 10.32417/1997 4868 2020 200 9 42 47
[24] Liu J , Stewart S N , Robinson K , Yang Q , Lyu W , Whitmore M A , Zhang G. (2021). Linkage between the intestinal microbiota and residual feed intake in broiler chickens. Journal of Animal Science and Biotechnology. 12(1), 22. DOI: 10.1186/s40104 020 00542 2
[23] Adnane M , Chapwanya A. A. (2022). Review of the Diversity of the Genital Tract Microbiome and Implications for Fertility of Cattle. Animals. 12(4), 460. DOI: 10.3390/ani12040460
[17] Verdier Metz I. , Gagne G., Bornes S ., Monsallier F. , Veisseire P ., Delbes Paus C ., Montel M.C . (2012). Cow teat skin, a potential source of diverse microbial populations for cheese production. Applied and environmental microbiology. 78(2), 326 333. DOI: 10.1128/AEM.06229 11 [18] Spittel S ., Hoedemaker M. (2012). Mastitis diagnosis in dairy cows using PathoProof real time polymerase chain reaction assay in comparison with conventional bacterial culture in a Northern German field study. Berliner und Münchener tierärztliche Wochenschrift. 125, 494 502. DOI: 10.2376/0005 9366 125 494 [19] Carrero L., Córdoba R.,Chirino Zárraga C. (2017). Bovine summer mastitis during venezuelan rainy season: Cases reports at Yaracal, Falcón State. Revista científica de veterinaria. 27(6), 351 358. [20] Schwaiger K. , Wimmer M ., Huber Schlenstedt R. , Fehlings K., Holzel C.S. , Bauer J. (2012). Hot topic: Bovine milk samples yielding negative or nonspecific results in bacterial culturing the possible role of PCR single strand conformation polymorphism in mastitis diagnosis. Journal of dairy science. 95(1), 98 101. DOI: 10.3168/jds.2011 4700
Maksim Bytov is a Junior Researcher at the Department of Animal Genomics and Selection, FSBSI «Ural Federal Agrarian Scientific Research Centre, Ural Branch of the Russian Academy Sciences», Russia. His research interests are Diagnostics Methods for Livestock Animals’ pathogens, genetics of economic traits, approaches to genomic selection of livestock Animals, Genetic Engineering and Genome Editing of Livestock Animals, Disease Prevention and Treatment in Livestock Animals, Role of Microbiota Composition in Determination of Productivity and State of Health in Livestock Animals
Dr.Olga Sokolova, Doctor of Veterinary Sciences, is a Senior Researcher at the Department of Animal Genomics and Selection, FSBSI «Ural Federal Agrarian Scientific Research Centre, Ural Branch of the Russian Academy Sciences», Russia. Her research interests are Veterinary Microbiology and Virology Diagnostics, Phylogenetic Studies and Genotyping of Microorganisms, Analysis of Antimicrobial Resistance (AMR) spread in Microorganisms, Development of Methods for Control and Containment of AMR, study of the Pathogenesis of Perinatal Pathology in Animals, including Infectious Etiology Natalia Bezborodova, Candidate of Veterinary Sciences, is a Senior Researcher of the Department of Animal Genomics and Selection, FSBSI «Ural Federal Agrarian Scientific Research Centre, Ural Branch of the Russian Academy Sciences», Russia. Her research interests are Analysis of Microbiota Structure of Various Loci of Livestock Animals, Analysis of the Level of Genetic Mutations Distribution responsible for AMR in recovered Bacterial Isolates, Molecular Genetic and Phylogenetic Characteristics of Causative Agents of Animals’ Infectious Diseases, including Bovine Leukosis, Chlamydiosis, Mycoplasmosis and Anaerobic Microorganisms
Olga Zaitseva, Candidate of Veterinary Sciences, is a Senior Researcher of the Department of Animal Genomics and Selection, FSBSI «Ural Federal Agrarian Scientific Research Centre, Ural Branch of the Russian Academy Sciences», Russia. Her r esearch interests are Diagnostics Methods for Livestock Animals’ Pathogens, Genetics of economic traits, approaches to Genomic Selection of Livestock Animals, Genetic Engineering And genome Editing of Livestock Animals, Disease Prevention and Treatment in Livestock Animals
http://TuEngr.com Page | 12 Gakkaiho . 91(1), e13441. DOI: 10.1111/asj.13441 [27] Kanoe M , Nouka K , Toda M. (1984). Isolation of obligate anaerobic bacteria from bovine abscesses in sites other than the liver. Journal of medical microbiology. 18(3), 365 369. DOI: 10.1099/00222615 18 3 365 [28] Sokolova O . V., Bezborodova N. A., Lysova Y.Y ., Pechura E . V. (2021). Characteristics of species composition, biochemical and pathogenic nature of the microbiota of mammary gland and the reproductive tract in dairy cows. E3S Web Conf. 282, 03017. DOI: 10.1051/e3sconf/202128203017
Vladlena Zubareva, is a Senior Specialist of the Department of Animal Genomics and Selection, FSBSI «Ural Federal Agrarian Scientific Research Centre, Ural Branch of the Russian Academy Sciences», Russia. Her research interests are Diagnostics Methods for Livestock Animals’ Pathogens, Genetics of Economic Traits, Approaches to Genomic Selection of Livestock Animals, Genetic Engineering and Genome Editing of Livestock Animals, Management of Quantitative Indicators of Productivity and Quality of Livestock Products, Disease Prevention and Treatment in Livestock Animals, Role of Microbiota Composition in Determination of Productivity and Health in Livestock Animals
Nikolai Martynov, is a Laboratory Assistant of the Department of Animal Genomics and Selection, FSBSI «Ural Federal Agrarian Scientific Research Centre, Ural Branch of the Russian Academy Sciences», Russia. His research interests are Diagnostics Methods for Livestock Animals’ Pathogens, Genetics of Economic traits, approaches to Genomic Selection of Livestock Animals, Genetic Engineering and Genome Editing of Livestock Animals, Health Monitoring in Livestock Animals
Dr.Irina Shkuratova, Doctor of Veterinary Sciences, is a Professor, Corresponding Member of Russian Academy of Sciences, Chief Researcher of the Department of Ecology and Non infectious Diseases FSBSI «Ural Federal Agrarian Scientific Research Centre, Ural Branch of the Russian Academy Sciences» Russia. Her research interests are : Development of Biological Technologies for Animal Health Management and in vivo Formation of the Quality of Livestock Products


Abstract Skin disease stratification is essential for individualized treatment. Stratifying skin disorders involves finding disease subgroups for effective therapy. Academics and the medical community have recently become interested in cluster algorithms for stratifying skin conditions. Cluster methods feature experimental sounds, a large number of dimensions, and insufficient interpretation. Cluster algorithms evaluate cluster quality with one internal operation. Creating a robust internal evaluation mechanism for all datasets is difficult. This research included several time complexity investigations. Despite its prevalence, skin tone and hair color variations confound identification. Many studies cannot properly predict skin conditions. This paper presents an RFAT algorithm to overcome these difficulties. The image data used in this approach has been pre processed, and Linear Regression is employed to remove unwanted material. The Adversarial Tunicate Swarm Algorithm partitions data using Fuzzy Clustering (FM) (ATSA). Optimal clustering based data has been adapted to fulfill sub problems' ultimate purpose (A3). MSD and Dunn Index can help with this (DI). Logistic Regression can help choose attributes. Data classification uses Sigmoid and logistic regression. Clustered data output is divided by normal and aberrant. A performance investigation determined OPTSA's local optimum avoidance capacity. It has also been evaluated using ANN, LR HID, ML IDS, and En ABC. Synthetic, NIB (IBRL), and NSL KDD datasets are used for the proposed work's efficacy.
Page | 1 ©2022 International Transaction Journal of Engineering, Management, & Applied Sciences & Technologies ISSN 2228 9860 eISSN 1906 9642 CODEN: ITJEA8 Skin Disease Stratification based on Regression with Fuzzy C-mean Adversarial Tunicate Algorithm (RFAT) Ravinder Reddy Baireddy1*, R.Nagaraja2, G.Sudha3* 1 IT Department, Sreenidhi Institute of Science & Technology (SNIST), Hyderabad, INDIA. 2 ISE Department, Bangalore Institute of Technology (BIT), Bangalore, INDIA. 3 EEE Department, Bangalore Institute of Technology (BIT), Bangalore, INDIA. *Correspinding Authors (Email: ravibaireddy @gmail.com, profgsudha @gmail.com). Paper ID: 13A6D Volume 13 Issue 6 Received 15 January 2022 Received in revised form 25 April Accepted202201 May 2022 Available online 07 May 2022 Keywords: Cluster clusteringAlgorithmTunicateDunnSquareAlgorithmTunicatedisorderStratificationBenchmarkalgorithm;function;ofskin;AdversarialSwarm(ATSA);MeanDeviation(MSD);Index(DI);Swarm(TSA);Fuzzyalgorithm;EnABC;OppositionalTunicateSwarmAlgorithm(OPTSA);ANN,LRHID,MLIDS;Syntheticdataset;NIB(IBRL);NSLKDDdataset
Cite This Article: Baireddy, R.R., Nagaraja, R., Sudha, G. (2022). Skin Disease Stratification based on Regression with Fuzzy C mean Adversarial Tunicate Algorithm (RFAT). International Transaction Journal of Engineering, Management, & Applied Sciences & Technologies, 13(6), 13A6D, 1 15. http://TUENGR.COM/V13/13A6D.pdf
DOI: 10.14456/ITJEMAST.2022.109
International Transaction Journal of Engineering, Management, & Applied Sciences & Technologies http://TuEngr.com
©2022 INT TRANS J ENG MANAG SCI TECH.
Disciplinary: Electrical Engineering, Medicine and Health Sciences .

Introduction With its promising findings, skin disease categorization and segmentation have been emerging in the artificial intelligence space. It is a standard procedure to employ clustering methods and support vector machines (SVMs) for segmenting and classifying skin diseases [1,2]. Overall, clustering algorithms are flexible, easy to implement, and capable of generalizing traits with a statistical variance that are similar. Fuzzy c means, modified fuzzy c means, and K means were all used by Trabelsi et al. [3] to segment a skin ailment with an accuracy of about 83 percent in their study. They employed an ISODATA clustering technique to find the optimal threshold for skin lesion segmentation. Clustering a skin condition is limited by the availability of noise resiliency. Clustering methods rely on establishing a centroid in order to generalize a cluster of data. Outliers and noisy data impede the development of these algorithms. A fuzzy clustering model proposed by Keke et al.[4] is a more robust alternative to non clustering strategies for dealing with noisy datasets, as opposed to the original fuzzy clustering methodology. High dimensional data has made SVMs famous for their ability to decipher "...subtle patterns in noisy and complex datasets." Lu et al.[5] employed the radial basis kernel function to segregate erythema in the skin using SVMs that can differentiate nonlinear hyperplanes. An SVM k NN classifier combination by Sumithra et al. [6] was used for the segmentation and classification of skin lesions into five distinct categories. For classification, Maglogiannis et al. [7] utilized an SVM with a threshold on the RGB value. It is more difficult to extract features from data using SVMs than clustering techniques that are much more resilient. SVMs may potentially underachieve if they are not pre processed such that hyperplanes may be clearly defined. Because of the drawbacks of old techniques, convolution neural networks (CNNs) have become highly widespread because of their capacity to retrieve high level data with minimal pre processing. SVMs can reap the benefit of CNNs, such as resilience in noisy datasets without the requirement for efficient pre processing, by absorbing picture context and retrieving high level features by down sampling. The pixels of a picture can be examined within the context of the picture itself rather than being examined as part of a dataset by CNNs. As a result, the quality of images is degraded when CNNs use down sampling. Althou gh the context is gained, the location of a target is lost as a result of downsampling. There are almost no issues with categorization; however, fragmentation is a little more complex because context and location are critical for the successful performance of the system. Up sampling, which functions in the reverse direction of down sampling, is required to resolve this problem, as it enhances the picture's resolution. A matrix is reduced to a feature map whereas a feature map can be increased to a larger matrix through up sampling. The location of the targets can be segmented through learning to make a high resolution image. So we apply an integration of up and downsampling, while solely down sampling is used for categorization. When CNN models became too huge and sophisticated, skip connections were proposed as a remedy to the degradation problem that develops. Both
http://TuEngr.com Page | 2 1
a. Ignorance of Divergence among the search agent: The divergence among the search agent can be denied by estimating a new location for the search agent. HND = (1), FbbH =+ 32 (2), 12.bF = (3). F represents the water flow advection and H denotes the gravity force. ‘b1, b2, and b3’ are the arbitrary variables and lie from 0 to 1. Moreover, the social force between the search agent is determined by N , ].[ minmax1min RRbRN =+ (4) Equation (4.17), minR and max R determines the initial and subordinate speeds which are used to create social interaction. Let us consider the value of minR is 1 and max R is 4. The movement to the best behavior direction: After ignoring the divergence of the neighbors, the search agents shift towards the best neighboring side.
A. Adversarial Tunicate Swarm Algorithm (APTSA)
A Tunicate Swarm Algorithm (TSA) and Oppositional Learning Algorithm (OLA) combination are called Oppositional based TSA (OBL). Following is more information on the Oppositional Tunicate Swarm Algorithm (OPTSA).
2 Data Clustering Exploit ing FM and APTSA
B. TSA (Tunicate Swarm Algorithm): Using the tunicate, seafood can be ranked according to its quality. Moreover, the characteristics (Swarm intelligence incorporated with jet propulsion) of tunicate determines the optimal food source. Further, the jet propulsion must satisfy three criteria: i) close to the search agent ii) ignorance of divergence among the agents, and iii) movement toward the search agent. The characteristics of Swarm will be upgraded by the best optimal solution. The numerical expression is illustrated in the following section.
The Adversarial Tunicate Swarm Algorithm is used in conjunction with the clustering technique of fuzzy C mean to demonstrate how data might be clustered.
http://TuEngr.com Page | 3 segmentation and classification models use skip connections. To connect the down and up sampling portions in the segmentation model, blocks wit h similar feature numbers are used as connectors. These skip connections are represented in the classification model by inverted residual blocks. The complexity of our models can thus be increased without affecting their efficiency.
Optimization in terms of Opposition: Assume the candidate solution as ),...,,( 21 DxxxP = in D dimensional space. Moreover, the fitness function )( Pζ can be estimated by considering the
http://TuEngr.com Page | 4 )( xRrGLRC pandom =⋅ (5). Here, AS indicates the interval between the food source and search agent. Meanwhile, x represents the current execution of the tunicate and GL determines the location of the food source. 0,1][ ∈random and it's an arbitrary constant )( x p R that denotes the tunicate location.
Convergence rate: Convergence rate is the maintenance of convergence between the search agents. The upgraded position of ()Rxp the can is denoted as SF . ⋅< +≥ = 0.55.0)( andomandomp rifASYGL rifASYGL xR (6).
ii. Adversarial Based Learning (ABL): Heuristic methods have been used to derive the optimal solution from arbitrary choices in an initial population in common. The algorithm's convergence time is determined using the obtained solution. Convergence times are shorter if the initial solution is nearer ideal; otherwise, they are longer. Opposition learning also enhances the initial population [6]. The executions were repeated until the enhanced solutions were obtained. Moreover, the OBL is used to choose the estimation of the current candidate solution, and hence optimal threshold learning and searching were utilized to stimulate the OBL process. The following section clarifies the OBL steps.
Opposition Number: The opposition integer ���� for the real number (o) can be determined as onmo =+ (i.e. ]),[( nmo ∈ ). The multidimensional behavior of the opposition integer can be determined as Oppositionabove.point: Assume the opposition point ),...,,( 21 DxxxP = in D dimensional space and ],[ aa nmo ∈ , Ry n ∈ . Here, { }Dn ,3,2,1,= . The opposition point can be expressed numerically as aaa onmo =+ (8).
i. Characteristics of the swarm: After completing the convergence rate the location of search agents is upgraded to replicate the swarm characteristics of the tunicate. 12 1)()(1)( d xRxR xR pp p + ++ += (7).
• The up gradation of each search agent location can be estimated by Equation (4)
A fuzzy clustering algorithm is exploited to partition the clusters into O clusters. Moreover, each data points hold its membership grades and lies between 0 and 1. The data points which are nearer to the cluster exhibit a maximum membership grade than the other data points. Consider, { }jdD = η as the dataset along with { }mj ,...2,1,= and { }qiO = be the center cluster, and { }ki .,3,2,1,= . Besides FCM based clustering is carried out to perform the reduction of the objective function n I ∑ ∑ = = =≤<∞ jm k i ijjinn PwhereqdPI 1 1 2 1, (8) Here m and k are real values that are higher than unity and the data point [0,1]∈Pji distributes the membership grades. Moreover, in qi the cluster the jd is used to denote the data point which holds membership grades. Further, Euclidean distance is evaluated to analyse the similarity between the data points jd and their respective cluster qi . Further, the upgraded membership grade Pji for the cluster centre qi can be numerically expressed as, 1(2 1= ∑ = n k l ij ij ji qd qd P (9) However, the cluster center for the iteration i can be expressed as
http://TuEngr.com Page | 5
• Choose the initial parameters for the greatest aggregation of executions
• Estimate the fitness value for the upgraded search agent and if it is greater than the already existing value then upgrade the solution as p R . Repeat the executions until the optimal solution has been attained, i.e., pBR . C. Fuzzy Clustering Algorithm
opposition point of P )( P . Hence the fitness function for the opposition point must be greater than the point P, i.e., )()( PP ζζ ≥ . Thus the optimization has been obtained for the opposition point. iii. Adversarial Tunicate Swarm Algorithm (ATSA)
• The tunicate population can be initiated by utilizing OBL in Equation (2)
• Estimate the fitness value for each search agent by utilizing Equation (3)
• In the present space search, determine the most effective search agent and calculate the optimal value for every agent in the space.
The local optimization problem can be solved by utilizing ATSA. To attain these , two functions have to be considered i.e., Mean square deviation (MSDδ ), and Dunn Index (DIµ ). Of these MSDδ should be minimized and DIµ should be maximized. This can be explained below.
http://TuEngr.com Page | 6 ∑ ∑ = = = jm jin jm jjin i PPdO 1 1 (10).
Algorithm 1: FCM clustering model
Input: OPTSA's optimal value (RPB)and the data points to be clustered Set []pBRk ← and terminal criterion ℜ forEach j and fixed n doInitialization of Pji as the fuzzy membership grade / ∑ = = k i Pji 1 1 and [0,1]∈Pjin end initializationfor of P with Pρ Oi can be calculated with the equation (5) The Euclidean distance jinδ can be estimated between the thi Use equation (8) to calculate the Euclidean distance jinδ between the thi cluster centre and data object s th Dj ∈ if 0>jinδ UsethenEquation (9 ) to update Pjin else if 0= jinδ Clusterthen j with i the cluster data point ∑ = =ik Pjin1 1 if ℘<ς P thenAgain use equation (6) to determine the iC endelse Output:if Set of k clusters
http://TuEngr.com Page | 7
In every clustering algorithm evaluation of the complexity of C (M, n) is predominantly important to avoid complexity. However, the proposed ATSA provides better optimal output for FM. Moreover, the process followed is explained in Algorithm 2. The computational complexity evaluated by using the proposed work can be determined as )).()(( nMRC p + . RP denotes the aggregations of solution whereas, n and M represent the number of data objects and are constant.
Output: Custer centroids k with optimal positions
Input: Set the Solution population of OPTSA with the highest values of iterations, OPTSA parameters, and testing set testD ,η Initialize the tunicate population )( p R and candidate solution ),,,( 21 DxxxP = The fitness value can be estimated by exploiting Equation (7) Initialize nullR beztp ←[] , The best behaviour of the swarm can be determined by using Equatio n (8) The convergence value of the best agent can be evaluated by using Equation (9) for if 5)0( ≤random then RCBSFswarmswarm ←++⋅ else RCBSFswarmswarm ←+ end if end for if )()( PFPF ≥ then Replace P with )( P else update the solution pbeztp RR ←[] , end if set →[] , beztp R cluster centroids of the optimal position for FCM Call (Algorithm 1)
Algorithm 2: ATSA based FM Algorithm
Cluster Handling Stage
2.1
The expansion is started by setting a cluster head or cluster center. The objects having better similarities are considered as cluster centers. Typically, cluster extension is used to fix the issues of scattered clustering whereas the cluster formulation is being done. This problem can be answered using the sum of squared errors (SqE). Consider the kth cluster with bkp cluster members. Where { }np ,3,2,1,= { }xk ,3,2,1,= . Here x the total number of members in the kth clusters.
The sum of the squared error of the multidimensional vector v d can be estimated by 2 1 )(; ∑ = ∀= x k vqi ddESk (11), where { }klk l ...,3,2,1,; = The entire number of clusters that have been formed by deploying FCM . Moreover, the dispersion problems can be removed by reassigning clusters by ignoring and insisting on the unsuitable objects in other clusters.
To manage the development of clusters, it is necessary to do clustering data handling after data collection is complete. This has been discussed in more detail below.
The total ES q evaluated for all the k clusters can be given as (Montgomery et al. (2009)), kkqkqkqtotalq ESESESES =+++ ...21 (14). Otherwise, ∑ ∑ = = = k l x k kltotalq ddES 1 1 2)( (15).
http://TuEngr.com Page | 8
(a ) Cluster Expansion
Cluster Integration
The cluster Integration has been carried out by taking minimum values of ES q that the objects which are nearer to the centroids. ∑ = = x k kpe d x k 1 1 (12).
The cluster centers are allocated based on the clusters and for clusters g and h the cluster centers are denoted as egd and ehd . Its variance is denoted as gσ and h σ . The constraints used to satisfy two clusters can be given as gd and hd [9]. )(12 hgeheg dd σσ≤+ (13).
3 2.2
Collective intrusion detection can be performed by estimating the distance between the clusters. The interval between the clusters gd and hd from the cluster ck can be determined as, chg ghchcchgccg hgc mmm mmmmm ++ +++ = δδδ δ )()( ,/ (19) The distance between the object gd and hd from the cluster ck can be indicated as hgc ,/δ . Moreover, chg mandmm ,, represents the objects g, h, and c from the cluster. However, the distance can be calculated as gc δ for the clustering object gd and cd . ac δ is the distance between the cd and ad cluster. Similarly, baδ is the distance between the ad and cd cluster
The performance of the implemented technique can be analyzed by exploiting some of the performance metrics. Then the resultant outcomes are compared with the state of art methods. To performance, analysis is carried out in executi on with Cloudsim. These are explained below.
4 Experimental Analysis
http://TuEngr.com Page | 9
Intrusion Detection Stage
The Euclidean distance can be used to calculate the distance between the centre object ( ke) and each data object and can be written as ∑ = = pn epFpFe kd 1 2)(δ (16) The cluster radius (Rc ) is determined by the distance between the data object( c d )and center of cluster( e k ). Hence the distortion measurements can be determined as )(max ceRc =δ (17) Here, ∑ = = pn epcpce kd 1 2)(δ (18) Here, if cce Rδ≤ then the Fd belongs to jd∀ cluster.
(b) Collective Intrusion detection
Among the key divisions of intrusion detection are point intrusion detection and collective intrusion detection, both of which are discussed in greater detail below.
The squared error for clusters 1 and 2 are given as 1kq ES and 2kq ES . To integrate the clusters, the clusters with the least impact totalq ES have been chosen.
(a) Point Intrusion Detection
Table 1: Dataset description Parameters Datasets Image typeSynthetic NIB IBRL NSL KDD # Events 71,002 3,56,242 3.1 million 1,28,448 Dermoscopic images # Classes 5 2 2 4 Clinical images # Features 8 2 8 10 Clinical images
Image analysis relies largely on the following two criteria in order to succeed. Many other clinical indicators can be used to make a proper diagnosis, including asymmetry and irregularity of the lesion's border Additionally, consider the importance of precisely identifying borderlines when it comes to extracting additional clinically significant data, such as strange dots and colour variation. Drawing on a dermoscopic image for inspiration (Figure 1),
http://TuEngr.com Page | 10
Synthetic Dataset
Numenta Intrusion Benchmark (NIB):
The National Institute of Standards and Technology (NIST) dataset is the most widely used and available dataset for intrusion detection analysis. A mixture of fake and real world datasets is included in this collection.
Intel Berkeley Research Lab (IBRL) dataset
The Intel Berkeley research lab dataset contains time stamped information that was grasped from the 54 Mica2Dot sensors. This also gathers information about the temperature, voltage, humidity, and light via small DB in the network query processing systems.
NSL KDD is another and updated version of KDD 99. Moreover, KDD 99 holds redundancies and hence this selected dataset can be used to overcome them. This dataset can also be exploited to identify the intrusion in the big data of the military. Usually, it exhibits 24 different types of attacks, and further, it is enclosed in four different classes. They are Probe attack, R2L (Remote to Local), DOS (Denial of Service) and U2R(User to Root).
4.1 Details of the Dataset
The synthetic dataset is produced by the controlled testbed which was tested in a cloud computing environment. The taken testbed exhibit four hosts and is interlinked with the Local Area Network. They are listed below. (i) Offering web services and giving support for a variety of Virtual Machines, the Apache HTTP server has been implemented Exploiting this service also initiates the movement and traffic. Thus, it can be used to insist on malicious traffic for the detection of intrusion. (ii) The hardware emulation can be achieved by exploiting QEMU9, (iii) the virtualization support for the host can be provided by enabling KVM8, and (iv) Libcap 11 has been used to capture the packet traces among the different nodes. Thus, the Malicious traffic and benign plays a vital role in network traffic formation.
To evaluate the performance, the NIB, IBRL, and NSL KDD datasets, as well as the synthetic dataset, were used. Table 1 contained all of the information. In this data set, we consider skin disease images.
NSL KDD dataset
3. Set positive label samples number
Performance Evaluation of TSA
7. Shift unlabelled samples to labelled samples and make the value of objective function 8. If all the data satisfy the shifting condition, then T*tmp=T*tmp+1, else go to step 7
TSA is used not only for detecting the hyper plane but also for distinguishing between labelled samples/data and unlabeled samples/data using the classifier TSA. Our TSA classifier, which makes use of feature extraction, is quite simple in its recognition of the presence of disease on the skin. The following is an example of the objective function of TSA: A comparison of the proposed work's effectiveness to other similar ones has been created to assess its overall quality. These include Gray wolf Optimizer (Srivastava et al. (2019) [8], Ensemble Artificial Bee Colony (En ABC) [9] , and Tunicate Swarm Algorithm (TSA).
If T*tmp>T* 9. then obtain the output data, else go to step 6 10. TestingStop and comparison are two separate processes that take place once an image feature has been determined. By comparing the new data with the TSA algorithm's training set, we can get data that can be categorized. The TSA classifier is used to identify and detect skin diseases.
TPTNFPFN TPTN Ac +++ + = (20), FPFNFPFPR + = (21), TPFNTPTPR + = (22) Here, TN is used to denote the true positive, and TN is used to indicate the true negative rates. Similarly, FP and FN are used to determine the rate of false negative and false positive.
The performance of the proposed intrusion detection algorithm can be analyzed by using different performance metrics such as rate of false positive, true positive , and accuracy value.
5
Algorithm 1 : TSA training process algorithm 1. Initialize parameter ���� and ����∗ 2. Apply inductive SVM on training data
4. Find label samples for all unlabelled samples using decision boundary function value in where label samples are positive for the highest value of decision boundary function 5. Set T*tmp 6. Retrain SVM over the whole samples of labelled and unlabelled samples
http://TuEngr.com Page | 11 4.2 Measure of Work
image.
MATLAB was utilized to construct a prototype for our unique hybrid intelligent RFAT technique, which is capable of accurately segmenting dermatological pictures. Support vector
http://TuEngr.com Page | 12 6 Results Analysis and Discussion (a) Basal cell (b) Pemphigoid Figure 1: Color transformation process of diseased skin mages. (a) (b) (c)
ure
Fig 2: Testing infected skin image transformation to HIS, contrast enhanced, and ACO GA clustering labeled


http://TuEngr.com Page | 13 machines (SVM) may be used to accurately identify skin abnormalities using MATLAB. In this study, 812 colored skin images from the Department of Dermatology at Khulna Medical College were used, which included 24 different types of skin diseases, including scabies, psoriasis, seborrheic dermatitis, tinea corporis, chronic eczema, vitiligo and leprosy; these included images of 24 different types of skin diseases. In the dataset, you'll find examples of images of sick skin like the ones you see above. The input/query image is depicted using a distinct color channel (RGB). The histogram of a grayscale image can also be computed. With this technique, we were able to identify and analyze skin diseases that have not previously been studied by scientists, such as basal cell carcinoma and pemphigus.
(b)
Figure 1 shows the final result of the color alteration of the input image. (a)
(c)
Figure 3: Infected skin image segmentation using proposed TSA clustering
The contrast enhanced method and the Median filter are used to smooth out the noise in the infected image that was provided as input. The original query image is used to build the HIS file. The sick zone, on the other hand, is clearly marked in Figure 3. At the end of the process, hybrid TSA clustering is utilized to label and segment the image. This technique, which employs a


This section discusses the Regression with the Fuzzy c mean Adversarial Tunicate algorithm (RFAT) approach, which is based on Oppositional Tunicate Fuzzy C mean regression to detect cloud intrusions. The performance has been examined using a variety of datasets, including synthetic, NIB, IBRL, and NSL KDD. The suggested work has been compared to ML IDDS, En ABC, Lr HID and ANN among other state of the art efforts. As an added bonus, the maximum TPR and Low FPR values were computed using a performance assessment that took into account 10 different attributes and took into account assaults like DoS, R2L, Probe, U2R, and normal. Additionally, twenty benchmark functions and the problems they raise were used to determine the proposed work's efficiency. The convergence rate for the suggested and state of the art works such as GWO, En ABC and TSA was also assessed to analyse the performance and it was found that the proposed work has better convergence results than some other methods. Moreover, the false positive rate has been estimated and inference that the proposed work has the lowest FPR. Furthermore, the
Figure 4: Comparison of Accuracy for Hybrid GA ANN, Feed Forward BP ANN and our proposed TSA with RFAT algorithm.
http://TuEngr.com Page | 14 co mbination of the clustering method and the TSA clustering algorithm, is capable of segmenting the input contaminated skin image and providing the most practicable solution for it. The hybrid TSA approach makes use of three clusters to achieve its results. Pixels from both the diseased and healthy skin areas are detected at this stage, which is accomplished through the use of a sterile barrier. As illustrated in Figure 3, a segmented output of the TSA algorithm has been generated.
For images, TSA training is done during the training phase so that high detection accuracy is achieved. They have been approved into the testing phase. After the segmented picture features have been calculated, the data is compared to the training data. On the other hand, this classifier is able to tell the difference between different types of diseases based on photographs of diseased tissue.
Hybrid GA ANN and Feed Forward BP ANN are proposed in two studies in this field for identifying various patterns of skin disorders. Their technique has a detection rate of 88% and 90%, respectively. An inadequate study is being conducted with only 5 9 different types of skin diseases. When it comes to detecting various skin disorders with accuracy levels of up to 95%, our suggested system of RFAT algorithm with TSA classifier has achieved the best results to date. Figure 4 depicts the comparison of accuracy
7 Conclusion

Yoshida H, Dachman AH. Computer aided diagnosis for CT colonography. In Seminars in Ultrasound, CT and MRI 2004;25(5):419 31. DOI: 10.1053/j.sult.2004.07.002
Garg S, Kaur K, Batra S, Aujla GS, Morgan G, Kumar N, Zomaya AY, Ranjan R. En ABC: An ensemble artificial bee colony based anomaly detection scheme for cloud environment. Journal of Parallel and Distributed Computing. 2020;135:219 33.
Garg S, Kaur K, Batra S, Aujla GS, Morgan G, Kumar N, Zomaya AY, Ranjan R. En ABC: An ensemble artificial bee colony based anomaly detection scheme for cloud environment. Journal of Parallel and Distributed Computing. 2020;135:219 33.
Besharati E, Naderan M, Namjoo E. LR HIDS: logistic regression host based intrusion detection system for cloud environments. Journal of Ambient Intelligence & Humanized Computing. 2019;10(9):3669 92.
9 References
8
Trabelsi O, Tlig L, Sayadi M, & Fnaiech F. Skin disease analysis and tracking based on image segmentation. 2013 International Conference on Electrical Engineering and Software Applications, Hammamet, 1 7 Keke S, Peng Z, & Guohui L. Study on skin color image segmentation used by fuzzy c means arithmetic. In 2010 Seventh International Conference on Fuzzy Systems and Knowledge Discovery, Yantai 612 5 Lu J, Manton JH, Kazmierczak E, & Sinclair R. Erythema detection in digital skin images. In 2010 IEEE International Conference on Image Processing, Hong Kong, 2545 8. Sumithra R, Suhil M, & Guru DS. Segmentation and classification of skin lesions for disease diagnosis. Proced. Comput. Sci. 2015;45,76 85.
Awan SM, Khan ZA, Aslam M, Mahmood W, Ahsan A. Application of NARX based FFNN, SVR and ANN Fitting models for long term industrial load forecasting and their comparison. In 2012 IEEE International Symposium on Industrial Electronics 2012 (pp. 803 7). IEEE.
Maglogiannis I, Zafiropoulos E, & Kyranoudis C. Intelligent segmentation and classification of pigmented skin lesions in dermatological images in Advances in Artificial Intelligence. SETN 2006. In Lecture Notes in Computer Science. (Antoniou, G. et al. Eds). 2006;3955:214 23.
Ravinder Reddy Baireddy got his M.Tech From JNTUH. He is a Ph.D student at Vishveshwarayya Technological University. He is an Assistant Professor at Sreenidhi Institute of Science and Technology, Hyderabad. His research involves Data Mining Dermatologic Diseases Analysis using Swarm Optimization Algorithm Dr. R. Nagaraja is a former Professor & PG Coordinator in Bangalore institute of technology in ISE Dept. His research is in the area of Computer Sciences. Dr. G. Sudha is an Associate Professor & Head of the EEE Department, Bangolore Institute of Technology Her research involves Power Systems.
Availability of Data and Material Data can be made available by contacting the corresponding author.
Srivastava D, Singh R, Singh V. An intelligent gray wolf optimizer: a nature inspired technique in intrusion detection system (IDS). Journal of Advancement in Robotics. 2019;6(1):18 24.
performance metrics such as accuracy, TPR, and FPR were analyzed for the proposed as well for the existing works and concluded that the proposed work has better outcomes.
http://TuEngr.com Page | 15
Doi, K. Computer aided diagnosis in medical imaging: Historical review, current status and future potential. Comput. Med. Imaging Graph. 2007;31:198 211.


Paper ID: 13A6E Volume 13 Issue 6 Received 29 January 2022 Received in revised form 25 April Accepted202202May 2022 Available online 09 May 2022
This study analyses the effect of social capital on competitive advantage in Saudi Arabia's travel and tourist businesses. This study employs a survey methodology to collect data from deputy directors, heads of departments, and employees in the travel and tourism businesses in the Al Kharj Governorate. 250 employees comprise the final sample. This study reveals that travel and tourist organisations have a high level of internal social capital and achieve an increased competitive advantage when using descriptive statistics and simple and multiple regressions. Additionally, this study discovers a positive and statistically significant relationship between internal marketing and competitive advantage. This study proposes that travel and tourism businesses develop an internal social capital department due to the critical role of social capital in strengthening these organisations' competitive advantages.
Abstract
Page | 1 ©2022 International Transaction Journal of Engineering, Management, & Applied Sciences & Technologies ISSN 2228 9860 eISSN 1906 9642 CODEN: ITJEA8
Social Capital and Competitive Advantage: Evidence from Travel and Tourism Industries in Arabia
Disciplinary: Management (Marketing), Tourism. ©2022 INT TRANS J ENG MANAG SCI TECH. Cite This Article: Al Hazmi N. M. (2022). Social Capital and Competitive Advantage: Empirical Evidence from Travel and Tourism Industries in Saudi Arabia. International Transaction Journal of Engineering, Management, & Applied Sciences & Technologies, 13(6), 13A6E, 1 9 http://TUENGR.COM/V13/13A6E.pdf DOI: 10.14456/ITJEMAST.2022.110
*Corresponding Author (Email: 1n.alhazmi@psau.edu.sa).
Empirical
Nabil Mohemmed Al- Hazmi1
1 Introduction
Saudi
The shift from an industrial to a knowledge based economy has raised management studies' interest in social capital. Because social capital is a scarce resource that cannot be purchased or exchanged between organisations, it is an essential source of sustained competitive advantage and a critical factor in understanding organisational excellence. Several theoretical and applied research investigations highlighted the positive effect of social capital on businesses, including boosting job satisfaction, meeting emotional and ethical demands, and lowering stress. The second International Transaction Journal of Engineering, Management, & Applied Sciences & Technologies http://TuEngr.com
1Department of Marketing, College of Business Administration, Prince Sattam bin Abdulaziz University, KINGDOM of SAUDI ARABIA.
Keywords: Competitive Advantage; Social Capital ; Tourism industry; marketinginternal

part boosts worker performance, improving mission performance, competitiveness, and problem solving abilities. The third factor is productivity, which includes increasing production, enhancing quality, and lowering absenteeism. The current study aims to contribute to past findings and develop new concepts that turn the individual benefit of social capital into a community benefit. In Al Kharj Governorate, the impact of social capital on tourism and travel firms' competitive advantage is tested.
This study seeks to test the following hypothesis: There is a statistically significant impact of domestic social capital on the competitive advantage of travel and tourism organisations in the Kingdom of Saudi Arabia.
The topic of competitive advantage continues to be a significant concern for practitioners and scholars globally and locally. The enormous number of scholarly research and proposals on this issue does not obfuscate the fundamental goal of contributing to social well being. It is a commitment that instructs them to achieve their advantage not just by relying on traditional factors of production but also by researching and using intangible resources, especially those enshrined in their personal and non personal social relations, now known as the concept of social capital. Because Saudi travel and tourist organisations do not profit from and appreciate the relevance of social resources in their professional and competitive lives, these organisations can invest in the concept of social capital as one of the essential principles in management. Organise and guide these resources for the benefit of these organisations. To avoid the dominance of traditional organisational notions, it was decided to pose the problem as follows:
The study employed the descriptive analytical approach to collect secondary data from secondary sources (books, prior studies, magazines, etc.) and primary data from respondents via a
1.2 Study Limitations
1.1 Hypotheses
This study deals with social capital and its impact on the competitive advantage in travel and tourism organisations in Saudi Arabia.
How do social capital help travel and tourism companies compete in Saudi Arabia? This research seeks to achieve the following objectives:
http://TuEngr.com Page | 2
2. Identifying the reality of competitive advantage in travel and tourism organisations.
3. Investigating the role of social capital in the competitive advantage in travel and tourism organisations.
Spatial boundaries: This study was conducted on travel and tourism organisations in Al Kharj Governorate.Objectivelimitations:
2 Research Methodology
1. Determining the reality of social capital in travel and tourism organisations.
Time limitations: This study was conducted in 2022
The study population is represented by employees of travel and tourism organisations in Saudi Arabia (directors department heads front desk staff). The sample has been identified and selected randomly according to the nature of the study.
Population and research sample
Literature Review
After collecting data, the researcher conducted a reliability test using the Alpha Cronbach laboratory for internal consistency, as the average value of Alpha Cronbach for questionnaires is 0.88, a solid coefficient to begin the analysis process for questionnaires, while the questionnaire validity coefficient is 0.93 percent, also a strong coefficient to demonstrate the study tool's validity, as illustrated in Table 1.
Table 1: Stability test for the studyAlphatool.Cronbach's ValueNumber of paragraphsQuestionnaire 0.9332
2.2
2.1 Validity and Reliability
Table 2: Dist ribution of the study sample. %The Number of Sample ItemsType of Tourism OrganizationN. 2665Travel Agencies1 3383Hotels2 2152Restaurants3 2050Other Tourist Facilities 100250Total 3
http://TuEngr.com Page | 3 questionnaire. The descriptive analytical method was used to analyse the data using the Statistical Analysis Program SPSS and test the study tool's stability.
According to available research, no study examines the effect of social capital on the competitive advantage of travel and tourist firms in the Kingdom in general or in Al Kharj Governorate in particular. Rather than that, a few studies examined physical capital or issues about the governorate's tourism sector. Regarding the significance of prior studies as a component of the research and the necessity of using them as a theoretical backdrop with their research curricula and scientific and practical outcomes, we shall discuss a few of these studies as follows: Noman (2020) discussed commercial banks' social capital. The study concluded by examining the relationship between banks' social capital and competitive advantage, emphasising the importance of banking organisations' social capital. At the same time, Al Hazmi (2021) discussed the importance of customer relationships and their role in retaining customers in travel and tourism organisations in the Al Kharj Governorate. Additionally, the study provided several recommendations, the most significant of which is the importance of training customer relationship department personnel to deal with customers professionally and training them to use new modes of communication. Al Hazmi (2020) conducted an applied study at Prince Sattam University in Al Kharj Governorate to determine the value of internal marketing in Saudi
http://TuEngr.com Page | 4 universities. The study presented various recommendations about developing employees' competencies at Saudi universities and their training on how to provide services to a targeted audience. Several components and standards must be completed before applying the concept of Total Quality Management in the hotel sector. The importance of internal marketing in Saudi enterprises is manifold. Al Otaibi (2015) emphasises the importance of marketing interior services at Saudi universities and their role in enhancing competitiveness; Al Hazmi (2017) diagnosed the reality of Total Quality Management implementation in Al Kharj and determined its significance for the tourism sector's success. Lousia (2019) discussed the critical role of intellectual capital in industrial enterprises attaining a competitive advantage. Awath (2017) emphasised the role of intellectual capital in health organisations' competitive advantage. However, Mussa (2020) emphasised the importance of professional capital in organisations' competitive advantage and human resource capabilities. Khamees (2018) discussed the need to utilise intellectual capital in higher education institutions. Zubair (2019) emphasised the importance of investing in intellectual capital to achieve competitive advantage and concluded with an investment in intellectual capital, while Al Khatabat (2019) emphasised the importance of internal marketing in enhancing competitive advantage in travel and tourism organisations. Bakri (2019) examined the impact and role of internal marketing in improving employee performance in tourism organisations. Sadiq (2017) discussed the relevance of internal marketing in the growth and increase of employee loyalty in travel and tourist firms. Employee satisfaction improves when these banks implement internal marketing procedures. According to the previous literature study, most research examined internal marketing and quality management components in industries other than tourism, hospitality, and other locations but omitted Al Kharj Governorate. Thus, this study differs from past research in that it focuses on social capital in the tourism and hotel sectors in Saudi Arabia's Al Kharj governorate, and its aims have not been explored or handled in the manner recommended.
4 Descriptive Analysis of the Study's Constructs
Table 3: Descriptive analysis of internal social capital dimensions. p valueSigRankImportance%MeanDimensionsN. .0000.0000281.103.91The power of the work network1 .0000.0001379.233.62Frequency of communication2 .0000.0000478.963.79Emotional confidence (personal)3 .0000.0002664.963.10Emotional confidence (administration)4 .0000.0000183.013.82Common vision5 .0000.0000575.913.90Common language6 0.0000.00178.153.70Social capital
According to Table 3, all dimensions had a relative relevance of more than 78.15 percent, indicating a good attitude toward sizes and that the shared vision had the most significant relative value in the first place. While emotional confidence in the administration was the minor significant
4.1 Descriptive analysis of the Dimensions of Internal Social Capital
The researcher employed the simple correlation coefficient (Pearson's correlation coefficient) to examine the relationship between internal social capital and competitive advantage. The results were obtained in Table 5.
Descriptive Analysis of the Competitive Advantage
Table 5: The correlation coefficient between internal social capital and competitive advantage.SigPearson'scoefficient,correlationRVariables 0.0000.67Structural dimension and competitive advantage 0.0000.71Relationship dimension & competitive advantage 0.0000.72Cognitive dimension and competitive advantage 0.0000.75Internal social capital and competitive advantage
factor in the sixth and final position, as demonstrated by the column of moderation (Sig) having a value of less than 0.05 percent for all dimensions. Additionally, it was determined that the level of morale was less than 0.05 percent adopted via the value (p value) of convenient compatibility with all dimensions, indicating that the respondents' responses to dimensions have meaning in the research community.
Hypotheses Testing
To test the study hypothesis (there is no statistically significant effect of internal social capital on gaining competitive advantage), the relationship and impact on the dependent variable were evaluated separately (competitive advantage). To test the hypothesis, two approaches were used: simple linear regression and multiple linear regression, to identify the effect of internal social capital dimensions on competitive advantage (structure dimension, relationship dimension, and cognitive dimension).
Table 4: Descriptive analysis of the competitive advantage. p.valueSigRankImportance%MeanParagraphN. 0.0000.003180.323.94Market Share1 .00000.000276.593.74Quality2 .00000.00077.993.81Total
4.2
According to Table 4, the relative importance of all paragraphs and the overall dimension is 77.99 percent, indicating that the sections and the total dimension have received good acceptance. Market share was the essential factor relative to quality, as demonstrated by the moderation column (Sig), whose value was smaller than the approved indication threshold of 0.05 percent for all paragraphs of the dimension. Additionally, the value (p value) of convenient compatibility for all paragraphs and the total size was below the 0.05 percent threshold for indication, indicating that the respondents' responses to the sections are relevant to the research community.
5
http://TuEngr.com Page | 5
5.1 The C orrelation between Internal Social Capital and Competitive Advantage
CalculatedTValueR2RFactorsValuesFactorsIndependentVariable 0.00013.211.020.750.873.88AdimensionStructural 0.180.90B
CalculatedTValueR2RFactorsValuesFactorsIndependentVariable 0.00014.23 7.68 0.800.90 3.67ARelationshipdimension 0.860.62B
The results in Table 7 indicate a positive and morally significant impact relationship between the independent variable represented by the relationship dimension in the dependent variable and competitive advantage, where the regression coefficient is 0.62, indicating that increasing the relationship dimension by one unit of measurement results in an increase in the achievement of competitive advantage by 0.62 unit. While the correlation coefficient of 0.80 indicates a strong morale direct correlation, i.e. the more significant the relationship dimension, the increases competitive advantage achievement and vice versa, and these two coefficients regression coefficients and correlation coefficients are morally substantial as indicated by the T test. The interpretability of the regression mentioned above model, as measured by the selection
The results in Table 6 indicate a positive and morally significant relationship between the structural dimension and competitive advantage, with a regression coefficient of 0.90, indicating that the greater the structural dimension by one unit of measurement, the greater the competitive edge by 0.90 teams. While the correlation coefficient was 0.85, implying a high morale direct association, the greater the structural component, the more excellent the opportunity for competitive advantage, and vice versa. These two coefficients regression coefficients and correlation coefficients are morally significant, as indicated by the T test, and the interpretability of the above regression model, as measured by the selection coefficient R2, was 0.75, meaning that 75% of changes in competitive advantage are due to the structural dimension and 25% to other coefficients. These findings suggest that the structural factor contributes positively to gaining a competitive advantage. Table 7: Impact of the relationship dimension in achieving competitive advantage. SigCalculatedFValue
http://TuEngr.com Page | 6
As indicated in Table 5, there is a correlation between internal social capital and competitive advantage, as demonstrated by Pearson's correlation coefficient test result, which indicates a strong direct relationship with 0.75. The more internal social capital an organisation possesses, the more significant its competitive advantage is in the same direction. As the preceding table revealed, this correlation is based on morality at a 1% moral level. Along with the association between competitive advantage and internal social capital characteristics demonstrated in Table 5, the regression analysis was conducted, see Table 6.
Table 6: The impact of the structural dimension in achieving competitiveCalculatedadvantage.SigFValue
The results of multiple linear regression Table 9 demonstrate a direct morale effect between the independent variable (relational dimension) and the dependent variable (competitive advantage), but not between the other factors. Multiple regression illustrates the impact of the independent variable while also accounting for the effect of additional independent variables (while the simple linear regression shows the result of the impact of the independent variable with the stability of the rest of the other variables). The bigger the (connection dimension) per unit of measurement, the greater the competitive advantage by 0.42.
Table 9: T he analysis result of the multiple linear regression of the impact of internal social capital, on achieving competitive advantage SigCalculated F Value Calculated T ValueR2RcoefficientRegressionBgradientConstantAIndependentvariable 0.05 15.87 1.94 0.660.78 0.18 1.11 dimensionStructural 0.010.220.42Relationshipdimension 0.491.160.12dimensionCognitive ���� = 1 11 + 0 18����1 + 0 43����2 + 0 12����3 Additionally, the T test indicates that the regression coefficients are morally significant. The correlation coefficient of 0.78 indicates a strong correlation between internal social capital and competitive advantage, indicating that increased internal so cial capital results in increased
5.2 Multi Regression Method
http://TuEngr.com Page | 7 coefficient R2, was 0.80, suggesting that 80% of changes in competitive advantage were caused by the structural dimension, whereas other factors caused 20%.
Table 8: The impact of the cognitive dimension in achieving competitiveCalculatedadvantage.SigFValue
CalculatedTValueR2RFactorsValuesFactorsIndependentVariable 0.0009.9513.14 0.930.85 3.70AdimensionCognitive 0.910.78B
The results in Table 8 demonstrate a positive and morally significant relationship between the independent variable of the dependent variable and competitive advantage, with a regression coefficient of 0.78, indicating that increasing the cognitive dimension by one unit of measurement results in an increase in the competitive advantage of 0.78 of a unit. While the correlation coefficient is 0.93, indicating a strong moral direct coefficient, the greater the cognitive dimension, the greater the ability to acquire a competitive advantage, and vice versa. These coefficients regression coefficients and correlation coefficients are morally significant, as indicated by the T test, and the interpretability of the regression mentioned above model, as indicated by the R2, was 0.85, meaning that 85 percent of changes in competitive advantage are due to the cognitive dimension, while 15% are due to other factors.
8 Acknowledgments
7 Availability o f Data and Material Data can be made available by contacting the corresponding author.
6 Conclusion
http://TuEngr.com Page | 8 competitive advantage and vice versa. The indication coefficient of 0.66 indicates that 66% of changes and impacts on competitive advantage are due to independent factors. In comparison, 34% are related to other variables, implying that the central research hypothesis is accepted, which asserts that internal social capital has no statistically significant effect on gaining competitive advantage (statistically substantial for internal social capital in achieving competitive advantage).
The author expresses his gratitude to Prince Sattam Bin Abdulaziz University in Saudi Arabia and its Deanship of Scientific Research for their unwavering technical support in completing this research project [2021/02/17893].
By analysing the study's various dimensions and testing its hypotheses, we discover that the depth of relationships between members of the work network, workers' interactions with their colleagues outside of work, the existence of personal relationships outside of the official context of work and a sense of comfort with them are factors that contribute to the strengthening of work networks. In this way, workers' performance in their jobs is improved. We discover that organisations are working in the tourism and travel sectors to identify and enforce laws, policies, and regulations that protect the individual's rights and avoid harming him instil confidence in the administration, which has a positive effect on the performance of the work entrusted to the employees by this administration. The availability of a common language among tourism organisation employees boosts their capacity to comprehend the diverse perspectives, objectives, perceptions, and interpretations of other employees, leading to more favourable results in their performance. Tourism companies' competitive advantage is influenced by banks' interest in their workforce, given that human resources are accountable for conducting business within these institutions and because human resources are the establishment's most valuable resource. As a result, tourist organisations' divisions should take the issue of internal social capital seriously and recognise its critical role in achieving competitive excellence to treat employees with more excellent care and attention. It is needed to educate employees about the vital role they play in achieving institutional excellence, to foster an atmosphere of understanding and mutual trust among employees, to foster continuous communication among employees, to foster the formati on of a shared vision among all employees, to address negative aspects of work and to eliminate communication barriers between workers at various levels. Additionally, it is necessary to work to earn the department's employees' confidence, as this has a positive effect on employee motivation, which reflects positively on the tourism organisation's overall performance and to work diligently to provide something unique and distinct from others by developing information systems to explore all the desires and needs that are constantly evolving and working to meet them.
Al Hazmi, N. (2020). Internal marketing policies and procedures at Prince Sattam Bin Abdulaziz University and the extent of workers' satisfaction. Management Science Letters, 10(7), 1427 1436.
Al Otaibi, B. (2015). Marketing university services and their role in improving the competitive capabilities of Saudi universities. PhD Thesis, Umm Al Qura University, Saudi Arabia.
Bakri, S. (2019). The role of internal electronic marketing in improving workers' performance in tourism companies in Egypt. International Journal of Heritage, Tourism and Hospitality, 13(2), 262 280.
Khamees, A. (2018). The application of intellectual capital in higher education organisations. Educational Administration Journal, 18(1), 249 275.
Al Khatabat, A. (2019). The impact of the application of internal marketing in tourism organisations on the quality of tourism services in Algeria Study on a sample of staff and guests of Algerian hotels. College of Economic, Operational and Commercial Sciences, 12(2), 331 348.
Noman, M. (2020). Studying the role of social capital in Yemeni banks. Taiz University Journal for Studies and Research, 2(1), 348 365.
Mussa, Z. (2020). The impact of professional capital on sustainable competitive advantage. Unpublished Master's Thesis, University of the Middle East, Amman.
Sadiq, D. (2017). The impact of internal marketing on the performance of workers in tourism organisations. Al Rafidain Journal of Studies, 29(1), 49 65.
Zubair, M. (2019). Investing in intellectual capital as an entry point to create a competitive advantage. Journal of Administrative Sciences, 10(2), 312 328.
Lousia, F. (2019). The role of intellectual capital in achieving the competitive advantage of industrial organisations. Master's Thesis, University of Mohamed Khedir, Algeria.
Al Hazmi, N.(2020). Develop an internal marketing scale and test the validity of its application. King Saud University Journal, 22(1), 267 239.
http://TuEngr.com Page | 9 9 References
Al Hazmi, N. (2021). The impact of customer relationship management on customer retention in travel and tourism organisations. Management Science Letters, 11(1), 247 252.
Awath, M. (2017). The role of intellectual capital in achieving competitive advantage in health organisations. Master's Thesis, Hebron University, Palestine
Al Hazmi, (2017). Impact of Total Quality Management on Marketing of Tourism Services An Applied Study on Hotels located in Al Kharj City in KSA, International Journal of Management & Economics Invention, 4(1), 1595 1605.
Dr. Nabil Mahemmed Al Hazmi is an Associate Professor of Marketing in the Marketing Department College of Business Administration, Prince Sattam bin Abdulaziz University, the Kingdom of Saudi Arabia He was a Professor of Tourism Marketing and Head of the Department of Tourism Management at Taiz University in the Republic of Yemen. He has authored a set of books in the field of Marketing Management and Tourism Marketing. He is a trainer accredited by the International Finance Organization (IFC), a certified trainer at the International Labor Organization, and a member of the Board of Directors of the International Business License (IBDL).

1
*Corresponding Author (Email: isaeva.05@bk.ru). Paper ID: 13A6F Volume 13 Issue 6 Received 20 December 2021 Received in revised form 24 April Accepted202202 May 2022 Available online 09 May 2022
Pre-Implantation Embryos in vitro
Keywords: Oocyte; Cell division; EmbryologyMaturation;; Mammal embryo. Abstract Time lapse cultivation allows the processing of the maximum amount of information on early embryo development, including such morphological disorders that are not observed in the traditional assessment of embryo cleavage at certain time intervals. The time lapse technology was used by the authors to monitor the development of pre implantation cattle embryos obtained from unstimulated ovaries. It was shown that the temporal and morphological characteristics of the first and three subsequent embryo divisions determine compaction probability and the embryo reaching the blastocyst stage. Embryos whose development did not fit into these time parameters did not form a blastocyst and stopped at different stages of development. Disciplinary: Embryology ©2022 INT TRANS J ENG MANAG SCI TECH.
V.A. Makutina1, A.S. Krivonogova1, A.G. Isaeva 1*, K.V. Moiseeva 1, M.V. Petropavlovsky1 1Federal State Budgetary Scientific Institution Ural Federal Agrarian Scientific Research Centre, Ural Branch of the Russian Academy of Sciences (FSBSI UrFASRC, UrB of RAS), 112 А, Belinskogo St., 620000 Ekaterinburg, RUSSIA.
Cite This Article: Makutina, V.A., Krivonogova, A.S., Isaeva, A.G., Moiseeva, K.V., Petropavlovsky, M.V. (2022). Morphokinetic Development Parameters of Cattle Pre Implantation Embryos in vitro. International Transaction Journal of Engineering, Management, & Applied Sciences & Technologies, 13(6), 13A6F, 1 9. http://TUENGR.COM/V13/13A6F.pdf DOI: 10.14456/ITJEMAST.2022.111
Page | 1 ©2022 International Transaction Journal of Engineering, Management, & Applied Sciences & Technologies ISSN 2228 9860 eISSN 1906 9642 CODEN: ITJEA8
Morphokinetic Development Parameters of Cattle
Introduction
The use of high frequency time lapse technology for early mammalian embryo cleavage has only become possible in recent years thanks to the advent of high tech systems built into the incubator for pre implantation embryos' cultivation. Although time lapse photography was first used to observe development in the 1920s [1], modern time lapse photography systems allow obtaining high quality images of embryo cleavage dynamics throughout the entire cultivation period without the need to move embryos from a stable incubator environment. As a result of such monitoring, it is possible to estimate the timing of the main events of early embryo development in International Transaction Journal of Engineering, Management, & Applied Sciences & Technologies http://TuEngr.com

The early development of human embryos has been particularly well studied, t he time intervals of the first divisions have been determined, and the influence on the further development of such events as unequal cleavage, formation of cytoplasm fragments, reverse division, multi nucleation and blastomer's division into 3 or more cells and so on has been studied. Studies on other mammals are extremely scarce. It is known that the timing of the first divisions correlates with the further embryos' development of pigs, cattle, cats, mice, and hamsters [3, 4 ,5 ,6, 7].
Maturation of oocytes was carried out for 24 hours in a culture medium BO IVM (IVF Bioscience) coated with mineral oil for cell cultures (Sage) at a temperature of 38.5 ° C, carbon dioxide level of 6.5 vol.%, oxygen 5.0 vol.%. Cryopreserved bull spermatozoa frozen in 0.5 ml straws were used for in vitro fertilization. The straws were thawed in a water bath with a temperature of 37C for 30 seconds. The treatment of spermatozoa was carried out by centrifugation in a density gradient: 3 ml 80% Percoll (Irvine Scientific), for 15 minutes 400g at room temperature. After centrifugation, the sperm precipitate was washed with a buffer medium containing 3 IU of heparin for 10 minutes at 200g. After centrifugation and washing, spermatozoa were introduced into a BO IVF (IVF Bioscience) medium
Observation and frame by frame photography of the early stages of cattle development is complicated by the high concentration of lipid granules in their oocytes and embryos, which makes it difficult to visualize pronuclei, assess fertilization, and multi nucleation in the visible spectrum without removing the granules first [8]. The greatest difficulty is cleavage morphokinetics assessment of cattle embryos obtained from slaughter material; in this case, non stimulated cow ovaries are used and antral follicles of different diameters from 1 to 15 mm are aspirated. The resulting oocytes are at different maturity stages and preliminary pre incubation is required for their maturation (IVM in vitro maturation). However, even with IVM, not all oocytes obtained from non stimulated ovaries are potentially able to mature to MII stage, fertilize, form a zygote , and subsequently, a blastocyst. Therefore, it is interesting to evaluate the time intervals of early divisions of embryos obtained from non stimulated cattle ovaries and to determine possible predictors of development competence to the blastocyst stage.
After slaughter, cattle ovaries were selected and transported to the laboratory at 38.5 C in a controlled temperature environment for 4 5 hours. Immediately after receiving the ovaries, aspiration of the visualized follicles from 2 to 15 mm was performed using an 18G needle attached to a 5 10 ml syringe. Follicles' aspiration and all further work with eggs and embryos were carried out in sterile conditions of the "clean zone" in laminar cabinets with a surface heated up to 38.5 °C.
2.1 Material Sampling
http://TuEngr.com Page | 2 vitro, notice cleavage features and even predict the implantation potential of the embryo based on morphokinetic parameters [2].
2
2.2 Maturation and Fertilization of Oocytes , Embryos' Cultivation
Materials and Methods
http://TuEngr.com Page | 3 with mature oocyte cumulus complexes at a concentration of 1.0 2.0 x10 6 motile spermatozoa in 1 ml. 18 hours after insemination, the complexes were completely purified from cumulus cells and spermatozoa and transferred to the culture medium BO IVC (IVF Bioscience). The embryos were cultured in vitro without medium changes for the entire development period up to the blastocyst stage. 2.3
The images were captured in the Primo Vision sys tem (Vitrolife, Sweden) for 8 days (192h) after the fertilization of mature cattle oocytes. The Primo Vision device is a compact digital inverted microscope with integrated optics, Hoffman contrast and green LED illumination (550 nm), which is placed in a conventional laboratory incubator and communicates with a control unit located outside the incubator. Special cups designed for this system were used for cultivation, which can accommodate up to 16 embryos placed in 4 rows of 4 drops. The system was configured to receive 1 photo every 10 minutes. All received images were saved for further analysis. 3 Results A total of 5 series of time lapse photography were recorded, 50 dividing embryos obtained during the maturation and fertilization of non stimulated cattle oocytes were filmed. The level of blastocyst formation amounted to 22%, the remaining embryos stopped developing at different stages.The following time parameters were evaluated: the duration of the first division from the moment of the cleavage furr ow appearance (Figure 1A) to the end of cytokinesis and the formation of a 2 cell embryo ( Figure 1B); the time of the first division from the moment of fertilization to the formation of a 2 cell embryo; the time of the second embryo division from the moment of fertilization to the formation of a 3 cell embryo (Figure 1C); the time of the third embryo division from the moment of fertilization to the formation of a 4 cell embryo ( Figure 1D); the time of the fourth division from the moment of fertilization to the formation of a 5 cell embryo (Figure 1E); time of blastocyst formation (blastulation) (Figure 1G).
Time lapse Photography
A B C (Figure 1 continues on the next page).


Table 1: Morphokinetic indicators of cattle embryos' development obtained from non stimulated cattle follicles. indicator Embryos developed to blastocysts Embryos arrested in development MannTestWhitney t test
http://TuEngr.com Page | 4 D E F G H
Total q ty 11 39 First division, h 27,08 ± 0,81 32,81 ± 6,71 0,0007 0,007 Duration of the first division, min 13,41 ± 3,56 16,41 ± 2,46 second division, h 35,87 ± 1,16 43,27 ± 6,40 0,0004 0,005 Interval from 2 cell to 3 cell embryo, h 8,37 ± 1,25 11,60 ± 4,20 0,005 0,017 Third division, h 38,33± 2,83 44,93 ± 8,47 0,005 0,017 Interval from 3 cell to 4 cell embryo, h 2,40 ± 0,90 2,99 ± 1,01 Fourth division, h 44,81 ± 1,35 53,37 ± 3,63 0,001 Interval from 4 cell to 5 cell embryo, h 5,65 ± 2,07 11,67± 3,28 0,004 Interval from 5 cell to blastulation, h 122,07 ± 10,82 Interval from fertilization to blastulation, h 173,0 ± 10,9 Oocyte size, microns 151 ± 0,8 151 ± 0,8 The blastomer's division into two equal parts without fragmentation signs was assessed as normal ( Figure 1). If two blastomeres of unequal size were formed during division (Figure 2A), or nuclear free fragments of cytoplasm were formed in the perivitelline space (Figure 2B), or the
Figure 1: Normal development of the pre implantation cattle embryo. A the appearance of the first mitotic cleavage furrow; B the end of the first mitotic division, the formation of a 2 cell embryo; C 3 cell embryo; D 4 cell embryo; E 5 cell embryo; F blastomeres compactification, morula formation; G the beginning of blastulation; H expanded blastocyst.
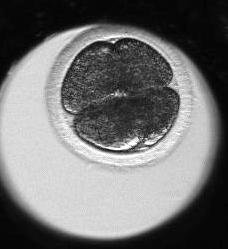


Abnormal development features included recursive division reabsorption cases of blastomeres or large cytoplasm fragments (Figure 4) (8% of embryos), as well as cases of blastomeres' exclusion from compaction and blastocyst formation (Figure 5) (6%).
Figure 4: Reversive division.
http://TuEngr.com Page | 5 blastomer was split into 3 or more parts (Figure 3A B), then the division was considered abnormal. Unequal mitotic division was found in 12% of embryos, blastomer division into more than two parts in 6% of embryos, and fragmentation in 4% of embryos. A B
Figure 2: A unequal first division with the formation of blastomeres of different sizes. B formation of cytoplasmic fragments.
Figure 3: Division of the embryo into three blastomeres: A the formation of the division furrow, B the end of cytokinesis


The most common anomaly observed in human IVF embryos is cytoplasmic fragmentation. This indicator is considered in all classification systems and is a key parameter determining the quality of embryos since it is known that the presence of fragmentation reduces the viability of embryos and the likelihood of their implantation into the uterus [2]. However, according to the authors' data, fragmentation was extremely rare in cattle embryos only in 4% of cases. More often, fragmentation occurred repeatedly in the same embryo; but the greatest impact on development was the fragmentation that occurred during the very first embryo's mitosis. During cytoplasm fragments' formation at later stages of development (6 8 cell embryo), their presence did not
Figure 5: In t he morula stage, one of the blastomeres is excluded from compaction.
http://TuEngr.com Page | 6
Discussion
According to the results, in cases where the embryo forms more than one cleavage furrow and splits into three or more blastomeres, the probability of blastocyst formation is very low, which is consistent with the data of other authors obtained on pre implantation human embryos. Such cytokinesis anomalies are caused by disorders of the spindle and incorrect chromosome divergence [11]. If such mitotic disorders occur at the very first mitotic division, the embryo carries numerous chromosomal abnormalities that lead to the arrest of its development [12].
4
Time lapse cultivation allows processing the maximum amount of information on the development of pre implantation embryos, including morphological disorders that are not observed in the traditional assessment of embryo cleavage. Figure 1 shows the stages of the first cattle embryos' mitoses, while all divisions occur without the occurrence of cytoplasm fragmentation and the embryo forms an expanded blastocyst on the 8th day of development. The duration of the first cell cycles (time intervals of the first and three subsequent divisions of the embryo) determines the compaction probability and the embryo reaching the blastocyst stage (Table 1). Embryos which development did not fit into these parameters did not form a blastocyst and stopped at different stages of development. One of the reasons for such delayed cleavage may be multiple chro mosomal pathologies; so, in human embryos and primates, it has been shown that the frequency of chromosomal abnormalities is significantly higher in slowly dividing embryos [9, 10].

http://TuEngr.com Page | 7 prevent the further development of the embryo to the blastocyst stage. Moreover, during the formation of the morula, parts of the cytoplasm fragments did not participate in compactification and were excluded from further embryo development. Sugimura et al. obtained cattle embryos after hormonal stimulation of the ovaries and observed a higher potential for implantation into the uterus in embryos with correct mitotic division (into two blastomeres of equal size without fragmentation) (66.7%) than in embryos with abnormal division (33.3%) [13]. Similar data were obtained on human embryos and primates [14,15].
Two other important parameters are cytoplasmic vacuoles and multi nucleation of blastomeres. Multi nucleation the presence of more than one nucleus in the blastomere is one of the signs of chromosomal abnormalities in the embryo. However, this indicator cannot be tracked in cattle embryos either by conventional microscopy or by time lapse due to the abundance of lipid granules in the cytoplasm. Vacuoles in the cytoplasm appear either as a result of vesicles' fusion from the Golgi apparatus, or smooth endoplasmic reticulum, or are formed spontaneously [16]. The presence of vacuoles in the cytoplasm is an unfavorable prognostic trait since it can lead to the displacement of the meiotic spindle and disruption of the cytoskeleton; it also indicates the processes of apoptosis in the embryo [17]. In this study, there were no cattle embryos with vacuolization at early cleavage stages.Thus, slowly dividing embryos had low viability and low potential for blastocyst formation. Conversely, viable embryos had shorter cell cycles. The authors' data are consistent with Sugimura data obtained on cattle embryos after hormonal ovarian stimulation [18].
5 C onclusion
7 Acknowledgments
Data can be made available by contacting the corresponding author.
The research was supported by a grant from the Russian Science Foundation, Project No. 19 76 10022
6
Time lapse cultivation allows the processing of the maximum amount of information on early embryo development, including such morphological disorders that are not observed in the traditional assessment of embryo cleavage at certain time intervals. This study used the time lapse technology to monitor the development of pre implantation cattle embryos obtained from unstimulated ovaries. It was shown that the temporal and morphological characteristics of the first and three subsequent embryo divisions determine compaction probability and the embryo reaching the blastocyst stage. Embryos whose development did not fit into these time parameters did not form a blastocyst and stopped at different stages of development. Availability of Data and Material
[7] Kochan, J., Nowak, A., Kij, B., Prochowska, S., Niżański, W. (2021). Analysis of Morphokinetic Parameters of Feline Embryos Using a Time Lapse System. Animals (Basel) 11(3), 748.
[1] Lewis, W.H., Gregory, P.W. (1929). Cinematographs of living developing rabbit eggs. Science, 69, 226 229.
[15] Lundin, K., Park, H. (2020). Time lapse technology for embryo culture and selection. Ups J Med Sci. 125(2), 77-84.
[11] Sathananthan, A.H., Kola, I., Osborne, J., Trounson, A., Ng, S.C., Bongso, A., Ratnam, S.S. (1991). Centrioles in t he beginning of human development. Proc Natl Acad Sci U S A. 88(11), 4806 10.
[12] Wong, C.C., Loewke, K.E., Bossert, N.L., Behr, B. De Jonge, C.J., Baer, T.M., Reijo, R.A. (2010). Pera. Non invasive imaging of human embryos before embryonic genome activation predicts development to the blastocyst stage. Nat Biotechnol. 28(10), 1115 21.
[8] Suzuki, R., Okada, M., Nagai, H., Kobayashi, J., Sugimura, S. (2021). Morphokinetic analysis of pronuclei using time lapse cinematography in bovine zygotes. Theriogenology 166, 55 63.
http://TuEngr.com Page | 8 8 References
[13] Sugimura, S., Akai, T., Somfai, T., Hirayama, M., Aikawa, Y., Ohtake, M., Hattori, H., Kobayashi, S., Hashiyada, Y., Konishi, K. Imai. K. (2010). Time lapse cinematography compatible polystyrene based microwell culture system: a novel tool for tracking the development of individual bovine embryos. Biol Reprod . 83(6), 970 8.
[14] Li, M., Wang, Y., Shi, J. (2019). Do day 3 embryo grade predict day 5 blastocyst transfer outcomes in patients with good prognosis? Gynecol Endocrinol. 35, 36 9.
[6] Pribenszky, C., Losonczi, E., Molnár, M., Lang, Z., Mátyás, S., Rajczy, K., Molnár, K., Kovács, P., Nagy, P., Conceicao, J., Vajta, G. (2010). Prediction of in vitro developmental competence of early cleavage stage mouse embryos with compact time lapse equipment. Reprod Biomed Online 20(3), 371 9.
[4] Mateusen, B., Soom, A.V., Maes, D.G.D., Donnay, I., Duchateau, L., Lequarre A.S. (2005). Porcine embryo development and fragmentation and their relation to apoptotic markers: a cinematographic and confocal laser scanning microscopic study. Reproduction 129(4), 443 52.
[9] Magli, M.C., Gianaroli, L., Ferraretti, A.P., Lappi, M., Ruberti, A., Farfalli, V. (2007). Embryo morphology and development are dependent on the chromosomal complement. Fertil Steril 87(3), 534 41. [10] Daughtry, B.L., Chavez, S.L. (2018). Time Lapse Imaging for the Detection of Chromosomal Abnormalities in Primate Preimplantation Embryos. Methods Mol Biol. 1769, 293 317.
[3] Gonzales, D.S., Pinheiro, J.C., Bavister, B.D. (19 95). Prediction of the developmental potential of hamster embryos in vitro by precise timing of the third cell cycle. J Reprod Fertil. 105(1), 1 8.
[5] McKiernan, S.H., Bavister , B.D. (1994). Timing of development is a critical parameter for predicting successful embryogenesis. Hum Reprod . 9(11), 2123 9.
[2] Meseguer, M., Herrero, J., Tejera A., Hilligsøe, K.M., Ramsing, N.B., Remohí, J. (2011). The use of morphokinetics as a predictor of embryo implantation. Hum. Reprod , 26, 2658 2671.
http://TuEngr.com Page | 9
Isaeva Albina Gennadievna is a Doctor of Biological Sciences, Associate Professor. She is interested in immune status, Dietarymicrobiology,supplements, Productive, Ecology, Productive animals. Moiseeva Ksenia Victorovna is interested in Molecular Biology, Farm Animals, Microbiology Petropavlovskiy Maxim Valerievich is a candidate in biological sciences. His research interests are Virology, Immunology, Microbiology, Molecular Biology, Virology, Epidemiology, Epizootiology, Bovine Leukaemia Virus, Syncytium Test, Polymerase Chain Reaction, Phylogenetic Analysis, DNA Sequencing.
[16] Van Blerkom, J. (1990). Occurrence and developmental consequences of aberrant cellular organization in meiotically mature human oocytes after exogenous ovarian hyperstimulation. J Electron Microsc Tech 16(4), 324 46. [17] Ebner, T., Moser, M., Sommergruber, M., Gaiswinkler, U., Shebl, O., Jesacher, K., Tews, G. (2005). Occurrence and developmental consequences of vacuoles throughout preimplantation development. Fertil Steril. 83(6), 1635 40. [18] Sugimura, S., Akai, T., Imai, K. (2017). Selection of viable in vitro fertilized bovine embryos using time lapse monitoring in microwell culture dishes. J Reprod Dev. 63(4), 353 357.
Dr.Makutina Valeria Andreevna holds a Ph.D. in Biological Sciences. Her research interests are Cattle Embryology, Gene Editing, Assisted Reproductive Technologies Dr.Krivonogova Anna Sergeevna is an Associate Professor. She holds a Doctor of Biological Sciences. She is interested in Molecular Genetic Technology, farm Animals, Microbiology, Radiation Biology, Radiation Technology, Biotechnology, Food, Food Safety, Animals and Human Health


April Accepted202203
Rapid Calculation of Well Productivity
Arfanezhad1 *, Poplygin Vladimir
Paper ID: 13A6G Volume 13 Issue
Ashkan Valerievich1
Keywords: Gas Uncertainty;productivity;reservoir;condensateWellDew
The calculation of well efficiency in gas condensate reservoirs is a significant challenge. Condensate Blockage is assumed as one of the most serious hurdles in Iran’s gas reservoirs. When the pressure falls below the dew point pressure, the lower the pressure, the more condensed liquid is formed in the reservoir. Due to the higher pressure difference, this phenomenon is very common in near wellbore regions. If liquids are formed in the reservoir, in addition to the economic losses due to the retention of components with hydrocarbon value, they will also reduce the gas relative permeability and well productivity. The productivity calculation in gas condensate wells requires performing numerical simulations and downscaling technique of the local grids around the wellbore. Otherwise, the effects of gas velocity as well as the phenomenon of condensate formation around the wellbore are ignored in the calculations, which leads to inaccurate well productivity estimates. The mentioned complexities make the calculati on of gas condensate well productivity more time consuming while using the numerical simulation method. This paper introduced an analytical method for the rapid calculation of well productivity by considering the effects of velocity and condensate formation around the wellbore with different geometric shapes, including vertical, horizontal, and hydraulically fractured wells. Then, using Monte Carlo simulation, the effects of uncertainty in different input parameters upon the productivity coefficient were investigated and ultimately a model was presented.
Received
International Transaction Journal of Engineering, Management, & Applied Sciences & Technologies http://TuEngr.com
Disciplinary: Petroleum Engineering & Technology ©2022 INT TRANS J ENG MANAG SCI TECH. Cite This Article: Arfanezhad, A., Valerievich, P. V (2022). Rapid Calculation of Well Productivity in Gas condensate Reservoirs. International Transaction Journal of Engineering, Management, & Applied Sciences & Technologies, 13(6), 13A6G, 1 14. http://TUENGR.COM/V13/13A6G.pdf DOI: 10.14456/ITJEMAST.2022.112
National Research Polytechnic
in Gas-condensate Reservoirs
a: half of the major radius of the drainage ellipse around the wellbore
1Perm University, Perm, RUSSIA. (Email: arfanejad@ gmail.com). 6 01 March 2022 in revised form 26 May 2022 10 May 2022 point Condensate well, well;
pressure;
Fractured well Abstract
Page | 1 ©2022 International Transaction Journal of Engineering, Management, & Applied Sciences & Technologies ISSN 2228 9860 eISSN 1906 9642 CODEN: ITJEA8
*Corresponding Author
Available online
Received
Horizontal
Nomenclature
blockage; Vertical

Pi = initial reservoir pressure (psia)
µ = fluid viscosity (cp)
Fevang and Whitson [15] presented the most effective method for calculating gas productivity using the pseudo pressure equation. They provided an accurate method for modeling the productivity of gas condensa te wells. Well productivity was introduced using a modified form of the pseudo pressure equation of Evinger and Muskat used to consider the available gas in the oil phase [3].In this method, the gas/oil ratio along with the reservoir oil properties and relative permeability functions is required to calculate the pseudo pressure. Mott [4] and Xiao and [5] then
Using hybrid simulations, Fussel proved that the O'Dell and Miller’s equation, by considering the available gas in the liquid phase, estimates the productivity reduction much more than usual [2].
k:
O'Dell and Miller used the gas rate equation to describe the effect of Condensate Blockage using a pseudo pressure function for the first time. However, their equation was valid only when the pressure was higher than the dew point pressure in most of the reservoirs, and there was only a partial accumulation of condensate around the wellbore [1].
D: non Darcy flow coefficient permeability (md) kro, krw, krg = oil, water, and gas relative permeability
A: flow cross section area (ft2)
b: half of the minor radius of the drainage ellipse around the wellbore
The calculation of well efficiency in gas condensate reservoirs is one of the significant challenges in such reservoirs. Condensate Blockage is assumed as one of the most serious hurdles in Iran’s gas reservoirs. When the pressure falls below the dew point pressure, the lower the pressure, the more condensed liquid is formed in the reservoir. Due to the higher pressure difference, this phenomenon is very common in near wellbore regions. If liquids are formed in the reservoir, in addition to the economic losses due to the retention of components with hydrocarbon value, they will also reduce the gas relative permeability and we ll productivity.
Pres = reservoir pressure (psia)
B: formation volume factor (ft3/SCF)
Pwf = bottomhole pressure (psia)
P1 = regions 1 and 2 boundary pressure (psia)
Pdew = dew point pressure PV = pore volume (ft3)
Introduction
L = horizontal well length (ft)
qg = produced gas flow rate (MSCFD)
1
http://TuEngr.com Page | 2
Lf = hydraulic fracture length (ft)
http://TuEngr.com Page | 3
proposed methods for estimating the radius of the two phase region of the reservoir that no longer needed to calculate the gas/oil ratio in pseudo pressure equations.
Although the hybrid simulation method is an accurate and efficient approach, the need for simpler methods for rapid engineering calculations was also demanded, where the method proposed by Fevang & Whitson could fulfil this requirement.
The rate equation for pseudo steady state (PSS) condition of gas condensate production with any geometric structure (radial, vertically fractured, and horizontal) is based on the black oil data as brought in equation [6].
Region 1: The innermost area around the wellbore which includes the simultaneous
1.2 Flow Regions
1.1.1ReservoirsEquationof
Using the proposed productivity model, Fevang and Whitson [15] showed that the results of Fine Grids Simulation can be obtained again by the pseudo pressure equation. Either in single well reservoirs, using Fine Grids around the wellbore, or in models with more wells, using Grids Refinement around the wellbore, the most accurate method for calculating the productivity of condensate gas wells is microgrid numerical simulation.
����g = ���� ∫ ( ������������ �������� �������� �������� + ������������ ����g���� ����g )�������� ������������ �������� (1), Where ���� = 2������������ℎ ln( �������� �������� ) 0 75+���� (2). In [7], the value of α can be 0.00112719 and 1 in the field and the standard units, respectively. The value of γ is a function of the typical characteristics of the reservoir as well as the effects of non ideal flow including formation damage, well stimulation, drainage form, and partial penetration.Thecondensate
blocking effect is calculated within the pseudo pressure integral equation. To calculate the pseudo pressure integral, Fevang and Whitson [15] divided the reservoir into several areas, which will be discussed in the following.
An accurate but simple estimate of the gas condensate reservoirs requires the definition of three flow regions within the reservoir.
In this paper, we first introduced an analytical method for the rapid calculation of well productivity in gas condensate reservoirs. Then, the effects of uncertainty upon the productivity coefficient of vertical, horizontal, and hydraulically fractured gas condensate wells were investigated and analyzed.
Gas- condensate Reservoir Rate
1.1 Rapid Calculation of Well Produc tivity in Gas condensate
Region 3: This region includes the part of the reservoir that has a higher pressure than the dew point pressure and its volume decreases over time due to the drop in reservoir pressure. The fluid in this
Region 2: is the condensate accumulation zone, but only gas can move Region 3: where only gas exists.
movement of oil and gas into the reservoir .
Figure 1: The flow regions in gas condensate reservoirs
The most important reason for the decrease in gas condensate well productivity is the existence of region one, which is due to the high volume of leaked condensate in this region. It must be noted that the size of this region increases over time.
http://TuEngr.com Page | 4
Over time, one, two, or all three regions may be present when producing from a reservoir. These three regions give rise to a pseudo steady production condition, which indicates the stable condition at a particular time and change in the drainage of the reservoir.
Region 1: The composition of the moving fluid in this area is constant. This means that the single phase gas fluid that enters region 1 is the same fluid produced in the form of gas and condensate from the well. In other words, if the composition of the produced fluid is known, the composition of the flowing fluid inside region 1 is determined and the dew point pressure of the generated fluid at the reservoir temperature is the pressure of the outer radius of the first region, p1.
Region 2: This region, if there is one (which it usually is), is the area where the condensate just collects and has no movement. The saturation in the second region is equal to the liquid phase saturation diagram in the constant volume drainage test regarding the reservoir water saturation. The size of this region is maximum primarily when the well pressure falls below the dew point pressure and decreases over time due to the increase in the volume of the first region. When the reservoir fluid enters this region, its concentration decreases and causes the produced fluid to have a lower concentration than the initial concentration in the reservoir.

2.1
http://TuEngr.com Page | 5 region is the initial fluid in the gas condensate reservoir.
b. Assuming the PSS condition in the reservoir, the first trial for the average reservoir pressure Pres corresponding to the stabilization period time is calculated using Equation ( 3): [13].
Since at the end of the stabilization period, the flow rate and Pwf are known and are equal to qg, cons and Pwf, min , respectively, Equation 6 is written for the estimated value of Pres to calculate the experimental value of P1. If the production time is shorter than the reservoir life of the tank, the average reservoir pressure is reduced by ∆P and the calculations are repeated from step B. Otherwise, the production profiles will be plotted and the program will end.
pres = pi + �pwf,min pwf,int� (3), ����g = ���� ∆����(����) ∆���� (����) = �∫ ������������ �������� �������� ���������������� ���������������� �������� + ∫ ������������ �������� �������� ������������ ������������ ����1 + ∫ ( ������������ �������� �������� + �������� �������� �������� �������� )����1 ������������ ��������� (4).
Model Validation
In order to validate the introduced model, the results of this model are compared with the results obtained from a hybrid commercial simulator. Numerical simulation is considered as a single well model with a radius of 0.58 ft with fine grids around the wellbore and in the center of a homogeneous reservoir with dimensions of 6000 × 6000 ft. The average porosity and permeability of the reservoir are assumed to be 10% and 50 md, respectively. To avoid numerical error due to grid dimensions in the hybrid simulator, the simulation was repeated by dwindling the grid dimensions. When the results did not change as the grid size became smaller, the grid dimensions were selected as the optimal dimensions for comparison with the analytical model. Several samples of condensate gas with condensate to gas ratios of 166, 71 and 7.32 bbl/1000ft3 were used as rich, medium and light condensate fluids, respectively. Different reservoir rock samples have been tested for relative gas and oil permeability. The relative permeability of each sample is estimated using Corey Equation. The pertinent parameters of the rock samples used in the validation stage are given in Table 1. Also, in terms of the effects of velocity on relative permeability and in order to coordinate it with the analytical model, the key
a. Using the dry gas equation, the initial bottom hole pressure, P wf,in, corresponding to Pi is determined.
2 Calculation Algorithm
The calculation algorithm of the gas production profile in this study is divided into two subsections. The first section is the time values less than the stabilization period time when the flow rate is constant and equal to qg, cons. The second section refers to the time values greater than the stabilization period where the bottomhole pressure is constant, Pwf. [8,9].
In the first section, the trend of the gas production profile is constant, but the ultimate time of the stabilization period is unknown. To determine the stabilization period time, the following steps are performed [10, 11, 12].
Figure 4: Comparison of production changes in (a) gas, (b) condensate for the rich fluid sample and the third rock sample in the horizontal well for both analytical and simulation models. To ensure the accuracy of the results of this model for horizontal and fractured wells, samples of such wells have also been examined. Therefore, for each well with a specific geometric shape, the results of the analytical model and numerical simulation were determined for six different rock and fluid samples. Table 2 summarizes the average error of di fferent rock and fluid samples in the results of the developed analytical model compared to the numerical simulator for three different well geometries (as a percentage). A comparison of gas and condensate production profiles for one of the cases with the highest observed error (horizontal well for rock sample 3 with rich fluid) is illustrated in Figure 4. As can be seen from Table 2, the average error rate is less than 5%, which is quite acceptable in petroleum engineering calculations. The average time to perform the calculations in the analytical model (in the range of less than 1 min) is faster than the numerical simulator (in the range of 10 min). However, the advantage of the analytical model is not in the execution speed, but it is due to the possibility of performing sensitivity analysis on reservoir and well data and its effect on the duration of gas and condensate stabilization period and the produced volume of gas and condensate. In order to investigate the effect of uncertainties in both numerical and analytical methods and to limit the difference between the results of these two approaches, the porosity parameter has been selected as the uncertain parameter. Porosity was considered as a normal distribution function with a median of 0.1 and a standard deviation coefficient of 0.08. Table 1: Corey equation parameters for plotting relative permeability diagrams x SomaSominnok romaxSgmaxSgminngk rgmaxSwiRock Type 0.6 0.151.5 0.30.90.3 1.5 0.60.1 SCAL 1 0.351.54.5SCAL 2 0.3533SCAL 3
http://TuEngr.com Page | 6 related to Veldep dependent permeability as well as the Whitson empirical correlation have been employed in the numerical simulator.
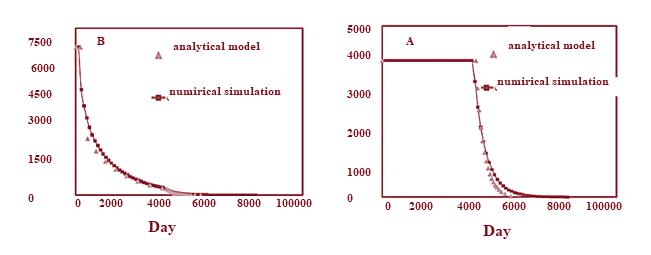
the
The cumulative production values for gas and condensate after 40 years as well as the duration of the gas stabilization period for one thousand times run by Monte Carlo method for both analytical and numerical approaches are compared in Table 3 .
In this section, the effects of uncertainty of different well and reservoir parameters on the values of cumulative gas production, cumulative condensate production and stabilization period will be investigated. For this purpose, Monte Carlo analysis methods have been utilized. Thus, for each study, a thousand probabilities are set for the desired uncertain parameter, and for each probability, the cumulative production values of gas and condensate, as well as the length of the stabilization period are calculated by the method introduced in this paper, and then are analyzed by employing the tornado diagram. In the following, the medium fluid and the relative permeability form of rock No. 4 are also considered as the sample fluid and the reference diagram of the relative permeability of the reservoir rock. The production profile of this reservoir is shown in Figure 5. The results of the uncertainty studies of vertical, horizontal and fractured wells data are given below.
Wellsimulatorshape
Table 3 Possible values for calculating the productivity of a vertical gas condensate well for uncertainty in the input data. gas production (billion ft3) Cumulative condensate production (million bbl)0.2780.234 Stabilization time (days)15.64 vertical gas condensate well production for base state
Table 2. Comparison of the results of the analytical model and numerical
:
Bottomhole pressure profile (psia) Gas flow rate profilecondensateProducedprofile StabilizationperiodperiodStabilizationlength vertical2.51.842.032.2 horizontal¼3.233.73.6 Hydraulic fracture1.891.462.12.67
2.2
ParameterPossible resultsAnalyticalP50 modelNumerical model Cumulative
12.612.93
http://TuEngr.com Page | 7
15.77 Figure 5: Changes in
Sensitivity Analysis of the Uncertain Data

Skin factorUniform distribution with a minimum value of 3 and a maximum of 10 stabilization period rate (billion ft3)Uniform distribution with a minimum value of 30 and a maximum of 50 permeabilityNormal log distribution with a median of 20 md and a standard deviation of 40 md
Outer radius of the reservoir Triangular distribution with a minimum value of 2500 ft, an average of 3000 ft, and a maximum of 3500 ft MinimumpressurebottomholeUniform distribution with a minimum value of 1000 psia and a maximum of 1500 psia
2.3 Vertical Wells
In this section, the sensitivity analysis is performed upon the input data in accordance with Table 4 for the vertical gas condensate well in order to find the important parameters affecting the well productivity. Table 5 shows the values of P10, P50, and P90 for the stabilization period and the cumulative production of gas and condensate after 40 years
Table 4. Probability distribution function of input data for studying the sensitivity analysis of vertical gas condensate well Input dataDistribution function
http://TuEngr.com Page | 8
Based on the results in Table 5, the probable range of results for the stabilization duration as well as the cumulative production of gas and condensate is wide. To show the effect of each uncertain parameter in the input data upon the output results, the tornado diagram is plotted in Figures 6 to 8. According to Figure 8, to reduce the cumulative gas production range, uncertainty in porosity, permeability, initial water saturation, minimum bottomhole pressure and external radius of the reservoir should be more limited. According to the results of Figure 7, porosity, permeability and external radius of the reservoir are the most important uncertain parameters affecting the cumulative production of condensate in the vertical gas condensate well. According to Figure 8, the reduction in permeability uncertainty, skin factor, porosity, initial water saturation, minimum bottomhole pressure, and flow rate can lead to a reduction in the stabilization period duration in vertical gas condensate wells. Based on Figures 6 and 7, porosity is the most important factor affecting the cumulative production of gas and condensate. According to Figures 6 and 7, porosity is the most significant factor affecting the cumulative production of gas and condensate. This can be attributed to the direct effect of porosity on the volume of gas and condensate. Uncertainty in porosity also affects the duration of the stabilization period. However, according to Figure 8, the contribution of permeability and skin factor over the stabilization period is greater. It should be noted that based on the expectation and according to the Tornado diagram in Figure 8, the permeability and the duration of the stabilization period have a negative correlation and the higher permeability estimate causes a lower estimate of the stabilization period.
Initial water saturationUniform distribution with a minimum value of 0.05 and a maximum of 0.4 porosityNormal distribution with a median of 0.1 and a standard deviation of 0.08 K rgmaxNormal log distribution with a median of 0.58 and a standard deviation of 0.2 ngUniform distribution with a minimum value of 1.5 and a maximum of 3
Cumulative gas production (billion ft3 standard)6.6712.620.63 condensate production (million barrels)0.04530.2750.134 Stabilization time (days)4.5215.6428.77
Figure 7: Tornado diagram to show the effect of uncertainty in each of the input data on the cumulative condensate production for the vertical well -15 -10 gas production(%) -20 -15 -10 condensate production (%)
Figure 6: Tornado diagram to show the effect of uncertainty in each of the input data on the cumulative gas production for the vertical well
Cumulative
-5 0 5 10 Impact rate Cumulative
. -20
-5 0 5 10 Impact rate Cumulative
http://TuEngr.com Page | 9 Table 5. Probable values for calculating the productivity in vertical gas condensate wells for uncertainty in the input data Parameter Probable results P90P50P10
Input dataDistribution function
Cumulative condensate production (million barrels)0.1440.2670.498 Stabilization time (days)8.921.730.7 -20 -15 -10 -5 rate time
Table 7: Probable values for calculating the productivity in horizontal gas condensate wells for uncertainty in the input data.
(%)
Horizontal well lengthUniform distribution with a minimum value of 1000 ft and a maximum of 4000 ft Reservoir lengthUniform distribution with a minimum value of 4000 ft and a maximum of 7000 ft reservoir thicknessUniform distribution with a minimum value of 4000 ft and a maximum of 7000 ft
Skin factorUniform distribution with a minimum value of 3 and a maximum of 10 Stabilization period flow rate (billion ft3)Uniform distribution with a minimum value of 30 and a maximum of 140 Permeability (md)Normal log distribution with a median of 20 md and a standard deviation of 40 md Initial water saturationUniform distribution with a minimum value of 0.05 and a maximum of 0.4 PorosityNormal distribution with a median of 0.1 md and a standard deviation of 0.08 K rgmaxNormal log distribution with a median of 0.58 md and a standard deviation of 0.2 md ngUniform distribution with a minimum value of 1.5 and a maximum of 3
0 5 10 Impact
Table 6: Probability distribution function of input data for studying the sensitivity analysis of horizontal gas condensate well
Figure 8: Tornado diagram to show the effect of uncertainty in each of the input data on the duration of the stabilization period for the vertical well.
Stabilization
2.4 Horizontal Wells
Table 7 shows the values of P50, P10, and P90 for the stabilization period as well as the cumulative gas and condensate production after 40 years in horizontal gas condensate wells. To show the effect of each uncertain parameter in the input data upon the cumulative gas production, a tornado diagram is plotted in Figure 6.
http://TuEngr.com Page | 10
In this section, the sensitivity analysis is performed on the input data in accordance with Table 6 for horizontal gas condensate wells to find the important parameters affecting the well productivity.
Cumulative gas production (billion ft3 standard)7.5812.6812.57
Parameter Probable results P90P50P10
2.5
In this section, the sensitivity analysis is performed upon the input data according to Table 6 for gas condensate wells with hydraulic fractures to find the important parameters affecting the well productivity. The fracture length in this analysis is considered to be uniformly distributed with a minimum value of 100 and a maximum of 400 ft. Table 8 shows the values of P10, P50, and P90 for the stabilization period as well as the cumulative production of gas and condensate after 40 years for gas condensate wells with hydraulic fractures. To show the effect of each uncertain parameter in the input data upon the output results, a tornado diagram is plotted in Figure 10. -20 -15 -10 -5 rate
According to Figure 9, the uncertainty parameters affecting the cumulative gas production in horizontal gas condensate wells are porosity, K rgmax (SCAL data), and initial water saturation.
0 5 10 Impact
http://TuEngr.com Page | 11
Figure 9: Tornado diagram to show the effect of uncertainty in each of the input data on the duration of the stabilization period for the horizontal well .
Hydraulically fractured Wells
According to the interpretation of the Tornado diagram results for the condensate cumulative production, porosity, permeability, initial water saturation, and Krgmax (SCAL data) is the most significant uncertain parameters affecting the cumulative production of condensate in the horizontal gas condensate wells. Based on the interpretation of tornado diagram results for the duration of the stabilization period, uncertainty in permeability, porosity, skin fac tor, initial water saturation has an important effect on determining the duration of the stabilization period in horizontal gas condensate well. In the sensitivity analysis related to horizontal wells, due to the significance of porosity on the number of hydrocarbons in place, it has the greatest effect on the cumulative production of gas and condensate as well as the duration of the stabilization period. In horizontal wells, as expected, permeability has a negative correlation with the duration of the stabilization period and thus is assumed as the most important parameter with uncertainty. It should be noted that the stabilization period flow rate, as well as the length of the horizontal well, do not affect the volume of cumulative production of gas and condensate. This is due to the fact that these parameters affect the well production and have no effect on the reservoir ultimate recovery. Also, the stabilization period flow rate and the length of the horizontal well have a minor effect on the duration of the stabilization period and the cumulative production of gas and condensate phases.
Cumulative gas production (%)
http://TuEngr.com Page | 12
. Parameter
Figure 10: Tornado diagram to show the effect of uncertainty in each of the input data on the cumulative gas production in the fractured gas condensate well
According to the interpretation of the Tornado diagram results for the cumulative production of condensate, porosity, minimum bottomhole pressure, and initial water saturation are the most important uncertain parameters affecting the cumulative production of condensate in a fractured gas condensate well. According to the interpretation of the tornado diagram results for the duration of the stabilization period, uncertainty in porosity, minimum bottomhole pressure, stabilization period flow rate, and initial water saturation have important effects on determining the duration of the stabilization period in gas condensate wells with hydraulic fracture. In wells with hydraulic fractures, porosity and initial water saturation, due to their considerable effect on in situ hydrocarbon volume, have the greatest uncertainty in the volume of hydrocarbon production as well as the duration of the stabilization period.
Table 8: Probable values for calculating the productivity in a hydraulically fractured gas condensate wells for uncertainty in the input data Probable results P90P50P10 Cumulative gas production (billion ft3 standard)7.7314.129.3 Cumulative condensate production (million barrels)0.1660.310.599 Stabilization time (days)5.410.320.7
According to Figure 10, the most important parameters with uncertainty affecting the cumulative gas production in gas condensate wells with hydraulic fractures include porosity, minimum bottomhole pressure, and initial water saturation.
In this well, because of the negative skin factor and thus the increase in permeability around the wellbore due to hydraulic fracture, uncertainty in the permeability parameter is not significant and the minimum bottomhole pressures as well as the stabilization period flow rate are effective in determining the duration of the stabilization period. Also, the length of the hydraulic fracture is less important than other parameters in determining the duration of the stabilization period -40 -20 0 20 40 60 80
Impact rate Cumulative gas production (%)
All information is included in this study.
[6] Mott R., “Engineering calculations of gas condensate well productivity,” SPE Reservoir Evaluation & Engineering, Vol. 6, No. 05, pp. 298 306, 2003.
[1] 'Dell, H. G., Miller, R. N., "Successfully cycling a low permeability, high yield gas condensate reservoir", paper SPE 1495 presented at the SPE 41st Annual Fall Meeting, Dallas, Texas, October 1966
[7] Murtha J., “Some challenges for monte carlo simulation,” The Way Ahead, Vol. 2, No. 02, pp. 13 18, 2006.
In this study, a rapid analytical method with Monte Carlo simulation was utilized to study the effects of uncertainty in the input data upon the probable results of productivity calculation in vertical, horizontal, and hydraulically fractured gas condensate wells.
[5] Xiao J.J., Ahmad J. AL Muraikhi; “A New Method for The Determination Gas Condensate well production performance SPE paper, 2004, SPE 90290
4
The results showed that in the reservoir model studied in this paper, the porosity is the most important input parameter with uncertainty in the probable results of the analytical model of the gas condensate well during the stabilization period, and the cumulative production of gas and condensate phases in wells with different geometric shapes. Porosity, permeability, skin factor, and initial water saturation were the most important uncertain parameters in calculating the duration of the stabilization period and hence making decisions for field development in the studied reservoir. It must be noted that the accurate determination of some parameters (such as empirical constants in correlations of velocity dependent relative permeability) is experimental, time consuming, and expensive. However, their changes do not have a significant effect on gas condensate well output results. The results of such a study guide the reservoir engineers to understand which of the uncertain reservoir data is more important and how the efforts and budgets need to be spent precisely to determine that specific reservoir data. Obviously, the most important uncertain data mentioned in this study was related to the reservoir and it is necessary to do a similar study for other gas condensate reservoirs. Also in this research, an analytical model for a homogeneous reservoir and a centralized well was developed. It is appropriate to develop such an analytical model to investigate the cases o f decentralized wells, the effect of heterogeneity in reservoir permeability, and the wells with different geometric shapes such as inclined ones.
http://TuEngr.com Page | 13 3 Conclusion
Availability of Data and Material
[2] Fussel, D.D., “Single Well Performance Prediction for Gas Condensate Reservoirs”, JPT (Jan 1973) 258: Trans., AINW, 255 [3] Fevang, and Whitson, C.H. “Modeling Gas Condensate Well Deliverability,” paper SPE 30714 presented at SPE Annual Technical conference and Exhibition, Dallas, Oct 1995.
5 References
[4] Mott, R.: “Engineering calculation of Gas Condensate well Productivity,” paper SPE 77551 presented at SPE Annual Technical and Exhibition, San Antonia, Oct 2002
[10] Panja P. and Deo M., “Factors that control condensate production from shales: surrogate reservoir models and uncertainty analysis,” SPE Reservoir Evaluation & Engineering, Vol. 19, No. 01, pp.130 141, [11]2016.Whitson
[14] Henderson Graeme D., Danesh A., Al kharusi B. and Tehrani D., “Generating reliable gas condensate relative permeability data used to develop a correlation with capillary number,” Journal of Petroleum Science and Engineeri ng, Vol. 25, No. 1, pp. 79 91, 2000.
[8] Luo H., Mahiya G., Pannett S. and Benham Ph. H., “The use of rate transient analysis modeling to quantify uncertainties in commingled tight gas production forecasting and decline analysis parameters in the alberta deep basin,” SPE Reservoir Evaluation & Engineering, Vol. 17, No. 02, pp. 209 219, 2014.
[15] Fevang Ø, Whitson CH. Modeling gas condensate well deliverability. SPE Reservoir Engineering. Vol.11, 04, pp.221 30, 1996
[9] Xiao J. J. and Al Muraikhi A. J., “A new method for the determination of gas condensate well production performance,” SPE Annual Technical Conference and Exhibition. Society of Petroleum Engineers, 2004.
[13] Diyashev I. R. and Economides Michael J., “The dimensionless productivity index as a general approach to well evaluation,” SPE Production & Operations, Vol. 21, No. 03, pp. 394 401, 2006.
C. H., Fevang Ø. and Saevareid A., “Gas condensate relative permeability for well calculations,” Transport in Porous Media, Vol. 52, No. 2, pp. 279 311, 2003.
Dr.Ashkan Arfanezhad is associated with Perm National Research Polytechnic University, Russia Dr.Poplygin Vladimir Valerievich is with Perm National Research Polytechnic University, Russia.
http://TuEngr.com Page | 14
[12] Jamiolahmady M., Sorabi M., Ireland S. and Ghahri P., “A generalized correlation for predicting gas condensate relative permeability at near wellbore conditions,” Journal of Petroleum Science and Engineering, Vol. 66, No. 3, pp. 98 110, 2009.


©2022 INT TRANS J ENG MANAG SCI TECH.
Impacting Students’ Happiness of Higher Educational Institutions: Comparative Analysis of Pre and During Pandemic Scenario
Paper
A
Received
Keywords: Happiness of students; Physical systemPandemiceducationalSocialPsychologicalfactors;factors;factors;Higherinstitutions;;Education;Student’sissues
&
1 Amity
Singh Anjali Devvrat1*, Harminder Kaur Gujral1, Niharika Joshi Bhatt2 Business School, Amity University Uttar Pradesh, Noida, INDIA. Blue Oceans Capital, Brisbane, AUSTRALIA.
*Corresponding Author (Email: anjali.d.singh@gmail.com). ID: 13A6H Volume 13 Issue 6 23 January 2022 in revised form 26 April Accepted202203 May 2022 online 10 May 2022
Abstract The happiness and well being of students are the prime focus of every educational institution. The pandemic forced us to once again think of a robust structure of curriculum that can stand firm in any such unseen futuristic conditions. An attempt has been made to study the effects of psychological, physical , and social factors contributing to happiness among students along with their comparative study before and during pandemic scenarios. Data was collected from 366 respondents through structured questionnaires both before and during the pandemic using convenience sampling. SPSS was used where paired t test was conducted to compare the before and during Covid 19 happiness of students. Happiness was found to be reduced during the pandemic. The physical factors impacted happiness the most closely followed by the psychological factors and social factors with no significant effect between before and during pandemic happiness. The research explored the difference between happiness scores and factors contributing to happiness amongst students in pre and during covid scenarios in the Indian context. Results may help educational systems to strategise curricula, maximise students’ happiness , and a more robust structure for future education systems .
International Transaction Journal of Engineering, Management, & Applied Sciences & Technologies http://TuEngr.com
Psychological Physical and Social Factors
ISSN 2228 9860 1906 9642
Available
Received
eISSN
Cite This Article: Devvrat, S. A., Gujral, H. K., Bhatt, N. J. (2022). Psychological & Physical and Social Factors Impacting Students’ Happiness of Higher Educational Institutions: A Comparative Analysis of Pre and During Pandemic Scenario. International Transaction Journal of Engineering, Management, & Applied Sciences & Technologies, 13(6), 13A6H, 1 11. http://TUENGR.COM/V13/13A6H.pdf DOI: 10.14456/ITJEMAST.2022.113
Disciplinary: Psychology, Education & Management.
Page | 1 ©2022 International Transaction Journal of Engineering, Management, & Applied Sciences & Technologies
CODEN: ITJEA8
2

Happiness is the measure of subjective well being. Many scientists gave their own form of definition for happiness like "what I experience here and now" Daniel Kahneman (Mandel, 2018). Students from that part of society that remains always active, happy going, full of excitement, ready to take up challenges , etc. Visiting college does not only provide education, more to it is disciple, routine, competitions, social bonding, fun, s haring feelings, etc. all make a part of it. Students in their growing phase were already trying to understand various aspects of life like managing the balance between remaining easygoing to becoming responsible for the future. This covid 19 suddenly added to their ambiguity in dealing with life. Happiness means the ability to self expression. The time has come when exploring, understanding , and addressing issues with students has become a priority of the education system before making it too late. A lot o f studies are going around in the world in this context, but few are conducted in the Indian context. This research tries to dig out the difference in happiness and
One of the most vulnerable sections of society is our young generation, the college going ones, who were forced to switch to online educa tion since the inception of the pandemic in the country. The students are that section of society that is always full of enthusiasm, have great energy, carry a lot of dreams for the future, have a passion for doing their best, etc. Any country’s future and development are completely based on the strong shoulders of youngsters. Students are always counted as building blocks of a flourishing society and so taking care of their happiness becomes the prime motive. Overnight switching from ever practiced physical classes to unimaginable complete online classes was not an easy task for the education system. This impacted every participant of this system starting from teachers, staff, and most importantly students. The daily physical exertion in commuting, attending classes, submissions, and various endless activities suddenly became nil. The life of sharing thoughts, feelings, aggressions , etc. with colleagues, teachers, mentors, etc. physically also came to an end.
The new mode of teaching though supported the education system in times of crisis , it impacted everyone in various ways. It affected both academicians and students. This paper deals with psychological, physical, and social issues that affected students’ happiness during the pandemic. The paper tries to unfold the gap, by comparing psychological, physical , and social contributors to the happiness of students before and during the pandemic. Further, this study attempts to suggest new and innovative practices for managing the happiness of students in this crucial time making the education system a more robust one.
http://TuEngr.com Page | 2
1. Introduction
The pandemic caused by a novel coronavirus (SARS CoV 2) has affected each sector and that too around the world. Covid 19 got originated in December 2019 in Wuhan, China, and enforced restrictions on travel, and gatherings, closing the education system by public authorities in several countries (Rabi et al., 2020). India got its first 1 lakh infection by 18th May 2020 and it reached up to 8.5 lakh by 11th July. Broadly it severely affected the economy and society (Nicola et al., 2020).
2. Conceptualisation
Happiness on one side can be described very deeply as a peaceful state of mind and body while on the other side it can be expressed as just a momentary smile on the face. It has several synonyms like contentment, joy, pleasure, cheerfulness, merry, etc. It is found that happiness is a positive perception of self relativity, but surely with no complete absence of negative emotions (Diener and Satvik, 1991). Graham et al. (2004) also found that various changes and fluctuations influence happiness and it’s based on one’s nature inherited from parents through genes. Further Sheldon & Lucas (2014) also found that one’s genes and nurture give specific points to their happiness. This study reassures that people facing good and bad times tend to come back a t a set point that is governed by their genes. Nes (2010) challenges this by stating that increment in happiness is not restricted by genes and thus opens the door for exploring methods, and interventions for increasing happiness.
3.2 Factors Affecting Happine ss during Pandemic
Covid 19 has not only brought the risk of mortality from infection but unsustainable pressure of psychosocial issues. In past also diseases like MERS brought along high levels of mental problems like anxiety, and aggression (Jeong et al., 2016). Similarly, covid also is resulting in mental health issues like panic attacks, depression, and anxiety (Ahorsu et al., 2020; Qiu et al., 2020). A lot of ways were adopted to handle pandemic s e.g. isolation, washing hands, quarantine, etc. which researchers concluded short and long term impacts of fear of infection, frustration, and boredom (Tian et al., 2020). The pandemic affected each and every section of society. It also impacted higher education students’ activities related to work of academi c and personal life because of various changes in routine activities. Suddenly switching from offline to online classes was not easy for students and their parents too. Lack of technological knowledge, unavailability of internet connectivity plus parents’ tremendous efforts in assisting and supervising their wards were some of the major hurdles posed by this pandemic all causing negative impacts and suggesting the need for innovative and offline e learning platforms to supplement classroom teaching benefiting students having issues (Owusu Fordjour et al., 2020). Comparing outdoor activities to indoor ones, Stieger et al. (2021) show that higher emotional well being is associated with outdoor ones, and spending greater time on screen is linked with lower well being. Talking about eating habits across ages largely got affected by various restrictions like self isolation, social distancing, quarantine,
3. Literature Review
factors contributing to it among students of higher educational institutions and find out i f those differ in their contributions during the pandemic. Further suggestions for practicing innovative techniques and inculcating those in curriculum design are given where student’s issues can be addressed in a better way.
3.1 Happiness
http://TuEngr.com Page | 3
disturbed daily routine activities, less outdoor activities , etc.(Di Renzo et al., 2020) and all these factors impacted physical activity too again across ages (Calcaterra et al., 2020).
Husain and Ashkanani (2020) showed a reduction in consumption of fast food and an increase in freshly made food greatly during the pandemic along with a reduction in physical activity and an increase in screen time plus sedentary behavior. Also detects an increase in a day time sleep and a decrease in nighttime sleep. Bracale and Vaccaro ( 2020) revealed that food habits took a change where long shelf life got recorded, decreasing the consumption of fresh green food goods. AlMughamis et al. (2020) found that unhealthy diets, anxiety, and consuming excessive snacks are more prone to have weight increase leading to psychological issues.
http://TuEngr.com Page | 4
Anxiety and depression are the two most reported issues which are increasing in the population (Burke et al., 2020) which are actually the repercussion of psychological well being, being negatively affected due to unforeseeable situations (Brooks et al., 2020). Anxiety is found to be positively related to effects on the economy, physical activity, and delays in academic activities due to pandemics (Cao et al., 2020). This once again resulted in findings of moderate to severe anxiety in students of Changzhi medical college but interesting findings are that students living in urban areas, having a stable family income, and living with parents acted as protective factors towards anxiety while relatives and acquaintances infected with covid 19 increased anxiety amongst them (Cao et al., 2020).
Lund et al. (2010) found that an alarming stage is reached in the college student population where insufficient sleep and improper sleep wake patterns are diagnosed, needing urgent intervention programs for sleep disturbance. Romero Blanco et al. (2020) researched nursing students and showed that due to changes in their sleep patterns, areas got affected were their performances, behavior, and eating habits. Further pre and during lockdown data showed that sleep quality was worse during lockdown although time spent in bed was high.
The pandemic disrupted university student’s life too along with the whole world. Talking student learning performances, it was found to be improved during Covid 19 confinement, as a change is seen in learning habits which have become more continuous (Gonzalez et al., 2020). The study revealed that students were satisfied by the support given by university public relations and teaching staff but their perception of higher performance was found to be affected due to lack of computer skills and higher workload. In the end, the research analysed that students studying in Europe with better living standards (ability to pay fees), the ones more satisfied with academic work/life, social science students, more hopeful and less bored ones showed greater satisfaction with university activities and measures during the crisis of covid 19 (Aristovnik et al., 2020). One of the studies conducted on Italian adolescents aged 15 21, in relation to the ongoing pandemic investigated lifestyle behaviors and coping strategies. The study revealed adaptation with coping strategies like daily routine planning, engaging in constructive activities, and exploring new interests. Though found tough to stay at home, revaluation of family relationships, and maintaining contact with friends, teachers were also part of coping strategies. The s tudy showed
The objectives of this study are to • Explore the difference in the happiness experienced by students of higher educational institutions before and during the pandemic.
http://TuEngr.com Page | 5 frequent anxiety symptoms and some changes in subjective well being due to various coping strategies (Pigaiani et al., 2020).
Thecontributions.datacollection was performed in two phases, one before the pandemic February March 2020, and another during pandemic from January to February 2021. For the pre pandemic and during pandemic data, 366 higher education students were surveyed through a self structured questionnaire with a five point Likert scale having a Cronbach’s alpha of 0.877. 5. Re sults and Discussion
H1a: there is a difference in happiness among students before and during the pandemic H2a: there is a difference in contributing factors of happiness for students before and during the pandemic 4. Research Methodology
• Study the difference in contributing factors of happiness by students of higher educational institutions before and during the pandemic.
The research was conducted on higher education institution students before the pandemic to collect data and find out factors contributing to happiness among college going students. Simultaneously as the pandemic arrived, the study was extended and carried forward to see the difference in happiness among students before and during the pandemic. The further study statistically tested if the factors contributing to happiness before and during a pandemic also differ in their
For this study, questions based on physical, psychological , and social factors influencing happiness were analysed. Happiness scores for both collected data were then compared through SPSS, paired t test. Table I (Demographic Profile of Respondents) shows the demographic details of respondents both before and during the pandemic.
The pandemic forces us to re evaluate the guiding norms and reconstruct them (Honorato et al., 2020)and thus such reformulated norms can pose drastic changes in dealing with the education of the future workforce(Rose, 2020). Adolescents are crossing a very fragile phase of quick psychosocial and socio cognitive alterations on which their well being is dependent in long run. Another research talks about attitudes and behaviour among young students during the pandemic time. Students need to be adapted to new and more efficient technologies in daily and academic practices. Taking into consideration all the above perspectives, an alert and proactive intervention seems very important nullifying the effects of unhealthy lifestyles and dysfunctional behaviors for long term happiness and well being
Table 2: Paired Sample Statistics
Education UndergraduatesLevelPostgraduates
First SecondYearYearThirdYearFourthYearFirstYearSecondYear 1246450514829 13.113.913.733.917.57.9 103829190 24.624.928.122.4
Respondent’sProfile No. (N) Before Pandemic (%) No. (N) During Pandemic (%) Gender FemaleMale 197169 53.846.2 27096 26.273.8
Table 3: Paired Samples Test differencePaired IntervalConfidence95%oftheDifference
Mean N SD Std. Error Mean Happiness 1 217.72 355 20.28 1.08 Happiness 2 212.32 355 22.81 1.21 Happiness 1 indicates happiness before a pandemic, Happiness 2 indicates happiness during the pandemic Table III (Paired Samples Test) describes differences in happiness before and during the pandemic. The results are drawn with the help of Paired t test using SPSS. The findings show a significant difference between before and during pandemic happiness with t values of 3.211 for 354 degrees of freedom and at a significance level of 0.05. This means there is a significant difference between both measured happiness levels, so acceptin g H1a. Further on average before the pandemic happiness scores were 5.402 points higher than during the pandemic happiness (95% CI [1.682, 2.094]). This clearly shows that students were happier before the pandemic.
Mean SD Std.MeanError Lower Upper t df Sig.tailed)(2 Hypothesis Result Happiness 1 Happiness 2 5.402 31.697 1.682 2.094 8.711 3.211 354 0.001 Accepted Happiness 1 denotes before the pandemic, Happiness 2 denotes during the pandemic
Now, Table 4 (Paired t test for Constructs) depicts and compares the three constructs with their before and during pandemic scores as contributing factors to happiness. The findings show a significant difference between physical construct scores before and during the pandemic with t value of 4.112 for 365 degrees of freedom and a significance of 0.000. This means there is a significant difference between both measured physical construct scores, so rejecting null
Table II (Paired Sample Statistics) shows results for mean values of happiness in both cases where Happiness 1 denotes before the pandemic and Happiness 2 denotes during the pandemic with mean of 217.72 and 212.32 along with std. deviation as 20.284 and 22.811 respectively.
Table 1: Demographic Profile of Respondents
http://TuEngr.com Page | 6
The psychological construct also gets the same results by showing significant differences between before and during pandemic scores with t value of 2.95 for 363 degrees of freedom and a significance of 0.003. Again, accepting H2a. Psychological construct on an average scores 1.208 higher before the pandemic than during the pandemic, stating that students were psychologically stronger before the pandemic. Students use to share their feelings with friends, teachers, and mentors. They used to express themselves. Listening, speaking, reacting, etc. all are needed to have mental balance. In this new normal, everything and everyone being in virtual space makes it difficult to have mental balance.
http://TuEngr.com Page | 7 hypothesis 2 and accepting H2a. Further on average before the pandemic physical construct scores were 1.234 points higher than during the pandemic physical scores (95% CI [0.644, 1.825]), depicting students to be physically more fit before the pandemic. Students used to commute for classes daily, attending sessions, the daily routine of submissions, the team works, competitions and much more all add up to a physical aspect that is nil in the covid 19 situation.
HypothesisResult
Surprisingly social construct does not show a significant difference between before and during pandemic scores with t values as 0.017 for 365 degrees of freedom and significance as 0.986 which is higher than 0.05. So, accepting null hypothesis 2 and rejecting alternate hypothesis 2. Stating that students are socially active and happy. This could be the result of family contribution towards their well being in various forms like spending time with them, playing with them, helping with assignments , etc. These findings compel us to dig out more as to which factors are contributing to making the difference as significant. So, table IV (Paired t test for factors ) shows a detailed breakup for all 3 constructs into the factors considered in this research. Table V (Paired t test for factors ) reveals that factors like meal, sleep, exercise, attitude and stress measured a difference in their scores when compared before and during the pandemic. Here factors meal, sleep and exercise contribute to physical construct while attitude and stress towards psychological construct. Table 5 (Paired t test for factors) also shows that means of the meal, sleep, exercise, attitude, and stress are more for before pandemic scores than during pandemic scores by 0.175, 0.644, 0.437, 0.475. 0.286
Constructs Mean SD Std.MeanError Lower Upper t df Sig.tailed)(2 Physical Physical12 1.234 5.741 0.300 0.644 1.825 4.112 365 0.000 Accepted Psychological Psychological12 1.208 7.816 0.409 0.403 2.014 2.95 363 0.003 Accepted Social 1 Social 2 0.002 3.014 0.157 0.312 .307 .017 365 0.986 Rejected Physical 1, Psychological 1, Social 1 all denote before pandemic measures of respective constructs Physical 2, Psychological 2, Social 2 all denote during pandemic measures of respective constructs
Table 4: Paired t test for Constructs differencePaired IntervalConfidence95%oftheDifference
Hope and opportunity also fall under psychological construct but they do not show any difference in their scores. Students were found to be more hopeful before because of the help they are getting from institutions. A full team of teachers, mentors, and coaches use to be in front of them and approachable. Further different institutions had various opportunities as career enhancement programs, campus interviews for final year ones, etc. Lastly, Belongingness contributes to social construct and it also does not show any difference. This could be the result of the family taking utmost care of students by spending quality time and institutions also handling their grievances and mentoring them online.
6. Conclusion
Table 5: Paired t test for factors differencesPaired Confidence95%IntervaloftheDifference
The results of this study clearly show that the pandemic has impacted the young generation physically and psychologically. There is a lack of routine regular diet, sleep, and exercise. All these three aspects are linked with each other. Any disturbance with one will disturb the cycle. Improper diet and eating anytime in the day lead to a lethargic body making it inactive and so lack of sleep occurs.Further, there is a huge lack of positive attitude among students now due to covid 19 continuously going on. With lockdowns, isolations, quarantine, loneliness, and no better news in
http://TuEngr.com Page | 8 respectively. This makes us interpret that eating, sleeping, and exercise pattern was better before the pandemic. The attitude was more positive before covid 19. Stress was also a little more, as there were proper exams conducted and various submissions for assessments. This stress may be acting as eustress as it was motivating students to perform.
Hypothesis Result Factors Mean SD Std.MeanError Lower Upper t df Sig.tailed)(2 MealMeal12 0.175 1.67 0.087 0.003 0.347 2.000 365 0.046 Accepted SleepSleep12 0.644 2.932 0.153 0.343 0.946 4.206 365 0.000 Accepted ExerciseExercise12 0.437 2.710 0.141 0.158 0.715 3.085 365 0.002 Accepted AttitudeAttitude12 0.475 2.840 0.148 0.183 0.767 3.202 365 0.001 Accepted HopeHope12 0.181 2.618 0.137 0.88 4.511 1.321 363 0.187 Rejected Opportunity Opportunity12 0.232 2.947 0.154 0.070 0.535 1.507 365 0.133 Rejected StressStress12 0.286 2.631 0.137 0.016 0.557 2.086 365 0.038 Accepted
Belongingness Belongingness12 0.002 3.014 0.157 0.312 0.307 .017 365 0.986 Rejected 1 all denotes before pandemic measures of respective factors 2 all denotes during pandemic measures of respective factors
• Innovative career support. Benefit Psychological aspect Final year ones may be absorbed in the research assistance team of institutions. Pass out students on a contract basis may be motivated to join counseling and guidance centers of institutions themselves, as coming up with batches always have a good bond with seniors and so can connect easily.
• Educational sectors may add assessments related to health in their curriculum. Weekly and monthly progress of students may be monitored wherein nutrient rich balanced and timely diet, routine exercise and proper amount of sleep can be administered. This assessment should be compared to individual progress and not with some generalised parameter. Benefit Physical aspect A new type of assessment full of excitement may motivate students to remain fit.
• Open access libraries. Benefit Psychological aspect it can be a good option for students so to maintain continuity in their studies.
• 24/7 counseling and guidance centers. Benefits Psychological aspect These should be there monitoring academics and non academics issues of students. The center should be in continuous touch with each and every student and not for only those who approach it themselves.
8. References Ahorsu, D. K., Lin, C. Y., Imani, V., Saffari, M., Griffiths, M. D., & Pakpour, A. H. (2020). The Fear of COVID 19 Scale: development and initial validation. International Journal of Mental Health and Addiction Advance online publication. DOI: 10.1007/s11469 020 00270 8
7. Availability of Data and Material All information is included in this study.
http://TuEngr.com Page | 9 near future are shattering all hope. They all are stuck in their hometowns with no timeline to resume offline classes. They are feeling helpless in terms of their careers.
• Financial help. Benefit Psychological aspect Institutions may come up with financial help for affected dependent students who have lost their family members.
In this crucial time family played its role well along with a lot of online efforts of institutions. Both bodies are trying to take utmost care of their young and budding generations. Remaining in continuous touch with students has become a priority. This is the time for exploring, understanding and resolving all issues concerned with students.
Various innovative techniques can be inculcated in pedagogy, to address issues with students in present and contribu te toward a strong curriculum for the future. Institutions can go for many actions where motivating students should be the key.
• Subject matter experts. Benefit Psychological aspect they may be hired who can assist students’ doubts after online sessions and help in monitoring and motivating students throughout the course. Many times, students find it tough to approach teachers due to many issues like shyness, fear, hesitation, occupied teachers, etc.
AlMughamis, N., AlAsfour, S. and Mehmood, S. (2020). Poor eating habits and predictors of weight gain during the COVID 19 quara ntine measures in Kuwait: a cross sectional study. F1000 Research, 9, 914. DOI: Aristovnik,10.12688/f1000research.25303.1A.etal.(2020)Impactsofthe
Owusu Fordjour et al. (2020) The Impact of COVID 19 on Learning The Perspective of the Ghanaian Student European Journal of Education Studies DOI: 10.5281/zenodo.3753586
Gonzalez, T. et al. (2020) Influence of COVID 19 confinement in students’ performance in higher education DOI: 10.35542/osf.io/9zuac Graham, C.E., and et al. (2004). Does happiness pay: an exploration based on panel data. Journal of Economic Behavior and Organization, 55, 319 342.
Cao, W. et al. (2020) The psychological impact of the COVID 19 epidemic on college students in China Psychiatry Research Elsevier Ireland, 287. DOI: 10.1016/j.psychres.2020.112934
Husain, W. and Ashkanani, F. (2020) ‘Does COVID 19 change dietary habits and lifestyle behaviours in Kuwait: A community based cross sectional study Environmental Health and Preventive Medicine, 25(1), 1 13. DOI: 10.1186/s12199 020 00901 5
Honorato, E. J. S. et al. (2020) Waves of mental health Demands during the COVID 19 pandemic. Research, Society and Development, 9(8). DOI: 10.33448/rsd v9i8.6204
Jeong, H., Yim, H. W., Song, Y. J., Ki, M., Min, J. A., Cho, J., & Chae, J. H. (2016). Mental health status of people isolated due to Middle East respiratory syndrome. Epidemiology and Health, 38, e2016048. DOI: 10.4178/epih.e2016048
Bracale, R. and Vaccaro, C. M. (2020) Changes in food choice following restrictive measures due to Covid 19 Nutrition, Metabolism and Cardiovascular Diseases, 30(9), 1423 1426. DOI: 10.1016/j.numecd.2020.05.027
Brooks, S. K. et al. (2020). The psychological impact of quarantine and how to reduce it: a rapid review of the evidence The Lancet Elsevier, 395(10227), 912 920. DOI: 10.1016/S0140 6736(20)30460 8 Burke, T. et al. (2020). Increased Psychological Distress during COVID 19 and Quarantine in Ireland: A National Survey. Journal of Clinical Medicine, 9(11), 3481. DOI: 10.3390/jcm9113481
Lund, H. G. et al. (2010). Sleep Patterns and Predictors of Disturbed Sleep in a Large Population of College Students. Journal of Adolescent Health, 46(2), 124 132. DOI: 10.1016/j.jadohealth.2009.06.016
COVID 19 pandemic on the life of higher education students: A global perspective Sustainability (Switzerland), 12(20), 1 34. DOI: 10.3390/su12208438
Mandel, A. (2018). Why Nobel Prize winner Daniel Kahneman gave up on happiness Israel News Haaretz.com, October 7. Available at: https://www.haaretz.com/israel news/.premium.MAGAZINE why nobel prize winner daniel kahneman gave up on happiness 1.6528513 (Accessed February 2019).
Calcaterra, V. et al. (2020). Special Attention to Diet and Physical Activity in Children and Adolescents With Obesity During the Coronavirus Disease 2019 Pandemic Frontiers in Pediatrics. Frontiers Media, 8. DOI: 10.3389/fped.2020.00407
Nes, R. B. (2010). Happiness in Behaviour Genetics: Findings and Implications. Journal of Happiness Studies, 11(3), 369 381. DOI: 10.1007/s10902 009 9145 6
Nicola, M. et al. (2020). The socio economic implications of the coronavirus pandemic (COVID 19): A review’, International Journal of Surgery, 185 193. DOI: 10.1016/j.ijsu.2020.04.018
http://TuEngr.com Page | 10
Diener, E. and Satvik, E. (1991), Happiness is a frequency, not intensity of positive vs. negative effects Subjective Well Being: An Interdisciplinary Perspective, Pergamon Publishers, New York, 119 139.
Pigaiani, Y. et al. (2020) Adolescent Lifestyle Behaviors, Coping Strategies and Subjective Wellbeing during the COVID 19 Pandemic: An Online Student Survey. Healthcare, 8(4), 472. DOI: 10.3390/healthcare8040472
Tian, F., Li, H., Tian, S., Yang, J., Shao, J., & Tian, C. (2020). Psychological symptoms of ordinary Chinese citizens based on SCL 90 during the level emergency response to COVID 19. Psychiatry Research, 288, 112992. DOI: 10.1016/j.psychres.2020.112992
Romero Blanco, C. et al. (2020) Sleep pattern changes in nursing students during the COVID 19 lockdown
Rose, S. (2020). Medical student education in the time of COVID 19. Jama, 323(21), 2131 2132. DOI: Sheldon,10.1001/jama.2020.5227K.M.,&Lucas,R.E.(Eds.).
Dr. Niharika Joshi Bhatt is an Analyst, and Researcher at Blue Oceans Capital, Brisbane, Australia. She got a Ph.D. from Mohan Lal Sukhadia University, Udaipur, research center BIMTECH, Greater Noida. She is an Accredited Management Teacher by All India Management Association. She can be contacted at email. id. niharika1joshi@ gmail.com
International Journal of Environmental Research and Public Health, 17(14), 1 11. DOI: 10.3390/ijerph17145222
http://TuEngr.com Page | 11
(2014). Stability of happiness: Theories and evidence on whether happiness can change. Elsevier. Stieger, S., Lewetz, D. and Swami, V. (2021). Emotional Well Being Under Conditions of Lockdown: An Experience Sampling Study in Austria During the COVID 19 Pandemic. Journal of Happiness Studies, 1 18. DOI: 10.1007/s10902 020 00337 2
Rabi, F. A. et al. (2020) Sars cov 2 and coronavirus disease 2019: What we know so far Pathogens, 9(3), 1 14. DOI: 10.3390/pathogens9030231
Dr. Harminder Kaur Gujral is a Professor at Amity Business School, Amity University Uttar Pradesh, India. She holds a Ph.D. from University of Delhi She is a registered re habilitation psychologist and Certified Practitioner in Neuro Linguistic Programming by (Association of Neuro Linguistic Programming (India) and European Community for Neuro Linguistic Programming (ENCLP). She can be contacted at email. id. hkgujral@ amity.edu
Singh Anjali Devvrat is a Doctoral student in Management She holds a Bachelor’s degree in Textiles. She was associated with reputed organisations like Lal Bahadur Shastri Institute of Management, Amity University, ICFAI, GIMS, India, and is currently a teaching facilitator at Victoria University, Australia. She is an expert at ‘social science panel’ at National Council for Promotion of Urdu Language (NCPUL), MHRD, GOI, New Delhi. She can be contacted by email. id. anjali.d.singh@ gmail.com
Di Renzo, L. et al. (2020). Eating habits and lifestyle changes during COVID 19 lockdown: An Italian survey. Journal of Translational Medicine, 18(1), 1 15. DOI: 10.1186/s12967 020 02399 5


1 Introduction
At present, building physical resource management is important to building management and maintenance and enabling efficient building management, and stepping into the elevation of city management to be a smart city (Chotipanich, 2004). However, many agencies have begun to develop physical resource management by upgrading from building physical resource management to city physical resource management, but because cities are large areas, information is fragmented and discrete. Causing problems in data collection; as a result, various agencies use computer technology to help collect data, analyze and organize data to consolidate information on the same International Transaction Journal of Engineering, Management, & Applied Sciences & Technologies http://TuEngr.com
Keywords: 3D building; SuperMap; 3D visualizing system; Integrating platform; Facility CampusSustainablemanagement,Smart.
1 Graduated Program in Civil Engineering, Faculty of Engineering, Chiang Mai University, Chiang Mai, THAILAND.
Abstract Building physical resource management is essential to building management and maintenance. This state enables efficient building management. Meanwhile, Chiang Mai University has a master plan for smart city development. This research aims to integrate the 3D building data into the 3D GIS platform to prepare it as a future model for building resource management. The research method is to create a three dimensional model of the building and import it into a 3D geographic information platform. The result of importing the physical data and visualizing 3D images also stores data attributes in the model, which can be expressed to help manage resources effectively. Disciplinary: Civil Engineering & Technology. ©2022 INT TRANS J ENG MANAG SCI TECH. Cite This Article: Manokeaw, S., Timprae, W., and Rinchumphu, D (2022). The Integrating 3D Building with 3D GIS Platform for Facility Management . International Transaction Journal of Engineering, Management, & Applied Sciences & Technologies, 13(6), 13A6I, 1 9. http://TUENGR.COM/V13/13A6I.pdf DOI: 10.14456/ITJEMAST.2022 114
Sattaya Manokeaw1, Warut Timprae2, Damrongsak Rinchumphu3*
Page | 1 ©2022 International Transaction Journal of Engineering, Management, & Applied Sciences & Technologies ISSN 2228 9860 eISSN 1906 9642 CODEN: ITJEA8 The Integrating 3D Building with 3D GIS Platform for Facility Management
2 City Research and Development Center, Faculty of Engineering, Chiang Mai University, Chiang Mai, THAILAND.
Paper ID: 13A6I Volume 13 Issue 6 Received 24 January 2022 Received in revised form 27 April Accepted202208 May 2022 Available online 11 May 2022
*Corresponding Author (Tel +66 959959519, Email: damrongsak.r @cmu.ac.th).
3 Department of Civil Engineering, Faculty of Engineering, Chiang Mai University, Chiang Mai, THAILAND.

Over the past few years, the city has developed in various areas. However, most of them are under the same function, which does not use modern technology, causing problems in the city such as scarcity of resources, traffic jams, and inefficient management. At the same time, people tend to understand that the word "city" is a densely populated place. The city can also be categorized in a variety of ways, such as classification by size or population can be classified as large cities, small cities, or classified by population characteristics as a minority group and can be classified according to the location of the city as a port city, or a border city. Cities can also be categorized in two ways; qualitative and quantitatively classified cities are categorized as qualitative cities such as commercial, industrial, and administrative. According to Harris (2016), quantitatively classified cities are industrial cities, wholesale cities, and university cities. As measured by employment
http://TuEngr.com platform. This issue will make resource management more convenient, accurate, and efficient (Thongmuenwai & Kenaphoom, 2017).
2 Literature Review 2.1 Sustainab le Smart Campus
Page | 2
Chiang Mai University is one of the leading organizations in the region with the readiness and potential to help drive smart city policy. Combining many body of knowledge, building physical resource management, geographic information system three dimensional model, and the internet of things (IoT) create a platform where information can be collected and analyzed in real time. This condition will help in the decision making of the administrators effectively. In this regard, Chiang Mai University has developed the Chiang Mai University Educational Development Plan Phase 12 (Chiang Mai University, n.d.) with a proactive strategy Number 1 about environmental and energy innovation. The university has set the goal of being a leader in creating, managing, building capacity, and sharing knowledge. Sustainable green innovation technology leads to the design of the smart city development master plan at Chiang Mai University called CMU Smart City Clean Energy. Therefore, to ensure that the management of the university area is consistent and according to the Chiang Mai University development plan, the idea was to create a three dimensional model of the building. Thus, digital data is integrated into a 3D information platform as a guideline for effective management.
The Ministry of Digital Economy and Society (MDES) has assigned the Digital Economy Promotion Agency (DEPA) to drive and develop smart cities in Thailand. Meanwhile, Chiang Mai province is one of the first seven provinces; the MDES has a development plan to step up to become a smart city. It planned to focus on tourism promotion smart farming model for agriculture and organized the Chiang Mai City health project with cooperation from the organization both government agencies, universities, and science and technology parks so that Chiang Mai Province is ready to enter the digital age and can also support the entry into an aging society in the future sustainably.Atpresent,
The GIS is the process of working on geographic information with a computer system. The data is related to the area's location and presented in the form of a map. The data is stored in the form of a data table that can work with the analysis of mathematical data such as the spread of the epidemic relocation invasion, change in use of space, and is a database for physical resource management of the city (Kumar, 2014). Nowadays , GIS is increasingly applied in managing the city's physical resources, which uses data from the IoT to analyze with various algorithms to manage the city sustainably and create a smart city. A BIM is used as a model that contains the basic information needed to operate and manage physical resources. BIM is a new technology developed to collaborate civil engineering, architecture, and mechanical engineering systems. So, there are three parts to having a consistent understanding of the construction drawing (AppliCAD Pubilc Company Limited, 2018). BIM has a granularity in the level of development (LOD) that ranges from 100 to 500. The LOD 100 is described in detail as the design stage. The beginning of LOD 200 will be the design phase of the building plan, the LOD 300 phase of the design development for use in construction, the LOD 400 during construction, and LOD 500 during the delivery period, as shown in Figure 1.
http://TuEngr.com Page | 3
Figure 1: Level of Development (LOD)
statistics from the 1930 Industrial and Commercial Census looked at 605 cities with populations of 10,000 or more residents and interactions which is the model of the university city. It is interesting to study physical resources because it is a city with various physical resources and has a small educational territory. This term is the simple understanding to analyze and manage resources suitable for experimenting with various information systems studies. Neupane (2020) proposes that the concept of a sustainable smart city with facility management is a key to achieving sustainability. It uses an analytical process that consists of 3 tools: geographic information system (GIS), building information modeling (BIM), and the internet of things (IoT) to solve data collection problems and process data from different operating platforms, including working in two dimensions difficult to manage facilities.

http://TuEngr.com Page | 4
Moreover, in the future can also plan to share knowledge and experience for future sustainability to be a model used to manage the physical resources of the entire university and every campus. It is to create a better understanding of physical resource management. Therefore, reviewing the literature and research will be the content in the next section.
Figure 2: Relationship between workers and buildings for the management of building physical resources.
However, all three management areas need tools to help make the work easier to manage. The management of physical resources in the manner of the university will give a novel of people, processes, and place, which will give the same meaning but will be added to the part of the larger study area.Leet al. (2019) examined the relationship between data interactions of city intelligence modeling (CIM) technologies through an in depth investigation. The information on the physical building resources is essential for advanced resource management processes. In the same way, Rich & Davis (n.d.) studies geographic information for facility management. Establish a relationship between building physical resources and facility management to benefit resource management in conjunction with geographic information.
Zaballos et al. (2020) have experimented with college towns. It was found that a smart city must be a city that can support the needs of its citizens and promote sustainability in both building structures and the environment. Therefore, a smart campus to analyze the results before applying to large cities. It is because the use of information technology in large areas is complex. There are limitations in terms of space, budget, and computers that can support the capacity of all data, which combines data according to actual conditions. It uses IoT models to examine environments and gain insights into comfort levels.
2.2 Facility Management
The building's physical resource management manages the physical data of the entire building. The important thing is the relationship between people, process, and place, as shown in Figure 2. Buildings are not defined by users alone but according to job requirements and vary with the global economic conditions. Consequently, it shows the relationship between buildings and the change in the world. As a result, a changed conceptual model was needed for modern building management (Chotipanich, 2004).

It is to create an understanding of data collection for physical resource management through information models. Therefore, the definition of the digital twin model was studied as a guideline for creating such a process. This point will be contented in the next section.
3.1 Creating a 3D Model
http://TuEngr.com Page | 5
2.3 Digital Twin Model
Min Allah & Alrashed (2020) explores the concept of a smart campus by combining smart technology with physical infrastructure for more efficient and sustainable services. The bringing various technologies into the university, the operation of the IoT system to store information about Student's face recognition smart card for analyzing physical resources such as classroom usage data. Students' study time and room use can be planned, and Li (2021) studied smart campus management using IoT systems to plan effective teaching and learning on the GIS platform. This paper will study the integration between BIM and GIS technologies on a 3D platform to be a model for future building resource management. The methodology will be explained in the next section. 3 Method Integrating the 3D building with a 3D GIS platform for facility management has two main steps in the research; 1) creating a 3D model and 2) creating a platform for collecting physical data. The detail will be described the steps in detail.
Li et al. (2020) study real time GIS, a scientific information system that can collect actual data t hrough IoT data to create a data analysis model and show high speed spatial results in smart cities. In addition, Marzouk & Othman (2020) study the infrastructure needs for smart cities using the integration of BIM and GIS to plan and forecast urban expansion. By focusing on the issue of smart cities managing the city's physical resources to support the demand for resources such as freshwater use and electric power to be efficient and sustainable.
A digital twin is a digital simulation of physical resources, processes, and systems combined with artificial intelligence that can learn independently and perform data analysis to create dynamic digital models to be able to change physical resources or digital environment to change according to the actual change and if the algorithm is suitable, it will be effective in predicting the future. Currently, the development of these processes will be applied to buildings, infrastructure, and the environment. Evans et al. (n.d.) found that digital twins face various challenges because the work process is a multidisciplinary collaboration. Therefore, much knowledge is required in engineering, architecture, and computer programming. Moreover, even knowledge of GIS is essential for the digital twin. Gathering this information and then putting it into action is a complex and challenging problem. However, if there is a suitable algorithm and control accuracy, it will be able to create models that predict the future and solve complex city problems.
Today's construction drawings are saved as CAD files and PDFs and can be used to create 3D models with Revit or other 3D modeling programs. Construction is used as a model is necessary to
Figure 3: Interface of Autodesk Revit
Build a platform to collect physical data using the SuperMap iDesktop tool; the program collects data through the data source and retrieves the desired data through the layer, which can be used to create a display as a map or map 3D scenes.
4 Result a nd Discussion
3.2 Creating a Platform for Collecting Physical Data
4.1 The 3D Building Model
To import physical data, It must create a workspace, which is the main working area of the program, and have a file type of “.smwu” and then create a data source to divide the physical data types. The file type is “.udbx”. The data import tool uses the import BIM data function. For building 3D models, it can be imported into three types o f files: 3DXML, Revit, and IFC.
http://TuEngr.com Page | 6
have the completeness of data to model at LOD 300 resolution. The architectural models are the essential floor plans in 3D modeling.
Building construction data will be used as a model to create a 3D model using Autodesk Revit. This research will use 3D models with a resolution of LOD 300, showing only architectural works in sufficient displaying 3D data. However, if used in maintenance or energy collection, the model resolution is LOD 400 or higher because it needs to use the sub device data in the 3D model for display.

http://TuEngr.com Page | 7
Figure 5: The 3D building model and the data attributes shown on SuperMap.
By importing physical data and visualizing 3D images, data attributes are stored in the model, which can be expressed to help manage resources effectively. This section presents the results of data ingestion and the characteristics o f data imported into the data collection platform and creates and prepares data for management.
The results of importing building model data show that the Revit import requires the installation of the SuperMap plug in in Autodesk Revit and has licensing restrictions, making it difficult to import. Access data directly through this function. The recommended method is to convert model files from Revit and Sketchup to IFC files first and then import them through the IFC function in every program.
4.2 The Physical Data Platform
Figure 4: T he 3D building model.


This project was supported by Chiang Mai University, Thailand. The authors also wish to thank the Faculty of Engineering, Chiang Mai University for their help and support, under the Research Assistant Scholarships.
Kumar, T. V. (2014). Geographic information system for smart cities. E 143, Lajpat Nagar, Sahibabad, Distt. Ghaziabad, UP 201005, India: Copal Publishing Group.
Developing a 3D visualization system for building resources allows for an overview of the building's 3D model, which significantly affects managing the building's physical resources.
Material and Data Availability
All information has been included in this article.
Furthermore, the 3D model data is collected on the same platform, which is easy to manage. Building 3D modeling is also part of the future digital twin platform, which will combine 3D models with sensor data acquisition to enable more granular management, such as building energy consumption management and building maintenance planning. Building and collecting buildings' physical data is an essential foundation for future building management. Because in addition to collecting physical data in the platform, it is also possible to manipulate data within the platform to present more detailed information. This point makes management decisions more accurate. In this research, additional classroom locations and areas were presented. Allows building managers to see the location of various rooms clearly inside the building through a single platform which is helpful for classroom use. It can also be applied to sensors to study classroom air quality and energy.
5
Page | 8
Conclusion
Even if physical data is collected on a single platform, it will be helpful for management. However, users need to be very knowledgeable in using the platform. The platforms for collecting or handling information are very complicated to use. Using a web portal is a good solution for presenting information and as a tool for use in management. Because of writing a web portal, the processes can create specific options and impressions the r want. This solution allows users to easily and quickly access the information they need.
8 References AppliCAD. (2018). Building information modeling (BIM) . Retrieved January 2022, https://www.applicadthai.com/articles/ Chiang Mai University. (n.d.). Educational development plan of Chiang Mai University phase 12 (2017 2 Chotipanich,021).S. (2004). Facility management. Bangkok: Chulalongkorn University printing house. Evans, S., Savian, C., Burns, A., & Cooper, C. (n.d.). Digital twins for the built environment. The Institution of Engineering and Technology . Harris, C. (2016). The nature of cities.
http://TuEngr.com
6
7 Acknowledgement
Le, T., Hassan, F., Le, C., & Jeong, H. D. (2019). Understanding dynamic data interaction between civil integrated management technologies: a review of use cases and enabling techniques. International Journal of Construction Management, 1 22. Li, W. (2021). Design of smart campus management system based on internet of things technology. Journal of Intelligent & Fuzzy Systems, 40 (2), 3159 3168. Li, W., Batty, M., & Goodchild, M. F. (2020). Real time GIS for smart cities. International Journal of Geographical Information Science . Marzouk, M., & Othman, A. (2020). Planning utility infrastructure requirements for smart cities using the integration between BIM and GIS. Sustainable Cities and Society, 57 . Min Allah, N., & Alrashed, S. (2020). Smart campus A sketch. Sustainable Cities and Society, 59 . Neupane, P. (2020). A conceptual framework of facility management with a rtificial intelligence for a sustainable smart city. Nepal. Rich, S., & Davis, K. H. (n.d.). Geographic information systems (GIS) for facility management. Manhattan Software 425 Fortune Boulevard, Suite 200 Milford, MA 01757 USA. Thongmuenwai, P., & Kenaphoom, S. (2017). Cooperation between public and private sector s of smart city development (in Thai). Journal of Research and Development Institute, Rajabhat Maha Sarakham University, 4 (1).
http://TuEngr.com Page | 9
Zaballos, A., Briones, A., Massa, A., Centelles, P., & Caballero, V. (2020). A smart campus’ digital t win for sustainable comfort monitoring. Sustainability 12(21), 9196
Sattaya Manokeaw is a master’s degree student at the Department of Civil Engineering Faculty of Engineering in Civil Engineering, Chiang Mai University, Thailand. He got a bachelor’s degree in civil engineering from Chiang Mai University, Thailand. His research focuses on the 3D GIS platform and 3D visualization Warut Timprae is a researcher at City Research and Development Center, Faculty of Engineering, Chiang Mai University, Chiang Mai, Thailand. He got a bachelor’s degree in computer engineering from Chiang Mai University, Thailand and a master’s degree in Industrial Management from Chiang Mai University, Thailand. His research focuses on artificial intelligent applications in Civil Engineering and the Built Environment Dr. Damrongsak Rinchumphu is a researcher at the Center of Excellence for Natural Disaster Management (CENDIM) and an assistant professor at the Department of Civil Engineering, Faculty of Engineering, Chiang Mai University, Thailand. He has a doctoral degree in civil engineering and built environment from Queensland University of Technology, Australia. His research focuses on Sustainability and Technology in Civil Engineering and Construction Management


Introduction
Page | 1 ©2022 International Transaction Journal of Engineering, Management, & Applied Sciences & Technologies ISSN 2228 9860 eISSN 1906 9642 CODEN: ITJEA8 Bromelain as a Potential Material in Future Chemotherapy: A Review Syahirah Mohd Noor1, Rohardiyana Roslan1, Soon Chin Fhong2, Nadirul Hasraf Mat Nayan2* 1Department of Chemical Engineering Technology, Faculty of Engineering Technology, Universiti Tun Hussein Onn, Pagoh, Johor, MALAYSIA 2 Microelectronic and Nanotechnology Shamsuddin Research Centre (MiNT SRC), Integrated Engineering Institute, Universiti Tun Hussein Onn, Parit Raja, Johor, MALAYSIA *Corresponding Author (Tel: +60 136224963, nadirul@uthm.edu.my) Paper ID: 13A6J Volume 13 Issue 6 Received 27 December 2021 Received in revised form 28 April Accepted202205 May 2022 Available online 12 May 2022 Keywords: Cancer cell; ininflammatory;death;ChemotherapyBromelain;;CellMetastasis;Antiinvitro;vivo
Bromelain is a complex mixture of proteases and non protease components found in pineapple (Ananas comosus) extracts. Protease is a part of the major components of bromelain in pineapple which consists of stem bromelain (80%), fruit bromelain (10%), and ananain (5%) (Maurer, 2001). Investigations into the use of a variety of proteolytic enzymes in pineapple plants for therapeutic purposes have been conducted. Bromelain is stable without deterioration or loss of its biological properties and well absorbed, whereby it is exposed to the gastrointestinal tract upon oral administration (Hale et al., 2005). The therapeutic effects of bromelain are dose dependent, International Transaction Journal of Engineering, Management, & Applied Sciences & Technologies http://TuEngr.com
Disciplinary: Chemotherapy, Health and Science, Plant Science.
©2022 INT TRANS J ENG MANAG SCI TECH. Cite This Article: Noor, S. M., Roslan, R., Fhong, S. C., and Nayan, N. H. M (2022). Bromelain as a Potential Material in Future Chemotherapy: A Review. International Transaction Journal of Engineering, Management, & Applied Sciences & Technologies, 13(6), 13A6J, 1 12 http://TUENGR.COM/V13/13A6J.pdf DOI: 10.14456/ITJEMAST.2022.115
Abstract Cancer is an uncontrolled cell growth type chronic illness. It is usually associated with oxidative stress and chronic inflammation. Pineapple and its components have been shown in several studies that significantly reduce cancer risk. One of these substances is the bromelain enzyme, which exhibits anti inflammatory, reduces metastasis which can stimulate cell death and support the white blood cell activity of some cancer cells that may reduce inflammation and minimize oxidative stress. Herein, a comprehensive review of the potential of bromelain as a treatment of chemotherapy to be employed in the future medical sector is discussed in this paper. This review study focuses exclusively on the effect of bromelain on distinct cancer cell types that use experimental approaches in vitro and in vivo.
1

The unique properties of bromelain increase interest in its anti cancer activity studies in deeper purpose for advanced chemotherapy technology. Its capability affect s the cancer cell with numerous studies on the effect of bromelain on cancer cells have been established as shown in Table 1. Bromelain is shown to affect cancer activities via interrupting the cancer cell growth and proliferation, metastasis, inflammation, and immunodulation. Several bromelain studies have been performed, and evidence indicates that bromelain was able to treat breast, ovarian cancer and other cancers (Mohamad et al., 2019). Some investigations of bromelain studies on different types of cancers are listed in Table 2.
and monoclonal antibodies are commonly used to supplement chemotherapy in the treatment of cancer. The combination therapy of two or more medicines or herbal medicinal concoctions has been of interest in the fight against diverse illnesses, in particular cancer. Nutritional supplements or herbs have long been used to regulate the immune system and enhance the efficacy of the medications that are being implemented. Various fruits have been documented with anti inflammatory and immunomodulatory properties, including pineapple. Bromelain is a protease found in pineapples. It has been described as having immunostimulatory and anti inflammatory properties, as well as being easily absorbed when taken orally. It has been reported bromelain isolated from pineapple stem attributed to immunomodulatory and anti inflammatory effects in In vivo research treatment of P 388 leukemia, sarcoma (S 37), asciti c tumor, Lewis lung carcinoma, MB F10 melanoma, and mammalian adenocarcinoma (ADC 755) model (Dhaval et al., 2016).
2 Effect of Bromelain on Cancer Cell
and it has been shown that bromelain is both safe and reliable as a food supplement (Tochi et al., 2008). Bromelain is popularly known for a wide spectrum of therapeutic benefits, including a nutritional supplement to promote digestion, improved drug delivery and absorption, fibrinolytic effect s, and wound debridement (Bhattacharyya, 2008). Bromelain also has anti cancer properties and is able to facilitate cell death through apoptosis (Pavan et al., 2012).
http://TuEngr.com Page | 2
Cancer is an invasive cell that tends to proliferate with uncontrolled growth. The evolution of cancer is defined by hallmarks that are dependent on the tumor suppressor genes and proto oncogenes (Mamo & Assefa, 2019). Replicative immortality and angiogenesis are hallmarks, as is the ability to evade growth suppressors and activate invasion and metastasis, as well as resistance to cell death and angiogenesis. (Hanahan & Weinberg, 2011). Cancer cells are self regulating and self sufficient which is in contrast with the behavior of normal healthy cells due to DNA mutation (Torgovnick & Schumacher, 2015). It is independent of growth signaling in proliferation cause interruption of the normal homeostatic mechanism of cells in tissue (Yousef Ahmad & Carmen, 2017). Mitigation against cancer cell growth requires concentrating on the lead factors in uncontrolled proliferation, angiogenesis, metastasis, and other development factors (Doughlas & Weinberg,Adjuvants2000).
MesotheliomaPeritonealMalignant(MPM)
Metastasis Bromelain reduces metastatic foci by inhibiting platelet aggregation by endothelial cell (Béez et al., 2007)
Colorectalcancer In vivo and In vitro bromelain treatment Induces high levels of ROS, ATG 5/12, beclin, p62, LC3, Endo G, and caspases 3, 8, and 9
CarcinomaProstatic(PC3) In vitrotreatmentbromelain+Cisplatin Upregulates p53 Inhibits colony formation and reduces cell viability (Amini Chermahini et al., 2020)
Table 1: Established Anti cancer effects of bromelain Parameters
Bromelainapoptosisinduces (Chang et al., 2019) Lung cancer In vivo Downregulates tPA receptor Bromelainmetastasisreduces (Béez et al., 2007)
In vivotreatmentbromelain Reduces the volume of tumor up to 65%, upregulate sp53, Bax, caspase 3, caspase 9, downregulate sBcl 2, Cox 2, NF κB. Cutdown activity of ERK1/2, MAPK and Akt Bromelain inhibits tumor development (Bhui et al., 2009)
Bromelain reduces proliferation and cell viability
Inflammation Bromelain downregulated the inflammatory related genes (Mohamad et al., 2019)
Table 2: Investigation of anti cancer properties of bromelain Target ExperimentalApproach Result Impact Reference 4TI negativetriplebreastcancercell(Mice)
In vitrotreatmentbromelain+Cisplatin Downregulates NF κB, p NF κB and p AKT. Activates caspase 7, 8, 9, cytochromes c, and PARP
Bromelain induces cell apoptosis and autophagy (Pillai et al., 2014) Human Breast Cancer (MCF 7) In vitrotreatmentbromelain Reduces cell viability and cell generations Bromelain as an anti proliferative effect (Fouz et al., 2013; Oliveira et al., 2017)
Bromelain induces cell apoptosis (Bhatnagar et al., 2014) HepG2, HT 29, A549, KB, HeLa and HuTu 80 cell In vitrotreatmentbromelain Induces apoptosis Bromelain as anti proliferation and induce apoptosis. (Manosroi et al., 2017)
In vivotreatmentbromelain+Cisplatin Low weight and size of tumor, downregulates GREM1, IL 1β, IL 4, NFκB1, PTGS2, NO, IL 1β, and IL 4 Bromelain induces apoptosis, causes reduce tumor size, reduces lung metastasis of 4TI (Mohamad et al., 2019)
Immunomodulation
Bromelain enhances IFN γ derived signals in primary macrophages as well as macrophage cell lines. (Manosroi et al., 2017)
HEK293, MCF 7, HeLa, A549, HaCaT,MiceEAC
In vivo and In vitro bromelain treatment Upregulates (p53, p21, Bcl2, Bax), increases ROS, loss of MMP
http://TuEngr.com Page | 3
Bromelain induces apoptosis via activation of survival cellular proteins (Mohamad et al., 2019) (Hale et al., 2005; Tochi et al., 2008) (Chermahini et al., 2020; Oliveira et al., 2017) (Bhatnagar et al., 2014; Bhui et al., 2009; Pillai et al., 2014)
tumorigenesisSkin(Mice)
Cellular/Molecular effect Reference Cancer cells growth Bromelain reduces tumor size and metastasis
Bromelain inhibits tumor development
AGS, PC3, MCF 7 (Human) In vitro of bromelain treatment Suppresses growth and colony formation Bromelain inhibits cell proliferation and colony formation (Raeisi et al., 2019)
Regulated cell growth and proliferation are the normal processe s that undergo by each normal cell. The uncontrolled cell proliferation could cause an imbalance cell cycle and leads to the formation of cancer cells. Cell cycle is a series of events that include phases of cell growth and division. The cell cycle composes of four phases which are mitosis, synthesis and two phases of gaps that correspond between synthesis and mitosis (Kastan & Bartek, 2004). Cyclins is responsible at every checkpoint of the phases for determining the confirmation of each cell to proceed to the next phase (Lim & Kaldis, 2013). In a cancer cell, the cell cycle is interrupted and irregulated as a normal cell cycle whereby the function of the cell cycle checkpoint is limited (Evan & Vousden, 2001). It leads to uncontrolled cycling even in the presence of DNA damage as a cancer cell is independent of growth signal and it will initiate the cell cycle even though cell division is unrequired. Cancerous cells have their own tendency to resist receiving growth suppression signals in order to continue to grow and proliferate through different pathways over time (Elledge, 1996).
http://TuEngr.com Page | 4 3 3.1DiscussionCellGrowth and Proliferation
The mechanism by which cells grow uncontrollably is dependent on oncogenes and tumour suppressor genes. The most mutated oncogene in human cancers is the RAS oncogene (DeBerardinis et al., 2008). An increase in RAS oncogene motivates more cancer cell growth and proliferation. Oncogenes are a part of cell DNA and initiate the production of proteins that are important for cell growth, cell survival, and cell activity (Gariglio, 2012). RAS stimulates the activity of several transcription factors, which results in the activation of genes involved in cell cycle progression and division. RAS gene is activated through the exchange of protein that is bound to the RAS gene which is GDP substituted with GTP. After sufficient cell growth, the RAS gene needs to be deactivated. However, the mutated RAS gene is unable to be deactivated and keep on activated due to the failure of exchange of protein factor. Continuous activation could lead to active cancer cell growth (Evan & Vousden, 2001). Irregulated cell cycles cause loss of control of protein complex in cancer cells. The majority of chemotherapy aims to stop cancer cells from growing and spreading by reverting them to their normal cell cycle ( Levine & Puzio Kuter, 2010).
Commercial and recombinant bromelain has shown the reduction of cytokinetic activities of MCF 7 breast cancer cells by decreasing the cell viability with IC50 values of 5.125 µg/mL and 6.25 µg/mL, respectively. Bromelain, both commercial and recombinant, has a better anti proliferative effect by reducing the number of cell generations of MCF 7 cells from 3.92 to 2.81 compared to taxol reducing the cell generations fro m 3.92 to 3.12 (Fouz et al., 2013). The highest anti proliferative effects were revealed in a study of lung tissue cancer cells (A549) by freeze dried and the spray dried bromelain with the ic50 values of 18.31±5.11 and 26.36±9.76 μg/ml, respectively (Manosroi et al., 2017). Bromelain also proved to have anti proliferative effects on human AGS, PC 3, and MCF 7 cancer cells with bromelain at concentrations >75 μg/ml (Raeisi et al., 2019).
Angiogenesis is the process by which endothelial cells migrate and proliferate to form new blood vessels from the pre existing vasculature (Folkman, 1985). Angiogenesis is a vital biological event for tumor growth and metastasis to provide nutrients needed by rapidly proliferating cancer cells. As the tumor grows bigger, tumor cells become hypoxic and stabilize hypoxia inducible factor
http://TuEngr.com Page | 5
Bromelain has been mainly killing the cancer cells by induction of apoptosis to reduce the number of malignant cells (Bhui et al., 2010). Furthermore, evidence shows bromelain inhibits of NF κ B and induces apoptosis by causing G2/M arrest of epidermoid carcinoma and melanoma cancer cells (Bhui et al., 2012). Studies have shown that exposure to bromelain in advanced colorectal cancer (CRC) causes induction of high levels of apoptosis with elevated amounts of pro apoptotic proteins including Endo G, and caspases 3, 8, and 9 (Chang et al., 2019). Another study shows that stem bromelain indu ces apoptosis activity on A549, HeLa, DU145, HT 29, KB and HuTu 80 cell lines (Manosroi et al., 2017). Bromelain was found to induce apoptosis by triggering the mitochondrial pathway with inhibit the expression of COX 2 and nuclear factor κ B (NF κB). At the same time, downregulation of Bcl 2 and upregulation of p53, Bax and activation of caspase 3 and caspase 9 are also found in studies on skin tumors whereby it is a strong proof of the ability of bromelain on induction of apoptosis on malignant cells (Bhui et al., 2009; Kalra et al., 2008). Bromelain diminishes the activity of cell survival proteins such as NF kB, Ikkb, p Ikkb, p AKT and p NF kB thus endorsing apoptotic cell death in tumors (Pillai et al., 2014).
Apoptosis, a programmed cell death, is one of the phases in a normal cell cycle that is vital in the homeostatic preservation of cells in a body (Evan & Vousden, 2001). Loss of apoptotic pathways could cause advanced development growth of cancer cells. The apoptotic mechanism could happen through several pathways including the intrinsic pathway, extrinsic pathway, or apoptosis inducing factor (Vermeulen et al., 2005). Current chemotherapy is targeting apoptosis to increase cell death of cancer cells to reduce the availability of cancer cells to spread likely in the body (Kerr et al., 1994). The effect of bromelain on cell death does link with the reduction of tumor volume by up to 65% (Bhui et al., 2009). Intrinsic pathways, also known as mitochondrial pathways, involve the tumor suppressor gene p53 in the upregulation of Bcl 2 like protein 4 (Bax) expression in B cell lymphoma 2 cells (Bcl 2) (Haupt et al., 2003). Bax functioning is a pro apoptotic protein while Bcl 2 is an anti apoptotic protein. The upregulation of Bax could donate a higher ratio of pro apoptotic over anti apoptotic protein whereby increases the chances of the apoptotic pathway occurring (Zhang et al., 2000). Bax disrupts the protective protein Bcl 2 on the mitochondrial membrane, allowing cytochrome to enter the cytosol, and interacts with the apoptotic protease activating factor 1 (Apaf 1) to create the apoptosome complex, a specialized structure. Apoptosomes cause the activation of a specific type of protease protein called caspase 9 (Martin, 2014). The active caspase 9 complexes is formed when caspase 9 is activated. The complex will move around the organelles of the cell and breakdown the organelles which lead s to breakdown of DNA causing apoptosis (Ahn & Metallo, 2015).
3.2 Angiogenesis and Metastasis
http://TuEngr.com Page | 6 (HIF) proteins (Senger & Davis, 2011). HIF proteins will trigger pro angiogenic proteins such as vascular endothelial growth factor (VEGF) to induce angiogenesis. The existence of ECM act s as a barrier for VEGF to reach its target receptor which is the endothelial cell membrane of the blood capillary. Hence, the recruitment of macrophage and mast cells from nearby stroma will aid the degradation of ECM using matrix metalloproteinases MMPs. The breakdown of ECM releases other pro angiogenic factors such as platelet derived growth factors (PDGF), basic fibroblast growth factor (bFGF), epidermal growth factor (EGF), and transforming growth factor (TGF β), angiogenin and angiopoetin 1 and 2 (Kerbel, 2008).
The increased expression of pro angiogenic factors could contribute to the higher ratio of pro angiogenic factor over anti angiogenic factors leading to promote angiogenesis ( Folkman, 1995). Bromelain is known to downregulate TGF β which acts as pro angiogenic growth factor to counteract the effects of anti angiogenic factors (Béez et al., 2007). The spread of cancer from the primary tumor is one of the causes related to high mortality rates (Paroulek et al., 2010). Metastatic is a process of spread of tumor cells from the primary tumor to a secondary site in the body (Sagar et al., 2006). The spreading of cancer depends on the location of the primary tumor. Malignant tumors can undergo metastasis through lymphatic, hematogenous spread or body cavity passages. Tumor metastasis mechanism invasion of extracellular matrix (ECM), vascular dissemination, homing of tumor cells, and colonization (Gupta & Massagué, 2006). Invasion of ECM starts with cell detachment from the primary tumor where the loss of intercellular e cadherin force. The migration of tumor cells could be through ameboid migration or local degradation of the extracellular matrix (ECM) ( Chaffer & Weinberg, 2011). Ameboid migration occurs through spaces in the matrix instead of cutting its way through, perhaps explaining the low performance of metalloproteinases (MMP) inhibitors as chemotherapy in some clinical trials (Egeblad & Werb, 2002). Local degradation of ECM occurs when tumor cells interact with ECM proteins. The interaction causes loss of integrins, secretion of proteolytic enzymes and increase of metalloproteinases (MMPs), cathepsin D and urokinase plasminogen activator (Mohamad et al., 2019). Subsequently, tumor cells invade the lumen of blood vessels and are carried away via blood to a distant target organ. Tumor cells are able to survive from the interaction with host lymphoid cells due to autocrine motility factor (AMF) making the tumor more motile. Then, extravasation of tumor cells from the blood lumen to the secondary location. Tumor cells will be homing and colonizing the new location. Survival of tumor cells is also extended with growth factors provided by the host tissue and cleavage products of matrix ECM such as PDGF, FGF, TGFβ and VEGF (Sasaki et al., 2013). Other than focusing on the impairment growth of malignant cells, bromelain also has a captivating feature of an anti cancer agent which is the ability to inhibit of cancer metastasis process (Doughlas & Weinberg, 2000). The inhibition is by interfering with the pivotal biological events in the progression of cancer metastasis such as cell migration, inflammation, and cell adhesion on the target site. The ability of bromelain to inhibit platelet activation is due to its
3.3 Inflammation Regulator
Inflammation is known as one essential during the development of cancer in the cellular transformation phase, cell growth, metastasis, and angiogenesis (Coussens & Werb, 2002). It is shown that cancer progression could be suppressed and reduce the chance of cancer incidence with suppression of chronic inflammation (Paroulek et al., 2010). Chronic inflammation could trigger chronic diseases including cancer depending on the tumor type, and micro surroundings of the tumor. Inflammations require pro inflammation protein to promote progression such as prostaglandin E2 (PGE 2) synthesized by Cyclooxigenase 2 (COX 2) makes COX 2 as an important molecule in cancer associated inflammation (Grivennikov et al., 2010). Some studies have shown that bromelain is able to reduce inflammation by inhibiting cyclo oxygenase 2 activity by patterning a do wnregulation of COX 2 and PEG 2 levels (Sagar et al., 2006). It is also shown that bromelain is able to reduce the migration of neutrophils to inflammation sites hence reducing the expression of cytokines that aid amplifies inflammatory reaction s (Fitzhugh et al., 2008). The majority of proinflammatory mediators are eliminated by bromelain, which indicates a significant function as an anti inflammatory agent in a variety of conditions and circumstances (Mynott et al., 1999). 3.4
Immuno modulatory
The ability to modulate immune response activity is one of the targets in chemotherapy and various clinical testing. The i mmunological response is a natural response of body defense and modulation of the immune system involves the use of therapy to modify the action of the immune response (Engwerda et al., 2001). Clinical trial on immunomodulating activity of bromelain has been proved capable of modulating and enhancing cellular responses of lymphocyte s (S. Müller et al., 2013). The cluster of differentiation 44 (CD44) i s a cell surface marker that is expressed by cancer and leukocyte cells. The level of CD44 expression is also used as a diagnostic and prognostic marker on a cancer patient. Expression of CD44 indicates inflammation, cancer growth and metastasis. The upregulation of CD44 indicates an increase in lymphocyte homing to the vascular
http://TuEngr.com Page | 7 proteolytic activity (Bhui et al., 2009). The reduction of platelet aggregation shows that the anti coagulant activity of bromelain helps to enhance the blood flow circulation and prevention of formation of a thrombus (Béez et al., 2007). Bromelain's anti platelet activity thus interferes with the growth and development of platelet mediated cancer and prevents the development of tumor platelet aggregates by uncoating and exposing cancer cells to the immune system (Kalra et al., 2008). Studies on human cholangiocarcinoma cell lines show bromelain downregulated the expression level of MMP 9 and other epithelial mesenchymal transition markers. Downregulation of MMP 9 by inhibition of activator protein 1 (AP 1) and NF κ B signaling pathways remarks reduction of inflammation and deployment of tissue bound growth factors and proteins (Müller et al., 2016).
http://TuEngr.com Page | 8 endothelium at inflammatory sites. CD44 expression at high levels in the blood was found to be associated with cancer progression aggressiveness and lymphatic metastasis. Bromelain was shown to reduce CD44 expression in breast cancer cells which conclude that the reduction could impede the adhesion of lymphocyte on endothelial cells (Munzig et al., 1994). Moreover, in murine microglial cells and human monocytic leukaemia cell lines, bromelain has been shown to reduce PGE 2 and COX 2 expression ( Engwerda et al., 2001). Bromelain increases the development of granulocyte macrophage colony stimulating factors , IL 2, and IL 6 and decreases the activation of T helper cells by activating natural killer cells. The implications of bromelain in immune system response for progression of human cancer would have to be identified in further studies (Chobotova et al., 2010).
6 Acknowledgement
5 Availability of Data and Material
7 References
from Universiti Tun Hussein Onn Malaysia (UTHM) and the Fundamental Research Grant Scheme (FRGS Vote number K220) from the Ministry of Higher Education Malaysia.
4 Conclusion
Bromelain has been shown to be a safe and effective therapeutic agent. Clinical evidence indicates that bromelain has a bright potential to become an important therapeutic agent against cancer. Laboratory evidence indicates that the anti cancer effect of bromelain may be the result of a systemic reaction, likely involving a variety of target sites and pathways. Bromelain inhibits tumor growth, which has antitumor initiating and proliferative properties, as evidenced by induction of p53, shifts in the decreases in Cox 2 expression, induction of caspases, Bax/Bcl 2 ratio and inhibition of the NF κB pathway through regulation of the MAPK and Akt/PKB signaling pathways. Studies of bromelain in relevant psychological and conditions are pivotal for evaluating its role as an anti cancer agent. More clinical assessments in cancer patients are suggested to be done in the future with priority focusing on detecting the effects of bromelain on patient survival in terms of tumor growth and metastasis rate, chronic inflammation, tumor infiltrates, and blood coagulability. In this review, all studies are interpreted to show that bromelain's anti cancer activity affects major pathways and regulators. Bromelain based chemotherapy could benefit from more in vivo studies, laboratory assess ments, clinical trials, and further research in this area.
Ahmad, F. Y., & Carmen, A. (2017). Revisiting the hallmarks of cancer. Anales Venezolanos de Nutricion , 7 (1), 62. Ahn, C. S., & Metallo, C. M. (2015). Mitochondria as biosynthetic factories for cancer proliferation. Cancer and Metabolism, 3 (1), 1 10.
All information is included in this study.
This research is funded by the Geran Penyelidikan Pascasiswazah (GPPS Vot number H730)
Amini Chermahini, F., Raeisi, E., Aazami, M. H., Mirzaei, A., Heidarian, E., & Lemoigne, Y. (2020). Doe s
Bromelain Cisplatin Combination Afford In Vitro Synergistic Anticancer Effects on Human Prostatic Carcinoma Cell Line, PC3? Galen Medical Journal, 9 , 1749. Béez, R., Lopes, M. T. P., Salas, C. E., & Hernández, M. (2007). In vivo antitumoral activity of stem pineapple (Ananas comosus) bromelain. Planta Medica , 73 (13), 1377 1383.
Fitzhugh, D. J., Shan, S., Dewhirst, M. W., & Hale, L. P. (2008). Bromelain treatment decreases neutrophil migration to sites of inflammation. Clinical Immunology , 128 (1), 66 74.
Bhatnagar, P., Patnaik, S., Srivastava, A. K., Mudiam, M. K. R., Shukla, Y., Panda, A. K., Pant, A. B., Kumar, P., & Gupta, K. C. (2014). Anti Cancer activity of bromelain nanoparticles by oral administration. Journal of Biomedical Nanotechnology , 10 (12), 3558 3575.
Chaffer, C. L., & Weinberg, R. A. (2011). A perspective on cancer cell metastasis. Science, 331 (6024), 1559 1564.
Bhui, K., Tyagi, S., Prakash, B., & Shukla, Y. (2010). Pineapple bromelain induces autophagy, facilitating apoptotic response in mammary carcinoma cells. BioFactors, 36 (6), 474 482.
Bhattacharyya, B. K. (2008). Bromelain: An overview. Indian Journal of Natural Products and Resources, 7 (4), 359 363.
DeBerardinis, R. J., Lum, J. J., Hatzivassiliou, G., & Thompson, C. B. (2008). The Biology of Cancer: Metabolic Reprogramming Fuels Cell Growth and Proliferation. Cell Metabolism, 7 (1), 11 20. Dhaval, A., Yadav, N., & Purwar, S. (2016). Potential applications of food derived bioactive peptides in management of health. International Journal of Peptide Research and Therapeutics, 22 (3), 377 398.
http://TuEngr.com Page | 9
Bhui, K., Prasad, S., George, J., & Shukla, Y. (2009). Bromelain inhibits COX 2 expression by blocking the activation of MAPK regulated NF kappa B against skin tumor initiation triggering mitochondrial death pathway. Cancer Letters, 282 (2), 167 176.
Bhui, K., Tyagi, S., Srivastava, A. K., Singh, M., Roy, P., & Singh, R. (2012). Bromelain Inhibits Nuclear Factor Kappa B Translocation , Driving Human Epidermoid Carcinoma A431 and Melanoma A375 Cells Through G 2 / M Arrest to Apoptosis. 243 (January 2011), 231 243.
Chobotova, K., Vernallis, A. B., & Majid, F. A. A. (2010). Bromelain’s activity and potential as an anti cancer agent: Current evidence and perspectives. Cancer Letters, 290 (2), 148 156.
Engwerda, C. R., Andrew, D., Murphy, M., & Mynott, T. L. (2001). Bromelain activates murine macrophages and natural killer cells in vitro. Cellular Immunology , 210 (1), 5 10.
Doughlas, H., & Weinberg, R. A. (2000). The Hallmarks of Cancer. Cell, 100 (1), 57 70.
Coussens, L. M., & Werb, Z. (2002). Inflammation and cancer. Nature, 420 (December), 860 867.
Evan, G. I., & Vousden, K. H. (2001). Proliferation, cell cycle and apoptosis in cancer. Nature, 411 (6835), 342 348.
Egeblad, M., & Werb, Z. (2002). New functions for the matrix metalloproteinases in cancer progression. Nature Reviews Cancer, 2 (3), 161 174.
Elledge, S. J. (1996). Cell cycle checkpoints: Preventing an identity crisis. Science , 274 (5293), 1664 1672.
Chang, T. C., Wei, P. L., Makondi, P. T., Chen, W. T., Huang, C. Y., & Chang, Y. J. (2019). Bromelain inhibits the ability of colorectal cancer cells to proliferate via activation of ROS production and autophagy. PLoS ONE, 14 (1), 1 18.
http://TuEngr.com Page | 10
Lim, S., & Kaldis, P. (2013). Cdks, cyclins and CKIs: Roles beyond cell cycle regulation. Development (Cambridge), 140 (15), 3079 3093.
Kerr, J. F. R., Winterford, C. M., & Harmon, B. V. (1994). Apoptosis. Its significance in cancer and cancer Therapy. Cancer, 73 (8), 2013 2026.
Kastan, M. B., & Bartek, J. (2004). Cell cycle checkpoints and cancer. Nature , 432 (7015), 316 323.
Mamo, J., & Assefa, F. (2019). Antibacterial and Anticancer Property of Bromelain: A Plant Protease Enzyme from Pineapples (Ananas comosus). Curr Trends Biomedical Eng & Biosci., 19 (2), 60 68.
Gariglio, P. (2012). Oncogenes and tumor suppressor genes. Molecular Oncology Principles and Recent Advances, 64 82.
Hale, L. P., Greer, P. K., Trinh, C. T., & James, C. L. (2005). Proteinase activity and stability of natural bromelain preparations. International Immunopharmacology , 5 (4), 783 793.
Levine, A. J., & Puzio Kuter, A. M. (2010). The control of the metabolic switch in cancers by oncogenes and tumor suppressor genes. Science , 330 (6009), 1340 1344.
Manosroi, W., Chankhampan, C., Manosroi, J., & Manosroi, A. (2017). In vitro anti cancer activity comparison of the freeze dried and spray dried bromelain from pineapple stems. Chiang Mai Journal of Science, 44 (4), 1407 1418.
Mohamad, N. E., Abu, N., Yeap, S. K., & Alitheen, N. B. (2019). Bromelain Enhances the Anti tumor Effects of Cisplatin on 4T1 Breast Tumor Model In Vivo. Integrative Cancer Therapies, 18 , 0 6.
Hanahan, D., & Weinberg, R. A. (2011). Hallmarks of cancer: The next generation. Cell, 144 (5), 646 674. Haupt, S., Berger, M., Goldberg, Z., & Haupt, Y. (2003). Apoptosis The p53 network. Journal of Cell Science, 116 (20), 4077 4085.
Martin, S. J. (2014). Caspases: Executioners of Apoptosis. Pathobiology of Human Disease: A Dynamic Encyclopedia of Disease Mechanisms, 16 , 145-152.
Kalra, N., Bhui, K., Roy, P., Srivastava, S., George, J., Prasad, S., & Shukla, Y. (2008). Regulation of p53, nuclear factor κB and cyclooxygenase 2 expression by bromelain through targeting mitogen activated protein kinase pathway in mouse skin. Toxicology and Applied Pharmacology , 226 (1), 30 37.
Maurer, H. R. (2001). Bromelain: Biochemistry, pharmacology and medical use. Cellular and Molecular Life Sciences, 58 (9), 1234 1245.
Folkman, J. (1985). Tumor Angiogenesis. Advances in Cancer Research , 43(C), 175 203. Folkman, J. (1995). Clinical applications of research on angiogenesis. New England Journal of Medicine, 333 (26), 1757 1763.
Fouz, N., Amid, A., & Hashim, Y. Z. H. Y. (2013). Cytokinetic study of MCF 7 cells tr eated with commercial and recombinant bromelain. Asian Pacific Journal of Cancer Prevention , 14 (11), 6709 6714.
Grivennikov, S. I., Greten, F. R., & Karin, M. (2010). Immunity, Inflammation, and Cancer. Cell, 140 (6), 883 899. Gupta, G. P., & Massagué, J. (2006). Cancer Metastasis: Building a Framework. Cell, 127 (4), 679 695.
Kerbel, R. S. (2008). Tumor Angiogenesis. New England Journal of Medicine , 358 (9), 2039 2049.
Müller, S., März, R., Schmolz, M., Drewelow, B., Eschmann, K., & Meiser, P. (2013). Placebo controlled randomized clinical trial on the immunomodulating activities of low and high dose bromelain after oral.pdf 204 (February 2012), 199 204.
Tochi, B. N., Wang, Z., Xu, S. Y., & Zhang, W. (2008). Therapeutic Application of Pineapple Protease ( Bromelain ): A Review. 7 (4), 513 520.
Mynott, T. L., Ladhams, A., Scarmato, P., & Engwerda, C. R. (1999). Bromelain, from pineapple stems, proteolytically blocks activation of extracellular regulated kinase 2 in T cells. Journal of Immunology (Baltimore, Md. : 1950), 163 (5), 2568 2575.
Sasaki, T., Hiroki, K., & Yamashita, Y. (2013). The role of epidermal growth factor receptor in cancer metastasis and microenvironment. BioMed Research International, 2013
Munzig, E., Eckert, K., Harrach, T., Graf, H., & Maurer, H. R. (1994). Bromelain protease F9 reduces the CD44 mediated adhesion of human peripheral blood lymphocytes to human umbilical vein endothelial cells. FEBS Letters, 351 (2), 215 218.
Paroulek, A. F., Jaffe, M., & Rathinavelu, A. (2010). The effects of the herbal enzyme bromelain against breast cancer cell line GI 101A
Sagar, S. M., Yance, D., & Wong, R. K. (2006). Natural health product s that inhibit angiogenesis: A potential source for investigational new agents to treat cancer - Part 2. Current Oncology , 13 (3), 14-26.
http://TuEngr.com Page | 11
Zhang, L., Yu, J., Park, B. H., Kinzler, K. W., & Vogelstein, B. (2000). Role of BAX in the Apoptotic Response to Anticancer Agents. Science, 290 , 989 992
T orgovnick, A., & Schumacher, B. (2015). DNA repair mechanisms in cancer development and therapy. Frontiers in Genetics, 6 (APR), 1 15.
Pavan, R., Jain, S., Shraddha, & Kumar, A. (2012). Properties and Therapeutic Application of Bromelain: A Review. Biotechnology Research International, 2012 , 1 6.
Pillai, K., Ehteda, A., Akhter, J., Chua, T. C., & Morris, D. L. (2014). Anticancer effect of bromelain with and without cisplatin or 5 -FU on malignant peritoneal mesothelioma cells. Anti Cancer Drugs, 25 (2), 150160. Raeisi, F., Raeisi, E., Heidarian, E., Shahbazi Gahroui, D., & Lemoigne, Y. (2019). Bromelain inhibitory effect on colony formation: An in vitro Study on human AGS, PC3, and MCF7 cancer cells. Journal of Medical Signals and Sensors, 9 (4), 267 273.
Senger, D. R., & Davis, G. E. (2011). Angiogenesis. 1 20.
Oliveira, C. P., Prado, W. A., Lavayen, V., Büttenbender, S. L., Beckenka mp, A., Martins, B. S., Lüdtke, D. S., Campo, L. F., Rodembusch, F. S., Buffon, A., Pessoa, A., Guterres, S. S., & Pohlmann, A. R. (2017). Bromelain Functionalized Multiple Wall Lipid Core Nanocapsules: Formulation, Chemical Structure and Antiproliferative Effect Against Human Breast Cancer Cells (MCF 7). Pharmaceutical Research , 34 (2), 438 452.
Müller, A., Barat, S., Chen, X., Bui, K. C., Bozko, P., Malek, N. P., & Plentz, R. R. (2016). Comparative study of antitumor effects of bromelain and papain in human cholangiocarcinoma cell lines. International Journal of Oncology , 48 (5), 2025 2034.
Vermeulen, K., Van Bockstaele, D. R., & Berneman, Z. N. (2005). Apoptosis: Mechanisms and relevance in cancer. Annals of Hematology , 84 (10), 627 639.
Rohardiyana Roslan is a student at the Department of Chemical Engineering Technology, Universiti Tun Hussein Onn, Malaysia. She got a Bachelor’s degree in Chemical Engineering Technology from Universiti Tun Hussein Onn, Malaysia. Her researches are Biomedical Engineering, Polymer and Materials, Tissue Engineering and Chemotherapy. Prof. Madya Ir. Dr. Soon Chin Fhong is a Lecturer at the Department of Electronic Engineering, Universiti Tun Hussein Onn, Malaysia. She got her Ph.D. degree in Molecular and Biomedical Engineering from the University of Bradford, United Kingdom. Her research focuses on 3D Cell Culture , 3D Bio printing and Nanobiotechnology in Tissue Engineering. Dr. Nadirul Hasraf Mat Nayan is a Lecturer at the Department of Chemical Engineering Technology, Universiti Tun Hussein Onn, Malaysia. He got his Master’s and Ph.D. degrees in Polymer Engineering from Universiti Teknologi, Malaysia. His research focuses on Bio fabrication in Tissue Engineering.
Syahirah Mohd Noor is a student at the Department of Chemical Engineering Technology, Universiti Tun Hussein Onn, Malaysia. She got a Bachelor’s degree in Chemical Engineering Technology from Universiti Tun Hussein Onn, Malaysia. Her research is Biomedical Engineering, Polymer and Materials, Tissue Engineering and Chemotherapy.
http://TuEngr.com Page | 12


1 Introduction Traditional software were using programs that are written for serial computation. A serial computation is a whole problem divided into discrete chunks of sub problems that are sequentially executed on a single processor. The main problem of serial computing is time consuming due to the execution of one problem at a given time. Parallel computing emerged in order to replace those problems with serial computing where we use more than one processor to execute instructions faster. Parallel computing enables solving problems in a concurrent method. In order to execute the tasks concurrently, an overall control mechanism is built to control the system [1] .
Abstract This study attempts to investigate the efficient and simple incorporation of a basic pathfinding algorithm that is suitable for students, graduates, freshmen, and scholars for exploring and upgrading research related studies and theories. The aim of writing this paper is to present the fundamentals of AI path finding algorithms most simply and effectively. The algorithm takes inspiration from the popular pathfinding A* algorithm used widely in modular programming architecture in association with parallel computing. This algorithm is well suitable for games or game levels created with the modular designing methodology or any application using modularity as its core foundation. The algorithm enables navigation of any game entity within the game world on a plane surface with obstacle detection. Disciplinary: Artificial Intelligent ©2022 INT TRANS J ENG MANAG SCI TECH.
1Sathyabama University, Chennai, INDIA.
Received 25 January 2022 Received in revised form 29 April Accepted202205May 2022 Available online 12 May 2022
2 Department of CSE, Rajalakshmi Engineering College, Chennai, INDIA.
*Corresponding Author (Email: s.balapriya@gmail.com).
Implementation and Evaluation of an Optimal Algorithm for Neural Networks Association in Machine Learning S. Balapriya1*, N. Srinivasan2
Page | 1 ©2022 International Transaction Journal of Engineering, Management, & Applied Sciences & Technologies
Paper ID: 13A6K Volume 13 Issue 6
Keywords: A* modularity.ArchitectureModularParallelPathfindingalgorithm;algorithm;computing;programming;
ISSN 2228 9860 eISSN 1906 9642
Cite This Article: Balapriya, S., N., Srinivasan. (2022). Implementation and Evaluation of an Optimal Algorithm for Neural Networks Association in Machine Learning. International Transaction Journal of Engineering, Management, & Applied Sciences & Technologies, 13(6), 13A6K, 1 11 http://TUENGR.COM/V13/13A6K.pdf
International Transaction Journal of Engineering, Management, & Applied Sciences & Technologies http://TuEngr.com
CODEN: ITJEA8
DOI: 10.14456/ITJEMAST.2022.116

Parallel computers are not only distinguished from a hardware perspective but also from functional units. The various functional units are cache with different levels like L1, L2, etc, branch, prefetch, decoding, GPU and many more. Multiple threading can also be a part of software functionality to support parallel processing. To create bigger multiple processor clusters, networks connect several stand alone computers, often known as nodes. Today the majority of the global total uses PCs with several processors known as supercomputers which are hardware clusters from well known manufacturers. We chose distributed processing because it is better suited for modelling, simulating, and interpreting complex real world phenomena such as galactic changes, structural geology, meteorology, transport, and many others. Parallel computing, in general, saves time and money in solving complex and difficult problems. Parallelism is the future of computing.
http://TuEngr.com Page | 2
2 Literature Review
Depth First Search DFS Depth First Search is usually practiced in Graphs and Trees. Mainly used in backtracking of topological ordering, creating decision trees, and discovering a solution approaches with various leveled alternatives. Depth First Search is not suitable for finding the shortest path but when it finds a path it is considered as its goal. More suited for games and puzzles, for example, mazes. Dijkstra Instead of investigating all different possibilities equally, Dijkstra's Algorithm is primarily used to choose which directions to explore. It finds the best path involving the lowest cost of traveling. Dijkstra’s algorithm finds the shortest path from a starting node to every other node in the graph/tree. Dijkstra’s Algorithm can find paths to all locations from the start node.
The biggest challenge in game development is designing realistic Artificial Intelligence AI and movements for these AIs. Pathfinding strategies help us to solve this challenge by finding the next path within the game world [3] This system takes the starting and endpoint called the source and destination and finds a series of points in between these points to take the optimal route. These pathfinder logics work based on a condition that requires accepting this path to be the best shortest path of all. The most popular path finding algorithms are.
A pathfinding algorithm is used to solve the shortest path to travel from the given points of source and the destination. We try to find all the possible paths in a programmatic way and out of all the paths we select the best path based on some criteria. These criteria could be cost, time, distance , etc. In graph theory, the shortest path is to find the best and optimal path between two vertices. Pathfinding algorithms are useful in many applications like Google maps, satellite navigations, and routing packets over the internet [2]. This idea of finding the shortest path is not only applicable in real life but also in the gaming world.
Breadth First Search BFS Breadth First Search is usually practiced in graphs and trees [4]. Mainly used in backtracking of any regular traversal, network analysis and finding places nearby in GPS. It explores equally in all directions but doesn't promise to find the best path.
To find the approximate shortest path or best optimal path, an A* algorithm is very effective in both real time scenarios and in games [6]. Especially when you have a map to traverse. Consider the following image with source point, destination point and several obstacles:
The A* search algorithm is one of the finest and almost always used path finding strategies. It's a brilliant technique that many games and web based navigation apply to locate the efficient way quickly (approximation).
There could be an ‘n’ number of destinations for this algorithm [5]. Here we optimise which approach to explore or the order of the paths to be explored.
A*(A Star) Dijkstra's Algorithm is efficient for finding the shortest path, however, it spends time examining directions that aren't necessary. A* is a single destination of Dijkstra's Algorithm that has been updated.
Figure 1: Obstacle
A* finds the best path from one location to another on a map. It prioritizes paths that look closer to the goal. It is the most popular and widely used algorithm known to be the industry standard algorithm for finding the shortest path in both applications and games. In games , most of the AIs use this algorithm to determine the best path.
The game is prepared before the algorithm is executed; meaning the source, destination and obstacles are created or known directly [7]. The entire map is also divided into nodes which are used to record the progression of the game element (usually AI) in the map during the search. In addition to all this, it also holds 3 different attributes called i, l, and n, where 1. i the cost of getting from the start node to the current node
In Figure 1, the path from source to destination is found with several obstacles. The algorithm takes the cost or considers other conditions to take the shortest path and takes every step depending upon these criteria.
http://TuEngr.com Page | 3
3. n the sum of g and h best estimate of the cost of the path going through the current node.
2. l heuristic cost from the current node to the goal node
4. The purposes of i, l, and n are to quantitatively analyse how promising a path is up to

Creation of ObtuseDia Algorithm
The pseudo code for the A* Algorithm is as follows:
c. Repeat step 5 for all valid children of Q. 6. Repeat from step 4. 3
Table 1: Terminologies Terms Meanings Actual Map
As we all know, A* is the widely suitable algorithm for finding the shortest path in games and any application which requires finding the best optimal path. It works well in all cases to handle big data with maps and terrains [8]. In case we need a simple algorithm that works well in the same scenario without much complication in implementing and handling. This idea has led me to think of an algorithm without involving a cost element but simply considering the number of steps or nodes we travel to reach the shortest path.
The map of the game world Trace Map
The map where we traverse SB Source Box DB Destination Box (always 0,0) CB Current Box where the box recently visited NB New/Next Box denotes the next possible box where we are likely to visit r row number to be checked for New/Next Box from Current Box c the column number to be checked for New/Next Box from Current Box CB(r,c) Current Box row & col number NB(r,c) New/Next Box row & col number R New/Next Box row value [up( 1), down(+1)] C New/Next Box column value [left( 1), right(+1)] NB(R,C) Value of New/Next Box row & col SUM(R,C) sum value of NB (R,C)
STEPS no. of steps taken from Source Box to Current Box in order to reach the Destination Box
http://TuEngr.com Page | 4 the present node.
5. Finally, A* maintains two lists, an Open and a Closed list. The Open list contains all the nodes in the map that have not been fully explored whereas the Closed list consists of all the nodes that have been fully explored.
1. Let V= starting point. 2. Assign i, l and n values to V. 3. AddVto the Open list. At this point,V is the only node on the Open list. 4. LetQ = the best node from the Open list (i.e. the node that has the lowest ivalue).
a. If Qis the goal node, then quit a path has been found. b. If the Open list is empty, then quit a path cannot be found 5. Let S = a valid node connected to Q. a. Assign i, l, and n values toS. b. Check whether S is on the Open or Closed list. i. If so, check whether the new path is more efficient (i.e. has a lower fvalue). 1. If so update the path. ii. Else, add S to the Open list.
Trace Map After retrieving the Source and Destination from the Actual Map, a part of the Actual Map is taken to find the optimal path between them. This map is called the Trace Map. The Trace map is relatively less than the Actual Map.
The fundamental of this algorithm is to diagonally move in the upward direction to reach from the source to the destination. According to the concept, below is the working logic: There are 2 maps in this algorithm: Actual Map Actual Map is the original map where all the game entities are present and the game world exists.
Figure 2: Actual/Original Map
http://TuEngr.com Page | 5
Naming the algorithm was really challenging since there could be a lot of algorithms in the market with usual technical names relating to pathfinding [9]. Observing the features and properties of this algorithm, the basic traversing criteria is to satisfy a diagonal path to reach from the source to the destination. Moving diagonally is considered to take less number of steps toward the destination. Hence the term ‘diagonal’ must be in the part of the name. The next step is to consider the direction of movement. Here also the algorithm always marks the destination as (0,0) which means the source will be some (x,y) and we keep moving from source to destination only in the upward direction (most of the time).
3.1.1 Properties of the Actual Map Figure 2 shows original actual map with the properties
3.1 Basic Logic
Considering the style and direction of movement this algorithm was given many names like Dia Angle, Slant Tracing, Back Shadow, Obtuse Angle and a few more. Finally, it is named “Obtuse Dia” meaning moving throughout in an obtuse direction to find the best and optimal path of traversing.

Figure 3 shows the trace map with the properties
The Destination Box is the place where the game entity wants to move. In the Trace Map, the Destination Box will always be Box(0,0) denoted in GREEN color.
2. The path that takes a minimal number of steps is the best and optimal path. In that scenario, in each iteration, we will be moving 1 step by row and column to get close to the Destination Box. This movement would mostly be the diagonal movement within the Trace Map.
The Actual Map space is converted as 2D TILES.
http://TuEngr.com Page | 6
The Source Tile is the tile where the game entity is present, usually denoted in RED color. In this example Source Tile(362,453)
Properties of the Trace Map
Boxes are marked between BOX(0,0) to BOX(r,c) where r,c is the size of the map in rows and columns within the Trace map.
1. We aim at finding the optimal path from the Source Box to the Destination Box in the Trace Map. We assume that the cost of travelling from one box to another is zero and therefore we will not consider the element called cost. Instead of the cost we take a path that can reach the Destination Box by counting the number of steps.
Tiles are marked between TILE(0,0) to TILE(x,y), where x,y is the size of the map in rows and columns within the Actual Map.
The Destination Tile is the tile where the game entity would like to move, usually denoted in GREEN color. In this example Destination Tile(353,398)
The Source Box is the place where the game entity is present, usually denoted in RED color. In this example Source Box(9,5)
Figure 3: Trace Map
The Trace map space is converted as BOXES.
3.1.2

Figure 4: Trace Map for optimized path
http://TuEngr.com Page | 7
5. In this example after step 5, we do not have any diagonal box so we move 1 step by row to reach the Destination Box. Here we reach the Destination Box in 8 steps which are considered the best and optimal path.
4 Case Studies
Case Study 1 : Assume there are no obstacles in the Trace Map (Figure 5). Source Box(5,5) is marked as RED and Destination Box(0,0) is marked as GREEN.
4. For example, in the above example the optimal path found by the algorithm ObtuseDia() is given below :
Solution: In this scenario, in each iteration we try to find the next best box to move so that we get close to the Destination Box. Source Box is SB, Destination Box is DB, Current Box CB is the box where the game entity is present, NB New Box is the box we are considering moving in this iteration. The R and C store the direction value from the CB. R and C may have the values 1, 0, +1. This algorithm calculates the Sum(R,C) before deciding the NB. if Sum(R,C) is 2 or 1, it is considered the best box to move. If Sum(R,C) is 0, then this box is considered to be the medium optimal choice. If Sum(R,C) is greater than 0, then this box is considered to be the worst optimal choice taken since there is no other option.
3. If there is no diagonal box available or the diagonal box is filled with obstacles, we choose to either move 1 step to a row or column. If moving 1 step closer by row or column or both is not possible we will try to re route and take a long path.
6. If we take any other route also, you may reach the Destination Box with 8 or greater than 8 steps only. But not less than 8 steps.
7. Once we get this path, we apply the same path in the Actual Map to move the game entities to reach the Destination Tile from the Source Tile.

http://TuEngr.com Page | 8
Figure 6: One obstacle
Solution: In this scenario, in the first iteration, we take the New Box(4,4) and in the second iteration New Box(3,3). In the third iteration, we find an obstacle in Box(2,2) hence, we have to take a different path. Let us see what are the different paths we can take after identifying an obstacle: Now, we have 6 options or ways to travel on the Trace map to reach the Destination Box (Figure 7). The different possible boxes that we can move from the current box(3,3) are highlighted as A, B, C, D, E, and F. Box A(3,2) This box moves forward from the Current Box by 1 column Box B(2,3) This box moves forward from the Current Box by 1 row Box C(2,4) This box moves forward by 1 row but backward by 1 column Box D(3,4) This box moves backward by 1 column Box E(4,3) This box moves backward by 1 row Box F(4,2) This box moves backward by 1 row but forward by 1 column.
Case Study 2 : Assume there is one obstacle in the Trace Map (Figure 6). Source Box(5,5) is marked as RED, Destination Box(0,0) is marked as GREEN, Box(2,2) is marked as Obstacle in BLACK
Figure 5: No obstacles
Look at the below calculations for this scenario. Hence the best or optimal path is found to be the following :


http://TuEngr.com Page | 9
Figure 8: ObtuseDia algorithm description
Consider the case without obstacles: In Figure 9, the trace map is highlighted in WHITE color. And the shortest path between the source and destination is marked in PURPLE color.
Since the motive of our algorithm is to reach a short distance by taking less number of steps to traverse the Trace map, our algorithm will take either the route of A or B according to the order of execution.TheObtuseDia
Figure 7: One obstacle
algorithm is implemented as a prototype to check the functionality with sample data (Figure 8) This prototype is working fine with any valid data given to it. The output of the execution of the prototype is given below:
Let us consider Boxes A and B. In b oth cases, after evading the obstacle box, we can reach the destination in 5 steps.
In case we take the Boxes C, D, E , and F, after evading the obstacle box we will be taking a total of 6 steps to reach the Destination Box.


Figure 9: Trace Map (without obstacles)
This study investigated the efficient and simple incorporation of a basic path finding algorithm that is suitable for students, graduates, freshmen and scholars for exploring and upgrading research related studies and theories. The algorithm takes inspiration from the popular pathfinding A* algorithm used widely in modular programming architecture in association with parallel computing. This algorithm is well suitable for games or game levels created with the modular designing methodology or any application using modularity as its core foundation. The algorithm enables navigation of any game entity within the game world on a plane surface with obstacle detection.
6 Availability of Data and Material Data can be made available by contacting the corresponding author.
5 Conclusion
Figure 10: Trace Map (with obstacles)
http://TuEngr.com Page | 10
And the shortest path between the source and destination is marked in PURPLE color.
Consider the case with obstacles: In Figure 10, the trace map is highlighted in WHITE color.


http://TuEngr.com Page | 11 7 References
[8] Noto, M abd Sato, H. (2000, October). A method for the shortest path search by extended Dijkstra algorithm. In Smc 2000 conference proceedings. 2000 ieee international conference on systems, man and cybernetics.'cybernetics evolving to systems, humans, organizations, and their complex interactions'(cat. no. 0 (Vol. 3, pp. 2316 2320). IEEE.
[2] Luo, L., Wong, M and Hwu, W. M. (2010). An eective GPU implementation of breadthfirst search. In Design Automation Conference (pp. 52 55). IEEE.
S. Balapriya is a student at the Faculty of Computing, Sathyabama University, Chennai, TamilNadu. She got a Master's degree in Computer Application. Her researches are on Computer Game Technologies. Dr. Srinivasan N is a Professor at the Department of Computer Science, Rajalakshmi Engineering College, Chennai, TamilNadu. He got his Master’s and Ph.D. degrees in Computer Science. His research focuses on Cloud Technology, Data Mining and Testing.
[1] Beamer, S., Asanovic, K and Patterson, D. (2012). Direction optimizing breadth first search. In SC'12: Proceedings of the International Conference on High Performance Computing, Networking, Storage and Analysis (pp. 1 10). IEEE .
[4] Holzmann, G. J., Peled, D. A and Yannakakis, M. (1996). On nested depth first search. The Spin Verication System, 32, 81 89
[3] Awerbuch, B. (1985). A new distributed depth first search algorithm. Information Processing Letters, 20(3), 147 150.
[5] Duchon, F., Babinec, A., Kajan, M., Beno, P., Florek, M., Fico, T and Jurisica, L. (2014). Path planning with modied a star algorithm for a mobile robot. Procedia Engineering , 96, 59 69.
[6] AlShawi, I. S., Yan, L., Pan, W and Luo, B. (2012). Lifetime enhancement in wireless sensor networks using fuzzy approach and A star algorithm.
[7] Yao, Junfeng, Chao Lin, Xiaobiao Xie, Andy JuAn Wang, and Chih Cheng Hung. Path planning for virtual human motion using improved A* star algorithm. In 2010 Seventh international conference on information technology: new generations, pp. 1154 1158. IEEE, 2010.
[9] Deng, Y., Chen, Y., Zhang, Y and Mahadevan, S. (2012). Fuzzy Dijkstra algorithm for shortest path problem under uncertain environment. Applied Soft Computing , 12(3), 1231 1237.


Page | 1
The of Parents in Choosing Tutorial Schools for Students in Samutsakhon Province in Thailand
*Corresponding Author (Email: hellokt.st @gmail.com). Paper ID: 13A6L Volume 13 Issue 6 Received 10 February 2022 Received in revised form 26 April Accepted202207 May 2022 Available online 14 May 2022
©2022 International Transaction Journal of Engineering, Management, & Applied Sciences & Technologies
Salintip Sanrasak1*, Alif Samse y1 , Supaw adee Lapcharoen1
1 Introduction In Thailand, there is a survey from Thai Publica (2015), statistical data for 2006 2013, tutoring schools are expanding every year. This shows that the need for tutoring has always been and is increasing. According to private education statistics, in the 2017 academic year, there were 2,483 tutoring schools, of which 546 in Bangkok had 166,877 students, approximately one third of tutoring students across the country. The remaining 1,937 tutoring schools are scattered in the provinces with 337,041 students from the student tutoring needs The tutoring schools have increased greatly with their quality in their field, became known but limited because school
DOI: 10.14456/ITJEMAST.2022.117
ISSN 2228 9860 eISSN 1906 9642
International Transaction Journal of Engineering, Management, & Applied Sciences & Technologies http://TuEngr.com
Opinions
1 Faculty of Education, Ramkhamhaeng University, THAILAND.
CODEN: ITJEA8
Keywords: Choosing a tutoring school ; Choice of tutoring schools; Type of parents; Investment in children education; Parents’ income; Parents’ education level.
Abstract In this research, the objective was to study the opinions of parents in choosing a tutoring school for students. And compare the demographic characteristics of parents affecting the choice of tutoring schools classified by age, occupation, educational level, and family monthly income. The study sample consists of 359 parents of primary school students in Samutsakhon. Overall opinions of parents in choosing a tutoring school for primary school students in Samutsakhon are at the highest level. And when considering each aspect, it was found that product and process results , customer results, workforce results , and governance results are the most important. From the comparison by using ANOVA, classified by different age, education level, occupations, and monthly income of the family had significantly different opinions on choosing tutoring schools for students at a 95 percent confidence interval. Disciplinary: Education Science, Parenting. ©2022 INT TRANS J ENG MANAG SCI TECH. Cite This Article: Sanrasak, S , Samsey, A., Lapcharoen, S. (2022). The Opinions of Parents in Choosing Tutorial Schools for Students in Samutsakhon Province in Thailand. International Transaction Journal of Engineering, Management, & Applied Sciences & Technologies, 13(6), 13A6L, 1 6. http://TUENGR.COM/V13/13A7U.pdf

2
3 Method
Parents attend to sending students t o tutoring schools Because t he additional learning time and alternative didactic approaches of the tutors improve the student’s academic achievement. In line with much existing literature, it was found that the marketing mix factor had a statistically significant correlation with the behavior of sending their children to school. Personnel, product, price, and location factors are important in decision making behavior to sending their children to mental math tutoring schools. Parents pay the most attention to personnel factors because a teacher is a person who transfers knowledge and abilities to students for effective learning. (Chatnamcharoen, 2016) Most of the parents and students found that the teachers have a better ability to communicate the content to the learners. Therefore, parents expect great results from tutoring to pass exams or obtain higher grades. (Singmacha , 2016)
Literature Review
http://TuEngr.com Page | 2
The family income and parental educational levels have a significant effect on tutoring attendance. Panichkan (2011) found that higher incomes and higher parental educational levels devoted more resources to tutoring Parents have to work more outside the home, they were unable to self teach homework or tutoring, thus need to rely on tutoring schools to ensure students will keep up, get ahead and catch up with their classmates . There are many factors that parents think about before making a decision related to selecting a tutoring school, especially the courses that are being taught according to the needs of the learners, the location of the tutoring school that is close to the community, easy to access, and tuition fees are clearly stated. (Suwansing , 2015) Also, parents of different ages had the same opinion, but when considering each aspect, it was found that the motivation and expectation of the tutoring school were different. (Srisangnam, 2012)
administration requires a management process and other factors, as with various organizations . Therefore, the researcher is interested in studying the opinions of parents in choosing a tutoring school , then comparing the demographic characteristics of parents affecting the selection of tutoring schools through the national quality award criteria. This is a criterion for developing organizational management capabilities. National Quality Award is a world class award because it has the same technical background and award judging process as Malcolm Baldridge National Quality Award (MBNQA), tutoring schools have applied guidelines that met these criteria that would build confidence and trust in the parents which serve as the important guidelines for parents in deciding the quality of tu toring school for their children. T he National Quality Award is considered a world class award because it is based on the same technical background and award judging process as the United States National Quality Award which can be seen. National Quality Award is one of the tools for assessing the quality of education and managing the school quality system. Tutoring schools can be used in developing quality management, achieving the goal s, and improving to increase competitiveness.
The research started by studying the related theories and research works regarding the opinions of parents in choosing a tutoring school for students. Then design the research
http://TuEngr.com Page | 3 methodology. This is a quantitative study. The required data were recorded by the research checklist and used in the analysis by frequency, percentage, standard deviation, One way ANOVA, and Scheffé's (Scheffé's method).
Table 1: The status of the parents. Status Parents % 1.LowerAge than 31 110 30.6 31 40 92 25.6 41 50 126 35.2 O ver than 50 31 8.6 2.LowerEducationthan bachelor’s degree 87 24.2 Bachelor’s degree 211 58.8 Higher than bachelor ’s degree 61 17.0 3.GovernmentOccupation personnel 153 42.6 Business Owner 109 30.4 Employee 56 15.6 Unemployed 41 11.4
4 Analysis and Results
Overall opinions of parents in choosing a tutoring school for primary school students in Samutsakhon are at the highest level. When considering each aspect, it was found that product and process results, customer results, workforce results, and governance results are the most important. From Table 2, parents' opinions on choosing a tutoring school for students overall and each aspect is at the highest level in every aspect. Except for the marketing, the aspect is at a high level.
4. monthly income of the family (Baht) Lower than 18,000 4 1.1 18,001 36,000 167 46.5 More than 36,000 188 52.4 Total 359 100.0
Table 2: The level of parents’ opinion in choosing a tutoring school for their kids Aspect Mean SD Product and process results 3.37 0.43 Customers results 3.26 0.49 Workforce results 3.49 0.41 Governance results 3.34 0.51 Market results 3.16 0.61 Overall 3.32 0.38
Table 1, t he status of the parents who answered the questionnaire, from 359 people, there were 110 parents lower than 31 years old 30.6% of the total number of the questionnaire, 25.6% were 31 40 years old, 35.2% were 50 years old , aged 51 and over were 8.6% 24.2% of parents ha d a lower than bachelor's degree, 58.8% had a bachelor's degree, and 17% had a higher bachelor’s degree. 42.6% of parents were government personnel, 30.4% were business o wners, 15.6% were employees, and 11.4% unemployed Parents 1.1% had less than 18,000 Baht for their monthly income of the family, 46.5% 18,001 30,000Baht, and 52.4% higher than 30,000 baht per month.
From the comparison by using ANOVA, classified by different age, education level, occupations, and monthly income of the family had significantly different opinions on choosing tutoring schools for students at a 95 percent confidence interval. The details are summarized in Tables 3 6.
Table 3: Comparison of parents' opinions classified by age.
http://TuEngr.com Page | 4
Table 5: Comparison of parents' opinions classified by occupation
OccupationAspect personnelGovernmentandBusinessOwner GovernmentpersonnelandEmployee personnelGovernmentandUnemployed OwnerBusinessandEmployee UnemployedOwnerBusinessand UnemployedEmployeeand Customers results >0.05 >0.05 <0.05* >0.05 >0.05 >0.05 Governanceresults >0.05 >0.05 >0.05 <0.05* >0.05 >0.05
Table 4 shows the results of parents with different educational levels having statistically different opinions on choosing a tutoring school for students who differ in lower than bachelor's degree and higher than bachelor’s degree in customers’ results, workforce results, governance results, and market results. And they had a statistically different opinion in bachelor's degree and higher than bachelor’s degree in workforce results , governance results, and market results.
Table 3 shows the results of parents with different age ranges having significantly different opinions on choosing tutoring schools for students at 95 percent confidence.
Table 4: Comparison of parents' opinions classified by education level.
Table 5 shows the results of parents with different occupations on choosing tutoring schools for students , there are differences in government personnel and unemployed in customers results, business owner and employee aspect in governance results.
AspectAge Lower than 31 and 31 40 Lower than 31 and 41 50 Lower than 31and over than 50 31 40 and 41 50 31 40 and Over than 50 41 50 and Over than 50 Product and resultsprocess >0.05 <0.05* <0.05* >0.05 >0.05 >0.05 Customers results >0.05 <0.05* <0.05* <0.05* <0.05* >0.05 Workforce results >0.05 <0.05* >0.05 <0.05* <0.05* >0.05 Governance results >0.05 <0.05* >0.05 <0.05* <0.05* >0.05 Market results >0.05 <0.05* >0.05 <0.05* <0.05* >0.05
AspectEducationallevel Lower than bachelor’s degree anddegreebachelor’s Lower than bachelor’s degree and higher than bachelor’s degree bachelor’s degree and higher than a degreebachelor’s Customers results >0.05 <0.05* >0.05 Workforce results >0.05 <0.05* <0.05* Governance results >0.05 <0.05* <0.05* Market results >0.05 <0.05* <0.05*
AspectIncome Lower than 18,000 and 18,001 36,000 Lower than 18,000 and more than 36,000 18,001 36,000 and more than 36,000 Product and resultsprocess >0.05 >0.05 <0.05* Customers results >0.05 >0.05 <0.05* Market results >0.05 >0.05 <0.05*
The opinions of parents in choosing a tutoring school for students at the most important level, because parents focus on quality teaching . Tutoring schools must have personnel with knowledge and abilities, and experiences in transferring knowledge to students. It will be a safe and conducive learning space and has a good reputation to help achieve its goals.
Education is a very long investment; even in today's highly competitive society, getting a good education can help create a bright future for students. Parents try to give their kids this opportunity, even though the burden of increased expenses but parents is happy to support them.
5 Conclusion
In which , parents with different incomes will have different support powers. Therefore, it is important to decide wisely in choosing tutoring schools t o get the best results and the best value.
7 References Chatnumchareon, J. (2016). Independent Study on Factors Influencing Parental Choices of Tuition School: A Case Study on Mental Arithmetic Schools. Master of Business Administration, Rajamangala University of Technology Rattanakosin. Panichakan, C. (2011). Parents’ Decision to Bring Their Children to study in Tutorial School in Chonburi Province. Master of Science Industrial Management, King Mongkut’s Institute of Technology Ladkrabang. Singmutcha, S. (2016). The Opinions of Parents and Students on Choosing Tutorial Secondary School in Bangkok Area. Master of Business Administration Program, Rajamangala University of Technology Krungthep.
Parents of different ages, educational levels, occupations, and family monthly incomes ha d significantly different opinions on choosing tutoring schools for primary students at a .05 level in all aspects. Young parents who are still in their working years may blur recognizing the importance of education in influencing future careers. Therefore parents want students to attend tutoring schools in order to have more opportunities for further education and have good grades. Some parents who receive different levels of education have different knowledge and experiences that may affect the decision making process . Parents with low educational levels may have littl e confidence in their knowledge, unable to teach or educate their children Therefore, they need a tutorial sc hool that is close to their homes, and safe, in order continuously gain knowledge.
All information is included in this study.
Table 6: Comparison of parents' opinions classified by the monthly income of the family
6 Availability of Data an d Material
Table 6 shows the results of parents with different family monthly incomes had a statistically significantly different opinion on choosing a tutoring school for students at the 95 percent confidence, there were differences in 18,001 36,000baht and more than 36,000baht aspects in product and process results , customers, and market.
http://TuEngr.com Page | 5
Srisangnam, M. (2012). A Study of Decision Making in Factors of Parents in Enrolling Their Children to Study Kumon Mathematics Program at Tutorial Schools in Thailand. Master of Education, Ramkhamhaeng Suwansing,University.N.(2015).
Factors in Decision Making to Select Tutorial Institutes by Parents of Primary Education Students in Loei municipality, Loei Province. Master of Business Administration, Loei Ratjabhat University. Thaipublica. ( 2015). Top 9 tutoring schools without limits, Over the past 7 years, expanding 200 300 places per year. Retrieved November 2019, https://thaipublica.org/2015/02/tutor 1/ Thailand Quality Award. (2017). TQA Criteria for Performance Excellence Framework 2018 2019 Bangkok.
Salintip Sanrasak is a student for a master’s degree at the Faculty of Education, Ramkhamhaeng University, Thailand She has also earned a bachelor’s degree in business administration from Ramkhamhaeng University. She is a Manager in International Trading, and also runs Private Tuition. Her research focuses on Tutorial School Management
http://TuEngr.com Page | 6
Alif Samsey is a master’s student at the Faculty of Education, Ramkhamhaeng University, Thailand He got a bachelor’s degree in Civil Engineering from Thammasat University, and a master’s degree in Civil Engineering from Gifu University, Japan. He also works as a flight attendant at Thai Airways. He is also a school licensee of Khanawali Memorial School which is a private school located in Narathiwat Province. He is interested in School Development, and Curriculum Development. His research focuses on Private School Administration Dr. Supawadee Lapcharoen is an Assistant Professor at the Faculty of Education, Ramkhamhaeng University, Thailand She got her Ph.D. degree in Educational Administration from Vongchavalitkul Un iversity, Thailand. Her research focuses on Educational Management


International Transaction Journal of Engineering, Management, & Applied Sciences & Technologies http://TuEngr.com
1 Business Administration Department, Faculty of Economics and Administration, King Abdulaziz University, Jeddah, SAUDI ARABIA.
Abstract Training and quality culture are important approaches that hospitals use to improve performance. This study aimed to investigate the impact of training and quality culture on administrative staff performance and patient satisfaction in public hospitals in Saudi Arabia (SA). This study followed a deductive, quantitative, and descriptive analytical approach. Data was collected from public hospital administrative staff (n=211) through a Google Forms questionnaire which was distributed as a link to the study participants through social media applications and e mails. Data analysis reveals that the training and quality culture of administrative staff in SA public hospitals has helped improve their behavior and service to their clients. There is no relationship between training, quality culture, and employee satisfaction. There is a positive relationship between quality culture and employee satisfaction. There is a statistically significant impact of training culture and quality culture on administrative services. Therefore, this study recommends developing deliberate training plans for raising administrative competencies and services in public hospitals in SA and encouraging administrators to practice and apply what has been acquired from training programmers and quality principles. Further studies should be conducted to find effective strategies for adopting training and quality culture in hospitals during pandemics (e.g., COVID 19).
Satisfaction of Patients and Administrative Staff: A Study in Saudi Arabia Public Hospitals
3University of Business and Technology, College of Business Administration, Jeddah, SAUDI ARABIA.
*Corresponding author (Email: salbliwi@kau.edu.sa). ID: 13A6M Volume 13 Issue 6 01 January 2022 Received in revised form 01 May 07 May 2022 online 14 May 2022
Disciplinary: Hospital Management.
Page | 1 ©2022 International Transaction Journal of Engineering, Management, & Applied Sciences & Technologies ISSN 2228 9860 eISSN 1906 9642 CODEN: ITJEA8
Keywords: Staff Administrativetraining; staff; Healthcare HRM; Employee satisfaction; Quality managementPublicpleasureCultureAdministrativeculture;service;quality;Patient’s;HospitalHRM;hospital.
Accepted2022
International Transaction Journal of Engineering, Management, & Applied Sciences & Technologies, 13(6), 13A6M, 1 13. http://TUENGR.COM/V13/13A6M.pdf
Saja Ahmed Albliwi1, Wajanat Kamil Alhashimy2 and Mohammed Binkhamis3
Paper
Available
Cite This Article: Albliwi, S.A., Alhashimy, W.K and Binkhamis, M (2022). Impacts of Training and Quality Culture on the Satisfaction of Patients and Administrative Staff: A Study in Saudi Arabia Public Hospitals.
2Ministry of Health, Quality and Patient Safety Department and Transformation management Office, Jeddah First Health Cluster, Jeddah, SAUDI ARABIA.
Impacts of Training and Quality Culture on the
Received
©2022 INT TRANS J ENG MANAG SCI TECH.
DOI: 10.14456/ITJEMAST.2022.118

http://TuEngr.com Page | 2 1
Another definition of training is “a program aimed to provide employees with the required information and skills, which enable them to work efficiently and effectively” (Al Jobairi et al., 2021). Training culture encourages green training, which is defined as “a system for teaching practices related to the work environment for improving employees’ awareness and skills to manage the work environment” (Tang et al., 2018).
On the other hand, quality is define d as “a total management philosophy that aims to continuity of improvement in the whole organization through the optimal use of resources employing them for customer service” (Kaynak and Hartley, 2005). It is also “a non stop process that aims to reduce and eliminate mistakes and improve customer service and assurance by providing adequate training for employees” It is the approach and behavior which enable employees to meet customers’ expectations by carrying out the right activities at the optimum time (Patel and Pitroda, 2021). Both a culture of training and quality allows all hospital staff to systematically incorporate the concepts of training and quality into their work lives, which has a positive impact on patient satisfaction.
Quality is considered an essential factor in improving the performance and outputs of healthcare institutions, thereby improving customer satisfaction. This is especially true in the healthcare sector, where the quality of healthcare services is regarded as a key factor goal in customer satisfaction Health providers can play an effective role in achieving this goal, especially if they are capable of providing quality services. To achieve this goal, healthcare organizations need to educate healthcare professionals and service workers on social relationships and communication skills (Velmurugan et al., 2019). Therefore, there is a correlation between training in the healthcare organization and the achievement of quality culture and quality of service, thereby achieving customer satisfaction. Training and quality culture are the most prominent approaches that hospitals adopt to improve their performance. Training culture is " a short term organized process that enables employees (not managers) to acquire knowledge and technical skills that help them achieve the organization’s goals" (Slamet et al., 2021). Training is also “an activity planned for enhancing the employees’ knowledge and providing them with skills, competencies, and experiences to help in their current and future jobs” (Noe, 1986; Schmidt, 2007; Polo et al., 2018).
Introduction Services that benefit human well being are considered one of the greatest concerns, especially if these services are related to health (Summers et al., 2012). Therefore, governments in developed countries are focusing on research related to the health sector.
In Saudi Arabia, the government sets a huge annual budget for health care sectors (Alharbi , 2018) The goal of hospitals is to promote patient satisfaction both inside and outside the hospital by improving the performance and efficiency of healthcare services (Lee and Lee, 2022). Unfortunately, most administrative staff are not well trained to deal with others. Therefore, it is difficult for managers to maintain active contact with customers (Greenhaw and D’Abreau, 2020).
Table 1: C ommon 5 point Likert scale format for measuring the weighted average of statements and dimensions.
The second part consisted of 21 closed ended questions, divided into four dimensions (training culture, employee satisfaction, quality culture, and administrative services). The questionnaire was conducted electronically via Google Forms, distributed as a link to the study participants through social media applications (Twitter, LinkedIn, WhatsApp, and Facebook) and sent by email. The link was available for 4 weeks. The target group is the administrative staff of public hospitals in Saudi Arabia from 2020 to 2021. The subject’s size of this study was determined using the formula of Thampson (2012), ���� = ���� ∗����(1 ����) [(���� 1)∗(����2 ����2)+����(1 ����)] , N: Population size; p: probability value = 0.5m; d: error = 0.05; z: standard normal value =1.96. Accordingly, the subject’s size is 211.
2 Research M ethodology
Scale M easurement
By realizing this level of culture, hospitals can achieve their own goals, minimize potential errors, and achieve the highest levels of staff and patient satisfaction (Lee and Lee, 2022).
2.2
H3: “Quality culture positively affect s administrative healthcare services in public hospitals in SA”. H4: “Quality culture increase employee satisfaction in public hospitals in SA”.
All statements are positively formulated and refer to the relationship between factors and statements. Table 1 shows a common 5 point scale format for measuring the weighted average of statements and dimensions. The mean and standard deviations of all questionnaire statements and dimensions were detected and sorted in descending order according to the mean of the statements.
H1: “Training culture positively affect s administrative healthcare services in public hospitals in SA”.
http://TuEngr.com Page | 3
Scale Strongly disagree Disagree Neutral Agree Strongly agree Average range 1 1.80 1.81 2.60 2.61 3.40 3.41 4.20 4.21 5
This study follows a deductive, quantitative, and descriptive analytical approach. It is based on a questionnaire as a research tool to understand the relationships between dependent variables (training culture and quality culture) and independent variables (administrative services and customer satisfaction) 2.1 Research Instrument and Subject s Size
The data was collected using a questionnaire created from a previous study. The questionnaire has been divided into two parts. The first part was concerned with demographic information about the participants, such as sector type, age, qualifications, and years of experience.
H2: “Training culture increase employee satisfaction in public hospitals in SA”.
This study aimed to investigate the relationship between training, quality culture, and customer satisfaction to determine its impact on the administrative services of public hospitals in Saudi Arabia (SA) Research hypotheses are
A pilot study was constructed to check the validity and reliability of the questionnaire, including 20 public hospital administrative staff who are different from the study population. Since the pilot study size is less than 30 subjects, a normal distribution test (Kolmogorov Smirnov) was conducted to check the normality of the distribution. The Kolmogorov Smirnov value was 0.071 (greater than 0.05), so the results of the pilot study follow a normal distribution and the parametric test can be used (Table 2) .
Table 2: Kolmogorov Smirnov normal distribution test. Kolmogorov Smirnov Statistic df Sig. Questionnaire total score 0.185 20 0.071
2.4 Validity T est
2.5 Reliability Test
Table 4: Cronbach’ s alpha values between dimension and grand total of the questionnaire.
Cronbach’s alpha test was used to compute reliability for each dimension. Cronbach’s alpha reliability coefficient normally falls between 0 and 1. Table 4 showed that the overall reliability was 0.95 / excellent, which is sufficient to guarantee a reliable internal consistency of the questionnaire. The administrative services dimension had the highest Cronbach’ s alpha value (0.91 / excellent), while the employee satisfaction dimension has the lowest Cronbach’s alpha value (0.85 / good ). The values in Table 4 prove that the study que stionnaire was reliable.
To check the questionnaire validity, Person correlation coefficients were computed between dimensions and the grand total of the questionnaire. Table (3) shows that all Person correlations are statistically significant at level (α=0.01), and all dimensions correlated with the grand total of the questionnaire. Person correlation coefficients ranged between (0.79 0.95) with a high degree of validity, which establishes the desired measurement goals.
Table 3: Pearson correlation coefficients between dimension and grand total of the questionnaire. Dimension Pearson correlation coefficients Training culture 0.86* Employee satisfaction 0.81* Quality culture 0.95* Administrative services 0.79* *Statistically significant at level (α=0.01)
http://TuEngr.com Page | 4
Dimension Cronbach's Alpha Internal consistency Training culture 0.90 Excellent Employee satisfaction 0.85 Good Quality culture 0.90 Excellent Administrative services 0.91 Excellent Overall reliability 0.95 Excellent
Pilot Study
2.3
3 3.1ResultsDemographic
The age category “30 39 years old” has the highest percentage in the sample with 55.9%, while the category “less than 30 years old” has the lowest percentage with 6.6%. Respondents with “bachelor” qualifications have the highest percentage with 48.8%, while respondents with other qualifications have the lowest percentage with 2.4%. Regarding the experience, the 6 12 years category has the highest percentage of respondents with 40.8%, while the category less than 6 years has the lowest percentage with 10.4% (Table 5) .
The results were analyzed using the Statistical Package for Social Sciences (SPSS) version 23. Descriptive and inferential statistics are used to test the study hypotheses. One way analysis of variance (ANOVA) was used to check if there is a statistically significant on the dependent and independent variables.
Table 5: The study participants’ demographic and functional information Characteristics Frequency (n=211) Percent (%) Age less than 30 14 6.6 30 39 118 55.9 40 49 60 28.4 50 and above 19 9.0 Qualifications High School 18 8.5 Diploma 42 19.9 Bachelor 103 48.8 Higher Education 43 20.4 Other 5 2.4 Experience Less than 6 years. 22 10.4 6 12 years 86 40.8 13 19 years 56 26.5 20 and more 47 22.3 3.2 Training Culture
Table 6: Training culture dimension statements. Statement Mean Std. Deviation Scale Training is a way to improve my performance 4.48 0.692 Strongly agree Training increases my participation in decision making 4.02 0.897 Agree Training changes my work reality 3.94 0.911 Agree I have a good chance of getting a promotion by taking training courses 3.42 1.264 Agree I face opposition during the application of skills and knowledge I learn 2.92 1.037 Neutral Training culture 3.76 0.565 Agree
http://TuEngr.com Page | 5
2.6 Statistical Analysis
and Functional Info rmation of the Study Participants
Table 6 represents training culture dimension statements. The statement “training is a way to improve my performance” comes first with a mean of (4.48 ± 0.692/ (strongly agree). The statement “I face opposition during the application of skills and knowledge I learn.” comes last with a mean of 2.92 ± 1.037 (neutral). The total average for the training culture dimension was 3.76 ± 0.565 (agree).
3.3 Employee S atisfaction
My work includes all staff in a continuous training program 2.77 1.233 Neutral Quality culture 3.21 0.845 Neutral 3.5 Administrative Services
Table 8 represents the quality culture dimension statements. The statements “I feel using quality tools (e. g., flow charts, and diagrams….etc.) help me to improve my work outputs” come first with a mean of 3.74±1.039 (agree). The statement “My work includes all staff in a continuous training program” comes last with a mean of 2.77±1.233 (neutral). The total average for the quality culture dimension is 3.21±0.845 (neutral).
Table 7: Employee satisfaction dimension statements. Statement Mean SD Scale
I am ready to provide assistance related to administrative services 4.32 0.742 Strongly agree
I'm committed to accomplishing my administrative tasks on time 4.24 0.777 Strongly agree I rely on modern electronic methods to provide administrative service 4.13 0.861 Agree I`m Acting professionally while doing my administrative tasks 4.08 0.902 Agree I`m knowledgeable about all my administrative tasks 3.98 0.971 Agree Administrative Services 4.15 0.679 Agree
My work`s services conform to the customers’ requirements 3.45 1.001 Agree
I`m satisfied with the appreciation that I get for my work 3.35 1.199 Neutral
I feel using quality tools (e. g., flow charts, and diagrams…. etc.) help me to improve my work outputs 3.74 1.039 Agree
I`m satisfied with the way my manager handles the employees 3.26 1.216 Neutral I`m satisfied with the availability of resources to do my work 2.95 1.154 Neutral Employee satisfaction 3.38 0.824 Neutral
Table 9: Administrative services dimension statements Statement Mean SD Scale
I`m totally satisfied with my work 3.82 0.985 Agree
3.4 Quality Culture
I`m satisfied with the way my colleagues behave with each other 3.50 1.025 Agree
http://TuEngr.com Page | 6
Table 8: Quality culture dimension statements. Statement Mean SD Scale
Table 9 represents the administrative services dimension statements. The statements “I am ready to provide assistance related to administrative services” come first with a mean of 4.32 ± 0.742 (strongly agree). The statement “Knowledgeable about all my administrative tasks” comes last with a mean of 3.98 ± 0.971 (agree). The total average for the administrative services dimension is 4.15 ± 0.679 (agree).
My work implements the overall quality concept 3.23 1.063 Neutral My work encourages me to use quality tools (e. g., flow charts, and diagrams…. etc.) for work facilitation and quality 3.07 1.123 Neutral Work motivates all staff by truth, respect, recognition of merits, material, and moral rewards, etc. 3.00 1.187 Neutral
Table 7 represents employee satisfaction dimension statements. The statement “I`m totally satisfied with my work” comes first with a mean of 3.82 ± 0.685 (agree). In comparison, the statement “I`m satisfied with the availability of resources to perform my work” comes last with a mean of 2.95 ± 1.154 (neutral). The total average for the employee satisfaction dimension is 3.38 ± 0.824 (neutral).
3.8 Linear r egression analysis between employee satisfaction and independent variables
Pearson correlation analysis was used to assess the relations between the independent variables (training culture and quality culture) with the dependent variables (administrative services and e mployee satisfaction). There is a statistically positive correlation between independent variables with dependent variables. Pearson correlation coefficients (r) range (0.54 0.72). All these coefficients have positive good correlations between independent and dependent variables (Table 11). Table 11: Pearson correlations analysis between independent variables and dependent variables.
Dimension Mean SD Scale
Administrative services Pearson Correlation 0.67* 0.71** Sig. (2 tailed) 0.021 0.001
Table 10: Overall research dimensions
Employee Satisfaction Pearson Correlation 0.54* 0.72** Sig. (2 tailed) 0.018 0.000 *Correlation is significant at the 0.05 level (2 tailed). **Correlation is significant at the 0.01 level (2 tailed).
http://TuEngr.com Page | 7
Table 10 shows the rank of research dimensions according to their means. The dimension “administrative services” comes first with a mean of 4.15 ± 0.679 (agree). The dimension “quality culture” comes last with a mean of 3.21 ± 0.845 (neutral). The total questionnaire score average is 3.60 ± 0.543 (agree).
3.6 Overall research dimensions
3.7 Inferential A nalysis
A simple linear regression was constructed to establish a linear relationship between dependent “employee satisfaction “and independent variables “training culture and quality culture” to predict values for future dependent variables and test if independent variables can increase dependent variables. Table (12) shows that the training culture factor interprets about 0.29 of the dependent variable employee satisfaction variances, with adjusted R 2 = 0.286. In contrast, the quality culture factor interprets about 0.52 of the independent variable employee satisfaction, with adjusted R 2 = 0.515.
Dependent variables Independent variables Training culture Quality culture
Table 12: Simple linear regression analysis for the dependent variable ( employee satisfaction) with independent variable (training culture). Independent variable R R2 Adjusted R2 Training culture 0.54 0.29 0.286 Quality culture 0.72 0.52 0.515
Administrative services 4.15 0.679 Agree Training culture 3.76 0.565 Agree Employee satisfaction 3.38 0.824 Neutral Quality culture 3.21 0.845 Neutral Overall questionnaire 3.60 0.543 Agree
Table 14 shows that the training culture factor interpreted 0.45 of the independent variable administrative services, with adjusted R 2 = 0.421. The quality culture factor interpreted about 0.50 of the independent variable administrative services, with adjusted R2 = 0.50.
3.10
From Table 6 the mean of training culture was 3.76 ± 0.565 (agree). Also, Table 12 shows that there was a meaningful positive correlation between training culture and employee satisfaction since (r=0.54), from Table 13, this relationship has no statistically significant impact on employee satisfaction since (p value = 0.061), also from Table 14, training culture has no statistically
From Table (6) the mean of training culture was 3.76 ± 0.565 (agree). Also, Table (11) shows that there was a meaningful positive correlation between training culture and administrative healthcare services since (r=0.67), and from Table 15, this relation has a statistically significant impact on administrative healthcare services since (p value is 0.002), from Table 14, training culture interprets about (45%) of the change in a dministrative services. Therefore, H 1 is accepte3d that training culture positively affects administrative healthcare services in public hospitals in SA . H2: “Training culture can increase employee satisfaction in public hospitals in SA ”.
Table 14: Simple linear regression analysis for administrative services variable with the independent variable (training culture) Independent variable R R2 Adjusted R2 Training culture 0.67a 0.45 0.421 Quality culture 0.71 0.50 0.50
Table 13: Correlation between employee satisfaction and independent variable (training culture and quality culture).
Table 15: Correlation between administrative services and independent variable (training culture and quality culture).
There is no statistically significant impact of training culture (predictors) on the dependent variable (employee satisfaction) (p value is 0.061). At the same time, there is a statistically significant impact of the quality culture factor on employee satisfaction (p value is 0.000) (Table 13).
There is a statistically significant impact of training culture on and quality culture factor on administrative services (p value is 0.002 and 0.000, respectively) (Table 15).
Testing of R esearch H ypothesis
Linear regression analysis between administrative services and independent variables
Model Sum of Squares df Mean Square F p value. Training culture 4.250 1 4.250 9.588 0.002 Quality culture 15.068 1 15.068 38.491 0.000
Training culture 2.385 1 2.385 3.552 0.061 Quality culture 73.894 1 73.894 224.286 .000
3.9
Model Sum of Squares df Mean Square F p value.
http://TuEngr.com Page | 8
4
Based on data analysis and testing of the research hypotheses, the results of this study revealed that training culture positively impacted administrative performance and services. Training culture, on the other hand, did not affect employee satisfaction. Many studies supported our results concerning the impact of training culture on administrative services. Velada and Caetano (2007) stated that employee training contributes to increasing productivity, improving quality outputs , and raising profits. Al Mzary et al. (2015) suggested that training contributes to human resources development, improving their knowledge, skills, and experiences, which, in turn, positively impact the work environment, competency, and pro ductivity improvement. A study conducted in the health sector in Palestine’s hospitals showed that training programs had a positive impact on the staff's knowledge, skills, and experience. In addition to supporting the effective development of their performance, they use new skills in the workplace and motivate
http://TuEngr.com Page | 9 significant on administrative services. Thus , H2 is rejected as these results prove that training culture exerted no statistically significant impact on employee satisfaction in public hospitals in SA. From Table 8 the mean quality culture was 3.21± 0.845 (agree). Also, Table (14) shows that there was a meaningful positive correlation between training culture and administrative healthcare services since (r=0.71), and from Table 15, this relation has a statistically significant impact on administrative healthcare services since (p value = 0.000), from the Table 14, training culture interprets about (50%) of the change in administrative services. Th us, H3 is accepted that quality culture positively affects administrative healthcare services in public hospitals in SA . H4: “Quality culture can increase employee satisfaction in public hospitals in SA”. From Table 8, the mean quality culture was 3.21± 0.845(agree). Also, Table (12) shows that there was a meaningful positive correlation between training culture and employee satisfaction since (r=0.72), and from Table 15, this relation has a statistically significant impact on Employee Satisfaction since (p value = 0.000), from Table 12, quality culture interprets about (52%) of the change in employee satisfaction. Thus, H4 is accepted that good quality culture positively affects employee satisfaction in public hospitals in SA.
The hospital Administrative services providers are responsible for performing all the tasks for the patient. The level of quality of service is considered the most important tool for increasing patient satisfaction. Their duty includes transactions, facilities, and logistics services that help achieve patient satisfaction, depending on the provider’s level of quality of service and efficiency (Prakash, 2010). Hospitals are pursuing the goal of increasing the efficiency of the services provided by staff in order to achieve customer satisfaction (employees and patients). . You need to provide administrative staff with training tailored to their service area and build a training culture. Training is an organized educational process aimed at providing employees with technical skills and information that will help them improve their knowledge, improve their ability to perform their duties, and achieve their organization's intended goals (Schmidt, 2007; Polo et al., 2018).
Discussion
Page | 10
the results of this study revealed that training had no impact on employee satisfaction. Several studies opposed our findings regarding the impact of training culture on employee satisfaction. These studies showed the importance of employee training and its impact on decreasing employee turnover rates and increasing their satisfaction (Asraf , 2017; Tsai et al., 2007; Velada and Caetano, 2007). Besides, Oakland (2004) reported that customers’ satisfaction could be achieved through training and educating employees on how to provide health care and services. Recently, Al Hyasat (2020) showed that training brings self actualization to employees and makes them feel good, stable, and satisfied. This study showed a positive impact of quality culture on administrative performance and services. Also , this relationship impacts achieving employee satisfaction. The results of this study revealed that quality culture positively impacted administrative services. Several studies support this finding. Al Salman and Hassan (2016) show that a quality culture contributes to the development of team spirit and employee involvement, leading to increased employee performance competence and trust. Ghawari (2016) and Boudia (2017) suggested the importance of embracing the culture of quality and its impact on services, as it helps raise the level of service to meet public expectations. In addition, institutions gain a competitive advantage. In addition, Dhaka et al. (2011) and Yusoff (2013) showed that adopting a quality culture positively impacted the performance, resulting in an improvement in employee satisfaction, then, increasing productivity, thus, and ensuring the institution's sustainable growth in the future. Al Hashimy and Al Adaila (2017) also found that quality of work life, regarding work circumstances and work environment, impacts increasing organizational effectiveness. The results of th is study showed that quality culture had no impact on employee satisfaction. In agreement with this study data, Dhaka et al. (2011) and Jenish (2019) reported that adopting a quality culture contributes to making employees more satisfied, more productive, and hence more organizational effective. Also adopting a quality culture enhances employee satisfaction ( Del Río Rama , 2016). Moreover, Zelnik et al. (2012) and Yusoff (2013) showed that applying a quality culture increases job satisfaction as it helps improve work circumstances. Eskildsen and Dahlgaard (2000) found that the more employee satisfaction is, the more positive impact on work and customer satisfaction with products and services (. The same findings were reported by Chang et. al. (2010) and Sadikoglu and Zehir (2010) who revealed that employee satisfaction directly impacts customer satisfaction through service quality and productivity .
http://TuEngr.com them to use computers and internet techniques to develop their work environment (Abed et al., 2016). Moreover, Abdul Rahim (2019) of King Abdul Allah Hospital in Bisha, SA, states that the higher the quality of training provided, the more positive the quality of health services. .. Tsai et al. (2007) emphasized the positive impact of training on employees’ performance. Contrary to our findings, EL Hajjarm and Alkhanaizi (2018) say that the impact of training on performance and service is not always positive, but can be negative as it depends on the training’s implication and approach.Moreover,
Al Hyasat , W. (2020). The impact of training programs on job performance, an empirical study on banks in Al Balqa governorate. Global Journal of Economics & Business, 9(2), 226 234.
Alharbi, M.F. (2018). Does health financing in Saudi Arabia need a national health accounts framework?
International Journal of Health Sciences (Qassim), 12(4), 72 77.
Al Mzary, M.M., Al rifai, A.M. and Eid Al Momany, M.O. (2015). Training and its impact on the performance of employees at Jordanian Universities from the perspective of employees, The case of Yarmouk University. Journal of Education and Practice , 6(32), 128 140.
Al Hashimy, R. H. and Al Adailah, A. M. (2017). The impact of the quality of functional life on organizational effectiveness in military hospitals in the Riyadh region from the point of view of its employees. Jordan Journal of Business Administration , 13(1), 1 30.
7 References Abdul Rahim, A. M. (2019). The effect of training on improving the quality of medical services in Saudi Arabia’s hospitals. Practical study on King Abedallah hospital Bisha province. Journal of Economic , Administrative & Legal Sciences, 3(5),20 40.
Journal of Economic Administrative and Legal Sciences, 5(9), 103 120.
Asraf, H. J. (2017). Effect of training programs on administrative innovation among UAE general pension and social security authority personnel. Provisional Intellect, 26(4), 199 153.
This study revealed that training and quality culture provided to administrative staff in public hospitals improve their administrative behaviors and services. Quality culture contributes to employee satisfaction. The more satisfied the employees are, the more positive and effective they are. This study helps clarify the importance of training and quality culture to SA hospitals, especially for administrative staff, where it helps hospitals to improve their staff performance, output, satisfaction, and productivity. Therefore, we recommend developing deliberate training plans for raising administrative competencies and services in public hospitals in SA and encouraging administrators to practice and apply what has been acquired from training programmers and quality principles. Further studies should be conducted to find effective strategies for adopting training and quality culture in hospitals during pandemics (e.g., COVID 19).
Al Salman, W. and Hassan, Z. (2016) Impact of effective teamwork on employee performance. International Journal of Accounting & Business Management, 4(1), 76 85.
Boudia, B. B. (2017). The impact of adopting and applying the principles of total quality management on the quality of the health service provided at Trabi Boudjemaa Hospital. Al Bashaer Economic Journal,
Conclusion
6 Availability of Data and Material Data can be made available by contacting the corresponding authors.
Abed, H., Mansur, M. and Saleh, B. (2016). Effect of organizational culture and business climate within the work environment on transfer of training from the perspective of workers in Palestinian government hospitals. Arab Journal of Management, 36(1),459 490.
Al Jobairi, N. M., Taibah, H. A. and Jifri, A. O. (2021). The effectiveness of training on managing public employee performance A field study at the ministry of commerce branches in Makkah region.
http://TuEngr.com Page | 11 5
Polo, F., Cervai, S., and Kantola, J. (2018). Training culture. Journal of Workplace Learning , 30 (3), 162 173.
EL Hajjarm, S.T. and Alkhanaizi, M.S. (2018). Exploring the factors that affect employee training effectiveness, A case study in Bahrain. S AGE Open Research Paper , 2018, 1 12. Eskildsen, J. K. and Dahlgaard, J. J. (2000). A causal model for employee satisfaction. Total Quality Management, 11(8), 1081 1094. Ghawari, M. (2016). Total Quality Management in Health Care Services 1 st Ed., Vol.1. Yazori Scientific Greenhaw,House.L. and D’Abreau Denny, M. (2020). When technical skills aren’t enough, training for the softer side of community action leadership. Journal of Leadership Education , 19(1), 29-36.
Prakash, B. (2010). Patient satisfaction Journal of Cutaneous and Aesthetic Surgery, 3(3), 151 155.
Chang, C. C., Chiu, C. M. and Chen, C. A. (2010). T he effect of TQM practices on employee satisfaction and loyalty in government. Total Quality Management & Business Excellence , 21(12), 1299 1314.
Kaynak, H. and Hartley, J. L. (2005). Exploring quality management practices and high tech firm performance. The Journal of High Technology Management Research , 16(2), 255 272.
Lee, S.M. and Lee D. (2022). Effects of healthcare quality management activities and sociotechnical systems on internal customer experience and organizational performance. Service Business, 16,1 28 Noe, R. (1986). Trainees’ attributes and attitudes, Neglected influences on training effectiveness. Academy of Management Review, 11, 736 749.
Sadikoglu, E. and Zehir, C. (2010). Investigating the effects of innovation and employee performance on the relationship between total quality management practices and firm performance, An empirical study of Turkish firms. International Journal of Production Economics, 127(1), 13 26.
Jenish, P. (2019). Impact of quality of work life on employee satisfaction at private organization. CLEAR International Journal of Research in Commerce & Management, 10 (5), 20-24.
Schmidt, S. W. (2007). The relationship between satisfaction with workplace training and overall job satisfaction. Human Resource Development Quarterly , 18(4), 481 498.
Dhaka, D., Jahan, K., Rahman, T. and Tabassum, A. (2011). A comparative analysis of quality of work life among the employees of local private and foreign commercial banks in Bangladesh. World Journal of Social Sciences, 1(1),17 33.
Oakland, J.S. (2004). Oakland on quality management 3 rd ed. Routledge Tayor & Francis Group. Patel, C. S. and Pitroda, J. R. (2021). Quality management system in construction, a review. Quality Management System, 16(1),121 130.
Del Río Rama, M. D. L. C., Álvarez García, J., Saraiva, M. and Ramos Pires, A. (2016). Influence of quality on employee results, the case of rural accommodations in Spain. Total Quality Management & Business Excellence, 28 (13 14), 1489 1508.
Slamet, P., Yasir, A. and Rohana (2021). The contribution of work motivation and training towards employee performance at the inland water and ferries transport polytechnic of Palemba ng. Excellent Human Resource for the Sustainable Safety of Inland Water and Ferries Transport in New Normal Era International Webinar
http://TuEngr.com Page | 12 3(2), 165 180.
Thampson, S.K. (2012). Sampling . 3 rd Ed , John Willey & Sons, New Jersey.
Zelnik, M., Maletič, M., Maletič, D. & Gomišček, B. (2012). Quality management systems as a link between management and employees. Total Quality Management & Business Excellence , 23(1), 45 62.
Dr.Saja Ahmed Albliwi is an Assistant Professor in the field of Lean Six Sigma and Quality Management at King Abdulaziz University, Faculty of Economics & Administration, Department of Business Adm inistration. EFQM assessor. She has received a Ph.D. degree from the School of Social Sciences, Heriot Watt University, UK and a Master 's degree from the School of Management and Languages, Heriot Watt University.
http://TuEngr.com Page | 13
Yusoff, R. (2013). Relationship between hard total quality management practices and organizational performance in municipalities. American Journal of Applied Sciences, 10 (10), 1214 1223.
Velmurugan, G., Shubasini, R., SaravanaBhavan, N. and Selvam, V. (2019). A study on service quality of a health care organization. International Journal of Online and Biomedical Engineering , 15(10), 91.
Summers, J. K., Smith, L. M., Case, J. L. and Linthurst , R. A. (2012). A review of the elements of human well being with an emphasis on the contribution of ecosyst em services. Ambio , 41(4), 327 340.
Tang, G., Chen, Y., Jiang, Y., Paillé, P. and Jia, J. (2018). Green human resource management practices, scale development and validity. Asia Pacific Journal of Human Resources, 56(1), 31 55.
Wajanat Kamil Alhashimy is a committee coordinator at both Directorate of Health Affairs in Jeddah, the Quality and Patient Safety Department and the first health cluster in Jeddah, the Transformation Management Office. She received a Master 's degree (Executive MBA ) from King Abdulaziz University, KSA, Jeddah.
Velada, R. and Caetano, A. (2007). Training transfer, the mediating role of perception of learning. Journal of European Industrial Training , 31(4), 283 296.
Mohammed Binkhamis is an Assistant Professor in the field of Business, strategy management and Finance at several universities (UBT, DAH and JIC). Dr. Mohammed received his Master's degree and Ph.D. degree from Business School, De Montfort University, UK.
Tsai, P. C. F., Yen, Y. F., Huang, L. C. and Huang, I. C. (2007). A study on motivating employees’ learning commitment in the post downsizi ng era, Job satisfaction perspective. Journal of World Business, 42(2), 157 169.


Disciplinary: Management Sciences, Administrative Sciences
Abstract Hazardous environmental emissions contain a high volume of carbon particles globally seen as a green management issue. Most of the world' s companies have to go through specific compliance issues, which are regarded as the reforms of business objectives related to green and sustainability management and pro environmental behavior, i.e., Organizational Citizenship Behavior Towards Environment (OCBE). However, companies are now designing execution plans for their business objectives to capture new business market s. It is essential to promote and design Green Human Resource based policies and procedures through which they emphasize creating pro environmental behaviors in the presence of workplace spirituality and Organizational Engagement
International Transaction Journal of Engineering, Management, & Applied Sciences & Technologies, 13(6), 13A6N, 1 11 http://TUENGR.COM/V13/13A6N.pdf
©2022 INT TRANS J ENG MANAG SCI TECH. Cite This Article: Javed, U., et al (2022). Impacts of Green HRM on Organizational Citizenship Behavior Towards Environment: Mediating Role of Workplace Spirituality and Organizational Engagement .
DOI: 10.14456/ITJEMAST.2022 119
. Recently, business researchers have raised their attention towards Green HRM practices as a tool for sustainability towards Organizational Citizenship Behavior within firms. CSR (Corporate Social Responsibility) initiatives or capitalizing on the opportunities available globally. Organizations must continue the practices that equip them to implement Green HR Policies that promote green behaviors and pro environmental behaviors while executing those policies as desired objectives. Results show that Green HR policies would help establish Workplace Spirituality and Organizational Engagement that will enhance the Organizational Citizenship Behavior towards the environment, which ultimately helps them retain employees.
International Transaction Journal of Engineering, Management, & Applied Sciences & Technologies http://TuEngr.com
Page | 1 ©2022 International Transaction Journal of Engineering, Management, & Applied Sciences & Technologies ISSN 2228 9860 eISSN 1906 9642 CODEN: ITJEA8 Impacts of Green HRM on Organizational Citizenship Behavior Towards Environment: Mediating Role of Workplace Spirituality and Organizational Engagement Usman Javed1, Aamir Manzur Wain1, Ahsan Ali Ashraf2*, Imran Bashir1 1 Department of Business Administration, Lahore Leads University, Lahore, PAKISTAN. 2 Department of Business Administration, University of Sialkot, Sialkot, PAKISTAN. *Corresponding Author (Tel: +92 321 466 0697, Email: ahsanali.ashraf@uskt.edu.pk). Paper ID: 13A6N Volume 13 Issue 6 Received 02 February 2022 Received in revised form 02 June Accepted2022 09 June 2022 Available online 16 June 2022 Keywords: Green policiesManagement;GreenEngagement;OrganizationalWorkplaceCitizenshipOrganizationalHR;Behaviour;Spirituality;OCBE;HumanResourceGreenHR

http://TuEngr.com Page | 2 1 Introduction
This research will contribute to the literature on sustainable automotive production and workplace environment behaviors through GHRM ―Workplace Spirituality (WPS). First, this research studies the factors that motivate the manufacturing related workforce to contribute to green related practices, which are incredibly significant for attaining successful ecofriendly curriculums [3] . It will spread restricted literature regarding the motivation of employees interrelated to PEB and behaviors sustainability. Secondly, our research enhances the current understanding of automotive employees against PEB, the understudied area that needs more research studies [4]. Third, this discovers the spiritual influence of motivations towards entities and their relationship with OCBE, establishing diminutive consideration. Fourth, despite extensive dialogs about WPS role in organizational management literature [5], few studies regarding automotive industry literature have empirically drawn out this substantial variable [5]. Besides, workplace spirituality is under investigation in the manufacturing environment [6]. Fifth, GHRM, recently fascinated significant consideration by creating a psychological climate as a factor of PEB, required additional examination in situations of organizations [6]. Lastly, no pragmatic reading in the automobile industry has recorded actions of mediating the influence of Workplace spirituality on employees' organizational citizenship behavior towards the environment.
Businesses are coping with new challenges like diverse environmental components that raise the need to develop and practice environmental centric strategies to maximize sustainability and competitive advantage [7]. However, industrialization posed ecological challenges in different countries . The firm's environmental performance has not been able to solely depend upon the corporate policies that promote sustainability and pro environmental behaviors of personnel like OCBE [2,7]. OCBE states the environmental behaviors willingly embraced by the company's workers [1], which have been converted into serious contributors to sustainable corporate ecological management [8]. This has been suggested that workplace spirituality prompts members of the Organization naturally by giving them a purpose to protect nature and reason naturally to make the
Presently several researchers contribute with their work to educate the realization of Green Human Resource Management (GHRM) [1] . Businesses must formulate formal environmental strategies by increasing worldwide environmental worries and advancing intercontinental ecological standards [2] . They are driven by legislation, many companies have to comply with on environmental management or green management. Authors stated that pollution control to pollution preclusion strategies are formulated to reduce the effect on business strategies, including customer's rejections, new liking preferences, and the new customer wants [2]. To implement green based management strategies at corporate level, management has to develop high level new technical and managerial skills because companies have to measure the impact of sustainable competitiveness of the company by focusing on innovation and strategies that support the initiatives for environmental programs [1].
2 Lit e rature Review
http://TuEngr.com Page | 3
Researchers have found that support from the Organization regarding environmental related activities certainly positively affects Organizational Citizenship Behavior Towards Environment (OCBE) and other job related elements like satisfaction, recognition, empowerment, and reducing turnover among employees [10]. Employees' voluntary environmental based practices, often not required and rewarded by organizations, are called Organizational Citizenship Behavior Towards Environment (OCBE).
2.1 Green HRM and Employee ' s OCBE
corporate world a healthier place to work for the current and future groups [9] . The US Environmental Protection Agency (EPA) described that ― to track sustainability is to generate and sustain the environments under which humans and nature can exist in productive synchronization to care for present and forthcoming generations . Therefore, people at work look for the reasons for meaning in their work [8], which prompt s organizations to innovate such environmental centric activities that engage employees and appeal to them to participate in environmentally responsible behaviors by understanding the mechanisms through which motivation in employees occur by strategies that promote environmentally responsible behavior, intrinsic motivation leads engagement of employees that create a human work environment and improved performance at the workplace [7]. This study aims to measure the impact of the Green Human Resource Management research stream regarding OCBE in Pakistan' s automobile industry.
Green Practices for businesses have guided us on how to gain competitive advantages through environmental sustainability by providing consistent training to employees regarding sustainability. Moreover, GHRM practices help them to be aware of sustainability gains . It also provides leverage regarding the improved performance of businesses, cost reduction, and employee commitment towards environmentally friendly outcomes.
Supporting employees from the Organization and supervisors in creating an environmentally friendly atmosphere can increase employee commitment. T he measures to improve the corporate environment, attitudes towards ecological protection, and concerns regarding self environmental security positively impact employees' OCBE. Thus the assumption can be taken as follow s: H1: A positive relationship bet ween GHRM and OCBE.
2.2 Green HRM and Organizational Engagement
Organizati onal goals that engage employees by creating a climate of shared perceptions of involvement and energy are called a climate for Corporate Engagement. On the other hand, HRM practices are viewed by employees as a personalized ' commitment to them by the Organization , which is then reciprocated back to the Organization by employees through positive attitudes and behavior. The engagement of employees theoretically can be seen in three different ways:
http://TuEngr.com Page | 4
2.4 Mediating Role of Organizational Engagement between Green HRM and Employee ' s OCBE
Improved employee relations and lower expenditure can be achieved by emphasizing GHRM practices. Organizations can focus on and support environmentally sustainable business practices, leading to efficiency by instigating green Corporate culture [7]. GHRM practices can be a triggering point to foster a positive work environment and well being among employees, enhancing organizational performance through people [10]. So we can say that an equitable GHRM can considerably affect retaining employees, providing better work life quality, moral support, and employee commitment by engaging them .
Workplace Spirituality and Emp loyee ' s OCBE
involvement in environmental behaviors, promoting environment oriented initiatives, and innovative ecological behaviors.
H2: A positive relationship between GHRM and Organizational Engagement.
Employees who accomplish their tasks with minimum effort are more engaged and spirited. More engaged employees have achieved higher performance. T his helps them concentrate their efforts to be more connected to work emotionally and socially and focus them on achieving their work related goals vigilantly [9]. Employees spent more time seeking resources to change their work environment for improvement in delivering their work [10].
2.3
Whereas GHRM practices are likely to promote employee pro environmental consciousness by encouraging employees to engage in green based interpersonal citizenship Behavior by providing regular feedback on achieving environmental goals and performance by familiarizing them with the greening efforts of the Organization and its corporate environmental management initiatives [9].
Workplace spirituality is defined as an employee' s spiritual experience at the workplace . Spirituality and sustainability are vitally interlinked, and there is no sustainability without spirituality [4]. People tend to protect and conserve nature when moralistic encouragement with a spiritual perspective [6]. Unity among employees and tight connectedness can be developed through WPS. Citizenship behavior is shown by responsibilities owned by employees to show care for others at work , and a sense of community forces them to demonstrate pro social behaviors.
Studies have shown that employees exhibit OCB with a high realization regarding WPS. In many studies, spirituality concepts activate pro social attitudes and behavior. Spirituality can play a pivotal role in sustainability [5]. Environmentally sustainable behavior has a strong relationship with spirituality. Many examples like an evocative correlation are established between Environmental sustainable behavior and spirituality in context to their concerns regarding the environment and the sustainability of their lifestyles . However, OCB is the defining root of OCBE, and OCB and WPS have shown a positive relationship [8]. So, we can undertake the following: H3: A positive relationship between WorkPlace Spiri tuality and OCBE.
Empirical research has been conducted on the five dimensional model of OCB proposed and provided consistent measures regarding dimensions, i.e. , fairness, job satisfaction, Burnout , and leader support [10]. The OCB structure is seldom used in corporate greening 'and recently aimed to link these OCB theories to environmental management [11]. OCBE can be defined as OCB 's that engage workers in the workplace with voluntary actions, without having intentions for being rewarded, other than their job needs and organizational setting, for environmental activities. Range from signifying solutions aimed at reducing energy consumption in the workplace to advising workforces about how they can reduce their environment related effects or impacts at work. Engagement of the workforce in OCBE is considered an essential element for corporate greening 'and can be done by guiding workers to reduce the impact of work by minimizing the energy consumption at the workplace. Research scholars have identified the sense of share perceptions among the employees that help them entirely focus on the work roles. Organizations identify these as their property in the form of Engagement. Organizational social processes can effectively develop a sense of engagement . H5: Organizational Engagement has a positive relationship wi t h OCBE.
Green HRM and Workplace Spirituality
Further studies have found a mediating role of engagement in task performance, self evaluations, and OCB [8]. Engaged employees have also observed proactive behavior and quest for learning goals [9]. Consistent findings have been shown to mediate the role of engagement to take performance, personal traits , and OCB.
2.6
Green activities can encourage participation in environmental related activities can be promoted through green activities by creating green teams, problem solving groups, and writing articles [9]. As workplace spirituality states, employees consider themselves an active community .
Organizational Engagement and Employee ' s OCBE
2.5
Employees' workplace spirituality depends upon being authentic and providing service to humanity and the meaningful purpose at work that gives them a sense of doing something great and gives them the feeling of belongingness to be part of an ethical company [9] It is established that workplace spirituality is about the organization's positive purpose and stated that embracing a cause is among the elements of organizational spirituality. By elaborating on a company's spiritual sides, we can say that providing solutions to world problems is the moral responsibility of every organization. [7] Implementing environmental policies to establish problem solving mechanisms is the primary role of HR executives dealing with ecological issues to break the status quo and have full cooperation from the staff [10].
http://TuEngr.com Page | 5
H4: Organizational Engagement me diates between the GHRM and OCBE.
They can experience personal growth, be valued as individuals, and have a sense of working togetherGHRM[12]. animate the environmental based practices by motivating them, realizing belongingness, and giving them pride by commitment and involvement in environmentally friendly practices, which reduce the stakeholders' pressure by creating the firm's good reputation and give substantial benefit to generations to come [13].
H6: A positive relationship between GHRM and WPS.
2.7 Mediating Rol e of Workplace Spirituality between Green HRM and Employee ' s OCBE
http://TuEngr.com Page | 6
GHRM can empower employees to be aware of different environment related challenges through various communication networks [13]. It engages in opportunities related to quality and problem solving issues regarding environmental improvement provided to employees. Employees behave pro environmentally and contribute to the Organization' s green strategies and owing green related resources from GHRM practices that are inclined to invest themselves in OCBE without any expectations. We can say that the work environment significantly affects one' s meaning of work. That defines work's components, including intrinsic motivation and specific aspects of work that can hold any significance for a person.
Further, this argument is supported as spirituality influences meaningfulness at work. Researchers have found that spiritual experience at work gives the greater experience of intrinsic motivation and fulfillment by gaining the full potential of individuals, encouraging GHRM to address environmental problems and resolve them by involving employees through green team building [7,8] . In this context, WPS creates a sense of membership and states, expanding beyond humanity towards an understanding of membership in the community of all living things. Ideally, spirituality among managerial procedures should be advocated to encounter the challenges of a new era for organizations. So, from the above literature, we can establish the following assumption: H7: WPS mediates between the GHRM and OCBE .
2.8 Research Framework To argue in this research regarding the positive influence of Green Human Resource Management related to human resource capital. The hypothesis i s positive in association with the Organizational Citizenship Behavior towards Environment (OCBE) and its mediating role with Workplace spirituality and Organizational Engagement. Figure 1 show s the framework of this research and its hypotheses
II. Regression estimating the independent variable X 'is associated with the mediator M. ' Hence the regression coefficient adds the value of a ―Model 2 .
This research study has used a survey conducting strategy to collect data. It is appropriate to ascertain the employee' s perspectives regarding Green Human Resource Management and its effects on Organizational citizenship Behavior. This exploration has employed a quantitative research technique to measure the relation of different Variables identified as indirect and mediating Roles.
Numerous research workers usually test mediation. Substitutive name for mediator variable is process variable. The variable creates a mediation effect in the correlation of outco mes between the dependent and causal variables and independent variables [14]. Researchers suggested that mediation is tested over three regression models are as under.
I. Regression estimating the independent variable X 'is associated with dependent variable Y 'and adds the value of C Model 1 .
3.1 Instruments and Scales
Figure 1: Framework 3 Method
http://TuEngr.com Page | 7
The study demeanor technique is based on a questionnaire with relevant literature review, and the substance comprises four variables. Green Human Resource Management (GHRM), which was developed by authors [14], and Organizational Citizenship Behavior Towards Environment was established by other researchers. [15]. T he mediating dimension of WPS is adopted from [14] , and the authors developed the Organizational Engagement (OE) [15]. Two aspects of willingness of company investment and professional knowledge and skills are under Green Human Resource Management which combined to develop the whole GHRM variable. This operational definition uses the measurement in detail. The questionnaire is accustomed to the Likert scale mechanism to measure the degree of agreeableness respectively as strongly disagree as lowest agreeable scale, disagree, neutral, agree & strongly agree as uppermost agreeable scale.
3.2 Mediation Analysis Using Process Macro

Table 1 supports H1: A positive relationship between GHRM and OC BE.
Table 1: Positive Relationships between GHRM & OCBE Model Unstandardized Coefficients StandardizedCoefficients T Sig. Result B Std. Error Beta 1 (Constant) 9.251 2.039 4.537 .000 Supported GHRM .188 .022 .524 8.651 .000 Dependent Variable: OCBE Table 2 supports H2: A positive relationship between GHRM and Organizational Engagement.
Regression estimates the resultant Y 'from the independent variable X, 'and the mediator M. The regression coefficient for the predictor adds the value of C and the regression coefficient for the mediator adds the value of B ―Model 3. 4 Result a nd Discussion
Table 2: Positive Relationships between GHRM & OE Model Unstandardized Coefficients StandardizedCoefficients T Sig. Result B Std. Error Beta 1 (Constant) 9.443 1.504 6.280 .000 Supported GHRM .113 .016 .449 7.070 .000 Dependent Variable: OE
Table 3 supports H3: A positive relationship between WPS and OCBE.
As per the literature suggest, all hypotheses are supported. The detailed result s in tabular form are given below, indicating the supportive relationship.
Table 3: Positive Relationships between WPS & OCBE Model Unstandardized Coefficients StandardizedCoefficients T Sig. Result B Std. Error Beta 1 (Constant) 8.980 1.856 4.838 .000 Supported WPS .217 .022 .566 9.655 .000 Dependent Variable: OCBE Table 4 supports H4: Or ganizational Engagement mediates bet ween the GHRM and OC BE.
Table 4: OE Mediates between GHRM & OCBE Model Unstandardized Coefficients StandardizedCoefficients T Sig. Result B Std. Error Beta 12 (Constant) 11.102 1.698 6.539 .000 Supported OE(Constant) .785 .0842 .552 9.309 .000 OE .564 .088 .397 6.419 .000 GHRM .124 .022 .346 5.597 .000 Dependent Variable: OCBE
http://TuEngr.com Page | 8
http://TuEngr.com Page | 9
Table 6: Positive Relationship between GHRM & WPS Model Unstandardized Coefficients StandardizedCoefficients T Sig. Result B Std. Error Beta 1 (Constant) 39.369 5.449 7.225 .000 Supported GHRM .461 .058 .491 7.930 .000
Table 7: WPS Mediates between GHRM & OCBE Model Unstandardized Coefficients StandardizedCoefficients T Sig. Result B Std. Error Beta 12 (Constant) 8.980 1.856 4.838 .000 Supported WPS(Constant) .217 .022 .566 9.655 .000 WPS .156 .024 .407 6.418 .000 GHRM .116 .023 .324 5.115 .000
5
Conclusion
As preceding research outcomes, it can be established that the more focus is on green based management at the corporate level with the green based human capital in organizations. When the administration focused on developing the corporate green management policies, they had more green based human resource capital. While working for greening the process in the business in the extended term, more employees will have acceptable prospects to prepare and increase their green based skills and knowledge with cooperate relevant measures. Our research spreads the literature by studying and exploring voluntary green based behavior narrated as individual level OCBE. Nevertheless, the individual degree of contribution to the organization's sustainability and performance and green based management studies are generally expected. Green Human Resource Management researchers are inclined to anchor on workplaces' green based behavior at the individual level [13]. OCBE, particularly in the manifestation of workplace spirituality and engagement at work through eco initiatives, will create the interaction among the workforce's
Table 6 supports H6: A positive relationship between GHRM and WPS.
Table 5 supports H5: Or ganizational Engagement has positive relationship with OCBE.
Table 5: Positive Relationship between OE & OCBE Model Unstandardized Coefficients StandardizedCoefficients T Sig. Result B Std. Error Beta 1 (Constant) 11.102 1.698 6.539 .000 Supported OE .785 .084 .552 9.309 .000
Dependent Variable: OCBE
Dependent Variable: WPS H7: WPS mediates between the GHRM and OCBE .
Dependent Variable: OCBE
[10] Afsar, B., Badir, Y., & Kiani, U. S. (2016). Linking spiritual leadership and employee pro environmental behavior: The influence of workplace spirituality, intrinsic motivation, and environmental passion. Journal of Environmental Psychology , 45 , 79 88.
[8] Ashraf, A., & Ahmed, A. (2019). Impact of Instrumental Climate on Workplace Bullying and Post Traumatic Stress: the Moderating role of type A personality. The Journal of Managerial Sciences, 14 (4), 1 10.
http://TuEngr.com Page | 10 green based efforts. Our research has taken a step further to study Green Human Resource Management and the integration of both individual OCBE and GHRM. It will help drive other research streams to the combined level of certain behaviors, such as Organizational Citizenship Behavior or inventive behavior, mainly evaluated at the individual level [13]. Our study advances the Green Human Resource Management work by adding OCBE to the emerging but partial build workplace spirituality consequences on Organizational Citizenship Behavior and innovation sights into engagement at work for green based out comes and creating OCBE in the organization.
[11] Lamm, E., Tosti Kharas, J., & King, C. E. (2015). Empowering employee sustainability: Perceived organizational support toward the environment. Journal of Business Ethics, 128 (1), 207 220.
[6] Zahid, S., Ashraf, A. A., & Bashir, I. (2021). Journal of ISOSS 2021 Vol. 7 (4), 311 322 ETHICAL CLIMATES AND JOB STRESS RELATIONSHIP: THE MODERATING EFFECT OF TYPE A/B PERSONALITY. Journal of ISOSS , 7 (4), 311 322.
7 References
[12] Chiu, S. F., & Tsai, M. C. (2006). Relationships among burnout, job involvement, and organizational
[3] Daily, B. F., Bishop, J. W., & Govindarajulu, N. (2009). A conceptual model for organizational citizenship behavior directed toward the environment. Business & Society, 48 (2), 243 256.
[4] Ashraf, A. A. (2016). Total quality management, knowledge management and corporate culture: How do they synchronized for performance excellence. Pakistan Journal of Commerce and Social Sciences (PJCSS), 10 (1), 200 211.
[9] Dumont, J., Shen, J., & Deng, X. (2017). Effects of green HRM practices on employee workplace green behavior: The role of psychological green climate and employee green values. Human resource management, 56 (4), 613 627.
[7] Ashraf, A. A., Farooq, U., Din, S. M. U., & Mohy, S. (2014). An investigation to the leadership culture fit and its impact on job satisfaction and work commitment. World Applied Sciences Journal, 31 (4), 427 438.
[5] Ashraf, A. A., Lodhi, S. A., & Farooq, U. (2014). An Investigation of Leadership Culture Fit with Quality Improvement and Cost Reduction by Synchronizing TQM and KM Philosophies. World Applied Sciences Journal, 32 (3), 478 491.
6 Availability o f Data and Material Data can be made available by contacting the corresponding author.
[2] Daily, B. F., & Huang, S. C. (2001). Achieving sustainability through attention to human resource factors in environmental management. International Journal of operations & production management.
[1] Renwick, D., Redman, T., & Maguire, S. (2008). Green HRM: A review, process model, and research agenda. University of Sheffield Management School Discussion Paper, 1 (1), 1 46.
[14] Tang, G., Chen, Y., Jiang, Y., Paille, P., & Jia, J. (2018). Green human resource management practices: scale development and validity. Asia Pacific Journal of Human Resources, 56 (1), 31 55.
[15] Molina Azorin, J. F., López Gamero, M. D., Tarí, J. J., Pereira Moliner, J., & Pertusa Ortega, E. M. (2021). Environmental management, human r esource management and green human resource management: A literature review. Administrative Sciences, 11 (2), 48. Usman Javed is an MS student at the Department of Business Administration, Lahore Leads University, Pakistan. He got a Master's degree in Management Sciences from Lahore Leads University, Lahore Pakistan. His researches are Management Sciences and such as Workplace Spirituality, and Work Engagement. Aamir Manzur Wain is a Lecturer at the Department of Business Administration, Lahore Leads University, Pakistan. He got his Master's degree in Management Sciences from Superior University, Lahore Pakistan. His research focuses on Contemporary issues in Marketing and Finance Dr. Ahsan Ali Ashraf is an Assistant Professor / HOD at the Department of Business Administration, Faculty of Management and Administrative Sciences, University of Sialkot, Pakistan. He got his Bachelor's and Master's degrees in Management Sciences from COMSATS University Islamabad, Lahore Campus and a Ph.D. degree in Business Administration from NCBA&E, Lahore, Pakistan. His research focuses on Workplace Bullying, Organizational Behaviour, and Human Resource Management. Mr. Imran Bashir is a Lecturer is a Lecturer at the Department of Business Administrat ion, Lahore Leads University, Pakistan. He got his Master 's degree in Management Sciences from SZAIBIST, Islamabad Pakistan His research focuses on Contemporary issues in Marketing
http://TuEngr.com Page | 11 citizenship behavior. Th e Journal of psychology , 140 (6), 517 530.
[13] Ashmos, D. P., & Duchon, D. (2000). Spirituality at work: A conceptualization and measure. Journal of management inquiry , 9 (2), 134 145.


ISSN 2228 9860 eISSN 1906 9642
G.S. Gill1 1Department of Instrumentation, Kurukshetra University, Kurukshetra, Haryana, INDIA.
Disciplinary: Instrumentation Engineering, Physics.
Keywords: Speed channelsignalContactmeasurement;less;Optical;Highspeed;Two
©2022 International Transaction Journal of Engineering, Management, & Applied Sciences & Technologies
Corresponding Author (Tel: +91 9992013130, Email: gsgill@ kuk.ac.in).
Non destructive measurement techniques are widely used for measuring the velocity of high speed projectiles. Numerous kinds of systems presently used for accurate determination of projectile speed can deliver under a diverse set of circumstances and ambient conditions. The gamut of high speed estimation methods is so wide that six to seven classification levels are used to quantify the span ranging from low to high speeds. Low speed applications include event measurement in sports, instrument vibration analysis and measuring revolutions per minute for rotating shafts (Joshi and Gangal, 2002; Zhexin et. al., 2009). An extensive variety of instruments based on diverse methods populate this span of measurement in this range, but on moving towards the upper end of the range the procedures adopted as well as the application areas are not the same compared to mainstream methods adopted for general purpose velocity measurement applications. Methods for high speed velocity estimation are widely employed in detonation physics for efficient International Transaction Journal of Engineering, Management, & Applied Sciences & Technologies http://TuEngr.com
Page | 1
CODEN: ITJEA8
Non-Destructive Method for Velocity Estimation of Small Caliber Projectile
Abstract This work presents the development of a novel non destructive approach for the measurement of high speed small caliber projectiles with desired accuracy level. The velocity of the projectile is compu ted from the time taken by the projectile to travel a predefined fixed distance between any two locations under observation. The system development mainly encompassed the design and testing of an electronic circuit for processing the optical signals from the primary optical sensors. The system so developed exhibited an accuracy of ±1% during the trials with projectiles of different calibers traveling in a velocity band of 390 m/s to 912 m/s.
Paper ID: 13A6O Volume 13 Issue 6 Received 12 February 2022 Received in revised form 01 May 09 May 2022 Available online 16 May 2022
©2022 INT TRANS J ENG MANAG SCI TECH. Cite This Article: Gill, G.S. (2022). Non Destructive Method for Velocity Estimation of Small Caliber Projectile. International Transaction Journal of Engineering, Management, & Applied Sciences & Technologies, 13(6), 13A6O, 1 5. http://TUENGR.COM/V13/13A6O.pdf
1 Introduction
DOI: 10.14456/ITJEMAST.2022.120
Accepted2022

http://TuEngr.com Page | 2 estimation of detonation speeds (Decker et. al., 2017). They also find their increasing applications in ballistics and forensic sciences. Such types of instruments have been increasingly utilized for the estimation of the velocity of small caliber projectiles. In this work, an attempt has been made towards the development of an instrument for the estimation of velocity of small caliber projectile traveling at ultra high speed using a non destructive approach. The novelty of the proposed method lies in the approach followed for capturing the signal at the preliminary stage. During the initial period, the measurement systems predominantly involved paper breakage or wire breakage methods. The wire breakage system suffered from a serious drawback of elongation of the wire due to its elastic nature before breaking off, thereby introducing an error due to the extension of the wire. Similarly, the protruding of paper before its destruction on being hit by the projectile also leads to the introduction of error. These deviations in physical dimensions of either wire or paper before destruction were random and non recurring in nature. Such variations introduced an error component in measurement as these methods primarily focused on the calculation of time taken by the projectile to travel a fixed distance between two sensors placed in a straight line of travel. Subsequent developments led to the evolution of advanced methods like the parabolic approach, light gate method and Ballistic pendulum (Sanders, 2020; Milutinovic, 2019). These methods essentially being analytical in nature, lacked the ability to provide to evolve into a direct readout device. In the present work, an attempt has been made to estimate the time of arrival of the projectile at two sites of interest and thereby evaluating its speed using a dual sensor system.
2
Photonics based instruments have been widely used for analysing the motion of small caliber projectiles, particularly, before the event and just after it hits the target. The proposed instrumentation system estimates the speed of the projectile principally by determining the time taken by it to pass through a constant distance between two points. As the distance between these two points is fixed, the speed of the projectile can be simply estimated by measuring the time taken by the projectile to travel through this distance. In this setup, the projectile interrupts the beam of the laser when it passes through two channels positioned 300mm apart as shown in Figure 1.
Experimental Set up
Figure 1: Experimental Setup
When the projectile intercepts a continuous beam from the source to the laser it produces a variation in the signal intensity level at the detector. A source of laser is mounted at the lower end of each of the channels and a detector is installed at the top end of each of the channels. Each

The development of channels using retro reflecting prisms is a complex and iterative procedure as their alignment, with their hypotenuse faces parallel, is a tedious task. Their number, size and constructional accuracy determine the accuracy of the measurement. The system designed is rigid enoug h to withstand the shock wave traveling with the projectile as it passes through it, to ensure the repeatability of results in the long run. The system has been designed to detect a projectile of the minimum size of 5mm traveling with a maximum velocity of 912 m/s.
http://TuEngr.com Page | 3 channel is made of two vertical columns rigidly fitted with retro reflected right angled prisms. This setup forms a virtual screen of laser ( Figure 2) and anything passing through this curtain will eventually block the path of the laser beam between the source and detector.
Figure 3: Building Blocks of the System
In the absence of any obstruction, the beam of laser is reflected, back and forth, by these prims and is laterally displaced till it falls on the detector. A self triggering mechanism, actuated the system if any object, moving or stationary, obstructs the beam from reaching the detector. As soon as the projectile enters the active area between the channels, it intercepts the laser beam and obstructs the continuity of the beam from the laser to the detector. The schematic diagram of the complete setup is presented in Figure 3.
Figure 2: laser Screen


During the measurement when the projectile enters the first channel, it partially obstructs the laser beam and reduces the signal intensity reaching the detector of the first channel. As the projectile moves towards the center of the first channel the detector exhibits a sudden drop in the output signal, which was held at a constant level prior to that. Further, as the projectile moves away from the center of the first channel, the detector output again exhibits an increase till it reaches its constant normal value as shown in Figure 4. This event is again exhibited in a similar manner when the projectile passes through the second channel.
The signal from the monoshot of channel 1 has been used to set the D latch and the signal from the channel 2 monoshot has been employed to reset the D latch and the pulse thus received has been used to compute the velocity of the projectile by means of the timer interfaced with the computer (Hickman, 2016).
Figure 4: Detector output at Channel 1
Detector outputs from both the channels are amplified using a preamplifier followed by a two stage amplifier. Optimization of the dual stage preamplifier comprising a current to voltage converter and an amplifier has been the most challenging aspect of circuit design (Jain, 2000; Gayakwad, 2000; Walt, 1996). Further, the amplified signals containing a substantial amount of noise were passed through a comparator stage giving rise to a train of pulses at the output of the comparator. Monoshot was triggered using the first rising edge of the comparator outputs for both the channels, thus obtaining clean pulses at the output of monoshot in response to the obstruction of projectile at both the channels (Figure 5).
http://TuEngr.com Page | 4 3
Methodology
Figure 5: Output of monoshot for both the channels


6
5
References
The proposed non destructive system for measuring the velocity of small caliber projectiles exhibits an accuracy of as high as ±1%. During the trials the projectiles of different calibers varying in velocities from 390 m/s to 912 m/s were tested with the proposed set up and the results were found to be highly satisfactory. During the trials and testing it was observed that such systems demand a high level of structural rigidity as the pressure waves moving with the high speed projectiles have enormous potential to shake the system and produce shock waves in the structure which in turn can introduce noise in the electronic circuit was well. Further, the accuracy can be remarkably enhanced by the introduction of multiple channels in the existing two channels design thereby generating more information for the same event. Also, the ultimate speed can be taken as an average of these measurements. Also, an increase in separation of channels is expected to yield better results as optical interference between the light sources and the detectors of different can be considerably reduced with an increase in channel spacing. The reflection from the surface of the structural members can be reduced using non reflective paints or a mask.
Conclusion
Decker, R., Duca, M. and Fulton, S. S. (2017). Measurement of bullet impact conditions using automated in flight photography system. Defence Technology, 13(4). 288 294. Gayakwad, R. (2000). Op amps and Linear Integrated Circuits. PHI, New Delhi. Jain, S. and Choudhury, D. R. (2000). Linear Integrated Circuits. New Age International, New Delhi. Joshi, S. R. and Gangal, S. A. (2002). RPM measurement system using in house developed Si based Hall sensor. Journal Instrum. Soc. India, 32, 218 226. Milutinovic, J. M. (2019). The application of the ballistic pendulum for the bullets velocity measurements, IOP Conf. Ser.: Mater. Sci. Eng. 659 012016. Sanders, J. C. (2020). The effects of projectile mass on ballistic pendulum displacement. American Journal of Physics, 88, 360. Walt, K. (1996). High Speed Design Techniques. Analog Devices, Inc., USA. Zhexin, J., Gong, K. and Huo, Y. (2009). Optoelectronic system for high speed flier velocity measurement based on laser scattering. Optical Engineering, 48, 0433601(1 6).
Availability o f Data and Material Data can be made available by contacting the corresponding author.
Dr. G. S. Gill is an Assistant Professor at the Department of Instrumentation, Kurukshetra University, Kurukshetra, Haryana, India. He got his master’s degree in Instrumentation Engineering from the School of Instrumentation, D.A.V.V. Indore and a Ph D degree in Instrumentation Engineering from Thapar University Patiala, India . His research focuses on Instrument design and development.
http://TuEngr.com Page | 5 4

©2022 INT TRANS J ENG MANAG SCI TECH.
Volume
Available
*Corresponding
Author (Tel: +669 2092 7094, Email: cha_xyz@hotmail.com). ID: 13A6P 13 Issue 6 14 January 2022 in revised form 04 May 09 May 2022 online 18 May 2022
2Department of Rural Roads, Ministry of Transport, THAILAND.
Paper
Received
International Transaction Journal of Engineering, Management, & Applied Sciences & Technologies http://TuEngr.com
Received
Abstract This paper presents the behavior of the reinforced concrete drainage pipe (RCP) subjected to static loading conditions using a finite element model based on the standard No. TIS. 128 2549. For the first category, three types of circular prefabricated reinforced concrete pipes are investigated. These circular pipes include the single circular, the double circular, and the elliptical steel cages. The development of stresses in concrete and reinforcing bars obtained from the finite element model along the load deflection curve of the circular pipes is sequentially presented. Similar to those found in literature, the redistribution process appears. Since the applied load is continuously increased in its magnitude , the excessive stress developed is transferred from the concrete to the reinforcing steel, whose strength capacity is better, especially for tension. For the second category, the circular pipes consisting of either circular or elliptical steel cages are co mpared with the elliptical pipes consisting of elliptical steel cages. For comparison, each pipe contains the same cross sectional area. The load deflection curves obtained from the circular and elliptical RCP present a similar behavior, however, it is different in their magnitude. The elliptical pipe with a vertical position provides the significantly highest ultimate load capacity. It confirms that any cross sectional area of these vertical elliptical RCP provides the longest moment arm of the resisting moment.
Page | 1 ©2022 International Transaction Journal of Engineering, Management, & Applied Sciences & Technologies ISSN 2228 9860 eISSN 1906 9642 CODEN: ITJEA8
Cite This Article: Kosaiyakanon, N., Pisitpaibool, C (2022). Behaviors of Precast Reinforced Concrete Drainage Pipes under Static Load Using Finite Element Model International Transaction Journal of Engineering, Management, & Applied Sciences & Technologies, 13(6), 13A6P, 1 22. http://TUENGR.COM/V13/13A6P.pdf DOI: 10.14456/ITJEMAST.2022.121
Behaviors of Precast Reinforced Concrete
Narongsak Kosaiyakanon1,2, Chaisak Pisitpaibool1*
Disciplinary: Civil Engineering & Technology.
Drainage Pipes under Static Load Using Finite Element Model
Keywords: ABAQUS; Precast reinforced concrete drainage pipe (RCP); Reinforced concrete; TIS.128 2549; Circular pipe; Elliptical pipe; Finite element.
1Department of Civil Engineering, Thammasat School of Engineering, Thammasat University, Pathumtani, THAILAND.
Accepted2022

Drainage work is provided as an integral part of the transportation service to eliminate the excess surface water, especially from the rainfall which may cause damage to passenger traffic. A channel for draining or even a water channel can be included as one type of drainage work to get rid of the surface water out of the roads. An underground drainage system is a preferable selection due to the need f or a wider traffic surface. This selection, however, increases the applied loads, which include not only the heavy truck weight transferring from the wheels to the traffic surface but also the above soil weight and the groundwater. Behaviors of the structural drainage system need to be investigated to confirm their survival under different stages of the combination of these loads. The finite element model is one of the popular procedures to simulate the structural behavior reducing time and cost consumption by laboratory experiments. The numerical analysis can capture the different stages of material response caused by the applied loads. This includes the development of stress distribution across a section of the complicated materials, such as the behavior of the reinforcing bar and concrete subjected to the load history based on the performance of the reinforced concrete drainage structure. Literature shows that some researchers use ABAQUS software to apply the finite element method for simulation of the RCP behavior using the three edge bearing (TEB) test method. Tehrani (2016)formulates the models to compare the difference between the single and double cage behavior of the RCP according to ASTM standards Younis et. al. (2021) simulate the pipe models with three types of transverse reinforcement, which are single cage, double cage, and triple cage. Ramadan et. al. (2020) creates the non linear 3D FEM models of the RCP with a single elliptical steel cage to investigate the effect of the cage rotation on the reduction of the load and moment capacity of the pipe. In Thailand, the load test for RCP is governed by AS/NZS 4058 2007 {30}. T o evaluate the structural performance of pipes, the pipe and load orientation is performed similarly to the TEB test arrangement. However, the magnitudes of their size and load capability are different from the literature. In addition, the Thai specification does not require consideration of the elliptical concrete pipe. The development of Thailand's transportation system accelerates many large trucks , especially with heavy weight transmitted through the surface of the traffic. These overweights can affect and damage t he road structures including the underground RCP behavior. The simulation of the structural performance and failure mechanisms of RCP obtained from the finite element model can be one of the guidelines to review and update the available RCP standard raising the infrastructure development and transport services. The objective of this study is to simulate the finite element models of the TEB test of the RCP for drainage work in Thailand certifying by the standard No.TIS.128 2549 from the Thai Industrial Standard (TIS). The finite element models are both the circular pipes and the pipes of elliptical cross section. The first circular pipes include the single circular, the double circular, and the elliptical steel cages. The second pipes of elliptical cross section consider the single elliptical and the double elliptical steel cages. In addition, the
http://TuEngr.com Page | 2 1 Introduction
The behavior investigation of the RCP subjected to static loading conditions using the finite element model is divided into two series. The first series investigates three types of circular prefabricated tongue groove pipes. These circular pipes include the single circular, the double circular, and the elliptical steel cages. The second series includes the pipes of elliptical cross
3 Overview of Drainage Pipes Investigation
http://TuEngr.com Page | 3 cooperation between stress development in concrete and reinforcing steel is expected to propose in a simple systematic sequence according to the pipe performance during the load history.
da Silva et al. (2018) tested RCP using a TEB method. Two types of RCP were identified in the test; spigot pocket (SPP) and ogee joint pipes (OJP). Thirty two pipes, with a nominal diameter of 800 and 1200 mm, were laboratory performed. The pipes were divided into two series, each of which consisted of 16 pipes. The testing method complied with the ASTM C76 (2016) and ABNT (2007). The pipe stiffness was increased by the presence of the pocket.
Tehrani (2016) conducted the uniaxial cylinder tests to verify the material properties for ABAQUS software to simulate the behavior of RCP under the TEB test. The graphs from the TEB tests were used to validate the proper work of the FEM simulation. Results obtained from the simulations indicated that the location of the circumferential reinforcements correlated with the service and ultimate D loads.
Literature Review
Wen et al. (2016) tested reinforced concrete pipes (RCP) using the three edge bearing (TEB) method. Cracking was generally found first at the crown of the circular pipes. T he test device for determining the tensile and compressive strength between the outer and inner pipe wall was determined by using bending tests of both concave and convex segments representing the curved beams. Different production process provide s different concrete strength between the inner and outer pipe walls.
Younis et al. (2021) evaluated the pipe design classes by proposing 3D finite element models to represent the RCP structural performance. Three types of transverse reinforcement arrangement within the pipes were single cage, double cage, and triple cage. The behavior of RCP models using ABAQUS was calibrated by comparison with laboratory test results. The parametric study wa s performed on developing the FEM models to clarify the influence of the different reinforcement s concerning the areas, concrete cover, positioning, and yield strength.
2
Ramadan et al. (2020) simulated the behavior of precast concrete pipe with a single elliptical steel cage using non linear 3D FEM model s. The rotation of the elliptical cage reinforcement resulted in a reduction of the serviceability load and moment capacity of the pipe. For the observation at 10 mm deflection, from 0 to 90 degrees rotation the load capability was reduced to 83%. In addition, at 10 mm deflection, the non symmetrical shape of the elliptical cage reinforcement reduced only 5.9% of the symmetrical elliptical shape.
Figure 1: Set up of Three Edge Bearing Test according to TIS. 128 2549
http://TuEngr.com Page | 4 section, which are considered into two types; (a) Single elliptical and (b) Double elliptical steel cages. General information concerning the investigation is as follows:
A good quality product of a reinforced concrete pipe for drainage work in Thailand is certified by Standard No. TIS. 128 2549 from the Thai Industrial Standard (TIS). The precast reinforced concrete drainage pipes are divided into two categories: bell spigot and tongue groove pipes. However, this investigation concentrates only on the tongue groove pipes. The standard inner diameters of the tongue groove pipes are 0.30, 0.40, 0.60, 0.80, 1.00, 1.20, 1.50, 1.75, 2.00, 2.25 and 2.50 m. Three Edge Bearing (TEB) test is specified for determining the compressive strength and load bearing capacity. In the TEB test (Figure 1), the pipe is supported at its lower part by two longitudinal bearing strips, which can be wood or hard rubber. The upper part of the pipe is loaded by another bearing rubber strip under a wood beam to simulate a uniformly distributed load along the pipe length.
Table 1: Geometric properties of selected RCP.
Inner Diameter Wall Thickness Reinforcement Circular Elliptical Bar mm2/mmm mm Inner Bar mm2/m Outer Bar mm2/m 800 95 400 (RB6mm @ 70mm) 340 (RB6mm @ 80mm) 1000 110 420 (RB6mm @ 70mm) 320 (RB6mm @ 90mm) 470 (RB6mm @ 60mm)
3.1
Circular Reinforced Concrete Pipes and TIS. 128 - 2549
In the first stage of this study, the circular tongue groove pipes are considered into three types as shown in Figure 2; (a) Single circular, SC, (b) Double circular, DC, and (c) Single elliptical, SE, steel cages. Table 1 provides the general properties of the selected pipes for this study. This includes the pipe diameter, thickness, concrete strength, and the details of reinforcement. It shroud be noted that four specimens are selected in this stage; SC 800, DC 1000, SE 800, and SE 1000. The first two letter indicates the configuration of the reinforcing bars. The following number indicates the inner diameter of the pipes. Tables 2, 3, and 4 provide the selected materials properties of concrete, steel, and wood for simulating the TEB test in FEM.

(a) Single circular steel cage (b) Double circular steel cage (c) Single elliptical steel cage
Figure 2: Detail of the circular RCP in the first stage
3.2
Table 3: Material properties of r einforcement Item No. ModuluselasticityofMPa Poisson's Ratio Densitykg/m3 Yield strength MPa, (kg/mm2 ) Tensile strength MPa, (kg/mm2 ) Reinforcement 200,000 0.30 7.850x10 5 235, (24) 385, (39)
http://TuEngr.com Page | 5 SC 800 DC 1000 SE 800, SE 1000
Table 4: Material properties of wood Item No. Modulus of MPaelasticity Poisson's Ratio DensityKg/m3 Wood 10,000 0.315 6.870x10 6
Elliptical Reinforced Concrete Pipe
Table 2: Material concrete properties Item No. ModuluselasticityofMPa Poisson's Ratio DensityN/mm3 TensileMPastrength CompressivestrengthMPa Concrete 31,062 0.17 2.400x10 5 2.368 30
In the second stage of this study, a comparison of the load deflection behavior between the tongue groove pipes of circular and elliptical cross sections is investigated. Three types of circular RCP are obtained from the first stage. However, the pipes of elliptical cross section s are consi dered into two types; (a) Single elliptical and (b) Double elliptical steel cages. The cross section of the elliptical pipe is selected based on the Span/Rise ratio equal to 1.55 and resulting in the equivalent areas corresponding to the two types of circular pipes with single elliptical, SE 800, and double elliptical, DE 1000, steel cages. For comparison, the pipes of elliptical cross section require two configuration s, which are horizontal and vertical positions. In conclusion, four specimens for the pipes of the elliptical cross section are needed in this stage as shown in Figure 3; H SE 800, V SE 800, H DE 1000, and V DE 1000. The first letter indicates the configuration of the pipes of the elliptical cross section. The following letters and numbers indicate the configuration of the reinforcing bars and the inner diameter of the pipes, respectively. Table 5 provides the general properties of the pipes of the elliptical cross section for simulating the TEB test in FEM.


Two element types are selected for modeling the RCP, which are solid and truss elements. The 3D solid element C3D8R, see Figure 4, is selected to model the concrete pipe and the bearing strips.
3.3 Typical Outcome s from Investigation
The typical outcomes of this investigation are the load deflection relationship and the stress resultants obtained from the finite element simulation of the TEB test on the drainage pipes. The ratio of the vertical deflection, ∆, to the vertical inner pipe diameter under the applied loads is expressed in the percentage of deflection (δ) as δ (% ���������������������������������������� ) = ∆ �������������������������������� �������������������� �������������������������������� ����100% (1). where: ∆ = vertical deflection of RCP in millimeter Based on the internal stress pattern obtained by the applied load, the pipe cross sectional area can be divided by two shear lines into four segments. For the crown and invert, which are the top and bottom segments, the compressive and tensile stresses are produced in the outer and inner parts of the half pipe thicknesses, respectively. For the two spring lines, one on the left and another one on the right, the co mpressive and tensile stresses are reversed as they are produced in the inner and outer parts of the half pipe thicknesses, respectively.
4.1 Element Types
The TEB test of the RCP is simulated by creating the finite element model using ABAQUS software. The selection of the element types and application of the material properties to the model components are mentioned in the following subsections
4 Element Types and Material Properties
http://TuEngr.com Page | 6 H-SE -800 V-SE -800 H -DE -1000 V-DE -1000 (a) Single elliptical steel cages (b) Double elliptical steel cages Figure 3: Detail of the precast reinforced concrete elliptical draina ge pipe Table 5: Geometric properties of FE models. Circular Elliptical Inner MmDiameter InnermmRise InnermmSpan 800 670 1055 1000 864 1346


Steel Material
Figure 6: Elastic plastic idealization
The 3 dimensional truss element T3D2, as shown in Figure 5, is selected to model the reinforcing bar in terms of the steel cage of the precast RCP.
4.2 Material Properties
(a) 2 node straight truss element (b) How truss elements are called in Abaqus Figure 5: Truss elements (T3D2)
The concrete damaged plasticity (CDP) model of ABA QUS software is selected to represent the material property of concrete. Information obtained from the stress strain diagrams of
4.2.2 Concrete Material
The material property of the steel cage of the RCP model is simulated as an elastic plastic behavior. The stress strain relationship for steel in tension and in compression is assumed to be identical, see Figure 6. The properties of the steel reinforcement are provided in Table 3. This includes yielding stress, fy = 235 MPa, modulus of elasticity, Es = 200 GPa, and Poisson’s ratio, υ = 0.3.
Three different material properties for finite element analysis to simulate the TEB test of the RCP model are defined depending on the three main components; which are concrete pipe, steel cage, and bearing strips. The behavior of the longitudinal bearing strips is simply defined by using the material properties of wood, as shown in Table 4. However, since the behavior of the RCP structure is nonlinear, the material properties of the steel cage and concrete pipe are rather complicated to define.
http://TuEngr.com Page | 7
(a) 8 node brick solid elements (b) How solid elements are called in Abaqus Figure 4: Solid element (C3D8R)
4.2.1


�������� (1) = ����0 �������� (2), �������� (2) = ������������ �������� ������������ � �������� ������������ �2 1+������������� ������������ ������������ 2� �������� ������������ ������������ (3), �������� (3) = � 2+�������������������� ������������ 2������������ �������� �������� + ��������2�������� 2������������ � 1 (4).
(a) Compression (b) Tension Figure 7: Uniaxial stress strain diagram of concrete behavior
1) The values of the stress strain relationship of concrete for compression behavior are divided into three parts, as shown in Figure 7(a). They are presented by Equations (2), (3), and (4), respectively.
http://TuEngr.com Page | 8 concrete including the inelastic region for both compression and tension behavior, see Figure 7, is required to create the CDP material model. The algorithms presented by Alfarah et al. (2017) are applied to develop the information obtained from the inelastic compressive and tensile stress strain responses for modeling the concrete material.
2) The values of the stress strain relationship of concrete for tension behavior are divided into two parts, as shown in Figure 7(b). They are presented by Equations (5), and (6), respectively.
�������� (1) = ����0 �������� (5), �������� (2) = ����1(����) ������������ = �1 + � ����1 ���� ���������3 � ���� ����2 ���� �������� ���� �������� (1 + ����13 )���� ����2 (6). 3) The parameters in the Equations (2) to (6), such as ������������ , ������������ , ����0 , �������� , �������� ������������ �������� , are computed from the Equations (7) to (13), respectively. Compressive stress strength, ������������ = ������������ + 8 (7), Tensile stress strength, ������������ = 0 3016������������ 2 3 (8), The initial tangent modulus of deformation of concrete, ������������ = 10000������������ 1 3 (9), The undamaged modulus of deformation, ����0 = ������������ �0.8 + 0.2 ������������ 88 � ( ),10 The fracture (N/mm), �������� = 0 073������������ 0 18 (11),

Dilation Angle (Ψ ), This is the ratio of volume change to shear strain. The value of 36 °is selected.
Other Concrete Plasticity Parameters
5) The additional parameters, such as the specified concrete compressive strength ������������ , and the mesh size ������������ , are suggested to set up the initial assumption by using b = 0.9 and compressive stress strength, ������������ = 0.0022 .
For this study, the concrete compressive and tensile strength are specified as 30 MPa and 2.368 MPa, as shown in Table 2. The stress strain diagrams of concrete including the inelastic region for both compression and tension behavior are obtained, as shown in Figure 8 .
The points in the stress strain diagram of concrete for compression behavior obtained by substitution of a value of compressive strain �������� into the appropriate Equations from (2) to (4). The corresponding compressive stress is then obtained. Repeat the procedure with different values of compressive strain to get different results of compressive stresses. The information can be plotted on the stress strain diagram of concrete for compression behavior. The stress strain diagram of concrete for tension behavior can be done by a similar procedure. Finally, all information can be input into the ABAQUS form for material properties to introduce the inelastic behavior into the finite element model.
4) The additional parameters in Equations (5) and (6), such as ��������ℎ ������������ �������� which are presented for only the tension behavior, are calculated by Equations (14) and (15).
Crushing energy (N/mm), ��������ℎ = ������������� ������������ �2 �������� (12), Critical crack opening, �������� = 5.14�������� / ������������ (13).
http://TuEngr.com Page | 9
��������ℎ = � ������������ ������������ �2 �������� (14), �������� = ������������ + W/������������ (15).
(a) Compressive (b) tensile Figure 8: Stress strain used to model concrete material 4.2.3
For the CDP model in ABAQUS, five plasticity parameters for concrete properties need to be defined. The values presented by Alfarah et al. (2017) are applied for this study, which are as follows:1)
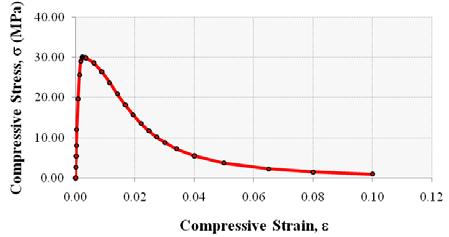

2) Eccentricity, This value is used to get a soft curvature of the potential flow and gives almost a similar dilation angle for a wide range of confining pressure values. An eccentricity of 0.1 is used.3)
Finite Element Modeling
Three main components, which are used to simulate the TEB test of the 3D RCP model, are shown in Figure 9. Thi s includes the concrete pipe, the steel cage, and the (upper & lower) bearing strips. The geometric properties of the concrete pipe using solid element C3D8R and the steel cage using truss element T3D2 are presented in Table 1. In addition, the basic material properties of concrete, reinforcing bar, and wood bearing strip are provided in Table 2, 4, and 5, respectively.
Figures 10, 11, and 12 show the assembly of the three main components of finite element models of the RCP with single circular, double circular, and single elliptical steel cages, respectively. These simulation models represent the TEB test method according to TIS. 128 2549 The bond interaction between the steel reinforcement and the concrete is developed by using the technique defined as the embedded region constraint. The steel (truss) element and the concrete (solid) element are defined as the embedded element and the host element, respectively. The
5
5) Kc Parameter , This parameter is determined by considering the yield surface in the deviatory plane. Kc is the ratio of the second stress invariant on the tensile stress meridian (T.M.) to the second stress invariant on the compressive stress meridian (C.M.). The value 2/3 is used.
As a general finite element procedure, after assigning the material properties and meshing each component of the model, it needs to specify the interaction between elements of different components , boundary condition s, and load application to represent the test simulation and obtain the test results.
5.1 Components and Assemblage
http://TuEngr.com Page | 10
4) Viscosity Parameter, This parameter is required when a convergence problem is caused by softening behavior. The vis cosity parameter is assumed to be 0.001.
Figure 9: Parts and contact pairs in the FEM model
σ bo/σ co Parameter, This is the ratio of the initial biaxial compressive strength to the uniaxial compressive strength. The default value of 1.16 is used.

translational degrees of freedom of the embedded node are specified corresponding to the degrees of freedom of the host element.
Load and Boundary Conditions
Figure 10: Components of finite element model
Figure 11 : Components of finite element model of RCP with a single circular steel cage of RCP with a double circular steel cage
A load applied on the top surface of the upper bearing strip is assigned by using a technique called a kinematic coupling constraint. This load is specified on a reference point located at a specific distance above the center of the top surface of the upper bearing strip. U sing the coupling constraint locks all nodes on the top surface to the nodes at the reference point. The total response of all nodes on the top surface is equal to the response from the nodes of the reference point. The boundary conditions are set on nodes of the upper and lower bearing strips. To confirm that vertical movement can take place, the rollers are assigned to both sides along the length of the upper bearing strip. These rollers allow the upper bearing strip can move freely in the vertical (z)direction, however, the translational displacements in x and y directions are set to be zero. For the two lower bearing strip s, translational movement is not allowed. All translational displacements of the bottom surfaces of both lower bearing strips are set to be zero.
http://TuEngr.com Page | 11
Figure 12: Components of finite element model of RCP with a single elliptical steel cage
The interaction between the concrete pipe and the bearing strips is obtained by applying the tie constraint to a pair of contact surfaces . By using t his type of constraint, the active degrees of freedom of a pair of surfaces are specified to be equal. The contact surfaces of bearing strips and concrete are assigned to be the slave surfaces and the master surface s, respectively.
5.2


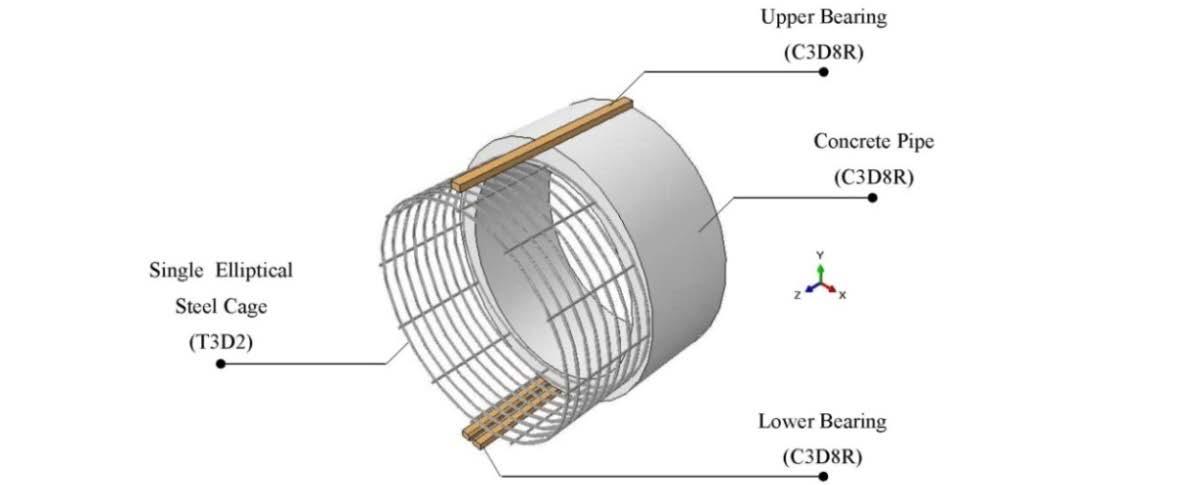
Circular Reinforced Concrete Pipes
The static monotonic loading uses the displacement control technique . A vertical displacement is progressively applied in the downward direction on a reference point located above the top of the upper bearing strip up to failure to obtain the load deflection curves of these RCP simulation models.
Figure 13: Specify boundary conditions and load
Results from the investigation of the RCP subjected to static loading conditions using the Finite Element model are divided into two categories. The first category presents the results obtained from the circular cross sectional pipes with different types of steel cages. The second category compares the results obtained from the circular pipes with either circular or elliptical cages and the elliptical pipes with elliptical cages.
6.1
For the first category, the load deflection curves of the circular pipes with the single circular cage SC 800, the single elliptical cage SE 800, the double circular cage DC 1000, and the single elliptical cage SE 1000, are presented in Figures 14, 15, 16, and 17, respectively. In addition, the corresponding principal stress development, which is distributed across the cross section of these circular pipes, is expressed in Tables 6, 7, 8, and 9, respectively. The letters in the first row refer to the corresponding points in the load deflection curves repeated in the last row . The sequence of these letters refers to the increase in the magnitude of the applied load. The second and third rows are the stress development in concrete and circular reinforcing bar, respectively, generated on the pipe cross sectional area. It should be noted that the color scale bars of concrete and reinforcing bar showing in the last row represent the different magnitude of stresses. The fourth and fifth row s present the magnifier of the stress development of the reinforcing bar near the crown (highest inside level), the invert (lowest inside level) and the spring line ( mid height of the vertical level) of the pipeUnderwall.the TEB test simulation, the RCP exhibits similar behavior to a vertical ring subjected to a downward loading. The pipe diameter in the vertical direction tends to be deceased while in the horizontal direction tends to be increased. The pipe wall segment behaves similarly to a simply supported beam subjected to a point load. Therefore, at the crown or the highest level, the
http://TuEngr.com Page | 12
6 Results and Discussion

Figure 15: Load deflection curves for typical SE 800 (circular pipe with single elliptical cage)
Figure17: Load deflection curves for typical SE 1000 (circular pipe with single elliptical cage)
http://TuEngr.com Page | 13 compressive and tensile stresses are created above and below the neutral axis of the pipe wall. In contrast, at the invert or the lowest level, the compressive and tensile stresses are created below and above the neutral axis of the pipe wall. For the spring line level or the level of horizontal diameter, the compressive and tensile stresses are produced inward and outward in the radial directions fro m the neutral axis of the pipe wall. At point (a) of Tables 6 to 9, when the applied load is initially increased after the elastic deformation, the high stress concentration in concrete starts to form at the crown, the invert, and the outer faces of the spring lines. As the load is further increased, as shown at point (b) in Tables 6 to 9, the high principal stress in concrete spreads over the region at the location of stress concentration. In addition, the moderate stress in circumferential reinforcing steel begins to develop at the identical location of the stress concentration in concrete. For further increasing of the applied load within the inelastic range, as shown at points (c) to (f) in Tables 6 to 9, the stress in the steel bar increases continuously. This implies that the excessive principal stress carried by the concrete capability is transferred to the reinforcing steel bar.
Figure 14: Load deflection curves for typical SC 800 (circular pipe with single circular cage)
Figure 16: Load deflection curves for typical DC 1000 (circular pipe with double circular cage)

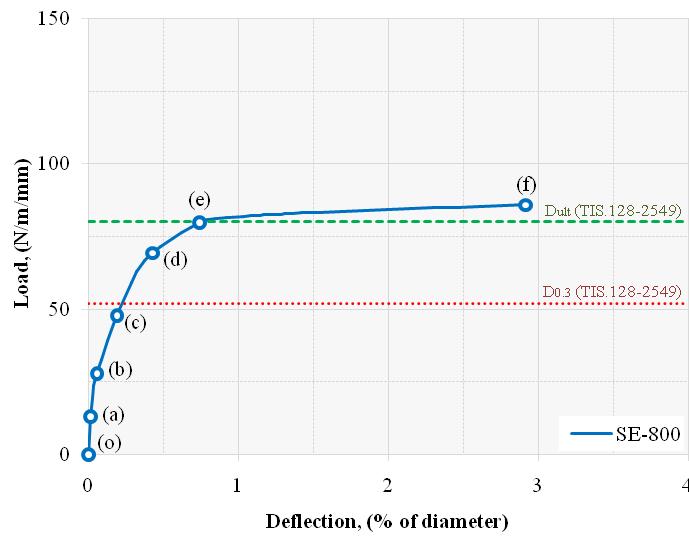


http://TuEngr.com Page | 14 Table 6: Development of stress distribution for typical SC 800 single circular steel cage model Point Concrete Reinforcement Load deflection curves (f) Crown (f) SpL (f) Crown (e) (e) Crown (d) SpL (e) Crown (c) (d) Crown (b) SpL (d) Reinforcement Crown (a) (c) Crown (o) SpL (c) Invert (f) (b) Invert (e) SpL (b) Concrete Invert (d) (a) Invert (c) SpL (a) Invert (b) (o) Invert (a) SpL (o) Invert (o)


http://TuEngr.com Page | 15 Table 7: Development of stress distribution for typical SE 800 single elliptical steel cage model Point Concrete Reinforcement Load deflection curves (f) Crown (f) SpL (f) Crown (e) (e) Crown (d) SpL (e) Crown (c) (d) Crown (b) SpL (d) Reinforcement Crown (a) (c) Crown (o) SpL (c) Invert (f) (b) Invert (e) SpL (b) Concrete Invert (d) (a) Invert (c) SpL (a) Invert (b) (o) Invert (a) SpL (o) Invert (o)

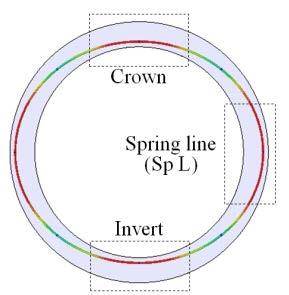


http://TuEngr.com Page | 16 Table 8: Development of stress distribution for typical DC 1000 double circular steel cage model Point Concrete Reinforcement Load deflection curves (f) Crown (f) SpL (f) Crown (e) (e) Crown (d) SpL (e) Crown (c) (d) Crown (b) SpL (d) Reinforcement Crown (a) (c) Crown (o) SpL (c) Invert (f) (b) Invert (e) SpL (b) Concrete Invert (d) (a) Invert (c)
SpL (a) Invert (b) (o) Invert (a) SpL (o) Invert (o)


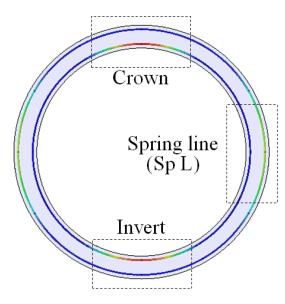


SpL (a) Invert (b) (o) Invert (a) SpL (o) Invert (o)
http://TuEngr.com Page | 17
Table 9: Development of stress distribution for typical SE 1000 single elliptical steel cage model Point Concrete Reinforcement Load deflection curves (f) Crown (f) SpL (f) Crown (e) (e) Crown (d) SpL (e) Crown (c) (d) Crown (b) SpL (d) Reinforcement Crown (a) (c) Crown (o) SpL (c) Invert (f) (b) Invert (e) SpL (b) Concrete Invert (d) (a) Invert (c)


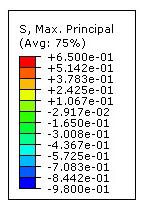


Cross section Pipe Load deflection Curves SC 800 SE 800 H SE 800 V SE 800
For the second category, two sets of the load deformation curves and the corresponding stress development across the section s of the RCP are compared. The first set (Tables 10 and 11) are the finite element results obtained from four RCP, each of which contains a single steel cage. These include (1) the circular pipe with a single circular cage SC 800, (2) the circular pipe with a single elliptical cage SE 800, and the elliptical pipes with a single elliptical cage with either (3) horizontal position H SE 800, or (4) vertical position V SE 800. The second set, shown in Table s 12 and 13, are the results obtained from four RCP, which are (1) the circular pipe with double circular cage DC 1000, (2) the circular pipe with single elliptical cage SE 1000, and the elliptical pipes with double elliptical cages with either (3) horizontal position H DE 800, or (4) vertical position V DE 800. For each set of comparison s, each pipe contains the same cross sectional area.
Table 10: Cross section and load deflection curves of typical circular and ellipse pipes
http://TuEngr.com Page | 18
Tables 10 and 12 show similar behavior but different in magnitude for the load deflection curves of both circular and elliptical shapes of the RCP with an equivalent cross sectional area. However, for each set of curves, the elliptical pipe with a vertical position indicates the highest ultimate load capacity compared with the remaining ones. The highest load carrying capability takes advantage of the longest depth of the compressive stress diagram above the neutral axis of the cross section affecting the flexural behavior. This results in the longest moment arm of the resisting moment developed at any cross sectional area of these vertical elliptical RCP. The comparison between the SC 800 and SE 800 in Table 10, however, provides an unexpected magnitude. This may cause by the calibration of their parameters, which are based on the different works of literature. Future study is suggested to investigate the appropriate values of these
6.2 Comparison between Circular and E lliptical Pipes


http://TuEngr.com Page | 19 parameters, especially the sensitive tensile strength of the concrete. Tables 11 and 13 present some stress distribution for concrete and steel including the deformed shapes obtained from the TEB test of the finite element models of these circular and ellipse pipes. Results from the investigation are similar to the ones obtained from the first category. Table 11: Stress distribution and deformed shape for typical circular and ellipse pipes Model SC 800 SE 800 H SE 800 V SE 800 Concrete (Isometric view) ReinforcementConcrete (Scale factor 2.5) deformed shape (Scale factor 2.5) Table 12: Cross section and load deflection curves of typical circular and ellipse pipes Cross section Pipe Load deflection Curves DC 1000 SE 1000 H DE 1000 V DE 1000


For the first category, the pipes of circular cross section include the single circular, the double circular, and the elliptical steel cages. Under the TEB test simulation, the RCP behaves like a vertical ring under a downward loading . This behavior is similar to th ose result s found in the literature The vertical pipe diameter tends to be decreased while the horizontal diameter tends to be increased. Therefore, at the crown, the compressive and tensile stresses are produced above and below the neutral axis of the pipe wall, respectively. At the invert, however, the compressive and tensile stresses are created below and above t he neutral axis of the pipe wall, respectively At the
http://TuEngr.com Page | 20 Table 13: Stress distribution and deformed shape for typical circular and ellipse pipes Model DC 1000 SE 1000 H DE 1000 V DE 1000 Concrete (I sometric view) ReinforcementConcrete (Scale factor 2.5) deformed shape (Scale factor 2.5) 7
The behavior of the RCP subjected to static loading conditions using the Finite Element model of ABAQUS software is divided into two categories. The first category investigates the pipes of circular cross section s with different types of steel cages. The second category compares the circular pipes with either circular or elliptical cages and the elliptical pipes with elliptical cages.
Conclusion
To simulate the TEB test of the RCP model using ABAQUS software, three different material properties for the three main components are defined . This includes the concrete pipe, the steel cage, and the (upper & lower)bearing strips. The behavior of the longitudinal bearing strips is simply defined by using the material properties of wood . The material properties of the steel cage of the RCP model are simulated as an elastic plastic behavior. The concrete damaged plasticity (CDP) model is selected to represent the material property of concrete. The algorithms presented in the literature are applied to develop the information obtained from the inelastic compressive and tensile stress strain diagram for creating the CDP material model.


Abaqus (2013). Abaqus 6.13 Analysis User’s Guide Volume III: Materials Dassault Systèmes Simulia Alfarah,http://130.149.89.49:2080/v6.13/pdf_books/ANALYSIS_3.pdfB.,LópezAlmansa,F.,&Oller,S.(2017).NewMethodology
9 References
American Concrete Pipe Association. (2011). Concrete Pipe Design Manual. http://resources.concretepipe.org/concrete pipe design manual American Concrete Pipe Association. (2020). Post Installation Evaluation and Repair of Installed Reinforced Concrete Pipe https://www.concretepipe.org/pipe box resources/inspection/post installation/ ASTM. (2018). ASTM C76 16: Standard Specification for Reinforced Concrete Culvert, Storm Drain, and Sewer Pipe. West Conshohocken, PA: ASTM Atichat, A., Sirimontree, S., & Witchayangkoon, B. (2017). Behaviors of Concrete Beam to Column Connections under Static Load Using Finite Element Method. International Transaction Journal of Engineering Management & Applied Sciences & Technologies, 8(2), 57 67. https://tuengr.com/Vol82.html
Buda Ożóg, L., & Skrzypczak, I. (2015). Experimental and Numerical Analysis of Cracks in the Reinforced Concrete Pipes. Journal of Civil Engineering, Environmental and Architecture, 62(3), 63 74. CSA A257 14. (2014). Standards for Concrete Pipe and Manhole Sections. Misissauga, ON: CSA.
da Silva, J. L., El Debs, M. K., & Kataoka, M. N. (2018). A Comparative Experimental Investigation of Reinforced Concrete Pipes under Three Edge Bearing Test: Spigot and Pocket and Ogee Joint Pipes. Acta
Page | 21
for Calculating Damage Variables Evolution in Plastic Damage Model for RC Structures. Engineering Structures, 132, 70 86. DOI: 10.1016/j.engstruct .2016.11.022
http://TuEngr.com spring line level, compressive and tensile stresses are produced inward and outward in the radial directions from the neutral axis of the pipe wall. The stress development both in concrete and reinforcing steel is presented in a systematic sequence. This reveals the redistribution process from concrete to reinforcing steel. As the applied load is continuously increased, the excessive principal stress , which is larger than the concrete capability, is transferred to the reinforcing steel cage, which can experience a higher magnitude of stress until the structure is reached its ultimate failure.For the second category, the circular pipes consisting of either circular or elliptical steel cages are co mpared with the elliptical pipes consisting of elliptical steel cages. Two sets of the investigation are proposed. In t he first set, each RCP contains a single steel cage. However, in the second set, the circular pipes include either double circular or single elliptical steel cages , while the elliptical pipes include double elliptical cages . In addition, the elliptical pipes are considered in both horizontal, and vertical position s. For each set of comparison s, each pipe contains the same cross sectional area. The load deflection curves obtained from the circular and elliptical RCP for both sets provide similar behavior but their magnitudes are different. F or each set of curves, the elliptical pipe with a vertical position provides the highest ultimate load capacity. This is caused by the longest moment arm of the resisting moment developed at any cross sectional area of these vertical elliptical RCP. Additional results, such as the stress distribution for concrete and steel including the deformed shapes , of these circular and ellipse pipes from the investigation are similar to those obtained from the first category. 8 Availability of Data and Material Data can be made available by contacting the corresponding authors.
Page | 22
Michał, S., & Andrzej, W. (2015). Calibration of the CDP model parameters in Abaqus. World Congr. Adv. Struct. Eng. Mech. (ASEM15), Incheon Korea. Mohamed, N., & Nehdi, M. L. (2016). Rational Finite Element Assisted Design of Precast Steel Fibre Reinforced Concrete Pipes. Engineering Structures, 124, 196 206. DOI: 10.1016/j.engstruct.2016.06.014
http://TuEngr.com
Ferrado, F. L., Escalante, M. R., & Rougier, V. C. (2016). Numerical Simulation of the Three Edge Bearing Test of Steel Fiber Reinforced Concrete Pipes. Mecánica Computacional, 34(34), 2329 2341. http://venus.santafe conicet.gov.ar/ojs/index.php/mc/article/view/5156
Montha, A., Sirimontree, S., & Witchayangkoon, B. (2018). Behaviors of the Composite Slab Composed of Corrugated Steel Sheet and Concrete Topping Using Nonlinear Finite Element Analysis. International Transaction Journal of Engineering, Management, & Applied Sciences & Technologies, 9(2), 75 84. https://tuengr.com/Vol91.html#V92 Ontario Concrete Pipe Association. (n.d.). OCPA Concrete Pipe Design Manual. https://ccppa.ca/design/ Ramadan, A., Shehata, A., Younis, A A., Wong, L. S., & Nehdi, M. L. (2020). Modeling Structural Behavior of Precast Concrete Pipe with Single Elliptical Steel Cage Reinforcement. Structures, 27, 903 916. Riahi, E. (2016). Evaluation of Structural Capacity of Epoxy Coated Concrete Pipes and Its Interaction with Soil. Doctoral dissertation, the University of Texas at Arlington. https://rc.library.uta.edu/uta Tehrani,ir/handle/10106/27873A.D.(2016).
Younis, A A., Shehata, A., Ramadan, A., Wong, L. S., & Nehdi, M. L. (2021). Modeling Structural Behavior of Reinforced Concrete Pipe with Single, Double and Triple Cage Reinforcement. Engineering Structures, 240, 112374. DOI: 10 1016/j engstruct 2021 112374 Narongsak Kosaiyakanon is a Master’s Candidate of Civil Engineering at Thammasat University, Thailand. He received his Bachelor of Engineering degree in Civil Engineering from Prince of Songkhla University, Thailand. He works at the Department of Rural Roads, Ministry of Transport, Thailand He is interested in Design Buildings and Bridges Dr.Chaisak Pisitpaibool is an Assistant Professor at the Department of Civil Engineering, Thammasat University. He received his B.Eng. and M.Eng. from Khon Khaen University. He was a Lecturer at Chiang Mai University. He got a PhD from Nottingham University, UK His research encompasses Prestress Engineering
Scientiarum. Technology, 40, e30860. DOI: 10.4025/actascitechnol.v40i1.30860
TIS. (2000). Thai Industrial Standards: Steel Bars for Reinforced Concrete: Round Bars. TIS.20 2543, Thai Industrial Standards Institute, Ministry of Industry, Thailand TIS. (2006). Thai Industrial Standards Precast Reinforced Concrete Drainage Pipe TIS.128 2549, Thai Industrial Standards Institute, Ministry of Industry, Thailand. Wen, Q J., Jing, H W., Sanda, S., & Zhuan, S S. (2017). Experimental Investigation of Mechanical Properties of Centrifugal Concrete in Circular Pipes Journal of Materials in Civil Engineering,29(4), 04016251. DOI: 10 1061/(asce )mt 1943 5533 0001771 Wong, L. S., & Nehdi, M. L. (2018). Critical Analysis of International Precast Concrete Pipe Standards. Infrastructures, 3(3), 18. DOI: 10.3390/infrastructures3030018
Doru, Z. (2017). Steel Fibers Reinforced Concrete Pipes Experimental Tests and Numerical Simulation. IOP Conference Series: Materials Science and Engineering, 245(2), 022032. DOI: 10 1088/1757 Erdogmus,899X/245/2/022032E.,&Tadros,M. K. (2006). Behavior and Design of Buried Concrete Pipes. Nebraska Department of Transportation Research Reports, 54. http ://digitalcommons .unl.edu/ndor /54
Finite Element Analysis for ASTM C 76 Reinforced Concrete Pipes with Reduced Steel Cage. Master’s Thesis, the University of Texas at Arlington. DOI: 10 .13140/RG.2.2.13688.08967


Available online 19
1
Andrey Bakuradze1*, Irina Gladilina2, Kapitolina Ulanova3, Oksana Glazova3, Elena Konovalova4 K.G. Razumovsky Moscow State University of Technology and Management (First Cossack University), Moscow, RUSSIA Moscow Metropolitan Governance University, Moscow, RUSSIA.
3 Russian Peoples' Friendship University, Moscow, RUSSIA.
ITJEA8 Quality of Education in the Application of E-Learning in Vocational Education
4 Russian State University of Tourism and Service, Moscow, RUSSIA.
*Corresponding Author (Email: andrey.bakuradze @bk.ru) ID: 13A6Q 13 6 24 February 2022 revised form May 2022 May 2022 Learning DidacticElearningProfessionaltechnologies;education;teacher;cycle;D.Kolb;Studentlearningdevelopment.
Issue
Keywords:
International
Volume
©2022 INT TRANS J ENG MANAG SCI TECH.
Bakuradze, A., Gladilina, I., Ulanova, K., Glazova, O., and Konovalova, E. (2022). Quality of Education in the Application of E Learning in Vocational Education International Transaction Journal of Engineering, Management, & Applied Sciences & Technologies, 13(6), 13A6Q, 1 8. http://TUENGR.COM/V13/13A1D.pdf DOI: 10.14456/ITJEMAST.2022 122
1 Introduction
The transition to a post industrial society, one of the leading features of which is the active implementation of digitalization, has generated significant changes in the system of professional International Transaction Journal of Engineering, Management, & Applied Sciences & Technologies http://TuEngr.com
.
| 1
Page
Paper
Received
Received in
Disciplinary: Vocational Education (Elearning).
Cite This Article:
©2022 Transaction Journal of Engineering, Management, & Applied Sciences & ISSN 2228 9860 eISSN 1906 9642 CODEN:
Technologies
2
09 May Accepted2022 14
Abstract The article analyzes the advantages and disadvantages of learning technologies that the complex nature of their application allows you to achieve a synergetic effect, which ensures high quality education. The material describes the didactic component of the e learning model offered by the authors the D. Kolb cycle, based on which it is expedient to build the content of the educational process. Also, the authors pay much attention to the issue of changing the professional position of a teacher from traditional to tutor and consultant in the course of e learning. The article concludes that the factors increasing the quality of professional education with the use of e learning are the complex use of a case study, telecommunication, and network technologies in combination with the construction of the educational process on the basis of the didactic cycle D. Kolb and the change of teachers' professional position

In determining the purpose of the study, we were guided by the methodology of a systematic approach to educational activities. This methodology implies identifying numerous internal and external relations between the elements of professional education and ordering these relations, which implies their hierarchical order.
http://TuEngr.com Page | 2 education. Such changes are associated with the introduction into the educational process of content components and methods of educational activity adequate to the current and future state of science and technology, which are caused by the mass application of digital technologies in all spheres of human life and society, peculiarities of personality socialization in the conditions of post industrial civilization (Ivanova et al., 2019).
At the same time, it is necessary to keep in mind that the insufficiency of resources, which the education system as a whole, and vocational education, in particular, can have, is the strategic factor, which both in the past and in the present and in the foreseeable future will have a significant impact on the development of educational activity (Bakuradze, 2013). This is a serious obstacle to achieving quality education, which ensures the development and implementation of breakthrough technologies, high living standards for the population, and worthy responses to a variety of social, environmental, and political challenges.
The insufficient resources to ensure high quality professional education include both the material and technical base of educational institutions, as well as the amount of their funding, but also the number of highly qualified teaching staff, which is not enough to implement the educational process that provides a modern quality of education. Moreover, this highly qualified personnel tend to work in large university centers. We should also note the lack of time resources available to teachers and students for the educational process: the increased workload of the former and the need to work for the latter is a significant obstacle to ensuring the quality of the educational process. The situation with the lack of resources in the vocational education system has been aggravated in recent years by the significant acceleration of knowledge obsolescence, which is especially characteristic of the technical sphere. This requires the vocational education system to regularly review the content of vocational education and the methods of educational activity.The above circumstances determine the need to use in mass educational practice solutions, which would be characterized by low resource costs. Among these solutions should be the use of e learning, and, above all, its leading variety distance learning technologies.
2 Materials and Methods
The use of the general logical method of analysis in combination with the system approach makes it possible to distinguish the positive and negative effects of some or other e learning tools, as well as to assess their strength and, in case of negative impact, to determine the ways of compensation.Thesynergetic approach to the educational process and the method of synthesis allow us to determine the complex influence of e learning tools on the quality of the educational process. This
The combination of the above mentioned scientific approaches and methods of cognition allowed us to model the educational process, the main components of which were case study, telecommunication, and network distance learning technologies. The organizational basis of the developed model was the didactic cycle of D. Kolb which assumed such stages of work with students as referring to their experience, a reflection of this experience, mastering the theory of the issues in question, and experimenting based on the reflection made and the knowledge received.
http://TuEngr.com Page | 3
3 Results and Discussion In the course of this study, we have revealed that the resource intensity of basic and additional professional education is a marker that separates elitist professional education, which is available to a small part of the student contingent and is mainly conducted in the mode of full time education, from mass education. The distinctive feature of such elite education is the direct interaction in the system of "teacher student". The organization of mass professional education will increasingly use indirect forms of interaction between students and instructors. This means that the process of ensuring accessibility of vocational education, especially in its mass segment, will largely be realized through e learning and, above all, distance learning technologies, which presuppose mediated interaction between students, teaching staff, and the specialists who organize
Empirical methods, such as observation and experimentation, were actively used during this study. During the pedagogical observation the results and effects of using traditional approaches to the organization of the educational process, which was characterized by fragmented use of modern digital technology, were recorded. The experiment included the integrated use of case study, telecommunication and network distance learning technologies, construction of the content of the educational process on the basis of the D. Kolb cycle, as well as work on changing the professional position of the teacher. We developed the program of the experiment, monitored the progress and results of each of its stages, and at the end of the experiment its final results and effects. To experiment, we took five study groups of students and three study groups of trainees of professional development courses at two universities: classical university Federal State Budgetary Educational Institution of Higher Professional Education "K.G. Razumovsky Moscow State University of Technologies and Management (First Cossack University)" (hereinafter MGUTU) and technical university Federal State Educational Institution of Higher Professional Education "Russian Transport University (MIIT)" (hereinafter RUT (MIIT). In total, 210 students (105 from each university) and 120 trainees of professional development courses (60 from each university) took part in the experiment. Some elements of the model were tested at the Institute of Management of the University of Social Sciences and Management of the Republic of Mali. Finally, the method of comparison allowed us to record the differences between the traditional use of e learning and its proposed model.
influence is carried out due to the self organization of participants in educational relations, assuming the spontaneity of transition from less complex to more complex and ordered forms of educational process organization within the implementation of e learning.
As a result of the study three groups of distance learning technologies were studied: case, telecommunication, and network. Case technologies stipulate that students are provided with a variety of information educational resources in the format of cases educational methodical complexes, as a rule, on electronic media, which are designed for independent study. The use of case technologies makes it possible to ensure the completeness of the content of education, which is very important for the system of secondary and higher education but is not a mandatory requirement for the content of modern additional educational programs. But case technologies do not provide quality means of interaction between students and teachers. In addition, the provision of cases ready to be mastered by students has both positive and negative effects. Their positive effects include saving time on searching for educational information, which undoubtedly contributes to the acceleration of the educational process, and makes it possible to promptly refer to it at the right time for the student, turning the case into a kind of means of quick professional support. The negative effects include the fact that by consuming the information practically in a "ready made" form, the student makes no effort to search for it and analyze it. This leads to superficiality in mastering knowledge and skills, and insufficient development of learning and research competencies, the importance of which increases from year to year. The negative effects of case based technologies related to the organization of interaction between students and teachers can be compensated by telecommunication technologies, which involve the use of telecommunication networks for the interaction of participants in educational relations in an interactive mode and also allow them to obtain a variety of educational and methodological materials. Howe ver, telecommunication technologies, primarily due to the psychological features of distance communication (Robert, 2010), cannot sufficiently provide the effects of face to face interaction, which are possible in the classroom work of a student and a teacher. Also, the use of these technologies requires that educational institutions and students
http://TuEngr.com Page | 4 the educational process. At the same time, there will be an obvious decrease in the quality of education, which will be a consequence of ensuring its accessibility. This conclusion actualizes the task of introducing e learning into the educational process of basic and additional professional education in such a way that it would enable us to achieve the results of the educational process of acceptable quality in conditions of, first of all, mass education. In the course of our analysis, it was determined that e learning is a way of implementing educational programs in part or in full, using various information systems and information and telecommunication networks. It implies the use of distance learning technologies by making various electronic resources and services available to participants in educational relations, as well as the remote exchange of knowledge and skills, as well as to organize collaborative learning activities. Then, distance learning technologies are understood as educational technologies, which are implemented mainly through the use of information and telecommunication systems in terms of mediated interaction between students, teachers, and organizers of educational activities (Bakuradze et al., 2018). Thus, distance learning technologies are the main means of e learning.
The study we have conducted makes it possible to conclude that the content basis of the proposed model of e learning in professional education, it is advisable to make a case study, on telecommunication and network technologies, which in their totality contribute to improving the quality of the educational process. As the testing of the proposed model showed, the use of the above mentioned technologies in aggregate increased students' satisfaction with the educational process in the experimental groups of RUT (MIIT) and K.G. Razumovsky Moscow State Technical University (PKU) by 43% against an average of 13.5% when each group of technologies were used separately. The efficiency of the educational process increased with the integrated use of the above mentioned distance technologies by 15% on average. However, substantive changes in e learning should be supplemented by changes in the methodology of classes, as well as changes in the professional position of teachers and their training. Speaking about the methodological changes, it should be borne in mind that the distance learning mode can be effective only when its content is based on the existing professional experience of students in the field of studied professional activity. Such experience is necessary when learners actually study the courses offered through e learning by correspondence. There is no problem with its availability when studying additional professional programs, but when studying
http://TuEngr.com Page | 5 have such technical devices, which would meet the required technical characteristics for their provision. The latter may involve significant investments for the purchase of new technical devices or modernization of existing ones; certain costs for their operation. Thus, the positive effects of the use of telecommunications technology can be offset.
Network technologies used in e learning are based on the use of global and local information networks. These technologies are designed to give students and teachers access to information and educational resources that are beyond their reach, outside the educational institution. As the above resources can be quite unique professional educational programs, and high quality teaching materials, as well as organizational, such as opportunities to participate in interesting for the student scientific research, scientific practical conferences and seminars, virtual practical lessons, master classes of important personalities, virtual excursions, and other events. All this contributes to the development of students' creativity, which is currently one of the most important goals of professional education (Karavanova et al., 2020). Network technologies contribute to the formation of virtual educational networks, which allows to significantly expand the knowledge component of the educational process. They enable the student to become a participant in educational events, which are inaccessible to him outside the network interaction (Builova & Bakuradze, 2016). These circumstances have allowed us to conclude that network educational technologies are an essential factor of motivation of educational activity for those students who attach importance to the digitalization of their life activity. An important positive role these technologies have on the organizational side of the educational activity. But network technologies do not solve the main problem of education, which is to build effective interaction between the participants of educational relations.
higher education programs for students who have only a theoretical idea of their future profession, it is necessary to immerse them in the professional sphere from the very first months of study.
Further, at the second stage (stage "comprehension of experience") there is a reflection of the professional experience of students, assuming its comprehension. Such comprehension makes it possible to discover problems in professional activity related to the studied object.
The first stage (stage "personal experience") represents the actualization of the students' professional experience and identification of their stereotypical ideas about the object under study.
http://TuEngr.com Page | 6
Figure 1: The didactic cycle by D. Kolb
Abstract conceptualization, which implies a brief presentation of theoretical material that is included in the content of the educational program, represents the third stage (stage "acquaintance with theory") of the unfolding of D. Kolb's didactic cycle. This stage focuses on the development of students' leading concepts about the object under study, which can enable them to change some of their stereotypical ideas about such an object as a result of their own judgments and inferences.
Further, during the discussion of the results of practical works, there is a new reference to the personal experience of students, during which changes in it related to the development of new knowledge and skills are recorded.
Active experimentation on the basis of the knowledge and skills acquired at the third stage and their active application in the course of practical classroom work and in the course of practical training constitute the fourth and final stage of D. Kolb's (1984) didactic cycle (stage "application in practice"). The content of the received education is tested experimentally. It can be clarified in some aspects and even be subjected to reasoned refutation, which should be presented for discussion to the study group under the guidance of a teacher. Application of the received knowledge and skills in practice occurs in the process of specially organized independent work of the student, which provides his active experimentation with the mastered educational material (Bukhteeva et al., 2019).
Based on the above, it seems reasonable to build the content of e learning in vocational education based on the didactic cycle of D. Kolb, who proposed a generalized model of learning, which is based on the use of students' experience and reflection of such experience. This cycle can be represented in the form of four successive stages (Figure 1).

Testing of the proposed model of e learning showed an increase in interest of students in the use of didactic cycle D. Kolb, especially in relation to students of refresher courses courses as interesting recognized 93% of students who were trained with the use of didactic cycle D. Kolb, as opposed to 56% of students who were trained by traditional methods. Students also rated the use of the didactic cycle by D. Kolb, as increasing interest in learning by 76% vs. 52% in traditional teaching. Learning outcomes when using this cycle also showed an upward trend an average increase of 13% for students and 24% for the trainees of the professional development courses of both universities.Thedigitalization of the educational process makes special demands on the selection of personnel (Panshin & Vlasov, 2019). The systematic application of e learning requires the teaching staff not only to master digital competencies but also a change in the professional position of the teacher. This position should be shifted from teaching roles (lecturer, seminar and practice leader, etc.) to the roles of organizers of students' educational activity, tutor, expert, and consultant. It provides for teachers and organizers of the educational process to master the technologies of tutoring and consulting, the knowledge of the psychology of modern adult learners and andragogy.
At the present time for the teaching staff participating in the experimental activities of universities the relevant refresher courses and training are held, and consulting activities are carried out, which have the aim to support the change of professional and pedagogical positions.
http://TuEngr.com Page | 7
Bakuradze, A. B., Barinova, G. V., Blonsky, L. V., Bykov, A. K., Veterkov, A. I., Klimov, S. N., Kuzmenkova, T. L., Orlova, N. V., & Panshin, A. I. (2018). E learning and distance learning technologies in modern higher technical schools Russian University of Transport (MIIT)
6 References Bakuradze, A. B. (2013). Management resource values. The Education and Science Journal, 9, 43 55.
Builova, L. N., & Bakuradze, A. B. (2016). Perspective models for the development of additional education for children and mechanisms for their implementation. Municipal Education: Innovations and
4 Conclusion
The results of the research were discussed at the International Internet conference "Modern problems of railway transport" (April 2020, RUT (MIIT) and at the International scientific practical conference "Formation of digital culture of continuous humanities education in the context of traditional values" (Moscow, K.G. Razumovsky Moscow State Technical University (PKU) 08 09 June 2021).
5 Availability o f Data and Material Data can be made available by contacting the corresponding author.
Thus, the factors for improving the quality of professional education when using e learning are the integrated use of case study, telecommunication and network technologies in combination with the construction of the educational process based on the didactic cycle of D. Kolb. It also implies teachers' transition from the traditional professional pedagogical position to tutoring and consulting positions.
Experiment, 2(28), 26 35. Bukhteeva, E. E., Zimovina, O. A., Shishov, S. E., Rabadanova, R. S., & Polozhentseva, I. V. (2019). Practical and theoretical grounds of a student’s autonomous learning activities in professional education. Amazonia Investiga, 8(20), 575 581. Ivanova, O. M., Bilalo va, L. M., Yulina, G. N., & Polozhentseva, I. V. (2019). Social institutes in the system of person’s socialization in present day Russia. Dilemmas of the Present: Education, Politics, Values, 7(S10), 69. Karavanova, L. Zh., Shishov, S. E., Rozhnova, T. M., Rozhnova, K. S., Polozhentseva, I. V., & Lobacheva, L. P. (2020). Development of students’ individual creativity in higher education institutions: Project based learning. Universidad y Sociedad, 12, 380 384.
Kolb, D. (1984). Experiential learning: Experience as the source of learning and development. Prentice-Hall. Panshin, A. I., & Vlasov, A. V. (2019). Improvement of the management system recruitment process in terms of digitalization of the economy. Entrepreneur's Guide, 41, 169 180. Robert, I. V. (2010). Theory and methodology of informatization of education (psychological, pedagogical and technological aspects). IIO RAO.
Professor Dr. Andrey Bakuradze is a Professor at the K.G. Razumovsky Moscow State University of Technology and Management (First Cossack University), Moscow, Russia. ORCID ID: https://orcid.org/0000 0002 6840 6969 Professor Dr.Irina Gladilina is a Professor at the Moscow Metropolitan Governance University, Moscow, Russia. ORCID ID: https://orcid.org/0000 0002 8076 5518 Kapitolina Ulanova is an Associate Professor at the Russian People`s Friendship University, Moscow, Russia. ORCID ID: https://orcid.org/0000 0002 0190 930X Oksana Glazova is an Associate Professor at the Russian People`s Friendship University (Moscow, Russia) ORCID ID: https://orcid.org/0000 0002 7221 0483
http://TuEngr.com Page | 8
Elena Konovalova is an Associate Professor at the Higher School of Tourism and Hospitality of the Russian State University of Tourism and Service, Moscow, Russia ORCID ID: https://orcid.org/0000 0002 8454 8166


Page | 1
©2022International
Received in revised form 05 May Accepted202212 April 2022 Available online 19 May 2022 Keywords: Internet of things; Wireless
Abstract It is possible to build a decentralised wireless network using Internet of Things (IoT) sensors and other IoT based devices. Wireless connections allow all network nodes to be moved around at will. They can connect and construct a network without current network infrastructure.
Transaction Journal of Engineering, Management, & Applied Sciences & Technologies
University,
*Corresponding Author (Email: neha19khandelwal8@gmail.com). Paper ID: 13A6R Volume 13 Issue 6 Received 05 February
International Transaction Journal of Engineering, Management, & Applied Sciences & Technologies http://TuEngr.com
1Department ITM Gwalior, INDIA 2022 BATMAN)Extendedmanagementtechnology;tolerance;ByzantineNetwork;faultBlockchainTrust;BATMAN(E
of Computer Science Engineering,
©2022 INT TRANS J ENG MANAG SCI TECH. Cite This Article: Khandelwal, N., Gupta, S (2022). Secure IoT Architecture in Mobile Ad hoc Network Against Malicious Attacks Using Blockchain based BATMAN.International Transaction Journal of Engineering, Management, & Applied Sciences & Technologies, 13(6), 13A6R, 1 15 http://TUENGR.COM/V13/13A6R.pdf
Extended BATMAN (E BATMAN) is a method of integrating blockchain technology into the BATMAN protocol using IoT based MANETs. Blockchain is a safe, distributed, and trustworthy platform, with each node performing its security procedures. Four characteristics are used to evaluate the proposed ensemble method: pdr, average e2e latency, network throughput, and algorithm vitality use. All of these components outperform the existing traditional techniques using the recommended ensemble approach .
ISSN 2228 9860
Disciplinary: Information Technology.
DOI: 10.14456/ITJEMAST.2022.123
eISSN 1906 9642 CODEN: ITJEA8 Secure IoT Architecture in Mobile Ad-hoc Network Against Malicious Attacks Using Blockchain-based BATMAN Neha Khandelwal1*, Shashikant Gupta1
Using blockchain technology in a wireless ad hoc context, an IoT based MANET is a fresh research topic. The key challenge for ad hoc blockchain applications is to cope with the high computational cost of block validation while keeping blockchain features and incorporating nodes. This article presents a blockchain based mobile network as a potential application of the ensemble approach, which has been covered in other articles. The suggested technique for MANETS routing uses the Byzantine Fault Tolerance (BFT) protocol. It is possible to integrate Blockchain into an IoT based MANET (BATMAN) using advanced mobile ad hoc networking (MANET) (BATMAN).

This part describe s several ways the suggested algorithm may be supported in various circumstances.
Blockchain technology, first announced by Satoshi Nakamoto in 2008, is still used today (Nakamoto, 2019). Network segmentation happens when two separate chains split apart. Because two chains cannot coexist, one of the links is routinely removed. Data loss may be the root of the problem. Thoughts on the long term value of a new kind of Blockchain with high network distribution capabilities (Cordova et al., 2020). On demand distance vector routing (AODV) (Perkins et al., 2003) and BATMAN (Clausen et al., 2003) are three innovative MANET protocols designed to overcome this issue (Sanchez Iborra et al., 2014). Varaprasad The nodes determine the optimum forward route and push packets appropriately.
The suggested system assessment mechanism, based on blockchain technology, can satisfy MANETWhengoals.it comes to our work, we divide it into four separate phases that we call our framework: When the Trust value is determined, the second stage, delegated BFT , is used to pick the speaker, an d the third stage uses delegated BFT based on the Extended BATMAN protocol for transaction claims/node validation and block construction, and the fourth stage does maintenance.
2 Lit e rature Review
http://TuEngr.com Page | 2 1
According to Laube et al. (2019), a DAG based architecture may handle the partitioning problem in a MANET with mobile nodes. When the network topology changes, the partition problem arises. The BATMAN routing protocol, presently being developed by the German "Freifunk" community, enabled this. It will be replaced by the more efficient OLSR (Kulla et al., 2012a). The lack of trustworthiness of blockchains has only recently been realized as a mechanism to produce the demand for collaborative components in diverse frameworks, on the current situation of agreements with blockchain enabled in process sending motivations for multi hop (Machado and Westphall, 2021).
Yang et al. A protocol based on the system's ability to withstand Byzantine Generals faults (BFT) was designed to conduct blockchain operations (Kotla and Dahlin, 2004). A few nodes fail or behave maliciously, but the BFT system continues to operate (Aublin et al., 2013). We use DCFM (L, 2020a; S., 2015) to identify hostile intruders from trustworthy nodes. Lwin and coworkers (Lwin et al., 2020a) call it one of the most efficient systems recently suggested (2020a).
Introd u ction
Many researchers have been working on developing a secure network communication system. (Omar et al., 2012) devised an authentication technique that verifies connections are safe before any network communication can occur. Because MANETs are continually changing, a hostile actor may get the private key even if no unauthorized outsiders are present (Eschenauer et al., 2002).
Please remember that the Batman protocol decentralizes route information, which means that routing tables are not available to the whole network through the Batman protocol (Sliwa and colleagues, 2019). It is decided which single hop neighbours will be assigned to each node in the mesh to offer the best feasible gateway for communication with the destination node. The result is developing an efficient and very fast routing system t hat allows for establishing a collective intelligence network while using little CPU and, therefore, requiring less energy consumption on the side of each node (Johnson et al., 2008).
As an example of a normal project, we have taken the concepts from this project and incorporated them into the recommended project. It is necessary first to discuss NIAs (Node Isolation Attacks), which are attacks that are specially addressed by denial contradictions with fake node mechanism, before moving on to the topic of denial contradictions with fake node mechanism itself. It was Kannhavong et al. who first reported about NIAs, which are a kind of denial of service attack on the OLSR (2006).
http://TuEngr.com Page | 3
The development of blockchain based applications has accelerated significantly in recent years. These applications are being used in various fields, including concurrent IoTOS (IoT), economic facilities, standing schemes, and others. Mining produces a block, which requires a substantial amount of computer power and is also a probabilistic endeavour. While block mining is challenging, determining whether or not a block is valid is not tricky (Dennis and Owen, 2015).
2.1 BATMAN: A Brief Overview
This strategy has piqued the scientific community's curiosity. As a result, a lot of effort is done to evaluate routing efficiency under various scenarios. For example, Kulla et al. (2012)b analyze their system's performance in multiple settings and node situations (Kulla et al., 2011, 2010).
2.2 BATMAN's Attack Mitigation Scheme
A blockchain is a chain of records linked together. In addition to the date, each Block contains a hash reference to the previous Block. Each successive Block binds itself to the previous Block's hash by connecting to it, and the Blockchain is established as a result of this linking. When it comes to data manipulation, blockchain architecture has shown to be quite durable.
2.3 Trust Management in MANET via the Use of Blockchain
A distributed reputation model based on Blockchain technology was created by Peiris and colleagues (2020) to ensure trust, and it is now being tested. B4SDC is a blockchain based approach for gathering security related data in MANETs developed by several academics, including Liu et al. (2020) and other researchers.
If
Figure 1: The suggested architecture's workflow diagram. 3 Method We propose a distributed trust installation system based on blockchains throughout this article. We chose a blockchain based architecture to handle trust in the IoT based MANET ecosystem to accomplish so. Its high resource usage and extended validity time make it unsuitable for use in dynamic and latency sensitive situations. The suggested system has multiple components, as shown in Figure 1.
http://TuEngr.com Page | 4
Calculate Trust Values Elect validator & Speaker results
of delegate & speaker matches generationBlack Discardrequest Validation of Transaction Find best next hop using BATMAN protocol Continuously maintain the blockchain Yes No
http://TuEngr.com Page | 5
RouteStart
Discovery Check Node Capabilty Critariya
3.1 Step 1: Calculation of the Threshold Value
2. Buffer Management: Min 15 packets, Max 100 packets
4. Traffic Patterns, CBR or FTP CheckCapabiltyNodeCritariya Mark, Node is TransmissionforMark, Node is not for Transmission Propagaite Model Until Reach Destination Stop
This investigation was conducted to determine whether a distributed trust mechanism might be developed to improve the stability and scalability of networks. Rather than concentrating on the computation of trust value, we focus on creating the trusted network instead. The presence of an adversary near a node results in information about the attacking no de being propagated across the network, reducing the possibility of that same attacker striking again. Our proposed system uses several different discovery and belief models; however, we chose denial contradictions with a fake
Figure 2: The Flow for computing the Trust Value.
3. Energy Level: Min 30 Joules (Range 0 100 Joule)
1. Mobility: minimum speed equal to 0 and maximum speed varied from 0 to 500 m/s
An enemy node is identified in the network , and information about it is broadcast across the web for it to be removed from the network. This is made possible by the use of blockchain technology. Figure 2 illustrates the process of determining how to determine Trust Value.
∑ �������� ���� ���� �������� ���� ���� + 1���� 1 ����=1 I pick j as its MPR node to relay packets for k iterations from when j connects to I to when I calculate js TV. �������� = ��������� ∗ ���� �������� �������������������� ��������������������ℎ���������������� �������� + ���� , ��������ℎ������������������������ (1) ���� = � 1 �������� �������������������� �������� ������������������������ 0 7, ��������ℎ������������������������ (2) ���� = �max � ∑ ������������ �������� 1 ����=1 ∑ ������������+1�������� 1 ����=1 , 0.5� �������� ���������������� �������� ������������ 0.5, ��������ℎ������������������������ (3) ������������ → multipoint relay selector set. Algorithm 1. Trust Value Computation 1. Begin() 2. { 3. Routs discovery initialize, current position initialize {
http://TuEngr.com Page | 6 node mechanism (Schweitzer and colleagues, 2015) as an example of a typical scheme suited for the solution presented in this research.
As a consequence, it should be maintained at all times. Consequently, following equation 3, the value is altered. The MPR node's default value is 0.7. In the near term, it will be based on honest nodes that are not MPRs, and in the long run, it will be based on MPRs. Every node starts with a zero value but may gain the maximum trust value of "1" throughout the game. Each node has a TV value of zero when the network is created . In Equation 3, the numerator, i.e.,
As the AIMD system (Marti et al., 2000) regulates each node's Trust Value (TV), it provides clear and fair incentives and punishments for residential nodes and MANET enemies. Because of the moniker "addition and multiplication," the TVs of the node are added and multiplied together, with addition and multiplication factors () and () being used in the equations for addition and multipli cation, respectively, to accomplish this. The denial contradicts the fake node mechanism detection technique using a heuristic approach to detection. To compute a network penalty, multiply the TV of the attacker node by the 1 number, which is the harshest network penalty that may be applied. As a result, negative TV node information is propagated throughout the network. Since each resident owns the information, they may exclude particular nodes from the connection check. A trust rating of 1 signifies that the node cannot join the network. In equation 2, selfish nodes are represented by a different value. On the other hand, a functional node will contribute to the growth of the TV by increasing its value. T o guarantee that the trust level decision is fair, a high TV of MPR nodes should be maintained.
3.2 Step 2: Algorithm of dBFT
http://TuEngr.com 4. Motion = 0 <motion< 500m/s 5. Buffer_Queuemanaging = 15 < Buffer_Queue< 100 6. Vitalitynear = 0 <vitality< 100 7. Traffic flowoutline = CBR or FTP 8. } 9. If(Node ability == yes) 10. { 11. Mark node for transmission 12. } 13. Else 14. { 15. Leave the node 16. } 17. While(current position == destination0 18. { 19. Repeat (3 to 16) 20. } A collaborative approach to our security solutions is also being implemented to boost total system efficiency via collaboration. Even though MANETs (Hernandez Orallo et al., 2014) were previously classified as cooperative networks, early nodes undertake distinct detection processes for most security modes. This is illustrated in Figure 1 and is contrary to previous assumptions about c ooperative networks. In denial of contradictions with the fake node mechanism, the search is performed after each Hello interval. However, since our strategy reduces the investigation duration in proportion to the number of neighbours around the node, the synergistic impacts of near surrounding nodes may aid in lengthening the inquiry interval in some circumstances, as shown in Figure 1. Rather than evaluating nodes individually, nodes that meet the following criteria may be examined collectively, as shown in the accompanying picture (Lwin et al., 2020a).
Page | 7
It is necessary to determine the trust values before pro ceeding with the construction of the proposed model. In the case of the nodes, this is true. The model is generated when the trust values of the nodes have been computed. The selection algorithm chooses a validator node from among the candidates. After tha t, the Delegated Byzantine Fault Tolerance (dBFT) system selects a speaker from among the available candidates. The node that survives acts as a delegate for the remainder of
The first method, referred to as Algorithm 1, specifies the procedures that must be followed to calculate the trust value (TV). Line 1 has been finished with completing the route finding process and identifying the present location. On Line 2, there is a check for node capability performed. Then, as noted in Line 5, you may either select the node for transmission or leave the node undesignated for the message. This is followed by a comparison of the current location and target position. If the current location matches the target position, the procedure is repeated from step 1 through step 5 until the target position is reached.
→ Arrays of nodes eligible to become a validator
Procedure 2: Delegated_Byzantive_fault_tolerance
A popular vote selects the Validator. These are the nodes qualified to serve as validators in the network, and they are those with the highest TVs. The bully election approach (Hernandez Orallo et al., 2014) determines which node is the block creator node among a set of similar nodes. The permission of a nearby node is required for a trustworthy election, unlike a bully election. Neighbours with TVs over the threshold will send claim messages to each other. I j, TV Claim, one hop count) prKeyi j's beliefworth and single hop neighbour total are placed into single hop counter, correspondingly. The claim message is signed using I prKeyi's private and i's public keys. Also, any node with TVs over the threshold may broadcast a claim message to the whole network by piggybacking on a transmission control message (TCM). The V alidator is the letter j if all of the following conditions are satisfied. This node has the highest TV and no false allegations against it. No fraudulent claims were made against nodes I and j. Unable to pick between dual or additional nodes with a similar belief value, a claim message has an extra one hop count. In this case, the Validator is the node with the most one hop counts. By broadcasting a claim message for node j, node I save energy. The most frequent voter should be rewarded since MANET is resource intensive.It's a process. A decision method is used to choose specific nodes from the list of accessible nodes to function as validation nodes. Assigning a speaker node and all other functions to representations simplifies the procedure. Inquiry representatives get hashed values for each outstanding accusation from the speaker. Next, a novel chunk of privileges or communications is supplementary if the comparison between the speaker and the representative is more than 68.9% algorithm three delegated authority.
TV Array of belief number of hig_hours
ReturnBullyV{Begin()=max(TV)election(V);coordination validator
V}
http://TuEngr.com Page | 8 the network's operations. Following that speaker's presentation, delegates are handed a proposal once the claims have been validated and hashes have been created. Algorithm 2 shows the dBFT steps.
Algorithm 3: Delegation Process 1. Begin()
It's a process. A decision method is used to choose certain nodes from the list of accessible nodes to function as validation nodes. Assigning a speaker node and all other functions to representations simplifies the procedure. Inquiry representatives get hashed values for each outstanding accusation from the speaker. Next, a novelchunk of prerogatives or communications is additional if the comparison between the speaker and the representative is more than 68.9 percent algorithm 3 delegated authority.
} 11. End()
It is possible to summarise the BATMAN protocol in the following way in a simplified form: The initial message, also known as the OGM, is sent to the whole network by each node to alert its neighbours that it has been discovered and is functioning properly. The IP and UDP overhead associated with the transmission is typically 52 bytes. To begin with, the OGM has the following data: the sender's address, the node that delivered the packet, the time between packets (TTL), and the sequence number. The network selectively floods the overlay mesh network (OGM) , notifying receiving nodes of other nodes' existence and letting them connect with them. The fact that an X node obtains its OGM from another node implies a Y node. It occurs when one of node Y's one hop neighbours requests OGM from the other node. Node X receives messages quicker and more reliably with several single hop neighbours. This improves throughput and reliability. The neighbour must transfer data via the network to connect with the distant node. Determining this neighbour as the optimal next hop for the message sender at that moment, the protocol configures its routing table
10. 3.3 Step 3: Block Authentication and Block Creation
3.4 BATMAN Extended Version (EBATMAN)
http://TuEngr.com Page | 9 2. { 3. CN = Validators // CN contains array of validators 4. Choicepresenter S from CN, and cogitate all remains as representatives D. 5. S is answerable for buildingnovelchunk from to comeprerogatives. 6. S confirm and analyze hash 7. D validate(outcomes of S) 8. D portion&relate (results of S) 9. IF (sk_P ≥ 68.9%) Chunksupplementary{}Else{Rejectinvitation}
The investigational findings acquired via the suggested technique are described in this segment. Experiment 1: Results Network performance is measured by characteristics including pdr,
First, a lightweight nodule is deployed to the system, able only to download data from the blocker's header. This is the first step. Although a new node enters the network as a light node, it may quickly create transactions for attacker detection/TV calculation. Until a full node becomes available, the mass node actions as a temporary complete node for the communicate chunk headers.
Full and lite nodes are the two kinds of nodes in a blockchain ecosystem. Both maintain the whole Blockchain, but the latter relies significantly on the information provided by the entire node community to work successfully. This is due to the nature of MANETs. A new node is allowed admittance to the network's blockchain information.
Algorithm 4 : The Better Approach to Mobile Ad hoc Networking Routing Protocol Algo: {Begin()
http://TuEngr.com Page | 10 to use this neighbour. As seen in Process 4, the various stages of The Improved Method to IoT based MANET protocol are described.
2. Neighbours re Broadcast O_G_M’S to prove their exist ence O_G_M’s areoringator msg’s of size 52 byte. Counting IP SUDP over_head 3. If(node_neighbour > 1) 4. { 5. Best nop node= current node; 6. } 7. Else { 8. Repeated (1,3) 9. } 10. } 11. End() Blocks are organized in a certain way. The block structure must also contain information about how the representative node configures the Block. A block of transactions recorded in a blockchain system binds the network together. Because the hash value is produced directly from the transaction data, it must provide a hash value using the SHA 256 technique in the Block. As a consequence of this, instability is brought into the blockchain ecosystem.
3.5 Maintenance on the Block
4 Result a nd Discussion
1. Respectively node Brodcost O_G_Ms to her neighbours
4.3 Outcomes
This evaluation of the planned method and the current algorithm is shown next . The simulation parameters are presented in Table 1.
http://TuEngr.com Page | 11 average e2e latency, setup throughput, and vitality use. This outcome subdivision contains 105 moveable nodes connected to the network for 105 mobile nodes.
4.2
Throughput:
Average end to end delay: The average end to end delay (AED) is the total time it takes for all data chunks to transit from the source nodes to the base station. The term "end to end delay" refers to the time it takes a packet to transit from its point of origin to its point of destination.
Network Size 1km x 1km PropagationModel Two ray ground Connection Protocol UDP/TCP Mobility Model Random Way Point Traffic type Constant Bit (CBR)/FTPRate Channel Type Wireless Channel Source/Destination Random Antenna Model Test parabolic Data packet size 256 bytes Simulation time 200 Second Data packet size 256 bytes, 512 bytes, and 1024 bytes Language Tcl,oTcl,C++,ScriptingAWK Simulation Protocol BATMAN,BATMANE No. ofNodeMalicious 5% out of the scenario Simulation Scenario (No. of Mobile Nodes) 25,50,75,100,125 Channel Type Wifiphy Standard
Parameters Specification Parameters Specification Network Simulator NS 2, Version 2.35 PHY/MACProtocol IEEE 802.11
The throughput (TP) of a network equals the total of the data sent to the based station divided by the time it takes to simulate the network.
The Extended BATMAN algorithm is compared to the present BATMAN protocol. This study's average throughput and E BATMAN approach are shown in Figure 3. Figure 3 explain throughput, units of throughput are kbps. We have to compare three scenarios on different numbers of nodes. Scenarios like BATMAN _MANET Normal Scenario, BATMAN_MANET Under Attackers, BATMAN_MANET [Lwin MT [2020b]] with Attackers, Proposed _BBATMAN_MANET with Attackers. Nodes like 25, 50,75,100,125 are compared to all these scenarios. In normal scenarios maximum of 1024 kbps and a minimum of 942 kbps of throughput. In Under Attackers scenarios maximum of 226 kbps and a minimum of 215 kbps of throughput. In [Lwin MT [2020b]] with Attackers scenarios maximum of 1032 kbps and a minimum of 978 kbps of throughput. In Proposed
Performance Calculation
Table 1: Simulation Constraints
4.1 NS2 Simulation Constraints
Packet delivery ratio: The PDR is the fraction of informations packets transferred to packets received at a certain time (Taha et al., 2017).
http://TuEngr.com Page | 12 _BBATMAN_MANET
1400120010008006004002000 25 50 75 100 125 KBPS Number of Nodes
BATMAN _MANET BATMAN_MANETScenario Under BATMAN_MANETAttackers [Lwin MT [2020b]] with Attackers _BBATMAN_MANETProposed with Attackers
with Attackers scenarios maximum of 1245 kbps and a minimum of 1235 kbps of throughput.
Figure 4 explains e2e delay, units of end to end delay are milliseconds. We have to compare three scenarios on different numbers of nodes. Scenarios like BATMAN _MANET Normal Scenario, BATMAN_MANET Under Attackers, BATMAN_MANET [Lwin MT [2020b]] with Attackers, Proposed _BBATMAN_MANE T with Attackers. Nodes like 25, 50, and 75,100,125 are compared to all these scenarios. In normal scenarios maximum of 0.26 ms and a minimum of 0.21ms of e2e delay. In Under Attackers scenarios maximum of 12ms and a minimum of 10ms of e2e delay. In [Lwin MT [2020b]] with Attackers scenarios maximum 0.31ms and minimum 0.28ms of e2e delay. In Proposed _BBATMAN_MANET with Attackers scenarios maximum of 0.17 ms and a minimum of 0.15 ms of e2e delay.
Normal
12108642014 25 50 75 100 125 MS Number of Nodes
_MANET_Normal_ScenarioBATMANBATMAN_MANET[2020b]]_AttackersBATMAN_MANETs_BBATMAN_MANET_AttackerProposed[LwinMT_Attackers
Figure 3: Average throughput (kbps) under attack
Figure 4: Average e2e delay test results
http://TuEngr.com Page | 13
100%80%60%40%20%0% 25 50 75 100 125 % Number of Nodes Proposed _BBATMAN_MANET with Attackers BATMAN_MANET [Lwin MT [2020b]] with Attackers BATMAN_MANET Under Attackers BATMAN _MANET Normal Scenario 25002000150010005000 PDR(%) Throughput (Kbps) Delay(s) Parameters MTExistingProposed_Method_ProtocolMethod_Protocol[Lwin[2020b]]]
Figure 5 explain about Packet Delivery Ratio (PDR), units of PDR are percent (%). We have to compare three scenarios on different numbers of nodes. Scenarios like BATMAN _MANET Normal Scenario, BATMAN_MANET under Attackers, BATMAN_MANET [Lwin MT [2020b]] with Attackers, Proposed _BBATMAN_MANET with Attackers. Nodes like 25, 50, 75, 100, and 125 are compared to all these scenarios. In normal scenarios maximum of 98.84 % and a minimum of 94.72 % of the Packet Delivery Ratio. In Under Attackers scenarios maximum of 11.39 % and a minimum of 9.94 % of Packet Delivery Ratio. In [Lwin MT [2020b]] with Attackers scenarios maximum of 88.91 % and a minimum of 86.38 % of Packet Delivery Ratio. In Proposed _BBATMAN_MANET with Attackers scenarios maximum of 98.88 % and a minimum of 94.84 % of Packet Delivery Ratio.
Figure 6 show s the results of comparing parameters such pdr (%), latency (s) and throughput (kbps). The suggested method outperforms earlier work (Lwin et al., 2020b) on all criteria. 5 Conclusion This research suggested a unique technique for generating distributed trust value in MANETs, which is described in detail below. The blockchain idea was applied in the Better Approach to Mobile Ad hoc Networking protocol, dubbed Extended the Improved Method to 98.84 96.38 95.38 94.21 94.7211.39 11.88 10.24 9.19 9.94 88.91 88.14 88.04 86.08 86.38 98.88 96.46 95.41 94.29 94.84
Figure 6: An evaluation of the proposed E BATMAN protocol compared to the current BATMAN protocol using evaluation parameters (Lwin et al., 2020b).
Figure 5: Average Packet Delivery Ratio under Attack.
All information is included in this study.
Kulla E, Ikeda M, Hiyama M, Barolli L, Miho R . Performance evaluation of olsr and batman protocols for vertical topology using indoor stairs testbed. In2011 International Conference on Broadband and Wireless Computing, Communication and Applications, IEEE . 2011:159 66.
Cordova D, Laube A, Pujolle G, et al. Blockgraph: A blockchain for mobile ad hoc networks. In 2020 4th Cyber Securit y in Networking Conference (CSNet), IEEE. 2020:1 8
7 References
Eschenauer L, Gligor VD, Baras J (2002) On trust establish ment in mobile ad hoc networks. In: International workshop on security protocols, Springer .2002:47 66. Hernandez Orallo E, Olmos MDS, Cano JC, Calafate CT, Manzoni P Cocowa: A collaborative contact based watchdog for detecting selfish nodes. IEEE transactions on mobile computing. 2014;14(6):1162 75. Johnson D, Ntlatlapa NS, Aichele C (2008) Simple prag matic approach to mesh routing using batman.2nd IFIP International Symposium on Wireless Communications and Information Technology in Developing Countries, CSIR, Pretoria, South Africa Kannhavong B, Nakayama H, Kato N, Nemoto Y, Ja malipour A. Analysis of the node isolation attack against olsr based mobile ad hoc networks.In 2006 International Symposium on Computer Networks, IEEE, 2006:30 5.
Kotla R, Dahlin M. High throughput byzantine fault tolerance. In 2004International Conference on Dependable Systems and Networks, IEEE. 2004:575 84.
Dennis R, Owen G Rep on the B lock: A next generation reputation system based on the Blockchain. In 2015 10th International Conference for Internet Technology and Secured Transactions (ICITST), IEEE .2015:131 8.
Mobile Ad hoc Networking (Enhance BATMAN) . The model outcomes indicated that a distributed trust value gives high network safety. Using the proposed E BATMAN protocol ensures no data is lost even if the attacker moves and attacks other network nodes, lowering overall complexity. The network is safe. Aside from that, respectively node's role is summary. Our MANET based blockchain based proposed system is also consistent and accessible. We want to examine our suggested solution in MANETs with various routing protocols in the future.
http://TuEngr.com Page | 14
6
Clausen T, Jacquet P, Adjih C, Laouiti A, Minet P, Muhlethaler P, Qayyum A, Viennot L. Optimized link state routing protocol (OLSR). 2003. http://hal.inria.fr/inria -00471712
Availability of Data and Material
Kulla E, Hiyama M, Ikeda M, Barolli L. Performance comparison of OLSR and BATMAN routing protocols by a MANET testbed in stairs environment. Computers & Mathematics with Applications. 2012a;63(2):339 49.
Aublin PL, Mokhtar SB, Que'ma V Rbft: Redundant byzantine fault tolerance. In 2013 IEEE 33rd International Conference on Distributed Computing Systems 2013: 297 306
Kulla E, Ikeda M, Barolli L, Miho R. Impact of source and destination movement on manet performance considering batman and aodv protocols. In 2010 International Conference on Broadband, Wireless Computing, Communication and Applications, IEEE . 2010:94 101
2020;20(3):698
.
.
Marti S, Giuli TJ, Lai K, Baker M Mitigating routing misbehaviour in mobile ad hoc networks. In: Proceedings of the 6th annual international conference on Mobile computing and networking, 2000;255 265 NaOmar M, Challal Y, Bouabdallah A. Certification based trust models in mobile ad hoc networks: A survey and taxonomy. Journal of Network and Computer Applications 2012;35(1):268 286
Sanchez Iborra R, Cano MD, Garcia Haro J . Performance evaluation of batman routing protocol for voip services: a qoe perspective. IEEE Transactions on Wireless Communications 2014;13(9):4947 4958
Neha Khandelwal is a Research Scholar at the Department of Computer Science Engineering, ITM University, Gwalior, India She got a Masters's degree in Artificial Intelligence from VaishnavCollege of Engineering, Indore, India. Her research is related to Computer Applications and Modern Computer Technology Dr.Shashikant Gupta is an Associate Professor at the Department of Computer Science Engineering, ITM University, Gwalior, India He got his Master 's and Ph.D. degrees in Information Technology in Engineering. His research encompasses Computer Applications and Modern Computer Technology Note: This article is an extended work of the previous article entitled “Blockchain based BATMAN protocol using Mobile ad hoc Network (MANET) with an Ensemble Algorithm” https://doi.org/10.21203/rs.3.rs 673489/v1
Kulla E, Ikeda M, Oda T, Barolli L, Xhafa F, Takizawa M Multimedia transmissions over a manet testbed: problems and issues. In the6th International Conference on Complex, Intelligent, and Software Intensive Systems, IEEE.2012b:141 147.
Peiris P, Rajapakse C, Jayawardena B. Blockchain based distributed reputation model for ensuring trust in mobile adhoc networks. In 2020 International Research Conference on Smart Computing and Systems Engineering (SCSE), IEEE.2020:51 56.
Perkins C, Royer EM, Das S. Ad hoc on demand distance Vector routing (AODV). 2003 http://media.gradebuddy.com/documents/3107203/4e440567 1f3b 4e47 8585 8d2c24b05758.pdf
Laube A, Martin S, Al Agha K. A solution to the split & merge problem for blockchain based applications in ad hoc networks. In the 8th International Conference on Performance Evaluation and Modeling in Wired and Wireless Networks (PEMWN), IEEE 2019:1 6
Lwin MT, Yim J, Ko YB Blockchain-based lightweight trust management in mobile ad-hoc networks.Sensors
Machado C, Westphall CM. Blockchain incentivized data forwarding in manets: Strategies and challenges. Ad Hoc Networks. 2021;110:102321
Liu G, Dong H, Yan Z, Zhou X, Shimizu S. B4SDC: A blockchain system for security data collection in MANETs. IEEE Transactions on Big Data. 2020.DOI: 10.1109/TBDATA.2020.2981438
http://TuEngr.com Page | 15


Paper ID: 13A6S Volume 13 Issue 6 Received 1 January 2022 Received in revised form 4 May Accepted2022 12 May 2022 Available online 19 May 2022 Keywords: Centella
Disciplinary: Plant Sciences, Herbal Medicine. ©2022 INT TRANS J ENG MANAG SCI TECH.
*Corresponding (Email: nattapong@tistr.or.th). yieldgrowthMadecassocideElicitors;Asiatica;Asiaticoside;;Centellarate;Centella.
Centella Asiatica , or Asiatic pennywort, is a herb that is listed on the Thai Ministry of Public Health’s National Herbal Drug List. All parts of the plant are used as medicines and other health products. In traditional medicine practice, it has been used to treat internal contusions, fortify the heart, as an analeptic, to treat exhaustion and fatigue, promote micturition, promote kidney International Transaction Journal of Engineering, Management, & Applied Sciences & Technologies http://TuEngr.com
Abstract Centella Asiatica is a medicinal plant distributed throughout tropical and sub tropical areas. It has been used extensively for the treatment of nervous disorders and skin diseases due to its contents of bioactive compounds such as asiaticoside, madecassoside, flavonoids , etc. The fact that there is a huge demand in the pharmaceutical and cosmetic preparation markets led to our interest in increasing Centella biomass and bioactive constituents per planting area. This study focused on using different elicitors (salicylic acid, yeast extract and malt extract) for the enhancement of biomass and content of two main bioactive components (asiaticoside and madecassoside) in five accessions of Centella (Nakhonpathom, Prachinburi, Rayong, Ubonratchathani and Nakhonsrithammarat) growing in Khlong Luang, Pathum Thani. The findings exhibited that the accession Nakhonpathom provided the highest biomass yield and accumulation of two bioactive compounds (madecassoside and asiaticoside) when 1 mg/L salicylic acid was applied two times at 7 day intervals and 7 days ahead of harvesting.
Page | 1 ©2022 International Transaction Journal of Engineering, Management, & Applied Sciences & Technologies ISSN 2228 9860 eISSN 1906 9642 CODEN: ITJEA8 Influence of Varieties and Elicitors on Biomass and Bioactive Compound Yield of Centella Asiatica Growing in Pathumthani Khanok-on Amprayn1, Nattapong Chanchula1*, Anan Piriyapattarakit1 , Napassawan Sunthorn1, and Siriporn Premrit1
Innovative
Cite This Article: Amprayn, K., Chanchula, N., Piriyapattarakit, A., Sunthorn, N., and Premrit, S. (2022). Influence of Varieties and Elicitors on Biomass and Bioactive Compound Yield of Centella Asiatica Growing in Pathumthani. International Transaction Journal of Engineering, Management, & Applied Sciences & Technologies, 13(6), 13A6S, 1 10. http://TUENGR.COM/V13/13A6S.pdf DOI: 10.14456/ITJEMAST.2022.124
1 Introduction
1Expert Center of Agriculture, Thailand Institute of Scientific and Technological Research (TISTR), Khlong Ha, Khlong Luang, Pathumthani, THAILAND.
Author

2 Research Problem & Research Objective
Elicitors are substances that stimulate plants’ defense mechanisms by stressing them and thereby cause them to synthesize more secondary metabolites (Yodyothi, 2014; Kundu et al., 2016).
For the production of raw materials for herbal products, it is important to have both high yields and good quality. That means you should choose a variety of accession of plant s that is suitable for the growing area, use appropriate production technology to maintain safety and achieve high harvest volume per unit area, and also find ways to make sure the plants contain high volumes of active substances that are desired. This research is about using safe and easily available elicitors on different accessions of Centella in order to recommend a production system that can supply high quality raw materials for the production of health and beauty products. This study emphasizes the results of 3 kinds of elicitors on the yield and secondary metabolite content of 5 accessions of Centella Asiatica
There have been several studies about the use of different kinds of elicitors to increase secondary metabolites in Centella . For example, exposure to 100 µM salicylic acid for 10 days stimulated the expression of CabAS ( the gene responsible for triterpenoid synthesis ) in Centella cells by three times compared to control (Loc et al., 2016). It was also reported that the use of methyl jasmonate (MJ) and yeast extract as elicitors could stimulate asiaticoside production by 1.5 and 1.4 times (Kim et al., 2004). You can see that besides choosing the most appropriate accession of Centella and cultivating it in the proper season, the use of elicitors is another way to maximize the accumulation of important secondary metabolites in Centella. This can be a way to produce high quality raw materials for the herbal medication and cosmetics indus tries.
http://TuEngr.com Page | 2 function, and treat skin disease and enhance wound healing (Mingmuang, et al, 2020). For beauty treatments, Centella can be an ingredient in products including skin creams, facial cleansing gels, shampoo, soap, and toner. The phytochemicals naturally found in Centella are said to help reduce black spots and scars, promote the growth of new skin cells and tissues, and nourish hair (Panya, 2018). The important bioactive constituents of Centella are mainly in the triterpenoid glycoside group, including asiaticoside, madecassoside, asiatic acid and madecassic acid (Tongekkaew, 2013 ) . For Centella cultivation, the main emphasis has been on yield and growers tend to select accessions that are high yielding in their area. However, the high yielding accessions may not have the highest content of bioactive components, and in fact, the opposite may be true. A study that collected and tested growing several accessions of Centella from different parts of Thailand and quantified the asiaticoside content in each by Piriyapatarakij (2008) found that the 4 accessions that contained the most asiaticoside were Nakhonsrithammarat, Prachinburi, Rayong, and Ubon Ratchathani. When grown in the hot season, Nakhonsrithammarat and Ubonratchathani accessions contained the most asiaticoside, and when grown in the rainy season, Rayong and Ubonratchathani contained the most asiaticoside.
vessels measuring 20 x 25 x 15 cm. were filled with a 1:1 mixture of peat moss and coarse sand. Four Centella stolon sections were planted in each vessel and the vessels were arranged in the shade net house. Basic compound formula chemical fertilizer (16 16 16) was applied at the rate of 1 g per vessel each week. The planting vessels were watered once a day. Thirty days after planting, the elicitor formulas were applied by spraying to totally cover the above ground parts of the plants. This was followed 7 days later by second spraying. Five days after the second elicitor application, plant growth data were collected by measuring the leaf width, leaf length, number of leaves in each vessel, and total leaf area per vessel. Seven days after the second elicitor application, the entire above ground parts of the plants were harvested by cutting the stems about 1 cm above the soil surface. Then the plant's fresh weight and dry weight per vessel were measured. The dried plants were ground to powder and subject to chemical distillation using a column separation method modified from Dorni et al. (2017). The amounts of asiaticoside (AS) and madecassoside (MD) were analyzed by HPLC. An HPLC column reverse phased C18 method was used with the mobile phase consisting of methanol:acetonitrile:H2O (1:1:1) at the rate of 1 ml/minute. The wavelength of 210 nm was used to detect the amount of AS and MD in each sample.
Materials and Methods
4.1.1 High Yield and Fastest Growing Accessions
Data on plant yield showed that at harvest, Nakhonpathom accession had the highest fresh weight accumulation at 136.16 g per vessel, followed by Ubonratchathani and Nakhonsrithammarat at 127.99 g and 126.97 g per vessel, while Rayong averaged 119.20 g per vessel, and Prachinburi had the lowest fresh weight at 101.04 g per vessel. This was also reflected in the data for average dry weight per vessel, where Nakhonpathom and Ubonratchathani had the highest dry weight, ranging from 10.3 10.8 g per vessel, while all the other accessions had an average dry weight of less than 10
The experiment was performed from June to August 2021 at the shade net house test field of the Thailand Institute of Scientific and Technological Research (TISTR) in Khlong Ha Sub district, Khlong Luang District, Pathum Thani Province. The experiment was a 5 x 4 factorial experiment in CRD with 3 repetitions. The factors were factor a: Centella accession, consisting of Nakhonsrithammarat (NS), Prachinburi (P), Rayong (R), Nakhonpathom (NP) and Ubonratchathani (U), and factor b: elicitor type and concentration, consisting of no elicitor or control (C ), salicylic acid (SA), yeast extract (YE) and malt extract (ME) at the concentrations of 1 mg , 1 g and 10 g per liter of Plantingwater.
http://TuEngr.com Page | 3
Centella G rowth R ate and Y ield
3
Ubon Ratchathani accession had large leaves and the largest leaf area per vessel at 41.12 cm2. The second largest was Nakhonpathom accession, followed by Nakhonsrithammarat, Rayong and Prachinburi, in that order. Rayong produced more leaves than other accessions, with an average of 93.5 leaves per vessel.
4 4.1Results
http://TuEngr.com Page | 4 g per vessel. Prachinburi accession had the lowest plant dry weight. You can see that Nakhonpathom’s average fresh and dry weight s were 1.3 and 1.8 times those of Prachinburi, which was the lowest performing in terms of yield ( Table 1 ).
Figure 1: Fully grown leaves of the tested accessions of Centella Asiatica (1) Rayong (2) Ubonratchathani (3) Prachinburi (4) Nakhonsrithammarat and (5) Nakhonpathom.
2) 3) 4) 5)1)
The application of elicitors had an effect on Centella leaf generation. Spray application of SA solution at a concentration of 1 mg /L for 2 times, 7 days apart, resulted in the greatest number of leaves when Centella was harvested 7 days after the second spray application. The plants in this treatment group had the most leaves per unit area at 86 leaves/500 cm2, which was 1.2 times more than the control plants (Table 1 ).
4.1.3 Combined Influence of Accession and Elicitor on the Growth and Yield Per Unit Area of Centella Comparing all the accessions tested, Nakhonpathom had the overall best growth and yield. The application of elicitors tended to have no effect or in some cases tended to restrict the growth of Centella, with the exception of SA at the concentration of 1 mg /L, which resulted in a slight (0.1 times) increase in leaf area in Nakhonpathom accession. However, when applied at the higher concentration of 1 g /L, almost all the elicitors, except for ME, resulted in a decrease of fresh weight by 0.03 0.18 times. Similarly, in Rayong and Nakhonsrithammarat we recorded only an increase in the number of leaves or leaf areas when elicitors were applied. In Ubon Ratchathani accession, the application of YE at the concentration of 1 g/L resulted in increased growth and 0.12 times greater yield. In Prachinburi, which was the lowest yielding accession overall, the use of all 3 kinds of elicitors helped increase growth and yield about 0.08 0.24 times. SA at a concentration of 1 mg /L had the greatest positive effect on the growth and yield of Prachinburi ( Tables 1 and 2).
Elicitor Effects on Centella Growth and Yield
4.1.2


ns
P
when
(from
Thani
Table 2: Comparison
*
the
Total leaf area, number of leaves, fresh weight, dry weight, and amount of bioactive compounds madecassoside and asiaticoside in 5 accessions of Centella Asiatica grown with 3 different kinds of elicitors applied (and control) Treatment Per 500 cm2 growing area contentMD (mg /g weightdry ) contentAS (mg /g weightdry ) Totalarealeaf (cm2 ) ofNumberleaves weightFresh(g) weightDry (g) accession (a) a1 = NP 34.70b 77.7b 136.16a 10.796a 3.22ab 2.40b a2 = P 22.74d 78.2b 101.04c 5.945c 3.45ab 3.98a a3 = R 24.69d 93.5a 119.20b 8.969ab 4.00a 3.60a a4 = U 41.12a 68.0b 127.99ab 10.278a 2.52b 3.13ab a5 = NS 29.47c 70.5b 126.97ab 7.936ab 2.73b 2.20b elicitor (b) b1 = no elicitor 30.06 72.7b 123.89 9.160 2.81 2.74 b2 = ME 1 g/l 29.95 76.4ab 119.29 8.513 2.89 2.95 b3 = SA 1 mg/l 31.84 86.3a 126.80 9.641 3.55 3.27 b4 = YE 1 g/l 30.30 74.9b 119.11 7.825 3.47 3.29 a1b1 34.57bcd 71.3bcd 142.77a 12.033a 2.25cd 1.88efg a1b2 33.72bcde 79.3bcd 142.62a 11.583abc 1.59d 1.57fg a1b3 37.96abc 86.7bcd 138.57ab 11.690ab 5.98a 4.17ab a1b4 32.47bcdefg 73.3bcd 120.70abcde 7.877cdef 3.06bcd 2.00defg a2b1 20.01i 73.3bcd 91.29e 4.837f 3.07bcd 3.75bcde a2b2 21.85hi 78.0bcd 98.21de 6.183ef 3.07bcd 3.84bcd a2b3 23.20hi 90.7ab 113.68abcde 7.927bcdef 2.46cd 2.41bcdefg a2b4 25.90fghi 70.7bcd 100.96cde 4.833f 5.15ab 5.90a a3b1 25.54ghi 88.0bc 128.81abcd 10.273abcd 4.09abc 3.50bcde a3b2 26.89efghi 85.3bcd 109.59abcde 7.457def 3.83abcd 3.41bcdef a3b3 23.23hi 110.7a 130.56abcd 10.753abcd 4.29abc 3.91bc a3b4 23.09hi 90.0ab 107.84bcde 7.393def 3.80abcd 3.58bcde a4b1 41.75a 65.3d 124.01abcde 10.160abcd 2.18cd 2.27cdefg a4b2 41.77a 66.7cd 123.45abcde 9.730abcde 2.47cd 3.00bcdefg a4b3 42.08a 70.7bcd 125.83abcd 9.733abcde 2.57cd 3.73bcde a4b4 38.87ab 69.3bcd 138.66ab 11.490abc 2.87bcd 3.50bcde a5b1 28.45defgh 65.3d 132.56abc 8.497abcdef 2.48cd 2.30bcdefg a5b2 25.51ghi 72.7bcd 122.56abcde 7.613def 3.52bcd 2.91bcdefg a5b3 32.73bcdef 72.7bcd 125.38abcd 8.100bcdef 2.45cd 2.12cdefg a5b4 31.17cdefg 71.3bcd 127.38abcd 7.533def 2.49cd 1.46g F test (a x b) * * * * * * C.V. (%) 14.18 17.49 16.65 26.18 43.28 37.30 NP= Nakhonpathom accession; P= Prachinburi accession; R= Rayong accession; U= Ubonratchathani accession; Nakhonsrithammarat accession = no statistically significant difference, = different to a statistically significant degree at <=0.05 of the effects of different elicitors on growth yield of the tested accessions of Centella Asiatica grown in house during rainy season in Pathum Province data in
and
http://TuEngr.com Page | 5
Table 1) accession Leaf area Number of leaves accumulationBiomass Dry weight best C M S Y C M S Y C M S Y C M S Y NP ↓ ↑ ↓ ↓ ↓ ↓ ↓ ↓ C* P ↑ ↑ ↑ ↑ ↑ ↑ ↑ ↑ ↑ S R ↑ ↓ ↓ ↓ ↑ ↑ ↓ ↓ ↓ ↓ C U ↑ ↑ ↑ ↑ ↑ ↓ ↓ ↑ Y NS ↓ ↑ ↑ ↑ ↑ ↑ ↓ ↓ ↓ ↓ ↓ ↓ C C = control (no elicitor); M= malt extract; S= salicylic acid; Y= yeast extract no statistically significant difference from control; * highest yield ↑ more than control; ↑ greatest increase; ↓ less than control; ↓ least compared to control
Table 1:
NS=
a shade net
4.2
Bioactive Compound Accumulation
Accession madecassoside asiaticoside recommendation C= control (no elicitor); M= malt extract; S= salicylic acid; Y= yeast extract; MD= madecassoside; AS= asiaticoside no statistically significant difference from control; * highest amount of bioactive compound ↑ more than control; ↑ the most; ↓ less than control; ↓ the least compared to control
Accessions with High Levels of Bioactive Compounds
4.2.1
C M S Y C M S Y MD AS NP ↓ ↑ ↑ ↓ ↑ ↑ S* S P ↓ ↑ ↓ ↑ Y Y* R ↓ ↓ ↓ ↑ C/S S U ↑ ↑ ↑ ↑ Y S/Y NS ↑ ↓ ↓ M C/M
4.2.2 Effect of Elicitors on the Accumulation of Bioactive Compounds
Application of all the elicitors that we tested resulted in greater accumulation of both MD and AS, with average levels of 2.89 3.55 mg/g dry weight for MD and 2.95 3.29 mg/g dry weight for AS. Increases in bioactive compounds tended to be the highest when SA was applied, but there was no statistically significant difference compared to the control (Table 1 ).
http://TuEngr.com Page | 6
Of the 5 accessions and 3 elicitors we tested, Nakhonpathom contained the most MD (5.98 mg/g dry weight ) when treated with salicylic acid (SA) and Prachinburi contained the most AS (5.90 mg/g dry weight ) when treated with yeast extract (YE )
4.2.3 Combined Influence of Accession and Elicitor on Bioactive Compound Accumulation
Looking at each accession, Nakhonpathom responded the best when sprayed with SA, producing 5.98 mg/g dry weight MD and 4.17 mg/g dry weight AS, while Prachinburi, Rayong, Ubonratchathani and Nakornsrithammarat contained the most bioactive compounds when sprayed with YE, SA, YE and ME, respectively (5.15 mg/g dry weight MD and 5.90 mg/g dry weight SA, 4.29 mg/g dry weight MD and 3.91 mg/g dry weight SA, 2.57 mg/g dry weight MD and 3.73 mg/g dry weight SA, and 3.52 mg/g dry weight MD and 2.91 mg/g dry weight SA, respectively) (Tables 1 and 3 ). Table 3: Comparison of the effect of different elicitors on the accumulation of asiaticoside and madecassoside in 5 different accessions of Centella Asiatica grown in a shade net house during the rainy season in Pathum Thani Province (from data in Table 1)
Rayong was the accession that had the highest levels of both bioactive compounds tested for madecassoside (MD) and asiaticoside (AS) at 4.00 and 3.60 mg /g of dry weight. The second highest producer was Prachinburi accession at 3.45 and 3.98 mg /g of dry weight. The amounts of MD and AS detected in Nakhonpathom accession and Ubonratchathani accession were 3.22 and 2.40 mg/g dry weight and 2.52 and 3.13 mg /g of dry weight, respectively, while the lowest amount of bioactive compounds (2.73 and 2.20 mg /g of dry weight) were found in Nakhonsrithammarat accession (Table 1 ) .
For the greatest fresh weight harvest per unit area, Nakhonpathom accession is recommended and there is no need to use an elicitor. Alternatively, if you grow Ubonratchathani accession and spray ME at the concentration of 1 g/L two times, 7 days apart, and wait 7 days after the second spraying to harvest, you can expect an approximately 12% increase in fresh weight. This is in agreement with the report of Kundu et al. (2016) who found that adding 1 mg/L of ME along with 6 benzyl amino purine (BAP) to the nutrient medium resulted in the greatest number of leaves when 5 accessions of Centella Asiatica were raised in tissue culture, and the overall growth was 2 4 times greater when compared to adding SA or JA (jasmonic acid) together with BAP to the medium.
The most important secondary metabolites in Cerntella for making herbal medicine and cosmetics products are madecassoside (MD) and asiaticoside (AS). MD is the most prevalent triterpene found in Centella extract. It is used to delay skin aging and promote wound healing as well as fight infection and it has anti psoriasis effects because of its lipid oxidation prevention
of Single Factors and Combined Factors on Fresh Weight Yield
5.2 Influence of Single Factors and Combined Factors on Bioactive Compound Content
http://TuEngr.com Page | 7 5 5.1DiscussionInfluence
Considering only the fresh weight of the above soil portion of Centella plants grown in the rainy season (June August) in Khlong Luang District, Pathum Thani Province, Nakhonpathom accession had the highest fresh weight per unit area, followed by Ubonratchathani and Nakhonsrithammarat accessions, which had about 6 7% less fresh weight than Nakhonpathom accession.Our results are different from those of the Chachoengsao Agricultural Occupation Promotion and Development Center which tested Rayong, Chac hoengsao, Nakhonpathom, Nongbualampoo and Nakhonsrithammarat accessions in Phanomsarakham District, Chachoengsao Province. They reported that Nongbualampoo and Rayong accessions were the most suitable for growing in their area. This may be related to the environmental, climatic and soil conditions as well as different fertilizer applications ) Khumkan, S. 2019 (. When Jai aye )2013) tested growing 8 accessions in a shade net house with 60% shading, the highest yield was obtained from Trat accession, followed by Chiangrai, Phayao, Phetburi, Nakhonpathom, Ratchaburi, Rayong and Chantaburi accessions, in that order.
For general Centella cultivation when growers are not selecting a specific accession for fresh harvest, it is not necessary to use any elicitor because none of the elicitors had a significant effect on the fresh weight of the above ground portion of Centella in this experiment.
Influence of Elicitors
5.1.1
5.1.2
Influence of Accession Combined with Elicitor
Influence of Accession
Combined Influence of Accession and Elicitor
5.2.3
Influence of Elicitors
The application of elicitors tends to promote the accumulation of bioactive compounds in Centella. In our experiment, SA at the concentration of 1 mg /L had the greatest effect. This is similar to the findings of Loc et al. (2017) who found that treatment with SA 100 µM helped stimulate madecassoside synthesis in Centella cells.
http://TuEngr.com Page | 8 properties and its ability to promote collagen synthesis and stimulate blood vessel formation )Tan et al., 2021). Another of the important phytochemicals found in Centella, AS, has antioxidant properties that make it quite effective in reducing the effects of harmful UV A radiation that causes cell degradation. AS works together with MD and Asiatic acid to stimulate the formation of type 1 collagen, the most common type of collagen in the human body that promotes flexibility and is key in wound healing ) Kwon et al., 2014).
5.2.2
When elicitors were sprayed on the different Centella accessions to stimulate a greater accumulation of bioactive compounds, Nakhonpathom accession had the greatest MD and AS content (5.98 and 4.17 mg /g dry weight ( when treated with SA. The second greatest secondary metabolite content was observed in Prachinburi accession at 5.15 and 5.90 mg /n dry weight when treated with YE. These figures were 17 28% and 6 34% greater than the bioactive compound content measurements from Rayong accession when treated with SA. Before this, the use of SA as a chemical elicitor and YE as an abiotic elicitor to stimulate the production of centellosides (madecassoside and asiaticoside) in Centella has been previously reported by several researchers including Kim et al. (2014), Loc and Giang (2012), Giang et al. (2016) and Loc et al. (2017).
Our results showed that the different accessions of Centella produced different amounts of phytochemicals. The highest content of MD and AS were found in Rayong accession, followed by Prachinburi, Nakhonpathom, Ubonratchathani and Nakhonsritthammarat, in that order. The average amounts of MD and AS found in Rayong were 32% and 38% higher than in Nakhonsrithammarat. This is consistent with the work of Jai aye (2013), who reported that the Rayong accession contained more asiaticoside compared to the other accessions studied.
We can conclude that to harvest the most of the 2 bioactive compounds of interest (MD and AS) when growing Centella in Pathum Thani Province, or other parts of central Thailand, growers should choose Nakhonpathom accession, because it can yield higher fresh weight and dry weight per unit area than Prachinburi accession when treated with SA spray at the concentration of 1 mg /L. Two applications should be done, spaced one week apart, and the Centella can be harvested one week after the second spraying. Additional studies should be done using varying concentrations and durations of elicitor application, and growing the plants at different times of the year.
5.2.1
Piriyapatarakij, A. Cited in Jai aye, P. 2013 Research and development of Centella production technology. Research report, Department of Agriculture. 2008. 29 p. (in Thai)
Loc, N.H., Giang, N.T., and Huy, N.D . Effect of salicylic acid on expression level of genes related with isoprenoid pathway in centella (Centella Asiatica (L.) Urban) cells. 3 Biotech. 2016;6:86 93.
Data can be made available by contacting the corresponding author.
Loc, N.H., Giang, N.T., Huy, N.D. , and Lan, T.T.P. Accumulation of madecassoside a major component of centelloside in centella (Centella Asiatica (L.) Urban) cells elicited by salicylic acid. Periodicum Biologorum. 2017;119(1): 81 85.
7 References
Stockhausen L, Turale S. An explorative study of Australian nursing scholars and contemporary scholarship. J Nurs Scholarsh. 2013;43(1):89 96.
Mingmuang, J. , Cheunnangchi, W. , Sakpetch, A. , Niamsakul, S. and Ontong, S.,. Development of a method of triterpene analysis in Centella using UPLC. Thai and Alternative Medicine Journal 2020;18(2): 270 286. (in Thai)
Panya, I. Development of a serum from centella extract. Master’s Degree thesis. Srinakharinwirot University. 2018. (in Thai)
Kundu, K., Roy, A., Saxena, G., Kumar, L., and Bharadvaja, N. Effect of different carbon sources and elicitors on shoot multiplication in accessions of Centella asistica . Medical & Aromatic Plant s. 2016;5(4). DOI: 10.4172/2167 0412.1000251 Kwon, K.J., Bae, S., Kim, K., An, I.S., Ahn, K.J., An, S., and Cha, H.J. Asiaticoside, a component of Centella Asiatica , inhibits melanogenesis in B16F10 mouse melanoma. Molecular Medicine Reports 2014;10: 503-507.
Yodyothi, Y. Induction of disease resistance and expression of PR 1 gene expression in Hevea brasiliensis using different elicitors. Master’s degree thesis. Prince of Songkhla University. 2014. (in Thai)
Loc, N H. and Giang, N T . Effects of elicitors on the enhancement of asiaticoside biosynthesis in cell cultures of centella (Centella Asiatica L. Urban). Chemical Papers. 2012;66: 642 648.
Jai-aye, P. Research and development of Centella production technology Research report, Department of Agriculture. 2013. 29 p. (in Thai)
Tongekkaew, J. Centella: a very useful herb. Ubon Ratchathani University Journal of Science and Technology 2013;15(3): 70 75. (in Thai)
Khumkan, S. Research on 5 centella accessions to promote commercial cultivation Kom Chad Leuk newspaper, online version of 29 July, 2019 (general news column) 2019. www.komchadluek.net/news/381404 (in Thai)
http://TuEngr.com Page | 9 6 Availability o f Data and Material
Dorni, A.I.C., Peter, G., Jude, S., Arundhathy, C.A., Jacob, J., Amalraj, A., Pius, A., and Gopi, S. UPLC Q ToF MS guided enrichment and purification of triterpenoids from Centella asistica (L.) extract with microporous resin. Journal of Liquid Chromatography & Related Technologies. 2017;40(1): 13 25. Kim O T , Kim M Y , Hong M H , Ahn J C , and Hwang, B Stimulation of a siaticoside accumulation in the whole plant cultures of Centella Asiatica (L.) urban by elicitors. Plant Cell Rep. 2014;23(5):339 44.
http://TuEngr.com Page | 10 Tan, S.C., Bhattamisra, S.K., Chellappan, D.K., and Candasamy, M. Actions and t herapeutic potential of madecassoside and other major constituents of Centella Asiatica : A Review. Appl. Sci. 2021;11: 8475. Dr. Khanok on Amprayn is a Researcher in the Expert Center of Innovative Agriculture (InnoAg), Thailand Institute of Science and Technological Research, Pathum Thani, THAILAND. She is interested in Microorganism, Soil Management Fertilizer, and Molecular Biology Dr. Nattapong CHANCHULA is a Researcher in the Expert Center of Innovative Agriculture (InnoAg), Thailand Institute of Science and Technological Research, Pathumthani, THAILAND. His research encompasses Plant Biotechnology, Mutation Breeding, Floriculture, and Phytochemistry Dr. Anan Piriyaphatarakit is a Researcher in the Expert Center of Innovative Agriculture (InnoAg), Thailand Institute of Science and Technological Research, Pathum Thani, THAILAND. His research pertains to Plant Physiology and Plant Breeding, Plant Physiology, Exploration and Experimental with Rare Plants in Thailand, He also Coordinates Projects and Develops Landscape Decorations through Innovation. and Technology to pass on to farmers who grow ornamental plants.
Miss Napassawan SUNTHORN is an Assistant Researcher at the Expert Center of Innovative Agriculture (InnoAg), Thailand Institute of Science and Technological Research, Pathum Thani, THAILAND. She is interested in Soil Management Fertilizer and Environment Miss Siriporn Premrit is an Assistant Researcher at the Expert Center of Innovative Agriculture (InnoAg), Thailand Institute of Science and Technological Research, Pathumthani, Thailand. She is focused on Microorganisms and Molecular Biology


Digital marketing is increasing its relevance as an important influence in customer buying decisions this study tries to find t he degree of impact of various important digital media on buying decisions for LG Electronics appliances in Noida, India.
This research was to find the effect of digital medium on buying decisions of customers in the appliance industry. The researcher could conclude the degree of effect major digital medium elements had on the appliances buying decisions of LG Electronics in NOIDA. This study used the explanatory research design and multilinear regression model run by the programing language Python 3. To achieve the paper's purposes, this study collected the information from LG Electronics customers by designing a questionnaire according to the hypotheses of this study. The questionnaire was distributed to a sample of 384 by random sampling. The studied model concludes that Facebook and YouTube are the most critical digital medium elements for customers, in influencing their buying decisions. Twitter has the lowest impact on the buying decisions .
The purpose of this research is to examine the role of using Digital Medium (Facebook, Twitter, and YouTube) in consumers' buying decisions, especially in the electrical appliances sector that is focused in this research by LG Electronics Company.
Buying decisions have many stages and if enforcement by digital media happens then the conversions from leads increases and thereby the sales.
ISSN 2228 9860 eISSN 1906 9642
Disciplinary: Business Management & Application of Information Technology ©2022 INT TRANS J ENG MANAG SCI TECH.
Accepted2022
Keywords: Digital decision;customers;Facebook;medium;Twitter;YouTube;IndianonlineBuyingPython3
*Corresponding Author (Tel: +919910819607, Email: neeraj291219 @gmail.com).
CODEN: ITJEA8
International Transaction Journal of Engineering, Management, & Applied Sciences & Technologies, 13(6), 13A6T, 1 8. http://TUENGR.COM/V13/13A6T.pdf
Abstract
International Transaction Journal of Engineering, Management, & Applied Sciences & Technologies http://TuEngr.com
The Effect of Digital Medium as a Facilitator of Appliances Buying Decisions in NOIDA
Paper ID: 13A6T Volume 13 Issue 6 Received 06 January 2022 Received in revised form 06 May 13 May 2022 Available online 20 May 2022
Cite This Article: Bali, N. (2022). The Effect of Digital Medium as a Facilitator of Appliances Buying Decisions in NOIDA.
Page | 1
Neeraj Bali1* 1 Department of Management, Wollega University, ETHIOPIA.
1 Introduction
©2022 International Transaction Journal of Engineering, Management, & Applied Sciences & Technologies
DOI: 10.14456/ITJEMAST.2022.125

http://TuEngr.com Page | 2
Importance of Digital Medium for Business
A digital medium is an electronic medium that is cost effective as compared to traditional advertising which uses News Paper, Television, Magazines, and Radio.
‘Online social media has become a phenomenon that connects internet users. The continuous and rapid technological evolution has led to the development of numerous online social media types. The goal is usually to develop online communities that enable users to come together to exchange and share information that suits their interests or activities. It is a communication channel through new media that is highly popular. This has led to the culture of using the internet today (Thitimachima, 2010). Banthathong (2014) and Hemmin (2013) defined the behavior in using online social media as the experience in using and the characteristics of using the services of online social media. This includes a channel of use, frequency of use, length of time of use, the objective of use, most liked quality, and source of interest. This includes activities that have been carried out to serve their needs or interactions that could be observed in using online social media.’ (Euajarusphan, 2021)
‘Channel 4’s chief marketing officer Dan Brooke provided a bird’s eye view of the digital transformation behind the scenes of one of the country’s favorite TV channels. He explained how digital has taken a firm grip on most aspects of broadcasting Facebook, distribution, visitor engagement, and marketing. Brooke pointed out how the entertainment industry known for its creativity embraced the science behind numbers. Apart from viewership figures providing more accurate targeting to advertisers, data is also increasingly being used to serve up seemingly serendipitous recommendations based on predictive modeling.’ (Wolny, 2014)
Here’s how social media influences consumer behavior:
o Social Media is a major influence in buying decision.
1.3 The Effect of Online media on Consumer Purchase Decision
o Majority consumers’ purchasing decisions are influenced by their friends’ social media posts.
o Face book is a major player amongst all social media in influencing buying decisions. o Tweeting is used for supporting or pushing the buying decisions of the customers at the last stage. After the corona virus pandemic the influence of Digital medium has increased manifolds in influencing buying decisions. ’ (Nosto, 2021)
The objectives of this study is t o identify the impact of social media on the purchasing decisions of LG electronics in appliances in NOIDA.
1.2
1.1 Digital Medium
Traditional marketing focuses on mass communication but digital marketing can be used to target the audience as per the requirement, so your advertising campaign is more effective in terms of cost and conversions.
2 Lit e rature Review Gupta & Chopra (2020) focused on web based social networking that has engaged purchasers, as advertisers have no control over the substance, timing, or recurrence of online discussions among shoppers. Results show that social media usage influences consumer satisfaction in the stages of information search and alternative evaluation, with satisfaction getting amplified as the consumer moves along the process towards the final purchase decision and post purchase evaluation. However, this paper is not focusing on LG electronics in particular.
Voramontri & Klieb (2019) researched empirically the role of social media in consumers’ decision making process for complex purchases those characterized by significant brand differences, high consumer involvement, and risk, and which are expensive and infrequent. The model used the information search, alternative evaluation, and purchase decision stages from the classical EBM model. A quantitative survey investigates to what degree experiences are altered by the use of social media. Results show that social media usage influences consumer satisfaction in the stages of information search and alternative evaluation, with satisfaction getting amplified as the consumer moves along the process towards the final purchase decision and post purchase evaluation. The research was done among internet savvy consumers in South East Asia, and only considered purchases that were made by consumers, not including searches that were abandoned. resulting in other cultures, so the Digital, economic, and cultural differences should be considered. However, the research is on the impact of social media on decision making and is generic and does not focus on LG Ramsunderelectronics.(2011)investigated
http://TuEngr.com Page | 3
the Effect of Digital Medium on a consumer’s purchase decision in the South African tyre industry addressing traditional strategies, the consumer’s purchase decision journey, and Digital Medium strategy. The research instrument used in this research was a questionnaire which was designed specifically for this research. The questionnaire was based on the literature review and specifically addressed that the main purpose of Digital Medium is connectivity; the ability to meet new people, create new contacts and develop networks and create new customers and business associates. If managed and maintained appropriately, organizations can utilize the power of Digital Medium to promote their brand, gain insight into the
The importance of this research can be noticed through the stunning development of information technology and communications in the recent times as well as its ability to affect the consumer's buying decisions through the features that are provided by these channels, in terms of time, cost and speed of access to information. In addition, addressing several variables related to using such websites, especially in the field of advertising and promotion via Facebook, Twitter, and Youtube to various Indian businesses is necessary to identify and bring Facebook to the customers, and know to what extent the client would accept this idea as well as how will the customer react and how to create the need through the influence of this channel. Finally, this research would help researchers, managers, and marketers to consider the real value of Digital mediums when it's used as E channels
FacebookTwitterYoutube BehaviourCustomerBuying
3.1MethodConceptual
http://TuEngr.com Page | 4 market and assess how consumers feel about their brands. As thousands of users visit Digital Medium platforms daily, Digital Medium allows marketers to reach and talk to a mass audience at little or no cost. This study's geography and industry are different and the focus was on SouthAfrica and the tyre industry respectively.
3
Independent Variables Dependent Variable Figure.1: Research Conceptual Framework
Hypothesis 1 : There is a statistically significant impact of the Facebook on organization Buying Decisions in LG Electronics company.
3.2 Hypothes e s The hypotheses are tested in this study.
Azzam & Mizeed, (2021); This study talks about the positive effect of digital marketing on the Purchase Decision among the students of Jordanian universities. Although the study puts light on digital marketing's impact on buying behavior nevertheless the dependent variable was different, which was ‘Purchase Decision among the students of Jordanian universities ’ Kumar (2013) talked about the Social media role in LG products sales but a regression model which is ideal for finding the impact was not used.
Although there are many related types of research, t here is no existing research in the exact title covered by this study. In most of the research, the industry or the methodology, or the variables differs compared to this study. Therefore there is a need to conduct this research to fill the gap.
Framework
From structured interviews and literature, Figure 1 posed the conceptual framework
Hypothesis 2 : There is a statistically significant impact of the Twitter on organization Buying Decisions in LG Electronics company.
Hypothesis 3 : There is a statistically significant impact of the Youtube on organization BuyingDecisions in LG Electronics company.
Adjusted R squared concludes that the model predicts the dependent variables with 65% accuracy. F statistical probability is less than 0.05 which makes the model valid.
4.2 Validity and Reliability
For the validity test, the questionnaires were given to a few respondents and compared with expected results from the known facts. The response was as per expectation.
Table 2: Multi Linear Regression ( n = 383).
Dep. Variable: Buying R squared: 0.657 Model: OLS Adj. R squared: 0.654 Method: Least Squares F statistic: 241.6 Prob (F statistic): 1.37E 87 Log Likelihood: 575.91 AIC: 1160 Df Residuals: 379 BIC: 1176 Df Model: 3 Covariance Type: nonrobust coef std err t P>|t| [0.025 0.975] Intercept 1.691 0.666 2.538 0.012 0.381 3.001 Facebook 0.386 0.045 8.6 0 0.298 0.474 Twitter 0.256 0.052 4.876 0 0.153 0.359 Youtube 0.271 0.051 5.355 0 0.172 0.371 Omnibus: 84.631 Durbin Watson: 2.198 Prob(Omnibus): 0 Jarque Bera (JB): 255.71 Skew: 1.003 Prob(JB): 2.9E 56 Kurtosis: 6.464 Cond. No. 376
5
Result and Discussion
D ata Collection
http://TuEngr.com Page | 5 4 4.1MethodologyPopulationand
Our required sample size will be around 384 for your population with a 5% margin of error and a 95% confidence level. Basing on the formula (Z score is 1.96 for a 95% confidence level) SS = (Z score)² * p*(1 p) / (margin of error)² = (1.96)² * 0.5*(1 0.5) / (0.05)² = 384.2. Thus, for the case of unknown population, a minimum of 384 questionnaires are sufficient.
Table 2 shows regression analysis which helps us to conclude that all of the independent variables are at a significant level and the MLR model helps to predict the dependent variable.
5.1 Regression Analysis
From Table1 we can conclude that .908 Cronbach alpha Reliability Statistics confirms that our model is reliable. Table 1: Reliability Statistics Cronbach's Alpha No of Items .908 4
One unit change in Facebook leads to a 0.3859 change in Buying Decisions, keeping all other Explanatory variables constant, which is the maximum positive impact among all Independent variables.From the regression Table 2, we can conclude that all p values are less than alpha (.05) so we accept (claim) all the research hypotheses , that all independent variables have a significant impact on the dependent variable Buying Decisions.
Confidence Interval Table 2 also shows the confidence interval at 95%, which has no zero values, which again confirms that there is a 95% chance that the coefficients of independent variables lie within the interval and have an impact on the dependent variable.
Table 3 shows there is a significant relationship between the dependent variable and all independent variables under study. It can be observed that Organization Buying Decisions has a maximum correlation with YouTube and Facebook.
Table 3 : Heat map o f the correlation between variables
http://TuEngr.com Page | 6
4.2 MLR Assumptions Assumption of Linearity, Assumption of Equal Variability, Assumption of Homoscedasticity, Assumption of Linearity between Dependent and Independent Variables are met by the Regression Model in this study.

8
Our Model concludes that Facebook and YouTube are the most critical digital medium elements for customers, in influencing their Buying Decisions. Twitter has the lowest impact on the Buying Decisions as per the regression model, used in the study. Organizations are recommended to have a strong digital media strategy to influence buying decisions of their customers. Digital medium contributes to the buying decision of LG Electronics Company and therefore they should continue their strategy.
Acknowledgment
Table 4: The variance inflation factor (VIF) const 141.99 Facebook 2.49 Twitter 2.16 Youtube 2.88 dtype: float64 Conclusion
The Effect of Digital Medium on purchase decision in the tyre industry . Nelson Mandela Metropolitan University Business School. pp40 46
The researcher is thankful to the customers of LG electronics who gave their valuable feedback. 9
7
o f
Usage Behavior, Attitude, Satisfaction, and Online Social Media Literacy of Generation X, Generation Y, and Generation Z. SSRN Electronic Journal DOI: 10.2139/ssrn.3998457
Table 4 shows Co linearity diagnostic test of the predicted variable: The variance inflation factor (VIF) should be less than or between 3 to 10 for no co linearity. From table 4 we can say, all Independent Variable’s VIF is less than 3.5, which means that independent variables have negligible co linearity.
References Al Azzam, A. F., & Al Mizeed, K. (2021). The Effect of Digital Marketing on Purchasing Decisions: A Case Study in Jordan. Journal of Asian Finance, Economics, and Business, 8 (5), 455 463. DOI: Euajarusphan,10.13106/jafeb.2021.vol8.no5.0455A.(2021).OnlineSocialMedia
http://TuEngr.com Page | 7 4.2.1 Assumption of Co Linearity
Availabil ity Data and Material Data can be made available by contacting the corresponding authors
Gupta, S., & Chopra, C. (2020). Impact Of Social Media On Consumer Behaviour. Ramsunder,Nosto.Kumar,viourhttps://www.researchgate.net/publication/342638389_Impact_Of_Social_Media_On_Consumer_BehaR.(2013).SocialMediaStrategyReview:LGIndia.https://www.socialsamosa.com/2013/01/socialmediastrategyreviewlgindia/(2021).HowDoesSocialMediaInfluenceConsumerBehavior?14Stats|Stackla.https://www.nosto.com/blog/howdoessocialmediainfluencecustomerbehavior/M.(2011).
6
Dr. Neeraj Bali is an Assistant Professor in Management Department, Wollega University He got his MBA in Marketing with distinction from Sinhagad Institute of Management (Affiliated with Pune University) and a Ph.D. in Management from Sainath University recognized by UGC. He did a ‘Statistics with Python’ specialization from the University of Michigan. The Specialization covers three certifications Understanding and Visualizing Data with Python, Inferential Statistical Analysis with Python, and fitting Statistical Models to Data with Python. Most of his research work is based on Management topics.
http://TuEngr.com Page | 8
Voramontri, D., & Klieb, L. (2019). Impact of social media on consumer behavior. International Journal of Information and Decision Sciences, 11(3), 209 233. DOI: 10.1504/ijids.2019.101994
Wolny, J. (2014). Marketing transformations: Re thinking marketing, digital first. Journal of Direct, Data and Digital Marketing Practice, 16 (2), 150 151. DOI: 10.1057/dddmp.2014.57

The characteristics of structural lightweight concrete that make it preferable include lower density, higher specific strength, good thermal insulation and better durability. The density of concrete is of primary con cern in the context of the self weight of structural members. In many structures, self weight forms an appreciable proportion of the total load. Reduced density of International Transaction Journal of Engineering, Management, & Applied Sciences & Technologies http://TuEngr.com
Disciplina ry: Civil Engineering ( Concrete Technology, Structural Engineering, Construction and Building Materials ). ©2022 INT TRANS J ENG MANAG SCI TECH.
Page | 1 ©2022 International Transaction Journal of Engineering, Management, & Applied Sciences & Technologies ISSN 2228 9860 eISSN 1906 9642 CODEN: ITJEA8 A Study on Material Properties of Structural Light Weight Concrete with Micro-reinforcement K K Gaayathri1*, K Suguna2, P N Raghunath3 1 Department of Civil and Structural Engineering, Annamalai University, INDIA. *Corresponding Author (Tel: +91 9095225566, Email: gaayathrikk14 @gmail.com) . Paper ID: 13A6U Volume 13 Issue 6 Received 09 January 2022 Received in revised form 07 May Accepted2022 14 May 2022 Available online 21 May 2022 Keywords: Compressive strength; Expanded clay aggregate; Flexural PolypropyleneModulusModulusLightweightStrength;concrete;ofelasticity;ofrupture;fibres.
Cite This Article: Gaayathri, K. K., Suguna, K., and Raghunath, P. N (2022). A Study on Material Properties of Structural Light Weight Concrete with Micro reinforcement. International Transaction Journal of Engineering, Management, & Applied Sciences & Technologies, 13(6), 13A6U, 1 11. http://TUENGR.COM/V13/13A6U.pdf DOI: 10.14456/ITJEMAST.2022.126 1 1.1IntroductionInformation
Abstract This paper presents the results of an experimental study on material properties such as mechanical properties and durability properties to examine the effectiveness of structural lightweight concrete. Expanded clay aggregates (ECA) have been used in varying percentages of 10%, 20%, 30%, 40% to replace coarse aggregates. Polypropylene fibres have been used in volume fractions of 0.1%, 0.2%, 0.3% and 0.4%. Based on trials, the optimum dosage of expanded clay aggregates for meeting the workability and strengt h requirements has been obtained. The laboratory results showed that the inclusion of polypropylene fibres improved the properties of structural lightweight concrete appreciably. Non linear regression analysis was carried out to determine the relationship between the dependent variables such as compressive strength, Flexural strength and Modulus of elasticity for Structural Lightweight Concrete with polypropylene fibres and independent variables such as volume fraction of fibres and aspect ratio.

Cube Specimens (3 cubes for each mix) of size 150 X 150 X 150 mm were cast and tested for determining the compressive strength of concrete. Cylinder Specimens (3 cylinders for each mix) of size 150 X 300 mm were cast and tested for determining the compressive strength of c oncrete. Cylinder Specimens (3 cylinders for each mix) of size 150 X 300 mm were cast and tested for determining the elasticity modulus of concrete . Prism Specimens (3 prisms for each mix) of size 100 X 100 X 500 mm were cast and tested for determining the flexural strength of concrete.
http://TuEngr.com Page | 2
2.1 Materials
The longitudinal tensile reinforcement ratios compatible with flexural ductility are somewhat lower for Light Weight aggregate Concrete beams when compared to Normal Weight Aggregate Concrete. The methods contained in the American code of practice (ACI 318 2005 and ACI 213 2003) for Light Weight aggregate Concrete can predict the cracking and ultimate strength quite accurately . The optimal HPPFs content of 1.1% and SFs content of 2.0% improved the flexural toughness of plain concrete. The addition of 1.5% polypropylene fibre increased the compressive and split tensile strength. The use of industrial waste steel wires can be used as micro reinforcement for improving the mechanical properties of lightweight concrete (Gaayathri et al., 2022).
structural lightweight concrete results in reduced self weight of structural members which is qui te important in seismic resistant design. It is relatively understandable that the addition of micro reinforcement enhances the overall performance in general. The improved mechanical properties of structural lightweight concrete as a result of the inclusi on of micro reinforcement makes it fit for use in load bearing structural members also. The addition of steel fibres to high strength lightweight concrete is extremely effective in improving the strength and fracture toughness [9].
In this study, efforts have been made to study the behaviour of expanded clay based structural lightweight concrete with the inclusion of polypropylene fibres in varying volume fractions.
2 E xperimental Programme
2.2 Control Specimens
Ordinary Portland Cement of grade 53 conforming to IS 12269: 2013 was used in this investigation. The coarse aggregate used was crushed granite of a maximum particle size of 20mm and conforming to IS 383:2016. Expanded Clay Aggregate was used to partially replace coarse aggregate. A combination of natural river sand conforming to IS 383: 2016 and manufactured sand was used as fine aggregate in this study. Trials were made to arrive at the combination of R sand to M sand. 55% R sand and 45% M sand combined were found to be beneficial. The specific gravity of the combine was found to be 2.66. Commercially available Recron 3S fibres were used in this study. The fibres are compatible with all admixtures used in concrete which conform to ASTM C1116. A SNF based high range water reducing admixture Conplast SP430 was used to satisfy the workability demand of each mix
Mechanical Properties2.3.2
Designation
Slump Test2.3.1
The concrete mix has been designed as per IS 10262:2019. The workability test has been conducted for all the five mixes as per IS 1199:2008. The SP dosage used and the slump obtained for each mix are shown in Figure 1. A standard mould of 300mm height, 200mm base diameter and 100mm top diameter was used. The fresh concrete was filled into the mould in equal layers and well compacted. The subsidence was measured after the removal of the cone.
contentWater(kg) Cement (kg) AggregateCoarse(kg) Expanded Clay Aggregate (kg) River(kg)Sand M(kg)Sand VolumeFibre % EC0 175 350 995.8 52.17 377.85 309.15 0.0 EC1 175 350 995.8 52.17 377.85 309.15 0.1 EC2 175 350 995.8 52.17 377.85 309.15 0.2 EC3 175 350 995.8 52.17 377.85 309.15 0.3 EC4 175 350 995.8 52.17 377.85 309.15 0.4
2.3
A total of 18cubes, 18 cylinders, and 18 prisms (control, with 20 % ECA, with 20% ECA plus 0.1% PPF, with 20% ECA plus 0.2% PPF, with 20% ECA plus 0.3% PPF and with 20% ECA plus 0.4% PPF) were tested according to standard documents of Indian standards. The cubes were tested as per IS516: 1999 in a standard Compression Testing Machine for determining compressive strength. The cylinders were tested as per IS 516: 1999 in a standard Compression Testing Machine and tested as per IS 516: 1999 in a standard Compression Testin g Machine for determining the cylinder compressive strength and modulus of elasticity. The prisms were tested as per IS 516: 1999 in a standard loading frame for determining the modulus of rupture. Each value represents the average result of three specimens in the same group. 60 57 58 56 EC057 EC1 EC2 EC3 EC4 Slump in mm
Figure 1: Slump Test Results
Experimental Methods
http://TuEngr.com Page | 3
Table 1: Details of Control Specimens
Figure 3: Disc sealed with adhesive tape Figure 4: Sorptivity Test Setup
Durability Properties2.3.3
A) Water Absorption and Porosity
Figure 2: Boiling of Cubes
B) Sorptivity Disc specimens of 100mm diameter and 50mm thickness were tested for the capillary rise of water as per ASTM C1585 04. Each value represents the average result of three specimens in the same group. An adhesive tape was used to maintain the path of the capillary rise of water. The mass of the disc was taken for 6 hours at time intervals of 30 minutes. The specimen was surface dried each time before weighing.
http://TuEngr.com Page | 4
Specimens of size 150×150×150mm (control, with 20 % ECA, with 20% ECA plus 0.1% PPF, with 20% ECA plus 0.2% PPF,with 20% ECA plus 0.3% PPF and with 20% ECA plus 0.4% PPF) were tested for water absorption as per ASTM C642 97. Each value represents the average result of three specimens in the same group. The initial specimen weight was taken. Then the specimen was immersed in water for 48hrs. The specimen was surface dried with a towel and saturated mass after immersion was measured. The specimen was boiled for 5 hours, allowed to cool and the saturated mass after boiling was measured.
Cubes


(a) H2SO4 Acid (b) Cubes
Acid Attack (c) Cubes
3.1
Mechanical Properties
The compressive strength of expanded clay based structural lightweight concrete with varying fibre volume fractions of polypropylene fibre is presented. The average compressive strength of the expanded clay based structural lightweight concrete specimens was 23.55 MPa which conforms to ASTM 213R 03. The compressive strength of concrete with a 0.3% volume fraction of polypropylene fibres increased appreciably reaching a peak value of 28.22 N/m ���� 2 The increase in cube strength may be due to the strong bond between the PP fibres and the matrix. The elasticity modulus of expande d clay based structural lightweight concrete with varying fibre volume fractions of polypropylene fibre is presented. The results indicate an increase of 0.86% for fibre reinforced structural lightweight concrete when compared to non fibre reinforced struc tural lightweight concrete. The flexural strength test results for different mixes are presented. Each test value is the mean value recorded from three test specimens. The flexural strength was found to increase from 4.7 N/m ���� 2 to 7.4 N/m ���� 2 with an increase in fibre volume fraction from 0% to 0.4%. The fracture process consisted of progressive fibre debonding during which crack propagation occurred slowly. The compressive strength, modulus of elasticity and modulus of rupture are presented in Table 2 and s hown in Figure 6.
Cubes specimens of size 150×150×150mm were tested for Acid Resistance as per ASTM C1012. Each value represents the average result of three specimens in the same group. The initial weight of the specimens was taken. The acid medium was prepared (5% concentration of H 2SO 4). The specimens were kept immersed for 28 days in the prepared acid medium. The weight and strength loss after the immersion period was found. on after Resista nce Tests.
3 Result a nd Discussion
http://TuEngr.com Page | 5 C) Acid Resistance
Acid Attack (d) Testing Figure 5: Acid


http://TuEngr.com Page | 6 Table 2: Mechanical Properties of all the Test Specimens Designation CompressiveCubeStrength CompressiveCylinderStrength ModulusElasticityof ModulusRuptureof CC 33.33 26.71 28.21 6.5 EC0 23.55 18.84 24.39 4.7 EC1 24.44 19.58 24.60 5.2 EC2 26.00 20.94 25.50 5.8 EC3 28.22 22.64 26.87 6.5 EC4 25.42 20.37 27.26 7.4 Figure 6: Mechanical Properties of all Test Specimens 3.2 Durability Properties Water Absorption3.2.1 The water absorption percentage of Structural Lightweight Concrete with the inclusion of Polypropylene Fibres is furnished in Table 3. Structural lightweight concrete with 0% fibre exhibited increased absorption when compared to control concrete. The addition of 0.1%,0.2% and 0.3 % fibre volume fraction resulted in a decreasing trend in the absorption of water. This tendency may be due to uniform fibre dispersion. A slight increase in absorption was seen for the concrete with a 0.4% volume fraction of fibres. This may probably be due to the agglomeration of fibres. Figure 7 shows the effect of fibres on water absorption. Table 3: Percentage of Water Absorption. Designation Percentage of AbsorptionWater CC 0.46 EC0 0.65 EC1 0.61 EC2 0.47 EC3 0.39 EC4 0.44 33.33 23.55 24.44 26 28.22 25.42 26.71 18.84 19.58 20.94 22.64 20.37 28.21 24.39 24.6 25.5 26.87 27.26 6.5 4.7 5.2 5.8 6.5 7.435302520151050 CC EC0 EC1 EC2 EC3 EC4 CUBE COMPRESSIVE STRENGTH CYLINDER COMPRESSIVE STRENGTH MODULUS OF ELASTICITY MODULUS OF RUPTURE


Designation
0.700.600.500.400.300.200.100.00 CC EC0 EC1 EC2 EC3 EC4 0.46 0.65 0.61 0.47 0.39 0.44afterGainWeight waterAbsorption Test Specimen 1.50.501 CC EC0 EC1 EC2 EC3 EC4 voids(%)permeableofvolume Test Specimen
Table 4: Porosity Parameters SaturatedAbsorptionWater The volume of Permeable voids (%) CC 0.65 1.01 EC0 0.83 1.45 EC1 0.61 1.21 EC2 0.47 0.95 EC3 0.37 0.75 EC4 0.45 0.92
Figure 8: Effect of PP Fibres on voids (%).
http://TuEngr.com Page | 7
Figure.7: Effect of fibre on water Absorption Porosity3.2.2 The porosity of Structural Lightweight Concrete with the inclusion of Polypropylene Fibres is presented in Table 4. The expanded clay aggregate itself is a porous material which has a higher absorption percentage when compared with the normal weight aggregate. The cube specimens with lightweight aggregate exhibited an increased porosity when compared to normal weight aggregates. The voids got reduced with the inclusion of PP fibres of volume fraction 0.1%.0.2%,0.3% respectively. The stitching acti on of fibres facilitated the reduction in pores. An increase in porosity was observed with a 0.4% volume fraction of PP fibres owing to the collation of fibres. Figure 8 shows the effect of PP fibres on voids.


http://TuEngr.com Page | 8
Sorptivity is the capacity to absorb water through the capillary rise in the hardened concrete. The sorptivity depends on the porosity of concrete. The sorptivity is reduced with the inclusion of PP fibres of a volume fraction of 0.1%.0.2%,0.3% respectively. The bridging action of fibres would have facilitated the reduction in sorptivity. An increase in porosity was observed with a 0.4% volume fraction of PP fibres owing to the bundling of fibres. Figure 9 show s t he absorption with respect to time. ure 9: Absorption Vs Sqrt of Time Acid Resistance3.2.4
The percentage loss in weight and strength of Structural Lightweight Concrete with the inclusion of Polypropylene Fibres is furnished in Table 5. Structural lightweight concrete with 0% fibre showed a higher loss in weight and strength when compared to control concrete. The addition of 0.1%, 0.2% and 0.3 % fibre volume fraction resulted in a decreasing trend of loss in weight and strength. This may be because of a reduction in voids as a result of uniform fibre dispersion. A slight increase in loss in weight and strength was noticed for the concrete with a 0.4% volume fraction of fibres. This may probably be due to the balling of fibres. The effect of PP fibres on the loss of weight and strength is shown in Figure 10.
Fig
Table 5: Percentage Loss on Weight and Strength Designation Percentage of Weight Loss Percentage of Strength CC 5.10 1.55 EC0 5.44 1.0 EC1 4.32 1.5 EC2 4.10 1.45 EC3 3.44 1.17 EC4 3.99 1.53 3.50003.00002.50002.00001.50001.00000.50000.00000.00 5.00 10.00 15.00 20.00 Sqrt of Time EC4EC3EC2EC1EC0CC
Sorptivity3.2.3
ABSORPTION


values
The model for multiple Non linear regression takes the form yf=(a*y)+(b*vf)+(c*vf*vf)+(d*vf*l/d) (1).
1 Compressive Strength (0.979*fck)+(23191.438*vf) (47.999*vf*vf) (66.185*vf*l/d)
2 Flexural Strength (1.002*fck) (54911.732*vf)+(6.429*vf*vf) (302.043*vf*l/d)
Table 6: Regression Equation for structural lightweight concrete with PP Fibre Sl.No Prediction Paramaters Regression Equation
Modulus
4 Regression Analysis
Flexural Strength 0.0414
7. The regression equations 0 1 2 3 4 5 6 CC EC0 EC1 EC2 EC3 EC4 LossWeightofPercentage Test Specimen 0 0.5 1 1.5 2 CC EC0 EC1 EC2 EC3 EC4 LossStrengthofPercentage Test Specimen
(a) (b)
The RMSE,
3 Modulus of Elasticity (0.994*fck)+(105720.804*vf)+(5.929*vf*vf)+(156.902*vf*l/d)
Compressive Strength
http://TuEngr.com Page | 9
Figure 10: Effect of fibres on Acid Resistance
Regression analysis is a set of statistical processes for estimating the relationships among variables. The regression might be used to identify the effect of independent variables over the dependent variable. Thus the regression analysis helps us to understand how much the dependent variable changes with a change in one or more independent variables. The non linear regression analysis has been conducted using SPSS. Non linear regression relates two variables in a curved form.
Non linear regression analysis was carried out to determine the relationship between the dependent variables such as compressive strength, Flexural strength and Modulus of elasticity for Structural Lightweight Concrete with polypropylene fibres and independent variables such as volume fraction of fibres and aspect ratio. The proposed regression equations are presented in Table 6. 7: Statistical Indicators �������� MAPE 0.8599 0.9988 2.9859 0.9999 0.5593 of 0.9999 0.8939 statistical error coefficients show the correlation between the experimental and predicted results. ���� 2 MAPE are presented in Table
Table
Prediction Paramaters RMSE
Elasticity 0.2470
The
,


Figure 8: Experimental vs Predicted Parameters
The modulus of elasticity of Expanded Clay based Structural Lightweight Concrete increased at the rate of 0.86% to 11.78% as the fibre volume fraction increased from 0.1% to 0.4%.
The expanded clay based structural lightweight aggregate concrete showed a maximum of 19.83% increase in compressive strength with the inclusion of a 0.3% volume fraction of polypropylene fibre., which may be due to the cracking resistance offered by the fibre reinforcement.Theaddition
A noticeable improvement has been observed in respect of durability parameters such as water absorption, porosity, sorptivity and acid resistance owing to the bridging action caused by the PP fibre inclusion.
A good agreement has been observed between the results predicted through the proposed non linear regression equations and the test results. o f Data and Material Data can be made available by contacting the corresponding author.
302520151050 EC0 EC1 EC2 EC3 EC4 EC0 EC1 EC2 EC3 EC4 EC0 EC1 EC2 EC3 EC4 Compressive Strength Modulus of Elastisity Flexural Strength ParametersPredictedandExperimental Test Specimens REGEXP
6 Availability
The incorporation of polypropylene fibres not only improves the overall performance of structural lightweight concrete but also helps in preventing the brittle failure of the material.
5 Conclusion
http://TuEngr.com Page | 10 proposed closely predict the performance parameters of Structural Lightweight concrete with Polypropylene Fibres. The experimental and predicted values are shown in Figure 8.
of polypropylene fibres is very effective in improving the flexural strength of structural lightweight concrete. A maximum increase of 57.45% has been obtained with a 0.4% volume fraction of polypropylene fibres.


ASTM. ASTM C642 97: Standard Test Methods for Density,Absorption, and Voids in Hardened Concrete ,American Society for Testing Materials.
IS 516:1959 Methods of Tests for Strength of Concrete,Bureau of Indian Standards, New Delhi, India.
ASTM C39 Standard Test Method for Compressive Strength of Cylindrical Concrete Specimens, America n Society for Testing Materials.
ASTM. ASTM C1585 04: Standard Test Methods for Measurements of Rate of Absorption of Water by Hydraulic cement Concretes.
http://TuEngr.com
ASTM C494 Standard Specification for Chemical Admixtures for Concrete, American Society for Testing Materials,2019.
Gaayathri, K.K., Suguna, K., Raghunath, P.N. (2022). Effects of Polypropylene Fibres on the Properties of Reinforced Structural Lightweight Concrete Made With Expanded Clay Aggregates. International Transaction Journal of Engineering, Management, & Applied Sciences & Technologies, 13 (5), 13A5H, 1 11. http://TUENGR.COM/V13/13A5H.pdf DOI: 10.14456/ITJEMAST.2022.92
K.K.Gaayathri is a Research Scholar at the Department of Civil and Structural Engineering, Annamalai University, Annamalainagar 608001, Tamil Nadu, India. She got her Master’s Degree in Structural Engineering from Annamalai University. Annamalainagar 608001, Tamil Nadu. Her research is based on the Structural Lightweight Concrete with various percentages of Micro Reinforcements.
Page | 11 7 References
IS 456:2000 Plain and Reinforced Concrete Code of Practice, Bureau of Indian Standards, New Delhi, India.
Dr.K.Suguna is a Professor at the Department of Civil and Structural Engineering, Annamalai University, Annamalainagar 608001, Tamil Nadu, India She got her Master’s and PhD degrees in Structural Engineering, from Annamalai University Her research focuses on FRP laminates and fibre reinforced concrete.
Dr.P.N.Raghunath is a Professor at the Department of Civil and Structural Engineering, Annamalai University, Annamalainagar 608001, Tamil Nadu, India. He got his Master’s and PhD degrees in Structural Engineering, from Annamalai University His research focuses on FRP Laminates and Fibre Reinforced Concrete.
IS 383:2016 Coarse and Fine Aggregate for Concrete Specification, Bureau of Indian Standards, New Delhi, India. IS 2386:2016Methods of Test for Aggregates for Concrete Part I Particle Size and Shape, Bureau of Indian Standards, New Delhi, India.


:: International Transaction Journal of Engineering, Management, & Applied Sciences & Technologies http://TuEngr.com
Call for Papers: ITJEMAST invites you to submit high quality papers for full peer review and possible publication in areas pertaining to our scope including engineering, science, management and technology, especially interdisciplinary/cross disciplinary/multidisciplinary subjects.


Submithttp://TUENGR.COMyourscienceresearchtoday.
:: International Transaction Journal of Engineering, Management, & Applied Sciences & Technologies
More Research Publication Available at


