


postage paid
Editor’s Office and Advertiser Information: Florida Water Resources Journal 1402 Emerald Lakes Drive Clermont, FL 34711 Phone: 352-241-6006 Email: Editorial, editor@fwrj.com Display and Classified Advertising, ads@fwrj.com Business Office: 1402 Emerald Lakes Drive, Clermont, FL 34711 Web: http://www.fwrj.com General Manager: Michael Delaney Editor: Rick Harmon Graphic Design Manager: Patrick Delaney Mailing Coordinator: Buena Vista Publishing Published by BUENA VISTA PUBLISHING for Florida Water Resources Journal Inc. President: Richard Anderson (FSAWWA) Peace River Manasota Regional Water Supply Authority Vice President: Jamey Wallace (FWEA) Jacobs Treasurer: Rim Bishop (FWPCOA) Seacoast Utility Authority Secretary: Mish Clark Mish Agency Moving? The Post Office will not forward your magazine. Do not count on getting the Journal unless you notify us directly of address changes by the 15th of the month preceding the month of issue. Please do not telephone address changes. Email changes to changes@fwrj.com or mail to Florida Water Resources Journal, 1402 Emerald Lakes Drive, Clermont, FL 34711 Membership Questions FSAWWA: Casey Cumiskey – 407-979-4806 or fsawwa.casey@gmail.com FWEA: Karen Wallace, Executive Manager – 407-574-3318 FWPCOA: Darin Bishop – 561-840-0340 Training Questions FSAWWA: Donna Metherall – 407-979-4805 or fsawwa.donna@gmail.com FWPCOA: Shirley Reaves – 321-383-9690 For Other Information DEP Operator Certification: Ron McCulley – 850-245-7500 FSAWWA: Peggy Guingona – 407-979-4820 Florida Water Resources Conference: 407-363-7751 FWPCOA Operators Helping Operators: John Lang – 772-559-0722, e-mail – oho@fwpcoa.org FWEA: Karen Wallace, Executive Manager – 407-574-3318 Websites Florida Water Resources Journal: www.fwrj.com FWPCOA: www.fwpcoa.org FSAWWA: www.fsawwa.org FWEA: www.fwea.org and www.fweauc.org Florida Water Resources Conference: www.fwrc.org Throughout this issue trademark names are used. Rather than place a trademark symbol in every occurrence of a trademarked name, we state we are using the names only in an editorial fashion, and to the benefit of the trademark owner, with no intention of infringement of the trademark. None of the material in this publication necessarily reflects the opinions of the sponsoring organizations. All correspondence received is the property of the Florida Water Resources Journal and is subject to editing. Names are withheld in published letters only for extraordinary reasons.
Journal, 1402
Florida Water Resources Journal, USPS 069-770, ISSN 0896-1794, is published monthly by Florida Water Resources Journal, Inc., 1402 Emerald Lakes Drive, Clermont, FL 34711, on behalf of the Florida Water & Pollution Control Operator’s Association, Inc.; Florida Section, American Water Works Association; and the Florida Water Envi ronment Association. Members of all three associations receive the publication as a service of their association; $6 of membership dues support the Journal. Subscriptions are otherwise available within the U.S. for $24 per year. Periodicals at Clermont, FL and additional Resources Emerald Drive, Clermont,
offices. POSTMASTER: send address changes to Florida Water
Lakes
FL 34711 News and Features 28 Using Utility Information to Improve Team Efficiency and Citizen Satisfaction— John Bertrand Technical Articles 8 Conversion of Onsite Treatment and Disposal Systems: Will it Improve Water Quality?—Jenelle A. Mohammed, Sarina J. Ergas, and Mahmood H. Nachabe 20 Lead and Copper Rule Revisions Compliance and Funding Strategies for Systems With and Without Lead Service Lines—Christopher Hill and Quirien Muylwyk 38 Water Quality Modeling of Perfluorooctanoic Acid in a Water Distribution System— Christopher C. Baggett and Saheb Mansour-Rezaei Education and Training 6 Florida Water Resources Conference 15 CEU Challenge 30 FSAWWA Fall Conference Registration 31 FSAWWA Fall Conference Poker Night and Happy Hour 32 FSAWWA Fall Conference TopGolf 33 FSAWWA Fall Conference Students and Young Professionals Activities 34 FSAWWA Fall Conference Competitions 35 AWWA Virtual Student Chapter Membership 39 FWPCOA Training Calendar 43 TREEO Center Training Columns 4 Let’s Talk Safety: Holding on to Hand Safety 16 C Factor—Patrick “Murf” Murphy 18 Chapter Corner: Central Florida Chapter Thanks Our Community Partners—Megan L. Nelson 26 Test Yourself—Donna Kaluzniak 36 FWEA Focus—Sondra W. Lee 44 FSAWWA Speaking Out—Emilie Moore Departments 48 Classifieds 50 Display Advertiser Index ON THE COVER: Managing water resources keeps the water clean and clear at Lake Kissimmee State Park, here showing lily pads and cypress tree reflections. (photo: Jim Peters) Volume 73 September 2022 Number 9 Florida Water Resources Journal • September 2022 3
Authors agree to indemnify, defend and hold harmless the Florida Water Resources Journal Inc. (FWRJ), its officers, affiliates, directors, advisors, members, representatives, and agents from any and all losses, expenses, third-party claims, liability, damages and costs (including, but not limited to, attorneys’ fees) arising from authors’ infringement of any intellectual property, copyright or trademark, or other right of any person, as applicable under the laws of the State of Florida.


LET’S TALK SAFETY
Every year, about one million workers in the United States receive emergency hospital treatment for acute and serious hand, finger, and wrist injuries. Unfortunately, in one recent year, almost 8,000 of these injuries resulted in
S Absorption of hazardous substances through unprotected skin
S Thermal burns from touching extremely hot objects
Holding on to Hand Safety
S Identify the substances (particulates, liquids, and gases) present in the worksite and the hazards associated with these substances.
4 September 2022 • Florida Water Resources Journal
S
Although gloves will help protect against many of the hazards listed, no glove protects against all hazards. Managers and employees must select the appropriate gloves for the hazards of the specific job.
Perhaps the best place to begin when choosing appropriate hand protection is the American National Standards Institute (ANSI)/International Safety Equipment Association (ISEA) 105 Standard for Hand Protection Selection Criteria. The standard addresses the classification and testing of hand protection for specific performance properties related to chemical and industrial applications.Foradditional safety information see the OSHA regulations regarding hand show_document?p_table=STANDARDS&p_https://www.osha.gov/pls/oshaweb/owadisp.protection:
S Mechanical protection: resistance to cuts, punctures, and abrasions
S Full protection; no holes or tears
Accordingamputations.totheOccupational
Abrasions from rough surfaces
This column addresses safety issues of interest to water and wastewater personnel, and will appear monthly in the magazine. The Journal is also interested in receiving any articles on the subject of safety that it can share with readers in the “Spotlight on Safety” column.
Let’s Talk Safety is available from AWWA; visit www.awwa.org or call 800.926.7337. Get 40 percent off the list price or 10 percent off the member price by using promo code SAFETY20. The code is good for the Let’s Talk Safety book, dual disc set, and book + CD set.
S Cold protection
The Right Glove How do you select the right gloves for the job? As with any PPE selection process, the first step is to conduct a risk assessment to identify and understand the potential hazards.
A study by the Liberty Mutual Research Institute for Safety found that wearing gloves reduced hand injuries by 60 percent.
Keep in mind that some hand injuries (lacerations, crushing, broken bones, amputations) cannot be prevented by gloves. Gloves should be evaluated by the following criteria:
In addition, consider other hand protection features, such as length, size, coverage area, type of cuff, surface finish, and any attributes affecting function or comfort. Also consider the materials the gloves are made of. Select gloves that offer the optimal combination of features and performance. Periodically reevaluate your choices with yourWhenemployees.itcomes to the materials gloves are made from, keep in mind that some people may be sensitive to the proteins found in latex. Latex sensitivity is an issue that has prompted the glove industry to find alternative materials. Gloves are now made of materials such as vinyl, nitrile, and neoprene.
S Heat and flame protection
S
S Survey the worksite and list all physical and environmental hazards, such as sharp instruments, rough surfaces, or machinery.
S Chemical protection
S Broken fingers and bones in the hand S Chemical burns and severe skin irritation
S Vibration reduction S Dexterity for the job at hand S Voltage rating
S Make a list of employees who will be wearing the gloves, the work each person will do, and what equipment will be used.
Safety and Health Administration (OSHA), close to 70 percent of victims experiencing hand, finger, and wrist injuries were not wearing proper personal protective equipment (PPE); the other 30 percent wore gloves or PPE that were inadequate, damaged, or wrong for the type of work being performed.
Employer Responsibility Employers are now required by OSHA to determine the most appropriate types of PPE for their employees based on the specific work conditions and potential workplace hazards of the task to be performed. Many employers have found success in having their employees conduct their own hazard assessment for hand safety. It makes sense that involving employees in the assessment process increases their safety awareness. For example, when starting a discussion about hand safety, ask the employees to list all the ways their hands might be injured on a particular job. This list might include: S Cuts, lacerations, punctures, and even amputations


Florida’s Original On-Line Tank Cleaning Service Since 1982 Settled Solids Management WWTP Tank Cleaning Eliminate Your Grit: visit SSM.Hydro-int.com or call 407.322.0330 or email SSM@Hydro-int.com Inventors of Sand Dragon Technology State Funding Available to Pay for Cleaning - Contact us for Details! WE REMOVE GRIT WHILE YOUR PLANT REMAINS IN SERVICE & FULL OF WATER


6 September 2022 • Florida Water Resources Journal

Florida Water Resources Journal • September 2022 7 CLR Process Components Magna VelocityRotorsControl Baffles Rotor Covers Level Control Weirs E.A. ProcessAerotorMonitoring and Control Systems FLEXIBILITY IS ONLY ONE ADVANTAGE OF OUR CLOSED LOOP REACTOR PROCESS. We have more than 60 years of experience in oxidation ditch technology and more than 2000 installations. Lakeside’s CLR process offers a variety of wastewater treatment options, including several operational modes, nitrogen and phosphorus removal, and an adaptable configuration, providing maximum flexibility with consistently high quality effluent. The CLR process is simple to operate and can be configured in several shapes, including the conventional racetrack, folded U-shape or concentric multichannel designs. Lakeside’s staff delivers full service from initial concept through construction to plant operation. The result: reliable results with minimal operator attention and maintenance. When performance counts, count on the industry leader for more than 90 years! Cleaner Water for a Brighter Future® Corporation.EquipmentLakesidebyownedtrademarkregisteredaisFutureBrighteraforWaterCleaner®Corporation.EquipmentLakeside2022©owners.respectivetheirofpropertyaretrademarksotherAll Speak to one of our experts at 630.837.5640, email us at sales@lakeside-equipment.com, or visit www.lakeside-equipment.com for more product information. Visit us at BOOTH #2729 October 10-12, 2022 New Orleans, LA REPRESENTED LOCALLY BY: Florida Panhandle Only T: T.www.TrippenseeShaw.comEustisTrippenseewww.eshelmancompany.com205.424.7570Shaw,Inc.andSebring,FL863.382.2101 b b


South
Jenelle A. Mohammed, Sarina J. Ergas, and Mahmood H. Nachabe
20.4
8 September 2022 • Florida Water Resources Journal
Sewer Conversion 0.25 Table 1. Example of State Wastewater Projects Funded by Florida Department of Environmental Protection Wastewater Grant Program for Fiscal Year 2021-2022 (information on additional grants awarded can be found https://protectingfloridatogether.gov/state-action/grants-submissions)at FWRJ Continued on page 10
Communities 8 St.
The Clean Water State Revolving Fund 319 Grants and State Water Quality Assistance Grants programs support local government water quality improvement projects. These projects include the design, construction, or upgrades of wastewater or stormwater systems and nonpoint source pollution prevention projects. Similarly, the Florida Department of Environmental Protection (FDEP) is working toward county-specific septic upgrade incentive programs. A number of Florida counties and municipalities have received grants and initiated OSTDS conversion projects (Table 1), including sewer construction and expansion of wastewater treatment plants. Millions of dollars have also been allocated for future OSTDS conversion projects.
The goal of this study was to evaluate whether water quality improved in a receiving water body within a small urban watershed with a large number of OSTDS conversions and limited confounding factors. The Red Bug Slough (RBS) sub-basin of the Phillippi Creek watershed in Sarasota County was selected for this analysis because it’s a small urban watershed (<5 sq mi), with a large number of septic-to-sewer conversions and contains a small waterbody with a long history of water quality records.
Conversion of Onsite Treatment and Disposal Systems: Will it Improve Water Quality?
36.9
Hernando County Septic to Sewer Conversion River County West Wabasso Phase Septic to
CR 236
A
Jenelle A. Mohammed, M.S., EI, is a staff engineer II at Langan Engineering and Environmental Services in Tampa. Sarina J. Ergas, Ph.D., P.E., and Mahmood H. Nachabe, Ph.D., P.E., are professors in the department of civil and environmental engineering at the University of South Florida in Tampa.
South Central A, D
Additional
In Florida, approximately 2.5 million households utilize onsite treatment and disposal systems (OSTDS) for domestic wastewater. Conventional OSTDS (also known as septic systems) consist of a septic tank and a shallow subsurface drainfield. Treatment begins in the septic tank, where wastewater undergoes flotation, sedimentation, and biodegradation. Effluent is then transported to a drainfield and soil treatment area where pollutants are further treated via filtration, sorption, and biodegradation.Depending on site conditions, OSTDS may release elevated levels of nutrients, organic matter, and fecal indicator organisms to groundwater and surface waters (Swann, 2001). Florida requires a minimum lot size of 0.25 acres (Rule 64E-6.005.7[a] and [b], Florida Administrative code [F.A.C.]) and a minimum 2-ft separation from the drainfield bottom and wet season high water table at the OSTDS site; however, a larger separation distance is recommended between the drainfield and groundwater table for effective nutrient removal (Cox et al., 2019).
Island
Martin County Martin County Utilities Septic to Sewer Port Salerno/New Monrovia Lucie County North Hutchinson Septic
Hillsborough County Gibsonton Septic to Sewer Project
20
to Sewer 5.8
Tank Phaseout 0.4
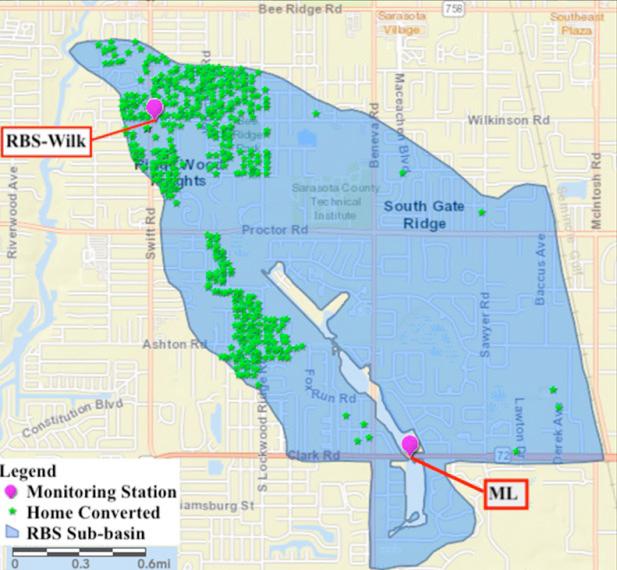
Methodology Site Description The Phillippi Creek watershed (Figure 1) is a large coastal watershed in Sarasota County comprised of six smaller sub-basins. The RBS sub-basin, at ~3 sq mi (Figures 2a and 2b), was a suitable area of interest, with water quality data covering pre- and postconversion eras. The drainage area is 69 percent residential, 0.1 percent recreational, and 0.5 percent agricultural. The RBS is a 2.8-mi stream flowing northwest, which discharges into Phillippi Creek; its catchment area drains approximately 1,925 acres. This
Many regions in Florida are experiencing water table elevation changes due to changes in precipitation patterns and sea level rise, resulting in loss of OSTDS treatment performance. Treatment can also be affected by soil permeability and organic content, lack of regular maintenance, and/or temporal variations in loading rates. Inadequate treatment can result in contamination of drinking water sources, eutrophication, and harmful algal blooms.
F, G
3
Marion County Silver Springs Shores Septic to Sewer, Phase Brevard County Merritt C, Septic to Sewer, Beaches Septic to Sewer, Septic
District A, Phase 1B 5 Indian
Orange County Wekiwa Springs Septic to Sewer Program
Island
to Sewer 16.4
Location Project Name Total Funding (~millions)
Sewer Conversion 1.6
Project:
City of High Springs Septic City of Apopka Camp Wewa Septic to
Despite the large investments in septicto-sewer conversions in Florida, there is a lack of information on whether these projects significantly improve water quality. It’s difficult to quantify the actual nutrient load reductions resulting from septic-to-sewer conversions due to natural attenuation processes in the subsurface (e.g., sorption, nitrification/denitrification). A number of confounding factors also make it difficult to pinpoint the impacts of septic-tosewer conversions, such as concurrent changes in land uses (e.g., from agricultural to residential) or changes in fertilizer ordinances.
Florida Water Resources Journal • September 2022 9 The P6 Di erence Zero Pump Maintenance 10-Year Wear Warranty Reduce OptimizeIncreasePolymerCakeSolidsSystemCONTACT:StephenGerberPHONE: 407 834 9104 EMAIL: sales@gerberpumps.com PATENTED www.p6polymix.com www.gerberpumps.com Want More from Your Belt Press? (Also Centri f uges and Screw Presses)


10 September 2022 • Florida Water Resources Journal
small catchment was also an ideal candidate, as it included minimal changes or confounding factors, as shown in Figure 1.
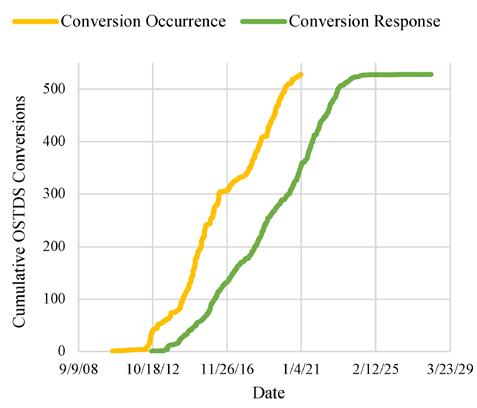
The OSTDS abandonment permits granted between 2000 and 2020 were obtained from the Florida Department of Health in Sarasota County. The permits were examined for “final inspection approvals,” as these indicated that construction was completed and homeowners were notified of sewer connection availability. In this area, 528 OSTDS located within 2 mi of the stream were converted between 2010 and 2021 (Figures 3a and 3b).The Sarasota County Water Atlas was the primary source of water quality data, as it contains data from various agencies, researchers, and volunteer groups. Data sets were obtained from Sarasota County coastal creeks and FDEP for total nitrogen (TN), total phosphorus (TP), ammonia-nitrogen (NH3-N), nitrate plus nitritenitrogen (NOx), turbidity, chlorophyll-a, and total suspended solids (TSS). A long record (>15 years) was available from sampling stations located at RBS near Wilkinson Road (RBS-Wilk) and upstream at Mirror Lake. Data sets were categorized into preconversion (January 2005 – July 2010) and postconversion (August 2010 –December 2020) periods. Confounding Factors Confounding factors evaluated for their potential influence on water quality included changes in land use (e.g., from agricultural to urban), water levels, fertilizer policies and practices (e.g., fertilizer restrictions or turfgrass•
RestorationEnvironmentalProtectionEnvironmentalDivisionofAssessmentand[DEAR],WatershedAssessmentSection
Data Sources
Continued on page 12 Continued from page 8 b b
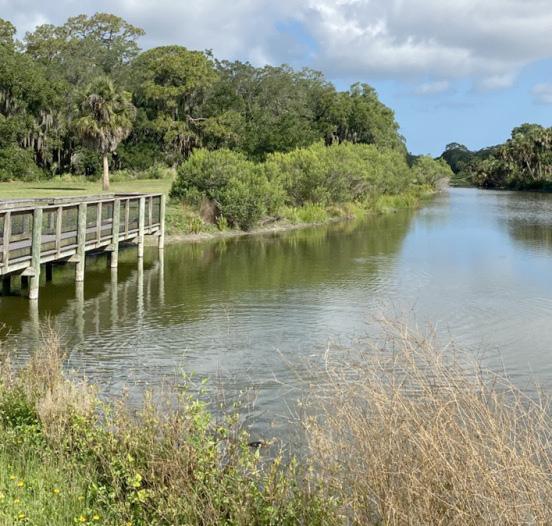
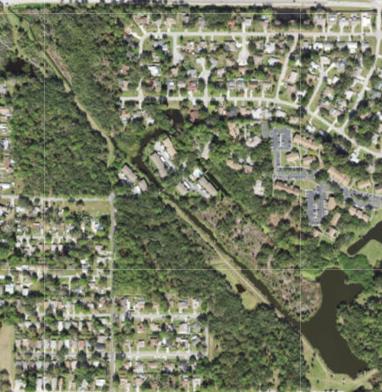
Figure 3. a) Spatial distribution of onsite treatment and disposal system conversions in RBS sub-basin during 2010-2020 and b) Progress of onsite treatment and disposal system conversions and expected dates for conversion impact. a Figure 2. a) Red Bug Slough site visit (credit: Jenelle A. Mohammed) and b) Aerial of Red Bug Slough, Sarasota County. (source: Google Earth, 2021) a Figure 1. Phillippi Creek Watershed and Red Bug Slough sub-basin. (source: Florida Department of )

Florida Water Resources Journal • September 2022 11 Water & Wastewater Process Treatment & Pumping Equipment SINCE Maintenance & Repair Service Available Copyright ©2021 Tencarva Machinery Company. All Rights Reserved. TM.FL.FWRJ.MU.11.16.2021


Changes in fertilizer policies were assessed through discussions with Sarasota County staff. Due to the large bird population in Mirror Lake, the influence of upstream levels on RBS was assessed by comparison and correlation of TN and TP concentrations at the lake and RBSWilk. Based on this analysis, the following factors did not cause substantial changes in nitrogen and phosphorus loads during the time of the study: S Land Uses. Prior to sewer construction and OSTDS conversions, the RBS sub-basin was largely built out and on septic. Between 2007 and 2017, there were no significant land use changes. No golf courses or wastewater treatment plant discharges (e.g., “package plants”) were located within the study site.
S Fertilizer Policies. Sarasota County’s fertilizer ordinances have remained unchanged since 2007.
Seasonality Water quality can fluctuate seasonally in response to changes in rainfall, surface runoff, groundwater recharge, or seasonal fertilizer bans.
Pooled monthly averages and standard deviations of water quality data were examined over the entire study period to examine seasonality impacts. Based on this analysis, three-month moving averages were applied to concentration data prior to trendline analysis.
A reference baseline concentration was established for each parameter using a oneand-a-half-year period (six months prior to and one year after conversion initiation). A time series analysis was used to generate trendline slopes of changes in TN, TP, chlorophyll-a, and turbidity concentrations in RBS for the pre- and postconversion eras. The annual streamflow in RBS was estimated by considering an annual water yield of 15 in. for the Sarasota region (U.S. Geological Survey). This value was combined with trendline slopes to estimate average nutrient load reductions (kg/year) for the postconversion period. The average nutrient load reductions were compared with the preconversion nutrient load from the 4,913 OSTDS in the RBS subbasin. Preconversion OSTDS nutrient loads were estimated by assuming 2.26 residents per household, a flow rate of 80 gal/capita/day and septic tank TN and TP concentrations of 60 mg/L and 10 mg/L, respectively.
12 September 2022 • Florida Water Resources Journal management), and bird influences. Land use and watershed data were accessed through ArcGIS layers and summarized land use distributions within the sub-basin using spatial analysis tools.
The TN, TP, NOx, NH3-N, turbidity, and chlorophyll-a values were evaluated using parametric t-tests to determine the statistical significance of pre- and postconversion means.
Data Analysis
annual
y = 0.98x 66.853 y = 1.63x + 3640.82100190017001500130011009007005001/14/04 10/10/06 7/6/09 4/1/12 12/27/14 9/22/17 6/18/20 (ug/L)AverageMovingMonth3 Sample Date Pre-Conversion Years Post-Conversion Years Baseline = 1500 ug/L Linear (Pre-Conversion Years) Linear (Post-Conversion Years) Figure 4. Time series of total nitrogen concentrations in Red Bug Slough. Parameter TN TP Chlorophyll a Turbidity PeriodPreconversionMean 1,196 ± (μg/L)85 316 ± (μg/L)21 5.67 ± (μg/L)0.03 4.46 ± 0.28 (NTU) PeriodPostconversionMean 1,338 ± (μg/L)106 275.4 ± 33.7 (μg/L) 5.73 ± (μg/L)0.04 4.08 ± 0.21 (NTU) TrendlinePostconversionSlope (μg/L/month)1.63 (μg/L/month)0.65 (μg/L/month)0.002 (NTU/month)0.01 Initial OSTDS Load 7.3x10⁴ (kg/year) 2.8x10⁴ (kg/year) Reduced Load Per Conversion 0.11 (kg/year) 0.04 (kg/year) T test (Pre versus TwoPost)-Tail p-Value *0.004 *0.007 0.96 0.09 Table 2. Time Series Analysis and T-Test Results for Red Bug Slough 180 73 813 924 383 348120010008006004002000 NH3-N Pre NH3-N Post Org-N Pre Org-N Post NOx Pre NOx Post (ug/L)AverageAnnual NH3-N Pre NH3-N Post Org-N Pre Org-N Post NOx Pre NOx PostPost Conversion YearsPre Conversion Years Figure 5. Red Bug Slough average NH3-N, Org-N, and NOX concentrations during the pre- and post-onsite treatment and disposal systems conversion periods. Continued from page 10 Parameter Nutrient Deficit Versus OSTDS RegressionConversionsAnalysisp-value Total Nitrogen 0.83 Total Phosphorus *0.007 Chlorophyll a 0.05 Turbidity 0.74 *statistically significant
Comparison of Pre- and Postconversion Water Quality Averages
Time Series Analysis
The following is a brief description of the data analysis methods used in this study. Additional details can be found in Mohammed (2021). Statistical tests were done at a 95 percent confidence interval, with p-values less than 0.05 used to determine the statistical significance.
Results and Discussion Time Series Analysis
Nutrient Deficit Analysis The regression of TN deficits (from the baseline) on the cumulative conversion impact date (accounting for the time lag) resulted in a slight, but not significant, positive relationship (Figure 6), suggesting that TN decreased as OSTDS conversions increased over time. A similar analysis of TP data revealed a significant decrease in TP, as OSTDS were converted to sewerage (Table 3). No significant correlations
Regression analysis
Florida Water Resources Journal • September 2022 13
Nutrient concentration deficits upstream of RBS-Wilk were calculated for the postconversion era by subtracting the concentration of each parameter from its preconversion baseline. A time lag is expected before water quality changes in response to OSTDS conversions (Figure 3b). The magnitude of the time lag is locationspecific and may range from months to decades, depending on hydrology, soil properties, vegetation, and pollutant sorption properties (Meals et al., 2010). In this study, the lag time was estimated based on the elapsed travel time of OSTDS effluent discharge to the slough, which was calculated from the conversion date, distance of the conversion site to the slough, and average groundwater velocity. A regression analysis of nutrient deficit versus conversion impact date (considering the lag period) was then used to examine whether the increase in septic conversions over time resulted in long-term nutrient concentration deficits.
Although chlorophyll-a is not a constituent of OSTDS effluent, high concentrations indicate nutrient overenrichment, resulting in increased phytoplankton and algae growth (Cowell and Dawes, 2004); however, changes in chlorophyll-a concentrations during the postconversion era were not significant (Table 2). Turbidity concentrations exhibited little seasonality, and changes in turbidity during the postconversion era were not significant. Variations in turbidity may occur due to algal blooms, transport of suspended particles by stormwater runoff, or resuspension of particles during severe weather events. The slight postconversion decline in turbidity (-0.01 nephelometric turbidity units [NTU]/month) could be attributed to reduced algal blooms due to reduced nutrient loads or reduced baseflow in RBS as OSTDS were removed from the sub-basin.
Nutrient Deficit Analysis
The average NH3-N, Org-N, and NOx concentrations for the pre- and postconversion eras are summarized in Figure 5. The NH3-N (p = 0.000034) and NOx (p = 0.002) concentrations significantly decreased during the postconversion era, while changes in Org-N concentrations were not significant (p = 0.59). The OSTDS can be substantial contributors to NH3 in regions, such as Florida, where seasonal high water tables do not provide enough of an unsaturated soil layer for nitrification (Bloetscher and Van Cott, 1999). High NOx levels prior to OSTDS conversions may have been due to limited denitrification in low organic content soil (Lusk et al., 2018). The OSTDS can produce nitrate concentrations between 25 and 80 mg N/L at the groundwater tables (McCray et al., 2005), but these concentrations decrease due to dilution and denitrification as the water flows toward the surface water systems. The Org-N was the most prevalent form of nitrogen in RBS throughout the study period, which is not commonly associated with OSTDS effluents, indicating other sources, such as bird feces, live or dead organisms, or organic solids from the catchment’s surface runoff.
Figure 6. of
The time series analysis of the three-month moving average TN concentrations (Figure 4) revealed high variability in TN over time; the highest TN levels were typically observed during the wet season, most likely due to surface runoff. A postconversion decline in TN concentration from a baseline of 1,500 µg/L at a rate of -1.63 μg/L/month was calculated. Based on the water yield in the slough and the slope of the regression line, an average load reduction of 58.2 kg-TN/ year was estimated for the postconversion era (August 2010 to December 2021). This change in TN load represented a 0.08 percent reduction from the preconversion OSTDS TN load. In contrast with TN, the highest TP levels were observed during the dry season, possibly due to Sarasota County’s fertilizer blackout period during the wet season. The slope of the postconversion TP concentration trendline (-0.65 μg/L/month; Table 2) suggested a 23.1 kg-TP/year load reduction due to the OSTDS conversion program. The small reduction in TP is not surprising, as phosphorus adsorbs to soil particles or is stored in groundwater before slowly bleeding out to the slough (Withers et al., 2011). Changes in TP accounted for a 0.2 percent reduction from the initial OSTDS TP load. An analysis of the chlorophyll-a data showed significant seasonality, with the highest concentrations during the wet season.
-200-400-6000200400600800 0 50 100 150 200 250 300 350(ug/L)DeficitTN Total OSTDS Conversions
total nitrogen deficit on total onsite treatment and disposal systems conversions. Parameter Nutrient Deficit Versus OSTDS RegressionConversionsAnalysispvalue Total Nitrogen 0.83 Total Phosphorus *0.007 Chlorophyll a 0.05 Turbidity 0.74 *statistically significant Parameter Nutrient Deficit Versus OSTDS RegressionConversionsAnalysispvalue Total Nitrogen 0.83 Total Phosphorus *0.007 Chlorophyll a 0.05 Turbidity 0.74 *statistically significant Table 3. Regression Analysis Results Reflecting Statistically Significant or Insignificant Changes in Water Quality Parameters Continued on page 14
Comparison of Pre- and Postconversion-Era Water Quality Averages
Acknowledgments
• Lusk, M., Toor, G., Obreza, T., 2018. Onsite sewage treatment and disposal systems: phosphorus. Retrieved Oct. 13, 2021, https://edis.ifas.ufl.edu/publication/SS551.from
• Bhateria, R., Jain, D., 2016. Water quality assessment of lake water: a review. Sustainable Water Res. Mgmt., 2(2), 161-173. https://doi. org/10.1007/s40899-015-0014-7.
Confounding Factors Due to a lack of reliable water level data during the postconversion era (data not shown), it’s not clear whether nutrient concentrations were influenced by changing flow rates in RBS. The lack of data also limited the ability to determine whether OSTDS removal from the sub-basin reduced aquifer recharge and baseflow return to RBS and Phillippi Creek.
Mirror Lake is a 17-acre private lake located upstream of RBS-Wilk (Figure 3a). The TN levels in the lake exceeded the FDEP Numeric Nutrient Criteria TN threshold of 1,650 μg/L (Figure 7). Sources of TN in the lake include upstream watershed input, in-lake nitrogen fixation, and inputs from a large population of migrating birds. The TN samples from the lake also had high variability, possibly due to seasonal bird migration patterns (Bhateria and Jain, 2016). The TN concentrations in RBS were consistently lower than those in the lake, indicating natural attenuation processes in the stream.
Also, many thanks to John Ryan and Ashlee Edwards at Sarasota County Public Works, and David Hoover at the Florida Department of Health, for their contributions, attendance at meetings, and assistance with data collection for this study. This study was funded in part by the Florida Department of Health Onsite Sewage Research Program. The views expressed are solely those of the authors and do not necessarily reflect views and policies of the Florida Department of Health. References
• Mohammed, J.A., 2021. An assessment of nutrient improvement in surface water due to the conversion of onsite sewage treatment and disposal systems to sewerage. MS Thesis, Department of Civil and Environmental Engineering, University of South Florida.
• Withers, P.J.A., Jarvie, H.P., Stoate, C., 2011. Quantifying the impact of septic tank systems on eutrophication risk in rural headwaters. Envir. Int., 37(3), 644-653. https://doi. org/10.1016/j.envint.2011.01.002. S 11/26/16 4/10/18 8/23/19 1/4/21 Date Station ML Station RBS-Wilk 1650 ug/L TN Critera (FDEP)
(ug/L)NitrogenTotal
14 September 2022 • Florida Water Resources Journal were observed between chlorophyll-a or turbidity and OSTDS conversions (Table 3). The results of the nutrient deficit analysis were consistent with the time series analysis presented.
Conclusions When properly designed, sited, and maintained, OSTDS can effectively remove organic matter, suspended solids, and pathogens from domestic wastewater in areas not served by public sewage systems. Conventional OSTDS, however, are not designed to remove nutrients, and may contribute to enrichment of surface waters. These systems are especially vulnerable to climate change-induced alterations in water table elevations and increased precipitation. To limit anthropogenic contributions of nutrients, certain regions can benefit from conversion of OSTDS to centralized sewers. This study focused on water quality changes after OSTDS conversion in Sarasota County. Statistically significant improvements were observed in TN and TP levels in RBS during the postconversion period. The NH3-N and NOx levels, commonly associated with OSTDS effluents, significantly decreased. Changes in Org-N, chlorophyll-a, and turbidity were not significant, reflecting other transport and transformation processes within the sub-basin; however, the observed rates of improvements (-0.65 μg/L of TP/month and -1.63 μg/L of TN/month) are considered slow. The OSTDS conversions, therefore, should be considered a long-term strategy for reducing nutrient concentrations, rather than a response to Florida’s urgent and pressing need to address major issues, such as algal blooms. The modest improvements in water quality in RBS are not surprising, given the small fraction of conversions in the sub-basin, the relatively large lot sizes (7,000-11,000 ft2), and the distance separating conversion sites from the slough. This results in long groundwater travel times and the opportunity to attenuate and assimilate nutrients in the local environment. It’s recommended that government agencies prioritize OSTDS conversion projects in regions with poor water quality near high densities of OSTDS, small lot sizes, short distances to surface waterbodies, and high water table levels.
• Bloetscher, F., Van Cott, W.R., 1999. Impact of septic tanks on wellhead protection efforts. Florida Water Resources Journal, 51(2), https://www.fwrj.com/articles2/9904.pdf.38-41.
Continued from page 13
• Cowell, B.C., Dawes, C.J., 2004. Growth and nitrate-nitrogen uptake by the freshwater cyanobacterium Lingpa wollei, J. Aquatic Plant Mgmt.. 42: 69-71. https://www.apms.org/japm/ vol42/v42p69.pdf.
• Cox, A., Loomis, G., Amador, J., 2019. Preliminary evidence that rising groundwater tables threaten coastal septic systems. J. Sus. Water Built Envir., 5(4). https://doi. org/10.1061/jswbay.0000887.
• Meals, D., Dressing, S., Davenport, T., 2010. Lag time in water quality response to best management practices: a review. J. Envir. Quality, 39(1), 85-96. https://doi.org/10.2134/ jeq2009.0108.
8000700060005000400030002000100007/15/15
The authors would like to thank Dr. Xueqing Gao, environmental consultant, and Dr. Eberhard Roeder, environmental administrator, at the FDEP Onsite Sewage Program for their valuable contributions throughout this research project.
Figure 7. Comparison of total nitrogen concentrations in Mirror Lake and Red Bug Slough.
• McCray, J.E., Kirkland, S.L, Siegrist, R.L., Thyne, G.D., 2005. Model parameters for simulating fate and transport of onsite wastewater nutrients. Ground Water, 43(4), 628-639. 6584.2005.0077.x.https://doi.org/10.1111/j.1745-
• Swann, C., 2001. The influence of septic systems at the watershed level. Watershed Protection Techniques, 3(4), 821.
Florida Water Resources Journal • September 2022 15 Operators: Take the CEU Challenge! Members of the Florida Water and Pollution Control Operators Association (FWPCOA) may earn continuing education units through the CEU Challenge! Answer the questions published on this page, based on the technical articles in this month’s issue. Circle the letter of each correct answer. There is only one correct answer to each question! Answer 80 percent of the questions on any article correctly to earn 0.1 CEU for your license. Retests are available. This month’s editorial theme is Emerging Issues and Water Resources Management. Look above each set of questions to see if it is for water operators (DW), distribution system operators (DS), or wastewater operators (WW). Mail the completed page (or a photocopy) to: Florida Environmental Professionals Training, P.O. Box 33119, Palm Beach Gardens, Fla. 33420-3119. Enclose $15 for each set of questions you choose to answer (make checks payable to FWPCOA). You MUST be an FWPCOA member before you can submit your answers! SUBSCRIBER NAME (please print) Article 1LICENSE NUMBER for Which CEUs Should Be Awarded Article 2LICENSE NUMBER for Which CEUs Should Be Awarded Article 3LICENSE NUMBER for Which CEUs Should Be Awarded If paying by credit card, fax to (561) 625-4858 providing the following information: (Credit Card (ExpirationNumber)Date) EARN CEUS BY ANSWERING QUESTIONS FROM PREVIOUS JOURNAL ISSUES! Contact FWPCOA at membership@fwpcoa.org or at 561-840-0340. Articles from past issues can be viewed on the Journal website, www.fwrj.com. 1. Which of the following are onsite treatment and disposal systems not designed to remove? a. Pathogens b. Organic matter c. Nutrients d. Suspended solids 2. _____________ adsorb(s) to the soil or is (are) stored in groundwater.a.Carbonaceous biological oxygen demand b. Dissolved solids c. Nitrogen d. Phosphorus 3. In the time series analysis, preconversion nutrient loads a flow rate of ____ gallons per capita per day. a. 2.26 b. 10 c. 60 d. 80 4. High concentrations of ___________ indicate nutrient overenrichment, which can increase phytoplankton and algae growth.a.phosphorus b. nitrogen c. chlorophyll-a d. turbidity 5. Which of the following is not recommended as a priority consideration for governments considering online septic tank and disposal system conversions? a. Type of property (residential versus commercial) b. Lot size c. Distance to water bodies d. Water table levels Lead and Copper Rule Revision Compliance and Funding Strategies for Systems With and Without Lead Service Lines Christopher Hill, Quirien Muylwyk, and John Konkus (Article 2: CEU = 0.1 DW/DS02015409) Conversion of Onsite Treatment and Disposal Systems: Will it Improve Water Quality? Jenelle A. Mohammed, Sarina J. Ergas, and Mahmood H. Nachabe (Article 1: CEU = 0.1 WW02015410) 1. The replacement of ____________ is expected to be undertaken opportunistically, whenever discovered in the system. a. copper pipe with nonlead core solder b. copper pipe with lead core solder c. service brass d. lead connectors 2. The compliance date for the Lead and Copper Rule Revisions is/ wasa.January 2021. b. Dec. 16, 2021. c. Oct. 16, 2024. d. Dec. 31, 2024. 3. The Lead and Copper Rule Revisions establish a new lead trigger level of ____ micrograms per liter. a. 10 b. 13 c. 15 d. 90 4. A water system that exceeds the action level must implement full lead service line replacement at a rate a. approved by the state. b. approved by the U.S. Environmental Protection Agency (EPA). c. of 3 percent per year. d. of 5 percent per year. 5. The Lead and Copper Rule Revisions identify single-family ser vices of copper with lead solder as Tier ___ sampling sites. a. 1 b. 2 c. 3 d. 4
A special thank you was given by Tom King, Education Committee chair, to Jeff Elder for his tireless work on completing the water distribution manual, which was distributed to students at this event. Elder is an amazing water distribution instructor, and fortunately, he was recently selected to be on the FDEP Exam Review Committee, which will help ensure the quality of the state exams.
Let this also be a huge thank you to all of the instructors who voluntarily give their time and knowledge during these short school events, and also at the regional CEU courses; most of them have been doing so for decades.
In 2007, he developed online training courses with CEU Plan for drinking water and distribution operators across the United States. After Joe retired, he returned to his roots in Ohio, enjoying fishing whenever he wanted.
The FWPCOA 2022 Fall State Short School, held August 1-5, 2022, at the Indian River State College in Fort Pierce had a lower attendance than usual (198 students), but from speaking with the students and instructors, there was great engagement within the classes.
On Wednesday at the short school, the awards luncheon was a huge success; the food was absolutely delicious, catered by Carter’s, and the students showed respect for the award
FWPCOA 2022 Fall State Short School
S Scott Ruland received the Joseph V. Towry Reclaimed Water Service Award S Phil Donovan for his many years of service as FWPCOA Publicity Committee chair S Tim McVeigh for building and managing the FWPCOA Online Institute S Darin Bishop for his work in developing the FWPCOA training library
It’s very hard to call out everyone who has done amazing things when you have so many folks that deserve recognition, but I’m throwing one more in here: Thank you to Shirley Reaves, FWPCOA’s training coordinator; there are very few of us who would really want to walk a mile in her flip flops.
Part of the succession plan for maintaining FWPCOA’s training schools is to have new folks who want to get involved in training shadow current instructors, which will help us in maintaining quality training classes through thick and thin. There were a number of trainees at the short school, some who jumped right into the fire and performed fantastically.
Many members of the Education Committee have been working on the different disciplines, and with the outstanding performance from ProEdit, the FWPCOA training library is getting closer to being completed. These manuals will give others a real run for their money: they will belong to FWPCOA and will be course work criteria that could be used throughout the U.S.
C FACTOR
16 September 2022 • Florida Water Resources Journal
Florida Water Resources Conference
recipients by hanging around during the presentation of the awards. Renee Moticker presented the usual awards given during the fall state short school luncheon, and Chuck Nichols presented the safety awards. There were a few other awards and recognitions that were preemptively given at the Sunday board of directors meeting due to the recipients not being able to return to Ft. Pierce midweek. They were as follows:
He was the operations, treatment, and laboratory supervisor for the City of Akron Water Department from 1952 to 1982. He then became the treatment supervisor for the City of Tampa Water Department from 1982 to 1993. From 1993 to 2006, he was the plant manager, southeast sales manager, and senior technical service adviser for Kemiron Inc.
In Memory of Joe Habraken Joe Habraken
President, FWPCOA
Patrick Murphy“Murf”
During the FWPCOA board of directors meeting, recently held on July 22, several tributes were offered as testimony to Joe’s character and commitment to his profession and his fellow operators. He will be missed.
The Florida Water Resource Conference (FWRC) is now going to be held May 31 to June 3, 2023, in Orlando at the Gaylord Palms Resort and Convention Center. This is a move from the original Mother’s Day weekend dates to two days after Memorial Day as the start, which is a Wednesday. I’m sure I’ll be confused even though I’ll have a program in my hand
Another leader in our industry has passed Joe Habraken died on July 10, 2022. I didn’t know him, even though we sat at opposite sides of the rooms we were in during Exam Review Committee meetings, or I was in the audience at presentations he gave during his tenure as an officer for FWPCOA.
Joe was Ohio water treatment operator 111, wastewater operator 1 (retired), and had Florida water plant operator A license 0004426. He held many offices and received many awards in the industry, including: S President of FWPCOA (1994) S Pat Flanagan Award (1996) S Inducted into the Florida Select Society of Sanitary Sludge Shovelers by Bill Allman (1997) S FWPCOA honorary life member (2001) S Chair of FWPCOA Education Committee and CEU Committee S Past member and past chair for the National Top Ops Committee of Florida Section AWWAJoewas an active member of the Florida Department of Environmental Protection (FDEP) Exam Review Committee starting in 1984, instructed water plant operator courses for the Ohio Operator Training Committee, instructed required Florida water plant operator courses at Hillsborough Community College and Pinellas Vocational and Technical Institute, and had been an instructor at FWPCOA state and regional short schools for over 20 years. He also contributed to the California State University in Sacramento course manuals, writing a good portion of the coagulation section, specifically the marble test.


Finally, I want to thank all the hardworking people in our industry. Thank you for doing all you do every single day! Let’s keep that water clean! S
Some believe having it start during the week will actually help with attendance from the beginning to the end. Regardless of when it starts, this event provides the most amazing offerings of technical programs, exhibits, awards luncheons, meetings, contests, competitions, networking, and other events. There is something for everyone in the water and wastewater industry to enjoy, and you get continuing education units (CEUs) and professional development hours (PDHs) doing some of Thisit! change will move the FWPCOA Operators Showcase to Wednesday, May 31, and held from 2 to 4 p.m. This will be the sixth showcase and I encourage you to plan on attending. We will make sure there’s a great presentation, and as always, free beer! There are several FWPCOA awards that are presented at the FWRC awards luncheon and annual meeting, and the recipients will be announced later. This is a great opportunity to acknowledge outstanding individuals in our association.Theawards are: S David B. Lee Award – Based on the operator’s plant operations and activities within FWPCOA. S Pat Flanagan Award – Given to an associate member, based on their assistance to operators and their contribution to FWPCOA. S Richard P. Vogh Award – Given to the region judged most progressive during the year.So, start thinking about your nominees now and set a calendar reminder to send those nominations to FWPCOA around January or February of 2023. At the FWRC luncheon, please stay until the awards are presented and give the recipients a huge round of applause for their service to our industry and our association.
Well, since this column was supposed to be on water resources management, which is one of the themes for this month’s magazine, I must throw in one item. The water resources management division of the City of Plant City recently developed some public outreach educational videos, and they are being posted on the city’s YouTube and Facebook pages. For YouTube access, tag it, then do a search for City of Plant City; there should be a string of the videos that Plant City posts. Bill McDaniel, our city manager, does so many and they are very good. You might have to scroll around a bit to find them. The mastermind behind these videos is John McGee, environmental coordinator for Plant City, and though he is a genius, I still am not sure why he scraped the bottom of the trickling filter for zoological film to have me star in the Fryedvideos.EggProductions is producing the clips, and every two weeks a new one will be posted, with six in total. The topics include illicit discharges, water conservation, Floridafriendly landscaping, and stormwater, and all will include me as some know-it-all expert (those that know me will see the real humor in that). I’ll be a cowboy in one, a greaser, a hippie, and unfortunately for all, a superhero. This one hasn’t been filmed yet, since they are having a hard time finding a pair of tights that will stretch that much!
Online Training Institute
Florida Water Resources Journal • September 2022 17 well in advance, but I’m just so used to having a weekend start to the conference.
fwpcoa.org and selecting the “Online Institute” button at the upper right-hand area of the home page to open the login page. You then scroll down to the bottom of this screen and click on “View Catalog” to open the catalog of the many training programs offered. Select your preferred training program and register online to take the course. This is a great way to get those needed CEUs for your license renewal. For more information, contact the institute program manager at OnlineTraining@fwpcoa.org or the FWPCOA training office at training@fwpcoa. org. Water Resources Management

Can I have a round of applause for everyone who makes the magic happen in the Central Florida Chapter (CFC)! The CFC serves eight counties and approximately 350 members. Planning CFC’s annual program is truly an art form as volunteers diligently work to bring great value to our members and the community.
S Chair: Michael Demko, P.E. S Vice Chair: Tucker Hunter, P.E. S Past Chair/Director at Large: Megan Nelson, P.E. Megan Nelson, M.S., P.E., is with Orange County Utilities in Orlando and serves on the FWEA Board of Directors as the director at large for the Central Florida Chapter.
Megan L. Nelson
18 September 2022 • Florida Water Resources Journal FWEA CHAPTER CORNER
Thanks to the Central Florida Chapter’s 2022-2023 virtual and sustaining partners.
Generous contributions help bring added value to members and the community
Central Florida Chapter members enjoy great company at their April leadership appreciation social to thank volunteers and sponsors for their dedication and contributions.
Melody Gonzalez
S Outstanding marketing, recruiting, and public relations opportunities S Opportunity to “host” a chapter networking event by selecting a date and location for the event and enjoying greater event visibilityWelook forward to continue growing as we further FWEA’s mission to keep our central Florida community connected, engaged, and informed. We are grateful to develop our relationships with our partners, volunteers, and champions as we continue elevating our community.Formore information regarding the CFC, please reach out to the chapter leaders:
Furthermore,leadership.CFC made year-end contributions to the Florida Water Environment Association (FWEA) general fund, Norm Casey Scholarship, and Gabe Delneky Scholarship.
Welcome to the FWEA Chapter Corner! The Member Relations Committee of the Florida Water EnvironmentvAssociation hosts this article to celebrate the success of recent association chapter activities and inform members of upcoming events. To have information included for your chapter, send details to Melody Gonzalez at gonzalezm@bv.com.
Central Florida Chapter Thanks Our Community Partners
Thanks to the support of 29 community partners in Fiscal Year (FY) 2021-2022 we were able to host five technical sessions, five networking events, one UCF student event, two civic events, a highly successful golf tournament, and many opportunities for volunteers to engage in local and state
S
Congratulations to the University of Central Florida (UCF) student award recipients: S Nino Stea S Alonso Sucasaca S Christopher Carrino We’re honored to support you. We are so proud of the work we do with CFC and have so much support in bringing this great annual program to life. We are thrilled to announce that we have confirmed 28 total community partners for FY 2022-2023. This includes three new companies who are new to our program—wow!Ourcommunity partners are highly engaged in our annual program and they also enjoy additional benefits of sponsorship including: S Advertisement associated with technical and social events S Advertisement in our member communications S Visibility within our association website and/or event banners S Complimentary registrations for select chapter events


Florida Water Resources Journal • September 2022 19 WATER TECHNOLOGIES Available Veolia's Actina™ Pellet Softening technology is a compact, reliable and robust system used for the removal of hardness, iron and manganese with no mechanical components making it easy to operate with low operating costs. Actina™ Enhanced offers the addition of a coagulant/oxidant upstream of the reactor to maximize metals and organics removal while also softening the water. No additional sludge treatment or waste brine disposal is needed with this energy saving technology. Waste pellets can be repurposed allowing for more disposal options that can impact global Ecological Transformation. usmunicipal@veolia.com www.veoliawatertech.com Actina™ is exclusively represented in Florida by MTS Environmental. Visit us at mts-florida.com PilotAilblTesting Waste Disposal and Repurposing Options with Pellet Softening Solution
Robert Bierhorst,
Jr. Wesley Chapel, FL 813-929-4454 Eric Peters P.E. Lakewood Ranch, FL 941-773-5051 Wade 321-299-2395Tampa,WoodFL


20 September 2022 • Florida Water Resources Journal
S Field investigations, including nondestructive testing or visual check of the interior, observations at the meter, and pothole investigations. Experience has shown that multiple pothole excavations may be necessary, particularly where there is a history of partial LSL replacement or where there is evidence of a service line repair. S Water quality sampling as an indicator of lead. If using water quality data to identify possible LSL locations, it’s important to consider the role of CCT and its potential impacts on water quality. For example, a water quality profile can be used to observe changes in lead concentrations from the tap to the water main. Observed increases in lead concentration in samples collected away from the water main can be indicative of an LSL; however, a system using an orthophosphate inhibitor might see little variation in lead and should be cautious about assuming that a service line is nonlead based solely on water quality. The threshold lead concentration used to indicate lead will vary by water system, and thus, calibration will be necessary to demonstrate the efficacy of water quality sampling to find lead.
Christopher Hill and Quirien Muylwyk
One of the most challenging things about the LCRR may be confirming the nonlead status for an individual property or water system. The EPA guidance issued in August 2022 provides several options for verification of service line materials, including visual inspections, water quality sampling, excavation, and predictive modeling; however, the guidance does not prescribe a particular method, nor does it prescribe details for a given method (e.g., how many locations on a service line should be excavated). As such, a recommended first step is to meet with the state or primacy agency to establish expectations for the LSL inventory, including what’s required to
All water systems, including those that do not have LSLs, are required to create a publicly accessible service line inventory by Oct. 16, 2024.
Confirmation of Nonlead Status
1.designations.KnownLSLs will be labeled “lead service lines.”
The LCRR mark the first significant changes to the original Lead and Copper Rule in nearly 30 years. The rule intends to reduce the risk of lead in drinking water, better protect children from the risk, and empower communities by providing more information about the risk and occurrences. The rule seeks to accomplish these objectives by using testing to find more sources of lead, requiring testing in schools and childcare facilities, identifying lead service line (LSL) locations, and driving LSL replacements.
4. Service lines known to be “nonlead” can be designated as such.
A nonlead designation does not require the water system to identify the exact material of a service line, such as plastic or copper, if it’s not an LSL or galvanized requiring replacement service line. It’s also worth mentioning that the LCRR does not require water systems to investigate or inventory lead connectors (i.e., goosenecks or pigtails); however, the replacement of lead connectors is expected to be undertaken opportunistically when discovered in the system.
Service lines will be given one of four possible
This article focuses on three specific areas of the LCRR—service line inventories, lead service line replacement (LSLR) planning, and changes in compliance monitoring—and strategies to take advantage of available funding for LSLR.
2. Galvanized service lines that are or were previously downstream of an LSL will be designated “galvanized requiring replacement.”
The LCRR will impact every public water system in the United States in some way. The magnitude of the impact and the approach to complying with the rule is most impacted by the presence of LSLs. Those without LSLs may mistakenly believe that their absence means the rule will not impact them; this is not the case, and the absence of LSLs may make complying with some parts of the rule even more challenging.
Developing a Service Line Inventory and Understanding Lead and Copper Rule Revisions Compliance Risk
The Lead and Copper Rule Revisions (LCRR) were finalized in January 2021. In June of 2021, the U. S. Environmental Protection Agency (EPA) affirmed the rule requirements and extended the effective date of the LCRR to Dec. 16, 2021, and the compliance date to Oct. 16, 2024.
Helping multiple utilities find and document lead services involved a range of different methods, including: S Desktop reviews of historical data, building codes and ordinances, maintenance records, staff knowledge, and other sources of data, such as a geographical information system (GIS) and asset management information.
The LCRR include a number of key provisions, including changes in corrosion control treatment (CCT) requirements, find-andfix provisions for homes with elevated lead levels, sampling requirements for schools and childcare facilities, and additional public outreach and education requirements.
Compliance and Funding Strategies for Systems With and Without Lead Service Lines
Christopher Hill is drinking water market sector leader with AECOM Technical Services in Tampa. Quirien Muylwyk is water quality technical director with AECOM Technical Services in Toronto, Ont.
Developing an inventory will be an iterative process due to the availability of records that may be incomplete or erroneous, the presence of unknown service lines, and the need to update the inventory over time. The inventory must be updated to reflect changes, such as verification of unknown service line materials or LSLs, that have been replaced. Water systems with only nonlead service lines are required to conduct an initial inventory and are not required to provide inventory updates. They may fulfill the requirement to make the inventory publicly accessible with a statement that there are no LSLs, along with a general description of the methods used to make that determination.
FWRJ Continued on page 22
3. Service lines of unknown material are to be labeled “lead status unknown service lines.”
Lead and Copper Rule Revisions
Whether you are looking to see how the LCRR might impact your community or will need funding for potential service line replacements, AECOM can help you develop a cost-effective compliance and funding strategy that will benefit your community. As one of the most trusted firms in the water industry, we have offices throughout the state of Florida.
The Lead and Copper Rule Revisions (LCRR) will impact every community water system across the U.S. To bring clean water to everyone, we are helping large cities and small towns develop LCRR compliance and funding strategies tailored to their unique needs.
Contact: Chris christopher.hill@aecom.comHill
Get the lead out

A transparent prioritization framework can be Machine learning can be an effective means of identifying lead service line locations and prioritizing replacement. Lead service line replacement plans are due by October 2024. Though replacement may not be required, the availability of funding should make replacement a priority for most systems.
Where the risk of exceeding the AL or TL is high (primarily systems with LSLs) there is a financial incentive to investigate unknown service lines, specifically as it relates to LSL replacements and the number of required replacements when a system exceeds the AL or TL. The number of replacements is based on a percentage of the total number of LSLs, galvanized service lines requiring replacement, and unknown status service lines. Reducing that total can reduce the number of required replacements.
The rule does not require mandatory LSL replacement unless a system exceeds the AL or TL; however, replacement of the publicly owned portion of the service line is required when replacement of the privately owned portion is initiated by a customer.
Though EPA opted not to lower the lead action level (AL) from its current value of 15 µg/L,
Continued from page 20
22 September 2022 • Florida Water Resources Journal demonstrate that a service line is nonlead versus lead status unknown. While there is no deadline to investigate the material of all lead status unknown service lines, water systems must include a strategy in their LSLR plan for investigating the unknowns in their inventory. This strategy, coupled with the incentive to investigate unknowns to ease the burden of future LSLR, will encourage water systems to verify unknown service line materials in a timely manner. The LCRR states that service lines installed after a state or federal ban on the use of lead may be designated as nonlead. Beyond that, an approach that balances the risk of lead exposure and the cost to conclusively determine that there is no lead (conduct water quality sampling, perform interior and pothole inspections, etc.) and prioritizes service line material confirmation based on that risk is recommended. For example, a household childcare facility located in an area where LSLs are known to exist is a relatively higher priority for confirmation. Alternatively, a service line at a home near an area where a water main was recently replaced and all of the homes were observed to have copper service lines is a lower priority for investigation (or could even be designated as nonlead based on discussions with the state or primacy agency).
As such, water systems should develop service line replacement policies and procedures, inclusive of construction materials and methods, customer outreach, and funding strategies, before October 2024.
The plan must include a strategy to investigate lead status unknown service lines. Thus, while a system with no LSLs does not need to prepare an LSLR plan, a system that believes it has no LSLs, but has a number of lead status unknown service lines, must still submit an LSLR plan. That plan must identify the strategy for investigating lead status unknown service lines.
Lead Service Line Replacement Planning to Reduce the Risk of Lead Exposure
the revisions establish a new lead trigger level (TL) of 10 µg/L. Compliance and associated actions by a water system are based on the 90th percentile of lead monitoring results in comparison to the AL and TL.As stated, water systems with LSLs are required to submit an LSLR plan by Oct. 16, 2024.
A water system that exceeds the AL must implement full LSLR at a rate of 3 percent per year, and a water system that exceeds the TL must implement LSLR at an annual rate approved by the state. In both scenarios, LSLR can be discontinued after two consecutive years of monitoring below the TL.The LSLR plan must describe how replacements are prioritized. It’s recommended that LSL replacement be prioritized based on risk; however, risk is relative. A water system with relatively few LSLs may prioritize individual replacements based on lead levels at a particular home and/or based on the risk to occupants; on the other hand, a system with a significant number of replacements may prioritize both individual sites and geographic areas based on risk.
It’s recommended that the following factors be considered to prioritize replacements: S Location, distribution, and density of LSLs S Sociodemographic factors that reflect the consequence of lead exposure S Construction constraints and opportunities to minimize community disruption When all three are considered, a balance between public health protection and construction efficiencies can be realized. Experience suggests that LSL occurrence often coincides with household income, and therefore, sociodemographic indicators for poverty, education, and other factors can be used with the lead inventory to determine which areas of a water system might be given higher priority. Consideration should also be given to construction opportunities (e.g., water main rehabilitation projects) to realize cost efficiencies.


Continued on page 24
Figure 1 compares lead statistics for a system that collects 100 samples twice per year under the current Lead and Copper Rule (LCR), which is a minimum of 50 percent single-family structure [SFS)] served by an LSL and 50 percent SFS served by a copper service line with lead solder installed prior to 1982, and LCRR (SFS served by LSLs only). The results show significant increases in lead statistics when only homes served by an LSL are considered.Underthe LCR or current sampling protocol (columns labeled “50:50”), the 90th percentile lead concentration is well below the AL and appears to be comfortably below the TL; however, exclusion of the copper service line sites (columns labeled “LSL only”) results in a 90th percentile lead concentration that exceeds the TL in each of the first two years evaluated and approaches the TL in the third year. When additional LSL sites are added (i.e., new LSL sites are substituted for the copper service line sites), this system may be at even more risk of exceeding the TL, and perhaps the AL.Figure 1 only considers the impacts of the change in sampling location; the potential impact on lead concentrations due to the fifth liter sample in homes with LSLs can be seen in Figure 2. In this instance, the increase in total lead concentration was not significant (maybe 20 to 30 percent), but it was sufficient to push the value at this home over the TL.When considered together, the focus on locations with LSLs and the shift to a fifth liter sample could significantly impact a water system’s compliance status, resulting in the need to optimize or study corrosion control treatment and/or initiate LSL replacement. For those systems without LSLs or with a number of unknown lead status service lines, the impacts of the changes in sampling are not expected to be significant; however, if a system has galvanized service lines that were previously downstream of an LSL, those sites would need to be added to the compliance monitoring.
Revised compliance monitoring will begin in 2025. Sample site selection under the LCRR will be based on a new set of tiering criteria (Table 1) that prioritize structures served by an LSL. For Tier 1 and 2 sites, a first liter and a fifth liter must be collected and analyzed; the first liter will be analyzed for copper and the fifth liter for lead. For all other sites, a first draw one-liter sample will be collected and analyzed for lead and copper.
The prioritization of sampling at sites served by an LSL could result in significant increases in the statistics used to determine LCRR compliance.
Additional guidance is anticipated from EPA to clarify compliance monitoring site selection and sampling requirements.
(For LCR sampling, data from a mix of 50 percent LSL sites and 50 percent copper with lead solder sites are indicated by “50:50.” For LCRR sampling, data from only SFS served by an LSL indicated by “LSL only.”)
SFS* = single-family structure
Funding Strategies: How to Pay for Lead Service Line Replacement Planning and Lead Service Line Replacement It’s estimated by EPA that the average cost to replace a single LSL is approximately $4,700 (2019 dollars); however, costs can vary significantly from system to system and could be as high as $10,000 to $15,000 (or more) per LSL when all costs (site restoration, public outreach, household filters, etc.) are considered.
Table 1. Lead and Copper Rule Revisions Sample Site Tiering Criteria
For those communities with a large number of LSLs, the financial burden of replacement could
There is a noted discrepancy in how EPA considers lead status unknown service lines from a replacement perspective (they are considered an LSL until verified otherwise) compared to compliance monitoring. Unknown status service lines would fall into the Tier 5 pool of representative sites and it’s not clear if a fifth liter sample will be required at those sites.
Florida Water Resources Journal • September 2022 23 shared with the public and city leaders so that customers know when the lead pipes at their home or in their neighborhood will be replaced, and why. Using the Lead Service Line Inventory: Impacts of Changes in Monitoring Requirements
Figure 1. Comparison of lead statistics under current Lead and Copper Rule monitoring protocols.
Tier 1 SFS* served by LSLs Tier 2 Buildings, including multifamily residences served by LSLs Tier 3 SFS served by galvanized service lines that are/were downstream of an LSL Tier 4 SFS service by copper service line with lead solder Tier 5 Representative sites
Tier Definition

Funding and Compliance Timeline
S Begin preparation of inventory and have a plan for implementation of the public interfaces.
S Begin reviewing historical data now to determine how changes in monitoring requirements could impact future compliance. In the absence of fifth liter samples at homes with an LSL, collect some samples to approximate the impacts of fifth liter sampling on compliance status.
be quite significant. Furthermore, economically disadvantaged homeowners may be unable to afford LSL replacement if the water system is unable to pay for the full cost of replacement.
It’s unclear if and how DWSRF or WIFIA requirements may change when it comes to funding LSL replacement, but water systems should begin developing a strategy to apply for and administer funds. Every state’s DWSRF program requirements are slightly different, and EPA just made minor modifications to the WIFIA application process, including a rolling application schedule. Understanding current DWSRF and WIFIA requirements is an important first step to determining which funding model is best suited for a particular water system. For example, DWSRF might be a better option for small and underserved communities due to the priority given to those systems with the greatest funding needs. It’s important to know a particular state’s eligibility requirements and deadlines to apply for and, perhaps more importantly, use funds to replace LSLs. Determining how and what it will take for a system to replace every LSL as quickly as possible will be the key to preparing a LSLR plan and determining the most appropriate funding strategy for a system.
Figure 2. Typical water quality profile for a home with a lead service line comparing first and fifth liter samples.
It’s important to understand how these programs work and what it will take to apply for and administer funds received under the programs. For example, securing DWSRF funds typically requires submission of a facility plan (i.e., an LSLR plan) and other commitments by a water system. Similarly, the first hurdle for WIFIA funding is the submission of a letter of interest, and although there is no deposit required with the submission of the letter, the water system will need to provide a deposit with the application approximately one year after submitting the letter. In addition, the utility will be charged a financing fee for each successfully funded project, though this may be waived by EPA if conditions warrant. The WIFIA may also require the water system to fund 50 percent or more of the replacement as a condition for funding.
Continued from page 23
A few key elements of the proposed timeline are:
S Meet with the state or primacy agency as soon as possible to understand their expectations for the inventory and what they will require for designation of nonlead status.
24 September 2022 • Florida Water Resources Journal
S Review current funding program requirements
In addition, the federal government passed the Bipartisan Infrastructure Law (BIL) in November 2021. The BIL prioritizes identification and replacement of LSLs and includes $15 billion in DWSRF funding specifically for LSL replacement, as well as an additional $11.7 billion emergency appropriaton for DWSRF that can also be used for LSL replacement. The WIFIA, and state and federal earmarks, may also be used to provide funding to water systems.
Fortunately, there are a number of existing grant and loan programs available and a number of agencies that may fund LSL replacement, including: S Drinking Water State Revolving Fund (DWSRF) S Water Infrastructure Finance and Innovation Act (WIFIA) S U.S. Department of Housing and Urban Development (HUD) S Federal Emergency Management Agency (FEMA)
Figure 3 provides a suggested timeline to guide systems to meet the LCRR requirements by the compliance deadline and have a funding strategy in place for LSL replacement.
Figure 3. Recommended funding and compliance timeline.
S U.S. Department of Agriculture (USDA) Rural Development S State and federal earmarks and other programs


Monitor federal legislation and state funding programs to understand how funding for LSL replacements will be distributed to water systems and what the associated administration and utility-provided funding commitments will be.
S Though not discussed at length here, understand the new monitoring and public education requirements for schools and childcare facilities and review the data from previous sampling efforts, if available. Water systems should initiate discussions with school districts and childcare facilities in their service areas as soon as possible. It’s important that these facilities not be caught off guard by the rule requirements and have a plan to communicate with their students and customers about the risks of lead in drinking water.
Use the time available between now and December 2024 to collect additional data to assess the potential impacts of changes in monitoring of a system to avoid surprises when the first round of new compliance data is gathered in 2025. Use the time to verify service line materials in accordance with state or primacy agency expectations and reduce the number of lead status unknown service lines in the system.
S
S Prepare funding applications and other required program documents as soon as possible (e.g., DWSRF facilities plan or WIFIA letter of interest).
The number of required replacements could be reduced significantly by verifying the unknown status services that are nonlead.
S
Assess funding program eligibility to cover the cost of the inventory and LSLR plan preparation. For example, DWSRF can be used for engineering design fees after submittal of the facilities plan. Preparing the facilities plan in such a way that it identifies how the LSLR plan will be developed, including field verification and additional testing, may make these costs eligible for funding. Similarly, the WIFIA funding may be used for development phase activities, including planning, preliminary engineering, design, environmental review, revenue forecasting, and other preconstruction activities. The WIFIA funds can be used to reimburse the cost of these activities if they were carried out under federal guidelines.
Florida Water Resources Journal • September 2022 25 (e.g., DWSRF or WIFIA) and identify which program is best suited for a system.
S Verify service lines of unknown status now as the requirements for nonlead sites and systems are substantially less than those with LSLs or lead status unknowns. Use the time between now and December 2024 to verify service line materials and reduce the number of lead status unknown service lines in a water system, which can have significant financial impact on the system. For example, if a system has 1000 known LSLs and 4000 unknowns and is required to implement LSL replacement, the required 3 percent per year is 150 LSLs.
Conclusion The LCRR will be challenging for many water systems for a variety of reasons. Understanding how the rule might impact a water system, and developing an effective funding strategy for LSL replacement, will be key to achieving compliance with the new rule. Water systems should begin an evaluation of their compliance, potential financial risk, and exposure, and formulate a strategy to address those risks immediately. The information here can serve as a road map to initiate that assessment.
S

1. Per Florida Administrative Code (FAC) 62555, Permitting, Construction, Operation, and Maintenance of Public Water Systems, suppliers of water shall maintain a minimum chlorine residual throughout their drinking water distribution system at all times. The minimum free chlorine residual is 0.2 mg/L and the minimum combined chlorine residual is a. 0.3 mg/L. b. 0.4 mg/L. c. 0.5 mg/L. d. 0.6 mg/L.
a. Slow-rate land application, restricted public access b. Slow-rate land application, public access areas c. Rapid-rate land application systems d. Overland flow systems
References used for this quiz:
• Florida
10. Per FAC 62-610, Reuse of Reclaimed Water and Land Application, which type of reuse application requires high-level disinfection?
a. One-log b. Two-log c. Three-log d. Four-log
3. Per FAC 62-550, Drinking Water Standards, Monitoring, and Reporting, the maximum residual disinfectant levels (MRDLs) for both chlorine and chloramines is 4 mg/L. What is the MRDL for chlorine dioxide? a. 0.4 mg/L b. 0.6 mg/L c. 0.7 mg/L d. 0.8 mg/L
6. Per FAC 62-555, if the results of a bacteriological survey of a well determines that the well is microbially contaminated or susceptible to microbial contamination, the supplier of water must provide treatment that reliably achieves at least what level of inactivation or removal of viruses?
Answers on page 50
5. Per FAC 62-555, following disinfection of a new or altered well, a bacteriological survey of the well must be conducted. Unless modified by the Florida Department of Environmental Protection (FDEP), what is the required minimum number of samples to be collected? a. 10 b. 15 c. 20 d. 25
7. Per 62-555, bacteriological evaluations to verify proper disinfection of treatment or storage facilities and water mains requires a total of at least two samples—each taken on a separate day and taken at least six hours apart from the other sample(s) and analyzed for total residual chlorine and for the presence of total coliform. Prior to taking the samples, the total chlorine residual in the facilities or mains must be reduced to no more than a. 1 mg/L. b. 2 mg/L. c. 3 mg/L. d. 4 mg/L.
asp?Chapter=62-610https://www.flrules.org/gateway/ChapterHome.Application: • Florida Department of Environmental Protection website, Ultraviolet (UV) Disinfection for Domestic domestic-wastewaterwastewater/content/ultraviolet-uv-disinfection-https://floridadep.gov/water/domestic-Wastewater: • National Water Research Institute, 2012 –“Ultraviolet Disinfection Guidelines for Drinking Water and Water https://www.nwri-usa.org/researchReuse”: Send Us Your Questions Readers are welcome to submit questions or exercises on water or wastewater treatment plant operations for publication in Test Yourself. Send your question (with the answer) or your exercise (with the solution) by email to: donna@h2owriting.com Donna Kaluzniak What Do You Know About Water and Wastewater Disinfection Rules?
2. Per FAC 62-555, for each day a supplier of water serving 3,300 or more persons serves water to the public from a drinking water treatment plant using chemical disinfection for virus inactivation, they shall continuously monitor the residual disinfectant concentration (C) before or at the first customer and shall record in the logs the lowest C measured during peak flow, the corresponding disinfectant contact time (T) at the C monitoring point during peak flow, and the resulting lowest CT provided before or at the first customer during peak flow. What other measurements must be taken at least once per day at the C monitoring point? a. pH and E. coli b. pH and Cryptosporidium c. pH and temperature d. Temperature and flow
9. Per the NWRI UV Guidelines, the design of a UV disinfection system for water reuse depends on what type of technology preceding it? a. Aeration b. Biological nutrient removal c. Filtration d. Sedimentation
8. Per the FDEP website, Ultraviolet (UV) Disinfection for Domestic Wastewater, FDEP will accept UV designs that comply with National Water Research Institute (NWRI) guidelines, supported with validation testing to provide reasonable assurance that a domestic wastewater treatment facility can meet high-level disinfection criteria. Per the NWRI “Ultraviolet Disinfection Guidelines for Drinking Water and Water Reuse” (NWRI UV Guidelines), the UV dose is expressed as the product of UV intensity and a. exposure time. b. transmittance level. c. turbidity value. d. volume of water.
• Florida
•
• Florida Administrative Code 62-550, Drinking Water Standards, Monitoring and asp?Chapter=62-550https://www.flrules.org/gateway/ChapterHome.Reporting: Administrative Code 62-555, Permitting, Construction, Operation and Maintenance of Public Water asp?Chapter=62-555https://www.flrules.org/gateway/ChapterHome.Systems: Administrative Code 62-600, Domestic Wastewater asp?Chapter=62-600https://www.flrules.org/gateway/ChapterHome.Facilities: Florida Administrative Code 62-610, Reuse of Reclaimed Water and Land
4. Per FAC 62-600, Domestic Wastewater Facilities, the criteria required for wastewater facilities to meet high-level disinfection includes any one effluent sample that shall not exceed 25 fecal coliform values per 100 mL of sample. Over a 30-day period, what percent of fecal coliform values must be below detection limits? a. 50 percent b. 60 percent c. 75 percent d. 90 percent
26 September 2022 • Florida Water Resources Journal Test Yourself

Complete Visibility in Full Wastewater Tanks SediVision®️ technology delivers unprecedented high-resolution image mapping of full wastewater tanks. Eliminate probing. Know with accuracy, where and how much material is under dark water. 844-765-7866 ©️2022 USST HOLDINGS, LLC ussubmergent.com sedivision.com


S Triage. The system analyzes those inputs to determine the priority of the issue. S Dispatch. High-priority issues are dispatched immediately, while low-priority issues are placed in a queue to be handled during normal business hours. S Engagement. Citizens have used the RMS platform to provide additional information, photos, and notes of gratitude to department members for their service.
S Input. The RMS can take data from many sources, both customer- and infrastructure-generated. The city chooses to track and analyze customer call information in its RMS. The platform takes the text of the call and triages it using a classification engine.
Citizen Engagement
Documentation: Better Insights Into Operations
Using Utility Information to Improve Team Efficiency and Citizen Satisfaction
John Bertrand
The city uses engagement tools built into the platform to enable citizens to provide additional information and receive status updates. In 21 percent of the incidents requiring a dispatch, citizens engaged with the city through the platform. Engagements include additional information, such as a second contact number, an address correction, or confirmation that a bill has been paid with a confirmation number. Citizens can also add photos, such as the ones provided to the city (Figures 1 and 2). Photos and additional information provide the city with details that aren’t available through the initial call. In several incidents, that additional information has helped the city better understand how to respond, who to send, and what equipment to bring. This enables them to make those decisions up front, rather than wait for the on-call person to arrive onsite to make an assessment, saving critical minutes during a response.
Water departments across the United States sometimes undergo herculean efforts to respond to incidents quickly and keep citizens informed during the process. The Response Management System (RMS) helps public works and utility crews respond to emergencies faster, save money, and reduce paperwork.Onecity in Florida has implemented an RMS to facilitate faster response times and improve citizen engagement. This article reviews how the city uses its RMS to understand the nature of the calls coming in, save hours of overtime throughout the year, and receive more-valuable input from citizens.
The basic pillars of an RMS include the following features and functionalities:
Response Management System
The city knows, for example, that 90 percent of dispatches are to the water crew; of those, almost half are related to disconnected service, 10 percent are related to leakages, and only 1 percent is related to water quality.
The ability of the RMS to triage data correctly is key to driving efficiencies and cost savings. For this city, its RMS uses an artificial intelligence algorithm to analyze incoming customer reports and assign type and criticality. Looking just at customer call data, for example, the RMS can differentiate between a nonemergency question or complaint (most are billing-related) and a report that requires attention (sewer blockage, water disconnect, etc.).Over the course of a year, the RMS classified 72 percent of calls as requiring dispatch. Of those, almost 90 percent were sent to the water team, while the rest went to the sewer team. About 28 percent of the calls were considered as nonemergency and saved the city a truck roll for those calls, which resulted in an estimated savings of 500 hours of overtime.
28 September 2022 • Florida Water Resources Journal
Figure 1. Citizen photo accompanying a report of water pumping out of their front lawn. Figure 2. Citizen photo accompanying a report of a burst pipe.
By tracking call data in the RMS, the city now has better insights into the calls they are receiving, when they are receiving them, what and who is being dispatched, and how quickly team members are acknowledging incidents.
S Documentation. The city uses the RMS to capture customer call data. This then allows it to identify the types of calls taken by month, day of the week, and time of day.
The city gets the highest volume of calls between 4 and 7 p.m., typically when people get off work. Over the course of a year, 58 percent of calls came in during those three hours and 30 percent of calls came in after hours.The average time for the city to acknowledge an incident is one minute, and it knows who on the team falls above and below
Triage and Dispatch

Finally, the RMS provides a heat map (Figure 3) of incidents, which gives a geographic view of the incidents and can highlight high-volume areas. The heat map can be viewed by type of incident for additional granularity.
John Bertrand, P.E., is the chief executive officer at Daupler Inc. in Overland Park, Kan. S Figure 3. Incident heat map.
Florida Water Resources Journal • September 2022 29 that average. It also knows the average time it takes for employees to arrive onsite, and who falls above and below that average.
Conclusion As a cloud-based software, RMS works across multiple utility and public works departments. It can also facilitate transfers among departments, creating another level of efficiency. While the focus of this article is one city in Florida, numerous other case studies document large savings in time and money for cities that implement RMS.


REGISTRATION Online Registration Deadline: November 15, 2022 fsawwa.org/2022fallregistration First Name: ___________________________________________________________ Last Name: ____________________________________________ Name to Appear on Badge: ___________________________________________________ AWWA Member No: ________________________________ Organization: ________________________________________________________________ Position | Title: ____________________________ Address: ______________________________________________________________________________________________________________________ City: _________________________________________________________ State: _____________________________ Zip: _____________________ Phone: (______) ________-__________ Fax: (______) ________-__________ Email: _______________________________________________ CEU|PDH Registration: We offer 0.1 CEU and 1 PDH per hour of participation in Technical Sessions, Symposiums, and Workshops. Fall Conference Course # 05100590 I am a Florida Professional Engineer, No: ____________________________________ I am a Florida Licensed Operator, No: _______________________________________ Please select one: Plant Distribution Collection Full Registration (3 days): Includes: Monday Workshops, Opening General Session, BBQ, Technical Sessions, Exhibits, Meet & Greet (Does not include Laws/Rules, Utility Systems Symposium, and Business & Awards Luncheon) Daily Registration: Workshops, Technical Sessions and Exhibits Please select a day: Monday (Includes all Monday events, except Laws/Rules & Utility Systems Symposium) Tuesday Wednesday Special Registration: (Must register) Speaker (One-day only)* Select day: Mon Tue Wed Free with full or one-day registration Retired AWWA member Select day: Mon Tue Wed Spouse (Lunch not included) Mon Tue Wed Operator Competitions Tue Wed Students - Free (Registration required if attending) Exhibit Hall Only Mon Tue Wed Engineering Laws | Rules 2.0 PDH Monday AM Utility Systems Symposium Monday 8-5 (Includes lunch) 0.8 CEU | 8.0 PDH Students/Young Professionals Lunch Tuesday PM FSAWWA Business & Awards Luncheon Wednesday PM Free Events: (You will need to register for an accurate count if you are attending the following events) Opening General Session Monday AM BBQ after Exhibits Meet & Greet Monday PM Water Conservation Symposium (No Credits) Wednesday AM Thank you for your interest in the FSAWWA. Looking forward to seeing you at the Hyatt Regency Grand Cypress on November 27 to November 30, 2022 Aging Well- Protecting Our Infrastructure Register online is strongly recommended at: www.fsawwa.org/2022 fallregistration Questions: Peggy Guingona | peggy@fsawwa.org Note: A 30% service fee will be retained on any cancellation by Nov. 1. No refunds after Nov. 2, 2022. Hotel Accommodations Host hotel is Hyatt Regency Grand Cypress. The special rate is $165. Visit fsawwa.org/2022hotel Member Non-Member Nov.By 1 Nov.After1 Nov.By 1 Nov.After1 $0$0$0$50$30$120$70$50$$35$50$50$30$100$200$200$3750 $0$0$0$50$30$120$70$50$$35$50$50$30$150$250$250$4250 $0$0$0$50$30$190$70$50$$35$50$50$30$175$275$275$4950 $0$0$0$50$30$190$70$50$$35$50$50$30$200$325$325$5450
Join us at poker after the BBQ and continue the networking. Your participation will benefit the Likins Scholarship Fund, Water Equation, and Water For People. Register fsawwa.org/2022pokerToday! It is not necessary to participate in the tournament in order to be a sponsor. Please send Terry Gullet at tgullett@neptunetg.com a pdf or jpeg version of your company logo for all sponsorships. Pre-Paid BlackjackBuy-ins:Buyin| $20.00 (2000 in chips) Poker Buy In | $40.00 (5000 in chips) At the Door Buy-ins: Blackjack Buy in | $30.00 (2000 in chips) Poker Buy In | $50.00 (5000 in chips) Grand Prize: 50” Monday,HDTV!November 28, 2022 8:30 - 11:30pm Hyatt Regency Grand Cypress Poker Night & Happy Hour Looking forward to seeing you at the Hyatt Regency Grand Cypress on November 27 to November 30, 2022 Any contribution of prizes is greatly appreciated for the worthwhile cause. Pre-purchase Buy-In and Table Sponsorships through Conference Registration. Buy-Ins may be purchased at the door during first hour of play with a credit card, personal check, or cash. Space is limited so pre-purchase to ensure that you have a chance to win. Entry tickets and chips have no cash value. Once they are purchased no refunds will be given. Only paid entries and sponsors will be allowed access to the hall. StraightOpportunitiestoSponsor|$50 • One of four at a game table sponsors • Logo on a prominently displayed sponsor board at the registration table Full House | $150 • One of two at a game table sponsors • Logo on a prominently displayed sponsor board at the registration table • 2 Blackjack or 2 Poker Buy-ins Royal Flush | $250 • Sole game table sponsor • Logo on a prominently displayed sponsor board • 4 Poker Buy Ins or 5 Blackjack Buy-ins Aging Well- Protecting Our Infrastructure The Roy Likins Scholarship Benefiting Fund


Join us at TopGolf. Have fun and network with water industry professionals. Your participation will benefit the Likins Scholarship Fund, Water Equation, and Water For People. Register fsawwa.org/2022golfToday!Location: TopGolf Orlando 9295 Universal Blvd. Orlando, FL (407)218-771432819|topgolf.com/us/orlando Entry: Entry Fee includes: Entry into the tournament, buffet food, 2 drink tickets per person, and fellowship with conference attendees Individual/Additional Registration | $125 Individuals will be placed into bays with other registrants Individual Utility Operator Registration | $50 Individuals will be placed into bays with other registrants Social Attendee | $50 Come mingle with friends and colleagues (Food and 1 Drink Ticket included) Wednesday, November 30, 2022 Registration starts at 5:00 pm Event: 6:00 - 9:00 pm Par-Tee at TopGolf OpportunitiestoSponsor Eagle Sponsor | $850 • Your company’s logo streaming on all TVs of the tournament bays. • Recognized with signage at bay. • 1 bay with up to 6 entries. • Recognition at the awards ceremony. Birdie Sponsor | $750 • Recognized with signage at bay. • 1 bay with up to 6 entries. • Recognition at the awards ceremony. Food SponsorBeverage&| $500 • Recognized with signage. • Recognized on rotating bay displays. • Recognition at the awards ceremony. It is not necessary to participate in order to be a sponsor. Please send Chase Freeman a pdf or jpeg version of your company logo for all sponsorships. Email: Cfreeman@spiritgroupinc.com Rain or shine, let’s play golf for a great cause. Aging Well- Protecting Our Infrastructure The Roy Likins Scholarship Benefiting Fund


Thank you for your interest in the FSAWWA.Regency November
FSAWWA hosts fun and lively competitions between municipalities to find the most skilled person or team in the Meter Madness, Tapping, Hydrant Hysteria, and Back Hoe Rodeo contests. Please join us as a spectator or visit our website to download the application to complete.
Ductile Iron Tap: 11:00 am - 12:00 pm Fun Tap: 1:00 - 2:30 pm Meter Madness: Tuesday | 4:00 - 5:00 pm
Grand Cypress on November 27 to
Looking forward to seeing you at the Hyatt
2022 Competitions Tuesday & Wednesday, November 29 - 30, 2022 Join Tappingthe FUN! CHEER for Meter Madness! Prep for HYDRANT Hysteria! Let loose at the RODEO! Please Contact: Mike (352)tapitflorida@att.netGeorge200-9631 Join the OpportunitiesSponsorshipCompetition
Back Hoe Rodeo: Tuesday | 10:00 am - 12:00 pm
Hydrant Hysteria is a fast paced two person competition as to who can assembly a fire hydrant quickly, totally, and accurately. Two or more teams go head to head while assembling the hydrant. All parts will be assembled in proper manner and reassembled hydrant shall be tested by the judges for ability to operate correctly.
Tapping Contests: Tuesday | 11:00 am - 2:30 pm
In a contest of skill and dexterity as well as speed, teams of four compete for the fastest time while they perform a quality drill and tap of pipe under available pressure. Penalties are assessed in seconds for infractions of rules such as leaking connections or safety violations. Only two taps are allowed per team.
30, 2022. Aging Well- Protecting Our Infrastructure
Hydrant Hysteria: Wednesday | 9:00 - 11:00 am
Contestants are challenged to put together a completely disassembled meter against the clock. To make the contest more interesting, three to six miscellaneous parts are included in the bucket of meter components. Once the meter is assembled, it must operate correctly and not leak.
Backhoe operators show off their expertise by executing several challenging lifts and drops of various objects in the fastest time.
fsawwa.org/2022fallconference


Florida Water Resources Journal • September 2022 35 Perfect for WaterEnvironmentalEngineering,ScienceandFocusedStudents •Advance Your Career •Network with 50K Water Professionals •Connect with Students that Share Your Interests •Gain Leadership Skills •Learn, Collaborate and Build Your Resume •Apply for Academic Scholarships $10 Membership to be a member of this HBCU Virtual Student Chapter Access to webinars, AWWAJournal, Opflow and awwa.org/hbcuresearch.ofresources–AotherwealthinformationforJoinNow


The strategic business plan has four main strategic goals that support the mission of FWEA, which is as follows:
The four strategic goal areas are:
Key Objectives of the FWEA Strategic Business Plan Parts of a Strategic Goal Four Strategic Goals Resulted in 65 Action Plans
“The Florida Water Environment Association is dedicated to promoting a clean and sustainable water environment by supporting and uniting our members with the public through public awareness and outreach, providing professional development and networking opportunities for our members, and creating alliances to promote sound sciencebased public policy.”
Member Engagement
Each strategic goal contains its own list of goals, with supportive objectives. Then, each objective has action plans that describe how the objective would be met. Team leaders assigned to each strategic goal will monitor the progress of the overall goals, objectives, and action plans.
Strategic Business Plan and Goals
Public Awareness/Outreach
36 September 2022 • Florida Water Resources Journal
The FWEA has a strategic business plan in place to ensure that the organization’s mission continues to be met by staying on top of emerging issues and allowing the organization to continue bringing value to water professionals. The most recent plan was developed in 2020 and adopted in early 2021.
After adoption, the FWEA board of directors (BOD) wanted to make sure that it remained an active guidance document for our chapters and committees.Sincethere was a lot packed into the strategic business plan, key objectives were identified that would be closely monitored throughout the year to help move them toward completion.
The FWEA acknowledges the benefit of creating alliances to inform water professionals and advise policy makers on scientific, environmental, operational, and financial aspects of water-related issues.
The FWEA chooses to be a resource for the general public in promotion of water quality issues and solutions by promoting and providing educational resources to its members for educating the public at all levels.
Sondra W. Lee, P.E.
The FWEA strives to provide value and demonstrate the value of joining the organization in order to accomplish our mission. Providing member services, such as high-quality training, education, and networking opportunities, draws water professionals in Florida to our association.
FWEA FOCUS
President, FWEA
Partnerships and Sound Science-Based Public Policy


S Objective 1.1b: Enhance FWEA social media presence and social media post quality in order to attract new members.
Workforce/Professional Development
Over the next year or two, FWEA volunteers will focus on the eight key objectives of the strategic business plan, providing updates to the BOD. Meanwhile, volunteers will work on other action plans as much as possible.
S Objective 1.2b: Enhance networking opportunities.
To narrow down and prioritize parts of the strategic business plan, the strategic goal leaders were asked to select two “key objectives” to focus on. Then, at the leadership development workshop held in February, FWEA chapter and committee leads reviewed the action plans of the key objectives. Breakout groups modified action plans to make sure that they were clearly actionable, naming resources and action plan leads, defining how to measure the actions, and providing estimated due dates.
S Objective 4.1a: Conduct an exit survey at the end of each seminar to evaluate content on a scale from 1 to 5, achieving a score of 80 percent or better.
Here are key objectives selected by the strategic goal leads:
Strategy Goal Number 1: Member Engagement
S Objective 4.3a: Produce a detailed step-bystep standard operating procedure, generic for any event, with a timeline of milestones for organizing the event.
Members of FWEA can review the full strategic business plan on its website at www. fwea.org from the “Volunteer Resources” page. S
Strategic Goal Number3: Partnerships and Sound Science-Based Public Policy
S Objective 3.1a: Participate in and help to plan events with other like-minded organizations, while maintaining the FWEA brand for specific events/efforts and associated joint events.
From these four strategic goals, 11 goals, 24 objectives, and 65 action plans were devel oped. While it’s quite possible for several action items to be taking place simultaneously, imple menting and tracking 65 separate action plans all at once appeared to be a method destined for failure or burnout of volunteers.
Florida Water Resources Journal • September 2022 37
Strategic Goal Number 2: Public Awareness and Outreach S Objective 2.1c: Continue to participate and support the Stockholm Junior Water Prize, and regional and state science fairs.
S Objective 2.2b: Provide outreach tools for use by members, public, or media by utilizing FWEA-created materials or collaborating with municipalities, nonprofits, and other associations or organizations.
S Objective 3.2a: Directors at large to give the FWEA Utility Council report from the BOD meeting back to chapter and committee leaders after each BOD meeting starting April 2021.
Strategic Goal Number 4: Workforce Professional Development
Key Objectives
The FWEA seeks an active and healthy opportunity to expand value to its members and to continue to provide professional development at the highest level for relevant and innovative education and training, and help the industry in identifying and developing a skilled workforce.

As part of the third Unregulated Contaminant Monitoring Rule (UCMR 3), The U.S. Environmental Protection Agency (EPA) conducted sampling and analysis of water systems for 30 unregulated contaminants, including PFAS, between 2013 and 2015. Due in part to the confirmed presence of PFAS in water samples and the possibility of adverse health impacts associated with drinking water containing PFAS, EPA established a drinking water health advisory level for PFAS in 2016. Epidemiology studies, however, have demonstrated that humans are at an increased risk of developing certain types of health issues due to drinking water with PFAS concentrations less than the EPA level. Some states have established maximum contaminant levels (MCLs), which are much lower than EPA’s PFAS drinking water health advisory level. In June 2022, EPA released a new health advisory (HA) for four PFAS: Interim HAs for PFOA and PFOS, and Final HAs for GenX chemicals and perfluorobutanesulfonic acid (PFBS). Table 1 presents a summary of the EPA and state drinking water values for PFAS in parts per trillion (ppt). Chemicals Cause Concern for the Water Industry
Both PFOA and PFOS have been the most extensively produced and studied of these chemicals. Studies have found PFOA in the blood samples of the general human population and wildlife.
P erfluorooctanoic acid (PFOA) is a man-made chemical that has been used in numerous industries since the 1940s. The PFOA is persistent in the environment and remains in the human body for years after exposure, leading to adverse healthTheeffects.PFOA and perfluorooctanesulfonic acid (PFOS) are a part of a larger group of chemicals called per- and polyfluoroalkyl substances (PFAS), which have been used in consumer products and industrial applications, such as food packaging, clothing, firefighting foams, and upholstery.
Christopher C. Baggett, P.E., is senior project manager, and Saheb Mansour-Rezaei, Ph.D., P.E., is lead project engineer, with WrightPierce in Tampa. (SAB)
FWRJ Regulatory Agency PFOA PFOS PFHxS PFNA PFHpA PFDA PFBS GenX ppt ppt ppt ppt ppt ppt ppt ppt United States 0.004 0.02 2,000 10 EPA Health Advisories* Connecticut 16 10 49 12 Department of Public Health Florida 70 (Sum of 2)Department of Environmental Protection Maine 20 (Sum of 6)Division of Environmental and Community MassachusettsHealth 20 (Sum of 6)Department of Environmental Protection New Hampshire 12 15 18 11 Department of Environmental Services New Jersey 14 13 13 NJ Drinking Water Standards New York 10 10 DH Drinking Water Standards Rhode Island 20 (Sum of 6)DEP Drinking Water Standards Vermont 20 (Sum of 5)DH Drinking Water and Groundwater *HealthStandardsadvisories are nonenforceable and nonregulatory and reflect EPA’s assessment of the best available peer reviewed science. The interim updated health advisories replace the 2016 final health advisories for PFOA and PFOS, which were both set at 70 ppt. The EPA is reviewing and will respond to the Science Advisory Board
comments as the agency moves forward to develop maximum contaminant level goals (MCLGs) to support the Safe Drinking Water Act National Primary Drinking Water Regulation for PFOA and PFOS, which is expected to be proposed later in 2022 Table 1. U.S. Environmental Protection Agency Health Advisory and States Levels for Per- and Polyfluoroalkyl Substances Continued on page 40
38 September 2022 • Florida Water Resources Journal
The concentrations of PFOA are a growing concern in water distribution systems. Water quality models provide a costeffective tool to estimate temporal and spatial variations of PFOA concentrations within water distribution systems. The concept of water quality modeling was preliminarily introduced to the utility industry in the early 1980s. The usability of these models was greatly improved in the 1990s with development of Windows-based commercial water distribution system models. Today, water distribution system models are commonly used to replicate the behavior of real-world systems. The following water quality models have been developed: S Clark and Boutin (2001) evaluated the applicability of water quality models to simulate formation and propagation
Water Quality Modeling of Perfluorooctanoic Acid in a Water Distribution System
Christopher C. Baggett and Saheb Mansour-Rezaei
Florida Water Resources Journal • September 2022 39 FWPCOA TRAINING CALENDAR Please go to the FWPCOA website www.fwpcoa.or g for the latest updates on classes Course registration forms are available at http://www.fwpcoa.org/forms.asp. SCHEDULE YOUR CLASS TODAY! September 12-14 .... Backflow Repair Course............................................................. St. Petersburg ... $275/305 12-15 Backflow Tester Course Deltona $375/405 14 .... Backflow Tester Recertification ................................................ St. Petersburg ... $85/115 16 Backflow Tester Recertification and Exams Deltona $85/115 22 .... Region IX Reclaimed Water Distribution C Course (Abbreviated)... Deltona ............. $125/155 23 .... Region IX Reclaimed Water Distribution B Course (Abbreviated) Deltona ............. $125/155 October 3-5 Backflow Repair Course Deltona $275/305 11-14 .... Water Distribution 2 .................................................................... Deltona ............. $325/325 November 14-17 .... Backflow Tester Course ............................................................. Deltona ............. $375/405 14-18 Reclaimed Water Field Inspector Winter Garden $350/380 12 .... Backflow Tester Recertification and Exams ............................ Deltona ............. $85/115 You are required to have your own calculator at state short schools and most other courses. Member / Non Member For additional information on these courses or other training programs offered by the FWPCOA, please contact the FW&PCOA Training Office at (321) 383-9690 or training@fwpcoa.org.

Water Quality Model To develop the water quality model, the boundary conditions, PFOA decay rate, and water quality mixing were established. The water quality model used the hydraulic model results to route PFOA through each pipe, then mixed at downstream junctions with other inflows into that junction. After mixing, PFOA was conveyed from the junction into its outflowing pipes. This process continued for all pipes and for the duration of the simulation. Water quality boundary conditions were developed based on the PFOA concentrations in the water in the wells. To establish the well water PFOA concentrations during the simulation, actual PFOA sampling results were used, along with provided groundwater modeling results. The PFOA reaction rate was set to a negligible value in the water quality model. This is because PFOA is stable in environmental media and doesn’t decay naturally in water (EPA, 2016); additionally, PFOA doesn’t deposit in pipes and the concentration remains constant. The half-life of PFOA in water was estimated to be greater than 92 years (EPA, 2014), which is much longer than the residence time in the water distribution system. The PFOA diffusion coefficient is very low; consequently, the Peclet number, which is the ratio of advection transport to diffusion transport, is much greater than 1. This indicates that PFOA transport is dominated by advection.Waterquality mixing occurred in the models at junctions and within tanks. A complete mixed solution was used by the model to calculate the concentration in the water entering the downstream pipes at each node. Also, the last in, first out (LIFO) mixing solution was used for the tanks in all model runs based on review of the tank-filling pipe configurations.
The American Water Work Association (AWWA) Manual M32, Computer Modeling of Water Distribution Systems, describes the applicability of water quality models to predict contaminant concentrations within distribution systems.
Water Quality Modeling Due to the presence of PFOA within the drinking water sources and the water distribution system serving a community, water quality modeling was performed. The public water system consisted of several groundwater wells, water storage tanks, booster stations, and over 150 mi of water distribution mains. The water distribution system serves over 7,500 water service locations, composed of residential, municipal, commercial, and industrial properties. Water quality modeling was used to estimate the likely historical PFOA concentrations that occurred throughout the water distribution system and determine if PFOA concentrations supplied to residential water system customers, over time, likely met or exceeded threshold values. This information can be used to help identify residential customers who potentially qualify for medical monitoring. To simulate PFOA concentration within the distribution system, WaterGEMS by Bentley was used. WaterGEMS is one of the commonly used software packages that can provide direct capabilities to assess impacts of contamination events (EPA, 2005).
created for each day. If a well had a production value greater than zero on a given day, the relative speed factor for that well was set to 1 for the duration that the well operated on during that day; for the remainder of the day, the relative speed factor for that well was set to zero. Finally, the well relative speed patterns were adjusted such that the total volume pumped into the system matched with the recorded volume in the well production data. This approach enabled the daily runtimes and daily volumes of water pumped into the water distribution system for each well pump in the model to match the actual or average daily values within specific time periods.
Water Quality DevelopmentModel
S Walski (2019) employed a water quality model to simulate disinfectant residual concentration in distribution systems to comply with water quality regulations.
The foundation of water quality models is hydraulic models, which simulate the flow quantity, directions, and pressures in water distribution systems. To build a hydraulic model, pipe network properties, topographic information, water use, and operation controls are required. A water quality model determines movement of constituents and travel times through the distribution system. To develop a water quality model, water quality boundary conditions and reaction rates should be defined. Hydraulic Model To build the hydraulic model, the WaterGEMS model builder was used to import spatial and attribute information for the pipes, wells with constant speed well pumps, booster pumps, and storage tanks from geographic information system (GIS) shapefiles to the model. In general, attribute information for each pipe included diameter, material, installation date, and active topology status. Inside pipe diameters were estimated based on pipe materials, pipe standards, and nominal diameters. The Hazen-Williams equation was used in the model to calculate frictional energy loss throughout water distribution system piping. The Hazen-Williams coefficient (C) values were determined for various pipe materials and diameters and included consideration of years in service. Model junctions were assigned ground elevation data using the WaterGEMS Terrain Extractor (TREX) tool, which were extracted from a digital elevation model.System water demands included nonrevenue water (NRW) use and customer water use. The NRW was the difference between water production and total customer water use and it was estimated to be equal to a small percentage of the annual water supply that included leakage and water system flushing, etc. Average customer water use was estimated by analyzing billing records. Customer water use was spatially distributed to the model pipe nodes by geocoding the customer physical addresses and using the nearest pipe method. Demand alternatives were created in the model by globally modifying the overall water usage to equal the actual customer water usage for eachToyear.determine well operations during a given day, well run time data were used. To translate this information into the model, a relative speed pattern for each well pump was
40 September 2022 • Florida Water Resources Journal of total trihalomethane (TTHM) contaminants in distribution systems.
S Islam and Karney (2010) developed a water quality model to simulate release and transport of lead in distribution systems. S Burkhardt et al. (2017) developed a water quality model to simulate fate and transport of arsenic in a real-world water distribution system serving 78,000 customers.
S Digiano and Zhang (2004) developed a water quality model to simulate bacterial spread and regrowth in water distribution systems.
Continued from page 38
A water quality boundary condition alternative was established for each modeling scenario that used actual PFOA sampling and/or groundwater modeling results. To incorporate the daily variations of demand, daily diurnal curves were created for each year using water supply records. Annual average daily demand of the system changed between approximately 2.2 to 2.5 mil gal per day (mgd) over the nearly two-decade time period.
Usingconcentration.thepharmacokinetic model, a table was provided for different exposure characteristics that are expected to increase Join a firm made up of 300+ employees who are passionate about making a difference in the world. Own your career with stock ownership, profit sharing plans, and competitive salaries/benefits. Advance your career with opportunities to work on and lead award-winning treatment, distribution, source, and planning projects.
To determine if the water quality model can reasonably predict PFOA concentrations within the distribution system, simulated PFOA concentrations were compared against historical field-measured concentrations. Historical PFOA concentrations were available at two locations within the water distribution system (single measurement for each) and at a wholesale customer point of connection (over 150 measurements over a prolonged period of time). A comparison scenario was performed for a one-year period. The overall differences between the simulated and field-measured PFOA concentrations, as well as the similar variations of the simulated and the field-measured PFOA, indicates that the model reasonably represents the operations of the system and transport of PFOA.
Florida Water Resources Journal • September 2022 41
Nineteen extended-period simulation (EPS) modeling scenarios were created to determine the likely PFOA concentrations that occurred in the water distribution system over nearly two decades. For each scenario, the model network alternative was modified to reflect the network that existed in that year (e.g., installing a new water main) based on review of the GIS shapefiles. The properties connected to the system were modified according to the model network alternative modifications for each scenario. This means if a water main was not in service in a given year, the properties connected to that water main, and their demand, would be excluded from the analysis. The water system demand alternative was globally adjusted in the model to equal the actual customer water usage for each year.
Modeling Scenarios
Simulated and Measured Perfluorooctanoic Acid
Balance your career working for a familyfriendly firm with flextime, four-hour Fridays, and a hybrid work environment.
Exposure to Perfluorooctanoic Acid Concentrations
JOIN OUR TEAM APPLY TODAY wright-pierce.com/careersrecruiting@wright-pierce.com888.621.8156 Continued on page 42
Wright-Pierce has opportunities for Project Managers, Lead Project Engineers, and Project Engineers.
Epidemiologic studies indicate that individuals consuming water containing PFOA at concentrations and durations sufficient to increase the blood serum PFOA concentration by a threshold value or more are at increased risk of adverse health effects caused by exposure to PFOA. The expected blood serum PFOA concentration due to water consumption can be calculated using the pharmacokinetic model (Bartell, 2017): Ct=C(t-1) e-k + Wt S (1- e-k) where Ct is an individual’s serum PFOA concentration on day t, k is the daily PFOA excretion rate constant, Wt is the tap water PFOA concentration on day t, and S is the steady-state ratio that shows the average amount of increase in the serum PFOA concentration for each unit increase in the water


• USEPA. Emerging Contaminants: Perfluorooctane Sulfonate (PFOS) and Perfluorooctanoic Acid (PFOA). 2014.
• USEPA. Drinking Water Health Advisory for Perfluorooctanoic Acid (PFOA). 2016. S Figure 1. Example of served residential property ownership periods and water perfluorooctanoic acid concentration.
Continued from page 41
References
• Jonathan B. Burkhardta, Jeff Szaboa, Stephen Klostermanb, John Halla. Modeling Fate and Transport of Arsenic in a Chlorinated Distribution System. Environmental Modeling and Software. Elsevier Science Ltd, New York, N.Y. 93(1):322-331, 2017.
• Francis A. DiGiano and Weidong Zhang. Uncertainty Analysis in a Mechanistic Model of Bacterial Regrowth in Distribution Systems. Environ. Sci. Technol., 38, 5925–5931, 2004.
Summary Water quality modeling was performed to estimate historical PFOA concentrations that occurred within the water distribution system over 20 years. Comparison between the simulated and field-measured PFOA concentrations showed that the model reasonably represents the operations of the system and propagation of PFOA within the distribution system. The water quality modeling results were used to develop a matrix for combination of drinking water PFOA concentrations and cumulative days of consumption for each property ownership period for all served residential properties. An exposure characteristic table was used to identify the served residential property ownership periods when occupants would likely be at increased risk of adverse health effects caused by exposure to PFOA.
The cumulative number of days during which occupants for each served residential property ownership period likely received drinking water were calculated with average daily PFOA concentration of at least 20 ppt through at least 70 ppt in 1-ppt intervals. The cumulative number of days were compared against the exposure characteristics table to identify the served residential property ownership periods during which occupants likely met or exceeded the combination of drinking water PFOA concentrations and cumulative days of consumption expected to increase their serum PFOA concentrations by the threshold value.
• Md. Monirul Islam and Bryan W. Karney. A Transient Model for Lead Pipe Corrosion in Water Supply Systems. 2010.
• Scott M. Bartell. Online Serum PFOA Calculator for Adults. Environmental Health Perspectives. 2017.
• Tom Walski. Raising the Bar on Disinfectant Residuals. Bentley Systems Inc. 2019.
• USEPA. Technologies and Techniques for Early Warning Systems to Monitor and Evaluate Drinking Water Quality: A Stateof-the-Art Review. 2005.
Figure 1 shows an example of what the variations of water PFOA concentrations might look like for a served residential property over the nearly two-decade period. For this example, the served residential property is assumed to have four owners during the period of interest. In this example, the analysis would show that during the third ownership period, the occupants were expected to experience serum PFOA concentration greater than, or equal to, the threshold value.
The water quality model was used to estimate the PFOA concentrations within the distribution system over a nearly twodecade period, and the average daily PFOA concentration within each model pipe was determined by averaging the hourly PFOA concentration values for each day. Using GIS, each served residential property was associated with the nearest model pipe, which allowed the average daily PFOA concentrations for all served residential properties to be determined for each day over the nearly two-decade period. Then, the property ownership period information was used to determine the average daily PFOA concentrations for each property ownership period for served residential properties.
the serum PFOA concentration by the threshold value. The table indicated the number of days of water consumption needed at each integer water PFOA concentration from 20 to 70 ppt to reach the serum PFOA concentration threshold value. The exposure characteristic table was used in conjunction with water quality modeling results to identify the residential property ownership periods in which occupants would be expected to be at an increased risk of adverse health effects due to consuming drinking water from the water distribution system.
• Robert M. Clark, Brenda K. Boutin. Controlling Disinfection Byproducts and Microbial Contaminants in Drinking Water. EPA. 2001.
42 September 2022 • Florida Water Resources Journal


Florida Water Resources Journal • September 2022 43 EXCELLENCE ENVIRONMENTALIN EDUCATION UPCOMING COURSES Register online at go.ufl.edu/FWRJTREEO Visit www.treeo.ufl.edu for a full schedule of courses including: Backflow Prevention Assembly Tester Training & Certification Backflow Prevention Assembly Repair and Maintenance Training & Certification Backflow Prevention Recertification Wastewater Certified Professional Operator Certificate This program is designed to train professionals in the foundational concepts of wastewater operations.The program focuses on testing wastewater quality, process control and troubleshooting, and maintaining permit compliance with Department of Environmental Protection. Learn more at go.ufl.edu/FWRJWPOCP 20-21OCT4-5SEP FDEP SOPs for Water & Groundwater Sampling & Meter Testing Gainesville, FL | $310 CEUs 1.2 DW DS WW Pumping Systems Operation and Maintenance Gainesville, FL | $575 CEUs 1.6 DS DW WW 27-29SEP 24-2718-21OCTOCT1-3NOV26-30OCT14SEP19-23SEP Introduction to Electrical Maintenance Gainesville, FL | $605 CEUs 2.0 DS DW WW Water Distribution Systems Operator Level 2 & 3 Training Virtual | $699 CEUs 3.2 DS DW WW - Level 2 CEUs 3.2 DS DW WW - Level 3 Wastewater Class B Certification Review Gainesville, FL | $720 Train the Trainer: How to Design & Deliver Effective Training Gainesville, FL & Virtual | $745 CEUs 2.4 DS DW WW Building an Effective Safety Program Gainesville, FL | $295 CEUs 8.0 DW WW DS Water Class C Certification Review Virtual | $720 Wastewater Class A Certification Review Gainesville, FL | $720


S
During 2015-2018, children and adolescents in the United States drank an average of 23 ounces of plain water daily and U.S. adults drank an average of 44 ounces of plain water daily, per a Centers for Disease Control and Prevention (CDC) water consumption study. This study indicates that plain water intake is significantly lower in these categories: S Younger children S Non-Hispanic Black children or Hispanic children S Youth in lower-income households S Youth whose head of household has less than a high school education
44 September 2022 • Florida Water Resources Journal FSAWWA SPEAKING OUT
S
S Aiding
S Youth who are underweight or normal weight, based on calculated body mass index (BMI)
Figure 1.
Health Nexus: Water Consumption, Humidity, and Extreme Heat Heat and humidity index chart.
Additionally per the CDC, when working in the heat, people should drink 8 ounces of water every 15 to 20 minutes, which is up to 32 ounces of water per hour. The CDC also states that drinking at shorter intervals is more effective than drinking large amounts infrequently. Additionally, it’s advised to not drink more than 48 ounces per hour, as too much water can cause a medical emergency because the concentration of salt in the blood becomes too low (hyponatremia).
S Flushing
S Older adults S Non-Hispanic Black adults Adults with lower income S Adults with less than a college education S Adults who are underweight or normal weight, based on calculated BMI (source: plain-water-the-healthier-choice.html)www.cdc.gov/nutrition/data-statistics/
Water is our body’s principal chemical component and makes up approximately 50 to 70 percent of our body weight.
S
S
S
Emilie Moore, P.E., PMP, ENV SP Chair, FSAWWA
The Harvard Medical School notes that the benefits of water to proper body function include: Carrying nutrients and oxygen to cells bacteria from the bladder digestion Maintaining electrolyte balance Normalizing blood pressure Regulating body temperature Protecting organs and tissues Preventing constipation Cushioning joints
S
S
S
Water consumption makes up for the body’s water losses through urine, via the skin, and respiration.
S 92 ounces (11.5 cups) for women S 124 ounces (15.5 cups) for men
The U.S. National Academies of Sciences, Engineering, and Medicine determined that an adequate daily fluid intake (including fluids from water, other beverages, and food) is:
Water Consumption Benefits


Humidity and Heat Index
Heat index, also known as the apparent temperature, is a measure of how hot it really feels to the human body with relative humidity factored in with the actual air temperature, according to the National Oceanic and Atmospheric Administration (NOAA), as shown in Figure 1. Potential heat index impacts to our bodies include: S 80-90°F – Caution: Fatigue possible with prolonged exposure and/or physical activity S 90-103°F – Extreme Caution: Heat stroke, heat cramps, or heat exhaustion possible with prolonged exposure and/or physical activity S 103-124°F – Danger: Heat cramps or heat exhaustion likely, and heat stroke possible with prolonged exposure and/or physical activity S 125°F or higher – Extreme Danger: Heat stroke highly likely The heat index values in Figure 1 are for shady locations. If you are exposed to direct sunlight, the heat index value can be increased by up to 15°F. The Occupational Safety and Health Administration (OSHA) requires employers to provide water on the jobsite. Its recommendations related to water consumption and heat index include: S Heat Index <91°F: An employer must provide drinking water S Heat Index 91 to 103°F: An employer must remind workers to drink water often (about 4 cups/hour)
Florida Water Resources Journal • September 2022 45
Continued on page 46
S Heat Index >115°F: An employer must establish a water-drinking schedule (about 4 cups/hour)TheCode of Federal Regulations, Title 29 – Labor, outlines the duties of an employer, including these that are related to potable water access in Part 1915, Subpart F (General Working Conditions): S 1915.88(b)(1): The employer shall provide potable water for all employee health and personal needs and ensure that only potable water is used for these purposes.
Figure 2. Heat illness guidelines.
To prevent heat illness, there needs to be a balance between heat load on the body (heat produced internally by the body and gained from external sources) and heat released from the body to allow it to cool. Florida’s humid subtropical climate can stress the body because it has trouble removing heat when sweat does not evaporate readily.
High humidity makes us feel hotter and uncomfortable, but it also increases our core temperature, causing our bodies to compensate by working harder to cool them down. When sweating does not work to cool us down and our bodies continue to heat up, it could result in overheating or heat exhaustion. This can lead to dehydration, chemical imbalances within the body, or even death. Dehydration depletes the body of water needed for sweating and thickens the blood, resulting in increased pressure to pump the blood throughout the body and straining the heart and blood vessels.
S Heat Index 103 to 115°F: An employer must actively encourage workers to drink plenty of water (about 4 cups/hour)
S 1915.88(b)(2): The employer shall provide potable drinking water in amounts that are adequate to meet the health and personal needs of each employee. S 1915.88(b)(3): The employer shall dispense drinking water from a fountain, a covered container with single-use drinking cups stored in a sanitary receptable, or single-use bottles. The employer shall prohibit the use of shared drinking cups, dippers, and water bottles.

When the air temperature gest hotter than skin temperature (typically 97-99°F), or if sweat does not evaporate, the body starts to gain heat and its core temperature rises. If body temperature rise is unabated, people may experience heat-related illnesses.
People at greater risk to the health effects of heat include: S Infants and children, as they lose fluid more quickly than adults and rely on caretakers to help keep them cool (U.S. Environmental Protection Agency [EPA]). S People taking certain medications. S Older adults, as they produce less sweat per gland, blood vessels change as people age, and it may be more difficult for blood to get pumped to the skin to help cool them down.
Heat stroke can occur with the body’s core temperature reaches at least 104°F and can lead to organ failure, brain damage, and potential death. Cognitive impairment can occur when a person is experiencing heatstroke. Older adults and children are most vulnerable to heat stroke.
(source: NOAA) Figure 3. National competition logo. (source: EPA) Continued from page 45
An existing heat illness prevention campaign from OSHA is currently developing formal heat regulations to protect indoor and outdoor workers from hazardous heat (Figure 2) and an advance notice of proposed rulemaking was issued in October 2021. It’s anticipated that the regulations will focus on protecting workers in environments where the heat index is greater than 80°F. Currently, the Division of Occupational Safety and Health in California (Cal/OSHA) requires that when air temperature in the workplace exceeds 80°F, shade structures must be erected if no other shade is readily available.Considering that OSHA is proposing workplace hazardous heat regulations, it seems that current water treatment facilities with ventilated-only buildings may require climatecontrolled environments in the future.
46 September 2022 • Florida Water Resources Journal
A 2022 published study examined the association between higher warm-season temperatures and the number of mental health-related emergency department (ED) visits by U.S. adults with health insurance (commercial health insurance or Medicare Advantage). The researchers evaluated approximately 3.5 million ED visits and found that higher warm-season temperatures increase the risk of emergency department visits for mental-health conditions, including substance use disorder, anxiety disorders, schizophrenia, self-harm, and childhoodonset behavioral disorders (Nori-Sarma, Amruta; Sun, Shengzhi; Sun, Yuantong; et al.
“Association Between Ambient Heat and Risk of Emergency Department Visits for Mental Health Among U.S. Adults, 2010 to 2019.” JAMA Psychiatry, Feb. 23, 2022). Rising body temperatures cause people to breathe harder. This is dangerous for people with respiratory-compromised systems from conditions such as asthma and chronic obstructive pulmonary disease (COPD). Air pollution and pollen may accompany high heat and can make breathing more difficult. High temperatures may strain the heart and lead to heart attacks. When our body temperature rises, our heart rate rises and the Figure UnitedheatExtreme4.daysintheStatesin2050.
Potable water is defined in Part 1915, Subpart F, as “water that meets the standards for drinking purposes of the state or local authority having jurisdiction, or water that meets the quality standards prescribed by the U.S. Environmental Protection Agency’s National Primary Water Regulations (40 CFR, Part 141).”These regulations clearly outline that an employer is obligated to provide water on the jobsite and to ensure that potable water is readily available in sufficient quantities and consumed by employees.
Heat’s Physiological Impacts


Millions of workers around the world are exposed to chronic heat stress and recurrent dehydration that may increase their risk for chronic kidney disease (CKD) and ultimately kidney failure. (Nerbass, Fabiana B.; PecoitsFilho, Roberto; Clark, William F., et al.
(Sorensen, Cecilia; Garcia-Trabanino, Ramon; :A New Era of Climate Medicine –
The New England Journal of Medicine, Aug. 22, 2019)
The EPA and its cosponsors (NOAA, Federal Emergency Management Agency, U.S. Department of Health and Human Services, The Atlantic Council, Georgetown Climate Center, Groundwork USA, and National Association of County and City Health Officials) launched the Let’s Talk About Heat Challenge
U.S.arecommunicationbeunderserveddisproportionatetoduringextremestrategiesinnovativeagov/innovation/lets-talk-about-heat-challenge),(www.epa.nationalcompetition(Figure3)toidentifyandeffectivecommunicationthatinformpeopleoftherisksofheatandidentifywaystokeepsafethehottestdays.Extremeheatislinkedanincreasedriskofillnessanddeathandhasimpactsonpeoplewhoareandoverburdened(EPA).WinnersofthecompetitionwillannouncedinFall2022andtheirsolutionsaboutextremeheattobesharedwithcommunitiesacrossthe
Potable Water Access to Help Manage Extreme Heat Risks
Extreme heat is and will continue to be present in our lives and a health hazard that we will need to actively manage. On Aug. 10, 2022, and per www.heat.gov, the National Integrated Heat Health Information System (NIHHIS) reported that approximately 21.5 million people in the U.S. were under active National Water Service extreme heat advisories, watches, and warnings. Extreme heat days projected in 2050 by NOAA are shown in Figure 4. The importance in providing readily available potable water for consumption and assisting with cooling people who have overheated or are in danger of overheating cannot be overstated. Excessive heat in the U.S., and here locally in Florida, is real and is a part of our daily activities, especially during the summer. It’s important for us as water purveyors to provide the quantity and quality of potable water to sufficiently quench the increasingly thirsty Floridians impacted by the heat. S
Florida Water Resources Journal • September 2022 47
heart works harder to pump blood near the skin to get rid of the heat. About a quarter of heatrelated deaths are caused by a combination of heat and cardiovascular disease (EPA).
Extreme Heat Risks Initiatives
Factory Trained Technicians - Emergency Repair Services - PM Service/Plans Gas Feed Systems Dry Chemical Feed Systems Peristaltic Pumps Fiberglass Enclosures Metering Pump Skids Tablet ScaleAnalyzersFeedersSystems Serving the Southeast since 1976 watertc@watertc.com800–826-7699 watertc.com
Addressing Heat-Triggered Renal Disease.”
“Occupational Heat Stress and Kidney Health: From Farms to Factories.” Kidney International Reports,When2017)the body heats up, kidneys will decrease their outflow of urine as blood flow decreases away from internal organs to the skin, and body fluid is secreted as sweat. There is increasing evidence that heat exposure greater than 104°F can cause daily subclinical acute kidney injury (ischemia, temperature-induced oxidative stress, and decreasing intracellular energy stores), which may cumulatively impair kidney function and result in CKD, either directly or by exacerbating renal insults caused by other environmental exposures—or both.


pay
position
Chief Operator the hourly rate of for this is $28.45-$32.71. City of Port St. Lucie-Utility Systems Department
provides
and
currently accepting applications for a full-time Water
to
The starting salary for this position is $71,941-$82,732, depending on qualifications.
ager?keywords=opera&pagetype=jobOpportunitiesJobsjobs/3535485/wastewater-treatment-operations-manhttps://www.governmentjobs.com/careers/cityofpsl/ at Village of Wellington is Operator. application Utilities Engineering Division ensure timely completion of capital improvement projects, design services engineering support operations, and ensures review and approval of commercial and industrial development will be determined by qualifications of candidates who exceed the minimum requirements as outlined within the job compensation based on licensure.
APPLY:
Administrative, supervisory, and technical work in
Water Treatment Plant Operators The Water Treatment Plant
to utility
dept?keywords=chief&pagetype=jobOpportunitiesJobsjobs/3682761/chief-water-plant-operator-utility-systems-https://www.governmentjobs.com/careers/cityofpsl/
Wastewater Treatment Operations Manager
residential,
48 September 2022 • Florida Water Resources Journal C L A S S I F I E D S CLASSIFIED ADVERTISING RATES - Classified ads are $20 per line for a 60 character line (including spaces and punctuation), $60 minimum. The price includes publication in both the magazine and our Web site. Short positions wanted ads are run one time for no charge and are subject to editing. ads@fwrj.com POSITIONS AVAILABLE CITY OF WINTER GARDEN –POSITIONS AVAILABLE The City of Winter Garden is currently accepting applications for the following positions: EXPERIENCED & TRAINEES/LABORERS - Collection Field Tech – I, II, & III - Distribution Field Tech – I, II, & III - Public Service Worker II – Stormwater - Superintendent – Collections, Wastewater, & Stormwater - Wastewater Plant Operator – Class C Please visit our website at www.cwgdn.com for complete job descriptions and to apply. Applications may be submitted online, in person or faxed to 407-877-2795.
operation and mechanical maintenance of Water Treatment Plant and their related Thesystems.starting
**Additionaldescription.
Water Plant
are available on our website: https://wellingtonfl.munisselfservice. aspx?req=20&sreq=5&form=WTO3&desc=OPERATORcom/employees/EmploymentOpportunities/JobDetail. III, WATER TREATMENT PLANT We are located in Palm Beach County, Florida. The Village of Wellington offers great benefits. For further information, call Human Resources at (561) 753-2585. Seminole County Government Utilities Engineering Division ManagerSeminole County Government Sanford, FL $88,150.23Salary - $141,040.37 Annually ManagesDescriptionthe
Highly responsible administrative position, under the general direction of the Assistant Director of the Utility Systems, this position performs technical and administrative work in developing goals and objectives of managing the wastewater treatment facilities and associated divisions within the department. Overall supervisory, and management responsibility of the Utility’s Wastewater facilities team, including Capital Improvement Project (CIP) and infrastructure asset management program functions through extensive analysis of maintenance, rehabilitation, and replacement.
Apply online. Job postings and
Minimum Qualifications Bachelor’s Degree in Engineering and ten (10) years of progressively responsible experience in a water, wastewater and/or solid waste utility, including five (5) years of supervisory experience. possess registration as a professional engineer in the State of Florida, or the ability to obtain such within 6 months of employment. A comparable amount of education, training, or experience may be substituted for the minimum qualifications. https://www.governmentjobs.com/careers/seminolecountyfl/jobs/3494581/utilities-engineering-division-manager
City of Port St. Lucie-Utility Systems Department
Must
plans. **Salary

Florida Water Resources Journal • September 2022 49 City of Titusville - Multiple Positions Available Water Reclamation Superintendent, Plant Operator Trainee, Utility Asset Program Manager, Meter Technician, Electrician, Maintenance Chief, Maintenance Mechanic, Equip Operator, Utility Foreman, Utility Field Tech, Service Worker. Apply at www.titusville.com Engineering Support Services Manager/Engineering: $81,353.07 - $130,164.91/annually Field Service and Advanced Metering Infrastructure (AMI) Administrator $76,030.91 - $121,649.46/annually Project Manager: $70,835.55 - $113,336.89/annually Public Utilities Asset Manager: $81,353.07 - $130,164.91/annually Public Utilities Manager (Wastewater Treatment Plant): $81,353.07 - $130,164.91/annually Utilities Instrumentation and Control Systems Specialist: $56,114.71 - $85,294.61/annually For More Info and to Apply go to: http://agency.governmentjobs.com/hollywoodfl/default.cfm EOE CityM/F/D/VofZephyrhills – Now Hiring for Multiple Positions! Wastewater Operators A,B,C Scada Specialist, Utility Service Workers, and Readers. Excellent Benefits and Retirement Plan. Access an Application/Submit Resume at: http://www.ci.zephyrhills.fl.us/jobs or reach our Human Resources Department at 813-780-0000, ext. 3522 or 3521. U.S. Water Service Corporation Hiring for all positions throughout the entire state of Florida https://www.uswatercorp.com/careers/?src=1&keyword=&city=&state=FL The Department of Environmental & Engineering Services (DEES) is currently accepting job applications at: https://www.margatefl.com/207/Job-Opportunities LOOKING FOR A JOB? The FWPCOA Job Placement Committee Can Help! Contact Joan E. Stokes at 407-293-9465 or fax 407-293-9943 for more information.


10� B) Slow-rate land application, public access areas Per FAC 62-610 Part III Slow Rate Land Application Systems, Public Access Areas, Residential Areas and Edible Crops – 62610.460 Waste Treatment and Disinfection, “Preapplication waste treatment shall result in a reclaimed water that meets, at a minimum, secondary treatment and high-level disinfection. The reclaimed water shall not contain more than 5 mg/L of suspended solids before the application of the disinfectant.” and are 60 the (for example, January 1 for the March issue). closing date upcoming everything else is 30 days before the issue month (for example, September 1 for the October issue). as well as
2 C) pH and temperature
Per FAC 62-555.350(5)(a), “For each day a supplier of water serving 3,300 or more persons serves water to the public from a drinking water treatment plant that includes chemical disinfection for virus inactivation, the supplier of water shall continuously monitor the residual disinfectant concentration (C) before or at the first customer and shall record in the logs. . . the lowest C measured before or at the first customer during peak flow, the corresponding disinfectant contact time (T) at the C monitoring point during peak flow, and the resulting lowest CT provided before or at the first customer during peak flow. In addition, at least once for each day the supplier of water serves water to the public from the plant, the supplier of water shall measure and record the temperature of the water at the point where C is monitored, shall measure and record the pH of the water at the point where C is monitored if free chlorine is being used for virus inactivation, and with this temperature and pH information, shall determine and record the minimum CT. . .”
days before
including classified ads,
The
Per FAC 62-555.350(6), Operation and Maintenance of Public Water Systems, “Suppliers of water shall maintain a minimum free chlorine residual of 0.2 mg/L, or a minimum combined chlorine residual of 0.6 mg/L, or an equivalent chlorine dioxide residual, throughout their drinking water distribution system at all times.”
7. D) 4 mg/L. Per FAC 62-555.340(2)(a) Disinfection and Bacteriological Evaluation of Public Water System Components, “After reducing the total chlorine residual in the facilities or mains to no more than 4 mg/L, a total of at least two samples – each taken on a separate day and taken at least six hours apart from the other sample(s) – shall be collected at each of the locations indicated in the applicable American Water Works Association (AWWA) standard. . . and the samples shall be analyzed for total residual chlorine and for the presence of total coliform.”
for display ad and directory card reservations, notices, announcements,
Test Yourself Answer Key Editorial Calendar January Wastewater Treatment February Water Supply; Alternative Sources March Energy EnvironmentalEfficiency;Stewardship April Conservation and Reuse May Operations and Utilities Management June Biosolids Management and Bioenergy Production July Stormwater Management; Emerging Technologies; Florida Water Resources Conference Review August Disinfection; Water Quality September Emerging Issues; Water Resources Management October New Facilities, Expansions, and Upgrades November ���������� Water Treatment December Distribution and Collection Technical articles are usually scheduled several months in advance
3 D) 0.8 mg/L Per FAC 62-550.310(2)(a), Primary Drinking Water Standards: Maximum Contaminant Levels and Maximum Residual Disinfectant Levels, “Maximum residual disinfectant levels (MRDLs) are as RESIDUALDISINFECTANTfollows: MRDL Chlorine 4 mg/L (as Cl2) Chloramines 4 mg/L (as Cl2). Chlorine Dioxide 0.8 mg/L (as ClO2). 4 C) 75 percent Per FAC 62-600.440(6)(a), Disinfection Requirements, “. . . facilities required to provide high-level disinfection shall meet the following criteria (using membrane filter [MF] or equivalent most probable number [MPN] 1.methods):Overa30-day period (monthly), 75 percent of the fecal coliform values shall be below the detection limits, 2. Any one sample shall not exceed 25 fecal coliform values per 100 mL of sample; and, 3. Any one sample shall not exceed 5 mg/L of total suspended solids (TSS) at a point before application of the disinfectant.”
From page 26 1 D) 0.6 mg/L.
issue month
8 A) exposure time. Per the NWRI “Ultraviolet Disinfection Guidelines for Drinking Water and Water Reuse” (NWRI UV Guidelines), Chapter 2, Section 2 Water Reuse – UV Dose, “The UV dose is expressed, for practical purposes, as the product of UV intensity, expressed in milliwatts per square centimeter (mW/cm2), and the exposure time of the fluid or particle to be treated, expressed in seconds (s). The units of UV dose are expressed as millijoules per square centimeter (mJ/cm2), which is equivalent to milliwatt seconds per square centimeter (mW•s/cm2).”
the most recent notices, announcements, and classified advertisements, go to www.fwrj.com or call 352-241-6006. Januar y 2016Januar y 2016 SERVING FLORIDA’S WATER AND WASTEWATER INDUSTRY SINCE 1949
9 C) Filtration Per NWRI UV Guidelines, Chapter 2, Section 2 Water Reuse – UV Dose, “The design of a UV disinfection system for the water reuse applications discussed in Section 1 depends on the type of filtration technologies preceding it. The following minimum criteria shall be used for these three types of filtration: media filtration, membrane filtration, and reverse osmosis (RO).”
5 C) 20 Per FAC 62-555.315(6)(b)1., Disinfection of Wells and Bacteriological Surveys and Evaluations of Wells, “A total of at least 20 samples—each taken on a separate but consecutive workday and taken at least six hours apart from the other samples—shall be collected after first pumping the well to waste to remove all residual chlorine and then pumping the well to waste at a rate approximately equal to that of the permanent well pump for at least 15 minutes before each sample is collected, and the samples shall be analyzed for the presence of total residual chlorine, total coliform, and E. coli.”
For further information on submittal requirements, guidelines for writers, advertising rates and conditions, and ad dimensions,
due
50 September 2022 • Florida Water Resources Journal AECOM 21 AWWA HBCU Virtual Student Chapter Membership 36 Blue Planet Environmental Systems 51 CEU Challenge 15 Data Flow ���������������������������������������������������������������������������������� 24 Florida Water Resources Conference�������������������������������������� 6 FSAWWA Fall Conference 30-34 FWPCOA Training Calendar 39 Gerber Pumps 9 Heyward 2 Hudson Pump �������������������������������������������������������������������������� 11 Hydro International �������������������������������������������������������������������� 5 InfoSence 47 Lakeside 7 PolyProcessing 37 UF TREEO Center 43 US Submergent 27 Violia ����������������������������������������������������������������������������������������� 19 Water Treatment����������������������������������������������������������������������� 47 Wright-Pierce 41 Xylem 52 Display Advertiser Index
events, and
6� C) Four-log Per FAC 62-555.315(6)(b)2., Disinfection of Wells and Bacteriological Surveys and Evaluations of Wells, “If a well is considered microbially contaminated or susceptible to microbial contamination, the supplier of water shall provide treatment that reliably achieves at least four-log inactivation or removal of viruses. . .”

WORLD’S FIRST WASTEWATER PUMPING SYSTEM WITH INTEGRATED INTELLIGENCE This revolutionary system delivers optimal performance while reducing your total cost of ownership. It also offers unparalleled flexibility and simplicity on a whole new level. You might even say it thinks for itself. We invite you to enter a new era in wastewater pumping with Flygt Concertor. One powerful solution. Unlimited possibilities. For more information contact your local Xylem product sales professional. Xylem Products 455 Harvest Time Dr. Apopka, FL 32771 407 www.flygt.com880-2900 CONCERTORINTEGRATEDINTELLIGENCE™ NEW PUMPING SYSTEM WITH

