17 minute read
Conversion of Onsite Treatment and Disposal Systems: Will it Improve Water


FWRJ Conversion of Onsite Treatment and Disposal Systems: Will it Improve Water Quality?
Jenelle A. Mohammed, Sarina J. Ergas, and Mahmood H. Nachabe
In Florida, approximately 2.5 million households utilize onsite treatment and disposal systems (OSTDS) for domestic wastewater. Conventional OSTDS (also known as septic systems) consist of a septic tank and a shallow subsurface drainfield. Treatment begins in the septic tank, where wastewater undergoes flotation, sedimentation, and biodegradation. Effluent is then transported to a drainfield and soil treatment area where pollutants are further treated via filtration, sorption, and biodegradation.
Depending on site conditions, OSTDS may release elevated levels of nutrients, organic matter, and fecal indicator organisms to groundwater and surface waters (Swann, 2001). Florida requires a minimum lot size of 0.25 acres (Rule 64E-6.005.7[a] and [b], Florida Administrative code [F.A.C.]) and a minimum 2-ft separation from the drainfield bottom and wet season high water table at the OSTDS site; however, a larger separation distance is recommended between the drainfield and groundwater table for effective nutrient removal (Cox et al., 2019).
Many regions in Florida are experiencing water table elevation changes due to changes in precipitation patterns and sea level rise, resulting in loss of OSTDS treatment performance. Treatment can also be affected by soil permeability and organic content, lack of regular maintenance, and/or temporal variations in loading rates. Inadequate treatment can result in contamination of drinking water sources, eutrophication, and harmful algal blooms.
The Clean Water State Revolving Fund 319 Grants and State Water Quality Assistance Grants programs support local government water quality improvement projects. These projects include the design, construction, or upgrades of wastewater or stormwater systems and nonpoint source pollution prevention projects. Similarly, the Florida Department of Environmental Protection (FDEP) is working toward county-specific septic upgrade incentive programs. A number of Florida counties and municipalities have received grants and initiated OSTDS conversion projects (Table 1), including sewer construction and expansion of wastewater treatment plants. Millions of dollars have also been allocated for future OSTDS conversion projects.
Despite the large investments in septicto-sewer conversions in Florida, there is a lack of information on whether these projects significantly improve water quality. It’s difficult to quantify the actual nutrient load reductions resulting from septic-to-sewer conversions due to natural attenuation processes in the subsurface (e.g., sorption, nitrification/denitrification). A number of confounding factors also make it difficult to pinpoint the impacts of septic-tosewer conversions, such as concurrent changes in land uses (e.g., from agricultural to residential) or changes in fertilizer ordinances.
The goal of this study was to evaluate whether water quality improved in a receiving water body within a small urban watershed with a large number of OSTDS conversions and limited confounding factors. The Red Bug Slough (RBS) sub-basin of the Phillippi Creek watershed in Sarasota County was selected for this analysis because it’s a small urban watershed (<5 sq mi), with a large number of septic-to-sewer conversions and contains a small waterbody with a long history of water quality records.
Table 1. Example of State Wastewater Projects Funded by Florida Department of Environmental Protection Wastewater Grant Program for Fiscal Year 2021-2022
Location Project Name Total Funding (~millions)
Orange County Wekiwa Springs Septic-to-Sewer Program 36.9 Hillsborough County Gibsonton Septic-to-Sewer Project 20.4
Marion County Silver Springs Shores Septic-to-Sewer, Additional Phase 20
Brevard County Merritt Island C, F, G Septic-to-Sewer, South Beaches A Septic-to-Sewer, South Central A, D Septic-to-Sewer 16.4
Martin County
Martin County Utilities Septic-to-Sewer Project: Port Salerno/New Monrovia Communities 8 St. Lucie County North Hutchinson Island Septic-to-Sewer 5.8 Hernando County Septic-to-Sewer Conversion - District A, Phase 1B 5 Indian River County West Wabasso Phase 3 Septic-to-Sewer Conversion 1.6 City of High Springs CR 236 Septic Tank Phaseout 0.4 City of Apopka Camp Wewa Septic-to-Sewer Conversion 0.25
Jenelle A. Mohammed, M.S., EI, is a staff engineer II at Langan Engineering and Environmental Services in Tampa. Sarina J. Ergas, Ph.D., P.E., and Mahmood H. Nachabe, Ph.D., P.E., are professors in the department of civil and environmental engineering at the University of South Florida in Tampa.
Methodology
Site Description
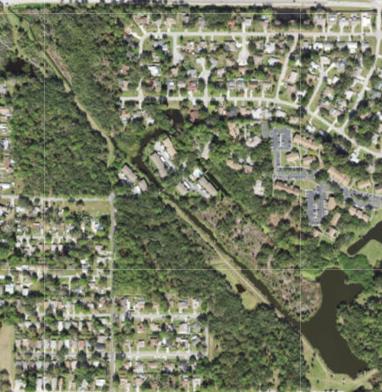
The Phillippi Creek watershed (Figure 1) is a large coastal watershed in Sarasota County comprised of six smaller sub-basins. The RBS sub-basin, at ~3 sq mi (Figures 2a and 2b), was a suitable area of interest, with water quality data covering pre- and postconversion eras. The drainage area is 69 percent residential, 0.1 percent recreational, and 0.5 percent agricultural. The RBS is a 2.8-mi stream flowing northwest, which discharges into Phillippi Creek; its catchment area drains approximately 1,925 acres. This Continued on page 10
Figure 1. Phillippi Creek Watershed and Red Bug Slough sub-basin. (source: Florida Department of Environmental Protection Division of Environmental Assessment and Restoration [DEAR], Watershed Assessment Section) Continued from page 8 small catchment was also an ideal candidate, as it included minimal changes or confounding factors, as shown in Figure 1.
Data Sources
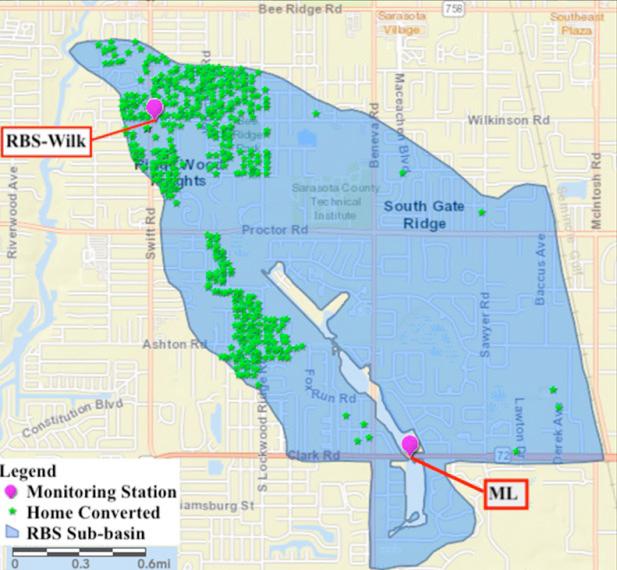
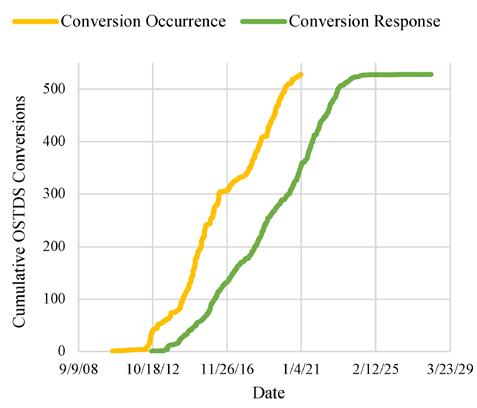
The OSTDS abandonment permits granted between 2000 and 2020 were obtained from the Florida Department of Health in Sarasota County. The permits were examined for “final inspection approvals,” as these indicated that construction was completed and homeowners were notified of sewer connection availability. In this area, 528 OSTDS located within 2 mi of the stream were converted between 2010 and 2021 (Figures 3a and 3b).
The Sarasota County Water Atlas was the primary source of water quality data, as it contains data from various agencies, researchers, and volunteer groups. Data sets were obtained from Sarasota County coastal creeks and FDEP for total nitrogen (TN), total phosphorus (TP), ammonia-nitrogen (NH3-N), nitrate plus nitritenitrogen (NOx), turbidity, chlorophyll-a, and total suspended solids (TSS). A long record (>15 years) was available from sampling stations located at RBS near Wilkinson Road (RBS-Wilk) and upstream at Mirror Lake. Data sets were categorized into preconversion (January 2005 – July 2010) and postconversion (August 2010 – December 2020) periods.
Confounding Factors
Confounding factors evaluated for their potential influence on water quality included changes in land use (e.g., from agricultural to urban), water levels, fertilizer policies and practices (e.g., fertilizer restrictions or turfgrass •
a
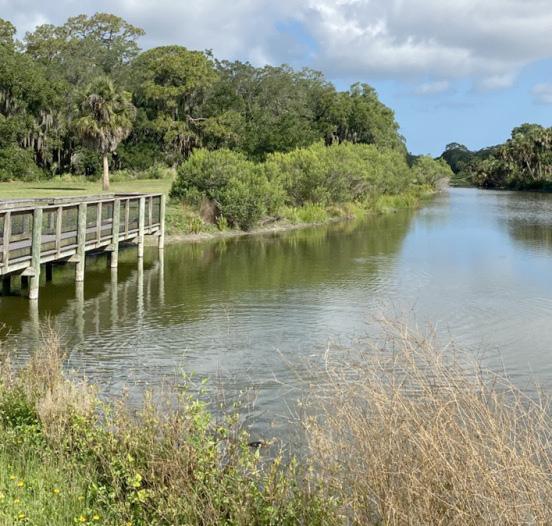
Figure 2. a) Red Bug Slough site visit (credit: Jenelle A. Mohammed) and b) Aerial of Red Bug Slough, Sarasota County. (source: Google Earth, 2021) b
Continued on page 12
a b
Continued from page 10 management), and bird influences. Land use and watershed data were accessed through ArcGIS layers and summarized land use distributions within the sub-basin using spatial analysis tools. Changes in fertilizer policies were assessed through discussions with Sarasota County staff.
Due to the large bird population in Mirror Lake, the influence of upstream levels on RBS was assessed by comparison and correlation of TN and TP concentrations at the lake and RBSWilk. Based on this analysis, the following factors did not cause substantial changes in nitrogen and phosphorus loads during the time of the study:
2100 1900 1700 1500 1300 Pre-Conversion Years Post-Conversion Years Baseline = 1500 ug/L Linear (Pre-Conversion Years) Linear (Post-Conversion Years)
y = -1.63x + 3640.8
1100 900 700 y = 0.98x - 66.853
500 1/14/04 10/10/06 7/6/09 4/1/12 12/27/14 9/22/17 6/18/20 Sample Date Figure 4. Time series of total nitrogen concentrations in Red Bug Slough.
Table 2. Time Series Analysis and T-Test Results for Red Bug Slough
Parameter TN TP Chlorophyll-a Turbidity Preconversion Period Mean
1,196 ± 85 (μg/L) 316 ± 21 (μg/L) 5.67 ± 0.03 (μg/L) 4.46 ± 0.28 (NTU)
Postconversion Period Mean
1,338 ± 106 (μg/L) 275.4 ± 33.7 (μg/L) 5.73 ± 0.04 (μg/L) 4.08 ± 0.21 (NTU)
Postconversion Trendline Slope
-1.63 (μg/L/month)
-0.65 (μg/L/month)
-0.002 (μg/L/month)
-0.01 (NTU/month) Initial OSTDS Load 7.3x10⁴ (kg/year) 2.8x10⁴ (kg/year) - -
Reduced Load Per Conversion
0.11 (kg/year) 0.04 (kg/year) - -
T-test (Pre versus Post) Two-Tail p-Value
Parameter
*0.004 *0.007 0.96 0.09
Nutrient Deficit Versus OSTDS Conversions Regression Analysis p-value
Total Nitrogen 0.83
Total Phosphorus *0.007
Chlorophyll-a 0.05 Turbidity 0.74 *statistically significant
813 924
180
73 383 348
NH3-N Pre NH3-N Post Org-N Pre Org-N Post NOx Pre NOx Post
NH3-N Pre NH3-N PostPre-Conversion Years Org-N Pre Org-N Post NOx Pre NOx PostPost-Conversion Years Figure 5. Red Bug Slough average NH3-N, Org-N, and NOX concentrations during the pre- and post-onsite treatment and disposal systems conversion periods. S Land Uses. Prior to sewer construction and
OSTDS conversions, the RBS sub-basin was largely built out and on septic. Between 2007 and 2017, there were no significant land use changes. No golf courses or wastewater treatment plant discharges (e.g., “package plants”) were located within the study site. S Fertilizer Policies. Sarasota County’s fertilizer ordinances have remained unchanged since 2007.
Data Analysis
The following is a brief description of the data analysis methods used in this study. Additional details can be found in Mohammed (2021). Statistical tests were done at a 95 percent confidence interval, with p-values less than 0.05 used to determine the statistical significance.
Seasonality
Water quality can fluctuate seasonally in response to changes in rainfall, surface runoff, groundwater recharge, or seasonal fertilizer bans. Pooled monthly averages and standard deviations of water quality data were examined over the entire study period to examine seasonality impacts. Based on this analysis, three-month moving averages were applied to concentration data prior to trendline analysis.
Time Series Analysis
A reference baseline concentration was established for each parameter using a oneand-a-half-year period (six months prior to and one year after conversion initiation). A time series analysis was used to generate trendline slopes of changes in TN, TP, chlorophyll-a, and turbidity concentrations in RBS for the pre- and postconversion eras. The annual streamflow in RBS was estimated by considering an annual water yield of 15 in. for the Sarasota region (U.S. Geological Survey). This value was combined with trendline slopes to estimate average nutrient load reductions (kg/year) for the postconversion period. The average nutrient load reductions were compared with the preconversion nutrient load from the 4,913 OSTDS in the RBS subbasin. Preconversion OSTDS nutrient loads were estimated by assuming 2.26 residents per household, a flow rate of 80 gal/capita/day and septic tank TN and TP concentrations of 60 mg/L and 10 mg/L, respectively.
Comparison of Pre- and Postconversion Water Quality Averages
The TN, TP, NOx, NH3-N, turbidity, and chlorophyll-a values were evaluated using parametric t-tests to determine the statistical significance of pre- and postconversion annual means.
Nutrient Deficit Analysis
Nutrient concentration deficits upstream of RBS-Wilk were calculated for the postconversion era by subtracting the concentration of each parameter from its preconversion baseline. A time lag is expected before water quality changes in response to OSTDS conversions (Figure 3b). The magnitude of the time lag is locationspecific and may range from months to decades, depending on hydrology, soil properties, vegetation, and pollutant sorption properties (Meals et al., 2010).
In this study, the lag time was estimated based on the elapsed travel time of OSTDS effluent discharge to the slough, which was calculated from the conversion date, distance of the conversion site to the slough, and average groundwater velocity. A regression analysis of nutrient deficit versus conversion impact date (considering the lag period) was then used to examine whether the increase in septic conversions over time resulted in long-term nutrient concentration deficits.
Results and Discussion
Time Series Analysis
The time series analysis of the three-month moving average TN concentrations (Figure 4) revealed high variability in TN over time; the highest TN levels were typically observed during the wet season, most likely due to surface runoff. A postconversion decline in TN concentration from a baseline of 1,500 µg/L at a rate of -1.63 μg/L/month was calculated. Based on the water yield in the slough and the slope of the regression line, an average load reduction of 58.2 kg-TN/ year was estimated for the postconversion era (August 2010 to December 2021). This change in TN load represented a 0.08 percent reduction from the preconversion OSTDS TN load.
In contrast with TN, the highest TP levels were observed during the dry season, possibly due to Sarasota County’s fertilizer blackout period during the wet season. The slope of the postconversion TP concentration trendline (-0.65 μg/L/month; Table 2) suggested a 23.1 kg-TP/year load reduction due to the OSTDS conversion program. The small reduction in TP is not surprising, as phosphorus adsorbs to soil particles or is stored in groundwater before slowly bleeding out to the slough (Withers et al., 2011). Changes in TP accounted for a 0.2 percent reduction from the initial OSTDS TP load.
An analysis of the chlorophyll-a data showed significant seasonality, with the highest concentrations during the wet season. Although chlorophyll-a is not a constituent of OSTDS effluent, high concentrations indicate nutrient overenrichment, resulting in increased phytoplankton and algae growth (Cowell and Dawes, 2004); however, changes in chlorophyll-a concentrations during the postconversion era were not significant (Table 2).
Turbidity concentrations exhibited little seasonality, and changes in turbidity during the postconversion era were not significant. Variations in turbidity may occur due to algal blooms, transport of suspended particles by stormwater runoff, or resuspension of particles during severe weather events. The slight postconversion decline in turbidity (-0.01 nephelometric turbidity units [NTU]/month) could be attributed to reduced algal blooms due to reduced nutrient loads or reduced baseflow in RBS as OSTDS were removed from the sub-basin.
Comparison of Pre- and Postconversion-Era Water Quality Averages
The average NH3-N, Org-N, and NOx concentrations for the pre- and postconversion eras are summarized in Figure 5. The NH3-N (p = 0.000034) and NOx (p = 0.002) concentrations significantly decreased during the postconversion era, while changes in Org-N concentrations were not significant (p = 0.59). The OSTDS can be substantial contributors to NH3 in regions, such as Florida, where seasonal high water tables do not provide enough of an unsaturated soil layer for nitrification (Bloetscher and Van Cott, 1999). High NOx levels prior to OSTDS conversions may have been due to limited denitrification in low organic content soil (Lusk et al., 2018). The OSTDS can produce nitrate concentrations between 25 and 80 mg N/L at the groundwater tables (McCray et al., 2005), but these concentrations decrease due to dilution and denitrification as the water flows toward the surface water systems. The Org-N was the most prevalent form of nitrogen in RBS throughout the study period, which is not commonly associated with OSTDS effluents, indicating other sources, such as bird feces, live or dead organisms, or organic solids from the catchment’s surface runoff.
Nutrient Deficit Analysis
The regression of TN deficits (from the baseline) on the cumulative conversion impact date (accounting for the time lag) resulted in a slight, but not significant, positive relationship (Figure 6), suggesting that TN decreased as OSTDS conversions increased over time. A similar analysis of TP data revealed a significant decrease in TP, as OSTDS were converted to sewerage (Table 3). No significant correlations
600
400
TN Deficit (ug/L) 200
0
-200 0 50 100 150 200 250 300 350
-400
-600
Total OSTDS Conversions
Figure 6. Regression analysis of total nitrogen deficit on total onsite treatment and disposal systems conversions.
Table 3. Regression Analysis Results Reflecting Statistically Significant or Insignificant Changes in Water Quality Parameters
Parameter
Nutrient Deficit Versus OSTDS Conversions Parameter Regression Analysis p-value
Total Nitrogen 0.83
Total Phosphorus *0.007
Chlorophyll-a 0.05 Turbidity 0.74 *statistically significant
Nutrient Deficit Versus OSTDS Conversions Regression Analysis p-value
Total Nitrogen 0.83
Total Phosphorus *0.007
Chlorophyll-a 0.05 Turbidity 0.74 *statistically significant
Continued from page 13 were observed between chlorophyll-a or turbidity and OSTDS conversions (Table 3). The results of the nutrient deficit analysis were consistent with the time series analysis presented.
Confounding Factors
Due to a lack of reliable water level data during the postconversion era (data not shown), it’s not clear whether nutrient concentrations were influenced by changing flow rates in RBS. The lack of data also limited the ability to determine whether OSTDS removal from the sub-basin reduced aquifer recharge and baseflow return to RBS and Phillippi Creek.
Mirror Lake is a 17-acre private lake located upstream of RBS-Wilk (Figure 3a). The TN levels in the lake exceeded the FDEP Numeric Nutrient Criteria TN threshold of 1,650 μg/L (Figure 7). Sources of TN in the lake include upstream watershed input, in-lake nitrogen fixation, and inputs from a large population of migrating birds. The TN samples from the lake also had high variability, possibly due to seasonal bird migration patterns (Bhateria and Jain, 2016). The TN concentrations in RBS were consistently lower than those in the lake, indicating natural attenuation processes in the stream.
Conclusions
When properly designed, sited, and maintained, OSTDS can effectively remove organic matter, suspended solids, and pathogens from domestic wastewater in areas not served by public sewage systems. Conventional OSTDS, however, are not designed to remove nutrients, and may contribute to enrichment of surface waters. These systems are especially vulnerable to climate change-induced alterations in water table elevations and increased precipitation. To limit anthropogenic contributions of nutrients, certain regions can benefit from conversion of OSTDS to centralized sewers.
This study focused on water quality changes after OSTDS conversion in Sarasota County. Statistically significant improvements were observed in TN and TP levels in RBS during the postconversion period. The NH3-N and NOx levels, commonly associated with OSTDS effluents, significantly decreased. Changes in Org-N, chlorophyll-a, and turbidity were not significant, reflecting other transport and transformation processes within the sub-basin; however, the observed rates of improvements (-0.65 μg/L of TP/month and -1.63 μg/L of TN/month) are considered slow. The OSTDS conversions, therefore, should be considered a long-term strategy for reducing nutrient concentrations, rather than a response to Florida’s urgent and pressing need to address major issues, such as algal blooms.
The modest improvements in water quality in RBS are not surprising, given the small fraction of conversions in the sub-basin, the relatively large lot sizes (7,000-11,000 ft2), and the distance separating conversion sites from the slough. This results in long groundwater travel times and the opportunity to attenuate and assimilate nutrients in the local environment. It’s recommended that government agencies prioritize OSTDS conversion projects in regions with poor water quality near high densities of OSTDS, small lot sizes, short distances to surface waterbodies, and high water table levels.
Acknowledgments
The authors would like to thank Dr. Xueqing Gao, environmental consultant, and Dr. Eberhard Roeder, environmental administrator, at the FDEP Onsite Sewage Program for their valuable contributions throughout this research project. Also, many thanks to John Ryan and Ashlee Edwards at Sarasota County Public Works, and David Hoover at the Florida Department of Health, for their contributions, attendance at meetings, and assistance with data collection for this study. This study was funded in part by the Florida Department of Health Onsite Sewage Research Program. The views expressed are solely those of the authors and do not necessarily reflect views and policies of the Florida Department of Health.
8000 7000 6000 5000 4000 3000 2000 1000 0 7/15/15 11/26/16 4/10/18 8/23/19 1/4/21 Date Station ML Station RBS-Wilk 1650 ug/L TN Critera (FDEP)
References
• Bhateria, R., Jain, D., 2016. Water quality assessment of lake water: a review. Sustainable
Water Res. Mgmt., 2(2), 161-173. https://doi. org/10.1007/s40899-015-0014-7. • Bloetscher, F., Van Cott, W.R., 1999. Impact of septic tanks on wellhead protection efforts.
Florida Water Resources Journal, 51(2), 38-41. https://www.fwrj.com/articles2/9904.pdf. • Cowell, B.C., Dawes, C.J., 2004. Growth and nitrate-nitrogen uptake by the freshwater cyanobacterium Lingpa wollei, J. Aquatic Plant
Mgmt.. 42: 69-71. https://www.apms.org/japm/ vol42/v42p69.pdf. • Cox, A., Loomis, G., Amador, J., 2019.
Preliminary evidence that rising groundwater tables threaten coastal septic systems.
J. Sus. Water Built Envir., 5(4). https://doi. org/10.1061/jswbay.0000887. • Lusk, M., Toor, G., Obreza, T., 2018. Onsite sewage treatment and disposal systems: phosphorus. Retrieved Oct. 13, 2021, from https://edis.ifas.ufl.edu/publication/SS551. • McCray, J.E., Kirkland, S.L, Siegrist, R.L.,
Thyne, G.D., 2005. Model parameters for simulating fate and transport of onsite wastewater nutrients. Ground Water, 43(4), 628-639. https://doi.org/10.1111/j.17456584.2005.0077.x. • Meals, D., Dressing, S., Davenport, T., 2010.
Lag time in water quality response to best management practices: a review. J. Envir.
Quality, 39(1), 85-96. https://doi.org/10.2134/ jeq2009.0108. • Mohammed, J.A., 2021. An assessment of nutrient improvement in surface water due to the conversion of onsite sewage treatment and disposal systems to sewerage. MS Thesis,
Department of Civil and Environmental
Engineering, University of South Florida. • Swann, C., 2001. The influence of septic systems at the watershed level. Watershed Protection
Techniques, 3(4), 821. • Withers, P.J.A., Jarvie, H.P., Stoate, C., 2011.
Quantifying the impact of septic tank systems on eutrophication risk in rural headwaters.
Envir. Int., 37(3), 644-653. https://doi. org/10.1016/j.envint.2011.01.002. S


