QUARTERLY MARKET REPORT
First Quarter 2024 ~ January - March
CHICAGO, IL 312.750.9333 NAPLES, FL 239.316.3883 HINSDALE, IL 630.686.4886 LAKE FOREST, IL 847.737.4775 WINNETKA, IL 847.807.3660 NEW BUFFALO,MI 269.256.6600 LAKE GENEVA, WI 262.649.9530 PARK CITY, UT 435.523.4453 ©2024 Coldwell Banker and the Coldwell Banker logos are trademarks of Coldwell Banker Real Estate LLC. The Coldwell Banker System fully supports the principles of the Fair Housing Act and the Equal Opportunity Act. Owned by a subsidiary of Anywhere Real Estate Inc. Coldwell Banker, the Coldwell Banker Logo, Coldwell Banker Global Luxury, and the Coldwell Banker Global Luxury logo are registered service marks owned by Coldwell Banker Real Estate LLC. Not intended as a solicitation if your property is already listed by another brokerage.
LUXURY PROPERTY REPORT
DAWN MCKENNA GROUP STATS
MARKET REVIEW BY DAWN MCKENNA
CHICAGO’S NEIGHBORHOODS IN REVIEW
CHICAGO’S NORTH SHORE IN REVIEW
CHICAGO’S WESTERN SUBURBS IN REVIEW
NAPLES IN REVIEW
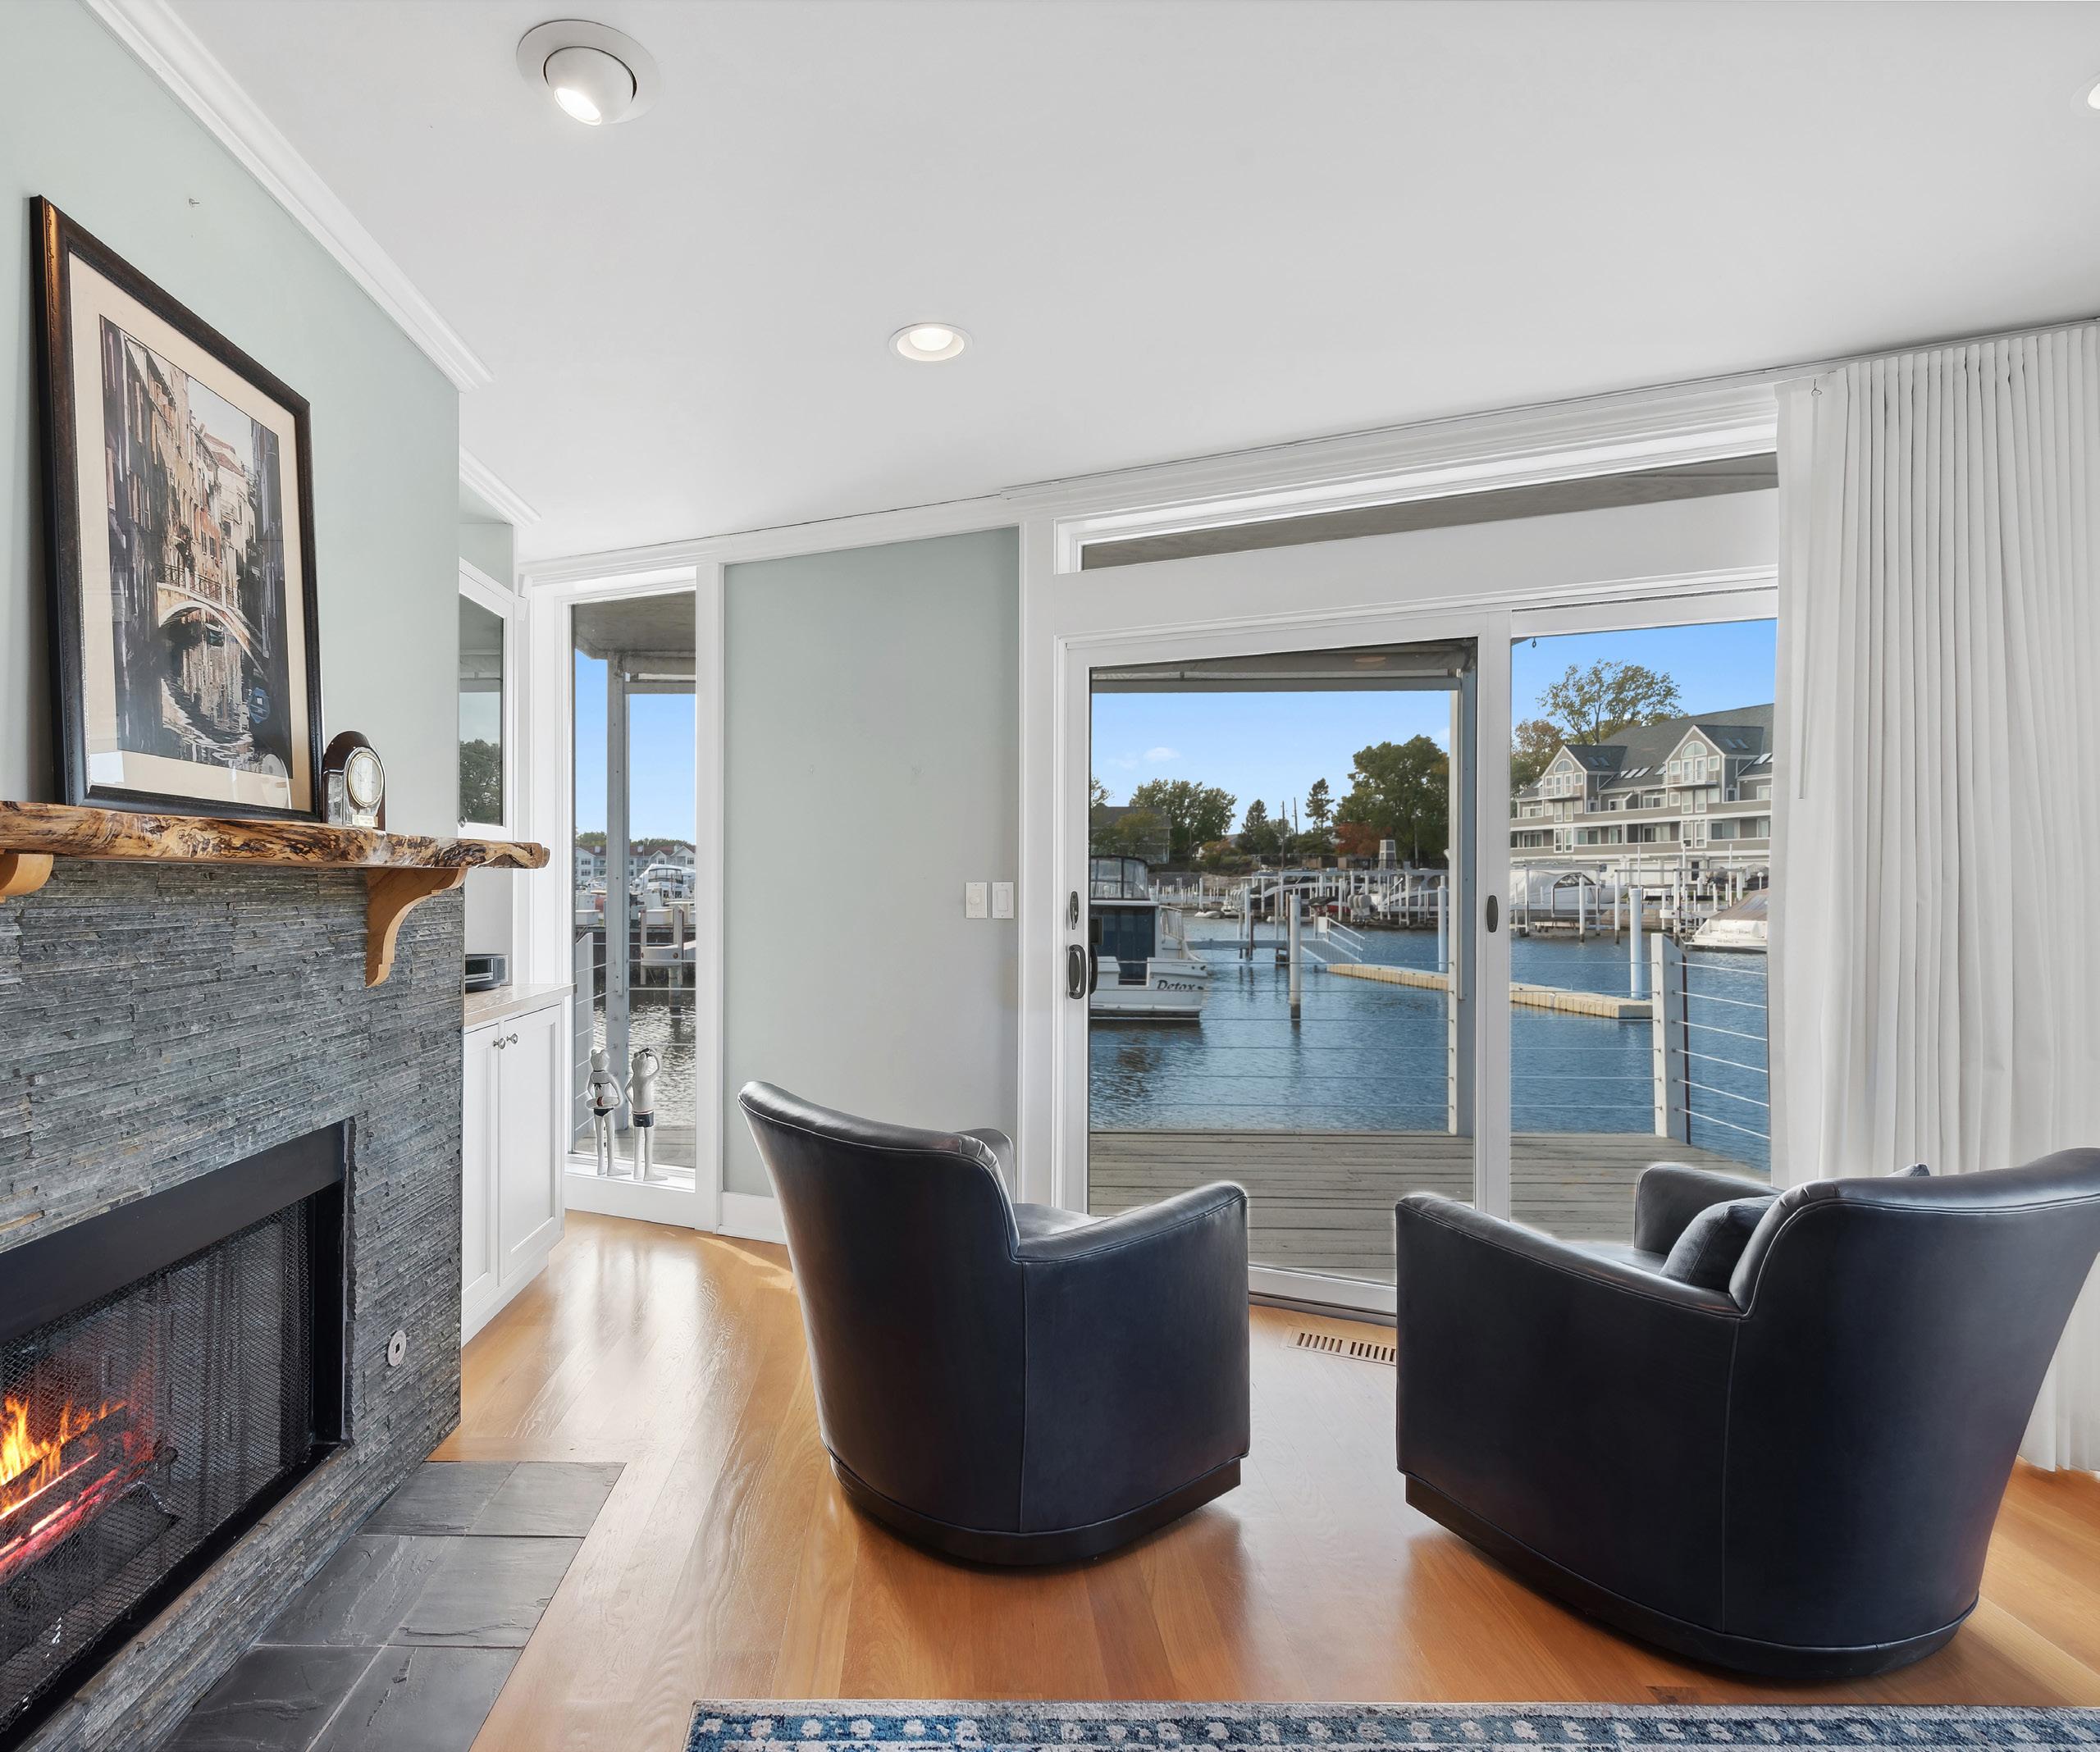
HARBOR COUNTY IN REVIEW
LAKE GENEVA IN REVIEW
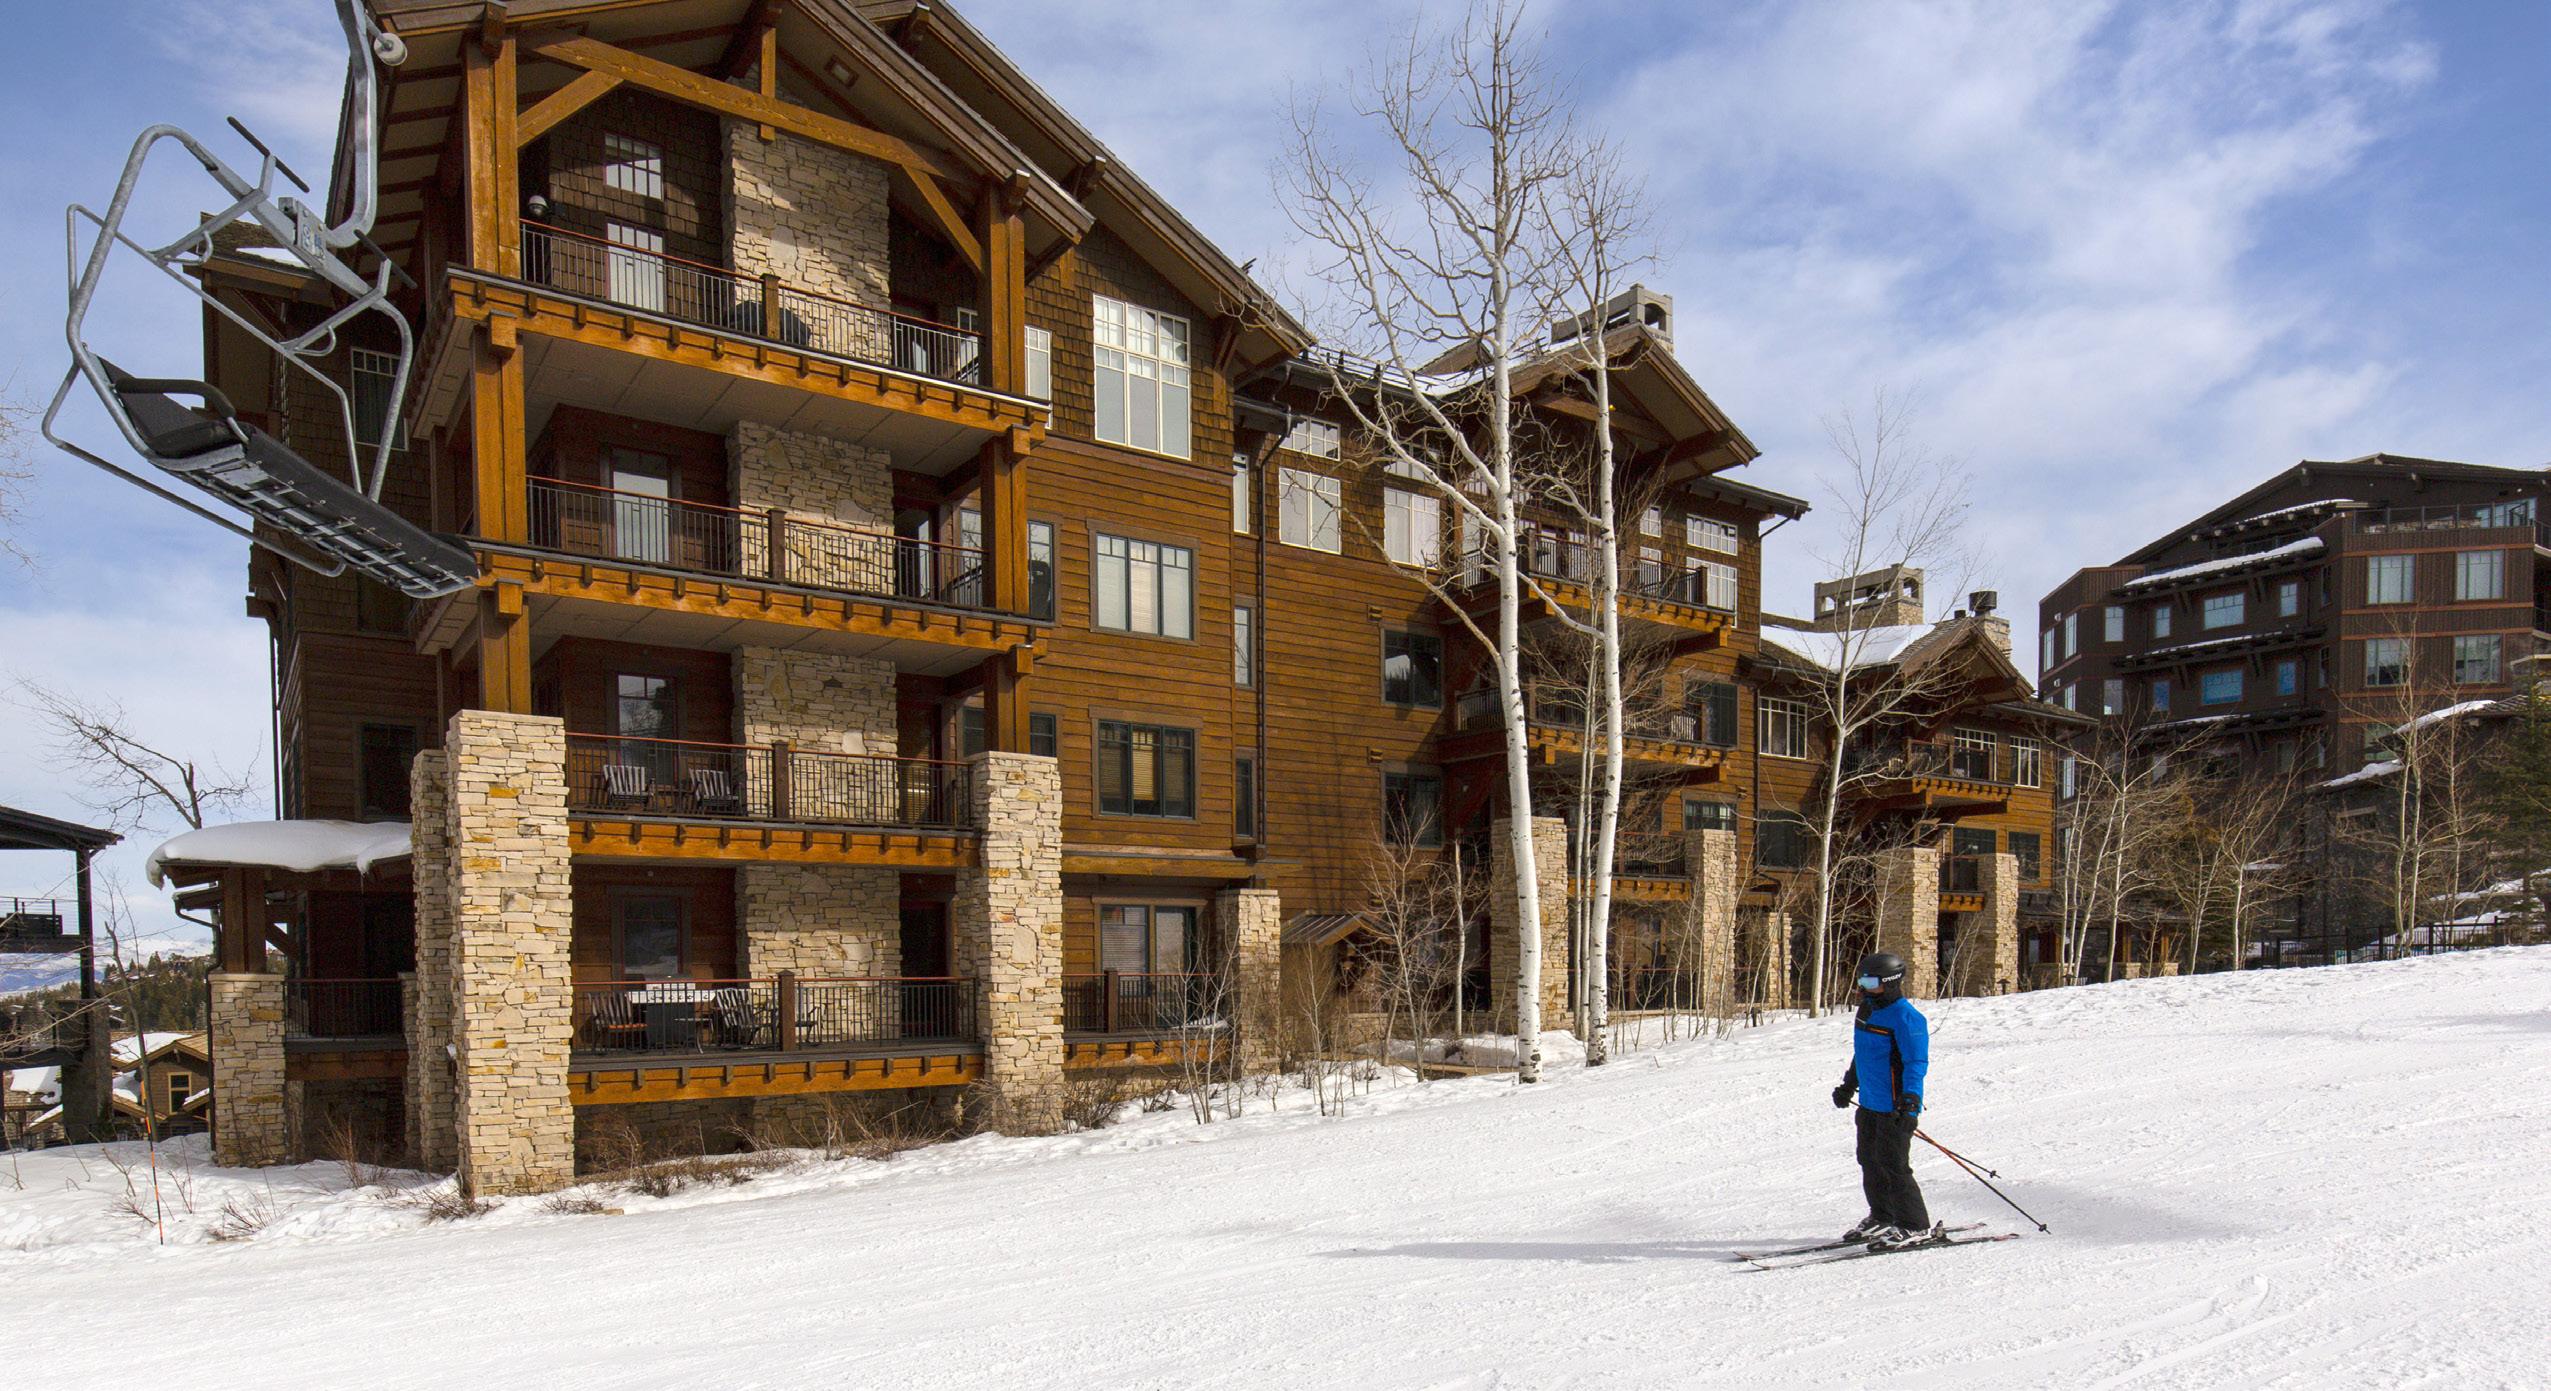
PARK CITY IN REVIEW
20 26 32 44 50 54
4 6 8
First
Quarter 2024
#4 TEAM IN THE UNITED STATES AMONG ALL BROKERAGES RANKED BY WALL STREET JOURNAL REALTRENDS #1 TEAM IN MIDWEST 1 #1 TEAM FOR ILLINOS 2 #1 TEAM IN UTAH 4 #1 TEAM IN SOUTHWEST FLORIDA 3 36 TEAM MEMBERS 25 DEDICATED AGENTS 8 OFFICES 7 KEY MARKETS Source: #4 Large Team in the Nation among all brokerages by closed volume ranked by RealTrends, as advertised in The Wall Street Journal 2023. 1 #1 Large Team in the Midwest among all brokerages by closed volume ranked by RealTrends, as advertised in The Wall Street Journal 2023. 2 #1 Large Team in Illinois within Coldwell Banker Realty based on closed volume 01/01/2023 – 12/31/2023 in Midwest Real Estate Data MLS. 3 #1 Large Team in Southwest Florida within Coldwell Banker Realty based on closed volume 01/01/2023 – 12/31/2023 in Southwest Florida MLS. 4#1 Large Team in Utah within Coldwell Banker Realty based on closed volume 01/01/2023 – 12/31/2023 in Utah Real Estate MLS.
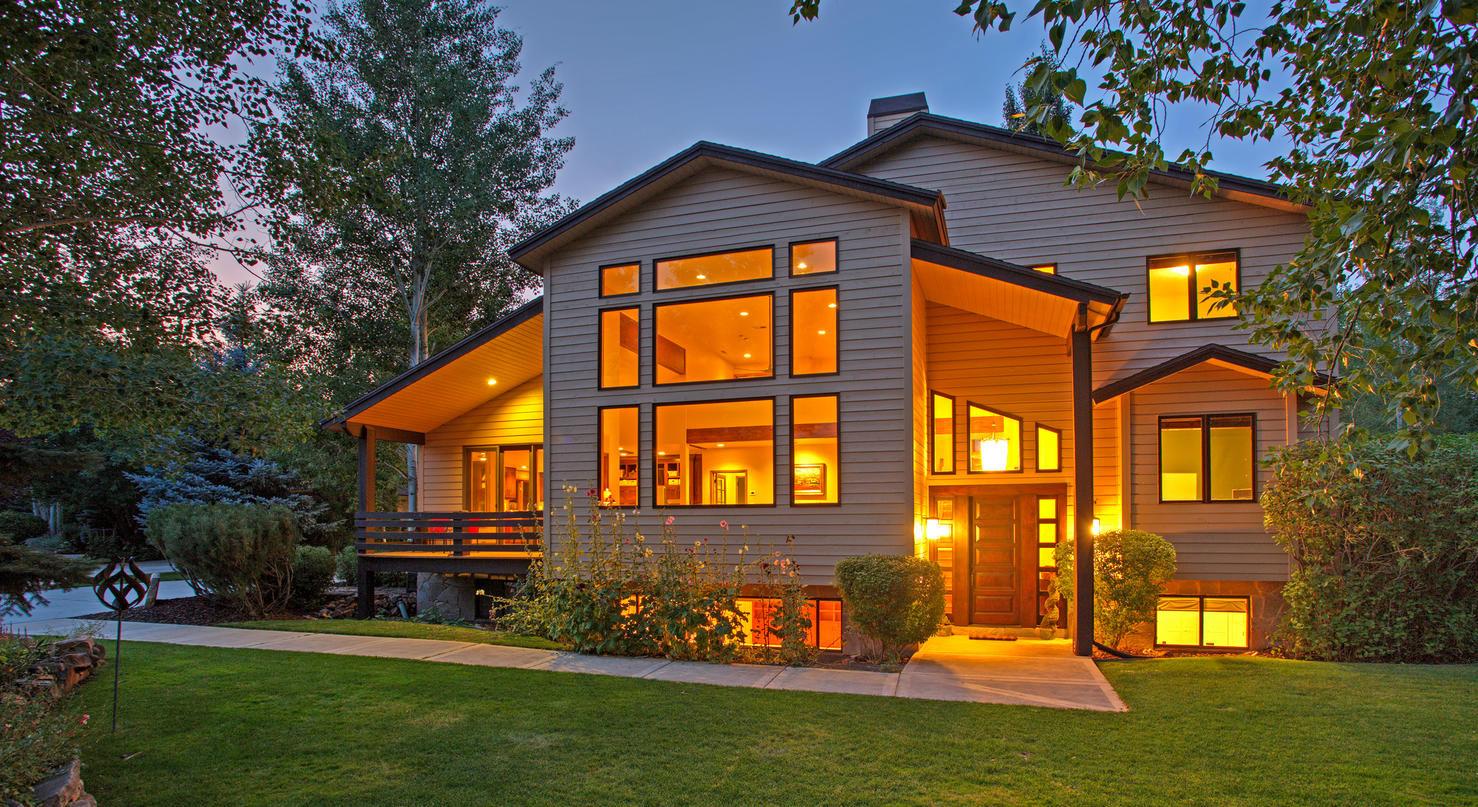
PARK CITY, UT
DMG IS EVERYWHERE OUR CLIENTS CALL HOME
LAKE GENEVA, WI
CHICAGOLAND, IL NEW BUFFALO, MI
The Dawn McKenna Group (DMG) is renowned for continually setting new standards. This has led to the recognition of DMG being an industry leader, not just in Coldwell Banker, but among international peers in affiliations such as the International Luxury Alliance and Global Collective.
Although Dawn McKenna has been the No. 1 Coldwell Banker agent in Illinois for the past 20 years, she and her team have recognized the need to grow into new markets, in order to fulfill their clients’ evolving lifestyle preferences.
By hand selecting local agents who also have a vision of providing a different standard of service, Dawn and DMG are now located in seven markets:
• Chicago, Lake Forest/Lake Bluff and Winnetka, Illinois
• Lake Geneva, Wisconsin
• Naples, Florida
• New Buffalo, Michigan
• Park City, Utah
NAPLES, FL

FIRST QUARTER REVIEW BY DAWN MCKENNA
The U.S. real estate market may still be facing some challenges, such as high mortgage rates. However, home prices continue to rise and economists predict that any market correction will be modest.
In March, the National Association of Realtors reported that the median existing-home price was up 5.7 percent over 2023.
Expectations for a significant correction of home prices since the slowdown of the market in late 2022 have simply not occurred. The reason is due to an unprecedented supplyand-demand imbalance, which remains attributable to a continued and significant low level of inventory.
While much of the market continues to hunker down, playing it safe, this is not the Dawn McKenna way, and we spent 2023 and the first quarter of 2024 looking at improving how we can better serve our clients’ interests.
Two consumer trends defined our growth. Our clients’ desire to diversify their real estate portfolios and their determination to embrace new lifestyle choices. This saw DMG expand into new markets: Harbor Country in Michigan, Lake Geneva in Wisconsin, and
Park City in Utah. These now complement our existing Chicagoland markets of downtown Chicago, the Western Suburbs, and the North Shore, and Naples in Florida.
Accordingly, we have also expanded our team of dedicated and client-focused real estate experts, as well as added a new Sales Director, Bernadette Kettwig, Creative Director, Bill Sloan, and New Development Sales and Marketing Director, Christine Lutz, each tasked with driving our business forward into the future. Our focus is to continue to build a passionate, imaginative, and entrepreneurial group supported by a team of leadership experts ready to embrace the latest technology while fully understanding the requirements of our clients.
We will continue to innovate and be your trusted guide, whether we’re helping you find your first apartment in the big city, relocating to a new home in the suburbs, or searching for a well-earned second home in the countryside, sunshine destination, or winter resort.
We value the confidence you place in us, and take that responsibility seriously.
Founder of the Dawn McKenna Group of Coldwell Banker
6
 CHICAGO - 119 NORTH GRANT STREET
DMG represented the Seller
CHICAGO - 119 NORTH GRANT STREET
DMG represented the Seller
CHICAGO
NEAR NORTH SIDE : GOLD COAST, OLD TOWN
During the first quarter of 2024, there was an uptick in sales in both of these markets, compared to the first quarter of 2023, especially in the condo/townhome segment.
In historic Gold Coast, the return of hyper-neighborhood-focused buyers is partially responsible for the increase in sales. The biggest difference year-overyear is the increase in sales in the $1-$2 million range in 2024 compared to sales in the $2-$3 million range in 2023 for single-family homes. Equally, there was an
GOLD COAST
SINGLE FAMILY
uptick in condo sales in the lower priced ranges in the last two quarters compared to the more equitable demand seen in the first quarter of 2023.
In Old Town, demand remained equitable compared to the last quarter and first quarter of 2023. However, despite the introduction of new developments, inventory levels continue to decline as demand increases for condominiums – particularly those priced in the $250-$500,000 range. Much of the demand is driven by younger professionals.
1 - MARCH 31, 2024 VS. SAME PERIOD 2023 JANUARY 1 - MARCH 31, 2024 VS. SAME PERIOD 2023
$2,100,000
Median Sales Price
107
$422,500
6 4.3
69 Months Supply of Inventory Months Supply of Inventory Avg. Market Time
Median Sales Price
Market Time
ATTACHED
Closed Sales Q1 2024 Closed Sales Q1 2023 % Change Closed Sales Q4 2023 % Change $0 - $1M 0 0 - 0$1M - $2M 4 0 400.00% 1 300.00% $2M - $3M 1 5 -80.00% 1 0.00% $3M - $4M 2 2 0.00% 1 100.00% $4M+ 1 0 100.00% 0 100.00% Closed Sales Q1 2024 Closed Sales Q1 2023 % Change Closed Sales Q4 2023 % Change $0 - $250K 18 28 -35.71% 19 -5.26% $250K - $500K 40 26 53.85% 32 25.00% $500K - $1M 33 24 37.50% 21 57.14% $1M - $2M 7 9 -22.22% 11 -36.36% $2M+ 3 2 50.00% 1 200.00%
JANUARY
Avg.
8 | Chicago
OLD TOWN
SINGLE FAMILY
JANUARY 1 - MARCH 31, 2024 VS. SAME PERIOD 2023
JANUARY 1 - MARCH 31, 2024 VS. SAME PERIOD 2023
$2,397,500
Sales Price Median Sales Price
$374,950 10.5 1.4 100
41 Months Supply of Inventory Months Supply of Inventory
Market Time
Market Time
ATTACHED
CHICAGO - 260 E CHESTNUT STREET UNIT 1210
Closed Sales Q1 2024 Closed Sales Q1 2023 % Change Closed Sales Q4 2023 % Change $0 - $1M 2 1 100.00% 0 200.00% $1M - $2M 0 3 -100.00% 0$2M - $3M 0 1 -100.00% 1 -100.00% $3M - $4M 1 0 100.00% 0 100.00% $4M+ 1 0 100.00% 2 -50.00% Closed Sales Q1 2024 Closed Sales Q1 2023 % Change Closed Sales Q4 2023 % Change $0 - $250K 22 20 10.00% 22 0.00% $250K - $500K 40 33 21.21% 28 42.86% $500K - $1M 28 29 -3.45% 25 12.00% $1M - $2M 10 5 100.00% 12 -16.67% $2M+ 2 2 0.00% 0 200.00% Median
DMG represented the Seller
Avg.
Avg.
DMG represented the Seller
Chicago | 9
CHICAGO - 1254 N LASALLE STREET
RIVER NORTH, STREETERVILLE
Real Estate is mainly comprised of attached properties in these two neighborhoods, and then mostly high-rise condominiums, with only a few single-family homes that rarely come up for sale.
Properties that offer quality amenities such as wellness centers, roof-top gardens as well as a great walkability score saw the greatest demand.
River North’s demand grew compared to both the first and fourth quarters of 2023. New development from established developers is
RIVER NORTH
leading the way to offering more opportunities in this neighborhood.
Streeterville saw little change year-overyear in the number of sold properties in the first quarter of 2024, although there was a significant increase in sales within the $0$250,000 price band, comparatively.
Inventory in both markets has remained consistent over the last three months, which opened the market up for more sales and increased the opportunity for buyers looking to purchase either a one- or two-bedroom property.
JANUARY 1 - MARCH 31, 2024 VS. SAME PERIOD 2023
$390,000 5
Sales Price
53 Months Supply of Inventory Avg. Market Time
STREETERVILLE
ATTACHED
JANUARY 1 - MARCH 31, 2024 VS. SAME
2023
$385,000
6.5
68
PERIOD
Median Sales Price
Months Supply of Inventory Avg. Market Time
ATTACHED
Median
Closed Sales Q1 2024 Closed Sales Q1 2023 % Change Closed Sales Q4 2023 % Change $0 - $250K 19 13 46.15% 13 46.15% $250K - $500K 96 87 10.34% 80 20.00% $500K - $1M 37 40 -7.50% 25 48.00% $1M - $2M 10 15 -33.33% 8 25.00% $2M+ 1 2 -50.00% 5 -80.00% Closed Sales Q1 2024 Closed Sales Q1 2023 % Change Closed Sales Q4 2023 % Change $0 - $250K 46 21 119.05% 30 53.33% $250K - $500K 57 55 3.64% 34 67.65% $500K - $1M 34 49 -30.61% 36 -5.56% $1M - $2M 18 15 20.00% 20 -10.00% $2M+ 7 8 -12.50% 4 75.00% 10 | Chicago
CHICAGO - 401 N WABASH AVENUE UNIT 82A DMG represented the Seller DMG represented the Seller CHICAGO - 411 W ONTARIO STREET UNIT 415 Chicago | 11
LAKEVIEW, LINCOLN PARK
Overall, there was a strong consistency of demand for both single-family and attached properties in Lakeview and Lincoln Park when comparing sales year-over-year to the first quarter of 2024.
The inventory and sales in these highly desirable neighborhoods tell the story of their popularity. The first quarter of 2024 saw the return of multiple offers at levels not seen in over a year.
Both neighborhoods have benefited from the uptick of new trendy stores and restaurants that are synonymous with the
LAKEVIEW
SINGLE FAMILY
diverse culture and art scene associated with these communities.
Lakeview has attracted new buyers with the introduction of several new developments, with condos priced below $1 million, while Lincoln Park retained its popularity alongside its historic charm.
In the single-family market, properties in the $1-$2 million range saw the greatest demand as did condos/townhomes listed under $1 million. But of the greatest significance, for both markets and property types, is the continued low levels of inventory available.
JANUARY 1 - MARCH 31, 2024 VS. SAME PERIOD 2023
$3M
ATTACHED
JANUARY 1 - MARCH 31, 2024 VS. SAME PERIOD 2023
$3,600,000
$1,498,125 $415,000 1.8 1.4 31 34
Closed Sales Q1 2024 Closed Sales Q1 2023 % Change Closed Sales Q4 2023 % Change $0 - $1M 6 5 20.00% 2 200.00% $1M - $2M 14 9 55.56% 13 7.69% $2M - $3M 4 3 33.33% 6 -33.33%
- $4M 0 0 - 2 -100.00% $4M+ 0 0 - 0Median
Price Median
Sales
Sales Price
Months
Avg.
Avg. Market Time Closed Sales Q1 2024 Closed Sales Q1 2023 % Change Closed Sales Q4 2023 % Change $0 - $250K 50 77 -35.06% 59 -15.25% $250K - $500K 109 126 -13.49% 94 15.96% $500K - $1M 89 95 -6.32% 90 -1.11% $1M - $2M 11 7 57.14% 8 37.50% $2M+ 0 0 - 012 | Chicago
Months Supply of Inventory
Supply of Inventory
Market Time

JANUARY 1 - MARCH 31, 2024 VS. SAME PERIOD 2023
JANUARY 1 - MARCH 31, 2024 VS. SAME PERIOD 2023
$1,842,500 $612,500 5.6 1.1 68 35
CHICAGO - 626 W BELDEN AVENUE UNIT
1 DMG represented the Seller
1
DMG
CHICAGO - 1131 W GRACE STREET UNIT
DMG represented the Seller
represented the Seller
CHICAGO - 2615 N BOSWORTH AVENUE
SINGLE FAMILY ATTACHED LINCOLN PARK
Closed Sales Q1 2024 Closed Sales Q1 2023 % Change Closed Sales Q4 2023 % Change $0 - $1M 2 1 100.00% 4 -50.00% $1M - $2M 13 12 8.33% 14 -7.14% $2M - $3M 4 6 -33.33% 9 -55.56%
- $4M 5 0 500.00% 3 66.67%
2 2 0.00% 6 -66.67% Median Sales Price Median Sales Price
$3M
$4M+
Months
of
Avg. Market Time Avg. Market Time Closed Sales Q1 2024 Closed Sales Q1 2023 % Change Closed Sales Q4 2023 % Change $0 - $250K 17 22 -22.73% 15 13.33% $250K - $500K 56 82 -31.71% 49 14.29% $500K - $1M 98 66 48.48% 78 25.64% $1M - $2M 21 28 -25.00% 30 -30.00% $2M+ 1 4 -75.00% 0 100.00% Chicago | 13
Months Supply of Inventory
Supply
Inventory
NORTH CENTER, LINCOLN SQUARE
Sales for both neighborhoods remained strong during the first quarter of 2024. The decline in sales was more related to the lack of inventory rather than a downturn in demand.
Inventory levels in both markets and property types at the end of the first quarter were all below two months of supply.
A combination of great schools, family-centric amenities, comparative value per square foot, and new construction has seen North Center and Lincoln Square become highly desirable communities.
NORTH CENTER
SINGLE FAMILY
Prices in both the North Center and Lincoln Square were still comparably affordable and offer first time and returning buyers the opportunity to invest in a home rather than a rental.
Single family-homes between $1-$2million retained their appeal year-over-year and quarter-over-quarter, as did attached properties listed under $1 million.
JANUARY 1 - MARCH 31, 2024 VS. SAME PERIOD 2023
$1,415,000
ATTACHED
JANUARY 1 - MARCH 31, 2024 VS. SAME PERIOD 2023
$3,600,000
$525,500 1.9 1.5 27
Closed Sales Q1 2024 Closed Sales Q1 2023 % Change Closed Sales Q4 2023 % Change $0 - $1M 5 8 -37.50% 11 -54.55% $1M - $2M 20 13 53.85% 20 0.00% $2M - $3M 3 4 -25.00% 4 -25.00% $3M - $4M 1 0 100.00% 0 100.00% $4M+ 0 0 - 0Median
Median
Sales Price
Sales Price
24 Months Supply
Months Supply of Inventory Avg. Market Time Avg. Market Time Closed Sales Q1 2024 Closed Sales Q1 2023 % Change Closed Sales Q4 2023 % Change $0 - $250K 1 4 -75.00% 2 -50.00% $250K - $500K 17 31 -45.16% 32 -46.88% $500K - $1M 23 37 -37.84% 17 35.29% $1M - $2M 1 2 -50.00% 1 0.00%
0 0 - 014 | Chicago
of Inventory
$2M+
LINCOLN SQUARE
SINGLE FAMILY
JANUARY 1 - MARCH 31, 2024 VS. SAME PERIOD 2023
ATTACHED
JANUARY 1 - MARCH 31, 2024 VS. SAME PERIOD 2023
$1,192,500
Sales Price Median Sales Price
$340,000 1.7 1 15 20 Months Supply of Inventory Months Supply of Inventory Avg. Market Time Avg. Market Time
CHICAGO - 3322 N LEAVITT STREET DMG represented the Seller
Closed Sales Q1 2024 Closed Sales Q1 2023 % Change Closed Sales Q4 2023 % Change $0 - $500K 2 2 0.00% 4 -50.00% $500K - $1M 3 5 -40.00% 6 -50.00% $1M - $2M 10 11 -9.09% 6 66.67% $2M - $3M 1 1 0.00% 0 100.00% $3M+ 0 0 - 0Closed Sales Q1 2024 Closed Sales Q1 2023 % Change Closed Sales Q4 2023 % Change $0 - $250K 14 11 27.27% 25 -44.00% $250K - $500K 19 36 -47.22% 21 -9.52% $500K - $750K 8 5 60.00% 3 166.67% $750K - $1M 1 3 -66.67% 1 0.00% $1M+ 0 0 - 0 -
Median
Chicago | 15
WEST TOWN/WICKER PARK, HUMBOLT, LOGAN SQUARE/BUCKTOWN
West Town and Logan Square share a similar price point for the single-family and attached properties in these two neighborhoods, with their month’s supply of inventory and average time on market also comparable between property types.
Sales during the first quarter of 2024 remained on par with both the first and last quarters of 2023, and only constrained by the lack of available inventory as all registered less than two months of supply.
Demand has been driven by the popularity of these communities, which have seen an
uptick in new restaurants and stores as well as construction of multi-family homes and new condo developments.
While Humbolt Park lies further southwest of West Town and Logan Square offer more more of a single-family home community, with condos found in low-rise buildings rather than skyscrapers.
Highly popular this socially and ethnically diverse community sees a stability of demand with sales both year-over-year and quarterover-quarter remaining consistent, especially for properties priced below $500,000.
WEST TOWN/ WICKER PARK
SINGLE FAMILY
JANUARY 1 - MARCH 31, 2024 VS. SAME PERIOD 2023
$1,210,000
Median Sales Price
JANUARY 1 - MARCH 31, 2024 VS. SAME PERIOD 2023
$3,600,000
$575,000 1.8 1.3
41 23
ATTACHED
Closed Sales Q1 2024 Closed Sales Q1 2023 % Change Closed Sales Q4 2023 % Change $0 - $500K 2 4 -50.00% 2 0.00% $500K - $1M 14 10 40.00% 14 0.00% $1M - $2M 17 28 -39.29% 17 0.00% $2M - $3M 1 0 100.00% 1 0.00% $3M+ 1 1 0.00% 0 100.00%
Median Sales Price
Months
Months Supply of
Avg. Market Time Avg. Market Time Closed Sales Q1 2024 Closed Sales Q1 2023 % Change Closed Sales Q4 2023 % Change $0 - $250K 8 2 300.00% 4 100.00% $250K - $500K 71 98 -27.55% 68 4.41% $500K - $1M 124 106 16.98% 103 20.39% $1M - $2M 7 5 40.00% 4 75.00% $2M+ 0 0 - 1 -100.00% 16 | Chicago
Supply of Inventory
Inventory
SINGLE FAMILY
JANUARY 1 - MARCH 31, 2024 VS. SAME PERIOD 2023
ATTACHED
JANUARY 1 - MARCH 31, 2024 VS. SAME PERIOD 2023
LOGAN SQUARE/BUCKTOWN HUMBOLT
SINGLE FAMILY
JANUARY 1 - MARCH 31, 2024 VS. SAME PERIOD 2023
ATTACHED
JANUARY 1 - MARCH 31, 2024 VS. SAME PERIOD 2023
Median Sales Price
Market Time
Median Sales Price
Market Time
Median Sales Price
Median Sales Price $1,125,000 $386,000 $507,500 $466,000 1.6 4.6 1 N/A 32 44 22 59 Months Supply of Inventory Months Supply of Inventory Months Supply of Inventory Months Supply of Inventory
Closed Sales Q1 2024 Closed Sales Q1 2023 % Change Closed Sales Q4 2023 % Change $0 - $500K 6 4 50.00% 6 0.00% $500K - $1M 12 16 -25.00% 13 -7.69%
- $2M 20 20 0.00% 20 0.00%
- $3M 0 1 -100.00% 0$3M+ 0 0 - 0Closed Sales Q1 2024 Closed Sales Q1 2023 % Change Closed Sales Q4 2023 % Change $0 - $250K 3 11 -72.73% 16 -81.25% $250K - $500K 13 14 -7.14% 13 0.00% $500K - $750K 4 6 -33.33% 4 0.00% $750K - $1M 2 2 0.00% 1 100.00% $1M+ 0 0 - 1 -100.00% Closed Sales Q1 2024 Closed Sales Q1 2023 % Change Closed Sales Q4 2023 % Change $0 - $250K 1 1 0.00% 4 -75.00% $250K - $500K 0 1 -100.00% 1 -100.00% $500K - $750K 1 0 100.00% 2 -50.00% $750K - $1M 0 0 - 0$1M+ 0 0 - 0Closed Sales Q1 2024 Closed Sales Q1 2023 % Change Closed Sales Q4 2023 % Change $0 - $250K 6 5 20.00% 6 0.00% $250K - $500K 42 42 0.00% 30 40.00% $500K - $750K 24 25 -4.00% 21 14.29% $750K - $1M 23 11 109.09% 13 76.92% $1M+ 3 0 300.00% 1 200.00%
$1M
$2M
Avg.
Avg.
Avg. Market Time Avg. Market
Chicago | 17
Time
WEST LOOP, THE LOOP/LAKESHORE EAST
These communities are recognized as highly desirable for new and returning buyers, with most homes for sale in the high-rise condominium market.
These vibrant neighborhoods feature eclectic restaurants, shops, and nightlife with the many skyscrapers are attracting buyers of one- and two-bedroom condos.
Equally, several new developments in price points below $750,000 have enticed young families to these communities that offer good schools, lots of amenities, and are situated close to transit.
WEST LOOP
SINGLE FAMILY
Prices have continued to increase year-overyear as demand escalates and inventory levels remain low – at the end of the first quarter the supply of condominiums for sale remained below 4 months.
The average days on market, coupled with low months of supply showed that demand from buyers remained strong. Expectations are that these markets will continue to see strong demand, in particular for attached homes priced between $250-$500,000.
JANUARY 1 - MARCH 31, 2024 VS. SAME PERIOD 2023
$642,500
Median Sales Price
7
67
ATTACHED
JANUARY 1 - MARCH 31, 2024 VS. SAME PERIOD 2023
$410,000
$3,600,000
Median Sales Price
2.4
48 Months Supply of Inventory Months Supply of Inventory Avg. Market Time Avg. Market Time
Closed Sales Q1 2024 Closed Sales Q1 2023 % Change Closed Sales Q4 2023 % Change $0 - $500K 0 1 -100.00% 2 -100.00% $500K - $750K 2 1 100.00% 1 100.00% $750K - $1M 0 0 - 3 -100.00% $1M - $2M 0 3 -100.00% 1 -100.00% $2M+ 0 0 - 0Closed Sales Q1 2024 Closed Sales Q1 2023 % Change Closed Sales Q4 2023 % Change $0 - $250K 11 20 -45.00% 15 -26.67% $250K - $500K 90 103 -12.62% 86 4.65% $500K - $750K 28 31 -9.68% 24 16.67% $750K - $1M 9 13 -30.77% 7 28.57% $1M+ 27 30 -10.00% 38 -28.95%
18 | Chicago

LOOP/LAKESHORE EAST
$387,250
3.7
71 Months Supply of Inventory Avg. Market Time
CHICAGO - 910 S MICHIGAN AVENUE UNIT 1904 DMG represented the Seller
- 130 S CANAL STREET UNIT 219 DMG represented the Seller DMG represented the Seller CHICAGO - 165 N CANAL STREET UNIT 1603 ATTACHED THE
1
31, 2024 VS.
PERIOD 2023 Closed Sales Q1 2024 Closed Sales Q1 2023 % Change Closed Sales Q4 2023 % Change $0 - $250K 29 33 -12.12% 18 61.11% $250K - $500K 68 80 -15.00% 89 -23.60% $500K - $1M 31 28 10.71% 38 -18.42% $1M - $2M 13 10 30.00% 21 -38.10% $2M+ 3 5 -40.00% 5 -40.00% Median
CHICAGO
JANUARY
- MARCH
SAME
Sales Price
For more information about your local market and to view current properties available visit our website: www.DawnMckennaGroup.com Chicago | 19
NORTH SHORE
LAKE BLUFF, LAKE FOREST, HIGHLAND PARK
These three communities nestled along the lakeshore of Lake Michigan offer a wide range of property types that take advantage of the myriad of different scenic landscapes from lakeshore to forests, resulting in high demand and low inventory levels.
Properties listed below $1 million during the first quarter of 2024 saw the fastest response from buyers, but across all these communities any property that was move-in-ready also saw immediate activity.
Inventory remains the biggest challenge in these communities with all markets showing,
LAKE BLUFF
SINGLE FAMILY
by the end of the first quarter of 2024, less than 3.5 months of home supply for potential buyers.
Lake Bluff and Highland Park saw the greatest demand for homes in the $500,000-$1 million range, with the median sold price increasing to over $700,000.
Whereas, properties listed between $1-$2 million saw the greatest demand in Lake Forest, which also saw its median sold price increase to $1.25 million.
JANUARY 1 - MARCH 31, 2024 VS. SAME PERIOD 2023
$717,500
2.6
41
LAKE FOREST
SINGLE FAMILY
JANUARY 1 - MARCH 31, 2024 VS. SAME PERIOD 2023
$1,250,100
3.4
64 Months Supply of Inventory Months Supply of Inventory Avg. Market Time
Closed Sales Q1 2024 Closed Sales Q1 2023 % Change Closed Sales Q4 2023 % Change $0 - $500K 5 4 25.00% 0 500.00% $500K - $1M 12 17 -29.41% 18 -33.33% $1M - $2M 26 16 62.50% 24 8.33% $2M - $3M 5 1 400.00% 6 -16.67% $3M+ 1 4 -75.00% 2 -50.00% Median
Median
Sales Price
Sales Price
Avg.
Closed Sales Q1 2024 Closed Sales Q1 2023 % Change Closed Sales Q4 2023 % Change $0 - $500K 3 8 -62.50% 3 0.00% $500K - $750K 6 2 200.00% 6 0.00% $750K - $1M 3 3 0.00% 5 -40.00% $1M - $2M 1 7 -85.71% 3 -66.67% $2M+ 4 0 400.00% 0 400.00% 20 | North Shore
Market Time
JANUARY 1 - MARCH 31, 2024 VS. SAME PERIOD 2023
Sales Price $720,000
1.5
39 Months Supply of Inventory
Market Time
SINGLE FAMILY HIGHLAND PARK
190
the Seller
SHORE
E CENTER AVENUE DMG represented the Seller Closed Sales Q1 2024 Closed Sales Q1 2023 % Change Closed Sales Q4 2023 % Change $0 - $500K 11 10 10.00% 14 -21.43% $500K - $1M 23 21 9.52% 36 -36.11% $1M - $2M 15 12 25.00% 16 -6.25% $2M - $3M 4 3 33.33% 1 300.00% $3M+ 0 0 - 0Median
NORTH SHORE -
KING MUIR ROAD DMG represented
NORTH
- 717
Avg.
DMG represented the Seller
North Shore | 21
NORTH SHORE - 1145 COUNTY LINE ROAD
GLENCOE, WINNETKA, KENILWORTH, WILMETTE
Located a short distance from downtown Chicago these lakeshore communities have proven to be in high demand from buyers looking for a suburban lifestyle combined with a quick commute.
Prices have increased in each of these communities with properties listed below $1.5 million seeing immediate attention from buyers.
Inventory levels continue to be depleted by increasing buyer demand and a lower-thanaverage supply of new listings entering the
SINGLE
FAMILY
market. With less than 2.8 months of supply, it is anticipated that prices will remain strong.
Properties valued between $1-2 million saw the greatest demand over the last 12 months for Glencoe, Winnetka, and Kenilworth.
In Wilmette, the $500-$1 million price band saw the greatest demand, although homes priced between $1-2 million may have seen greater sales, however there were only two properties available at the end of the first quarter in this price band.
JANUARY 1 - MARCH 31, 2024 VS. SAME PERIOD 2023
$1,808,950
Median Sales Price
SINGLE FAMILY
JANUARY 1 - MARCH 31, 2024 VS. SAME
Avg. Market Time
Median Sales Price
$1,499,000 2.8 1.5 12 21 Months Supply of Inventory Months Supply of Inventory
Market Time
WINNETKA
GLENCOE
Closed Sales Q1 2024 Closed Sales Q1 2023 % Change Closed Sales Q4 2023 % Change $0 - $500K 1 1 0.00% 0 100.00% $500K - $1M 4 6 -33.33% 3 33.33% $1M - $2M 6 7 -14.29% 13 -53.85% $2M - $3M 5 1 400.00% 4 25.00% $3M+ 4 2 100.00% 2 100.00% Closed Sales Q1 2024 Closed Sales Q1 2023 % Change Closed Sales Q4 2023 % Change $0 - $1M 3 6 -50.00% 5 -40.00% $1M - $2M 11 14 -21.43% 9 22.22% $2M - $3M 5 6 -16.67% 11 -54.55% $3M - $4M 0 1 -100.00% 2 -100.00% $4M+ 4 2 100.00% 5 -20.00%
PERIOD 2023
Avg.
22 | North Shore
KENILWORTH
SINGLE FAMILY
JANUARY 1 - MARCH 31, 2024 VS. SAME PERIOD 2023
WILMETTE
SINGLE FAMILY
JANUARY 1 - MARCH 31, 2024 VS. SAME PERIOD 2023
$1,914,500 $910,000 1.3 1.4 56 30 Months Supply of Inventory Months Supply of Inventory Avg. Market Time
Market Time
Closed Sales Q1 2024 Closed Sales Q1 2023 % Change Closed Sales Q4 2023 % Change
- $1M 0 2 -100.00% 1 -100.00% $1M - $2M 3 6 -50.00% 3 0.00% $2M - $3M 2 1 100.00% 1 100.00% $3M - $4M 1 5 -80.00% 0 100.00% $4M+ 0 0 - 0Closed Sales Q1 2024 Closed Sales Q1 2023 % Change Closed Sales Q4 2023 % Change $0 - $500K 3 9 -66.67% 6 -50.00% $500K - $1M 16 20 -20.00% 29 -44.83% $1M - $2M 9 20 -55.00% 24 -62.50% $2M - $3M 4 1 300.00% 3 33.33% $3M+ 1 1 0.00% 2 -50.00% Median
$0
Sales Price Median Sales Price
NORTH SHORE -
EDGEWOOD LANE
represented the Seller North Shore | 23
Avg.
1502
DMG
NORTHBROOK, NORTHFIELD, GLENVIEW
Located further inland, the communities of Northbrook, Northfield, and Glenview offer a larger quantity of properties at the lower price bands of $500,000-$1 million compared to their lakeshore neighbors, so demand has continued to remain strong.
NORTHBROOK
SINGLE FAMILY
Inventory levels for all three communities showed that, at the end of the first quarter of 2024, there were less than 1.5 month’s supply, so expectations are that this will continue to put an upward pressure on prices in 2024.
JANUARY 1 - MARCH 31, 2024 VS. SAME PERIOD 2023
NORTHFIELD
SINGLE FAMILY
JANUARY 1 - MARCH 31, 2024 VS. SAME PERIOD 2023
GLENVIEW
SINGLE FAMILY
JANUARY 1 - MARCH 31, 2024 VS. SAME PERIOD 2023
Median Sales Price
$720,000 1.4
26 Months Supply of Inventory Avg. Market Time
$970,000
Median Sales Price
1.3
9 Months Supply of Inventory
Avg. Market Time
Median Sales Price
$900,000 1
32 Months Supply of Inventory Avg. Market Time
Closed Sales Q1 2024 Closed Sales Q1 2023 % Change Closed Sales Q4 2023 % Change $0 - $500K 0 0 - 2 -100.00% $500K - $1M 6 3 100.00% 10 -40.00% $1M - $2M 5 3 66.67% 4 25.00% $2M - $3M 1 0 100.00% 3 -66.67% $3M+ 0 0 - 0 -
Closed Sales Q1 2024 Closed Sales Q1 2023 % Change Closed Sales Q4 2023 % Change $0 - $500K 8 21 -61.90% 11 -27.27% $500K - $1M 31 37 -16.22% 47 -34.04% $1M - $2M 8 5 60.00% 7 14.29% $2M - $3M 2 2 0.00% 1 100.00% $3M+ 0 0 - 0 -
Closed Sales Q1 2024 Closed Sales Q1 2023 % Change Closed Sales Q4 2023 % Change $0 - $500K 12 21 -42.86% 27 -55.56% $500K - $750K 11 19 -42.11% 29 -62.07% $750K - $1M 18 16 12.50% 13 38.46% $1M - $2M 21 19 10.53% 19 10.53% $2M+ 3 1 200.00% 3 0.00%
24 | North Shore

1 2 3 4 5 6 7 8 9 10
REASONS TO LIVE IN CHICAGOLAND 10
Affordable Living: Compared to other major cities in the U.S. Chicagoland offers comparatively more affordable living in and out of the city, for those looking to buy or rent.
World Class Cuisine and Dining: Chicagoland offers a diverse and thriving culinary culture that ranges from Michelin Star restaurants and international fine dining to deep-dish pizza and Chicago-style hot dogs.
Theatre and Festivals: Chicago is the perfect place to be if you are looking to be wowed by entertainment. There are musicals, ballet performances, shows at the Chicago Symphony Orchestra, and outdoor concerts with a view of the skyline at Northerly Island.
Access to Lake and Outdoor Spaces: Lake Michigan shoreline and beaches, including swimming, boating and fishing. In winter, activities abound.
Excellent Education System: Many schools, colleges and universities have been recognized as being in the U.S. Top 10 percentile for their category.
Midwestern Warmth: Extends even into downtown Chicago, where people are fast to say hello and offer a helping hand.
Easy Transportation System: Chicago has one of the most highly rated transportation systems, including the Chicago Transit System (the “L”), bus lines, water taxis, Amtrak and access to two international airports.
Exciting Sports Options: Sports in Chicagoland offer a diverse range of excitement, from baseball and basketball to football, hockey, soccer, and thrilling college sports events.
Vibrant Arts and Culture Scene: Museums, theaters, galleries, music venues, and festivals that cater to a wide range of interests and provide a captivating cultural experience.
Abundant Job Opportunities: Chicagoland presents a multitude of job opportunities across various industries, thanks to its thriving economy, diverse sectors, and the presence of major corporations, making it an attractive destination for professionals seeking career growth.
WESTERN SUBURBS
WESTERN SPRINGS, LA GRANGE, LA GRANGE PARK, LA GRANGE HIGHLANDS
Long recognized as favored communities, these markets saw very little change yearover-year as demand remained high.
Overall, it is fair to say that the number of sales in the first quarter of 2024, in all four communities, was only restricted by the lack of inventory, which was clearly reflected in the highest level of home supply equaling 3.5 months.
Western Springs not only saw stability in the number of sales year-over-year, but homes priced between $500,000-$2 million the largest demand and potential growth.
WESTERN SPRINGS
The highest demand in La Grange was for properties in the $750,000-$1 million price range, although sales in the lower price bands were severely limited as there only two homes available for sale at the end of the quarter.
Properties priced between $250-$500,000 proved to have the highest demand in La Grange Park although the other prices bands were handicapped by lack of inventory.
JANUARY 1 - MARCH 31, 2024 VS. SAME PERIOD 2023
LA GRANGE
La Grange Highlands saw an increase in sales for properties priced in the $500-$750,000 range compared to 2023. SINGLE FAMILY SINGLE
JANUARY 1 - MARCH 31, 2024 VS. SAME PERIOD 2023
$718,014
Median Sales Price
$724,750 1.5
21
Market Time
Median Sales Price
0.9
8 Months Supply of Inventory Months
FAMILY
Closed Sales Q1 2024 Closed Sales Q1 2023 % Change Closed Sales Q4 2023 % Change $0 - $500K 4 7 -42.86% 8 -50.00% $500K - $1M 17 14 21.43% 25 -32.00% $1M - $2M 8 7 14.29% 13 -38.46%
- $3M 1 0 100.00% 1 0.00% $3M+ 0 0 - 0Closed Sales Q1 2024 Closed Sales Q1 2023 % Change Closed Sales Q4 2023 % Change $0 - $250K 0 1 -100.00% 0$250K - $500K 6 12 -50.00% 12 -50.00% $500K - $750K 6 8 -25.00% 10 -40.00% $750K - $1M 7 6 16.67% 8 -12.50% $1M+ 3 3 0.00% 3 0.00%
$2M
of
Avg.
Avg. Market
26 | Western Suburbs
Supply
Inventory
Time
LA GRANGE PARK
SINGLE FAMILY
JANUARY 1 - MARCH 31, 2024 VS. SAME PERIOD 2023
SINGLE FAMILY
JANUARY 1 - MARCH 31, 2024 VS. SAME PERIOD 2023
$390,000
0.9
3.5 80 9 Months Supply of Inventory Months Supply of Inventory
Market Time
$575,000
Market Time
LA GRANGE HIGHLANDS
Closed Sales Q1 2024 Closed Sales Q1 2023 % Change Closed Sales Q4 2023 % Change
- $250K 0 0 - 1 -100.00% $250K - $500K 19 15 26.67% 25 -24.00% $500K - $750K 1 4 -75.00% 8 -87.50% $750K - $1M 2 0 200.00% 4 -50.00% $1M+ 2 1 100.00% 4 -50.00% Closed Sales Q1 2024 Closed Sales Q1 2023 % Change Closed Sales Q4 2023 % Change $0 - $250K 0 0 - 0$250K - $500K 0 1 -100.00% 2 -100.00% $500K - $750K 3 1 200.00% 0 300.00% $750K - $1M 0 0 - 1 -100.00% $1M+ 0 0 - 0Median Sales Price Median
$0
Sales Price
Avg.
WESTERN
Avg.
SUBURBS - 5907 FLAGG CREAK LANE DMG represented the Seller DMG represented the Seller
Western Suburbs | 27
WESTERN SUBURBS - 310 LEITCH AVENUE
DOWNERS GROVE, NAPERVILLE, ELMHURST, OAKBROOK
These western suburb communities typically offer homeowners a plethora of home choices. However, high demand and a lack of supply now typify the status of real estate in these markets.
Of the four communities, for the third quarter in a row, only Oakbrook registered a greater supply of inventory in the first quarter of 2024, the other markets’ supply remained below 2.5 months.
Downers Grove and Elmhurst saw the greatest demand for properties listed under $500,000, however, of more significance was
DOWNERS GROVE
the growth in sales volume in homes priced above $750,000.
Naperville, hampered a lack of inventory, did see a decline in the overall number of sales compared to the first and last quarters of 2023, but of significance was the increase of sales in the $750,000-$1 million range compared to the first quarter of 2023.
In a slightly higher price bracket, Oakbrook also saw a decline in sales during the first quarter, but an uptick in sales in the $2-$3 million price range.
JANUARY 1 - MARCH 31, 2024 VS. SAME PERIOD 2023
$530,000
Median
2.1
27
JANUARY 1 - MARCH 31, 2024 VS. SAME PERIOD 2023
$672,500
1.6
29 Months Supply of Inventory Months Supply of Inventory
SINGLE FAMILY
SINGLE FAMILY
NAPERVILLE
Median
Sales Price
Sales Price
Avg.
Avg. Market Time Closed Sales Q1 2024 Closed Sales Q1 2023 % Change Closed Sales Q4 2023 % Change $0 - $500K 32 73 -56.16% 55 -41.82% $500K - $750K 26 26 0.00% 25 4.00% $750K - $1M 9 8 12.50% 7 28.57% $1M - $2M 6 6 0.00% 12 -50.00% $2M+ 1 0 100.00% 1 0.00% Closed Sales Q1 2024 Closed Sales Q1 2023 % Change Closed Sales Q4 2023 % Change $0 - $500K 34 64 -46.88% 62 -45.16% $500K - $750K 88 94 -6.38% 132 -33.33% $750K - $1M 39 27 44.44% 45 -13.33% $1M - $2M 21 16 31.25% 21 0.00% $2M+ 6 2 200.00% 4 50.00% 28 | Western Suburbs
Market Time
SINGLE FAMILY
JANUARY 1 - MARCH 31, 2024 VS. SAME PERIOD 2023
OAKBROOK
SINGLE FAMILY ELMHURST
JANUARY 1 - MARCH 31, 2024 VS. SAME PERIOD 2023
Sales Price $587,500 $1,210,000 1.6 4.8
29
36 Months Supply of Inventory
Closed Sales Q1 2024 Closed Sales Q1 2023 % Change Closed Sales Q4 2023 % Change
- $500K 1 0 100.00% 0 100.00% $500K - $1M 3 12 -75.00% 4 -25.00% $1M - $2M 5 5 0.00% 10 -50.00% $2M - $3M 4 3 33.33% 1 300.00% $3M+ 0 1 -100.00% 0Median Sales Price Median
$0
Supply of
Avg.
Avg.
Time Closed Sales Q1 2024 Closed Sales Q1 2023 % Change Closed Sales Q4 2023 % Change $0 - $500K 25 44 -43.18% 42 -40.48% $500K - $750K 19 17 11.76% 18 5.56% $750K - $1M 6 11 -45.45% 13 -53.85% $1M - $2M 22 10 120.00% 20 10.00% $2M+ 0 0 - 0WESTERN SUBURBS - 412 FOX TRAIL LANE DMG represented the Seller DMG represented the Seller WESTERN
Western Suburbs | 29
Months
Inventory
Market Time
Market
SUBURBS - 4609 DOWNERS DRIVE
CLARENDON HILLS, HINSDALE, BURR RIDGE, WILLOWBROOK
Demand has remained high, supply low, and price points have continued to increase –albeit at a slower rate.
Clarendon Hills’ sales volume reflected this with an increase across all price points compared to the number of sales in the first quarter of 2023. Low inventory levels helped keep the upward pressure on prices.
Hinsdale retained its popularity, especially in price points above $2 million, compared to the first and last quarters of 2023. The
CLARENDON HILLS
SINGLE FAMILY
substantial decrease in the number of sales below $1 million was certainly a reflection of the lack of inventory in this price range.
Burr Ridge saw sales decline on a year-overyear comparison, with the lack of inventory once again playing a key role.
Offering properties at lower price points, Willowbrook saw sales increase for properties listed above $500,000, but decline for those listed below due to a lack of inventory in these price points.
JANUARY 1 - MARCH 31, 2024 VS. SAME PERIOD 2023
$735,000
Sales Price
2
22
HINSDALE
SINGLE FAMILY
JANUARY 1 - MARCH 31, 2024 VS. SAME PERIOD 2023
$1,577,500
Sales Price
2.8
56 Months Supply of Inventory Months Supply of Inventory Avg. Market Time
Market Time
Closed Sales Q1 2024 Closed Sales Q1 2023 % Change Closed Sales Q4 2023 % Change $0 - $1M 9 23 -60.87% 8 12.50% $1M - $2M 8 12 -33.33% 22 -63.64% $2M - $3M 8 5 60.00% 5 60.00% $3M - $4M 2 0 200.00% 1 100.00% $4M+ 1 0 100.00% 0 100.00% Median
Median
Closed Sales Q1 2024 Closed Sales Q1 2023 % Change Closed Sales Q4 2023 % Change $0 - $500K 5 2 150.00% 9 -44.44% $500K - $750K 3 1 200.00% 5 -40.00% $750K - $1M 1 0 100.00% 1 0.00% $1M - $2M 5 5 0.00% 4 25.00%
1 0 100.00% 0 100.00% 30 | Western Suburbs
Avg.
$2M+
BURR RIDGE
SINGLE FAMILY
JANUARY 1 - MARCH 31, 2024 VS. SAME PERIOD 2023
WILLOWBROOK
SINGLE FAMILY
JANUARY 1 - MARCH 31, 2024 VS. SAME PERIOD 2023
$1,020,000
$672,500 3.1 1.2
109
24 Months Supply of Inventory Months Supply
Sales Price
Closed Sales Q1 2024 Closed Sales Q1 2023 % Change Closed Sales Q4 2023 % Change
- $500K 3 7 -57.14% 7 -57.14% $500K - $1M 5 10 -50.00% 15 -66.67% $1M - $2M 9 10 -10.00% 5 80.00% $2M - $3M 2 2 0.00% 1 100.00% $3M+ 0 0 - 1 -100.00% Median
Median
$0
Sales Price
Avg.
Avg.
Time Closed Sales Q1 2024 Closed Sales Q1 2023 % Change Closed Sales Q4 2023 % Change $0 - $250K 0 0 - 1 -100.00% $250K - $500K 4 10 -60.00% 6 -33.33% $500K - $750K 6 5 20.00% 6 0.00% $750K - $1M 1 1 0.00% 0 100.00% $1M+ 3 1 200.00% 0 300.00% WESTERN SUBURBS - 444 NORTH MONROE STREET DMG represented the Seller & Buyer DMG represented the Seller WESTERN SUBURBS - 4 ROANOKE COURT Western Suburbs | 31
of Inventory
Market Time
Market
NAPLES
PORT ROYAL, AQUALANE SHORES
Port Royal and Aqualane Shores are two of the wealthiest communities in Naples. Home sales are rarely below $7 million and $5 million respectively.
The number of sales as well as inventory levels for the luxury properties in both communities have gradually returned to their pre-pandemic numbers over the last year. However, home values have retained their high-ticket prices.
The first quarter of 2024 saw an increase in the number of sales in the first quarter of 2024 for Port Royal, as well as a decline in
PORT ROYAL
SINGLE FAMILY
inventory, compared to the last quarter of 2023.
DMG is now co-listing one of the most expensive properties to come onto the U.S. market. This $295 million property is certainly attracting a lot of international media attention, creating great exposure, not just for Port Royal, but the whole of Naples’ luxury market.
Aqualane Shores’ inventory saw a steady growth over the last six months. Sales volume remained on par with the fourth quarter of 2023, but fell compared to the first quarter of 2023. Currently, only properties priced above $6.4 million are available for sale.
JANUARY 1 - MARCH 31, 2024 VS. SAME PERIOD 2023
$17,200,000
21
96 Months Supply of Inventory
Avg. Market Time
AQUALANE SHORES
SINGLE FAMILY
JANUARY 1 - MARCH 31, 2024 VS. SAME PERIOD 2023
$0
$8,825,000
35
85
Closed Sales Q1 2024 Closed Sales Q1 2023 % Change Closed Sales Q4 2023 % Change
$5M 0 0 - 0 -
$7M 0 0 - 0$7M - $10M 1 0 100.00% 0 100.00% $10M - $15M 1 2 -50.00% 0 100.00% $15M+ 2 2 0.00% 0 200.00% Median
Price
$0 -
$5M -
Sales
Closed Sales Q1 2024 Closed Sales Q1 2023 % Change Closed Sales Q4 2023 % Change
- $5M 0 0 - 0$5M - $7M 1 2 -50.00% 1 0.00% $7M - $10M 0 1 -100.00% 0$10M - $15M 1 2 -50.00% 1 0.00% $15M+ 0 0 - 0Median Sales Price
of Inventory Avg. Market
Months Supply
Time
32 | Naples
 NAPLES - 800 17TH AVENUE S DMG represented the Seller
Naples | 33
NAPLES - 682 17TH AVENUE S DMG represented the Seller
ROYAL HARBOR, OLDE NAPLES, COQUINA SANDS, THE MOORINGS
These communities offer not only a wide range of price points, but a plethora of property types that appeal to both long-term residents and second homeowners.
Sales in Royal Harbor remained on par, compared to the fourth quarter of 2023, but fell compared to first quarter of 2023.
Olde Naples saw single-family home sales increase considerably compared to the fourth quarter of 2023, but declined compared to the first quarter of 2023, while condo property sales fell against both quarters.
ROYAL HARBOR
SINGLE FAMILY
DMG is now involved in a new construction project located in the heart of this community that will see both commercial and residential development reimagine the area, and drive new major investment.
Inventory levels in Coquina Sands remain comparatively low for condo properties, but were enough to allow for a small uptick in sales during the first quarter of 2024.
In the Moorings demand fell for single-family homes in the first quarter of 2024 compared to 2023, however, sales remained on par in the attached/condo market.
JANUARY 1 - MARCH 31, 2024 VS. SAME PERIOD 2023
$6,613,500
Median Sales Price
30
58 Months Supply of Inventory
Avg. Market Time
Closed Sales Q1 2024 Closed Sales Q1 2023 % Change Closed Sales Q4 2023 % Change $0 - $1M 0 0 - 0$1M - $2M 0 0 - 0$2M - $3M 0 3 -100.00% 0$3M - $5M 1 0 100.00% 1 0.00% $5M+ 1 1 0.00% 1 0.00%
For more information about your local market and to view current properties available visit our website: www.DawnMckennaGroup.com 34 | Naples
OLDE NAPLES
SINGLE FAMILY
JANUARY 1 - MARCH 31, 2024 VS. SAME PERIOD 2023
$7,275,000
Median Sales Price
ATTACHED
JANUARY 1 - MARCH 31, 2024 VS. SAME PERIOD 2023
$1,675,000
Median Sales Price
15 11 112 139 Months Supply of Inventory Months Supply of Inventory Avg. Market Time Avg. Market Time
Closed Sales Q1 2024 Closed Sales Q1 2023 % Change Closed Sales Q4 2023 % Change
- $5M 4 7 -42.86% 0 400.00% $5M - $7M 2 9 -77.78% 3 200.00% $7M - $10M 2 2 0.00% 1 100.00% $10M - $15M 2 0 200.00% 0 200.00% $15M+ 2 3 -33.33% 0 200.00% Closed Sales Q1 2024 Closed Sales Q1 2023 % Change Closed Sales Q4 2023 % Change $0 - $1M 6 17 -64.71% 9 -33.33% $1M - $2M 4 12 -66.67% 5 -20.00% $2M - $3M 4 2 100.00% 4 0.00% $3M - $4M 0 1 -100.00% 1 -100.00% $4M+ 4 3 33.33% 0 400.00%
$0
NAPLES - 850 CENTRAL AVENUE 311 DMG represented the Seller DMG represented the Seller
Naples | 35
NAPLES - 411 6TH STREET S 202
COQUINA SANDS
SINGLE FAMILY
JANUARY 1 - MARCH 31, 2024 VS. SAME PERIOD 2023
ATTACHED
JANUARY 1 - MARCH 31, 2024 VS. SAME PERIOD 2023
$3,600,000
N/A
Closed Sales Q1 2024 Closed Sales Q1 2023 % Change Closed Sales Q4 2023 % Change
$2M 0 0 - 0$2M - $3M 0 0 - 1 -100.00% $3M - $4M 0 0 - 2 -100.00% $4M - $5M 0 0 - 1 -100.00% $5M+ 0 0 - 0Closed Sales Q1 2024 Closed Sales Q1 2023 % Change Closed Sales Q4 2023 % Change $0 - $1M 4 2 100.00% 3 33.33% $1M - $2M 0 0 - 1 -100.00% $2M - $3M 4 0 400.00% 1 300.00% $3M - $4M 0 0 - 0$4M+ 3 0 300.00% 1 200.00% Median Sales Price Median Sales Price
$0 -
Months
Avg.
Avg.
Time
$2,450,000 12 4 N/A 67 Months Supply of Inventory
Supply of Inventory
Market Time
Market
DMG represented the Seller
36 | Naples
NAPLES - 222 HARBOUR DRIVE 508
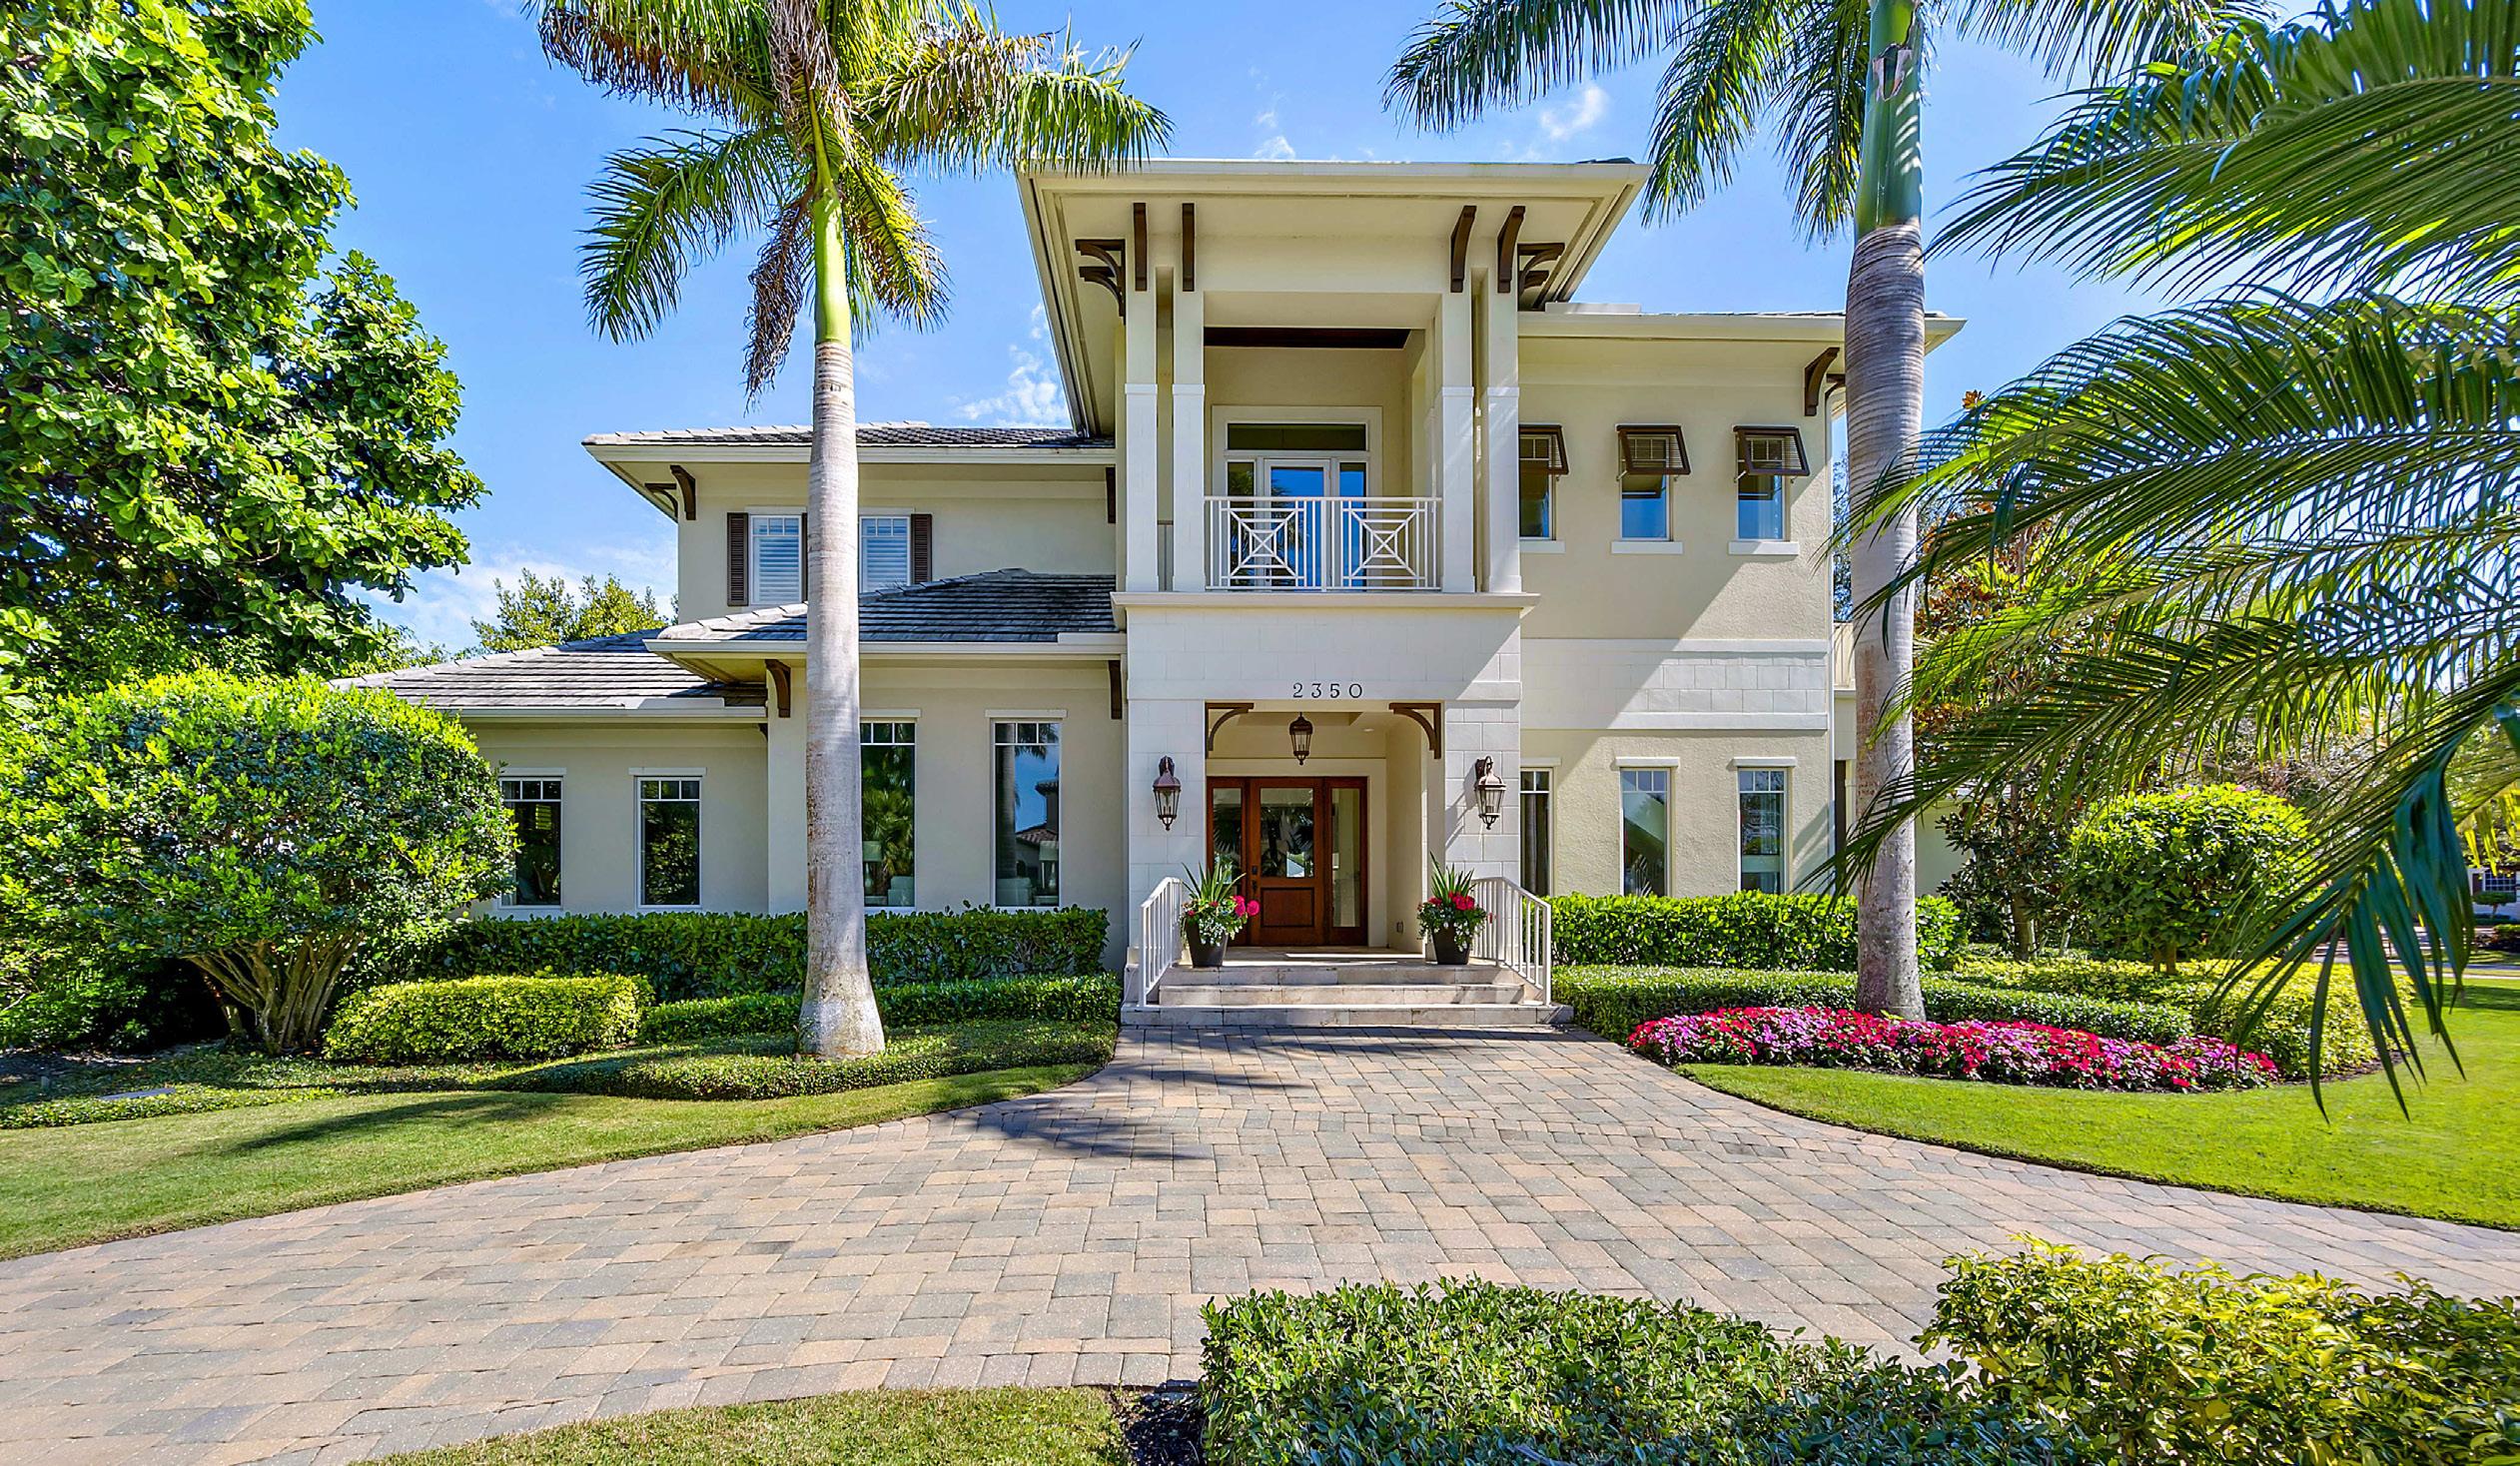
NAPLES - 2350 WINDWARD WAY DMG
SINGLE FAMILY
JANUARY 1 - MARCH 31, 2024 VS. SAME PERIOD 2023
JANUARY 1 - MARCH 31, 2024 VS. SAME PERIOD 2023
Median Sales Price
Median Sales Price $6,250,000 $1,100,000 8.6 12.7 117 87 Months Supply of Inventory Months Supply of Inventory Avg. Market Time Avg. Market Time
ATTACHED THE MOORINGS
Closed Sales Q1 2024 Closed Sales Q1 2023 % Change Closed Sales Q4 2023 % Change
- $3M 3 5 -40.00% 1 200.00% $3M - $4M 1 3 -66.67% 0 100.00% $4M - $5M 0 1 -100.00% 1 -100.00% $5M - $7M 2 6 -66.67% 1 100.00% $7M+ 3 2 50.00% 2 50.00% Closed Sales Q1 2024 Closed Sales Q1 2023 % Change Closed Sales Q4 2023 % Change $0 - $1M 13 13 0.00% 5 160.00% $1M - $2M 10 10 0.00% 6 66.67% $2M - $3M 3 4 -25.00% 4 -25.00% $3M - $4M 1 2 -50.00% 2 -50.00% $4M+ 2 1 100.00% 6 -66.67%
$0
represented the
Naples | 37
Seller
PARK SHORE, SEAGATE, PELICAN BAY, BAY COLONY
Taking full advantage of their access to the Gulf of Mexico, these communities offer a plethora of single-family and attached properties in a variety of price ranges that suit every budget.
Park Shore’s single-family homes saw the return of demand for properties over $7 million and a comparable number in sales to the first quarter of 2023 for single-family homes. Activity remained strong in the condo market with marked increases in sales for properties listed in the price points both below $1 million and above $4 million.
PARK SHORE
SINGLE FAMILY
Only expect to find single-family homes in Seagate which is comprised of a small enclave of luxury homes and currently only has a few properties available for sale, giving rise to an equal lack of sales.
The largest of these communities, Pelican Bay is home to many a second homeowner and sees a greater number of sales in its condo market, particularly in the $1-$2 million range. Sales for single-family homes saw a decrease in demand compared to the first quarter of 2023, but an increase in the number of homes sold over $5 million.
JANUARY 1 - MARCH 31, 2024 VS. SAME PERIOD 2023
JANUARY 1 - MARCH 31, 2024 VS. SAME PERIOD 2023
$6,150,000
$1,700,000 10
$3,600,000
Sales Price Median Sales Price
8 184 95 Months Supply of Inventory
Avg. Market Time Avg.
Months Supply of Inventory
ATTACHED
Closed Sales Q1 2024 Closed Sales Q1 2023 % Change Closed Sales Q4 2023 % Change $0 - $1M 0 0 - 0$1M - $2M 0 0 - 2 -100.00% $2M - $3M 3 4 -25.00% 2 50.00% $3M - $4M 0 1 -100.00% 0$4M+ 7 8 -12.50% 2 250.00% Closed Sales Q1 2024 Closed Sales Q1 2023 % Change Closed Sales Q4 2023 % Change $0 - $1M 16 6 166.67% 4 300.00% $1M - $2M 12 16 -25.00% 11 9.09% $2M - $3M 11 7 57.14% 6 83.33% $3M - $4M 1 8 -87.50% 3 -66.67% $4M+ 9 4 125.00% 2 350.00%
Median
38 | Naples
Market Time

JANUARY 1 - MARCH 31, 2024 VS. SAME PERIOD 2023
Median Sales Price
$3,985,000 7
32 Months Supply of Inventory
Market Time
SEAGATE
SINGLE FAMILY
Closed Sales Q1 2024 Closed Sales Q1 2023 % Change Closed Sales Q4 2023 % Change $0 - $1M 0 0 - 0$1M - $2M 0 1 -100.00% 0$2M - $3M 0 1 -100.00% 0$3M - $4M 1 0 100.00% 1 0.00% $4M+ 0 1 -100.00% 0 -
Avg.
NAPLES - 4234 CRAYTON ROAD DMG represented the Seller
Naples | 39
NAPLES - 4451 GULF SHORE BOULEVARD N UNIT 103 DMG represented the Seller & Buyer
BAY
SINGLE FAMILY
JANUARY 1 - MARCH 31, 2024 VS. SAME PERIOD 2023
ATTACHED
JANUARY 1 - MARCH 31, 2024 VS. SAME PERIOD 2023
Median Sales Price
$3,600,000
Median Sales Price $3,970,000 $1,300,000 6.2 4.9 155 74 Months Supply of Inventory Months Supply of Inventory Avg. Market Time Avg. Market Time
Closed Sales Q1 2024 Closed Sales Q1 2023 % Change Closed Sales Q4 2023 % Change
- $2M 1 3 -66.67% 1 0.00% $2M - $3M 1 1 0.00% 1 0.00% $3M - $4M 2 5 -60.00% 0 200.00% $4M - $5M 0 1 -100.00% 1 -100.00% $5M+ 3 1 200.00% 0 300.00% Closed Sales Q1 2024 Closed Sales Q1 2023 % Change Closed Sales Q4 2023 % Change $0 - $1M 17 13 30.77% 3 466.67% $1M - $2M 33 42 -21.43% 22 50.00% $2M - $3M 4 11 -63.64% 2 100.00% $3M - $4M 2 9 -77.78% 3 -33.33% $4M+ 8 6 33.33% 2 300.00%
$0
40 | Naples
PELICAN
DMG represented the Seller NAPLES - 8787 BAY COLONY DRIVE 502

1 2 3 4 5 6 7 8 9 10
REASONS TO LIVE IN NAPLES 10
Naples has been recognized by US News and World Report as one of the top 10 best places to live in America for the years 2023 and 2024, based on quality of life, value, job market and desirability.
Tropical Paradise: The year-round warm weather allows for outdoor activities and a relaxed lifestyle.
Outdoor Recreation: From boating, fishing and kayaking there are countless water activities. Naples is also recognized for being both the “Golf and Pickleball Capital of the World”, with over 80 championship golf courses while literally hundreds are playing pickleball daily during its peak season.
Golfing Galore: There are 108 courses within a 15-mile radius of Naples, 16 of which are public courses and 82 are private courses. There are 86 18-hole courses and 22 nine-hole layouts.
Diversifying Population: Naples has long been a popular retirement and second home community, however the growth in the last five years has evolved into full-time residents that include younger and multigenerational families.
Shopping & Dining: Naples offers a wealth of upscale shopping and dining experiences.
Thriving Real Estate Market: As a national vacation hot spot, real estate in Naples has consistently been a good investment.
Cultural Hub: A world-class zoo, a stunning botanical garden, and numerous museums and galleries make art, culture, and entertainment the way of life in Naples.
You’re Well-Connected: Naples is conveniently located near larger cities like Sarasota, Marco Island, Fort Myers and even Miami, which is only 2 hours away.
A Robust Economy & Job Market: There are plenty of exciting work opportunities, thanks to the city’s impressive growing economy, that includes many Fortune 500 companies.
VANDERBILT BEACH, KALEA BAY, THE DUNES
Taking advantage of the natural protection of the sand bars that run along the Gulf of Mexico, most of the properties in these three neighborhoods still enjoy great access to the water by way of the saltwater passes.
Vanderbilt Beach has seen a consistency in sales in the last two quarters as well as the first quarter of 2023 in its single-family home market. The demand for condo properties saw sales, especially in the $1-$2 million range increase substantially during the first quarter of 2024.
Kalea Bay offers an exclusive condominium complex with only a few units available for resale currently. However, the release of a new development over the last six months and the exceptional demand for these new condominiums are not reflected in these numbers.
The Dunes, also an exclusive enclave of condominiums, saw a turnover of sales on par with both the first and last quarters of 2023.
VANDERBILT BEACH
SINGLE FAMILY
JANUARY 1 - MARCH 31, 2024 VS. SAME PERIOD 2023
$7,500,000
Median Sales Price
20
173
ATTACHED
JANUARY 1 - MARCH 31, 2024 VS. SAME PERIOD 2023
$3,600,000
10.7
$1,150,000
Median Sales Price
Months Supply of Inventory
74 Months Supply of Inventory
Avg. Market Time Avg. Market Time
Closed Sales Q1 2024 Closed Sales Q1 2023 % Change Closed Sales Q4 2023 % Change $0 - $1M 0 0 - 0$1M - $2M 0 0 - 0$2M - $3M 1 3 -66.67% 0 100.00% $3M - $4M 1 1 0.00% 1 0.00% $4M+ 3 1 200.00% 1 200.00% Closed Sales Q1 2024 Closed Sales Q1 2023 % Change Closed Sales Q4 2023 % Change $0 - $1M 3 6 -50.00% 6 -50.00% $1M - $2M 8 4 100.00% 7 14.29% $2M - $3M 1 1 0.00% 0 100.00% $3M - $4M 1 0 100.00% 1 0.00% $4M+ 0 0 - 0 -
42 | Naples
ATTACHED
JANUARY 1 - MARCH 31, 2024 VS. SAME PERIOD 2023
$6,247,000
Median Sales Price
4 N/A Months Supply of Inventory
Avg. Market Time
ATTACHED
JANUARY 1 - MARCH 31, 2024 VS. SAME PERIOD 2023
Median Sales Price
$1,318,750 7
114 Months Supply of Inventory Avg. Market Time
KALEA BAY
Closed Sales Q1 2024 Closed Sales Q1 2023 % Change Closed Sales Q4 2023 % Change $0 - $1M 0 0 - 0$1M - $2M 0 32 -100.00% 0$2M - $3M 0 67 -100.00% 0$3M - $4M 0 13 -100.00% 1 -100.00% $4M+ 2 6 -66.67% 1 100.00%
THE DUNES
Closed Sales Q1 2024 Closed Sales Q1 2023 % Change Closed Sales Q4 2023 % Change $0 - $1M 1 0 100.00% 1 0.00% $1M - $2M 5 3 66.67% 2 150.00% $2M - $3M 0 2 -100.00% 1 -100.00% $3M - $4M 0 0 - 0$4M+ 0 0 - 0 -
NAPLES - 13915 OLD COAST ROAD PH03 DMG represented the Seller & Buyer Naples | 43
HARBOR COUNTRY
NEW BUFFALO, THREE OAKS, UNION PIER
Inventory and prices vary between New Buffalo and Union Pier, two communities positioned along the waterfront of Lake Michigan, as compared to Three Oaks, their inland neighbor to the east. The buyer profile significantly varies among the three communities too.
New Buffalo, probably the most identifiable of the communities in Harbor Country, has continued to see a dearth of inventory as well as a strong demand for its homes. Sales for the first quarter of 2024 dipped slightly compared
NEW BUFFALO
SINGLE FAMILY
to the first and last quarters of 2023, but the Spring demand from Chicagoans is expected to drive sales once more.
Three Oaks saw a decline in sales compared to the same quarter in 2023, but as waterfront communities become more expensive, prospective buyers are expected to turn inland.
Union Pier also saw a downturn in sales during the first quarter compared to 2023, with sales in the $1-$2 million range seeing the greatest demand in both years.
JANUARY 1 - MARCH 31, 2024 VS. SAME PERIOD 2023
$0
$446,000
Sales Price
4.4
59 Months Supply of Inventory Avg. Market Time
THREE OAKS
SINGLE FAMILY
JANUARY 1 - MARCH 31, 2024 VS. SAME PERIOD 2023
$131,501 9
28 Months Supply of Inventory
Closed Sales Q1 2024 Closed Sales Q1 2023 % Change Closed Sales Q4 2023 % Change $0 - $250K 2 2 0.00% 2 0.00% $250K - $500K 0 3 -100.00% 0$500K - $750K 0 0 - 0$750K - $1M 0 0 - 0$1M+ 0 0 - 0Median
Sales Price
Avg. Market Time
Closed Sales
2024 Closed Sales Q1 2023 % Change Closed Sales Q4 2023 % Change
Q1
- $250K 0 3 -100.00% 1 -100.00% $250K - $500K 3 0 300.00% 5 -40.00% $500K - $1M 3 4 -25.00% 5 -40.00% $1M - $2M 0 0 - 0$2M+ 0 0 - 1 -100.00% Median
44 | Harbor Country
SINGLE FAMILY
JANUARY 1 - MARCH 31, 2024 VS. SAME PERIOD 2023
$1,380,000
Median Sales Price
6
28 Months Supply of Inventory
Market Time
UNION PIER
Closed Sales Q1 2024 Closed Sales Q1 2023 % Change Closed Sales Q4 2023 % Change $0 - $500K 1 1 0.00% 2 -50.00% $500K - $1M 0 2 -100.00% 4 -100.00% $1M - $2M 3 3 0.00% 0 300.00% $2M - $3M 1 1 0.00% 0 100.00% $3M+ 1 0 100.00% 0 100.00%
COUNTRY
DMG
the
Harbor Country | 45
Avg.
HARBOR
-50 HARBOR ISLE DRIVE
represented
Seller
LAKESIDE, HARBERT, SAWYER
These three communities run along Lake Michigan enjoying easy access, as well as offering their residents everything lake life entails.
Lakeside offers homes that range from below $500,000 to luxury properties commanding prices well-above $6 million. Inventory levels have remained low, after home sales increased during the second quarter of 2023. They were not replaced, leaving minimal choices in the first quarter of 2024.
LAKESIDE
SINGLE FAMILY
Harbet realized even lower levels of inventory last quarter with all property prices below $1 million selling quickly. Today, there is less than two months of inventory available for sale, and very few listed properties are priced below $1 million.
Sawyer, saw all its sold properties priced below $1 million. While sales were higher than the same quarter in 2023, the number of sales in the last quarter of 2023 left a dearth in the level of inventory available for sale during this last quarter.
JANUARY 1 - MARCH 31, 2024 VS. SAME PERIOD 2023
N/A 5 N/A Months Supply of Inventory Avg. Market Time
HARBERT
SINGLE FAMILY
JANUARY 1 - MARCH 31, 2024 VS. SAME PERIOD 2023
$912,500 2 37 Months Supply of Inventory
Closed Sales Q1 2024 Closed Sales Q1 2023 % Change Closed Sales Q4 2023 % Change $0 - $500K 0 0 - 0$500K - $750K 1 0 100.00% 0 100.00% $750K - $1M 0 1 -100.00% 1 -100.00% $1M - $3M 1 0 100.00% 0 100.00% $3M+ 0 1 -100.00% 0Median Sales Price
Avg.
Market Time
Closed Sales Q1 2024 Closed Sales Q1 2023 % Change Closed Sales Q4 2023 % Change
- $500K 0 1 -100.00% 0$500K - $750K 0 0 - 1 -100.00% $750K - $1M 0 0 - 1 -100.00% $1M - $3M 0 0 - 0$3M+ 0 0 - 0Median Sales Price
$0
46 | Harbor Country
represented the
SINGLE FAMILY SAWYER
JANUARY 1 - MARCH 31, 2024 VS. SAME PERIOD 2023
Median Sales Price $457,500 2.3
66 Months Supply of Inventory
Closed Sales Q1 2024 Closed Sales Q1 2023 % Change Closed Sales Q4 2023 % Change $0 - $250K 0 0 - 0$250K - $500K 2 2 0.00% 6 -66.67% $500K - $750K 2 0 200.00% 0 200.00% $750K - $1M 0 0 - 1 -100.00% $1M+ 0 0 - 2 -100.00%
Avg.
Market Time
| 47
HARBOR COUNTRY - 16685 TIMBER LANE DMG
Seller Harbor Country
GRAND BEACH, MICHIANA, LONG BEACH
Nestled around the Indiana/Michigan border, these popular lakeside villages offer boundless amenities including golf, tennis,
GRAND BEACH
SINGLE FAMILY
pickleball, beach life and annual community events for all.
JANUARY 1 - MARCH 31, 2024 VS. SAME PERIOD 2023
$3,600,000
Median Sales Price
5
225 Months Supply of Inventory
Avg. Market Time
MICHIANA
SINGLE FAMILY
JANUARY 1 - MARCH 31, 2024 VS. SAME PERIOD 2023
LONG BEACH, IN
SINGLE FAMILY
JANUARY 1 - MARCH 31, 2024 VS. SAME PERIOD 2023
Median Sales Price
$1,029,000 5 111 Months Supply of Inventory
Avg. Market Time
$991,743
Median Sales Price
2.5
54 Months Supply of Inventory
Avg. Market Time
Closed Sales
2024 Closed Sales Q1 2023 % Change Closed Sales Q4 2023 % Change $0 - $500K 1 2 -50.00% 0 100.00% $500K - $750K 1 1 0.00% 4 -75.00% $750K - $1M 0 1 -100.00% 3 -100.00% $1M - $2M 0 1 -100.00% 3 -100.00% $2M+ 0 1 -100.00% 1 -100.00%
Q1
Closed Sales
2024 Closed Sales Q1 2023 % Change Closed Sales Q4 2023 % Change $0 - $500K 0 2 -100.00% 0$500K - $750K 0 0 - 2 -100.00% $750K - $1M 0 0 - 2 -100.00% $1M - $2M 0 1 -100.00% 3 -100.00% $2M+ 1 0 100.00% 1 0.00%
Q1
Closed Sales Q1 2024 Closed Sales Q1 2023 % Change Closed Sales Q4 2023 % Change $0 - $500K 1 3 -66.67% 0 100.00% $500K - $750K 2 1 100.00% 8 -75.00% $750K - $1M 2 2 0.00% 5 -60.00% $1M - $2M 1 0 100.00% 2 -50.00% $2M+ 1 0 100.00% 0 100.00%
48 | Harbor Country

REASONS TO LIVE IN HARBOR COUNTRY 10
1 2 3 4 5 6 7 8 9 10
Scenic Beauty: Boasts stunning natural landscapes, including sandy beaches along Lake Michigan, lush forests, and rolling dunes. The area’s picturesque beauty provides a tranquil and serene environment.
Lake Michigan: Living near Lake Michigan means access to one of the largest freshwater lakes in the world. Residents can enjoy water activities, including swimming, boating, paddleboarding, kayaking and relaxing on the beach.
Quaint Small Towns: Home to charming small towns such as New Buffalo, Sawyer, and Three Oaks. These towns offer a relaxed pace of life, friendly communities, and unique local shops and restaurants.
Culinary Scene: The region is known for its diverse culinary scene, featuring farm-to-table dining, wineries, breweries, and artisanal food producers. Residents can explore a variety of dining options that showcase local flavors.
Arts and Culture: Has a vibrant arts and culture community, with galleries, theaters, and cultural events throughout the year. This adds a creative and enriching aspect to the community.
Outdoor Recreation: Beyond the beaches, residents can enjoy hiking, biking, and exploring nature trails in the area. Warren Dunes State Park and Indiana Dunes National Park are popular destinations for outdoor enthusiatsts.
Seasonal Activities: Experiences all four seasons, each offering unique activities. From summer beach days to fall foliage tours, winter sports, and springtime blossoms, residents can enjoy a variety of seasonal experiences.
Winery and Brewery Tours: The region is known for its wineries and breweries, making it a paradise for wine and beer enthusiasts. Residents can explore local vineyards and tasting rooms.
Community Events: Hosts various community events and festivals, fostering a sense of community and providing opportunities for residents to come together and celebrate.
Proximity to Chicago: Conveniently located near Chicago, making it an ideal getaway for city dwellers. The short drive or a fast train journey, through a new high-speed rail system from Chicago, will allow residents quick access to the the peacefulness of Harbor Country.
LAKE GENEVA
LAKE GENEVA, WILLIAMS BAY, FONTANA, LINN
Nestled around Geneva Lake, these four communities are firm favorites of second homeowners and a growing population of residents alike.
Low inventory and the demand for lake frontage, views and access are the biggest drivers of the prices in all these markets… the closer to the lake the more expensive the price per square foot.
Lake Geneva still sees its greatest demand for homes in the $500-$1 million range. Visitors will shortly have access to a new boutique
LAKE GENEVA
hotel and resort that was formerly a local college.
Williams Bay saw a decline in the number of sales in the first quarter of 2024 compared to both first and last quarters of 2023, despite an uptick in inventory levels.
In contrast, Fontana saw lower levels of supply, with only 2 months available, as the number of sales increased compared to both the first and last quarters of 2023.
Linn offers a great variety of property prices, but although the number of sales remained on par with the first quarter of 2023, properties in the $750,000-$1 million range proved the most popular.
JANUARY 1 - MARCH 31, 2024 VS. SAME PERIOD 2023
SINGLE FAMILY SINGLE FAMILY
JANUARY 1 - MARCH 31, 2024 VS. SAME PERIOD 2023
$528,241
Median Sales Price
6.6
106
Market Time
$626,267
Median Sales Price
16
43 Months Supply of Inventory Months Supply of Inventory
WILLIAMS BAY
Closed Sales Q1 2024 Closed Sales Q1 2023 % Change Closed Sales Q4 2023 % Change $0 - $250K 1 3 -66.67% 1 0.00% $250K - $500K 8 8 0.00% 8 0.00% $500K - $1M 9 4 125.00% 14 -35.71% $1M - $2M 1 0 100.00% 2 -50.00%
0 0 - 0Closed Sales Q1 2024 Closed Sales Q1 2023 % Change Closed Sales Q4 2023 % Change $0 - $250K 0 0 - 0$250K - $500K 0 1 -100.00% 8 -100.00% $500K - $1M 6 5 20.00% 3 100.00% $1M - $2M 0 0 - 0$2M+ 0 1 -100.00% 0 -
$2M+
Avg.
50 | Lake Geneva
Avg.
Market Time
FONTANA
SINGLE FAMILY
JANUARY 1 - MARCH 31, 2024 VS. SAME PERIOD 2023
$0
$725,000
42
LINN
SINGLE FAMILY
JANUARY 1 - MARCH 31, 2024 VS. SAME PERIOD 2023
Sales Price Median Sales Price
$942,500 2 9.3
58 Months Supply of Inventory Months Supply of Inventory
Market Time
Market Time
Closed Sales Q1 2024 Closed Sales Q1 2023 % Change Closed Sales Q4 2023 % Change
- $500K 3 2 50.00% 2 50.00% $500K - $750K 5 4 25.00% 6 -16.67% $750K - $1M 4 1 300.00% 4 0.00% $1M - $2M 1 1 0.00% 0 100.00% $2M+ 1 0 100.00% 0 100.00% Closed Sales Q1 2024 Closed Sales Q1 2023 % Change Closed Sales Q4 2023 % Change $0 - $500K 1 1 0.00% 3 -66.67% $500K - $750K 0 0 - 2 -100.00% $750K - $1M 3 0 300.00% 0 300.00% $1M - $2M 1 3 -66.67% 6 -83.33% $2M+ 1 2 -50.00% 1 0.00% Median
Avg.
Avg.
Lake Geneva | 51
DMG represented the Seller LAKE GENEVA - W3676 LAKEVIEW AVENUE
DELAVAN, COMO
Located on their own lakes, and taking their namesakes, both of these communities have seen their popularity grow over the last few years, especially as property prices around Lake Geneva increased substantially.
Inventory is certainly playing an important role in both these communities. Sales of properties valued between $250-$500,000 have fallen, due to the availability of fewer properties in this price range, rather than a lack of demand.
In Delavan, a new development with homes over $1 million (that includes boat slips or water access) is proving popular and responsible for the increase in sales at this price point.
Como is also seeing changes with many of the homes being updated to reflect the demand of second homeowners looking to purchase homes along its shores.
SINGLE FAMILY
JANUARY 1 - MARCH 31, 2024 VS. SAME PERIOD 2023
DELAVAN COMO
SINGLE FAMILY
JANUARY 1 - MARCH 31, 2024 VS. SAME PERIOD 2023
$349,900
Median Sales Price
37
Avg. Market Time
$300,000
5 5.5
21 Months Supply of Inventory Months Supply of Inventory
Median Sales Price
Avg. Market Time
Closed Sales Q1 2024 Closed Sales Q1 2023 % Change Closed Sales Q4 2023 % Change $0 - $250K 9 11 -18.18% 9 0.00% $250K - $500K 10 18 -44.44% 14 -28.57% $500K - $1M 4 0 400.00% 1 300.00% $1M - $2M 6 0 600.00% 2 200.00% $2M+ 0 0 - 0Closed Sales Q1 2024 Closed Sales Q1 2023 % Change Closed Sales Q4 2023 % Change $0 - $250K 2 1 100.00% 0 200.00% $250K - $500K 3 8 -62.50% 7 -57.14% $500K - $1M 2 1 100.00% 4 -50.00% $1M - $2M 0 1 -100.00% 0$2M+ 0 0 - 0 -
52 | Lake Geneva

REASONS TO LIVE IN LAKE GENEVA 10
Natural Beauty: Boasts stunning natural beauty with its crystal-clear waters, picturesque shoreline, and surrounding scenic landscapes.
Recreational Activities: The area offers a plethora of recreational activities, including boating, fishing, swimming, hiking, biking, and golfing, providing ample opportunities for outdoor enthusiasts.
Water Sports: The expansive Geneva Lake is a haven for water sports enthusiasts, offering activities such as sailing, jet skiing, paddleboarding, and kayaking in the summer and ice boating, ice fishing and snowshoeing in the winter.
Resort Town Charm: Exudes a charming resort town atmosphere, with its quaint shops, boutiques, restaurants, and cafes lining the streets, creating a delightful ambiance.
Historic Architecture: The town showcases beautiful historic architecture, including grand mansions and estates, adding a touch of elegance and history to the area.
Events and Festivals: Hosts a variety of events and festivals throughout the year, including the Venetian Festival, Winterfest, and the Lake Geneva Restaurant Week, providing entertainment and cultural experiences for residents.
Proximity to Chicago: Close proximity to Chicago allows residents to enjoy a peaceful lakeside lifestyle while still having access to the amenities and opportunities of a major city.
Family-Friendly Environment: The area is known for its family-friendly environment, offering excellent schools, safe neighborhoods, and a range of activities and attractions suitable for all ages and known as a childhood paradise.
Shopping and Dining: Features a vibrant shopping and dining scene, with a mix of local boutiques, specialty stores, antiquing and a wide array of restaurants, ensuring residents have plenty of options to explore.
Community Spirit: Has a strong sense of community spirit, with friendly residents, community events, and a welcoming atmosphere that fosters a sense of belonging and connection among its residents. 1 2 3 4 5 6 7 8 9 10
PARK CITY
DEER VALLEY, OLD TOWN/PARK CITY/MOUNTAIN RESORT
Located at the foot of the Park City Mountain both of these communities continued to see a strong demand from second homeowners and residents, old and new, alike.
Inventory levels improved at the end 2023 opening more opportunities for buyers in a market that had remained comparatively tight over the last few years.
This resulted in Deer Valley, Old Town, Park City and Mountain Resort all seeing an increase in sales, especially for their higher priced properties in the first quarter of 2024 compared to 2023.
DEER VALLEY
SINGLE FAMILY
Deer Valley is also starting to see the benefits of its state-of-the-art expansion – anticipated to triple this community’s size.
Called Deer Valley East Village it will be the anchor for 3,700 acres of expanded terrain, a variety of luxury accommodations, retail options and a diverse array of new and upgraded amenities.
JANUARY 1 - MARCH 31, 2024 VS. SAME PERIOD 2023
$5,900,000
4
64
ATTACHED
JANUARY 1 - MARCH 31, 2024 VS. SAME PERIOD 2023
$3,600,000
Sales Price Median Sales Price
32 Months Supply of Inventory
Market Time
$2,302,850
2.6
Closed Sales Q1 2024 Closed Sales Q1 2023 % Change Closed Sales Q4 2023 % Change $0 - $3M 0 0 - 0$3M - $4M 1 0 100.00% 0 100.00% $4M - $5M 0 1 -100.00% 1 -100.00% $5M - $10M 4 2 100.00% 4 0.00% $10M+ 0 0 - 2 -100.00% Closed Sales Q1 2024 Closed Sales Q1 2023 % Change Closed Sales Q4 2023 % Change $0 - $1M 1 0 100.00% 0 100.00% $1M - $2M 3 9 -66.67% 1 200.00% $2M - $3M 6 4 50.00% 4 50.00% $3M - $5M 4 3 33.33% 4 0.00% $5M+ 2 2 0.00% 1 100.00%
Median
Avg.
Avg.
54 | Park City
Months Supply of Inventory
Market Time
DMG represented the Seller
OLD TOWN/PARK CITY/MOUNTAIN RESORT
SINGLE FAMILY
JANUARY 1 - MARCH 31, 2024 VS. SAME PERIOD 2023
$0
JANUARY 1 - MARCH 31, 2024 VS. SAME PERIOD 2023
Market Time
Sales Price Median Sales Price $4,660,000 $1,450,000 5.3 4.4 97 79 Months Supply of Inventory Months Supply of Inventory
Market Time
ATTACHED
Closed Sales Q1 2024 Closed Sales Q1 2023 % Change Closed Sales Q4 2023 % Change
- $1M 0 0 - 0$1M - $2M 2 0 200.00% 1 100.00% $2M - $3M 1 1 0.00% 2 -50.00% $3M - $5M 2 2 0.00% 2 0.00% $5M+ 4 0 400.00% 3 33.33% Closed Sales Q1 2024 Closed Sales Q1 2023 % Change Closed Sales Q4 2023 % Change $0 - $500K 0 0 - 1 -100.00% $500K - $1M 3 4 -25.00% 12 -75.00% $1M - $2M 12 6 100.00% 13 -7.69% $2M - $4M 8 7 14.29% 1 700.00% $4M+ 1 0 100.00% 3 -66.67%
Avg.
Median
Avg.
Park City | 55
PARK CITY - 7715 VILLAGE WAY
THE CANYONS/THE COLONY, THAYNES CANYON, PARK MEADOWS
Long recognized as favored communities of the affluent, these markets saw very little change year-over-year as demand remained high and inventory restricted.
The Canyons is a popular destination, with demand driven by those seeking properties that offer slope-side access.
Canyons Village consists of mainly condominiums while The Colony represents the single-family location.
Recognized for its unique trophy homes on ski-in/out acreage The Colony sees its entry level price at $10.5 million, as of the end of March 2024.
The attached properties in The Canyons saw an increase in demand for its lower-priced condos, although home sales priced between $1-$2 million were suppressed due to a lack of inventory in this price category.
Thaynes Canyon is another prestigious enclave of ski-in/ski-out properties where demand remains consistently high, as do the prices for single-family homes.
Park Meadows located in the heart of Park City consistently sees a high demand for its properties while inventory, particularly for condominiums, remains extremely low.
THE CANYONS/THE COLONY
SINGLE FAMILY
JANUARY 1 - MARCH 31, 2024 VS. SAME PERIOD 2023
$12,050,000
Median Sales Price
10
237
JANUARY 1 - MARCH 31, 2024 VS. SAME PERIOD 2023
$3,600,000
5
$775,000
Median Sales Price
71 Months Supply of Inventory
Months Supply of Inventory Avg. Market Time
ATTACHED
Closed Sales Q1 2024 Closed Sales Q1 2023 % Change Closed Sales Q4 2023 % Change $0 - $5M 0 1 -100.00% 0$5M - $7.5M 0 1 -100.00% 0$7.5M - $10M 1 0 100.00% 1 0.00% $10M - $15M 0 3 -100.00% 2 -100.00% $15M+ 1 0 100.00% 1 0.00% Closed Sales Q1 2024 Closed Sales Q1 2023 % Change Closed Sales Q4 2023 % Change $0 - $500K 6 8 -25.00% 2 200.00% $500K - $1M 10 10 0.00% 3 233.33% $1M - $2M 7 6 16.67% 12 -41.67% $2M - $4M 5 6 -16.67% 11 -54.55% $4M+ 1 3 -66.67% 1 0.00%
Avg.
56 | Park City
Market Time
THAYNES CANYON
SINGLE FAMILY
JANUARY 1 - MARCH 31, 2024 VS. SAME PERIOD 2023
$7,300,000
Median Sales Price
5
29 Months Supply of Inventory
Avg. Market Time
PARK MEADOWS
SINGLE FAMILY
JANUARY 1 - MARCH 31, 2024 VS. SAME PERIOD 2023
ATTACHED
JANUARY 1 - MARCH 31, 2024 VS. SAME PERIOD 2023
$3,300,000
Median Sales Price
9
123
Avg. Market Time
$3,600,000
$1,622,500
Median Sales Price
1
79 Months Supply of Inventory Months Supply of Inventory
Avg. Market Time
Closed Sales Q1 2024 Closed Sales Q1 2023 % Change Closed Sales Q4 2023 % Change $0
0 0 - 0 -
- $1M
0 0 - 0 -
$1M - $2M
0 - 0 -
$5M 0 0 - 1 -100.00% $5M+ 1 0 100.00% 0 100.00%
$2M - $3M 0
$3M -
Closed Sales
2024 Closed Sales Q1 2023 % Change Closed Sales Q4 2023 % Change
$1M 0 0 - 0$1M - $2M 1 1 0.00% 1 0.00% $2M - $3M 0 0 - 2 -100.00% $3M - $4M 1 0 100.00% 2 -50.00% $4M+ 1 2 -50.00% 4 -75.00% Closed Sales Q1 2024 Closed Sales Q1 2023 % Change Closed Sales Q4 2023 % Change $0 - $500K 0 0 - 0$500K - $1M 2 1 100.00% 1 100.00% $1M - $2M 2 2 0.00% 1 100.00% $2M - $3M 2 1 100.00% 1 100.00% $3M+ 0 1 -100.00% 2 -100.00%
Q1
$0 -
For more information about your local market and to view current properties available visit our website: www.DawnMckennaGroup.com Park City | 57
SUN PEAK/BEAR HOLLOW, SILVER SPRINGS AREA/OLD RANCH ROAD/KIMBALL
Located in the Synderville valley these communities have grown in popularity both for their range of property types and variety of price points.
In Sun Peak and Bear Hollow, the inventory levels of less than three months’ supply are clearly reflected in the lower number of sales during the first quarter of 2024. Demand remained strong and homes sold close to list price. Current inventory shows a mix of price points available in a community which is at build-out and only sees resales.
Silver Springs, Old Ranch Road, and Kimball saw slightly more activity in the first quarter of 2024 for single-family homes, but a decline in sales in the attached property market on comparison with the first quarter of 2023. Current inventory shows low availability for single-family homes in all these communities, that are a stronghold for full-time residents.
SUN PEAK/BEAR HOLLOW
SINGLE FAMILY
JANUARY 1 - MARCH 31, 2024 VS. SAME PERIOD 2023
$2,450,000
3
79
ATTACHED
JANUARY 1 - MARCH 31, 2024 VS. SAME PERIOD 2023
$3,600,000
Median Sales Price Median Sales Price
3
54 Months Supply of Inventory Months Supply of Inventory Avg. Market Time
$1,100,000
Market Time
Closed Sales Q1 2024 Closed Sales Q1 2023 % Change Closed Sales Q4 2023 % Change $0 - $1M 0 0 - 0$1M - $2M 1 3 -66.67% 2 -50.00% $2M - $3M 1 0 100.00% 1 0.00% $3M - $4M 0 0 - 0$4M+ 1 1 0.00% 1 0.00% Closed Sales Q1 2024 Closed Sales Q1 2023 % Change Closed Sales Q4 2023 % Change $0 - $500K 0 0 - 0$500K - $1M 1 1 0.00% 0 100.00% $1M - $2M 3 1 200.00% 2 50.00% $2M - $4M 0 0 - 0$4M+ 0 1 -100.00% 0 -
58 | Park City
Avg.
SILVER SPRINGS AREA/ OLD RANCH ROAD/KIMBALL
SINGLE FAMILY
JANUARY 1 - MARCH 31, 2024 VS. SAME PERIOD 2023
$2,250,000
Median Sales Price
ATTACHED
JANUARY 1 - MARCH 31, 2024 VS. SAME PERIOD 2023
$3,600,000
$900,000 4 10 104
39 Months Supply of Inventory Months Supply of Inventory Avg. Market Time
Median Sales Price
Market Time
Closed Sales Q1 2024 Closed Sales Q1 2023 % Change Closed Sales Q4 2023 % Change $0 - $1M 1 1 0.00% 0 100.00% $1M - $2M 1 1 0.00% 6 -83.33% $2M - $3M 7 2 250.00% 1 600.00% $3M - $4M 0 0 - 0$4M+ 1 1 0.00% 1 0.00% Closed Sales Q1 2024 Closed Sales Q1 2023 % Change Closed Sales Q4 2023 % Change $0 - $250K 0 0 - 0$250K - $500K 1 5 -80.00% 3 -66.67% $500K - $750K 1 2 -50.00% 2 -50.00% $750K - $1M 1 4 -75.00% 3 -66.67% $1M+ 2 0 200.00% 4 -50.00%
Avg.
DMG represented the Seller
Park City | 59
PARK CITY - 1194 ANGUS COURT
TRAILSIDE PARK/QUINN’S JUNCTION, SILVER CREEK ESTATES/SOUTH
Located in the Synderville valley these communities offer a wide variety of singlefamily homes, commercial amenities as well as Park City’s hospital. Positioned away from the ski hills these family neighborhoods are still within easy reach.
Demand for single-family homes in Trailside Park and Quinn’s Junction remains high, with new sales hindered by a three-month supply of inventory. This is further compounded as the inventory varies considerably, from smaller older homes to large acreages properties with stunning views as well as a new residential development.
Silver Creek Estates and Silver Creek South saw an increase in the level of inventory during the first quarter of 2024, as more ‘spec’ homes became available ready for the spring market. A broad range of homes from new developments to older, large acreages, including horse properties, are found in these communities.
TRAILSIDE PARK/QUINN’S JUNCTION
SINGLE FAMILY
JANUARY 1 - MARCH 31, 2024 VS. SAME PERIOD 2023
$1,400,000
Median Sales Price
3
167 Months Supply of Inventory
Avg. Market Time
Closed Sales Q1 2024 Closed Sales Q1 2023 % Change Closed Sales Q4 2023 % Change $0 - $1M 0 0 - 0$1M - $2M 1 3 -66.67% 3 -66.67% $2M - $3M 0 0 - 1 -100.00% $3M - $4M 0 0 - 0$4M+ 0 0 - 2 -100.00%
For more information about your local market and to view current properties available visit our website: www.DawnMckennaGroup.com 60 | Park City
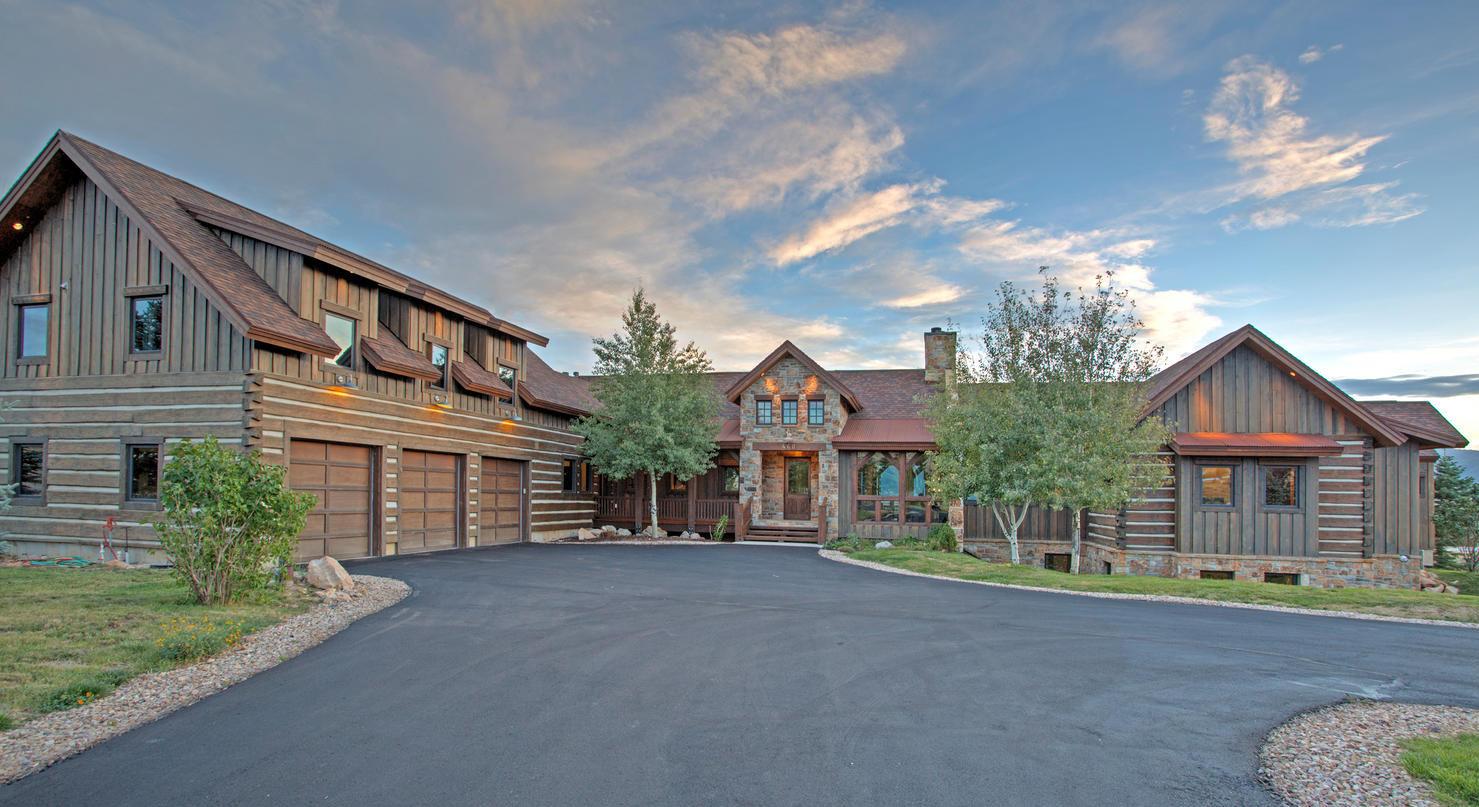
SILVER CREEK ESTATES/SOUTH
SINGLE FAMILY
JANUARY 1 - MARCH 31, 2024 VS. SAME PERIOD 2023
$2,850,000
ATTACHED
JANUARY 1 - MARCH 31, 2024 VS. SAME PERIOD 2023
$3,600,000
$945,000 19 4 4
36 Months Supply of Inventory
Market Time
Supply of Inventory
Market Time
Closed Sales Q1 2024 Closed Sales Q1 2023 % Change Closed Sales Q4 2023 % Change
- $1M 0 1 -100.00% 1 -100.00% $1M - $2M 0 11 -100.00% 6 -100.00% $2M - $3M 1 3 -66.67% 0 100.00% $3M - $4M 0 1 -100.00% 0$4M+ 0 0 - 2 -100.00% Closed Sales Q1 2024 Closed Sales Q1 2023 % Change Closed Sales Q4 2023 % Change $0 - $500K 0 0 - 0$500K - $750K 0 1 -100.00% 2 -100.00% $750K - $1M 4 2 100.00% 0 400.00% $1M - $2M 4 2 100.00% 4 0.00% $2M+ 0 0 - 0Median
Median
$0
Sales Price
Sales Price
Avg.
Avg.
Months
DMG represented the Seller
Park City | 61
PARK CITY - 460 WESTWOOD DRIVE
PROSPECTOR, JEREMY RANCH/PINEBROOK/SUMMIT PARK
An eclectic mix of country clubs and residential areas are found in these communities, that also offer a variety of property types to match the needs of primary and secondary residents.
Prospector is a thriving hub with its own distinct vibe located centrally within Park City. Highly desirable, new listings rarely stay on the market for long and as a result, there is still less than four months of inventory available even as we head into the spring market.
Jeremy Ranch, Pinebrook and Summit Park, located on Silver Summit are residential gems that offer a quieter lifestyle. Homes and homeowners are equally eclectic, as are the reasons they chose to live here – from those looking for quick access to Salt Lake City to others searching for a rural lifestyle.
Demand for single-family homes priced between $1-3 million saw an increase in sales compared to the first quarter of 2023, while sales for attached properties declined yearover-year.
PROSPECTOR
SINGLE FAMILY
JANUARY 1 - MARCH 31, 2024 VS. SAME PERIOD 2023
JANUARY 1 - MARCH 31, 2024 VS. SAME PERIOD 2023
$1,698,118
Median Sales Price
4
Supply of Inventory
31
$375,000
$3,600,000
Median Sales Price
2.3
58
ATTACHED
Closed Sales Q1 2024 Closed Sales Q1 2023 % Change Closed Sales Q4 2023 % Change $0 - $1M 0 0 - 0$1M - $2M 1 0 100.00% 2 -50.00% $2M - $3M 1 1 0.00% 2 -50.00%
- $4M 0 0 - 1 -100.00% $4M+ 0 0 - 0Closed Sales Q1 2024 Closed Sales Q1 2023 % Change Closed Sales Q4 2023 % Change $0 - $250K 1 0 100.00% 1 0.00% $250K - $500K 4 1 300.00% 7 -42.86% $500K - $750K 2 1 100.00% 3 -33.33% $750K - $1M 0 0 - 0$1M+ 0 0 - 1 -100.00%
$3M
Months
Avg.
Avg. Market Time 62 | Park City
Months
Supply of Inventory
Market Time
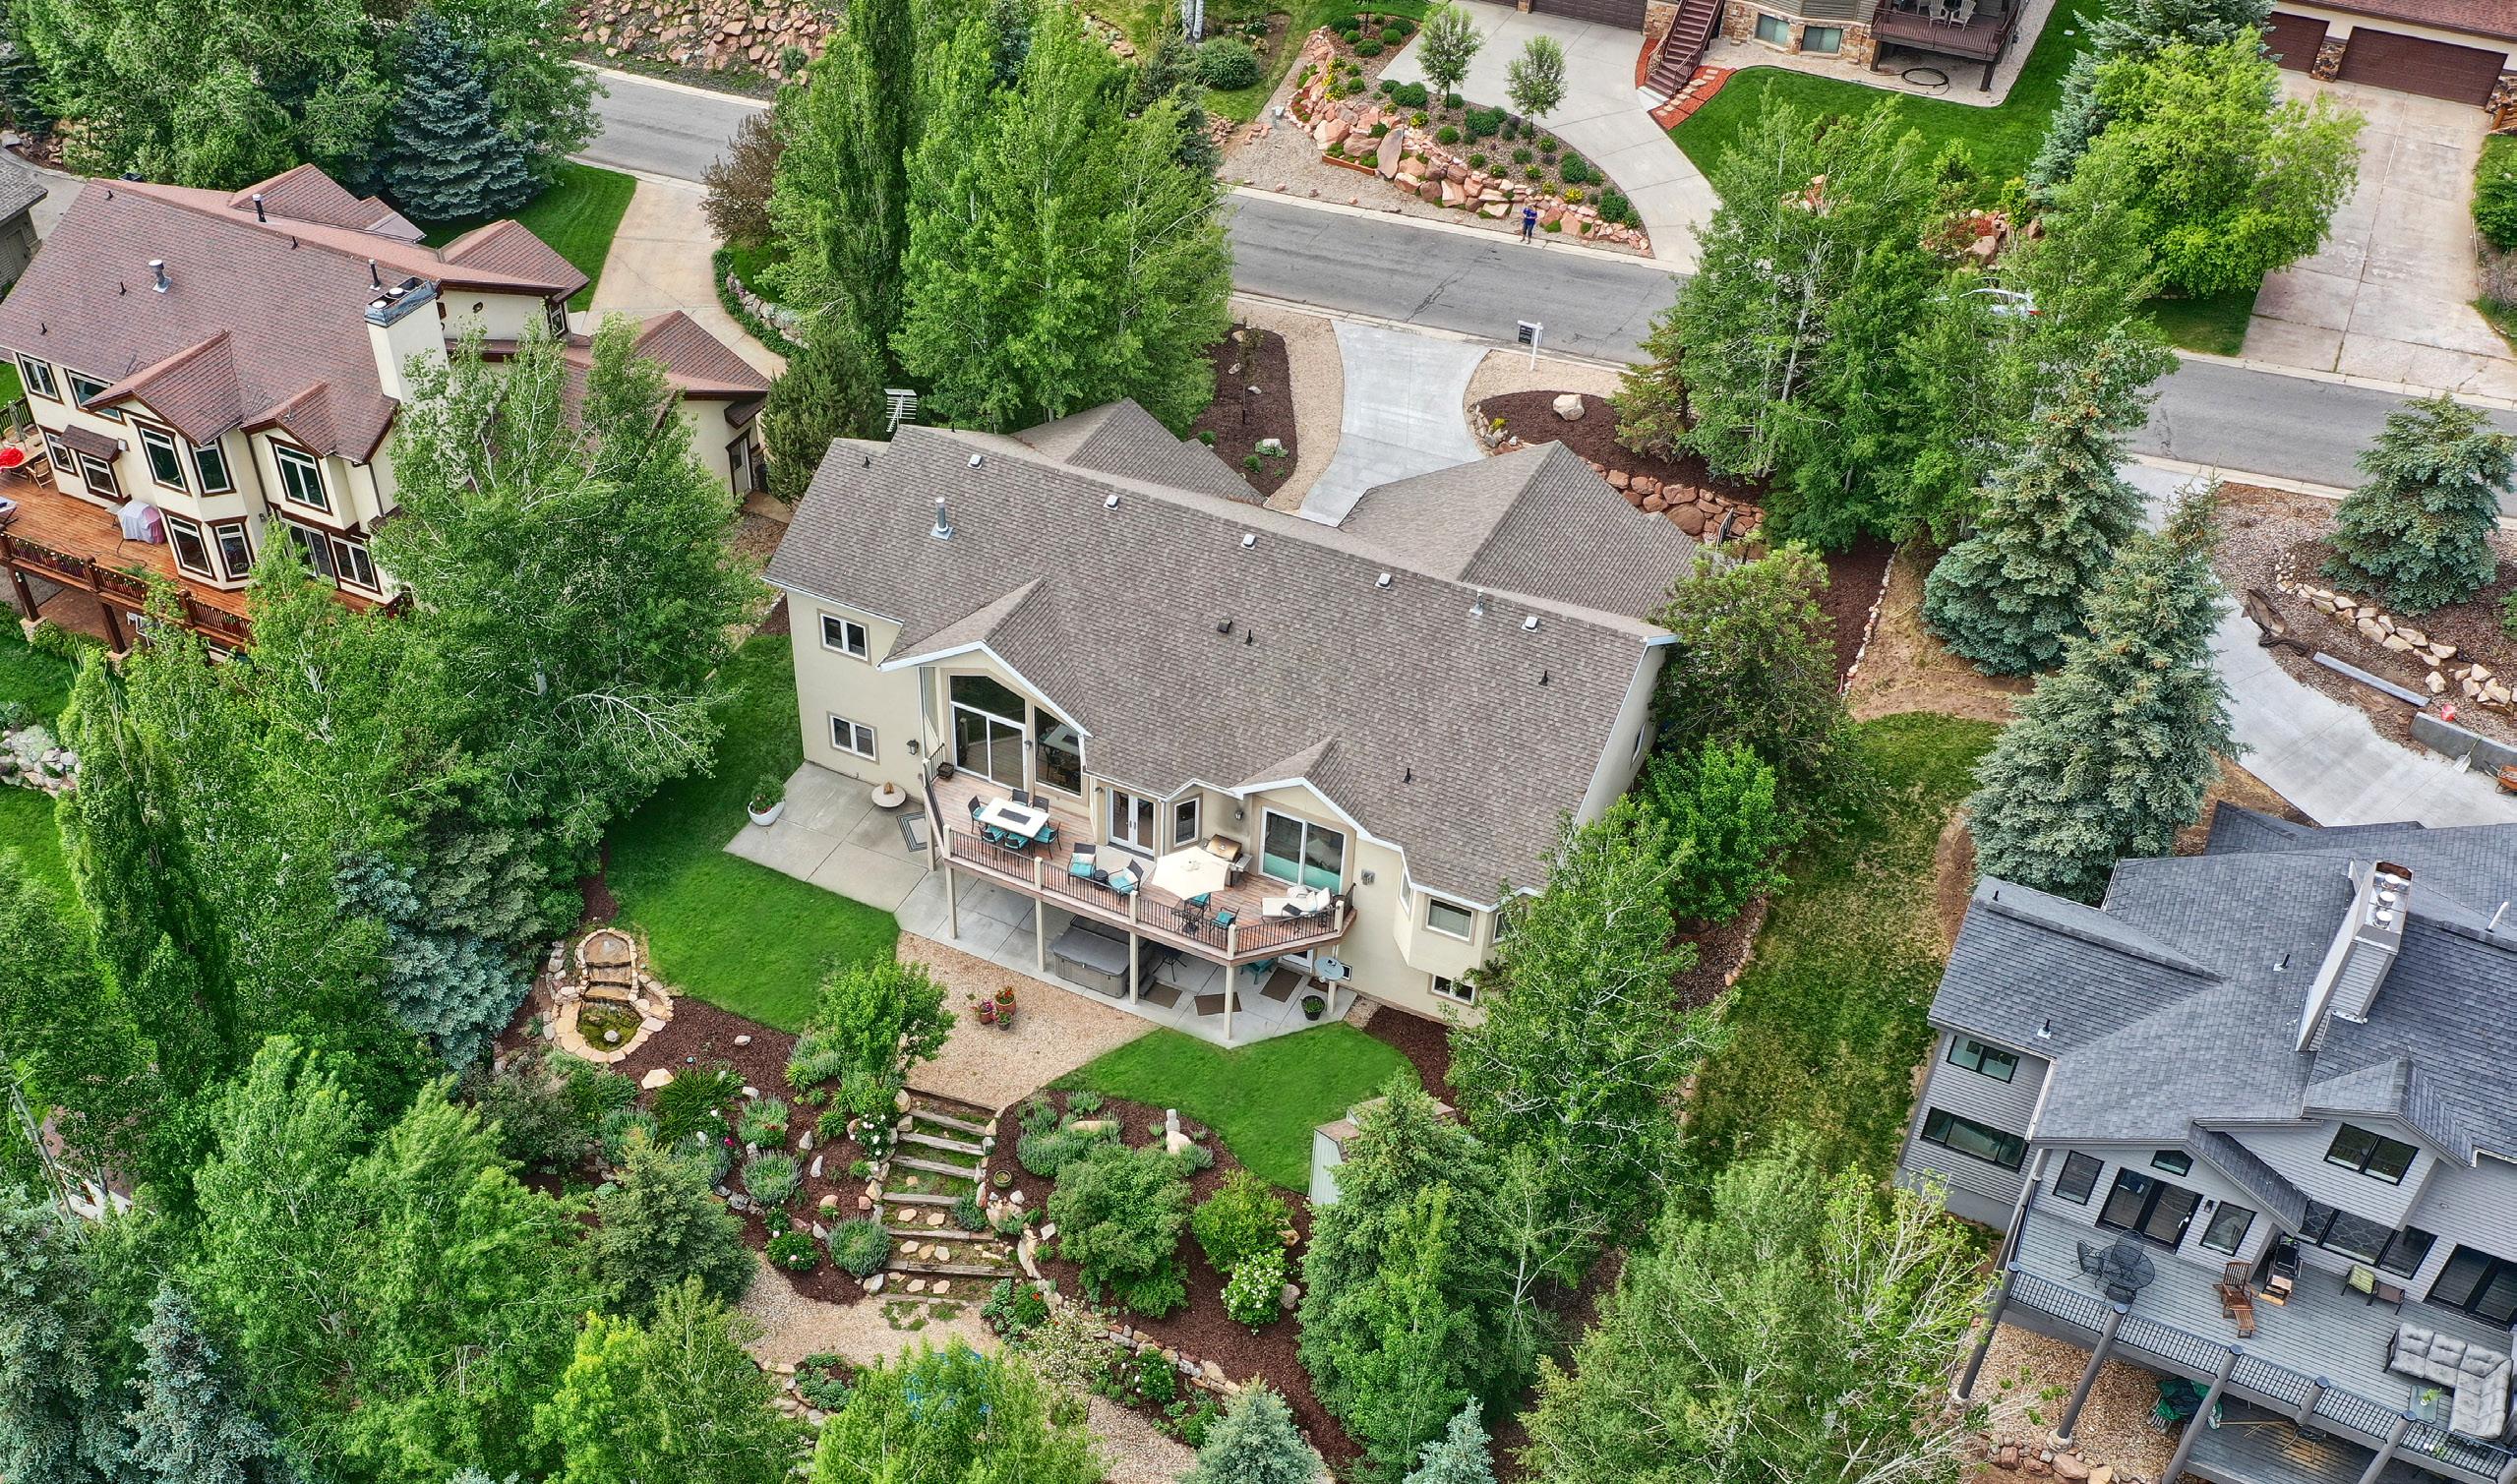
JEREMY
RANCH/PINEBROOK/SUMMIT PARK
SINGLE FAMILY
JANUARY 1 - MARCH 31, 2024 VS. SAME PERIOD 2023
ATTACHED
JANUARY 1 - MARCH 31, 2024 VS. SAME PERIOD 2023
$1,780,000
$995,000 7.7
$3,600,000
Sales Price Median Sales Price
15 87 50 Months Supply of Inventory Months Supply of Inventory
Market Time
Market Time
Closed Sales Q1 2024 Closed Sales Q1 2023 % Change Closed Sales Q4 2023 % Change $0 - $1M 1 1 0.00% 3 -66.67% $1M - $2M 6 5 20.00% 14 -57.14% $2M - $3M 3 2 50.00% 5 -40.00% $3M - $5M 1 1 0.00% 3 -66.67% $5M+ 1 0 100.00% 0 100.00% Closed Sales Q1 2024 Closed Sales Q1 2023 % Change Closed Sales Q4 2023 % Change
- $500K 0 1 -100.00% 0$500K - $750K 1 1 0.00% 5 -80.00% $750K - $1M 3 3 0.00% 0 300.00% $1M - $2M 2 3 -33.33% 2 0.00% $2M+ 0 1 -100.00% 0 -
$0
Median
Avg.
DMG represented the Seller PARK CITY - 2785 DAYBREAKER DRIVE Park City | 63
Avg.
HEBER CITY/MIDWAY, KAMAS
Located a little further away from Park City Mountain’s ski resorts, these communities are favored by those looking to live in a quieter locale but still gain quick access to all its amenities.
Heber City, a thriving town that, at its core remains a farming community, offers a wide variety of properties and price points. Midway, located a short distance away, offers a similar lifestyle, but comes complete with the charm of a ‘Swiss village feel’.
The single-family home market in both of these communities remained strong yearover-year with the first quarter of 2024
HEBER CITY/MIDWAY
SINGLE FAMILY
seeing significant sales, and demand is growing substantially in the $750,000-$3 million price range.
The attached market saw little change yearover-year other than an indication that prices are increasing for these properties with sales at higher price points.
In contrast, Kamas saw a significant increase in sales during the last quarter of 2023, but only one sale during the first quarter of 2024. However, sales from new developments depending upon when launched can distort the true demand.
JANUARY 1 - MARCH 31, 2024 VS. SAME PERIOD 2023
$937,500
JANUARY 1 - MARCH 31, 2024 VS. SAME PERIOD 2023
$3,600,000
Sales Price Median Sales Price
$452,500 3.9 10 87 40 Months Supply of Inventory Months Supply of Inventory Avg. Market Time
ATTACHED
Closed Sales Q1 2024 Closed Sales Q1 2023 % Change Closed Sales Q4 2023 % Change $0 - $500K 1 1 0.00% 4 -75.00% $500K - $750K 8 6 33.33% 16 -50.00% $750K - $1M 21 7 200.00% 12 75.00% $1M - $3M 21 11 90.91% 19 10.53% $3M+ 1 0 100.00% 1 0.00% Closed Sales Q1 2024 Closed Sales Q1 2023 % Change Closed Sales Q4 2023 % Change $0 - $250K 0 0 - 0$250K - $500K 4 5 -20.00% 3 33.33% $500K - $750K 1 0 100.00% 3 -66.67% $750K - $1M 1 0 100.00% 0 100.00% $1M+ 0 1 -100.00% 0 -
Median
Avg. Market
64 | Park City
Time

SINGLE FAMILY
JANUARY 1 - MARCH 31, 2024 VS. SAME PERIOD 2023
KAMAS
Closed Sales Q1 2024 Closed Sales Q1 2023 % Change Closed Sales Q4 2023 % Change $0 - $500K 0 0 - 0$500K - $750K 1 0 100.00% 3 -66.67% $750K - $1M 0 0 - 4 -100.00% $1M - $2M 0 6 -100.00% 4 -100.00% $2M+ 0 3 -100.00% 0Median Sales Price $645,000
Months Supply of Inventory Avg. Market Time DMG represented the Seller
Park City | 65
12 133
PARK CITY - 3925 RIVER ROAD
JORDANELLE/MAYFLOWER JORDANELLE, HIDEOUT
Located on either side of the Jordanelle Reservoir these communities offer private enclaves with single-family homes, land, and condos for sale.
Despite lying outside of Park City, they still have easy access to the ski-hills and will benefit considerably from the expansion of Deer Valley with its extensive year-round recreational activities and upgraded amenities.
During the last quarter of 2023, Jordanelle saw a slight decline in demand for single-
family properties but a significant increase for attached homes. Much of this change is to do with the launch of a new development which tends to skew the numbers as different phases are launched, as currently there are very few properties available between $500,000-$1 million.
Hideout, a small community, has seen a significant increase in demand since the launch of several new developments. The last quarter saw an increase in both the singlefamily and attached property sales.
JORDANELLE/MAYFLOWER JORDANELLE
SINGLE FAMILY
JANUARY 1 - MARCH 31, 2024 VS. SAME PERIOD 2023
$3,600,000
Median Sales Price
6
93
JANUARY 1 - MARCH 31, 2024 VS. SAME PERIOD 2023
$1,939,000
$3,600,000
Median
4.2
69 Months Supply of Inventory Months Supply of Inventory Avg. Market Time Avg. Market Time
ATTACHED
Closed Sales Q1 2024 Closed Sales Q1 2023 % Change Closed Sales Q4 2023 % Change $0 - $1M 0 0 - 0$1M - $2M 0 1 -100.00% 1 -100.00% $2M - $3M 1 2 -50.00% 0 100.00% $3M - $5M 3 3 0.00% 3 0.00% $5M+ 1 1 0.00% 0 100.00% Closed Sales Q1 2024 Closed Sales Q1 2023 % Change Closed Sales Q4 2023 % Change $0 - $500K 0 0 - 1 -100.00% $500K - $750K 1 10 -90.00% 2 -50.00% $750K - $1M 0 5 -100.00% 10 -100.00% $1M - $2M 6 6 0.00% 15 -60.00% $2M+ 6 0 600.00% 1 500.00%
Price
Sales
66 | Park City
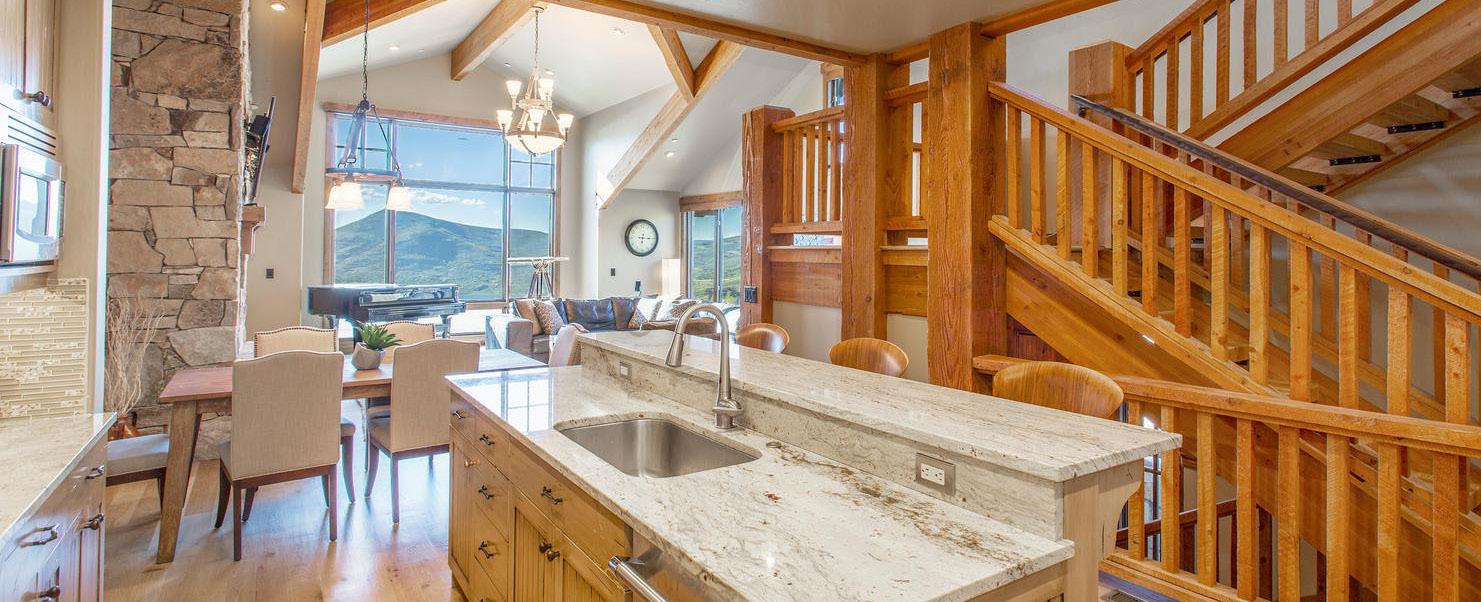
HIDEOUT
SINGLE FAMILY
JANUARY 1 - MARCH 31, 2024 VS. SAME PERIOD 2023
$1,935,300
6
114
LAND AT GOLDEN EAGLE DEVELOPMENT
JANUARY 1 - MARCH 31, 2024 VS. SAME PERIOD 2023
JANUARY 1 - MARCH 31, 2024 VS. SAME PERIOD 2023
$3,600,000
27
Median Sales Price Median Sales Price
85 Months Supply of Inventory Months Supply of Inventory Months Supply of Inventory
Market Time
$1,385,130
6.7
ATTACHED
Closed Sales Q1 2024 Closed Sales Q1 2023 % Change Closed Sales Q4 2023 % Change $0 - $1M 0 0 - 0$1M - $2M 3 1 200.00% 0 300.00% $2M - $3M 1 1 0.00% 4 -75.00% $3M - $4M 1 0 100.00% 1 0.00% $4M+ 0 0 - 0Closed Sales Q1 2024 Closed Sales Q1 2023 % Change Closed Sales Q4 2023 % Change
- $500K 3 2 50.00% 3 0.00% $500K - $750K 0 1 -100.00% 3 -100.00% Closed Sales Q1 2024 Closed Sales Q1 2023 % Change Closed Sales Q4 2023 % Change $0 - $500K 0 0 - 0$500K - $1M 0 7 -100.00% 0$1M - $1.5M 8 5 60.00% 8 0.00% $1.5M - $2M 5 2 150.00% 9 -44.44%
0 0 - 0 -
$0K
$2M+
Avg.
Avg.
DMG represented the Seller PARK CITY - 10802 NORTH HIDEOUT TRAIL Park City | 67
Market Time
GOLF COMMUNITIES: GLENWILD,
PROMONTORY, RED LEDGES
Park City has seen the rise of golf communities in the surrounding areas over the last few years. These communities offer primary residences and vacation properties as well as the opportunity to buy move-in-ready homes or build-your-own.
GLENWILD
SINGLE FAMILY
The majority of homes sold during the first quarter of 2024 were priced above $2 million, and the level of sales varied depending on the amount of inventory available.
Purchasing land to build a custom home remained very popular within these communities.
JANUARY 1 - MARCH 31, 2024 VS. SAME PERIOD 2023
$10,969,350
Median Sales Price
7
LAND
JANUARY 1 - MARCH 31, 2024 VS. SAME PERIOD 2023
Avg. Market Time
17
186 Months Supply of Inventory Months Supply of Inventory
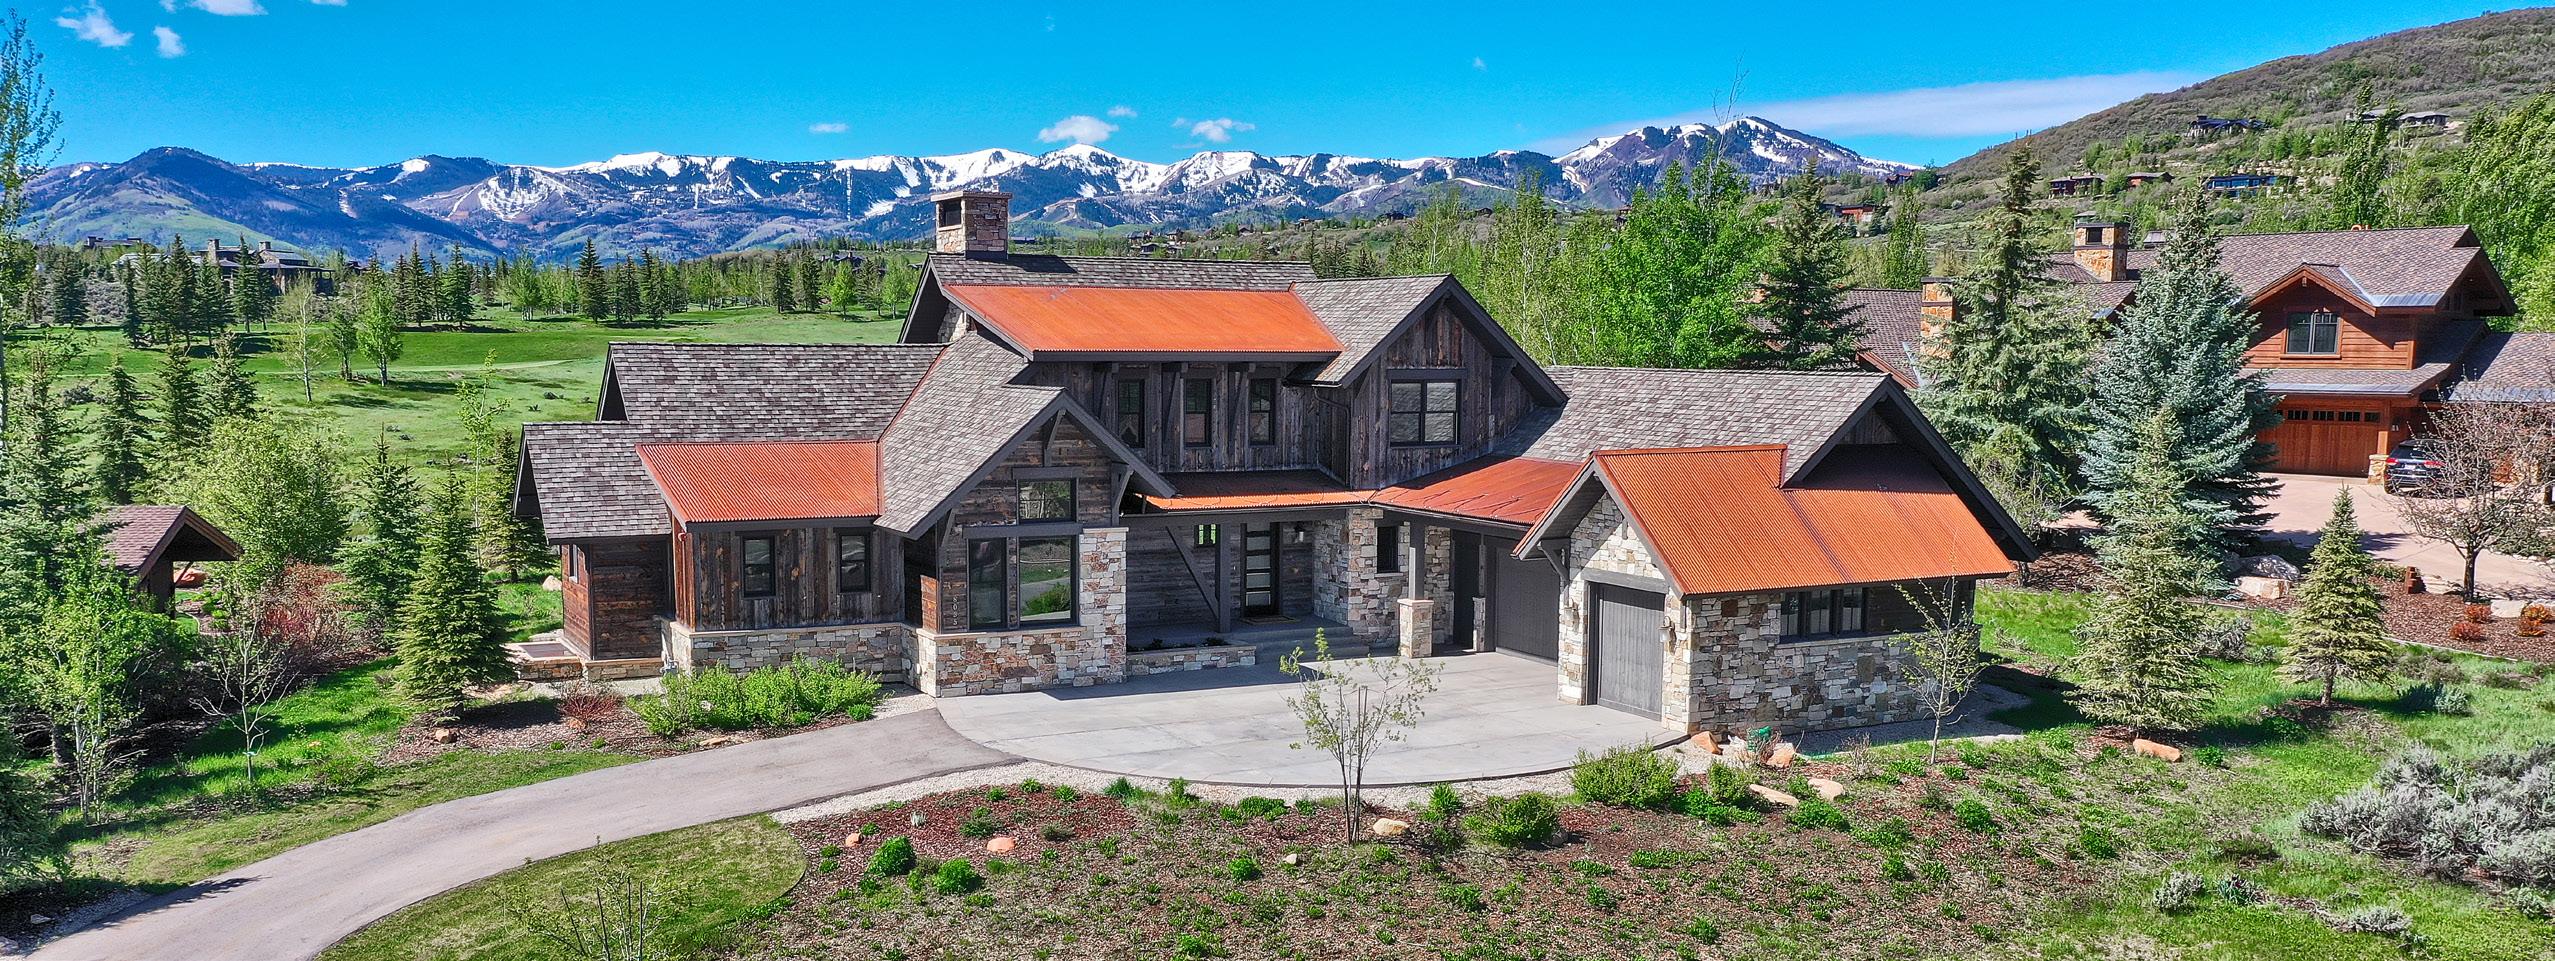
Closed Sales Q1 2024 Closed Sales Q1 2023 % Change Closed Sales Q4 2023 % Change
0 1 -100.00% 0$2M - $5M 0 0 - 1 -100.00% $5M - $7M 0 3 -100.00% 0$7M - $10M 0 0 - 0$10M+ 1 0 100.00% 0 100.00%
$0 - $2M
Closed Sales Q1 2024 Closed Sales Q1 2023 % Change Closed Sales Q4 2023 % Change $0 - $1M 2 1 100.00% 0 200.00% $1M+ 3 2 50.00% 1 200.00% DMG represented the Seller PARK CITY - 8035 GLENWILD DRIVE
PROMONTORY
SINGLE FAMILY
JANUARY 1 - MARCH 31, 2024 VS. SAME PERIOD 2023
LAND
JANUARY 1 - MARCH 31, 2024 VS. SAME PERIOD 2023
RED LEDGES
SINGLE FAMILY
JANUARY 1 - MARCH 31, 2024 VS. SAME PERIOD 2023
LAND
JANUARY 1 - MARCH 31, 2024 VS. SAME PERIOD 2023
Median Sales Price
$5,500,000 8.4
26 165 Months Supply of Inventory Months Supply of Inventory Avg. Market Time
$3,050,000 5.3 13.3
124 Months Supply of Inventory Months Supply of Inventory
Market Time
Closed Sales Q1 2024 Closed Sales Q1 2023 % Change Closed Sales Q4 2023 % Change $0
1 0 100.00% 2 -50.00% $2M
5 11 -54.55% 17 -70.59% $5M - $7M 5 1 400.00% 3 66.67% $7M - $10M 3 1 200.00% 2 50.00% $10M+ 1 0 100.00% 2 -50.00%
- $2M
- $5M
Closed
2024 Closed Sales Q1 2023 % Change Closed Sales Q4 2023 % Change
- $2M 1 0 100.00% 0 100.00% $2M - $3M 3 2 50.00% 5 -40.00% $3M - $4M 5 1 400.00% 2 150.00% $4M - $5M 2 1 100.00% 1 100.00% $5M+ 0 1 -100.00% 2 -100.00% Median Sales
Sales Q1
$0
Price
Avg.
Closed Sales Q1 2024 Closed Sales Q1 2023 % Change Closed Sales Q4 2023 % Change $0 - $1M 6 6 0.00% 5 20.00% $1M+ 1 0 100.00% 4 -75.00% Closed Sales Q1 2024 Closed Sales Q1 2023 % Change Closed Sales Q4 2023 % Change $0 - $1M 2 2 0.00% 4 -50.00% $1M+ 8 8 0.00% 2 300.00% For more information about your local market and to view current properties available visit our website: www.DawnMckennaGroup.com Park City | 69
GOLF COMMUNITIES: TUHAYE, VICTORY RANCH
TUHAYE
SINGLE FAMILY
JANUARY 1 - MARCH
$5,050,000
Median Sales Price
JANUARY 1 - MARCH 31, 2024 VS. SAME PERIOD 2023
VICTORY RANCH
JANUARY 1 - MARCH 31, 2024 VS. SAME PERIOD 2023
SINGLE FAMILY LAND LAND
JANUARY 1 - MARCH 31, 2024 VS. SAME PERIOD 2023
5 9.3
$4,450,000
Median Sales Price
4
176 Months Supply of Inventory Avg. Market Time
4.8
118 Months Supply of Inventory Months Supply of Inventory Months Supply of Inventory Avg. Market Time
Closed Sales Q1 2024 Closed Sales Q1 2023 % Change Closed Sales Q4 2023 % Change $0 - $2M 0 1 -100.00% 0$2M - $3M 0 0 - 0$3M - $4M 1 1 0.00% 0 100.00% $4M - $5M 0 1 -100.00% 2 -100.00% $5M+ 1 1 0.00% 0 100.00% Closed Sales Q1 2024 Closed Sales Q1 2023 % Change Closed Sales Q4 2023 % Change $0 - $2M 5 4 25.00% 2 150.00% $2M+ 0 0 - 0Closed Sales Q1 2024 Closed Sales Q1 2023 % Change Closed Sales Q4 2023 % Change $0 - $1.5M 4 8 -50.00% 9 -55.56% $1.5M+ 3 7 -57.14% 6 -50.00%
2024
Closed Sales Q1 2024 Closed Sales Q1 2023 % Change Closed Sales Q4 2023 % Change $0 - $2M 0 0 - 0$2M - $3M 1 2 -50.00% 2 -50.00%
1 3 -66.67% 1 0.00%
0 100.00%
31,
VS. SAME PERIOD 2023
$3M - $4M
$4M - $5M 1
1 0.00%
-25.00%
$5M+ 3 2 50.00% 4
70 | Park City

REASONS TO LIVE IN PARK CITY 10
Natural Beauty: Nestled in the stunning Wasatch Mountains, offering breathtaking views and access to outdoor activities like hiking, skiing, and mountain biking.
World-Class Skiing: Renowned for its exceptional ski resorts, including Park City Mountain Resort and Deer Valley Resort, providing unparalleled winter sports opportunities.
Outdoor Recreation: Beyond skiing, Park City offers a plethora of outdoor activities year-round, such as hiking, mountain biking, fishing, golfing, and horseback riding.
Festivals and Events: Hosts various festivals and events throughout the year, including the Sundance Film Festival, Kimball Arts Festival, and Park City Food & Wine Classic, providing a vibrant cultural scene.
Small-Town Charm: Despite its popularity, Park City maintains a smalltown charm with a tight-knit community, friendly locals, and a welcoming atmosphere.
Quality Education: Boasts excellent schools, making it an ideal place for families seeking quality education for their children.
Proximity to Salt Lake City: A short drive away from Salt Lake City, offering access to additional amenities, international airport, and urban attractions.
Strong Economy: Economy is robust, driven by tourism, outdoor recreation, and a growing tech industry, providing ample job opportunities.
Health and Wellness: Prioritizes health and wellness, with numerous fitness centers, spas, yoga studios, and access to outdoor activities that promote an active lifestyle.
Community Engagement: Has a strong sense of community engagement, with numerous volunteer opportunities, community events, and a supportive network of residents who care about the town’s well-being. 1 2 3 4 5 6 7 8 9 10
Park City | 71
CHICAGO
CHICAGO, IL 60611 312.750.9333
CHICAGO | LINCOLN PARK
1910 N. CLYBOURN AVENUE CHICAGO, IL 60614
312.750.9333
HINSDALE 8 E. HINSDALE AVENUE HINSDALE, IL 60521
630.686.4886
LAKE FOREST 675 FOREST AVENUE LAKE FOREST, IL 60045
847.737.4775 WINNETKA 45 GREEN BAY ROAD GLENCOE IL 60022
847.807.3660
WWW.DAWNMCKENNAGROUP.COM OFFICES FLORIDA NAPLES 550 5TH AVENUE SOUTH NAPLES, FL 34102 239.316.3883 MICHIGAN NEW BUFFALO 10 N. WHITTAKER STREET NEW BUFFALO, MI 49117 269.256.6600 UTAH PARK CITY 1153 CENTER DRIVE PARK CITY, UT 84098 435.523.4453 WISCONSIN LAKE GENEVA 226 BROAD STREET LAKE GENEVA, WI 53147 262.649.9530
ILLINOIS
GOLD COAST 676
AVENUE SUITE 3010
|
N. MICHIGAN
