FINANCIAL REPORT
SECOND QUARTER 2023
COMMUNITY AND ECONOMIC DEVELOPMENT

INFRASTRUCTURE
ORGANIZATIONAL AND SERVICE EFFECTIVENESS SAFE COMMUNITY
VIBRANT COMMUNITY AND NEIGHBORHOODS

Contributors:
Bryan Archer, Director of Finance
Deb Nielson, Deputy Director of Finance
Chris Kelly, Senior Budget Analyst
Carolyn Ewing, Budget Analyst
Rocky Sheppard, Budget Analyst
Vesta Weinhauer, Controller
Carolyn Ivey, Accounting Supervisor
Natasha Galston, Grant Accountant
Jenna Belec, Finance Program Coordinator
Steve Milke, Bun Heng, Print Shop
Finance Department • 8101 Ralston Road • Arvada, Colorado 80002 720-898-7120 • www.arvada.org
1 Table of Contents Overview ................................................................................................................................. 3 Property Tax ............................................................................................................................ 4 General Fund ....................................................................................................................... 5 - 8 Street Maintenance Fund................................................................................................... 9 -10 Parks Fund ........................................................................................................................... 11 Special Revenue Funds Tax Increment Funds ......................................................................................................... 12 Community Development .................................................................................................. 13 Arvada Housing Authority .................................................................................................. 14 Capital Improvements Projects Fund ................................................................................ 15 -16 Enterprise Funds Water Fund ....................................................................................................................... 17 Wastewater Fund .............................................................................................................. 18 Stormwater Fund 19 Golf Fund .......................................................................................................................... 20 Solid Waste Fund .............................................................................................................. 21 Internal Service Funds Insurance Fund ................................................................................................................. 22 Computer Fund ................................................................................................................. 23 Vehicle Fund ..................................................................................................................... 24 Print Services Fund ........................................................................................................... 25 Buildings Fund .................................................................................................................. 25 3F Bond Projects ............................................................................................................. 26 -27 Investment Report ........................................................................................................... 28 -29 Grant Information ................................................................................................................. 30 Performance Data............................................................................................................ 31-32
Intentionally left blank
OVERVIEW
2023 Second Quarter Financial Report
The Financial Report for the City of Arvada provides an unaudited overview of the major funds and how their revenues and expenditures performed in comparison to budget. This is not meant to be a complete accounting, but rather a quick look at the highlights
The global and national economies seem to be on the precipice of recession with credit card debt, home owner debt, car loan debt and the national debt at alltime highs. With the short term Fed Funds rate now sitting at 5.25-5.50% (the highest number in 22 years) after the Feds raised rates again in July, anything on credit is going to cost significantly more than it did just 18 short months ago. The yield curve between the 2-year and 10-year continues to be inverted and show no signs of changing. Historically, this has been a predictor of a recession with the average time to a recession of 18 months. The curve first inverted in March of 2022, 16 months ago.
As has been the case in the past, the consumer continues to keep a possible recession at bay. Gross Domestic Product (GDP) grew at 2.4% for the second quarter, up from 2.0% in the first quarter. This was far stronger than what was expected by forecasters. Spending was wide spread but a big chunk of the increase was from services, including vacation travel, restaurants and of course, Taylor Swift concerts. Not to be left behind, business investment rebounded along with an increase in state and local government spending.
Inflation has slowed, with the second quarter increase sitting at 2.6%. This is down from the revised number of 4.1% in the first quarter and the 7.2% felt in the first half of last year. While inflation has slowed, we are still a long way away from the Fed’s goal of 2.0%. Unemployment continues to remain low, sitting at 3.6%. Even though new job production has slowed, market participation rate has remained steady and current available jobs still outnumber workers looking at almost 1.5 times. Will the Fed’s manage the flow of money appropriately to get the hopeful, “soft landing”, or will the large credit card bills and consumer debt be too much for the economy to overcome. Only time will tell.
At the State level, the economy continues to be strong with growth exceeding expectations for the second quarter. Unemployment is very low, ending June at 2.8%. Housing price increases had slowed in the first quarter but returned to a growth pattern in the second quarter driving overall inflation to increase at over 5.1%. Wage growth accelerated in the second quarter as competition for qualified workers remains high.
Locally, General Fund revenues are keeping pace with inflation with the overall increase for the year sitting at 2.5%. Sales tax collections are performing better, up 6.3% year over year. The largest increases are in the Merchant Wholesalers, Internet Retailers and Limited Service Restaurants categories. The largest decreases are in Furniture Stores and Liquor Stores. As inflations continues to cool, sales tax revenues should slow down.
Auto Use, Building Use and General Use are all down compared to last year. While some of this is expected, for example Building Use due to large one-time construction projects started in 2022, these are categories that will need to be monitored as the year progresses.
Overall General Fund expenditures increased 32.0% over last year. The largest increase, over $9 million dollars, is the transfer to the Capital Improvement Fund. These same transfers happened in the 3rd quarter last year. The other large increase is related to pay and benefits. In 2022, pay was frozen until August 1 and then increased. This year, the increases happened January 1. Expenditures are
in line with
budget.
The golf courses and restaurants continue to experience a revival. Rounds are up 9.2% with golf revenues up over 21.2%. The rainy weather did not deter play. Not to be outdone, the restaurants revenues are up over 24.2%. The biggest challenge continues to be staffing, requiring management to jump in and do jobs such as cart cleaning, range picking, dish washing, cooking and serving.
One capital project is discussed on this quarter – Lake Arbor Lake Renovation. Please take the opportunity to read the write-up on this restoration project that is a partnership with Mile High Flood District to improve the water quality and bank stabilization of the 40-acre lake.
The citizens of Arvada passed Ballot Issue 3F in November of 2018, approving a sales and use tax bond to fund the widening of Ralston Road from Yukon to Garrison and the widening and creation of an underpass on 72nd Avenue from Kipling to Ward. Please see the project detail pages (pages 26-27) in the document for detailed updates.
As the City prepares for the revised 2023-2024 budget, revenues continue to exceed budget and expenditures are in line minus capital projects. The majority of the funds have healthy reserves and exceed the City Council’s required fund balance reserve. An enhanced focus on core services and defining expected levels of service will be a major part of the budget process. If, and when, the pending recession hits Arvada, the City is financially prepared.
3
OVERVIEW
The City’s property tax mill levy rate for 2023 was 4.31 mills. Residents paid $175.15 in City property taxes on the medium home price of $620,000

For 31 straight years, Arvada has received the Tree City USA Award from the @arborday for our commitment to the City’s urban forest.
For the 3rd straight year, Arvada has received the @arborday Growth Award for higher levels of tree care and community engagement.

4 WHRE DO YOUR PROPERTY TAX DOLLARS GO?
Overview
Residents may pay additional property taxes if they live in a Metro District. These additional mill rates vary from 10 mills up to 75 mills. A Metro District is a taxing entity that exists primarily to finance public improvements and amenities that benefit property owners in the district.
GENERAL FUND
General Fund Overview
The General Fund pays for the City’s basic services. This includes police, planning, transportation planning, street light maintenance and costs, building activity and general administration. In addition, the General Fund also provides for the following:
• Operational support to the Parks Fund
• General Debt Service payments

• Transfer to the Capital Improvements Fund for new parks, transportation and other infrastructure projects
• Grant support to the Arvada Center
The following table provides a comparison of budgeted cash balances, revenues and expenditures to actual amounts.
• The 2023 beginning fund balance was $70,114,000.
• $3,842,062 of the fund balance is dedicated to projects not completed in 2022, one-time items and new requests.
• The 2023-2032 ten-year financial plan requires the use of $29,129,232 to balance. A 10-year plan will be updated this summer in conjunction with the 2024 budget cycle.
GENERAL FUND ENDING FUND BALANCE BY QUARTER COMPARED TO FUND BALANCE GOAL OF 17% OF BUDGETED EXPENDITURES

5
General Fund 2023 Budget As of 06/30/23 As of 06/30/22 Beginning Fund Balance $70,114,000 $70,114,000 REVENUES Sales & Use Tax 90,373,950 37,105,843 37,229,540 Property Tax 8,152,193 5,795,410 5,787,568 Interest 1,173,000 764,359 455,310 Other 26,891,325 12,383,093 11,220,877 Total Revenues $126,590,468 $56,048,705 $54,693,295 EXPENDITURES Ongoing $110,490,352 $45,291,319 $43,076,051 Capital 10,701,459 12,536,747 345,000 Debt Service 5,360,782 1,305,391 1,370,891 Total Expenditures $126,552,593 $59,133,457 $44,791,942 Income/(Loss) 37,875 (3,084,752) 9,901,353 Ending Fund Balance $70,151,875 $67,029,248
0% 10% 20% 30% 40% 50% 60% 70% Q1 2020 Q2 2020 Q3 2020 Q4 2020 Q1 2021 Q2 2021 Q3 2021 Q4 2021 Q1 2022 Q2 2022 Q3 2022 Q4 2022 Q1 2023 Q2 2023
Revenue Highlights
• Overall revenues increased $1,355,410 or 2.5% over 2022.
• Franchise fees saw an increase of $297,705 or 15.2% over 2022. This increase is due to increased collections from Xcel energy as energy and natural gas charges to customers increased in 2023 over 2022.
• Building Use tax and building permits saw a decrease of $2,331,586 or 41.0%. In 2022 there was a permit for a large commercial project which leads to this decrease.


• Court fines and fees saw an increase of $89.977 or 20.4% over 2022.
• Sales tax saw an increase of $1,808,370 and is discussed in more detail in the “Sales Tax” section.
• General use tax saw a decrease of $9,294 and is discussed in more detail in the “Use Tax” section.
• Auto use tax saw a decrease of $149,641 and is discussed in more detail in the “Use Tax” section.
Sales Tax
• Sales tax collections lag one month; therefore, collections for the second quarter represent five months’ collections.
• Sales tax is up 6.3% for the second quarter.
• The following categories are up over the same time in 2022: grocery stores 4.7%, merchant wholesalers 19.0%, internet retailers 11.3%, limited service restaurants 22.5%, cable providers 40.0%, and local messengers 56.0%.
• The following categories are down from the same time in 2022: full service restaurants (2.3%), liquor stores (13.7%), and furniture stores (14.0%).
Use Tax
Building Use Tax
• Building use tax decreased 45.1% for the second quarter.
• This decrease is due to some large commercial projects starting in 2022.
• We expect this revenue source will meet its budget for 2023.
Auto Use Tax
• Auto use tax decreased 3.5% for the second quarter.
• We are seeing a slowdown in this area and will continue to monitor this revenue source throughout the year.
General Use Tax
• General use tax decreased 2.9% for the second quarter.
• This decrease is due to several businesses with larger use tax remittances in 2022. This revenue will continue to be monitored throughout the year.
BUDGETED GENERAL FUND REVENUES

Sales Tax Collections
Use Tax Collections
6 GENERAL FUND
$$5,000,000 $10,000,000 $15,000,000 $20,000,000 $25,000,000 $30,000,000 $35,000,000 06/30/2019 06/30/2020 06/30/2021 06/30/2022 06/30/2023 Sales Tax $20,778,493 $21,347,397 $26,170,377 $28,688,548 $30,491,918
$$1,000,000 $2,000,000 $3,000,000 $4,000,000 $5,000,000 $6,000,000 $7,000,000 $8,000,000 $9,000,000 06/30/2019 06/30/2020 06/30/2021 06/30/2022 06/30/2023 General $441,026 $278,433 $380,827 $323,000 $313,705 Auto $3,356,192 $2,944,833 $3,851,443 $4,296,327 $4,146,686 Building $1,700,707 $1,976,505 $1,996,557 $3,921,665 $2,153,533
Property Tax, 6.4% Sales Tax, 59.4% Use Tax, 0.8% Auto Use Tax, 8.5% Building Use Tax & Permits, 5.1% Court Fines & Fees, 0.9% Franchise Fees, 4.0% Interest, 0.9% Other, 14.0% 2023
Property Tax
• The City’s property tax rate is 4.31 mills per $1,000 of valuation.
• 2023 property tax is based on the mill which is placed on the assessed valuation from 2022.

• Property tax slightly increased 0.1% over 2022 and should meet budget.
Property Tax Collections
Intergovernmental Revenues
• Highway Users Tax Fund (HUTF), the City’s share of statecollected gas tax revenue, is down 13.5% for the second quarter. This tax is collected on the number of gallons of gas sold.
• Road and Bridge funds, the City’s share of property tax collected by Jefferson County & Adams County and dedicated to the maintenance of roads and bridges is up 2.5% over last year due to increased assessed valuations.

Intergovernmental Revenues

7 GENERAL FUND
$$500,000 $1,000,000 $1,500,000 $2,000,000 $2,500,000 06/30/2019 06/30/2020 06/30/2021 06/30/2022 06/30/2023 Jefferson County $1,706,104 $1,535,893 $1,509,332 $1,521,783 $1,560,071 HUTF $406,420 $402,869 $442,799 $505,321 $436,960
$$1,000,000 $2,000,000 $3,000,000 $4,000,000 $5,000,000 $6,000,000 06/30/2019 06/30/2020 06/30/2021 06/30/2022 06/30/2023 Property Tax $4,618,738 $5,272,544 $5,409,963 $5,787,568 $5,795,410
Expenditure Highlights
• Overall expenditures increased $14,341,515 or 32.0% over 2022.
• Attributing to the majority of this increase is an increase of $9,477,314 or 117.4% increase in transfers. This is due to the timing of transfers to the Capital Improvement Fund. These transfers were made early in 2023 and later in 2022.
• Personnel charges increased $4,520,579 as team members received a 3% pay increase August 1, 2022 and January 1, 2023 and an additional 38 FTE’s were approved in the 2023 budget.
• Services and charges increased $1,684,124 or 28.1% from 2022. This is due to increases in training, dues and subscriptions and contract services.
• Supplies and expenses saw an increase of $357,339 or 8.6% over 2022. This is primarily due to contributions to the computer replacement and maintenance fund to support additional costs associated with technology.
Salary and Benefit
2023 BUDGETED GENERAL FUND EXPENDITURES

• Personnel costs increased due to large number of new positions for 2023 and a mid-year pay adjustment in 2022, not yet factored in. The 2023 pay plan included 38 new positons. The City increased employee’s pay in the 3rd quarter of last year to accommodate for unusually high inflation.

8 GENERAL FUND Personnel, 44.4% Services and Charges, 11.9% Supplies and Expenses 7.2% Contracts 4.7% Debt Service 4.1% Transfers 27.1% Miscellaneous 0.6%
Salary & Benefits 2023 Budget As of 06/30/23 As of 06/30/22 Salaries & Wages $44,656,318 $18,763,009 $15,110,735 Vacancy Savings (2,262,434) -Overtime 857,155 590,050 533,514 Group Insurance 7,740,561 2,830,080 2,454,174 Retirement 4,988,662 2,111,195 1,720,046 Medicare 659,148 268,109 216,235 Temporary Wages & SS 310,062 145,880 220,286 Other 895,781 358,563 306,178 Total $57,845,253 $25,066,886 $20,561,167
Street Maintenance Fund

Overview
The Pavement Management - Street Maintenance Fund accounts for costs associated with street maintenance, repair and replacement planned by the Pavement Management Program including: ADA curb ramp compliance, concrete replacement, crack sealing, hot chip, cape and slurry sealing, reconstruction, milling and overlay. Revenues are derived from the City’s General Fund and the Highway Users Tax Fund which is the City’s share of state-collected gas tax revenue.
Revenue Highlights
• Revenues consist of a transfer from the General Fund and street degradation fees.
Expenditure Highlights
• The 2023 Pavement Management Program map includes proposed areas to be addressed is attached hereto and incorporated herein by reference. The map identifies areas proposed to be addressed in 2023 with compliant ADA curb ramps, concrete replacement, mill and overlay, hot chip seal, slurry seal, cape seal and crack seal.
Overview:
The Pavement Management - Street Maintenance Fund accounts for costs associated with street maintenance, repair and replacement planned by the Pavement Management Program including: ADA curb ramp compliance, concrete replacement, crack sealing, hot chip, cape and slurry sealing, reconstruction, milling and overlay. Revenues are derived from the City’s General Fund and the Highway Users Tax Fund which is the City’s share of state-collected gas tax revenue.
The 2023 Pavement Management Program (PMP) had three active contracts in the second quarter. See summaries below:
ADA Curb Ramp and Concrete Replacement Program
Summary:
• One (1) concrete contract
• Contractors – Triple M Construction
• Percent Complete – 46%
Pavement Maintenance 2023 Mill and Overlay
Summary:
• Two (2) Asphalt Contracts
• One Asphalt Contractor(2 Contracts) – Asphalt Specialties
• Percent Complete – 49%
Pavement Maintenance 2023 Hot Chip, Slurry Seal and Crack Seal
Summary:
• One (1) Contract - Hot Chip, Chip Seal, Slurry Seal, Mastic and Crack Seal
• One (1) Contractor – A-1 Chipseal
9 STREET
MAINTENANCE FUND
Street Maintenance Fund 2023 Budget As of 06/30/23 As of 06/30/22 Beginning Fund Balance $388,000 $388,000 REVENUES Project Cost Recovered - $151,421 General Fund Transfer $11,954,121 $6,002,061 $5,074,815 Other $120,000 - 116,695 Total Revenues $12,074,121 $6,153,482 $5,191,510 EXPENDITURES Asphalt Replacement $5,803,930 $2,099,284 $6,268 Concrete Replacement 3,897,328 7,411Crack Sealing 1,500,000 182,936 $446,022 Other 1,292,860 384,301 $52,406 Total Expenditures $12,494,118 $2,673,932 $504,696 Income/(Loss) (419,997) 3,479,550 4,686,814 Ending Fund Balance $(31,997) $3,867,550
• Percent Complete – 26%
Pavement Management Program Financi
Current Contracts:
04.705013.55005 – Concrete Contracts
• Budget Amount – 3,653,425.00
• Billing to date – 1,688,301.39
• Budget Balance Remaining- 1,965,123.61
04.705014.55009 - Asphalt - Mill and Overlay
• Budget Amount – 5,096,949.00
• Billing to date – 3,007,074.13
• Budget Balance Remaining- 2,089,874.90
04.705014.53032 - Chip, Crack and Slurry Seal
• Budget Amount – 1,500,000
• Billed to Date - 390,471.54
• Budget Balance Remaining – 1,109,528.50
Note: Financial Summary includes active contracts as of the end of the Second Quarter. It does not include costs for material testing/materials or other expenses. 04 - Pavement Maintenance Fund
Total Completed
• $5,085,847.10
Budget Balance Remaining
• $5,164,526.94
Note: 04 – Pavement Maintenance Fund Summary includes costs and balance as it relates to active contracts as of the end of the Second Quarter.
Challenges
• Poor subgrade conditions found during repaving
• Unforeseen additional costs were incurred. However, by addressing and correcting before repaving, the result will significantly extend the service life of the streets.
• The Impact of additional unforeseen costs affects the ability to complete areas proposed to be completed in 2023 as it relates to available funding.
• Unstable weather conditions
• ADA Curb Ramp Removal and Replacement
• Additional unforeseen removal and replacement of concrete in order to meet ADA curb ramp compliance. This triggers additional costs which impacts the funding needed to complete the ADA curb ramps scheduled for completion in 2023 in preparation for future pavement maintenance applications.
Conclusion
The Pavement Management Team is committed to improving pavement quality throughout the City. In addition to managing the 2023 contracts, the Pavement Management Team has been working to improve policies, processes, and procedures. Second quarter examples include:
• Concrete Replacement
• ADA compliance
• Collaborating with internal teams to develop and implement a standardized process when addressing non-compliant curb ramps which are included in the 2023 Pavement Maintenance Program.
• Proposed Changes to Pavement Management Concrete Policy
• Communication
• Continuous collaboration with internal teams to review, update and implement standardized communication internally and externally
• In an effort to research best practices and promote networking, other cities were engaged in discussion around Pavement Management. Among these were Denver, Colorado Springs, Aurora, Lakewood, and Longmont.
• RoadMatrix
• Utilizing software to assist with determining pavement maintenance applications and priorities
• Annual data captured by Stantec
10 STREET MAINTENANCE
FUND
--------------------E Overlay Program Hot Chip Seal Cape Seal Slurry Seal Curb Ramps Crack Seal Concrete Program Public Works Department Engineering Division OF 1 PROPOSED STREET MAINTENANCE PROGRAMS 2023 8101 Ralston Rd. Arvada, Colorado 80002 Phone 720-898-7640
Parks Fund
Overview
The Parks Fund accounts for costs associated with the acquisition, design, development, maintenance and beatification of parks, open space and trails within the City. Revenues are derived from the City’s General Fund, Grants Fund, Jefferson County Open Space Funds and Adams County Open Space Funds
Revenue Highlights
• Overall revenues increased by $137,248, or 2.4% over 2022.
• Jefferson County Open Space funds increased $127,544 or 6.4%.
• In 2022, the City transitioned athletic field programming from the APEX Recreation District to the Parks Department. At this time last year, the City received over a million dollars for reimbursement from APEX. Although the City no longer receives APEX money, revenues are still up from last year due to the receipt of field programming revenues.
Expenditure Highlights
• Overall expenditures increased in second quarter from 2022 by $121,150 or 2.2%.
• A high number of expenses are associated with running the new athletic field program and the new employees added for Parks safety and maintenance

11
PARKS FUND
Parks Fund 2023 Budget As of 06/30/23 As of 06/30/22 Beginning Fund Balance $7,529,376 $7,529,376 REVENUES Open Space $5,941,771 $2,136,520 $2,008,975 City Cash Transfer 4,975,153 2,529,019 1,965,964 APEX Reimbursement - - 1,002,738 Other 1,437,781 1,116,449 667,063 Total Revenues $12,354,705 $5,781,988 $5,644,740 EXPENDITURES Ongoing $13,929,649 $5,656,913 $5,535,763 Capital 52,000 -Total Expenditures $13,981,649 $5,656,913 $5,535,763 Income/(Loss) (1,626,944) 125,075 108,977 Ending Fund Balance $5,902,432 $7,654,451
$$2,000,000 $4,000,000 $6,000,000 $8,000,000 $10,000,000 $12,000,000 2019 2020 2021 2022 2023 2023 Budget APEX $- $- $- $1,002,738 $- $Cash Transfer $1,774,297 $1,848,614 $1,921,214 $1,965,964 $2,529,019 $4,975,153 Open Space $1,488,269 $1,597,491 $1,826,726 $2,008,975 $2,136,520 $5,941,771
Special Revenue Funds Overview
Special Revenue Funds account for revenues that are to be used for specific purposes. The following funds are considered special revenue funds:
• Tax Increment Funds
• Community Development

• Housing
Tax Increment Funds
Overview
There are two tax increment funds which account for the voter-approved sales tax increases to fund expanded police services. The first accounts for the .21 cent sales and use tax and the second accounts for the .25 cent sales and use tax. Sources include sales tax, general use tax, auto use tax, building use and interest income. Since the tax increment is in addition to the City’s 3% sales tax, revenue trends in the tax increment fund will closely follow those in the general fund.
Revenue Highlights
• Sales Tax and Audit revenue increased due to inflation. The price of goods and services has increased over the last year which is directly related to the sales tax increase.
• The increase in other revenue is due to a larger accounting adjustment entry for daily interest made in 2023 than the same entry made in 2022.
Expenditure Highlights
• Ongoing expenditures slightly increased due to more police officers onboard in 2023 than in 2022.
12 SPECIAL REVENUE FUNDS
Tax Increment Funds 2023 Budget As of 06/30/23 As of 06/30/22 Beginning Fund Balance $18,334,000 $18,334,000 REVENUES Sales Tax/Audit Revenue $12,039,036 $4,875,478 $4,562,536 Use Tax 2,374,576 1,014,119 1,231,366 Other 694,433 1,448,373 199,446 Total Revenues $15,108,045 $7,337,970 $5,993,348 EXPENDITURES Ongoing $18,429,805 $5,234,160 $5,009,954 Capital 16,634 - 6,334 Total Expenditures $18,446,434 $5,234,160 $5,016,288 Income/(Loss) (3,338,389) 2,103,810 977,060 Ending Fund Balance $14,995,611 $20,437,810
Community Development
The Community Development Fund accounts for all entitlements, revenues and expenditures of the Community Development Block Grants (CDBG) program and the Home Rehabilitation program and Essential Home Repairs program.
Revenue Highlights
• Overall revenues decreased by $24,653 or 5.9% from 2022.
• A third party is now managing the Essential Home Repair Program under the CDBG so the grant reimbursements have slowed down due to the new program needing time to establish. On the other hand, interest income has increased compared to the previous year.
Expenditure Highlights
• Overall expenditures increased $27,376 which is a 6.4% increase over 2022.
• Although our CDBG Program has been restructured and program spending is down $158,426 or 91.5% compared to the previous year, the City made a $200,000 grant to the local nonprofit for an affordable housing project in 2023 compared to no such grant in 2022. The net effect of this activity is a small increase in spending between the years. The Essential Home Repair Program has a few projects under way; none have been completed as of 6/30/23. The wait list for essential home repairs is at 58 as of June 30 2023.


13 SPECIAL REVENUE FUNDS Community Development Fund 2023 Budget As of 06/30/23 As of 06/30/22 Beginning Fund Balance $6,397,271 $6,397,271 REVENUES Recovered $156,810 $211,520 $211,716 Grants 659,470 81,872 172,728 City Cash Transfer 45,000 22,500 26,725 Interest/Other 34,000 79,793 9,169 Total Revenues $895,280 $395,685 $420,338 EXPENDITURES Ongoing $385,080 $332,140 $156,974 CDBG Essential Home Repairs 407,056 14,630 173,056 CDBG Other 532,571 102,700 96,865 SLFRF Housing Grant 180,000 4,800Total Expenditures $1,504,707 $454,270 $426,894 Income/(Loss) (609,427) (58,585) (6,557) Ending Fund Balance $5,787,844 $6,338,686
Overview
Arvada Housing Authority
The Authority administers funds received for rent subsidy to low/moderate income households under Section 8 of the U.S. Housing Assistance Payment Program.
Revenue Highlights
• Overall revenues increased $208,265 or 6.2% over 2022.
• Grants revenue increased $193,523 or 5.8% from 2022 due to rising rental costs in the Arvada area and increased leasing in both Section 8 and Mainstream Programs.
• For the first half of 2023 there have not been transfers from the General Fund or Community Development fund due to staffing changes.
Expenditure Highlights
• Overall expenditures increased $667,111 or 21.9% over 2022.
• Rent expenditures increased by $617,413 or 21.5% due to the increased number of tenants on the program and higher overall rental costs.
• The Arvada Housing Authority served 496 families during 2023 while 433 were served during the same period in 2022. The Housing Authority also served 46 families with disabled family members through the Mainstream voucher program, 11 more than last year. The waitlist has 198 people on it.
14 SPECIAL REVENUE
FUNDS
Arvada Housing Authority 2023 Budget As of 06/30/2023 As of 06/30/2022 Beginning Fund Balance $349,817 $349,817 REVENUES Recovered $15,600 $19,594 $6,903 Grants 5,881,629 3,524,518 3,330,995 Transfers (Rev) 75,000 -Interest/Other 1,000 2,262 212 Total Revenues $5,973,229 $3,546,375 $3,338,110 EXPENDITURES Ongoing $866,649 $221,217 $169,868 Rents 5,033,321 3,488,454 2,871,041 Transfers (Exp) 39,691 9,156 10,808 Total Expenditures $5,939,661 $3,718,828 $3,051,717 Income/(Loss) 33,568 (172,453) 286,393 Ending Fund Balance $383,385 $177,364 Overview
Capital Improvement Projects (CIP) Fund Overview
Revenue Highlights
• Transfers consist of transfers from the General Fund, Grants and Police Tax Increments. Contributions are lands dedicated fees that help fund eligible projects. Grants and recovered costs are reimbursements from other agencies that have shared in the cost of a project.
Expenditure Highlights

• Administration expenditures are related to: Court Security Upgrades, ERP Replacement, Olde Town Parking Garage, City Hall Second Floor Remodel, Arvada Center repairs, and Peg Cable Capital Maintenance.
• Technology expenditures are related to the fiber conduit boring project.
• Streets expenditures are related to the Streets Master Plan, Ward Road, and Ralston Road.
• Traffic expenditures are related to 58th & Kipling, 58th & Independence, 86th Parkway Signal Connect, Leyden Emergency Prepare Study, Tennyson Corridor, Alkire Street Trail and the Transportation Master Plan.
• Park expenditures are for: Standley Lake Library Trailhead, Gold Strike Park, Holistic Health and Fitness Park, Sabell Park, Pomona Bike Park, Marge Roberts Park, CO Front Range Trail Study, Creekside Playground, Irrigation Improvements, Majestic View Classroom/Facility Improvements and Repairs, Irrigation Improvements and Lake Arbor Community Pool.
15 CAPITAL IMPROVEMENTS PROJECTS FUND
Capital Improvement Fund 2023 Budget As of 06/30/23 As of 06/30/22 Beginning Fund Balance $56,853,000 $56,853,000 REVENUES Transfers $13,885,940 $10,697,945 $369,057 Grants and Recovered Costs 106,604 1,223,682 108,791 Contributions - 935,387 101,845 Interest 300,000 3,618,400 281,628 Total Revenues $14,292,544 $16,475,414 $861,321 EXPENDITURES CIP Administration $10,187,527 $554,405 $304,658 CIP Technology $245,975 $62,739 $438,806 CIP Street Projects $2,987,435 $723,932 297,364 CIP Traffic Projects $2,957,952 $759,481 212,077 CIP Park Projects $6,129,665 $501,768 (6,198) Total Expenditures $22,508,554 $2,602,325 $1,246,707 Income/(Loss) (8,216,010) 13,873,088 Ending Fund Balance $48,636,990 $70,726,088
The Capital Improvement Projects Fund accounts for capital projects for streets, traffic, and parks.
CIP Admin, $554,405 CIP
Technology, $62,739
CIP Street Projects, $723,932 CIP Park Projects, $501,768
CIP Traffic Projects, $759,481
2023 CIP EXPENDITURES
CAPITAL IMPROVEMENTS PROJECTS FUND
Project Updates
Lake Arbor Restoration
Lake Arbor is a 40-acre lake located in Lake Arbor Park northeast of 80th and Pierce. Over time, wave action had eroded away most of the lake shoreline, threatening the safety and integrity of adjacent park trails and diminishing the ecological habitat and aesthetics around the park. In addition, sediment deposition within the northwest pond, also known as the forebay, had led to a reduction in water quality and increase in unpleasant odors and algae blooms within the lake. In winter 2022, the City—in partnership with Consor Engineering, the Mile High Flood District (MHFD), and Naranjo Civil Constructors—completed final design plans for improvements to address the various issues at the lake. Construction then kicked off in February 2023.
With assistance from Colorado Parks and Wildlife, thousands of fish were relocated from the lake prior to the project to reduce impacts to the existing population. Additionally, the construction crew took extra precautions to protect and relocate any aquatic wildlife encountered during the work, including species of painted turtles and snapping turtles.
The project improvements include a buried riprap and vegetated shoreline, additional lake aerators for increased oxygen production, dredging of accumulated sediment and other contaminated materials in the lake bottom, new storm infrastructure, repairs to the concrete spillway, and additional irrigation around the park.
Despite an unprecedented rainy spring and summer that brought about some weather delays, construction progress has been on track and is slated to be complete by mid- to late-August 2023. Final landscape and irrigation installations will then finish up in the fall.
The improvements will restore this beloved community lake to a more resilient condition and bring back the beauty and recreational benefits that so many people have enjoyed over the years.


16
Water Fund Overview
The Water Fund accounts for all activities within the scope of the water utility operations including administration, operations, capital water projects, financing and related debt service and billing and collection.
Revenue Highlights
• Water Charges revenue has increased as a result of the new water consumption rate and the new bi-monthly water service fee despite the wet weather.
• System Development Charges revenue increased due to large new construction projects. The timing of new construction projects, are not consistent from yearto-year so System Development Charges revenue vary.
Expenditure Highlights
• The Major Capital Maintenance expenditures increased because of the Water Meter Replacement project.
• Capital expenditures increased due to a payment for the Gross Reservoir expansion project occurring in the 1st quarter of 2023 and not a corresponding payment in 2022.
*$27,057,600 of the Fund Balance is a cash escrow reserved in Denver Water’s name and related to the Gross Reservoir expansion. The Water Fund’s overall obligation is expected to total $120 million through 2026 .
17 ENTERPRISE
FUNDS
Water Fund 2023 Budget As of 06/30/23 As of 06/30/22 Beginning Fund Balance $130,800,000 $130,800,000 REVENUES Water Charges $30,643,493 $8,747,016 $8,561,311 System Development Charges $10,372,000 $7,062,536 2,672,620 Interest $686,104 $1,271,526 475,432 Other 53,063,768 900,266 7,030,052 Total Revenues $94,765,365 $17,981,344 $18,739,415 EXPENDITURES Ongoing 29,458,538 9,857,283 $8,973,645 Debt Service 3,100,000 948,245Major Capital Maintenance 10,128,775 1,209,632 980,390 Capital 83,955,105 13,016,580 4,584,138 Total Expenditures $126,642,418 $25,031,740 $14,538,173 Income/(Loss) (31,877,053) (7,050,396) 4,201,242 Ending Fund Balance $98,922,947 $123,749,604
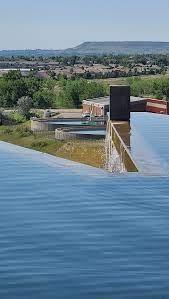
Wastewater Fund
Overview
The Wastewater Fund accounts for all activities necessary in the collection, transmission and disposal of sewage and wastewater.
Revenue Highlights
• Sewer Charges revenue and System Development Charges revenue increased due to the new wastewater rate, the new bi-monthly service fee and some large construction projects.
• Other revenue decreased due to a retainage fee being paid in 2022 from Jefferson Center Metropolitan District (JCMD) for the Alkire Lift project and there was not similar revenue in 2023.
Expenditure Highlights
• Major Capital Maintenance expenditures decreased due to the Trenchless Sewer Construction project having activity in 2022 and there were no maintenance projects in 2023.
• Capital expenditures increased because of the Ralston Trunk Sewer Improvement project and the North Trunk Sewer Improvement project in 2023.
18 ENTERPRISE
FUNDS
Wastewater Fund 2023 Budget As of 06/30/23 As of 06/30/22 Beginning Fund Balance $57,408,000 $57,408,000 REVENUES Sewer Charges $14,814,322 $6,847,221 $6,249,235 System Development Charges $3,022,443 $732,163 179,821 Interest $208,090 $207,885 162,892 Other 51,507,393 483,779 844,143 Total Revenues $69,552,248 $8,271,048 $7,436,091 EXPENDITURES Metro District 10,274,700 4,580,901 $5,000,870 Ongoing 7,651,024 2,873,567 1,514,780 Major Capital Maintenance 3,519,849 2,413 1,254,449 Capital 17,864,356 1,485,771 97,943 Total Expenditures $39,309,929 $8,942,653 $7,868,042 Income/(Loss) 30,242,319 (671,605) (431,951) Ending Fund Balance $87,650,319 $56,736,395
Stormwater Fund
Overview
The Stormwater Fund accounts for all activities necessary to maintain a stormwater management plan.
Revenue Highlights
• Stormwater Fee revenue increased slightly due to the new-bi-monthly service fee.
Expenditure Highlights
• Ongoing expenditures increased because of The The Capital expenditures increased due to a large payment for the Lake Arbor Restoration project.

19 ENTERPRISE FUNDS
Stormwater Fund 2023 Budget As of 06/30/23 As of 06/30/22 Beginning Fund Balance $4,523,000 $4,523,000 REVENUES Stormwater Fee $4,014,289 $1,999,935 $1,967,596 Interest $88,000 $60,559Other 16,345 16,746 41,445 Total Revenues $4,118,634 $2,077,240 $2,009,041 EXPENDITURES Ongoing $3,355,746 $1,093,550 $908,699 Debt Service 864,237 432,119 431,054 Capital 7,727,977 1,065,327 702,617 Total Expenditures $11,947,960 $2,590,996 $2,042,370 Income/(Loss) (7,829,326) (513,756) (33,329) Ending Fund Balance $(3,306,326) $4,009,244
Golf Fund
Overview
The Golf Course Fund accounts for all revenues and expenses of the Lake Arbor and West Woods Golf Courses, including food service operations.
Revenue Highlights
• Overall revenues increased in 2nd quarter 2023 by $729,576 or 22.3% over 2022.
• Golf course revenue increased by 21.12% or $440,584 over 2022 numbers. The rainy weather this spring did not seem to affect revenue or golf rounds played. Golf rounds played increased by 9.2% in the 2nd quarter of 2023 at both courses.
• Restaurant revenue increased as well from 2022, by $250,723 or 24.2%.
Expenditure Highlights
• Overall 2nd quarter expenditures increased by $620,865 or 18.9% over 2022.
• In order to keep up with the higher demand from golf and restaurant customers, expenditures increased in relation to increased revenue. Expenditures are on track with budgeted projections, coming in at 50.8% for half the year.
Golf Rounds by Type - January
20 ENTERPRISE FUNDS
Golf Fund 2023 Budget As of 06/30/23 As of 06/30/22 Beginning Fund Balance $(47,783) $(47,783) REVENUES Golf Courses $5,096,091 $2,526,567 $2,085,982 Restaurants 2,322,200 1,286,629 1,035,906 Construction Revenue - -City Cash Transfer 282,570 187,620 149,352 Total Revenues $7,700,861 $4,000,816 $3,271,240 EXPENDITURES Golf Courses $2,817,847 $1,352,315 $1,144,515 Restaurants 2,149,305 1,085,149 860,566 Administration 2,732,182 1,472,532 1,284,049 Capital - -Total Expenditures $7,699,334 $3,909,996 $3,289,131 Income/(Loss) 1,527 90,820 (17,891) Ending Fund Balance $(46,256) $43,037
- June
Player Support Super Users Annuals Super Users Clubs Tournament/ Corp Leagues Grow the Game Total West Woods 2022 24,076 3,153 324 115 101 27,769 2023 27,372 3,090 374 - 203 31,039 Variance 3,296 (63) 50 (115) 102 3,270 14% -2% 0% 0% 101% 12% Lake Arbor 2022 10,772 4,172 187 187 - 15,318 2023 12,582 2,950 165 165 - 15,862 Variance 1,810 (1,222) (22) (22) - 544 17% -29% 0% 0% 0% 4% Combined Rounds Total 2022 34,848 7,325 511 302 101 43,087 2023 39,954 6,040 539 165 203 46,901 Variance 5,106 (1,285) 28 (137) 102 3,814 15% -18% 0% 0% 101% 9%
Solid Waste Fund
Overview
In 2020, the Arvada City Council approved a new waste and recycling program. The City entered into an agreement with a single trash company to provide waste and recycling collection for residents. The trash and recycling services started in July 2021

Revenue Highlights
• Total Revenue increased from more customers receiving trash and recycling services. There were 489 new customers in the past year.
Expenditure Highlights
• The Operating expenditures decreased due to a one-time purchase in 2022 of replacement parts for the trash and recycling carts.
21 ENTERPRISE FUNDS
Solid Waste Fund 2023 Budget As of 06/30/23 As of 06/30/22 Beginning Fund Balance $405,000 $405,000 REVENUES Charges & Fees 4,185,030 2,191,030 $2,070,219 Other 263,987 25,378 2,170 Total Revenues $4,449,017 $2,216,408 $2,072,389 EXPENDITURES Operating $4,095,778 $1,625,172 $1,791,854 Debt Service 490,000 -Other - 57Total Expenditures $4,585,776 $1,625,226 $1,791,854 Income/(Loss) (136,759) 591,182 280,535 Ending Fund Balance $268,241 $996,182
Internal Service Funds Overview
There are five Internal Service Funds – Insurance Fund (Risk Management), Computer Fund, Print Services Fund, Vehicles Fund and Building Fund. Internal Service Funds charge internal programs and departments for use of goods and services. The Funds then pay for all associated costs of things such as purchasing insurance, vehicle purchases and maintenance, computer purchases and maintenance, and buildings maintenance.

Insurance Fund
Overview
The Insurance Fund, administered by the Risk Management Program of the City Attorney’s Office, accounts for the City’s self-insurance against loss. It is funded with contributions by all City departments and programs based on their levels and types of exposure. The Fund is also used for loss prevention programs, the protection of City personnel and the preservation of City property and assets.
*Per GASB Statement 10, an additional $3,210,034 in cash is currently held in the Risk Management fund to cover potentially incurred liabilities as of the beginning of the year. This figure was reached by the Risk Management’s actuary for 2022.
Revenue Highlights
• Revenues increased $480,080 or 36.10% over 2022.
• The increase is primarily due to the increase in contributions from other funds..
Expenditure Highlights
• Overall expenditures increased $453,146 or 23.37% over 2022.
• Workers compensation claims decreased $58,144 over 2022 due to delays in payments.
• However, liability claims increased $152,484 or 30.69% due to increased insurance premiums and the payments for sewer main break in March.
• Property claims increased $260,384.57 or 37.97% due to increased insurance premiums, remediation for the two big wind events in Q1 and Arvada Center burst pipe.
• Auto claims increased as well by $88,508 over 2022 due to increased insurance premiums and increased repair cost in general.
22 INTERNAL SERVICE FUNDS
Insurance Fund 2023 Budget As of 06/30/23 As of 06/30/22 Beginning Fund Balance $1,896,000 $1,896,000 REVENUES Contributions $3,469,066 $1,751,093 $1,259,212 Interest 66,000 55,527 27,166 Other - 3,180 43,342 Total Revenues $3,535,066 $1,809,800 $1,329,720 EXPENDITURES Risk Management Administration $2,885,753 $2,142,023 $1,764,723 Risk Management Operations 605,550 250,494 174,648 Total Expenditures $3,491,303 $2,392,517 $1,939,371 Income/(Loss) 43,763 (582,717) (609,651) Ending Fund Balance $1,939,763 $1,313,283
Computer Fund
Overview
The Computer Fund provides resources for both ongoing maintenance and replacement of the City’s computers, network hardware, and other electronic infrastructure. It is funded with contributions by all City departments based on their levels of use of this technology.

Revenue Highlights
• Other Revenues increased due to a larger accounting adjustment entry for daily interest in 2023 than the same entry made in 2022. The interest rate earned is much higher this year compared to last year’s rate.
Expenditure Highlights
• Maintenance expenditures decreased as a result of a radio system maintenance invoice payment in in the first half of 2022 that did not have a corresponding transaction in 2023.
• Replacement expenditures increased due to a transfer from the Operating fund to the Capital fund for the Enterprise Resource Planning (ERP) project of $3,000,000. Minus this transfer, expenditures would be in line with 2022.
23 INTERNAL SERVICE FUNDS
Computer Fund 2023 Budget As of 06/30/23 As of 06/30/22 Beginning Fund Balance $13,400,000 $13,400,000 REVENUES Maintenance $2,672,221 $1,433,989 $1,318,264 Replacement 1,948,381 1,258,398 1,299,973 Other 238,000 959,961 134,445 Total Revenues $4,858,602 $3,652,348 $2,752,681 EXPENDITURES Maintenance $3,017,448 $917,658 $1,041,397 Replacement 9,563,740 3,368,524 183,765 Other 92,553 43,028 37,126 Total Expenditures $12,673,741 $4,329,210 $1,262,289 Income/(Loss) (7,815,139) (676,862) 1,490,393 Ending Fund Balance $5,584,861 $12,723,138
INTERNAL SERVICE FUNDS
Vehicle Fund Overview
The Vehicles Fund provides resources for the maintenance and replacement of City vehicles and heavy equipment. It is funded with contributions by all City departments based on their vehicle inventory and use.
Revenue Highlights
• Overall revenues increased 10.0% over 2022 in the second quarter. The increase in revenue is largely due to transfers from other departments for vehicle replacements.
Expenditure Highlights
• Expenditures have increased over 2022 by $406,078 or 14.2%.
• In the second quarter of 2023, the City purchased:
• Five 2023 Ford Interceptor Utility Vehicles

• John Deere 5067E Utility Tractor
• 2022 Ford F550 4x4 Water Dump Truck
• T32 Upfit Flatbed
• Four 2023 Ford F250 4x4 Regular Cab Pick-Up Trucks
• 2023 Ford F250 4x4 Supercab Pick-Up Truck
• Trailer Mounted Spray Unit
• 2023 Ford Ranger 4x4 Supercab
• 2022 Ford F150 Pick-Up Truck
• Ford F350 Regular Can with Plow
• Ford F350 Supercab with Plow
• 2023 Parker HHTL H8218
24
Trailer Vehicles Fund 2023 Budget As of 06/30/23 As of 06/30/22 Beginning Fund Balance $7,193,000 $7,193,000 REVENUES Maintenance Contributions $2,727,970 $1,308,420 $1,197,681 Replacement Contributions 3,844,370 1,724,594 1,475,865 Other 346,000 987,975 981,611 Total Revenues $6,918,340 $4,020,989 $3,655,157 EXPENDITURES Maintenance $3,274,666 $1,812,982 $1,718,166 Replacement 3,571,996 1,450,100 1,138,837 Total Expenditures $6,846,662 $3,263,082 $2,857,003 Income/(Loss) 71,678 757,907 798,153 Ending Fund Balance $7,264,678 $7,950,907
Print Services Fund

The Print Services Fund provides ongoing operational support for the City’s printing needs.
Revenue Highlights
• Overall revenue decreased 3.16% from 2022.
• Printing revenue decreased 5.71% from 2022 due to fewer print jobs in 2023.
• Copier revenue remained stable only increasing 0.95% from 2022.
Expenditure Highlights
• Overall expenditures increased 47.73% over 2022.
• Printing expenditures increased $14,144 or 13.21% over 2022 primarily due to an increase in internal service fund charges to cover risk management, building and vehicle use.
• Copier expenses saw a marginal increase of 0.51% from 2022 due to slightly higher maintenance cost.
• Equipment expense of $53,949 reflects a large purchase to replace old equipment that was originally budgeted in 2022 but was delayed.
Buildings Fund
The Buildings Fund provides resources for maintaining major portions of facility infrastructure as replacement becomes necessary. The primary types of infrastructure are HVAC equipment, parking lots, roofs, and carpet. It is funded with contributions by all City departments based on their facility occupancy.
Revenue Highlights
• Revenues include savings related to the Ameresco Energy Performance contract being transferred to the Buildings fund to help offset the original construction costs. Other revenues include transfers from various City Departments. 2nd quarter 2023 has seen a 52.4% increase in revenue over the same period in 2022.
Expenditure Highlights
• Expenditures include a transfer to Capital Projects fund for the Indiana gate project, as well as Repair and Maintenance to HVAC at the Olde Wadsworth Shops, West Woods Golf Course duct modifications, and air units at the Indiana Shops.
25 INTERNAL SERVICE FUNDS
Overview
Building Fund 2023 Budget As of 06/30/23 As of 06/30/22 Beginning Fund Balance $348,000 $348,000 REVENUES Replacement Transfers $1,080,795 $475,405 $320,224 Other 25,000 13,142 386 Total Revenues $1,105,795 $488,547 $320,610 EXPENDITURES Personnel $71,610 $34,227 $28,679 Replacement 729,563 208,683 78,887 Equipment - -Total Expenditures $801,173 $242,910 $107,567 Income/(Loss) 304,622 245,637 213,043 Ending Fund Balance $652,622 $593,637
Overview
Print Services Fund 2023 Budget As of 06/30/23 As of 06/30/22 Beginning Fund Balance $346,000 $346,000 REVENUES Print Shop $200,000 $90,633 $96,126 Copiers 135,000 60,239 59,670 Total Revenues $335,000 $150,872 $155,795 EXPENDITURES Print Shop $271,421 $121,247 $107,103 Copiers 80,329 36,116 35,932 Equipment 11,500 53,949Total Expenditures $363,250 $211,312 $143,035 Income/(Loss) (28,250) (60,440) 12,761 Ending Fund Balance $317,750 $285,560
Overview:
On November 6, 2018 the citizens of Arvada approved Ballot Issue 3F to fund improvements to Ralston Road and West 72nd Avenue. Municipal bonds are commonly used by cities to fund capital improvement projects. In 2018, the City finished paying off a previous bond issue, freeing up $4.5 million in annual payments already accounted for in the City’s current budget. “Debt re-authorization” allows the money from the previous bond to be applied to a new bond whose funds will be used for these new capital improvement projects.

Ralston Road - Yukon to Garrison Bond Project
Description: Ralston Road is an arterial roadway and a major east-west corridor for Arvada’s transportation network, serving 23,000 vehicle trips each day. It provides connectivity to major north-south corridors including three State Highways. The Regional Transportation District (RTD) operates five bus lines using portions of Ralston Road. The Citizens Capital Improvement Plan Committee has twice ranked Ralston Road improvements as the number one transportation priority and recommended it for funding to the City Council. The project also addresses concerns expressed in recent Arvada Citizen Surveys. The 2014 Comprehensive Plan generated transportation models indicating that the congestion, operation, and safety of Ralston Road will deteriorate with the build-out of the City, and roadways will perform at the lowest levels of services
Progress:
Roadway:
• Contractor completed partial south side paving in April and shifted the traffic in May. During the Second quarter of 2023, the contractor completed a significant amount of work on the north side of Ralston Rd. The following activities were completed on the North side of Ralston between Garrison and west of Estes St. Soft soil excavation, stabilization, curb and gutter work, sidewalk pour, aggregate base course, geogrid placement, bottom two lifts of asphalt paving. Contractor also performed removal of existing asphalt pavement between Balsam and Yukon streets and prepared the road base. Contractor is also working on completing the improvements (parking lot pavement, grading work and etc.) in temporary construction easements between Garrison and Estes St.
Drainage:
• The contractor also completed a significant amount of storm sewer and water line work on the south side of Ralston Rd between Allison and Yukon streets, including manhole work, storm sewer pipe replacement, meter pit connections and fire hydrant work. Currently, the contractor is working on a storm sewer and water line tie-in work on the south side of Ralston at Balsam St intersection.
• One sanitary sewer service line at Estes St found to be in bad condition was repaired by Xcel third party contractor since they were found responsible for this damage.
Dry Utilities:
• Most of the dry utilities (Xcel electric, Comcast and Century link) work on the north side and part of the south side are done. Currently project team is coordinating Xcel gas line services conflicts associated with the construction activities between Balsam and Yukon St.
Wet Utilities:
• Contractor competed Meter pit connections and fire hydrants work at Yarrow St on south side of Ralston Rd.
Challenges:
• Contractor found additional gas line conflicts with the construction on the south side. The delay in the relocation from Xcel side is causing additional schedule challenges to the project completion date.
• This year additional rainy days in the spring also causing some issues to the project construction schedule.
• Keeping business access open without any disruption during the construction is also becoming a challenge on this project.
• In the past few months the contractor is constantly working on filling the potholes and re-striping the road as soon as possible. Through the City’s social media outlets, the project webpage, and direct contact with project team members, the City attempts to explain the challenges of the construction zone and upcoming work and any road closures. The project team recognizes the challenges with a construction zone and the City and Contractor teams are taking all reasonable steps to avoid as much inconvenience as possible.
• Contractor is also facing additional delays at Balsam St intersection for completing storm sewer and paving work due to gas line conflicts and additional rainy days in the season.
• Coordinating utility tie in work with Ralston gardens developer contractor before the top lift pavement goes on is also an additional challenge.
Next Steps:
• Contractor is working on completing the improvements in the temporary construction easement area on the north side parcels between Garrison to Estes St.
• Contractor is also focusing on finishing the grading, curb and gutter, road base preparation and sidewalk work between Carr St and Balsam on south side. Working on existing asphalt pavement removals, road base preparation, curb and gutter (flatwork), storm sewer and water line work from Balsam to Yukon St on south side of Ralston Rd.
• Continue coordination with third party utility providers to relocate/remove utility conflicts with roadway construction (Mainly Xcel Gas conflicts)
26
3F BOND PROJECTS
Ralston Road Budget Actual Remaining Design $1,809,992 $2,001,646 $(191,654) Right-of-Way 4,861,539 4,892,769 (31,230) Construction 10,540,410 8,925,183 1,615,227 Miscellaneous 671,059 403,580 267,479 Total Project $17,883,000 $16,223,179 $1,659,821 Ralston
Road 72nd Avenue
W. 72nd Avenue Bond Project
Description: W. 72nd Avenue is an arterial parkway and a major east-west corridor for Arvada’s transportation network, serving 21,000 vehicle trips each day. It provides connectivity to major north-south corridors including three State Highways. The regional corridor not only serves all of Arvada, it provides access to Westminster and Golden/Jefferson County. The Citizens Capital Improvement Plan Committee twice ranked improvements to W. 72nd Avenue as a high priority. The project also meets concerns expressed in recent Arvada Citizen Surveys. The 2014 Comprehensive Plan generated transportation models indicating the congestion, operations, and safety of W. 72nd Avenue will deteriorate with the build-out of the City and roadways will perform at the lowest levels of service.
Progress:
• Construction Package 1 - CP-1 (tree removal, utility relocation for the entire corridor, and new utilities). Xcel, Comcast, and Lumen are working to relocate utilities in the corridor. SEMA has met their contract deadline and is complete with CP-1.
• Construction Package 2 - CP-2 (Swadley to Oak). Work includes utilities and full roadway reconstruction. 100% Plans signed/stamped were received in February 2022. CP-2 began in March 2022. Currently, CP2 is on schedule to be completed in Feb 2024. Some delays have been experienced due to dry utility companies’ failure to relocate their facilities; however they have not impacted the critical schedule. Weather delays during an unusual spring and summer have slowed progress but CP-2 is still on schedule. CP-2 is $22.6 million.
• Construction Package 3 - CP-3 (Oak to Kipling, including the UPRR underpass) has five components: 1) bridge structure; 2) railroad shoofly; 3) temporary vehicular bypass; 4) roadway design plans; and 5) Construction and Maintenance Agreement (C & M Agreement), which are at varying stages of review by UPRR (Union Pacific Railroad) and the City. UPRR reviews have been occurring outside the expected timelines. 60% bridge plans have been returned with comments from UPRR in April 2023. The team is working on the next steps to achieve approval from UPRR. Anticipated Notice to Proceed is Q2 of 2024.
• Project scheduling will remain fluid until there is a better understanding of the UPRR coordination and response time. Construction Package 2 underway. UPRR reviews and timelines continue to be unpredictable. The length of the UPRR review process has now created a gap between the completion of CP-2 and the expected start of CP-3.
Project Challenges:
• For the underpass excavation component of CP-3, the project team is developing a plan to mitigate underpass excavation and dewatering issues and possible environmental issues. Options include discharging groundwater to the public sanitary sewer system and treating for heavy metals using a Baker Truck removal system, thus allowing discharge into the storm sewer system. A possible test hole is being considered at a City-owned property at the 72nd and UPRR intersection to better understand the dewatering method needed to waterproof the underpass excavation limits.
• Sonheim Underground Stream - The project team is assessing how the underpass may cut off underground stream flow to several properties on the south side of 72nd. A french drain is being proposed to recharge the water table in that location. Assessments are ongoing. Construction of this drain has begun in the CP2 portion of the project.
• UPRR has returned 60% bridge plans with comments during April 2023. Remaining and new comments are currently being addressed. Meanwhile the City is looking for other approaches to get more timely and effective responses from the UPRR in order to get the 60% plan finalized and move on to the next phase.
• The project team continues to work with dry utility contractors to get their infrastructure relocated and to keep our contractor, SEMA, moving on the roadway and utility portion of the project.
• Record rainfalls from May-July have delayed construction work multiple days. This has not yet affected the CP2 schedule but has reduced days of project float Right of Way (ROW):
• 71 of the 72 parcels to be acquired have been closed. The final parcel is expected to close soon.
• Temporary easements were extended for 20 parcels using the 6-month option in the agreements. Work is complete in the remaining temporary easements
Other Challenges:
• The Arvada’s citizens’ interest remains high in the construction progress. The City’s team of representatives continues to respond to all inquiries in a professional and timely fashion.

• Comments from our citizens range from temporary/permanent fence, traffic, signals, walls, potholes, stairs, and safety.
• Many of the homeowners are pleased with the work done to their property such as driveway replacements.
• The project team has made a significant effort to keep all users safe during construction.
• We have been coordinating with both schools in the area to understand typical drop-off and pick-up patterns. Work requiring road closures has repeatedly been scheduled during school vacations in order to minimize impacts to school traffic.
• Periodically we have project team members at the major intersections to remind students/pedestrians to be safe while waiting to cross the street.
• We have lowered the speed limit through the construction zone to 25 mph.
• We have asked the Arvada Police Department to periodically enforce through the construction zone. We have seen the police department doing just that at different times over the last few months.
• We have deployed digital speed signs to inform drivers of their speed and hopefully make them aware that they should slow down.
• We have circulated pedestrian maps to show the public which sidewalks are open through the construction zone.
Next Steps:
• Continue working with the UPRR to have them review plans in a timely manner and to get the on-site visit review complete. The City to begin negotiation of the C & M (Construction and Maintenance) Agreement in late 2023.
• Continue development of a construction organizational chart to allow the City team to forecast construction staffing needs for the different construction packages. Inspections will be a combination of City staff and Owner’s Rep staff.
• Continue coordination efforts with stakeholders, including the UPRR, Xcel Energy, Jefferson County School District, and Lincoln Academy, to allow a smooth transition from design to construction. Item to note: The project team has worked with zero injuries and zero lost work days!
27 3F BOND PROJECTS 72nd Avenue Budget Actual Remaining Design $2,915,584 $4,834,358 $(1,918,774) Right-of-Way 5,550,000 5,686,650 (136,650) Professional Services 2,695,226 2,625,109 70,117 Construction 53,339,190 15,936,476 37,402,714 Total Project $64,500,000 $29,082,592 $35,417,408
Investment Portfolio Objectives
The City maintains a conservative investment policy with the primary objectives of safety, liquidity and yield. Consistent with this policy, the portfolio of securities is invested in U.S. Treasuries, U.S. Agencies; local government investment pools (LGIPs), commercial paper, and corporate debt subject to rating restrictions and concentration limits which are outlined in the City’s investment policy. The City-managed investment portfolio is administered to provide sufficient liquidity to meet all reasonably anticipated operating cash needs without selling securities prior to maturity. The portfolio controlled by PFM is actively managed which means that investments may be sold prior to maturity and reinvested in order to achieve the desired duration, yield or diversification of the portfolio.

The City’s investment policy requires a minimum A- rating from two credit rating agencies. The Credit Quality graph is based on the S&P rating only, the other two agencies are Moody’s and Fitch .
Economic Outook
The second quarter of 2023 saw more Fed rate hikes, ending at 5.25%. While the U.S. banking system is resilient and sound, the tightening of credit conditions for consumers and businesses continues to impact inflation, hiring, and economic activities. The Consumer Price Index (CPI) remains elevated and job creation has slowed. Treasury yields pushed higher, while the inversion of the yield curve reached the greatest disparity since 1981.
The City’s total investment portfolio increased to $307 million. The portfolio yields continue to increase and interest earnings for the quarter totaled $1,720,931. The total unrealized loss is $15.6 million, with no loss realized because the City holds its investments until maturity at par.

PORTFOLIO CHANGES
28 CITY OF ARVADA INVESTMENT REPORT
Par Value as of 6/30/23 Par Value as of 6/30/22 Difference CITY-MANAGED PORTFOLIO MM/Savings/ Cash $6,014,640 $17,559,772 $(11,545,132) LGIP 23,992,250 32,615,214 (8,622,964) Time CD - 3,204,308 (3,204,308) Corporate 37,068,000 23,669,000 13,399,000 Municipal 18,850,000 21,850,000 (3,000,000) US Agency 144,036,000 115,000,000 29,036,000 US Treasury 22,000,000 20,000,000 2,000,000 Subtotal - City $251,960,890 $233,898,294 $18,062,596 PFM-MANAGED PORTFOLIO Negotiable CD $ - $ - $Corporate 17,495,000 11,670,000 5,825,000 Municipal 3,480,000 3,480,000US Agency 7,305,000 19,245,000 (11,940,000) US Treasury 27,420,000 20,460,000 6,960,000 Subtotal - PFM $55,700,000 $54,855,000 $845,000 CONSOLIDATED PORTFOLIO MM/Savings/ Cash $6,014,640 $17,559,772 $(11,545,132) LGIP 23,992,250 32,615,214 (8,622,964) Time CD - 3,204,308 (3,204,308) Negotiable CD - -Corporate 54,563,000 35,339,000 19,224,000 Municipal 22,330,000 25,330,000 (3,000,000) US Agency 151,341,000 134,245,000 17,096,000 US Treasury 49,420,000 40,460,000 8,960,000 Total - Combined $307,660,890 $288,753,294 $18,907,596 CONSOLIDATED MATURITY DISTRIBUTION CONSOLIDATED PORTFOLIO ALLOCATION MM/Savings/Cash 2.0% LGIP 7.8% Corporate 17.7% Municipal 7.3% US Agency 49.2% US Treasury 16.1% 0.0% 5.0% 10.0% 15.0% 20.0% 25.0% 30.0% 0-.25 .25-1 1-2 2-3 3-4 4-5 12.1% 7.8% 23.6% 26.6% 18.5% 11.4% Maturity (years)
PORTFOLIO

CREDIT QUALITY (S&P RATING)
Investment Management Focus - 2023
• The yields in the LGIP pools continue to rise along with Federal interest rates. The City uses liquidity from LGIPs to invest excess cash.
• Portfolios will be extended methodically to bring yields closer to benchmarks as the yield curve remains extremely inverted. Non-Treasury sectors such as agencies, municipals and supra-nationals may help with duration as their yields remain tight. Mortgage-backed securities continue to perform strongly and the City will maintain exposure while adding call protection options and bullets.
• PFM actively trades in order to reinvest the proceeds into a more attractive investment with higher potential future earnings. Asset-backed security spreads have tightened and they will continue to purchase in the new issue and secondary market as those spreads increase. Corporate spreads narrowed while the sector’s incremental income remains attractive due to the wide difference in yields and industrials.
29 CITY OF ARVADA INVESTMENT REPORT ACCOUNT SUMMARY
CHARACTERISTICS 6/30/2023 6/30/2022 Difference City Interest Earnings $2,869,082 $1,180,919 $1,688,163 PFM Interest Earnings 415,148 382,380 32,768 Total Interest Earned $3,284,230 $1,563,299 $1,720,931 YTD City Portfolio Yield 2.40% 1.14% +126 bps YTD PFM Portfolio Yield 1.95% 1.16% +79 bps YTD Benchmark 3.70% 0.73% +267 bps
PERFORMANCE City PFM Duration to Maturity (yrs) 2.06 2.43 Yield to Maturity at Cost 2.340% 2.120% Yield to Maturity at Market 4.970% 4.810% City PFM Total Par Value $251,960,890 $55,700,000 $307,660,890 Book Value 251,629,335 55,357,134 306,986,469 Market Value 238,867,297 52,475,957 291,343,254 Unrealized Gain /(Loss) $(12,762,038) $(2,881,177) $(15,643,215)
PORTFOLIO
AAA category 10.3% AA category, 78.9% A category, 9.9% BBB+ category, 1.0%
Overview:
The City is in the proecess of implementing AmpliFund, a grants management software. Future financial updates will include additional information.


30
GRANT INFORMATION
Grants ManaGeMent 2023 PrOsPeC tInG $1,911,672 PenDInG Grant reQUests (2023) $5,852,143 aWarDeD (2023) $2,056,498
Safe Community
6/2025 THE ONE SMALL STEP (OSS) SPECIALTY COURT DOCKET WILL BE SUCCESSFULLY IMPLEMENTED TO IMPROVE OUTCOMES FOR PEOPLE EXPERIENCING HOMELESSNESS
BY
By 12/2023 reduce recidivism among One Small Step defendants by 25% and identify where clients disengage in the process to enhance the benefits of the program
By 6/2023 the specialty court docket will be in compliance with best practices for the homeless population
By 6/2025 60% of One Small Step defendants are enrolled in a treatment program
Infrastructure
BY 12/23, CONTINUE TO IMPLEMENT A STREET MAINTENANCE MASTER PLAN AND DEVELOP AN IMPLEMENTATION PLAN TO ADDRESS AND PRIORITIZE FINDINGS.
Annually prepare an annual street maintenance report for City Council and the community
By 1/23 provide City Council with a briefing of the Streets Maintenance Master Plan
By 12/23, develop an implementation plan to address and prioritize master plan findings
Community and Economic Development
BY 12/24, IMPLEMENT A TOOL KIT OF HOUSING MIX AND STYLE PLANS TO IMPROVE ACCESS TO QUALITY HOUSING AFFORDABLE FOR A BROAD RANGE OF INCOME LEVELS
By 12/20, complete a list of current projects under development or planning
By 12/20, complete an affordable housing assessment including incentive options and the area south of Arvada Cemetery
By 12/20, create a regional strategy to address homelessness
By 6/21, evaluate the Human Services Advisory Committee’s process for recommending funding
By 12/22, create a Housing Advisory Committee to support the City in current/future initiatives while also educating the broader community on issues of affordable housing
By 12/24, Utilize housing committee to create a housing strategy plan and have plan approved by City Council
Completed
Completed
Completed
Completed
Completed
31 WE DREAM BIG AND DELIVER
10/1/22-12/29/23
10/1/22-10/31/22
10/1/22-6/27/25
4/1/19-12/31/25
Completed
1/2/23-1/1/24
61/23-12/31/24
Vibrant Community and Neighborhoods
BY
12/25, DEVELOP A FINANCIAL RESILIENCE PLAN
TO ENSURE A SUSTAINABLE, RESILIENT AND BEAUTIFUL COMMUNITY OF PARKS, TRAILS, OPEN SPACE, OUTDOOR RECREATION FACILITIES AND MEDIANS IN ALIGNMENT WITH OUR DIVERSE, CHANGING AND GROWING COMMUNITY
By 12/24 replace Meyers Pool with a new 50 meter natatorium 6/1/19-12/30/24
By 12/24, complete a sustainable Community Events Plan 6/1/19-12/31/24
By 12/25, adopt a strategic Land Pursuit and Acquisition Plan including opportunities for grants and funding partnerships 6/1/19-12/31/25
By 12/22, complete an inventory of all city medians with recommendations for improvement
By 12/23, complete Arts and Culture Master Plan workshop(s) to determine related actions to implement the plan
By 12/23, Complete Level of Service studies for Golf, Restaurants, Parks, Medians, Arts and Culture, Festivals, and Majestic View Nature Center
By 12/23, update the TLC program to include a communication plan and key lifecycle metrics
By 12/25, complete updates to the Lake Arbor Golf Master Plan
By 8/22, provide strategic recommendations for the Majestic View Nature Center and future city-wide interpretive programs
Organizational and Service Effectiveness
BY 12/25 IMPLEMENT A REGIONAL HOMELESSNESS STRATEGY
Completed
Completed
Completed
9/1/22-12/31/23
9/1/22-12/31/25
Completed
By 12/23 enter into a collaborative working and governance structure MOU with the metro cities within and including Jefferson County 9/1/21-10/31/22
By 12/23, implement or begin implementation of short-term goals as stated in the April 9, 2023 homelessness City Council presentation 9/1/21-12/29/23
By 12/24, implement, or begin implementation of intermediate-term goals as stated in the April 9, 2023 homelessness City Council presentation 9/1/21-12/31/24
By 5/2023, enter into fully authorized IGAs with Adams County for street outreach services and collaborative partnership with all Adams County jurisdictions
By 5/2023, hire a homelessness project manager
By 8/2023, implement a homelessness study and PESTEL analysis which includes each jurisdiction in the collaborative MOU (reference M4A)
9/1/21-5/31/23
Completed
32 WE DREAM BIG AND DELIVER
6/1/23-8/31/23