COLORADO

Proposed Revised Biennial Operating and Capital Budget
2023-2024
Intentionally left blank
2023-2024
Proposed Revised Biennial Operating and Capital Budget
Intentionally left blank
Cover Design: Jenna Belec, Finance Program Coordinator
Special Thanks To: Bryan Archer, Director of Finance
Debra Nielson, Deputy Director of Finance
Vesta Kruk, Controller
Chris Kelly, Senior Budget Analyst
Carolyn Ewing, Budget Analyst
Rocky Sheppard, Budget Analyst
Jenna Belec, Finance Program Coordinator
Steve Milke, Bun Heng, Print Shop
2023-2024 Proposed Revised Biennial Operating and Capital Budget 5 Table of Contents Overview City Staff . . . . . . . . . . . . . . . . . . . . . . . . . . . . . . . . . . . . . . . . . . . . . . . . . . . . . . . . . . . . . . . . . . . . . 6 Organization Chart 7 GFOA Distinguished Budget Presentation Award 8 Budget Transmittal Letter . . . . . . . . . . . . . . . . . . . . . . . . . . . . . . . . . . . . . . . . . . . . . . . . . . . . . 9-19 Council Strategic Plan . . . . . . . . . . . . . . . . . . . . . . . . . . . . . . . . . . . . . . . . . . . . . . . . . . . . . . . 21-51 Community Profile . . . . . . . . . . . . . . . . . . . . . . . . . . . . . . . . . . . . . . . . . . . . . . . . . . . . . . . . . . 53-54 Legal Requirements and Budget Process 55-62 Introduction 63-67 Revenue and Expenditure Summary 69-104 Ten-Year Assumptions and Models . . . . . . . . . . . . . . . . . . . . . . . . . . . . . . . . . . . . . . . . . . . . 105-133 Work Systems Section Community and Economic Development . . . . . . . . . . . . . . . . . . . . . . . . . . . . . . . . . . . . . . 135-140 Infrastructure 141-149 Organizational and Service Effectivness 151-159 Safe Community . . . . . . . . . . . . . . . . . . . . . . . . . . . . . . . . . . . . . . . . . . . . . . . . . . . . . . . . . 161-167 Vibrant Community and Neighborhoods . . . . . . . . . . . . . . . . . . . . . . . . . . . . . . . . . . . . . . . 169-173 Capital Improvement Projects . . . . . . . . . . . . . . . . . . . . . . . . . . . . . . . . . . . . . . . . . . . . . . . . 175-285 Debt Obligations 287-296 Additional Information 2023 Pay Plan Position and Schedules 297-321 City Council Policy . . . . . . . . . . . . . . . . . . . . . . . . . . . . . . . . . . . . . . . . . . . . . . . . . . . . . . . . . 322-325 Glossary of Terms . . . . . . . . . . . . . . . . . . . . . . . . . . . . . . . . . . . . . . . . . . . . . . . . . . . . . . . . . . 326-331
Mayor and City Council
2023-2024 Proposed Revised Biennial Operating and Capital Budget
Click here for more information about City Council
CITY MANAGER AND KEY STAFF
City Manager
Deputy City Manager
Deputy City Manager
Municipal Judge
City Attorney
Director of Community and Economic Development (Acting)
Director of Public Works
Director of Utilities
Director of Finance
Director of Human Resources
Chief Information Officer
City Clerk
Chief of Police
Director of Vibrant Communities and Neighborhoods

Lorie Gillis
Linda Haley
Don Wick
Kathryn Kurtz
Rachel Morris
Rob Smetana
Jacqueline Rhoades
Sharon Israel
Bryan Archer
Gabriella Bommer
Craig Poley
Kristen Rush
Ed Brady
Enessa Janes
6
David Jones Councilmember District 4 (Term expires 2023)
Bob Fifer Councilmember At-Large (Term expires 2023)
Marc Williams Mayor (Term expires 2023)
Lisa Smith Councilmember At-Large (Term expires 2025)
Randy Moorman Councilmember District 1 (Term expires 2025)
Lauren Simpson Councilmember District 2 (Term expires 2023)
John Marriott Councilmember District 3 (Term expires 2025)
2023-2024 Proposed Revised
Biennial Operating and Capital Budget
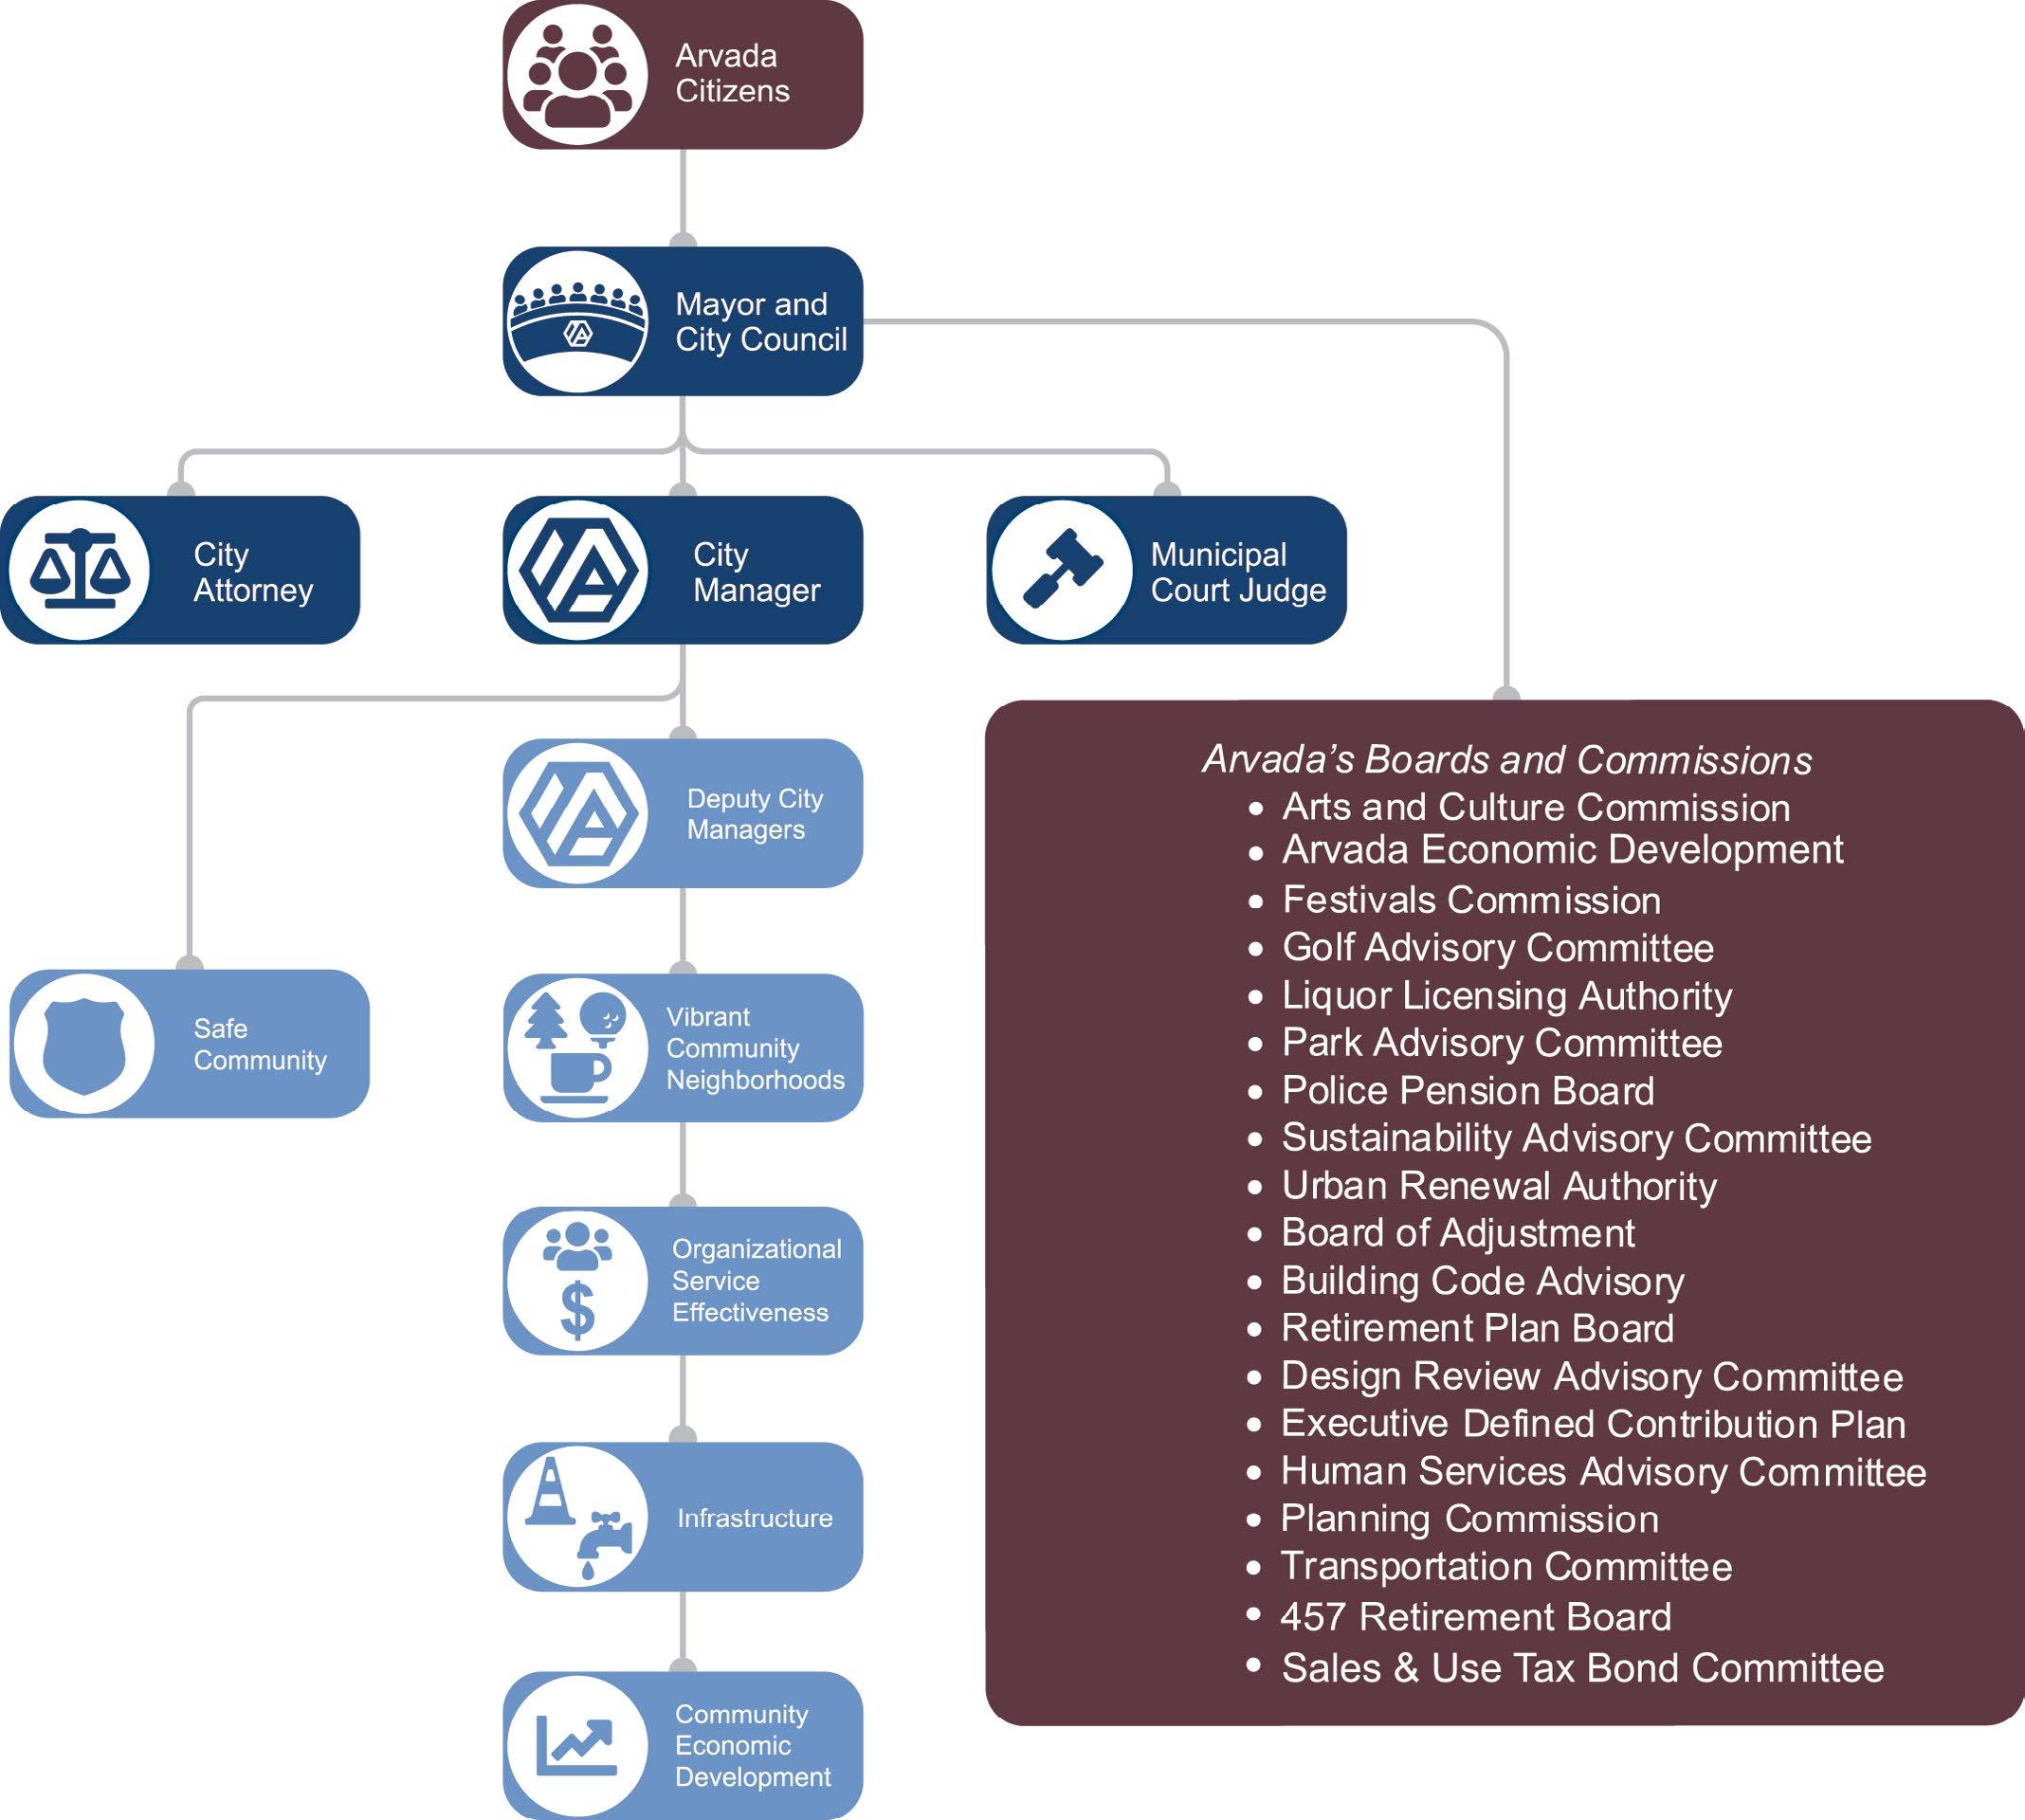
ORGANIZATION CHART
7
2023-2024 Proposed Revised
Biennial Operating and Capital Budget
GOVERNMENT
FINANCE OFFICERS ASSOCIATION
Distinguished Budget Presentation Award
PRESENTED TO
City of Arvada Colorado
For the Biennium Beginning January 01, 2023
Executive Director

The Government Finance Officers Association of the United States and Canada (GFOA) presented a Distinguished Budget Presentation Award to the City of Arvada for its Biennial Budget for the fiscal years 20212022. In order to receive this award, a governmental unit must publish a budget document that meets program criteria as a policy document, as an operations guide, as a financial plan, and as a communications device.
The City of Arvada has received this Distinguished Budget Presentation Award for the past 27 years!
8
2023-2024 Proposed Revised Biennial Operating and Capital Budget
Members of City Council - August 31, 2023
August 31, 2023
Members of City Council
City of Arvada
8101 Ralston Road
Arvada, Colorado 80002
Arvada City Council and the Arvada Community,
Transmitted with this letter is the City of Arvada’s Proposed Revised 2023-2024 Biennial Operating and Capital Budget As required by City Council Policy No 300 4, Arvada Budget and Fiscal Policy, our team must develop a Biennial Operating and Capital Budget which is to be presented in alignment with the City Council Strategic Plan (CCSP) for consideration by the City Council Each Biennial Operating and Capital Budget is presented in late August/early September and Council approval must be completed per state law by October 31 prior to the calendar year for which the budget will be implemented .
Council approval authorizes expenditure authority for only one year . Our team must develop and present a revised budget for the second year, which the Council will consider and approve in the same manner, in order to authorize expenditures for the second year of the Biennial Operating and Capital Budget .
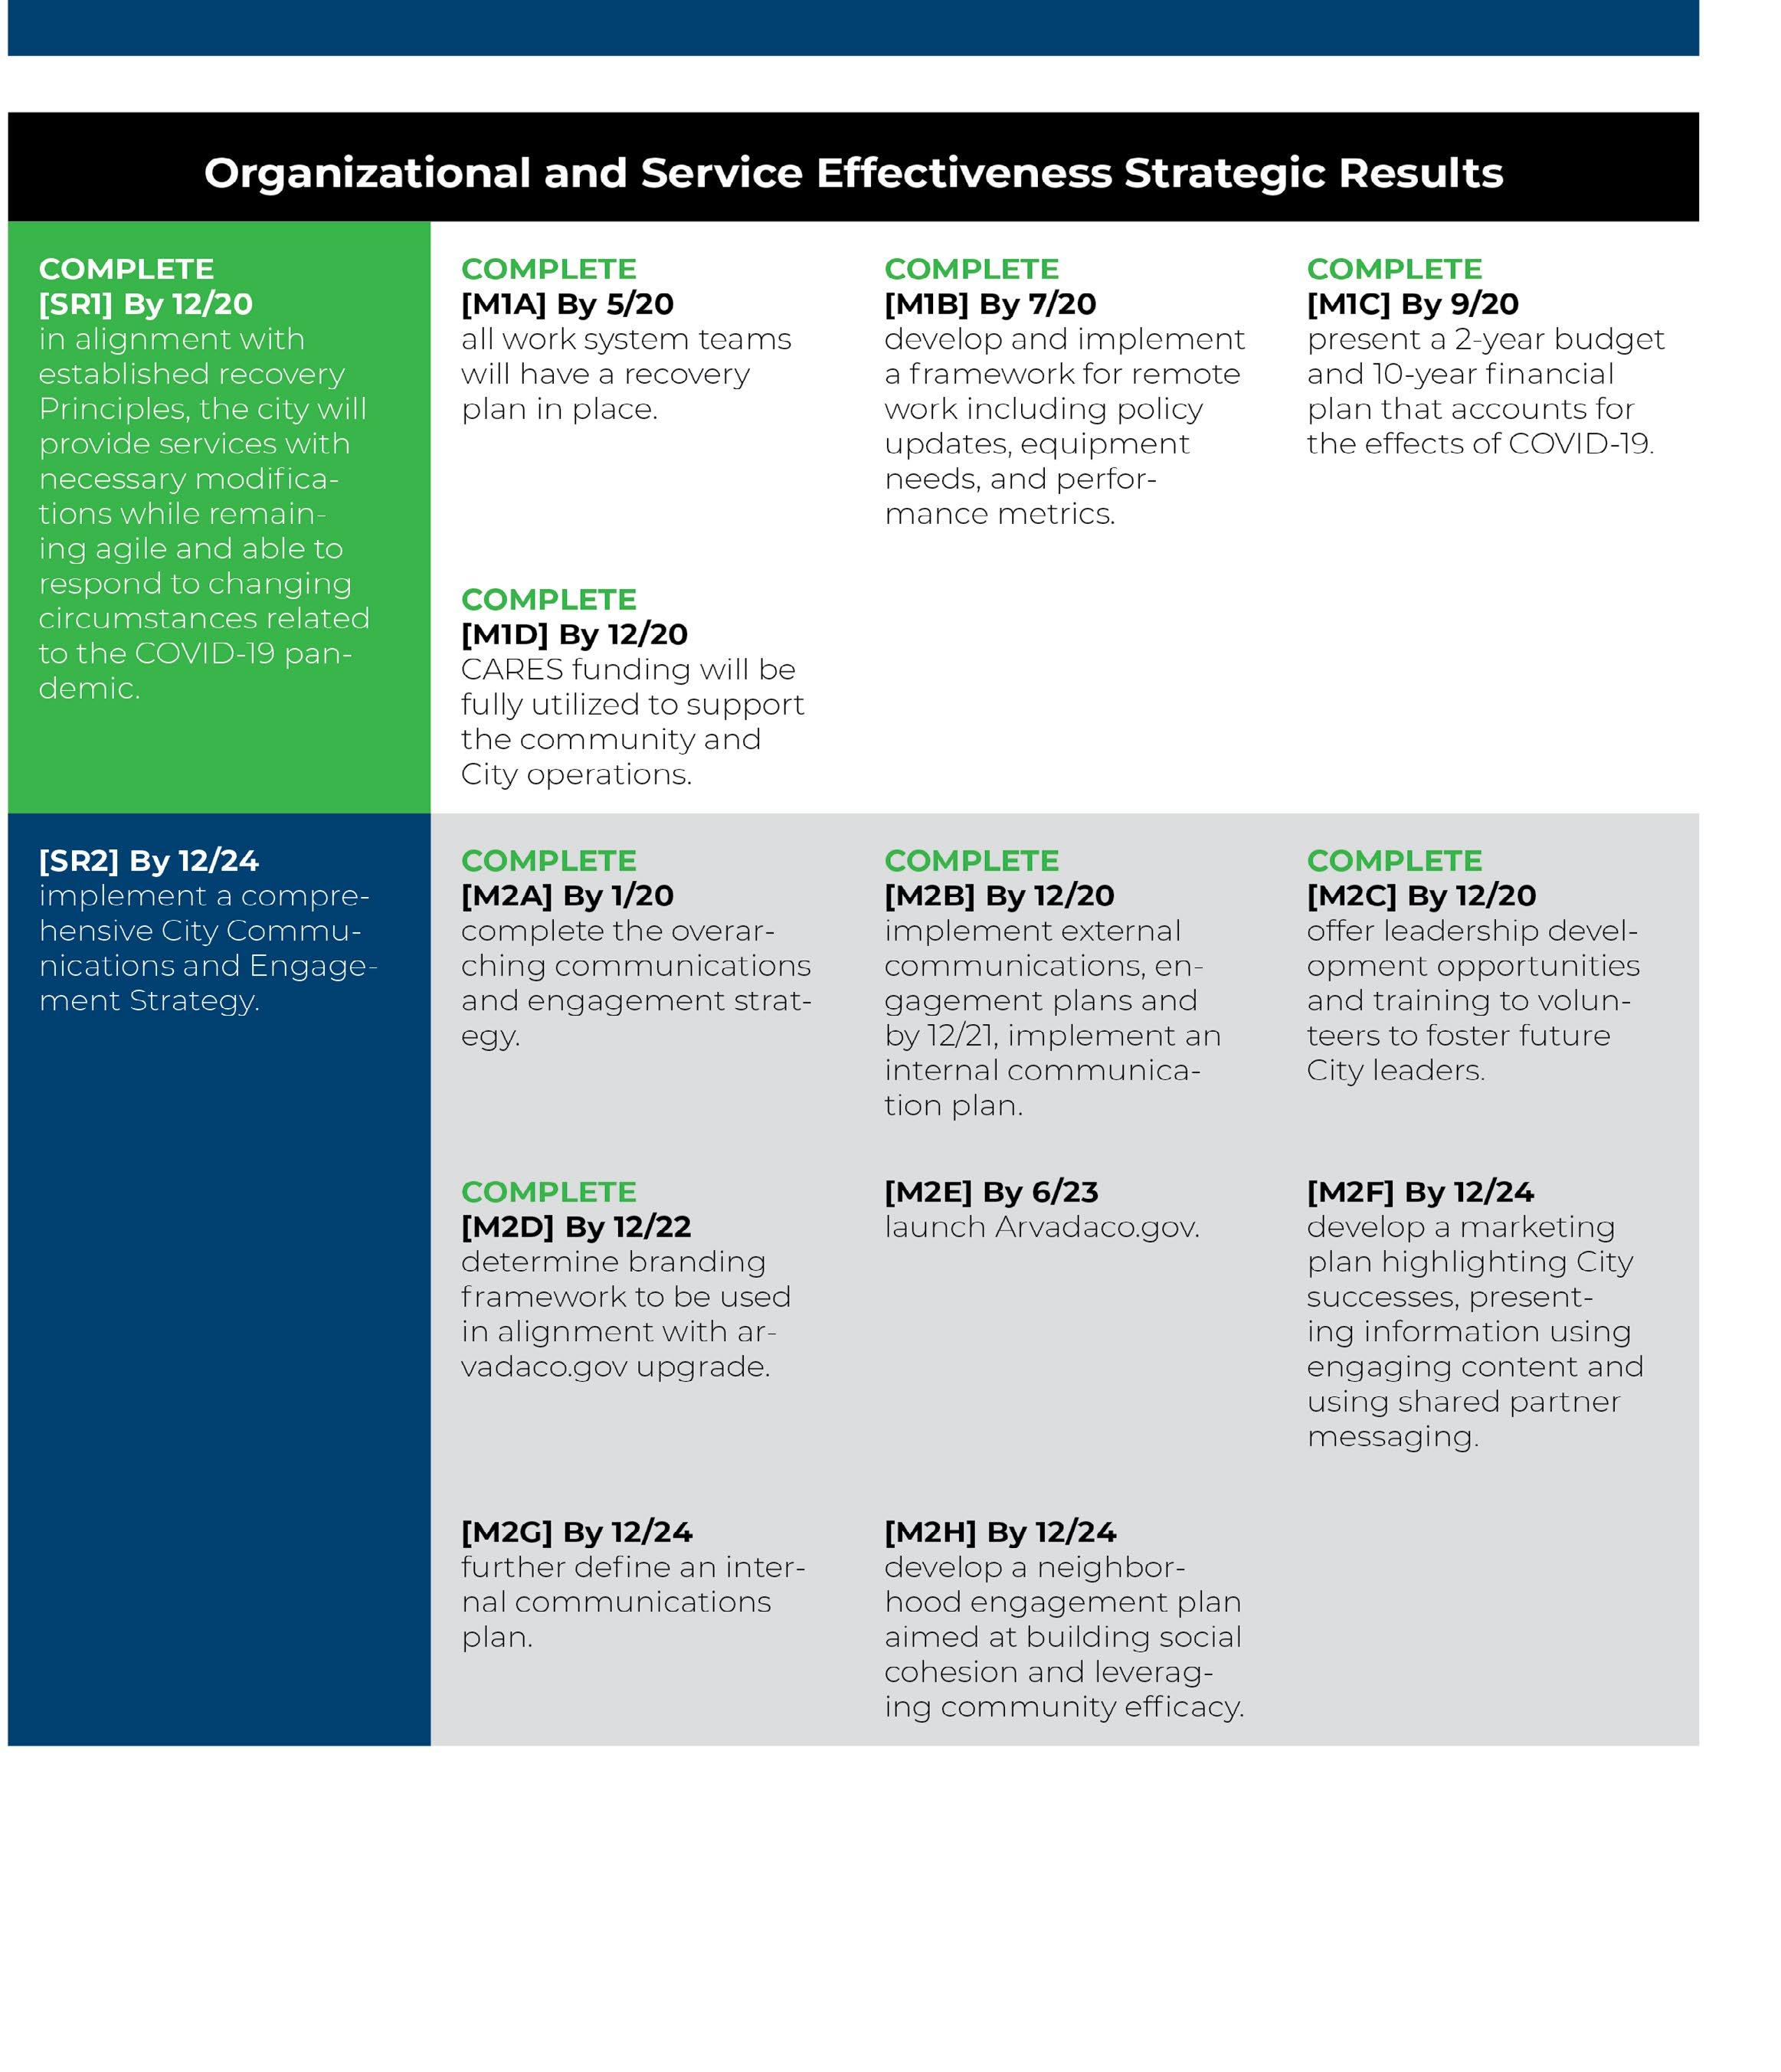
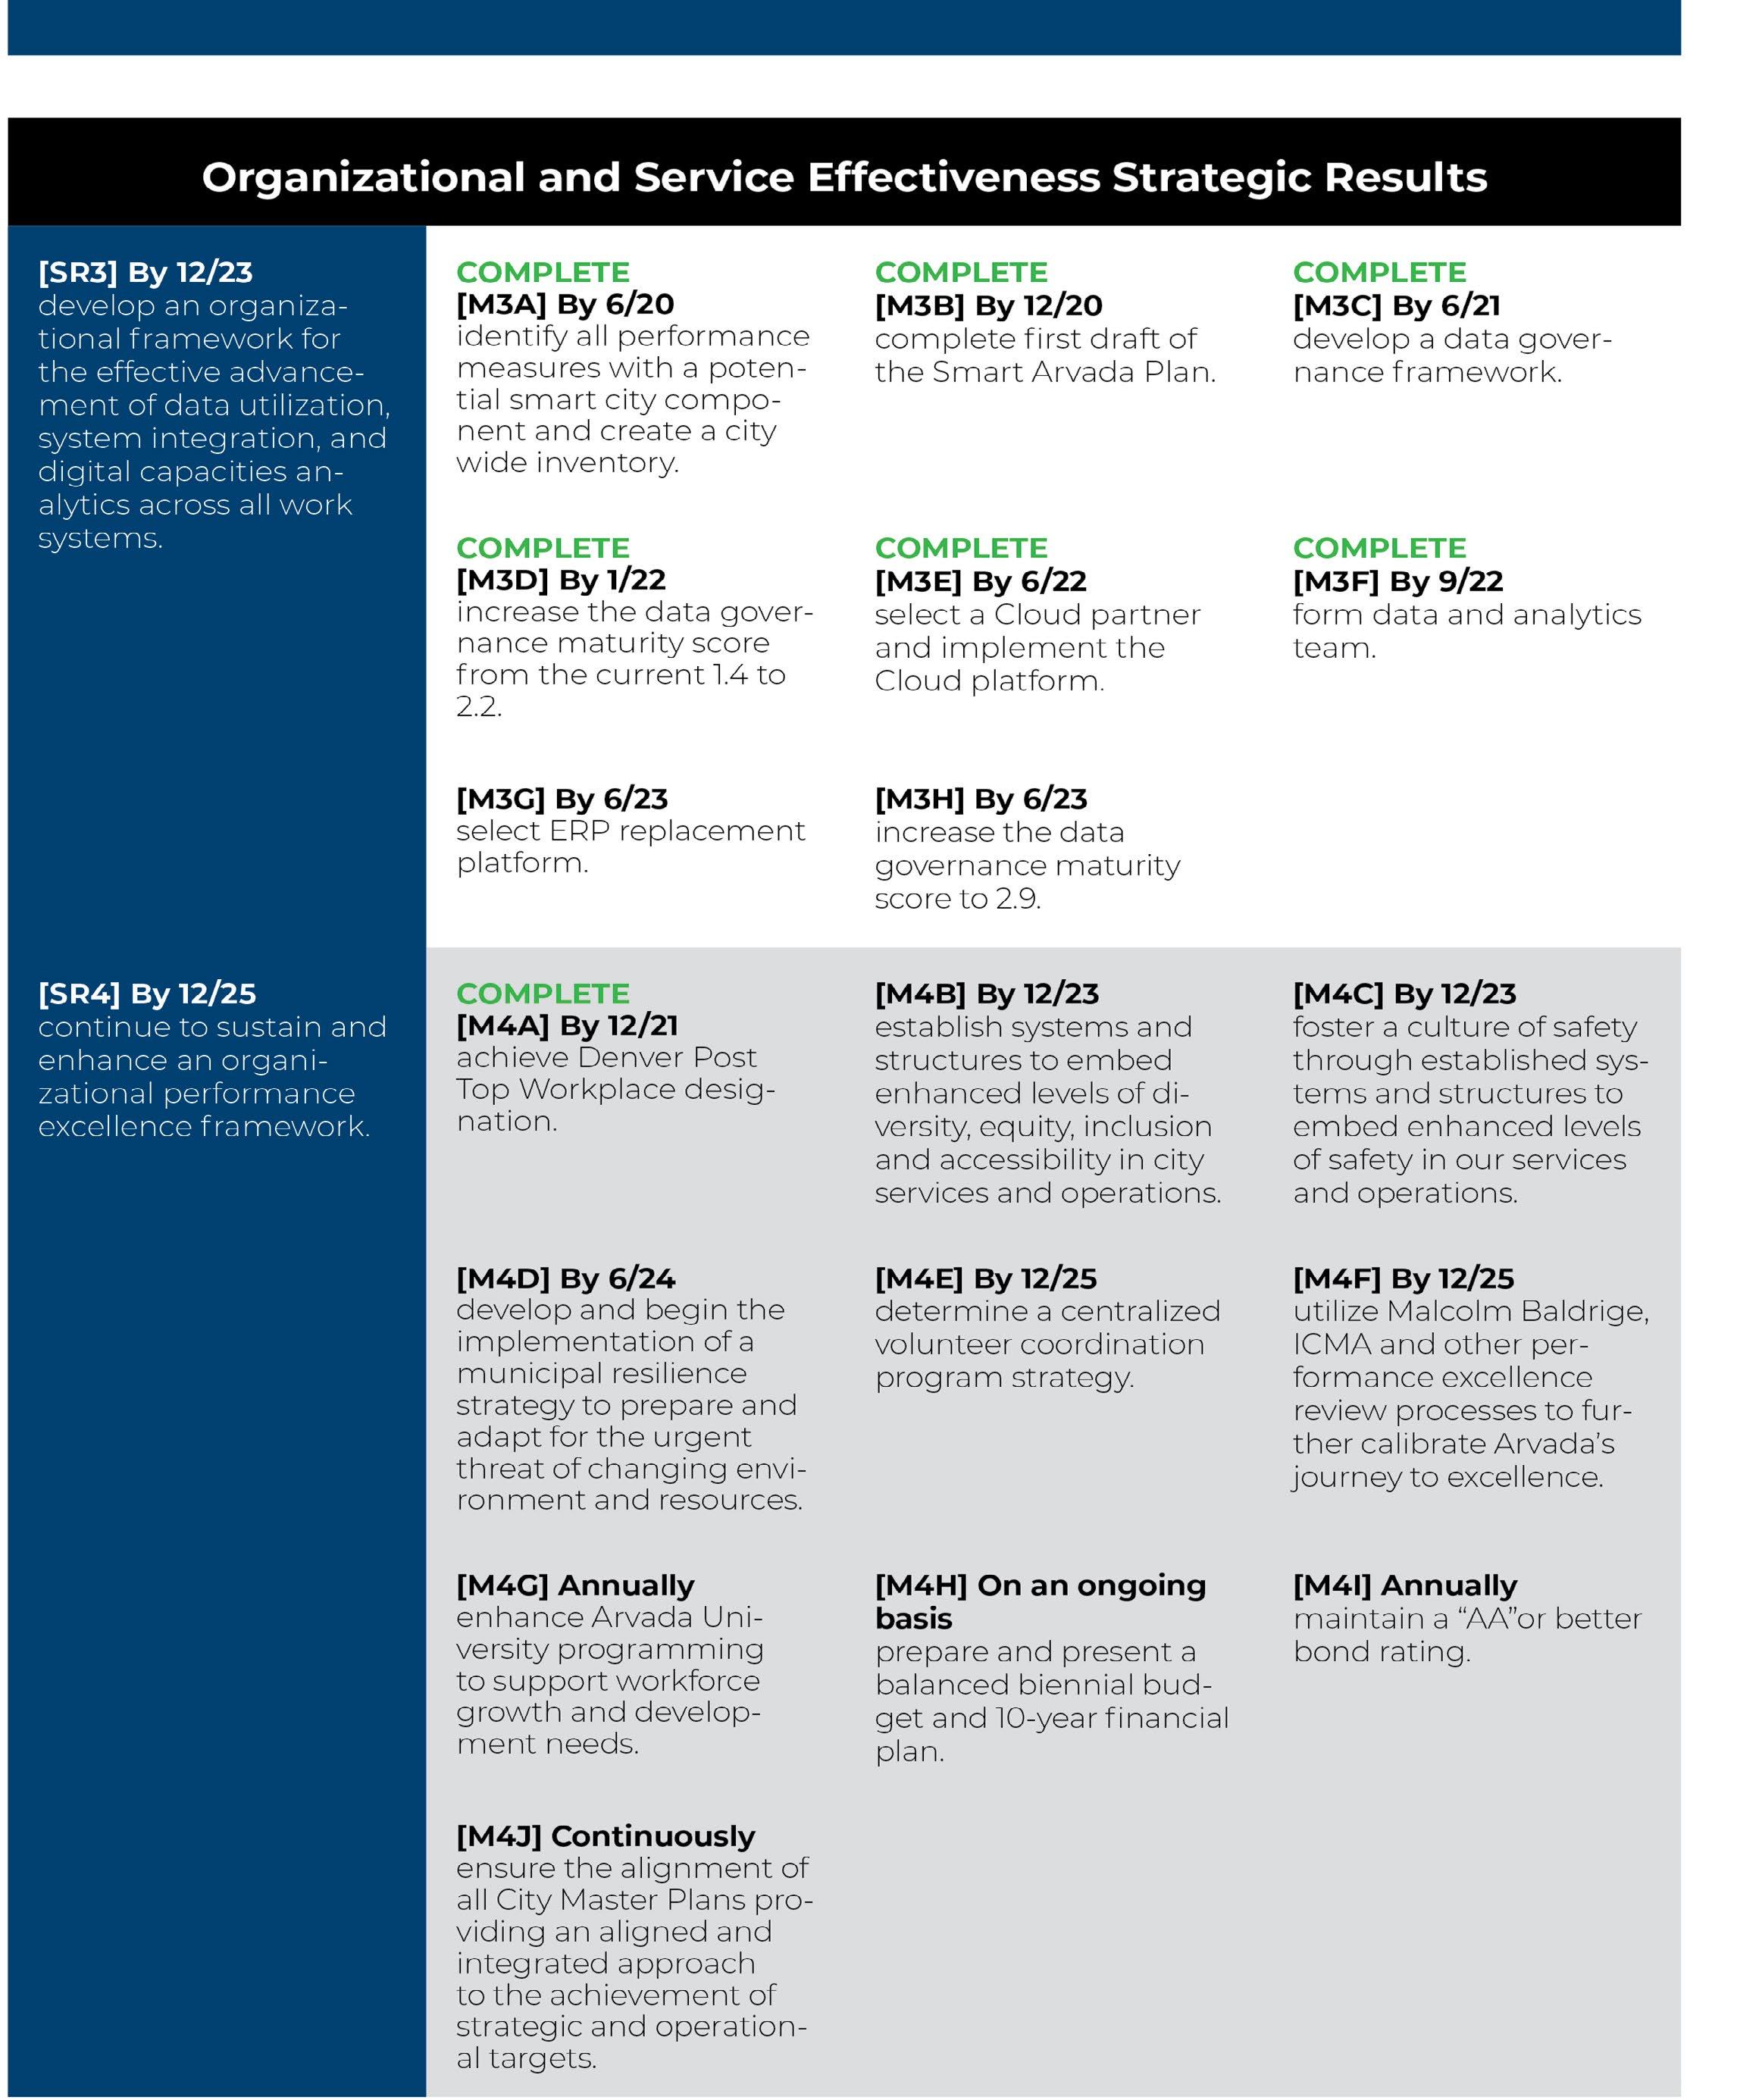
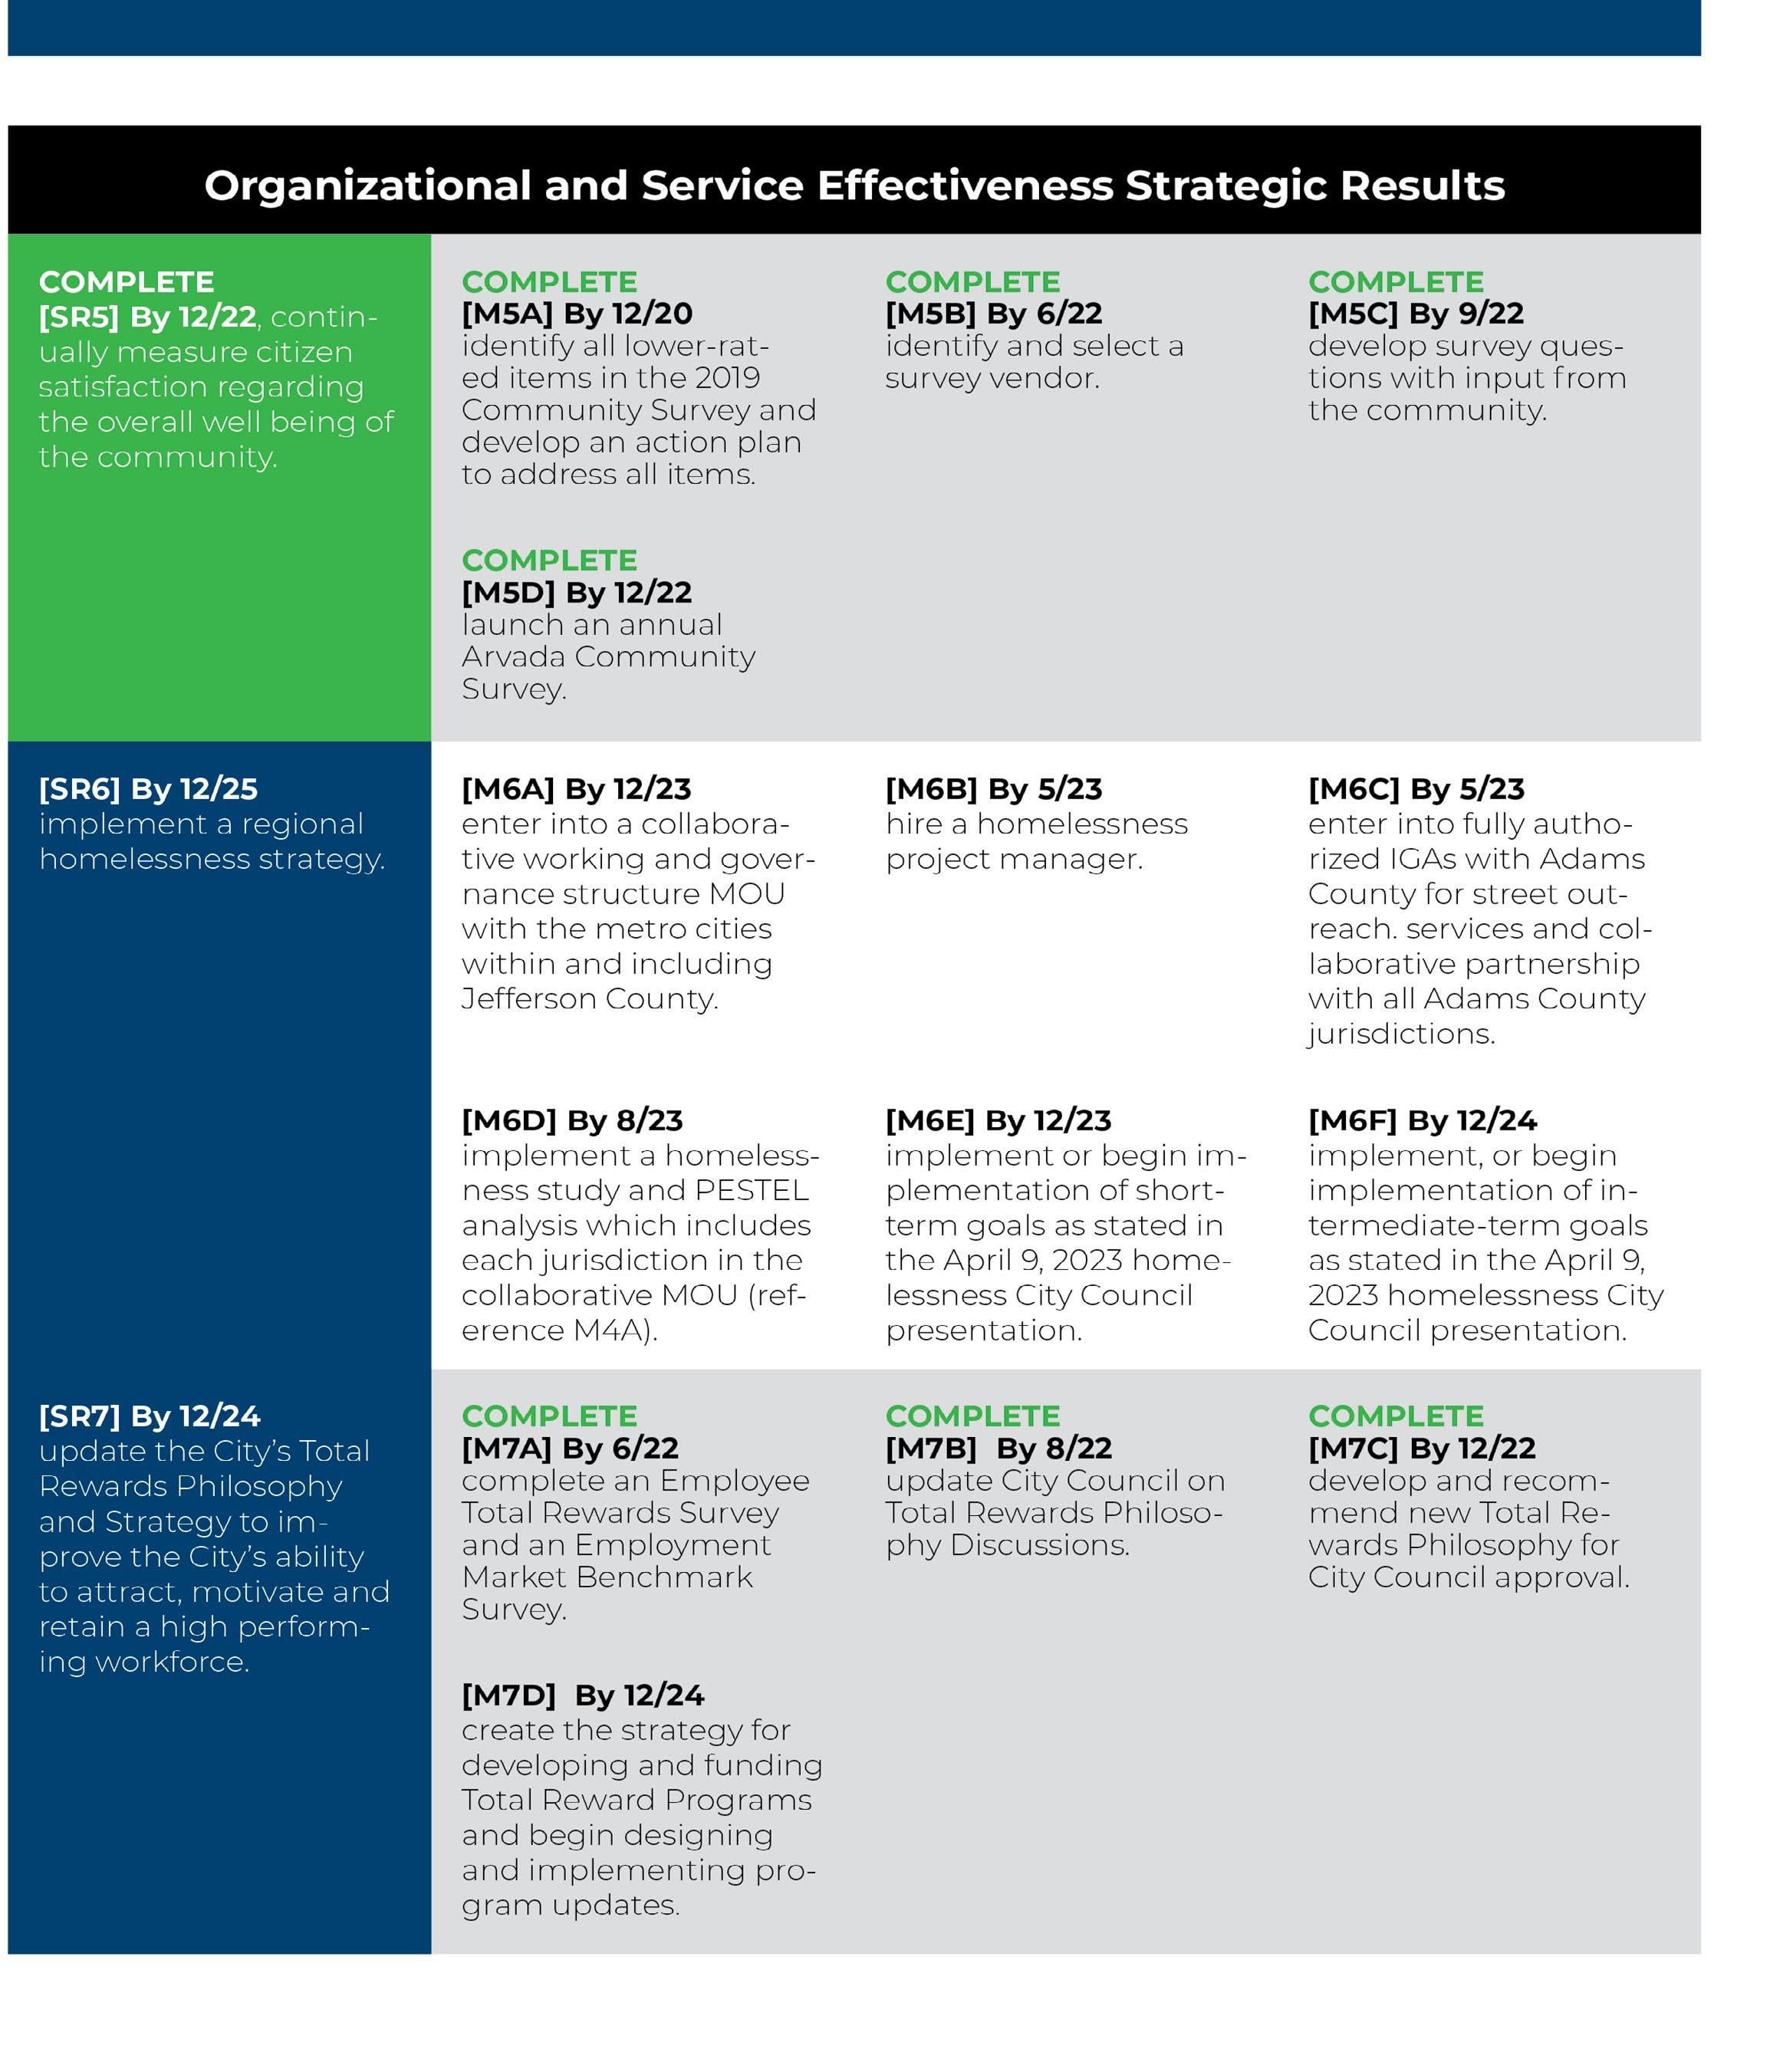
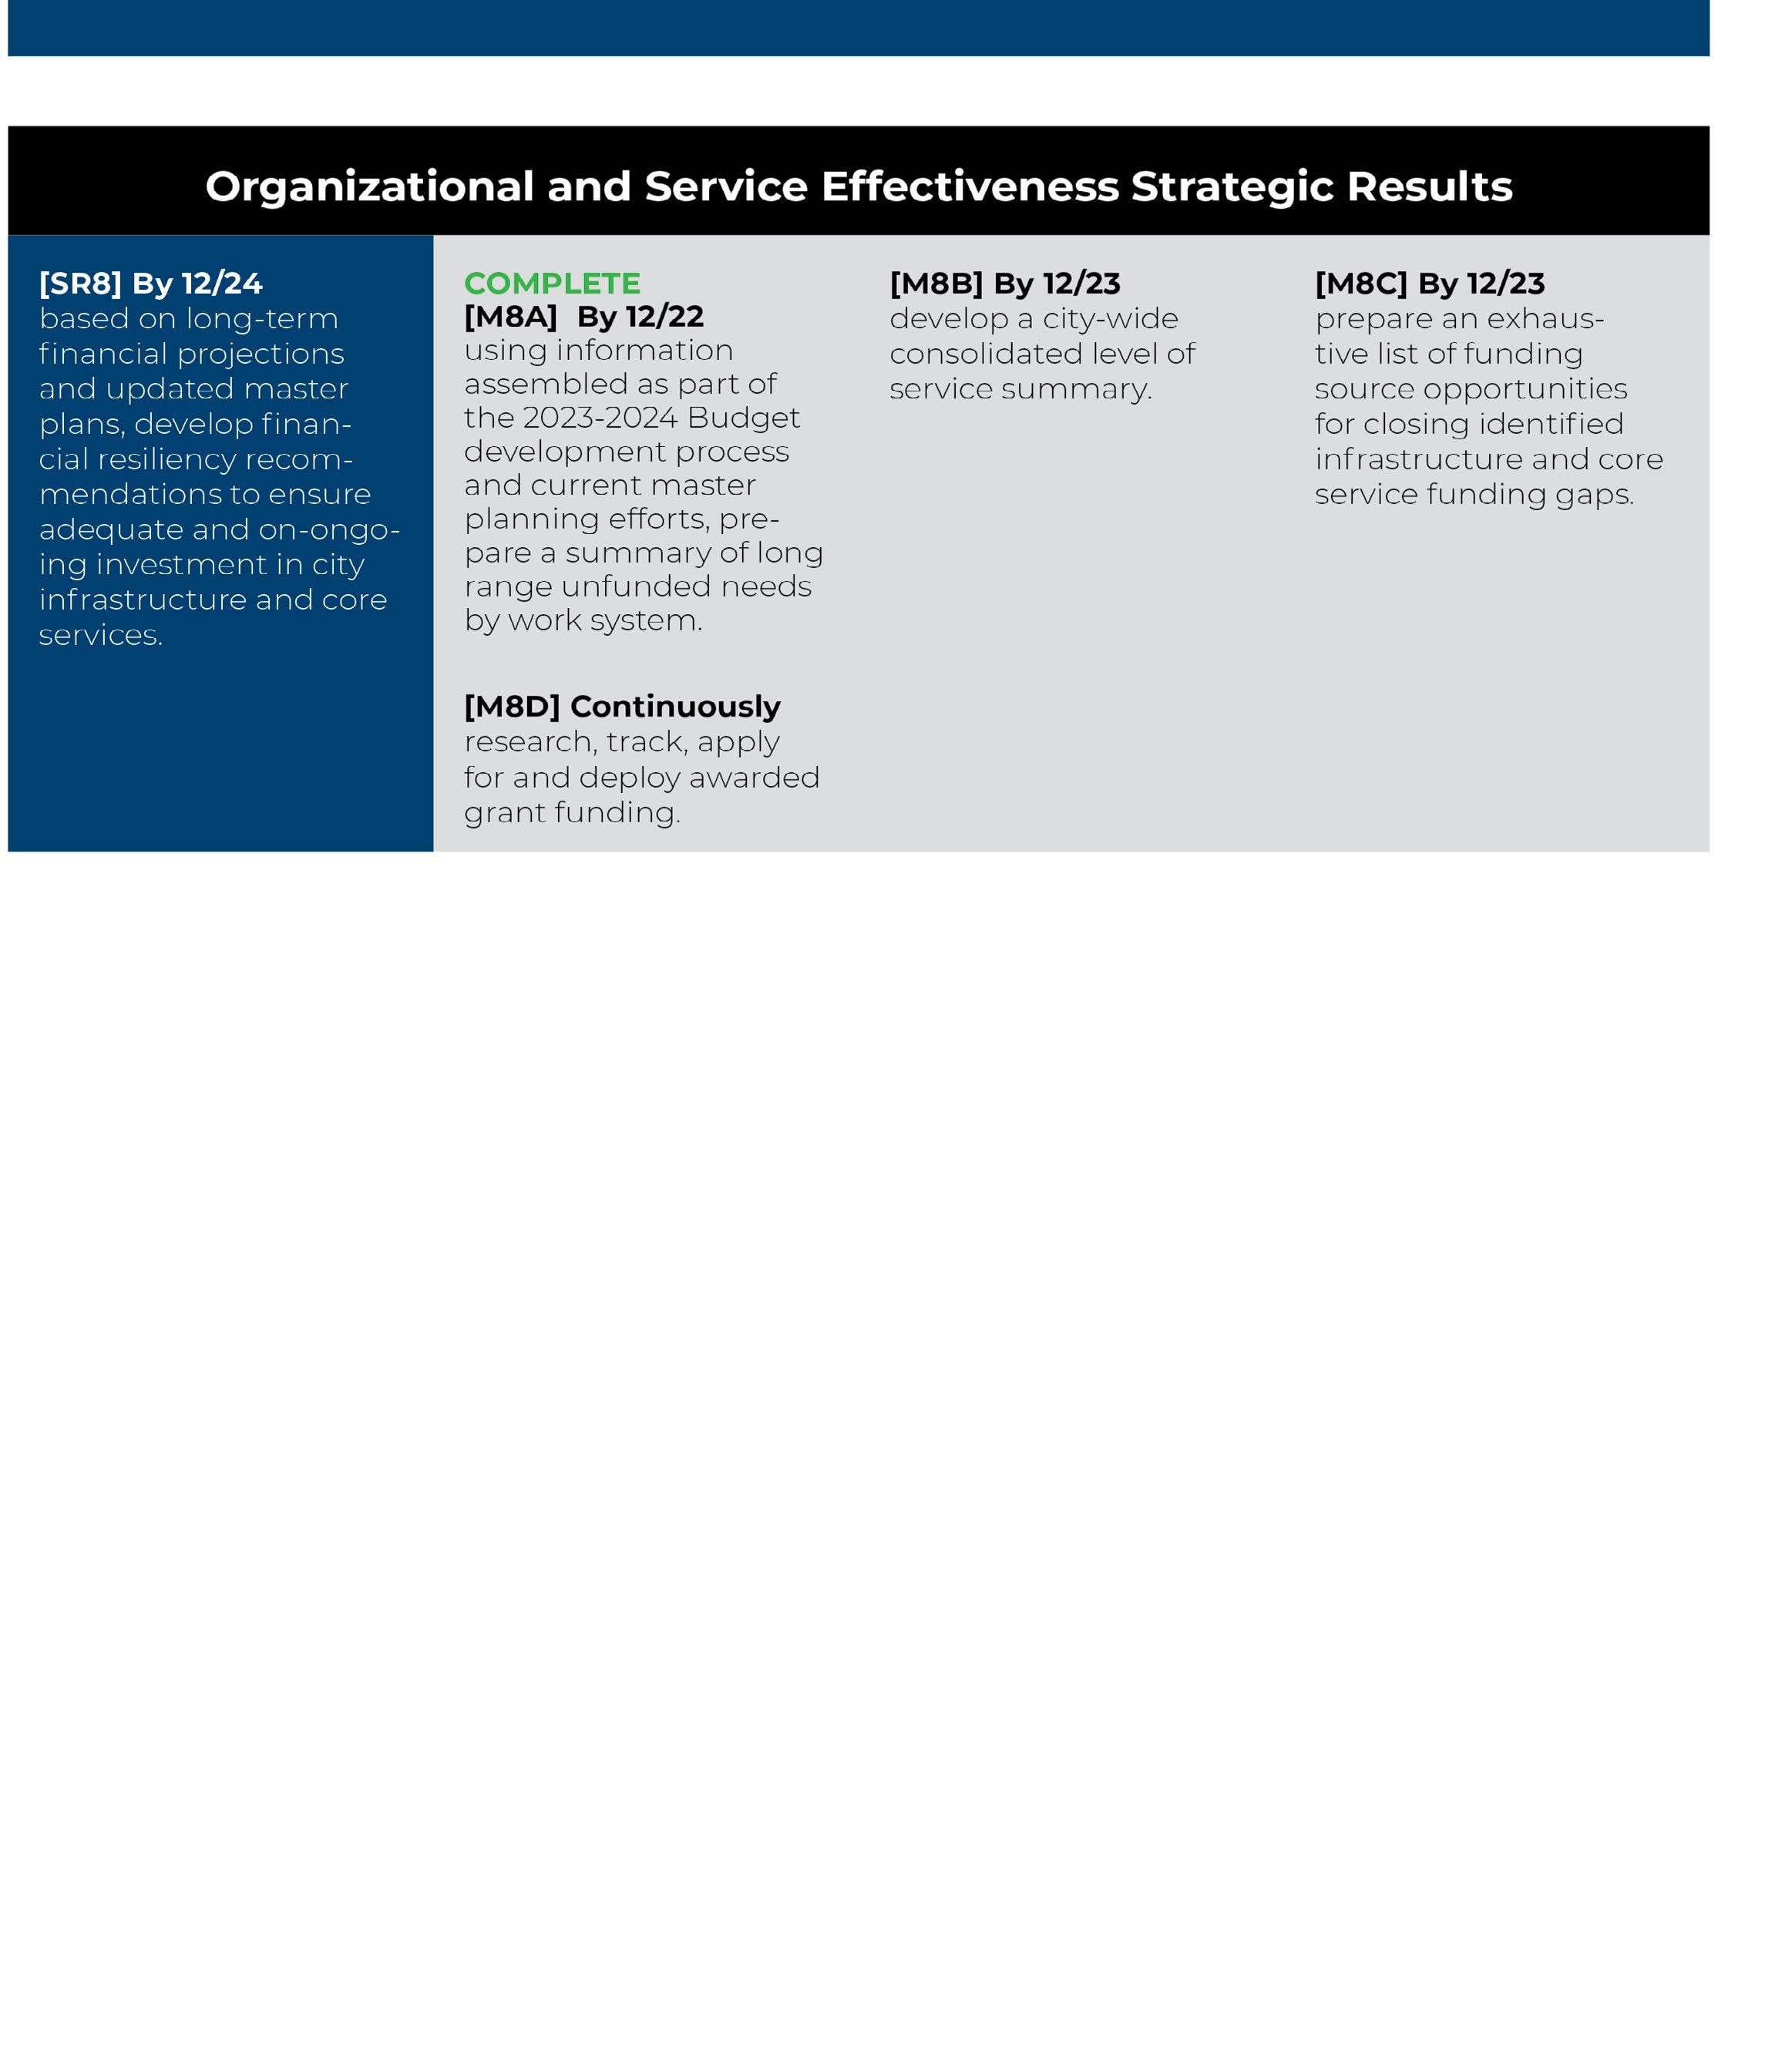
The Proposed Revised 2023-2024 Budget remains connected to the Strategic Planning Process framework which provides the foundation for accomplishing the Council Strategic Results and other key results identified by each of the City’s five work systems. This framework utilizes the following elements:
• Work Systems that align to the Priority Areas as defined in the City Council Strategic Plan;
• Principles defined as high level strategies that form our business model and serve as pillars of excellence;
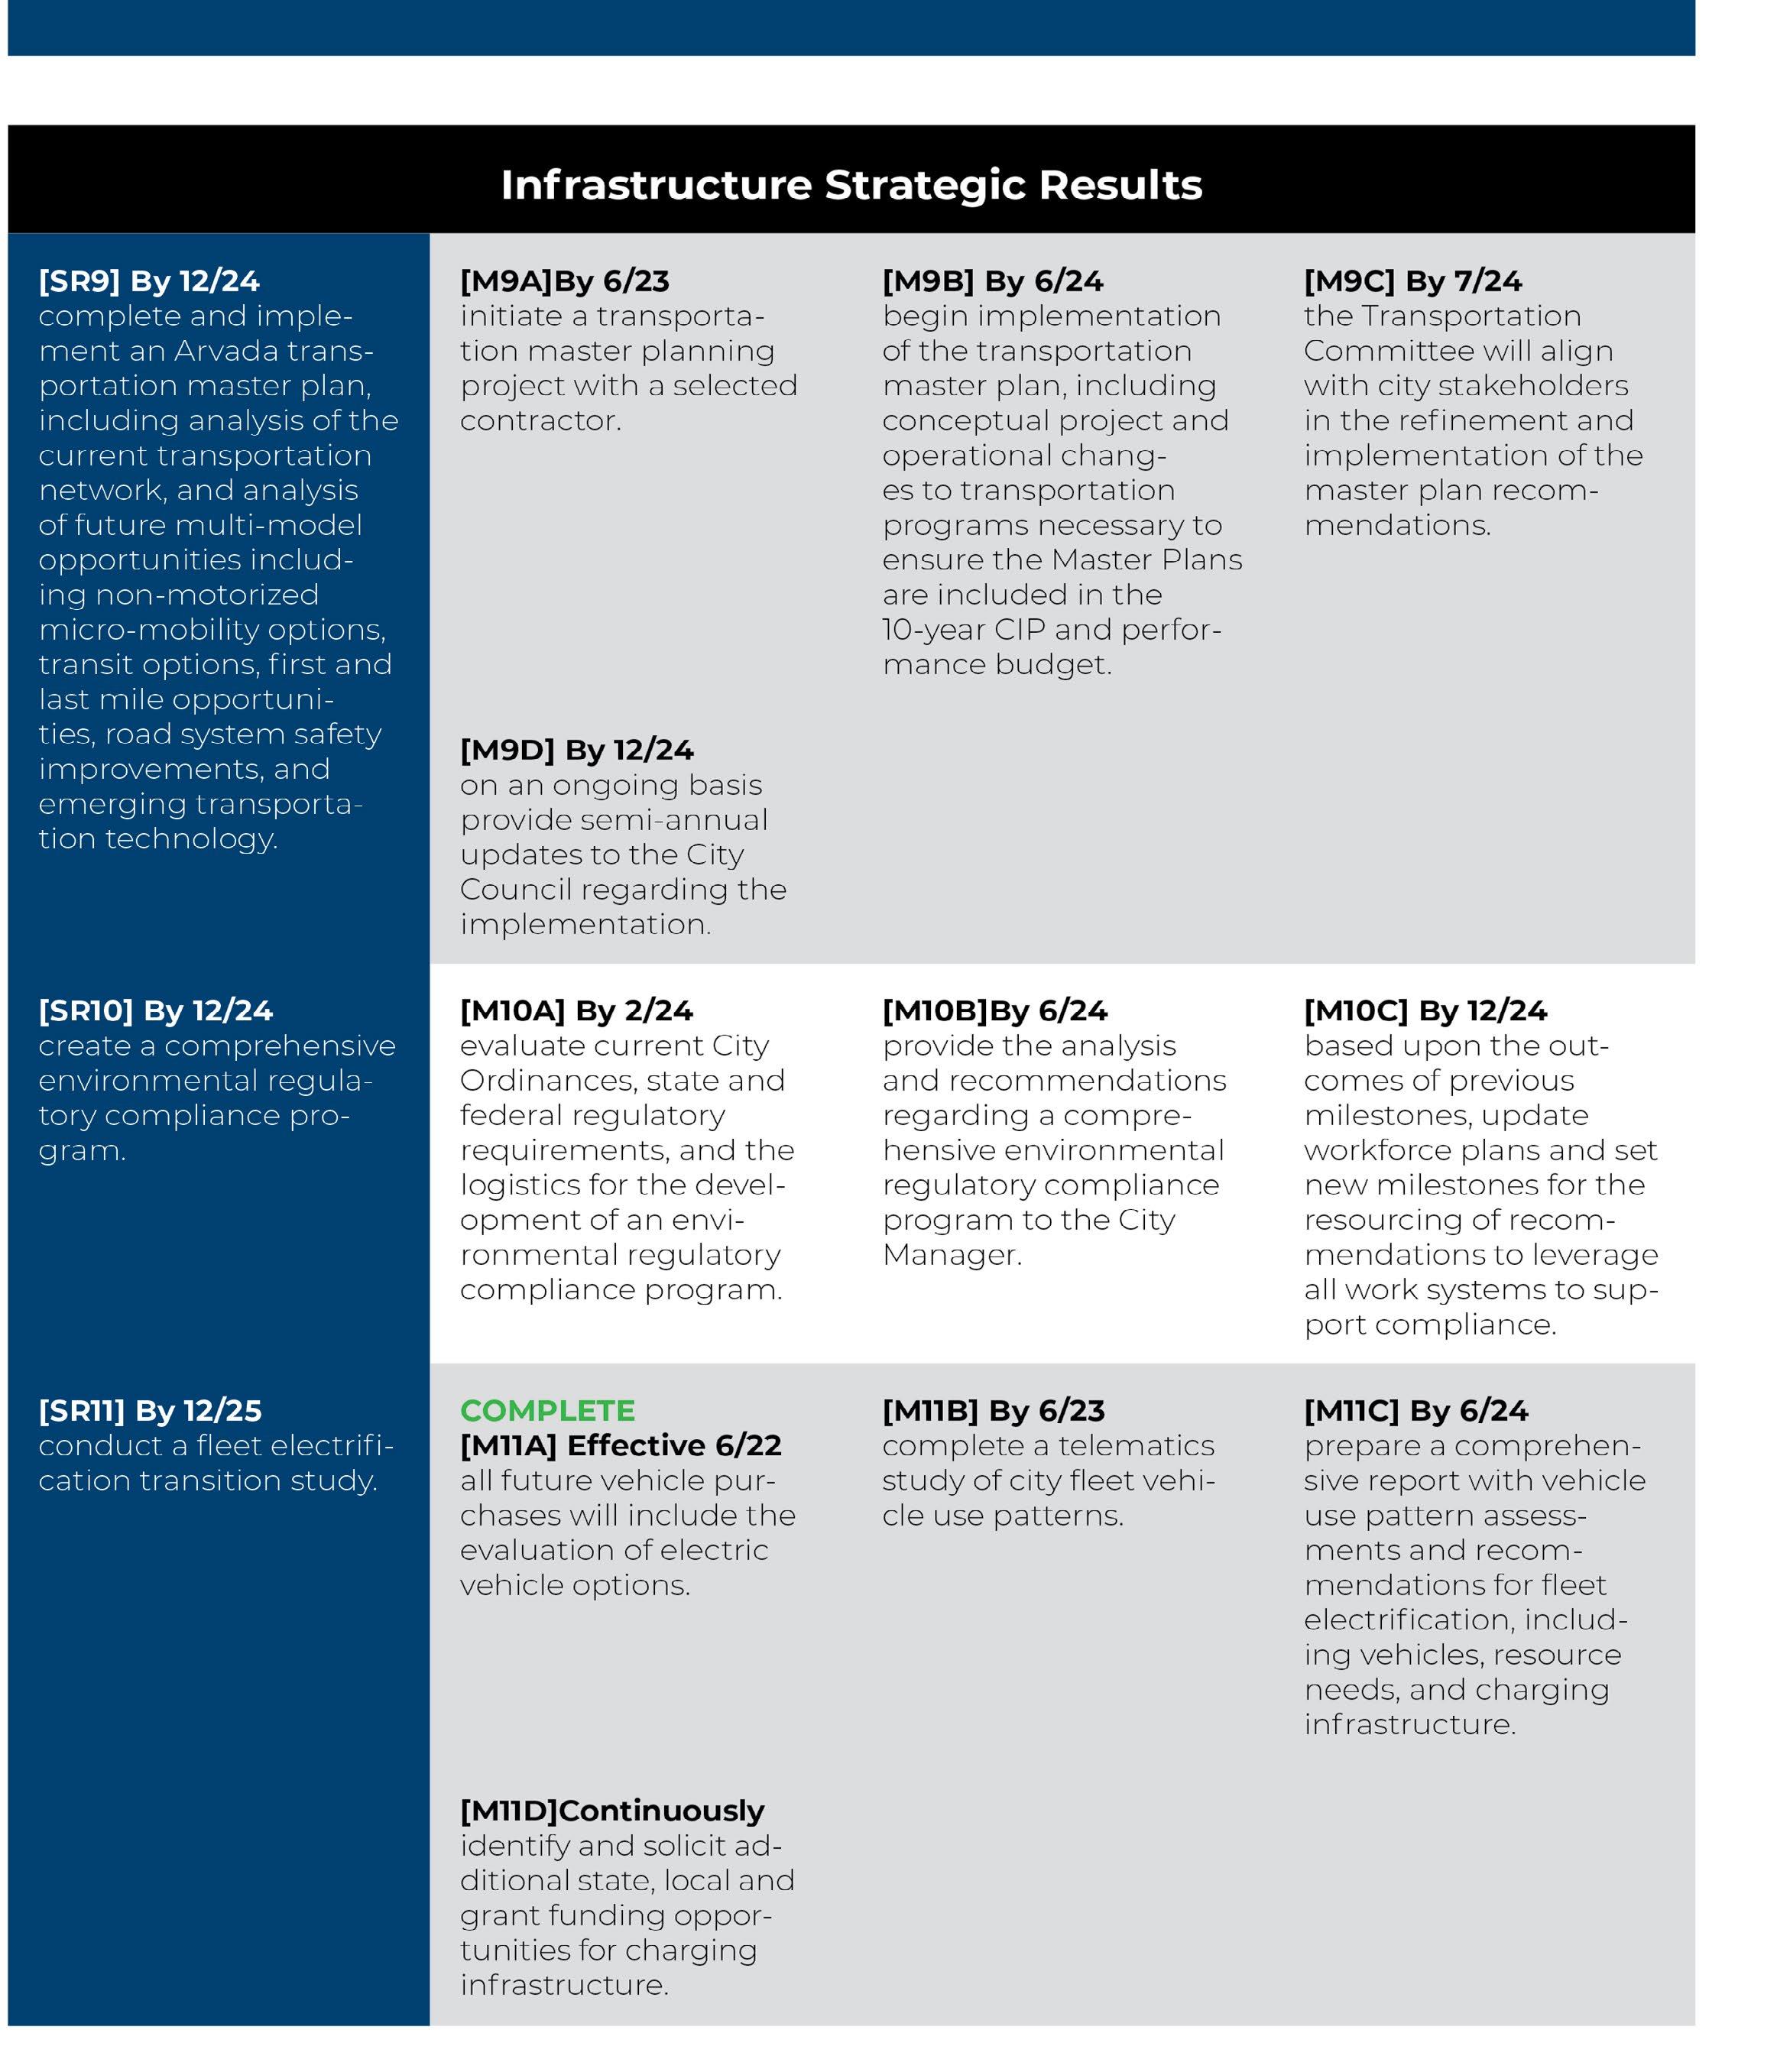
• Strategic Results defined as specific and measurable objectives directed by the City Council that provide guidance in supporting priorities and organizational transformation;
• Milestones defined as significant events or important achievements that indicate change or progress toward a strategic result; and
• Performance Measures that utilize the Specific, Measurable, Achievable, Relevant and TimeBased (SMART) goal framework to help focus our efforts and achieve the identified targets.
The Strategic Planning framework defines the performance management process that creates alignment between the CCSP and the day-to-day work accomplished by Arvada team members. Specifically, performance management implemented through this framework seeks to:
• Connect City Council Strategic Results to individual performance goals;
• Drive decisions and change used to inform budgets, set priorities and allocate resources;
• Hold all City team members accountable for achieving results; and
• Define value and provide transparency.
The work implemented by the City team is organized into five work systems that align to the City Council Priority Areas, which are defined in the CCSP. The City’s five work systems are:
9
2023-2024 Proposed Revised Biennial Operating and Capital Budget
Members of City Council - August 31, 2023
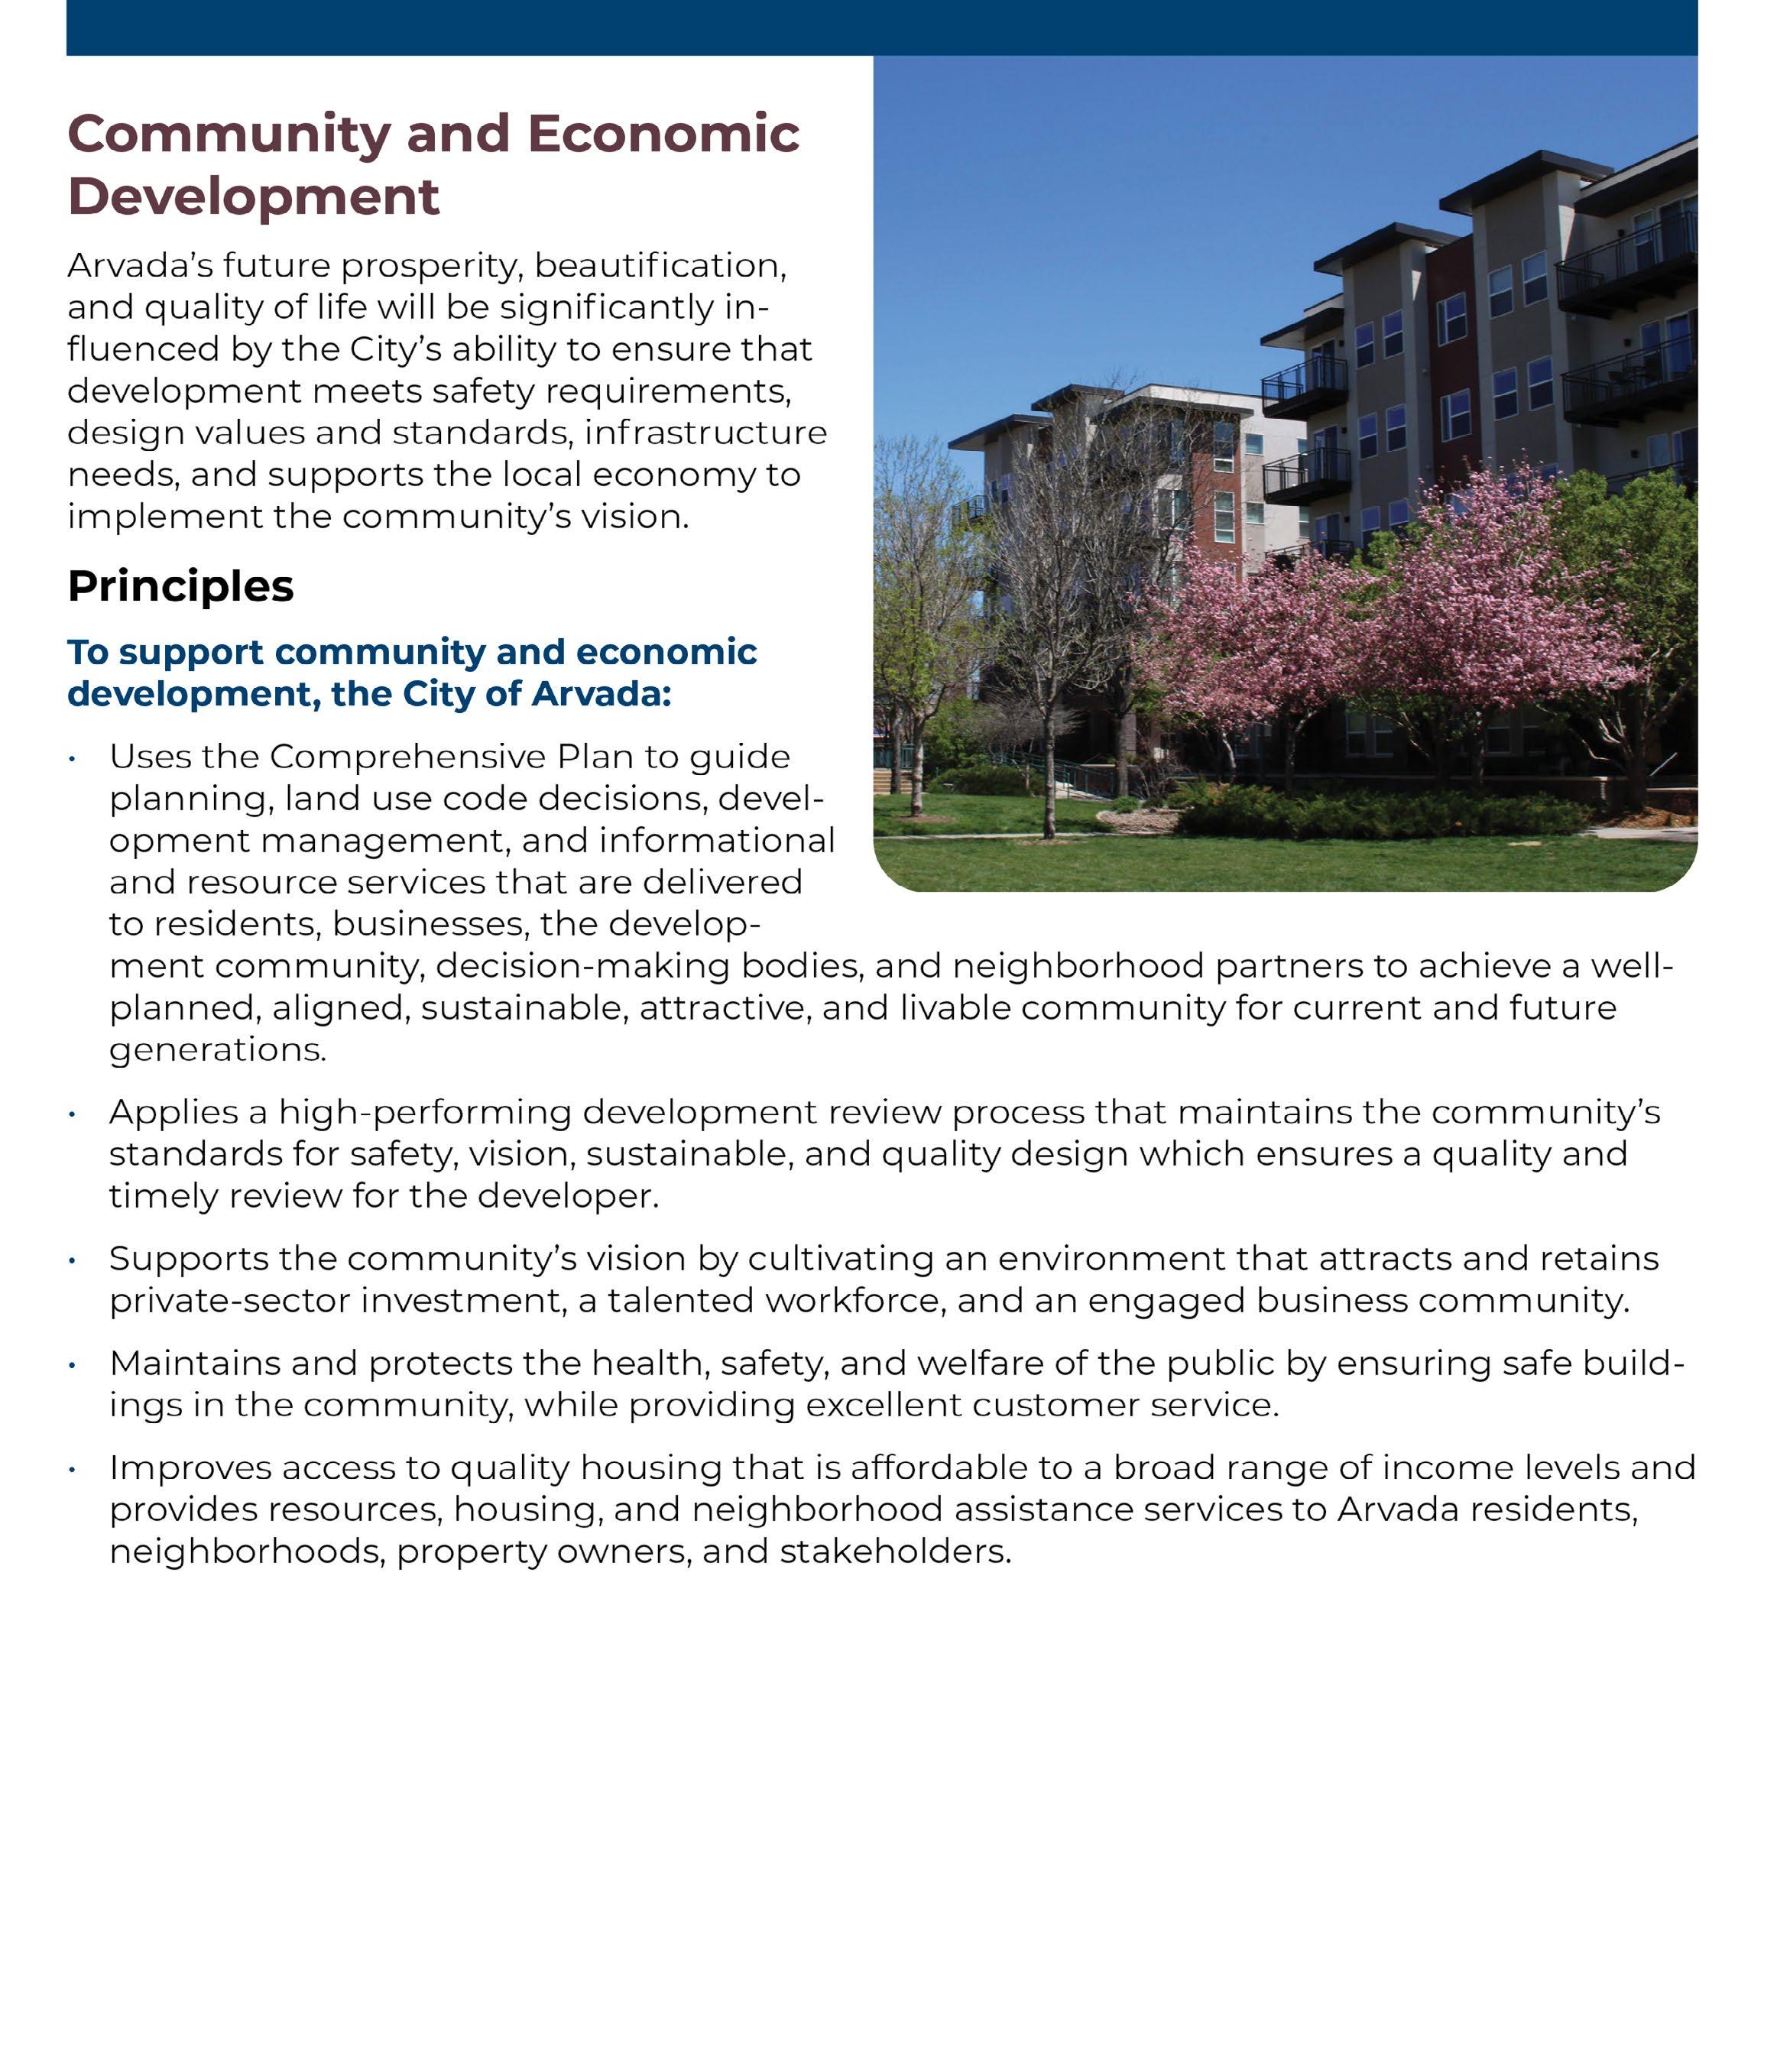
Community and Economic Development (CED) – The CED Work System includes Building, Economic Development, Development Review, Long Range Planning and Housing Preservation and Resources
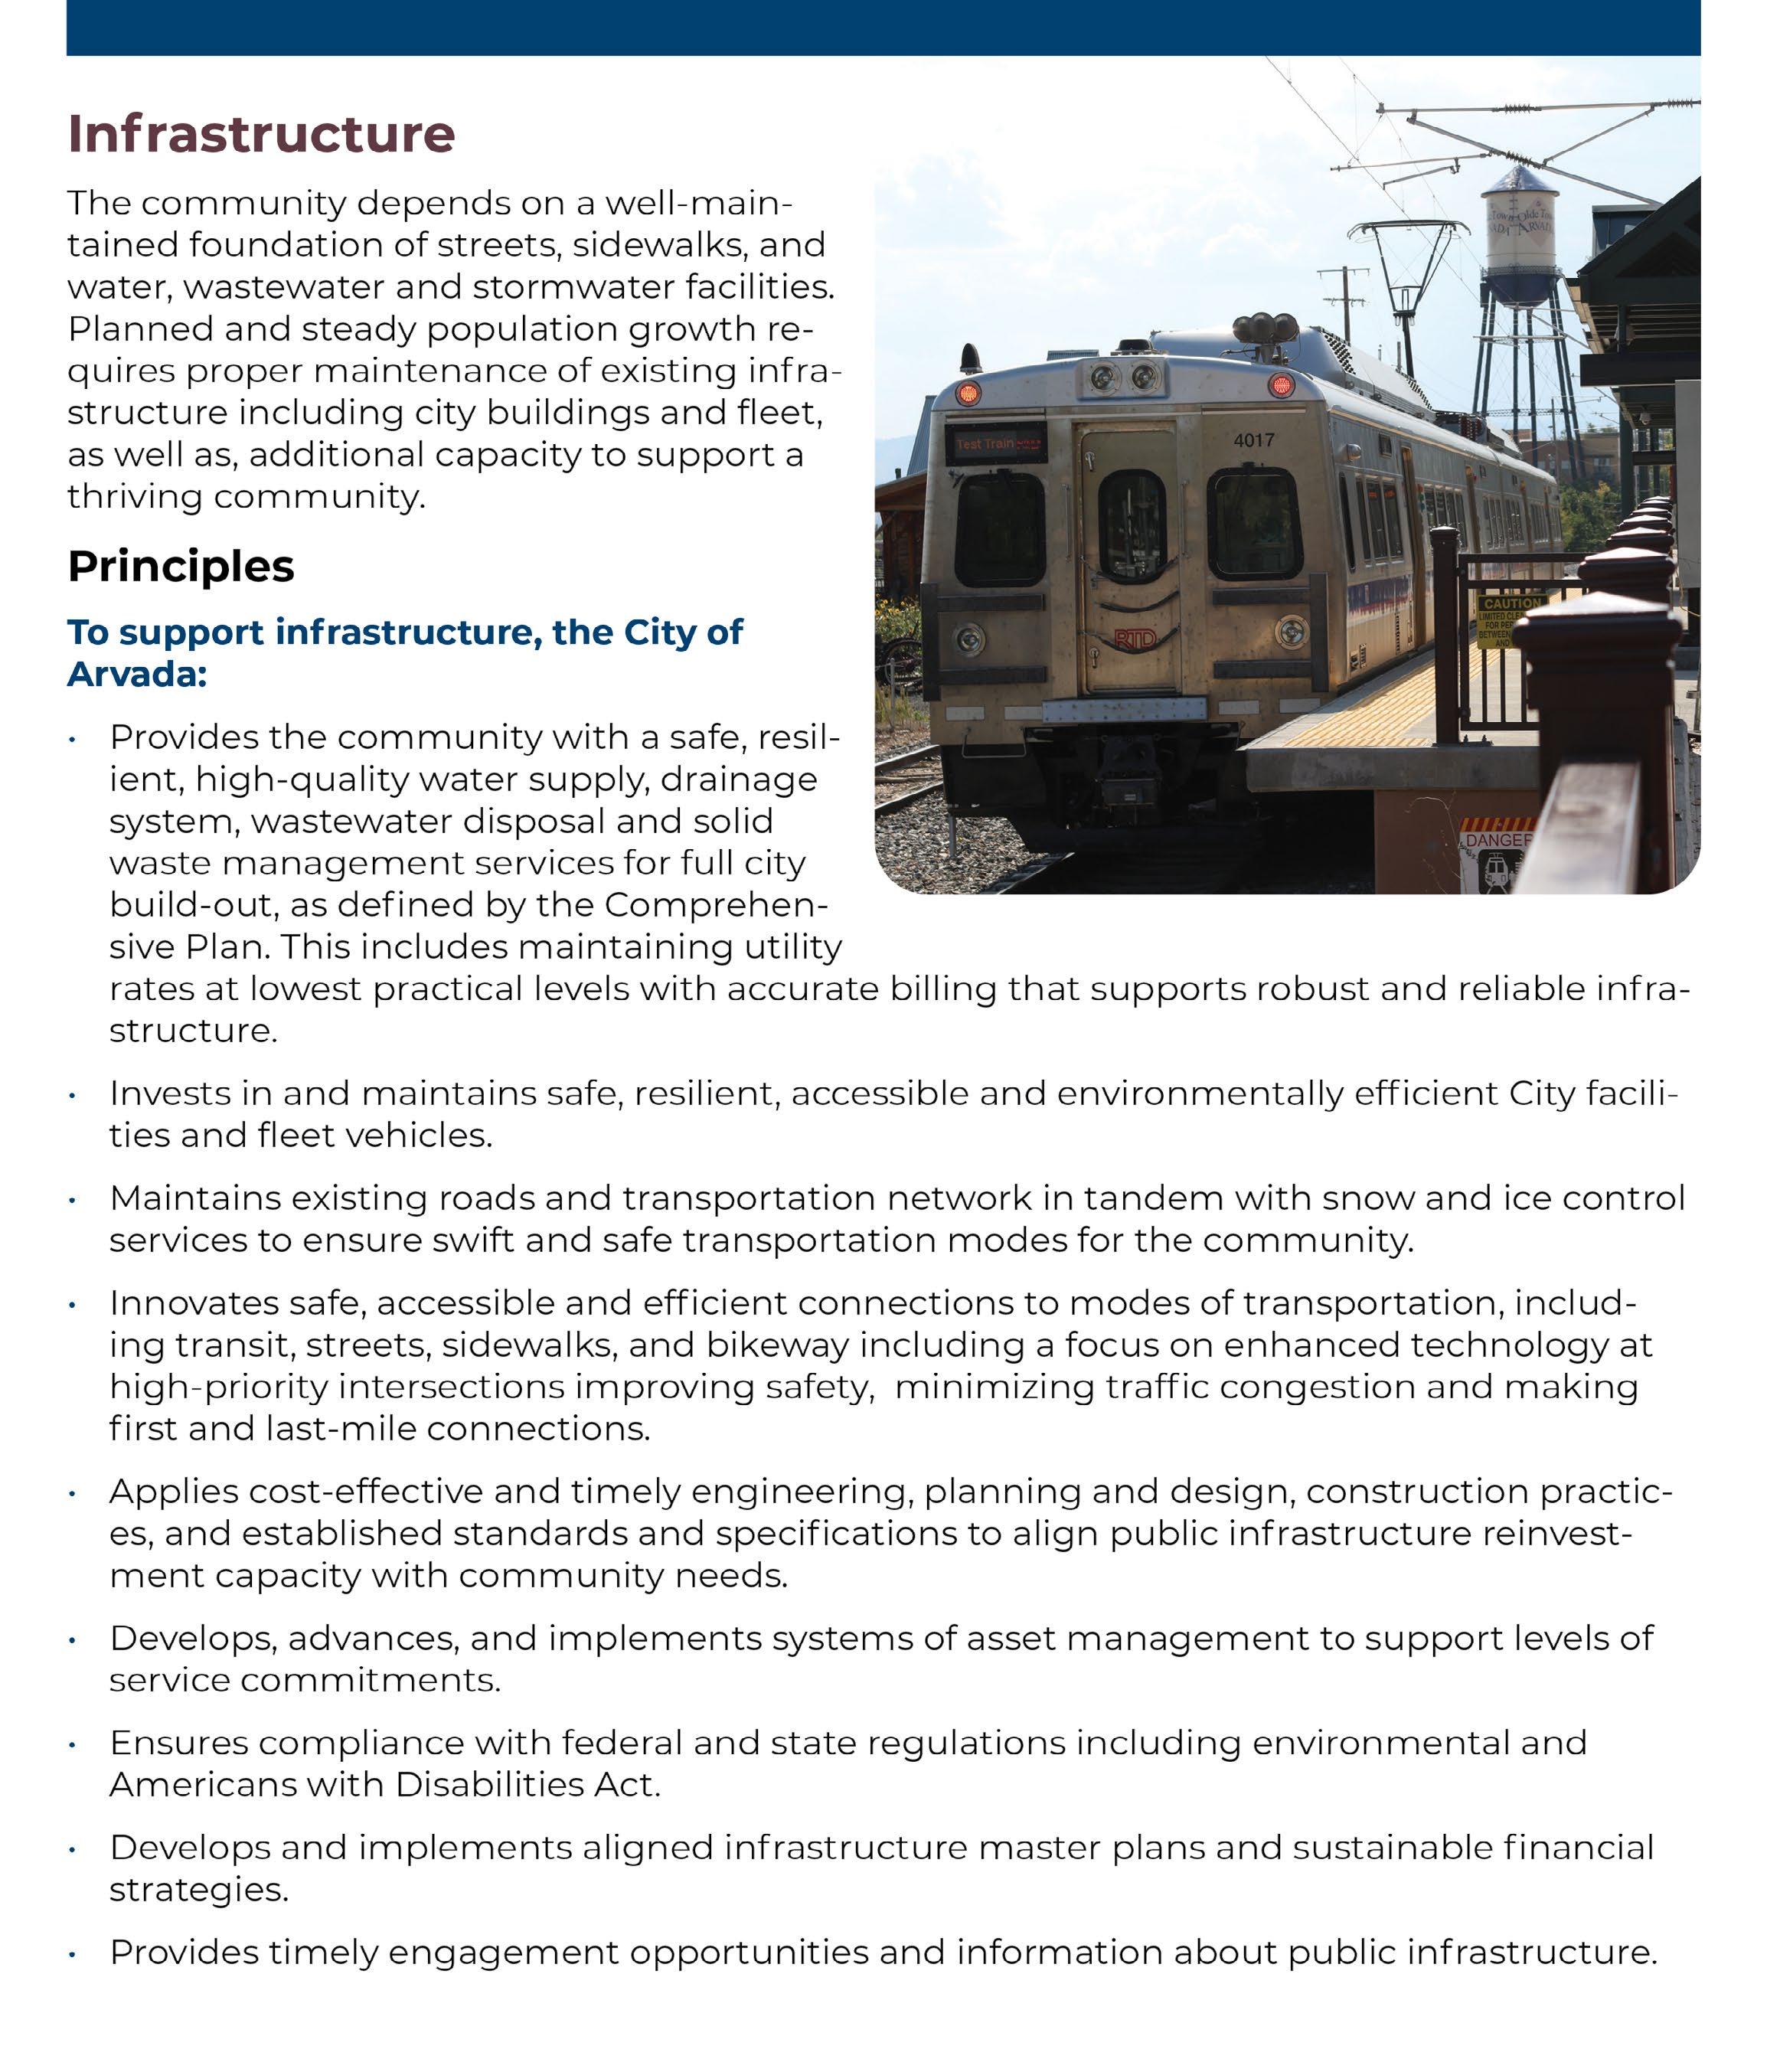
Infrastructure - The Infrastructure Work System includes Facilities Management, Fleet Services, Flood Control, Street Infrastructure, Utility Customer Information Services, Wastewater Collection and Disposal, Drinking Water and Solid Waste
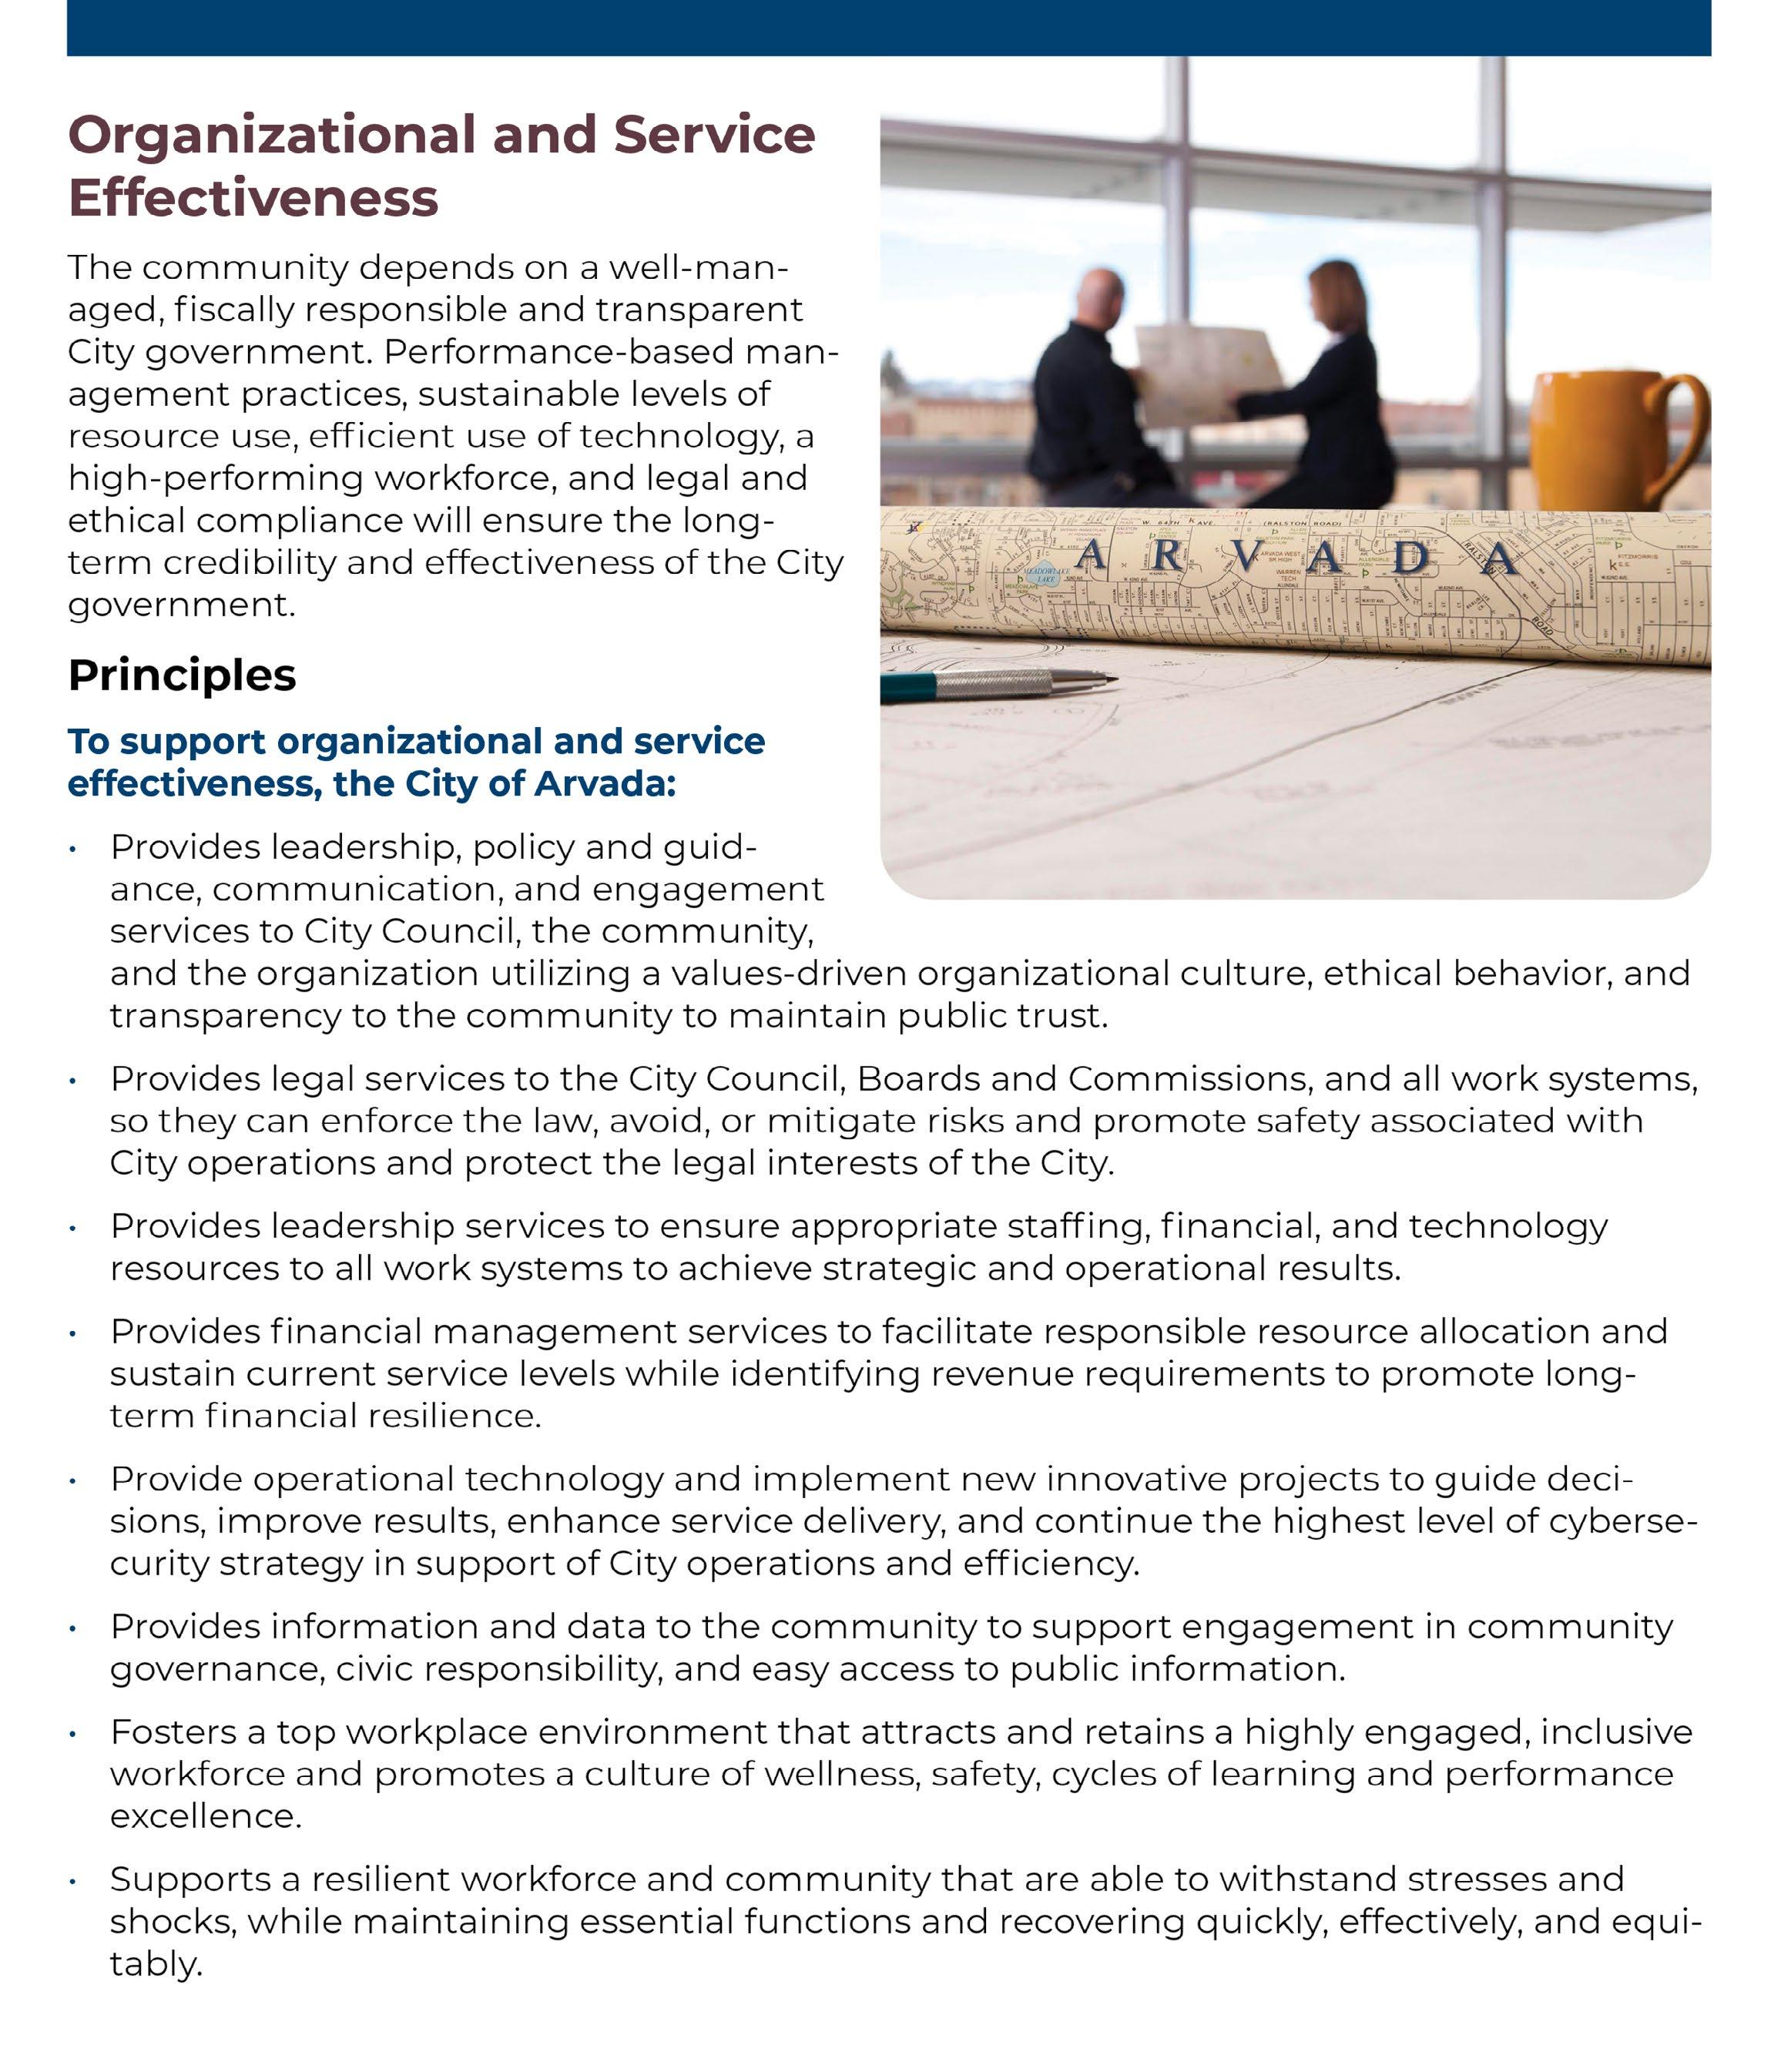
Organizational and Service Effectiveness (OSE) – The OSE Work System includes Business Systems, City Attorney, Communication and Engagement, Compensation, Benefits and Wellness, Employment, Fair and Open Government, Revenue, Accounting and Financial Analysis, Service Excellence, Economic Vitality and Infrastructure, Strategic Partnership, Technology Infrastructure and Operations, Technology and Project Management Services, and Workforce and Strategic Partnerships
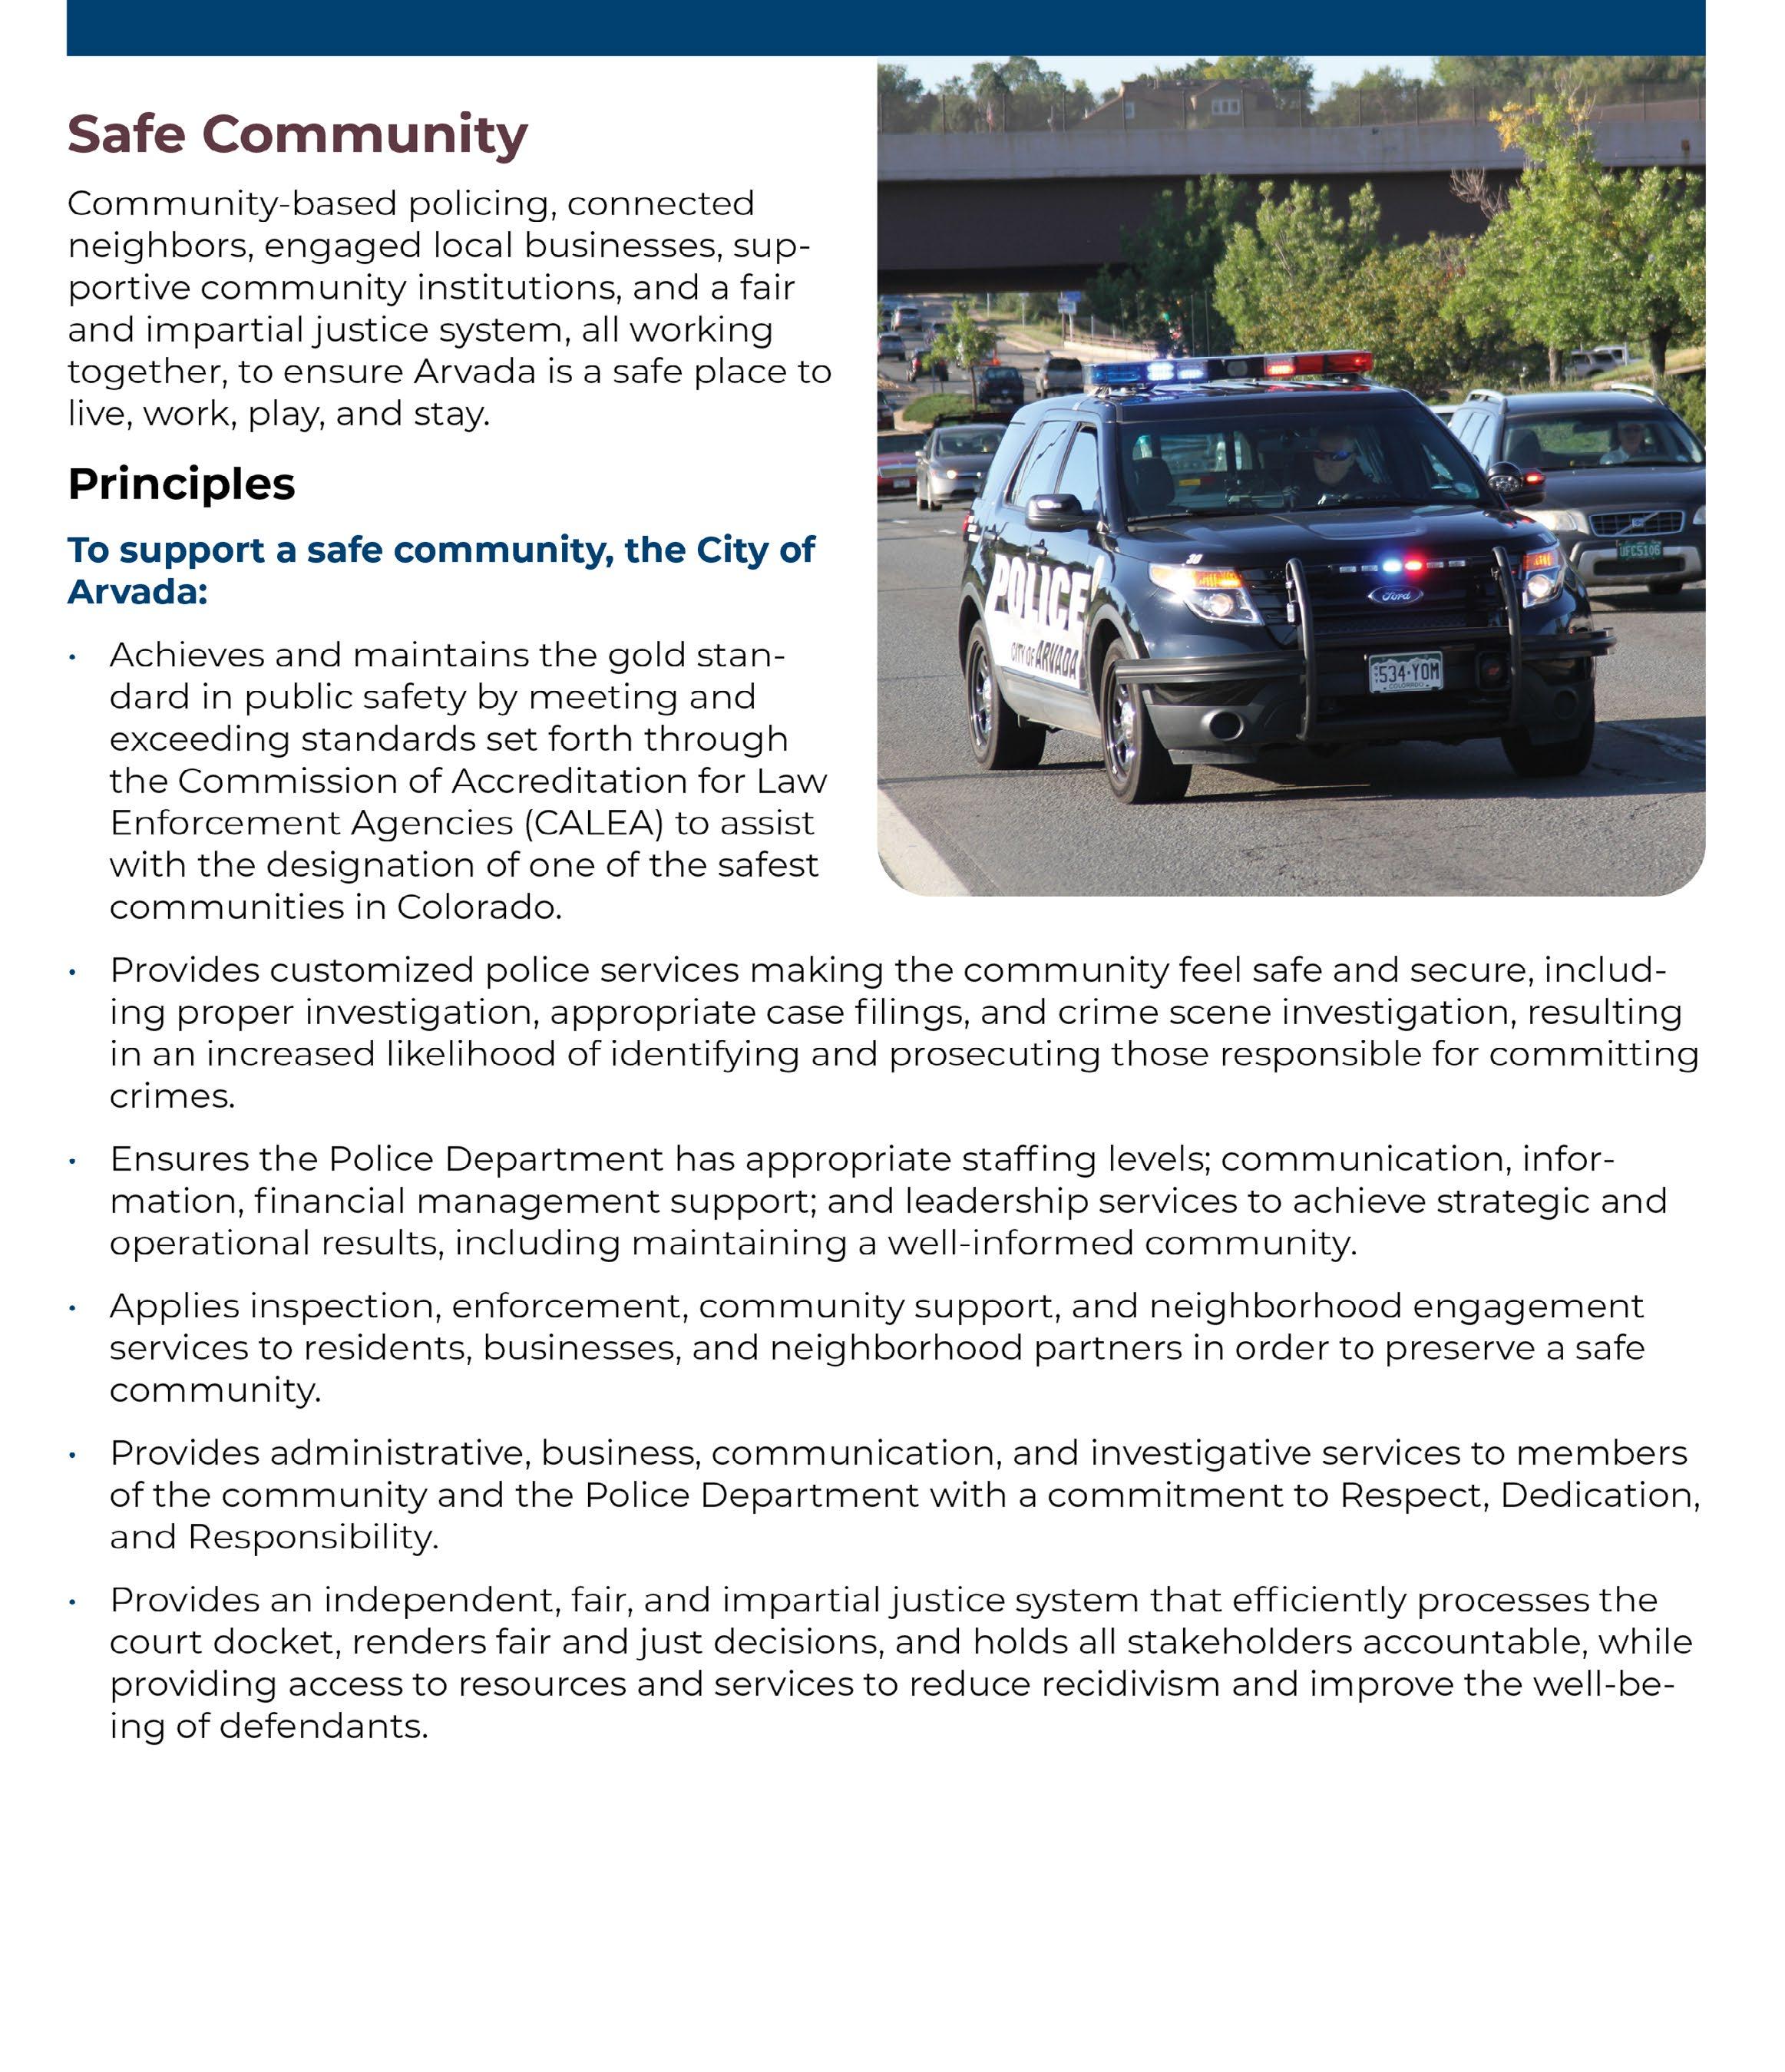
Safe Community – The Safe Community Work System includes Judicial Branch (Municipal Court) and Field Services and Operations within the Police Department
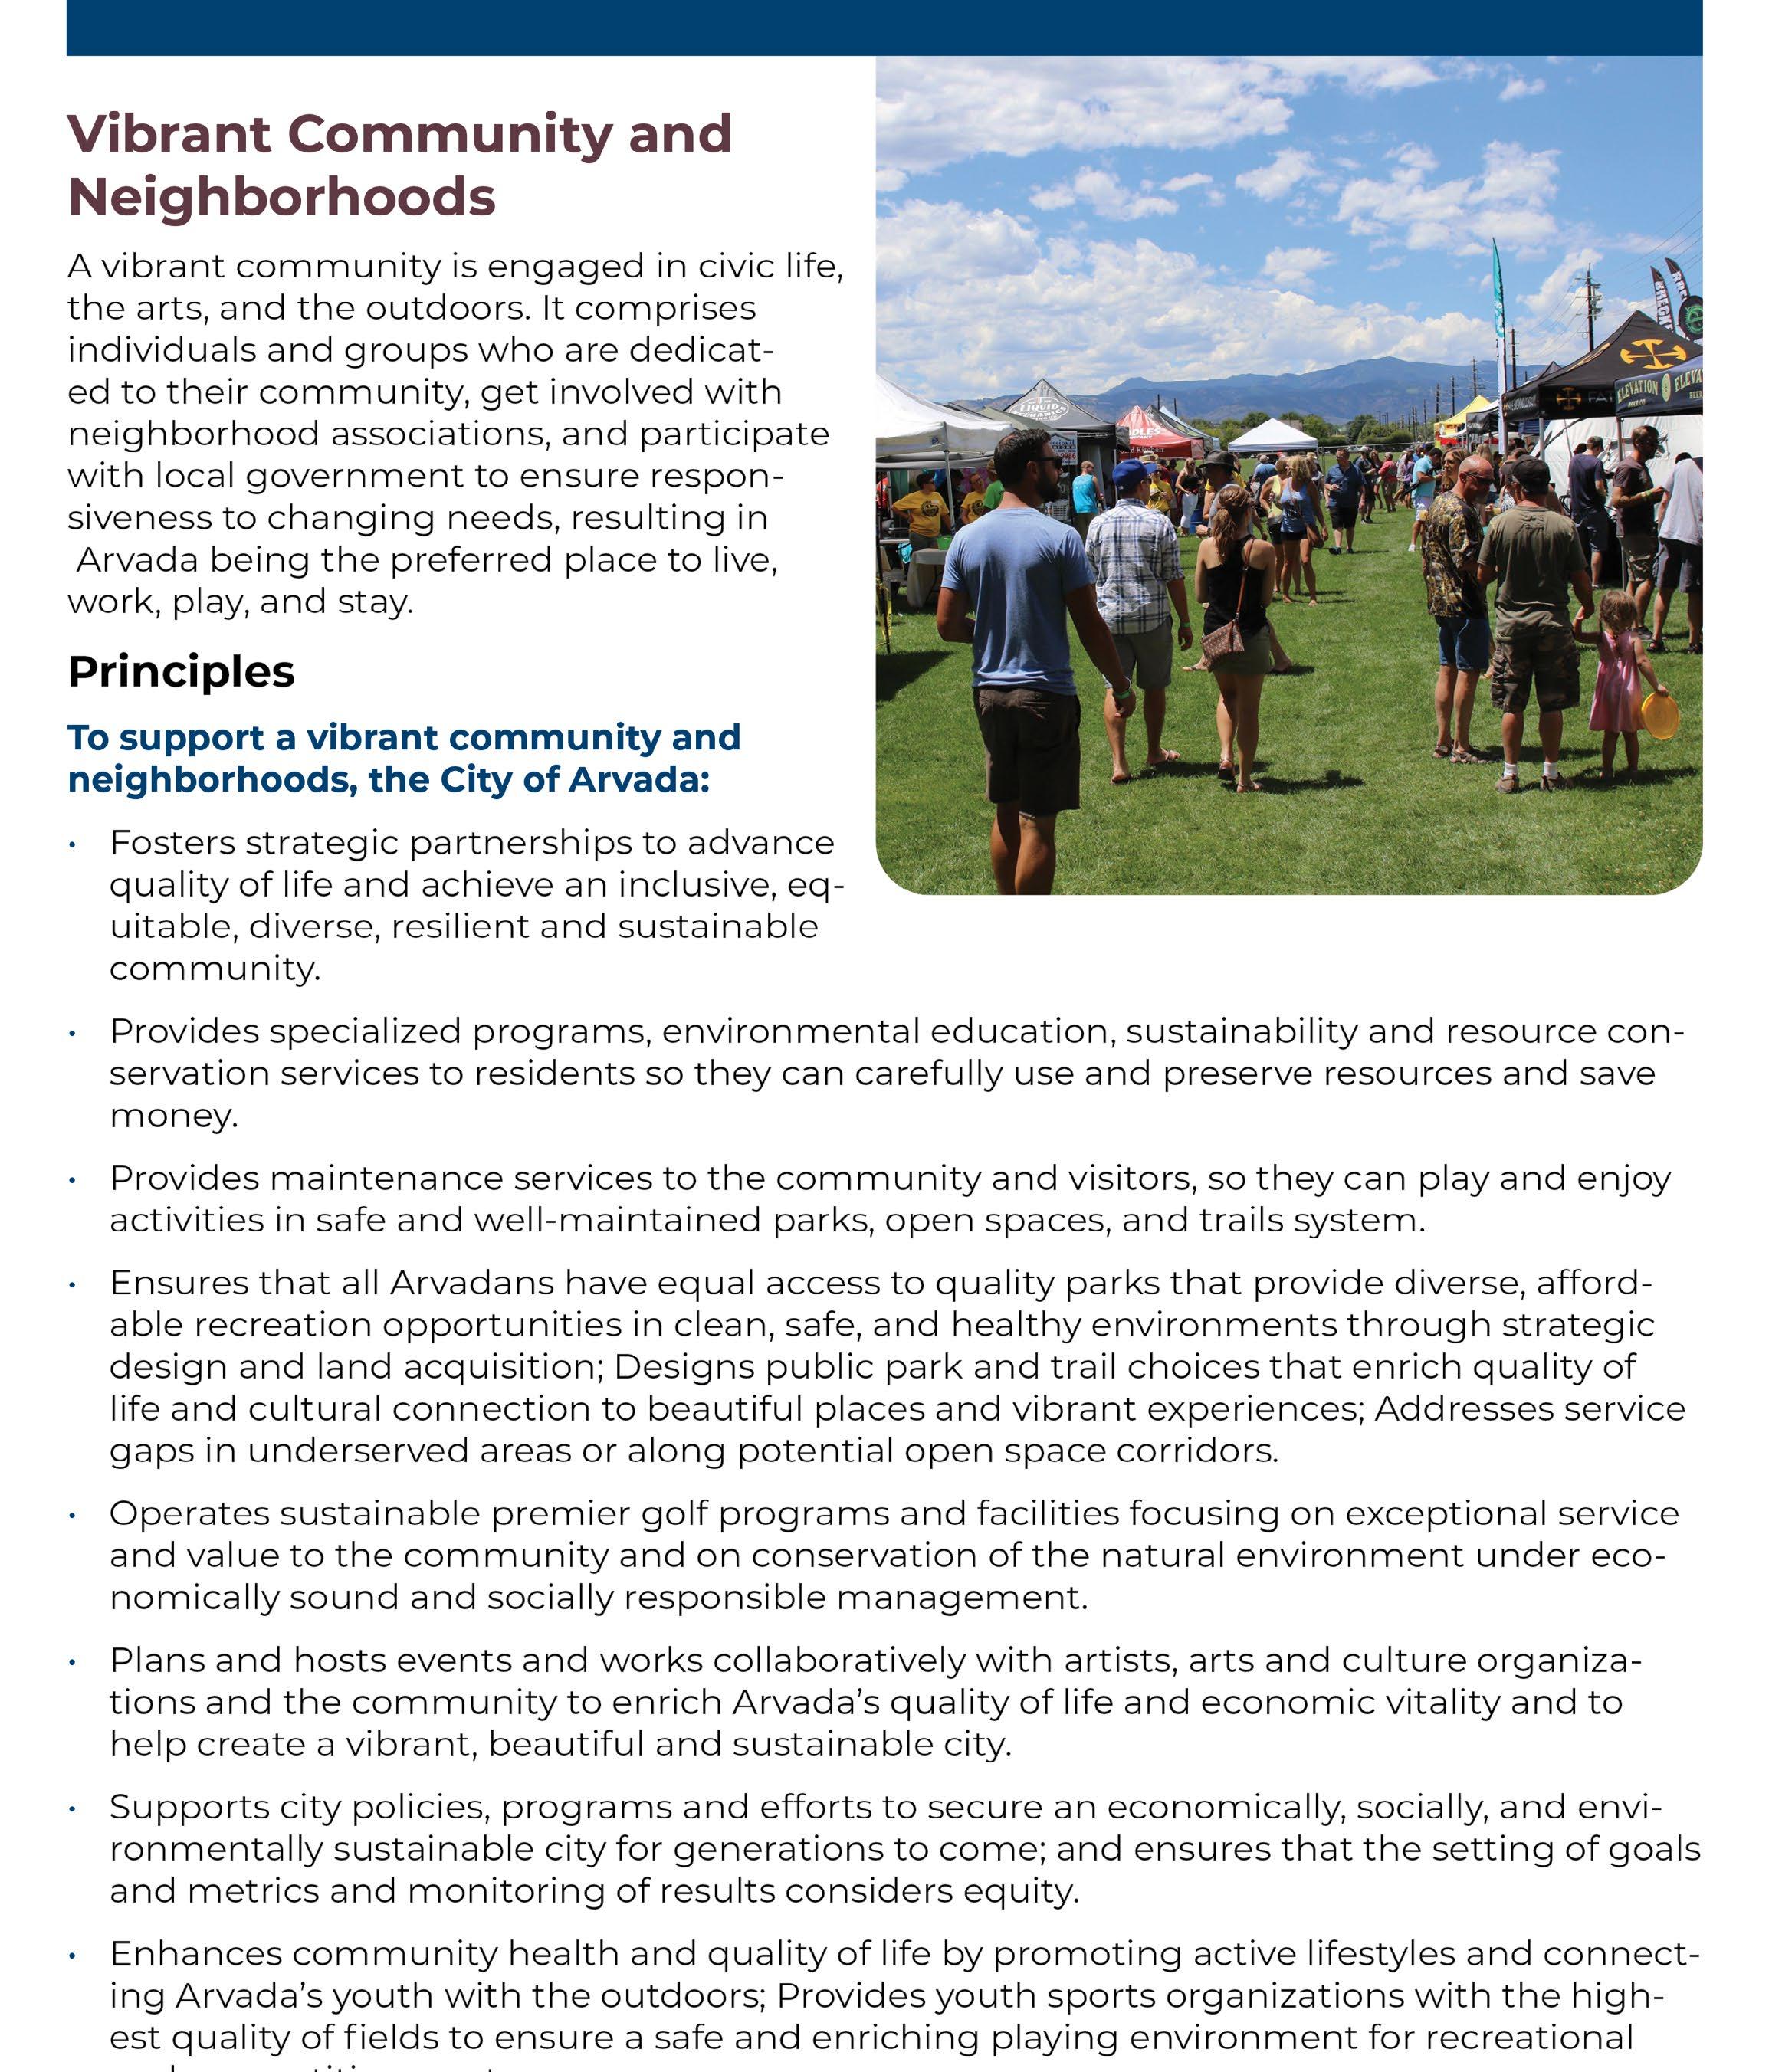
Vibrant Communities and Neighborhood (VCN) - The VCN Work System includes Parks, Golf, and Sustainable and Vibrant Community
With full alignment of our work with the CCSP, (Work Systems = City Council Strategic Priority Areas), implementation of a business model that defines high-level strategies for the provision of core services, completion of our work and performance measures that informs our progress and achievements, we are committed to performance excellence in building a customer-focused and results-driven organization .
With this commitment in mind, this letter summarizes the Proposed Revised 2023-2024 Budget and presents a summary of the updated 2023-2032 Ten-Year Financial Plan .
Background
2023-2024 Adopted and Amended Budget
Council approved the 2023-2024 Adopted Budget on October 17, 2023 . The total funds appropriated via Ordinance No . 4822, Council Bill No . 22-074 were $359,784,184 .
On April 17, 2023, Council approved Council Bill 23-008 authorizing the appropriation for the expenditure of funds from the 2022 budget lapsed on December 31, 2022 . At the end of 2022, there were several projects/programs that had been approved, although not yet completed . In order to complete these projects, funds that were designated for these projects carried over from the 2022 budget to the 2023 budget . The approved carryover totaled $39M . The majority of the carryover was from the Enterprise funds for ongoing capital improvement projects . There were also items added to the 2023 budget . Of the $25M additional appropriation, $16M was related to Water Fund projects due to the 2022 Water Bond issue, with the majority of the remaining $9M the result of large capital project inflationary increases. Finally, during the 2023 budget process, City team members identified $1.5M in one-time expenditure priorities that were presented for approval
10
Adopted Budget $359,784,184 Carryforward $39,071,325 One-Time Funds 1,502,700
2023-2024 Proposed Revised Biennial Operating and Capital Budget
Members of City Council - August 31, 2023
Management and Reporting
The City continues to demonstrate and be recognized for strong financial management with a clean audit opinion for the year ended December 31, 2022 and the affirmation of the City’s “AAA” S&P Global Rating on the City’s Sales & Use Tax Bonds. A foundation for strong financial management includes consistent monitoring of and reporting on the City’s financial position. Per the City’s Fiscal Policy, the Council receives quarterly financial reports. The quarterly financial reports are posted on the City’s Financial Transparency website .
Budget Development Considerations
As this document and requested budget approval represents the second year of this Biennial budget, our goal was to minimize changes from what was projected and included in the 2023-2024 Approved Biennial Budget . The City’s Executive Leadership Team evaluated service levels and programs included in the original 2023-2024 projections . In alignment with the City Council Strategic Plan, the budgetary process considerations included
• Financial Resilience - Plan for sustainable services into the future .
• People First - Support retention, development and a quality culture .
• Projects - Complete planned projects and follow strategic master plans
• Initiatives - Advance Sustainability, Housing and Diversity, Equity and Inclusion (DEI) initiatives
The slowing economy and resulting impacts of inflation, retention and revenues were considered as each work system assessed existing service levels We considered customer service, funding gaps, threats, opportunities and long range plans. The City team is developing five- year resilience plans for each work system to ensure resilient and sustainable services and infrastructure
The Economic Environment and Revenues
The Introduction section of this Proposed Revised 2023-2024 Biennial Budget provides an economic summary at the national and local levels As reported in the City’s 2023 Second Quarter Financial Report, the City’s General Fund revenues are keeping pace with inflation with an overall increase of 2 .5% at the end of the quarter . Sales tax revenues are up 6 .3% year over year, with a projected slow down as we continue through 2023 . Overall, 2023 budgeted revenues and expenditures are in line with what was presented to Council at the time the 2023-2024 Biennial Budget was adopted .
Understanding revenues and resources is the first step in budget development. As part of the budget development process, the City’s Revenue Manual was updated as of December 2022 . The Revenue Manual provides a comprehensive look at major City governmental revenues . The Revenue Manual presents historical revenue information and includes projected revenues for the next five years.
The Proposed Revised 2023-2024 Biennial Budget anticipates a slowing economy with limited growth in revenue and inflationary impacts on capital projects and services.
11 New Requests $25,144,786 Total 2023 Revised Budget $425,502,995
2023-2024 Proposed Revised Biennial Operating and Capital Budget
Members of City Council - August 31, 2023
Biennial Budget Updates:
Revisions to the 2023-2024 Adopted Biennial Budget are broken down by category and summarized below
Positions Approved and Funded in the 2023 Budget
The 2023-2024 Adopted Budget added 25 positions . The positions were included in the fully-balanced ten-year models. The new positions funded in the first year of the 2023-2024 Budget addressed an expanded capital program focusing on transportation and utilities infrastructure, timely maintenance of City facilities, cybersecurity and police services A list of positions added in the 2023-2024 Adopted Budget can be found on page 75;
Recommended New Positions in the Proposed Revised 2023- 2024 Budget
Fourteen new positions are recommended in the Proposed Revised 2023-2024 Biennial Budget Two of the new positions are planned for only the first few years in the ten-year model. Four positions are extended for an additional two years on the ten-year model Four positions are proposed to be funded throughout the model Three additional grant- funded positions that were added mid-cycle 2023 are listed below for awareness A Parks Maintenance Worker II was also added mid-cycle
• A Deputy Court Administrator to provide capacity for the municipal court team to move to a paperless environment The caseload in municipal court has not been conducive to project completion This two- year position provides capacity to advance and complete the project .
• An Assistant City Attorney to bring litigation in-house reducing expense of outside counsel . The position is funded as a three-year position to allow for assessment of the need in the future .
• A Legal Specialist who was previously funded for three years . The 2023-2024 Proposed Revised Budget funds the position through the ten-year model .
• Two Utility System Technicians, one in the Wastewater fund and one in the Stormwater fund .
• Stormwater Inspector
• Two Police Service Technicians extended for two years .
• Two Police Records Specialists extended for two years .
• Parks Maintenance Worker II
• A grant- funded Behavioral Health Case Manager
• Two grant- funded Police Officers.
Recommended Compensation Increases
Like other organizations across the country, the City has continued to be challenged to compete in the job market. Following the tragic deaths of Officer Gordon Beesley and Officer Dillon Vakoff, and the continuing negative national narrative regarding law enforcement, there are over 40 of 191 sworn positions in the Police Department vacant at this time Although pay is not the primary driver for ongoing vacancies in the Police Department, it is critical that the City remain highly competitive in the compensation of officers.
All other City Departments continue to face challenges associated with recruitment and retention . The Human Resources team shared information from the Bureau of Labor Statistic Employment Cost Index which indicated that wages and salaries for civilian workers increased 4 .6% for the 12-month period
12
2023-2024 Proposed Revised Biennial Operating and Capital Budget
Members of City Council - August 31, 2023
ending in June 2023. For state and local government workers the increase was an overall 4.7%. Specific to state and local government workers increases by occupational group are shown as:
• Management 4 .5%
• Professional and related 4 .6%
• Office and Administration 5.0%
• Service Occupations (this includes police officers) 5.5%
We use this information, along with other market data, to recommend adjustments to the City’s pay ranges in order to stay competitive and maintain the City’s Employer of Choice Compensation Philosophy
After checking with other local government employers within the market area, Human Resources, Finance and the Leadership Team believe the proposed pay plan adjustments will maintain our status as an Employer of Choice, while also supporting and acknowledging the efforts of our employees who have been working under prolonged stressful conditions with higher than usual vacancy rates and increasing demands. The proposed market rate adjustments effective January 1, 2024 are:
• Non-sworn market rate adjustment of 3 0%
• Sworn market rate adjustment of 4 0%
• Employee Cost of Health Care 0%
Additionally, employee step adjustments based on longevity and performance will be fully funded with an average increase of approximately 1 .7% . The cost of the proposed compensation increases is $4,716,617 for 2024 . This commitment also adds $25 million to the Ten-Year Financial Models for all funds based on current assumptions . A full analysis of the City’s total compensation program is underway . To remain competitive in the job market, we anticipate proposed enhancements in the next budget cycle .
Recommended Non-Salary Ongoing Budget Increases
A full list of funded budget requests include in this Proposed Budget begins on page 75 . Following is a summary of significant funded items.
Infrastructure – At the top of the list is an additional $500,000 in Streets funding for asphalt and concrete. This represents another small step in closing the significant gap in the City’s annual funding of street infrastructure . As a reminder, $20,000,000 is the needed annual investment in street infrastructure . With the additional $500,000, the City will be investing $12,500,000 In the 4th quarter of 2023, the City team will also be recommending a change in fiscal policy requiring that 50% of all excess revenues (year-end General Fund revenues over budgeted revenues) be directed to the street infrastructure.
Other ongoing increases for the Infrastructure Work System include $150,000 for additional snow and ice control, $125,000 in traffic locate funding, $60,000 for Commercial Driver ’s License (CDL) and other training, and an additional $42,000 in mowing and overtime
An annual funding increase of $1.0M for the City’s fleet is included to ensure funding availability for timely repair and replacement of City vehicles Additionally, the team is recommending $100,000 in ongoing funding for the Telematics system in support of efficient fleet utilization and data-driven maintenance.
13
2023-2024 Proposed Revised Biennial Operating and Capital Budget
Members of City Council - August 31, 2023
Safe Community – The proposed increases in the Police department are related to increased costs/ charges from service providers and partners including $175,000 for Victims Outreach, and $34,000 to Jefferson County Regional Crime Lab (JCRCL). An increase of $30,000 for relief judges is funded as part of the Safe Community work system .
Organizational and Service Effectiveness – Multiple technology- funding increases to support cybersecurity and accessibility, and to replace tools beyond their useful life totaling $480,000 are included in the Proposed Revised 2023-2024 Biennial Budget .
Additionally, increased funding for employee events of $66,000 has been added to the OSE budget . Vibrant Neighborhoods and Communities (Parks Fund) – Ongoing support for Little Raven Park of $42,000 and $10,000 in support of zero-waste events are recommended increases to the VCN budget .
One-Time Strategic Budget Investments
Known one-time budget adjustments for immediate needs are recommended and included in the Proposed Revised 2023-2024 Budget and ten-year models are summarized below .
The implementation of the new Enterprise Resource Planning (ERP) software system will require funding for backfill and support of the implementation team. As this is an 18- month citywide impact, we are projecting about $850,000 in additional staffing/consultant needs. Ahead of the ERP implementation, HR needs to evaluate and update the City’s job architecture . This much needed $100,000 project can be designed ahead of and implemented as part of the ERP system deployment .
The City continues to plan for the future of Police and emergency management radios . There is currently $2 .0M set aside which is about $500,000 below what will be needed for replacement . The $500,000 addition is included .
The Arvada Economic Development Association is in need of additional funding to support the business community and economic develop opportunities . An infusion of $250,000 will support their important investment in Arvada’s economic development
In alignment with the CCSP and as recommended by the Sustainability Advisory Committee, the team is recommending $150,000 in one-time funding for the development of a Sustainability Plan
A full list of one-time needs incorporated into the Proposed 2024 budget can be found on page 79
Presentation of the Budget Document
The Proposed Revised 2023-2024 Biennial Operating and Capital Budget begins with the City Council Strategic Plan as the foundational document that guides the allocation of resources Inclusion of the Strategic Plan is intended to emphasize the strategic focus associated with the allocation of resources in a manner that is consistent with Council and community priorities
The Community Profile provides a description of Arvada and summarizes the key demographics and characteristics of the community
The next section summarizes the Legal Requirements and a high-level summary of the Budget Process. This section includes an explanation of the fund structure, financial management standards/ policies and relevant state laws, including TABOR
14
2023-2024 Proposed Revised Biennial Operating and Capital Budget
Members of City Council - August 31, 2023
The Introduction section includes an overview of the national and local economies, and the impacts of both on City revenue sources Analysis of these impacts generates revenue and expenditure assumptions that are used to develop the 2024 Budget and the Ten-Year Financial Models for each of the City’s major funds The Ten-Year Financial Models are the foundation of our Ten-Year Financial Plan, which is a key requirement of the City Council Budget and Fiscal Policy Minimum fund balance goals which must be maintained for each year of the Ten-Year Plan are summarized for each of the major funds By meeting or exceeding the fund balance goal for each fund over the course of the Ten-Year planning horizon, the City is able to meet present and future financial challenges.
The Revenue and Expenditure Summary begins on page 71 and defines each of the City’s major funds, including the General Fund, Internal Service Funds and Enterprise Funds This section provides an overview of each fund by summarizing revenues, expenditures and changes to the fund balance for 2023-2024 . The Fund Highlights summary presents a brief description of the activity within each fund and related changes to the fund balance. Major differences between the 2023-2024 Adopted Biennial Budget and the Proposed Revised Biennial 2023- 2024 Budget are also reflected. A few key changes include:
• The total 2024 budget for all funds is $387,466,097 with $350,542,707 in revenues;
• The market rate adjustment for January of 2024 will be 3% for non-sworn and 4% for sworn employees;
• There will be no increase in health insurance premiums;
• Funding for an additional three positions is included in this proposed budget to support Courts and the City Attorney’s Office;
• An increase of $500,000 annually to the Streets Maintenance Fund to continue close the funding gap;
• One-time investments have been incorporated in the Proposed Revised 2023-2024 Biennial Budget to reflect immediate one-time needs;
• Continued commitment to safe, reliable, and high-quality water supply, drainage system and wastewater-disposal service A water rate increase of 12 % and a $2 increase in monthly service, a wastewater increase of 12% and a $2 increase in monthly service, and a storm water increase of 5% are necessary to maintain these services Even with these increases, the City’s rates are very low compared to the surrounding cities; and
• Significant changes to System Development Charges (formally Tap Fees) have been implemented in 2023 to better align the charges with the true costs and to allow the issuance of bonds to pay for much needed system improvements .
Presentation of the Ten-Year Financial Models begins on page 105, which summarizes financial assumptions for all funds, including for personnel expenses such as market-based compensation increases, benefits costs and transfers into Internal Service funds. More specific assumptions for each of the City’s major funds are presented prior to the actual tables showing the projected revenues and expenditures for each fund Please note that two pages are required to show the projections for each year of the Ten-Year Models, 2023-2032
All of the City’s major funds are balanced for each year of the 10-Year Financial Planning period and are therefore in compliance with the City Council Budget and Fiscal Policy with the exception of the Solid Waste Fund
15
2023-2024 Proposed Revised Biennial Operating and Capital Budget
Members of City Council - August 31, 2023
The Water, Wastewater and Stormwater funds include assumptions for on-going rate increases into the future. Increased inflationary costs have resulted in higher future-year rate increase assumptions than included in the 2023-2024 Adopted Biennial Budget. The City’s aging infrastructure requires significant investment as presented in recent infrastructure master plans .
The Work Systems section begins on page 135 with the Community and Economic Development Work System . This section provides additional revenue and expenditure details as well as the Strategic Results that are included within the City Council Strategic Plan for each work system . The Work Systems section is intended to illustrate the relationship of each work system to the Strategic Plan, show value and show transparency . Milestones and performance measures are included to help tell the story . Council and community members will be able to view this information and the status of performance measures . Capital Improvement Projects (CIPs) are presented beginning on page 175 . The CIPs are presented within the major functional areas of General Administration, Transportation, Street Maintenance, Parks, Water and Wastewater and Stormwater . Consistent with the Council Budget and Fiscal Policy and focus on long-term planning, the CIPs are projected over a long-term planning horizon through 2032 . All capital projects that require ongoing expenditures following completion include an estimate of Operations and Maintenance (O&M) costs that are allocated from the Ten-Year Financial Models of the appropriate fund.
The CIPs section summarizes the City’s focus on Taking Lasting Care (TLC) and implementing the priorities and projects identified by the Citizens Capital Improvement Project Committee (CCIPC), which was formed in 2015 at the direction of the City Council This section also summarizes Strategic Results included in the 2020-2025 CCSP that determine funding priorities within the 2023-2032 Capital Improvement Plan
The CIPs section also presents a summary of continuing capital projects, all projects currently funded in the Ten-Year Financial Model and a detailed description of the funding and expenditures for the 2023 projects All funded projects demonstrate alignment with the Strategic Plan, including the related strategic priority area and associated strategic principle Over $807 million is committed to CIPs through 2032 as noted on page 187
Following is a sample of high-priority projects underway throughout the City Each is explained in more detail within the CIPs Section . All projects will likely face cost increases and scope-of-work challenges resulting from inflation:
• Ralston Road Reconstruction, Phase II
• W . 72nd Avenue and UPRR Grade Separation
• Traffic Signal Replacement
• Annual Street Maintenance Asphalt and Concrete Replacement
• ADA Compliance – Facilities and Streets
• Sidewalks, Trails and Mobility
• Denver Water Moffat Project
• Water Distribution System Upgrades
• Ralston Plant Storage Tank Expansion
• North Trunk Sewer Line
• Median Renovations
• # 04 Trolley Park
16
2023-2024 Proposed Revised Biennial Operating and Capital Budget
Members of City Council - August 31, 2023
• Meyers Pool Replacement
• Public Safety Evidence Storage Building
At the end of the CIPs section (page 285), there is a list of over $461 million in un-prioritized projects .
A summary of Debt Service Obligations is presented beginning on page 287 This section summarizes the City’s long-term debt obligations, reviews state laws that regulate debt obligations and presents the City’s bond ratings
The Pay Plan Schedules section presents a summary of changes to the City positions within each Work System . The summary starts on page 297 with the titles for the added positions and continues with changes due to new titles or reclassifications for existing positions.
The City Council Budget and Fiscal Policy is presented on pages 322-325 and is included to emphasize the connection of the budget to the CCSP and provide other foundational elements associated with the budget, including mandated minimum reserve levels for each fund, updated Ten-year Financial Models, timely reporting of CCSP Strategic Results and Internal Service Funds . As previously mentioned the City team will bring forward recommended changes to the Fiscal policy in the fourth quarter of 2023 .
The final section of the budget is the Glossary of Terms, which is provided to assist those unfamiliar with budgeting terms and includes a few terms specific to the Arvada financial planning process.
On the Radar
While Arvada remains in a very financially strong and resilient position, we must recognize that we will face challenges in the near future and over the long term. Inflation and economic uncertainty will remain challenging into the near future Like many surrounding agencies, vacancies in Police Department staffing remain of concern. Conservative financial management will be important. Although we have met our goal in minimizing changes, and additions, to the Adopted 2023-2024 Biennial Budget, we recognize additional resources will be needed to fund current projects, initiatives and service levels
Initiatives
Affordable housing, homelessness, sustainability and DEI are important initiatives included in the CCSP Planning and action are underway in all of these areas We continue to work with external partners and agencies to elevate and accelerate our impact in these areas
• Affordable Housing – The City has established a Housing Advisory Committee to support and inform the City in the area of Affordable Housing. The City has been successful in receiving grant dollars and allocating resources
• Homelessness – We have developed an action plan including city-wide participation in addressing needs and connecting the unhoused with needed and desired resources . Council is fully supportive of this work and receives periodic updates . In collaboration with regional partners and external non-profits, we continue to move forward in developing navigation service opportunities for the unhoused .
• Sustainability – At the request of the Council appointed Sustainability Advisory Committee, a 2024 Budget request to fund a Sustainability Action Plan is included herein .
17
2023-2024 Proposed Revised Biennial Operating and Capital Budget
Members of City Council - August 31, 2023
• DEI – The City’s internal efforts to evaluate and advance City policies and process continue to move forward
Although these initiatives are not explicitly broken out in this document, planning, resourcing and problem-solving efforts continue.
Grant Funds
Significant funding has been made available at the state and federal level. The City has, and will continue to pursue available and feasible funding opportunities .
With Council direction, the City opted into Colorado Proposition 123, the Dedicate State Income Tax Revenue to Fund Housing Projects Initiative, which was approved on November 8, 2022 . The initiative created the State Affordable Housing Fund (SAHF) and dedicated one-tenth of one percent (0.1%) of state income tax revenue to fund affordable housing programs and projects. The initiative created the Affordable Housing Support Fund to receive 40% of funds in the SAHF and the Affordable Housing Financing Fund to receive 60% of funds in the SAHF. This action provides additional significant funding opportunities for the City, as well as other agencies and developers in Arvada
City Infrastructure
The City has more than $1.4 B in assets. Our assets and infrastructure require significant investment in maintenance, repair, and replacement As noted earlier, the City needs to increase our annual investment in transportation infrastructure by $8 M This $500K increase proposed herein is only a fraction of what is needed Recommended increases in Utility rates are driven by the need for additional investment in Utilities Infrastructure And although Streets and Utilities currently have the highest need for reinvestment, in order to remain resilient, the City must reinvest in all assets
Financial Resiliency
The CCSP includes the new Strategic Result: “Based on long-term financial projections and updated masterplans, develop financial resiliency recommendations to ensure adequate and ongoing investment in city infrastructure and core services.” As part of this budget development process, we have taken the first steps in analysis of service levels and revenue forecasts. We will present recommendations to the City Council by December 2024 . The purpose of this work is to recognize our funding challenges and address them through a planned, measured and strategic process ahead of the need to make immediate decisions and choices . It is anticipated that the options will include a combination of service level reductions, strategies to increase revenue, and initiatives to create efficiencies that will reduce operating costs .
Concluding Comments
As discussed, our goal was to minimize changes to the 2023-2024 Adopted Biennial Budget . Considering the challenging economy, job market, and external threats, I believe that we have met that goal . We have assessed our financial resilience considering programs, service levels and the likelihood of decline in certain revenue sources. With an uncertain economy, and flat revenue projections, the City needs to remain focused on ensuring sustainable services, finishing the projects that are underway and implementing the strategic plan initiatives
18
2023-2024 Proposed Revised Biennial Operating and Capital Budget
Members of City Council - August 31, 2023

The information and recommendations included herein reflect the collaboration and good thinking of the City team I am grateful for the work and support of the Finance Department in guiding City Department Leaders in the development of this 2023-2024 Proposed Revised 2023-2024 Biennial Budget
Respectfully submitted,
Lorie B Gillis City Manager
19
Intentionally left blank
21
Council Strategic Plan

23 Council Strategic Plan 25 26 27 27 28 29 31 31 32-33 35 35 36-38 39 39 40-41 43 43 44 45 45 46-49 51
Intentionally left blank
25 Council Strategic Plan

26 Council Strategic Plan
27 Council Strategic Plan
28 Council Strategic Plan
29 Council Strategic Plan
Intentionally left blank
31 Council Strategic Plan
32 Council Strategic Plan
33 Council Strategic Plan
Intentionally left blank
35 Council Strategic Plan
36 Council Strategic Plan
37 Council Strategic Plan
38 Council Strategic Plan
39 Council Strategic Plan

40 Council Strategic Plan

41 Council Strategic Plan
Intentionally left blank
43 Council Strategic Plan

44 Council Strategic Plan
45 Council Strategic Plan
46 Council Strategic Plan
47 Council Strategic Plan
48 Council Strategic Plan
49 Council Strategic Plan
Intentionally left blank

51 Council Strategic Plan
Intentionally left blank
COMMUNITY PROFILE
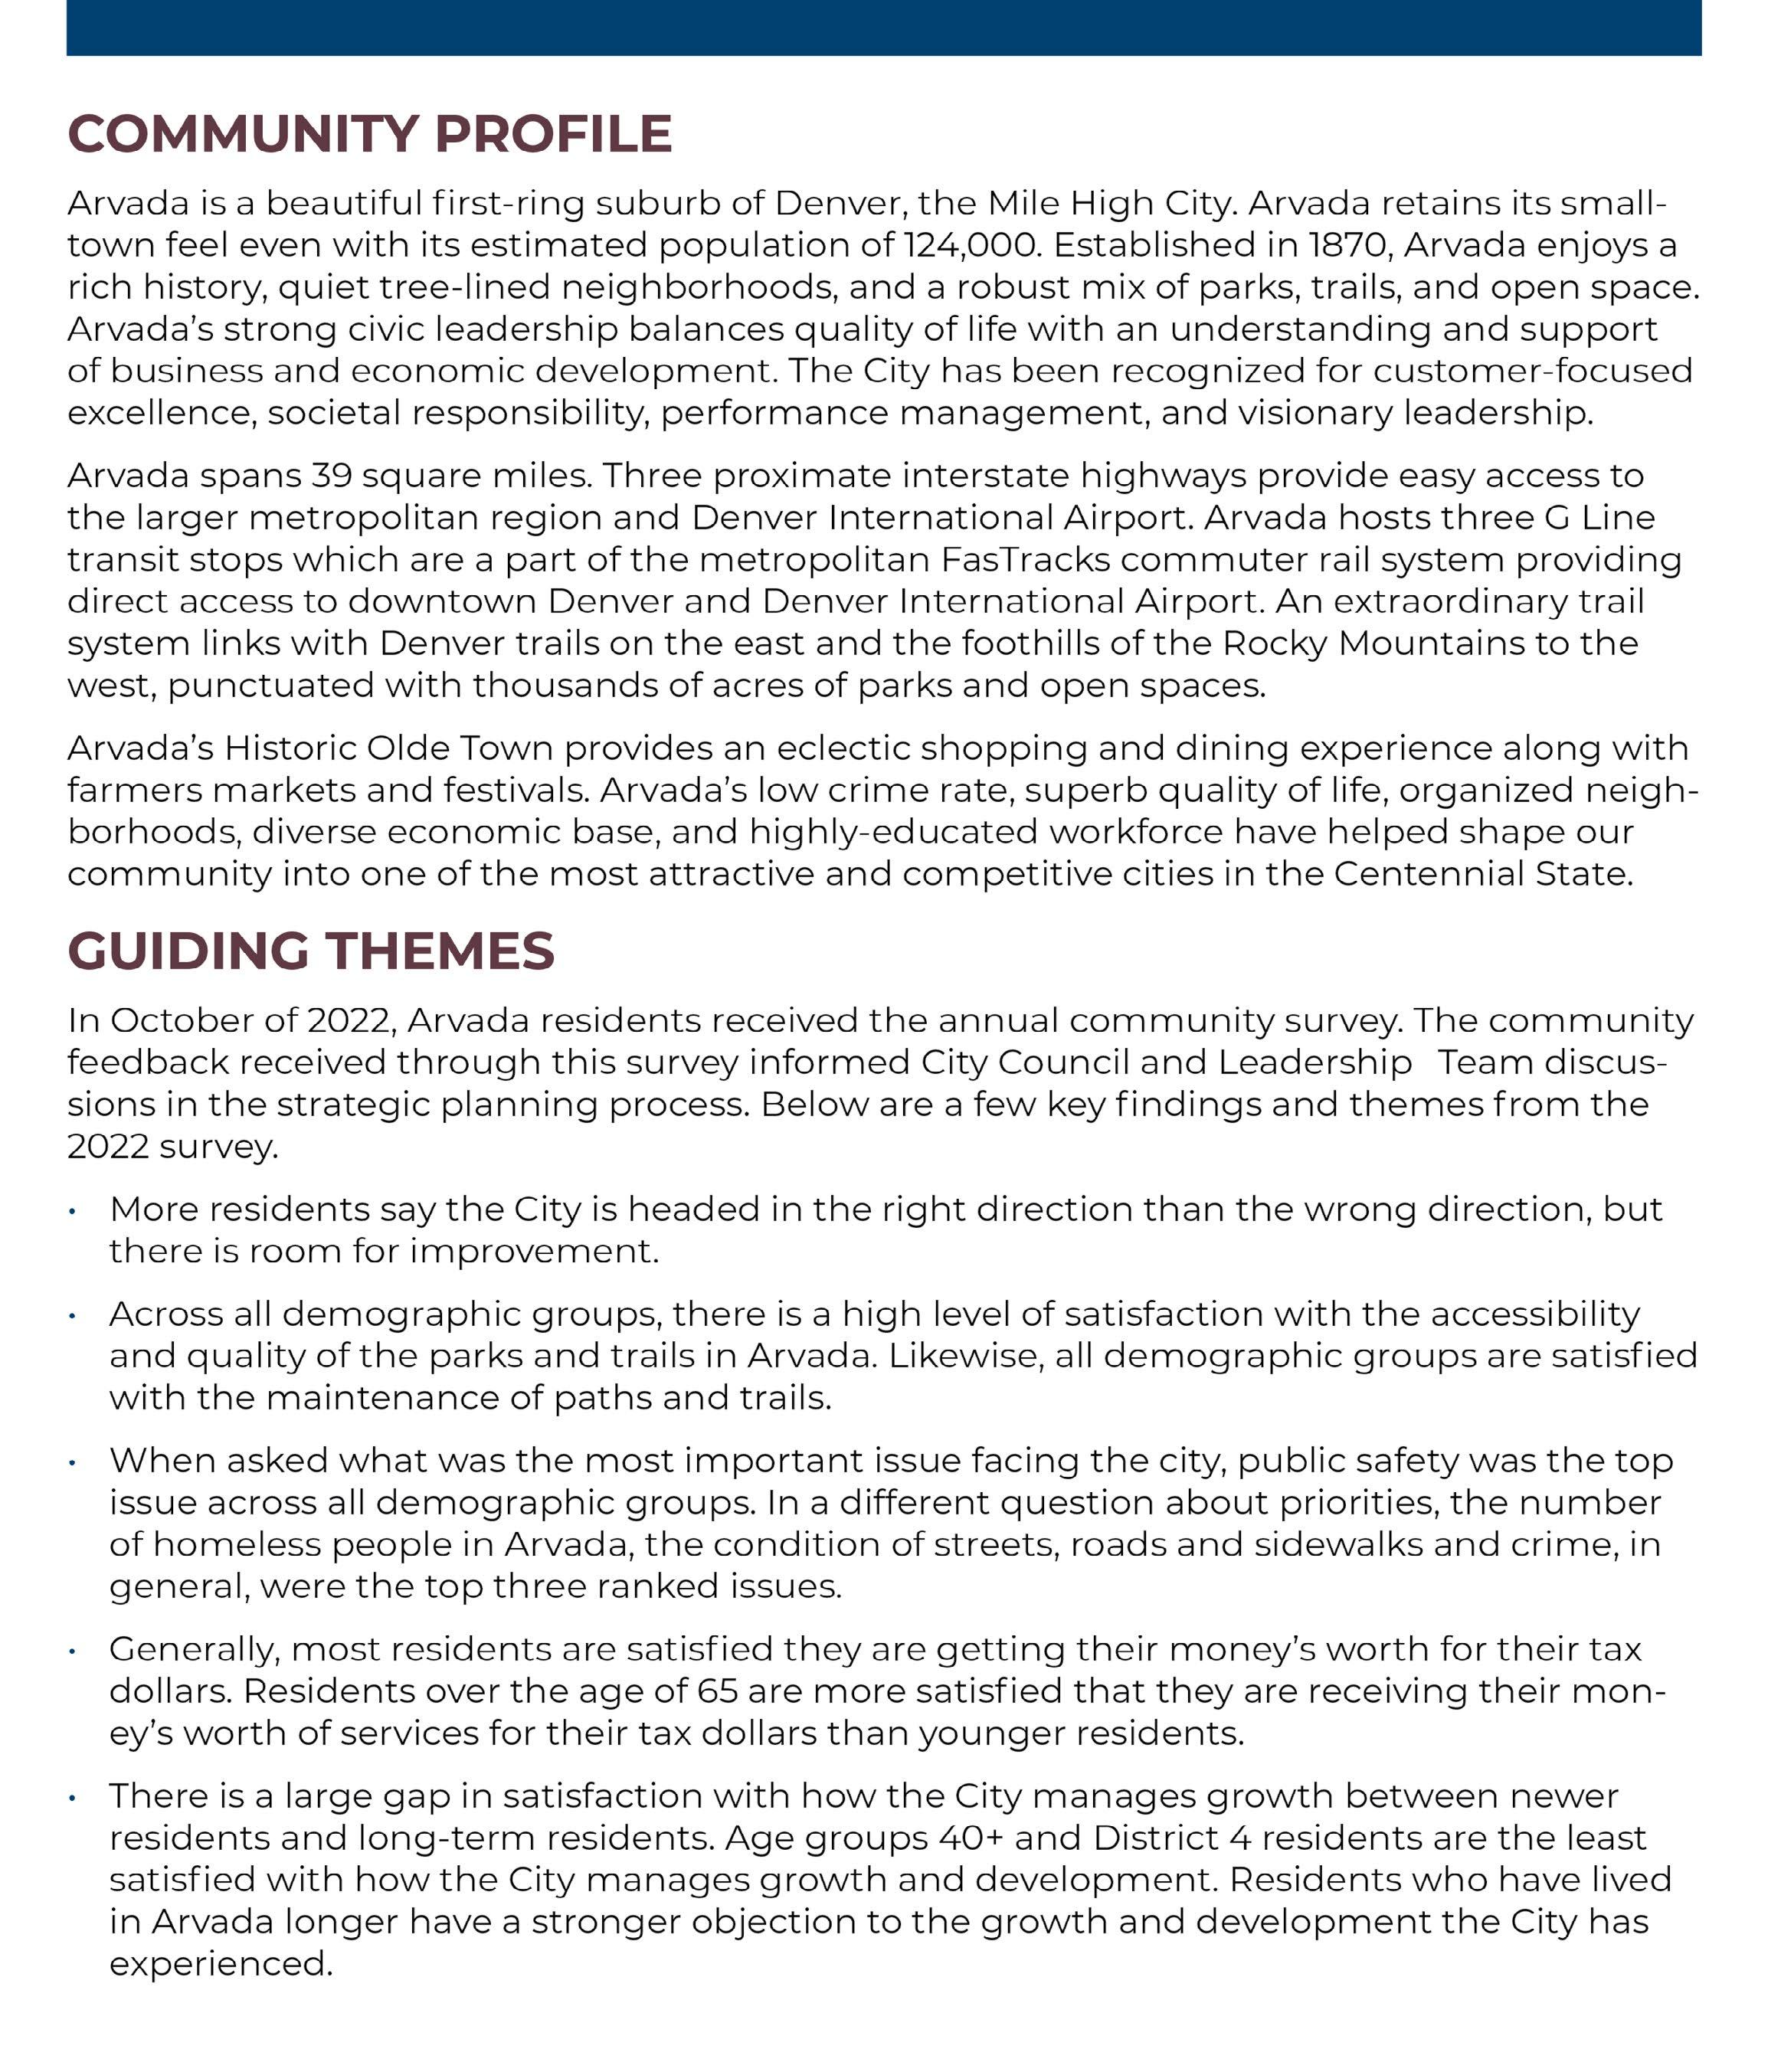
Arvada is a beautiful first-ring suburb of Denver, the Mile High City, with a small-town feel despite its estimated population of 123,170 Established in 1870, Arvada enjoys a rich history, quiet tree-lined neighborhoods, and a robust mix of business Our strong civic leadership balances quality of life with an understanding and support of business and economic development . The City has been recognized at the state and national level for its business retention program .
Arvada’s land encompasses nearly 23,000 acres Three proximate interstate highways provide easy access to the larger metropolitan region and Denver International Airport An extraordinary trail system links with Denver trails on the east and the foothills of the Rocky Mountains to the west, punctuated with thousands of acres of parks and open spaces .
Arvada’s historic downtown provides an eclectic shopping and dining experience, and includes one of three area transit stops as part of the metropolitan FasTracks light rail system
Arvada’s diverse economic base, highly educated workforce, low crime rate, and superb quality of life have helped shape our community into one of the most attractive and competitive cities in the Centennial State!

53
2023-2024 Proposed Revised Biennial Operating and Capital Budget
Real Estate - Residential
• Median Rent: $1,443
2023-2024 Proposed Revised
Biennial Operating and Capital Budget
Work Force
• Jobs in Arvada: 27,685


• Median Income: $102,500
• Unemployment Rate: 3 .1%
Population
• 123,170
• Households: 49,411
• Average Family Size: 2 5
• Owner Occupied: 76% (vs . 24% Renter Occupied)
• Median Single Family Home Sales Price: $501,650
• Median Townhouse/Condo Sales Price: $330,500
Real Estate - Office
• Average Rent(Sq Ft): $21
• Vacancy Percentage: 6 6%
• Vacant Sq Ft: 114k
Real Estate - Retail
• Average Rent (Sq Ft): $21
• Vacancy Percentage: 3 5%
• Vacant (Sq Ft): 224k
Real Estate - Industrial
• Average Rent (Sq Ft): $12

• Vacancy Percentage: 5 5%
• Vacant (Sq Ft): 266k
Education

• K-12 Schools: 31
• Students: 15,711
• Teachers: 1,248
Vision:
We Dream Big and Deliver
Mission:
We are dedicated to delivering superior services to enhance the lives of everyone in our community
Values:
Innovation - We excel in creativity, flexibility and the use of best practices while valuing diverse backgrounds, ideas and perspectives.
Passion - We are a high performing, inclusive team inspiring each other to pursue excellence.
Opportunity - We value our diversity, embrace possibilities, face challenges, perservere and take action to deliver quality results. * Information provided by the Arvada Economic Development Association

• Other Staff: 901

54
2023-2024 Proposed Revised
Biennial Operating and Capital Budget
LEGAL REQUIREMENTS AND BUDGET PROCESS
The City of Arvada is a political subdivision of the State of Colorado, located in Jefferson and Adams Counties in the Northwest quadrant of the greater Denver, Colorado, metropolitan area . The City Charter establishes a Council-Manager form of government The City’s governing body consists of an elected Mayor and six -member Council. The Mayor and Council appoint a City Manager. The City of Arvada is a “home rule” City, governed by its City Charter, the Colorado State Constitution, and City ordinances as adopted by the City Council .
The City Charter requires the adoption of budgets for the general fund, special revenue funds, debt service funds, capital projects funds, and proprietary funds. Budgets are not required for fiduciary funds. A fiduciary fund is custodial in nature and is used to account for assets that the government holds for others in an agent or trustee capacity .
City Council annually appropriates all budgeted funds with the exception of the capital projects funds . Project-length budgets are adopted for these funds. The City adopts budgets for all funds using the modified accrual basis of accounting, the same basis used in the entity’s financial statements, consistent with generally accepted accounting principles (GAAP) .
The City Manager submits a proposed budget to the City Council for each of two budget years (January 1 to December 31) The budget includes an explanatory message and is submitted in early September The proposed budget contains a complete and detailed financial plan for all City funds. The proposed budget is open for public inspection and review . By October 15th, City Council conducts at least one public hearing on the proposed budget. Not less than sixty days prior to the first day of the next fiscal year, City Council adopts the City budget by resolution and the annual appropriation by ordinance . The City prepares a combination line-item and program budget, but the legal level of control is at the fund level which is the amount approved by ordinance
2024 BUDGET PROCESS CALENDAR
FEBRUARY Revenue & Expenditure assumptions criteria completed
MARCH City Council Strategic Retreat
APRIL Departments present capital requests with associated operating costs
MAY City Manager & departments develop CIP recommendations/ Update 10-year Model
JUNE Departments develop Operating Budgets for 2023-2024
JULY Council begins review of Proposed CIP and 10-Year Plan
AUGUST City Manager and budget team prepare recommended budget
SEPTEMBER Council reviews recommended 2023-2024 operating budget with 10-year revenue and expenditure plans
OCTOBER Adoption of 2023-2024 Operating Budget and CIP with 10-year considerations
DECEMBER Publication of final Budget and CIP

55
FUND STRUCTURE
A brief description of the City of Arvada’s fund structure follows:
Governmental Funds (General, Special Revenue and Debt Service)
• General Fund - This fund accounts for all the financial resources of the City which are not required to be accounted for in another fund
• Streets Fund - This fund accounts for costs associated with street repair and replacement including crack sealing, chip sealing, seal coating, milling and overlay and reconstruction . Revenues are derived from the City’s General Fund and the Highway Users Tax Fund which is the City’s share of state-collected tax revenue . This fund is budgeted separately, but included with the General Fund in the City of Arvada’s Annual Comprehensive Financial Report (ACFR)
• Arvada Housing Authority Fund – The Section 8 Housing Assistance Payments Program is administered by the Arvada Housing Authority
• Community Development Fund – This fund accounts for all entitlements, revenues and expenditures of the Community Development Block Grant (CDBG), the Home Rehabilitation and the Essential Home Repairs programs .
• Parks Fund – This fund accounts for costs associated with the acquisition, design, development, maintenance and beautification of parks, open space and trails within the City. The Parks Fund also provides athletic field programming and maintenance.
• Police Seizure – Colorado State Statutes authorize local law enforcement agencies to seize cash and other assets belonging to persons convicted of public nuisance crimes . This fund was established to account for these resources as they are awarded and expended by the City’s law enforcement agency
• Police Tax Increment Funds – The purpose of the tax increment funds is to account for the voter-approved sales tax increments ( .21 and .25) to fund expanded police services .
• Grants Fund – This fund accounts for receipt of lottery monies through the Conservation Trust Fund .
• COP Debt Service Fund – This fund accounts for the payment of principal and interest on the $11,820,000 Series 2015 Refunding Certificates of Participation, the $11,180,000 Series 2016 Certificates of Participation and the $35,210,000 Series 2021 Jefferson County School District/ City of Arvada joint Certificates of Participation.
• Debt Service Fund – This fund accounts for the payment of principal and interest on the $70,825,0000 Series 2019 Sales and Use Tax Bonds and the $7,230,000 Series 2023 Sales and Use Tax Bonds
• Capital Improvement Projects Fund – This fund accounts for the financial resources to be used for the acquisition or construction of major capital facilities (other than those financed by the Enterprise or Internal Service Funds) . This fund also accounts for the proceeds from the $70,825,000 Series 2019 Sales and Use Tax Revenue Bonds and $7,230,000 Series 2023 Sales and Use Tax Bonds
56
2023-2024 Proposed Revised Biennial Operating and Capital Budget
The major Governmental Funds, as reported in the 2022 City of Arvada Annual Comprehensive Financial Report (ACFR), were the General Fund, Community Development Fund, Parks Fund, Construction Fund and the General Capital Improvement Projects Fund .
Internal Service Funds
• Insurance Service Fund – This fund accounts for the activities associated with the City’s worker’s compensation and property and liability insurance activities
• Print Shop Fund – This fund accounts for the activities associated with the print shop operations .
• Computer Fund – This fund accounts for the accumulation of financial resources necessary for the timely and orderly replacement and maintenance of the City’s computers .
• Vehicles Fund – This fund accounts for the accumulation of financial resources necessary for the timely and orderly replacement and maintenance of the City’s vehicles and equipment
• Building Fund – This fund accounts for the accumulation of financial resources necessary for the maintenance of City buildings .
Enterprise Funds
• Water Fund – This fund accounts for administration, operations, capital outlay, maintenance, financing and related debt service and billing and collection for the water utility operations.
• Wastewater Fund – This fund accounts for administration, operations, capital outlay, maintenance, billing and collection for the collection, transmission and disposal of sewage and wastewater
• Stormwater Fund – This fund accounts for all activities necessary to maintain a stormwater management plan .
• Solid Waste Fund – This fund accounts for all activities necessary to maintain the solid waste and recycling program
• Golf Course Fund – This fund accounts for all revenues and expenses of the Lake Arbor and West Woods Golf Courses .
The major Enterprise Funds, as reported in the 2022 City of Arvada ACFR, were the Water Fund, the Wastewater Fund, the Stormwater Fund, the Golf Course Fund and the Solid Waste Fund .
57
2023-2024 Proposed Revised Biennial Operating and Capital Budget
2023-2024 Proposed Revised
Biennial Operating and Capital Budget
The following table shows each City Work System and its associated fund(s):
Basis of Budgeting
Annual budgets for governmental funds (General, Special Revenue and Debt Service funds) are prepared separately using the modified accrual basis of accounting, the same basis of accounting that is used in the entity’s financial statements. Under the modified accrual basis of accounting, revenues are recognized in the accounting period in which they become available and measurable, and expenditures are recognized in the accounting period when the liability is incurred, if measurable
Annual budgets are also created for all Enterprise and Internal Service funds . This basis used to budget these funds is also a modified accrual basis of accounting which includes capital expenditures and current debt service principal and interest payments and excludes depreciation, amortization and adjustments for accrued compensation absences
58
Fund Community and Economic Development Infrastructure Organizational and Service Effectiveness Vibrant Community and Neighborhoods Safe Community General Fund X X X X X Grants Fund X X X X X Street Maintenance Fund X Community Development X X Arvada Housing Authority X Parks X Police Seizure X Police Tax Increment Fund .21 X Police Tax Increment Fund .25 X COP Debt Service X Debt Service Fund X Capital Projects Fund X X Special Assessments Fund X Water Fund X Wastewater Fund X Stormwater Fund X Solid Waste Fund X Golf Course Fund X Insurance Fund X Computer Fund X Print Shop X Vehicle Fund X Building Fund X
2023-2024 Proposed Revised
Biennial Operating and Capital Budget
Budget Control and Budget Transfers
Control of expenditures is exercised at the fund level . Once the City Council adopts the budget, the City’s financial management system is used to monitor activity. Quarterly financial reports are prepared for City Council and compare actual expenditures and revenues against the budgeted and prior year amounts . Reviewing actual expenditures to budgeted amounts on a fund-by-fund basis ensures that expenditures are within the legal appropriated limits required by the City’s Charter
Once the budget is adopted, transfers between line items for regular operating expenses, within funds and programs, can be accomplished with the approval of the department director . Transfers from any personnel accounts require the approval of the department director and the City Manager
Budget Amendments and Supplemental Appropriation
The adopted budget can be amended during the year . This action requires City Council approval in the form of a resolution . At the end of the year City Council approves a supplemental appropriation by ordinance for the budget amendments approved throughout the year for any unforeseen changes arising after the adoption of the annual appropriation A supplemental appropriation can be made as long as the total amount budgeted does not exceed the actual or anticipated revenues and the available fund balance
Lapsed Appropriations
All appropriations not spent at the end of the year lapse into the fund balance applicable to the specific fund except for appropriations in the Capital Improvement Fund which do not lapse until the project is complete or abandoned
Ten-Year Financial Models
In 2015, City Council adopted a budget and fiscal policy that utilizes long-range planning for each of the City’s major operating funds to maintain the fiscal health of the City. Specifically, the City prepares a twoyear budget based on a ten-year financial model. This method of budgeting is used to determine if future impacts of the current proposed budget are fiscally sound. Using this ten-year model, the City is able to test the effects of current financial decisions on future years’ financial conditions when approving funding requests throughout the organization .
There are many variables and factors that impact the ten-year model These components include the following: beginning fund balance, projected revenues, projected expenditures (including capital expenditures), ending fund balance and required Council established fund balance goals Revenue and expenditure projections are based on historical trends, various economic and inflation forecasts, and known changes in operations, legislation and capital outlay requirements .
The budget process begins with the estimated beginning fund balance for the current year Projected revenues and expenditures are applied to the beginning balance to calculate the ending balance for the proposed budget year This process is continued for the next ten years The resulting calculation of the ending balance in year ten is compared to the calculation of the minimum required fund balance goal . The bottom line is that each fund should work towards maintaining a fund balance that is equal to, or exceeds, the required fund balance goal in the tenth year. The “Ten-Year Models” section of this document includes summaries of ten-year financial models for the City’s major operating funds.
59
2023-2024 Proposed Revised Biennial Operating and Capital Budget
The comparison of ending balances to the required fund balance goal in the tenth year reveals whether or not adjustments in the current level of proposed expenditures are necessary in order to maintain long-term financial stability. If the ending balance is equal to or exceeds the fund balance goal, no adjustment in the current proposed budget is necessary . The fund may also contemplate additional expenditures based on the needs in the fund . However, if it is less than the ending fund balance and the fund balance goal, the City has ten years to either eliminate one-time capital expenditures, reduce on-going operating expenditures, or some combination of the above to work toward the fund balance goal
Taking a long-term view of the City’s current operations insures that the City acts in a fiscally responsible manner . Budgeting in this manner also allows management time to react and respond to changes in the economy and minimizes the effect of budget fluctuations on service delivery.
The City defines a balanced budget when estimated expenditures do not exceed estimated revenues and available fund balance for each year of the two-year budget . For the 2023-2024 revised budget, the City proposed a balanced budget .
Financial Planning Policies
• The City Manager is responsible for recommending a balanced budget to the City Council sixty days prior to the first day of the next fiscal year.
• The City defines a balanced budget when estimated expenditures do not exceed estimated revenues and available fund balance .
• The City’s budget is prepared on the modified accrual basis for all funds, and assumes that prior year ending fund balances may be utilized to balance the budget
• The City avoids the use of non-recurring and unpredictable revenues to fund ongoing expenditures
• The City will create and maintain a ten year financial forecast for each fund identified in the Council budget and fiscal policy and work towards maintaining a fund balance that is equal to, or exceeds the fund balance goal in the tenth year .
• The City will provide ongoing funding for required capital replacement through the Computer Maintenance and Replacement Fund, Vehicle Maintenance and Replacement Fund and Building Maintenance Fund
The City will create a ten-year Capital Improvement Plan that lists all capital improvements proposed for the ten year period including a project description, estimated project cost and timeline and alignment with any City Council Strategic Results
Fund Balance Policy
A top priority of the City Council is to maintain the fiscal health of the City. Revenue projections are conservative and expenditures are monitored throughout the year . In stable economic times, the combination of these two strategies leads to revenue collections being higher than budgeted and expenditures being lower than budgeted The combination of the two usually leads to additional monies in the fund balance which can be used for unanticipated increases in expenditures, unforeseen reductions in revenues, financing of one-time capital expenditures, adding to the fund balance or a combination of all the above . If these monies are used for expenditures, their use is not approved until the next year .
Included in the budget and fiscal policy adopted by City Council in 2015, is a required fund balance reserve that is established to mitigate current and future risks (e g revenue shortfalls or unanticipated expenditures) . The City maintains a fund balance in its General Fund equal to 17% of annual expenditures . Three
60
percent is reserved for emergencies as required by Article X of the Colorado Constitution . The remaining 14% protects the City from cyclical fluctuations in revenues or unanticipated expenditures. The City, in conjunction with the City Council, also establishes an individualized fund balance requirement for various operating funds . Use of fund balance reserves must be recommended by the Finance Director, and approved by the City Manager and City Council .
Cash Management and Investment Policy
The Colorado statutes and the City of Arvada Investment Policy govern general provisions for the City’s investment strategies The investment policy for the City shall apply to the investment of all general and special funds of the City of Arvada over which it exercises financial control.
The City’s objectives for cash management and investments are:
• Preservation of capital through and protection of investment principal
• Maintenance of sufficient liquidity to meet the City’s cash needs
• Diversification to avoid incurring unreasonable market risks
• Maximization of the rate of return for prevailing market conditions for eligible securities
The Investment Policy further restricts the investment of City funds to the following types of securities and transactions:
• U S Treasury Obligations
• Federal Agency and Instrumentality Securities
• Repurchase Agreements
• Commercial Paper
• Corporate Debt
• Municipal Bonds
• Certificates of Deposit
• Supranationals
• Local Government Investment Pools
• Money Market Mutual Funds
• Securities of the City of Arvada
Debt Policies
• Short-term borrowing or lease-purchase contracts may be considered for financing major operating capital equipment when the Finance Director, with approval of the City Manager and City Council, determines that this is in the City’s best financial interest.
• Long-term debt will not be used to finance current operating expenses. When long-term debt is warranted for a project, the payback period for bonds used for the project must not exceed the useful life of the project .
• The City of Arvada will attempt to obtain a minimum AA bond rating, although is currently rated AAA, and maintain a favorable rating through prudent financial management and adherence to a policy of full disclosure on financial reports.
• As required by State Statute, appropriate elections will be held to obtain voter approval for debt issuance .
• The City will hire qualified bond counsel and financial advisors and market its debt on a competitive basis .
• Refunding or prepayment of outstanding debt may occur when the possibility of interest cost reduction exists, or the City wishes to restructure its debt service
61
2023-2024 Proposed Revised Biennial Operating and Capital Budget
Taxpayers’ Bill of Rights (TABOR)
In 1992, voters approved an amendment to the Colorado Constitution (Article X, Section 20) that places limits on revenue and expenditures of the state and local governments . Even though the limit is placed on both revenue and expenditures, the constitutional amendment ultimately applies to a limit on revenue collections . Growth in revenue is limited to the increase in the Denver-Boulder Consumer Price Index plus local growth (new construction and annexation) This percentage is added to the preceding year’s revenue base, giving the dollar limit allowed for revenue collection in the ensuing year Any revenue collected over the limit must be refunded to the citizens Federal grants or gifts to the City are excluded in the revenue limit .
In November 1996, the qualified electors of the City approved Resolution R-96-127 which reads as follows: Without creating any new tax or increasing any current taxes, shall the City of Arvada be permitted, in 1996 and each year thereafter, to retain and spend City revenues in excess of the spending, revenue raising, or other limits in Article X, Section 20 of the Colorado Constitution, utilizing such revenues for public safety, municipal services, transportation and other public improvements, parks and recreational facilities, and any other lawful public purpose?
2023-2024 Proposed Revised Biennial Operating and Capital Budget 62
2023-2024 Proposed Revised
Biennial Operating and Capital Budget
INTRODUCTION
Arvada is continuing to make decisions under the FOCUS performance-management system This integrated performance-management system is not a project with a defined end date. Rather, this is a process that defines how staff looks at what they do each day and how this supports the City Council Strategic Results . It provides data for decision making and helps drive funding decisions for the many programs Arvada citizens want and need . Citizens will be able to see the value they receive for their investment through the performance measures and strategic results
All the revenue and expenditure assumptions for the proposed revised 2023-2024 Biennial Operating Budget were made in the context of the FOCUS Arvada framework . Each department’s budget was based upon five key elements: a mission statement, a vision statement, Council strategic plan, department strategic results and programs Using this framework and keeping the customer experience in mind, key results are identified that are to be accomplished during the two-year budget.
On September 16, 2019, City Council adopted a new six-year City Strategic Plan 2020 to 2025 . Their plan outlined five priority areas and 29 strategic goals to be accomplished over the next six years. City staff uses the Council’s identified strategic measures to develop milestones and measures to identify what results are being achieved and what needs refined. With these measures in place, discussions follow pertaining to process and budget, with the resulting goal of a true performance-based system City Council adopts annual revisions to the strategic plan to recognize updates to current goals and remove goals that have already been achieved The revisions approved on June 1, 2020 changed the timelines on a few of the approved measures due to the COVID pandemic . The revisions approved on July 19, 2021 added four measures to the plan . The revision approved on May 16, 2022 added seven measures to the plan and removed two measures The most recent revision, the fourth revision to the plan, was approved on May 1, 2023 and included one new measure, changed the timelines on nine measures and removed one measure
National Economy
US Gross Domestic Product (GDP) grew at an annualized rate of 2 .1% for the year ending 2022, a sharp slowdown compared to 2021 but in line with expectations of 2% GDP has continued to grow at this pace, up 2 .4% through the second quarter of 2023 . Spending has been wide spread but a big chunk of the increase was from services, including vacation travel, restaurants and large concerts
The Federal Reserve, trying to slow down the runaway train known as inflation, raised interest rates seven times in 2022 from 25%- 50% to 4 25%-4 50% – the fastest increase ever They have continued this practice in 2023, raising rates 25 basis points at the February, March, May and July meetings . The short term interest rate now sites at 5 25-5 50%, the highest number in 22 years
Inflation has slowed, with the second quarter increase sitting at 2.6%. This is down from the revised number of 4.1% in the first quarter and the 7.2% felt in the first half of last year. While inflation has slowed, we are still a long way away from the Fed’s goal of 2 .0% . Unemployment continues to remain low, sitting at 3 6% Even though new job production has slowed, market participation rate has remained steady and current available jobs still outnumber workers looking at almost 1 .5 times .
The yield curve between the 2-year and 10-year continues to be inverted and shows no signs of changing Historically, this has been a predictor of a recession with the average time to a recession of 18 months The curve first inverted in March of 2022, 16 months ago..
Local Economy
The City’s general revenue collection is influenced by many different factors. Two of the major contributors are sales tax and building activity . As illustrated in the discussion below, the City has experienced
63
2023-2024 Proposed Revised
Biennial Operating and Capital Budget
very positive results in nearly every major sales tax revenue category for the past ten years . In 2022, the City experienced consistent revenue growth with every month up over 8% except June and December . The majority of this growth was driven by the increase in on-line sales and inflation. The City finished the year with a 9.6% increase in sales tax revenue. The City’s retail offerings include many essential businesses such as grocery, warehouse, online retail and home improvement stores This has allowed sales tax, the City’s largest revenues source, to be more stable than many other government entities . 2023 appears to be following the positive results of 2021 and 2022 with specific areas starting to slow down. Auto Use and General Use taxes are down compared to last year, Property Tax, Court Revenues and Interest Revenues are flat and Sales Tax and Building Revenues continue to be strong.
Sales Tax
A 3% sales tax rate on all goods sold within the city limits pays for more than 53% of the General Fund services In addition, it pays for 82 police positions through an additional dedicated 0 46% tax on the same goods .
In eight of the past ten years, there has been significant sales tax growth. The following graph illustrates the percentage increase each year since 2015 Since 2015, sales tax grew an average of 6%, significantly higher than the expected growth rate of 2.5-3.0%. In the last two years, sales tax growth has exploded to an average of 12% per year . Initial estimates for sales tax growth in 2020 were conservative given all the COVID-19 restrictions The City saw an incredible increase of 9% in 2020 and this was followed up by a 15% increase in 2021 and a 9% increase in 2022 . The large increase in sales tax can be attributed to the City’s main sales tax generators which are grocery stores and general department stores, that had double digit increases, and explosive on-line retail . The City experienced a 48% increase in its on-line retailer’s category as a result of the Marketplace Facilitators Act that was passed in October 2019. Sales tax in the first half of 2023 is continuing at high pace up 5% through the second quarter. There are signs that sales tax may level off in the second half of 2023 with consumer spending stating to slowdown For the revised 2023-2024 budget, the City has projected growth in sales tax to be 3 .5% and 1 .5% respectively .

64
-4.0% -2.0% 0.0% 2.0% 4.0% 6.0% 8.0% 2015 2016 2017 2018 2019 2020 2021 2022 2023 2024 % change 6.2% 4.8% 6.0% 1.3% 2.5% 9.1% 15.4% 9.5% 3.5% 1.5%
Growth (%)
Sales Tax
2023-2024 Proposed Revised
Biennial Operating and Capital Budget
Building Activity
The following graph demonstrates the trend in single-family housing permits . The majority of this growth from 2012- 2016 is due to two new housing developments in northwest Arvada . However, the City also saw an increase in the smaller in-fill developments around the G Line transit stations. In 2017, the City saw the first decrease in single-family detached home permits since 2011. This trend continued from 2018 through 2021 In 2022 there was a small uptick with a return to a base level of building activity expected in 2023 and beyond .
Single-Family Detached Home Permits
While the decrease in building activity directly affects building revenues, the City conservatively budgets for building activity and bases building revenue on an average year Revenues from building activity generated over $10 4 million of the City’s 2022 revenues for general operating purposes, including building use tax and building permits for the General Fund . This amount is reduced to $6 .9 million in 2023 to account for the base level of building activity . A small growth factor of 2 .5% - 3 .0% has been assumed for 2024 and beyond .
Economic Environment


Unemployment
Unemployment hit a peak of almost 14 7% in April 2020, the highest observed rate since data collection began in 1948 . At the state level and local level, this number reached 12 .2% . A large percentage of the jobs that were lost were in the service industry . By December of 2020 the unemployment rate dropped to 6 .7% with the number falling all the way to 3 .9% at the end of 2021 . Unemployment has remained steady since that time period, currently sitting at 3 6% Many industries are experience labor shortages, much like 2019, and have needed to cut back their service levels
65
0 100 200 300 400 500 600 700 800 900 1000 2011 2012 2013 2014 2015 2016 2017 2018 2019 2020 2021 2022
1.5 3.5 5.5 7.5 9.5 11.5 13.5 15.5 January February March April May June July August September October November December January February March April May June July August September October November December January February March April May June July August September October November December January February March April May June July August September October November December January February March April May June 2019 2020 2021 2022 2023
US Colorado Arvada
Unemployment Rates 2019-2023
2023-2024 Proposed Revised
Biennial Operating and Capital Budget
Ten-Year Planning
All of these indicators and more went into development of the assumptions for the “Ten-Year Models.” The 2023-2024 Revised Biennial Operating Budget document has a separate section for each Fund and the assumptions included in the ten-year plan
The ten-year model is not a budget, but a planning tool . It is important to understand the long-term implications of all current decisions and their impact on the City’s long-term financial plan. Each recommendation that is included in the ten-year plan includes all operating costs for any new capital or ongoing operation recommendation
Ten-year plans typically anticipate both upticks and downward trends. The prior ten years have reflected the benefits of economic growth, and the resulting increased revenues. With that said, projections in this ten-year plan include impacts of a slowing economy . Revenue growth is expected to continue through 2023 proposed slowdown in 2024 and 2025
Following is a summary of significant revenue and expenditure assumptions in this updated ten-year plan .
Revenues
• Sales Tax revenue assumes a growth rate of 3 5% for 2023 and a 1 5% for 2024
• Building use tax revenue assumes a reset of the base in 2023 to $3,391,000 with a 3% in 2024 Increases of 1% - 4% are estimated for 2025 and beyond with a 0% in 2029 to reset the base again .
• Open Space revenues are derived from sales tax throughout the region . Open Space revenues are budgeted to increase at 3 0% - 4 5% for all years of the model
• Water rates are budgeted to increase 12% in 2024 with an additional $2 per month increase in the service fee Increases are estimated at 10% in the years thereafter The large increase is to help offset inflationary increases and help fund much needed bond issues to complete some large capital projects .
• Wastewater rates are budgeted to increase 12% in 2024 with an additional $1 per month increase in the service fee Increases are estimated at 10% in the years thereafter The large increase is to help offset inflationary increases; fund pass through charges from the Metro Reclamation District and help fund much needed bond issues to complete some large capital projects
• Stormwater rates will increase at 5% for 2025 . A 5% rate increase is projected for the years thereafter until the master plan work can be completed .
Expenditures
• Personnel-related costs were calculated based upon each employee’s current grade and step and include an assumption for future market-range adjustments (MRA’s) . The MRA methodology is not based on cost of living adjustments, but rather an analysis of each job class in an identified market. The MRA for 2023 was 3% and the budget for 2024 is 3 5%
• Medical cost increases are the most unknown due to external national forces and the full implementation of the Affordable Care Act. At this time, the increases are budgeted to be 0% in 2024 and 5% through the rest of the model. This represents the fifth straight year with no increases to the City’s health plan .
• Internal Service costs – insurance, building maintenance, vehicle maintenance and replacement and computer maintenance and replacement all have increases of 3% - 8% throughout the model
• Staff vacancy savings have been assumed in many of the funds. These are not the same across each fund due to the analysis of change in personnel by fund . Vacancy savings range from 1% to
66
2023-2024 Proposed Revised Biennial Operating and Capital Budget
as high as 3% .
• Ongoing street maintenance is now budgeted at $12 .5 million with an additional $ .5 million dollar transfer added starting in 2024 . Variable growth rates from 2 .0%-3 .0% are assumed for the rest of the model
Fund Balances
Over time, each fund needs a well-considered fund balance goal . In 2015, City Council adopted a budget and fiscal policy, included in this document under the Additional Information tax, setting out minimum required reserve levels All expenditures and revenues have to be considered within the context of ten-year implications The goal is to ensure all funds have a positive balance, meeting or exceeding the established goal, within the end of the ten-year planning horizon
• General Fund: 17% of fund expenditures .
• Parks, Golf and Hospitality: 11% of fund expenditures .
• Utility Enterprise Funds: 25% of fund expenditures These funds include: Water, Wastewater, Stormwater and Solid Waste
• Enterprise Funds: 11% of fund expenditures . This includes the Golf fund .

• Internal Service Funds: These funds have no adopted levels, except for the Print Shop which is 11% . All funds except the Enterprise funds are balanced throughout the model . The Enterprise funds fall under the required fund balance goal in the ten year model, but recover and meet the fund balance goal by the end of the model
SUMMARY
The factors noted above were all evaluated in developing the 2023-2024 Revised Biennial Operating Budget . As presented in the following sections, changes to the budget continue to focus on City Council’s Strategic Plan and each individual department’s strategic results and performance measures In addition, there are changes to ensure that the City continues to offer a competitive compensation package to attract top personnel .
Overall, the City has benefitted from a healthy economy for the past ten plus years and the funds had healthy reserves going into the pandemic induced recession Although the recession was short lived, the City fared much better than many of the comparable Cities and the State of Colorado Half way through 2023, the City is continuing to see revenue growth in many areas that will help to fund the increasing cost of City operations and offset some of the inflationary growth. The next few years are still unpredictable with a growing concern of a recession. As such, the 2023 - 2024 Revised Biennial Operating Budget offers an appropriately conservative direction for 2024 .
Bryan Archer Director of Finance
67
2023-2024 Proposed Revised Biennial Operating and Capital Budget
Intentionally left blank
68
Revenue and Expenditure Summary
A brief description of the City of Arvada’s fund structure follows:
Governmental Funds (General, Special Revenue and Debt Service)
• General Fund - This fund accounts for all the financial resources of the City which are not required to be accounted for in another fund .
• Streets Fund - This fund accounts for costs associated with street repair and replacement including crack sealing, chip sealing, seal coating, milling and overlay and reconstruction .
• Arvada Housing Authority Fund – The Section 8 Housing Assistance Payments Program is administered by the Arvada Housing Authority .
• Community Development Fund – This fund accounts for all entitlements, revenues and expenditures of the Community Development Block Grant (CDBG), the Home Rehabilitation and the Essential Home Repairs programs .
• Parks Fund – This fund accounts for costs associated with the acquisition, design, development, maintenance and beautification of City parks, open space and trails.
• Police Seizure – This fund accounts for seized assets awarded under the Colorado State Statutes as they are awarded and expended by the City
• Police Tax Increment Funds – The purpose of the tax increment funds is to account for the voter-approved sales tax increment ( 21 and 25) to fund expanded police services
• Grants Fund – This fund accounts for receipt of lottery monies through the Conservation Trust Fund
• Debt Service Funds – These funds account for the payment of principal and interest on the $70,925,000 Series 2019 Sales and Use Tax Revenue Bonds, $7,230,000 Series 2023 Sales and use Tax Bonds, $11,820,000 Series 2015 Refunding Certificates of Participation (COP), the $11,180,000 Series 2016 Certificates of Participation and the $35,210,000 Series 2021 Certificates of Participation .
• Capital Improvement Projects Fund – This fund accounts for the financial resources to be used for the acquisition or construction of major capital projects (other than those financed by the Enterprise or Internal Service Funds) .
Internal Service Funds
• Insurance Service Fund – This fund accounts for the activities associated with the City’s worker’s compensation and property and liability insurance activities .
• Print Shop Fund – This fund accounts for the activities associated with the print shop operations
• Computer Fund – This fund accounts for the accumulation of financial resources necessary for the timely and orderly replacement and maintenance of the City’s computers
• Vehicles Fund – This fund accounts for the accumulation of financial resources necessary for the timely and orderly replacement and maintenance of the City’s vehicles and equipment
• Building Fund – This fund accounts for the accumulation of financial resources necessary for the maintenance of City buildings
Enterprise Funds
• Water Fund – This fund accounts for administration, operations, capital outlay, maintenance, debt service and billing and collection for the water utility operations .
• Wastewater Fund – This fund accounts for administration, operations, capital outlay, maintenance, billing and collection for the collection, transmission and disposal of sewage and wastewater .
• Stormwater Fund – This fund accounts for all activities necessary to maintain a stormwater management plan .
• Solid Waste Fund – This fund accounts for all activities necessary to maintain the solid waste and recycling program .
• Golf Course Fund – This fund accounts for all revenues and expenses of the Lake Arbor and West Woods Golf Courses .
69
Revenue and Expenditure Summary
2023-2024 BIENNIAL OPERATING AND CAPITAL BUDGET
The following pages provide an overview or revenues and expenditures including changes by fund All Funds Summary: The total 2023 Revised Budget is $425,554,695 with $287,702,062 in revenues to meet these expectations
70
Funds Beginning Funds Available 2023 Revised Revenues 2023 Revised Expenditures 2023 Funds Available Change in Fund Balance General Fund $70,113,845 $119,513,126 $132,565,501 $57,061,470 -19% Special Revenue Funds: Grants Fund $1,385,020 590,529 184,481 $1,791,068 29% Streets Maintenance Fund $388,441 11,954,121 12,322,584 $19,978 -95% Community Development $6,397,271 895,280 1,397,426 $5,895,125 -8% Arvada Housing Authority $349,816 5,973,229 5,938,645 $384,400 10% Parks $7,551,596 13,431,971 13,840,003 $7,143,564 -5% Police Seizure $200,603 32,304 30,312 $202,595 1% Police Tax Increment Fund .21 $8,517,024 7,358,337 7,804,560 $8,070,801 -5% Police Tax Increment Fund 25 $9,816,806 8,063,554 8,813,308 $9,067,052 -8% Total Special Revenue Funds: 34,606,578 48,299,325 50,331,319 32,574,584 Debt Service Funds: COP Debt Service $224,044 3,268,984 3,277,985 $215,043 -4% Debt Service Fund $446,732 5,805,474 5,800,474 $451,732 1% Total Debt Service Funds 670,776 9,074,458 9,078,459 666,775 Capital Projects Funds: Capital Projects Fund $56,853,209 14,426,227 22,223,494 $49,055,942 -14% Special Assessments Fund $17,892 - - $17,892 0% Total Capital Projects Funds $56,871,101 14,426,227 22,223,494 49,073,834 Enterprise Funds: Water Fund $131,104,675 43,515,366 125,869,216 $48,750,825 -63% Wastewater Fund $55,549,080 19,552,248 39,679,675 $35,421,653 36% Golf Course Fund $422,394 7,700,859 7,695,923 $427,330 -1% Stormwater Fund $8,404,668 4,118,634 9,400,547 $3,122,755 -63% Solid Waste Fund $426,390 4,449,017 4,586,549 $288,858 -32% Total Enterprise Funds 195,907,207 79,336,124 187,231,910 88,011,421 Internal Service Funds: Insurance Fund $1,209,148 3,535,066 3,462,180 $1,282,034 6% Computers $13,400,001 5,158,602 12,680,157 $5,878,446 -56% Print Shop $356,666 335,000 363,250 $328,416 -8% Vehicles $6,998,308 6,918,340 6,817,254 $7,099,394 1% Buildings $348,487 1,105,794 801,171 $653,110 87% Total Internal Service Funds: 22,312,610 17,052,802 24,124,012 15,241,400 Total All Budgeted Funds $380,482,116 $287,702,062 $425,554,695 $242,629,483
Revenue and Expenditure Summary
All Funds Summary: The total 2024 Budget is $387,466,097 with $350,542,707, in revenues to meet these expectations
71
Funds Beginning Funds Available 2024 Budget Revenues 2024 Budget Expenditures 2024 Funds Available Change in Fund Balance General Fund $57,061,470 $124,670,824 $124,576,764 $57,155,530 0% Special Revenue Funds: Grants Fund $1,791,068 596,435 190,016 $2,197,487 23% Streets Maintenance Fund $19,978 12,864,244 12,824,973 $59,249 197% Community Development $5,895,125 715,017 1,226,248 $5,383,894 -9% Arvada Housing Authority $384,400 6,033,245 6,021,464 $396,181 3% Parks $7,143,564 14,125,779 14,337,478 $6,931,865 -3% Police Seizure $202,595 32,545 31,222 $203,918 1% Police Tax Increment Fund .21 $8,070,801 7,403,684 7,591,419 $7,883,067 -2% Police Tax Increment Fund 25 $9,067,052 8,168,309 8,269,420 $8,965,942 -1% Total Special Revenue Funds: 32,574,584 49,939,258 50,492,240 32,021,603 Debt Service Funds: COP Debt Service $215,043 3,268,484 3,277,484 $206,043 -4% Debt Service Fund $451,732 5,809,282 5,804,282 $456,732 1% Total Debt Service Funds 666,775 9,077,766 9,081,766 662,775 Capital Projects Funds: Capital Projects Fund $49,055,942 10,337,325 8,249,512 $51,143,755 4% Special Assessments Fund $17,892 - - $17,892 0% Total Capital Projects Funds 49,073,834 10,337,325 8,249,512 51,161,647 Enterprise Funds: Water Fund $48,750,825 98,316,342 101,037,278 $46,029,889 -6% Wastewater Fund $35,421,653 21,729,359 55,971,929 $1,179,083 -97% Golf Course Fund $427,330 8,163,272 8,010,198 $580,404 36% Stormwater Fund $3,122,755 4,321,435 6,761,290 $682,900 -78% Solid Waste Fund $288,858 4,604,733 4,737,907 $155,684 -46% Total Enterprise Funds 88,011,421 137,135,141 176,518,602 48,627,960 Internal Service Funds: Insurance Fund $1,282,034 3,830,068 3,548,316 $1,563,786 22% Computers $5,878,446 6,297,636 7,028,141 $5,147,941 -12% Print Shop $328,416 335,000 365,994 $297,422 -9% Vehicles $7,099,394 7,778,278 7,128,700 $7,748,972 9% Buildings $653,110 1,141,411 476,062 $1,318,459 102% Total Internal Service Funds: 15,241,400 19,382,393 18,547,213 16,076,580 Total All Budgeted Funds $242,629,483 $350,542,707 $387,466,097 $205,706,093
Revenue and Expenditure Summary
All Funds Summary
Fund Balance Goals
All ending fund balances meet or exceed the City Council Fund Balance Goal except for the Wastewater, Stormwater, Solid Waste, and Golf Course funds which are discussed in the Fund Highlights section .
Fund Highlights
General Fund
The General fund balance decrease of 19% in 2023 is due to a loan to the Arvada Urban Renewal Authority .
Grants Fund
The Grants fund balance increase of 29% in 2023 and 23% in 2024 is due to a reduction in the funding for capital projects
Streets Maintenance Fund
The Streets Maintenance fund balance in 2023 includes projects that were not completed in 2022 and carried forward to 2023 These projects are expected to be completed in 2023 which will decrease the fund balance in 2023 The fund balance decrease of 95% in 2023 is due the completion of 2022 and 2023 projects The increase of 197% in 2024 is due to the fund returning to a normal level of project spending
Arvada Housing Authority Fund
The Arvada Housing Authority fund balance increase of 10% in 2023 is due to an increase in federal grant funding to assist with the Section 8 Housing assistance program .
Capital Projects Fund
The Capital Projects fund balance decrease in 2023 of 14% is due some large projects anticipated to be completed in 2023 .
Water Fund
The Water fund balance decrease of 63% in 2023 is due to capital expenditures for various capital projects, which are discussed in the Capital Improvement section The City issued debt in late 2022 for capital projects, as these projects are constructed the fund balance will decrease Although, the fund balance of this fund is declining, it will still meet its City Council appointed fund balance goal at the end of ten years
Wastewater Fund
The Wastewater fund balance increase of 36% in 2023 is due to the bond issuance in late 2022 for various capital projects . The fund balance decrease of 97% in 2024 is due to capital expenditures for capital projects, which are discussed in the Capital Improvement section . Although, the fund balance of this fund is declining, it will still meet its City Council appointed fund balance goal at the end of ten years .
Stormwater Fund
The Stormwater fund decrease of 63% in 2023 and 78% in 2024 is due to capital expenditures for Ralston Creek Improvements from Vance Street to Wadsworth By-Pass in 2023 and 2024 . Although, the fund balance of this fund is declining, it will still meet its City Council appointed fund balance goal at the end of ten years
72
Revenue and Expenditure Summary
Solid Waste Fund
The Solid Waste fund is a new fund added in 2021 to account for activities of the waste hauling and recycling program in the City of Arvada The fund balance decrease of 32% in 2023 and 46% in 2024 is due to the repayment of a loan to the Water Fund for cart purchases in 2021 . This fund does not yet have an established fund balance goal .
Golf Course Fund
The fund balance increase of 36% in 2024 is due to the restaurants operating at full capacity and the golf courses seeing unprecedented revenues due to increased golf rounds .
Insurance
The Insurance fund balance increase of 22% in 2024 is due to increased contributions from various funds for claims and insurance premiums
Computers
The computers fund balance decrease of 56% in 2023 and 12% in 2024 is due to increased costs in items surrounding cybersecurity and a planned city-wide computer replacement program
Building Fund
An energy efficiency agreement was signed in 2020. The agreement will replace lighting, heating, ventilation and air conditioning units, compressors and other building equipment with more energy efficient units. The fund balance will recover as the energy savings will be transferred into the Building fund over the next ten years . This contributes to the fund balance increase of 87% in 2023 and 102% in 2024 .
73
Revenue and Expenditure Summary
2023-2024 Budget Changes:
As the City team was working on the assumptions for the 2024 proposed budget many components were going in different directions. Unemployment has returned to pre-pandemic levels during 2022 and has remained low into 2023. Unfortunately, inflation was increasing at levels not experienced in over 40 years in 2022 but has decreased and is currently sitting at 3 2% Consumer credit card debt is at an all-time high, vehicle debt is at all-time highs and the 2 year and 10 year yield curves are inverted
City revenues are growing, however at a slower rate than 2022 Sales tax was up 9 6% in 2022 and 6 3% so far in 2023. Auto use tax grew 1.7% in 2022 and currently has decreased 3.5% for the first half of 2023.
The major differences between the 2023 and 2024 budgets are in the following areas:
• Maintaining a competitive compensation package for existing employees
• Adding positions to several work systems to maintain existing levels of service and address the new City Council Strategic Results
• Addressing shortages in the building, vehicle, computer and insurance internal service funds
• Increasing the funding for street maintenance to close the ongoing funding gap
• Funding for increasing costs related to capital projects
• Increasing funding to the Parks Fund to help offset the additional costs related to taking over athletic field maintenance programming from APEX
The major differences between the 2023 and 2024 budgets are in the following areas:
• The market rate adjustment for January of 2024 is estimated to be 3% for non-sworn positions and 4% for sworn position
• The near-site health clinic combined with the City of Arvada employee’s continued efforts to make well informed healthcare decisions have resulted in favorable claim experience in 2022 and year to date in 2023 . Based on claim experience, the increase in health insurance was reduced from 5% to 0% .
• The addition of four positions mid-cycle (from October 2022 to July of 2023) has made an immediate impact on the ability of the City to serve its customers The areas addressed were Public Safety and Parks Maintenance
• An additional ten positions are proposed to be added in January of 2024 to Public Safety, Legal, Municipal Courts, Wastewater and Stormwater .
• An increase of $500,000 dollars annually will be added to the Streets Maintenance Fund to try and close the funding gap
• Continued commitment to safe, reliable, high quality water supply, drainage system and wastewater disposal service is a top priority of the City . A water rate increase of 12% and a service fee increase of $2 every month and a wastewater increase of 12% and a service fee increase of $1 every month are necessary to maintain these services . A stormwater rate increase of 5% has been added to maintain the stormwater system Even with these increases, the City’s rates are low compared the surrounding cities
74
Revenue and Expenditure Summary
All changes to the 2024 budget are presented in the following table:
75
Work System Fund Description Operating Cost (Reduction) Notes Strategic Alignment Community and Economic Development General Fund Housing Rehabilitation / Loan Specialist $(117,498) Position's duties have been absorbed by the other positions within the department Community and Economic Development Principles Infrastructure General Fund/ Public Works CDL training $50,000 Increase due to new regulations required to train CDL license holders . Infrastructure Principles Infrastructure General Fund/ Public Works Snow and ice material $150,000 Increase to snow and ice materials due to increasing costs Infrastructure Challenges Infrastructure General Fund/Public Works Contract services $25,000 Increase to mowing contract due to increasing costs Infrastructure Challenges Infrastructure General Fund/Public Works Contract services $125,000 Funding for utility locates Infrastructure Principles Infrastructure General Fund/Public Works Overtime $37,000 Additional funding for overtime for inspections Infrastructure Challenges Infrastructure Streets Maintenance Fund Training $10,000 Increased costs for training Infrastructure Principles Infrastructure Streets Maintenance Fund Asphalt $500,000 Additional funding for streets maintenance program Infrastructure Challenges Infrastructure Vehicles Fund Contracts $100,000 Funding for telematics contract Infrastructure Principles Infrastructure Vehicles Fund Electricity $18,750 Funding for eclectic costs at Wadsworth Shop . Infrastructure Principles Infrastructure Vehicles Fund Small equipment $4,800 Additional funding for the purchase of tools and small equipment due to increased costs Infrastructure Challenges Infrastructure Water Fund Training $32,950 Additional funding for training needs Infrastructure Principles Infrastructure Water Fund Chemicals $138,000 Additional funding for increases in chemical costs Infrastructure Challenges Infrastructure Water Fund Dues and subscriptions $3,463 Additional funding for dues and subscriptions due to increased costs Infrastructure Challenges Infrastructure Water Fund Mileage, supplies and clothing allowance $1,213 Additional funding due to increased costs Infrastructure Principles Ongoing Costs
Revenue and Expenditure Summary
76
Work System Fund Description Operating Costs (Reduction) Notes Strategic Alignment Infrastructure Water Fund Landfill costs $20,000 Additional funding for increases in landfill costs. Infrastructure Challenges Infrastructure Water Fund Utilities $150,000 Additional funding for utility increases Infrastructure Challenges Infrastructure Water Fund Software $9,600 Additional costs due to increases for software contracts . Infrastructure Challenges Infrastructure Water Fund Consulting services $35,000 Annual funding for consulting needs for water programs Infrastructure Principles Infrastructure Water Fund Contracts $20,713 Annual funding for increase to payment card processor . Infrastructure Challenges Infrastructure Wastewater Fund Utility Systems TechnicianAssociate Level $95,210 New position to assist with wastewater operations Salaries and benefits. Infrastructure Principles Infrastructure Wastewater Fund Training $8,550 Additional funding for training needs Infrastructure Principles Infrastructure Wastewater Fund Dues and subscriptions $2,463 Additional funding for dues and subscriptions due to increased costs Infrastructure Principles Infrastructure Wastewater Fund Utilities $9,975 Additional funding for utility increases . Infrastructure Challenges Infrastructure Wastewater Fund Supplies and clothing allowance $1,013 Additional funding due to increased costs Infrastructure Principles Infrastructure Wastewater Fund Equipment $10,000 Annual funding for replacement of CCTV van cables Infrastructure Principles Infrastructure Wastewater Fund Contracts $977,500 Annual funding for increase to Metro Recovery District costs Infrastructure Challenges Infrastructure Stormwater Fund Training $1,429 Additional funding for training needs Infrastructure Principles Infrastructure Stormwater Fund Dues and subscriptions $2,500 Additional funding for dues MS4 permit due to increasing costs . Infrastructure Challenges Infrastructure Stormwater Fund Supplies and clothing allowance $1,425 Additional funding due to increased costs Infrastructure Principles Infrastructure Stormwater Fund Fuel $1,000 Fuel costs for vehicle due to new position . Infrastructure Principles Infrastructure Stormwater Fund Computer equipment $2,000 Computer equipment for new position Infrastructure Principles Infrastructure Stormwater Fund Consulting services $50,000 Annual funding for consulting needs for open channel maintenance . Infrastructure Principles Infrastructure Stormwater Fund Contracts $30,000 Funding for algae treatment in City owned lakes Infrastructure Principles Infrastructure Stormwater Stormwater Inspector $111,904 New position to assist with stormwater inspection. Salaries and benefits. Infrastructure Principles Infrastructure Stormwater Utility Systems TechnicianAssociate Level $95,210 New position to assist with stormwater operations. Salaries and benefits. Infrastructure Principles Organizational and Service Effectiveness General Fund/ City Attorneys Office Assistant City Attorney $172,599 New position for 2024-2026 to assist with litigation. Salaries and Benefits. OSE Challenges
Revenue and Expenditure Summary
77
Work System Fund Description Operating Costs (Reduction) Notes Strategic Alignment Organizational and Service Effectiveness General Fund/ City Attorneys Office Training $2,123 Funding for 2024-2026 for training for new Assistant City Attorney Position OSE Challenges Organizational and Service Effectiveness General Fund/ City Attorneys Office Supplies $325 Funding for 2024-2026 for supplies for new Assistant City Attorney Position . OSE Principles Organizational and Service Effectiveness General Fund/ City Attorneys Office Dues and subscriptions $3,730 Funding for 2024-2026 for dues and subscriptions for new Assistant City Attorney Position OSE Principles Organizational and Service Effectiveness General Fund/ City Attorneys Office Legal Specialist $111,880 Convert temporary position to full time position to assist with increased legal needs. Salaries and benefits. OSE Principles Organizational and Service Effectiveness General Fund/ City Managers Office Employee events $66,000 Funding for employee events sponsored by the Employee Committee OSE Principles Organizational and Service Effectiveness General Fund/ Finance Annual financial audit $27,000 Increase in funding for annual financial audit due to increased cost to perform the annual audit . OSE Challenges Organizational and Service Effectiveness General Fund/ Human Resources Wellness $10,000 Funding for items associated with the wellness program This item is funded by reimbursement from UMR OSE Principles Organizational and Service Effectiveness General Fund/ Information Technology Consulting services $49,500 Funding for consulting and research in the Information Technology area so the City remains current with the rapidly changing Information Technology industry OSE Challenges Safe Community General Fund/ Municipal Court Temporary wages $30,000 Increase to temporary wages for relief judges Safe Community Principles Safe Community General Fund/ Municipal Court Deputy Court Administrator $138,872 New position for 2024 and 2025 to assist with needs during project implementation in Municipal Courts . Salaries and benefits. Safe Community Challenges Safe Community General Fund/Public Safety Software $6,250 Funding for Shop Spotter intel database software Safe Community Principles Safe Community General Fund/Public Safety Contracts $34,000 Increase in costs for Jefferson County Regional Crime Lab Safe Community Challenges
Revenue and Expenditure Summary
78
Work System Fund Description Operating Costs (Reduction) Notes Strategic Alignment Safe Community General Fund/Public Safety Contracts $175,000 Increase in costs for Victim Outreach Incorporated contract Safe Community Challenges Safe Community General Fund/Public Safety Two Police Records Specialists $143,014 Extended term limited position for another two years Salaries and benefits. Safe Community Challenges Safe Community T21 Fund/ Public Safety Behavioral Health Case Manager $116,258 New position to assist with behavioral health. Salaries and benefits. (mid-cycle) Safe Community Principles Safe Community T21 Fund/ Public Safety Two Police Officers $230,002 Two new grant funded Police Officers for 2023-2026 Salaries and benefits. (mid-cycle) Safe Community Principles Safe Community T21 Fund/ Public Safety Two Police Service Technicians $176,830 Extended term limited position for another two years . Salaries and benefits. Safe Community Challenges Vibrant Community and Neighborhoods Parks Fund/Festivals Zero waste events $10,000 Annual funding for the Festivals Commission to provide zero waste events VCN Principles Vibrant Community and Neighborhoods Parks Fund/Park Maintenance Maintenance at Little Raven Park $42,000 Funding for annual maintenance costs at newly constructed Little Raven Park VCN Challenges Vibrant Community and Neighborhoods Parks Fund/Park Maintenance Parks Worker II $95,301 Additional Parks Worker II to assist with parks maintenance challenges . Salaries and benefits. (mid-cycle) VCN Challenges
Revenue and Expenditure Summary
One
79
Time
Work System Fund Description One Time Costs (Reduction) Notes Strategic Alignment Community and Economic Development General Fund Sustainability $150,000 Funding to update the sustainability plan . Community and Economic Development Principles Community and Economic Development General Fund AEDA funding $250,000 Additional funding for Arvada Economic Development Association Community and Economic Development Principles Infrastructure General Fund/ Public Works Professional Services $302,000 Funding for facilities master plan Infrastructure Principles Infrastructure Vehicles Fund Vehicles $1,000,000 Additional funding for replacement and maintenance of vehicles due to increasing costs Infrastructure Challenges Infrastructure Water Fund Contract services $50,000 Funding for EPA mandated cybersecurity measures Infrastructure Challenges Infrastructure Water Fund Rate Model $37,500 Funding for rate model update . Infrastructure Principles Infrastructure Wastewater Fund Generator $100,000 Generator for wastewater shop Infrastructure Principles Infrastructure Wastewater Fund Pole Camera $20,000 Funding for pole camera . Infrastructure Principles Infrastructure Wastewater Fund Vehicles $490,000 Jet Vac Truck and one new truck for new position Infrastructure Principles Infrastructure Stormwater Two trucks $80,000 Truck for new positions Infrastructure Principles Organizational and Service Effectiveness General Fund/ City Attorney's Office Equipment $5,420 Computer equipment for new Assistant City Attorney position OSE Principles Organizational and Service Effectiveness General Fund/Finance Consulting and backfill needs $250,000 Backfill for team members during the ERP replacement project OSE Principles Organizational and Service Effectiveness General Fund/ Human Resources Consulting and backfill needs $250,000 Backfill for team members during the ERP replacement project OSE Principles Organizational and Service Effectiveness General Fund/ Human Resources Relocation of Human Resources $100,000 Funding to relocate Human Resources to the Annex building OSE Principles Organizational and Service Effectiveness General Fund/ Human Resources Temporary Wages $48,000 Additional temporary wages to assist with the implementation of the State mandated FAMLI Act OSE Challenges
Costs
Revenue and Expenditure Summary
80
Work System Fund Description One Time Costs (Reduction) Notes Strategic Alignment Organizational and Service Effectiveness General Fund/ Human Resources Professional Services $100,000 Funding for job architecture project OSE Principles Organizational and Service Effectiveness General Fund/ Human Resources Program expense $15,000 Funding to upgrade organizational development training facilities OSE Principles Organizational and Service Effectiveness General Fund/ Information Technology Consulting and backfill needs $350,000 Funding for consulting work and backfill for team members during the ERP replacement project OSE Principles Organizational and Service Effectiveness General Fund/ Information Technology Conversion of PDF documents $30,000 Funding to convert current PDF's on ArvadaCo .gov to be complaint with State ADA compliance mandate OSE Challenges Organizational and Service Effectiveness General Fund/ Information Technology Redundant internet $95,000 Funding for redundant internet at the Indiana shops . OSE Principles Safe Community T22 Fund/ Public Safety Radio replacement $500,000 Additional funding for the replacement of PD radio system Safe Community Principles
Revenue and Expenditure Summary
2021 City Actual Fund Balance, Revenues and Expenditures by Fund Type
81
General Fund Special Revenue Funds Debt Service Funds Capital Projects Funds Enterprise Funds Internal Service Funds Total Funds Water Fund Non-Major Funds Beginning Fund Balance $47,115,113 $28,622,954 $625,650 $34,372,608 $108,708,231 $8,708,510 $18,521,762 $246,674,828 Revenues Taxes $90,546,114 $13,026,272 $5,347,206 $102,088 $- $- $- $109,021,680 Licenses, Permits and Fees 4,175,086 47,765 - - 6,404,702 10,889,579 - 21,517,132 Intergovernmental 5,151,560 15,077,752 - 1,915,668 - 735,128 11,274,230 34,154,339 Charges for Services 4,698,667 38,188 - 911,671 25,386,702 19,303,811 116,461 50,455,500 Fines and Forfeits 1,089,246 - - - - - - 1,089,246 Miscellaneous 3,785,802 1,578,626 25,249 10,250,933 198,021 3,223,400 168,365 19,230,396 Revenue Transfer 298,452 14,138,784 2,120,837 8,983,063 493,104 511,220 1,317,061 27,862,521 Other Funding Sources 206,145 - - - (408,482) 2,000,000 306,522 2,104,185 Total Revenues 109,951,072 43,907,388 7,493,292 22,163,422 32,074,047 36,663,138 13,182,640 265,434,998 Total Amount Available $157,066,185 $72,530,342 $8,118,942 $56,536,030 $140,782,278 $45,371,648 $31,704,402 $512,109,826 Expenditures Personnel $46,918,310 $15,309,836 $- $- $7,610,829 $6,291,154 $2,541,535 $78,671,664 Services and Charges 11,749,498 10,239,480 1,900 2,379,626 9,740,347 940,081 2,987,859 38,038,791 Supplies and Expenses 6,431,820 3,109,621 - 160,958 1,392,341 3,362,825 2,812,442 17,270,007 Contract and Leases 5,365,621 9,109,278 6,000 715,924 2,537,134 10,688,879 206,555 28,629,391 Debt Service - - 7,487,280 390,147 - 163,200 - 8,040,627 Inventory (27,473) 4,370 - - - 826,500 (40,672) 762,725 Capital Maintenance 522,670 157,347 - 1,660 1,615,567 1,155,286 1,262,213 4,714,743 Capital Outlay 473,651 80,217 - 4,343,666 14,923,101 1,351,554 4,390,564 25,562,753 Transfers 24,623,006 2,298,322 - 150,000 2,994,334 2,437,252 89,332 32,592,246 Other 2,398 723 - - 647 - - 3,768 Total Expenditures 96,059,501 40,309,193 7,495,180 8,141,982 40,814,300 27,216,731 14,249,828 234,286,715 Ending Fund Balance $61,006,684 $32,221,148 $623,761 $48,394,048 $99,967,978 $18,154,917 $17,454,574 $277,823,111
Revenue and Expenditure Summary
2022 City Revised Fund Balance, Revenues and Expenditures by Fund Type
82
General Fund Special Revenue Funds Debt Service Funds Capital Projects Funds Enterprise Funds Internal Service Funds Total Funds Water Fund Non-Major Funds Beginning Fund Balance $61,006,684 $32,221,148 $623,761 $48,394,048 $99,967,978 $18,154,917 $17,454,574 $277,823,111 Revenues Taxes $101,988,279 $14,547,114 $5,347,629 $92,130 $- $- $- $121,975,153 Licenses, Permits and Fees 4,607,443 42,537 - - 14,037,453 4,123,390 - 22,810,823 Intergovernmental 5,771,379 15,218,177 - 1,254,996 - 54,093 14,208,694 36,507,339 Charges for Services 5,004,747 834,547 - 726,607 29,052,453 29,672,802 105,386 65,396,543 Fines and Forfeits 854,045 - - - - - - 854,045 Miscellaneous 1,616,575 833,079 25,097 720,469 4,021,845 544,512 (498,039) 7,263,538 Revenue Transfer 109,534 18,192,899 2,555,590 10,922,583 482,012 348,704 4,953,718 37,565,039 Other Financing Sources - - - - 43,096,171 46,611,802 231,668 89,939,641 Total Revenues 119,952,002 49,668,353 7,928,317 13,716,785 90,689,934 81,355,303 19,001,427 382,312,121 Total Amount Available $180,958,686 $81,889,501 $8,552,078 $62,110,833 $190,657,912 $99,510,220 $36,456,001 $660,135,232 Expenditures Personnel $44,943,168 $16,144,662 $- $110,810 $8,324,048 $6,931,912 $2,679,210 $79,133,810 Services and Charges 13,114,076 11,539,901 1,900 2,535,723 10,631,054 954,961 3,348,015 42,125,631 Supplies and Expenses 8,537,563 4,110,023 - 167,027 1,437,093 1,748,071 3,231,363 19,231,140 Contract and Leases 6,843,892 13,467,326 6,000 637,870 913,059 13,887,655 304,880 36,060,683 Debt Service 32,422 - 7,873,403 - 484,378 1,108,316 14,413 9,512,932 Inventory 28,467 (1,301) - - (1,250) 978,693 (10,871) 993,738 Capital Maintenance 454,918 181,568 - 10,150 1,225,415 1,368,669 1,509,945 4,750,666 Capital Outlay 2,906,636 763,626 - 1,778,151 33,332,913 4,531,493 2,924,361 46,237,180 Transfers 33,974,986 1,077,118 - - 3,206,165 3,181,670 92,010 41,531,949 Other 8,713 - - - 361 16,248 50,064 75,386 Total Expenditures 110,844,841 47,282,923 7,881,303 5,239,732 59,553,236 34,707,688 14,143,392 279,653,115 Ending Fund Balance $70,113,845 $34,606,578 $670,776 $56,871,101 $131,104,675 $64,802,532 $22,312,610 $380,482,117
Revenue and Expenditure Summary
2023 City Budget Fund Balance, Revenues and Expenditures by Fund Type
83
General Fund Special Revenue Funds Debt Service Funds Capital Projects Funds Enterprise Funds Internal Service Funds Total Funds Water Fund Non-Major Funds Beginning Fund Balance $70,113,845 $34,606,578 $670,776 $56,871,101 $131,104,675 $64,802,532 $22,312,610 $380,482,117 Revenues Taxes $100,794,284 $14,590,775 $5,797,474 $90,287 $- $- $- $121,272,820 Licenses, Permits and Fees 3,698,178 66,824 - - 10,618,026 3,033,153 - 17,416,181 Intergovernmental 5,472,997 14,677,505 - - - - 15,825,674 35,976,176 Charges for Services 4,064,186 1,120,267 - - 31,370,655 31,263,250 111,598 67,929,956 Fine and Forfeits 1,059,357 - - - - - - 1,059,357 Miscellaneous 4,097,510 744,680 8,000 350,000 1,039,170 1,241,785 372,000 7,853,145 Revenue Transfer 326,614 17,099,274 3,268,984 13,985,940 487,515 282,570 668,530 36,119,427 Other Financing Sources - - - - - - 75,000 75,000 Total Revenues 119,513,126 48,299,325 9,074,458 14,426,227 43,515,366 35,820,758 17,052,802 287,702,062 Total Amount Available $189,626,971 $82,905,903 $9,745,234 $71,297,328 $174,620,041 $100,623,290 $39,365,412 $668,184,179 Expenditures Personnel $55,302,417 $18,380,243 $- $136,596 $9,567,903 $8,318,850 $2,793,900 $94,499,909 Services and Charges 25,959,790 10,413,647 3,000 - 11,928,280 2,292,943 2,726,784 53,324,444 Supplies and Expenses 9,138,218 4,451,859 - 4,649 1,914,033 1,882,976 10,185,036 27,576,771 Contract and Leases 6,092,109 12,296,833 10,000 - 1,223,092 14,642,559 302,993 34,567,586 Debt Service - - 9,065,459 - 2,723,396 3,394,477 - 15,183,332 Inventory 20,600 2,610 - - - 876,103 - 899,313 Capital Maintenance 526,289 273,320 - - 12,430,275 3,578,414 1,421,581 18,229,879 Capital Outlay 132,580 857 - 22,082,249 83,455,106 23,418,923 3,598,946 132,688,661 Transfers 35,389,456 4,507,850 - - 2,620,571 2,957,349 3,094,772 48,569,998 Other 4,042 4,100 - - 6,560 100 - 14,802 Total Expenditures 132,565,501 50,331,319 9,078,459 22,223,494 125,869,216 61,362,694 24,124,012 425,554,695 Ending Fund Balance $57,061,470 $32,574,584 $666,775 $49,073,834 $48,750,825 $39,260,596 $15,241,400 $242,629,483
Revenue and Expenditure Summary
2024 City Budget Fund Balance, Revenues and Expenditures by Fund Type
84
General Fund Special Revenue Funds Debt Service Funds Capital Projects Funds Enterprise Funds Internal Service Funds Total Funds Water Fund Non-Major Funds Beginning Fund Balance $57,061,470 $32,574,584 $666,775 $49,073,834 $48,750,825 $39,260,596 $15,241,400 $242,629,483 Revenues Taxes $102,841,195 $14,765,459 $5,801,282 $88,482 $- $- $- $123,496,418 Licenses, Permits and Fees 3,961,453 68,829 - - 11,040,287 3,154,279 - 18,224,848 Intergovernmental 5,570,341 14,735,654 - - - - 17,859,508 38,165,503 Charges for Services 4,672,851 1,269,075 - - 35,573,963 34,152,174 85,023 75,753,086 Fine and Forfeits 802,079 - - - - - - 802,079 Miscellaneous 6,486,492 760,369 8,000 350,000 1,199,952 1,221,247 390,000 10,416,060 Revenue Transfer 336,413 18,339,872 3,268,484 9,898,843 502,140 291,099 972,862 33,609,713 Other Financing Sources - - - - 50,000,000 - 75,000 50,075,000 Total Revenues 124,670,824 49,939,258 9,077,766 10,337,325 98,316,342 38,818,799 19,382,393 350,542,707 Total Amount Available $181,732,294 $82,513,842 $9,744,541 $59,411,159 $147,067,167 $78,079,395 $34,623,793 $593,172,190 Expenditures Personnel $60,073,664 $21,095,893 $- $143,930 $10,048,280 $8,983,373 $2,914,240 $103,259,380 Services and Charges 16,029,455 10,177,910 3,000 - 12,598,492 2,350,981 2,806,171 43,966,009 Supplies and Expenses 10,258,483 4,782,445 - 5,518 2,175,666 2,155,710 7,718,256 27,096,078 Contract and Leases 6,296,812 12,802,716 10,000 - 1,352,998 15,616,806 336,893 36,416,225 Debt Service - - 9,068,766 - 2,874,550 3,547,156 - 15,490,472 Inventory 21,218 2,688 - - - 918,244 - 942,150 Capital Maintenance 533,724 255,317 - - 10,422,434 1,144,308 1,113,139 13,468,922 Capital Outlay 182,657 883 - 8,100,064 58,858,913 37,753,084 3,560,900 108,456,501 Transfers 31,176,586 1,370,288 - - 2,699,188 3,011,562 97,614 38,355,238 Other 4,165 4,100 - - 6,757 100 - 15,122 Total Expenditures 124,576,764 50,492,240 9,081,766 8,249,512 101,037,278 75,481,324 18,547,213 387,466,097 Ending Fund Balance $57,155,530 $32,021,603 $662,775 $51,161,647 $46,029,889 $2,598,071 $16,076,580 $205,706,093
2024 Revenue by Source
85 Revenue and Expenditure Summary Taxes 35% Charges for Services 22% Intergovernmental Revenues 11% Transfers 10% Licenses & Permits 5% Fines & Forfeits 1% Miscellaneous 2% Other Financing Sources 14% Personnel Costs 27% Capital Maintenance & Replacement 31% Services & Charges 11% Professional Services 9% Supplies 7% Debt Service 4% Miscellaneous 1% Transfers 10%
2024 Expenditures by Category Taxes $123,496,418 Charges for Services $75,753,086 Intergovernmental Revenues $38,165,503 Transfers $33,609,713 Licenses & Permits $18,224,848 Fines & Forfeits $802,079 Miscellaneous $10,416,060 Other Financing Sources $50,075,000 Total $350,542,707 Personnel Costs $103,259,380 Capital Maintenance & Replacement $121,925,423 Services & Charges $43,966,009 Professional Services $36,416,225 Supplies $27,096,078 Debt Service $15,490,472 Miscellaneous $957,272 Transfers $38,355,238 Total $387,466,097
Revenue and Expenditure Summary
Revenues
The following table illustrates total revenues by category . Taxes, Charges for Services and Intergovernmental revenues comprise over 78% of the total revenues of the City .
Taxes provide over 42% of the total budgeted revenue . The following table shows the major sources of taxes .
86
2021 Actual 2022 Actual 2023 Revised 2024 Budget Sales Tax $77,767,745 $85,192,766 $88,470,402 $89,662,034 Property and Ownership Tax 8,177,628 8,908,525 8,991,431 9,443,601 Auto Use Tax 11,527,196 11,723,633 11,723,632 11,739,219 Building Use Tax 4,467,398 8,293,758 4,090,644 4,607,431 General Use Tax 1,251,444 1,217,410 1,278,280 1,302,996 Other 5,830,269 6,639,061 6,718,431 6,741,137 Total Taxes $109,021,680 $121,975,153 $121,272,820 $123,496,418 $ Change 12,953,473 -702,333 2,223,598 % Change 11 9% -0 6% 1 8% 2021 Actual 2022 Actual 2023 Revised 2024 Budget Taxes $109,021,680 121,975,153 121,272,820 123,496,418 Licenses, Permits and Fees 21,517,132 22,810,824 17,416,181 18,224,848 Intergovernmental 34,154,339 36,507,339 35,976,176 38,165,503 Charges for Services 50,455,500 65,396,543 67,929,956 75,753,086 Fines & Forfeits 1,089,246 854,045 1,059,357 802,079 Miscellaneous 19,230,395 7,263,538 7,853,145 10,416,060 Revenue Transfer 27,862,521 37,565,039 36,119,427 33,609,713 Other Funding Sources 2,104,185 89,939,641 75,000 50,075,000 Total Revenues $265,434,998 $382,312,122 $287,702,062 $350,542,707 Taxes
Revenue and Expenditure Summary
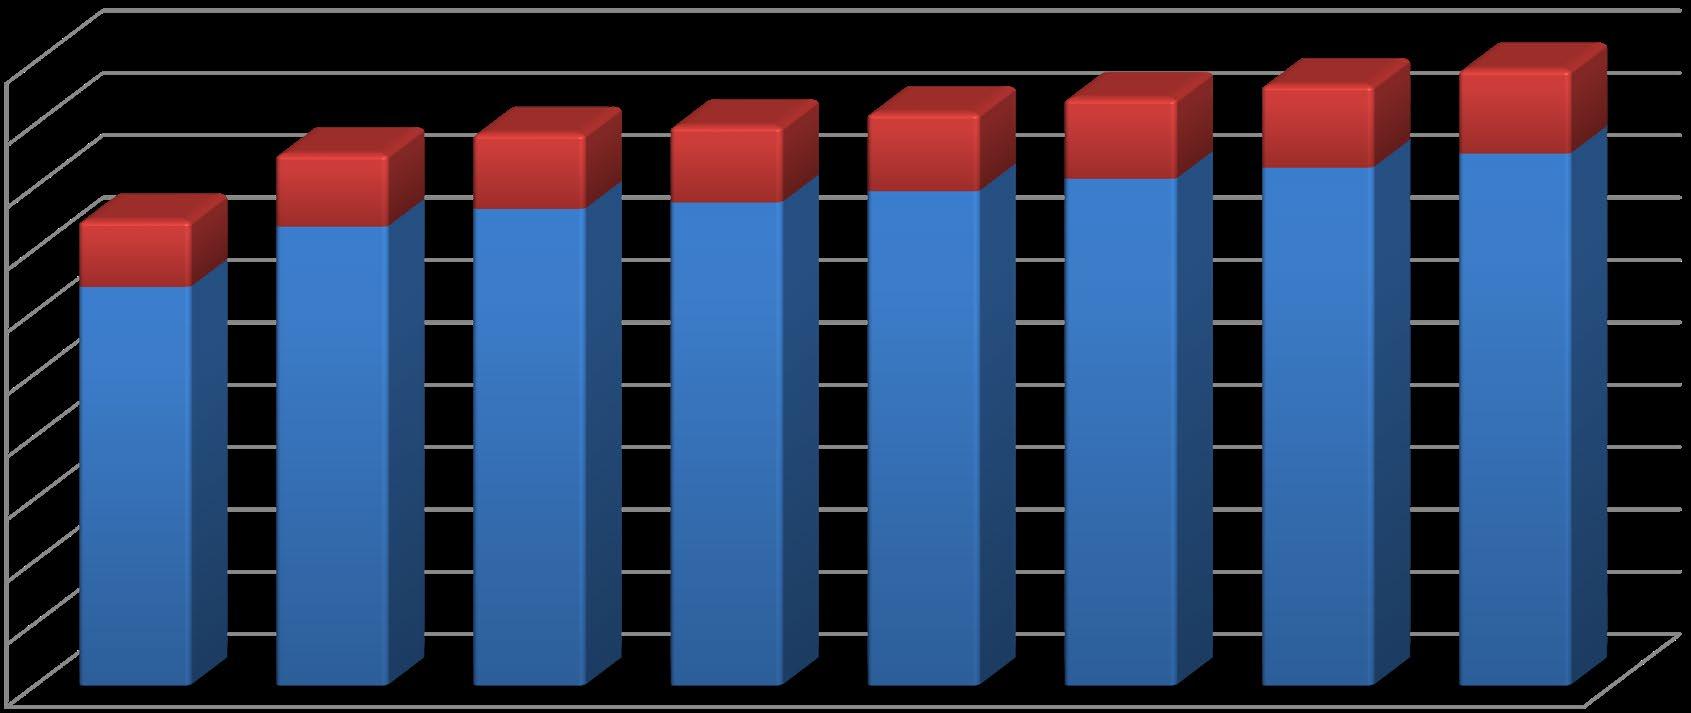
Sales Taxes
The City’s largest revenue source is sales tax . Currently, the City levies a 3 .46% on all retail sales within the City 3% is allocated to the General Fund and 0 .21% and 0 .25% are restricted for police operations which are accounted for in the two tax increment funds .
Over the past ten years, the City has seen significant growth in retail sales, averaging 6.9% annual growth An increase of 3 5% is estimated for 2023 and is currently at 5 3% increase over 2022 The increase in sales tax can be attributed to the City’s main sales tax generators which are grocery stores, general department stores and online sales The City is conservatively budgeting sales tax at an increase of 1 5% for 2024 Sales tax estimates for the remaining years are based on a growth rate between 1% and 3 4% Revenue from anticipated retailers is generally not included in the budget until a new store is constructed and operational. However in 2029 through 2032 of the ten year financial plan, the City included the estimated sales tax of an urban renewal area that will end in 2028
Sales Tax Collections
87
. $$10,000,000 $20,000,000 $30,000,000 $40,000,000 $50,000,000 $60,000,000 $70,000,000 $80,000,000 $90,000,000 $100,000,000 2021 Actual 2022 Actual 2023 Revised 2024 Forecast 2025 Forecast 2026 Forecast 2027 Forecast 2028 Forecast General Fund Tax Increment
Revenue and Expenditure Summary

Property Tax
Property tax is a tax assessed on all real estate . The City has had the same property tax rate since 1993, or for over 30 years . The tax rate is 4 .31 or $4 .31 for every $1,000 of assessed value . Assessed value is based on 7 .15% of the residential appraised value and 29% on all other property . Real property is appraised every odd-numbered year and collections lag one year from valuations . Property tax collections in 2023 are based on a non-appraisal year and are estimated to increase 1% due to new growth in the City 2024 collections are estimated to increase 5 4% and are based on a new appraisal year Property tax for 2025 and beyond is based on a 1%-3%
Property Tax Collections
Use Taxes
The City collects three types of use tax: Auto, Building and General Use Tax .
The City collected a record amount of auto use tax in 2021 with an increase of 16 .8% . Auto use tax Increased 1 .4% in 2022 . The City started to see a more normal growth rate in Auto Use Tax in 2022 . 2023 and beyond estimate a 1% to 3% increase with a 3% decrease in 2027, as the City normally experiences a rest in auto use tax every five to seven years.
Building use tax has been steadily decreasing since 2017 when two housing developments in northern Arvada opened up 2022 saw a 85 7% increase due to the start of two large commercial projects There are still a healthy number of new houses being built in these developments as well as in-fill development in the City A decrease of 52 8% is estimated for 2023 as new housing stabilizes, followed by increases of 0% to 4%
In the past, general use tax has been a stable source of revenue as it represents capital investment by Arvada businesses An increase of 5% was estimated in 2023 Increases in future years are forecasted at 2%
88
$6,300,000 $6,800,000 $7,300,000 $7,800,000 $8,300,000 $8,800,000 $9,300,000 2021 Actual 2022 Actual 2023 Revised 2024 Forecast 2025 Forecast 2026 Forecast 2027 Forecast 2028 Forecast
Revenue and Expenditure Summary
Auto, Building and General Use Tax
Intergovernmental
This category accounts for state and county shared revenue. The Jefferson County Open Space revenue is a 0.5% sales tax collected in Jefferson County and shared with cities. This revenue is to be used for acquiring, maintaining, administering, and preserving open space and park and recreational capital improvements . The City uses all of the Open Space revenues for ongoing park maintenance . This revenue is estimated to increase 3% in 2023, with 3% increases in the future .
The Highway Users’ Tax Fund (HUTF) is derived from the state sales tax on vehicle gas purchases and is allocated based on the number of vehicles and population in each City . In the past, the City saw increases of 1%-4% each year . In 2020, this revenue source saw a decline of 26% because of the sharp decline in gas purchases during the pandemic 2021 saw an increase of 7% and an increase of 4 5% for 2022 An increase of 2% was estimated for 2023 with
increases of 1% in future years
The Road and Bridge tax is county shared revenue that is derived from a property tax mill levy set by the counties to be used for road and bridge construction, maintenance, and administration This revenue source has varied from year to year As the counties have the authority to change the allocations each year, the City has conservatively estimated a 1% increase in 2023 followed by a 1% increase in future years
89
$0 $5,000,000 $10,000,000 $15,000,000 $20,000,000 $25,000,000 2021 Actual 2022 Actual 2023 Revised 2024 Forecast 2025 Forecast 2026 Forecast 2027 Forecast 2028 Forecast Auto Use Building Use General Use
Revenue and Expenditure Summary
Intergovernmental Revenue


Charges for Services
The majority of this revenue source is from Water, Wastewater and Stormwater charges The City also implemented a solid waste and recycling program The City entered into an agreement with a single waste hauler to provide services for the City Services started in July 2021 In 2024, Water rates will increase 12% and there will be a $2 per month increase in the service fee, while Wastewater rates will increase 12% with a $1 per month increase in the service fee There will be a 5% increase in Stormwater rates The Solid Waste fund estimates at 3 5% increase in 2023 The estimated rate increases for these utilities is expected to increase 3 5% to 10% in future years The City has followed the methodology of rate increases each year in order to fund large capital maintenance projects to the system .
90
$0 $2,000,000 $4,000,000 $6,000,000 $8,000,000 $10,000,000 $12,000,000 $14,000,000 2021 Actual 2022 Actual 2023 Revised 2024 Forecast 2025 Forecast 2026 Forecast 2027 Forecast 2028 Forecast
Jefferson County Open Space HUTF County Road and Bridge
$$10,000,000 $20,000,000 $30,000,000 $40,000,000 $50,000,000 $60,000,000 $70,000,000 $80,000,000 $90,000,000 2021 Actual 2022 Actual 2023 Revised 2024 Forecast 2025 Forecast 2026 Forecast 2027 Forecast 2028 Forecast Water Wastewater Stormwater Solid Waste
Utility Rate Revenue
Revenue and Expenditure Summary
Miscellaneous
The major source of miscellaneous revenue is interest earnings . The City invests its excess cash pursuant to the City’s investment policy . The primary objectives of the City’s investment activities, in priority order are safety, liquidity and yield . Consistent with this policy, the portfolio of securities is invested in U .S . Treasuries, U .S . Agencies, local government investment pools, commercial paper and corporate debt subject to rating and concentration limits .
Interest Earnings
Interest earnings in 2022 generated a 1.5% yield with the first six months of 2023 generating a yield of 2 4% Interest revenue is estimated to decrease in 2023 from 2022 as the City spends down bond proceeds from the 2019 Sales and Use Tax bonds Currently, the interest is estimated to decrease due to many investments “locked-in” at lower interest rates. This is an area the City will continue to monitor.
Interest Earnings
91
$$1,000,000 $2,000,000 $3,000,000 $4,000,000 $5,000,000 $6,000,000 2021 Actual 2022 Actual 2023 Revised 2024 Forecast 2025 Forecast 2026 Forecast 2027 Forecast 2028 Forecast
Revenue and Expenditure Summary
Expenditures by Category
The following table illustrates total expenditure by category . Personnel costs comprise 27% of the total costs in 2024, with Capital Maintenance and Replacement accounting for 31% and Services & Charges at 11% .
The market rate adjustment is 3% for 2023 and is 3% for non-sworn personnel and 4% for sworn personnel in 2024 . It is also assumed that each employee will receive their appropriate step increase in 2023 and 2024, if eligible .
An additional four positions were added mid-cycle (from October 2022 to July 2023) and has made an immediate impact on the ability of the City to serve its customers . The areas addressed were Public Safety and Parks Maintenance An additional ten positions are proposed to be added in 2024 to support Public Safety, Legal, Municipal Courts, Wastewater, and Stormwater
92
2021 Actual 2022 Actual 2023 Revised 2024 Budget Personnel Costs $78,671,664 $79,133,810 $94,499,909 $103,259,380 Capital 30,277,496 50,987,846 150,918,540 121,925,423 Services & Charges 38,038,791 42,125,631 53,324,444 43,966,009 Professional Services 28,629,391 36,060,683 34,567,586 36,416,225 Supplies & Expenses 17,270,007 19,231,140 27,576,771 27,096,078 Debt Service 8,040,627 9,512,932 15,183,332 15,490,472 Miscellaneous 766,493 1,069,124 914,115 957,272 Transfers 32,592,246 41,531,949 48,569,998 38,355,238 Total Expenditures $234,286,715 $279,653,115 $425,554,695 $387,466,097 Personnel Costs 2021 Actual 2022 Actual 2023 Revised 2024 Budget Salaries and Wages $54,984,897 $54,372,021 $68,638,953 $75,736,164 Temporary Wages 2,755,103 2,558,266 2,827,967 2,933,786 Benefits 16,618,830 17,062,071 20,415,228 21,522,367 Overtime and Other 4,312,834 5,141,453 2,617,761 3,067,063 Total Personnel Costs $78,671,664 $79,133,810 $94,499,909 $103,259,380 $ Change 462,146 15,366,099 8,759,471 % Change 0 .6% 19 .4% 9 .3%
Revenue and Expenditure Summary
Benefits are primarily comprised of health and dental costs. Total health costs in 2024 are expected to remain flat.
Most of the overtime and special pays are in the streets, police and water divisions, all due to general emergencies such as weather and other extraordinary events
Services and charges include expenses related to paying other agencies or organizations . Examples include: the utility costs the City pays for electricity, natural gas, water, wastewater and stormwater, monies paid to Denver Water for the purchase of raw water and the services to Metro Wastewater for the treatment of the City's sewage . The City pays outside consultants for a variety of trainings, including state and federal mandated training . Support to the Arvada Center for the Arts
of $3 .9 million is included in this expenditure category
Capital
The City has a Capital Improvement Plan (CIP) detailing the 2024 appropriations as well as a ten-year plan for the City's capital expenditures. For specific projects, please see the Capital Improvement Plan section in this document
The City has a legal provision to dedicate 60.0% of the first cent of sales tax to infrastructure, major capital maintenance, new construction or debt service This is referred to as 98-101 money after the section of the City's code authorizing the sales tax dedication for capital projects
In 2024 a total of $15 million will be generated from sales tax for capital needs . Of this total $7 .7 million will be used to pay for debt service for previous capital needs The remainder will be dedicated to capital improvement projects .
93
Services and Charges 2021 Actual 2022 Actual 2023 Revised 2024 Budget Housing Program $6,886,517 $6,020,553 $5,424,981 $5,483,859 Insurance 2,636,236 3,915,540 5,042,707 5,341,877 CDBG Program 343,234 532,795 587,056 419,268 Utilities 9,554,265 11,033,195 12,838,438 13,443,064 Program Expense 5,700,011 4,098,123 14,324,766 4,119,115 Training 692,075 1,035,908 1,325,366 1,271,978 Contract Services 2,080,541 2,646,432 2,411,750 3,105,702 Other 10,145,912 12,843,086 11,369,380 10,781,146 Total Services and Charges $38,038,791 $42,125,631 $53,324,444 $43,966,009 $ Change 4,086,840 11,198,813 (9,358,435) % Change 10 7% 26 6% -17 5%
and Humanities
In addition to these monies, the CIP recommendations include using water, wastewater, and stormwater revenues for major utility projects There will also be a variety of grants and other intergovernmental revenues to meet various needs
The table below is an overview of the types of capital expenditures
Debt Service
In 2019, the City issued $79.5 million in bonds to finance two road projects. Additionally, the City issued $7.2 million in bonds to finance two road projects. Debt service also includes the City's three Certificates of Participation (COP) - the 2005 COP, refinanced in 2015 and set to retire in 2025, the 2016 COP set to retire in 2036 and the 2021 COP set to expire in 2041 .
94
2023 Revised 2024 Budget 98-101 $15,038,925 $15,481,952 Debt Service Obligations Bond Payments (5,797,474) (5,801,282) COP Payments (1,976,683) (1,971,843) Transfer to the capital improvement program $7,264,768 $7,708,827
Revenue and Expenditure Summary
2023 Revised 2024 Budget General Administration $7,303,372 $665,008 Transportation 3,315,066 3,517,620 Parks and Golf 3,394,297 1,687,106 Water 52,821,216 41,752,040 Wastewater 10,547,631 22,568,000 Stormwater 1,030,304 1,793,982 Total $78,411,886 $71,983,756
Revenue and Expenditure Summary
Transfers
There are a host of transfers to and from various departments Examples include the following highlights:
The largest transfers are from the General Fund to help support the activities of other departments' missions The Water and Wastewater Funds pay the General Fund for building, utility and overhead expenses of operating these lines of business .
95
From To Amount General Fund Streets Maintenance $12,864,244 General Fund Parks $5,355,623 General Fund COP $3,303,484 General Fund Capital Projects $8,948,484 General Fund Golf $291,098 Water General Fund $2,633,885 Wastewater General Fund $653,379 Stormwater General Fund $473,519
Revenue and Expenditure Summary
96
Revenue Trend Analysis 2021 Actuals, 2022 Actuals, 2023 Revised and 2024 Budget 2021 Actual 2022 Actual 2023 Revised 2024 Budget General Fund $109,951,072 $119,952,002 $119,513,126 $124,670,824 Grants 732,831 745,432 590,529 596,435 Streets Maintenance Fund 10,284,847 13,759,216 11,954,121 12,864,244 Community Development 2,058,260 997,635 895,280 715,017 Arvada Housing Authority 6,284,345 6,553,061 5,973,229 6,033,245 Parks 10,883,497 13,283,020 13,431,971 14,125,779 Police Seizure 304,385 134,715 32,304 32,545 COP Debt Service 2,129,839 2,564,719 3,268,984 3,268,484 Police Tax Increment 21 6,293,000 6,683,529 7,358,337 7,403,684 Police Tax Increment .25 7,066,223 7,511,745 8,063,554 8,168,309 Debt Service 5,363,452 5,363,598 5,805,474 5,809,282 Capital Projects 22,157,724 13,716,018 14,426,227 10,337,325 Special Assessments 5,698 767 -Water 32,074,047 90,689,934 43,515,366 98,316,342 Wastewater 17,739,680 64,651,396 19,552,248 21,729,359 Golf Courses 7,378,909 7,707,489 7,700,859 8,163,272 Stormwater 6,757,690 4,681,242 4,118,634 4,321,435 Solid Waste 4,786,861 4,315,178 4,449,017 4,604,733 Insurance 2,231,596 2,348,336 3,535,066 3,830,068 Computers 3,007,640 8,101,820 5,158,602 6,297,636 Print Shop 324,446 295,107 335,000 335,000 Vehicles 6,976,204 7,223,801 6,918,340 7,778,278 Buildings 642,752 1,032,362 1,105,794 1,141,411 Total All Budgeted Funds $265,434,998 $382,312,122 $287,702,062 $350,542,707
Revenue and Expenditure Summary
Expenditure Trend Analysis
97
2021 Actuals, 2022 Actuals, 2023 Revised and 2024 Budget 2021 Actual 2022 Actual 2023 Revised 2024 Budget General Fund $96,059,501 $110,844,841 $132,565,501 $124,576,764 Grants 1,165,000 - 184,481 190,016 Streets Maintenance Fund 9,090,755 14,927,645 12,322,584 12,824,973 Community Development 1,833,163 886,696 1,397,426 1,226,248 Arvada Housing Authority 6,164,203 6,449,920 5,938,645 6,021,464 Parks 10,199,482 12,470,894 13,840,003 14,337,478 Police Seizure 11,162 759,394 30,312 31,222 COP Debt Service 2,131,748 2,517,621 3,277,985 3,277,484 Police Tax Increment 21 5,763,068 5,467,489 7,804,560 7,591,419 Police Tax Increment .25 6,082,361 6,320,886 8,813,308 8,269,420 Debt Service 5,363,431 5,363,681 5,800,474 5,804,282 Capital Projects 8,141,982 5,239,732 22,223,494 8,249,512 Special Assessments - - -Water 40,814,302 59,553,236 125,869,216 101,037,278 Wastewater 13,261,573 15,641,966 39,679,675 55,971,929 Golf Courses 6,636,679 7,322,059 7,695,923 8,010,198 Stormwater 3,258,509 7,127,987 9,400,547 6,761,290 Solid Waste 4,059,970 4,615,679 4,586,549 4,737,907 Insurance 3,345,499 3,854,947 3,462,180 3,548,316 Computers 2,460,533 2,967,310 12,680,157 7,028,141 Print Shop 319,609 349,578 363,250 365,994 Vehicles 7,505,613 6,347,430 6,817,254 7,128,700 Buildings 618,572 624,125 801,171 476,062 Total All Budgeted Funds $234,286,714 $279,653,116 $425,554,695 $387,466,097
Revenue and Expenditure Summary
General Fund
The General Fund pays for the City's basic services This includes police, planning, transportation planning, street light maintenance and costs, building activity and general administration . In addition, the General Fund also provides for the following:
• Operational support to the Parks Department
• General Debt Service Payments
• Transfer to the Capital Improvements Fund for new parks, transportation and other infrastructure projects
• Grant support to the Arvada Center
98
Funding Sources 2021 Actual 2022 Actual 2023 Revised 2024 Budget Taxes $90,546,114 $101,988,279 $100,794,284 $102,841,195 Licenses, Permits and Fees 4,175,086 4,607,443 3,698,178 3,961,453 Intergovernmental 5,151,560 5,771,379 5,472,997 5,570,341 Charges for Services 4,698,667 5,004,747 4,064,186 4,672,851 Fine and Forfeits 1,089,246 854,045 1,059,357 802,079 Miscellaneous 3,785,802 1,616,575 4,097,510 6,486,492 Revenue Transfer 298,452 109,534 326,614 336,413 Other Funding Sources 206,145 - -Total Revenues $109,951,072 $119,952,002 $119,513,126 $124,670,824 Expenditures/Uses 2021 Actual 2022 Actual 2023 Revised 2024 Budget Personnel $46,918,310 $44,943,168 $55,302,417 $60,073,664 Services and Charges 11,749,498 13,114,076 25,959,790 16,029,455 Supplies and Expenses 6,431,820 8,537,563 9,138,218 10,258,483 Contract and Leases 5,365,621 6,843,892 6,092,109 6,296,812 Inventory (27,473) 28,467 20,600 21,218 Capital Maintenance 522,670 454,918 526,289 533,724 Capital Outlay 473,651 2,906,636 132,580 182,657 Transfers 24,623,006 33,974,986 35,389,456 31,176,586 Other 2,398 8,713 4,042 4,165 Total Expenditures $96,059,501 $110,812,419 $132,565,501 $124,576,764
Revenue and Expenditure Summary
Special Revenue Funds
Special Revenue Funds account for revenues that are to be used for specific purposes. Funds included in Special Revenue funds are Streets Maintenance Fund, Grants Fund, Community Development, Arvada Housing Authority, Parks, Police Seizure and the two Police Tax Increment Funds .
99
Funding Sources 2021 Actual 2022 Actual 2023 Revised 2024 Budget Taxes $13,026,272 $14,547,114 $14,590,775 $14,765,459 Licenses, Permits and Fees 47,765 42,537 66,824 68,829 Intergovernmental 15,077,752 15,218,177 14,677,505 14,735,654 Charges for Services 38,188 834,547 1,120,267 1,269,075 Miscellaneous 1,578,626 833,079 744,680 760,369 Revenue Transfer 14,138,784 18,192,899 17,099,274 18,339,872 Total Revenues $43,907,388 $49,668,353 $48,299,325 $49,939,258 Expenditures/Uses 2021 Actual 2022 Actual 2023 Revised 2024 Budget Personnel $15,309,836 $16,144,662 $18,380,243 $21,095,893 Services and Charges 10,239,480 11,539,901 10,413,647 10,177,910 Supplies and Expenses 3,109,621 4,110,023 4,451,859 4,782,445 Contract and Leases 9,109,278 13,467,326 12,296,833 12,802,716 Inventory 4,370 (1,301) 2,610 2,688 Capital Maintenance 157,347 181,568 273,320 255,317 Capital Outlay 80,217 763,626 857 883 Transfers 2,298,322 1,077,118 4,507,850 1,370,288 Other 723 - 4,100 4,100 Total Expenditures $40,309,193 $47,282,924 $50,331,319 $50,492,240
Revenue and Expenditure Summary
Debt Service Funds
Debt Service Funds account for the debt issued by general government and include 2015 Certificates of Participation, 2016 Certificates of Participation, 2019 Sales and Use Tax Revenue Bonds, 2023 Sales and Use Tax Revenue Bonds, and 2021 Certificates of Participation.
100
Funding Sources 2021 Actual 2022 Actual 2023 Revised 2024 Budget Taxes $5,347,206 $5,347,629 $5,797,474 $5,801,282 Miscellaneous 25,249 25,097 8,000 8,000 Revenue Transfer 2,120,837 2,555,590 3,268,984 3,268,484 Total Revenues $7,493,292 $7,928,317 $9,074,458 $9,077,766 Expenditures/Uses 2021 Actual 2022 Actual 2023 Revised 2024 Budget Services and Charges $1,900 $1,900 $3,000 $3,000 Contract and Leases 6,000 6,000 10,000 10,000 Debt Service 7,487,280 7,873,403 9,065,459 9,068,766 Total Expenditures $7,495,180 $7,881,303 $9,078,459 $9,081,766
Revenue and Expenditure Summary
Capital Projects Funds
The Capital Projects Funds account for capital projects for streets, traffic and parks.
101
Funding Sources 2021 Actual 2022 Actual 2023 Revised 2024 Budget Taxes $102,088 $92,130 $90,287 $88,482 Intergovernmental 1,915,668 1,254,996 -Charges for Services 911,671 726,607 -Miscellaneous 10,250,933 720,469 350,000 350,000 Revenue Transfer 8,983,063 10,922,583 13,985,940 9,898,843 Other Funding Sources - - -Total Revenues $22,163,422 $13,716,785 $14,426,227 $10,337,325 Expenditures/Uses 2021 Actual 2022 Actual 2023 Revised 2024 Budget Personnel $- $110,810 $136,596 $143,930 Services and Charges 2,379,626 2,535,723 -Supplies and Expenses 160,958 167,027 4,649 5,518 Contracts and Leases 715,924 637,870 -Debt Service 390,147 - -Inventory - - -Capital Maintenance 1,660 10,150 -Capital Outlay 4,343,666 1,778,151 22,082,249 8,100,064 Transfers 150,000 - -Total Expenditures $8,141,982 $5,239,732 $22,223,494 $8,249,512
Revenue and Expenditure Summary
Enterprise Funds
The Enterprise Funds account for all business type activities and include Water, Wastewater, Stormwater, Golf Courses, and Solid Waste It is intended that all expenditures necessary, including capital and debt service costs, are captured in the fees related to the activity .
102
Funding Sources 2021 Actual 2022 Actual 2023 Revised 2024 Budget Licenses, Permits and Fees $17,294,281 $18,160,843 $13,651,179 $14,194,566 Intergovernmental 735,128 - -Charges for Services 44,690,513 58,725,255 62,633,905 69,726,137 Miscellaneous 3,421,421 4,566,357 2,280,955 2,421,199 Revenue Transfer 1,004,324 830,716 770,085 793,239 Other Funding Sources 1,591,518 89,707,973 - 50,000,000 Total Revenues $68,737,185 $171,991,145 $79,336,124 $137,135,141 Expenditures/Uses 2021 Actual 2022 Actual 2023 Revised 2024 Budget Personnel $13,901,983 $15,255,960 $17,886,753 $19,031,653 Services and Charges 10,680,428 11,586,015 14,221,223 14,949,473 Supplies and Expenses 4,755,166 3,185,164 3,797,009 4,331,376 Contract and Leases 13,226,013 14,800,714 15,865,651 16,969,804 Debt Service 163,200 1,592,694 6,117,873 6,421,706 Inventory 826,500 977,443 876,103 918,244 Capital Maintenance 2,770,853 2,594,084 16,008,689 11,566,742 Capital Outlay 16,274,655 37,864,406 106,874,029 96,611,997 Transfers 5,431,586 6,387,835 5,577,920 5,710,750 Other 647 16,609 6,660 6,857 Total Expenditures $68,031,031 $94,260,924 $187,231,910 $176,518,602
Revenue and Expenditure Summary
Internal Service Funds
Internal Service Funds charge internal programs and departments for use of goods and services . The Funds then pay for all associated costs of things such as purchasing insurance, vehicle purchases and maintenance, computer purchases and maintenance, and buildings maintenance. There are five Internal Service Funds - Insurance Fund (Risk Management), Computer Fund, Print Services Fund, Vehicles Fund and Building Fund
103
Funding Sources 2021 Actual 2022 Actual 2023 Revised 2024 Budget Intergovernmental $11,274,230 $14,208,694 $15,825,674 $17,859,508 Charges for Services 116,461 105,386 111,598 85,023 Miscellaneous 168,365 (498,039) 372,000 390,000 Revenue Transfer 1,317,061 4,953,718 668,530 972,862 Other Financing Sources 306,522 231,668 75,000 75,000 Total Revenues $13,182,640 $19,001,426 $17,052,802 $19,382,393 Expenditures/Uses 2021 Actual 2022 Actual 2023 Revised 2024 Budget Personnel $2,541,535 $2,679,210 $2,793,900 $2,914,240 Services and Charges 2,987,859 3,348,015 2,726,784 2,806,171 Supplies and Expenses 2,812,442 3,231,363 10,185,036 7,718,256 Contract and Leases 206,555 304,880 302,993 336,893 Inventory - (10,871) -Capital Maintenance (40,672) 1,509,945 1,421,581 1,113,139 Capital Outlay 1,262,213 2,924,361 3,598,946 3,560,900 Transfers 4,390,564 92,010 3,094,772 97,614 Other 89,332 50,064 -Total Expenditures $14,249,828 $14,128,978 $24,124,012 $18,547,213
Summary
104
2024 Expenditure
Work System General Fund Capital Project Funds Internal Service Funds Special Revenue Funds Debt Service Funds Enterprise Funds Community and Economic Development $5,457,215 $- $- $7,261,738 $- $Infrastructure 21,955,839 - 7,618,426 12,404,110 - 179,117,249 Organizational Service and Effectiveness 73,386,149 - 16,505,586 318,840 - 321,947 Safe Community 31,557,941 - - 16,252,969 -Vibrant Communities and Neighborhoods 208,357 - - 13,909,182 - 7,792,714 Capital Projects - 22,223,494 - 184,480 -Debt Service - - - - 9,078,459Total $132,565,501 $22,223,494 $24,124,012 $50,331,319 $9,078,459 $187,231,910 Work System General Fund Capital Project Funds Internal Service Funds Special Revenue Funds Debt Service Funds Enterprise Funds Community and Economic Development $5,710,193 $- $- $7,161,434 $- $Infrastructure 23,903,418 - 7,604,762 12,897,713 - 168,066,656 Organizational Service and Effectiveness 59,969,550 - 10,942,451 335,474 - 339,275 Safe Community 34,656,147 - - 15,483,846 -Vibrant Communities and Neighborhoods 337,456 - - 14,423,755 - 8,112,671 Capital Projects - 8,249,512 - 190,018 -Debt Service - - - - 9,081,766Total $124,576,764 $8,249,512 $18,547,213 $50,492,240 $9,081,766 $176,518,602
Revenue and Expenditure
2023 Expenditure Appropriations by Work System and Fund Type
Appropriations by Work System and Fund Type
2023-2032 TEN-YEAR MODEL ASSUMPTIONS
In 2015, City Council adopted a budget and fiscal policy that utilizes long-range planning for each of the City’s operating funds to maintain the fiscal health of the City. Specifically, the City prepares a two-year budget based on a ten-year financial model. This method of budgeting is used to determine if future impacts of the current proposed budget are fiscally sound. Using this ten-year model, the City is able to test the effects of current financial decisions on future years’ financial conditions when approving funding requests throughout the organization Budgeting in this manner allows management time to react and respond to changes in the economy and minimizes the effect of budget fluctuations on service delivery. Ten-year model assumptions are reviewed on an annual basis and revised as necessary The objective is that each fund should work towards maintaining a fund balance that is equal to or exceeds the required City Council fund balance goal in the tenth year
For the ten-year models, projections of economically-driven revenues do not factor in potential recessions or periods of robust expansion, which may occur during the ten year forecast . Instead, the revenue forecast assures continued moderate growth in the economy and the City’s population . In addition, expenditures do not take into consideration expansion of services or programs or an increase in the number of employees .
All Funds
• Personnel-related expenses are calculated in detail based upon each employee’s current grade and step and include future estimated market-rate adjustments The market-rate adjustment for 2024 is 3% non-sworn personnel and 4% for sworn personnel, 1% for 2025 and 2% for 2026-2032
• The increase in health insurance is estimated at 0% for 2024 Increases in the future for the City’s medical plan are budgeted at 5% for 2025-2032 .
• Transfers to fund insurance lines, vehicle replacement, computer maintenance and computer replacement have a .50% to 5% increase throughout the models .
• Transfers to fund building maintenance, vehicle maintenance and risk management services have a 3% increase throughout the models
General Fund
• The fund balance goal is 17% of all expenditures
• Sales tax revenue is continuing to see unprecedented growth and is based on a 9 6% increase in 2022 with a 6.2% increase in the first six months of 2023. Sales tax in future years assumes growth rates between 1 .4% and 3 .4% . These rates are based on the historical trend of sales tax .
• Auto use tax saw a 1 .7% increase in 2022 . An increase of 0% is expected for 2023 with increases of 1% to 2% in future years with a 3% decrease in 2027, as the City normally experiences a reset in auto use tax every five to seven years.
• Building use tax revenue assumes an increase of 14% in 2024 . Increases of 0% to 4% are estimated for 2025 and beyond with a 0% in 2029 to reset the base .
• Building permit revenue is expected to increase 9 .1% in 2024 to reset the base to $3,000,000 . Increases of .5% are expected in the future .
• Assumes $1,336,000 in additional annual sales tax starting in 2029 when the Kipling Ridge urban renewal tax increment area ends
• Assumes $12,320,000 for street maintenance in 2023 An additional $500,000 annual transfer will start
105
Ten Year Models
in 2024, raising the base funding to $12,850,000 per year with variable growth rates from 2% to 3% for 2025 and beyond .
• Assumes the required transfer to the Capital Projects Fund and/or Debt Service Fund to maintain compliance with section 98-101 of the Arvada Code .
• Assumes a salary vacancy savings of 3.25% for 2023. The salary vacancy rate stays flat in 2024 –2026 to 3% and then back down to 2 .25% in 2027 and beyond .
• All non-personnel expenditures increased at 3% in 2023 and beyond .
Parks
• The fund balance goal is 11% of all expenditures .
• Assumes a transfer from the General Fund of $5,025,000 in 2023 Increases for 2024 – 2032 range from 3% to 4%
• Open Space revenues are budgeted to increase at 3% through the model
• The City’s attributable share of Open Space revenue will continue to be used 100% for park maintenance and operations in 2024 and thereafter .
Police Tax .21
• The fund balance goal is 11% of all expenditures
• Sales tax, auto and building use tax assumptions are the same as the General Fund and also assume an increase when the Kipling Ridge urban renewal area ends .
• Assumes the replacement of the radio system and the creation of an evidence storage facility in the next 3 years .
Police Tax .25
• The fund balance goal is 11% of all expenditures .
• Sales tax, auto and building use tax assumptions are the same as the General Fund and also assume an increase when the Kipling Ridge urban renewal area ends
• Assumes the replacement of the radio system and the creation of an evidence storage facility in the next 3 years .
Water
• The working capital goal is 25% of expenditures .
• Rates are budgeted to increase 12% in 2024 with increases of 10% thereafter .
• Service fees are budgeted to increase $2 per month in every year starting in 2022 – 2025 with no increase thereafter
• Assumes a debt service payment ranging from $2,700,000 to $9,800,000 with $50,000,000 debt issuances in 2022, 2024 and 2026 .
• The Water fund does not meet its working capital goal in 2025, 2029, 2030, but recovers and meets the working capital goal by 2032 .
Wastewater
• The working capital goal is 25% of all expenditures
• Rates are budgeted to increase 12% in 2024 with increases of 10% thereafter
• Service fees are budgeted to increase $1 per month in every year starting in 2022 – 2025 with no increase thereafter .
106
Year
Ten
Models
• System Development Charges (formally known as Tap Fees) will be placed at the market rate starting in 2023 . This will move the charge from $1,500 to $10,400 and will be used to fund some much needed capital projects .
• Assumes a debt service payment of $2,700,000 to $4,600,000 starting in 2023 with debt issuances in 2022 and 2024 for capital projects
• The Wastewater fund does not meet its working capital goal in 2026 – 2031, but recovers and meets the working capital goal by 2032 .
Golf
• The working capital goal is 11% of all expenditures .
• Assumes that the Golf fund will pay for its share of the COP to finance the West Woods expansion with a transfer to the COP fund of $428,000 in 2023 increasing to $470,000 in 2032
• Assumes that the Golf fund will pay the Wastewater fund $163,000/year on the note payable used to finance the irrigation system replacement.
• The Golf fund does not meet its working capital until 2025 .
Storm Water
• The working capital goal is 25% of all expenditures .
• Rates are budgeted to increase 5% in 202 4 and 5% thereafter .
• Assumes a debt service payment of $350,000 starting in 2026 with debt issuance anticipated in 2025 for capital projects
• The Stormwater fund does not meet its working capital goal in 2027-2031, but recovers and meets the goal by 2032 .
Solid Waste
• This was a new fund in 2021 to account for revenues and expenditures of a city-wide solid waste hauling and recycling system .
• The Solid Waste fund does not meet its working capital goal in 2021 – 2027 The working capital goal is not met in 2031 due to capital investment in new trash carts, but recovers and meets the working capital goal by 2032
Insurance Services
• The fund balance goal is $3,000,000 plus the annual actuarial projection for limited loss .
• Revenues for insurance lines are assumed to increase at 3% to 5% throughout the model .
• Revenues for risk management services are increased at 3% throughout the model
107
Ten Year Models
Ten Year Models
Ten-Year Financial Models
General Fund - Table 1
108
2021 Actual 2022 Actual 2023 Revised 2024 Forecast 2025 Forecast 2026 Forecast REVENUES Taxes $90,546,114 $101,988,279 $100,794,284 $102,841,195 $105,430,171 $107,818,218 Licenses, Permits and Fees 4,175,086 4,607,443 3,698,178 3,961,453 3,940,131 3,939,293 Intergovernmental 5,151,560 5,771,379 5,472,997 5,570,341 5,625,644 5,681,500 Charges for Services 4,698,667 5,004,747 4,064,186 4,672,851 4,795,937 4,722,715 Fines & Forfeits 1,089,246 854,045 1,059,357 802,079 810,982 827,202 Miscellaneous 3,785,802 1,616,575 4,097,510 6,486,492 7,932,220 6,902,387 Other Financing Sources 206,145 - - - -Revenue Transfer 298,452 109,534 326,614 336,413 346,505 356,900 Total General Fund Revenue $109,951,072 $119,952,002 $119,513,126 $124,670,824 $128,881,590 $130,248,215 EXPENDITURES Personnel $46,918,310 $44,943,168 $55,302,417 $60,073,664 $61,841,422 $63,886,355 Services & Charges 11,749,498 13,114,076 25,959,790 16,029,455 15,784,266 16,298,148 Supplies & Expenses 6,431,820 8,537,563 9,138,218 10,258,483 10,618,914 11,006,689 Contract & Leases 5,365,621 6,843,892 6,092,109 6,296,812 5,203,468 5,361,153 Debt Service - 32,422 - - -Inventory (27,473) 28,467 20,600 21,218 21,854 22,510 Capital Maintenance 522,670 454,918 526,289 533,724 549,474 565,689 Capital Outlay 473,651 2,906,636 132,580 182,657 82,737 82,819 Transfers 24,623,006 33,974,986 35,389,456 31,176,586 32,518,728 32,014,101 Other 2,398 8,713 4,042 4,164 4,289 4,417 Total General Fund Expenditures $96,059,501 $110,844,841 $132,565,501 $124,576,764 $126,625,153 $129,241,882 Fund Balance, Beginning $47,115,113 $61,006,684 $70,113,845 $57,061,470 $57,155,530 $59,411,967 Fund Balance, Ending $61,006,684 $70,113,845 $57,061,470 $57,155,530 $59,411,967 $60,418,300 Fund Balance Goal (17% of Expenditures) $16,330,115 $18,843,623 $22,536,135 $21,178,050 $21,526,276 $21,971,120 Excess/(Deficiency) $44,676,569 $51,270,222 $34,525,335 $35,977,480 $37,885,691 $38,447,181
Ten Year Models
Ten-Year Financial Models
General Fund - Table 1
109
2027 Forecast 2028 Forecast 2029 Forecast 2030 Forecast 2031 Forecast 2032 Forecast REVENUES Taxes $109,645,343 $112,512,202 $116,570,049 $118,147,915 $120,865,823 $124,085,285 Licenses, Permits and Fees 3,968,952 3,999,120 4,029,811 4,061,038 4,092,815 4,125,158 Intergovernmental 5,737,915 5,794,894 5,852,443 5,910,568 5,969,273 6,028,566 Charges for Services 4,853,296 4,987,795 5,126,329 5,269,019 5,415,989 5,567,369 Fines & Forfeits 843,746 860,622 877,835 895,391 913,300 931,566 Miscellaneous 6,315,824 4,310,615 4,288,687 4,218,395 4,189,084 4,373,997 Other Financing Sources - - - - -Revenue Transfer 367,606 378,634 389,992 401,691 413,742 426,153 Total General Fund Revenue $131,732,683 $132,843,882 $137,135,146 $138,904,018 $141,860,027 $145,538,094 EXPENDITURES Personnel $66,464,879 $68,566,577 $70,579,139 $72,519,747 $74,378,924 $76,212,476 Services & Charges 16,849,336 17,322,121 17,775,425 18,241,580 18,730,997 19,234,312 Supplies & Expenses 11,510,459 11,640,225 11,915,753 12,195,354 12,483,100 12,781,688 Contract & Leases 5,492,205 5,642,945 5,812,037 5,957,355 6,121,550 6,303,951 Debt Service - - - - -Inventory 23,185 23,881 24,597 25,335 26,095 26,878 Capital Maintenance 582,385 599,578 617,280 635,509 654,278 673,604 Capital Outlay 2,904 2,991 3,081 3,173 3,268 3,366 Transfers 33,417,743 34,211,655 35,161,160 35,804,087 36,866,283 38,024,655 Other 4,550 4,686 4,827 4,972 5,121 5,274 Total General Fund Expenditures $134,347,647 $138,014,659 $141,893,299 $145,387,113 $149,269,617 $153,266,204 Fund Balance, Beginning $60,418,300 $57,803,337 $52,632,560 $47,874,407 $41,391,312 $33,981,723 Fund Balance, Ending $57,803,337 $52,632,560 $47,874,407 $41,391,312 $33,981,723 $26,253,612 Fund Balance Goal (17% of Expenditures) $22,839,100 $23,462,492 $24,121,861 $24,715,809 $25,375,835 $26,055,255 Excess/(Deficiency) $34,964,237 $29,170,068 $23,752,546 $16,675,503 $8,605,888 $198,358
Ten Year Models
Ten-Year Financial Models
Parks - Table 2
110
2021 Actual 2022 Actual 2023 Revised 2024 Forecast 2025 Forecast 2026 Forecast REVENUES Licenses, Permits and Fees $47,765 $42,537 $66,824 $68,829 $70,894 $73,020 Intergovernmental 6,148,620 6,835,466 7,022,756 7,234,158 7,451,183 7,674,719 Charges for Services 38,188 834,547 1,120,267 1,269,075 1,336,323 1,338,639 Miscellaneous 806,496 926,426 196,971 198,090 199,240 200,321 Revenue Transfer 3,842,427 4,644,043 5,025,153 5,355,627 5,547,263 5,756,289 Total Revenues $10,883,497 $13,283,020 $13,431,971 $14,125,779 $14,604,903 $15,042,988 EXPENDITURES Personnel $5,429,674 $6,337,991 $7,008,072 $7,343,035 $7,593,755 $7,895,025 Services & Charges 2,232,686 2,518,837 3,239,166 3,189,326 3,304,392 3,420,414 Supplies & Expenses 1,936,247 2,335,998 2,713,593 2,968,767 3,104,383 3,248,664 Contract & Leases 176,624 309,163 621,710 597,370 615,291 633,750 Inventory 4,370 (1,301) 2,610 2,688 2,768 2,852 Capital Maintenance 151,681 181,568 254,752 236,192 243,278 250,576 Capital Outlay 36,200 - - - -Transfers 232,000 788,638 - - -Other - - 100 100 100 100 Total Expenditures $10,199,482 $12,470,894 $13,840,003 $14,337,478 $14,863,968 $15,451,380 Fund Balance, Beginning $6,055,456 $6,739,470 $7,551,596 $7,143,564 $6,931,865 $6,672,800 Fund Balance, Ending $6,739,470 $7,551,596 $7,143,564 $6,931,865 $6,672,800 $6,264,409 Fund Balance Goal (11% of Expenditures) $1,121,943 $1,371,798 $1,522,400 $1,577,123 $1,635,036 $1,699,652 Excess/(Deficiency) $5,617,527 $6,179,797 $5,621,163 $5,354,742 $5,037,764 $4,564,757
Ten Year Models
Ten-Year Financial Models
Parks - Table 2
111
2027 Forecast 2028 Forecast 2029 Forecast 2030 Forecast 2031 Forecast 2032 Forecast REVENUES Licenses, Permits and Fees $75,211 $77,467 $79,791 $82,185 $84,651 $87,190 Intergovernmental 7,904,961 8,142,110 8,386,374 8,637,965 8,897,105 9,164,018 Charges for Services 1,341,025 1,377,206 1,379,737 1,382,344 1,385,029 1,422,531 Miscellaneous 203,234 206,235 209,326 212,509 215,788 219,165 Revenue Transfer 5,899,739 6,078,706 6,233,477 6,347,971 6,496,850 6,632,587 Total Revenues $15,424,170 $15,881,724 $16,288,705 $16,662,974 $17,079,423 $17,525,491 EXPENDITURES Personnel $8,190,282 $8,489,073 $8,780,853 $9,059,415 $9,310,535 $9,552,205 Services & Charges 3,521,316 3,625,249 3,732,304 3,842,574 3,956,157 4,073,150 Supplies & Expenses 3,339,913 3,438,921 3,511,576 3,584,623 3,659,829 3,738,205 Contract & Leases 652,762 672,345 692,515 713,291 734,690 756,730 Inventory 2,937 3,025 3,116 3,209 3,306 3,405 Capital Maintenance 258,093 265,836 273,811 282,026 290,486 299,201 Capital Outlay - - - - -Transfers - - - - -Other 100 100 100 100 100 100 Total Expenditures $15,965,403 $16,494,549 $16,994,275 $17,485,238 $17,955,102 $18,422,997 Fund Balance, Beginning $6,264,409 $5,723,176 $5,110,350 $4,404,780 $3,582,516 $2,706,838 Fund Balance, Ending $5,723,176 $5,110,350 $4,404,780 $3,582,516 $2,706,838 $1,809,332 Fund Balance Goal (11% of Expenditures) $1,756,194 $1,814,400 $1,869,370 $1,923,376 $1,975,061 $2,026,530 Excess/(Deficiency) $3,966,981 $3,295,950 $2,535,410 $1,659,140 $731,776 $(217,198)
Ten Year Models
Ten-Year Financial Models
Police Tax Increment .21 - Table 3
112
2021 Actual 2022 Actual 2023 Revised 2024 Forecast 2025 Forecast 2026 Forecast REVENUES Taxes $5,907,677 $6,596,922 $6,697,221 $6,770,151 $6,926,841 $7,083,125 Intergovernmental 402,929 430,145 536,116 498,533 515,282 178,312 Miscellaneous (17,606) (343,539) 125,000 135,000 140,000 135,000 Total Revenues $6,293,000 $6,683,529 $7,358,337 $7,403,684 $7,582,123 $7,396,437 EXPENDITURES Personnel $4,040,166 $3,783,974 $4,809,754 $5,951,293 $6,238,530 $6,152,692 Services & Charges 410,388 373,002 437,122 312,073 327,443 343,695 Supplies & Expenses 454,998 770,092 718,477 773,046 797,833 799,954 Contract & Leases 414,944 423,935 369,038 380,109 391,512 403,258 Capital Maintenance 2,920 - 9,665 9,955 10,254 10,561 Capital Outlay 44,017 18,452 - - -Transfers 395,634 98,033 1,460,504 164,944 469,517 174,227 Total Expenditures $5,763,068 $5,467,489 $7,804,560 $7,591,419 $8,235,089 $7,884,387 Fund Balance, Beginning $6,771,052 $7,300,984 $8,517,024 $8,070,801 $7,883,067 $7,230,101 Fund Balance, Ending $7,300,984 $8,517,024 $8,070,801 $7,883,067 $7,230,101 $6,742,151 Fund Balance Goal (11% of Expenditures) $629,096 $599,394 $858,502 $835,056 $905,860 $867,283 Excess/(Deficiency) $6,671,889 $7,917,630 $7,212,300 $7,048,011 $6,324,241 $5,874,868
Ten Year Models
Ten-Year Financial Models
Police Tax Increment .21 - Table 3
113
2027 Forecast 2028 Forecast 2029 Forecast 2030 Forecast 2031 Forecast 2032 Forecast REVENUES Taxes $7,247,986 $7,383,545 $7,471,660 $7,653,036 $7,870,350 $8,094,006 Intergovernmental 184,059 190,074 196,113 202,155 206,296 210,586 Miscellaneous 120,000 110,000 90,000 80,000 50,000 30,000 Total Revenues $7,552,045 $7,683,619 $7,757,773 $7,935,191 $8,126,646 $8,334,592 EXPENDITURES Personnel $6,153,540 $6,381,240 $6,554,771 $6,730,078 $6,900,502 $7,073,147 Services & Charges 354,006 364,626 375,565 386,832 398,437 410,390 Supplies & Expenses 799,176 823,079 845,926 869,348 893,474 918,381 Contract & Leases 415,355 427,816 440,650 453,870 467,486 481,511 Capital Maintenance 10,878 11,204 11,541 11,887 12,243 12,611 Capital Outlay - - - - -Transfers 179,079 184,076 189,224 194,525 199,986 205,611 Total Expenditures $7,912,035 $8,192,042 $8,417,676 $8,646,541 $8,872,129 $9,101,649 Fund Balance, Beginning $6,742,151 $6,382,161 $5,873,738 $5,213,834 $4,502,484 $3,757,001 Fund Balance, Ending $6,382,161 $5,873,738 $5,213,834 $4,502,484 $3,757,001 $2,989,944 Fund Balance Goal (11% of Expenditures) $870,324 $901,125 $925,944 $951,120 $975,934 $1,001,181 Excess/(Deficiency) $5,511,837 $4,972,613 $4,287,890 $3,551,365 $2,781,067 $1,988,762
Ten Year Models
Ten-Year Financial Models
Police Tax Increment .25 - Table 4
114
2021 Actual 2022 Actual 2023 Revised 2024 Forecast 2025 Forecast 2026 Forecast REVENUES Taxes $7,118,595 $7,950,192 $7,893,554 $7,995,309 $8,183,440 $8,371,644 Miscellaneous (52,372) (438,447) 170,000 173,000 175,000 175,000 Total Revenues $7,066,223 $7,511,745 $8,063,554 $8,168,309 $8,358,440 $8,546,644 EXPENDITURES Personnel $4,984,680 $4,909,078 $5,078,601 $6,279,198 $6,566,749 $6,887,839 Services & Charges 158,025 281,084 292,498 322,644 339,038 $356,393 Supplies & Expenses 614,629 846,608 779,050 793,898 824,009 855,933 Contract & Leases 186,644 144,881 153,248 157,846 162,581 167,459 Capital Maintenance 2,746 - 6,112 6,296 6,484 6,679 Capital Outlay - - 857 883 909 936 Transfers 135,637 139,235 2,502,942 708,655 514,540 220,601 Total Expenditures $6,082,361 $6,320,886 $8,813,308 $8,269,420 $8,414,310 $8,495,840 Fund Balance, Beginning $7,642,085 $8,625,947 $9,816,806 $9,067,052 $8,965,942 $8,910,071 Fund Balance, Ending $8,625,947 $9,816,806 $9,067,052 $8,965,942 $8,910,071 $8,960,876 Fund Balance Goal (11% of Expenditures) $669,060 $695,297 $969,464 $909,636 $925,574 $934,542 Excess/(Deficiency) $7,956,887 $9,121,509 $8,097,588 $8,056,305 $7,984,497 $8,026,334
Ten-Year Financial Models
Police Tax Increment .25 - Table 4
115
2027 Forecast 2028 Forecast 2029 Forecast 2030 Forecast 2031 Forecast 2032 Forecast REVENUES Taxes $8,569,602 $8,732,177 $8,837,179 $9,054,888 $9,316,004 $9,584,757 Miscellaneous 145,000 120,000 100,000 80,000 60,000 40,000 Total Revenues $8,714,602 $8,852,177 $8,937,179 $9,134,888 $9,376,004 $9,624,757 EXPENDITURES Personnel $7,216,503 $7,472,951 $7,659,721 $7,850,820 $8,043,752 $8,241,976 Services & Charges 367,085 $378,097 389,440 $401,123 413,157 $425,552 Supplies & Expenses 881,048 897,346 930,776 954,767 979,511 1,005,039 Contract & Leases 172,482 177,657 182,987 188,476 194,130 199,954 Capital Maintenance 6,879 7,086 7,298 7,517 7,743 7,975 Capital Outlay 965 993 1,023 1,054 1,086 1,118 Transfers 226,844 233,274 239,898 246,719 253,746 260,983 Total Expenditures $8,871,805 $9,167,405 $9,411,143 $9,650,477 $9,893,125 $10,142,597 Fund Balance, Beginning $8,960,876 $8,803,673 $8,488,445 $8,014,481 $7,498,892 $6,981,772 Fund Balance, Ending $8,803,673 $8,488,445 $8,014,481 $7,498,892 $6,981,772 $6,463,931 Fund Balance Goal (11% of Expenditures) $975,899 $1,008,415 $1,035,226 $1,061,552 $1,088,244 $1,115,686 Excess/(Deficiency) $7,827,774 $7,480,031 $6,979,255 $6,437,340 $5,893,528 $5,348,245
Ten Year Models
Ten Year Models
Ten-Year Financial Models
Water Fund - Table 5
116
2021 Actual 2022 Actual 2023 Revised 2024 Forecast 2025 Forecast 2026 Forecast REVENUES Licenses, Permits and Fees $6,404,702 $14,037,453 $10,618,026 $11,040,287 $11,479,364 $11,935,928 Charges for Services 25,386,702 29,052,453 31,370,655 35,573,963 39,559,965 43,824,534 Miscellaneous 198,021 4,021,845 1,039,170 1,199,952 1,221,151 1,257,774 Revenue Transfer 493,104 482,012 487,515 502,140 517,205 532,721 Other Financing Sources (408,482) 43,096,171 - 50,000,000 - 50,000,000 Total Revenues $32,074,047 $90,689,934 $43,515,366 $98,316,342 $52,777,685 $107,550,957 EXPENDITURES Personnel $7,610,829 $8,324,048 $9,567,903 $10,048,280 $10,372,256 $10,761,881 Services & Charges 9,740,347 10,631,054 11,928,280 12,598,492 12,148,501 12,527,906 Supplies & Expenses 1,392,341 1,437,093 1,914,033 2,175,666 2,257,838 2,353,520 Contract & Leases 2,537,134 913,059 1,223,092 1,352,998 1,354,963 1,395,612 Debt Service - 484,378 2,723,396 2,874,550 6,375,050 6,378,550 Inventory - (1,250) - - -Capital Maintenance 1,615,567 1,225,415 12,430,275 10,422,434 10,205,257 10,443,915 Capital Outlay 14,923,101 33,332,913 83,455,106 58,858,913 48,409,160 39,068,822 Transfers 2,994,334 3,206,165 2,620,571 2,699,188 2,780,164 2,863,569 Other 647 361 6,560 6,757 6,959 7,168 Total Expenditures $40,814,302 $59,553,237 $125,869,216 $101,037,278 $93,910,148 $85,800,943 Working Capital, Beginning $108,708,233 $99,967,978 $131,104,675 $48,750,825 $46,029,889 $4,897,426 Working Capital, Ending $99,967,978 $131,104,675 $48,750,825 $46,029,889 $4,897,426 $26,647,440 Working Capital Goal (25%) $6,472,800 $6,555,081 $10,603,528 $10,544,591 $11,375,247 $11,683,030 Excess/(Deficiency) $93,495,177 $124,549,594 $38,147,297 $35,485,298 $(6,477,821) $14,964,410
Ten Year Models
Ten-Year Financial Models
Water Fund - Table 5
117
2027 Forecast 2028 Forecast 2029 Forecast 2030 Forecast 2031 Forecast 2032 Forecast REVENUES Licenses, Permits and Fees $12,410,677 $12,904,335 $13,417,657 $13,951,425 $14,506,456 $15,083,598 Charges for Services 48,450,501 53,445,346 58,845,949 64,692,874 71,030,742 77,908,639 Miscellaneous 1,264,830 1,251,326 1,191,273 1,199,678 1,218,552 1,237,903 Revenue Transfer 548,703 565,163 582,116 599,580 617,567 636,092 Other Financing Sources - - - - -Total Revenues $62,674,711 $68,166,170 $74,036,995 $80,443,557 $87,373,317 $94,866,232 EXPENDITURES Personnel $11,155,668 $11,550,224 $11,948,423 $12,322,383 $12,666,086 $12,999,087 Services & Charges 12,898,140 13,279,387 13,671,975 14,076,245 14,492,577 14,921,317 Supplies & Expenses 2,421,726 2,494,484 2,556,276 2,619,008 2,683,551 2,750,551 Contract & Leases 1,437,480 1,480,604 1,525,023 1,570,773 1,617,896 1,666,433 Debt Service 9,874,800 9,874,050 9,876,050 9,875,550 9,877,550 9,876,800 Inventory - - - - -Capital Maintenance 11,846,766 11,877,169 11,908,484 11,940,739 11,973,961 12,008,180 Capital Outlay 16,418,962 12,039,591 41,960,722 13,982,367 14,010,756 46,389,998 Transfers 2,949,476 3,037,960 3,129,099 3,222,972 3,319,661 3,419,251 Other 7,383 7,605 7,833 8,068 8,310 8,559 Total Expenditures $69,010,401 $65,641,074 $96,583,885 $69,618,105 $70,650,348 $104,040,176 Working Capital, Beginning $26,647,440 $20,311,750 $22,836,846 $289,956 $11,115,408 $27,838,377 Working Capital, Ending $20,311,750 $22,836,846 $289,956 $11,115,408 $27,838,377 $18,664,433 Working Capital Goal (25%) $13,147,860 $13,400,371 $13,655,791 $13,908,935 $14,159,898 $14,412,545 Excess/(Deficiency) $7,163,890 $9,436,475 $(13,365,835) $(2,793,527) $13,678,479 $4,251,888
Ten Year Models
Ten-Year Financial Models
Wastewater Fund - Table 6
118
2021 Actual 2022 Actual 2023 Revised 2024 Forecast 2025 Forecast 2026 Forecast REVENUES Licenses, Permits and Fees $1,694,087 $2,994,475 $3,033,153 $3,154,279 $3,280,370 $3,411,441 Charges for Services 13,378,439 14,017,543 15,647,895 17,735,880 19,717,311 21,848,725 Miscellaneous 3,048,232 1,027,575 871,200 839,200 805,200 821,200 Other Financing Sources - 46,611,802 - - 25,000,000Revenue Transfer (381,078) - - - -Total Revenues $17,739,680 $64,651,396 $19,552,248 $21,729,359 $48,802,881 $26,081,366 EXPENDITURES Personnel $1,647,051 $1,943,261 $2,695,869 $2,951,387 $3,051,873 $3,177,276 Services & Charges 172,862 179,414 662,581 738,345 764,284 791,266 Supplies & Expenses 506,474 498,503 591,166 665,640 689,790 717,480 Contract & Leases 8,345,788 10,024,150 10,293,076 11,064,368 11,388,574 11,700,258 Debt Service 405,267 2,741,277 2,893,956 2,894,706 4,643,456 Capital Maintenance 1,101,295 1,262,631 3,519,849 1,043,387 988,828 1,036,343 Capital Outlay 662,858 386,606 18,306,369 35,719,274 17,064,572 13,926,910 Transfers 823,445 942,134 869,488 895,572 922,440 950,113 Other 1,800 - - - -Total Expenditures $13,261,573 $15,641,966 $39,679,675 $55,971,929 $37,765,067 $36,943,102 Working Capital, Beginning $2,061,543 $6,539,650 $55,549,080 $35,421,653 $1,179,083 $12,216,897 Working Capital, Ending $6,539,650 $55,549,080 $35,421,653 $1,179,083 $12,216,897 $1,355,161 Working Capital Goal (25% of Expenditures) $3,315,393 $3,910,492 $9,919,919 $13,992,982 $9,441,267 $9,235,776 Excess/(Deficiency) $3,224,257 $51,638,588 $25,501,734 $(12,813,900) $2,775,630 $(7,880,615)
Ten Year Models
Ten-Year Financial Models
Wastewater Fund - Table 6
119
2027 Forecast 2028 Forecast 2029 Forecast 2030 Forecast 2031 Forecast 2032 Forecast REVENUES Licenses, Permits and Fees $3,547,847 $3,689,704 $3,837,032 $3,990,528 $4,149,968 $4,315,955 Charges for Services 24,145,092 26,622,882 29,300,205 32,196,990 35,335,150 38,738,794 Miscellaneous 898,201 937,718 263,200 253,200 253,200 253,200 Other Financing Sources - - - -Revenue Transfer - - - - -Total Revenues $28,591,140 $31,250,304 $33,400,437 $36,440,718 $39,738,318 $43,307,949 EXPENDITURES Personnel $3,303,034 $3,430,035 $3,556,330 $3,672,870 $3,777,270 $3,879,883 Services & Charges 815,004 839,454 864,638 890,577 917,295 944,813 Supplies & Expenses 737,708 759,699 778,191 796,787 815,831 835,773 Contract & Leases 12,021,293 12,351,959 12,692,545 13,043,348 13,404,676 13,776,843 Debt Service 4,645,206 4,644,706 4,641,956 4,641,956 4,644,456 4,644,206 Capital Maintenance 1,086,933 1,139,601 1,194,349 1,252,180 1,313,095 1,377,098 Capital Outlay 5,531,954 3,673,372 11,166,834 11,168,339 15,169,889 7,171,485 Transfers 978,616 1,007,975 1,038,214 1,069,360 1,101,441 1,134,484 Other - - - - -Total Expenditures $29,119,748 $27,846,801 $35,933,057 $36,535,417 $41,143,953 $33,764,585 Working Capital, Beginning $1,355,161 $826,553 $4,230,056 $1,697,436 $1,602,737 $197,102 Working Capital, Ending $826,553 $4,230,056 $1,697,436 $1,602,737 $197,102 $9,740,466 Working Capital Goal (25% of Expenditures) $7,279,937 $6,961,700 $8,983,264 $9,133,854 $10,285,988 $8,441,146 Excess/(Deficiency) $(6,453,384) $(2,731,645) $(7,285,829) $(7,531,118) $(10,088,887) $1,299,319
Ten Year Models
Ten-Year Financial Models
Golf Course - Table 7
120
2021 Actual 2022 Actual 2023 Revised 2024 Forecast 2025 Forecast 2026 Forecast REVENUES Charges for Services $6,485,912 $7,459,021 $7,416,036 $7,869,786 $8,105,880 $8,349,056 Miscellaneous 698 (100,236) 2,253 2,388 2,460 2,534 Revenue Transfer 892,298 348,704 282,570 291,098 299,884 300,181 Total Revenues $7,378,909 $7,707,489 $7,700,859 $8,163,272 $8,408,224 $8,651,771 EXPENDITURES Personnel $3,767,897 $3,924,411 $4,247,229 $4,387,546 $4,522,205 $4,679,009 Services & Charges 622,536 695,911 644,468 683,657 707,600 732,580 Supplies & Expenses 850,898 930,730 917,090 1,069,591 1,099,926 1,132,444 Contract & Leases 191,656 25,415 247,171 259,061 266,833 274,838 Debt Service 163,200 213,049 163,200 163,200 163,200 163,200 Inventory 826,500 978,693 876,103 918,244 945,791 974,165 Capital Maintenance 53,991 53,019 58,564 60,921 62,749 64,631 Capital Outlay 40,504 - 110,000 30,000 30,000 30,000 Transfers 2,698 431,561 431,998 437,878 443,160 447,843 Miscellaneous 116,798 69,271 100 100 100 100 Total Expenditures $6,636,679 $7,322,059 $7,695,923 $8,010,198 $8,241,564 $8,498,810 Working Capital, Beginning $(705,265) $36,964 $422,394 $427,330 $580,404 $747,064 Working Capital, Ending $36,964 $422,394 $427,330 $580,404 $747,064 $900,025 Working Capital Goal (11% of Expenditures) $707,330 $740,003 $768,980 $811,703 $836,572 $864,354 Excess/(Deficiency) $(670,366) $(317,609) $(341,649) $(231,299) $(89,508) $35,671
Ten Year Models
Ten-Year Financial Models
Golf Course - Table 7
121
2027 Forecast 2028 Forecast 2029 Forecast 2030 Forecast 2031 Forecast 2032 Forecast REVENUES Charges for Services $8,462,457 $8,719,233 $8,982,333 $9,254,971 $9,535,393 $9,824,357 Miscellaneous 3,064 3,314 3,526 3,798 4,066 4,345 Revenue Transfer 300,488 300,803 301,129 301,464 301,809 302,164 Total Revenues $8,766,009 $9,023,350 $9,286,988 $9,560,233 $9,841,268 $10,130,866 EXPENDITURES Personnel $4,841,466 $4,991,613 $5,142,558 $5,286,944 $5,435,107 $5,582,655 Services & Charges 749,065 768,528 788,527 809,080 830,201 851,908 Supplies & Expenses 1,138,362 1,173,967 1,210,716 1,248,710 1,287,068 1,327,179 Contract & Leases 207,888 208,874 209,891 210,937 212,015 213,126 Debt Service 163,200 163,200 163,200 163,200 163,200 165,729 Inventory 968,331 992,537 1,017,397 1,042,929 1,069,152 1,096,086 Capital Maintenance 65,915 67,893 69,930 72,027 74,188 76,414 Capital Outlay 30,000 30,000 30,000 30,000 -Transfers 451,120 456,414 459,830 465,264 470,219 474,697 Miscellaneous 100 100 100 100 100 100 Total Expenditures $8,615,447 $8,853,126 $9,092,149 $9,329,191 $9,541,250 $9,787,894 Working Capital, Beginning $900,025 $1,050,587 $1,220,811 $1,415,650 $1,646,692 $1,946,710 Working Capital, Ending $1,050,587 $1,220,811 $1,415,650 $1,646,692 $1,946,710 $2,289,682 Working Capital Goal (11% of Expenditures) $876,824 $902,386 $928,303 $953,780 $979,861 $1,006,500 Excess/(Deficiency) $173,763 $318,425 $487,347 $692,912 $966,849 $1,283,183
Ten Year Models
Ten-Year Financial Models
Stormwater Utility - Table 8
122
2021 Actual 2022 Actual 2023 Revised 2024 Forecast 2025 Forecast 2026 Forecast REVENUES Licenses, Permits and Fees $2,709,580 $1,128,915 $- $- $- $Charges for Services 3,874,417 3,913,691 4,014,289 4,215,003 4,425,753 4,647,041 Miscellaneous 173,692 (361,364) 104,345 106,432 108,561 110,732 Other Finance Sources - - 5,000,000Revenue Transfer - - - - -Total Revenues $6,757,690 $4,681,242 $4,118,634 $4,321,435 $9,534,314 $4,757,773 EXPENDITURES Personnel $778,590 $867,873 $1,231,201 $1,490,324 $1,548,285 $1,619,751 Services & Charges 138,923 73,696 974,635 913,930 989,643 1,073,820 Supplies & Expenses 74,056 118,765 173,476 211,595 217,960 224,881 Contract & Leases 105,803 215,976 466,562 530,375 546,287 562,675 Debt Service - - - 350,000 Capital Outlay 648,192 4,144,887 5,002,554 2,043,810 2,412,000 2,682,000 Transfers 1,512,452 1,706,790 1,552,119 1,571,256 729,774 751,668 Other 493 - - - -Total Expenditures $3,258,508 $7,127,987 $9,400,547 $6,761,290 $6,443,949 $7,264,795 Working Capital, Beginning $7,352,232 $10,851,413 $8,404,668 $3,122,755 $682,900 $3,773,265 Working Capital, Ending $10,851,413 $8,404,668 $3,122,755 $682,900 $3,773,265 $1,266,243 Working Capital Goal (25%) $652,579 $745,775 $1,099,498 $1,179,370 $1,007,987 $1,145,699 Excess/(Deficiency) $10,198,834 $7,658,893 $2,023,257 $(496,470) $2,765,278 $120,545
Ten Year Models
Ten-Year Financial Models
Stormwater Utility - Table 8
123
2027 Forecast 2028 Forecast 2029 Forecast 2030 Forecast 2031 Forecast 2032 Forecast REVENUES Licenses, Permits and Fees $- $- $- $- $- $Charges for Services 4,879,393 5,123,362 5,379,531 5,648,507 5,930,932 6,227,479 Miscellaneous 112,946 115,205 117,509 119,860 122,257 124,702 Other Finance Sources - - - - -Revenue Transfer - - - - -Total Revenues $4,992,339 $5,238,567 $5,497,040 $5,768,367 $6,053,189 $6,352,181 EXPENDITURES Personnel $1,691,136 $1,763,640 $1,834,838 $1,898,276 $1,953,939 $2,007,994 Services & Charges 1,165,674 1,265,854 1,377,370 1,500,231 1,600,804 1,749,318 Supplies & Expenses 231,361 238,278 244,695 251,208 257,890 264,846 Contract & Leases 579,555 596,942 614,850 633,296 652,295 671,864 Debt Service 350,000 350,000 350,000 350,000 350,000 350,000 Capital Outlay 741,000 428,000 83,000 87,000 91,000 96,000 Transfers 774,218 797,444 821,368 846,009 871,389 897,531 Other - - - - -Total Expenditures $5,532,944 $5,440,158 $5,326,121 $5,566,020 $5,777,317 $6,037,553 Working Capital, Beginning $1,266,243 $725,638 $524,047 $694,966 $897,313 $1,173,185 Working Capital, Ending $725,638 $524,047 $694,966 $897,313 $1,173,185 $1,487,813 Working Capital Goal (25%) $1,197,986 $1,253,040 $1,310,780 $1,369,755 $1,421,579 $1,485,388 Excess/(Deficiency) $(472,348) $(728,992) $(615,814) $(472,442) $(248,394) $2,425
Ten Year Models
Ten-Year Financial Models
Solid Waste - Table 9
124
2021 Actual 2022 Actual 2023 Revised 2024 Forecast 2025 Forecast 2026 Forecast REVENUES Intergovernmental 735,128 54,093 - - -Charges for Services 2,050,955 4,282,548 4,185,030 4,331,506 4,504,766 4,707,481 Miscellaneous 778 (21,463) 263,987 273,227 282,790 292,687 Other Financing Sources 2,000,000 - - - -Total Revenues $4,786,861 $4,315,178 $4,449,017 $4,604,733 $4,787,556 $5,000,168 EXPENDITURES Personnel $97,616 $196,367 $144,552 $154,115 $160,205 $167,620 Services & Charges 5,760 5,940 11,259 15,049 15,890 16,783 Supplies & Expenses 1,931,397 200,073 201,244 208,885 215,151 221,606 Contracts & Leases 1,649,873 3,622,114 3,635,750 3,763,001 3,894,706 4,031,021 Debt Service 276,667 490,000 490,000 490,000 376,493Capital Outlay - - - - -Transfers 98,657 101,185 103,744 106,857 110,062 113,364 Total Expenditures $4,059,970 $4,615,679 $4,586,549 $4,737,907 $4,772,507 $4,550,394 Working Capital, Beginning $- $726,891 $426,390 $288,858 $155,684 $170,733 Working Capital, Ending $726,891 $426,390 $288,858 $155,684 $170,733 $620,507 Working Capital Goal (25% of Expenditures) $1,014,992 $1,153,920 $1,146,637 $1,184,477 $1,193,127 $1,137,599 Excess/(Deficiency) $(288,101) $(727,530) $(857,779) $(1,028,793) $(1,022,394) $(517,091)
Ten Year Models
Ten-Year Financial Models Solid Waste - Table 9
125
2027 Forecast 2028 Forecast 2029 Forecast 2030 Forecast 2031 Forecast 2032 Forecast REVENUES Intergovernmental - - - - -Charges for Services 4,895,780 5,116,090 5,320,734 5,533,563 5,754,906 5,985,102 Miscellaneous 302,931 313,534 324,508 335,865 347,621 359,787 Other Financing Sources - - - - -Total Revenues $5,198,711 $5,429,624 $5,645,242 $5,869,428 $6,102,527 $6,344,889 EXPENDITURES Personnel $174,568 $181,568 $188,519 $193,805 $197,824 $201,954 Services & Charges 17,287 17,806 18,340 18,890 19,457 20,040 Supplies & Expenses 228,254 235,102 242,155 249,419 256,902 264,609 Contracts & Leases 4,172,107 4,318,131 4,469,265 4,625,689 4,787,589 4,955,154 Debt Service - - - - -Capital Outlay - - - - 3,000,000Transfers 116,765 120,268 123,876 127,592 131,420 135,363 Total Expenditures $4,708,981 $4,872,875 $5,042,155 $5,215,395 $8,393,192 $5,577,120 Working Capital, Beginning $620,507 $1,110,237 $1,666,986 $2,270,073 $2,924,106 $633,441 Working Capital, Ending $1,110,237 $1,666,986 $2,270,073 $2,924,106 $633,441 $1,401,210 Working Capital Goal (25% of Expenditures) $1,177,245 $1,218,219 $1,260,539 $1,303,849 $2,098,298 $1,394,280 Excess/(Deficiency) $(67,008) $448,767 $1,009,534 $1,620,257 $(1,464,857) $6,930
Ten Year Models
Ten-Year Financial Models Insurance Services - Table 10
126
2021 Actual 2022 Actual 2023 Revised 2024 Forecast 2025 Forecast 2026 Forecast REVENUES Intergovernmental $2,203,511 $2,518,423 $3,469,066 $3,755,068 $4,017,923 $4,299,176 Miscellaneous 28,085 (170,087) 66,000 75,000 80,000 80,000 Revenue Transfer - - - - -Total Revenue $2,231,596 $2,348,336 $3,535,066 $3,830,068 $4,097,923 $4,379,176 EXPENDITURES Personnel $317,874 $386,933 $480,502 $506,559 $526,635 $551,995 Services & Charges 2,676,927 3,014,590 2,591,005 2,631,372 2,809,715 2,947,162 Supplies & Expenses 273,392 288,675 280,380 296,783 311,119 321,906 Contract & Leases 77,308 164,749 110,293 113,602 117,010 120,520 Capital Outlay - - - - -Transfers - - - - -Total Expenditures $3,345,499 $3,854,947 $3,462,180 $3,548,316 $3,764,479 $3,941,583 Fund Balance, Beginning $3,829,661 $2,715,758 $1,209,148 $1,282,034 $1,563,786 $1,897,230 Fund Balance, Ending $2,715,758 $1,209,148 $1,282,034 $1,563,786 $1,897,230 $2,334,823
Ten Year Models
Ten-Year Financial Models Insurance Services - Table 10
127
2027 Forecast 2028 Forecast 2029 Forecast 2030 Forecast 2031 Forecast 2032 Forecast REVENUES Intergovernmental $4,428,151 $4,561,995 $4,697,828 $4,838,760 $4,983,925 $5,133,440 Miscellaneous 80,000 80,000 80,000 80,000 80,000 80,000 Revenue Transfer - - - - -Total Revenue $4,508,151 $4,641,995 $4,777,828 $4,918,760 $5,063,925 $5,213,440 EXPENDITURES Personnel $577,307 $602,689 $625,900 $648,227 $666,502 $682,093 Services & Charges 3,091,363 3,242,680 3,401,465 3,568,088 3,742,939 3,926,426 Supplies & Expenses 333,074 344,638 356,611 369,009 381,848 395,142 Contract & Leases 124,136 127,860 131,696 135,646 139,716 143,907 Capital Outlay - - - - -Carryover - - - - -Transfers $4,125,880 $4,317,867 $4,515,672 $4,720,970 $4,931,005 $5,147,568 Total Expenditures $4,020,081 $4,200,384 $4,385,468 $4,574,799 $4,769,161 $4,969,543 Fund Balance, Beginning $2,334,823 $2,717,094 $3,041,222 $3,303,378 $3,501,168 $3,634,088 Fund Balance, Ending $2,717,094 $3,041,222 $3,303,378 $3,501,168 $3,634,088 $3,699,960
Ten Year Models
Ten-Year Financial Models
Computers - Table 11
128
2021 Actual 2022 Actual 2023 Revised 2024 Forecast 2025 Forecast 2026 Forecast REVENUES Intergovernmental $2,749,843 $5,236,473 $4,620,602 $5,286,636 $5,394,392 $5,505,769 Charges for Services 35,568 33,590 28,000 - -Miscellaneous (18,771) (168,243) 210,000 211,000 212,000 213,000 Revenue Transfer 241,000 3,000,000 300,000 800,000 300,000 300,000 Total Revenue $3,007,640 $8,101,820 $5,158,602 $6,297,636 $5,906,392 $6,018,769 EXPENDITURES Personnel $64,063 $88,557 $98,971 $101,447 $104,146 $106,762 Services & Charges 742 34,860 731 1,004 1,074 1,149 Supplies & Expenses 2,245,469 2,585,169 9,507,455 6,925,690 7,160,015 5,435,067 Contracts & Leases 10,394 85,000 73,000 - -Capital Maintenance 18,048 24,609 - - -Capital Outlay 121,817 149,115Transfers - - 3,000,000 - -Total Expenditures $2,460,533 $2,967,310 $12,680,157 $7,028,141 $7,265,235 $5,542,978 Fund Balance, Beginning $7,718,385 $8,265,492 $13,400,001 $5,878,446 $5,147,941 $3,789,098 Fund Balance, Ending $8,265,492 $13,400,001 $5,878,446 $5,147,941 $3,789,098 $4,264,889
Ten Year Models
Ten-Year Financial Models
Computers - Table 11
129
2027 Forecast 2028 Forecast 2029 Forecast 2030 Forecast 2031 Forecast 2032 Forecast REVENUES Intergovernmental $5,637,180 $5,753,309 $5,871,096 $5,992,135 $6,116,549 $6,242,888 Charges for Services - - - - -Miscellaneous 214,000 215,000 216,000 217,000 218,000 219,053 Revenue Transfer 300,000 300,000 300,000 300,000 300,000 300,000 Total Revenue $6,151,180 $6,268,309 $6,387,096 $6,509,135 $6,634,549 $6,761,941 EXPENDITURES Personnel $109,199 $110,283 $110,732 $111,204 $111,700 $112,220 Services & Charges 1,184 1,219 1,256 1,293 1,332 1,372 Supplies & Expenses 6,446,077 8,008,671 7,019,916 6,202,725 6,086,807 7,619,211 Contracts & Leases - - - - -Capital Maintenance - - - - -Capital Outlay Transfers - - - - -Total Expenditures $6,556,460 $8,120,173 $7,131,904 $6,315,222 $6,199,839 $7,732,803 Fund Balance, Beginning $4,264,889 $3,859,609 $2,007,745 $1,262,937 $1,456,850 $1,891,560 Fund Balance, Ending $3,859,609 $2,007,745 $1,262,937 $1,456,850 $1,891,560 $920,698
Ten Year Models
Ten-Year Financial Models Vehicles - Table 12
130
2021 Actual 2022 Actual 2023 Revised 2024 Forecast 2025 Forecast 2026 Forecast REVENUES Intergovernmental $5,591,370 $5,347,092 $6,572,340 $7,629,278 $8,171,900 $8,501,828 Miscellaneous 162,540 (133,910) 71,000 74,000 80,000 86,000 Other 1,222,294 2,010,619 275,000 75,000 75,000 75,000 Total Revenue $6,976,204 $7,223,801 $6,918,340 $7,778,278 $8,326,900 $8,662,828 EXPENDITURES Personnel $1,890,032 $1,931,241 $1,928,040 $2,011,709 $2,065,220 $2,132,785 Services & Charges 125,141 89,329 121,931 161,382 169,045 177,134 Supplies & Expenses 446,048 499,452 354,603 449,719 401,252 415,539 Contract & Leases 40,128 33,904 44,290 145,619 149,987 154,487 Debt Service 8,550 Inventory (40,672) (10,871) - - -Capital Maintenance 931,260 928,570 686,173 706,758 727,960 749,799 Capital Outlay 4,024,344 2,775,246 3,587,446 3,555,900 2,830,748 4,835,455 Transfers 89,331 92,010 94,771 97,615 100,543 103,559 Total Expenditures $7,505,613 $6,347,430 $6,817,254 $7,128,700 $6,444,756 $8,568,758 Fund Balance, Beginning $6,651,346 $6,121,937 $6,998,308 $7,099,394 $7,748,972 $9,631,116 Fund Balance, Ending $6,121,937 $6,998,308 $7,099,394 $7,748,972 $9,631,116 $9,725,185
Ten Year Models
Ten-Year Financial Models Vehicles - Table 12
131
2027 Forecast 2028 Forecast 2029 Forecast 2030 Forecast 2031 Forecast 2032 Forecast REVENUES Intergovernmental $8,898,745 $8,502,599 $8,646,917 $8,775,979 $8,912,294 $9,055,491 Miscellaneous 92,000 98,000 104,419 111,285 118,630 126,488 Other 75,000 75,000 75,000 75,000 75,000 75,000 Total Revenue $9,065,745 $8,675,599 $8,826,336 $8,962,264 $9,105,924 $9,256,979 EXPENDITURES Personnel $2,253,430 $2,320,428 $2,385,396 $2,442,961 $2,503,280 $2,565,422 Services & Charges 182,449 187,921 193,559 199,366 205,347 211,508 Supplies & Expenses 427,839 440,639 452,798 465,278 478,142 491,405 Contract & Leases 159,122 173,895 168,812 173,876 179,092 184,465 Debt Service Inventory - - - - -Capital Maintenance 772,293 795,462 819,326 843,906 869,223 895,299 Capital Outlay 1,587,804 1,437,960 5,484,709 2,647,570 3,616,056 4,236,613 Transfers 106,666 109,866 113,162 116,557 120,054 123,655 Total Expenditures $5,489,603 $5,466,171 $9,617,762 $6,889,513 $7,971,193 $8,708,368 Fund Balance, Beginning $9,725,185 $13,301,327 $16,510,755 $15,719,329 $17,792,080 $18,926,811 Fund Balance, Ending $13,301,327 $16,510,755 $15,719,329 $17,792,080 $18,926,811 $19,475,422
Ten Year Models
Ten-Year Financial Models
Buildings - Table 13
132
2021 Actual 2022 Actual 2023 Revised 2024 Forecast 2025 Forecast 2026 Forecast REVENUES Intergovernmental $401,385 $792,714 $828,666 $853,526 $879,132 $905,507 Charges for Services 80,893 71,796 83,598 85,023 86,499 88,026 Miscellaneous 185 (6,915) 25,000 30,000 35,000 40,000 Revenue Transfer 160,289 174,767 168,530 172,862 177,341 181,973 Total Revenue $642,752 $1,032,362 $1,105,794 $1,141,411 $1,177,972 $1,215,506 EXPENDITURES Personnel $66,762 $68,438 $71,608 $75,354 $77,824 $79,689 Services and Charges 2,484 3,019 4,810 4,572 4,892 5,235 Supplies and Expenses 3,110 5,209 4,649 5,518 5,683 5,854 Capital Maintenance 301,812 547,459 720,104 390,618 541,316 97,695 Transfers - - - - -Capital Outlay 244,404 - - - -Total Expenditures $618,572 $624,125 $801,171 $476,062 $629,715 $188,473 Fund Balance, Beginning $(83,930) $(59,750) $348,487 $653,110 $1,318,459 $1,866,716 Fund Balance, Ending $(59,750) $348,487 $653,110 $1,318,459 $1,866,716 $2,893,749
Ten Year Models
Ten-Year Financial Models
Buildings - Table 13
133
2027 Forecast 2028 Forecast 2029 Forecast 2030 Forecast 2031 Forecast 2032 Forecast REVENUES Intergovernmental $932,672 $960,653 $989,472 $1,019,157 $1,049,648 $1,081,010 Charges for Services 89,608 91,245 92,941 94,695 96,457 98,252 Miscellaneous 40,000 40,000 40,000 40,000 40,000 40,000 Revenue Transfer 186,761 191,712 196,831 202,123 207,520 213,061 Total Revenue $1,249,041 $1,283,610 $1,319,244 $1,355,975 $1,393,625 $1,432,323 EXPENDITURES Personnel $81,572 $83,511 $85,502 $87,546 $89,644 $91,811 Services and Charges 5,392 5,554 5,720 5,892 6,069 6,251 Supplies and Expenses 6,029 6,210 6,396 6,588 6,786 6,990 Capital Maintenance 431,731 619,967 395,933 628,665 400,000 650,000 Transfers - - - - -Capital Outlay - - - - -Total Expenditures $524,724 $715,242 $493,551 $728,691 $502,499 $755,052 Fund Balance, Beginning $2,893,749 $3,618,066 $4,186,434 $5,012,127 $5,639,411 $6,530,537 Fund Balance, Ending $3,618,066 $4,186,434 $5,012,127 $5,639,411 $6,530,537 $7,207,808
2023-2024 Proposed Revised Biennial Operating and Capital Budget
Intentionally left blank
134
Community and Economic Development Work System Summary
Arvada’s future prosperity and quality of life will be significantly influenced by the City’s ability to ensure that development meets safety requirements, design values and standards, infrastructure needs, and supports the local economy to implement the community’s vision.
PRINCIPLES AND SERVICES:
To support community and economic development, the City of Arvada:
• Uses the Comprehensive Plan to guide planning, land use code decisions, development management, and informational and resource services that are delivered to residents, businesses, the development community, decision-making bodies, and neighborhood partners to achieve a well-planned, aligned, sustainable, and livable community for current and future generations
• Ensures the alignment of all City Master Plans providing an aligned and integrated approach to the achievement of strategic and operational targets .
• Applies a high-performing development review process that maintains the community’s standards for safety, vision, and quality design which ensures a quality and timely review for the developer .
• Supports the community’s vision by cultivating an environment that attracts and retains private-sector investment, a talented workforce, and an engaged business community
• Maintains and protects the health, safety, and welfare of the public by ensuring safe buildings in the community, while providing excellent customer service .
135
Click here for more information about Arvada Economic Development
Community and Economic Development Work System Summary
Budget Summary
Note: In 2023 The Arvada Housing Authority and Community Development programs are moved to the Community and Economic Development Worksystem
Revenue Highlights
• Licenses, Permits and Fees include charges for building permits, plan inspection fees and other miscellaneous permits
• Intergovernmental revenues include federal grants for the housing and community development programs . The Housing and Community Development programs became part of the Community and Economic Development work system in 2023 Previously these programs were part of Vibrant Communities and Neighborhoods
• Charges for Services include plan review fees including building, zoning and engineering .
• The annual budgeted revenue is built upon a base level of service . This guarantees that on-going expenditures are not funded by growth
136
REVENUES BY TYPE 2021 Actual 2022 Actual 2023 Revised 2024 Budget Licenses, Permits and Fees 2,980,145 3,435,874 2,858,178 3,108,253 Intergovernmental - - 6,541,099 6,419,652 Charges for Services 854,053 1,058,485 550,000 550,000 Miscellaneous 23,494 - 207,410 208,610 Revenue Transfer - - 120,000 120,000 Total Revenues $3,857,693 $4,494,359 $10,276,687 $10,406,515
Community and Economic Development Work System Summary
Note: In 2023 The Arvada Housing Authority and Community Development programs are moved to the Community and Economic Development Worksystem
Expenditure Highlights
• Personnel include salaries and benefits for all of the CED employees. This includes the programs of Economic Development, Building, Development Review, Long Range Planning, Administration and Housing and Community Development
• The largest component of services and charges are the Section 8 Housing voucher program which accounts for $5 .4 million . Another $500,000 is for the Essential Home Repairs program in the Community Development Fund .
• Contracts and Leases include the outside building inspection contract, the retail consulting contract and professional services related to the development of the Land Development Code
Challenges Advantages
Approaching full buildout with focus shifting to redevelopment and infill
Finding a balance between new development and established neighborhoods
Increasing community concerns around growth and density
Growing concerns around sustainability
Opportunities for community engagement
Interdisciplinary development review process
Focus on infrastructure planning
Dedication to long-range land use
Relationship with the business community
137
EXPENDITURES BY TYPE 2021 Actual 2022 Actual 2023 Revised 2024 Budget Personnel $4,075,729 $2,752,375 $4,927,117 $5,132,202 Services and Charges 385,414 315,557 6,551,284 6,449,905 Supplies and Expenses 307,614 221,383 616,024 664,177 Contracts and Leases 123,143 87,219 312,392 306,212 Capital - - 4,171 4,296 Transfers - - 299,923 306,671 Other - 20 8,042 8,164 Total Expenditures $4,891,899 $3,376,554 $12,718,953 $12,871,627 Employee FTE 39 00 39 00 43 00 41 00
Community and Economic Development Work System Summary
Strategic Result 1
95% of development project approvals conform to the City’s Comprehensive Plan
COMPLETED MILESTONES:
a By 12/2020 complete and implement the updated Land Development Code through adoption and remapping
a By 12/2022 create a sub-area plan for NW Arvada focused on place making
MILESTONES:
• By 12/2025 fully align the Master Plans contained within the City's Comprehensive Plan
As is evidenced by the results, development projects continue to comply with the comprehensive plan
Strategic Result 2
By 12/2022 66% of development customers rate the development review process as ‘good’ and/or ‘excellent’
COMPLETED MILESTONES:
a By 12/2022 implement a development customer service survey with at least a 50% response rate
MILESTONES:
• Annually 90% of development reviews will be returned to the applicant within 15 business days . A 50% response rate
• On an ongoing basis resolve all temporary certificates of occupancy (TCOs) within 6 months of issuance
Incomplete development applications continue to be a challenge . Additional work in this area will be needed if the goal is going to be met in the future. The incomplete files have also lead to an increase in the timing
138
Performance Measures Target 2020 2021 2022 2023 Target 2024 Target Staff recommendations to City Council are adopted by City Council 96% 100% 96% 100% 96% 96% Comprehensive Plan implementation strategies will be initiated, on-going or complete 90% 98% 98% 99% 90% 90%
Performance Measures Target 2020 2021 2022 2023 Target 2024 Target Building permit inspections will be conducted on the day scheduled 98% 99% 99% 99% 98% 98% 1st review of non-over the counter commercial building permits will be within 20 business days 20 19 20 17 20 20 Development review comments will be returned to the applicant within 15 business days 15 15 23 33 15 15 Development review applications will be ap-
within the designated review tracks 90% 51% 44% 36% 90% 90%
proved
Community and Economic Development Work System Summary
Strategic Result 3
By 12/2023 adopt land use options that allow for pocket neighborhoods
COMPLETED MILESTONES:
a By 12/2021 develop a resource plan to ensure appropriate implementation
a By 12/2022 propose new land development code zone districts which can accommodate pocket neighborhoods
Pocket neighborhoods help connect commercial and residential activity at the neighborhood scale . Pocket neighborhoods integrate commercial uses into low intensity uses that can integrate into the surrounding area The concept of pocket neighborhoods is to draw from the local community and not be a regional destination The creating of pocket neighborhoods can serve as a local placemaking and gathering spot to build community
Strategic Result 4
By 12/2025 fully align the City’s economic development efforts with the community’s vision expressed in the Community Survey and Business Survey
COMPLETED MILESTONES:
a By 12/2021 AEDA will be re-accredited by the International Economic Development Council
a By 12/2021 establish a community outreach program that helps the community define its economic development goals
a By 12/2022 develop policies, procedures and standards for all events occurring in Olde Town to ensure safety and quality for the community
MILESTONES:
• By 12/2023 establish a plan to build a hospital in Arvada in collaboration with a regional healthcare provide
• By 12/2025 develop options for the Harvest Festival targeting the alignment of the Harvest Festival Committee and City goals
facilitate relationships with 100% of identified strategic partners
While commercial development has slowed since 2021, it still exceeded the target by over 30,000 square feet
139
Performance Measures Target 2020 2021 2022 2023 Target 2024 Target Annually facilitate the
of 150,000 square feet of new commercial real estate 150,000 225,392 422,912 188,079 150,000 150,000
100% 100% 100% 100% 100% 100%
development
Annually
Community and Economic Development Work System Summary
Strategic Result 5
By 12/2024 implement a tool kit of housing mix and style plans to improve access to quality housing affordable for a broad range of income levels
COMPLETED MILESTONES:
a By 12/2022 create a Housing Advisory Committee to support the City in current/future initiatives while also educating the broader community on issues of affordable housing
a By 12/2020 create a regional strategy to address homelessness
a By 12/2020 complete an affordable housing assessment including incentive options and the area south of the Arvada Cemetery
a By 6/2021 evaluate the Human Services Advisory Committee's process for recommending funding
a By 12/2020 complete a list of current projects under development or planning
MILESTONES:
• By 12/2024 utilize housing committee to create a housing strategy plan and have plan approved by City Council
These performance measures support access to quality housing that is affordable to a broad range of income levels and provides resources, housing and neighborhood assistance services to Arvada residents, businesses, property owners, and stakeholders
Meets or Exceeds Target Just Under Target Does Not Meet Target
Complete
140
a
Performance Measures Target 2020 2021 2022 2023 Target 2024 Target Number of households served by Essential Home Repairs Program N/A 7 8 6 10 10 Annual costs associated with Essential Home Repairs Program 205,585 240,192 332,877 406,661 235,000 235,000 Number of household served by Housing Choice Voucher Program 484 455 449 457 487 487
Infrastructure Work System Summary
The community depends on a well-maintained foundation of streets, sidewalks, and water, wastewater and stormwater facilities. Planned and steady population growth requires proper maintenance of existing infrastructure and additional capacity to support a thriving community.
PRINCIPLES AND SERVICES:
To support infrastructure, the City of Arvada:
• Provides the community with a safe, reliable, high-quality water supply, drainage system, and wastewater disposal services for full city build-out, as defined by the Comprehensive Plan. This includes maintaining utility rates at lowest practical levels with accurate billing that supports replacement of aging infrastructure in order to maintain robust utility systems .
• Offers services focused on safe and environmentally-efficient City facilities and fleet vehicles to ensure the most efficient and maximum usage of valued assets.
• Maintains existing roads and transportation network in tandem with snow and ice control services to ensure swift and safe transportation modes for the community .
• Provides safe and efficient connections to modes of transportation, including transit, streets, sidewalks, and bikeways with a focus on enhanced technology at high-priority intersections improving safety and minimizing traffic congestion.
• Applies cost-effective and timely engineering design, geographic information, effective construction practices, and established standards and specifications to align public infrastructure priorities with community growth and redevelopment needs
• Provides computer-aided drafting, design services, special analysis, GIS applications, and enterprise system integration for the workforce to better visualize spatial relationships for informed decisions, while maintaining and/or replacing infrastructure and accommodating new construction projects .
• Enforces the federal Clean Water Act, Safe Drinking Water Act, and Endangered Species Act through best practices for stormwater runoff protecting water quality in rivers and streams, watershed health, and groundwater as a drinking water resource .
141
Infrastructure Work System Summary
Budget Summary
Revenue Highlights
• Licenses, Permits and Fees include water tap and sewer tap fees, drilling fees, inspection fees, and Waste and Recycling fees The increase in 2023 and 2024 is due to an increase in system development fees to coincide with current market rates in this area System development fees were formally tap fees .
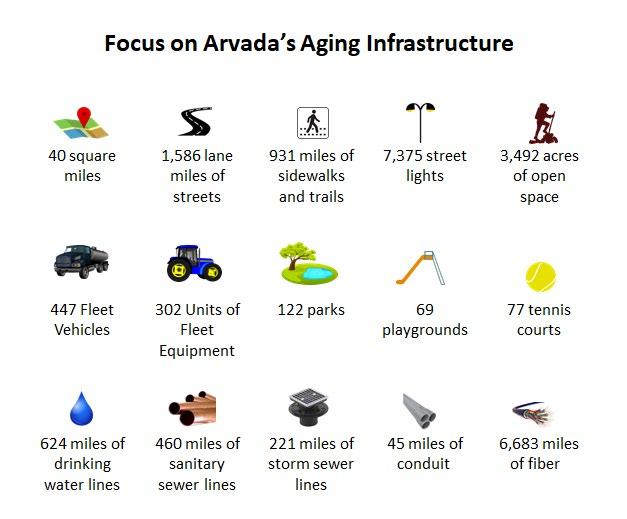
• Charges for services increased in 2022 due to increases in water and wastewater rates and the implementation of the waste hauling and recycling program The increase in 2023 and 2024 are due to water and sewer rate increases of approximately 12% Stormwater rates increase 5% in 2024 .
• Miscellaneous revenues include interest on investments and recovered costs .
• The increase in other financing sources in 2022 is due to the $50,000,000 bond issuances in the Water and Wastewater fund Another Bond issuance for $50,000,000 is planned in 2024 for the Water fund .
142
REVENUES BY TYPE 2021 Actual 2022 Actual 2023 Revised 2024 Budget Licenses, Permits and Fees $11,502,808 $18,843,646 $13,996,179 $14,539,566 Intergovernmental 6,803,883 6,194,899 7,401,006 8,482,804 Charges for Services 44,776,021 51,340,790 55,306,467 61,946,375 Fines and Forfeits 127,941 147,343 -Miscellaneous 4,374,915 4,998,164 2,418,702 2,566,811 Revenue Transfer 11,519,668 15,935,361 12,810,166 13,539,246 Other Financing Sources (483,037) 100,889,645 75,000 50,075,000 Total Revenues $78,622,200 $198,349,849 $92,007,520 $151,149,802
Infrastructure Work System Summary
Expenditure Highlights
• Personnel costs and the position count increased due to new positions in streets maintenance, facilities, engineering and the water and waste water funds
• Utilities and water disposal charges are included in the services and charges category . The annual increase in utilities was mitigated by implementation of the Ameresco Energy program in 2020 which is expected to reduce water, electric, and natural gas expenses .
• The largest components of contracts are payments to Denver Metro Wastewater Reclamation District for wastewater processing, asphalt and concrete work in the Street Maintenance program, and services associated with the Waste Hauling program
• Debt Service increases in 2023 and 2024 are due to the issuance of bonds in the Water and Wastewater Funds .
• Capital Maintenance and Capital Outlay increased in 2022 due to the Gross Reservoir project and in 2023 the bonds that were issued to fund capital projects which are discussed in further detail in the Capital Improvement section
• Transfers include transfers from the Water, Wastewater, and Stormwater utilities to the general fund and transfers from the Stormwater fund for payment of COPs
Challenges
Aging curb, gutter, sidewalks, ADA compliant ramps, streets and utility assets
Funding required for asset maintenance, replacement and serving planned development
Cost and availability of labor and materials
Expanding service area
Advantages
Execution of bond projects
Completion of Master Plans
Progress on long-term water and sewer needs
Comprehensive road condition analysis
Accessibility to public buildings Success of organized waste hauling
143
Transportation infrastructure Climate variability EXPENDITURES BY TYPE 2021 Actual 2022 Actual 2023 Revised 2024 Budget Personnel $21,787,695 $22,752,887 $27,713,541 $29,568,347 Services and Charges 14,787,234 17,446,863 19,630,297 20,858,184 Supplies and Expenses 7,098,610 5,862,964 6,644,088 7,657,520 Contracts and Leases 19,610,713 28,313,749 27,667,016 29,531,734 Debt Service 276,667 1,379,645 5,954,673 6,258,506 Capital Maintenance 4,451,986 4,550,310 17,786,842 13,046,551 Capital Outlay 20,760,808 40,714,375 110,210,230 99,988,448 Transfers 6,073,732 6,362,600 5,482,377 5,556,502 Other (4,732) 395 6,560 6,757 Total Expenditures $94,842,712 $127,383,787 $221,095,624 $212,472,549 Employee FTE 213 25 229 25 251 25 243 25
Strategic Result 1
Infrastructure Work System Summary
By 12/2023 continue to implement a Street Maintenance Master Plan and develop an implementation plan to addres and prioritize the findings
COMPLETED MILESTONES:
a By 1/2023 provide City Council with a briefing of the Streets Maintenance Master Plan
MILESTONES:
• Annually prepare a street maintenance report for the City Council and the community
• By 12/23 develop and implementation plan to address and prioritize master plan findings
Performance Measure: Funds allocated toward street maintenance and the dollars required to maintain streets
Over the past decade, the cost of repairs to the street system has outpaced the money the City is able to dedicate to street maintenance projects In November 2016, the City placed a measure on the ballot to increase City sales and use tax by 1/2 cent to fund only street maintenance and improvements . The ballot measure did not pass . Nevertheless, the City remains committed to protecting this asset and is working diligently to increase funding for street maintenance . This performance measure demonstrates that while the City has increased its contribution to street maintenance, we are falling further and further behind
In 2020, the City transitioned from a Pavement Condition Index to a more comprehensive Pavement Quality Index (PQI) . The PQI provides an overall indication of a pavement section's condition with regard to present and future service to the user. The present service to the user is reflected in the Riding Comfort Index, which reflects the traveling public's opinion of the pavement's smoothness, hence the quality of service it provides Future service to the user is measured through measurement of surface distress and structural adequacy . The city-wide averages of these measures make up the PQI, which is rated from a low of 0 to a high of 100 . The PQI helps the City to create its maintenance plan and efficiently allocate resources.
144
2020 2021 2022 2023 2024 Level of Funding 13,194,319 9,950,504 15,416,931 12,488,937 12,864,244 Funding needed to stabilize streets 15,500,000 16,200,000 16,200,000 20,000,000 20,000,000 Gap in Funding 2,305,681 6,249,496 783,069 7,511,063 7,135,756
Performance Measures Target 2020 2021 2022 2023 Target 2024 Target Pavement Quality Index 70 38 38 39 70 70
Strategic Result 2
a By 12/2021 complete full implementation of waste hauling options
COMPLETED MILESTONES:
a By 5/2020 the first reading of the proposed ordinance will be complete
a By 6/2020 a public hearing at a City Council Business Meeting will be held and City Council will be provided with the option for contract approval
a By 12/2020 develop a waste hauling engagement and outreach plan if the contract is approved by City Council
a By 4/2021 complete initial household component selections to prepare for Cart Deployment in June
a By 6/2021 stage and deploy waste and recycle carts
a By 7/2021 begin waste and recycle collection services with a contracted vendor
Strategic Result 3
By 12/2023 update water, sewer, stormwater master plans and develop an implementation plan to address all findings
COMPLETED MILESTONES:
a By 12/2021 complete the Sewer and Stormwater Master Plans
a By 12/2022 complete the Water Master Plan
MILESTONES:
• By 12/2023 actions including conceptual project and operational changes to utilities programs necessary to implement the Master Plans are included in the 10-year ClP and performance budget
The City is committed to maintaining the investment in the water system infrastructure Timely response to all urgent situations minimizes property damage and inconvenience to all customers By investing in water main replacement and taking the time to analyze and prioritize existing infrastructure, pipeline breaks have remained under the target in recent years .
145
Infrastructure Work System Summary
Performance Measures Target 2020 2021 2022 2023 Target 2024 Target Water distribution pipeline breaks 25 14 22 29 25 25
Infrastructure Work System Summary
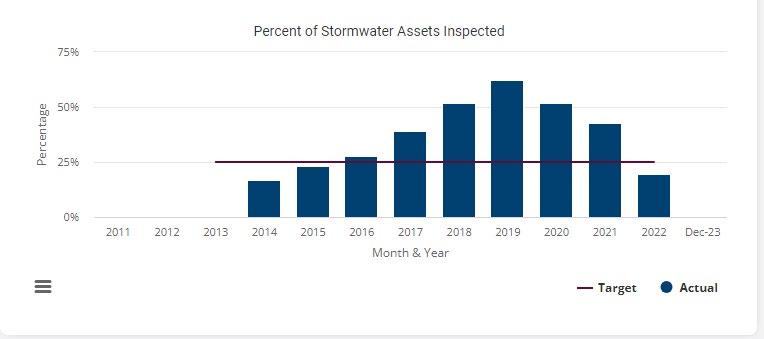
Routine cleaning and maintenance of the stormwater system is needed to prevent blockages from forming in the pipelines Inspecting and cleaning each pipe segment an average of once every 4 years is effective in preventing the buildup of materials that lead to blockages. This work helps minimize local flooding and maintain maximum flow capacity. Timely responses to water breaks, sewer overflows, and flooding help minimize damage.
Upgrading the sewer system installed prior to 1980 will increase the lifecycle of the pipes . With this goal in mind, the City has a target of rehabilitating and/or replacing 60,000 lineal feet of sanitary sewer each year. Routine cleaning of the system prevents blockages from forming in the pipelines; the City target of 66% of the system to be cleaned each year is double the industry standard of 33% Mainline backups are caused by debris that builds up over time If a mainline is blocked and sewage backs up into the basement of a nearby home, the City assumes responsibility . The City is responsible for locating all underground infrastructure; if the assets are not precisely located, any damage becomes the City's responsibility and cost
146
Performance Measures Target 2020 2021 2022 2023 Target 2024 Target Miles of sanitary sewer pipeline installed prior to 1980 rehabilitated or replaced Zero miles remaining by 2023 24 24 6 0 0 Portion of the sewer system cleaned annually 66% 48% 59% 30% 66% 66% Sanitary sewer backup events resulting in claims 2 or fewer 1 1 1 2 2 Underground infrastructure locates which result in damage to the City's water, sewer, or stormwater systems 2 or fewer 1 0 0 2 2 Performance Measures Target 2020 2021 2022 2023 Target 2024 Target Stormwater assets inspected and cleaned annually . 25% 52% 43% 20% 25% 25%
Strategic Result 4
Infrastructure Work System Summary
By 12/2023 provide financial options for City Council in order to eliminate the street maintenance deficit
COMPLETED MILESTONES:
a By 12/2022 evaluate and develop policy direction for streets maintenance including ADA compliance requirements
a By 12/2022 all new development in the City complies with ADA requirements and 2022 updated engineering standards
MILESTONES:
• By 7/24 obtain City Council support and direction after completing research and developing the business case for dedicated funding to street maintenance
Strategic Result 5
By 12/2025 effectively utilize voter approved bond funds for the completion of Ralston Road phase 2 and the expansion of 72nd Avenue
MILESTONES:
• By 3/2024 85% of bond funds will be expended
• By 3/25 the required 5-year bond arbitrage calculation will be completed on time
In 2018, Arvada citizens approved Ballot Issue 3F to fund $79 .8 million of improvements to Ralston Road and West 72nd Avenue . By March 2022, 85% of those funds ($67 .8 million) must be expended .
147
Performance Measure Bond Budget 2020 2021 2022 2023 Target 2024 Target 72nd Underpass 64,500,000 6,203,229 11,937,357 22,314,223 35,000,000 64,500,000 Ralston Road - Yukon to Garrison 15,300,000 4,432,573 9,667,016 13,464,764 15,300,000 15,300,000
$0 $5,000,000 $10,000,000 $15,000,000 $20,000,000 $25,000,000 72nd Underpass Ralston Road - Yukon to Garrison Bond Proceeds Spent 2020 2021 2022
Strategic Result 6
By 12/2025 complete a comprehensive plan for City facilities and properties that would be utilized for City business operations post COVID-19, including the City Hall campus, Indiana Shops, and other appropriate satellite facilities to ensure optimal usage of space
COMPLETED MILESTONES:
a By 12/2020 update the conceptual plan for the Post Office property
a By 12/2021 present the conceptual plan for the Post Office property with cost, funding, and schedule to City Council
MILESTONES:
• By 12/2023 complete an evaluation of utilization of all currently operating City facilities
• By 12/2024 determine need for additional facilities to support City operations
• By 12/2025 develop a financial plan for improvements to existing City facilities and/or purchase of additional properties
Strategic Result 7
Through 12/2025 continue progress on having 100% of the water supply needed for buildout based upon the water supply master plan and current schedule for completion of Gross Reservoir by 2028
MILESTONES:
• By 12/2024 develop a Water Supply Master Plan
• Through 12/2025 maintain funds to meet water supply financial commitments
• Through 12/2025 monitor Denver Water participation contract requirements to meet water delivery scheduled for 2028
Strategic Result 8
By 12/2022 the engineering standards and City code framework will be updated
COMPLETED MILESTONES:
a By 12/2020 create new development agreement terms and template
a By 12/2020 complete an inventory of engineering Ordinances and specifications and by 12/22, adopt new/revised Ordinances and specifications
a By 12/2021 complete draft engineering standards and specifications update
148
Infrastructure Work System Summary
Strategic Result 9
By 12/2023 complete and implement an Arvada transportation master plan, including analysis of the current transportation network, and analysis of future multi –model opportunities including non-motored micro-mobility options, transit operations first and last mile opportunities, road system safety improvements, and emerging transportation technology
MILESTONES:
• By 6/2023 initiate a transportation master planning project with a selected contractor
• By 6/2024 begin implementation of the transportation master plan, including conceptual project and operational changes to transportation programs necessary to ensure the Master Plans are included in the 10-year CIP and performance budget
• By 7/2024 the Transportation Committee will align with city stakeholders in the refinement and implementation of the masterplan recommendations
• By 12/2024 on an on-going basis provide semi-annual updates to the City Council regarding the implementation
Strategic Result 10
By 12/2024 create a comprehensive environmental regulatory compliance program
MILESTONES:
• By 2/2024 evaluate current City Ordinances, state and federal regulatory requirements, and the logistics for the development of an environmental regulatory compliance program
• By 6/2024 provide the analysis and . recommendations regarding a comprehensive environmental regulatory compliance program to the City Manager
• By 12/2024 based upon the outcomes of previous milestones, update workforce plans and set new milestones for the resourcing of recommendations
Strategic Result 11
By 12/2025 conduct a fleet electrification transition study
COMPLETED MILESTONES:
a Effective 6/2022 all future vehicle purchases will include the evaluation of electric vehicle options
a By 6/2023 complete a telematics study of city fleet vehicle use patterns
MILESTONES:
• By 6/2024 prepare a comprehensive report with vehicle use pattern assessments and recommendations for fleet electrification, including vehicles, resource needs, and charging infrastructure
• Continuously identify and solicit additional state, local and grant funding opportunities for charging infrastructure
Meets or Exceeds Target Just Under Target Does Not Meet Target
Complete
149
Infrastructure Work System Summary
a
Intentionally left blank
Organizational and Service Effectiveness Work System Summary
The community depends on a well-managed, fiscally-responsible and transparent City government to guide the organization in a manner that enhances quality of life. Performance-based management practices, sustainable levels of resource use, efficient application of technology, a high-performing workforce, and legal and ethical compliance will ensure the long-term credibility and effectiveness of the City government.
PRINCIPLES AND SERVICES:
To support organizational and service effectiveness, The City of Arvada:
• Provides leadership, policy and guidance, communication, and engagement services to City Council, the community, and the organization utilizing a values-driven organizational culture, ethical behavior, and transparency to the community to maintain public trust .
• Provides legal services to the City Council, Boards and Commissions, and all work systems, so they can enforce the law, avoid, or mitigate risks associated with City operations and protect the legal interests of the City
• Maintains appropriate staffing levels, collaborative communications, information technology and financial management support, as well as, leadership services to all work systems to achieve strategic and operational results
• Provides a well-managed, fiscally responsible government that operates effectively and efficiently while identifing revenue requirements to sustain current service levels and achieve future requested levels of service
• Leverages technology, and benchmarks to guide decisions, improve results, enhance service delivery, and maintain the highest level of data security in support of City effectiveness, now and into the future.
• Provides multiple information platforms and data to the community to support its ability to engage in community governance, exercise civic responsibility, and easily access and share public information
• Fosters a top workplace environment that attracts and retains a highly engaged, inclusive workforce and fosters a culture of wellness, safety, cycles of learning and performance excellence .
• Supports a resilient workforce and community that are able to withstand stresses and shocks, while maintaining essential functions and recovering quickly, effectively, and equitably .
151
Organizational and Service Effectiveness Work System Summary
Budget Summary
Revenue Highlights
• Taxes include sales tax, general use tax, auto use tax, building use tax, property tax and property tax and account for over 79% of the budget Revenues increase 2% in 2024 as these revenue sources stabilize
• Highway Users’ Tax Fund and Jefferson County Road and Bridge taxes account for approximately $5 .5 million of intergovernmental revenues . The remaining amount of intergovernmental revenue is composed of allocations to the Insurance fund Intergovernmental revenue declines in 2023 as the 2022 revised revenue includes American Rescue Plan funding of $5 5 million
• Charges for services reflect the cost of administrative services paid by the Enterprise funds.
• Miscellaneous revenues include interest income and recovered costs .
The Achievement of Excellence in Procurement Award is earned by public and non-profit agencies that demonstrate a commitment to procurement excellence . This annual program recognizes procurement organizations that embrace Innovation, Professionalism, Productivity, Leadership and e-Procurement
152
REVENUES BY TYPE 2021 Actual 2022 Actual 2023 Revised 2024 Budget Taxes $90,546,114 $101,988,585 $100,794,284 $102,841,195 Licenses, Permits and Fees 7,464,298 17,283,682 495,000 508,200 Intergovernmental 11,325,372 18,398,088 13,897,665 14,947,045 Charges for Services 3,876,567 3,977,092 3,537,186 4,117,851 Fines and Forfeits 92 15 -Miscellaneous 3,470,972 771,251 4,324,510 6,723,492 Other Financing Sources 870,289 - -Revenue Transfer 539,452 3,109,534 626,614 1,136,413 Total Revenues $118,093,155 $145,528,248 $123,675,259 $130,274,196
Organizational and Service Effectiveness Work System Summary
Expenditure Highlights
• Personnel include salaries and benefits for the City Manager’s Office, City Attorney’s Office, Finance, Human Resources and Information Technology departments. The increase in 2023 reflects five new positions in Community and Economic Development, Facilities and Engineering
• The services and charges line item in 2022 includes expenses related to the receipt of funds from the American Rescue Plan as these funds will be spent from this line item
• The supplies and expense line item increases for 2023 are due to increased maintenance and replacement spending in the Computer Maintenance Fund
• The contracts and leases line item increases in 2022 are due to several one-time increases for legal fees, professional services and security projects . Spending returns to normal levels in 2023 .
• Transfers include transfers to the Street Maintenance Fund, Capital Improvement Projects Fund, Parks Fund and Certificates of Participation Fund.
Challenges
Advantages
153
Recruitment and retention of employees . Financial stability through the pandemic Heightened focus on cyber security Long range financial planning Increasing complexity and magnitude of workloads Focus on building organizational capacity Employment Legislation 2021 Top Workplace recognition Changing workforce demographics and expectations Engaged Workforce Legacy Technology Flexible work schedule and location options Increasing Litigation Homelessness EXPENDITURES BY TYPE 2021 Actual 2022 Actual 2023 Revised 2024 Budget Personnel $14,576,539 $19,487,403 $14,876,517 $15,628,731 Services and Charges 8,989,773 10,391,775 25,834,812 10,237,406 Supplies and Expenses 2,987,962 3,963,054 11,313,396 8,869,299 Contracts and Leases 2,969,343 3,358,909 2,751,703 2,727,394 Debt service - 5,864 Inventory 18,265 1,018 20,600 21,218 Capital Maintenance 32,968 43,365 66,908 60,786 Capital Outlay 232,870 2,856,653 61,500 105,000 Transfers 24,364,411 33,660,645 38,207,774 30,990,572 Other - 50 -Total Expenditures $54,172,131 $73,768,737 $93,133,210 $68,640,406 Employee FTE 110 .10 115 .00 124 .00 137 .00
Organizational and Service Effectiveness Work System Summary
Strategic Result 1
a By 12/20, in alignment with established recovery principles, the City will provide services with necessary modifications while remaining agile and able to respond to changing circumstances related to the COVID-19 pandemic
COMPLETED Milestones:
a By 5/20, all work systems teams will have a recovery plan in place
a By 7/20, develop and implement a framework for remote work including policy updates, equipment needs, and performance metrics
a By 9/20, present a 2-year budget and 10-year financial plan that accounts for the effects of COVID-19
a By 12/20, CARES funding will be fully utilized to support the community and City operations
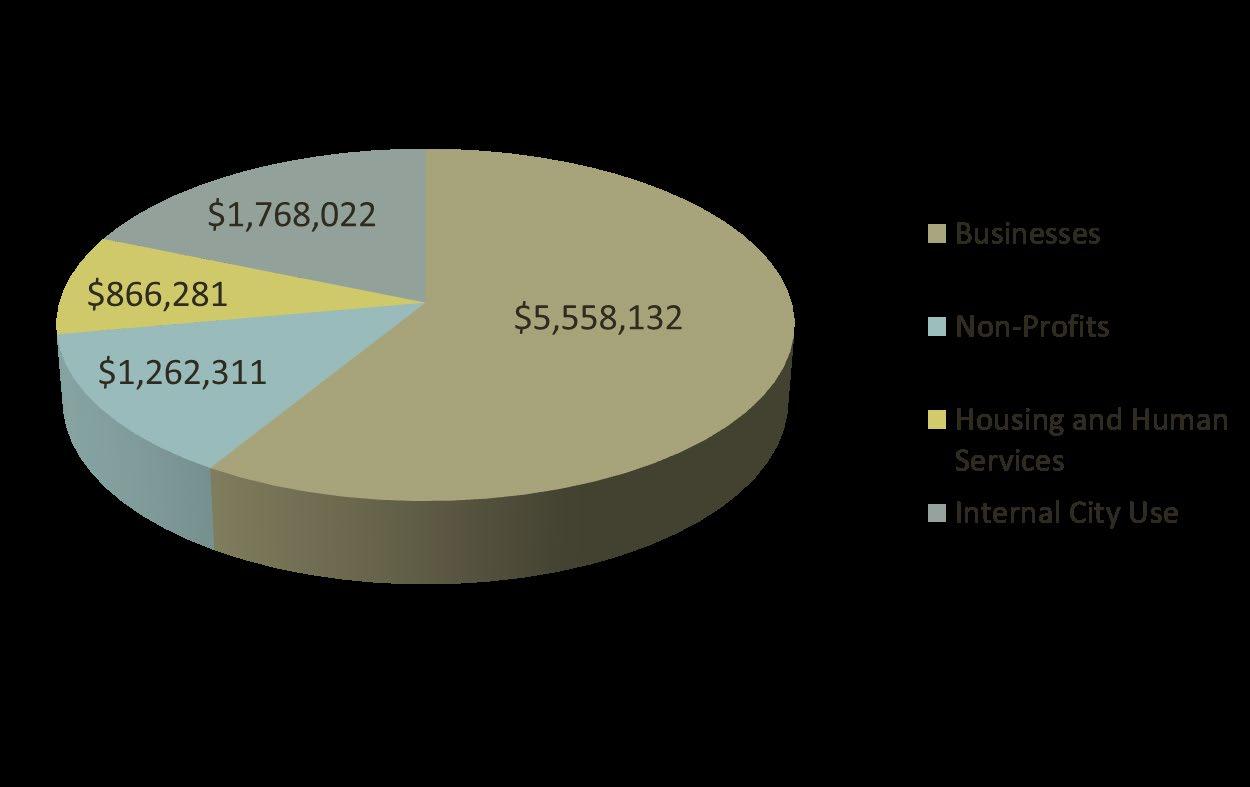
By 12/24, implement a comprehensive City communications and engagement strategy
COMPLETED MILESTONES:
a By 1/20, complete the overarching communications and engagement strategy
a By 12/20, implement external communications, engagement plans and an internal communication plan and by 12/21 implement an internal communications plan
a By 12/22, determine branding framework to be used in alignment with arvadaco .gov upgrade
a By 12/20 offer leadership development opportunities and training to volunteers to foster future City Leaders
a By 6/23, launch Arvadaco gov
MILESTONES:
• By 12/24, develop a marketing plan highlighting the City successes, presenting information using engaging content and using shared partner messaging
• By 12/24, further define and internal communications plan
• By 12/24 develop a neighborhood engagement plan aimed at building social cohesion and leveraging community efficacy
154
“Cares Act Allocation”
Strategic Result 3
By 12/23, develop an organizational framework for the effective advancement of data utilization, system integration, and digital capacities across all work systems
COMPLETED MILESTONES:
a By 6/20, identify all performance measures with a potential smart city component and create a city wide inventory
a By 12/20, complete first draft of the Smart Arvada Plan
a By 6/21, develop a data governance framework
a By 1/22, increase the data governance maturity score from the 1 .4 to 2 .2
a By 6/22, select a Cloud partner and implement the Could platform
a By 9/22 form data and analytics team
a By 6/23, select ERP replacement platform
MILESTONES:
• By 12/23, increase the data governance maturity score to 2 .9
Strategic Result 4
COMPLETED MILESTONES:
a By 12/21 achieve Denver Post Top Workplace designation
MILESTONES:
• By 12/23, establish systems and structures to embed enhanced levels of diversity, equity, inclusion and accessibility in city services and operations
• By 12/23 foster a culture of safety through established systems and structure to embed enhanced levels of safety in our services and operations
• By 6/24, develop and begin the implementaion of a municipal resilience strategy to prepare and adapt for the urgent threat of changing environment and resources
• By 12/25 determine a centralized volunteer coordination program strategy
• By 12/25 utilize Malcolm Baldrige, ICMA and other performance excellence review processes to further calibrate Arvada's journey to excellence
• Annually enhance Arvada University programming to support workplace growth and development needs
• On an ongoing basis, prepare and present a balanced biennial budget and 10-year financial plan
• Annually maintain a "AA" or better bond rating
• Continuously ensure the alignemetn of all City Master Plans providing an aligned and integrated approach to the achievement of strategic and operational targets
155
Organizational and Service Effectiveness Work System Summary
By 12/22, continue to implement an organizational performance excellence framework
AAA is the highest possible rating and reflects an opinion that the City has the current capacity to meet is debt obligations

These performance measures demonstrate that the City is a well-managed, fiscally responsible government that can sustain current service levels and also utilizes long range planning to maintain the fiscal health of the City.
* The Certificate of Distinguished Budget is awarded every other year
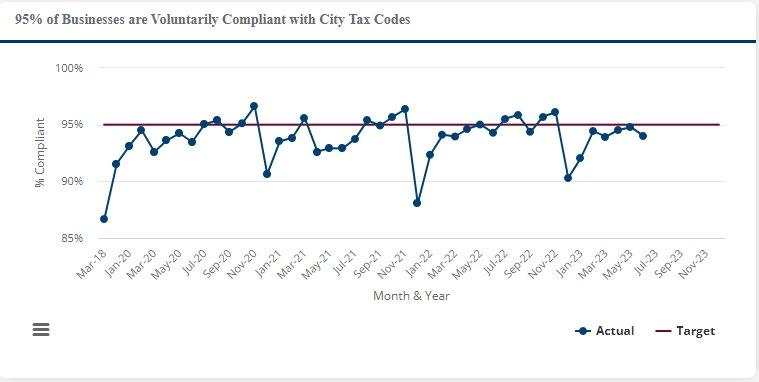
156
Performance Measures Target 2020 2021 2022 2023 Target 2024 Target Annually update the City's ten-year financial plan Yes Yes Yes Yes Yes Yes GFOA Certificate of Achievement in Financial Reporting received Yes Yes Yes Yes Yes Yes *GFOA Certificate of Distinguished Budget Presentation received Yes NA Yes NA Yes NA Businesses voluntarily compliant with City tax codes 95% 91% 88% 90% 95% 95% Licensed businesses that file and pay sales and use tax returns online 99% 95% 100% 100% 99% 99% Grant proposals awarded 50% 73% 77% 85% 50% 50%
Organizational and Service Effectiveness Work System Summary
Performance Measure Target 2020 2021 2022 2023 Target 2024 Target Bond Rating AA AAA AAA AAA AA AA
healthcare increase over previous year
Organizational and Service Effectiveness Work System Summary
recruitments resulting in a hire during
posted where a conditional offer occurs within 45 days of
*Achieve Denver Post Top Workplace designation
The City is an employer of choice and fosters a culture of safety, wellness, cycles of learning and process improvement that attracts and retains a highly-engaged and diverse workforce
*Denver Post Top Workplace only entered in 2021
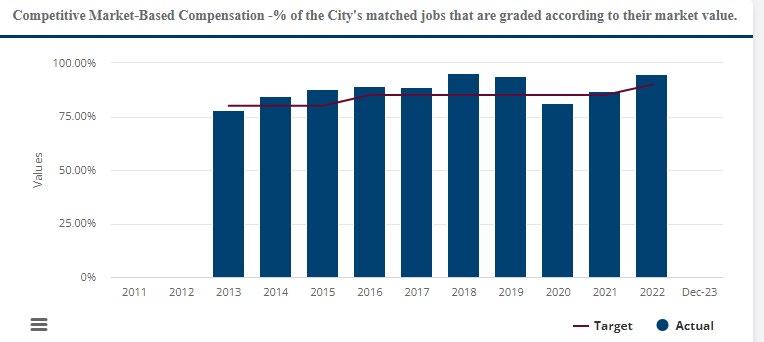
157
Performance Measures Target 2020 2021 2022 2023 Target 2024 Target City's
85% 82% 87% 95% 85% 85% Annual
6% or less 0% 0% 0% 6% 6% City
70% 83% 75% 59% 70% 70% Employees
and incentives 50% 50% 55% 45% 50% 50% Benefitted
the
recruitment
90% 95% 89% 97% 90% 90% Vacancies
90% 95% 100% 100% 90% 90%
matched jobs graded according to their market value
employees enrolled in the City's healthcare plan who receive an annual physical
participating in wellness awareness
first
process
the application deadline
Yes Yes Yes
Organizational and Service Effectiveness Work System Summary
Strategic Result 5
By 12/22 Continually measure citizen satisfaction regarding the overall well-being of the community
COMPLETED MILESTONES:
a By 12/20 identify all lower-rated items in the 2019 Community Survey and develop an action plan to address all items
a By 6/22, identify and select a survey vendor
a By 9/22, develop survey questions with input from the community
a By 12/22, launch an annual Arvada Community Survey
contaced the City in the past
moths, the % that rated interaction as good
The City of Arvada performs a biennial community survey . The results of the survey are used to help the City identify the areas where the City delivers excellent services and areas that need to be improved .
Strategic Result 6
By 12/25 implement a regional homelessness strategy
COMPLETED MILESTONES:
a By 5/23 hire a homelessness project manager
a By 5/23 enter into fully authorized IGA's with Adams County for street outreach, services and collaborative partnership with all Adams County jurisdictions
MILESTONES:
• By 12/23 enter into a collaborative working and governance structure MOU with the metor cities within and including Jefferson County
• By 8/23 implment a homelessness study and PESTEL analysis which includes each jurisdiction in the collaborative MOU
• By 12/23 implement or being implementation of shortterm goals as stated in the April 9, 2023 homelessness City Council presentation
• By 12/24 implement, or being implementation of intermediate-term goals as stated in the April 9, 2023 homelessness City Councl presentation
158
Performance Measures Target 2020 2021 2022 2023 Target 2024 Target Number of Community Survey paticipants 400 NA NA 1,200 NA 400 Percentage of participants who rate the City's customer service is good or fair 50% NA NA 67% NA 50% Among residents who
12
50% NA NA 74% NA 50%
Organizational and Service Effectiveness Work System Summary
Strategic Result 7
By 12/23, update the City's Total Rewards Philosophy and Strategy to improve the City's ability to attract, motivate and retain a high-performing workforce
COMPLETED MILESTONES:
a By 6/22, complete an Employee Total Rewards Survey and an Employment Market Benchmark Study
a By 8/22, update City Council on Total Rewards Philosophy for City Council discussions
a By 12/22, develop and recommend new Total Rewards Philosophy for City Council approval MILESTONES:
• By 12/24, create the strategy for developing and funding Total Reward Program and begin designing and implementing program updates
Strategic Result 8
By 12/24, based on long-term financial projections and updated master plans, develop financial resiliency recommendations to ensure adequate and ongoing investment in city infrastructure and core services
COMPLETED MILESTONES:
a By 12/22, using information assembled as part of the 2023-2024 Budget development process and current mater planning efforts, prepare a summary of long range unfunded needs by work system MILESTONES:
• By 12/23, develop a city-wide consolidated level of service summary
• By 12/23, prepare an exhaustive list of funding source opportunities for closing identified infrastructure and core service funding gaps
• Continuously research, track, apply for and deploy awarded grant funding
Meets or Exceeds Target Just Under Target Does Not Meet Target
159
a Complete
Intentionally left blank
Safe Community Work System Summary
Community-based policing, connected neighbors, engaged local businesses, supportive community institutions, and a fair and impartial justice system, all working together, to ensure Arvada is a safe place to live, work, play, and stay.


PRINCIPLES AND SERVICES:
To support a safe community, the City of Arvada:
• Achieves and maintains the gold standard in public safety by meeting and exceeding standards set forth through the Commission of Accreditation for Law Enforcement Agencies (CALEA) to assist with the designation of one of the safest communities in Colorado .
• Provides customized police services making the community feel safe and secure, including proper investigation, appropriate case filings, and crime scene investigation, resulting in an increased likelihood of identifying and prosecuting those responsible for committing crimes
• Ensures the Police Department has appropriate staffing levels; communication, information, financial management support; and leadership services to achieve strategic and operational results, including maintaining a well-informed community .
• Applies inspection, enforcement, community support, and neighborhood engagement services to residents, businesses, and neighborhood partners in order to preserve safety, compliance, stability, and appearance of neighborhoods through collaborative partnerships and achievement of long-term neighborhood goals .
• Provides administrative, business, communication, and investigative services to members of the community and the Police Department with a commitment to Respect, Dedication, and Responsibility
• Provides an independent, fair, and impartial justice system that efficiently processes the court docket, renders fair and just decisions, and holds all stakeholders accountable .
161
Click here to learn more about the Arvada Police Department
Budget Summary
Revenue Highlights
• The primary sources of revenue are a 21 of sales tax increment and a 25 of sale tax increment generated from a voter-approved measure to fund expanded police services . Revenue trends closely follow those in the General Fund
• Intergovernmental revenue has decreased due to grants for additional police officers ending.
• Miscellaneous revenue has decreased as a result of the fluctuation in traffic enforcement adjudications .
162
Safe Community Work System Summary
REVENUES BY TYPE 2021 Actual 2022 Actual 2023 Revised 2024 Budget Taxes $13,026,272 $14,546,808 $14,590,775 $14,765,459 Intergovernmental 447,990 718,216 536,116 498,533 Fines and Forfeits 961,214 706,687 1,059,357 802,079 Miscellaneous 88,356 (594,699) 332,304 345,545 Revenue Transfer 300,000 - -Total Revenues $14,823,832 $15,377,012 $16,518,552 $16,411,616
Expenditure Highlights
• Personnel costs increased from new positions in the Police and Judicial departments . Mental health workers have been added to assist with the community's needs. Salaries and benefits have been reevaluated to attract and retain police officers.
• Supplies and Expenses increased due to inflation related to vehicle maintenance costs and related to the contributions toward vehicle replacement .
• The increased transfer in 2023 is for the acquisition or construction of an evidence building in 2023 .
Challenges
National narrative on policing
Tragic loss of an officer
Recruitment and retention of officers
Increase in legislative mandates
Increase in homelessness
Increase in population and calls for service
Increase in violent crime
Lack of mental health services
Lack of appropriate sentencing options
Advantages
Supportive community, Council and City Management
Strong leadership in the Police Department and Municipal Court
Maintaining national accreditation
Judicial focus on restorative justice
Specialty Court docket addressing homeless population
163
Safe Community Work System Summary
EXPENDITURES BY TYPE 2021 Actual 2022 Actual 2023 Revised 2024 Budget Personnel $29,184,475 $27,463,523 $33,205,841 $38,388,325 Services and Charges 1,265,894 1,599,899 2,441,011 2,310,059 Supplies and Expenses 3,727,629 5,470,631 5,265,539 5,730,914 Contracts and Leases 2,419,633 3,223,302 2,795,261 2,695,714 Capital Maintenance 22,457 44,947 57,756 59,263 Capital Outlay 148,705 935,397 82,057 82,119 Transfers 531,271 237,268 3,963,446 873,599 Other 2,398 8,634 -Total Expenditures $37,302,461 $38,983,601 $47,810,911 $50,139,993 Employee FTE 249 .00 259 .00 264 .00 267 .00
Strategic Result 1
By 12/23, Public Safety staffing levels will be at 95% filled
COMPLETED MILESTONES:
a By 12/20, create performance measures documenting the amount of and reasons for officer attrition
MILESTONES:
• Continuously update and utilize the recruitment and retention plan including the use of a hiring strategy
A bachelor’s degree is a minimum educational requirement for all Arvada police officers. The Bureau of Justice Statistics state only 1% percent of U S police agencies require a four-year college degree

Strategic Result 2
a By 2/21, Public Safety will implement a community engagement and education plan
COMPLETED MILESTONES:
a By 12/20, formalize and integrate the CORE unit to work with those experiencing homelessness by providing resources, education, and criminal violation enforcement
a By 12/20, implement a plan that outlines services and education provided to juveniles within Arvada
a By 12/20, implement a plan that outlines strategies to enhance positive police and community interaction
164
Safe Community Work System Summary
Performance Measures Target 2020 2021 2022 2023 Target 2024 Target Sworn Officers earned a Bachelor's Degree 100% 100% 100% 100% 100% 100%
Strategic Result 3
By 12/23, maintain a violent crime rate lower than 80% of the cities in the state of Colorado with a population of 100,000
COMPLETED MILESTONES:
a By 12/22, implement a comprehensive Traffic Safety Strategy and Operational Plan with collaboration between the police department, traffic engineering and streets maintenance programs to ensure high level traffic safety and operation standards
MILESTONES:
• Annually, 80% of calls for service with a priority of "0" or "1" will have less than 5 minute response time
• By 12/2023, design and implement Code Enforcement Measure focused on proactive inspections for designated retail commercial areas
80% of calls with a priority of 0 or 1 will have less than five (5) minute response times
Appropriate staffing levels, communication, information, and financial management support as well as leadership services to the Police Department to achieve strategic and operational results including maintaining a well-informed community .
Industry average is 10 minutes .
165 Safe Community Work System Summary Performance Measures Target 2020 2021 2022 2023 Target 2024 Target
80% 76% 72% 71% 80% 80%
50% 60% 70% 80% 90% 1Q-20 2Q-20 3Q-20 4Q-20 1Q-21 2Q-21 3Q-21 4Q-21 1Q-22 2Q-22 3Q-22 4Q-22 % emergent calls % of calls with a priority of 0 or 1 will have less than 5 minute response time
Sergeants will respond to 20% of citizen initiated calls for service
** Measure not implemented until 2021
Provides customized police services making the community feel safe and secure, including proper investigation, appropriate case filings, and crime scene investigation, resulting in an increased likelihood of identifying and prosecuting those responsible for committing crimes .
Strategic Result 4
a By 12/22, 100% of juveniles charged with criminal offenses and referred to probation will receive measurable risk-based pre-sentence assessments
COMPLETED MILESTONES:
a Annually, 90% of pre-sentence reports will be completed and provided to juvenile within 72 hours of sentence
a Annually, 80% of pre-sentence reports contribute to evidenced based sentencing recommendations - Municipal Judge
a Annually, 80% pre-sentence reports contribute to evidenced based sentencing recommendations - City prosecution team
Strategic Result 5
By 6/2025 the One Small Step (OSS) Specialty Court Docket will be successfully implemented to improve outcomes for people experiencing homelessness
MILESTONES:
• By 6/2023 the specialty court docket will be in compliance with best practices for the homeless population
• By 12/2023 reduce recidivism among One Small Step defendants by 25%
• By 6/2025 60% of One Small Step defendants are enrolled in a treatment program
166 Safe Community Work System Summary Performance Measures Target 2020 2021 2022 2023 Target 2024 Target
20% ** 20% 21% 20% 20%
Strategic Result 6
COMPLETED MILESTONES:
a By 12/23, complete analysis of a Parent Accountability ordinance that would address juvenile violence in schools for the City Council's consideration
MILESTONES:
• By 6/24, complete revisions to Chapter 62 of the ACC to be more consistent with Colorado State criminal laws to facilitate prosecution of defendants in the Municipal Court and help hold defendants accountable for their conduct
By 12/24, complete a review of the City Code and present revisions for the City Council's consideration that will improve the accountability of defendants Meets or Exceeds Target Just Under Target Does Not Meet Target
167 Safe Community Work System Summary
a Complete
Intentionally left blank
Vibrant Community and Neighborhoods Work System Summary
A vibrant community is engaged in civic life, the arts, and the outdoors. It comprises individuals and groups who are dedicated to their community, get involved with neighborhood associations and participate with local government to ensure responsiveness to changing needs resulting in Arvada being the preferred place to live, work, play and stay.
PRINCIPLES AND SERVICES:
To support vibrant communities and neighborhoods, The City of Arvada:
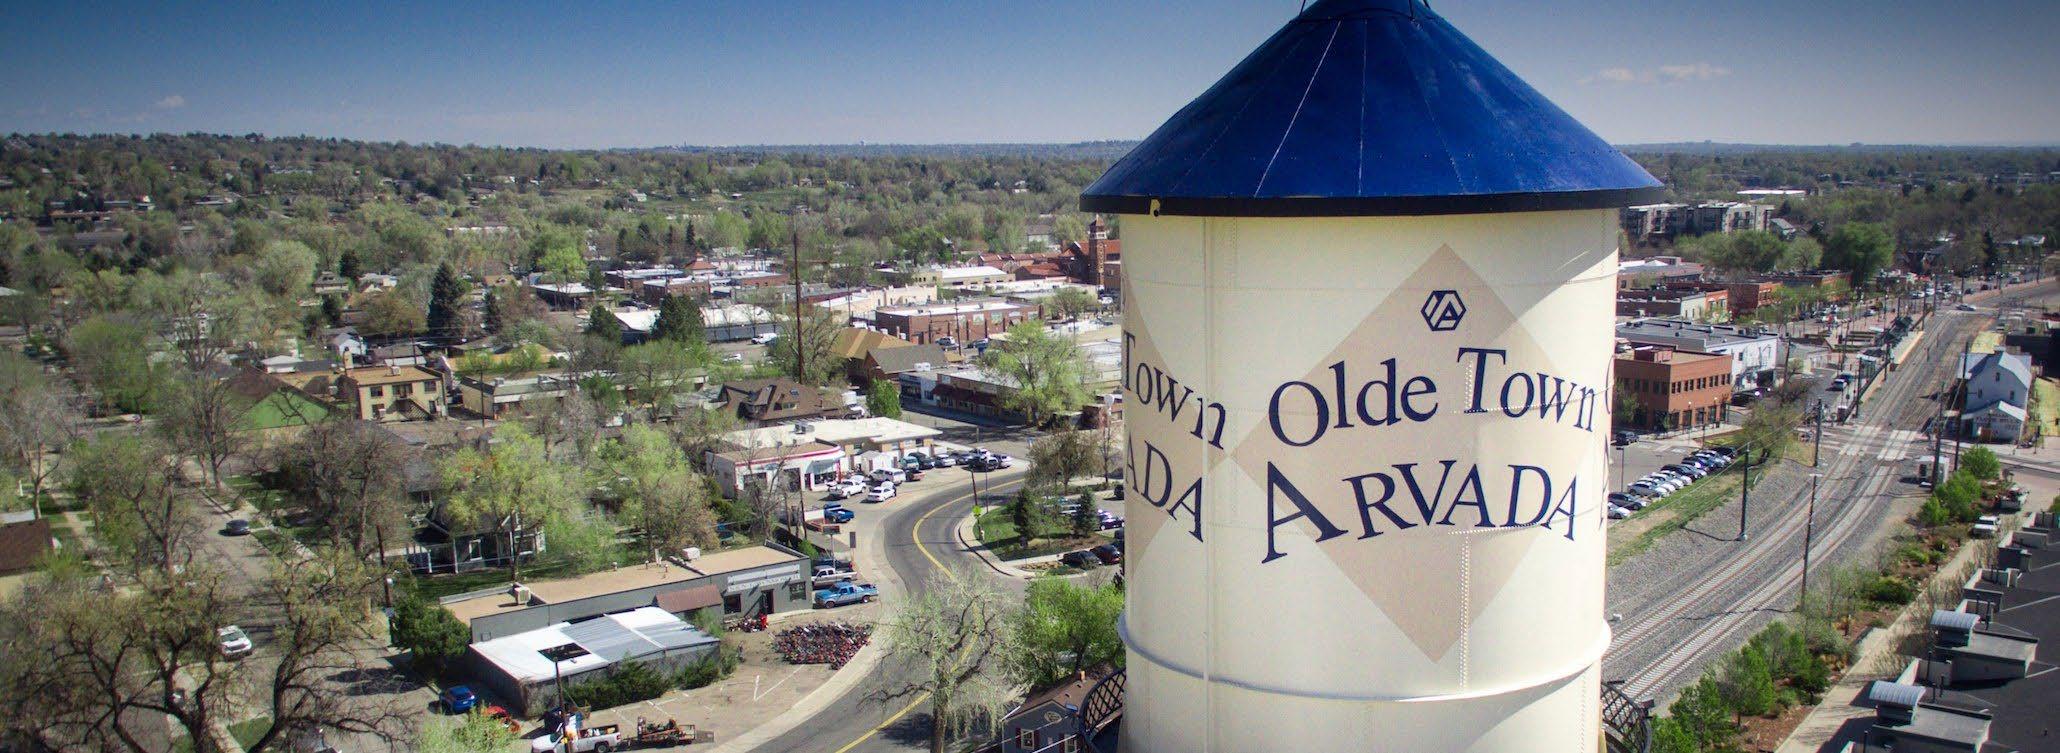
• Provides meaningful ways for the community to engage with local government and strategic partnerships to advance quality of life by embracing Arvada’s small town traditions and history to achieve an inclusive, equitable, diverse, prosperous, and resilient community that cares about its neighbors .
• Improves access to quality housing that is affordable to a broad range of income levels and provides resources, housing, and neighborhood assistance services to Arvada residents, businesses, property owners, and stakeholders
• Provides specialized programs and resource conservation services to the workforce, the community, and businesses so they can carefully use and preserve resources and save money .
• Provides maintenance services to the community and visitors, so they can play and enjoy activities in a safe, well-maintained parks, open space, and trails system Completing park projects and identifying trail gaps, creating a green spine trail system while enhancing the existing trail system, and acquiring lands for open space conservation to complete gaps in underserved areas or along potential open space corridors .
• Operates sustainable premier golf facilities focusing on exceptional service and value to the community with the conservation of natural environment under economically sound and socially responsible management
• Plans and hosts conferences and events, concessions, and centralized culinary services, focusing on exceptional service and value to businesses, groups, and individuals through an economically sound and socially-responsible management, ensuring customers can have an enjoyable, memorable, productive, and personalized event experience
169
Click here to learn about the City’s Parks and Open Space
Vibrant Community and Neighborhoods Work System Summary
Budget Summary
Note: In 2023
The Arvada Housing Authority and Community Development programs are moved to the Community and Economic Development Worksystem
Revenue Highlights
• Licenses, Permits and Fees reflects the success the Parks Department is having since taking over the Athletic Field Programs from the APEX Recreation District
• In 2023, the Arvada Housing Authority and Community Development programs moved to the Community and Economic Development work system, which included a majority of the intergovernmental grants. The remaining intergovernmental revenue is for Jefferson County Open Space funds.
• Charges for services reflect the revenue generated from golf and resturant operations at both Westwoods Golf Course and Lake Arbor Golf Course, banquet operations at the Golf Courses, education classes at Majestic View Nature Center and participation in Athletic Field Programs .
• Miscellanous revenues include interest income, but no longer include recovered costs from the APEX Recreation District. In 2022 the City assumed all operations of athletic fields including maintenance and field programming.
• A transfer from the General Fund in support of Parks Operations is reflected in the Revenue Transfer .
Challenges
Effect of climate change on outdoor assets
Lack of affordable housing/increasing cost of housing
Limited land available for aqusition and increasing cost of property
Expanding service area
Impacts of increased use of parks, trails, and open space amenities
Increasing impact of homelessness on the Arvada community
Accessibility of parks and amenities
Lasting impacts and uncertainty of pandemic restictions
Lack of volunteers
Advantages
Resident and community support for parks, trails and open space
Collaboration for affordable housing options
Implementation of the regional initiative to address homelessness
Parks superior level of service
170
REVENUES BY TYPE 2021 Actual 2022 Actual 2023 Revised 2024 Budget Licenses, Permits and Fees $47,764 .82 $42,536 .92 $66,824 .00 $68,829 .00 Intergovenmental 13,938,977 13,984,933 7,022,756 7,234,158 Charges for Services 6,524,101 8,293,568 8,536,303 9,138,860 Miscellaneous 639,731 1,178,196 199,224 200,479 Revenue Transfer 5,452,987 5,041,972 5,307,723 5,646,725 Total Revenues $26,603,560 $28,541,205 $21,132,830 $22,289,051
Vibrant Community and Neighborhoods Work System Summary
Note: In 2023 The Arvada Housing Authority and Community Development programs are moved to the Community and Economic Development Worksystem
Expenditures Highlights
• In the past, the largest component of services and charges were the Section 8 Housing voucher program The Housing Department moved to the Community and Economic Development work system in 2023 . This change accounts for the reduction in this line item .
• Contract and Leases includes the annual Golf Cart Rental payment for Lake Arbor and West Woods, as well as Parks Maintenance and Lake Arbor projects, including new netting at Lake Arbor Golf Course and Lake Arbor drainage .
• The Debt Service line accounts for the West Woods irrigation loan payment to Waste Water . This payment was suspended in 2021 and 2022, but reinstated for 2023 and beyond
• Food, beverage, and merchandise for purchase at both golf courses, including banquets, is shown in the Inventory expenditure line .
• Capital Outlay includes the funds set aside for the new design of Lake Arbor Golf Course .
• The largest component of Transfers is a transfer to the COP Fund for the payment of the debt related to the West Woods Golf Clubhouse remodel. The amount in 2022 reflected a large transfer to the Vehicles Fund as well .
171
EXPENDITURES BY TYPE 2021 Actual 2022 Actual 2023 Revised 2024 Budget Personnel $10,291,940 .48 $11,070,468 .19 $11,476,207 .00 $11,959,712 .00 Services and Charges 10,232,959 9,867,025 4,004,124 3,981,753 Supplies and Expenses 2,998,562 3,466,400 3,650,634 4,063,470 Contract and Leases 389,097 428,558 881,858 1,019,625 Debt Service 41,794 50,752 163,200 163,200 Inventory 830,869 977,392 878,712 920,931 Capital Maintenance 205,672 236,488 313,316 297,113 Capital Outlay 76,704 - 110,000 30,000 Transfers 307,826 1,271,410 431,998 437,878 Other 116,924 (100,325) 200 200 Total Expenditures $25,492,349 $27,268,166 $21,910,249 $22,873,882 Employee FTE 92 89 87 89
Strategic Result 1
By 12/2025 complete current improvements to recognize Arvada’s history
MILESTONES:
• By 12/2024 partner with AURA in the development of a plan for activation of the Flour Mill in Olde Town
• By 12/2025 complete operational plan for display of the restored 04 Trolley
Strategic Result 2
By 12/2025 develop a maintenance and reinvestment plan to ensure a sustainable, resilient and beautiful community of parks, trails, open space and medians in alignment with our diverse, changing and growing community
COMPLETED MILESTONES:
a By 8/2022 provide strategic recommendations for the Majestic View Nature Center and future city-wide interpretive programs
a By 12/2022 complete an inventory of all city medians with recommendations for improvement
a By 12/2023 complete Arts and Culture Master Plan workshop(s) to determine related actions to implement the plan
MILESTONES:
• By 12/2023 update the TLC program to include a communication plan and key lifecycle metrics
• By 12/2023 Complete Level of Service studies for Golf, Restaurants, Parks, Medians, Arts and Culture, Festivals, and Majestic View Nature Center
• By 12/2023 complete a Community Events Plan
• By 12/2024 replace Meyer's Pool with a new 50 meter natatorium
• By 12/2025 complete updates to the Lake Arbor Golf Master Plan
• By 12/2024 adopt a strategic Land Pursuit and Acquisition Plan including opportunities for grants and funding partnerships
172
Vibrant Community and Neighborhoods Work System Summary
Vibrant Community and Neighborhoods Work System Summary
The City provides maintenance services to the community and visitors, so they can play and enjoy activities in a safe, well-maintained parks, open space, and trails system Completing parks projects and identifying trail gaps, creating a green spine trail system while enhancing the existing trail system, and acquiring lands for open space conservation to complete gaps in underserved areas or along potential open space corridors .
Strategic Result 3
By 12/25 a sustainability plan will be complete and ready for City Council approval and implementation beginning in 2026
COMPLETED MILESTONES:
a By 12/22 begin hiring process for a new Sustainability Coordinator
a By 6/23, work with the Arvada Sustainability Advisory Committee in the development of the scope of work for the update of the Sustain Arvada Plan
MILESTONES:
• By 12/25, complete Arvada's Sustainability Plan including an inventory of existing sustainability actions to determine level of service needs
Meets or Exceeds Target
Just Under Target Does Not Meet Target a Complete
173
Performance Measures Target 2020 2021 2022 2023 Target 2024 Target Published Maintenance Standards Met for All Park Areas 95% 82% 90% 95% 95% 95% % of Priority 1 Trails Cleared Once within 24 Hours of Snowfall 100% 100% 94% 100% 100% 100% Park Level of Service - Park within 10 minute walk of every residence 100% 84% 96% 96% 100% 100% Hours contributed Park & Reservoir Rangers 3,500 5,625 7,990 8,552 5,000 5,000 Nature Center: educators/aids with Elementary Exploration groups report students enjoyed learning about wildlife and nature 95% 0% 0% 100% 95% 95% Golf course maintenance performance standards met 95% 100% 96% 95% 95% 95%
Intentionally left blank
Capital Improvement Projects
Capital Program Introduction
The Capital Improvement Plan (CIP) for 2023 and 2024 represents the first two years of a ten-year plan that encompasses a strategic approach for the City’s capital investments for the next decade . This plan reflects a dual approach to utilizing scarce capital resources for capital improvement and major capital maintenance needs: Taking Lasting Care and the continued implementation of the Citizens Capital Improvement Planning Committee’s recommendations under the guidance of City Council’s current Strategic Plan
First, the City is continuing its focus on “Taking Lasting Care” (TLC) of its vast inventory of assets. Preserving existing infrastructure is a chief priority of the capital plan . Among TLC plans for the coming two years are:
• Allocation of resources for the replacement of aging traffic signals, guardrails, street medians and street infrastructure
• Reinvestment in the City’s park system with a focus on playground renovation, trail renovation, irrigation systems, and tree replacements
• Water system and sewer system repair and maintenance, including mains and ancillary infrastructure
Second, the City is focused on the long-term implementation of many of the recommendations of the 2015 Citizens Capital Improvement Planning Committee (CCIPC) The 21-member CCIPC was charged by the Arvada City Council to prioritize capital projects and recommend funding strategies The Committee recommended 19 projects, of which 11 have been completed or have received significant funding. CCIPC-recommended projects in the upcoming two year plan include:
• Ongoing funding for installation of conduit and a backbone fiber network
• Significant resources for missing sidewalks, transit-oriented development, bike and pedestrian access, and trails
Total budgeted capital expenditures by major category for 2023 and 2024 are listed below The remainder of the capital improvement section explains what capital projects are, how the City pays for them, and how projects are identified and prioritized. This section also includes individual project pages detailing each capital improvement within the 10-year plan .
2023-2024 CIP Projects by Category
175
Category 2023 Budget 2024 Budget Debt Service $7,741,500 $7,773,125 Personnel 123,446 130,850 General Administration 7,303,372 665,008 Transportation 3,315,066 3,517,620 Street Maintenance 12,643,701 13,349,576 Parks and Golf 3,447,297 1,741,696 Water 52,821,216 41,782,040 Wastewater 10,547,631 22,568,000 Stormwater 1,030,304 1,793,982 Grand Total $98,973,533 $93,321,897
Capital Improvement Projects
What are Capital Improvements?
The Capital Improvement Plan (CIP) is a ten-year road map for creating, maintaining, and paying for Arvada’s present and future infrastructure needs The CIP outlines the project costs, funding sources, and estimated future operating costs associated with each capital improvement The plan is designed to ensure that capital improvements will be made when and where they are needed and that the City will have the funds to pay for and maintain them .
Capital improvement projects are non-routine capital expenditures that result in the acquisition of land, design and construction of new assets, or the renovation, rehabilitation, or expansion of existing capital assets. Capital projects usually have an expected useful life of at least five years.
Capital improvements make up the physical infrastructure that all cities must have in place to provide essential services to current residents and support new growth and development . They are also designed to prevent the deterioration of the City’s existing infrastructure, such as roads, parks, buildings, and underground pipes for water and sewer systems, and to respond to and anticipate future growth of the City .
Ongoing capital projects receive consistent funding for recurring capital infrastructure needs throughout the City and ensure that General CIP dollars are available for improvements in particular areas Their creation grew out of the recognition that, while some recurring needs are relatively small in scope, it was still imperative that resources be reserved to fund necessary work Routine capital expenditures generally will have no significant impact on the operating budget.
One-time capital projects generally receive funding for the construction of a public facility or acquisition of land for a future public facility These projects may have ongoing operating and maintenance costs, which would be included in the operating budget
Capital maintenance expenditures represent recurring capital expenditures intended specifically to sustain existing infrastructure and capital capacity, such as with water and sewer main replacements .
Paying for Capital Improvements:
Funding for the City’s capital program comes from a variety of sources
98-101 Funding – Since the electors of Arvada adopted a sales tax in 1969, the City Code has required that 60% of the first cent of sales tax revenue must be appropriated annually for capital projects or debt service. Codified as §98-101 in the Arvada Code of Ordinances, this funding is referred to as 98-101 funding The funding for 2023 and 2024 is calculated as follows:
2023-2024 98-101 Funding
176
Funding 2023 Budget 2024 Budget 98-101 15,038,924 15,481,952 Debt Service Obligations Bond Payments (5,797,474) (5,801,282) COP Payments (1,976,683) (1,971,843) Transfer to the Capital Improvement Program $7,264,767 $7,708,827
Capital Improvement Projects
Water Fund – The Water Fund accounts for capital outlay and related debt service relating to the water utility operation Typically, water rates pay for ongoing maintenance and replacement costs while water tap fees cover projects related to growth and expansion .
Wastewater Fund – The Wastewater Fund accounts for capital outlay and related debt service relating to the collection, transmission, and disposal of sewage and wastewater Typically, wastewater rates pay for ongoing maintenance and replacement costs while wastewater tap fees cover projects related to growth and expansion .
Stormwater Fund – The Stormwater utility fee pays for capital improvements and debt service necessary to maintaining a stormwater management plan Using the Stormwater Fund to pay for joint capital projects with the Mile High Flood District (MHFD) also qualifies the City for MHFD funding to operate and maintain stormwater improvements within the District
Golf Fund – Revenue from the Golf Fund is expected to meet all of the identified capital needs and debt service for the Golf programs at Lake Arbor and West Woods Golf Courses .
Bond Proceeds – Proceeds from the sale of bonds fund specific capital improvement projects. A bond is a written promise to pay a designated sum of money at a specific date in the future, together with periodic interest at a specified rate, used as a long term financing tool. Bonds are used to fund the 72nd underpass project and the Ralston Road project included in the Continuing Projects list . This ten year capital improvement plan includes bond proceeds in the Water and Wastewater Funds which will be used for infrastructure projects in these funds and are identified in the 2023 and 2024 capital expenditure table and individual project sheets
Grant Funding – Funding received from an outside agency for a specific capital improvement project. Grant funding does not need to be repaid, but it may require the City to match a certain percentage of the award
Developer Funding – Contributions that developers make to the City in support of public improvements, such as traffic signals, roadway improvements, or park development, often to help respond to population growth .
Streets Fund – The Streets Fund accounts for costs relating to the asphalt and concrete replacement programs Revenues are derived from the City’s General Fund, the Highway Users Tax Fund, and street degradation fees .
Other Funding Sources – Other funding sources included in the current CIP include:
• Conservation Trust – Profits from the sale of state lottery products are distributed to local governments by the Colorado Department of Local Affairs for park and recreation services
• Adams County Transportation Sales Tax – Each year the City receives funds through a transportation sales tax from Adams County that can only be used in Adams County for transportation purposes
• Adams County Open Space Sales Tax – Each year the City receives funds through an open space sales tax from Adams County that can only be used in Adams County for open space purposes
• Lands Dedicated Opt-Out Fee – A fee in lieu of dedicating land to the City during development; used for park development
177
Capital Improvement Projects
• 3-Cent per Thousand Gallon Fee – This fee, which is based on annual water consumption, funds irrigation system upgrades
• Park Water Tap Fees – As part of new construction, park tap fees are collected to fund new park construction
Operating Impact – Each year, as capital projects are planned and others are completed, the costs related to maintaining those capital assets are examined Many times those costs can be absorbed in the City’s operations. Other times, additional staff and supplies are needed to maintain these projects. The operating impact of the 2023 and 2024 CIP is detailed later in this section and the operating impact of each project is included within the individual project pages .
Capital Budgeting Process
In many respects, the planning process for selecting, scheduling, and financing capital improvements parallels the way someone might plan to buy a house or a car . The process involves assessing many competing needs, determining priorities, evaluating costs and financing options, and establishing a realistic timeline for completing the projects
The following graphic outlines the City of Arvada’s ten-year Capital Improvement Plan process:
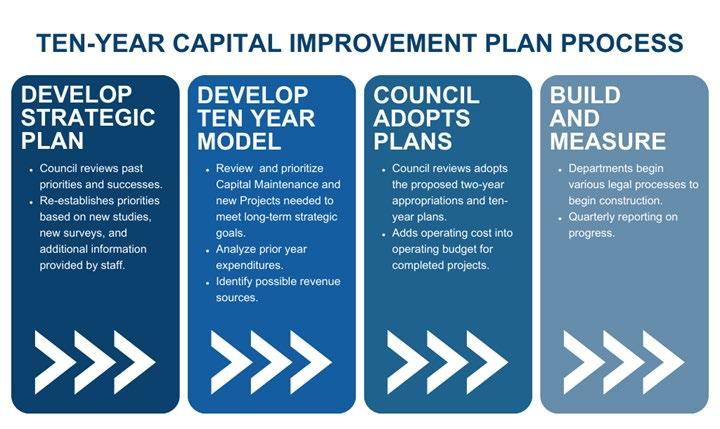
The prioritization of projects is done as part of the biennial budget process, with a preference towards funding projects that are mandated, remove a risk, and/or align with Council’s Strategic Plan . Mandates can include orders from the federal or state government that require action of the City, court orders, action required by health and life safety codes, and regulations regarding ADA accessibility . The criteria used for each priority is as follows:
Priority 1
• Eliminates a hazard
• Satisfies an obligation, such as federal and state mandates, City Council Strategic Plan priorities, developer agreements, and legal contracts
• Funded entirely by sources other than CIP dollars – for example, Open Space funds, developer contributions, CDBG funds, the Regional Transportation District funds, etc
178
Capital Improvement Projects
Priority 2
• Eliminates a hazard
• Satisfies an obligation, such as federal and state mandates, City Council Strategic Plan priorities, developer agreements, and legal contracts
• Receives funding from other sources as well as CIP dollars
Priority 3
• May eliminate a hazard
• Does not satisfy an obligation
• Does not have funding available other than CIP dollars
Strategic Plan
The City’s Performance-based Budgeting program, FOCUS, acts as the foundation of Arvada’s budget process In 2019, City Council adopted a new Strategic Plan to lay the foundation for meeting current and future community needs . The following strategic results and milestones have provided guidance in determining funding priorities for the 2023-2032 capital improvement plan:
• By 2021 Arvada will have a traffic accident rate lower than the national average
• Through 2025 prepare an annual street maintenance report for City Council and the community
• By 2021 complete the Sewer and Stormwater Master Plans
a By 2021 complete the Water Master Plan
• By 2023 actions including conceptual project and operational changes to utilities programs necessary to implement the Master Plans are included in the 10-year CIP and performance budget
• By 2021 all new development in the City complies with ADA requirements and 2021 updated engineering standards
• By 2024 develop a financial plan for improvements to existing City facilities and/or purchase of additional properties
• Through 2025 continue progress on having 100% of water needed for build out based upon the water supply master plan and current schedule for completion of Gross Reservoir by 2028
• Through 2025, maintain funds to meet water supply financial commitments
• By 2022, complete strategic investments and initiatives to ensure parks, trails, open space, and amenities are in alignment with our diverse, changing, and growing community
2015 Citizens Capital Improvement Planning Committee
The current Capital Improvement Plan is also driven by the recommendations of the 2015 Citizens Capital Improvement Planning Committee (CCIPC) . The Committee was charged by the Arvada City Council with prioritizing capital projects and recommending funding strategies To do this, the Committee learned about the projects, developed and applied evaluation criteria, and then deliberated on which projects to recommend to Council for funding and at what level . The CCIPC recommended $73 million dollars of funding for nineteen different projects.
179
Capital Improvement Projects
CCIPC Recommended Projects
Above is a table identifying the CCIPC-recommended projects that have previously received funding or that are receiving funding as part of the 2023 - 2024 budget .
In the seven years since the Committee released its report, the City has dedicated nearly $122 million to CCIPC-recommended projects, several million more than the level of funding recommended in the report . The ten-year capital improvement plan includes a substantial dedication of resources for CCIPC-recommended projects
The performance measure below shows the number of CCIPC projects completed since 2016
Number of Citizen's Capital Improvement Planning Committee Projects Funded (ongoing projects) or Completed (one-time projects)
Included in the CCIPC projects that received funding in recent years are two bond-funded projects As the previous sales and use tax bonds retired in 2018, a ballot question for reissuance of the bonds was voted on and approved in November 2018 . This approval allowed for the reissuance of bonds for two major road capacity projects: a grade separation on W. 72nd Avenue at the Union Pacific Railroad with improvements between Simms Street and Kipling Street, and the reconstruction and improvement of much of Ralston Road along the W 58th Avenue alignment
In addition to the project recommendations made by the CCIPC, the group particularly examined the maintenance needs of the City’s street system . While street maintenance is capital in nature, the City’s program for maintenance is funded through operating dollars within the Streets Fund . The committee recommended that the City quickly take action “to address the pressing need for additional resources to repair and maintain roads and streets in Arvada.” Although a proposed sales and use tax increase to fund additional street maintenance was rejected by voters in 2016, the City increased its annual funding for street maintenance by redirecting other operating expenditures . Over the ten years of the plan, more than $100 million is dedicated to street maintenance in order to achieve that goal .
180
2016 2017 2018 2019 2020 2021 2022
5 5 6 7 7 9 9
Project Funding to Date 2023 Budget 2024 Budget Status W. 72nd Ave. & Indiana St. Intersection $11,109,523 $- $- Complete Park Maintenance, Fleet, and Central Stores Bldg 10,218,612 - - Complete W. 72nd Ave. & UPRR Grade Separation 64,500,000 24,000,000 14,000,000 Underway Ralston Road Reconstruction (Phases 1 & 2) 23,365,263 3,000,000 - Underway Gold Strike Park 2,172,691 - - Underway Utility Undergrounding 332,017 59,703 61,494 Ongoing Missing Sidewalks/TOD/Bike & Trail Gaps 3,240,000 700,000 700,000 Ongoing ATMS, Conduit, and Fiber Interconnect 2,336,136 245,975 253,354 Ongoing Guardrails 253,327 59,851 60,747 Ongoing Playground Renovation 2,758,820 494,577 500,408 Ongoing Irrigation 1,490,321 171,054 676,185 Ongoing Total $121,776,710 $28,731,160 $16,252,188
Capital Improvement Projects
Open Projects
As part of the 2023-2024 CIP budget process, a detailed review was conducted of all currently open capital projects. Staff evaluated the level of resources committed to active projects in order to identify and resolve any known funding issues . The following table lists all currently open Capital Improvement projects and their estimated completion dates .
181
CIP
Project Name 2023 Budget Expected Completion Trolley Restoration 524,482 TBD Visitability Fee 592,674 Ongoing Opportunity "Fund" 9,237 Ongoing City Public Art 417,975 Ongoing Parks Maintenance Building 10,218,612 2023 Natatorium 1,500,000 Ongoing Public Art Capital Maintenance 225,150 Ongoing Olde Town Parking Garage 1,773,939 2023 Trolley Park 460,000 TBD PEG Cable Fees 645,056 Ongoing PEG Fee Capital Maintenance 102,820 Ongoing ADA Compliance Facilities 252,932 Ongoing City Hall ADA Compliance 45,671 Ongoing Arvada Center ADA Compliance 266,837 Ongoing Fire System Replacement 175,000 2024 Indiana Gate 288,500 2024 Arvada Center Kiln Roof 250,000 2023 2nd Floor Remodel 585,000 2023 Post Office Mural 30,138 2023 PD Evidence Storage Building 6,750,000 TBD ERP Replacement 3,000,000 2024 Court Security Upgrade 260,000 2024 Arvada Center Electrical Sign 300,000 2024 City Hall - Xcel Underground 40,000 2024 Bike Fence Activation 12,000 2024 Lake Arbor Improvements 80,000 TBD Standley Lake Lib Trailhead 594,546 2024 Trail Renovation 356,184 Ongoing Gold Strike Pk . 2,172,691 TBD Adams Co . Open Space Sales Tax 325,472 Ongoing
Continuing
Projects
Click here to see the Infrastructure projects
Capital Improvement Projects
Continuing CIP Projects (continued)
182
Project Name 2023 Budget Expected Completion Irrigation Systems 313,245 Ongoing Parks Water Tap Fees 461,228 Ongoing Park Development Fees 2,462,236 Ongoing Holistic Health & Fitness Park 3,532,202 2024 Land Dedication Opt Outs 6,410,843 Ongoing Tree Replacement Program 210,278 Ongoing Memorial Park Lighting (CDBG) 126,000 TBD RMG Trail Crossings 243,000 TBD Playground Renovation 52,692 Ongoing Sabell Park (Dev . Agreement) 1,107,505 2024 Leyden Creek Trail Extension 292,279 TBD Lakecrest Park Playground 210,000 Ongoing CO Front Range Trail Study 50,000 2023 Marge Roberts Park 1,635,185 2023 ADA Compliance Parks 55,111 Ongoing Pomona Bike Park 160,000 TBD Creekside Playground 250,000 TBD McIlvoy Playground 250,000 TBD Robby Ferrufino 250,000 TBD Median Renovation 2023 200,000 Ongoing 66th & Sheridan Land Acq 10,000 2024 2023 Irrigation Improvements 76,219 Ongoing MVNC ADA/Facility Repair 224,109 2024 Majestic View Classroom Space 250,000 2024 Lake Arbor Community Pool 506,179 TBD Tree Planting 30,000 Ongoing Danny Kendrick East Playground 400,000 TBD Hillside Park Playground 200,000 TBD Missing Sidewalks 2,286,511 Ongoing Guardrails-Revolving 552,186 Ongoing Ralston Rd Reconst-Upham2Yukon 5,496,776 2023 ADA Compliance Streets 867,524 Ongoing Collector Streets Improvmt .Rev 209,221 Ongoing W 60th Ave (Adams County) 1,125,779 2024 Streets Master Plan 300,365 2024
Capital Improvement Projects
Continuing CIP Projects (continued)
183
Project Name 2023 Budget Expected Completion Alkire @ 77th Sidewalks 502,164 TBD Leyden Rd Improvements 473,166 Ongoing Ralston Road 4,498,000 2023 72nd & Indiana Final Imprv 146,198 2023 Leyden Road Study 600,000 2023 Ward Road TOD 2,192,305 2023 Alkire St Bridge @HL Canal 29,747 2023 Grandview Guardrails 40,578 Ongoing 72nd Avenue - Sunrise Village 37,000 2023 Bridge and Structures Program 1,304,176 Ongoing ADA Ramp Program 50,000 Ongoing 2023 Missing Sidewalks 2,500 Ongoing Bridge Repair/Maint/Signs 2023 73,680 Ongoing Grandview Sign Modifications 16,570 2024 Pierce Sidewalk (SRTS Grant) 806,565 TBD AFON Fiber Project - Recurring 374,785 Ongoing AFON Co-Locate Project 227,385 Ongoing AFON Fiber Project 2,471,726 Ongoing AFON 2023 151,623 Ongoing Adams Co Transportation Tax 640,466 Ongoing Vehicle Detection Program 239,863 Ongoing Sign Replacements - MUTCD 140,277 Ongoing Tennyson Corridor (ADCO Grant) 2,739,790 2024 Olde Town Street Ltg Phase II 513,937 TBD Candelas Lighting 25,023 2023 Xcel Undergrounding Supplement 304,023 Ongoing Misc Signal Rebuild-Revolving 275,000 Ongoing Traffic Signal Replacement 3,858,236 Ongoing 58th & Indep. (HSIP1 Grant) 1,028,194 2024 86th & Kipling (HSIP1 Grant) 790,425 2024 64th & Simms (HSIP3 Grant) 1,198,625 2024 58th & Kipling (HSIP2 Grant) 961,017 2024 80th & Vance (HSIP3 Grant) 864,000 2024 W 80th Ave Signal 600,000 TBD Intersection Safety Improvmnts 68,000 Ongoing
Capital Improvement Projects
Continuing CIP Projects (continued)
184
Project Name 2023 Budget Expected Completion 58th/Ward Rd LT Lanes (HSIP) 2,225,386 2024 W 52nd Ave Sidewalk 21,750 2024 Alkire St Trail (TAP Grant) 1,500,000 2024 Transportation Master Plan 940,829 2024 Indiana Corridor 274,000 TBD Signal Interconnect 250,000 Ongoing Signal Timing Implementation 203,204 Ongoing School Safety 182,481 Ongoing Marshall St Intersection Imp 29,783 2024 W 59th Pl and Kipling Pkwy Imp 46,706 2024 86th Parkway Signal Connect 854,184 TBD Kipling Pkwy & Allendale 670,962 2024 Ralston & Rensselaer Imp 500,000 TBD 58th Pl/Indep ADA Improvement 106,460 TBD 63rd & McIntyre RRFB 206,459 2024 Dev Fees for Transportation 4,001,031 Ongoing Developer Fees for Signals 1,056,317 Ongoing Traffic Impact Fees - Leyden 4,320,341 Ongoing Little Dry Crk Trail Study 100,000 TBD Leyden Emergency Prepare Study 50,000 2024 W 92nd Dr & Candelas Pkwy 175,000 TBD Ralston Yukon-Garrison (Bond) 18,793,575 2023 72nd Ave Underpass (Bond) 64,537,000 2025 Meyers Pool 35,210,000 2024 Tower at 68th and Dover 700,000 TBD 2021 Water Replacement 391,816 2023 2022 Water Replacement 2,145,477 2023 2023 Water Replacement 3,627,684 2024 Ralston Ck @ Croke Xing 1,325,000 2023 MHFD Joint MP Studies 529,157 Ongoing Lake Arbor Dredging 4,916,133 2023 Arvada Ctr Sthrn Det Pnd Outlt 54,340 TBD Ralston Creek at Ward Road 750,000 2023 Bates Lake 3,237 TBD MHFD Joint Maintenance 55,456 Ongoing VanBibber 425,000 2026
Capital Improvement Projects
Continuing CIP Projects (continued)
185
Project Name 2023 Budget Expected Completion Drainage Improvement Projects 1,678,243 Ongoing Ralston Creek Improvements 180,000 2026 NTL Improvements Phase I 1,000,000 TBD NSTL 61st & Tennyson (Bond) 5,250,000 2024 NTSI W 81 & Teller-W 72 & Sher 950,000 2025 NTSI - W 81 Oak to Johnson 1,950,000 2024 NTSL 81st & Kipling (Bond) 1,887,803 2023 RTSI - Simms to Pierson (CRT7) 400,000 2024 RTSI - CRT6 (Bond) 7,797,427 2024 Sewer Syst Replacement (Bond) 750,000 Ongoing 2022 Wastewater CIPP Project 2,923,278 2024 Alkire Lift Station 2,648,775 2025 RWTP Handlng & Filter Improv 21,405,284 Ongoing 2023 Water Replacement (Bond) 4,500,000 2024 Smart Meter Upgrades (Bond) 2,100,000 2024 Corrosion Control&SVC Line Rep 230,000 Ongoing 2021 Water Replacement - Bond 2,564,427 2024 Denver Water Moffat Project 61,920,438 2027 Castlegate Water Line 1,470,604 2024 RWTP Reaction Tank Rehab 374,055 2024 AWTP Clarifier Rehab 1,020,281 TBD Exp & Repl. Treatment Study 600,000 2024 RWTP Engineering&Reinvestment 49,500 TBD Chemical System Improvement 250,000 2026 Canyon Pines Pump Station 6,465,795 2024 Pumped Zones Storage Tank 6,250,000 2024 Pumped Zones Pump Station 6,250,000 2024 Hydraulic Modeling 226,315 Ongoing WTP Roof Replacement 504,000 2023 Imp Disinfection Infrstructure 230,744 2025 WTP Replace & Expans 1,000,000 Ongoing Water Resources Master Plan 250,000 Ongoing Water Distr System Upgrades 541,216 Ongoing Zone 5 Purple Pine/Indy 1,268,000 2024 Distr Syst Storage/Pump/Pipe 6,050,000 TBD UT Comm Strategic Plan 60,000 2024
Intentionally left blank
186 Capital Improvement Projects
Capital Improvement Projects
The 2023-2032 Capital Improvement Program
The following table displays the City’s full 2023-2032 capital improvement program . Funding is summarized by source Expenditures are summarized by category of spending
187
Sources Existing 2023 2024 2025 2026 2027 §98-101 $ $5,217,762 $6,026,157 $5,707,668 $6,356,128 $6,637,047 $6,912,632 Other City $ 46,594,339 48,696,589 56,038,382 67,596,904 41,567,571 45,045,745 External $ 66,848,853 41,706,287 34,138,132 15,477,572 1,717,160 3,394,898 Total Sources $118,660,954 $96,429,033 $95,884,182 $89,430,604 $49,921,778 $55,353,275 Total Uses Existing 2023 2024 2025 2026 2027 Debt Service $- $7,774,157 $7,773,125 $7,333,515 $7,331,876 $7,335,333 Personnel - 123,446 130,850 137,308 144,086 150,563 General Administration 2,493,828 12,252,161 24,312,100 666,695 676,572 662,756 Transportation 333,141 9,629,932 5,405,841 3,911,597 3,962,045 4,109,352 Street Maintenance - 12,763,701 13,349,576 13,799,864 14,165,401 14,540,936 Parks and Golf 3,861,416 3,447,297 1,741,696 1,732,539 1,995,616 2,158,972 Water 42,645,438 58,462,387 41,962,040 54,243,081 29,954,343 26,919,164 Wastewater - 10,787,631 37,968,000 16,395,000 9,881,000 5,282,667 Stormwater - 685,304 918,982 4,084,662 3,735,446 1,566,859 Total Uses $49,333,823 $115,926,016 $133,562,210 $102,304,261 $71,846,385 $62,726,602 Sources 2028 2029 2030 2031 2032 2023-2032 Total §98-101 $ $6,914,321 $7,351,799 $7,641,293 $7,864,610 $8,094,300 $74,723,717 Other City $ 56,219,398 36,421,614 30,650,728 31,279,684 31,974,182 492,085,136 External $ 2,736,788 230,833 233,038 6,576,707 42,067,048 215,127,316 Total Sources $65,870,507 $44,004,246 $38,525,059 $45,721,001 $82,135,530 $781,936,169 Total Uses 2028 2029 2030 2031 2032 2023-2032 Total Debt Service $7,334,056 $7,334,282 $7,336,744 $7,337,244 $7,338,981 $36,681,307 Personnel 157,280 163,937 170,468 174,162 177,638 1,529,738 General Administration 665,222 712,291 750,176 699,230 656,228 44,547,259 Transportation 4,258,078 5,103,322 5,309,886 5,443,681 5,581,492 53,048,366 Street Maintenance 14,698,026 14,930,917 15,366,855 15,815,489 16,277,190 145,707,955 Parks and Golf 2,228,352 2,009,354 2,069,635 2,131,724 2,195,676 21,710,861 Water 38,230,880 17,842,831 11,455,021 14,473,672 56,842,883 393,031,741 Wastewater 4,672,667 2,216,667 2,271,667 2,329,667 2,390,667 94,195,633 Stormwater 993,619 1,098,598 1,214,606 1,308,000 1,450,000 17,056,076 Total Uses $73,238,181 $51,412,199 $45,945,058 $49,712,869 $92,910,755 $807,508,937
Capital Improvement Projects
2023-2024 Capital Expenditure Detail
The following table details the City’s 2023 capital expenditures by project . Capital expenditures are presented in major categories with the sources of funding shown for each project
2023 Capital Expenditures
* Denotes nonrecurring capital expenditures
188
Project 98-101 $ Other City $ External $ 2023 Total Debt Service Estimated Debt Service $7,741,500 $- $- $7,741,500 Personnel Engineering Salary Placeholder $123,446 $- $- $123,446 General Administration Aquatics Center $356,172 $- $- $356,172 Arvada Fiber Optic Network 245,975 - - 245,975 Public Art 106,121 - - 106,121 ADA Compliance - Facilities 200,000 - - 200,000 PEG Cable Fees - - 106,604 106,604 Public Safety Evidence Storage Building - 6,000,000 - 6,000,000 Indiana Gate 288,500 - - 288,500 Transportation Adams County Transportation Projects $- $- $80,635 $80,635 Bike Master Plan Implementation 50,000 - - 50,000 Bridge Repair 250,000 - - 250,000 Collector Street Improvements 67,196 - - 67,196 Guardrails 59,851 - - 59,851 Intersection Safety Improvements 100,794 - - 100,794 School Safety 26,878 - - 26,878 Sidewalks/TOD/Bike & Trail Gaps 700,000 - - 700,000 Traffic Signals 1,166,805 - - 1,166,805 Xcel Energy Undergrounding Fund Supplement 59,703 - - 59,703 Signal Interconnect 250,000 - - 250,000 Signal Timing Implementation 203,204 - - 203,204 Transportation Master Plan Implementation 300,000 - - 300,000 Street Maintenance Asphalt and Concrete Replacement $- $11,954,121 $- 11,954,121 ADA Compliance - Streets 689,580 - - 689,580 Parks Adams County Open Space Projects $- $- $33,598 $33,598 Holistic Health and Fitness Park - - 2,233,023 2,233,023 ADA Compliance - Parks 53,000 - - 53,000 Irrigation Systems - 171,054 - 171,054 Park Water Tap Fees - 174,690 - 174,690 Playground Renovation 494,577 - - 494,577 Trail Renovation 67,196 - - 67,196 Tree Replacement Program 20,159 - - 20,159 Median Rennovations 200,000 - - 200,000
Capital Improvement Projects
2023 Capital Expenditures (continued)
* Denotes nonrecurring capital expenditures
189
Project 98-101 $ Other City $ External $ 2023 Total Water Denver Water Moffat Project Participation $- $20,000,000 $- $20,000,000 Water Distribution System Upgrades - 541,216 - 541,216 Water System Replacement (Operations) - - 8,100,000 8,100,000 Distribution System Storage/Pumping/Pipe Expansion (additional water system upgrades) - - 6,050,000 6,050,000 Hydraulic Modeling - 50,000 - 50,000 Lead and Copper Corrosion Control and Service Line Replacement - 230,000 - 230,000 Pumped Zones Pump Station - 6,000,000 - 6,000,000 Pumped Zones Storage Tank - - 6,000,000 6,000,000 Smart Meter Upgrades - - 4,100,000 4,100,000 Water Resources Master Plan - 250,000 - 250,000 Water Treatment Plant Repair Program - 500,000 - 500,000 Water Treatment Plant Replacement and Expansion - 1,000,000 - 1,000,000 Wastewater Infiltration Elimination Program $- $450,204 $- $450,204 Sewer System Replacement (Operations) - 750,000 - 750,000 Alkire Force Mains - - 200,000 200,000 North Trunk Sewer Improvements - W. 81st & Teller to W. 72nd & Sheridan (NT7) - - 950,000 950,000 Ralston Trunk Sewer Improvements - Simms to Pierson (CRT7) - - 400,000 400,000 Ralston Trunk Sewer Improvements - W 69th from Coors to Urban (CRT 6) - - 7,797,427 7,797,427 Stormwater Mile High Flood District Joint Maintenance Projects $- $28,138 $- $28,138 Mile High Flood District Joint Master Plan Studies - 59,703 - 59,703 Ralston Creek Improvements - Vance Street to Wadsworth ByPass - - 180,000 180,000 Van Bibber Creek from Oak St to Kipling Pkwy - - 225,000 225,000 Drainage Improvement Projects - 537,464 - 537,464 Grand Total $13,820,657 $48,696,589 $36,456,287 $98,973,533
Capital Improvement Projects
2023-2024 Capital Expenditure Detail
The following table details the City’s 2024 capital expenditures by project . Capital expenditures are presented in major categories with the sources of funding shown for each project .
2024 Capital Expenditures
* Denotes nonrecurring capital expenditures
190
Project 98-101 $ Other City $ External $ 2024 Total Debt Service Estimated Debt Service $7,773,125 $- $- $7,773,125 Personnel Engineering Salary Placeholder $130,850 $- $- $130,850 General Administration Arvada Fiber Optic Network 253,354 - - 253,354 Public Art 107,182 - - 107,182 ADA Compliance - Facilities 200,000 - - 200,000 PEG Cable Fees - - 104,472 104,472 Transportation Adams County Transportation Projects $- $- $83,054 $83,054 Bridge Repair 250,000 - - 250,000 Collector Street Improvements 69,212 - - 69,212 Guardrails 60,747 - - 60,747 Intersection Safety Improvements 103,818 - - 103,818 School Safety 27,685 - - 27,685 Sidewalks/TOD/Bike & Trail Gaps 700,000 - - 700,000 Traffic Signals 1,201,810 - - 1,201,810 Xcel Energy Undergrounding Fund Supplement 61,494 - - 61,494 Indiana Corridor Improvement Study - - 200,000 200,000 Signal Interconnect 250,000 - - 250,000 Signal Timing Implementation 154,800 - - 154,800 Transportation Master Plan Implementation 300,000 - - 300,000 Citywide Survey Datum Update 55,000 - - 55,000 Street Maintenance Asphalt and Concrete Replacement $- $12,864,244 $- 12,864,244 ADA Compliance - Streets 485,332 - - 485,332 Parks Adams County Open Space Projects $- $- $34,606 $34,606 ADA Compliance - Parks 54,590 - - 54,590 Irrigation Systems 500,000 176,185 - 676,185 Park Water Tap Fees - 179,931 - 179,931 Playground Renovation 500,408 - - 500,408 Trail Renovation 69,212 - - 69,212 Tree Replacement Program 20,764 - - 20,764 Median Rennovations 206,000 - - 206,000
Capital Improvement Projects
2024 Capital Expenditures (continued)
* Denotes nonrecurring capital expenditures
191
Project 98-101 $ Other City $ External $ 2024 Total Water Denver Water Moffat Project Participation $- $25,040,000 $- $25,040,000 Water Distribution System Upgrades - 552,040 - 552,040 Water System Replacement (Operations) - 8,300,000 - 8,300,000 Chemical System Improvement - 120,000 - 120,000 Distribution System Master Plan Update - 400,000 - 400,000 Hydraulic Modeling - 50,000 - 50,000 Lead and Copper Corrosion Control and Service Line Replacement - 1,300,000 - 1,300,000 Pumped Zones Storage Tank - - 1,350,000 1,350,000 Risk and Resiliency Assessment / Emergency Response Plan Updates - 100,000 - 100,000 Sliplining of 54" Transmission Main - 1,100,000 - 1,100,000 Smart Meter Upgrades - 2,900,000 - 2,900,000 Water Treatment Plant Repair Program - 570,000 - 570,000 Wastewater Infiltration Elimination Program $- $230,000 $- $230,000 Sewer System Replacement (Operations) - 862,000 - 862,000 Alkire Force Mains - - 2,000,000 2,000,000 North Trunk Sewer Improvements - 68th & Sheridan to Tennyson & W. 64th (NT8) - - 600,000 600,000 North Trunk Sewer Improvements - W. 81st & Teller to W. 72nd & Sheridan (NT7) - - 15,276,000 15,276,000 North Trunk Sewer Improvements - W . 84th from Alkire to Simms (NT2) - - 400,000 400,000 Ralston Trunk Sewer Improvements - Simms to Pierson (CRT7) - - 3,200,000 3,200,000 Stormwater Bates Lake Watershed Drainage Improvements $- $105,000 $- $105,000 Mile High Flood District Joint Maintenance Projects - 28,982 - 28,982 Mile High Flood District Joint Master Plan Studies - 65,000 - 65,000 Ralston Creek Improvements - Vance Street to Wadsworth ByPass - 20,000 - 20,000 Van Bibber Creek from Oak St to Kipling Pkwy - 500,000 500,000 1,000,000 Drainage Improvement Projects - 575,000 - 575,000 Grand Total $13,535,383 $56,038,382 $23,748,132 $93,321,897
Capital Improvement Projects
Operating Impact
The City’s operating budget is directly affected by the CIP. When certain types of capital projects are developed and completed, they also have ongoing financial impacts. For example, if the City were to construct a new building, the operating budget would increase to include capacity for any new equipment, utilities, and supplies needed to operate and maintain the facility. Park maintenance staff might be added when a new park is completed Likewise, operating costs can decrease with certain capital improvement For example, repair and maintenance costs could go down with the replacement of an aging traffic signal.
In the 2023-2032 Capital Improvement Program, each individual project includes an estimated future operating budget impact, if it is possible to identify the cost at this time in the project’s lifecycle The City carefully considers these operating costs when deciding which projects to move forward in the CIP.
The following table summarizes the quantifiable projected annual impact of the FY 2023-2024 CIP on the City’s operating budget:
192
Project Operating Impact Annual Cost Annual Savings Arvada Fiber Optic Network Operational cost to maintain OSP Insight software, used to document the fiber cable and fiber strand allocation $10,000 $Gold Strike Park Operating cost for Gold Stike Park 25,000Holistic Health and Fitness Park Operating cost for Holistic Health and Fitness Park 8,000Citywide Survey Datum Update Operating and maintenance cost - 20,000
Capital Improvement Projects
2025-2032 Governmental Capital Expenditure Detail
The planned capital expenditures from 2025 to 2032 are shown in the chart below . Some of the larger projects that make up these expenditures include:
General Administration
Arvada Fiber Optic Network - $2,320,497
ADA Compliance for Facilities - $1,618,180
Public Art - $911,988
Transportation
Arterial Improvements - $7,249,289
Bridge Repair - $2,022,725
Sidewalks/TOD/Bike & Trail Gaps - $5,728,539
Signal Interconnect - $2,022,725
Signal Timing Implementation - $1,001,920
Traffic Signals - $12,661,191
Transportation Master Plan - $2,279,552
Parks
Irrigations System Renovations - $3,659,605
Median Renovations - $1,886,776
Park Water Tap Fee - $1,648,006
Playground Renovations - $7,686,434
Trail Renovation - $633,915
Water
Denver Water Moffat Project - $51,280,000
Distribution System Expansion - $18,000,000
Highway 93 Lakes Water Storage Project - $20,500,000
Ralston Plant Storage Tank Expansion - $48,350,000
Smart Meter Upgrades - $2,900,000
Water Distribution System Upgrades - $4,851,871
Water System Replacement - $76,600,002
Water Treatment Plant Repair Program - $6,600,000
Wastewater
Central Trunk Line - $5,967,000
Infiltration Elimination Program - $4,790,002
Oversizing of Replacement Pipelines - $3,390,000
North Trunk Line Replacement - $14,150,000
Ralston Trunk Line Replacement - $8,500,000
Sewer System Replacement - $8,643,000
Stormwater
Bates Lake Watershed Improvements - $1,555,000
Drainage Improvement Projects - $7,673,000
Ralston Creek Improvements - $1,724,000
Van Bibber Creek - $2,000,000
2025-2032 Expenditures
193
General Administration 1% $5,435,051 Parks 4% $16,521,867 Stormwater 3% $13,795,090 Transportation 8% $37,807,991 Wastewater 10% $45,440,002 Water 49% $231,591,875 Personnel <1% $1,275,442 Street Maintenance 25% $119,594,677
Capital Improvement Projects
2023-2032 Individual Project Sheets
Each project included in the 2023-2032 Capital Improvement Plan is presented on a separate sheet within the following program areas: General Administration, Transportation, Street Maintenance, Parks and Golf, Water, Wastewater, and Stormwater . Each project sheet contains a description, picture, project justification, strategic plan alignment, project funding source details, anticipated uses of funds, expected timeline, and operating impact
194
Capital Improvement Projects
General Administration Overview
The General Administration category includes items such as public art, the Arvada Fiber Optic Network project, and the construction, expansion, or replacement of existing facilities. From 2022-2030, the City has set aside $31.5 million for debt service for the construction of an aquatics center to replace the George Meyers Pool, $2.7 million for the fiber optic network, and $1.6 million for ADA improvements to City facilities.
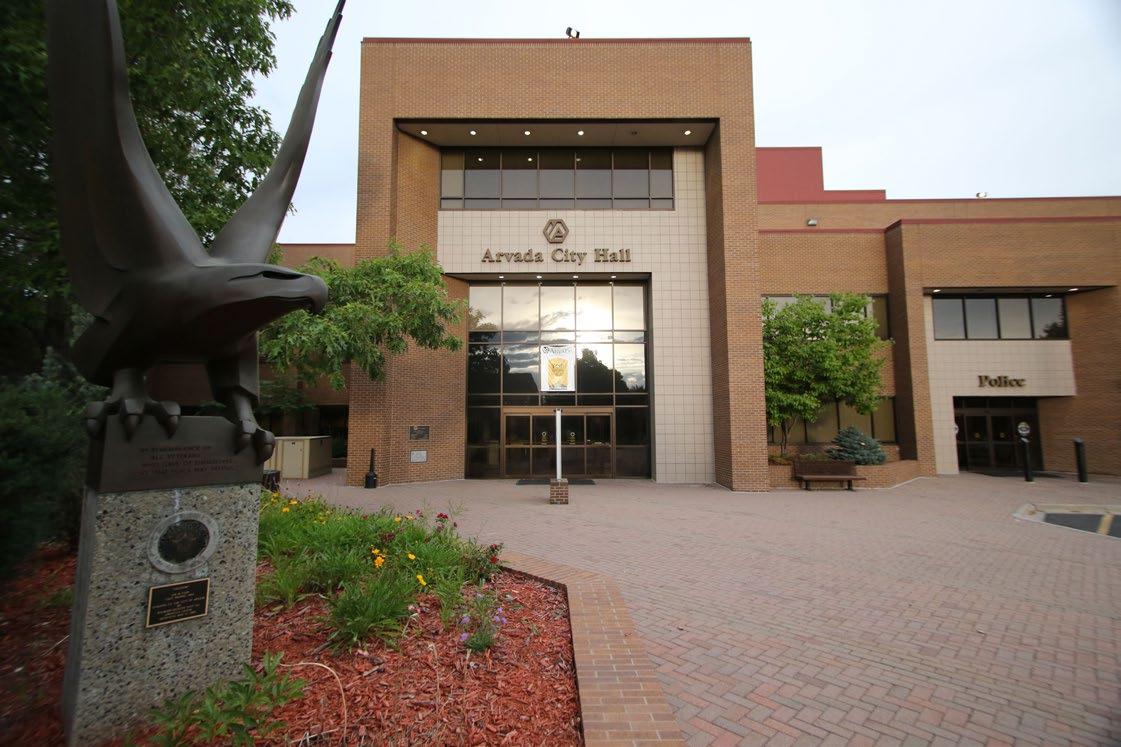
Summary of General Administration Sources
Summary of General Administration Uses
195
Uses Existing 2023 2024 2025 2026 2027 2028-2032 Total Design $646,640 $955,783 - - - - - $1,602,423 Acquisition - 106,121 107,182 108,254 109,337 110,430 583,967 1,125,291 Construction 1,847,188 11,190,257 24,204,918 558,441 567,235 552,326 2,899,180 41,819,545 Total Uses $2,493,828 $12,252,161 $24,312,100 $666,695 $676,572 $662,756 $3,483,147 $44,547,259 Sources Existing 2023 2024 2025 2026 2027 2028-2032 Total 98-101 $ $1,163,828 $1,196,768 $560,536 $569,209 $578,120 $587,277 $3,116,059 $7,771,797 Other City $ 750,000 6,000,000 - - - - - 6,750,000 External $ 36,263,529 106,604 104,472 102,382 100,335 98,328 283,341 37,058,991 Total Sources $38,177,357 $7,303,372 $665,008 $671,591 $678,455 $685,605 $3,399,400 $51,580,788
Capital Improvement Projects General Administration
#.04 Trolley Park Description
This historic restoration project involves the creation of a permanent interpretive display for the #.04 streetcar. The display will include a covered structure to protect the trolley from rain and sun and it will be integrated into Olde Town as a public amenity with historical significance. Site improvements will include benches, interpretive signage, brick pavers around the installation, and additional landscaping improvements to create a destination setting.
Project Justification
The #.04 streetcar is significant to Arvada as it provided transit service to downtown Denver for decades along route 84. It is the last Denver tramway car in restorable condition and the last to run on the system before its closure in 1950. It is listed on the Colorado State Register of Historic Places.
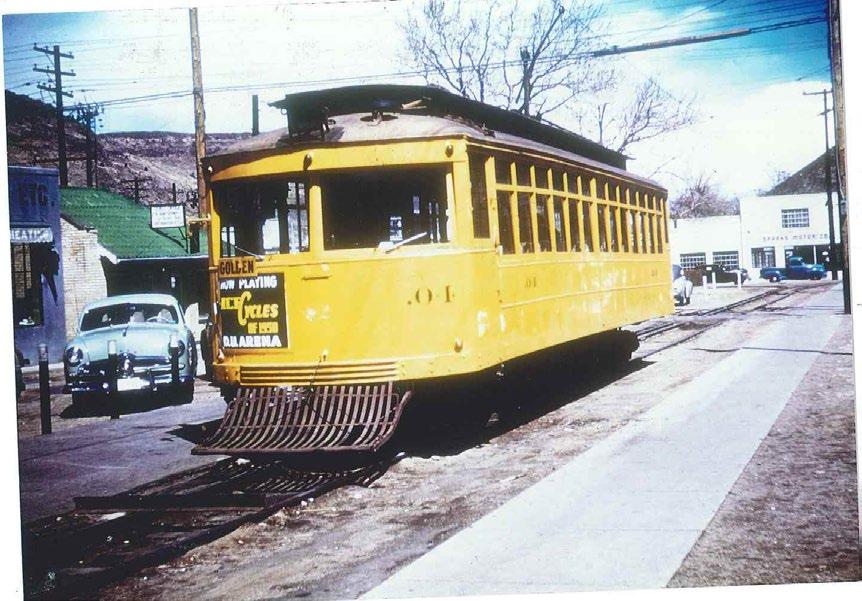
Strategic Plan Alignment
Strategic Priority: Vibrant Community and Neighborhoods
A vibrant community is engaged in civic life, the arts, and the outdoors. It comprises individuals and groups who are dedicated to their community, get involved with neighborhood associations, and participate with local government to ensure responsiveness to changing needs, resulting in Arvada being the preferred place to live, work, play, and stay.
Project Funding
Strategic Principle: Provides meaningful ways for the community to engage with local government and strategic partnerships to advance quality of life by embracing both Arvada’s small town traditions and history and changing to achieve an inclusive, equitable, diverse, prosperous, and resilient community that cares about its neighbors
This project is primarily funded by $460,000 from the Arvada Urban Renewal Authority. Depending on final design, existing capital dollars may be reallocated to this project.
Project Cost Estimate and Timeline
This project is pending final site approval.
Operating Cost Impact
There will be ongoing maintenance costs for this project which will be absorbed by the Parks Maintenance budget.
196
Uses Existing 2023-2032 Project Total Design $46,640 $- $46,640 Acquisition - -Construction 433,360 - 433,360 Total Uses $480,000 $- $480,000
Timeline Start Completion Design 2021 2021 Acquisition Construction TBD TBD Sources Existing 2023 2024 2025 2026 2027 2028-2032 Project Total 98-101 $ $20,000 $- $- $- $- $- $- $20,000 Other City $ - - - - - - -External $ 460,000 - - - - - - 460,000 Total Sources $480,000 $- $- $- $- $- $- $480,000
Capital Improvement Projects General Administration
ADA Compliance - Facilities Description
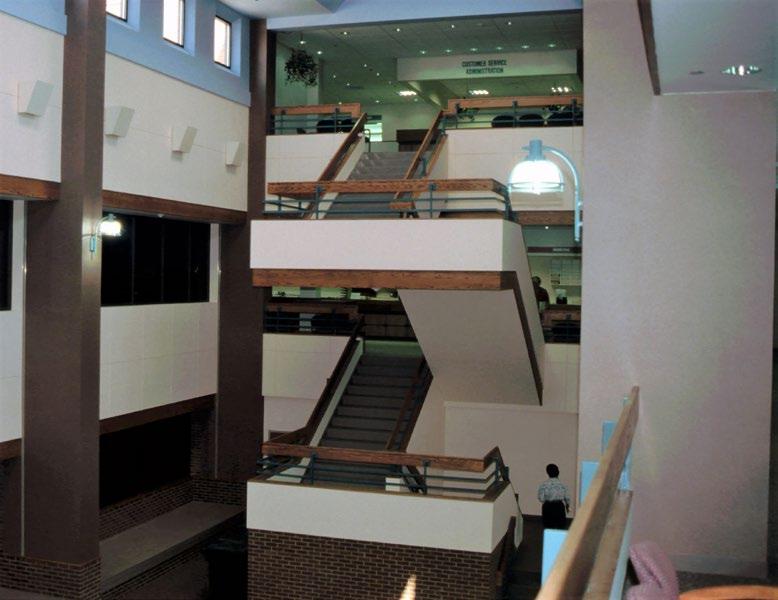
Title II of the Americans with Disabilities Act (ADA) requires that when viewed in their entirety, City services, programs, and activities are accessible to and usable by people with disabilities. This funding will be used to complete high priority projects identified by the ADA transition plan as barriers to program accessibility in City facilities.
Project Justification
The ADA Transition Plan completed in 2021 outlines best practices to ensure accessibility of City facilities and programs to individuals with disabilities. In addition, the project is needed to meet federal law compliance under the ADA title II. There is potential risk of DOJ assessment of the City’s ADA program and subsequent settlement agreement negotiations. Implementation of the transition plan will lower the City’s risk of a DOJ assessment.
Strategic Plan Alignment
Strategic Priority: Infrastructure
The community depends on a well-maintained foundation of streets, sidewalks, and water, wastewater and stormwater facilities. Planned and steady population growth requires proper maintenance of existing infrastructure and additional capacity to support a thriving community.
Project Funding
Strategic Principle:
Offers services focused on safe and environmentally-efficient City facilities and fleet vehicles to ensure the most efficient and maximum usage of valued assets.
This project provides ongoing funding for continuous ADA improvement, but there is an unmet need to reach full compliance with the federal requirement.
Project Cost Estimate and Timeline
This is an ongoing project. The funding will be utilized as particular needs are identified.
Operating Cost Impact
There is no operating cost impact associated with this project.
197
Uses 2023 2024 2025 2026 2027 2028-2032 10-Year Total Design $- $- $- $- $- $- $Acquisition - - - - - -Construction 200,000 200,000 200,000 200,000 200,000 1,018,180 2,018,180 Total Uses $200,000 $200,000 $200,000 $200,000 $200,000 $1,018,180 $2,018,180
Sources 2023 2024 2025 2026 2027 2028-2032 10-Year Total 98-101 $ $200,000 $200,000 $200,000 $200,000 $200,000 $1,018,180 $2,018,180 Other City $ - - - - - -External $ - - - - - -Total Sources $200,000 $200,000 $200,000 $200,000 $200,000 $1,018,180 $2,018,180
Capital Improvement Projects General Administration
Aquatics Center Description
These funds establish the required capital maintenance fund for the George Meyers Pool replacement facility.
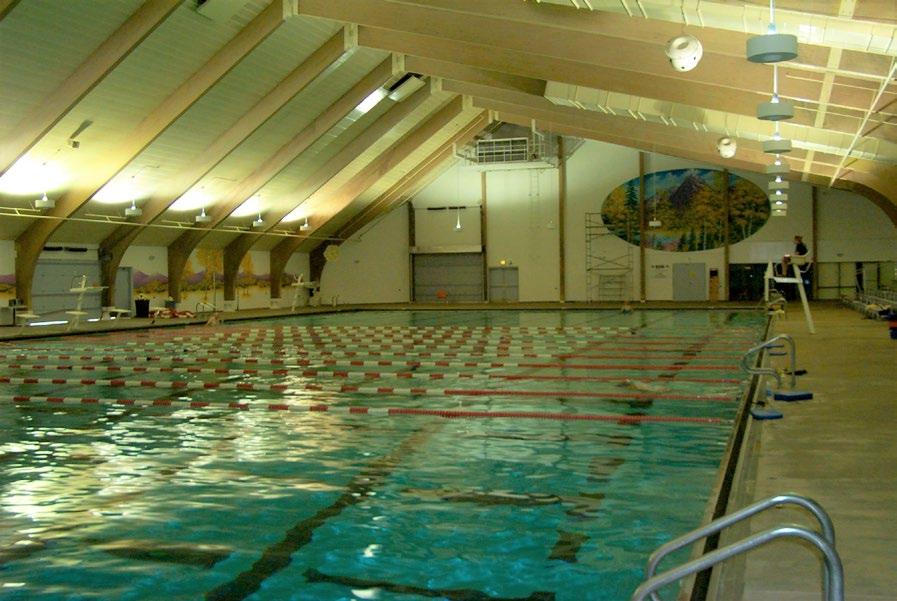
Project Justification
The George Meyers Pool and building has reached the end of its useful life.
Strategic Plan Alignment
Strategic Priority: Vibrant Community and Neighborhoods
A vibrant community is engaged in civic life, the arts, and the outdoors. It comprises individuals and groups who are dedicated to their community, get involved with neighborhood associations, and participate with local government to ensure responsiveness to changing needs, resulting in Arvada being the preferred place to live, work, play, and stay.
Project Funding
Strategic Principle: Provides meaningful ways for the community to engage with local government and strategic partnerships to advance quality of life by embracing both Arvada’s small town traditions and history and changing to achieve an inclusive, equitable, diverse, prosperous, and resilient community that cares about its neighbors
Costs will be shared between Arvada, JeffCo Public Schools, and the Apex Park and Recreation District. The funding identified below reflects the City’s share of the capital maintenance fund.
Project Cost Estimate and Timeline
While the project design and construction timeline are in the planning phase, establishing the required capital maintenance fund is ongoing.
Operating Cost Impact
According to the Intergovernmental Agreement (IGA), Arvada will take the lead in construction of the new facility. The operating cost is not yet known. An ongoing capital maintenance budget shared by all three entities has been established in the IGA.
198
Sources Existing 2023 2024 2025 2026 2027 2028-2032 Project Total 98-101 $ $1,143,828 $356,172 $- $- $- $- $- $1,500,000 Other City $ - - - - - - -External $ - - - - - - -Total Sources $1,143,828 $356,172 $- $- $- $- $- $1,500,000 Sources Existing 2023 2024 2025 2026 2027 2028-2032 Project Total Design $- $- $- $- $- $- $- $Acquisition - - - - - - -Construction 1,143,828 356,172 - - - - - 1,500,000 Total Sources $1,143,828 $356,172 $- $- $- $- $- $1,500,000
Capital Improvement Projects General Administration
Arvada Fiber Optic Network Description
Arvada Fiber Optic Network (AFON) is a backbone fiber network which will allow City facilities, Jefferson County Public Schools, and the Arvada Fire Protection District to have lateral network connections to Information Communication and Technology assets. AFON will not only provide a high-speed communication network linking current City assets distributed throughout the City but will position the City to undertake yet unforeseen technology improvements that will benefit the City and its citizens.
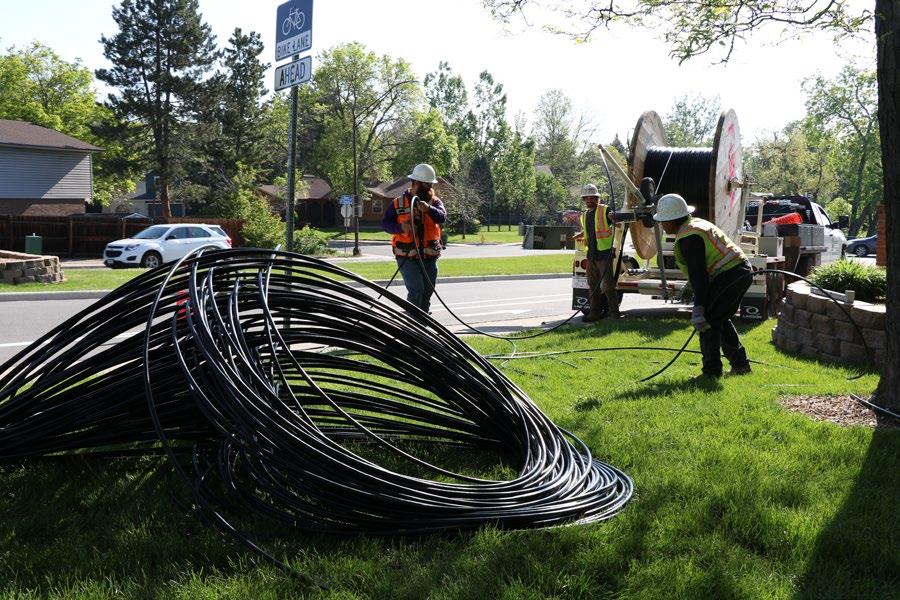
Project Justification
Due to the longevity of fiber optic cable, this project will prepare the City for other opportunities that may arise over the next 30 years. Such initiatives may include improvements in public safety, traffic management, economic development opportunities, and Smart Community initiatives.
Strategic Plan Alignment
Strategic Priority: Infrastructure
The community depends on a well-maintained foundation of streets, sidewalks, and water, wastewater and stormwater facilities. Planned and steady population growth requires proper maintenance of existing infrastructure and additional capacity to support a thriving community.
Project Funding
Strategic Principle:
Maintains existing roads and transportation network in tandem with snow and ice control services to ensure swift and safe transportation modes for the community.
Additional funding has come from Arvada Fire Protection District and Jeffco Schools. Over $500,000 has been contributed as of 2019 from those two entities. Other opportunities include grants related to public safety and traffic management.
Project Cost Estimate and Timeline
As of January 2020, about 68% of the master plan conduit is installed. The initial plan will take the next 3 to 5 years to complete. The changing needs of the City will generate other opportunities to expand the conduit network and install additional fiber cable.
Operating Cost Impact
Operational funding will be used for the cost to maintain OSP Insight software, about $10,000 a year. This software is used to document the fiber cable and fiber strand allocation.
199
Uses 2023 2024 2025 2026 2027 2028-2032 10-Year Total Design $- $- $- $- $- $- $Acquisition - - - - - -Construction 245,975 253,354 260,955 268,783 276,847 1,513,912 2,819,826 Total Uses $245,975 $253,354 $260,955 $268,783 $276,847 $1,513,912 $2,819,826
Sources 2023 2024 2025 2026 2027 2028-2032 10-Year Total 98-101 $ $245,975 $253,354 $260,955 $268,783 $276,847 $1,513,912 $2,819,826 Other City $ - - - - - -External $ - - - - - -Total Sources $245,975 $253,354 $260,955 $268,783 $276,847 $1,513,912 $2,819,826
Capital Improvement Projects General Administration
Indiana Gate Description
Upgrade the security gate at the Indiana Shops so that it meets the daily operational and security needs of the site. The new gate will be bi-directional with a faster bi-fold opiating gate utilizing Radio Frequency Identification (RFID) technology for security clearance.
Project Justification
Strategic Plan Alignment
Strategic Priority: Infrastructure
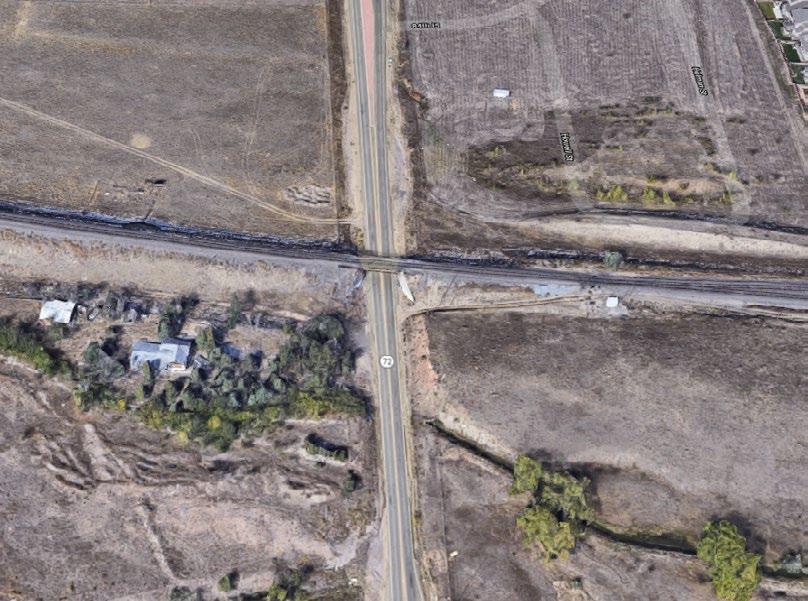
The community depends on a well-maintained foundation of streets, sidewalks, and water, wastewater and stormwater facilities. Planned and steady population growth requires proper maintenance of existing infrastructure and additional capacity to support a thriving community.
Project Funding
Strategic Principle: Offers services focused on safe and environmentally-efficient City facilities and fleet vehicles to ensure the most efficient and maximum usage of valued assets.
Project Cost Estimate and Timeline
This project is expected to be complete by 2024.
Timeline Start Completion Design 2021 2021 Acquisition Construction 2023 2024 Sources Existing 2023 2024 2025 2026 2027 2028-2032 Project Total 98-101 $ $- $288,500 $- $- $- $- $- $288,500 Other City $ - - - - - - -External $ - - - - - - -Total Sources $- $288,500 $- $- $- $- $- $288,500
$- $- $-
Operating Cost Impact
200
Uses Existing 2023-2032 Project Total Design
Acquisition
There is no operating impact associated with this request. Construction - 288,500 288,500 Total Uses $- $288,500 $288,500
- - -
This project is fully funded.
The current gate is open during business hours. It is not capable of heavy duty operation. The gate prevents access to police evidence, millions of dollars of parts inventories and heavy equipment, fuel station, and multiple outbuildings and storage areas deep in the property.
Capital Improvement Projects General Administration
Meyers Pool Replacement Description
Arvada, Jefferson County School District and APEX Parks and Recreations District have entered into an Intergovernmental Agreement (IGA) to replace and operate a new facility for the George Meyers Pool. Arvada and Jefferson County Schools will fund the construction of new facility 50/50 and have jointing issued Certificates of Participation to fund the construction of the facility. Arvada will own the pool according to the IGA.
Project Justification
The George Meyers Pool is reaching the end of its useful life.
Strategic Plan Alignment
Strategic Priority: Vibrant Community and Neighborhoods
A vibrant community is engaged in civic life, the arts, and the outdoors. It comprises individuals and groups who are dedicated to their community, get involved with neighborhood associations, and participate with local government to ensure responsiveness to changing needs, resulting in Arvada being the preferred place to live, work, play, and stay.
Project Funding
Strategic Principle: Provides meaningful ways for the community to engage with local government and strategic partnerships to advance quality of life by embracing both Arvada’s small town traditions and history and changing to achieve an inclusive, equitable, diverse, prosperous, and resilient community that cares about its neighbors
Arvada and Jefferson County Schools issued Certificates of Participation in 2021 to fund the replacement of the George Meyers Pool.
Project Cost Estimate and Timeline
Project design and construction are expected from 2022 through 2024.
Operating Cost Impact
According to the Intergovernmental Agreement (IGA), APEX will take the lead in operating the new facility. The operating cost is not yet known.
201
Uses Existing 2023-2032 Project Total Design $600,000 $955,783 $1,555,783 Acquisition
Construction - 33,694,217 33,694,217 Total Uses $600,000 $34,650,000 $35,250,000
- - -
Timeline Start Completion Design 2022 2023 Acquisition Construction 2023 2024 Sources Existing 2023 2024 2025 2026 2027 2028-2032 Project Total 98-101 $ $- $- $- $- $- $- $- $Other City $ - - - - - - -External $ 35,250,000 - - - - - - 35,250,000 Total Sources $35,250,000 $- $- $- $- $- $- $35,250,000
Capital Improvement Projects General Administration
PEG Cable Fees Description
The City has franchise agreements with cable providers Comcast and TDS to authorize their use of public rights-of-way and easements. As part of these agreements, these cable providers collect from customers the full amount of Public Education and Government (PEG) fees paid to the City, as authorized by the Federal Cable Act.
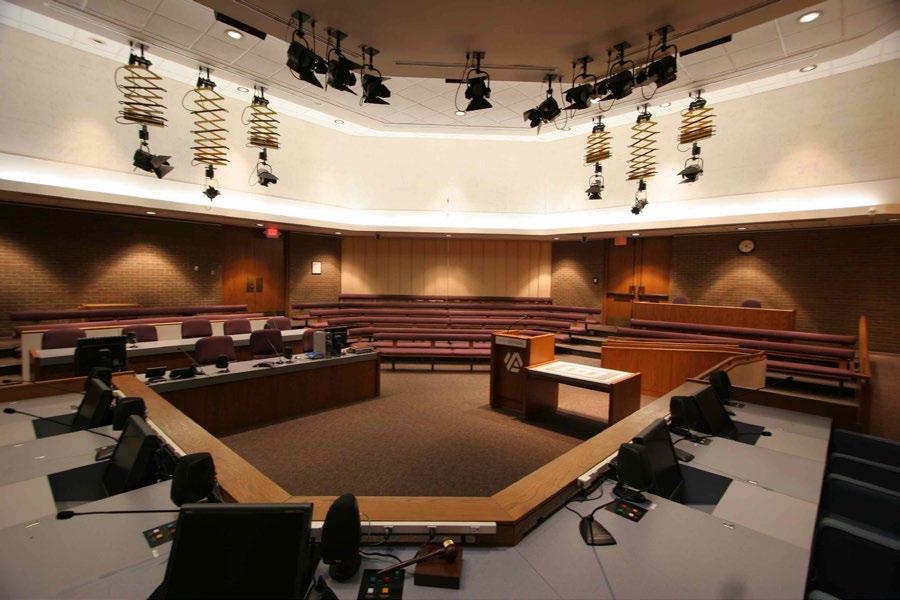
Project Justification
This project will provide the ability to track and monitor revenue and expenses tied to PEG. Residents who subscribe to cable television through Comcast or TDS may view Arvada Channel 8 as part of their programming lineup. Channel 8 may also be streamed live on computers or any mobile device. In addition to City Council meetings, Arvada’s Channel 8 offers hundreds of hours of programming via the City YouTube Channel about City services and the community.
Strategic Plan Alignment
Strategic Priority: Organizational and Service Effectiveness
The community depends on a well-managed, fiscally-responsible and transparent City government to guide the organization in a manner that enhances quality of life. Performance-based management practices, sustainable levels of resource use, efficient application of technology, a highperforming workforce, and legal and ethical compliance will ensure the longterm credibility and effectiveness of the City government.
Project Funding
Strategic Principle: Provides multiple information platforms and data to the community to support its ability to engage in community governance, exercise civic responsibility, and easily access and share public information.
This project is funded by Public Education and Government (PEG) fees paid to the City, as authorized by the Federal Cable Act. The project has a starting balance of $553,529 not reflected in the numbers below.
Project Cost Estimate and Timeline
This ongoing project is fully funded. Equipment costs vary by year and are determined by the equipment inventory replacement cycle.
Operating Cost Impact
Capital maintenance is included in this project. There are no other operating cost impacts.
202
Uses 2023 2024 2025 2026 2027 2028-2032 10-Year Total Design $- $- $- $- $- $- $Acquisition - - - - - -Construction 99,610 57,347 97,486 98,452 75,479 367,088 795,462 Total Uses $99,610 $57,347 $97,486 $98,452 $75,479 $367,088 $795,462
Sources 2023 2024 2025 2026 2027 2028-2032 10-Year Total 98-101 $ $- $- $- $- $- $- $Other City $ - - - - - -External $ 106,604 104,472 102,382 100,335 98,328 283,341 795,462 Total Sources $106,604 $104,472 $102,382 $100,335 $98,328 $283,341 $795,462
Capital Improvement Projects General Administration
Public Art Description
In support of the City Art in Public Places Program, this project will fund the acquisition of public art for placement throughout the City. The funds are used within the guidelines set forth by the program and purchases are approved by City Council.
Project Justification
Established by City Council in 2009, program goals are to enhance and enrich the lives of Arvada’s residents, visitors, employees, and local businesses by incorporating works of art in public places, contribute to Arvada’s civic pride and sense of identity, increase access to works of art, and enhance Arvada’s reputation as a City which celebrates and supports the arts.
Strategic Plan Alignment
Strategic Priority: Vibrant Community and Neighborhoods
A vibrant community is engaged in civic life, the arts, and the outdoors. It comprises individuals and groups who are dedicated to their community, get involved with neighborhood associations, and participate with local government to ensure responsiveness to changing needs, resulting in Arvada being the preferred place to live, work, play, and stay.
Project Funding
This project is fully funded.
Project Cost Estimate and Timeline
This is an ongoing project.
Operating Cost Impact
This project includes funding for capital maintenance on public art.
Strategic Principle: Provides meaningful ways for the community to engage with local government and strategic partnerships to advance quality of life by embracing both Arvada’s small town traditions and history and changing to achieve an inclusive, equitable, diverse, prosperous, and resilient community that cares about its neighbors
203
Uses 2023 2024 2025 2026 2027 2028-2032 10-Year Total Design $- $- $- $- $- $- $Acquisition 106,121 107,182 108,254 109,337 110,430 583,967 1,125,291 Construction - - - - - -Total Uses $106,121 $107,182 $108,254 $109,337 $110,430 $583,967 $1,125,291
Sources 2023 2024 2025 2026 2027 2028-2032 10-Year Total 98-101 $ $106,121 $107,182 $108,254 $109,337 $110,430 $583,967 $1,125,291 Other City $ - - - - - -External $ - - - - - -Total Sources $106,121 $107,182 $108,254 $109,337 $110,430 $583,967 $1,125,291
Capital Improvement Projects General Administration
Public Safety Evidence Storage Building
Description
Public safety is in need of larger facility to store police related evidence items based on the increase in evidence and new regulation on retention of evidence.
Project Justification
Public Safety’s current evidence storage facility is at capacity. Temporary storage solutions, using space at Indiana impound and purchasing conex units have helped but are not long term solutions. The need to obtain a new facility that will allow for current evidence storage levels and allow for growth projected as Arvada grows is critical. If not funded, evidence storage needs will continue and ability to properly store evidence will be compromised. Incorrect evidence storage will create negative impacts and a potential safety issue for citizens of Arvada.
Strategic Plan Alignment
Strategic Priority: Safe Community Community-based policing, connected neighbors, engaged local businesses, supportive community institutions, and a fair and impartial justice system, all working together, to ensure Arvada is a safe place to live, work, play, and stay. blah
Project Funding
Strategic Principle:
Achieves and maintains the gold standard in public safety by meeting and exceeding standards set forth through the Commission of Accreditation for Law Enforcement Agencies (CALEA) to assist with the designation of one of the safest communities in Colorado.
Funding for this project is from fund balance in the General Fund and Police Tax Increment Funds.
Project Cost Estimate and Timeline
Timing for this project has not been determined.
Operating Cost Impact
Ongoing facilities maintenance and utilities expenses are still being determined. There are potentially some productivity and efficiency savings by re-purposing the current evidence storage area.
204
Uses Existing 2023-2032 Project Total Design $- $- $Acquisition
Construction
Total Uses $- $- $-
- - -
- - -
Timeline Start Completion Design 2021 TBD Acquisition TBD TBD Construction TBD TBD Sources Existing 2023 2024 2025 2026 2027 2028-2032 Project Total 98-101 $ $- $- $- $- $- $- $- $Other City $ 750,000 6,000,000 - - - - - 6,750,000 External $ - - - - - - -Total Sources $750,000 $6,000,000 $- $- $- $- $- $6,750,000
Capital Improvement Projects
Vibrant Community and Neighborhoods Overview
The City of Arvada’s park system includes regional, community and neighborhood parks, as well as the trails that link neighborhoods to parks. This category includes the “Taking Lasting Care” component of the parks capital improvement program which includes major capital maintenance of existing parks or park infrastructure, including playground and trail renovation, tree replacement and irrigation systems. Projects related to the City’s Golf enterprise fund also fall into this category.
Summary of Parks and Golf Sources
Summary of Parks and Golf Uses
205
Uses Existing 2023 2024 2025 2026 2027 2028-2032 Total Design $434,013 $81,680 $81,680 $1,730 $1,836 $1,891 $10,339 $533,271 Acquisition - - - - - - -Construction 3,347,403 3,445,617 1,739,966 1,730,757 1,993,780 2,157,081 10,684,402 25,039,006 Total Uses $3,781,416 $3,447,297 $1,741,696 $1,732,539 $1,995,616 $2,158,972 $10,634,741 $25,492,277 Sources Existing 2023 2024 2025 2026 2027 2028-2032 Total 98-101 $ $1,912,237 $834,932 $1,350,974 $1,330,095 $1,581,098 $1,732,020 $8,299,993 $17,041,349 Other City $ 50,000 345,744 356,116 366,800 377,804 389,137 2,127,963 4,013,564 External $ 1,899,179 2,266,621 34,606 35,644 36,713 37,815 206,785 4,517,363 Total Sources $3,861,416 $3,447,297 $1,741,696 $1,732,539 $1,995,615 $2,158,972 $10,634,741 $25,572,276
Capital Improvement Projects General Administration
ADA Compliance - Parks Description
Title II of the Americans with Disabilities Act (ADA) requires that when viewed in their entirety, City services, programs, and activities are accessible to and usable by people with disabilities. This funding will be used to complete high priority projects identified by the ADA transition plan as barriers to program accessibility in City parks.
Project Justification
Strategic Plan Alignment
Strategic Priority: Infrastructure
A vibrant community is engaged in civic life, the arts, and the outdoors. It comprises individuals and groups who are dedicated to their community, get involved with neighborhood associations, and participate with local government to ensure responsiveness to changing needs, resulting in Arvada being the preferred place to live, work, play, and stay.
Project Funding
Strategic Principle: Provides maintenance services to the community and visitors, so they can play and enjoy activities in a safe, well-maintained parks and trails system. Completing park projects, creating a green spine trail system while enhancing the existing trail system, and acquiring lands for open space conservation to complete gaps in underserved areas or along potential open space corridors.
This project provides ongoing funding for continuous ADA improvement, but there is an unmet need to reach full compliance with the federal requirement.
Sources 2023 2024 2025 2026 2027 2028-2032 10-Year Total 98-101 $ $53,000 $54,590 $56,228 $57,915 $59,625 $326,201 $607,856 Other City $ - - - - - -External $ - - - - - -Total Sources $200,000 $200,000 $200,000 $200,000 $200,000 $1,018,180 $2,018,180
Project Cost Estimate and Timeline
This is an ongoing project. The funding will be utilized as particular needs are identified.
Operating Cost Impact
206
There is no operating cost impact associated with this project. Uses 2023 2024 2025 2026 2027 2028-2032 10-Year Total Design $- $- $- $- $- $- $Acquisition - - - - - -Construction 53,000 54,590 56,228 57,915 59,625 326,201 607,856 Total Uses $53,000 $54,590 $56,228 $57,915 $59,625 $326,201 $607,856
The ADA Transition Plan completed in 2021 outlines best practices to ensure accessibility of City parks and programs to individuals with disabilities. In addition, the project is needed to meet federal law compliance under the ADA title II. There is potential risk of DOJ assessment of the City’s ADA program and subsequent settlement agreement negotiations. Implementation of the transition plan will lower the City’s risk of a DOJ assessment.
Capital Improvement Projects Parks
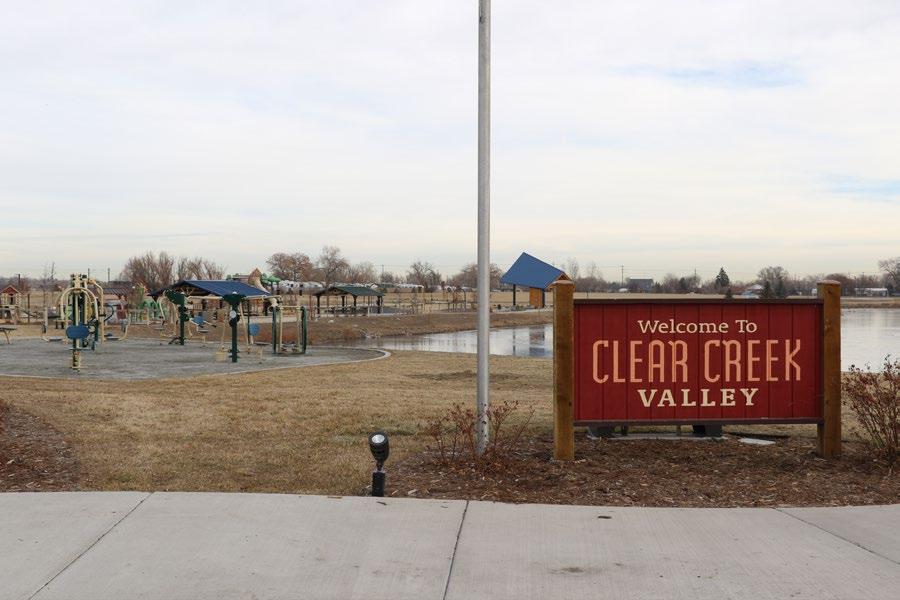
Adams County Open Space Projects
Description
Each year the City receives funding for Open Space from the Adams County sales tax. This funding can only be used in Adams County for Open Space-related projects.
Project Justification
The funds are used for various needs in Adams County as they arise.
Strategic Plan Alignment
Strategic Priority: Vibrant Community and Neighborhoods
A vibrant community is engaged in civic life, the arts, and the outdoors. It comprises individuals and groups who are dedicated to their community, get involved with neighborhood associations, and participate with local government to ensure responsiveness to changing needs, resulting in Arvada being the preferred place to live, work, play, and stay.
Project Funding
Funding is received from Adams County sales tax.
Strategic Principle: Provides maintenance services to the community and visitors, so they can play and enjoy activities in a safe, well-maintained parks and trails system. Completing park projects, creating a green spine trail system while enhancing the existing trail system, and acquiring lands for open space conservation to complete gaps in underserved areas or along potential open space corridors.
Project Cost Estimate and Timeline
This is an ongoing project. Funding is used as needs are identified.
Operating Cost Impact
There is no operating cost impact.
207
Uses 2023 2024 2025 2026 2027 2028-2032 10-Year Total Design $1,680 $1,730 $1,782 $1,836 $1,891 $10,339 $19,258 Acquisition
- - -Construction 31,918 32,876 33,862 34,878 35,924 196,446 365,903 Total Uses $33,598 $34,606 $35,644 $36,713 $37,815 $206,785 $385,161
- - -
Sources 2023 2024 2025 2026 2027 2028-2032 10-Year Total 98-101 $ $- $- $- $- $- $- $Other City $ - - - - - -External $ 33,598 34,606 35,644 36,713 37,815 206,785 385,161 Total Sources $33,598 $34,606 $35,644 $36,713 $37,815 $206,785 $385,161
Capital Improvement Projects Parks
CO Front Range Trail Feasibility Study
Description
The Colorado Front Range Trail (CFRT) project is a multi-community initiative to create a multi-purpose trail from Wyoming to New Mexico along the Front Range of Colorado. The 876-mile trail will link diverse communities, scenic landscapes, cultural and historic points, parks, open space and other attractions. In 2021, Jefferson County Open Space partnered with Arvada and the Trust for Public Lands on an Intergovernmental Agreement to conduct a feasibility study on a segment of the CFRT in Northern Jefferson County parallel to Highway 93.
Project Justification
The study’s driving principles dovetail with Arvada’s 2016 Parks and Open Space Trails Master Plan’s intent to enhance multimodal connections between urban centers within Jefferson County and neighboring subregions, increase safety and reliability of transportation systems, and connect people to natural resource areas, open space, parks, and trails. The CFRT will help to fulfill the Colorado the Beautiful Initiative where every Coloradan will live within 10 minutes of a trail, park, or green space within a generation.
Strategic Plan Alignment
Strategic Priority: Vibrant Community and Neighborhoods
A vibrant community is engaged in civic life, the arts, and the outdoors. It comprises individuals and groups who are dedicated to their community, get involved with neighborhood associations, and participate with local government to ensure responsiveness to changing needs, resulting in Arvada being the preferred place to live, work, play, and stay.
Project Funding
Strategic Principle: Provides maintenance services to the community and visitors, so they can play and enjoy activities in a safe, well-maintained parks and trails system. Completing park projects, creating a green spine trail system while enhancing the existing trail system, and acquiring lands for open space conservation to complete gaps in underserved areas or along potential open space corridors.
This project is a partnership with Jefferson County Open Space and the Trust for Public Lands. The funding reflected here only represents Arvada’s share of the cost.
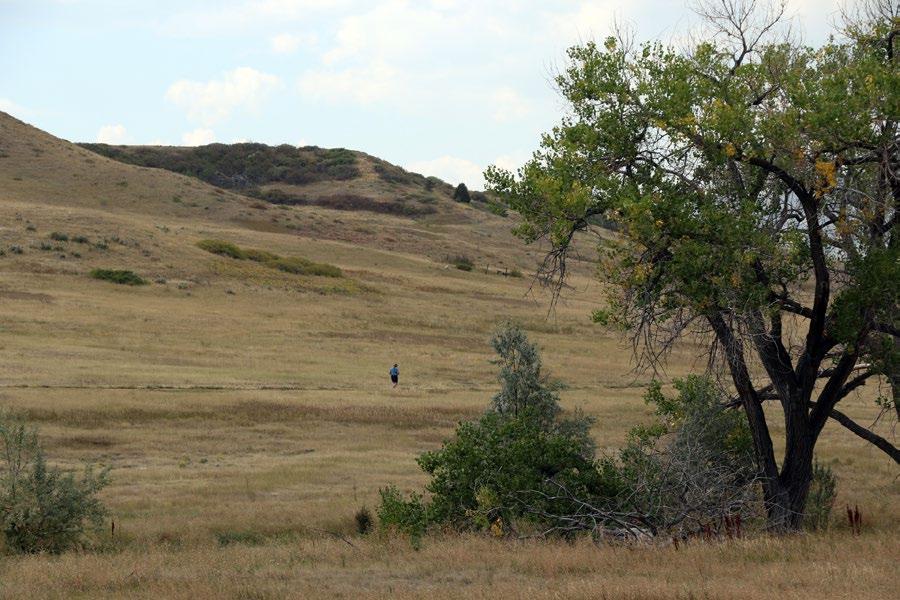
Project Cost Estimate and Timeline
This funding is for a feasibility study and design contract. Potential future construction of the CFRT is not included in these costs. The design is expected to be complete by 2023.
Uses Existing 2023-2032 Project Total
Design $50,000 $- $50,000
Acquisition - - -
Total Uses $50,000 $- $50,000
Operating Cost Impact
There is no operating cost at this time.
208
Construction - - -
Timeline Start Completion Design 2022 2023 Acquisition Construction Sources Existing 2023 2024 2025 2026 2027 2028-2032 Project Total 98-101 $ $50,000 $- $- $- $- $- $- $50,000 Other City $ - - - - - - -External $ - - - - - - -Total Sources $50,000 $- $- $- $- $- $- $50,000
Capital Improvement Projects Parks
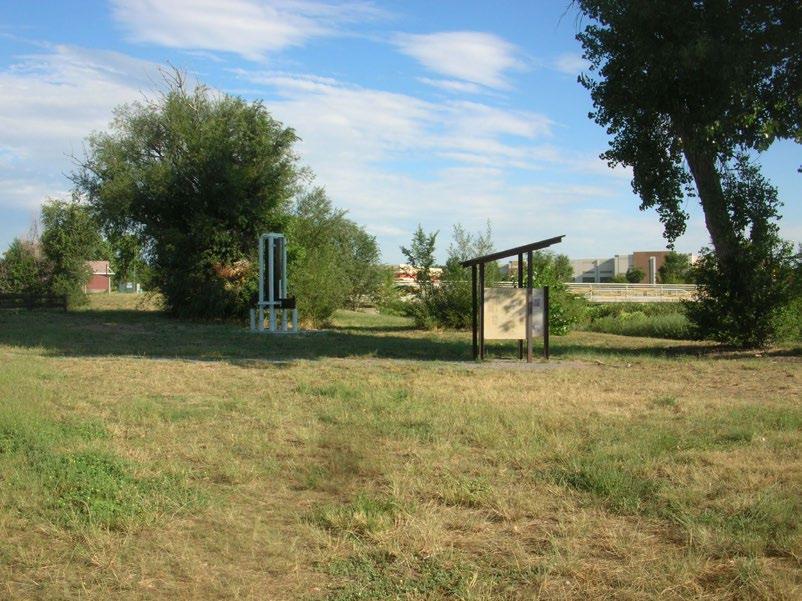
Gold Strike Park Description
This project will see major improvements to the Gold Strike Park area. Preliminary discussions with other governmental entities, such as Apex, Hyland Hills, Adams County, Jefferson County, and CDOT are underway.
Project Justification
This project represents a major upgrade to a regional park servicing the southeast portion of the City.
Strategic Plan Alignment
Strategic Priority: Vibrant Community and Neighborhoods
A vibrant community is engaged in civic life, the arts, and the outdoors. It comprises individuals and groups who are dedicated to their community, get involved with neighborhood associations, and participate with local government to ensure responsiveness to changing needs, resulting in Arvada being the preferred place to live, work, play, and stay.
Project Funding
A portion of this project will be funded through the Conservation Trust.
Strategic Principle: Provides maintenance services to the community and visitors, so they can play and enjoy activities in a safe, well-maintained parks and trails system. Completing park projects, creating a green spine trail system while enhancing the existing trail system, and acquiring lands for open space conservation to complete gaps in underserved areas or along potential open space corridors.
Project Cost Estimate and Timeline
This is a one-time project.
Operating Cost Impact
The annual operating cost for Gold Strike Park will be $25,000 a year.
209
Uses Existing 2023-2032 Project Total Design $250,000 $- $250,000 Acquisition - -Construction 1,939,237 - 1,939,237 Total Uses $2,189,237 $- $2,189,237
Timeline Start Completion Design 2021 2023 Acquisition Construction TBD TBD Sources Existing 2023 2024 2025 2026 2027 2028-2032 Project Total 98-101 $ $1,619,237 $- $- $- $- $- $- $1,619,237 Other City $ - - - - - - -External $ 570,000 - - - - - - 570,000 Total Sources $2,189,237 $- $- $- $- $- $- $2,189,237
Capital Improvement Projects Parks
Holistic Health and Fitness Park Description
The City of Arvada and Red Rocks Community College (RRCC) are working together to develop a new park in the Arvada Ridge area which seeks to meet identified public park service gaps and support higher education curriculum at the RRCC Arvada Campus.
Project Justification
One of the first of its kind in the nation, Arvada’s newest park will focus on whole-body health and offer a variety of uses for all ages and abilities, provide interactive features, and improve community access to free health opportunities and solutions to chronic health issues. Residents, practitioners, faculty, students, artists, and other stakeholders were invited to help shape the vision for this new park.
Strategic Plan Alignment
Strategic Priority: Vibrant Community and Neighborhoods
A vibrant community is engaged in civic life, the arts, and the outdoors. It comprises individuals and groups who are dedicated to their community, get involved with neighborhood associations, and participate with local government to ensure responsiveness to changing needs, resulting in Arvada being the preferred place to live, work, play, and stay.
Project Funding
Strategic Principle: Provides maintenance services to the community and visitors, so they can play and enjoy activities in a safe, well-maintained parks and trails system. Completing park projects, creating a green spine trail system while enhancing the existing trail system, and acquiring lands for open space conservation to complete gaps in underserved areas or along potential open space corridors.
Project funding is from Lands Dedicated fees, Conservation Trust Fund, and Development fees.
Project Cost Estimate and Timeline
This is a one-time project that is expected to be completed in 2024.
Operating Cost Impact
The annual operating cost for Holistic Health and Fitness Park will be $36,795 a year.
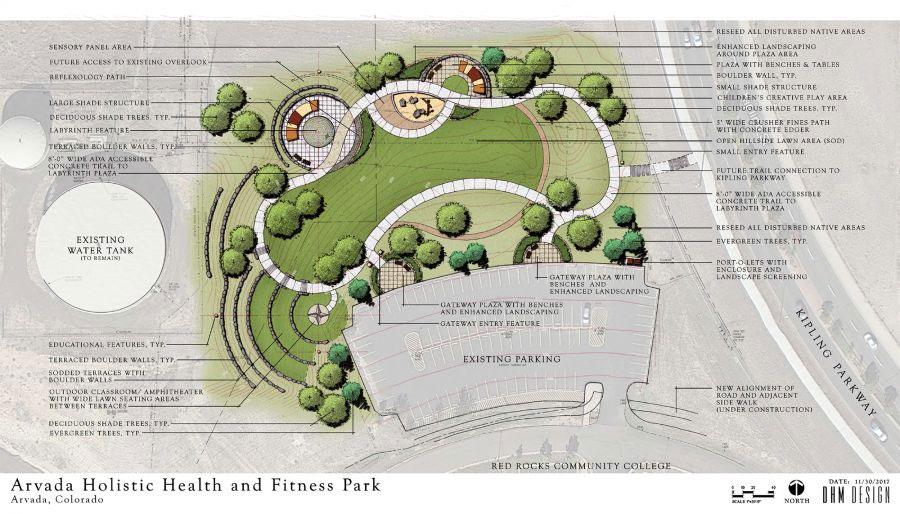
210
Uses Existing 2023-2032 Project Total Design $134,013 $- $134,013 Acquisition - -Construction 1,165,166 2,233,023 3,398,189 Total Uses $1,296,184 $2,233,023 $3,532,202
Timeline Start Completion Design 2017 2023 Acquisition Construction 2023 2024 Sources Existing 2023 2024 2025 2026 2027 2028-2032 Project Total 98-101 $ $- $- $- $- $- $- $- $Other City $ - - - - - - -External $ 1,299,179 2,233,023 - - - - - 3,532,202 Total Sources $1,299,179 $- $- $- $- $- $- $3,532,202
Capital Improvement Projects Parks
Irrigation Systems Description
This project funds renovation of parks irrigation system for improved efficiancy.
Project Justification
Improving water efficiency and resource conservation are key priorities for the City of Arvada. Arvada’s park division is doing their part by proactively updating the irrigation systems.
Strategic Plan Alignment
Strategic Priority: Vibrant Community and Neighborhoods
A vibrant community is engaged in civic life, the arts, and the outdoors. It comprises individuals and groups who are dedicated to their community, get involved with neighborhood associations, and participate with local government to ensure responsiveness to changing needs, resulting in Arvada being the preferred place to live, work, play, and stay.
Project Funding
Strategic Principle: Provides maintenance services to the community and visitors, so they can play and enjoy activities in a safe, well-maintained parks and trails system. Completing park projects, creating a green spine trail system while enhancing the existing trail system, and acquiring lands for open space conservation to complete gaps in underserved areas or along potential open space corridors.
A 3-cent per thousand gallons of water consumed revenue source funds the irrigation system upgrades. This varies annually based on consumption.
Project Cost Estimate and Timeline
This is an ongoing project. Sites are reevaluated each year.
Operating Cost Impact
Savings on water, ongoing maintenance costs, and specialized labor are expected as the irrigation system is upgraded.
211
Uses 2023 2024 2025 2026 2027 2028-2032 10-Year Total Design $- $- $- $- $- $- $Acquisition - - - - - -Construction 171,054 676,185 431,471 436,915 442,522 2,348,697 4,506,844 Total Uses $171,054 $676,185 $431,471 $436,915 $442,522 $2,348,697 $4,506,844
Sources 2023 2024 2025 2026 2027 2028-2032 10-Year Total 98-101 $ $- $500,000 $250,000 $250,000 $250,000 $1,295,907 $2,545,907 Other City $ 171,054 176,185 181,471 186,915 192,522 1,052,790 1,960,937 External $ - - - - - -Total Sources $171,054 $676,185 $431,471 $436,915 $442,522 $2,348,697 $4,506,844
Capital Improvement Projects Parks
Median Renovations Description
This project includes a citywide assessment of medians in need of construction improvements. Medians are evaluated, and prioritized, on the basis of key criteria: safety, water efficiency, and percentage of dead/dying plant material. Improvements will include lower maintenance landscaping and drought resistant materials.
Project Justification
This project will result in minimized safety hazards for Parks Maintenance team members, improved community aesthetics, and increased water conservation and efficiency. Currently, team members need to mow and repair materials in high-traffic medians, doing so at a heightened safety risk. In addition, ongoing maintenance costs will be minimized as a result of landscaping features that require less water and irrigation equipment. The project will remove dead and dying plant material from existing medians and will greatly improve the aesthetics of our community roadways.
Strategic Plan Alignment
Strategic Priority: Vibrant Community and Neighborhoods
A vibrant community is engaged in civic life, the arts, and the outdoors. It comprises individuals and groups who are dedicated to their community, get involved with neighborhood associations, and participate with local government to ensure responsiveness to changing needs, resulting in Arvada being the preferred place to live, work, play, and stay.
Project Funding
This project is fully funded.
Project Cost Estimate and Timeline
This is an ongoing project.
Operating Cost Impact
Strategic Principle: Provides meaningful ways for the community to engage with local government and strategic partnerships to advance quality of life by embracing both Arvada’s small town traditions and history and changing to achieve an inclusive, equitable, diverse, prosperous, and resilient community that cares about its neighbors
Parks Maintenance supplies and service costs will be reduced as a result of these renovations.
212
Uses 2023 2024 2025 2026 2027 2028-2032 10-Year Total Design $- $- $- $- $- $- $Acquisition
- - -Construction 200,000 206,000 212,180 218,545 225,102 1,230,949 2,292,776 Total Uses $200,000 $206,000 $212,180 $218,545 $225,102 $1,230,949 $2,292,776
- - -
Sources 2023 2024 2025 2026 2027 2028-2032 10-Year Total 98-101 $ $200,000 $206,000 $212,180 $218,545 $225,102 $1,230,949 $2,292,776 Other City $ - - - - - -External $ - - - - - -Total Sources $200,000 $206,000 $212,180 $218,545 $225,102 $1,230,949 $2,292,776
Capital Improvement Projects Parks
Park Water Tap Fees
Description
As part of new construction, park tap fees are collected to fund new park construction.
Project Justification
This project covers the cost to pay water tap fees for new City parks.
Strategic Plan Alignment
Strategic Priority: Vibrant Community and Neighborhoods
A vibrant community is engaged in civic life, the arts, and the outdoors. It comprises individuals and groups who are dedicated to their community, get involved with neighborhood associations, and participate with local government to ensure responsiveness to changing needs, resulting in Arvada being the preferred place to live, work, play, and stay.
Project Funding
Funded through the water fund. The fee varies based on type of development.
Strategic Principle: Provides maintenance services to the community and visitors, so they can play and enjoy activities in a safe, well-maintained parks and trails system. Completing park projects, creating a green spine trail system while enhancing the existing trail system, and acquiring lands for open space conservation to complete gaps in underserved areas or along potential open space corridors.
Project Cost Estimate and Timeline
This is an ongoing project. Projects are prioritized each year as new parks are developed.
Operating Cost Impact
There are no operating costs associated with Park Water Tap Fees.
213
Uses 2023 2024 2025 2026 2027 2028-2032 10-Year Total Design $- $- $- $- $- $- $Acquisition - - - - - -Construction 174,690 179,931 185,329 190,889 196,615 1,075,173 2,002,627 Total Uses $174,690 $179,931 $185,329 $190,889 $196,615 $1,075,173 $2,002,627
Sources 2023 2024 2025 2026 2027 2028-2032 10-Year Total 98-101 $ $- $- $- $- $- $- $Other City $ 174,690 179,931 185,329 190,889 196,615 1,075,173 2,002,627 External $ - - - - - -Total Sources $174,690 $179,931 $185,329 $190,889 $196,615 $1,075,173 $2,002,627
Capital Improvement Projects Parks
Playground Renovation Description
This project is for playground renovation as evaluated and prioritized by the City of Arvada’s 2016 Parks, Open Space, and Trails Master Plan.
Project Justification
Playgrounds receive intensive use at all parks and could represent the greatest potential risk for public use. Adding to use and risk issues, ongoing changes to ASTM Standards, CPSC Guidelines, and ADA access requirements require manufacturers to update play equipment, making replacement of older equipment sometime impossible after 15 years.
Strategic Plan Alignment
Strategic Priority: Vibrant Community and Neighborhoods
A vibrant community is engaged in civic life, the arts, and the outdoors. It comprises individuals and groups who are dedicated to their community, get involved with neighborhood associations, and participate with local government to ensure responsiveness to changing needs, resulting in Arvada being the preferred place to live, work, play, and stay.
Project Funding
Strategic Principle: Provides maintenance services to the community and visitors, so they can play and enjoy activities in a safe, well-maintained parks and trails system. Completing park projects, creating a green spine trail system while enhancing the existing trail system, and acquiring lands for open space conservation to complete gaps in underserved areas or along potential open space corridors.
Playground renovation can be supplemented by Park Development and Lands Dedicated fees collected from developers located near the playground.
Project Cost Estimate and Timeline
This is an ongoing project. Projects are prioritized by the City of Arvada’s 2016 Parks, Open Space, and Trails Master Plan..
Operating Cost Impact
This project is for ongoing renovation of existing playgrounds; it does not have an operating cost impact.
214
Uses 2023 2024 2025 2026 2027 2028-2032 10-Year Total Design $- $- $- $- $- $- $Acquisition
Construction 494,577 500,408 719,013 959,183 1,098,948 4,909,290 8,681,421 Total Uses $494,577 $500,408 $719,013 $959,183 $1,098,948 $4,909,290 $8,681,421
- - - - - - -
Sources 2023 2024 2025 2026 2027 2028-2032 10-Year Total 98-101 $ $494,577 $500,408 $719,013 $959,183 $1,098,948 $4,909,290 $8,681,419 Other City $ - - - - - -External $ - - - - - -Total Sources $494,577 $500,408 $719,013 $959,183 $1,098,948 $4,909,290 $8,681,419
Capital Improvement Projects Parks
Rocky Mountain Greenway Description
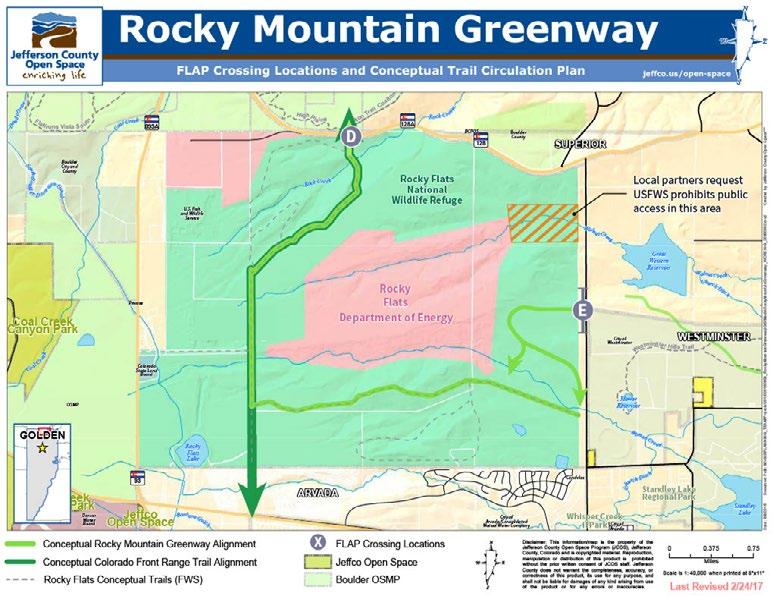
Construction of two crossings of the Rocky Mountain Greenway Trail at Indiana Street and Colorado HWY 128. In 2021, Arvada City Council authorized the approval of an Intergovernmental Agreement (IGA) between the City of Arvada, the City of Boulder, County of Boulder, City of Westminster, and Jefferson County for the funding of these Rocky Mountain Greenway Trail Crossings.
Project Justification
Development of the RMG Trail directly aligns with the vision laid out in the City of Arvada Parks, Trails, and Open Space Master Plan and contributes to the following City Council Strategic Result: By 12/22, complete strategic investments and initiatives to ensure parks, trails, open space, and amenities are in alignment with our diverse, changing, and growing community. The IGA ensures Arvada’s continued participation in strategic efforts to connect Arvada’s park, open space and trail system with green spines in a regionally-focused way.
Strategic Plan Alignment
Strategic Priority: Vibrant Community and Neighborhoods
A vibrant community is engaged in civic life, the arts, and the outdoors. It comprises individuals and groups who are dedicated to their community, get involved with neighborhood associations, and participate with local government to ensure responsiveness to changing needs, resulting in Arvada being the preferred place to live, work, play, and stay.
Project Funding
Strategic Principle: Provides maintenance services to the community and visitors, so they can play and enjoy activities in a safe, well-maintained parks and trails system. Completing park projects, creating a green spine trail system while enhancing the existing trail system, and acquiring lands for open space conservation to complete gaps in underserved areas or along potential open space corridors.
This project is primarily funded through a Federal Highway Administration FLAP grant awarded to Jefferson County for $3,930,000, which provides funding for trail crossings at Indiana Street and Colorado Highway 128. The grant requires a 17.21% local match divided between the partner organizations.
Project Cost Estimate and Timeline
This cost represents Arvada’s portion of the project total. The project is expected to be complete by 2023.
Operating Cost Impact
Maintenance of the crossings will be shared between jurisdictions. Operating cost impact is not currently known.
215
Uses Existing 2023-2032 Project Total Design $-
Acquisition - -Construction 243,000 - 243,000 Total Uses $243,000 $- $243,000
$- $-
Timeline Start Completion Design 2021 2022 Acquisition Construction 2022 2023 Sources Existing 2023 2024 2025 2026 2027 2028-2032 Project Total 98-101 $ $243,000 $- $- $- $- $- $- $243,000 Other City $ - - - - - - -External $ - - - - - - -Total Sources $243,000 $- $- $- $- $- $- $243,000
Capital Improvement Projects Parks
Trail Renovation Description
These funds are used to renovate trails as evaluated and prioritized by the City of Arvada’s 2016 Parks, Open Space, and Trails Master Plan..
Project Justification
Trails develop potential safety issues for the public as conditions decline with age.
Strategic Plan Alignment
Strategic Priority: Vibrant Community and Neighborhoods
A vibrant community is engaged in civic life, the arts, and the outdoors. It comprises individuals and groups who are dedicated to their community, get involved with neighborhood associations, and participate with local government to ensure responsiveness to changing needs, resulting in Arvada being the preferred place to live, work, play, and stay.
Project Funding
Strategic Principle:
Provides maintenance services to the community and visitors, so they can play and enjoy activities in a safe, well-maintained parks and trails system. Completing park projects, creating a green spine trail system while enhancing the existing trail system, and acquiring lands for open space conservation to complete gaps in underserved areas or along potential open space corridors.
Trail renovation funds may be supplemented by Park Development and Lands Dedicated fees as available.
Project Cost Estimate and Timeline
This is an ongoing project. Projects are prioritized by the City of Arvada’s 2016 Parks, Open Space, and Trails Master Plan and may be coordinated with other park maintenance efforts, such as playground renovation.
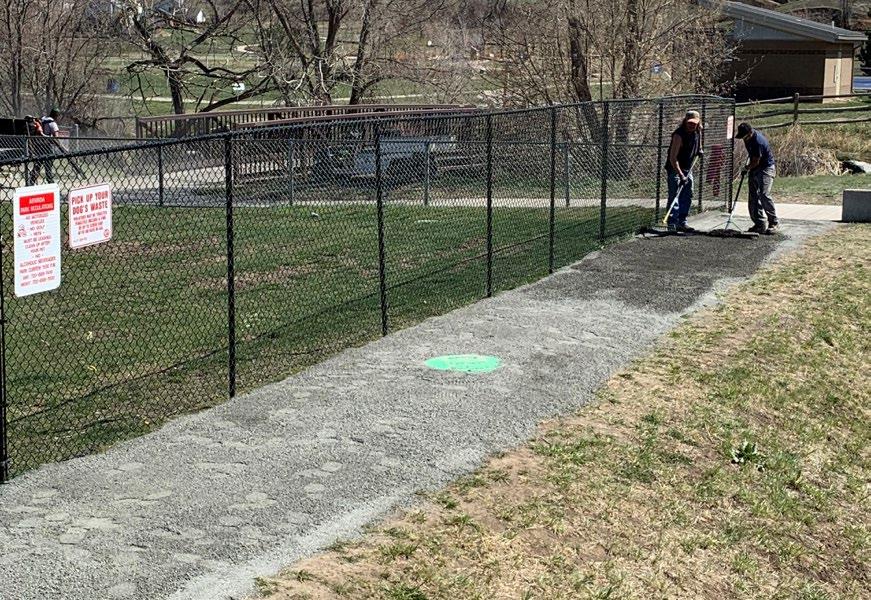
Operating Cost Impact
Trail renovation does not have an operating cost impact.
216
Uses 2023 2024 2025 2026 2027 2028-2032 10-Year Total Design $- $- $- $- $- $- $Acquisition - - - - - -Construction 67,196 69,212 71,288 73,427 75,629 413,571 770,323 Total Uses $67,196 $69,212 $71,288 $73,427 $75,629 $413,571 $770,323
Sources 2023 2024 2025 2026 2027 2028-2032 10-Year Total 98-101 $ $67,196 $69,212 $71,288 $73,427 $75,629 $413,571 $770,323 Other City $ - - - - - -External $ - - - - - -Total Sources $67,196 $69,212 $71,288 $73,427 $75,629 $413,571 $770,323
Project Justification
Capital Improvement Projects Parks
Tree Replacement Program
Description
This program is necessary to purchase and install new trees on City rights-of-way, medians, and parks.
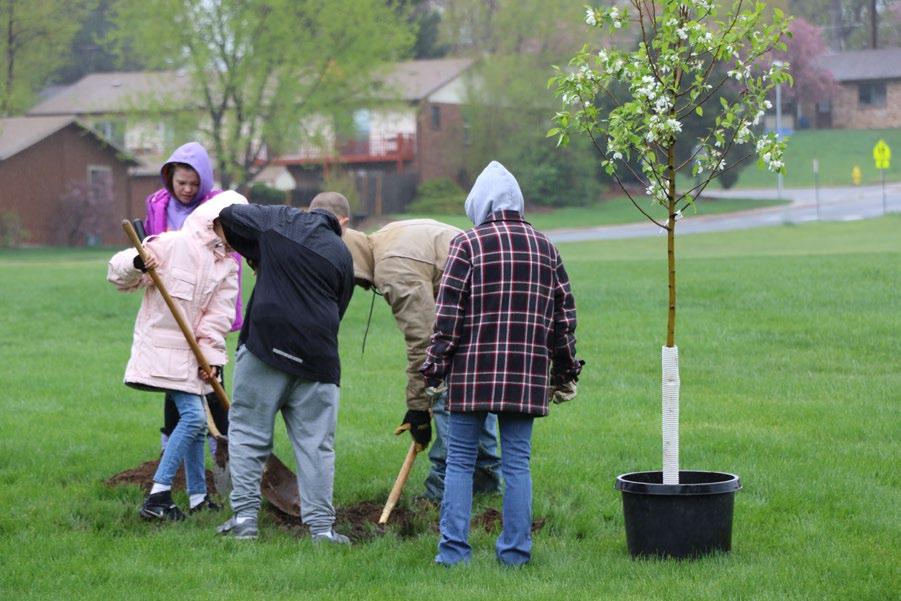
Strategic Plan Alignment
Strategic Priority: Vibrant Community and Neighborhoods
A vibrant community is engaged in civic life, the arts, and the outdoors. It comprises individuals and groups who are dedicated to their community, get involved with neighborhood associations, and participate with local government to ensure responsiveness to changing needs, resulting in Arvada being the preferred place to live, work, play, and stay.
Project Funding
This project is fully funded.
Project Cost Estimate and Timeline
This is an ongoing project. Projects are prioritized by Parks staff.
Strategic Principle: Provides maintenance services to the community and visitors, so they can play and enjoy activities in a safe, well-maintained parks and trails system. Completing park projects, creating a green spine trail system while enhancing the existing trail system, and acquiring lands for open space conservation to complete gaps in underserved areas or along potential open space corridors.
Operating Cost Impact
Tree replacement does not have an operating cost impact.
217
Uses 2023 2024 2025 2026 2027 2028-2032 10-Year Total Design $- $- $- $- $- $- $Acquisition - - - - - -Construction 20,159 20,764 21,386 22,028 22,689 124,074 231,100 Total Uses $20,159 $20,764 $21,386 $22,028 $22,689 $124,074 $231,100
Sources 2023 2024 2025 2026 2027 2028-2032 10-Year Total 98-101 $ $20,159 $20,764 $21,386 $22,028 $22,689 $124,074 $231,100 Other City $ - - - - - -External $ - - - - - -Total Sources $20,159 $20,764 $21,386 $22,028 $22,689 $124,074 $231,100
The Tree Replacement program maintains the integrity of the original design for the built environment in parks and right-of-way throughout the City.
Capital Improvement Projects Golf
Lake Arbor Golf Course Improvements Description
Designed in 1973, Lake Arbor Golf Course is an approachable, walkable, traditionally designed 18 hole course that features some of the best quality greens in the metro area. Tucked into the urban landscape of the northeast Arvada, the course is best suited for golfers looking to improve their accuracy off the tee and improve their iron/approach game while readily accommodating all skill and experience levels. The Arvada Golf leadership team has been working diligently to assess the playability of the Lake Arbor Golf Course and determine which, if any, course improvements could be made to improve the customer and community experience of this historic community asset.
Project Justification
With a focus on having golfers play the course as it was originally designed, the course improvement plan seeks to build upon the strengths of the course, while not fundamentally altering the essence of the historic Lake Arbor Golf Course experience.
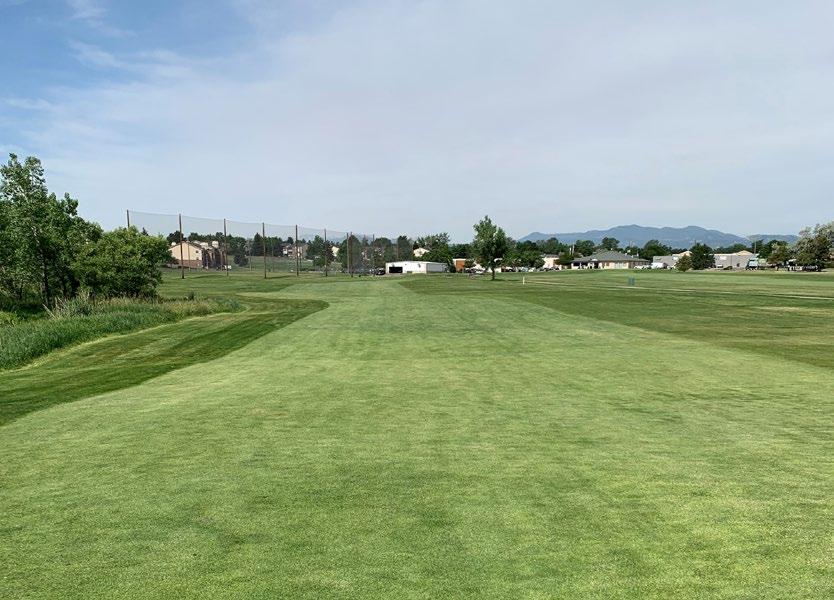
Strategic Plan Alignment
Strategic Priority:
A vibrant community is engaged in civic life, the arts, and the outdoors. It comprises individuals and groups who are dedicated to their community, get involved with neighborhood associations, and participate with local government to ensure responsiveness to changing needs, resulting in Arvada being the preferred place to live, work, play, and stay.
Project Funding
Strategic Principle: Operates sustainable premier golf programs and facilities focusing on exceptional service and value to the community with the conservation of natural environment under economically sound and socially responsible management.
Funding for this project is provided through a combination of the General Fund, Conservation Trust Fund, and the Golf Fund.
Project Cost Estimate and Timeline
The funding covers immediate improvement services, materials and assets like trees and signage. The project is anticipated to be started in 2023.
Operating Cost Impact
This is currently an existing asset; there is no additional operating cost associated with this project.
218
Uses Existing 2023-2032 Project Total Design $80,000 $- $80,000 Acquisition - -Construction - -Total Uses $80,000 $- $80,000
Timeline Start Completion Design Acquisition Construction 2024 TBD Sources Existing 2023 2024 2025 2026 2027 2028-2032 Project Total 98-101 $ $- $- $- $- $- $- $- $Other City $ 50,000 - - - - - - 30,000 External $ 30,000 - - - - - - 50,000 Total Sources $80,000 $- $- $- $- $- $- $-
Capital Improvement Projects
Stormwater Overview
The City’s Stormwater utility has programmed a robust series of projects to span the coming decade. Major plans include improvements to Van Bibber Creek and Ralston Creek, as well as various outfall improvements aimed at mitigating potential threats of flash flooding and property damage. Ongoing operations include stream bank stabilizations, open channel vegetation management, minor miscellaneous infrastructure replacements and upgrades, as well as joint master plan studies with the Mile High Flood District.
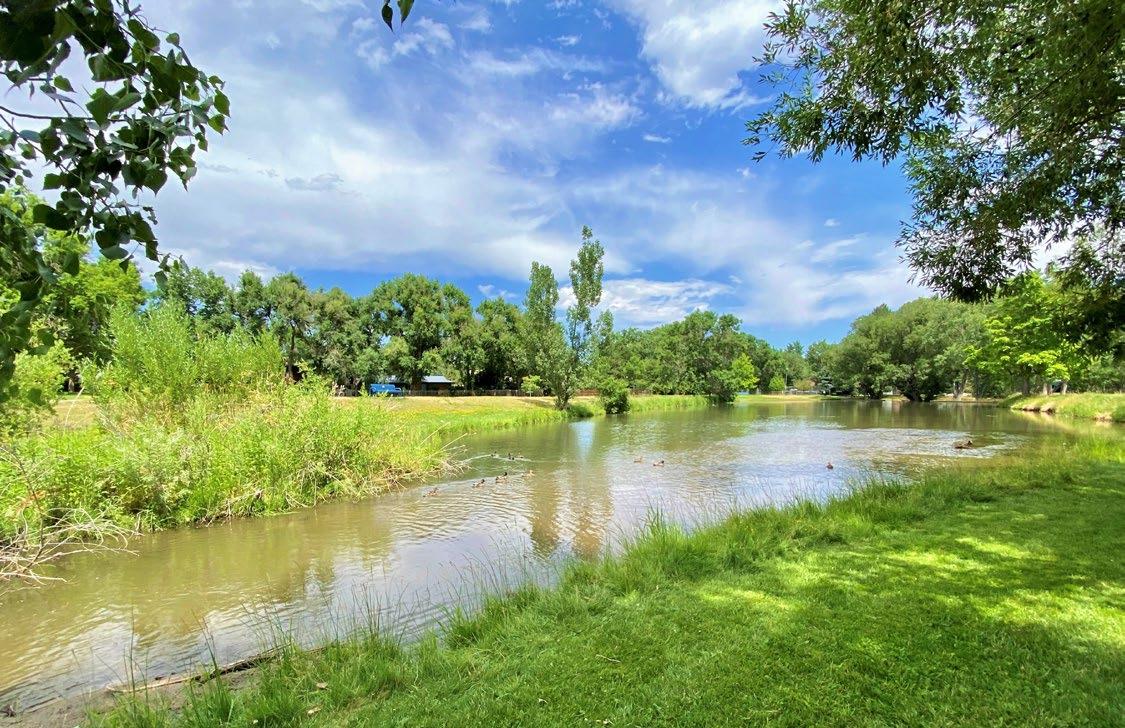
Summary of Stormwater Sources
Summary of Stormwater Uses
219
Uses Existing 2023 2024 2025 2026 2027 2028-2032 Total Design - $149,703 $360,000 $546,810 $126,000 $135,000 $811,000 $2,128,513 Acquisition - - - 418,000 - - - 418,000 Construction - 535,602 558,982 3,119,851 3,609,446 1,431,859 5,253,823 14,509,563 Total Uses - $685,304 $918,982 $4,084,662 $3,735,446 $1,566,859 $6,064,823 $17,056,076 Sources Existing 2023 2024 2025 2026 2027 2028-2032 Total 98-101 $ $- $- $- $- $- $- $- $Other City $ 436,699 625,304 1,293,982 1,661,851 2,197,747 1,565,669 6,064,823 13,846,076 External $ - 405,000 500,000 1,104,000 1,201,000 - - 3,210,000 Total Sources $436,699 $1,030,304 $1,793,982 $2,765,851 $3,398,747 $ 1,565,669 $6,064,823 $17,056,076
Capital Improvement Projects Stormwater
Bates Lake Watershed Drainage Improvements
Description
This is multi-phased project to rebuild the outlet works for the Bates Lake Detention area, upsize the existing stormwater pipe under the railroad tracks at Depew St., and expand the stormwater conveyance system along Sheridan Blvd. from W. 62nd Ave. to Clear Creek. The watershed boundaries are roughly Lamar St., W. 66th Ave., Tennyson St., and Clear Creek. This project is part of a Major Drainageway Planning Study generated by Mile High Flood District and is eligible for their contributions.
Project Justification
The primary aim of this project is to reduce property damage caused by flooding events.
Strategic Plan Alignment
Strategic Priority: Infrastructure
The community depends on a well-maintained foundation of streets, sidewalks, and water, wastewater and stormwater facilities. Planned and steady population growth requires proper maintenance of existing infrastructure and additional capacity to support a thriving community.
Project Funding
Strategic Principle:
Provides the community with a safe, reliable, high-quality water supply, drainage system, and wastewater disposal services for full city build-out, as defined by the Comprehensive Plan. This includes maintaining utility rates at lowest practical levels with accurate billing that supports replacement of aging infrastructure in order to maintain robust utility systems.
Funded through the stormwater utility fee and eligible for Mile High Flood district contributions in the future.
Project Cost Estimate and Timeline
This project is fully funded. Design is expected to begin in 2025.
Operating Cost Impact
The replacement of undersized storm sewer collection systems will reduce the annual frequency of maintaining and operating these problem drainage areas, decreasing operating costs.
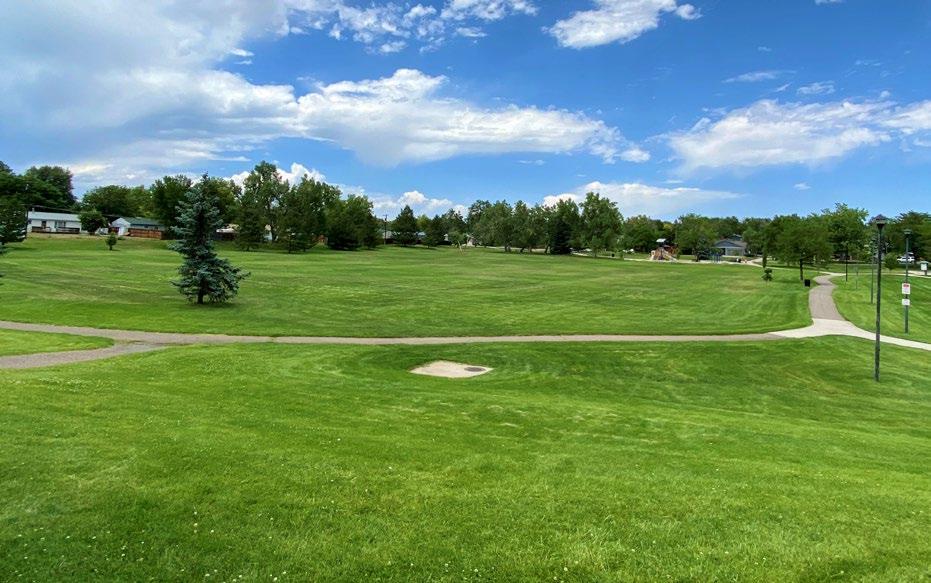
220
Uses Existing 2023-2032 Project Total Design $- $140,000 $140,000 Acquisition - -Construction - 1,520,000 1,520,000 Total Uses $- $1,660,000 $1,660,000
Timeline Start Completion Design 2025 2025 Acquisition Construction 2026 2030 Sources Existing 2023 2024 2025 2026 2027 2028-2032 Project Total 98-101 $ $- $- $- $- $- $- $- $Other City $ - - 105,000 - 250,000 - - 355,000 External $ - - - 604,000 701,000 - - 1,305,000 Total Sources $- $- $105,000 $604,000 $951,000 $- $- $1,660,000
Capital Improvement Projects Stormwater
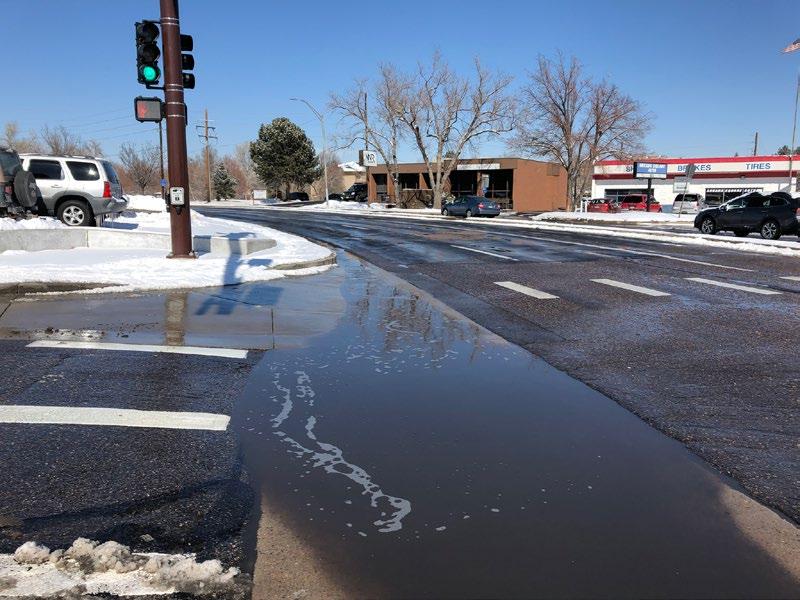
Drainage Improvement Projects
Description
This project is intended to fund construction of stormwater improvements per the recommendations received in the 2021 Stormwater Master Plan study project, as well as addressing drainage issues raised by our community and staff.
Project Justification
Upon completion of the Stormwater Master Plan, this project will fund construction of the priorities identified within the plan.
Strategic Plan Alignment
Strategic Priority: Infrastructure
The community depends on a well-maintained foundation of streets, sidewalks, and water, wastewater and stormwater facilities. Planned and steady population growth requires proper maintenance of existing infrastructure and additional capacity to support a thriving community.
Project Funding
Funded through the stormwater utility fee.
Strategic Principle:
Provides the community with a safe, reliable, high-quality water supply, drainage system, and wastewater disposal services for full city build-out, as defined by the Comprehensive Plan. This includes maintaining utility rates at lowest practical levels with accurate billing that supports replacement of aging infrastructure in order to maintain robust utility systems.
Project Cost Estimate and Timeline
This is an ongoing project.
Operating Cost Impact
The replacement of undersized storm sewer collection systems will reduce the annual frequency of maintaining and operating these problem drainage areas.
221
Uses 2023 2024 2025 2026 2027 2028-2032 10-Year Total Design $30,000 $45,000 $50,000 $55,000 $60,000 $375,000 $615,000 Acquisition
Construction 507,464 530,000 590,000 657,000 733,000 5,153,000 8,170,464 Total Uses $ 537,464 $575,000 $640,000 $712,000 $793,000 $5,528,000 $8,785,464
- - - - - - -
Sources 2023 2024 2025 2026 2027 2028-2032 10-Year Total 98-101 $ $- $- $- $- $- $- $Other City $ 537,464 575,000 640,000 712,000 793,000 5,528,000 8,785,464 External $ - - - - - -Total Sources $ 537,464 $575,000 $640,000 $712,000 $793,000 $5,528,000 $8,785,464
Capital Improvement Projects Stormwater
Mile High Flood District Joint Maintenance Projects
Description
This project funds the City’s share of the construction of jointly funded maintenance projects with the Mile High Flood District as opportunities become available.
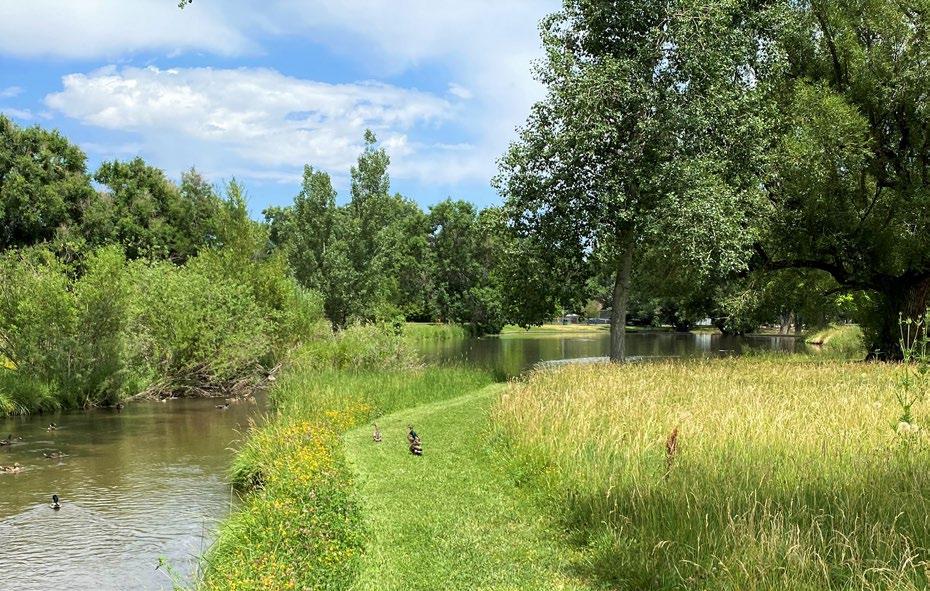
Project Justification
This project is for the maintenance of existing stormwater infrastructure on creeks and drainageways throughout the City so that the infrastructure continues to function as designed.
Strategic Plan Alignment
Strategic Priority: Infrastructure
The community depends on a well-maintained foundation of streets, sidewalks, and water, wastewater and stormwater facilities. Planned and steady population growth requires proper maintenance of existing infrastructure and additional capacity to support a thriving community.
Project Funding
Strategic Principle: Provides the community with a safe, reliable, high-quality water supply, drainage system, and wastewater disposal services for full city build-out, as defined by the Comprehensive Plan. This includes maintaining utility rates at lowest practical levels with accurate billing that supports replacement of aging infrastructure in order to maintain robust utility systems.
Funded through the stormwater utility fee. These funds supplement contributions by the Mile High Flood District.
Project Cost Estimate and Timeline
This is an ongoing project.
Operating Cost Impact
There is no operating cost impact.
222
Uses 2023 2024 2025 2026 2027 2028-2032 10-Year Total Design $- $- $- $- $- $- $Acquisition - - - - - -Construction 28,138 28,982 29,851 30,747 31,669 100,823 250,210 Total Uses $28,138 $28,982 $29,851 $30,747 $31,669 $100,823 $250,210
Sources 2023 2024 2025 2026 2027 2028-2032 10-Year Total 98-101 $ $- $- $- $- $- $- $Other City $ 28,138 28,982 29,851 30,747 31,669 100,823 250,210 External $ - - - - - -Total Sources $28,138 $28,982 $29,851 $30,747 $31,669 $100,823 $250,210
Capital Improvement Projects Stormwater
Mile High Flood District Joint Master Plan Studies
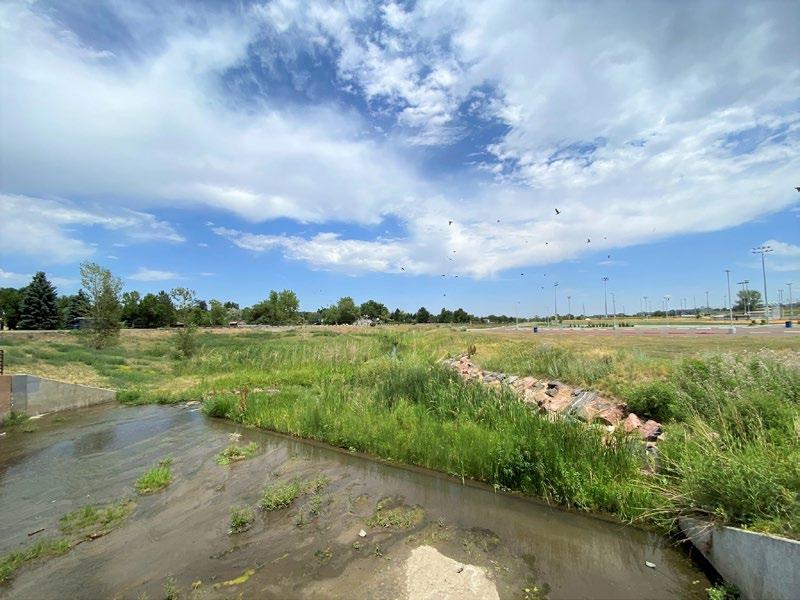
Description
Drainageway Master Plans are updated or created through collaboration with the Mile High Flood District in order to identify solutions to basin-wide drainage problems. By contributing financial support, the City becomes eligible to receive Mile High Flood District construction funds as they are available.
Project Justification
This project is for engineering analysis and the creation of drainageway master plans to identify basin-wide drainage problems. Basins can also traverse across multiple jurisdictional lines.
Strategic Plan Alignment
Strategic Priority: Infrastructure
The community depends on a well-maintained foundation of streets, sidewalks, and water, wastewater and stormwater facilities. Planned and steady population growth requires proper maintenance of existing infrastructure and additional capacity to support a thriving community.
Project Funding
Strategic Principle: Provides the community with a safe, reliable, high-quality water supply, drainage system, and wastewater disposal services for full city build-out, as defined by the Comprehensive Plan. This includes maintaining utility rates at lowest practical levels with accurate billing that supports replacement of aging infrastructure in order to maintain robust utility systems.
Funded through the stormwater utility fee. These funds match contributions by the Mile High Flood District.
Project Cost Estimate and Timeline
This is an ongoing project.
Operating Cost Impact
There is no operating cost impact.
223
Uses 2023 2024 2025 2026 2027 2028-2032 10-Year Total Design $59,703 $65,000 $ 68,000 $71,000 $75,000 $436,000 $774,703 Acquisition
- -Construction - - - - - -Total Uses $59,703 $65,000 $ 68,000 $71,000 $75,000 $436,000 $774,703
- - - -
Sources 2023 2024 2025 2026 2027 2028-2032 10-Year Total 98-101 $ $- $- $- $- $- $- $Other City $ 59,703 65,000 68,000 71,000 75,000 436,000 774,703 External $ - - - - - -Total Sources $59,703 $65,000 $ 68,000 $71,000 $75,000 $436,000 $774,703
Capital Improvement Projects Stormwater
Ralston Creek Improvements - Vance Street to Wadsworth By-Pass
Description
The purpose of this project is to remove around twenty residential properties in the 100-year floodplain along Ralston Creek from upstream of Vance Street to Wadsworth By-Pass. A detailed solution has not been identified, but it will probably be a combination of capital solutions and purchasing flood prone properties.
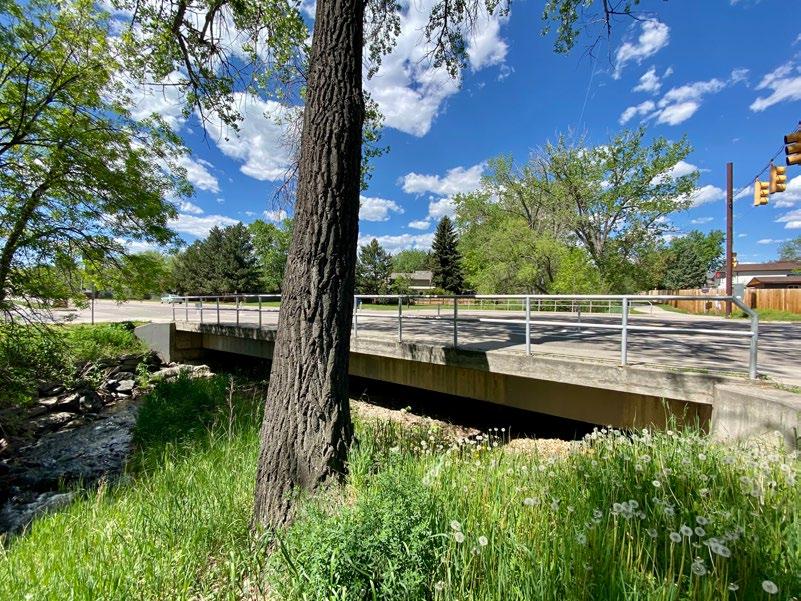
Project Justification
About 20 homes in this area have been in the 100-year floodplain for years. The neighborhood is adjacent to Olde Town and with the opening of the G Line Commuter Rail, it will be difficult for those properties in the floodplain to reach their full redevelopment potential.
Strategic Plan Alignment
Strategic Priority: Infrastructure
The community depends on a well-maintained foundation of streets, sidewalks, and water, wastewater and stormwater facilities. Planned and steady population growth requires proper maintenance of existing infrastructure and additional capacity to support a thriving community.
Project Funding
Strategic Principle:
Provides the community with a safe, reliable, high-quality water supply, drainage system, and wastewater disposal services for full city build-out, as defined by the Comprehensive Plan. This includes maintaining utility rates at lowest practical levels with accurate billing that supports replacement of aging infrastructure in order to maintain robust utility systems.
Funded through the stormwater utility fee and from a FEMA property acquisition feasibility study grant. Other grant opportunities will be pursued.
Project Cost Estimate and Timeline
This project is expected to begin in 2023 and be completed by 2026.
Operating Cost Impact
There is no operating cost impact.
224
Uses Existing 2023-2032 Project Total Design $- $238,810 $238,810 Acquisition - 418,000 418,000 Construction - 1,267,190 1,267,190 Total Uses $- $1,924,000 $1,924,000
Timeline Start Completion Design 2023 2023 Acquisition 2024 2025 Construction 2025 2027 Sources Existing 2023 2024 2025 2026 2027 2028-2032 Project Total 98-101 $ $- $- $- $- $- $- $- $Other City $ - - 20,000 424,000 634,000 666,000 - 1,744,000 External $ - 180,000 - - - - - 180,000 Total Sources $- $180,000 $20,000 $424,000 $634,000 $666,000 $- $1,924,000
Capital Improvement Projects Stormwater
Van Bibber Creek from Oak St to Kipling Pkwy
Description
As a result of an updated hydraulic analysis of Van Bibber Creek, improvement are required at the Oak St and Kipling Parkway crossings as well as main and overflow channel improvements.
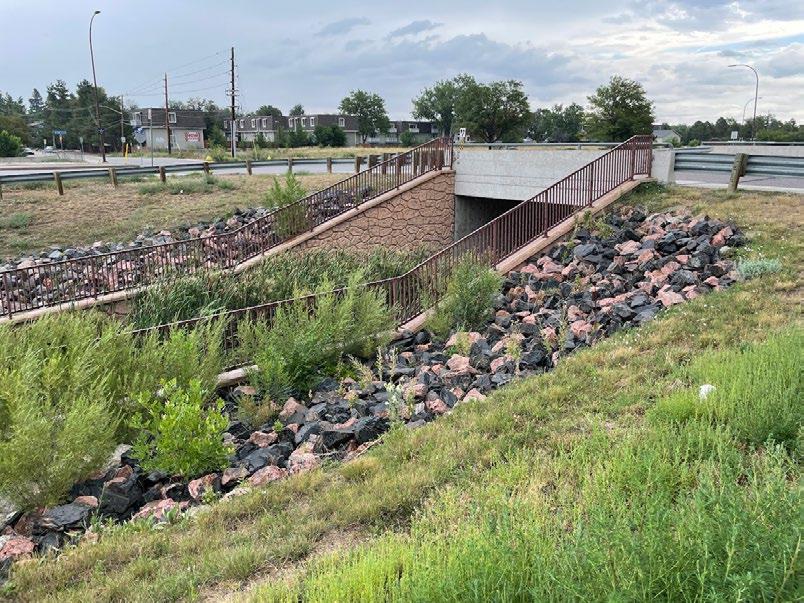
Project Justification
To reduce the flood water surface evaluations and meet the intent of the US Army Corps of Engineers “Flood Projection Project Segment 2 Upstream of New Kipling,” completed in July 2006.
Strategic Plan Alignment
Strategic Priority: Infrastructure
The community depends on a well-maintained foundation of streets, sidewalks, and water, wastewater and stormwater facilities. Planned and steady population growth requires proper maintenance of existing infrastructure and additional capacity to support a thriving community.
Project Funding
Strategic Principle:
Provides the community with a safe, reliable, high-quality water supply, drainage system, and wastewater disposal services for full city build-out, as defined by the Comprehensive Plan. This includes maintaining utility rates at lowest practical levels with accurate billing that supports replacement of aging infrastructure in order to maintain robust utility systems.
This project is anticipated to be completed through 50/50 cost sharing with the Mile High Flood District.
Project Cost Estimate and Timeline
Design is expected to start in 2023 and run through part of 2024. Construction expected to run the majority of 2025 through 2026.
Operating Cost Impact
This is a joint capital project with MHFD which qualifies for their Maintenance Eligibility Program(MEP). Through MEP. MHFD funding can be used to help operate and maintain the capital improvements.
225
Uses Existing 2023-2032 Project Total Design $- $360,000 $360,000 Acquisition - -Construction - 1,720,000 1,720,000 Total Uses $- $2,080,000 $2,080,000
Timeline Start Completion Design 2023 2024 Acquisition Construction 2026 2027 Sources Existing 2023 2024 2025 2026 2027 2028-2032 Project Total 98-101 $ $- $- $- $- $- $- $- $Other City $ - 425,000 300,000 - 79,000 - - 804,000 External $ - - 225,000 551,000 500,000 - - 1,276,000 Total Sources $- $425,000 $525,000 $551,000 $579,000 $- $- $2,080,000
Capital Improvement Projects
Street Maintenance Overview
The Street Maintenance category includes funding for the asphalt program. Over $100 million is dedicated to street maintenance over the ten-year life of the program. The Street Maintenance program is funded through the City’s operating budget. Additional funding is provided through the capital program for ADA compliance improvements to the City’s curb ramps.
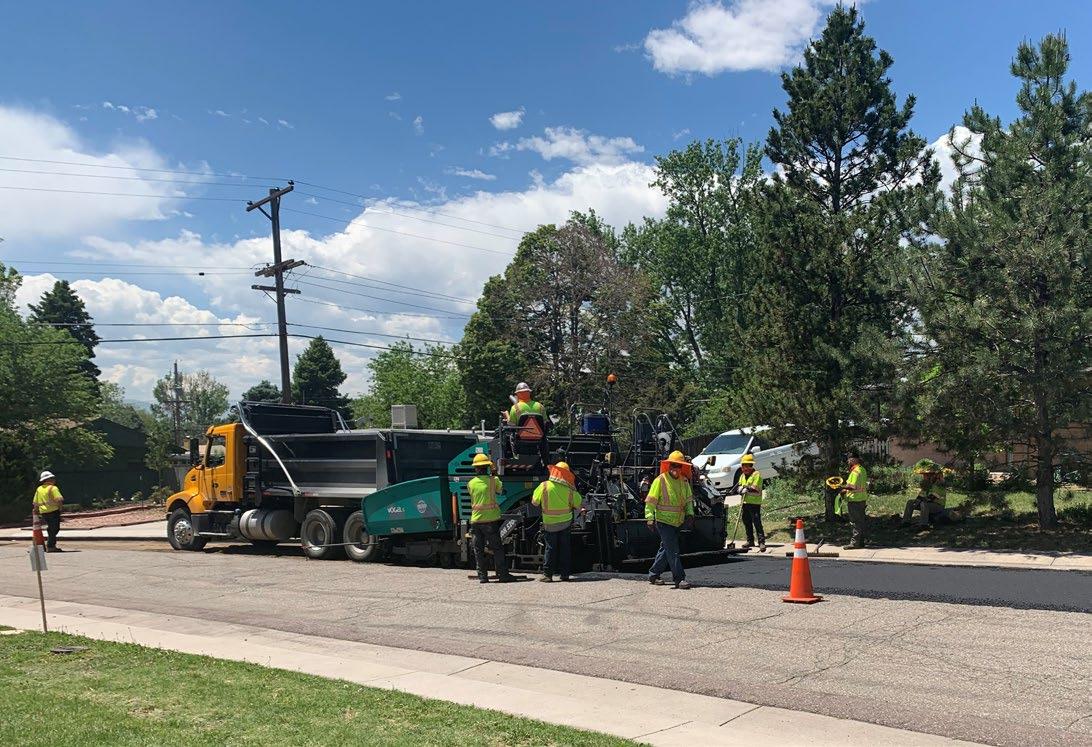
Summary of Street Maintenance Sources
Summary of Street Maintenance Uses
226
Uses Existing 2021 2022 2023 2024 2025 2026-2030 Total Design $- $- $- $- $- $- $- $Acquisition - - - - - - -Construction - 12,763,701 13,469,576 13,919,864 14,285,401 14,660,936 77,088,476 145,587,954 Total Uses - $12,643,701 $13,349,576 $13,799,864 $14,165,401 $14,540,936 $77,088,476 $145,587,954 Sources Existing 2023 2024 2025 2026 2027 2028-2032 Total 98-101 $ $- $689,580 $485,332 $549,693 $517,724 $483,828 $604,279 $3,330,436 Other City $ - 11,954,121 12,864,244 13,250,171 13,647,677 14,057,108 76,484,197 142,257,518 External $ - - - - - - -Total Sources $ - $12,643,701 $13,349,576 $13,799,864 $14,165,401 $14,540,936 $77,088,476 $145,587,954
Capital Improvement Projects Street Maintenance
ADA Compliance - Streets
Description
This project funds the Federal requirement to replace non-compliant sidewalks and install or upgrade to new compliant ramps on streets with significant treatments or alterations. It also installs ramps along heavily used pedestrian corridors and special needs locations.
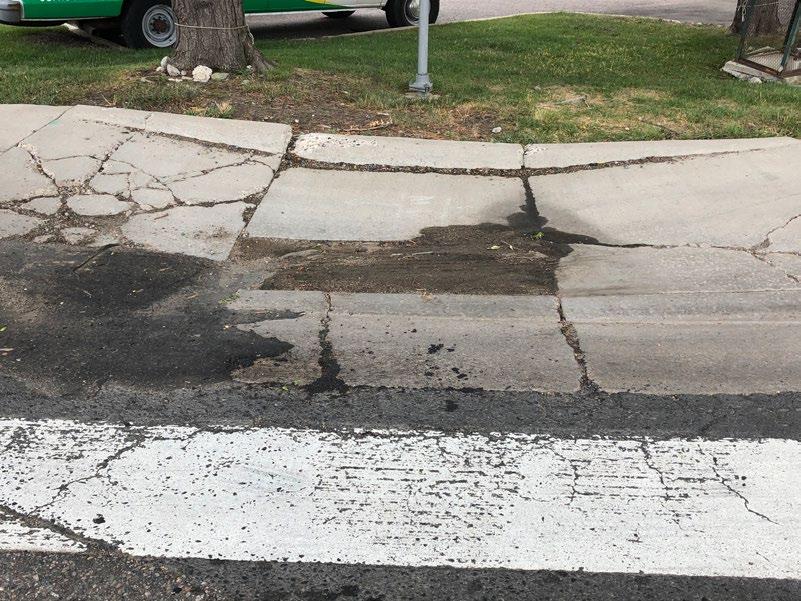
Project Justification
This project fulfills a federal requirement per Title II of the Americans with Disabilities Act of 1990, utilizing the Public Right of Way Access Guidelines (PROWAG) adopted by the DOJ in 2010. It increases access to physically impaired individuals and installs ramps in areas of high pedestrian traffic and in neighborhoods where there are ADA ramp deficiencies and known physically impaired residents live.
Strategic Plan Alignment
Strategic Priority: Infrastructure The community depends on a well-maintained foundation of streets, sidewalks, and water, wastewater and stormwater facilities. Planned and steady population growth requires proper maintenance of existing infrastructure and additional capacity to support a thriving community.
Project Funding
Strategic Principle: Maintains existing roads and transportation network in tandem with snow and ice control services to ensure swift and safe transportation modes for the community.
This project provides ongoing funding for continuous ADA improvement, but there is a large unmet need to reach full compliance with the federal requirement.
Project Cost Estimate and Timeline
This is an ongoing project. The funding will be utilized as particular needs are identified.
Operating Cost Impact
There are no additional operating costs associated with this project.
227
Uses 2023 2024 2025 2026 2027 2028-2032 10-Year Total Design $- $- $- $- $- $- $Acquisition
- - - - -Construction 689,580 485,332 549,693 517,724 483,828 604,279 3,330,436 Total Uses $689,580 $485,332 $549,693 $517,724 $483,828 $604,279 $3,330,436
-
Sources 2023 2024 2025 2026 2027 2028-2032 10-Year Total 98-101 $ $689,580 $485,332 $549,693 $517,724 $483,828 $604,279 $3,330,436 Other City $ - - - - - -External $ - - - - - -Total Sources $689,580 $485,332 $549,693 $517,724 $483,828 $604,279 $3,330,436
Capital Improvement Projects Street Maintenance
Asphalt and Concrete Replacement Description
This project includes asphalt maintenance and rehabilitation as well as concrete replacement. Arvada’s street infrastructure of 1,498 lane miles is the City’s largest and most valuable asset. The concrete program provides improved surface drainage and compliant ADA ramps.
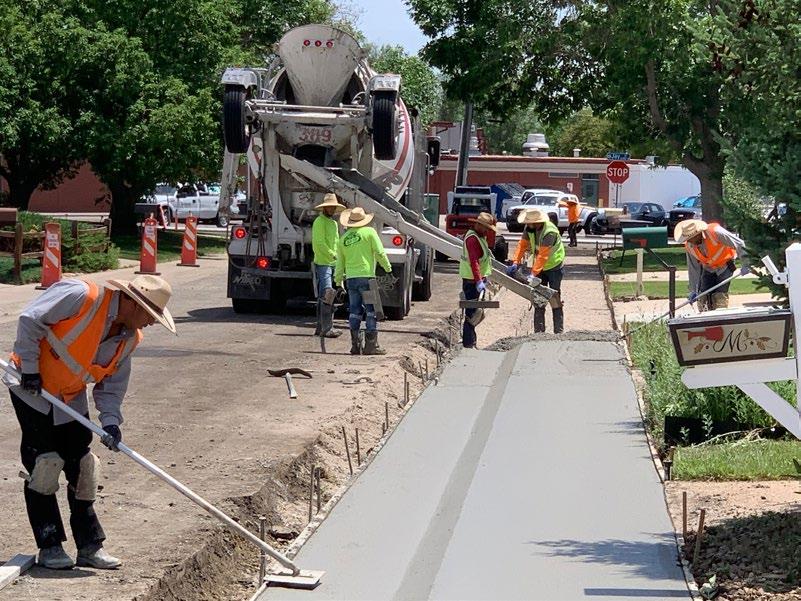
Project Justification
This project addresses the pressing need for additional resources to repair and maintain roads and streets in Arvada. In 2016, the electors of Arvada rejected a proposed tax to fund additional street maintenance. While the tax increase did not pass, the City redirected operating funds to address street maintenance needs.
Strategic Plan Alignment
Strategic Priority: Infrastructure
The community depends on a well-maintained foundation of streets, sidewalks, and water, wastewater and stormwater facilities. Planned and steady population growth requires proper maintenance of existing infrastructure and additional capacity to support a thriving community.
Project Funding
Strategic Principle: Maintains existing roads and transportation network in tandem with snow and ice control services to ensure swift and safe transportation modes for the community.
This project is funded by the Streets Fund, which is part of the City’s operating budget. Revenues come from the City’s General Fund and the Highway Users Tax Fund (HUTF), and other funds from FASTER funds as part of HUTF. External funding comes from street degradation fees.
Project Cost Estimate and Timeline
This is an ongoing project. Priorities will be determined through the annual pavement assessment. Personnel costs, testing, equipment, maintenance treatments, and materials are not reflected in these numbers.
Operating Cost Impact
This project is funded through the City’s operating budget. Additional operating expenses related to this project are reflected in the Streets fund.
228
Uses 2023 2024 2025 2026 2027 2028-2032 10-Year Total Design $- $- $- $- $- $- $Acquisition
Construction 11,954,121 12,864,244 13,250,171 13,647,677 14,057,108 76,484,198 142,257,519 Total Uses $11,954,121 $12,864,244 $13,250,171 $13,647,677 $14,057,108 $76,484,198 $142,257,519
- - - - - - -
Sources 2023 2024 2025 2026 2027 2028-2032 10-Year Total 98-101 $ $- $- $- $- $- $- $Other City $ 11,954,121 12,864,244 13,250,171 13,647,677 14,057,108 76,484,198 142,257,519 External $ Total Sources $11,954,121 $12,864,244 $13,250,171 $13,647,677 $14,057,108 $76,484,198 $142,257,519
Capital Improvement Projects
Transportation Overview
The Transportation category includes all redesign and construction of transportation infrastructure within the City limits, including roads, bridges, traffic signals, intersections, guardrails, bike lanes, and sidewalks. Much of the funding for transportation is dedicated to “Taking Lasting Care” of existing transportation infrastructure. However, the ten-year plan also includes funding for specific improvements to Leyden Road, Ralston Road, Pierce Street, and the Indiana Corridor. In addition, the ten year program targets challenges relating to traffic congestion with such projects as the Transportation Master Plan, Signal Interconnect, and Signal Timing Implementation.

Summary of Transportation Sources
Summary of Transportation Uses
229
Uses Existing 2023 2024 2025 2026 2027 2028-2032 Total Design $44,239 $1,225,159 $831,484 $343,015 $345,895 $354,759 $2,367,129 $5,511,679 Acquisition 143,122 414,918 118,161 131,106 134,757 147,756 808,792 1,898,613 Construction - 4,635,634 4,456,195 3,437,476 3,481,393 3,606,837 22,520,539 42,138,074 Total Uses $187,361 6,275,712 $5,405,841 $3,911,597 $3,962,045 $4,109,352 $25,696,459 $49,548,366 Sources Existing 2023 2024 2025 2026 2027 2028-2032 Total 98-101 $ $2,141,697 $3,234,431 $3,234,566 $3,826,051 $3,873,934 $4,018,596 $25,328,709 $45,657,984 Other City $ - - - - - - -External $ 3,530,861 80,635 283,054 85,546 88,112 90,755 496,288 4,655,251 Total Sources $5,672,558 $3,315,066 $3,517,620 $3,911,597 $3,962,046 $4,109,351 $25,824,997 $50,313,235
Capital Improvement Projects Transportation
Adams County Transportation Projects Description
Each year the City receives about $75,000 in a Transportation Tax from Adams County that can only be used in Adams County for transportation-related projects. The funds are captured in a holding account. The monies are used to complete missing sidewalks, upgrade street sections not meeting current City standards, and for the City match on jointly funded projects.

Project Justification
The TOD Bike-Ped Access Plan describes the need for roadway retrofits along W 60th Ave, Tennyson St, W 64th Ave and Sheridan Blvd. The retrofits adjust the lane channelization to include bicycle lanes, parking, and travel lanes. The plan also identifies expansion or construction of sidewalks. These upgrades result in streets that meet current City standards and fund City matches on joint projects.
Strategic Plan Alignment
Strategic Priority: Infrastructure
The community depends on a well-maintained foundation of streets, sidewalks, and water, wastewater and stormwater facilities. Planned and steady population growth requires proper maintenance of existing infrastructure and additional capacity to support a thriving community.
Project Funding
Strategic Principle: Maintains existing roads and transportation network in tandem with snow and ice control services to ensure swift and safe transportation modes for the community.
Each year the City receives about $75,000 through a transportation sales tax from Adams County that can only be used in Adams County for transportation purposes.
Project Cost Estimate and Timeline
This is an ongoing project. Funding will be utilized as eligible needs are identified.
Operating Cost Impact
There is no operating cost impact.
230
Uses 2023 2024 2025 2026 2027 2028-2032 10-Year Total Design $4,032 $4,153 $4,277 $4,406 $4,538 $24,816 $46,221 Acquisition
Construction 76,603 78,901 81,268 83,706 86,218 471,473 878,170 Total Uses $80,635 $83,054 $85,546 $88,112 $90,755 $496,288 $924,390
- - - - - - -
Sources 2023 2024 2025 2026 2027 2028-2032 10-Year Total 98-101 $ $- $- $- $- $- $- $Other City $ - - - - - -External $ 80,635 83,054 85,546 88,112 90,755 496,288 924,390 Total Sources $80,635 $83,054 $85,546 $88,112 $90,755 $496,288 $924,390
Capital Improvement Projects Transportation
Arterial Improvements Description
This project will improve segments of arterial streets meriting work due to traffic demand. Work may include improvements to existing lanes, addition of turn lanes, etc.
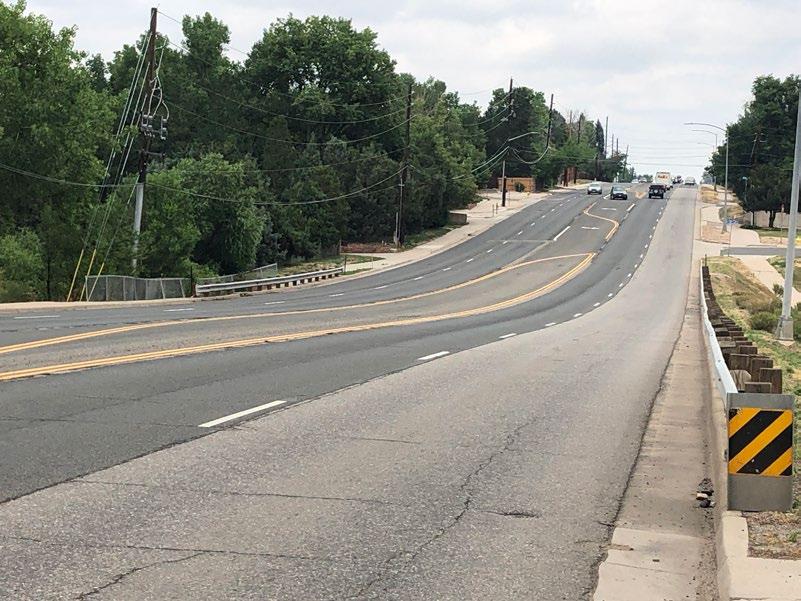
Project Justification
This project provides spot and intersection improvements on arterials as traffic volumes increase and as needs arise.
Strategic Plan Alignment
Strategic Priority: Infrastructure
The community depends on a well-maintained foundation of streets, sidewalks, and water, wastewater and stormwater facilities. Planned and steady population growth requires proper maintenance of existing infrastructure and additional capacity to support a thriving community.
Project Funding
This project is fully funded.
Project Cost Estimate and Timeline
Strategic Principle: Provides safe and efficient connections to modes of transportation, including transit, streets, sidewalks, and bikeways with a focus on enhanced technology at high-priority intersections improving safety and minimizing traffic congestion.
This is an ongoing project. The funding will be utilized as particular needs are identified.
Operating Cost Impact
There are no ongoing operating costs associated with arterial improvements.
231
Uses 2023 2024 2025 2026 2027 2028-2032 10-Year Total Design $- $- $30,000 $30,000 $30,000 $634,929 $724,929 Acquisition
- - -
Construction - - 270,000 270,000 270,000 5,714,360 6,524,360 Total Uses $- $- $300,000 $300,000 $300,000 $6,349,289 $7,249,289
- - -
-
Sources 2023 2024 2025 2026 2027 2028-2032 10-Year Total 98-101 $ $- $- $300,000 $300,000 $300,000 $6,349,289 $7,249,289 Other City $ - - - - - -External $ - - - - - -Total Sources $- $- $300,000 $300,000 $300,000 $6,349,289 $7,249,289
Capital Improvement Projects Transportation
Bike Master Plan Implementation Description
This project will initiate study, design and construction of projects related to the bicycle master plan. Projects under consideration include improvements to the Ralston Creek Trail (Johnson Way), a Bike Boulevard on W. 57th Ave., and a demonstration project on Ward Road.
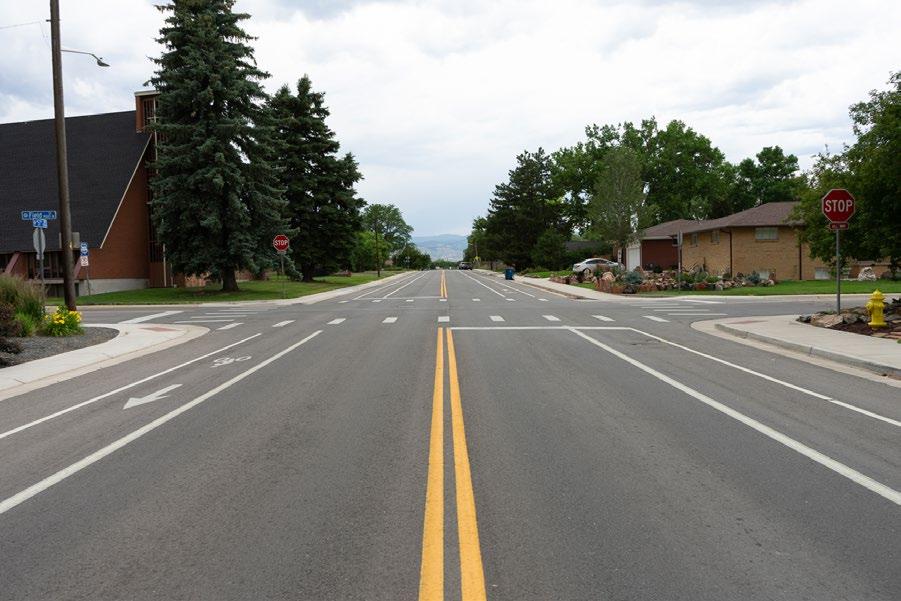
Project Justification
The bike master plan is ready for implementation. Demand for alternative forms of transportation is increasing, as shown in the results of the citizen’s survey and comments from City Council members.
Strategic Plan Alignment
Strategic Priority: Infrastructure
The community depends on a well-maintained foundation of streets, sidewalks, and water, wastewater and stormwater facilities. Planned and steady population growth requires proper maintenance of existing infrastructure and additional capacity to support a thriving community.
Project Funding
Strategic Principle: Provides safe and efficient connections to modes of transportation, including transit, streets, sidewalks, and bikeways with a focus on enhanced technology at high-priority intersections improving safety and minimizing traffic congestion.
This project provides periodic, ongoing funding for implementation of the bike master plan, but does not fully fund all needs identified.
Project Cost Estimate and Timeline
This is an ongoing, multi-year project.
Operating Cost Impact
Regular maintenance of roadway improvement.
232
Uses 2023 2024 2025 2026 2027 2028-2032 10-Year Total Design $15,000 $- $30,000 $30,000 $30,000 $150,000 $255,000 Acquisition
Construction 35,000 - 70,000 70,000 70,000 350,000 595,000 Total Uses $50,000 $- $100,000 $100,000 $100,000 $500,000 $850,000
- - - - - - -
Sources 2023 2024 2025 2026 2027 2028-2032 10-Year Total 98-101 $ $50,000 $- $100,000 $100,000 $100,000 $500,000 $850,000 Other City $ - - - - - -External $ - - - - - -Total Sources $50,000 $- $100,000 $100,000 $100,000 $500,000 $850,000
Capital Improvement Projects Transportation
Bridge Repair
Description
Non-CDOT bridges need to be regularly inspected and maintained. The City has bridges that need attention in order to ensure the safety and ongoing maintenance of the existing infrastructure.
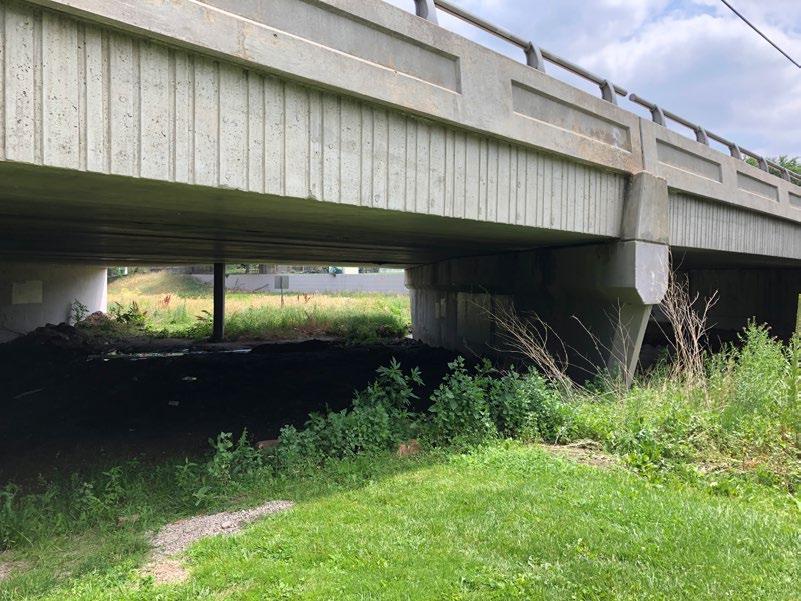
Project Justification
There are bridge infrastructure issues in the City that need repair or maintenance. If bridge maintenance issues are not addressed routinely, expensive repairs or replacement is likely. Without sufficient funding, bridge infrastructure will deteriorate.
Strategic Plan Alignment
Strategic Priority: Infrastructure
The community depends on a well-maintained foundation of streets, sidewalks, and water, wastewater and stormwater facilities. Planned and steady population growth requires proper maintenance of existing infrastructure and additional capacity to support a thriving community.
Project Funding
This project is fully funded.
Project Cost Estimate and Timeline
This is an ongoing project.
Operating Cost Impact
There are no ongoing operating costs associated with this project.
Strategic Principle: Maintains existing roads and transportation network in tandem with snow and ice control services to ensure swift and safe transportation modes for the community.
233
Uses 2023 2024 2025 2026 2027 2028-2032 10-Year Total Design $50,000 $50,000 $50,000 $50,000 $50,000 $272,725 $522,725 Acquisition
- - - -Construction 200,000 200,000 200,000 200,000 200,000 1,000,000 2,000,000 Total Uses $250,000 $250,000 $250,000 $250,000 $250,000 $1,272,725 $2,522,725
- -
Sources 2023 2024 2025 2026 2027 2028-2032 10-Year Total 98-101 $ $250,000 $250,000 $250,000 $250,000 $250,000 $1,272,725 $2,522,725 Other City $ - - - - - -External $ - - - - - -Total Sources $250,000 $250,000 $250,000 $250,000 $250,000 $1,272,725 $2,522,725
Capital
Improvement Projects Transportation
Citywide Survey Datum Update
Description
The “Arvada” datum is not in compliance with regulations and does not align with nationally recognized and accepted datums. NGS datums provide for consistent and reliable datums that engineers, surveyors, and GIS professionals use for accurate horizontal and vertical positioning that are consistent with one another, scalable, and compatible with future datums developed by the NGS.
Project Justification
Strategic Plan Alignment
The community depends on a well-maintained foundation of streets, sidewalks, and water, wastewater and stormwater facilities. Planned and steady population growth requires proper maintenance of existing infrastructure and additional capacity to support a thriving community.
Project Funding
(blank)
Project Cost Estimate and Timeline
(blank)
Strategic Principle: Applies cost-effective and timely engineering design, geographic information, effective construction practices, and established standards and specifications to align public infrastructure priorities with community growth and redevelopment needs.
Timeline Start Completion Design 2024 2024 Acquisition Construction 2024 2024 Sources Existing 2023 2024 2025 2026 2027 2028-2032 Project Total 98-101 $ $- $- $55,000 $- $- $- $- $55,000 Other City $ - - - - - - -External $ - - - - - - -Total Sources $- $- $55,000 $- $- $- $- $55,000
Operating Cost Impact
234
Estimated cost savings of $20,000 per year. Uses Existing 2023-2032 Project Total Design $- $- $Acquisition - -Construction - 55,000 55,000 Total Uses $- $55,000 $55,000
Strategic Priority: Infrastructure
There is a lack of data integrity and consistency that currently leads to increased City and Consultant efforts to provide accurate survey data to base engineering decisions upon.
Capital Improvement Projects Transportation
Collector Street Improvements Description
This project completes isolated improvements along collector streets such as turn lanes, curb gutters, sidewalks, etc. It may also provide the City’s match for outside funding on projects, such as preliminary engineering studies or design needed to apply for outside grants, and it can serve as supplemental funding between a budgeted project and actual costs.
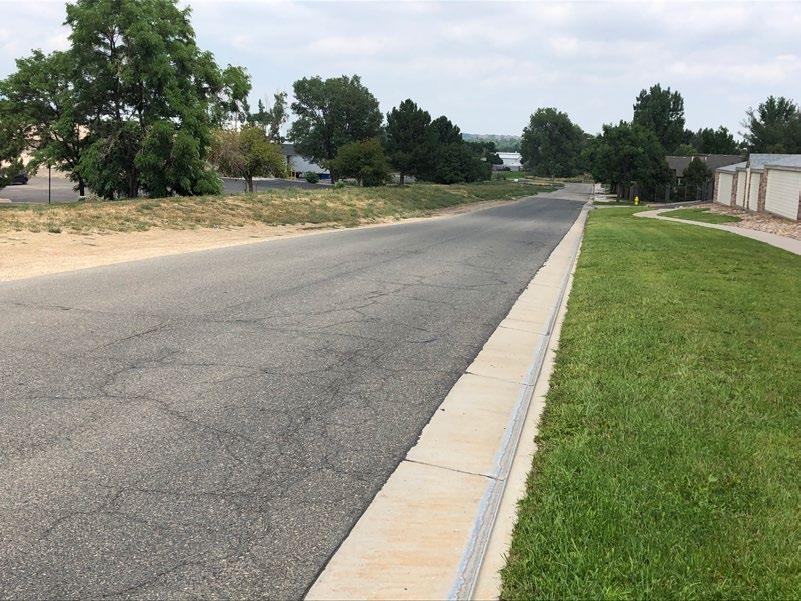
Project Justification
This project completes projects along collector streets to bring them into compliance with the City’s collector street standards and to improve safety and capacity.
Strategic Plan Alignment
Strategic Priority: Infrastructure
The community depends on a well-maintained foundation of streets, sidewalks, and water, wastewater and stormwater facilities. Planned and steady population growth requires proper maintenance of existing infrastructure and additional capacity to support a thriving community.
Project Funding
This project is fully funded.
Project Cost Estimate and Timeline
Strategic Principle:
Provides safe and efficient connections to modes of transportation, including transit, streets, sidewalks, and bikeways with a focus on enhanced technology at high-priority intersections improving safety and minimizing traffic congestion.
This is an ongoing project. The funding will be utilized as particular needs are identified.
Operating Cost Impact
There are no new costs associated with Collector Street Improvements.
235
Uses 2023 2024 2025 2026 2027 2028-2032 10-Year Total Design $3,360 $3,461 $3,564 $3,671 $3,781 $20,679 $38,516 Acquisition
Construction 63,836 65,751 67,724 69,755 71,848 392,894 731,808 Total Uses $67,196 $69,212 $71,288 $73,427 $75,629 $413,572 $770,324
- - - - - - -
Sources 2023 2024 2025 2026 2027 2028-2032 10-Year Total 98-101 $ $67,196 $69,212 $71,288 $73,427 $75,629 $413,571 $770,323 Other City $ - - - - - -External $ - - - - - -Total Sources $67,196 $69,212 $71,288 $73,427 $75,629 $413,571 $770,323
Capital Improvement Projects Transportation
Guardrails Description
This project will be used to conduct an inventory of the City’s guardrails, perform a structural assessment on existing guardrails, and install new guardrails or mitigate hazards that do not meet current City and AASHTO standards for roadside clear zones. Mitigation measures, in addition to the installation of guardrails or other barriers, may include installing or extending culverts to eliminate a ditch or culvert end section or the removal of large roadside objects that pose a hazard to the traveling public.
Project Justification
This project eliminates safety hazards to motorists and pedestrians. Funding for guardrails was included in the 2015 Citizens Capital Improvement Project Committee’s recommendations to City Council.
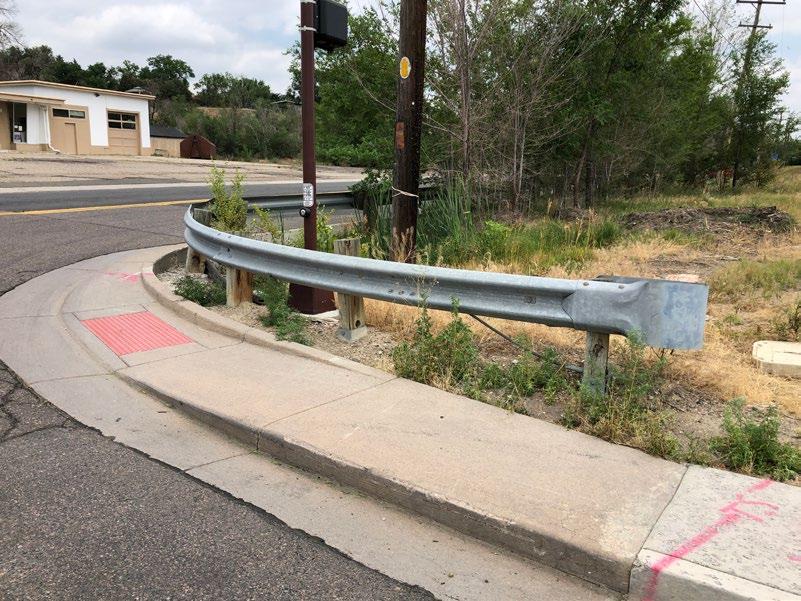
Strategic Plan Alignment
Strategic Priority: Infrastructure
The community depends on a well-maintained foundation of streets, sidewalks, and water, wastewater and stormwater facilities. Planned and steady population growth requires proper maintenance of existing infrastructure and additional capacity to support a thriving community.
Project Funding
Strategic Principle: Maintains existing roads and transportation network in tandem with snow and ice control services to ensure swift and safe transportation modes for the community.
This project provides consistent, ongoing funding for guardrails, but there is an additional unmet need.
Project Cost Estimate and Timeline
This is an ongoing project. The funding will be utilized as particular needs are identified.
Operating Cost Impact
There are no operating costs associated with guardrails.
236
Uses 2023 2024 2025 2026 2027 2028-2032 10-Year Total Design $- $- $- $- $- $- $Acquisition - - - - - -Construction 59,851 60,747 61,669 62,619 62,619 325,904 633,409 Total Uses $59,851 $60,747 $61,669 $62,619 $62,619 $325,904 $633,409
Sources 2023 2024 2025 2026 2027 2028-2032 10-Year Total 98-101 $ $59,851 $60,747 $61,669 $62,619 $62,619 $325,904 $633,409 Other City $ - - - - - -External $ - - - - - -Total Sources $59,851 $60,747 $61,669 $62,619 $62,619 $325,904 $633,409
Capital Improvement Projects Transportation
Indiana Corridor Improvement Study Description
The CIP funds will provide transportation planning and preliminary engineering design for a significant railroad bottleneck on a strategic roadway corridor: SH-72 Indiana Street, bounded by W 82nd Ave and W 86th Pkwy. The City has obtained CDOT commitment for a funding match and has positioned the corridor for regional funding through DRCOG. The CIP funds will be used to coordinate the City and State priorities with addressing environmental clearance and railroad requirements. By completing the initial steps, the City can apply for $39,000,000 in DRCOG construction funding (grant) between 20292039.
Project Justification
Indiana St. is a major north/south corridor. Traffic volumes have significantly increased over the past few years since the NW area of Arvada is being built out. The additional traffic and congestion is a significant issue for motorists and the public has actively encouraged the City to address this issue. The first required step is transportation planning to coordinate priorities between the City and State, identifying complexities associated with environmental and railroad requirements, and develop a preliminary design that shows project “readiness” and can be used to obtain regional funding.
Strategic Plan Alignment
Strategic Priority: Infrastructure
The community depends on a well-maintained foundation of streets, sidewalks, and water, wastewater and stormwater facilities. Planned and steady population growth requires proper maintenance of existing infrastructure and additional capacity to support a thriving community.
Project Funding
Strategic Principle: Provides safe and efficient connections to modes of transportation, including transit, streets, sidewalks, and bikeways with a focus on enhanced technology at high-priority intersections improving safety and minimizing traffic congestion.
This grant match is funded through the City’s 98-101 funding. The remainder of this study will be funded through a pending federal grant, which has been requested but not yet approved.
Project Cost Estimate and Timeline
The Transportation study is only the first step in the Indiana Corridor Improvement. By completing the plan and preliminary design, the City can initiate environmental and railroad coordination. The next step will be project design which is estimated at $4-10 million.
Operating Cost Impact
There is no operating cost impact associated with this project.
237
Uses Existing 2023-2032 Project Total Design $- $474,000 $474,000 Acquisition - -Construction - -Total Uses $- $474,000 $474,000
Timeline Start Completion Design 2024 2028 Acquisition Construction Sources Existing 2023 2024 2025 2026 2027 2028-2032 Project Total 98-101 $ $274,000 $- $- $- $- $- $- $274,000 Other City $ - - - - - - -External $ - - 200,000 - - - - 200,000 Total Sources $274,000 $- $200,000 $- $- $- $- $474,000
Capital Improvement Projects Transportation
Intersection Safety Improvements
Description
The Traffic Division analyzes intersections annually to determine if improvements are needed. Funds are used to rebuild arterial intersections, modify traffic signals, and reduce the risk of accidents.
Project Justification
This project improves intersections in order to reduce road and intersection related accidents.
Strategic Plan Alignment
Strategic Priority: Infrastructure
The community depends on a well-maintained foundation of streets, sidewalks, and water, wastewater and stormwater facilities. Planned and steady population growth requires proper maintenance of existing infrastructure and additional capacity to support a thriving community.
Project Funding
This project is fully funded.
Project Cost Estimate and Timeline
Strategic Principle: Provides safe and efficient connections to modes of transportation, including transit, streets, sidewalks, and bikeways with a focus on enhanced technology at high-priority intersections improving safety and minimizing traffic congestion.
This is an ongoing project. Funds are used as needs are determined through analysis of intersections.
Operating Cost Impact
There is no operating cost impact.
238
Uses 2023 2024 2025 2026 2027 2028-2032 10-Year Total Design $5,040 $5,191 $5,347 $5,507 $5,672 $31,018 $57,774 Acquisition 5,040 5,191 5,347 5,507 5,672 31,019 57,775 Construction 90,714 93,436 96,239 99,126 102,100 558,324 1,039,938 Total Uses $100,794 $103,818 $106,932 $110,140 $113,444 $620,360 $1,155,488
Sources 2023 2024 2025 2026 2027 2028-2032 10-Year Total 98-101 $ $100,794 $103,818 $106,932 $110,140 $113,444 $620,361 $1,155,489 Other City $ - - - - - -External $ - - - - - -Total Sources $100,794 $103,818 $106,932 $110,140 $113,444 $620,361 $1,155,489
Capital Improvement Projects Transportation
Leyden Road Improvement Project Description
Leyden Road needs improvement as a result of the significant development that has occurred in this area. This project intends to be a planning document to identify: 1) 10% roadway design, 2) right-of-way, 3) environmental impacts, 4) survey, 5) conceptual construction costs.
Project Justification
With the significant development and increased traffic on Leyden Road and adjacent roadways, Leyden road is no longer capable of handling the traffic volume. This project intends to begin the study and design work associated with improving Leyden Road.
Strategic Plan Alignment
Strategic Priority: Infrastructure
The community depends on a well-maintained foundation of streets, sidewalks, and water, wastewater and stormwater facilities. Planned and steady population growth requires proper maintenance of existing infrastructure and additional capacity to support a thriving community.
Project Funding
Strategic Principle:
Provides safe and efficient connections to modes of transportation, including transit, streets, sidewalks, and bikeways with a focus on enhanced technology at high-priority intersections improving safety and minimizing traffic congestion.
This project is funded through Traffic Impact Fees from the Leyden Rock and Leyden Ranch developments.
Project Cost Estimate and Timeline
This project is for the initial study and project design. Once complete, construction costs and timing will be reviewed.
Operating Cost Impact
There are no additional operating costs associated with this project.
239
Uses Existing 2023-2032 Project Total Design $- $600,000 $600,000 Acquisition - -Construction - -Total Uses $- $600,000 $600,000
Timeline Start Completion Design TBD TBD Acquisition TBD TBD Construction TBD TBD Sources Existing 2023 2024 2025 2026 2027 2028-2032 Project Total 98-101 $ $- $- $- $- $- $- $- $Other City $ - - - - - - -External $ 600,000 - - - - - - 600,000 Total Sources $600,000 $- $- $- $- $- $- $600,000
Capital Improvement Projects Transportation
Pierce Street Sidewalks
Description
This project will construct a new sidewalk with a curb along Pierce Street from 60th Ave. to 62nd Ave. in order to provide a safer environment for students walking to Secrest Elementary School.
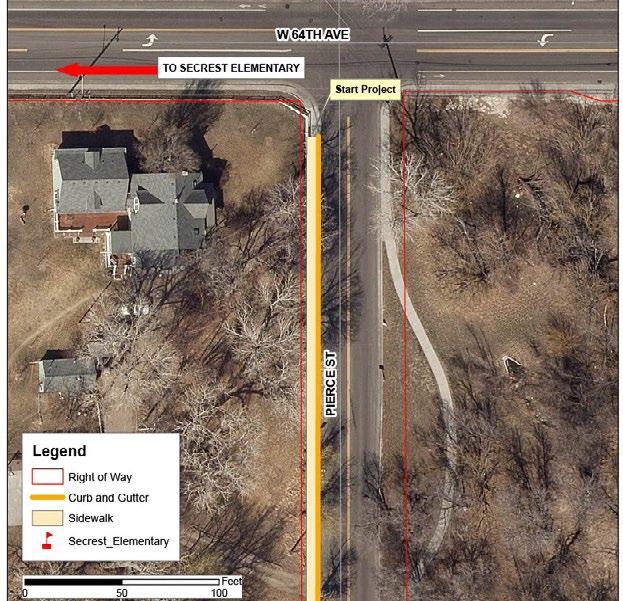
Project Justification
Strategic Plan Alignment
Strategic Priority: Infrastructure
The community depends on a well-maintained foundation of streets, sidewalks, and water, wastewater and stormwater facilities. Planned and steady population growth requires proper maintenance of existing infrastructure and additional capacity to support a thriving community.
Project Funding
Strategic Principle:
Provides safe and efficient connections to modes of transportation, including transit, streets, sidewalks, and bikeways with a focus on enhanced technology at high-priority intersections improving safety and minimizing traffic congestion.
This project is funded in part by a Safe Routes to School Grant. The balance is funded through the City’s Sidewalk/Transit-Oriented Development/Bike & Trail Gap capital program.
Project Cost Estimate and Timeline
This project is fully funded. It is expected to be complete by 2024.
Timeline Start Completion Design 2022 2022 Acquisition 2023 2023 Construction 2024 2024 Sources Existing 2023 2024 2025 2026 2027 2028-2032 Project Total 98-101 $ $806,565 $- $- $- $- $- $- $806,565 Other City $ - - - - - - -External $ - - - - - - -Total Sources $806,565 $- $- $- $- $- $- $806,565
Operating Cost Impact
240
There are no operating costs associated with this project. Uses Existing 2023-2032 Project Total Design $- $175,000 $175,000 Acquisition - -Construction - 631,565 631,565 Total Uses $- $806,565 $806,565
Pierce St. stretches from W 52nd to W 72nd within the Secrest Elementary School boundary area and is a collector roadway with around 1,500 vehicles per day and speed limits at 25 and 30 mph. Although most of the street has sidewalks on one side, there is a segment between W 60th Ave. and W 62nd Ave. that is missing a sidewalk on both sides of the street. Parent surveys indicated that many parents would never let their kids walk to school because of the speed of traffic.
Capital Improvement Projects Transportation
School Safety Description
This project provides funding to increase the safety of students walking or biking to school and serves as a potential match for grants through the Federal Safe Routes to School program.
Project Justification
This project will provide increased safety for elementary and middle school students who walk and bike to school.
Strategic Plan Alignment
Strategic Priority: Infrastructure
The community depends on a well-maintained foundation of streets, sidewalks, and water, wastewater and stormwater facilities. Planned and steady population growth requires proper maintenance of existing infrastructure and additional capacity to support a thriving community.
Project Funding
Strategic Principle: Provides safe and efficient connections to modes of transportation, including transit, streets, sidewalks, and bikeways with a focus on enhanced technology at high-priority intersections improving safety and minimizing traffic congestion.
Funding can be used for smaller school safety projects or as the 20% match to grants received through the Federal Safe Routes to School program.
Project Cost Estimate and Timeline
This is an ongoing project.
Operating Cost Impact
There is no operating cost impact.
241
Uses 2023 2024 2025 2026 2027 2028-2032 10-Year Total Design $8,063 $8,305 $8,555 $8,811 $9,076 $49,629 $92,439 Acquisition
-Construction 18,815 19,379 19,961 20,559 21,176 115,800 215,691 Total Uses $26,878 $27,685 $28,515 $29,371 $30,252 $165,429 $308,130
- - - - -
Sources 2023 2024 2025 2026 2027 2028-2032 10-Year Total 98-101 $ $26,878 $27,685 $28,515 $29,371 $30,252 $165,429 $308,130 Other City $ - - - - - -External $ - - - - - -Total Sources $26,878 $27,685 $28,515 $29,371 $30,252 $165,429 $308,130
Capital Improvement Projects Transportation
Sidewalks/TOD/Bike & Trail Gaps
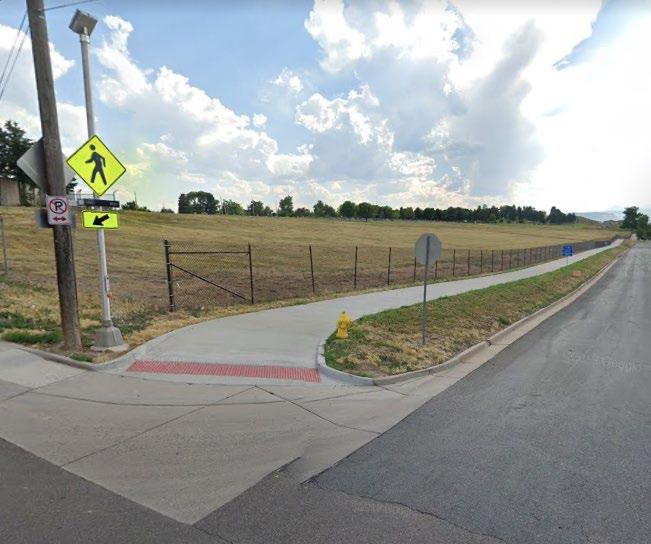
Description
The CIP funds will improve non-vehicular mobility at the City’s existing an planned trails, bikeways, and sidewalks as coordinated in the City’s Comprehensive Plan and Strategic document. For small, projects, the funding will be used to make spot improvements (e.g. intersection crossings). For medium scale projects, the funds will be bundled with other programs (e.g. paving program, parks, TOD) to cover bike/ped safety upgrades. For large projects, the funds will be used as a local match towards grants to connect the nonmotorized mobility system.
Project Justification
As part of the 2015 Citizens Capital Improvement Project Committee’s report to City Council, it recommended substantial funding for sidewalks, transit-oriented development, bicycle and pedestrian improvements, and trails. The recommendation aligns with technical analysis and public feedback documented in the City’s Comprehensive Plan (Chapter 3 Multimodal Transportation Plan) identifying needs for non-motorized transportation modes.
Strategic Plan Alignment
Strategic Priority: Infrastructure
The community depends on a well-maintained foundation of streets, sidewalks, and water, wastewater and stormwater facilities. Planned and steady population growth requires proper maintenance of existing infrastructure and additional capacity to support a thriving community.
Project Funding
Strategic Principle: Provides safe and efficient connections to modes of transportation, including transit, streets, sidewalks, and bikeways with a focus on enhanced technology at high-priority intersections improving safety and minimizing traffic congestion.
While this project provides an ongoing, annual source of funding, it does not fully meet the need for trail and sidewalk gaps identified by the City.
Project Cost Estimate and Timeline
This is an ongoing project. Specific improvements are planned through coordination between Public Works and Parks.
Operating Cost Impact
There are no operating cost impacts.
242
Uses 2023 2024 2025 2026 2027 2028-2032 10-Year Total Design $91,000 $91,000 $91,000 $91,000 $91,000 $455,000 $910,000 Acquisition - - - - - -Construction 609,000 609,000 609,000 609,000 609,000 3,045,000 6,090,000 Total Uses $700,000 $700,000 $700,000 $700,000 $700,000 $3,500,000 $7,000,000
Sources 2023 2024 2025 2026 2027 2028-2032 10-Year Total 98-101 $ $700,000 $700,000 $700,000 $700,000 $700,000 $3,628,539 $7,128,539 Other City $ - - - - - -External $ - - - - - -Total Sources $700,000 $700,000 $700,000 $700,000 $700,000 $3,628,539 $7,128,539
Capital Improvement Projects Transportation
Signal Interconnect Description
The purpose of this project is to develop a multi-year strategic and implementation plan to connect all signals to the city’s fiber backbone. This will allow the City to monitor realtime traffic operations effectively and better manage congestion.
Project Justification
Currently, less than one-third of the signalized intersections are connected to the city’s fiber backbone. This prohibits the City from managing signal-related congestion issues in real-time. In the 2019 Community Survey, citizens indicated lower than average satisfaction levels with congestion and traffic signal timing. This project is also aligned with Arvada’s Smart City initiative.
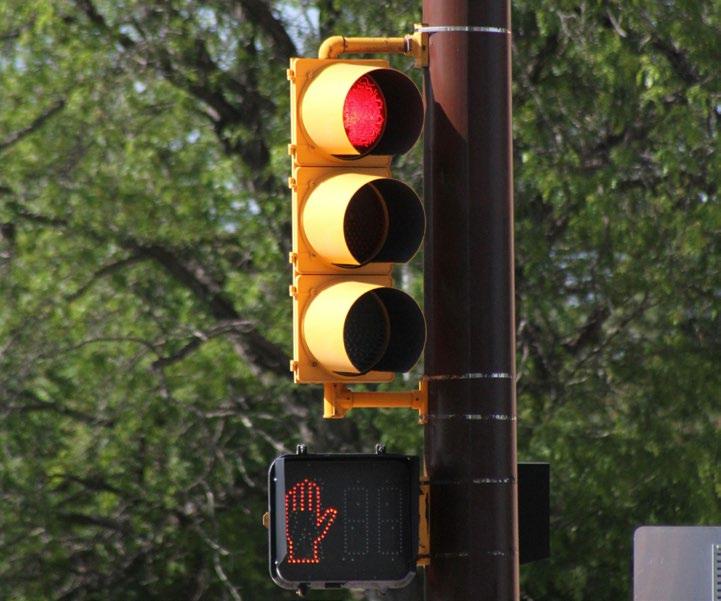
Strategic Plan Alignment
Strategic Priority: Infrastructure
The community depends on a well-maintained foundation of streets, sidewalks, and water, wastewater and stormwater facilities. Planned and steady population growth requires proper maintenance of existing infrastructure and additional capacity to support a thriving community.
Project Funding
This project is fully funded.
Project Cost Estimate and Timeline
Strategic Principle: Provides safe and efficient connections to modes of transportation, including transit, streets, sidewalks, and bikeways with a focus on enhanced technology at high-priority intersections improving safety and minimizing traffic congestion.
This is an ongoing project. Connection to the fiber backbone will be prioritized by the Traffic Engineering Division.
Operating Cost Impact
Signal maintenance costs may be reduced as aging infrastructure is replaced.
243
Uses 2023 2024 2025 2026 2027 2028-2032 10-Year Total Design $25,000 $25,000 $25,000 $25,000 $25,000 $147,725 $272,725 Acquisition
Construction 225,000 225,000 225,000 225,000 225,000 1,125,000 2,250,000 Total Uses $250,000 $250,000 $250,000 $250,000 $250,000 $1,272,725 $2,522,725
- - - - - - -
Sources 2023 2024 2025 2026 2027 2028-2032 10-Year Total 98-101 $ $250,000 $250,000 $250,000 $250,000 $250,000 $1,272,725 $2,522,725 Other City $ - - - - - -External $ - - - - - -Total Sources $250,000 $250,000 $250,000 $250,000 $250,000 $1,272,725 $2,522,725
Capital Improvement Projects Transportation
Signal Timing Implementation Description
This project is to develop a multi-year strategic and implementation plan to upgrade and maintain city-wide signal timing to ensure safe and efficient traffic operations. This request complements the new, staff-run signal timing initiative to create a comprehensive approach to signal management. This funding will allow components of the signal infrastructure to be improved as the signal timing program is rolled out.
Project Justification
City-wide signal timing hasn’t been upgraded due to a lack of resources. In the 2019 Community Survey, citizens indicated lower than average satisfaction levels with congestion and traffic signal timing.
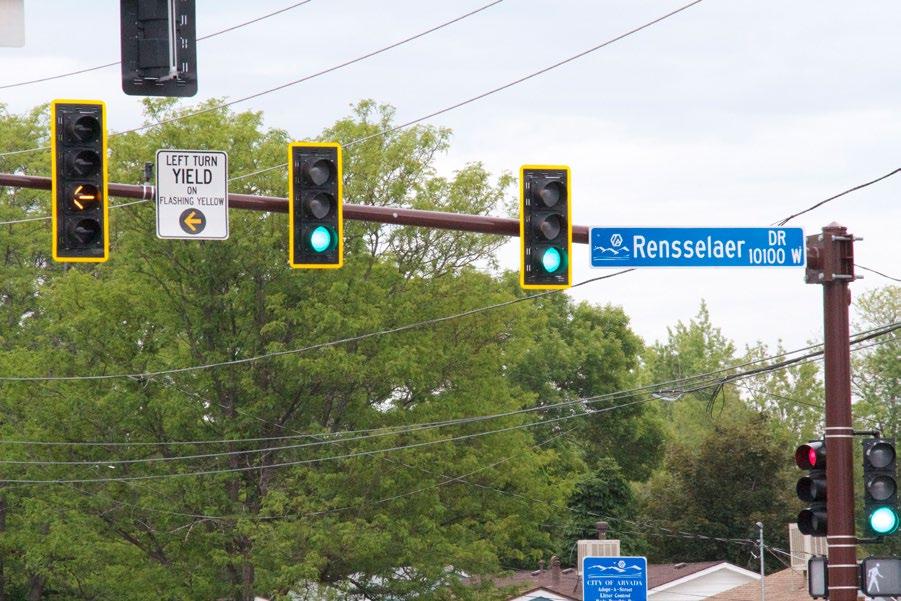
Strategic Plan Alignment
Strategic Priority: Infrastructure
The community depends on a well-maintained foundation of streets, sidewalks, and water, wastewater and stormwater facilities. Planned and steady population growth requires proper maintenance of existing infrastructure and additional capacity to support a thriving community.
Project Funding
Strategic Principle:
Provides safe and efficient connections to modes of transportation, including transit, streets, sidewalks, and bikeways with a focus on enhanced technology at high-priority intersections improving safety and minimizing traffic congestion.
This project is fully funded. It includes the capital dollars previously set aside for vehicle detection.
Project Cost Estimate and Timeline
This is an ongoing project. Funds are used as needs are identified by Traffic Engineering staff.
Operating Cost Impact
There is no operating cost impact associated with this project.
244
Uses 2023 2024 2025 2026 2027 2028-2032 10-Year Total Design $- $- $- $- $- $- $Acquisition
Construction 203,204 154,800 206,444 208,138 209,882 377,456 1,359,924 Total Uses $203,204 $154,800 $206,444 $208,138 $209,882 $377,456 $1,359,924
- - - - - - -
Sources 2023 2024 2025 2026 2027 2028-2032 10-Year Total 98-101 $ $203,204 $154,800 $206,444 $208,138 $209,882 $377,456 $1,359,924 Other City $ - - - - - -External $ - - - - - -Total Sources $203,204 $154,800 $206,444 $208,138 $209,882 $377,456 $1,359,924
Capital Improvement Projects Transportation
Traffic Calming Description
This project will continue the design and experimentation of traffic calming through the lighter, quicker, cheaper strategy. The funds will be used to construct a temporary traffic circle at 59th and Brooks to address traffic and pedestrian issues. Another project is to design traffic circles and raised medians for W. 57th Ave and traffic circles along Grandview Ave.
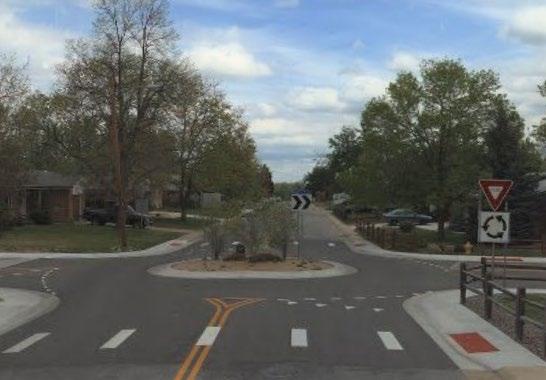
Project Justification
This project will improve safety for drivers, pedestrians, and bicyclists. It supplements traditional education and enforcement strategies currently engaged in by the traffic engineering and police teams.
Strategic Plan Alignment
Strategic Priority: Infrastructure
The community depends on a well-maintained foundation of streets, sidewalks, and water, wastewater and stormwater facilities. Planned and steady population growth requires proper maintenance of existing infrastructure and additional capacity to support a thriving community.
Project Funding
This project provides multi-year funding for various traffic-calming projects.
Strategic Principle: Provides safe and efficient connections to modes of transportation, including transit, streets, sidewalks, and bikeways with a focus on enhanced technology at high-priority intersections improving safety and minimizing traffic congestion.
Project Cost Estimate and Timeline
This is a multi-year, ongoing project. Individual projects will be prioritized and implemented by Transportation Mobility staff.
Operating Cost Impact
Maintenance of traffic calming devices will be included in the operating budget. Final operating costs are currently being evaluated and will depend on traffic calming design.
245
Uses 2023 2024 2025 2026 2027 2028-2032 10-Year Total Design $- $- $15,000 $15,000 $15,000 $75,000 $120,000 Acquisition
- - - -Construction - - 35,000 35,000 35,000 175,000 280,000 Total Uses $- $- $50,000 $50,000 $50,000 $250,000 $400,000
- -
Sources 2023 2024 2025 2026 2027 2028-2032 10-Year Total 98-101 $ $- $- $50,000 $50,000 $50,000 $250,000 $400,000 Other City $ - - - - - -External $ - - - - - -Total Sources $- $- $50,000 $50,000 $50,000 $250,000 $400,000
Capital Improvement Projects Transportation
Traffic Signals Description
This project is to replace, rebuild, and build new traffic signals. The City is behind on replacing traffic signals at several locations. This project replaces old, deteriorating signals and upgrades signals in order for them to meet contemporary standards. It includes not only the signals themselves, but improving sidewalk crossings, obtaining right-of-way, and installing the latest technology to help connect signals. This project allows the City to leverage the installation of fiber and connect the signal infrastructure in order to better control signals remotely, optimize signal timing, and improve traffic flow.
Project Justification
Many of the City’s traffic signals are over 30 years old and are in need of replacement or rebuild. Some infrastructure is deteriorating, doesn’t meet current standards, doesn’t meet the needs of the intersection (e.g., signal lights don’t align with lanes), or vehicles are damaging the infrastructure (e.g., trucks at 80th and Chase). Without adequate funding, deterioration will lead to expensive emergency repair. In addition, some intersections now meet warrants for signalization (e.g., 64th and Quail and 64th and Easley).
Strategic Plan Alignment
Strategic Priority: Infrastructure
The community depends on a well-maintained foundation of streets, sidewalks, and water, wastewater and stormwater facilities. Planned and steady population growth requires proper maintenance of existing infrastructure and additional capacity to support a thriving community.
Project Funding
Strategic Principle: Provides safe and efficient connections to modes of transportation, including transit, streets, sidewalks, and bikeways with a focus on enhanced technology at high-priority intersections improving safety and minimizing traffic congestion.
While this project provides ongoing funding for traffic signals, there is an additional unmet need to address the backlog of intersections that require new signals. This project now includes the capital dollars previously set aside for unlimited power supply installations at major intersections.
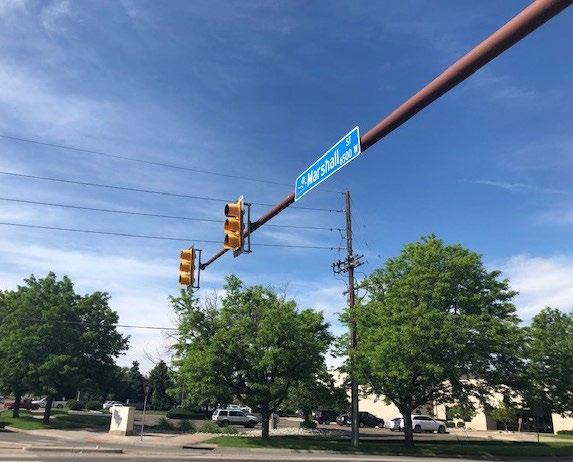
Project Cost Estimate and Timeline
This is an ongoing project. Signal replacement is driven by actual conditions. The Traffic Engineering Division has a list of priorities for new and replacement signals.
Operating Cost Impact
A new signal build cost is approximately $950,000. Older signals that require extensive repairs can run in the range of $50,000 - $75,000 a year. Intersections in poor repair have a higher risk of major component failure, such as a pole or cabinet failure, which can cost $150,000 or more to replace.
246
Uses 2023 2024 2025 2026 2027 2028-2032 10-Year Total Design $70,008 $72,109 $80,272 $82,500 $90,692 $505,609 $901,189 Acquisition 109,680 112,970 125,759 129,250 142,084 777,773 1,397,516 Construction 987,117 1,016,731 1,131,833 1,163,250 1,278,755 7,143,414 12,721,100 Total Uses $1,166,805 $1,201,810 $1,337,864 $1,375,000 $1,511,531 $8,426,796 $15,019,805
Sources 2023 2024 2025 2026 2027 2028-2032 10-Year Total 98-101 $ $1,166,805 $1,201,810 $1,337,864 $1,375,000 $1,511,531 $8,426,796 $15,019,806 Other City $ - - - - - -External $ - - - - - -Total Sources $1,166,805 $1,201,810 $1,337,864 $1,375,000 $1,511,531 $8,426,796 $15,019,806
Capital Improvement Projects Transportation
Transportation Master Plan Implementation Description
This project is intended to fund construction of transportation improvements per the recommendations received in the Transportation Master Plan study project.
Project Justification
Upon completion of the Transportation Master Plan, this project will help fund construction of the priorities identified within the plan.
Strategic Plan Alignment
Strategic Priority: Infrastructure
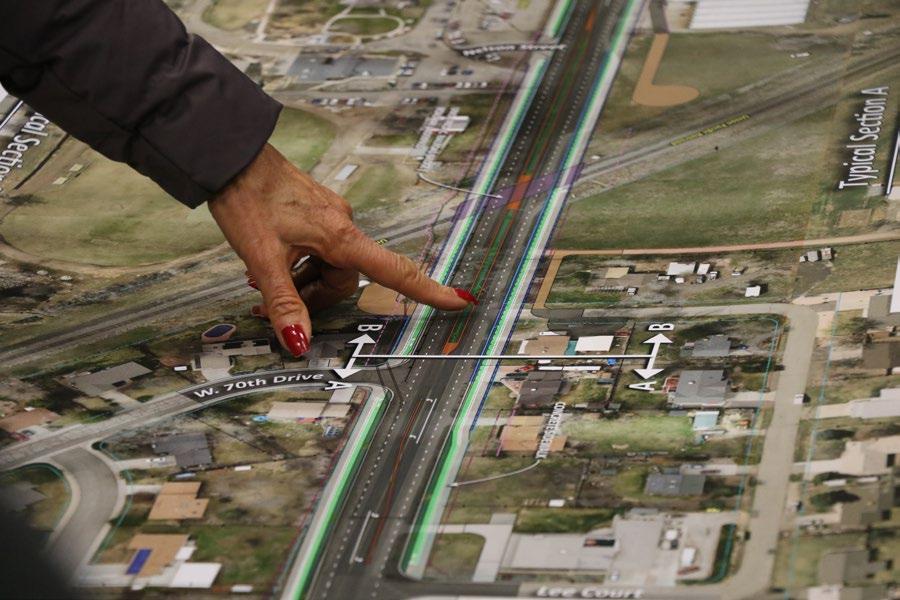
The community depends on a well-maintained foundation of streets, sidewalks, and water, wastewater and stormwater facilities. Planned and steady population growth requires proper maintenance of existing infrastructure and additional capacity to support a thriving community.
Project Funding
This project is fully funded.
Project Cost Estimate and Timeline
Strategic Principle: Provides safe and efficient connections to modes of transportation, including transit, streets, sidewalks, and bikeways with a focus on enhanced technology at high-priority intersections improving safety and minimizing traffic congestion.
This is an ongoing project. Project timing is subject to change based on need and priorities.
Operating Cost Impact
There is no operating impact associated with this project.
247
Uses 2023 2024 2025 2026 2027 2028-2032 10-Year Total Design $- $- $- $- $- $- $Acquisition - - - - - -Construction 300,000 300,000 300,000 300,000 300,000 1,379,552 2,879,552 Total Uses $300,000 $300,000 $300,000 $300,000 $300,000 $1,379,552 $2,879,552
Sources 2023 2024 2025 2026 2027 2028-2032 10-Year Total 98-101 $ $300,000 $300,000 $300,000 $300,000 $300,000 $1,379,552 $2,879,552 Other City $ - - - - - -External $ - - - - - -Total Sources $300,000 $300,000 $300,000 $300,000 $300,000 $1,379,552 $2,879,552
Capital Improvement Projects Transportation
Xcel Energy Undergrounding Fund Supplement
Description
This funding will help to cover costs for undergrounding other utilities on existing Xcel Energy poles during Xcel 1% fund undergrounding work. Utility poles cannot be removed until all lines on them are undergrounded.
Project Justification
The Xcel 1% fund provides funding to underground Xcel electric lines. Often there are also phone, cable and fiber optic lines on the poles that must also be undergrounded in order to remove the poles. The Xcel 1% fund does not cover the undergrounding cost for other lines.
Strategic Plan Alignment
Strategic Priority: Infrastructure
The community depends on a well-maintained foundation of streets, sidewalks, and water, wastewater and stormwater facilities. Planned and steady population growth requires proper maintenance of existing infrastructure and additional capacity to support a thriving community.
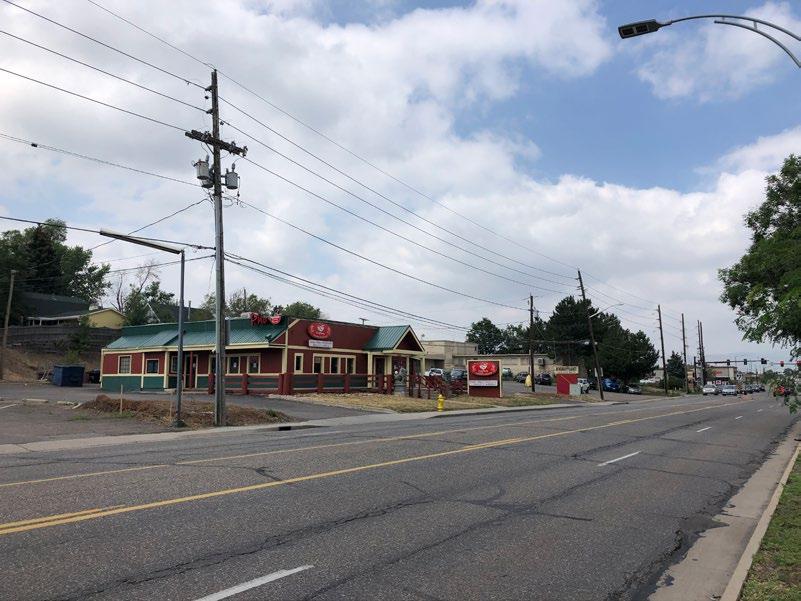
Project Funding
Strategic Principle:
Maintains existing roads and transportation network in tandem with snow and ice control services to ensure swift and safe transportation modes for the community.
Per the City’s franchise agreement with Xcel Energy, an amount equal to 1% of revenues collected on utility sales in Arvada are available for the undergrounding of utilities at locations identified by the City. This City funding supplements the Xcel 1% fund.
Project Cost Estimate and Timeline
This is an ongoing project. Timing is dependent on needs identified by Public Works.
Operating Cost Impact
There is no operating impact.
248
Uses 2023 2024 2025 2026 2027 2028-2032 10-Year Total Design $- $- $- $- $- $- $Acquisition
- - -Construction 59,703 61,494 63,339 65,239 65,239 346,362 661,376 Total Uses $59,703 $61,494 $63,339 $65,239 $65,239 $346,362 $661,376
- - -
Sources 2023 2024 2025 2026 2027 2028-2032 10-Year Total 98-101 $ $59,703 $61,494 $63,339 $65,239 $65,239 $346,362 $661,376 Other City $ - - - - - -External $ - - - - - -Total Sources $59,703 $61,494 $63,339 $65,239 $65,239 $346,362 $661,376
Capital Improvement Projects

Wastewater Overview
The plan for the Wastewater Division, which operates and maintains the City’s sanitary sewer system, focuses primarily on the maintenance and replacement of sewer infrastructure throughout the City to our connection with Metro Recovery who provied treatment. The comprehensive inspections and proactive maintenance that have marked Wastewater operations for over a decade, particularly with its cure-in-place pipe (CIPP) work, will continue in order to carry on its exemplary service record. In addition, the expansion of system capacity in the north area of the City will meet rising demands as growth continues in the coming years.
Summary of Wastewater Sources
Summary of Wastewater Uses
249
Uses Existing 2023 2024 2025 2026 2027 2028-2032 Total Design - $2,090,000 $1,000,000 $500,000 - - - $3,590,000 Acquisition - - - - - - -Construction - 8,697,631 36,968,000 15,895,000 9,881,000 5,282,667 13,881,335 90,605,633 Total Uses $ - $10,787,631 $37,968,000 $16,395,000 $9,881,000 $5,282,667 $13,881,335 $94,195,633 Sources Existing 2023 2024 2025 2026 2027 2028-2032 Total 98-101 $ $- $- $- $- $- $- $- $Other City $ - 1,200,204 1,092,000 9,045,000 2,790,000 2,114,667 11,373,335 27,615,206 External $ - 14,597,427 31,866,000 14,150,000 291,000 3,168,000 2,508,000 66,580,427 Total Sources $690,000 $15,797,631 $32,958,000 $23,195,000 $3,081,000 $5,383,667 $13,881,335 $94,195,633
Capital Improvement Projects Wastewater
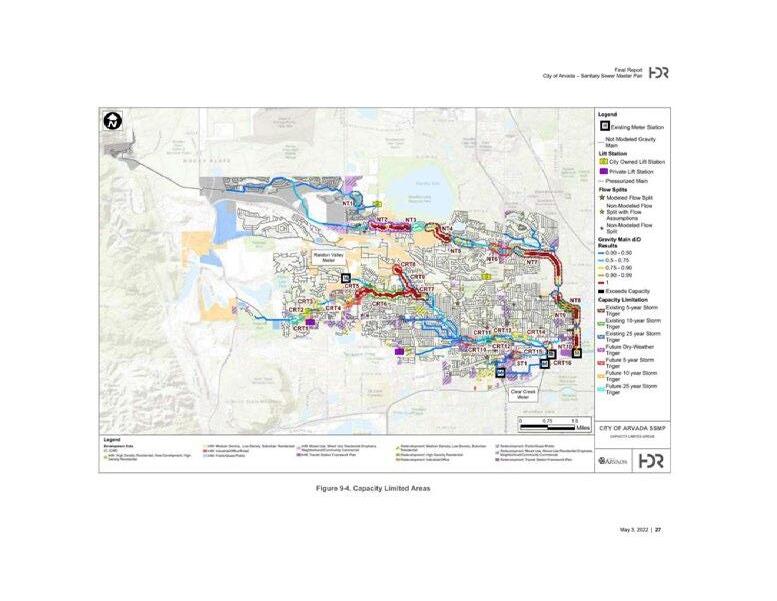
Alkire Force Mains
Description
The force mains from the Alkire lift station are undersized for the upgraded capacity. An additional force main will be packaged with NT2.
Project Justification
Required to meet demand from planned development.
Strategic Plan Alignment
Strategic Priority: Infrastructure
The community depends on a well-maintained foundation of streets, sidewalks, and water, wastewater and stormwater facilities. Planned and steady population growth requires proper maintenance of existing infrastructure and additional capacity to support a thriving community.
Project Funding
This project will be funded by bond issuance.
Strategic Principle:
Provides the community with a safe, reliable, high-quality water supply, drainage system, and wastewater disposal services for full city build-out, as defined by the Comprehensive Plan. This includes maintaining utility rates at lowest practical levels with accurate billing that supports replacement of aging infrastructure in order to maintain robust utility systems.
Project Cost Estimate and Timeline
Project is expected to be complete in 2026.
Operating Cost Impact
No additional operating expenses are anticipated. Cost of payment to Metro may be lower due to reduction in infiltration.
250
Uses Existing 2023-2032 Project Total Design $- $200,000 $200,000 Acquisition - -Construction - 2,000,000 2,000,000 Total Uses $- $2,200,000 $2,200,000
Timeline Start Completion Design 2022 2024 Acquisition Construction 2025 2026 Sources Existing 2023 2024 2025 2026 2027 2028-2032 Project Total 98-101 $ $- $- $- $- $- $- $- $Other City $ - - - - - - -External $ - 200,000 2,000,000 - - - - 2,200,000 Total Sources $- $200,000 $2,000,000 $- $- $- $- $2,200,000
Capital Improvement Projects Wastewater
Central Trunk Line (CTL) Description
The Central Trunk Line (CRT) has several areas that are at or exceed capacity. This project was identified as a priority segment as part of the Sewer Master Plan and is required to meet the timeline for planned development. This segment is also nearing the end of useful life and is in need of rehabilitation or replacement.
Project Justification
Required to meet demand from planned development.
Strategic Plan Alignment
Strategic Priority: Infrastructure
The community depends on a well-maintained foundation of streets, sidewalks, and water, wastewater and stormwater facilities. Planned and steady population growth requires proper maintenance of existing infrastructure and additional capacity to support a thriving community.
Project Funding
This project will be funded by bond issuance.
Strategic Principle:
Provides the community with a safe, reliable, high-quality water supply, drainage system, and wastewater disposal services for full city build-out, as defined by the Comprehensive Plan. This includes maintaining utility rates at lowest practical levels with accurate billing that supports replacement of aging infrastructure in order to maintain robust utility systems.
Project Cost Estimate and Timeline
Project is expected to be complete in 2028.
Operating Cost Impact
No additional operating expenses are anticipated. Cost of payment to Metro may be lower due to reduction in infiltration.
251
Uses Existing 2023-2032 Project Total Design $- $- $Acquisition - -Construction - 5,967,000 5,967,000 Total Uses $- $5,967,000 $5,967,000
Timeline Start Completion Design 2026 2027 Acquisition Construction 2027 2028 Sources Existing 2023 2024 2025 2026 2027 2028-2032 Project Total 98-101 $ $- $- $- $- $- $- $- $Other City $ - - - - - - -External $ - - - - 291,000 3,168,000 2,508,000 5,967,000 Total Sources $- $- $- $- $291,000 $3,168,000 $2,508,000 $5,967,000
Capital Improvement Projects Wastewater
Infiltration Elimination Program
Description
Groundwater infiltration into the city’s sanitary sewer system after heavy rains has been identified at various points in the system. The City is then required to pay for treatment of this groundwater as it flows through the Metro Wastewater system. This project will fund improvements to underdrain systems and replacement of sections of sanitary sewer main where infiltration is the greatest.
Project Justification
Any inflow from groundwater into the sanitary sewer system is billed by Metro Water Recovery and reduces capacity of sewer pipes.
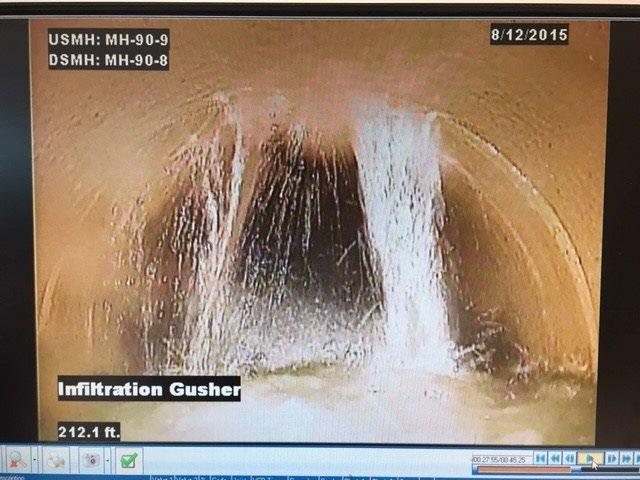
Strategic Plan Alignment
Strategic Priority: Infrastructure The community depends on a well-maintained foundation of streets, sidewalks, and water, wastewater and stormwater facilities. Planned and steady population growth requires proper maintenance of existing infrastructure and additional capacity to support a thriving community.
Project Funding
This project is funded through the Wastewater Fund.
Strategic Principle:
Provides the community with a safe, reliable, high-quality water supply, drainage system, and wastewater disposal services for full city build-out, as defined by the Comprehensive Plan. This includes maintaining utility rates at lowest practical levels with accurate billing that supports replacement of aging infrastructure in order to maintain robust utility systems.
Project Cost Estimate and Timeline
This is an ongoing program.
Operating Cost Impact
Elimination of groundwater infiltration results in lower operating costs.
252
Uses 2023 2024 2025 2026 2027 2028-2032 10-Year Total Design $- $- $- $- $- $- $Acquisition -
-Construction 450,204 230,000 480,000 250,000 676,667 3,383,335 5,470,206 Total Uses $450,204 $230.000 $480,000 $250,000 $676,667 $3,383,335 $5,470,206
- - - -
Sources 2023 2024 2025 2026 2027 2028-2032 10-Year Total 98-101 $ $- $- $- $- $- $- $Other City $ 450,204 230,000 480,000 250,000 676,667 3,383,335 5,470,206 External $ - - - - - -Total Sources $450,204 $230.000 $480,000 $250,000 $676,667 $3,383,335 $5,470,206
Capital Improvement Projects Wastewater
North Sewer Trunk Line - 61st and Tennyson (NT 10)
Description
The North Trunk of the sanitary sewer has several bottlenecks. There is not enough capacity to serve growth in the northwest part of the City. This project will upsize the sewer line in the 61st and Tennyson area to our connection with Metro Water Recovery. This segment is also at the end of useful life and in need of rehabilitation or replacement.
Project Justification
This project was identified as a priority segment as part of the Sewer Master Plan is required to need the timeline for planned development. This segment is at the end of useful life and in need of replacement.
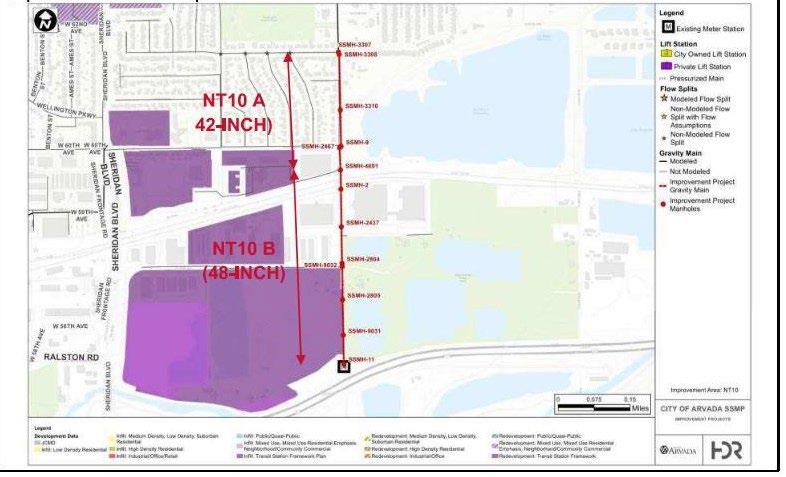
Strategic Plan Alignment
Strategic Priority: Infrastructure
The community depends on a well-maintained foundation of streets, sidewalks, and water, wastewater and stormwater facilities. Planned and steady population growth requires proper maintenance of existing infrastructure and additional capacity to support a thriving community.
Project Funding
This project is funded through wastewater tap fees and bond issuance.
Strategic Principle:
Provides the community with a safe, reliable, high-quality water supply, drainage system, and wastewater disposal services for full city build-out, as defined by the Comprehensive Plan. This includes maintaining utility rates at lowest practical levels with accurate billing that supports replacement of aging infrastructure in order to maintain robust utility systems.
Project Cost Estimate and Timeline
This project is fully funded. It is expected to be complete by 2024.
Operating Cost Impact
No additional operating expenses are anticipated. Cost of payment to Metro may be lower due to reduction in infiltration.
253
Uses Existing 2023-2032 Project Total Design $- $690,000 $690,000 Acquisition - -Construction - 14,950,000 14,950,000 Total Uses $- $15,640,000 $15,640,000
Timeline Start Completion Design 2021 2023 Acquisition 2023 2023 Construction 2023 2024 Sources Existing 2023 2024 2025 2026 2027 2028-2032 Project Total 98-101 $ $- $- $- $- $- $- $- $Other City $ - - - - - - -External $ - 5,250,000 10,390,000 - - - - 15,640,000 Total Sources $- $5,250,000 $10,390,000 $- $- $- $- $15,640,000
Capital Improvement Projects Wastewater
North Trunk Sewer Improvements - 68th & Sheridan to Tennyson & W. 64th (NT8)
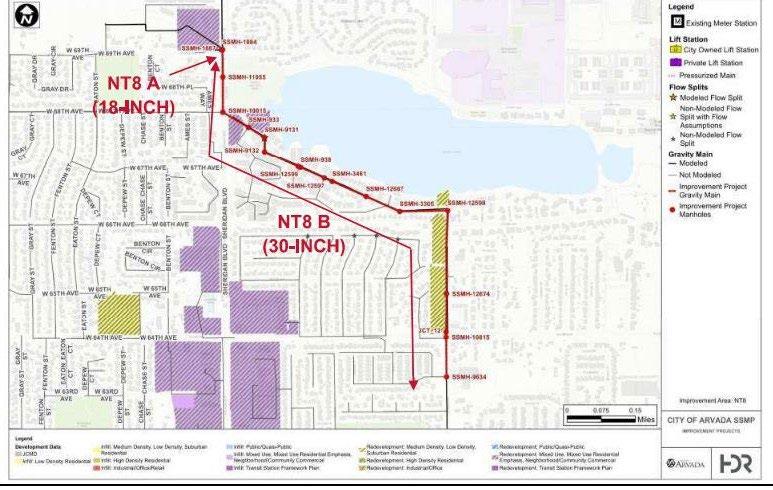
Description
The NTL has several areas that are at or exceed capacity. This project was identified as a priority segment as part of the Sewer Master Plan and is required to meet the timeline for planned development. This segment is also at the end of useful life and in need of rehabilitation or replacement.
Project Justification
This project was identified as a priority segment as par of the Sewer Master Plan is required to need the timeline for planned development. This segment is at the end of useful life and in need of replacement.
Strategic Plan Alignment
Strategic Priority: Infrastructure
The community depends on a well-maintained foundation of streets, sidewalks, and water, wastewater and stormwater facilities. Planned and steady population growth requires proper maintenance of existing infrastructure and additional capacity to support a thriving community.
Project Funding
Strategic Principle:
Provides the community with a safe, reliable, high-quality water supply, drainage system, and wastewater disposal services for full city build-out, as defined by the Comprehensive Plan. This includes maintaining utility rates at lowest practical levels with accurate billing that supports replacement of aging infrastructure in order to maintain robust utility systems.
This project will be funded by bond issuance, and future bond to provide full funding.
Project Cost Estimate and Timeline
Project is expected to be complete in 2026.
Operating Cost Impact
No additional operating expenses are anticipated. Cost of payment to Metro may be lower due to reduction in infiltration.
254
Uses Existing 2023-2032 Project Total Design $- $600,000 $600,000 Acquisition - -Construction - 10,700,000 10,700,000 Total Uses $- $11,300,000 $11,300,000
Timeline Start Completion Design 2024 2024 Acquisition 2024 2025 Construction 2025 2026 Sources Existing 2023 2024 2025 2026 2027 2028-2032 Project Total 98-101 $ $- $- $- $- $- $- $- $Other City $ - - - - - - -External $ - - 600,000 10,700,000 - - - 11,300,000 Total Sources $- $- $600,000 $10,700,000 $- $- $- $11,300,000
Capital Improvement Projects Wastewater
North Trunk Sewer Improvements - W. 81st & Teller to W. 72nd & Sheridan (NT7)
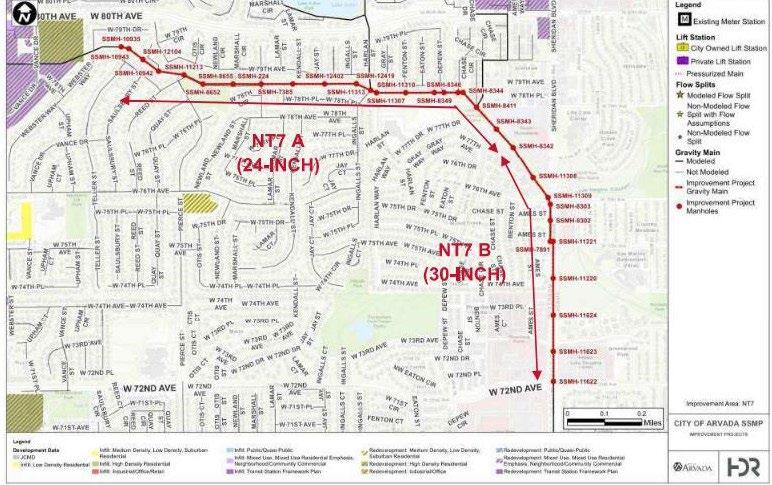
Description
The NTL has several areas that are at or exceed capacity. This project was identified as a priority segment as part of the Sewer Master Plan and is required to meet the timeline for planned development. This segment is also at end of useful life and in need of rehabilitation or replacement.
Project Justification
This project was identified as a priority segment as part of the Sewer Master Plan is required to need the timeline for planned development. This segment is at the end of useful life and in need of replacement.
Strategic Plan Alignment
Strategic Priority: Infrastructure
The community depends on a well-maintained foundation of streets, sidewalks, and water, wastewater and stormwater facilities. Planned and steady population growth requires proper maintenance of existing infrastructure and additional capacity to support a thriving community.
Project Funding
This project will be funded by bond issuance.
Strategic Principle:
Provides the community with a safe, reliable, high-quality water supply, drainage system, and wastewater disposal services for full city build-out, as defined by the Comprehensive Plan. This includes maintaining utility rates at lowest practical levels with accurate billing that supports replacement of aging infrastructure in order to maintain robust utility systems.
Project Cost Estimate and Timeline
Project is expected to be complete in 2025.
Operating Cost Impact
No additional operating expenses are anticipated. Cost of payment to Metro may be lower due to reduction in infiltration.
255
Uses Existing 2023-2032 Project Total Design $- $500,000 $500,000 Acquisition - -Construction - 15,726,000 15,726,000 Total Uses $- $16,226,000 $16,226,000
Timeline Start Completion Design 2023 2023 Acquisition 2023 2023 Construction 2023 2025 Sources Existing 2023 2024 2025 2026 2027 2028-2032 Project Total 98-101 $ $- $- $- $- $- $- $- $Other City $ - - - - - - -External $ - 950,000 15,276,000 - - - - 16,226,000 Total Sources $- $950,000 $15,27,000 $- $- $- $- $16,226,000
Capital Improvement Projects
North Trunk Sewer Improvements - W. 84th from Alkire to Simms (NT2)
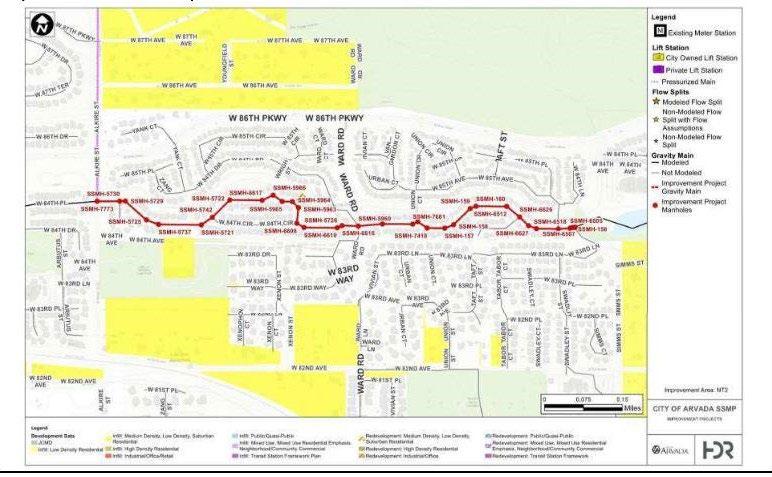
Description
The NTL has several areas that are at or exceed capacity. This project was identified as a priority segment as part of the Sewer Master Plan and is required to meet the timeline for planned development.
Project Justification
This project was identified as a priority segment as par of the Sewer Master Plan is required to need the timeline for planned development.
Strategic Plan Alignment
Strategic Priority: Infrastructure
The community depends on a well-maintained foundation of streets, sidewalks, and water, wastewater and stormwater facilities. Planned and steady population growth requires proper maintenance of existing infrastructure and additional capacity to support a thriving community.
Project Funding
Strategic Principle:
Provides the community with a safe, reliable, high-quality water supply, drainage system, and wastewater disposal services for full city build-out, as defined by the Comprehensive Plan. This includes maintaining utility rates at lowest practical levels with accurate billing that supports replacement of aging infrastructure in order to maintain robust utility systems.
This project will be funded by bond issuance and future bond to provide full funding.
Project Cost Estimate and Timeline
Project is expected to be complete in 2026.
Operating Cost Impact
No additional operating expenses are anticipated. Cost of payment to Metro may be lower due to reduction in infiltration.
256
Uses Existing 2023-2032 Project Total Design $- $400,000 $400,000 Acquisition - -Construction - 3,450,000 3,450,000 Total Uses $- $3,850,000 $3,850,000
Timeline Start Completion Design 2024 2024 Acquisition 2024 2024 Construction 2025 2026 Sources Existing 2023 2024 2025 2026 2027 2028-2032 Project Total 98-101 $ $- $- $- $- $- $- $- $Other City $ - - - - - - -External $ - - 400,000 3,450,000 - - - 3,850,000 Total Sources $- $- $400,000 $3,450,000 $- $- $- $3,850,000
Wastewater
Capital Improvement Projects Wastewater
Oversizing of Replacement Pipelines for Additional Capacity
Description
This project involves rehabilitation of the larger sewer pipelines. It provides funding for areas where larger pipeline sizes are needed to increase capacity or to remove structures that result in flow constrictions.
Project Justification
This project maintains the wastewater collection system and increases flow capacity where needed.
Strategic Plan Alignment
Strategic Priority: Infrastructure
The community depends on a well-maintained foundation of streets, sidewalks, and water, wastewater and stormwater facilities. Planned and steady population growth requires proper maintenance of existing infrastructure and additional capacity to support a thriving community.
Project Funding
This project is funded through the Wastewater Fund tap fees.
Strategic Principle: Provides the community with a safe, reliable, high-quality water supply, drainage system, and wastewater disposal services for full city build-out, as defined by the Comprehensive Plan. This includes maintaining utility rates at lowest practical levels with accurate billing that supports replacement of aging infrastructure in order to maintain robust utility systems.
Project Cost Estimate and Timeline
This is an ongoing program.
Operating Cost Impact
There is no operating cost impact.
257
Uses 2023 2024 2025 2026 2027 2028-2032 10-Year Total Design $- $- $- $- $- $- $Acquisition - - - - - -Construction - - 360,000 390,000 440,000 2,200,000 3,390,000 Total Uses $- $- $360,000 $390,000 $440,000 $2,200,000 $3,390,000
Sources 2023 2024 2025 2026 2027 2028-2032 10-Year Total 98-101 $ $- $- $- $- $- $- $Other City $ 360,000 390,000 440,000 2,200,000 3,390,000 External $ - - - - - -Total Sources $- $- $360,000 $390,000 $440,000 $2,200,000 $3,390,000
Capital Improvement Projects Wastewater
Ralston Trunk Sewer Improvements - Simms to Pierson (CRT7)
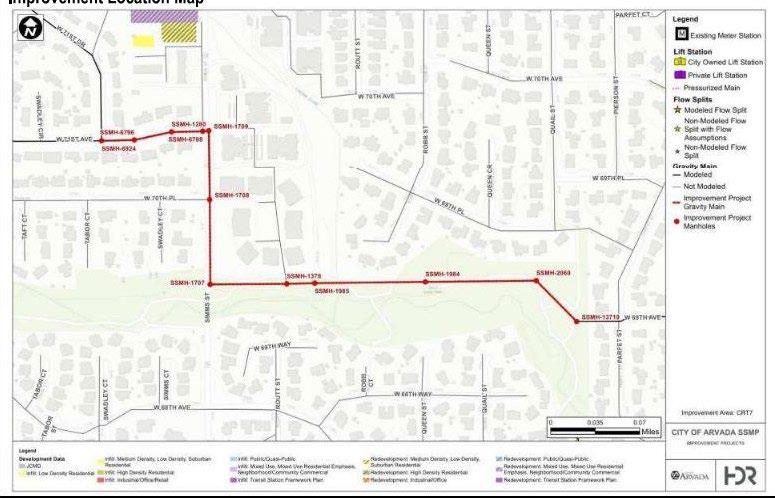
Description
The Central Ralston Trunk Line (CRT) has several areas that are at or exceed capacity. This project was identified as a priority segment as part of the Sewer Master Plan and is required to meet the timeline for planned development. This segment is also at end of useful life and is in need of rehabilitation or replacement.
Project Justification
This project was identified as a priority segment as part of the Sewer Master Plan is required to need the timeline for planned development. This segment is at the end of useful life and in need of replacement.
Strategic Plan Alignment
Strategic Priority: Infrastructure
The community depends on a well-maintained foundation of streets, sidewalks, and water, wastewater and stormwater facilities. Planned and steady population growth requires proper maintenance of existing infrastructure and additional capacity to support a thriving community.
Project Funding
This project will be funded by bond issuance.
Strategic Principle: Provides the community with a safe, reliable, high-quality water supply, drainage system, and wastewater disposal services for full city build-out, as defined by the Comprehensive Plan. This includes maintaining utility rates at lowest practical levels with accurate billing that supports replacement of aging infrastructure in order to maintain robust utility systems.
Project Cost Estimate and Timeline
Project is expected to be complete in 2024.
Operating Cost Impact
No additional operating expenses are anticipated. Cost of payment to Metro may be lower due to reduction in infiltration.
258
Uses Existing 2023-2032 Project Total Design $- $400,000 $400,000 Acquisition - -Construction - 3,20,000 3,200,000 Total Uses $- $3,600,000 $3,600,000
Timeline Start Completion Design 2023 2023 Acquisition 2023 2023 Construction 2024 2024 Sources Existing 2023 2024 2025 2026 2027 2028-2032 Project Total 98-101 $ $- $- $- $- $- $- $- $Other City $ - - - - - - -External $ - 400,000 3,200,000 - - - - 3,600,000 Total Sources $- $400,000 $3,200,000 $- $- $- $- $3,600,000
Capital Improvement Projects Wastewater
Ralston Trunk Sewer Improvements - Union from W. 75th to W. 71st (CRT9)
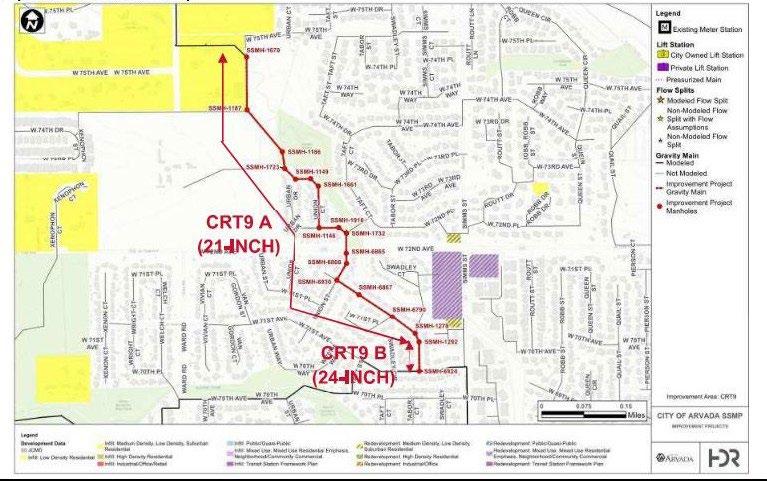
Description
The Central Ralston Trunk Line (CRT) has several areas that are at or exceed capacity. This project was identified as a priority segment as part of the Sewer Master Plan and is required to meet the timeline for planned development. This segment is also at end of useful life and is in need of rehabilitation or replacement.
Project Justification
This project was identified as a priority segment as part of the Sewer Master Plan is required to need the timeline for planned development. This segment is at the end of useful life and in need of replacement.
Strategic Plan Alignment
Strategic Priority: Infrastructure
The community depends on a well-maintained foundation of streets, sidewalks, and water, wastewater and stormwater facilities. Planned and steady population growth requires proper maintenance of existing infrastructure and additional capacity to support a thriving community.
Project Funding
This project will be funded by bond issuance.
Strategic Principle: Provides the community with a safe, reliable, high-quality water supply, drainage system, and wastewater disposal services for full city build-out, as defined by the Comprehensive Plan. This includes maintaining utility rates at lowest practical levels with accurate billing that supports replacement of aging infrastructure in order to maintain robust utility systems.
Project Cost Estimate and Timeline
Project is expected to be complete in 2025.
Operating Cost Impact
No additional operating expenses are anticipated. Cost of payment to Metro may be lower due to reduction in infiltration.
259
Uses Existing 2023-2032 Project Total Design $- $500,000 $500,000 Acquisition - -Construction - 8,000,000 8,000,000 Total Uses $- $8,500,000 $8,500,000
Timeline Start Completion Design 2024 2024 Acquisition 2024 2024 Construction 2025 2025 Sources Existing 2023 2024 2025 2026 2027 2028-2032 Project Total 98-101 $ $- $- $- $- $- $- $- $Other City $ - - - 7,300,000 1,200,000 - - 8,500,000 External $ - - - - - - -Total Sources $- $- $- $7,300,000 $1,200,000 $- $- $8,500,000
Capital Improvement Projects Wastewater
Ralston Trunk Sewer Improvements - W. 69th from Coors to Urban (CRT 6)
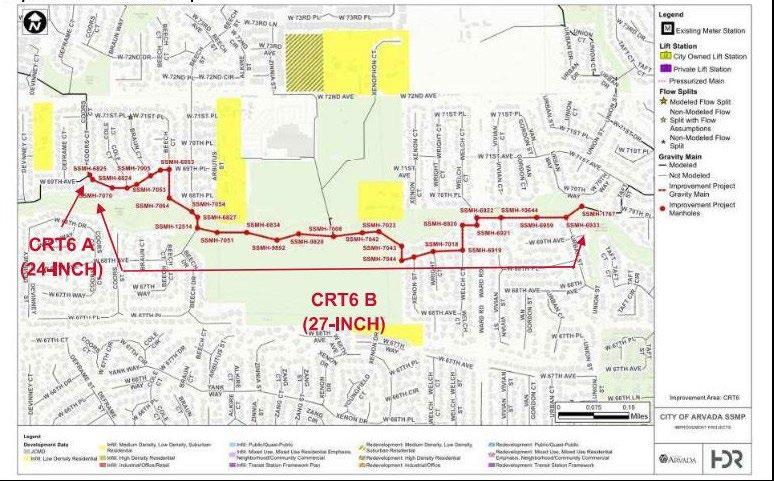
Description
The Central Ralston Trunk Line (CRT) has several areas that are at or exceed capacity. This project was identified as a priority segment as part of the Sewer Master Plan and is required to meet the timeline for planned development. This segment is also at end of useful life and is in need of rehabilitation or replacement.
Project Justification
This project was identified as a priority segment as par of the Sewer Master Plan is required to need the timeline for planned development. This segment is at the end of useful life and in need of replacement.
Strategic Plan Alignment
Strategic Priority: Infrastructure
The community depends on a well-maintained foundation of streets, sidewalks, and water, wastewater and stormwater facilities. Planned and steady population growth requires proper maintenance of existing infrastructure and additional capacity to support a thriving community.
Project Funding
This project will be funded by bond issuance.
Strategic Principle:
Provides the community with a safe, reliable, high-quality water supply, drainage system, and wastewater disposal services for full city build-out, as defined by the Comprehensive Plan. This includes maintaining utility rates at lowest practical levels with accurate billing that supports replacement of aging infrastructure in order to maintain robust utility systems.
Project Cost Estimate and Timeline
Project is expected to be complete in 2025.
Operating Cost Impact
No additional operating expenses are anticipated. Cost of payment to Metro may be lower due to reduction in infiltration.
260
Uses Existing 2023-2032 Project Total Design $- $300,000 $300,000 Acquisition - -Construction - 7,497,427 7,497,427 Total Uses $- $7,797,427 $7,797,427
Timeline Start Completion Design 2023 2023 Acquisition 2023 2024 Construction 2024 2025 Sources Existing 2023 2024 2025 2026 2027 2028-2032 Project Total 98-101 $ $- $- $- $- $- $- $- $Other City $ - 7,797,427 - - - - - 7,797,427 External $ - - - - - - -Total Sources $- $7,797,427 $- $- $- $- $- $7,797,427
Capital Improvement Projects
Ralston Trunk Sewer Improvements - W. 69th from Eldridge to Coors (CRT5)
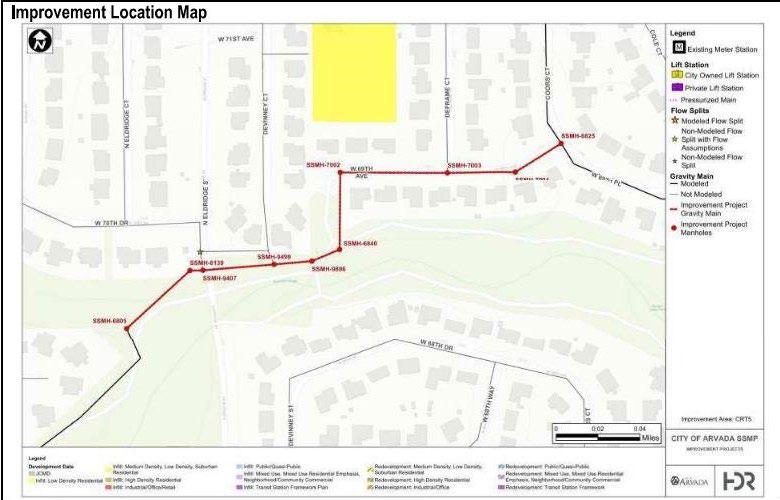
Description
The Central Ralston Trunk Line (CRT) has several areas that are at or exceed capacity. This project was identified as a priority segment as part of the Sewer Master Plan and is required to meet the timeline for planned development.
Project Justification
This project was identified as a priority segment as part of the Sewer Master Plan and is required to meet the timeline for planned development.
Strategic Plan Alignment
Strategic Priority: Infrastructure
The community depends on a well-maintained foundation of streets, sidewalks, and water, wastewater and stormwater facilities. Planned and steady population growth requires proper maintenance of existing infrastructure and additional capacity to support a thriving community.
Project Funding
This project will be funded by bond issuance.
Strategic Principle:
Provides the community with a safe, reliable, high-quality water supply, drainage system, and wastewater disposal services for full city build-out, as defined by the Comprehensive Plan. This includes maintaining utility rates at lowest practical levels with accurate billing that supports replacement of aging infrastructure in order to maintain robust utility systems.
Project Cost Estimate and Timeline
Project is expected to be complete in 2025.
Operating Cost Impact
No additional operating expenses are anticipated. Cost of payment to Metro may be lower due to reduction in infiltration.
261
Uses Existing 2023-2032 Project Total Design $- $185,000 $185,000 Acquisition - -Construction - 1,665,000 1,665,000 Total Uses $- $1,850,000 $1,850,000
Timeline Start Completion Design 2025 2025 Acquisition 2025 2025 Construction 2025 2025 Sources Existing 2023 2024 2025 2026 2027 2028-2032 Project Total 98-101 $ $- $- $- $- $- $- $- $Other City $ - - - 1,850,000 - - - 1,850,000 External $ - - - - - - -Total Sources $- $- $- $1,850,000 $- $- $- $1,850,000
Wastewater
Capital Improvement Projects
Ralston Trunk Sewer Improvements - W. 75th from Ward to Union (CRT8)
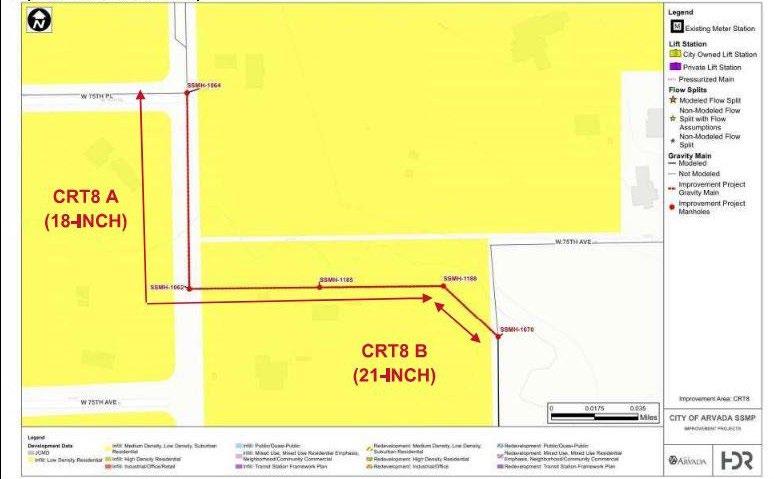
Description
The Central Ralston Trunk Line (CRT) has several areas that are at or exceed capacity. This project was identified as a priority segment as part of the Sewer Master Plan and is required to meet the timeline for planned development.
Project Justification
This project was identified as a priority segment as part of the Sewer Master Plan and is required to meet the timeline for planned development.
Strategic Plan Alignment
Strategic Priority: Infrastructure
The community depends on a well-maintained foundation of streets, sidewalks, and water, wastewater and stormwater facilities. Planned and steady population growth requires proper maintenance of existing infrastructure and additional capacity to support a thriving community.
Project Funding
This project will be funded by bond issuance.
Strategic Principle:
Provides the community with a safe, reliable, high-quality water supply, drainage system, and wastewater disposal services for full city build-out, as defined by the Comprehensive Plan. This includes maintaining utility rates at lowest practical levels with accurate billing that supports replacement of aging infrastructure in order to maintain robust utility systems.
Project Cost Estimate and Timeline
Project is expected to be complete in 2025.
Operating Cost Impact
No additional operating expenses are anticipated. Cost of payment to Metro may be lower due to reduction in infiltration.
262
Uses Existing 2023-2032 Project Total Design $- $100,000 $100,000 Acquisition - -Construction - 900,000 900,000 Total Uses $- $1,000,000 $1,000,000
Timeline Start Completion Design 2025 2025 Acquisition 2025 2025 Construction 2025 2025 Sources Existing 2023 2024 2025 2026 2027 2028-2032 Project Total 98-101 $ $- $- $- $- $- $- $- $Other City $ - - - 1,000,000 - - - 1,000,000 External $ - - - - - - -Total Sources $- $- $- $1,000,000 $- $- $- $1,000,000
Wastewater
Capital Improvement Projects Wastewater
Sewer System Replacement (Operations)
Description
Approximately 60% of the sanitary sewer system was constructed before 1980. Material from that earlier time period has a 50-year life cycle. Using a relatively inexpensive process, these sewer lines are being rehabilitated, resulting in an extension of their life cycle by many decades.
Project Justification
Strategic Plan Alignment
Strategic Priority: Infrastructure
The community depends on a well-maintained foundation of streets, sidewalks, and water, wastewater and stormwater facilities. Planned and steady population growth requires proper maintenance of existing infrastructure and additional capacity to support a thriving community.
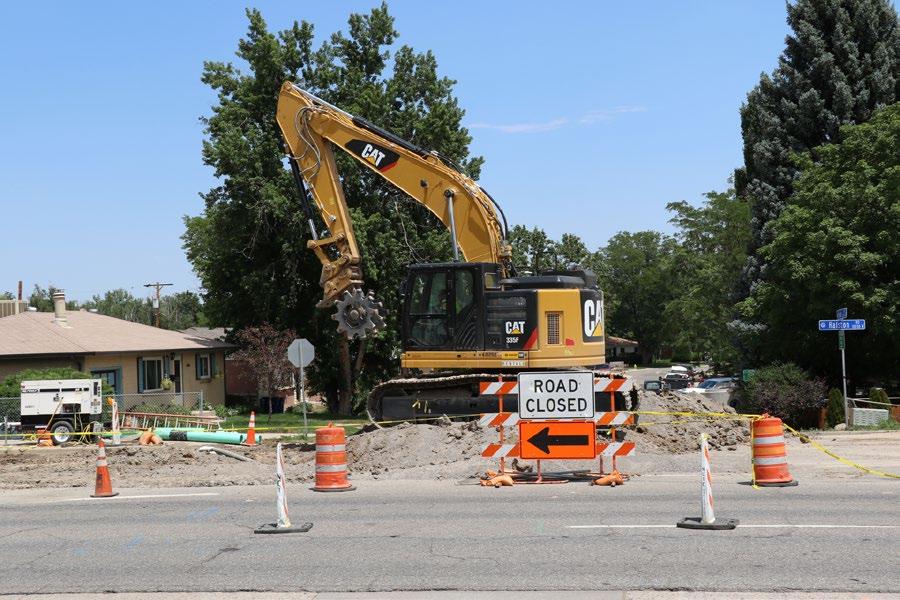
Project Funding
This project is funded through the Wastewater Fund using wastewater rates.
Strategic Principle:
Provides the community with a safe, reliable, high-quality water supply, drainage system, and wastewater disposal services for full city build-out, as defined by the Comprehensive Plan. This includes maintaining utility rates at lowest practical levels with accurate billing that supports replacement of aging infrastructure in order to maintain robust utility systems.
Sources 2023 2024 2025 2026 2027 2028-2032 10-Year Total 98-101 $ $- $- $- $- $- $- $Other City $ 750,000 862,000 905,000 950,000 998,000 5,790,000 10,255,00 External $ - - - - - -Total Sources $750,000 $862,000 $905,000 $950,000 $998,000 $5,790,000 $10,255,00
Project Cost Estimate and Timeline
This is an ongoing program.
Operating Cost Impact
263
There is no operating cost impact. Uses 2023 2024 2025 2026 2027 2028-2032 10-Year Total Design $- $- $- $- $- $- $Acquisition - - - - - -Construction 750,000 862,000 905,000 950,000 998,000 5,790,000 10,255,00 Total Uses $750,000 $862,000 $905,000 $950,000 $998,000 $5,790,000 $10,255,00
This project maintains the reliability and capacity of the wastewater system.
Capital Improvement Projects
Water Overview
The Water category includes improvements for all water infrastructure, including water treatment plants and the drinking water distribution system. Over $117 million through the ten-year plan is included for the Gross Reservoir Expansion, which will substantially increase the availability of water for the City, ensuring a stable and adequate supply for decades to come. Other projects, including system capacity expansion to accommodate new growth in the northwest and continued water main replacements, will see to the continued provision of safe drinking water.
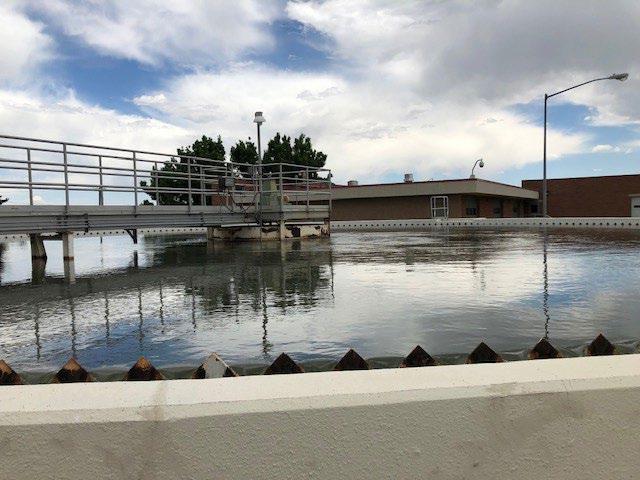
Summary of Water Sources
Summary of Water Uses
264
Uses Existing 2023 2024 2025 2026 2027 2028-2032 Total Design $475,000 $1,330,000 $300,000 $50,000 $50,000 $50,000 $56,050,000 $58,305,000 Acquisition - - - - - - -Construction 19,333,586 51,950,177 35,854,554 31,243,741 28,105,683 60,515,498 104,052,424 331,055,663 Total Uses $19,808,586 $53,280,177 $36,154,554 $31,293,741 $28,155,683 $60,565,498 $160,102,424 $389,360,663 Sources Existing 2023 2024 2025 2026 2027 2028-2032 Total 98-101 $ $- $- $- $- $- $- $- $Other City $ 45,607,640 13,571,216 41,782,040 43,273,081 22,554,343 26,919,164 138,845,288 332,552,772 External $ 21,405,284 39,250,000 - - - - - 60,655,284 Total Sources $67,012,924 $52,821,216 $41,782,040 $43,273,081 $22,554,343 $26,919,164 $138,845,288 $393,208,056
Capital Improvement Projects Water
Chemical System Improvement Description
Update and rehabilitate aging water treatment plant chemical feed systems. The original chemical building was built in 1962 and houses a number of out of service or obsolete chemical systems. Currently, the heating, ventilation, and air conditioning (HVAC) system is obsolete and the lavatories require updating. Individual chemical feed locations require backflow prevention and eyewash stations and water access are needed on all levels of the building.
Project Justification
The water treatment facilities use numerous chemicals to remove contaminants and to render inactivate pathogens. Without consistent chemical feed, the plant will not be able to produce safe drinking water could violate drinking water regulatory requirements. These aging systems are at risk of failure.
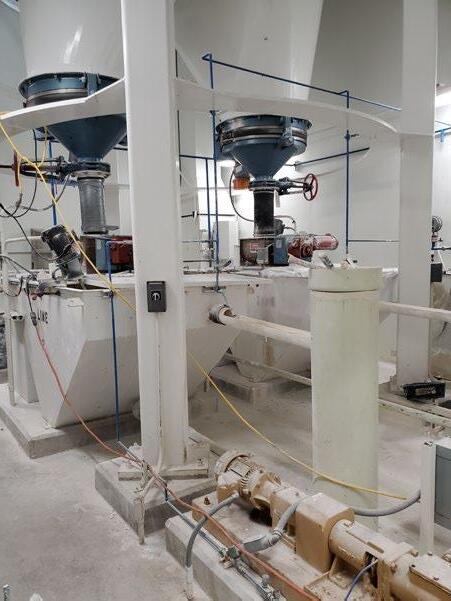
Strategic Plan Alignment
Strategic Priority: Infrastructure
The community depends on a well-maintained foundation of streets, sidewalks, and water, wastewater and stormwater facilities. Planned and steady population growth requires proper maintenance of existing infrastructure and additional capacity to support a thriving community.
Project Funding
Funding is from the Water Fund.
Project Cost Estimate and Timeline
Strategic Principle:
Provides the community with a safe, reliable, high-quality water supply, drainage system, and wastewater disposal services for full city build-out, as defined by the Comprehensive Plan. This includes maintaining utility rates at lowest practical levels with accurate billing that supports replacement of aging infrastructure in order to maintain robust utility systems.
The initial phase of this project is funded, but it is anticipated that final project design will indicate that rehabilitation is needed for multiple chemical systems. An additional budget request may be needed.
Operating Cost Impact
The operating impact will be known after project design is complete.
265
Uses Existing 2023-2032 Project Total Design $250,000 $- $250,000 Acquisition - -Construction - 1,120,000 1,120,000 Total Uses $250,000 $1,120,000 $1,370,000
Timeline Start Completion Design 2023 2024 Acquisition Construction 2025 2026 Sources Existing 2023 2024 2025 2026 2027 2028-2032 Project Total 98-101 $ $- $- $- $- $- $- $- $Other City $ 250,000 - 120,000 1,000,000 - - - 1,370,000 External $ - - - - - - -Total Sources $250,000 $- $120,000 $1,000,000 $- $- $- $1,370,000
Capital Improvement Projects Water
Denver Water Moffat Project Participation
Description
Arvada has entered into a financial partnership with Denver Water on the expansion of Denver’s Moffat system. Arvada’s participation in the Moffat project will result in a water system that can meet the needs of the City at full buildout.
Project Justification
This project will provide additional water supplies to meet the needs of residents.
Strategic Plan Alignment
Strategic Priority: Infrastructure
The community depends on a well-maintained foundation of streets, sidewalks, and water, wastewater and stormwater facilities. Planned and steady population growth requires proper maintenance of existing infrastructure and additional capacity to support a thriving community.
Project Funding
Strategic Principle:
Provides the community with a safe, reliable, high-quality water supply, drainage system, and wastewater disposal services for full city build-out, as defined by the Comprehensive Plan. This includes maintaining utility rates at lowest practical levels with accurate billing that supports replacement of aging infrastructure in order to maintain robust utility systems.
Funding is from water system development charges and bond issuance. In October of 2013, $36,514,560 was placed into escrow per an agreement with Denver Water as part of the City’s financial obligation toward the expansion. That funding is reflected in the figures below.
Project Cost Estimate and Timeline
These funds represent Arvada’s portion of the project total. Construction is expected to be complete by 2027.
Operating Cost Impact
There are no operations and maintenance costs, but water will be purchased from Denver Water at the standard out-of-city contract rate. These are different terms from the 1965 contract with Denver Water and will be subject to additional drought period limitations.
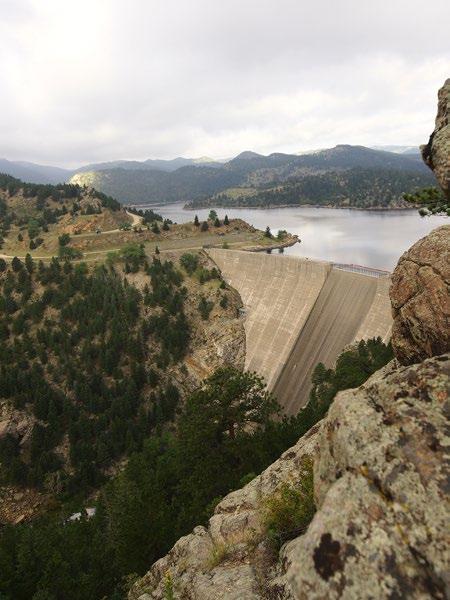
266
Uses Existing 2023-2032 Project Total Design $- $- $Acquisition - -Construction 41,920,438 188,120,000 230,040,438 Total Uses $41,920,438 $118,120,000 $230,040,438
Timeline Start Completion Design 2013 2020 Acquisition Construction 2020 2027 Sources Existing 2023 2024 2025 2026 2027 2028-2032 Project Total 98-101 $ $- $- $- $- $- $- $- $Other City $ 41,920,438 25,040,000 29,560,000 12,520,000 9,200,000 - 118,240,428 External $ 20,000,000 - - - - - 20,000,000 Total Sources $41,920,438 $20,000,000 $25,040,000 $29,560,000 $12,520,000 $9,200,000 $- $138,240,428
Capital Improvement Projects Water
Distribution System Master Plan Update
Description
City council included utilities system master planning in the Strategic Plan. The Water Distribution System Master Plan was completed in 2019. Routine updating is needed to reflect system changes and verify and update project priorities.
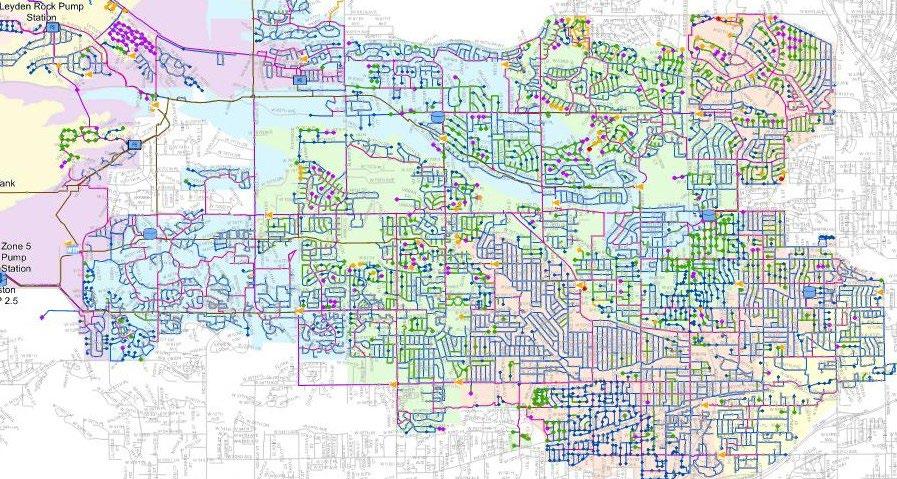
Project Justification
Master Plans updates should be conducted approximately every 5 years.
Strategic Plan Alignment
Strategic Priority: Infrastructure
The community depends on a well-maintained foundation of streets, sidewalks, and water, wastewater and stormwater facilities. Planned and steady population growth requires proper maintenance of existing infrastructure and additional capacity to support a thriving community.
Project Funding
Funding is from Water Tap fees.
Project Cost Estimate and Timeline
Ongoing every 5 years.
Operating Cost Impact
There is no operating cost impact with this project.
Strategic Principle:
Provides the community with a safe, reliable, high-quality water supply, drainage system, and wastewater disposal services for full city build-out, as defined by the Comprehensive Plan. This includes maintaining utility rates at lowest practical levels with accurate billing that supports replacement of aging infrastructure in order to maintain robust utility systems.
267
Uses 2023 2024 2025 2026 2027 2028-2032 10-Year Total Design $- $- $- $- $- $- $Acquisition - - - - - -Construction - 400,000 - - - 300,000 700,000 Total Uses $- $400,000 $- $- $- $300,000 $700,000
Sources 2023 2024 2025 2026 2027 2028-2032 10-Year Total 98-101 $ $- $- $- $- $- $- $Other City $ - 400,000 - - - 300,000 700,000 External $ - - - - - -Total Sources $- $400,000 $- $- $- $300,000 $700,000
Capital Improvement Projects Water
Distribution System Storage/Pumping/Pipe Expansion (additional water system upgrades)
Description
The water distribution master plan identified additional storage capacity needed for buildout. A storage master plan is currently underway to refine the analysis. This project contemplates an additional 3 MG of water storage by 2026-2027. Additional piping and pumping is needed to integrate new storage into the system.
Project Justification
This project is needed capacity for planned development.
Strategic Plan Alignment
Strategic Priority: Infrastructure
The community depends on a well-maintained foundation of streets, sidewalks, and water, wastewater and stormwater facilities. Planned and steady population growth requires proper maintenance of existing infrastructure and additional capacity to support a thriving community.
Project Funding
This project will be funded by bond issuance.
Strategic Principle:
Provides the community with a safe, reliable, high-quality water supply, drainage system, and wastewater disposal services for full city build-out, as defined by the Comprehensive Plan. This includes maintaining utility rates at lowest practical levels with accurate billing that supports replacement of aging infrastructure in order to maintain robust utility systems.
Project Cost Estimate and Timeline
This project is expected to be completed by 2027.
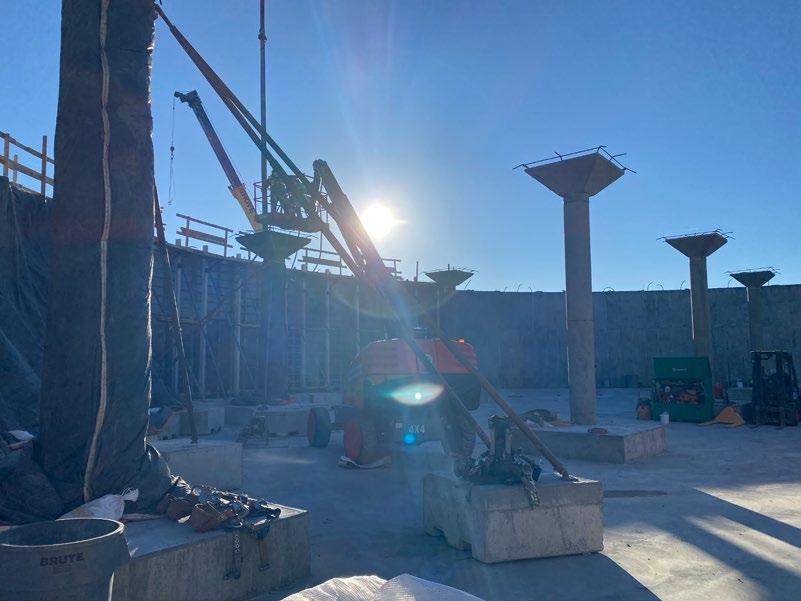
Operating Cost Impact
The operating cost impact of this project is currently unknown.
268
Uses Existing 2023-2032 Project Total Design $- $500,000 $500,000 Acquisition - -Construction - 23,550,000 23,550,000 Total Uses $- $24,050,000 $24,050,000
Timeline Start Completion Design 2026 2026 Acquisition Construction 2026 2027 Sources Existing 2023 2024 2025 2026 2027 2028-2032 Project Total 98-101 $ $- $- $- $- $- $- $- $Other City $ - - - - 6,000,000 6,000,000 6,000,000 18,000,000 External $ - 6,050,000 - - - - - 6,050,000 Total Sources $- $6,050,000 $- $- $6,000,000 $6,000,000 $6,000,000 $24,050,000
Capital Improvement Projects Water
Highway 93 Lakes Water Storage Project
Description
This project is for construction of a raw water reservoir on the Pioneer-Blunn property.
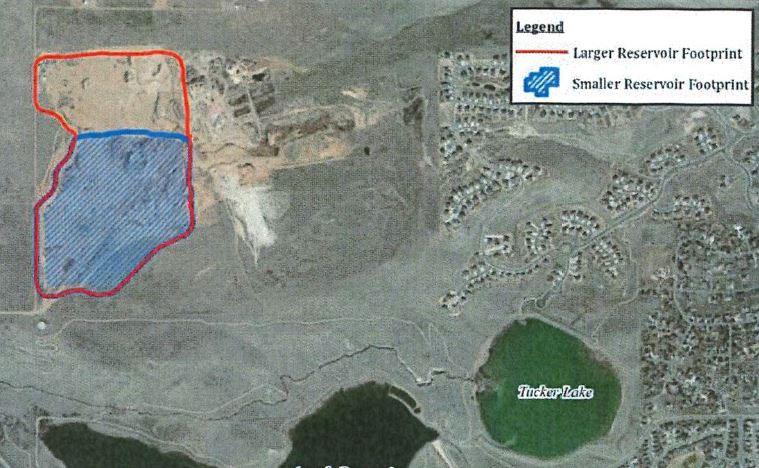
Project Justification
This project meets future water supply needs.
Strategic Plan Alignment
Strategic Priority: Infrastructure
The community depends on a well-maintained foundation of streets, sidewalks, and water, wastewater and stormwater facilities. Planned and steady population growth requires proper maintenance of existing infrastructure and additional capacity to support a thriving community.
Project Funding
Funding is from the Water Fund water tap fees.
Strategic Principle:
Provides the community with a safe, reliable, high-quality water supply, drainage system, and wastewater disposal services for full city build-out, as defined by the Comprehensive Plan. This includes maintaining utility rates at lowest practical levels with accurate billing that supports replacement of aging infrastructure in order to maintain robust utility systems.
Project Cost Estimate and Timeline
This project is expected to be completed by 2030.
Operating Cost Impact
The operating cost impact of this project is currently unknown.
269
Uses Existing 2023-2032 Project Total Design $- $1,500,000 $1,500,000 Acquisition - -Construction - 19,000,000 19,000,000 Total Uses $- $20,500,000 $20,500,000
Timeline Start Completion Design 2028 2028 Acquisition Construction 2028 2030 Sources Existing 2023 2024 2025 2026 2027 2028-2032 Project Total 98-101 $ $- $- $- $- $- $- $- $Other City $ - - - - - 20,500,000 20,500,000 External $ - - - - - - -Total Sources $- $- $- $- $- $20,500,000 $20,500,000
Capital Improvement Projects Water
Hydraulic Modeling Description
The water distribution system hydraulic model requires annual updates to reflect system improvements and operational changes. This budget will be used to include those updates in the model and use the model for scenario analysis.
Project Justification
Understanding how changes in the distribution system, whether operational development or capital project based, will impact service throughout the system is fundamental to maintaining uninterrupted service and providing water within regulatory guidelines. The model will also help evaluate the impact of changing water demands over time. The model can be used to evaluate alternatives resulting in cost savings.
Strategic Plan Alignment
Strategic Priority: Infrastructure
The community depends on a well-maintained foundation of streets, sidewalks, and water, wastewater and stormwater facilities. Planned and steady population growth requires proper maintenance of existing infrastructure and additional capacity to support a thriving community.
Project Funding
Funding is from the Water Fund.
Project Cost Estimate and Timeline
Annual updates to reflect system improvements and operational changes.
Strategic Principle:
Provides the community with a safe, reliable, high-quality water supply, drainage system, and wastewater disposal services for full city build-out, as defined by the Comprehensive Plan. This includes maintaining utility rates at lowest practical levels with accurate billing that supports replacement of aging infrastructure in order to maintain robust utility systems.
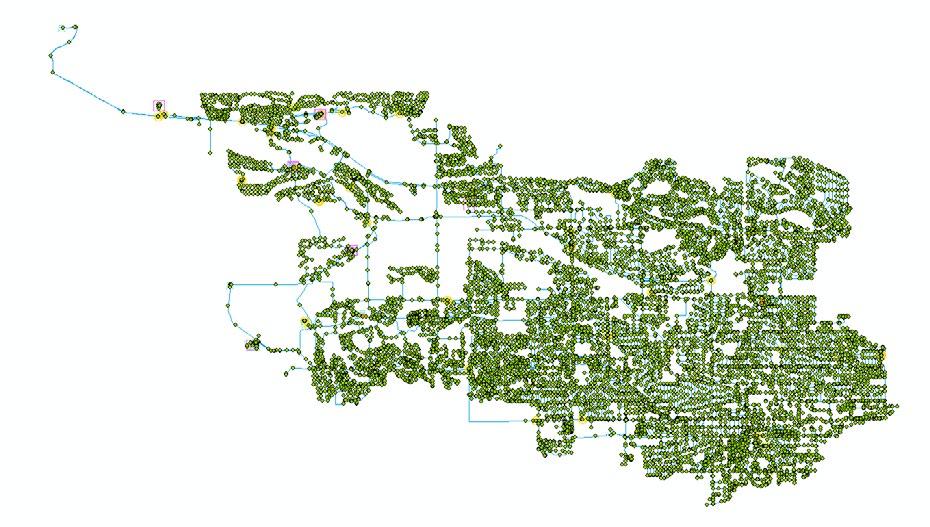
Operating Cost Impact
There is no operating cost associated with this project.
270
Uses 2023 2024 2025 2026 2027 2028-2032 10-Year Total Design $50,000 $50,000 $50,000 $60,000 $ 66,667 $ 333,335 $610,002 Acquisition - - - - - -Construction - - - - - -Total Uses $50,000 $50,000 $50,000 $50,000 $50,000 $333,335 $610,002
Sources 2023 2024 2025 2026 2027 2028-2032 10-Year Total 98-101 $ $- $- $- $- $- $- $Other City $ 50,000 50,000 50,000 60,000 66,667 333,335 610,002 External $ - - - - - -Total Sources $50,000 $50,000 $50,000 $60,000 $ 66,667 $333,335 $610,002
Capital Improvement Projects Water
Lead and Copper Corrosion Control and Service Line Replacement
Description
The revised EPA lead and copper rule requires water systems to conduct service line inventories, corrosion studies, provide optimal corrosion control treatment and implement service line replacement programs.
Project Justification
This project fulfills the mandatory requirements of the revised EPA lead and copper rule, which includes the investigation/identification/replacement of any lead and/or galvanized water lines for our customers and city-owned properties.
Strategic Plan Alignment
Strategic Priority: Infrastructure
The community depends on a well-maintained foundation of streets, sidewalks, and water, wastewater and stormwater facilities. Planned and steady population growth requires proper maintenance of existing infrastructure and additional capacity to support a thriving community.
Project Funding
This project is funded by bond issuance and the Water Fund.
Strategic Principle:
Provides the community with a safe, reliable, high-quality water supply, drainage system, and wastewater disposal services for full city build-out, as defined by the Comprehensive Plan. This includes maintaining utility rates at lowest practical levels with accurate billing that supports replacement of aging infrastructure in order to maintain robust utility systems.
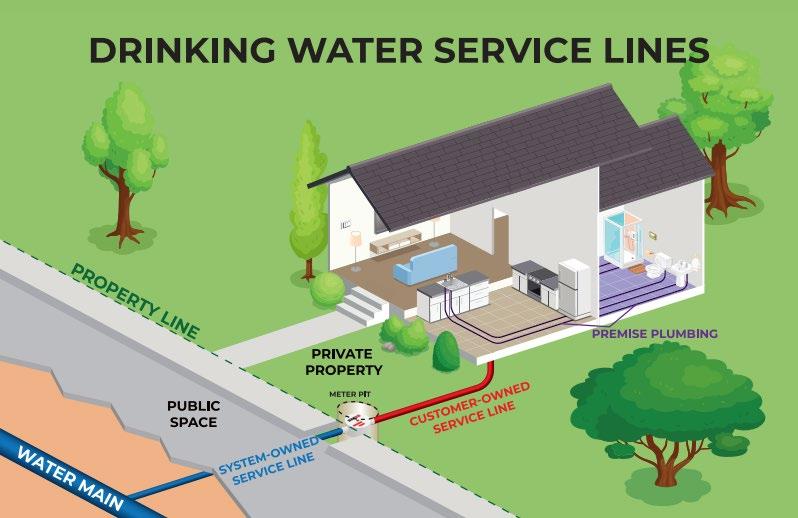
Project Cost Estimate and Timeline
This project is fully funded and expected to be complete by 2025.
Operating Cost Impact
The operating cost impact of this project is currently unknown.
271
Uses Existing 2023-2032 Project Total Design $- $230,000 $230,000 Acquisition - -Construction - 2,300,000 2,300,000 Total Uses $- $2,530,000 $2,530,000
Timeline Start Completion Design 2023 2024 Acquisition Construction 2024 2025 Sources Existing 2023 2024 2025 2026 2027 2028-2032 Project Total 98-101 $ $- $- $- $- $- $- $- $Other City $ - - 2,300,000 - - - - 2,300,000 External $ - 230,000 - - - - - 230,000 Total Sources $- $230,000 $2,300,000 $- $- $- $- $2,530,000
Capital Improvement Projects Water
Pumped Zones Pump Station
Description
The water distribution system requires additional water storage and pumping to meet current and future demands of planned development. These projects are required for planned development to continue on the current timeline. Additional pumping is needed for the pumped zones storage tank to be fully integrated into the water system.
Project Justification
Strategic Plan Alignment
Strategic Priority: Infrastructure
The community depends on a well-maintained foundation of streets, sidewalks, and water, wastewater and stormwater facilities. Planned and steady population growth requires proper maintenance of existing infrastructure and additional capacity to support a thriving community.
Project Funding
Partially funded by developer contributions and water bond issue.
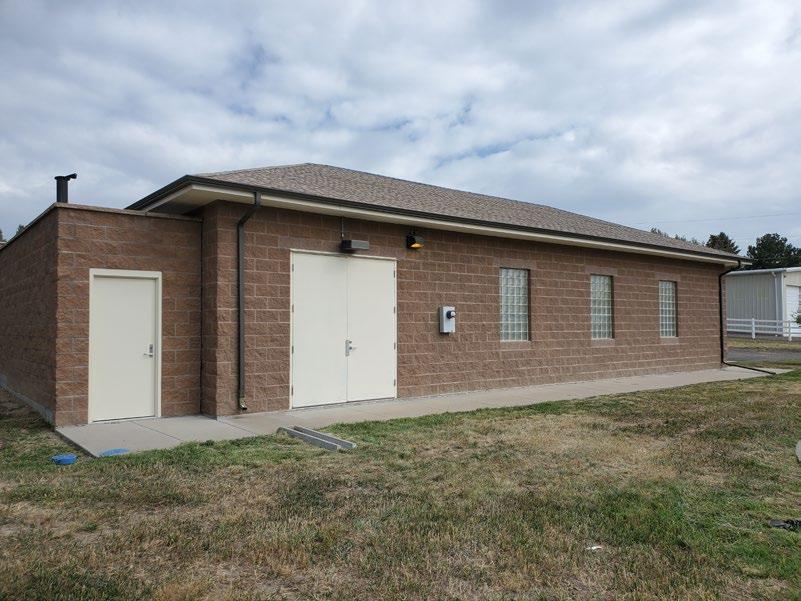
Strategic Principle: Provides the community with a safe, reliable, high-quality water supply, drainage system, and wastewater disposal services for full city build-out, as defined by the Comprehensive Plan. This includes maintaining utility rates at lowest practical levels with accurate billing that supports replacement of aging infrastructure in order to maintain robust utility systems.
Project Cost Estimate and Timeline
This project is fully funded and expected to be complete in 2024.
Timeline Start Completion Design 2022 2023 Acquisition 2022 2022 Construction 2023 2024 Sources Existing 2023 2024 2025 2026 2027 2028-2032 Project Total 98-101 $ $- $- $- $- $- $- $- $Other City $ 250,000 6,000,000 - - - - - 6,250,000 External $ - - - - - - -Total Sources $250,000 $6,000,000 $- $- $- $- $- $6,250,000
Operating Cost Impact
272
The operating cost impact of this project is currently unknown. Uses Existing 2023-2032 Project Total Design $- $250,000 $250,000 Acquisition - -Construction - 6,000,000 6,000,000 Total Uses $- $6,250,000 $6,250,000
The project is required for planned development to continue on the current timeline. 100% of this project will be funded by the city.
Capital Improvement Projects Water
Pumped Zones Storage Tank
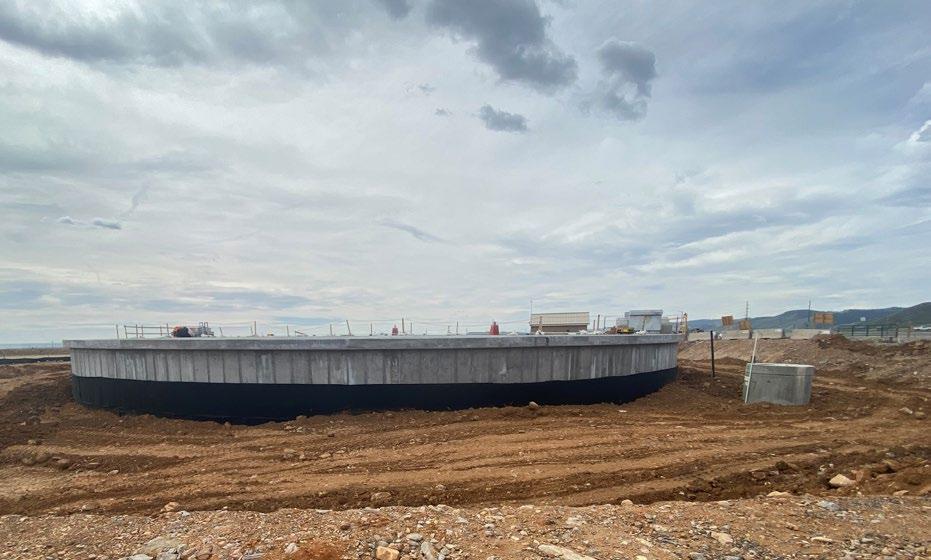
Description
The water distribution system requires additional water storage and pumping to meet current and future demands of planned development. The storage provided by this tank is identified in the Jefferson Center Metropolitan District Utility Master Plan.
Project Justification
The project is required for planned development to continue on the current timeline. Funding for 100% of this project will come from the Metro District.
Strategic Plan Alignment
Strategic Priority: Infrastructure
The community depends on a well-maintained foundation of streets, sidewalks, and water, wastewater and stormwater facilities. Planned and steady population growth requires proper maintenance of existing infrastructure and additional capacity to support a thriving community.
Project Funding
Funding is from developer contributions.
Strategic Principle:
Provides the community with a safe, reliable, high-quality water supply, drainage system, and wastewater disposal services for full city build-out, as defined by the Comprehensive Plan. This includes maintaining utility rates at lowest practical levels with accurate billing that supports replacement of aging infrastructure in order to maintain robust utility systems.
Project Cost Estimate and Timeline
Project is fully funded and expected to be complete in 2024.
Operating Cost Impact
The operating cost impact of this project is currently unknown.
273
Uses Existing 2023-2032 Project Total Design $- $250,000 $250,000 Acquisition
-Construction - 7,350,000 7,350,000 Total Uses $- $7,600,000 $7,600,000
-
Timeline Start Completion Design 2023 2023 Acquisition 2023 2023 Construction 2023 2024 Sources Existing 2023 2024 2025 2026 2027 2028-2032 Project Total 98-101 $ $- $- $- $- $- $- $- $Other City $ - - - - - - -External $ 250,000 6,000,000 1,350,000 - - - - 7,600,000 Total Sources $250,000 $6,000,000 $1,350,000 $- $- $- $- $7,600,000
Capital Improvement Projects Water
Ralston Plant and System Storage Tanks Replacement and Expansion Description
In order to serve the city’s growth, the water master plan identified the need to add storage capacity at the Ralston Water Treatment Plant. Additionally, existing storage in the distribution system is aged. A storage master plan is currently underway to provide a roadmap for replacement, rehabilitation, and expansion.
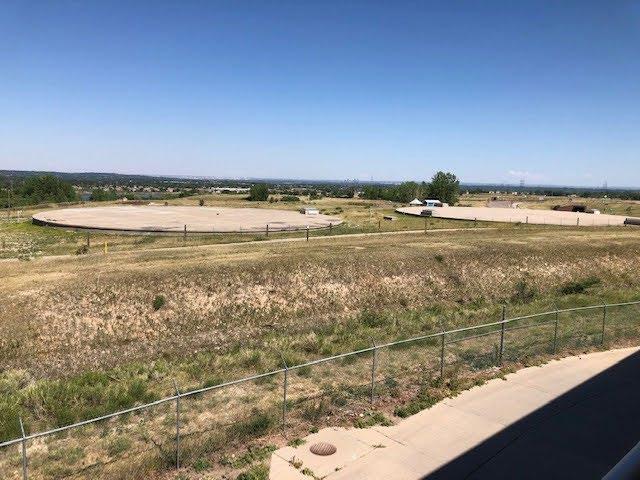
Project Justification
This project is twofold. One phase is a reinvestment to replace an old, failing, leaking storage tank with a new larger tank by 2030. After 2030, a second tank will be needed. If the request is not funded, the water system will not be able to serve the city needs as contemplated in the comprehensive plan.
Strategic Plan Alignment
Strategic Priority: Infrastructure
The community depends on a well-maintained foundation of streets, sidewalks, and water, wastewater and stormwater facilities. Planned and steady population growth requires proper maintenance of existing infrastructure and additional capacity to support a thriving community.
Project Funding
Funding is not identified.
Project Cost Estimate and Timeline
This project is scheduled for 2029 start.
Operating Cost Impact
Strategic Principle:
Provides the community with a safe, reliable, high-quality water supply, drainage system, and wastewater disposal services for full city build-out, as defined by the Comprehensive Plan. This includes maintaining utility rates at lowest practical levels with accurate billing that supports replacement of aging infrastructure in order to maintain robust utility systems.
No additional expenses. The first phase will replace an existing tank with a larger one.
274
Uses Existing 2023-2032 Project Total Design $- $3,000,000 $3,000,000 Acquisition - -Construction - 45,350,000 45,350,000 Total Uses $- $48,350,000 $48,350,000
Timeline Start Completion Design 2029 2029 Acquisition 2029 2029 Construction 2029 2031 Sources Existing 2023 2024 2025 2026 2027 2028-2032 Project Total 98-101 $ $- $- $- $- $- $- $- $Other City $ - - - - - - -External $ - - - - - - 48,350,000 48,350,000 Total Sources $- $- $- $- $- $- $48,350,000 $48,350,000
Capital Improvement Projects Water
Ralston Water Treatment Plant Filter Rehab
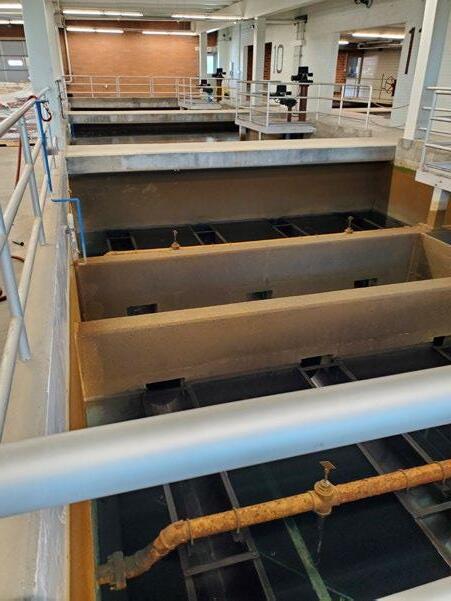
Description
The Ralston Plant filters and filter media are beyond their design life. This project will fund filter design and replacement.
Project Justification
Filters are the heart of any water treatment plant. The existing filters at the Ralston plant have not been rehabilitated in over 25 years. Typical filter design life is 10 years. If not funded, the city risks not being able to meet regulatory requirements in the Safe Drinking Water Act. This project will also evaluate the potential to increase capacity in the existing filters and provide resiliency and serve growth in the city as contemplated in the comprehensive plan. This was identified as a high priority in the water treatment master plan.
Strategic Plan Alignment
Strategic Priority: Infrastructure
The community depends on a well-maintained foundation of streets, sidewalks, and water, wastewater and stormwater facilities. Planned and steady population growth requires proper maintenance of existing infrastructure and additional capacity to support a thriving community.
Project Funding
Funding is from the Water Fund.
Project Cost Estimate and Timeline
Strategic Principle:
Provides the community with a safe, reliable, high-quality water supply, drainage system, and wastewater disposal services for full city build-out, as defined by the Comprehensive Plan. This includes maintaining utility rates at lowest practical levels with accurate billing that supports replacement of aging infrastructure in order to maintain robust utility systems.
This project is not fully funded. The design work and preliminary construction currently funded will determine the final cost of the filter rehabilitation.
Operating Cost Impact
No additional ongoing expenses.
275
Uses Existing 2023-2032 Project Total Design $475,000 $- $475,000 Acquisition - -Construction - 23,691,171 23,691,171 Total Uses $475,000 $23,691,171 $24,166,171
Timeline Start Completion Design 2021 2022 Acquisition Construction 2022 2024 Sources Existing 2023 2024 2025 2026 2027 2028-2032 Project Total 98-101 $ $- $- $- $- $- $- $- $Other City $ 2,760,887 - - - - - - 2,760,887 External $ 21,405,284 - - - - - - 21,405,284 Total Sources $ 24,166,171 $- $- $- $- $- $- $24,166,171
Capital Improvement Projects Water
Risk and Resiliency Assessment / Emergency Response Plan Updates
Description
Updated Risk and Resiliency and Emergency Response Plans (RRA/ERP) are required by America’s Water Infrastructure Act (AWIA).
Project Justification
This project is a mandatory requirement.
Strategic Plan Alignment
Strategic Priority: Infrastructure
The community depends on a well-maintained foundation of streets, sidewalks, and water, wastewater and stormwater facilities. Planned and steady population growth requires proper maintenance of existing infrastructure and additional capacity to support a thriving community.
Project Funding
This project is funded by Water Fund tap fees.
Strategic Principle:
Provides the community with a safe, reliable, high-quality water supply, drainage system, and wastewater disposal services for full city build-out, as defined by the Comprehensive Plan. This includes maintaining utility rates at lowest practical levels with accurate billing that supports replacement of aging infrastructure in order to maintain robust utility systems.
Project Cost Estimate and Timeline
This is an ongoing project requiring update every 5 years.
Operating Cost Impact
There is no operating cost impact with this project.
276
Uses 2023 2024 2025 2026 2027 2028-2032 10-Year Total Design $- $- $- $- $- $- $Acquisition - - - - - -Construction - 200,000 - - 300,000 100,000 600,000 Total Uses $- $200,000 $- $- $300,000 $100,000 $600,000
Sources 2023 2024 2025 2026 2027 2028-2032 10-Year Total 98-101 $ $- $- $- $- $- $- $Other City $ - 200,000 - - 300,000 100,000 600,000 External $ - - - - - -Total Sources $- $200,000 $- $- $300,000 $100,000 $600,000
Capital Improvement Projects Water
Sliplining of 54” Transmission Main
Description
Project was recommended based on an assessment completed for the 54” TM alignment West of Indiana and adjacent to the new Ralston Ridge Development.
Project Justification
The project would reduce risk of line damage and extend the useful life of the asset.
Strategic Plan Alignment
Strategic Priority: Infrastructure
The community depends on a well-maintained foundation of streets, sidewalks, and water, wastewater and stormwater facilities. Planned and steady population growth requires proper maintenance of existing infrastructure and additional capacity to support a thriving community.

Project Funding
Project funding is from Water Fund system development charges.
Strategic Principle:
Provides the community with a safe, reliable, high-quality water supply, drainage system, and wastewater disposal services for full city build-out, as defined by the Comprehensive Plan. This includes maintaining utility rates at lowest practical levels with accurate billing that supports replacement of aging infrastructure in order to maintain robust utility systems.
Project Cost Estimate and Timeline
Project is expected to be complete by 2025.
Operating Cost Impact
There is no operating cost impact with this project.
277
Uses Existing 2023-2032 Project Total Design $- $- $Acquisition - -Construction - 1,100,000 1,100,000 Total Uses $- $1,100,000 $ 1,100,000
Timeline Start Completion Design 2025 2025 Acquisition Construction 2025 2025 Sources Existing 2023 2024 2025 2026 2027 2028-2032 Project Total 98-101 $ $- $- $- $- $- $- $- $Other City $ - - 1,100,000 - - - - 1,100,000 External $ - - - - - - -Total Sources $- $- $1,100,000 $- $- $- $- $1,100,000
Capital Improvement Projects Water
Smart Meter Upgrades
Description
Upgrade water meters to smart water meters to gain efficiencies in meter reading and customer billing. Smart meters allow customers to monitor their use in real time.
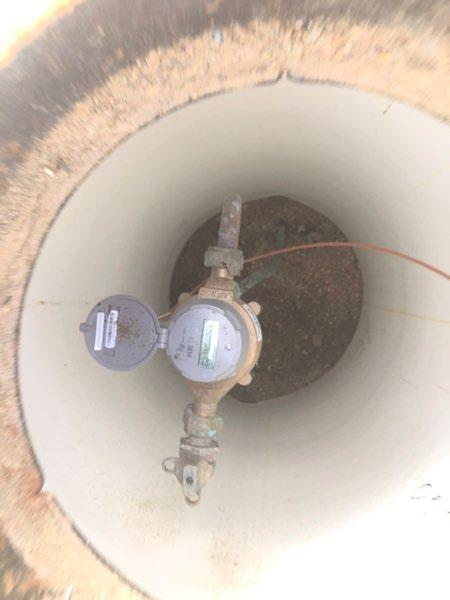
Project Justification
Increase efficiencies in meter reading and customer billing.
Strategic Plan Alignment
Strategic Priority: Infrastructure
The community depends on a well-maintained foundation of streets, sidewalks, and water, wastewater and stormwater facilities. Planned and steady population growth requires proper maintenance of existing infrastructure and additional capacity to support a thriving community.
Project Funding
Funded from customer water rates and bond issuance.
Strategic Principle:
Provides the community with a safe, reliable, high-quality water supply, drainage system, and wastewater disposal services for full city build-out, as defined by the Comprehensive Plan. This includes maintaining utility rates at lowest practical levels with accurate billing that supports replacement of aging infrastructure in order to maintain robust utility systems.
Project Cost Estimate and Timeline
Project is fully funded and expected to be complete in 2025.
Operating Cost Impact
The operating cost is expected to be net zero.
278
Uses Existing 2023-2032 Project Total Design $- $- $Acquisition - -Construction - 9,900,000 9,900,000 Total Uses $- $9,900,000 $9,900,000
Timeline Start Completion Design 2021 2021 Acquisition Construction 2021 2025 Sources Existing 2023 2024 2025 2026 2027 2028-2032 Project Total 98-101 $ $- $- $- $- $- $- $- $Other City $ - - 2,900,000 2,900,000 - - - 5,800,000 External $ - 4,100,000 - - - 4,100,000 Total Sources $- $4,100,000 $2,900,000 $2,900,000 $- $- $- $9,900,000
Capital Improvement Projects
Water Distribution System Upgrades
Description
A water distribution system master plan was recently completed. These funds are for system upgrades identified in the master plan.
Project Justification
System upgrades are needed to provide improved long term water system functionality and reliability.
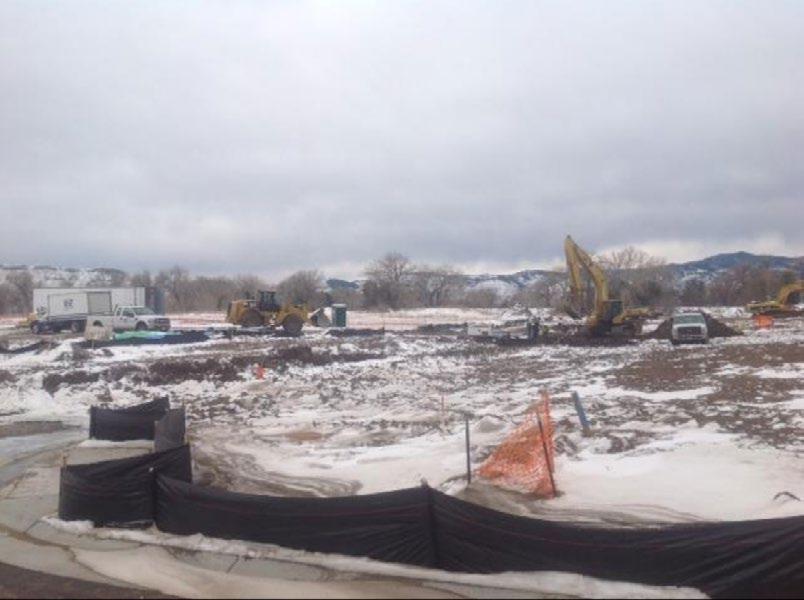
Strategic Plan Alignment
Strategic Priority: Infrastructure
The community depends on a well-maintained foundation of streets, sidewalks, and water, wastewater and stormwater facilities. Planned and steady population growth requires proper maintenance of existing infrastructure and additional capacity to support a thriving community.
Project Funding
Funding is from the Water Fund water tap fees.
Strategic Principle:
Provides the community with a safe, reliable, high-quality water supply, drainage system, and wastewater disposal services for full city build-out, as defined by the Comprehensive Plan. This includes maintaining utility rates at lowest practical levels with accurate billing that supports replacement of aging infrastructure in order to maintain robust utility systems.
Project Cost Estimate and Timeline
This project is fully funded. Projects are determined by the water distribution master plan.
Operating Cost Impact
There is no operating cost impact.
279
Uses 2023 2024 2025 2026 2027 2028-2032 10-Year Total Design $- $- $- $- $- $- $Acquisition - - - - - -Construction 541,216 552,040 563,081 574,343 585,830 3,128,618 5,945,128 Total Uses $541,216 $552,040 $563,081 $574,343 $585,830 $3,128,618 $5,945,128
Sources 2023 2024 2025 2026 2027 2028-2032 10-Year Total 98-101 $ $- $- $- $- $- $- $Other City $ 541,216 552,040 563,081 574,343 585,830 3,128,618 5,945,128 External $ - - - - - -Total Sources $541,216 $552,040 $563,081 $574,343 $585,830 $3,128,618 $5,945,128
Water
Capital Improvement Projects
Water
Water Resources Master Plan Description
A Water Resources and raw water system master plan is needed to plan for future capacity and reinvestment needs for the system and supply portfolio. This plan compliments the recently completed Water Distribution Master Plan and Treatment Master Plans.
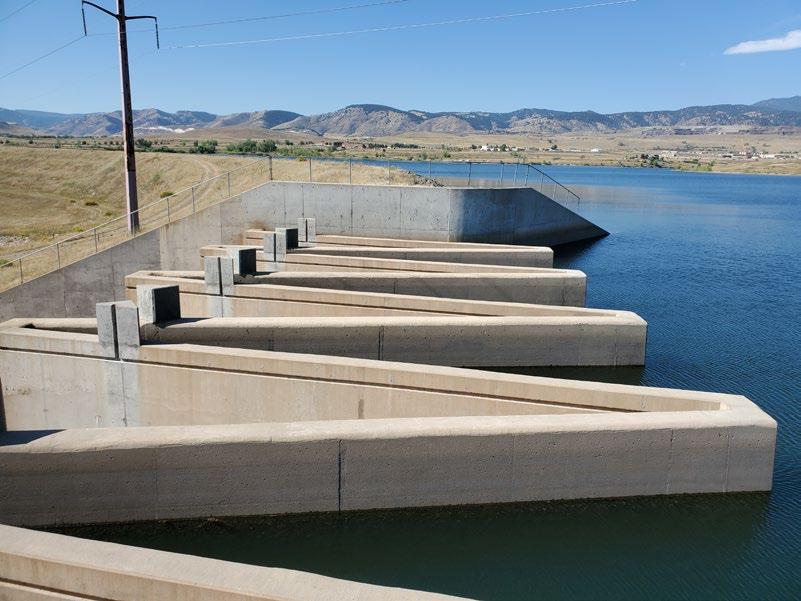
Project Justification
City council included utilities system master planning in the Strategic Plan. The raw water assets were not evaluated in the Water Treatment and Distribution System Master Plans. These are critical assets that require evaluation and master planning for reinvestment and upgrades.
Strategic Plan Alignment
Strategic Priority: Infrastructure
The community depends on a well-maintained foundation of streets, sidewalks, and water, wastewater and stormwater facilities. Planned and steady population growth requires proper maintenance of existing infrastructure and additional capacity to support a thriving community.
Project Funding
Funding is from the Water Fund tap fees.
Project Cost Estimate and Timeline
Ongoing project every 5 years.
Operating Cost Impact
There is no operating cost impact for this project.
Strategic Principle: Provides the community with a safe, reliable, high-quality water supply, drainage system, and wastewater disposal services for full city build-out, as defined by the Comprehensive Plan. This includes maintaining utility rates at lowest practical levels with accurate billing that supports replacement of aging infrastructure in order to maintain robust utility systems.
280
Uses 2023 2024 2025 2026 2027 2028-2032 10-Year Total Design $250,000 $- $- $- $- $300,000 $550,000 Acquisition - - - - - -Construction - - - - - -Total Uses $250,000 $- $- $- $- $300,000 $550,000
Sources 2023 2024 2025 2026 2027 2028-2032 10-Year Total 98-101 $ $- $- $- $- $- $- $Other City $ 250,000 - - - - 300,000 550,000 External $ - - - - - -Total Sources $250,000 $- $- $- $- $300,000 $550,000
Capital Improvement Projects Water
Water System Replacement (Operations)
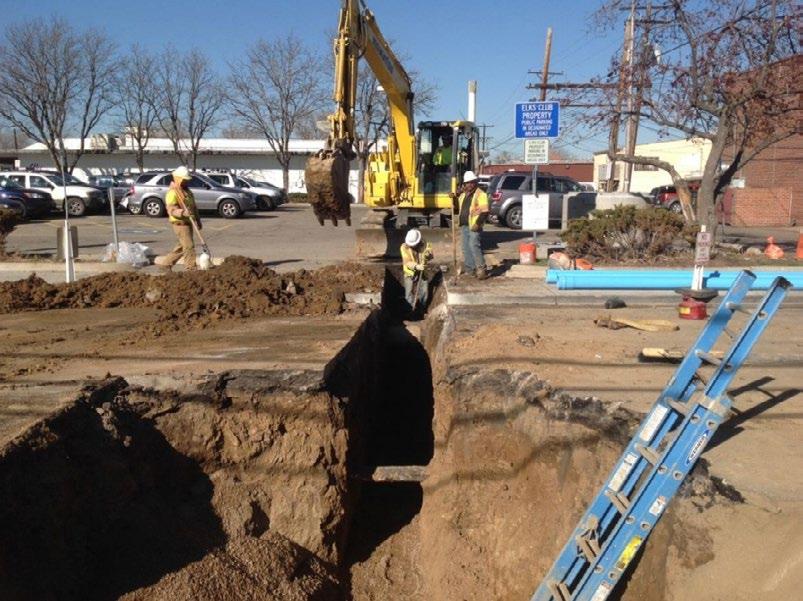
Description
Water infrastructure installed prior to 1980 generally has a 50-year life cycle. As this part of the water system reaches the end of its life cycle, the infrastructure needs to be replaced. The pipeline replacement priority is based upon leak history, age, and other known factors about the condition of the pipeline.
Project Justification
A proactive main replacement program is key to maintaining the reliability of the water system, an expectation and responsibility to City of Arvada rate payers.
Strategic Plan Alignment
Strategic Priority: Infrastructure
The community depends on a well-maintained foundation of streets, sidewalks, and water, wastewater and stormwater facilities. Planned and steady population growth requires proper maintenance of existing infrastructure and additional capacity to support a thriving community.
Project Funding
Strategic Principle:
Provides the community with a safe, reliable, high-quality water supply, drainage system, and wastewater disposal services for full city build-out, as defined by the Comprehensive Plan. This includes maintaining utility rates at lowest practical levels with accurate billing that supports replacement of aging infrastructure in order to maintain robust utility systems.
Funding is from the Water Fund, through water rates. The program is designed to grow at 3% each year to keep up with vendor costs and to grow the level of replacement over the years.
Project Cost Estimate and Timeline
This project is fully funded. Projects are designed in-house by the Engineering Division of Public Works.
Operating Cost Impact
There is no operating cost impact.
281
Uses 2023 2024 2025 2026 2027 2028-2032 10-Year Total Design $- $- $- $- $- $- $Acquisition - - - - - -Construction 8,100,000 8.300.000 8,600,000 8,800,000 9,866,667 49,333,335 93,000,002 Total Uses $8,100,000 $8,300,000 $8,600,000 $8,800,000 $9,866,667 $ 49,333,335 $93,000,002
Sources 2023 2024 2025 2026 2027 2028-2032 10-Year Total 98-101 $ $- $- $- $- $- $- $Other City $ 8.300.000 8,600,000 8,800,000 9,866,667 49,333,335 84,900,002 External $ 8,100,000 - - - - - 8,100,000 Total Sources $8,100,000 $8,300,000 $8,600,000 $8,800,000 $9,866,667 $ 49,333,335 $93,000,002
Capital Improvement Projects
Water Treatment Plant Repair Program
Description
The water treatment plants are aging and require ongoing maintenance to remain operational while plans are made to replace the treatment plant in future years.
Project Justification
This project is for ongoing capital maintenance for the water treatment plant.
Strategic Plan Alignment
Strategic Priority: Infrastructure
The community depends on a well-maintained foundation of streets, sidewalks, and water, wastewater and stormwater facilities. Planned and steady population growth requires proper maintenance of existing infrastructure and additional capacity to support a thriving community.
Project Funding
Funding is from water rates charged to customers.
Strategic Principle: Provides the community with a safe, reliable, high-quality water supply, drainage system, and wastewater disposal services for full city build-out, as defined by the Comprehensive Plan. This includes maintaining utility rates at lowest practical levels with accurate billing that supports replacement of aging infrastructure in order to maintain robust utility systems.
Project Cost Estimate and Timeline
This project is ongoing to provide ongoing maintenance.
Operating Cost Impact
No ongoing costs associated with this project is for ongoing capital maintenance.
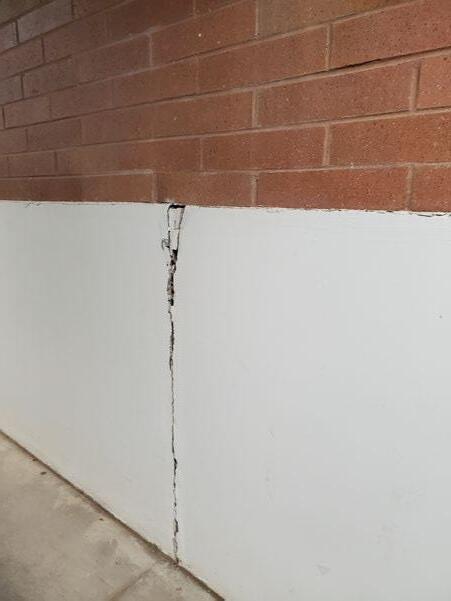
282
Uses 2023 2024 2025 2026 2027 2028-2032 10-Year Total Design $- $- $- $- $- $- $Acquisition - - - - - -Construction 500,000 570,000 600,000 600,000 900,000 4,500,000 7,670,000 Total Uses $500,000 $570,000 $600,000 $600,000 $900,000 $4,500,000 $7,670,000
Sources 2023 2024 2025 2026 2027 2028-2032 10-Year Total 98-101 $ $- $- $- $- $- $- $Other City $ 500,000 570,000 600,000 600,000 900,000 4,500,000 7,670,000 External $ - - - - - -Total Sources $500,000 $570,000 $600,000 $600,000 $900,000 $4,500,000 $7,670,000
Water
Capital Improvement Projects Water
Water Treatment Plant Replacement and Expansion
Description
The Water Treatment Plant Master Plan identified replacement of the Arvada WTP as more cost effective than significant repairs in the long-term. This line items provides budget for the steps needed to implement a new treatment plant after the completion of the siting study. The cost of construction is not reflected.
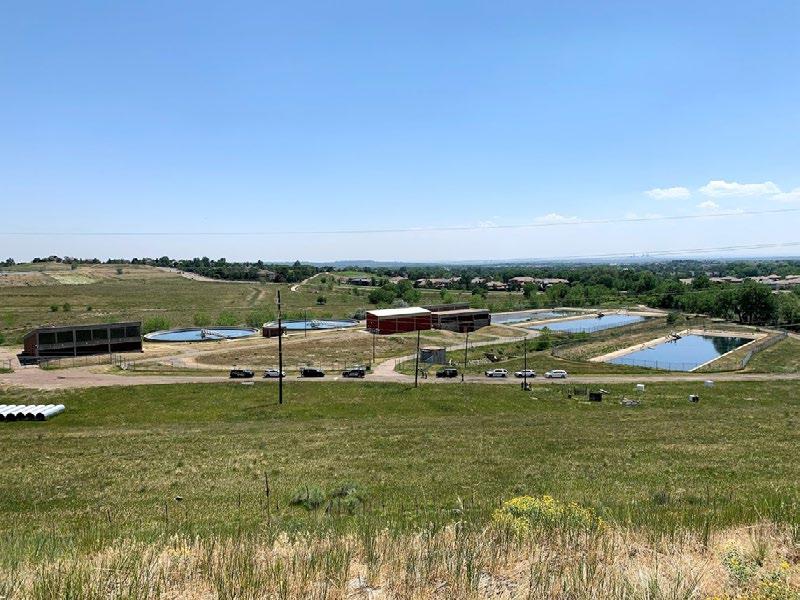
Project Justification
This project is needed to maintain existing treatment capacity and for additional water treatment capacity and is addressed in the 2019-2020 Water Treatment Master Plan.
Strategic Plan Alignment
Strategic Priority: Infrastructure
The community depends on a well-maintained foundation of streets, sidewalks, and water, wastewater and stormwater facilities. Planned and steady population growth requires proper maintenance of existing infrastructure and additional capacity to support a thriving community.
Project Funding
Strategic Principle:
Provides the community with a safe, reliable, high-quality water supply, drainage system, and wastewater disposal services for full city build-out, as defined by the Comprehensive Plan. This includes maintaining utility rates at lowest practical levels with accurate billing that supports replacement of aging infrastructure in order to maintain robust utility systems.
Funding is from the Water Fund water system development charges and bond issue.
Project Cost Estimate and Timeline
This project is fully funded. It is expected to be complete by 2028.
Operating Cost Impact
There is no operating cost impact for this project.
283
Uses Existing 2023-2032 Project Total Design $- $1,000,000 $1,000,000 Acquisition - -Construction - -Total Uses $- $1,000,000 $1,000,000
Timeline Start Completion Design 2023 2028 Acquisition 2023 2025 Construction 2027 2030 Sources Existing 2023 2024 2025 2026 2027 2028-2032 Project Total 98-101 $ $- $- $- $- $- $- $- $Other City $ - 1,000,000 - - - - -External $ - - - - - - -Total Sources $- $1,000,000 $- $- $- $- $- $1,000,000
Capital Improvement Projects
Future Unprioritized Projects
Capital projects need a long lead time for planning, environmental studies, and cost evaluation . As a result, the City maintains a list of potential future projects . While these projects may be pursued in time, they have not been prioritized and are not a part of the current capital improvement plan .
284
Project Anticipated Cost General Administration $50,000 Post Office Master Plan 50,000 Transportation $340,655,256 Alkire St - W 86th Pkwy to W 88th Ave 700,000 Bicycle / Pedestrian Overpass at Alkire St. and Union Pacific Railroad 4,628,000 Bike Master Plan 59,560,000 Eldridge Street - W 64th Ave to Ralston Creek 3,000,000 Guardrails 580,000 Indiana Street Widening -W . 64th Ave . to W . 86th Pkwy 42,126,190 Kendrick Dr . Extension - W . 64th Ave . to Indiana St . 11,000,000 Leyden Parkway Improvements 8,000,000 Missing Sidewalks 25,000,000 Oberon Road Improvements 12,000,000 Quaker St Improvements - W 72nd Ave to Leyden Road 13,100,000 Traffic Calming 550,000 Traffic Signals 6,711,066 W 52 Ave trail/sidewalk 2,500,000 W 72nd Ave Improvements - Indiana St to McIntyre St 6,000,000 W 72nd Ave Improvements - Simms St to Indiana St 33,000,000 W . 72nd Ave . Spot Widening 800,000 W . 80th Ave . Improvements - Kipling St . to Simms St . 13,100,000 W 80th Ave Improvements - Simms St to Alkire St 13,100,000 W . 80th Avenue UP Railroad Grade Separation 8,100,000 Ward Rd Extension - Double E Ranch Frontage 1,000,000 Ward Rd Extension - W 72nd Ave to W 86th Pkwy 4-lane section 36,600,000 Ward Road Extension - W 72nd Ave to W 80th Ave (Two Lane Section) 15,000,000 Ward Road Improvements - W . 64th Ave . to W . 72nd Ave . 24,500,000 Parks $119,634,000 Quaker Acres Park Expansion 450,000 Spring Mesa Open Space Acquisitions and Trail Extensions 800,000 Leyden Lake Open Space and Trails 3,340,000
Capital Improvement Projects
Future Unprioritized Projects (continued)
285
Indiana Equestrian Center Completion 785,000 Leyden Creek Trail 1,000,000 Pioneer Park 355,000 Lake Arbor Park 3,325,000 Kipling Street Entrance Signage 420,000 The Hills at Standley Lake Park Completion 725,000 Double E Park/ Ph2 325,000 Gibbs West Community Park 28,912,000 Churches Ranch National Historic District 1,710,000 Moore Brothers Farm and Agricultural Center 1,525,000 Hyatt Lake Park Preserve Acquisition 3,620,000 Majestic View Community Park and Nature Center 7,927,000 Arvada Blunn Reservoir 1,075,000 Welton Reservoir Trail 350,000 Median Renovation/Completion project 1,500,000 Trail Gaps 50,000,000 Lake Arbor Maintenance Building 890,000 Bunker Renovation 1,550,000 West Woods Bathroom 250,000 Stenger / Lutz Parking Lot Paving and ADA 4,000,000 Synthetic Turf Replacement Long Lake Regional Park and ADA Improvements 1,600,000 Implementation of 2011 Long Lake Regional Park Master Plan TBD Lighting Efficiency Updates (Lutz and Long Lake) 3,200,000 Golf $930,000 Cart Path Repair/Replacement 430,000 West Woods Silo Course Additions and Improvements 500,000 Total Unfunded Projects $461,269,256
Intentionally left blank
286 Capital Improvement Projects
LONG-TERM DEBT OBLIGATIONS
Payments on all of the City of Arvada’s long–term obligations are included in debt service . This includes revenue bonds and lease purchase agreements . Additionally, the City has a number of lease-purchase agreements for equipment, however, such payments are handled through operating budgets, because the amounts are small and do not adversely affect operating budgets.
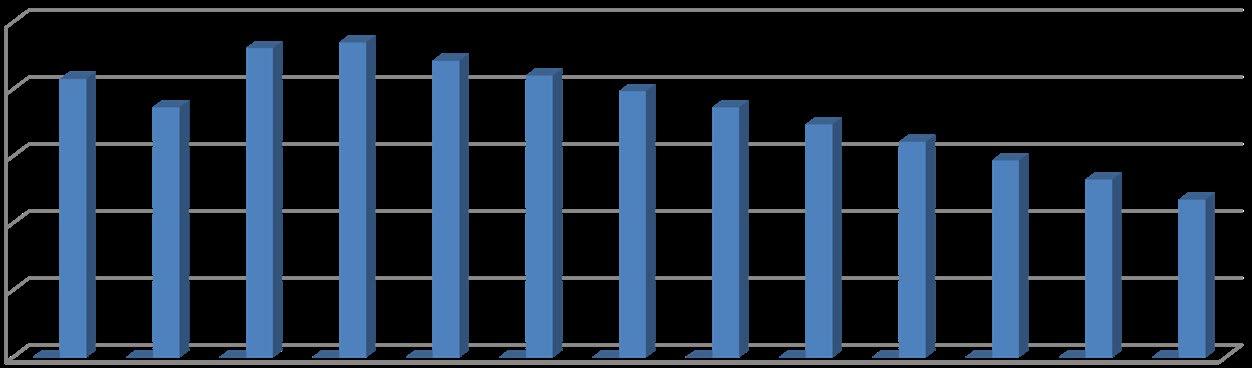
LEGAL DEBT LIMIT
General obligation debt is a direct obligation which pledges the full faith and credit of the government . The Colorado Revised Statutes provides that general obligation indebtedness for all purposes shall not at any time exceed 3 percent (3%) of actual value, as determined by the County Assessor, of the taxable property in the City As of December 31, 20202 the City has no general obligation debt outstanding and does not intend to issue any general obligation debt at this time . The City’s debt is within the legal debt limit as demonstrated by the table below:
TOTAL FINANCIAL OBLIGATIONS
In 2018, the City retired the 1998 Sales and Use Tax Bonds A ballot question for the reissuance of bonds was voted on and approved in November 2018 The City issued $70,825,000 of Sales and Use Tax Bonds in February 2019 for two transportation capital improvement projects The City issued $7,230,000 of Sales and Use Tax Bonds in February 2023 for two transportation capital improvement projects .
Certificates of Participation (COPs) are a lease-financing mechanism where the City enters into an agreement to make regular lease payments for the use of an asset over a period of time, after which the title of the assets transfers to the government Since the government can decide, at any time, to discontinue the lease, COPs do not constitute a multi-year fiscal obligation and can be issued without voter approval. While COPs are not technically debt, they are included in this graph to show the City’s total governmental financial obligations. Total debt in 2023 is $93,943,078 which decreases to $46,992,108 in 2032.
Total Outstanding Sales and Use Tax Bonds and Certificates of Participation
287
Service Obligations
Debt
Legal Debt Limit Actual Value $22,965,905,129 Debt Limit: 3 percent of Actual Value $688,977,154 Amount of General Obligation Debt $0
$0 $20,000,000 $40,000,000 $60,000,000 $80,000,000 $100,000,000 2020 2021 2022 2023 2024 2025 2026 2027 2028 2029 2030 2031 2032
Debt Service Obligations
In 2022, the City issued $48,150,000 in Water Revenue Bonds for several capital improvement projects identified in the Capital Improvements section. The City also issued $47,855,000 in Wastewater Revenue Bonds in 2022 for two sewer trunk line replacements. A portion of the 2015 Certificates of Participation were used to finance projects in the Stormwater Fund. The Stormwater Fund transfers two-thirds of the annual debt service payment of the 2015 Certificates of Participation to the COP Debt Service Fund. In addition, approximately half of the proceeds from the 2016 Certificates of Participation were used to fund the expansion of the West Woods Golf Clubhouse . The Golf Course Fund transfers approximately half of the debt service payment of the 2016 Certificates of Participation to the COP Debt Service Fund .
Total Outstanding Enterprise Bonds
BOND RATING
The City’s Sales and Use Tax Revenue Bond rating with Standard & Poor’s (S & P) Global Ratings is AAA, the very highest rating The rating was assigned in May 2023 when the City issued bonds to fund two transportation capital improvement projects. Key rating drivers from S & P Global rating report include:
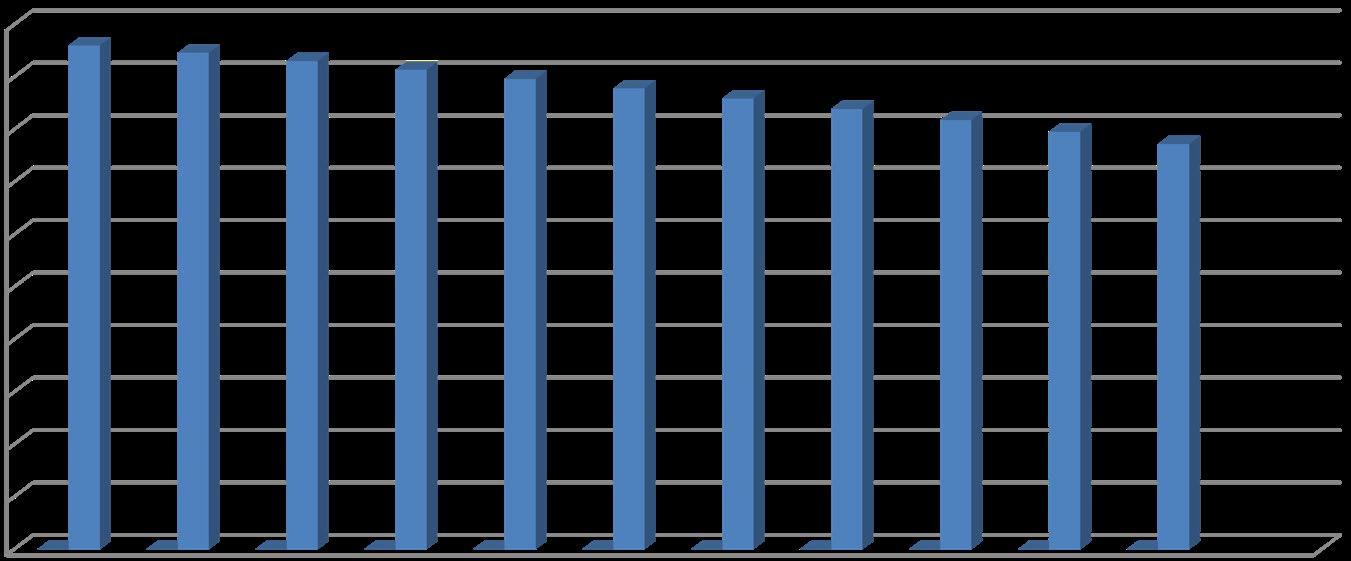
• A strong-to-very strong economic base with ongoing development, which benefits from the city’s access to participation in the Denver-Aurora-Lakewood MSA
• Our view that the sales tax have historically demonstrated low volatility nationwide and are additionally supported by a relatively strong taxing base
• Extraordinarily strong maximum annual debt service (MADS) coverage for the sales and use tax revenue bonds of 15 8x, with strong reliance on pledged revenues that we believe serves as a deterrent to dilute coverage
288
$0 $10,000,000 $20,000,000 $30,000,000 $40,000,000 $50,000,000 $60,000,000 $70,000,000 $80,000,000 $90,000,000 $100,000,000 2022 2023 2024 2025 2026 2027 2028 2029 2030 2031 2032
The S & P Global bond rating is a credit score that describes the general credit worthiness of a company, city or county that issues debt. S & P Global rates how likely debt will be repaid from the entity in question
The City’s Water Revenue Bond rating with Fitch Ratings is AA+; this rating was assigned in November, 2022 when the City issued bonds for several capital improvement projects . Key rating drivers from Fitch’s rating report include:
• The system is a monopolistic water-service provider to a growing customer base exhibiting very favorable economics . The City has the independent legal ability to increase rates without external approval. Rates are affordable for the vast majority of the population and should remain so even with projected increases to support large CIP
• Very low operating cost burden and sound capital investment
• Exceptionally low leverage to increase as the system enters a capital investment cycle The liquidity profile is sound and neutral to the assessment
The Fitch bond rating is a credit score that describes the general credit worthiness of a company, city or county that issues debt Fitch rates how likely debt will be repaid from the entity in question
The City’s Wastewater Revenue Bond rating with Fitch Ratings is AA; this rating was assigned in November, 2022 when the City issued bonds for several capital improvement projects . Key rating drivers from Fitch’s rating report include:
• Revenues are generated from monopolistic sources Service area characteristics are very strong with high income levels, midrange population growth and low unemployment rates. Rates are affordable for the vast majority of the population the system serves
• Very low operating cost burden and moderate life cycle needs
• Very strong financial profile with rising leverage. Coverage of full obligations and liquidity levels are robust and considered neutral to the assessment
The Fitch bond rating is a credit score that describes the general credit worthiness of a company, city or county that issues debt . Fitch rates how likely debt will be repaid from the entity in question .
289
Debt Service Obligations
Letter Grade
Debt Service Obligations
Capacity to Repay
AAA Highest credit quality – Exceptionally strong capacity for repayment
AA Very high credit quality - Very strong capacity for repayment
A High credit quality – Repayment capacity more vulnerable to adverse business conditions
BBB Good credit quality – Adverse business conditions more likely to impair repayment capacity
BB Speculative - Elevated vulnerability to credit risk
B Highly speculative – Material default risk is present
CCC Substantial credit risk - Default is a possibility
CC Very high levels of credit risk - Default of some kind appears probable
C Near default – A default or default like process has begun
D Default
The following table shows bond ratings from other cities in Colorado .
*Assumed issuer credit rating based off of one notch higher than COP rating
290
City Moody’s Fitch Standard & Poor’s Arvada - - AAA Aurora Aaa AA *AA+ Denver Aaa AAA AAA Fort Collins Aaa - AAA Golden - - *AAA Lakewood - - *AA+ Northglenn - - AA+ Thornton Aa1 - *AA Westminster - - *AA+
Debt Service Obligations
DEBT SERVICE REQUIREMENTS
Series 2019 Sales and Use Tax Revenue Bonds
The City issued Sales and Use Tax Bonds in the amount of $70,825,000 . The bonds were issued for the purpose of funding two capital improvement projects, widening an underpass at Union Pacific Railroad crossing on West 72nd Avenue between Kipling Street and Simms Street and improvements on Ralston Road between Yukon Street and Garrison Street . The bonds carry interest rates from 3% to 5% payable semi-annually June 1 and December 1 and principal due annually to December 31, 2038 .
Sales and Use Tax Revenue Bonds - Series 2019
291
Year Principal Interest Total Payment Principal Balance 60,585,000 2024 2,885,000 2,473,281 5,358,281 57,700,000 2025 3,030,000 2,329,031 5,359,031 54,670,000 2026 3,180,000 2,177,531 5,357,531 51,490,000 2027 3,340,000 2,018,531 5,358,531 48,150,000 2028 3,510,000 1,851,531 5,361,531 44,640,000 2029 3,685,000 1,676,031 5,361,031 40,955,000 2030 3,865,000 1,491,781 5,356,781 37,090,000 2031 4,060,000 1,298,531 5,358,531 33,030,000 2032 4,265,000 1,095,531 5,360,531 28,765,000 2033 4,435,000 924,931 5,359,931 24,330,000 2034 4,565,000 791,881 5,356,881 19,765,000 2035 4,710,000 649,225 5,359,225 15,055,000 2036 4,855,000 502,038 5,357,038 10,200,000 2037 5,015,000 344,250 5,359,250 5,185,000 2038 5,185,000 174,994 5,359,994 0 Totals $60,585,000 $19,799,098 $80,384,098
Debt Service Obligations
Series 2023 Sales and Use Tax Revenue Bonds
The City issued Sales and Use Tax Bonds in the amount of $7,230,000 The bonds were issued for the purpose of funding two capital improvement projects, widening an underpass at Union Pacific Railroad crossing on West 72nd Avenue between Kipling Street and Simms Street and improvements on Ralston Road between Yukon Street and Garrison Street . The bonds carry an interest rate of 5% payable semi-annually June 1 and December 1 and principal due annually to December 31, 2042 .
292
Year Principal Interest Total Payment Principal Balance 6,960,000 2024 95,000 348,000 443,000 6,865,000 2025 95,000 343,250 438,250 6,770,000 2026 105,000 338,500 443,500 6,665,000 2027 110,000 333,250 443,250 6,555,000 2028 110,000 327,750 437,750 6,445,000 2029 115,000 322,250 437,250 6,330,000 2030 125,000 316,500 441,500 6,205,000 2031 130,000 310,250 440,250 6,075,000 2032 135,000 303750 438,750 5,940,000 2033 140,000 297,000 437,000 5,800,000 2034 150,000 290,000 440,000 5,650,000 2035 155,000 282,500 437,500 5,495,000 2036 165,000 274,750 439,750 5,330,000 2037 175,000 266,500 441,500 5,155,000 2038 180,000 257,750 437,750 4,975,000 2039 1,155,000 248,750 1,403,750 3,820,000 2040 1,210,000 191,000 1,401,000 2,610,000 2041 1,275,000 130,500 1,405,500 1,335,000 2042 1,335,000 66,750 1,401,750 0 Totals $6,960,000 $5,249,000 $12,209,000
Sales and Use Tax Revenue Bonds - Series 2023
Series 2015A Certificates of Participation
The City issued certificates of participation in the amount of $7,880,000 to advance refund a portion of the Series 2005 Certificates of Participation, resulting in a deferred loss on the refunding of $444,000. The certificates of participation carry an interest rate of 1.78% payable semi-annually June 1 and December 1 and principal due annually to December 1, 2024
Series 2016 Certificates of Participation
The City issued certificates of participation in the amount of $11,180,000 for the purpose of funding two capital improvement projects, reconstruction and widening of West 72nd Avenue and Indiana Street and to expand the West Woods Golf Clubhouse. The certificates of participation carry an interest rate of 4% payable June 1 and December 1 and principal due annually to December 31, 2036
293
Debt Service Obligations
Certificates of Participation - Series 2015A Year Principal Interest Total Payment Principal Balance 1,270,000 2024 1,270,000 22,606 1,292,606 0 Totals $1,270,000 $22,606 $1,292,606
Certificates of Participation - Series 2016 Year Principal Interest Total Payment Principal Balance 8,275,000 2024 490,000 341,050 831,050 7,785,000 2025 515,000 316,550 831,550 7,270,000 2026 540,000 290,800 830,800 6,730,000 2027 560,000 269,200 829,200 6,170,000 2028 585,000 246,800 831,800 5,585,000 2029 605,000 223,400 828,400 4,980,000 2030 630,000 199,200 829,200 4,350,000 2031 655,000 174,000 829,000 3,695,000 2032 680,000 147,800 827,800 3,015,000 2033 710,000 120,600 830,600 2,305,000 2034 740,000 92,200 832,200 1,565,000 2035 765,000 62,660 827,660 800,000 2036 800,000 32,000 832,000 0 Totals $8,275,000 $2,516,260 $10,791,260
Debt Service Obligations
Series 2021 Certificates of Participation
The City and Jefferson County School District issued certificates of participation in the amount of $35,210,000 for the purpose of funding the replacement of the Meyers Pool complex with a 50 meter pool. The City and School District are each responsible for ½ of the Certificates of Participation, the City’s portion is $17,605,000. The certificates of participation carry an interest rate of 2.25%. Interest and principle payments are due June 15 and December 15 .
294
Certificates of Participation
Year Principal Interest Total Payment Principal Balance 16,853,078 2024 768,935 374,893 1,143,828 16,084,143 2025 786,333 357,495 1,143,828 15,297,810 2026 804,125 339,703 1,143,828 14,493,685 2027 822,320 321,508 1,143,828 13,671,365 2028 840,926 302,902 1,143,828 12,830,438 2029 859,953 283,875 1,143,828 11,970,485 2030 879,411 264,417 1,143,828 11,091,074 2031 899,309 244,519 1,143,828 10,191,765 2032 919,658 224,171 1,143,828 9,272,107 2033 940,466 203,362 1,143,828 8,331,641 2034 961,746 182,082 1,143,828 7,369,895 2035 983,507 160,321 1,143,828 6,386,388 2036 1,005,760 138,068 1,143,828 5,380,628 2037 1,028,517 115,311 1,143,828 4,352,111 2038 1,051,789 92,039 1,143,828 3,300,322 2039 1,075,587 68,241 1,143,828 2,224,735 2040 1,099,924 43,904 1,143,828 1,124,811 2041 1,124,812 32,000 1,156,812 0 Totals $16,853,078 $3,748,811 $20,601,890
- Series 2021
Debt Service Obligations
Series 2022 Water Revenue Bonds
The City issued water revenue bonds in the amount of $48,150,000 to fund capital improvement projects including replacement of lead service lines, residential water meters, Ralston Water Treatment Filter rehabilitation, Ralston Water Treatment Plant rehabilitation, replacement of water lines and construction costs for the Gross Reservoir Expansion project . The bonds carry interest rates from 4% to 5% payable semi-annually June 1 and December 1 and principal due annually to December, 2052 .
295
Year Principal Interest Total Payment Principal Balance 47,435,000 2024 790,000 2,084,550 2,874,550 46,645,000 2025 830,000 2,045,050 2,875,050 45,815,000 2026 875,000 2,003,550 2,878,550 44,940,000 2027 915,000 1,959,800 2,874,800 44,025,000 2028 960,000 1,914,050 2,874,050 43,065,000 2029 1,010,000 1,866,050 2,876,050 42,055,000 2030 1,060,000 1,815,550 2,875,550 40,995,000 2031 1,115,000 1,762,550 2,877,550 39,880,000 2032 1,170,000 1,706,800 2,876,800 38,710,000 2033 1,225,000 1,648,300 2,873,300 37,485,000 2034 1,290,000 1,587,050 2,877,050 36,195,000 2035 1,355,000 1,522,550 2,877,550 34,840,000 2036 1,420,000 1,454,800 2,874,800 33,420,000 2037 1,490,000 1,383,800 2,873,800 31,930,000 2038 1,565,000 1,309,300 2,874,300 30,365,000 2039 1,645,000 1,231,050 2,876,050 28,720,000 2040 1,725,000 1,148,800 2,873,800 26,995,000 2041 1,795,000 1,079,800 2,874,800 25,200,000 2042 1,870,000 1,008,000 2,878,000 23,330,000 2043 1,945,000 933,200 2,878,200 21,385,000 2044 2,020,000 855,400 2,875,400 19,365,000 2045 2,100,000 774,600 2,874,600 17,265,000 2046 2,185,000 690,600 2,875,600 15,080,000 2047 2,275,000 603,200 2,878,200 12,805,000 2048 2,365,000 512,200 2,877,200 10,440,000 2049 2,460,000 417,600 2,877,600 7,980,000 2050 2,555,000 319,200 2,874,200 5,425,000 2051 2,660,000 217,000 2,877,000 2,765,000 2052 2,765,000 110,600 2,875,600 0 Totals $47,435,000 $35,965,000 $83,400,000
Water Revenue Bonds - Series 2022
Debt Service Obligations
Series 2022 Wastewater Revenue Bonds
The City issued water revenue bonds in the amount of $47,855,000 to fund the replacement of two sewer trunk lines to provide for build out needs of the City The bonds carry interest rates from 4% to 5% payable semi-annually June 1 and December 1 and principal due annually to December, 2052
296
Year Principal Interest Total Payment Principal Balance 47,145,000 2024 785,000 2,108,956 2,893,956 46,360,000 2025 825,000 2,069,706 2,894,706 45,535,000 2026 865,000 2,028,456 2,893,456 44,670,000 2027 910,000 1,985,206 2,895,206 43,760,000 2028 955,000 1,939,706 2,894,706 42,805,000 2029 1,000,000 1,891,956 2,891,956 41,805,000 2030 1,050,000 1,841,956 2,891,956 40,755,000 2031 1,105,000 1,789,456 2,894,456 39,650,000 2032 1,160,000 1,734,206 2,894,206 38,490,000 2033 1,215,000 1,676,206 2,891,206 37,275,000 2034 1,280,000 1,615,456 2,895,456 35,995,000 2035 1,340,000 1,551,456 2,891,456 34,655,000 2036 1,410,000 1,484,456 2,894,456 33,245,000 2037 1,480,000 1,413,956 2,893,956 31,765,000 2038 1,555,000 1,339,956 2,894,956 30,210,000 2039 1,630,000 1,262,206 2,892,206 28,580,000 2040 1,715,000 1,180,706 2,895,706 26,865,000 2041 1,780,000 1,112,106 2,892,106 25,085,000 2042 1,855,000 1,040,906 2,895,906 23,230,000 2043 1,925,000 966,706 2,891,706 21,305,000 2044 2,005,000 889,706 2,894,706 19,300,000 2045 2,085,000 809,506 2,894,506 17,215,000 2046 2,170,000 726,106 2,896,106 15,045,000 2047 2,255,000 636,594 2,891,594 12,790,000 2048 2,350,000 543,575 2,893,575 10,440,000 2049 2,450,000 443,700 2,893,700 7,990,000 2050 2,555,000 339,575 2,894,575 5,435,000 2051 2,660,000 230,988 2,890,988 2,775,000 2052 2,775,000 117,938 2,892,938 0 Totals $47,145,000 $36,771,408 $83,916,408
Wastewater Revenue Bonds - Series 2022
Pay Plan Schedules
Pay Plan Schedule by Fund
297
Fund - Department 2021 Actual 2022 Actual 2023 Revised 2024 Budget 01 General Fund City Attorney's Office 15 00 17 00 17 00 18 00 City Manager's Office 20 10 21 00 22 00 24 00 Community and Economic Development 39 00 39 00 35 00 34 00 Finance 29 .75 29 .66 31 .00 31 .00 Human Resources 11 00 11 00 13 00 13 00 Innovation and Technology Management 26 00 28 00 30 00 32 00 Municipal Court 11 00 11 00 12 00 13 00 Parks, Golf, and Hospitality 3 .00 4 .00 1 .00 1 .00 Public Safety 161 00 170 00 170 00 170 50 Public Works 90 75 92 00 106 00 101 00 Utilities 0 00 3 00 4 00 1 00 Total 01 General Fund Positions 406 .60 425 .66 441 .00 438 .50 04 Streets 4 00 5 00 7 00 8 00 09 Community Development 3 42 4 50 4 50 3 50 10 Arvada Housing Authority 3 .58 3 .50 3 .50 3 .50 14 Parks 54 00 54 00 62 00 64 00 21 Police Tax Increment 21 40 50 38 50 41 50 45 00 22 Police Tax Increment 25 40 50 43 50 44 50 42 50 31 Capital Projects 0 .00 1 .00 1 .00 1 .00 34 2019 Bond Construction 0 75 0 00 0 00 0 00 41 Water 72 75 77 50 83 25 81 59 42 Wastewater 16 70 18 75 22 00 26 33 43 Golf Courses 21 90 23 34 23 00 23 00 44 Stormwater 6 .55 8 .95 7 .95 12 .28 45 Food Services 6 35 0 00 0 00 0 00 47 Solid Waste 2 00 2 20 2 20 2 20 51 Insurance 3 00 3 00 4 00 4 00 52 Computers 1 .00 1 .00 1 .00 1 .00 53 Print Shop 2 00 2 00 2 00 2 00 54 Vehicles 16 75 17 85 17 85 17 85 55 Buildings 1 00 1 00 1 00 1 00 Total Position FTE 703 .35 731 .25 769 .25 777 .25
Pay Plan Schedules
Budget Position Changes
298
Fund Type of Change Work System Department Position Notes 01 General Fund New Organizational and Service Effectiveness City Attorney's Office (+) Assistant City Attorney II New 01 General Fund New Organizational and Service Effectiveness City Attorney's Office (+) Legal Specialist New 01 General Fund New Safe Community Municipal Court (+) Deputy Court Administrator New 01 General Fund New Safe Community Public Safety (+) Police Records Specialist (2) New 14 Parks Golf & Hospitality New Vibrant Community and Neighborhoods Parks, Golf & Hospitality (+) Parks Worker II New 21 Tax Initiative Fund New Safe Community Public Safety (+) Behavioral Health Case Manager New 21 Tax Initiative Fund New Safe Community Public Safety (+) Police Officer (2) New 21 Tax Initiative Fund New Safe Community Public Safety (+) Police Services Technician (2) New 42 Wastewater Fund New Infrastructure Utilities (+) Utility Systems Technician-Associate Level New 44 Stormwater Fund New Infrastructure Public Works (+) Stormwater Inspector New 44 Stormwater Fund New Infrastructure Utilities (+) Utility Systems Technician-Associate Level New 01 General Fund Title Infrastructure Public Works (+) Administrative Specialist (-) Administrative Coordinator 01 General Fund Title Infrastructure Public Works (+) Assistant Manager of City Facilities (-) Assistant Building Manager 01 General Fund Title Infrastructure Public Works (+) Engineering Manager (-) Manager of Development Engineering 01 General Fund Title Infrastructure Public Works (+) Engineering Manager (-) Senior Civil Engineer 01 General Fund Title Infrastructure Public Works (+) Engineering Manager (-) Traffic Engineering Manager 01 General Fund Title Infrastructure Public Works (+) Survey Crew Chief (-) Survey Party Chief 01 General Fund Title Organizational and Service Effectiveness City Managers Office (+) Director of Communications and Engagement (-) Chief Communications Manager
Pay Plan Schedules
299
Fund Type of Change Work System Department Position Notes 01 General Fund Title Organizational and Service Effectiveness City Managers Office (+) Emergency Management Coordinator (-) Community Resilience Coordinator 01 General Fund Title Organizational and Service Effectiveness Human Resources (+) Learning and Development Coordinator (-) Senior HR Coordinator 01 General Fund Title Organizational and Service Effectiveness Information Technology (+) Data Engineer (-) Senior SQL Data Analyst/ Developer 01 General Fund Title Organizational and Service Effectiveness Information Technology (+) Mobile Systems Administrator (2) (-) Mobile Network Systems Administrator (2) 01 General Fund Title Organizational and Service Effectiveness Information Technology (+) Senior Systems Administrator (-) Senior Network Systems Administrator 01 General Fund Title Organizational and Service Effectiveness Information Technology (+) Systems Administrator (-) Network Systems Administrator 01 General Fund Title Safe Community Judicial (+) Administrative Court Clerk (-) One Small Step Court Administrator 01 General Fund Title Safe Community Public Safety (+) Police Evidence Supervisor (-) Evidence Supervisor 21 Tax Initiative Fund Title Safe Community Public Safety (+) Police Operations Supervisor (-) Police Civilian Operations Supervisor 21 Tax Initiative Fund Title Safe Community Public Safety (+) Police Records Supervisor (-) Police Civilian Operations Supervisor 22 Tax Initiative Fund Title Safe Community Public Safety (+) Police Operations Manager (-) Police Civilian Operations Manager 44 Stormwater Fund Title Infrastructure Public Works (+) Engineering Manager (-) Transportation Design Manager 51 Insurance Fund Title Organizational and Service Effectiveness City Attorneys Office (+) Risk and Claims Analyst (-) Risk and Claims Specialist 01 General Fund ReClass Community and Economic Development Community and Economic Development (+) Housing Development Specialist (-) Housing Development and Navigation Supervisor 01 General Fund ReClass Organizational and Service Effectiveness City Managers Office (+) Homeless Project Manager (-) Police Officer
(continued)
Budget Position Changes
Pay Plan Schedules
300
Fund Type of Change Work System Department Position Notes 01 General Fund ReClass Organizational and Service Effectiveness Information Technology (+) GIS Application Systems Administrator (-) Senior GIS Analyst 01 General Fund ReClass Organizational and Service Effectiveness Information Technology (+) Mobile Device Specialist (-) Web Systems Administrator 01 General Fund ReClass Organizational and Service Effectiveness Information Technology (+) Senior Mobile Systems Administrator (2) (-) Mobile Systems Administrator (2) 01 General Fund ReClass Safe Community Public Safety (+) Civilian Accident Investigator (4) (-) Police Officer (4) 01 General Fund ReClass Safe Community Public Safety (+) Lead Animal Management Officer (-) Animal Management Officer 01 General Fund ReClass Safe Community Public Safety (+) Lead Code Compliance Officer (-) Code Compliance Officer 01 General Fund ReClass Safe Community Public Safety (+) Lead Police Services Technician (-) CSI Technician 01 General Fund ReClass Safe Community Public Safety (+) Master Police Officer (3) (-) Police Officer (3) 01 General Fund ReClass Safe Community Public Safety (+) Neighborhood Services Supervisor (-) Police Officer 01 General Fund ReClass Safe Community Public Safety (+) Police Lieutenant (-) Police Commander 01 General Fund ReClass Safe Community Public Safety (+) Public Information Officer (-) Crime Analyst 04 Street Fund ReClass Infrastructure Public Works (+) Municipal Inspector Foreman (-) Municipal Inspector Ii 21 Tax Initiative Fund ReClass Safe Community Public Safety (+) Evidence Technician (-) Police Services Technician 41 Water Fund ReClass Organizational and Service Effectiveness Information Technology (+) Application Systems Administrator (2) (-) Utility Systems Analyst (2) 41 Water Fund ReClass Organizational and Service Effectiveness Information Technology (+) GIS Manager (-) Operations Support Supervisor 54 Vehicles Fund ReClass Organizational and Service Effectiveness Information Technology (+) Specialty Applications Manager (-) Utility Systems Analyst Supervisor 09 Community Development Eliminated Community and Economic Development Community and Economic Development (-) Housing Rehabilitation / Loan Specialist Position's duties have been absorbed by the other positions within the department Budget Position Changes (continued)
Pay Plan Schedules
Pay Plan Schedule by Department
301
CITY ATTORNEY 2021 Actual 2022 Actual 2023 Actual 2024 Budget Assistant City Attorney 2 .00 3 .00 0 .00 0 .00 Assistant City Attorney I 0 00 0 00 2 00 2 00 Assistant City Attorney II 0 00 0 00 4 00 5 00 City Attorney 1 00 1 00 1 00 1 00 Deputy City Attorney 2 .00 2 .00 2 .00 2 .00 Law Office Administrator 1 .00 1 .00 1 .00 1 .00 Legal Specialist 3 00 4 00 4 00 4 00 Litigation Paralegal 1 00 1 00 1 00 1 00 Senior Assistant City Attorney 5 .00 5 .00 2 .00 2 .00 Total General Fund Positions 15.00 17.00 17.00 18.00 Risk and Claims Analyst 0 .00 0 .00 1 .00 2 .00 Risk and Claims Specialist 0 00 0 00 1 00 0 00 Risk and Safety Manager 0 00 0 00 1 00 1 00 Safety Specialist 0 00 0 00 1 00 1 00 Total Insurance Fund Positions 0.00 0.00 4.00 4.00 Total City Attorney Positions 15.00 17.00 21.00 22.00 CITY MANAGER’S OFFICE 2021 Actual 2022 Actual 2023 Actual 2024 Budget Administrative Analyst 1 .00 1 .00 0 .00 0 .00 Administrative Coordinator 1 .00 1 .00 1 .00 1 .00 Administrative Specialist 3 50 3 00 3 00 3 00 Administrative Supervisor 0 00 0 00 1 00 1 00 Assistant to the City Manager 1 .00 1 .00 1 .00 1 .00 Chief Communications Manager 1 .00 1 .00 1 .00 0 .00 City Clerk 1 00 1 00 1 00 1 00 City Manager 1 00 1 00 1 00 1 00 Communications Coordinator 0 60 1 00 1 00 1 00 Community Engagement Coordinator 1 .00 1 .00 0 .00 0 .00 Community Resilience Coordinator 1 .00 1 .00 1 .00 0 .00 Deputy City Clerk 1 00 1 00 1 00 1 00 Deputy City Manager 1 00 2 00 2 00 2 00 Digital Content Producer 1 .00 1 .00 2 .00 2 .00 Director of Communications and Engagement 0 .00 0 .00 0 .00 1 .00 Engagement Coordinator 0 00 0 00 1 00 1 00
Pay Plan Schedules
302
CITY MANAGER’S OFFICE (continued) 2021 Actual 2022 Actual 2023 Actual 2024 Budget Executive Assistant 1 00 1 00 0 00 0 00 Homeless Project Manager 0 00 0 00 0 00 1 00 Innovation and Performance Manager 1 .00 1 .00 0 .00 0 .00 Manager of Communications and Marketing 0 00 0 00 0 00 1 00 Manager of Communications-Infrastructure 0 00 0 00 0 00 1 00 Media Services Manager 1 00 1 00 1 00 1 00 Multi Media Technician 1 .00 1 .00 0 .00 0 .00 Neighborhood Engagement Coordinator 0 .00 0 .00 1 .00 1 .00 Records Management Coordinator 1 00 1 00 1 00 1 00 Senior Sustainability Coordinator 0 00 0 00 1 00 1 00 Strategic Planning and Performance Manager 0 00 0 00 1 00 1 00 Total General Fund Positions 20.10 21.00 22.00 24.00 Creative Services Designer 1 00 1 00 1 00 1 00 Printing Technician 1 00 1 00 1 00 1 00 Total Print Shop Fund Positions 2.00 2.00 2.00 2.00 Total City Manager's Office Positions 22.10 23.00 24.00 26.00 COMMUNITY AND ECONOMIC DEVELOPMENT 2021 Actual 2022 Actual 2023 Actual 2024 Budget Administrative Coordinator 2 00 2 00 0 00 0 00 Administrative Specialist 4 00 4 00 0 00 0 00 Assistant Building Official 2 00 2 00 2 00 2 00 Chief Building Official 0 .00 0 .00 1 .00 1 .00 Civil Engineer I 2 00 0 00 0 00 0 00 Civil Engineer II 0 00 2 00 0 00 0 00 Civil Engineer III 1 00 1 00 0 00 0 00 Combination Inspector I 1 .00 2 .00 2 .00 2 .00 Combination Inspector II 3 .00 3 .00 3 .00 3 .00 Combination Inspector III 3 00 2 00 2 00 2 00 Development Technician I 0 00 0 00 2 00 3 00 Development Technician II 0 .00 0 .00 2 .00 1 .00 Deputy Director of Community and Economic Development 1 .00 1 .00 0 .00 0 .00 Director of Community and Economic Development 1 00 1 00 1 00 1 00
Plan
by Department (continued)
Pay
Schedule
Pay Plan Schedules
Pay Plan Schedule by Department (continued)
303
COMMUNITY AND ECONOMIC DEVELOPMENT (continued) 2021 Actual 2022 Actual 2023 Actual 2024 Budget Economic Development Manager 1 00 1 00 1 00 1 00 Economic Development Specialist 1 00 1 00 1 00 0 00 Engineering Permit Coordinator 1 .00 1 .00 0 .00 0 .00 Homeless Navigator 0 00 0 00 1 00 1 00 Housing Development and Navigation Supervisor 0 00 0 00 1 00 0 00 Housing Development Specialist 0 00 0 00 0 00 1 00 Land Development Technician 1 .00 1 .00 0 .00 0 .00 Manager of City Planning and Development 1 .00 1 .00 1 .00 1 .00 Manager of Communication and Marketing 1 00 1 00 1 00 0 00 Manager of Development Engineering 1 00 1 00 0 00 0 00 Manager of Housing Preservation and Resources 0 00 0 00 1 00 1 00 Planner I 1 .00 1 .00 2 .00 2 .00 Planner II 2 00 2 00 2 00 2 00 Planning Technician 1 00 1 00 0 00 0 00 Plans Examiner I 1 00 1 00 1 00 1 00 Plans Examiner II 1 .00 1 .00 1 .00 1 .00 Senior Economic Development Specialist 0 .00 0 .00 1 .00 2 .00 Senior Planner 5 00 5 00 5 00 5 00 Systems and Administrative Manager 1 00 1 00 1 00 1 00 Total General Fund Positions 39.00 39.00 35.00 34.00 Administrative Specialist 0 .00 0 .00 0 .50 0 .50 Community Development Block Grant Coordinator 0 .00 0 .00 1 .00 1 .00 Homeless Navigator 0 00 0 00 1 00 1 00 Housing Navigator 0 00 0 00 1 00 1 00 Housing Rehabilitation / Loan Specialist 0 00 0 00 1 00 0 00 Total Community Development Fund Positions 0.00 0.00 4.50 3.50 Administrative Specialist 0 00 0 00 0 50 0 50 Housing Choice Voucher Program Supervisor 0 00 0 00 1 00 1 00 Housing Specialist 0 .00 0 .00 2 .00 2 .00 Total Arvada Housing Authority Positions 0.00 0.00 3.50 3.50 Total Community and Economic Development Positions 39.00 39.00 43.00 41.00
Pay Plan Schedules
Pay Plan Schedule by Department (continued)
304
FINANCE 2021 Actual 2022 Actual 2023 Actual 2024 Budget Accountant 1 00 1 00 2 00 1 00 Accounting Specialist 1 00 1 00 1 00 1 00 Accounting Supervisor 3 .00 3 .00 2 .00 2 .00 Accounting Technician II 1 .00 1 .00 1 .00 1 .00 Accounts Payable Technician 2 00 2 00 2 00 2 00 Accounts Receivable Technician 1 00 1 00 1 00 1 00 Assistant Finance Director 1 00 1 00 0 00 0 00 Budget Analyst 2 .00 2 .00 3 .00 2 .00 Business Analyst 0 .75 0 .66 0 .00 0 .00 Compliance Agent 0 00 0 00 1 00 1 00 Controller 1 00 1 00 1 00 1 00 Deputy Director of Finance 0 .00 0 .00 1 .00 1 .00 Director of Finance 1 .00 1 .00 1 .00 1 .00 Executive Assistant 1 00 1 00 0 00 0 00 Finanace Program Coordinator 0 00 0 00 1 00 1 00 Financial Systems Analyst 1 00 1 00 1 00 1 00 Grants Accountant 1 .00 1 .00 1 .00 1 .00 Grants Administrator 1 00 1 00 1 00 1 00 Payroll Administrator 1 00 1 00 0 00 0 00 Payroll Specialist 0 00 0 00 1 00 1 00 Payroll Supervisor 0 .00 0 .00 1 .00 1 .00 Procurement Specialist 2 .00 1 .00 1 .00 1 .00 Purchasing Manager 1 00 1 00 1 00 1 00 Revenue Manager 1 00 1 00 1 00 1 00 Revenue Technician 2 00 2 00 1 00 1 00 Sales Tax Auditor 2 .00 2 .00 2 .00 2 .00 Sales Tax Auditor Supervisor 1 00 1 00 1 00 1 00 Senior Accountant 0 00 0 00 0 00 1 00 Senior Budget Analyst 0 00 0 00 0 00 1 00 Senior Procurement Specialist 0 .00 1 .00 1 .00 1 .00 Storeskeeper 1 .00 1 .00 1 .00 1 .00 Total General Fund Positions 29.75 29.66 31.00 31.00
Pay Plan Schedules
Pay Plan Schedule by Department (continued)
305
FINANCE (continued) 2021 Actual 2022 Actual 2023 Actual 2024 Budget Business Analyst 0 .25 0 .34 0 .00 0 .00 Total Golf Course Fund Position 0.25 0.34 0.00 0.00 Claims Specialist 0 .00 1 .00 0 .00 0 .00 Property and Casualty Claims Manager 1 .00 0 .00 0 .00 0 .00 Risk and Claims Analyst 1 00 1 00 0 00 0 00 Risk and Safety Manager 1 00 1 00 0 00 0 00 Total Insurance Fund Positions 3.00 3.00 0.00 0.00 Total Finance Department Positions 33.00 33.00 31.00 31.00 HUMAN RESOURCES 2021 Actual 2022 Actual 2023 Actual 2024 Budget Administrative Coordinator 1 00 1 00 0 00 0 00 Benefits Specialist 1 00 1 00 1 00 1 00 Compensation Analyst 1 00 1 00 0 00 0 00 Deputy Director of Human Resources 1 .00 1 .00 0 .00 0 .00 Director of Human Resources 1 .00 1 .00 1 .00 1 .00 Employment Specialist 0 00 0 00 1 00 1 00 Executive Assistant 0 00 0 00 1 00 1 00 HR Business Partner 1 .00 1 .00 0 .00 0 .00 HR Business Partner Manager 0 .00 1 .00 0 .00 0 .00 HR Coordinator 1 00 1 00 2 00 0 00 HR Manager 0 00 0 00 2 00 2 00 HR Technician 0 00 0 00 1 00 1 00 Learning and Development Coordinator 0 .00 0 .00 0 .00 1 .00 Organizational Development Manager 1 .00 1 .00 0 .00 0 .00 Recruiting and Onboarding Manager 1 00 1 00 0 00 0 00 Senior Compensation Analyst 0 00 0 00 1 00 1 00 Senior HR Business Partner 1 .00 0 .00 1 .00 1 .00 Senior HR Coordinator 1 .00 1 .00 1 .00 2 .00 Senior Organizational Development Manager 0 00 0 00 1 00 1 00 Total Human Resources Positions 11.00 11.00 13.00 13.00
Pay Plan Schedules
Pay Plan Schedule by Department (continued)
306
INNOVATION AND TECHNOLOGY MANAGEMENT 2021 Actual 2022 Actual 2023 Actual 2024 Budget Administrative Specialist 1 00 1 00 1 00 1 00 Application System Administrator 2 00 3 00 2 00 3 00 Associate Data Scientist 0 .00 0 .00 1 .00 1 .00 Associate Technical Support Analyst 0 .00 1 .00 1 .00 1 .00 Chief Information Officer 1 00 1 00 1 00 1 00 Chief Information Security Officer 0 00 0 00 1 00 1 00 Cloud Systems Administrator 0 00 1 00 1 00 1 00 Community Connectivity Manager 1 .00 0 .00 0 .00 0 .00 Data Engineer 0 00 0 00 0 00 1 00 GIS Analyst 0 00 0 00 0 00 1 00 GIS Applications System Administrator 0 00 0 00 0 00 1 00 IT Business Analyst 1 .00 1 .00 1 .00 1 .00 IT Infrastructure Architect 0 .00 1 .00 1 .00 1 .00 IT Security Specialist 1 00 0 00 0 00 0 00 Mobile Device Specialist 0 00 0 00 0 00 1 00 Mobile Network Systems Administrator 2 00 2 00 2 00 0 00 Network Systems Administrator 1 .00 1 .00 1 .00 0 .00 Security Operations Analyst 0 00 2 00 2 00 2 00 Senior Applications Systems Administrator 1 00 0 00 1 00 0 00 Senior Database Administrator 1 00 1 00 1 00 1 00 Senior IT Project Manager 1 .00 2 .00 2 .00 2 .00 Senior Mobile Systems Administrator 0 .00 0 .00 0 .00 1 .00 Senior Network Engineer 2 00 1 00 1 00 1 00 Senior Network Systems Administrator 1 00 1 00 1 00 0 00 Senior SQL Data Analyst/Developer 0 .00 1 .00 1 .00 0 .00 Senior Systems Administrator 0 .00 0 .00 0 .00 1 .00 Service Desk Manager 1 00 1 00 1 00 1 00 Services Technician 1 00 0 00 0 00 0 00 Software Developer 1 00 1 00 1 00 1 00 Systems Administrator 0 .00 0 .00 0 .00 1 .00 Technical Support Analyst 2 .00 2 .00 2 .00 2 .00 Technical Systems Project Manager 1 00 0 00 0 00 0 00 Technology and Project Services Manager 1 00 1 00 1 00 1 00 Technology Infrastructure and Operations Manager 1 .00 1 .00 1 .00 1 .00
Pay Plan Schedules
Pay Plan Schedule by Department (continued)
307
INNOVATION AND TECHNOLOGY MANAGEMENT (continued) 2021 Actual 2022 Actual 2023 Actual 2024 Budget Web Architect 1 .00 1 .00 0 .00 0 .00 Web Systems Administrator 1 00 1 00 2 00 2 00 Total General Fund Positions 26.00 28.00 30.00 32.00 Applications Systems Administrator 1 00 1 00 1 00 1 00 Radio Communications Administrator 1 00 1 00 1 00 1 00 Total Tax Initiative 22 Fund Positions 2.00 2.00 2.00 2.00 Analytics and Business Intelligence Developer 0 00 0 00 1 00 1 00 Applications Systems Administrator 0 00 0 00 0 00 2 00 Data and Analytics Manager 0 00 0 00 1 00 1 00 GIS Analyst 0 .00 0 .00 0 .00 2 .00 GIS Manager 0 00 0 00 0 00 1 00 Senior GIS Analyst 0 00 0 00 0 00 1 00 Total Water Fund Positions 0.00 0.00 2.00 8.00 GIS Analyst 0 00 0 00 0 00 1 00 Specialty Application Manager 0 00 0 00 0 00 1 00 Total Wastewater Fund Positions 0.00 0.00 0.00 2.00 Senior Technical Support Analyst 0 00 1 00 1 00 1 00 Technical Support Analyst 1 00 0 00 0 00 0 00 Total Computer Fund Positions 1.00 1.00 1.00 1.00 Total Innovation and Technology Positions 29.00 31.00 35.00 45.00 MUNICIPAL COURT 2021 Actual 2022 Actual 2023 Actual 2024 Budget Administrative Court Clerk 7 00 0 00 6 00 7 00 Court Administrator 1 00 1 00 1 00 1 00 Deputy Court Administrator 1 00 1 00 1 00 2 00 Judicial Specialist 0 .00 7 .00 0 .00 0 .00
Pay Plan Schedules
Pay Plan Schedule by Department (continued)
308
MUNICIPAL COURT (continued) 2021 Actual 2022 Actual 2023 Actual 2024 Budget Municipal Judge 1 00 1 00 1 00 1 00 One Small Step Court Administrator 0 00 0 00 1 00 0 00 Senior Probation Officer 1 .00 1 .00 2 .00 2 .00 Total Municipal Court Positions 11.00 11.00 12.00 13.00 PARKS, GOLF AND HOSPITALITY 2021 Actual 2022 Actual 2023 Actual 2024 Budget Deputy Director of Vibrant Community and Neighborhoods 1 .00 1 .00 1 .00 0 .00 Homeless Navigator 0 .00 1 .00 0 .00 0 .00 Manager of Housing Preservation and Resources 1 00 1 00 0 00 0 00 Neighborhood Engagement Coordinator 1 00 1 00 0 00 0 00 Senior Sustainability Coordinator 0 00 0 00 0 00 1 00 Total General Fund Positions 3.00 4.00 1.00 1.00 Administrative Specialist 0 50 0 50 0 00 0 00 Homeless Navigator 1 .00 1 .00 0 .00 0 .00 Housing Navigator 0 .00 1 .00 0 .00 0 .00 Housing Rehabilitation / Loan Specialist 1 00 1 00 0 00 0 00 Housing Services Specialist 0 92 1 00 0 00 0 00 Total Community Development Fund Positions 3.42 4.50 0.00 0.00 Administrative Specialist 0 50 0 50 0 00 0 00 Housing Choice Voucher Program Supervisor 1 00 1 00 0 00 0 00 Housing Services Specialist 0 .08 0 .00 0 .00 0 .00 Housing Specialist 2 .00 2 .00 0 .00 0 .00 Total Arvada Housing Authority Positions 3.58 3.50 0.00 0.00 Administrative Coordinator 1 .00 1 .00 1 .00 1 .00 City Forester 1 00 1 00 1 00 1 00 Computerized Irrigation Supervisor 1 00 1 00 1 00 1 00 Computerized Irrigation System Administrator 1 00 1 00 1 00 1 00 Deputy Director of Vibrant Community and Neighborhoods 0 .00 0 .00 0 .00 1 .00 Director of Vibrant Community and Neighborhoods 1 .00 1 .00 1 .00 1 .00
Pay Plan Schedules
Pay Plan Schedule by Department (continued)
309
PARKS, GOLF AND HOSPITALITY (continued) 2021 Actual 2022 Actual 2023 Actual 2024 Budget Executive Assistant 1 00 1 00 0 00 0 00 Forestry Technician 3 .00 3 .00 3 .00 3 .00 Irrigation Crew Supervisor 1 00 1 00 1 00 1 00 Irrigation Maintenance Leadworker 1 00 1 00 1 00 1 00 Irrigation Maintenance Worker 4 00 4 00 0 00 0 00 Manager of Communications VCN 0 .00 0 .00 1 .00 1 .00 Municipal Services Worker 1 .00 1 .00 1 .00 1 .00 Nature Center Director 1 00 1 00 1 00 1 00 Parks and Urban Design Manager 1 00 1 00 1 00 1 00 Parks Field Programmer 0 .00 0 .00 1 .00 1 .00 Parks Maintenance Leadworker 6 .00 6 .00 7 .00 7 .00 Parks Manager 1 00 1 00 1 00 1 00 Parks Program Manager 1 00 1 00 1 00 1 00 Parks Supervisor 5 00 5 00 6 00 6 00 Parks Worker II 19 .00 19 .00 29 .00 26 .00 Parks Worker III 0 00 0 00 0 00 4 00 Senior Landscape Architect 2 00 2 00 2 00 2 00 Special Events Coordinator 1 00 1 00 1 00 1 00 Total Parks Fund Positions 53.00 53.00 62.00 64.00 Assistant Nature Center Director 0 75 0 75 0 75 0 75 Total Water Fund Positions 0.75 0.75 0.75 0.75 Assistant Nature Center Director 0 25 0 25 0 25 0 25 Total Stormwater Fund Positions 0.25 0.25 0.25 0.25 Assistant Golf Manager 1 00 1 00 1 00 1 00 Assistant Golf Professional 2 00 2 00 2 00 2 00 Assistant Restaurant Manager 1 .00 1 .00 0 .00 0 .00 Business Development Coordinator 0 .30 0 .00 0 .00 0 .00 Business Development Manager 0 15 0 00 0 00 0 00 Executive Chef 0 45 0 00 0 00 0 00 Food and Beverage Manager 0 00 1 00 1 00 1 00 Golf Course Computerized Irrigation Technician 2 .00 2 .00 2 .00 2 .00
Pay Plan Schedules
310
PARKS, GOLF AND HOSPITALITY (continued) 2021 Actual 2022 Actual 2023 Actual 2024 Budget Golf Course Equipment Specialist 2 00 2 00 2 00 2 00 Golf Course Maintenance Worker 3 .00 3 .00 3 .00 3 .00 Golf Course Manager 1 .00 1 .00 1 .00 1 .00 Golf Course Superintendent 2 00 2 00 2 00 2 00 Head Golf Professional 2 00 2 00 2 00 2 00 Manager of Golf Course Operations 1 00 1 00 1 00 1 00 Restaurant Manager 3 .00 3 .00 4 .00 4 .00 Sales Coordinator 0 00 1 00 1 00 1 00 Sous Chef / Kitchen Manager 1 00 1 00 1 00 1 00 Total Golf Course Fund Positions 21.90 23.00 23.00 23.00 Assistant Banquet Manager 1 00 0 00 0 00 0 00 Business Development Coordinator 1 70 0 00 0 00 0 00 Business Development Manager 0 85 0 00 0 00 0 00 Executive Chef 0 .55 0 .00 0 .00 0 .00 Food Services Manager 1 00 0 00 0 00 0 00 Hospitality Services Supervisor 1 00 0 00 0 00 0 00 Total Food Service Fund Positions 6.10 0.00 0.00 0.00 Total Parks, Golf and Hospitality Positions 92.00 89.00 87.00 89.00 PUBLIC SAFETY 2021 Actual 2022 Actual 2023 Actual 2024 Budget Administrative Coordinator 1 .00 1 .00 1 .00 1 .00 Animal Management Officer 4 .00 4 .00 4 .00 3 .00 Chief of Police 1 00 1 00 1 00 1 00 Civilian Accident Investigator 0 00 0 00 0 00 4 00 Code Compliance Officer 4 .00 4 .00 4 .00 3 .00 Crime Analyst 1 .00 2 .00 2 .00 1 .00 Criminalist 1 00 1 00 1 00 1 00 CSI Technician 1 00 1 00 1 00 0 00 Deputy Police Chief 2 00 2 00 2 00 2 00 Evidence Supervisor 1 .00 1 .00 1 .00 0 .00 Evidence Technician 2 00 2 00 2 00 2 00 Executive Assistant 1 00 1 00 1 00 1 00
Pay Plan Schedule by Department (continued)
Pay Plan Schedules
Pay Plan Schedule by Department (continued)
311
PUBLIC SAFETY (continued) 2021 Actual 2022 Actual 2023 Actual 2024 Budget Lead Animal Management Officer 0 00 0 00 0 00 1 00 Lead Code Compliance Officer 0 00 0 00 0 00 1 00 Lead Crime Analyst 0 00 1 00 1 00 1 00 Lead Police Services Technician 0 .00 0 .00 0 .00 1 .00 Liquor Licensing Control Administrator 1 00 1 00 1 00 1 00 Master Police Officer 7 00 9 00 9 00 14 00 Neighborhood Services Supervisor 0 00 0 00 0 00 1 00 Patrol Investigative Specialist 1 .00 1 .00 1 .00 1 .00 Police Accreditation Coordinator 1 .00 1 .00 0 .00 0 .00 Police Accreditation Analyst 0 00 0 00 1 00 1 00 Police Administrative Assistant 1 00 0 00 0 00 0 00 Police Commander 4 00 5 00 5 00 4 00 Police Digital Media Technician 0 .00 2 .00 2 .00 2 .00 Police Digital Records Technician 0 00 0 00 2 00 2 00 Police Equipment Coordinator 0 00 1 00 1 00 1 00 Police Evidence Supervisor 0 00 0 00 0 00 1 00 Police Lieutenant 6 .00 4 .00 4 .00 5 .00 Police Officer 94 .00 92 .00 92 .00 82 .00 Police Records Specialist 6 00 10 00 8 00 8 00 Police Recruiter 1 00 1 00 1 00 1 00 Police Sergeant 16 .00 17 .00 17 .00 18 .00 Police Services Technician 3 .00 4 .00 4 .00 3 .50 Police Training Coordinator 1 00 1 00 1 00 1 00 Public Information Officer 0 00 0 00 0 00 1 00 Total General Fund Positions 161.00 170.00 170.00 170.50 Animal Management Officer 1 00 1 00 1 00 1 00 Behvioral Health Case Manager 1 00 Behvioral Health Clinician I 0 .00 0 .00 1 .00 2 .00 Behvioral Health Clinician II 0 .00 0 .00 1 .00 0 .00 Code Compliance Officer 1 00 1 00 1 00 1 00 Crime Analyst 1 00 1 00 1 00 1 00 Evidence Technician 1 00 1 00 1 00 1 00 Financial Business Analyst 1 .00 1 .00 1 .00 1 .00 Lead Police Records Specialist 0 00 0 00 1 00 1 00 Master Police Officer 1 00 1 00 1 00 1 00
Pay Plan Schedules
Pay Plan Schedule by Department (continued)
312
PUBLIC SAFETY (continued) 2021 Actual 2022 Actual 2023 Actual 2024 Budget NIBRS Data Specialist 1 .00 1 .00 1 .00 1 .00 Police Civilian Operations Manager 0 .00 2 .00 2 .00 0 .00 Police Commander 2 00 2 00 2 00 2 00 Police Lieutenant 0 00 1 00 1 00 1 00 Police Officer 22 00 20 00 20 00 22 00 Police Operations Supervisor 0 .00 0 .00 0 .00 1 .00 Police Records Specialist 1 00 1 00 1 00 1 00 Police Records Supervisor 0 00 0 00 0 00 1 00 Police Sergeant 2 00 1 00 1 00 1 00 Police Services Technician 3 .00 3 .00 3 .00 3 .50 Records Supervisor 2 .00 0 .00 0 .00 0 .00 Total Tax Initiative 21 Fund Positions 39.00 37.00 40.00 44.50 Animal Management Officer 1 00 1 00 1 00 1 00 Master Police Officer 1 .00 2 .00 2 .00 0 .00 Police Civilian Operations Manager 1 .00 1 .00 1 .00 0 .00 Police Lieutenant 0 00 1 00 1 00 1 00 Police Officer 30 00 31 00 31 00 32 00 Police Operations Manager 0 00 0 00 0 00 1 00 Police Records Specialist 0 .00 1 .00 0 .00 0 .00 Police Sergeant 5 00 4 00 6 00 5 00 Total Tax Initiative 22 Fund Positions 38.00 41.00 42.00 39.00 Total Public Safety Positions 238.00 248.00 252.00 254.00 PUBLIC WORKS 2021 Actual 2022 Actual 2023 Actual 2024 Budget ADA Coordinator 0 00 1 00 1 00 1 00 Administrative Coordinator 0 .00 1 .00 1 .00 0 .00 Administrative Specialist 1 00 1 00 1 00 2 00 Assistant Building Manager 0 00 0 00 1 00 0 00 Assistant City Engineer 0 00 1 00 1 00 1 00 Assistant Manager of City Facilities 0 .00 0 .00 0 .00 1 .00 Building Craftsworker 1 .00 1 .00 1 .00 1 .00 Building Maintenance Leadworker 2 00 2 00 2 00 2 00
Pay Plan Schedules
Pay Plan Schedule by Department (continued)
313
PUBLIC WORKS (continued) 2021 Actual 2022 Actual 2023 Actual 2024 Budget Building Maintenance Worker 4 .00 4 .00 4 .00 4 .00 CAD / GIS Supervisor 1 .00 1 .00 1 .00 1 .00 Chief Surveyor 1 00 1 00 1 00 1 00 City Engineer 0 00 1 00 1 00 1 00 Civil Engineer I 0 00 0 50 0 50 0 00 Civil Engineer II 1 .50 1 .00 5 .00 2 .50 Civil Engineer III 1 00 2 00 2 00 2 00 Civil Engineer IV 0 00 0 00 0 00 1 00 Community Connectivity Manager 0 00 1 00 1 00 1 00 Construction and Inspection Supervisor 1 .00 1 .00 1 .00 1 .00 Construction and Maintenance Supervisor 1 .00 1 .00 1 .00 1 .00 Craftsworker 0 00 0 00 1 00 1 00 Custodian 10 00 10 00 12 00 12 00 Director of Public Works 1 .00 1 .00 1 .00 1 .00 Electrician 1 .00 1 .00 1 .00 1 .00 Engineering Manager 0 00 0 00 0 00 3 00 Engineering Permit Coordinator 0 00 0 00 1 00 1 00 Engineering Permit Technician I 0 00 0 00 0 00 2 00 Engineering Services Manager 0 .75 0 .00 0 .00 0 .00 Engineering Technician I 0 .00 0 .00 1 .00 0 .00 Engineering Technician II 0 00 0 00 1 00 0 00 Executive Assistant 0 00 1 00 1 00 1 00 Facilities Manager 1 .00 0 .00 0 .00 0 .00 GEO Data Services Manager 1 .00 0 .00 0 .00 0 .00 GIS Analyst 1 00 0 00 0 00 0 00 HVAC Specialist 1 00 1 00 1 00 1 00 Land Development Technician 0 00 0 00 1 00 1 00 Manager of City Facilities 1 .00 1 .00 1 .00 1 .00 Manager of Communication-Infrastructure 1 00 1 00 1 00 0 00 Manager of Development Engineering 0 00 0 00 1 00 0 00 Manager of Traffic Operations and Maintenance 0 00 0 00 1 00 1 00 Mobility Planning and Innovation Manager 1 .00 1 .00 1 .00 1 .00 Municipal Inspector Foreman 1 .00 1 .00 1 .00 1 .00 Municipal Inspector I 0 00 0 00 2 00 2 00 Municipal Inspector II 6 00 6 00 4 00 2 00 Parking and Travel Demand Management Coordinator 1 00 1 00 1 00 1 00 Pavement Manager 1 .00 1 .00 1 .00 1 .00
Pay Plan Schedules
Pay Plan Schedule by Department (continued)
314
PUBLIC WORKS (continued) 2021 Actual 2022 Actual 2023 Actual 2024 Budget Public Works Project Manager 1 00 1 00 1 00 1 00 Senior Civil Designer 0 50 0 50 0 50 0 50 Senior Civil Engineer 1 .00 0 .00 0 .00 0 .00 Senior GIS Analyst 1 .00 0 .00 0 .00 0 .00 Senior Survey Technician 1 00 1 00 1 00 2 00 Streets Foreman 6 00 6 00 6 00 6 00 Streets Manager 1 00 1 00 1 00 1 00 Streets Supervisor 3 .00 3 .00 3 .00 3 .00 Streets Technician 21 .00 21 .00 21 .00 21 .00 Survey Crew Chief 0 00 0 00 0 00 1 00 Survey Party Chief 1 00 1 00 1 00 0 00 Survey Technician III 1 .00 1 .00 1 .00 0 .00 Traffic Crew Foreman 1 .00 1 .00 0 .00 0 .00 Traffic Engineer I 0 00 0 00 0 00 1 00 Traffic Engineer II 2 00 2 00 2 00 1 00 Traffic Engineer IV 0 00 0 00 1 00 1 00 Traffic Engineering Manger 1 .00 1 .00 1 .00 0 .00 Traffic Field Operations Supervisor 1 00 1 00 1 00 1 00 Traffic Technician I 2 00 2 00 2 00 2 00 Traffic Technician II 1 00 1 00 1 00 1 00 Traffic Technician III 0 .00 0 .00 0 .00 1 .00 Transportation Design Manager 1 .00 1 .00 1 .00 0 .00 Transportation Planner 1 00 1 00 1 00 1 00 Total General Fund Positions 90.75 92.00 106.00 102.00 Municipal Inspector Foreman 1 00 Municipal Inspector I 0 00 1 00 1 00 3 00 Municipal Inspector II 1 00 1 00 2 00 1 00 Pavement Management Coordinator 1 .00 1 .00 2 .00 2 .00 Traffic Technician I 2 .00 2 .00 2 .00 1 .00 Total Streets Fund Positions 4.00 5.00 7.00 8.00 Craftsworker 1 .00 1 .00 0 .00 0 .00 Total Parks Fund Positions 1.00 1.00 0.00 0.00
Pay Plan Schedules
Pay Plan Schedule by Department (continued)
315
PUBLIC WORKS (continued) 2021 Actual 2022 Actual 2023 Actual 2024 Budget Custodian 0 50 0 50 0 50 0 50 Total Police Tax Increment .21 Fund Positions 0.50 0.50 0.50 0.50 Custodian 0 50 0 50 0 50 0 50 Total Police Tax Increment .22 Fund Positions 0.50 0.50 0.50 0.50 Civil Engineer II 0 .50 0 .00 0 .00 0 .00 Civil Engineer III 0 00 1 00 1 00 1 00 Engineering Services Manager 0 25 0 00 0 00 0 00 Total 2019 Bond Construction Fund Positions 0.75 1.00 1.00 1.00 Civil Engineer I 0 00 0 25 0 25 0 00 Civil Engineer II 0 00 0 00 1 75 1 00 Civil Engineer III 2 .00 2 .00 3 .00 2 .00 Civil Engineer IV 0 00 0 00 0 00 1 00 Custodian 1 00 1 00 1 00 1 00 Engineering Manager 0 00 0 00 0 00 0 50 Senior Civil Designer 1 .50 1 .50 1 .50 1 .50 Senior Civil Engineer 0 .00 0 .50 0 .50 0 .00 Total Water Fund Positions 4.50 5.25 8.00 7.00 Civil Engineer I 0 .00 1 .25 1 .25 2 .00 Civil Engineer II 0 00 0 00 1 25 2 50 Civil Engineer III 0 00 0 00 2 00 2 00 Engineering Manager 0 00 0 00 0 00 0 50 Senior Civil Engineer 0 .00 0 .50 0 .50 0 .00 Total Wastewater Fund Positions 0.00 1.75 5.00 7.00 Civil Engineer III 0 .00 1 .00 1 .00 2 .00 Engineering Manager 0 .00 0 .00 1 .00 1 .00 Senior Utilities Design Engineer 1 00 1 00 0 00 0 00 Stormwater Administrator 1 00 1 00 1 00 1 00
Pay Plan Schedules
316
PUBLIC WORKS (continued) 2021 Actual 2022 Actual 2023 Actual 2024 Budget Stormwater Inspector I 0 00 0 00 0 00 1 00 Stormwater Inspector II 1 00 1 00 1 00 1 00 Stormwater Regulatory Analyst 1 00 1 00 1 00 1 00 Total Stormwater Fund Positions 4.00 5.00 5.00 7.00 Building Maintenance Worker 1 00 1 00 1 00 1 00 Total Buildings Fund Positions 1.00 1.00 1.00 1.00 Total Public Works Positions 107.00 113.00 134.00 134.00 UTILITIES 2021 Actual 2022 Actual 2023 Actual 2024 Budget Direct Mail Specialist 0 .00 1 .00 1 .00 1 .00 GIS Analyst 0 00 1 00 2 00 0 00 Senior GIS Analyst 0 00 1 00 1 00 0 00 Total General Fund Positions 0.00 3.00 4.00 1.00 Chief Plant Operator 4 00 4 00 5 00 5 00 Customer Information Manager 1 00 1 00 1 00 1 00 Customer Information Specialist 0 .00 0 .00 0 .00 1 .00 Customer Information Supervisor 1 .00 1 .00 1 .00 1 .00 Director of Utilities 1 00 1 00 1 00 1 00 Electro Mechanical Technician 1 00 4 00 4 00 4 00 Executive Assistant 0 00 0 50 0 50 0 50 GIS Analyst 1 .00 4 .00 2 .00 0 .00 Operations Supervisor 1 00 1 00 1 00 1 00 Operations Support Supervisor 1 00 1 00 1 00 0 00 OT/ITCS Security Operations Analyst 0 00 0 00 1 00 1 00 Plant Operator 6 .00 6 .00 5 .00 5 .00 Plant Supervisor - SCADA 1 .00 1 .00 1 .00 1 .00 SCADA Process and Controls Technician I 5 00 2 00 2 00 2 00 SCADA Process and Controls Technician II 0 00 0 00 1 00 1 00 Senior Customer Information Specialist 5 .00 5 .00 5 .00 4 .00 Senior GIS Analyst 1 .00 1 .00 1 .00 0 .00 Utilities Business Manager 0 00 0 50 0 50 0 50
317
UTILITIES (continued) 2021 Actual 2022 Actual 2023 Actual 2024 Budget Utility Foreman 8 00 8 00 9 00 9 00 Utility Supervisor 4 00 4 00 4 00 4 00 Utility System Technician 17 00 17 00 0 00 0 00 Utility System Technician-Associate Level 0 .00 0 .00 9 .00 7 .00 Utility System Technician-Journey Level 0 .00 0 .00 0 .00 4 .00 Utility System Technician-Senior Level 0 00 0 00 8 00 5 00 Utility Systems Analyst 2 00 2 00 2 00 0 00 Water Quality Administrator 1 .00 1 .00 1 .00 1 .00 Water Quality Analyst 2 .00 2 .00 2 .00 2 .00 Water Quality Technician 1 00 1 00 1 00 1 00 Water Resources Administrator 1 00 1 00 1 00 1 00 Water Resources Analyst 0 50 0 50 0 50 0 50 Water System Manager 1 .00 1 .00 1 .00 1 .00 Water Treatment Manager 1 .00 1 .00 1 .00 1 .00 Total Water Fund Positions 67.50 71.50 72.50 65.50 Executive Assistant 0 00 0 20 0 20 0 20 Utilities Business Manager 0 .00 0 .10 0 .10 0 .10 Utility Foreman 4 .00 4 .00 5 .00 5 .00 Utility Supervisor 2 00 2 00 2 00 2 00 Utility System Technician 10 00 10 00 0 00 0 00 Utility System Technician-Associate Level 0 00 0 00 4 00 6 00 Utility System Technician-Journey Level 0 .00 0 .00 0 .00 1 .00 Utility System Technician-Senior Level 0 00 0 00 5 00 4 00 Wastewater and Stormwater Manager 0 70 0 70 0 70 0 70 Total Wastewater Fund Positions 16.70 17.00 17.00 19.00 Executive Assistant 0 00 0 20 0 20 0 20 GIS Analyst 0 00 1 00 0 00 0 00 Utilities Business Manager 0 .00 0 .20 0 .20 0 .20 Utility System Technician 2 .00 2 .00 0 .00 0 .00 Utility System Technician-Associate Level 0 00 0 00 0 00 1 00 Utility System Technician-Journey Level 0 00 0 00 1 00 1 00
Pay Plan Schedules
318
UTILITIES (continued) 2021 Actual 2022 Actual 2023 Actual 2024 Budget Utility System Technician-Senior Level 0 00 0 00 1 00 1 00 Wastewater and Stormwater Manager 0 .30 0 .30 0 .30 0 .30 Total Stormwater Fund Positions 2.30 3.70 2.70 3.70 Customer Information Specialist 0 .00 2 .00 2 .00 2 .00 Executive Assistant 0 .00 0 .10 0 .10 0 .10 Utilities Business Manager 0 00 0 10 0 10 0 10 Senior Customer Information Specialist 2 00 0 00 0 00 0 00 Total Solid Waste Fund Positions 2.00 2.20 2.20 2.20 Assistant Fleet Manager 2 00 2 00 2 00 2 00 Fleet Courier 0 00 0 00 0 75 0 75 Fleet Equipment Technician 4 .00 5 .00 5 .00 5 .00 Fleet Lube Technician 0 .00 1 .00 1 .00 1 .00 Fleet Manager 1 00 1 00 1 00 1 00 Lead Master Fleet Technician 3 00 3 00 3 00 3 00 Master Fleet Equipment Technician 3 .00 2 .00 2 .00 2 .00 Parts Specialist 2 .00 2 .00 2 .00 2 .00 Police Courier 0 75 0 75 0 00 0 00 Utilities Business Manager 0 00 0 10 0 10 0 10 Utility Systems Administrator Supervisor 1 00 1 00 1 00 0 00 Total Vehicle Fund Positions 16.75 17.85 17.85 16.85 Fleet Equipment Technician 1 00 1 00 1 00 1 00 Total Tax Initiative 21 Fund Positions 1.00 1.00 1.00 1.00 Total Utilities Department Positions 106.25 116.25 117.25 109.25 Total Position Count 703.35 731.25 769.25 777.25
Pay Plan Schedules
Intentionally left blank
319 Pay Plan Schedules
Pay Plan Schedules
320
EXECUTIVE 1 2 3 4 5 6 7 8 9 10 11 12 EX1 $118,758 $123,211 $127,523 $131,668 $135,618 $139,686 $143,877 $148,193 $151,898 $155,696 $159,199 $162,383 EX2 $165,240 $171,436 $177,436 $183,203 $188,699 $194,360 $200,191 $206,197 $211,352 $216,635 $221,510 $225,940 EX3 $172,675 $179,151 $185,421 $191,447 $197,191 $203,106 $209,199 $215,475 $220,862 $226,384 $231,478 $236,107 EX4 $183,468 $190,348 $197,010 $203,413 $209,515 $215,800 $222,274 $228,943 $234,666 $240,533 $245,945 $250,864 INFORMATION TECHNOLOGY 1 2 3 4 5 6 7 8 9 10 11 12 INFT1 $80,568 $83,589 $86,515 $89,326 $92,006 $94,766 $97,609 $100,538 $103,051 $105,627 $108,004 $110,164 INFT2 $87,174 $90,443 $93,609 $96,651 $99,551 $102,537 $105,613 $108,782 $111,501 $114,289 $116,860 $119,197 INFT3 $94,323 $97,860 $101,285 $104,576 $107,714 $110,945 $114,274 $117,702 $120,644 $123,660 $126,443 $128,972 INFT4 $102,057 $105,884 $109,590 $113,152 $116,546 $120,043 $123,644 $127,353 $130,537 $133,801 $136,811 $139,547 INFT5 $110,426 $114,567 $118,576 $122,430 $126,103 $129,886 $133,783 $137,796 $141,241 $144,772 $148,030 $150,990 INFT6 $119,481 $123,961 $128,300 $132,469 $136,444 $140,537 $144,753 $149,096 $152,823 $156,643 $160,168 $163,371 LABOR, TRADES, CRAFTS and UTILITIES 1 2 3 4 5 6 7 8 9 10 11 12 LTCU1 $32,095 $33,299 $34,465 $35,585 $36,652 $37,752 $38,884 $40,051 $41,052 $42,078 $43,025 $43,886 LTCU2 $35,382 $36,709 $37,994 $39,228 $40,405 $41,618 $42,866 $44,152 $45,256 $46,387 $47,431 $48,380 LTCU3 $39,005 $40,468 $41,884 $43,245 $44,543 $45,879 $47,256 $48,673 $49,890 $51,137 $52,288 $53,334 LTCU4 $42,999 $44,612 $46,173 $47,674 $49,104 $50,577 $52,094 $53,657 $54,999 $56,374 $57,642 $58,795 LTCU5 $47,402 $49,180 $50,901 $52,556 $54,132 $55,756 $57,429 $59,152 $60,631 $62,146 $63,545 $64,816 LTCU6 $52,256 $54,216 $56,114 $57,937 $59,675 $61,466 $63,310 $65,209 $66,839 $68,510 $70,052 $71,453 LTCU7 $57,608 $59,768 $61,860 $63,870 $65,786 $67,760 $69,793 $71,886 $73,684 $75,526 $77,225 $78,769 LTCU8 $63,507 $65,888 $68,194 $70,410 $72,523 $74,698 $76,939 $79,248 $81,229 $83,259 $85,133 $86,835 LTCU9 $70,010 $72,635 $75,177 $77,620 $79,949 $82,348 $84,818 $87,362 $89,547 $91,785 $93,850 $95,727 MANAGEMENT 1 2 3 4 5 6 7 8 9 10 11 12 MGMT2 $57,041 $59,180 $61,251 $63,242 $65,139 $67,093 $69,106 $71,179 $72,958 $74,782 $76,465 $77,994 MGMT3 $62,893 $65,251 $67,535 $69,730 $71,822 $73,977 $76,196 $78,482 $80,444 $82,455 $84,310 $85,996 MGMT4 $69,346 $71,946 $74,464 $76,884 $79,191 $81,567 $84,014 $86,534 $88,698 $90,915 $92,961 $94,820 MGMT5 $78,236 $81,170 $84,011 $86,741 $89,343 $92,024 $94,784 $97,628 $100,069 $102,570 $104,878 $106,976 MGMT6 $86,263 $89,498 $92,630 $95,641 $98,510 $101,465 $104,509 $107,644 $110,336 $113,094 $115,639 $117,951 MGMT7 $95,114 $98,680 $102,134 $105,453 $108,617 $111,876 $115,232 $118,689 $121,656 $124,697 $127,503 $130,053 MGMT8 $104,872 $108,805 $112,613 $116,273 $119,761 $123,354 $127,055 $130,866 $134,138 $137,491 $140,585 $143,397 MGMT9 $113,000 $117,237 $121,341 $125,284 $129,043 $132,914 $136,901 $141,008 $144,534 $148,147 $151,480 $154,510 MGMT10 $124,594 $129,266 $133,790 $138,138 $142,282 $146,551 $150,947 $155,476 $159,363 $163,347 $167,022 $170,363 MGMT11 $132,069 $137,022 $141,817 $146,427 $150,819 $155,344 $160,004 $164,804 $168,924 $173,148 $177,043 $180,584 MGMT12 $139,993 $145,243 $150,327 $155,212 $159,869 $164,665 $169,604 $174,693 $179,060 $183,536 $187,666 $191,419 MGMT13 $146,993 $152,505 $157,843 $162,973 $167,862 $172,898 $178,085 $183,427 $188,013 $192,713 $197,049 $200,990
POLICE SWORN
Pay Plan Schedules
321
1 2 3 4 5 6 PD1 $83,283 $89,321 $95,796 $102,742 $110,190 PDM $115,149 PD2 $125,984 $129,764 $133,657 $136,664 PD3 $153,064 $156,508 PD4 $165,898 $169,631 PD5 $187,307 $191,521 PR2 $77,400 PROFESSIONAL 1 2 3 4 5 6 7 8 9 10 11 12 PROF3 $52,929 $54,914 $56,836 $58,683 $60,443 $62,257 $64,124 $66,048 $67,699 $69,392 $70,953 $72,372 PROF4 $58,486 $60,680 $62,803 $64,845 $66,790 $68,794 $70,857 $72,983 $74,808 $76,678 $78,403 $79,971 PROF5 $64,628 $67,051 $69,398 $71,653 $73,803 $76,017 $78,297 $80,646 $82,663 $84,729 $86,636 $88,368 PROF6 $71,413 $74,091 $76,685 $79,177 $81,552 $83,999 $86,519 $89,114 $91,342 $93,626 $95,732 $97,647 PROF7 $78,912 $81,871 $84,737 $87,490 $90,115 $92,819 $95,603 $98,471 $100,933 $103,456 $105,784 $107,900 PROF8 $87,198 $90,468 $93,634 $96,677 $99,577 $102,565 $105,642 $108,811 $111,531 $114,319 $116,892 $119,229 PROF9 $96,353 $99,967 $103,465 $106,828 $110,033 $113,334 $116,734 $120,236 $123,242 $126,323 $129,165 $131,748 PROF10 $106,470 $110,463 $114,329 $118,045 $121,586 $125,234 $128,991 $132,861 $136,182 $139,587 $142,727 $145,582 PROF11 $117,650 $122,062 $126,334 $130,440 $134,353 $138,383 $142,535 $146,811 $150,481 $154,243 $157,714 $160,868 TECHNICAL and BUSINESS SUPPORT 1 2 3 4 5 6 7 8 9 10 11 12 TBS1 $34,013 $35,288 $36,523 $37,710 $38,842 $40,007 $41,207 $42,443 $43,504 $44,592 $45,595 $46,507 TBS2 $37,465 $38,870 $40,230 $41,538 $42,784 $44,068 $45,390 $46,751 $47,920 $49,118 $50,223 $51,228 TBS3 $41,268 $42,815 $44,314 $45,754 $47,127 $48,540 $49,997 $51,497 $52,784 $54,104 $55,321 $56,427 TBS4 $45,456 $47,161 $48,812 $50,398 $51,910 $53,467 $55,071 $56,723 $58,142 $59,595 $60,936 $62,155 TBS5 $50,070 $51,948 $53,766 $55,513 $57,179 $58,894 $60,661 $62,481 $64,043 $65,644 $67,121 $68,463 TBS6 $55,152 $57,221 $59,223 $61,148 $62,982 $64,872 $66,818 $68,823 $70,543 $72,307 $73,934 $75,412 TBS7 $60,750 $63,028 $65,234 $67,355 $69,375 $71,456 $73,600 $75,808 $77,703 $79,646 $81,438 $83,067 TBS8 $66,916 $69,426 $71,856 $74,191 $76,417 $78,709 $81,071 $83,503 $85,590 $87,730 $89,704 $91,498 TBS9 $73,709 $76,473 $79,149 $81,721 $84,173 $86,698 $89,299 $91,978 $94,278 $96,635 $98,809 $100,785 TBS10 $81,190 $84,235 $87,183 $90,016 $92,717 $95,498 $98,363 $101,314 $103,847 $106,443 $108,838 $111,015
322
2023-2024 Proposed Revised Biennial Operating and Capital Budget
323
2023-2024 Proposed Revised Biennial Operating and Capital Budget
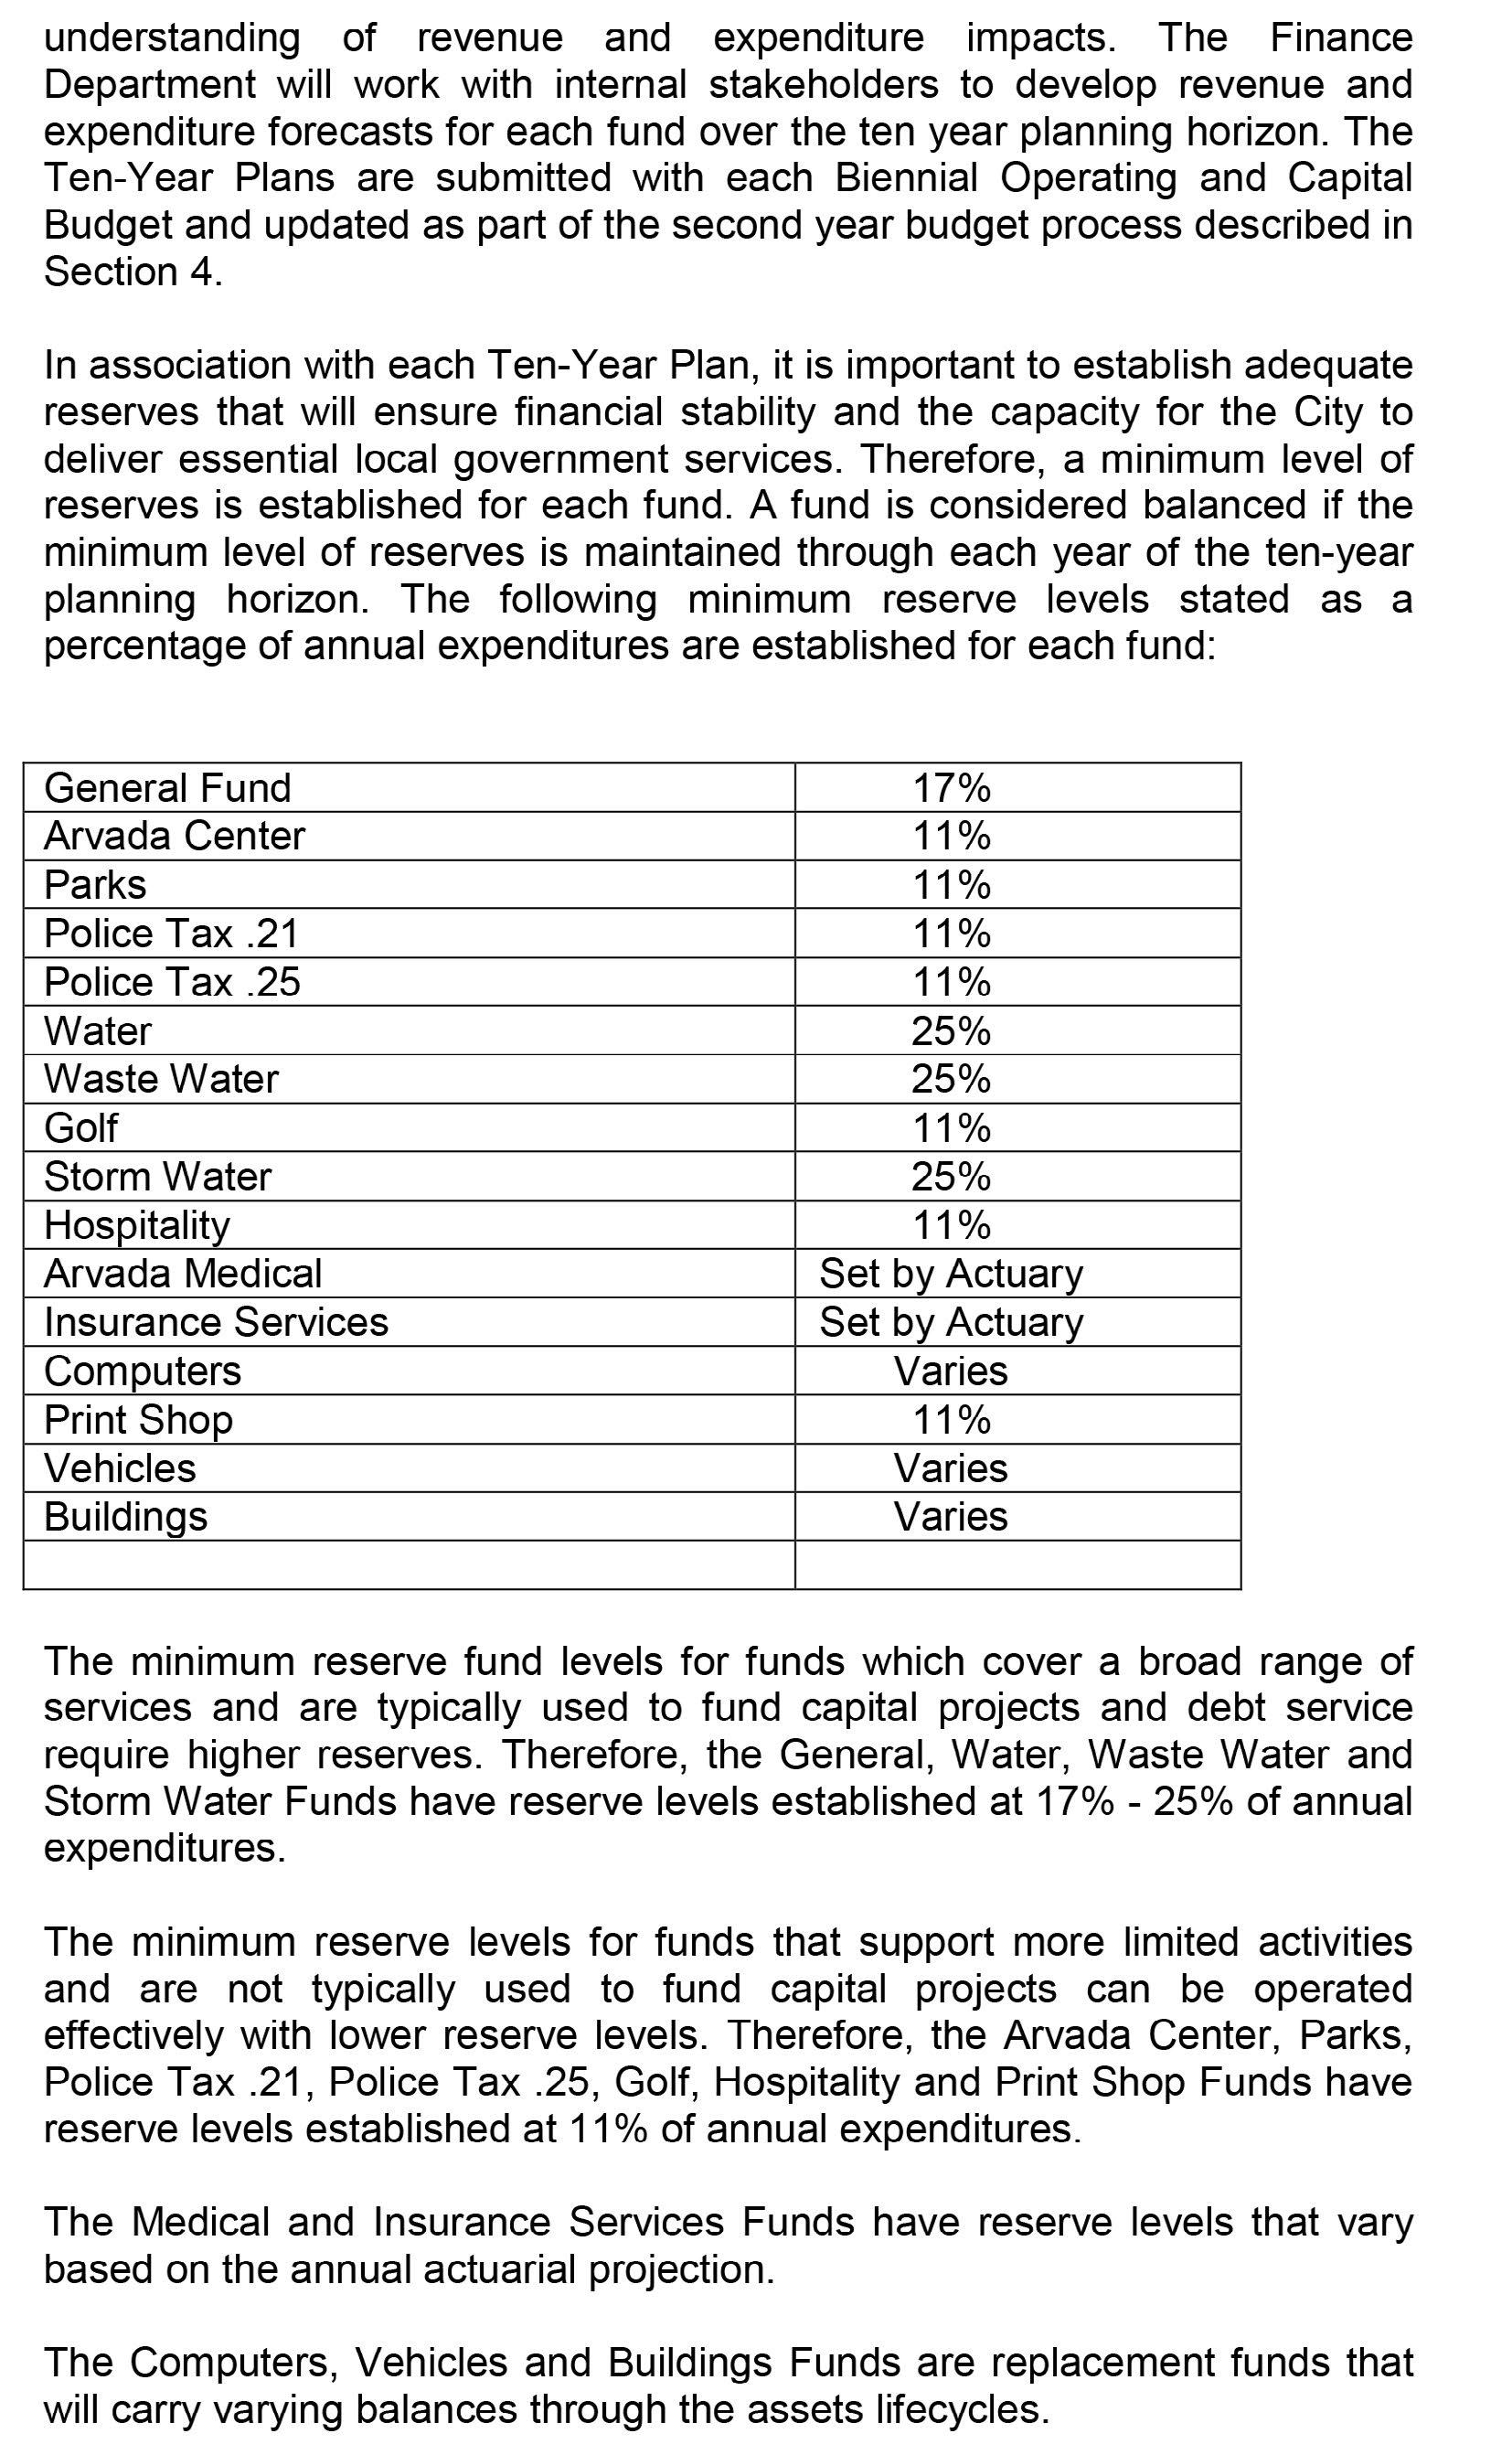
324
2023-2024 Proposed Revised Biennial Operating and Capital Budget
325
2023-2024 Proposed Revised Biennial Operating and Capital Budget
Glossary of Terms
The City of Arvada Operating and Capital Budget is structured to be easily understood and meaningful to both the general public and the organization . This glossary is provided to assist those unfamiliar with budgeting terms and a few terms specific to the Arvada financial planning process
98-101 Funding: Since the electors of Arvada adopted a sales tax in 1969, the City Code has required that 60% of the first cent of sales tax revenue must be appropriated annually for capital projects or debt service. Codified as 98-101 in the Arvada Code of Ordinances, this funding is referred to as 98-101 funding
Accrual Basis: A basis of accounting in which transactions are recognized at the time they are incurred, as opposed to when cash is received or spent
Advance Refunding: The payoff and re-issuance of bonds to obtain better interest rates and/or bond conditions
American Rescue Plan Act of 2021 (ARPA): Is a $1 .9 trillion economic stimulus bill passed by the 117th U .S . Congress and signed into law by President Joe Biden on March 11, 2021, to provide additional relief to address the continued impact of COVID-19
Amortization: Decrease the book value of a loan or intangible asset over a period of time, typically the for the life of the loan
Annual Comprehensive Financial Report (ACFR): Thorough and detailed presentation of the City's financial condition, reporting on the City's activities and balances for the fiscal year
Appropriation: Appropriation is a formal action by the City Council which approves the spending limits for the fiscal year for each fund
Arvada Economic Development Association (AEDA): Arvada Economic Development Association provides start-up, existing or expanding businesses with the latest demographic, financial, business, and consumer research necessary to succeed in the City of Arvada .
Assessed Valuation: Assessed valuation is a valuation set upon real estate or other property by the County Assessor as a basis for levying taxes .
Asset: Resources owned or held that have monetary value
Assigned Fund Balance: These are amounts that a government intends to use for a specific purpose Intent can be expressed by the governing body or by an official or body to which the governing body delegates authority
Attrition: A method of achieving a reduction in personnel by not refilling the positions vacated through resignation, reassignment, transfer, retirement or means other than layoffs
Audit: Examination and evaluation by an independent audit firm of the financial statements to represent that the Financial Statements are free of material misstatement
AURA: AURA stands for Arvada Urban Renewal Authority AURA acquires and assembles property in order to redevelop blighted property located in the urban renewal district The district in Arvada includes five active areas that are located throughout the City .
Authorized Positions: Employee positions, which are authorized in the adopted budget, to be filled during the year
Balanced budget: Estimated expenditures do not exceed estimated revenues and available fund balance for each
326
Glossary of Terms
year of the two-year budget .
Bond: A long-term I O U or promise to pay Often bonds are issued to finance the construction of long term capital projects . It is a promise to repay a specified amount of money (the face amount of the bond) on a particular date (maturity date) . Bonds come in two types: general obligation bonds are backed by the full faith, credit and taxing authority of the government and revenue bonds are backed only by a specific revenue stream, such as water user fees or sales tax .
Budget: A plan of financial activity for a specified period of time (two years) indicating all planned revenues and expenditures for the budget period .
Budgetary Basis: This refers to the basis of accounting used to estimate financing sources and uses in the budget This generally takes one of three forms: Generally Accepted Accounting Principles (GAAP), cash, or modified accrual .
Budgetary Control: The control or management of a government in accordance with the approved budget for the purpose of keeping expenditures within the limitations of available appropriations and resources .
Capital Equipment: Assets of value greater than $5,000 and having a useful life greater than 36 months . Capital equipment is also called fixed assets .
Capital Improvements Plan (CIP): The appropriation and spending plan for improvements to city facilities including buildings, streets, water , stormwater and sewer projects, drainage improvements, parks and trails .
Capital Outlay: Classification of expenditures related to the purchase of capital equipment .
Capital Project: Major construction, acquisition or renovation activities which add value to a government’s physical assets of significantly increase their useful life .
Cash basis: A basis of accounting in which transactions are recognized only when cash is increased or decreased
CCIPC: The Citizens Capital Improvement Plan Committee, a 21-member group of citizens appointed by City Council to report recommendations for capital improvement project prioritizations and funding
Certificate of Participation (COP): A certificate of participation is a lease financing agreement used by a government to improve or purchase infrastructure
CDBG: CDBG stands for Community Development Block Grant, which is money given to cities from the federal government to improve blighted conditions and to assist low and moderate income persons
City Council Strategic Plan (CCSP): The City Council Strategic Plan is the guiding document that lays the foundation for meeting current and future community needs, integrates the Biennial Operating and Capital Improvement Budgets, and subsequently drives daily operations within the City of Arvada .
Committed Fund Balance: These are amounts constrained to specific purposes by a government itself, using its highest level of decision making authority . To be reported as committed, amounts cannot be used for any other purpose unless the government takes the same highest-level action to remove or change the restraint .
Consumer Price Index (CPI): A statistical description of price levels provided by the U .S . Department of Labor . The index is used to measure the increase in the cost of living (economic inflation) .
327
Glossary of Terms
Contingency: A contingency is a budgetary reserve set aside for emergency or unanticipated expenditures and/ or revenue shortfalls .
Coronavirus Aid, Relief, and Economic Security Act (CARES): Also known as the CARES Act is a $2 .2 trillion economic stimulus bill passed by the 116th U .S . Congress and signed into law by President Donald Trump on March 27, 2020, in response to the economic fallout of the COVID-19 pandemic in the United States
Debt Service: Debt Service is the principal and interest payments on outstanding bonds .
Depreciation: Expiration in the service life of capital equipment attributable to wear and tear, deterioration, action of the physical elements, inadequacy or obsolescence .
Emergency Reserve: The Emergency Reserve is a term used in TABOR .TABOR requires Arvada to maintain 3% of total fiscal year spending as an emergency reserve .
Encumbrance: An encumbrance is the formal accounting recognition of commitments to expend resources in the future .
Enterprise Fund: An enterprise fund is a separate set of financial records used for operations which are financed and operated in a manner similar to a private business enterprise . City enterprise funds are set up in order to pay ongoing costs of a program using ongoing revenues and fees generated by the program such as Arvada’s utility service .
Fiscal Year: A fiscal year is the one year period designated by the city for the beginning and ending of financial transactions . This is the period covered by the budget and the financial report . The city’s fiscal year begins January 1 and ends December 31 .
FOCUS: This is the name given to the City of Arvada’s system of performance based budgeting and the practice of developing budgets based on the relationship between program funding levels and expected outcomes from that program
Fiduciary Fund: Fund used to report on assets held in trust for others such as pension funds .
Full Time Equivalent Position (FTE): A position converted to the decimal equivalent of a full-time position based on 2,080 hours per year . For example, a part-time typist working for 20 hours per week would be equivalent to .5 of a full-time equivalent
Full Faith and Credit: A pledge of the government’s taxing power to repay debt obligations .
Fund: A fund is a fiscal and accounting entity with a self-balancing set of accounts recording cash and other financial resources, related liabilities and residual balances .
Fund Balance: A fund balance is the difference between total assets and total liabilities for a fund .
GASB: GASB is the Governmental Accounting Standards Board, which is the source of generally accepted accounting principles for public-sector entities like the City of Arvada .
General Obligation (G.O.) Bond: This type of bond is backed by the full faith, credit and taxing power of the city
General Fund: A general purpose fund supported by taxes, fees and other revenues which may be used for any lawful purpose This fund accounts for all financial resources except those required to be accounted for in another
328
Goal: A goal is a statement of broad direction, purpose or intention based on the needs of the community . A goal is general and timeless; that is, it is not concerned with a specific achievement in a given time period.
Government Finance Officers Association (GFOA): An organization founded in 1906 that represents public finance officials throughout the United States and Canada
Governmental Fund: Fund used to account for most of general activities including tax supported activities, debt service, capital projects and special revenue funds
Infrastructure: Infrastructures are facilities on which the continuance and growth of a community depend such as a road, water lines, sewer lines, public buildings, and parks Infrastructure assets are immovable and of value only to the government
Internal Service Fund: This fund accounts for the financing of goods or services provided by one department or agency to other departments or agencies of the governmental unit An example is the insurance fund
Liability: An obligation to pay an amount in money, goods, or services to another party
Line of Business: A grouping of Programs with similar common purposes .Local Growth: Local growth is a term defined by TABOR Local growth is the net percentage change in actual value of all real property
Maintenance and Operation Costs: The day to day operation and maintenance costs of a municipality include such things as gas and electric utility bills, telephone expense, reproduction costs, postage and vehicle maintenance
Major Fund: Funds are considered major if total assets, liabilities, revenues or expenditures of the fund are at least 10 percent of the corresponding total assets, liabilities, revenues or expenditures for all funds in that category The total assets, liabilities, revenues or expenditures of the individual fund are at least 5 percent of the total assets, liabilities, revenue or expenditures of all fund categories combined .
Milestone: A significant event or important achievement that indicates change or progress toward a strategic result Milestones signal anchors and serve as visible indicators of progress toward achievement of a strategic result .
Mill: Property tax rates that are based on the valuation of property are measured in units called mills A tax rate of one mill produces one dollar of taxes on each $1,000 of assessed property valuation .
Modified Accrual: Modified accrual is a basis of accounting where revenues are recognized in the accounting period in which they become available and measurable, and expenditures are recognized in the accounting period when the liability is incurred, if measurable
Non-spendable Fund Balance: These are amounts that are not in a spendable form (such as inventory) or are required to be maintained intact (such as the corpus of an endowment fund)
Operating Budget: An operating budget contains the day-to-day costs of delivering city services . The operating budget is the spending plan for the entity
Operating Revenue: Funds that the government receives as income to pay for ongoing operations . It includes such items as taxes, fees from specific services, interest earnings and grant revenues Operating revenues are used to pay for day-to-day services
329
Glossary of Terms fund
Glossary of Terms
Operating Expenditures: The cost for personnel, materials and equipment required for a department to function
Performance Measure: Using smart goal framework, performance measures are specific, measurable, achiveable, realistic and timely Performance measures help focus efforts and ability to achieve targets All strategic performance measures are directly aligned with a strategic result and all operational performance measures align with one or more principles
Personnel Expenditures: Expenditures for salaries, wages and fringe benefits for employees .
Principle: Principles are high-level business strategies that form our business model and serve as pillars of excellence . They are broad in scope and apply to all areas within the City organization and provide standards for how we do business in order to successfully support City Council priorities They promote working collaboratively in a deliberate strategic direction
Proprietary Fund: Fund used for operations which are financed and operated similar to a private business enterprise The City has two types of proprietary funds, Enterprise Funds and Internal Service Funds
Program: A subdivision within a department within which revenues and expenditures are organized around benefits experienced by consumers of the program’s services
Reserve: A reserve is a portion of the fund balance that is not available for appropriation or expenditure
Resolution: A resolution is a formal statement of a decision or expression of opinion put before or adopted by the city council
Restricted Fund Balance: These are amounts constrained to specific purposes by their providers (such as grantors, bondholders, and higher levels of government), through constitutional provisions or enabling legislation
Revenue Bond: This is a type of bond that is backed only by a particular source of revenue, such as water sales, road tolls, and sales taxes
Special Revenue Fund: Fund used to account for revenue from specific sources restricted to a certain purpose .
Strategic Result: A specific and measurable objective directed by City Council providing guidance in supporting priorites and organizational transformation . Strategic resutls are a statement of a desired end-state and are measurable and explicity defined using outcome language They provide guidance to organizational transformation
STRAT OP: A strategic planning framework and process emphasizing perspective first helps us close the gap between City Council’s vision and our day to day work
Supplemental Appropriation: An additional appropriation made by the governing body after the budget year has started
System Development Charges: Payment to connect to the City’s water or sewer infrastructure to provide service to a location
TABOR: TABOR (Taxpayer Bill of Rights, Article X, and Section 20 of the Colorado Constitution) is an amendment to Colorado’s State Constitution passed by election in 1992 that imposes revenue limitations for governments
TABOR Caps: TABOR caps are the limits placed each year on how much money cities can receive . The caps are calculated on a yearly basis and are dependent upon local growth plus inflation
330
Taking Lasting Care (TLC): Taking Lasting Care is one of the key components of the City’s Capital Improvement Plan and focuses on reinvestment of resources to existing infrastructure .
Taxes: Taxes are compulsory charges levied by a government for the purpose of financing services performed for the common benefit of the people . This term does not include specific charges made against particular persons or property for current or permanent benefit, such as special assessments .
Tax Levy: A tax levy is the total amount to be raised by general property taxes as measured by mills . A mill equals $1,000 of assessed valuation .
Transfer: A transfer is expenditure from one fund for the benefit of a receiving fund .
User Charges: The payment of a fee for direct receipt of a public service by the party benefiting from the service is a user charge .
Working Capital: The difference between the current assets and current liabilities in a fund In other words, working capital is the amount of money available to pay for current operations .
331
Glossary of Terms
City of Arvada 8101 Ralston Road, Arvada, CO 80002
