2023-2024 Proposed Biennial Operating and Capital Budget COLORADO
Intentionally left blank
2023-2024 Proposed Biennial Operating and Capital Budget 2

Intentionally left blank
Intentionally left blank
Overview
City Staff
Organization Chart
GFOA Distinguished Budget Presentation Award
Budget Transmittal Letter
Council Strategic Plan
Community Profile
9-22
23-52
53-54
Legal Requirements and Budget Process 55-62
Introduction 63-67 Revenue and Expenditure Summary 69-104 Ten-Year Assumptions and Models
Work Systems Section
105-133
135-140 Infrastructure 141-151
Community and Economic Development
Organizational and Service Effectivness 153-161 Safe Community . . . . .
Vibrant Community and Neighborhoods
Capital Improvement Projects .
163-169
171-176
. 177-299
Debt Obligations 301-306
Additional Information
2023 Pay Plan Position and Schedules 307-329
2023 Budget Adoption Resolution . . . . . . . . . . . . . . . . . . . . . . . . . . . . . . . . . . . . . . .
In Final Edition
2023 Capital Improvement Adoption Resolution . . . . . . . . . . . . . . . . . . . . . . . . . . . . In Final Edition
2023 Pay Plan Adoption Resolution
In Final Edition
Mill Levy Ordinance In Final Edition
2023 Appropriating Funds Fiscal Year Ordinance In Final Edition City Council Policy .
Glossary of Terms . .
331-334
335-340
Cover Design:
Special Thanks To:
Jenna Belec, Executive Assistant
Bryan Archer, Director of Finance
Debra Nielson, Assistant Finance Director
Vesta Weinhauer, Controller
Vacant, Budget Analyst
Chris Kelly, Budget Analyst
Carolyn Ewing, Budget Analyst
Jenna Belec, Executive Assistant
Steve Milke, Bun Heng, Print Shop
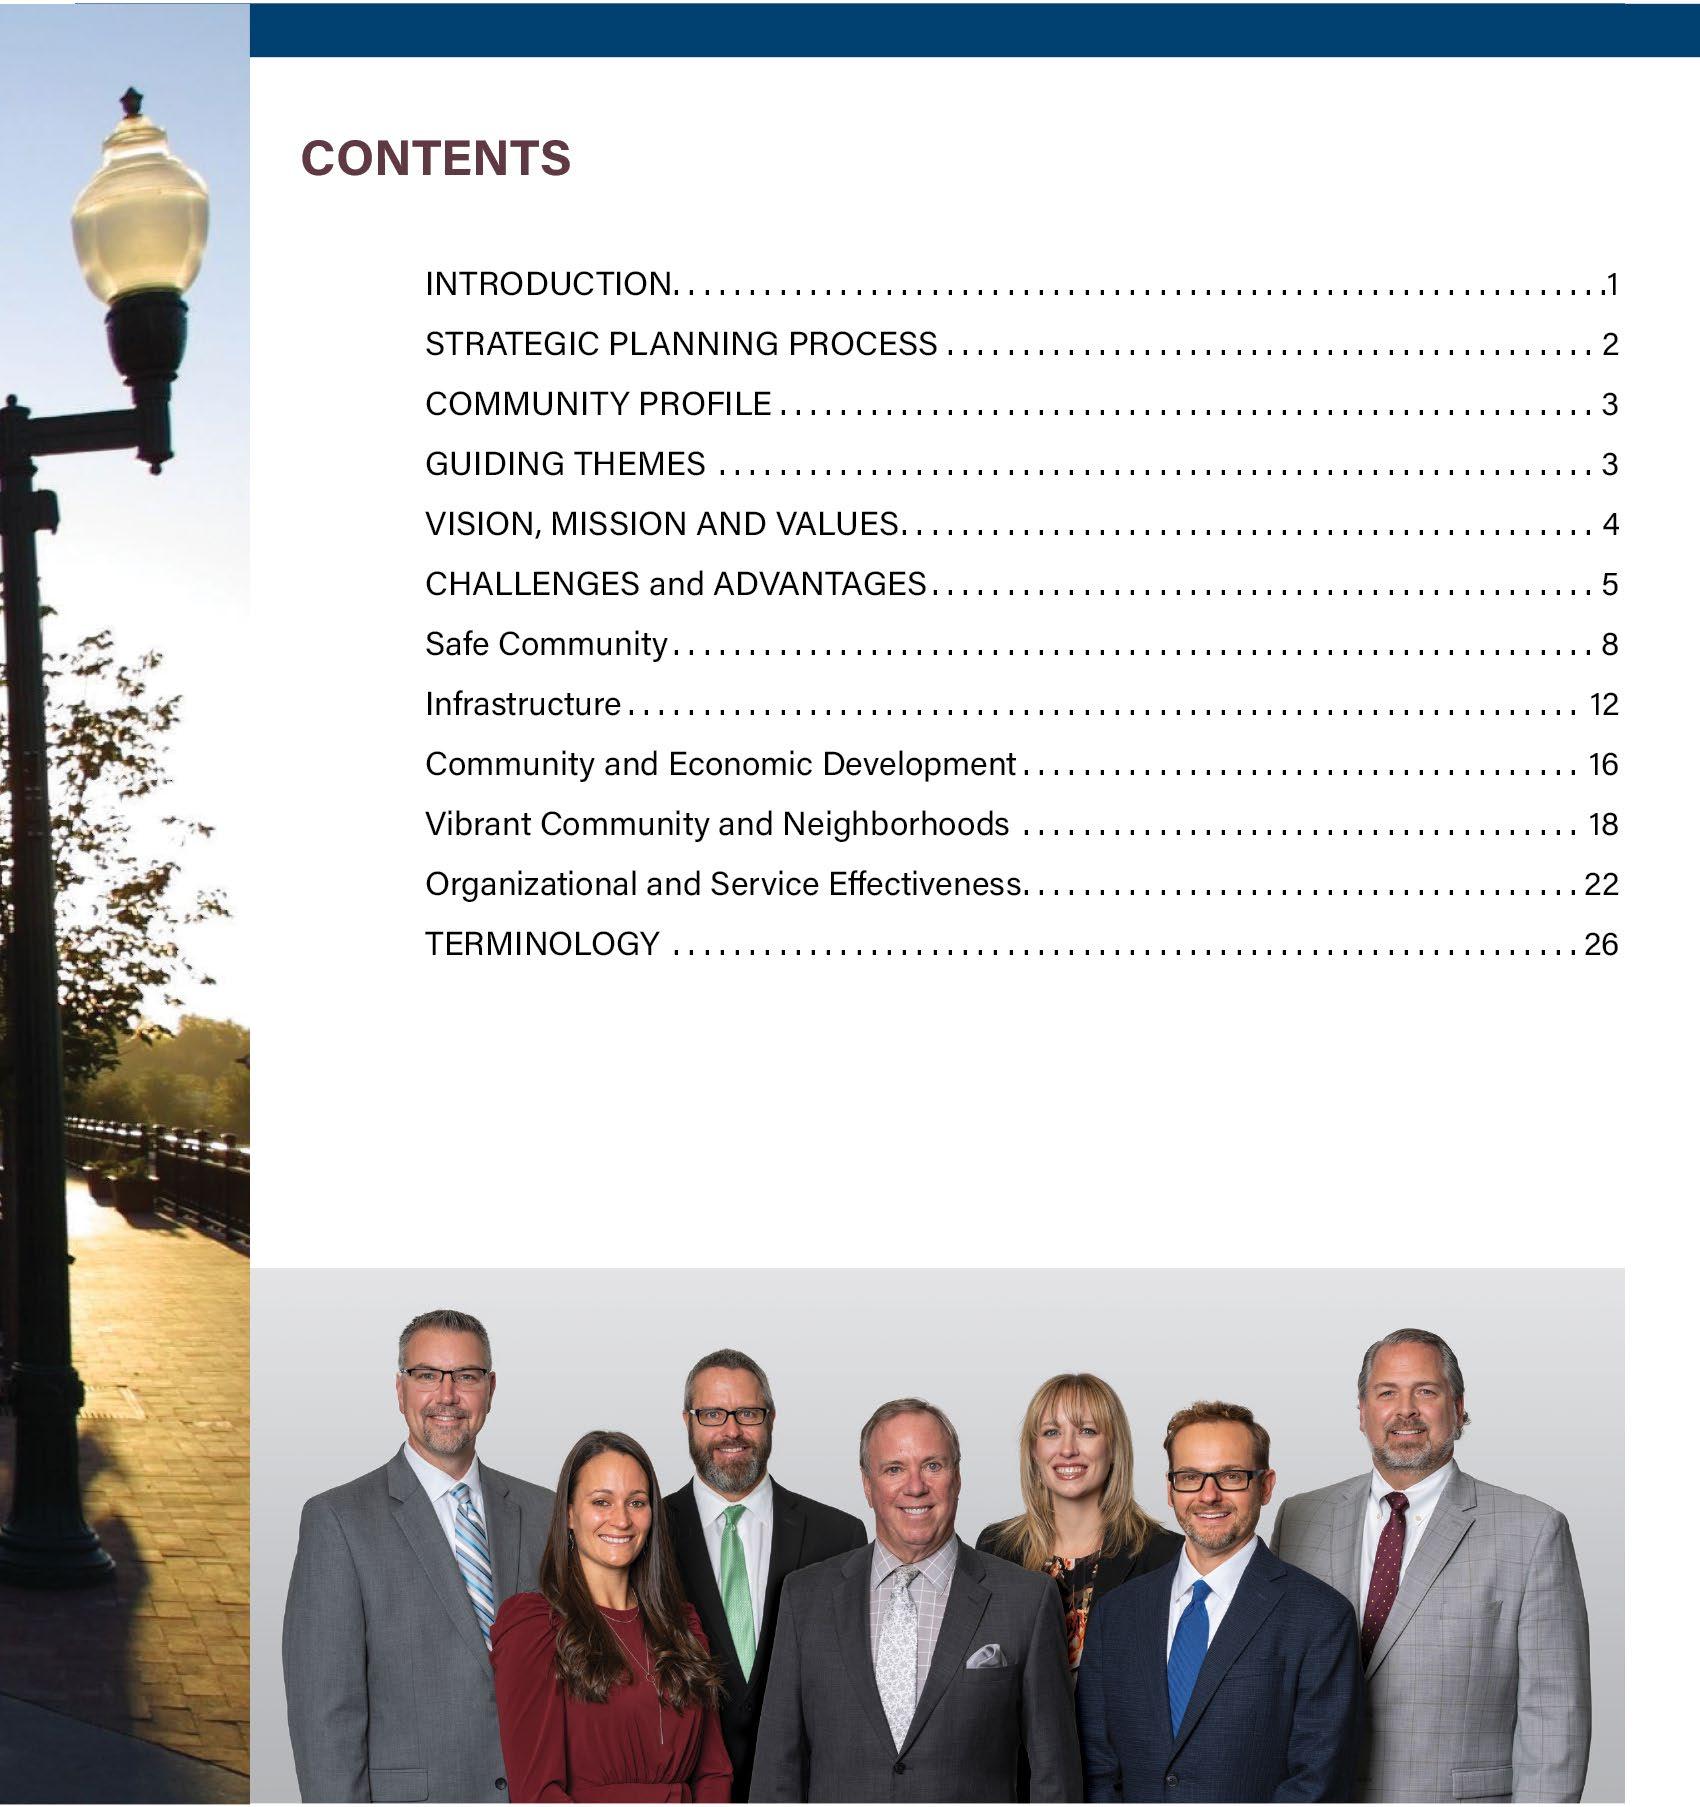
Bob Fifer Councilmember At-Large (Term expires 2023)

Click
Lisa Smith Councilmember At-Large (Term expires 2025)
Randy Moorman Councilmember District 1 (Term expires 2025)
more information about City Council
City Manager
Lauren Simpson Councilmember District 2 (Term expires 2023)
John Marriott Councilmember District 3 (Term expires 2025)
David Jones Councilmember District 4 (Term expires 2023)
Mark G Deven
Lorie Gillis Deputy City Manager
Deputy City Manager
Linda Haley Municipal Judge
Kathryn Kurtz City Attorney

Rachel Morris Community and Economic Development
Director of Community and Economic Development
Ryan Stachelski Infrastructure
Director of Public Works
Director of Utilities
Organizational and Service Effectiveness
Director of Finance
Director of Human Resources
Don Wick
Sharon Israel
Bryan Archer
Gabriella Boomer
Craig Poley City Clerk
Chief Information Officer
Safe Community
Kristen Rush
Chief of Police Link Strate Vibrant Community and Neighborhoods
Director of Vibrant Communities
Enessa Janes

of Arvada Colorado
For the Biennium Beginning January 01, 2021
Executive Director
The Government Finance Officers Association of the United States and Canada (GFOA) presented a Distinguished Budget Presentation Award to the City of Arvada for its Biennial Budget for the fiscal years 20192020. In order to receive this award, a governmental unit must publish a budget document that meets program criteria as a policy document, as an operations guide, as a financial plan, and as a communications device.
The City of Arvada has received this Distinguished Budget Presentation Award for the past 26 years!
Members of City Council City of Arvada 8101 Ralston Road Arvada, Colorado 80002
Members of City Council and the Arvada Community:
Transmitted with this letter is the City of Arvada’s Proposed 2023-2024 Biennial Operating and Capital Budget . As required by City Council Policy No . 300 .4, Arvada Budget and Fiscal Policy, our team must develop a Biennial Operating and Capital Budget which is to be presented in alignment with the City Council Strategic Plan (CCSP) for consideration by the City Council . Each Biennial Operating and Cap ital Budget is presented in late August/early September and Council approval must be completed per state law by October 31 of the even-numbered year prior to the odd-numbered year the budget is imple mented .
Council approval authorizes expenditure authority for only one year . Our team must develop and present a revised budget for the second year, which the Council will consider and approve in the same manner, in order to authorize expenditures for the second year of the Biennial Operating and Capital Budget
The Proposed 2023-2024 Budget remains connected to the Strategic Planning Process framework which provides the foundation for accomplishing the Council Strategic Results and other key results identified by each of the five work systems. This framework utilizes the following elements:
• Work Systems that align to the Priority Areas as defined in the City Council Strategic Plan;
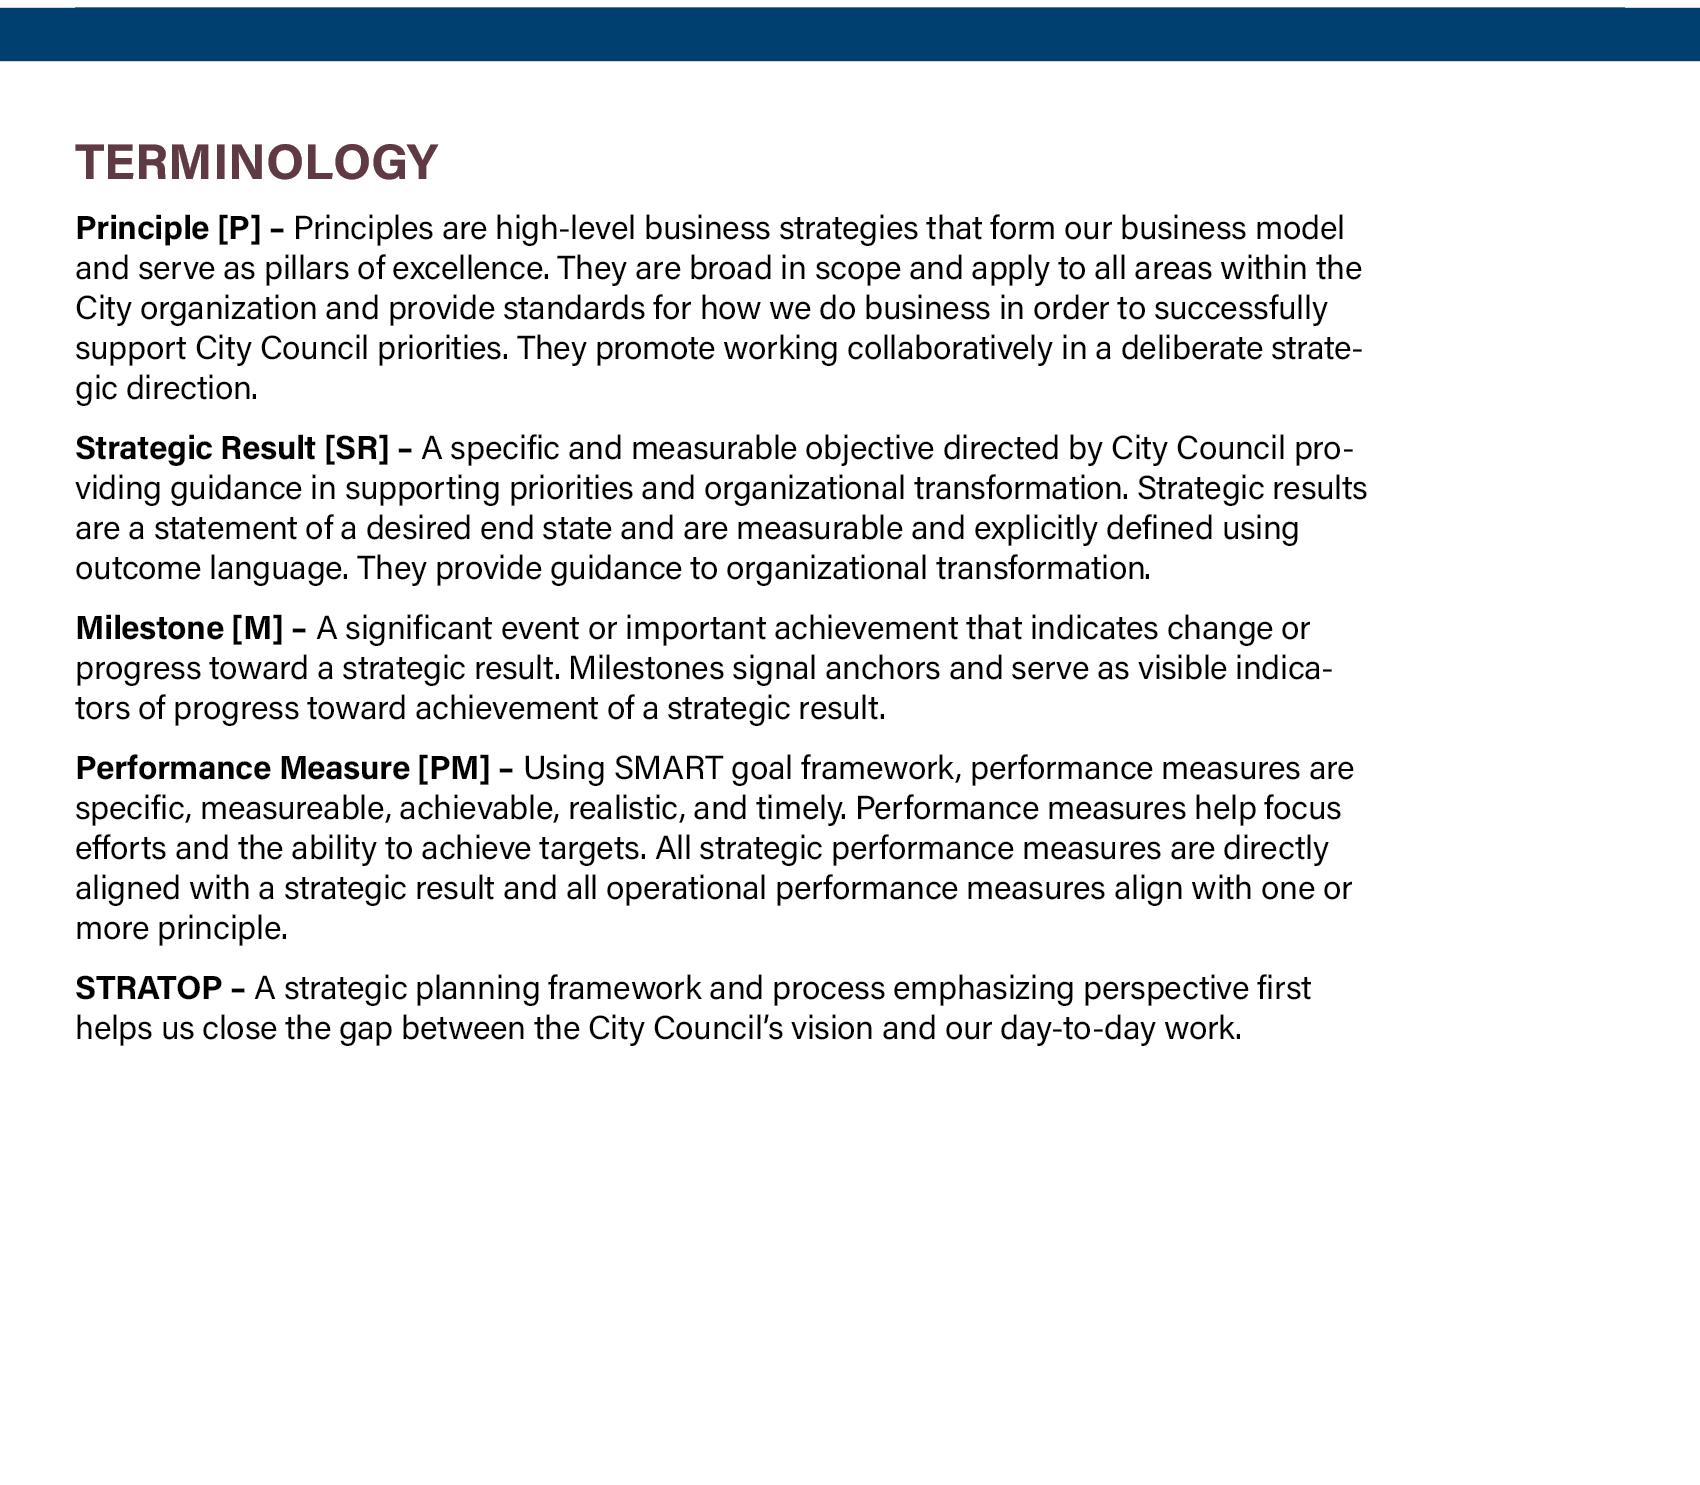
• Principles defined as high level strategies that form our business model and serve as pillars of excellence;
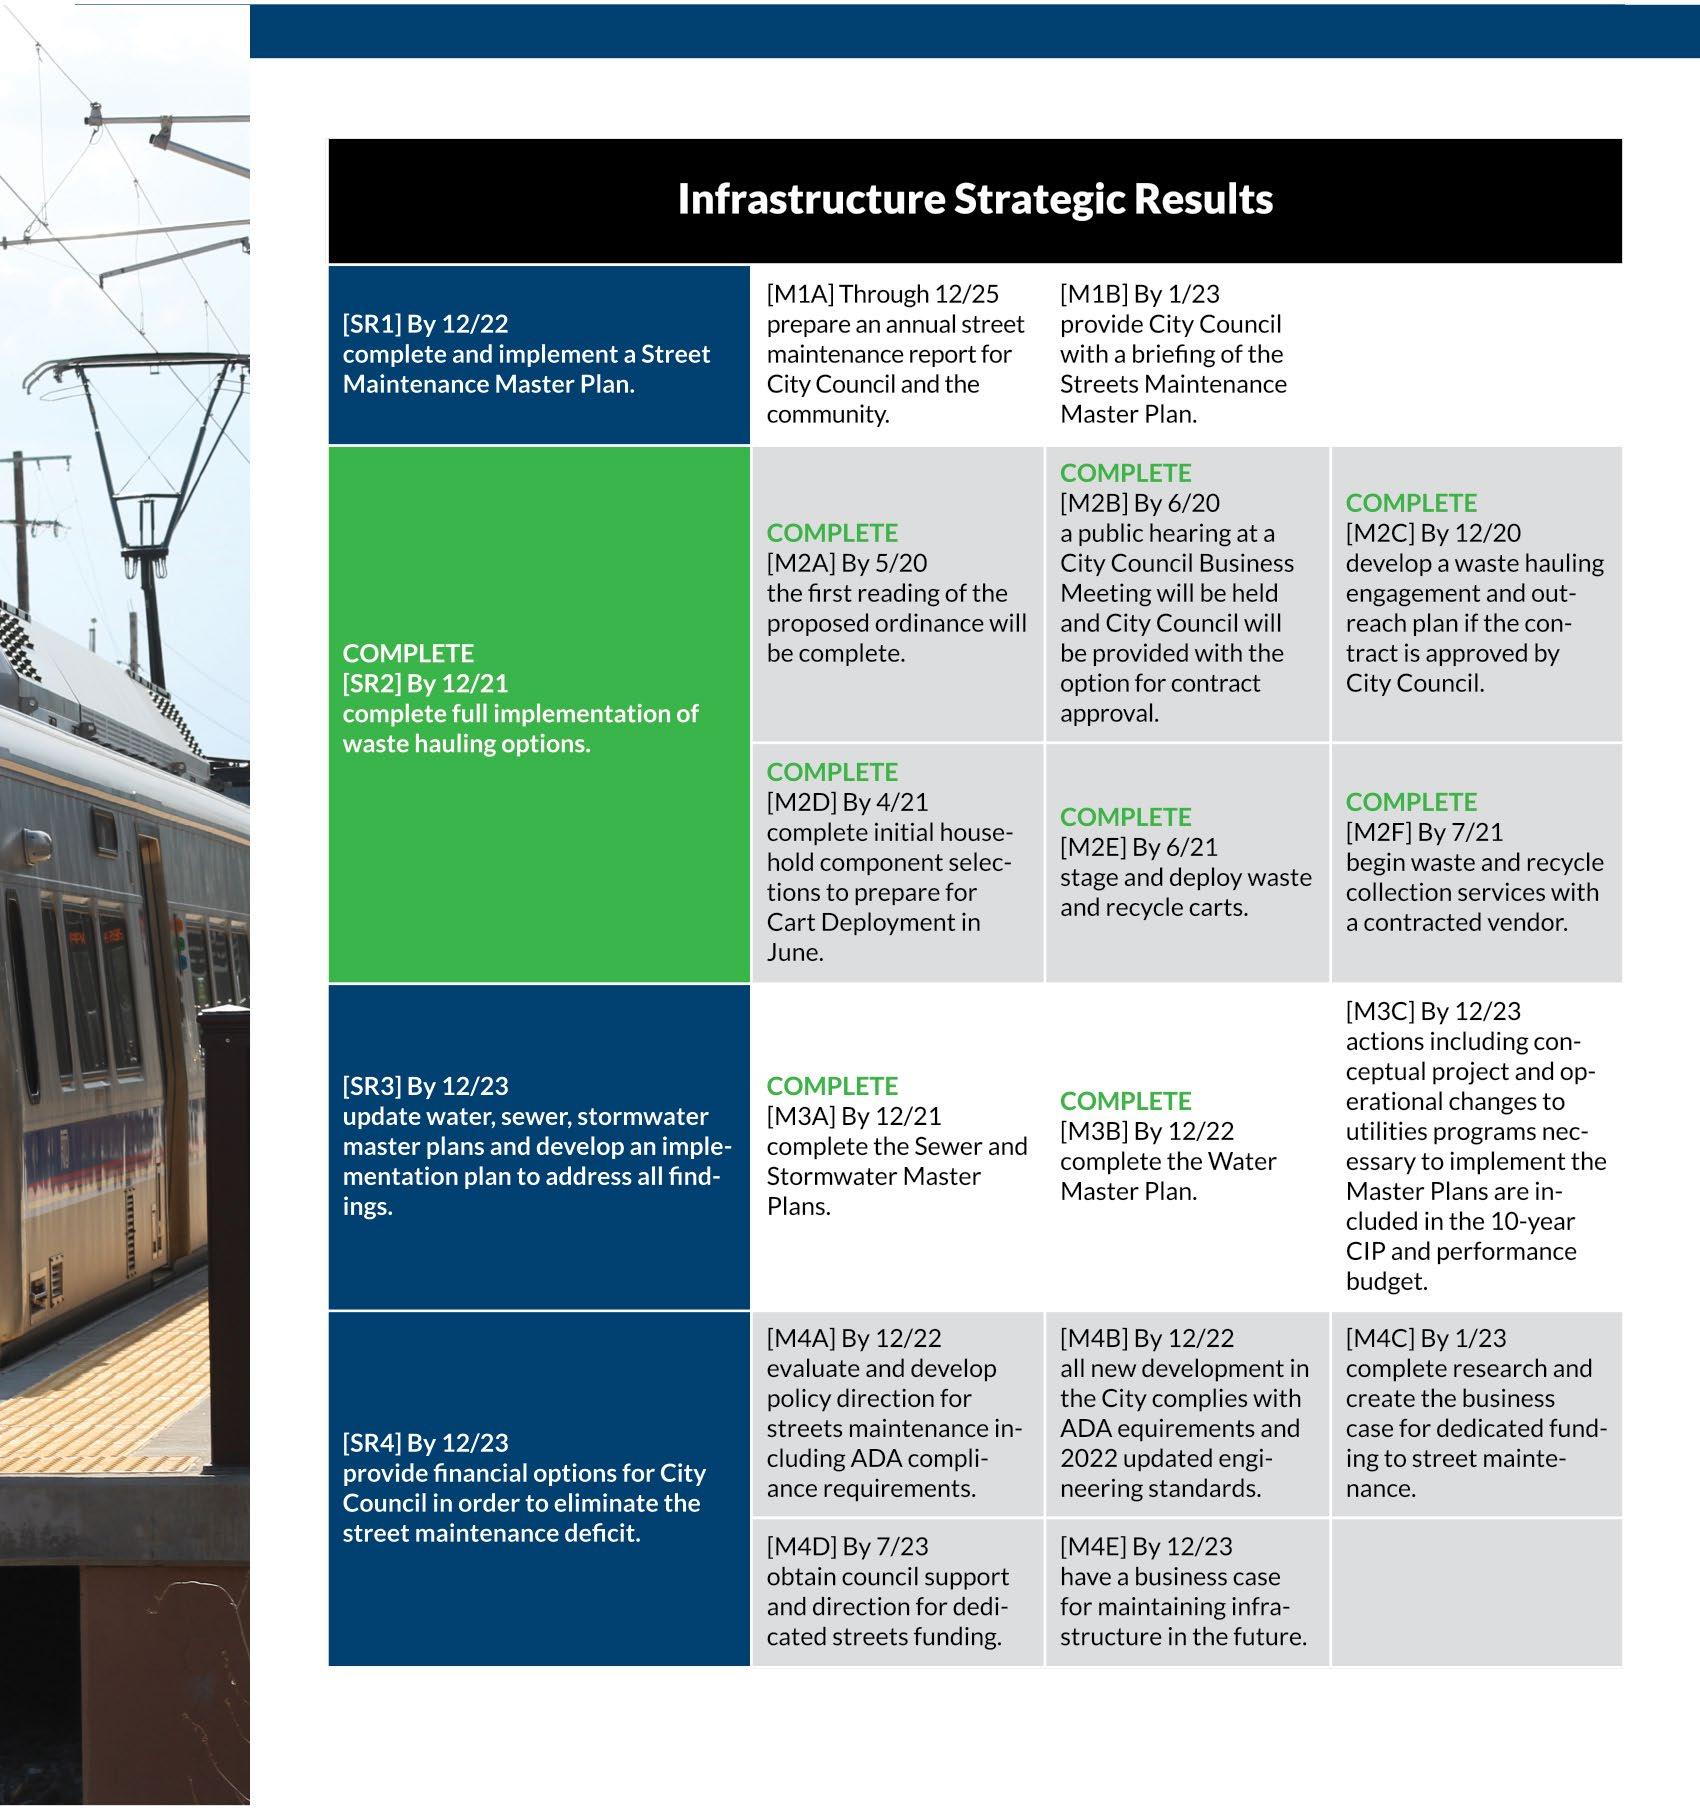
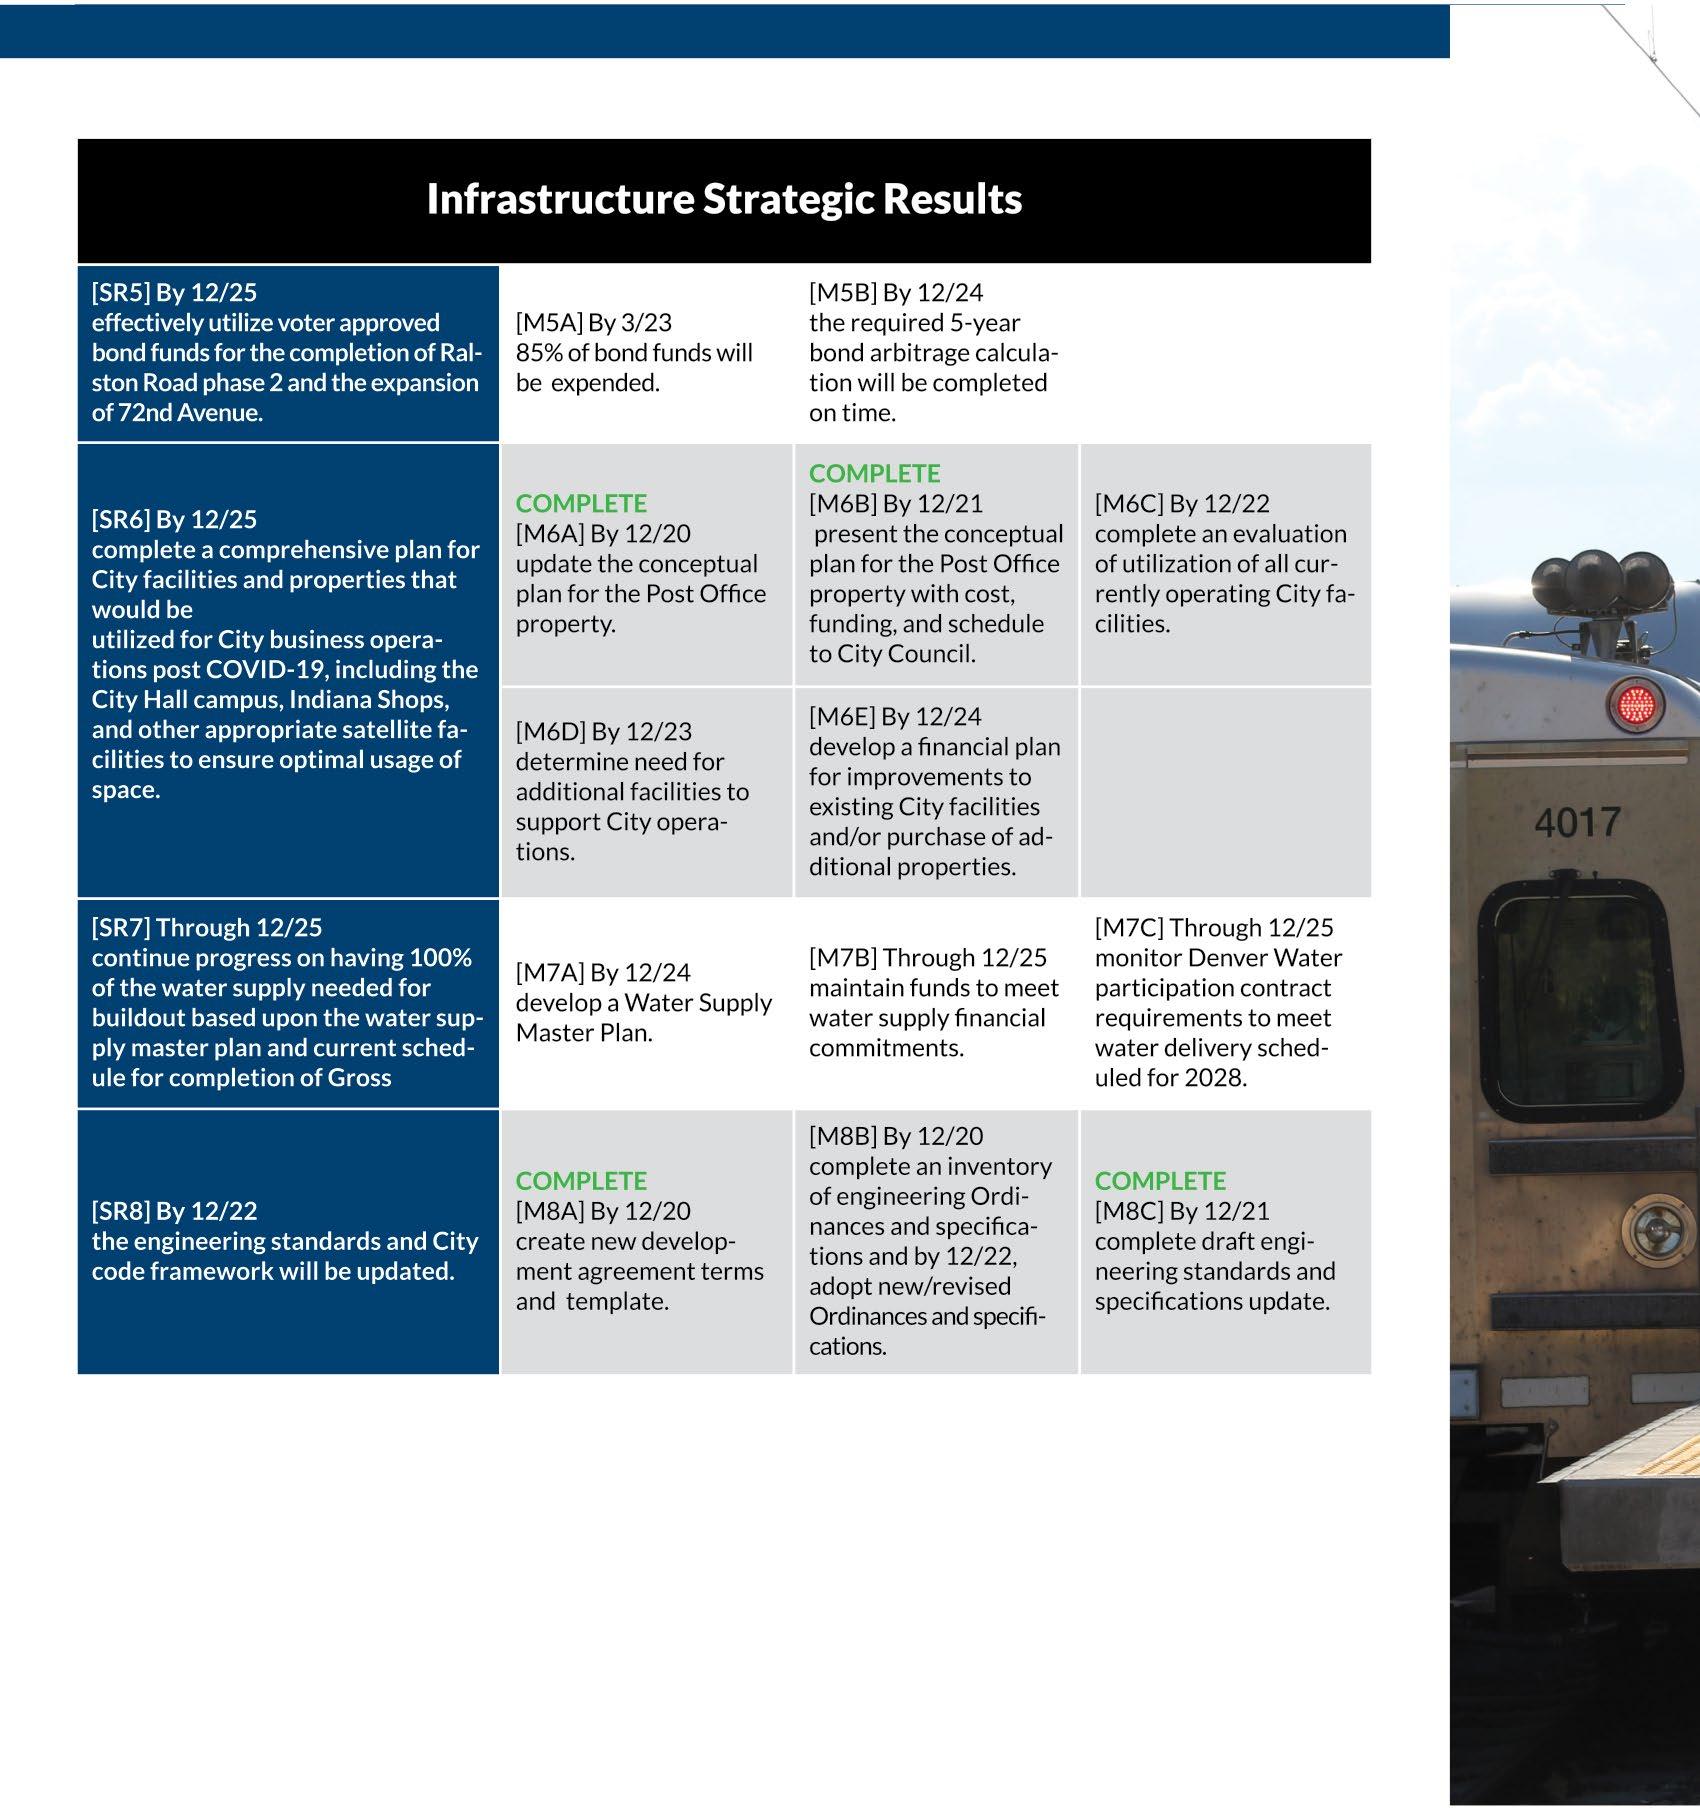
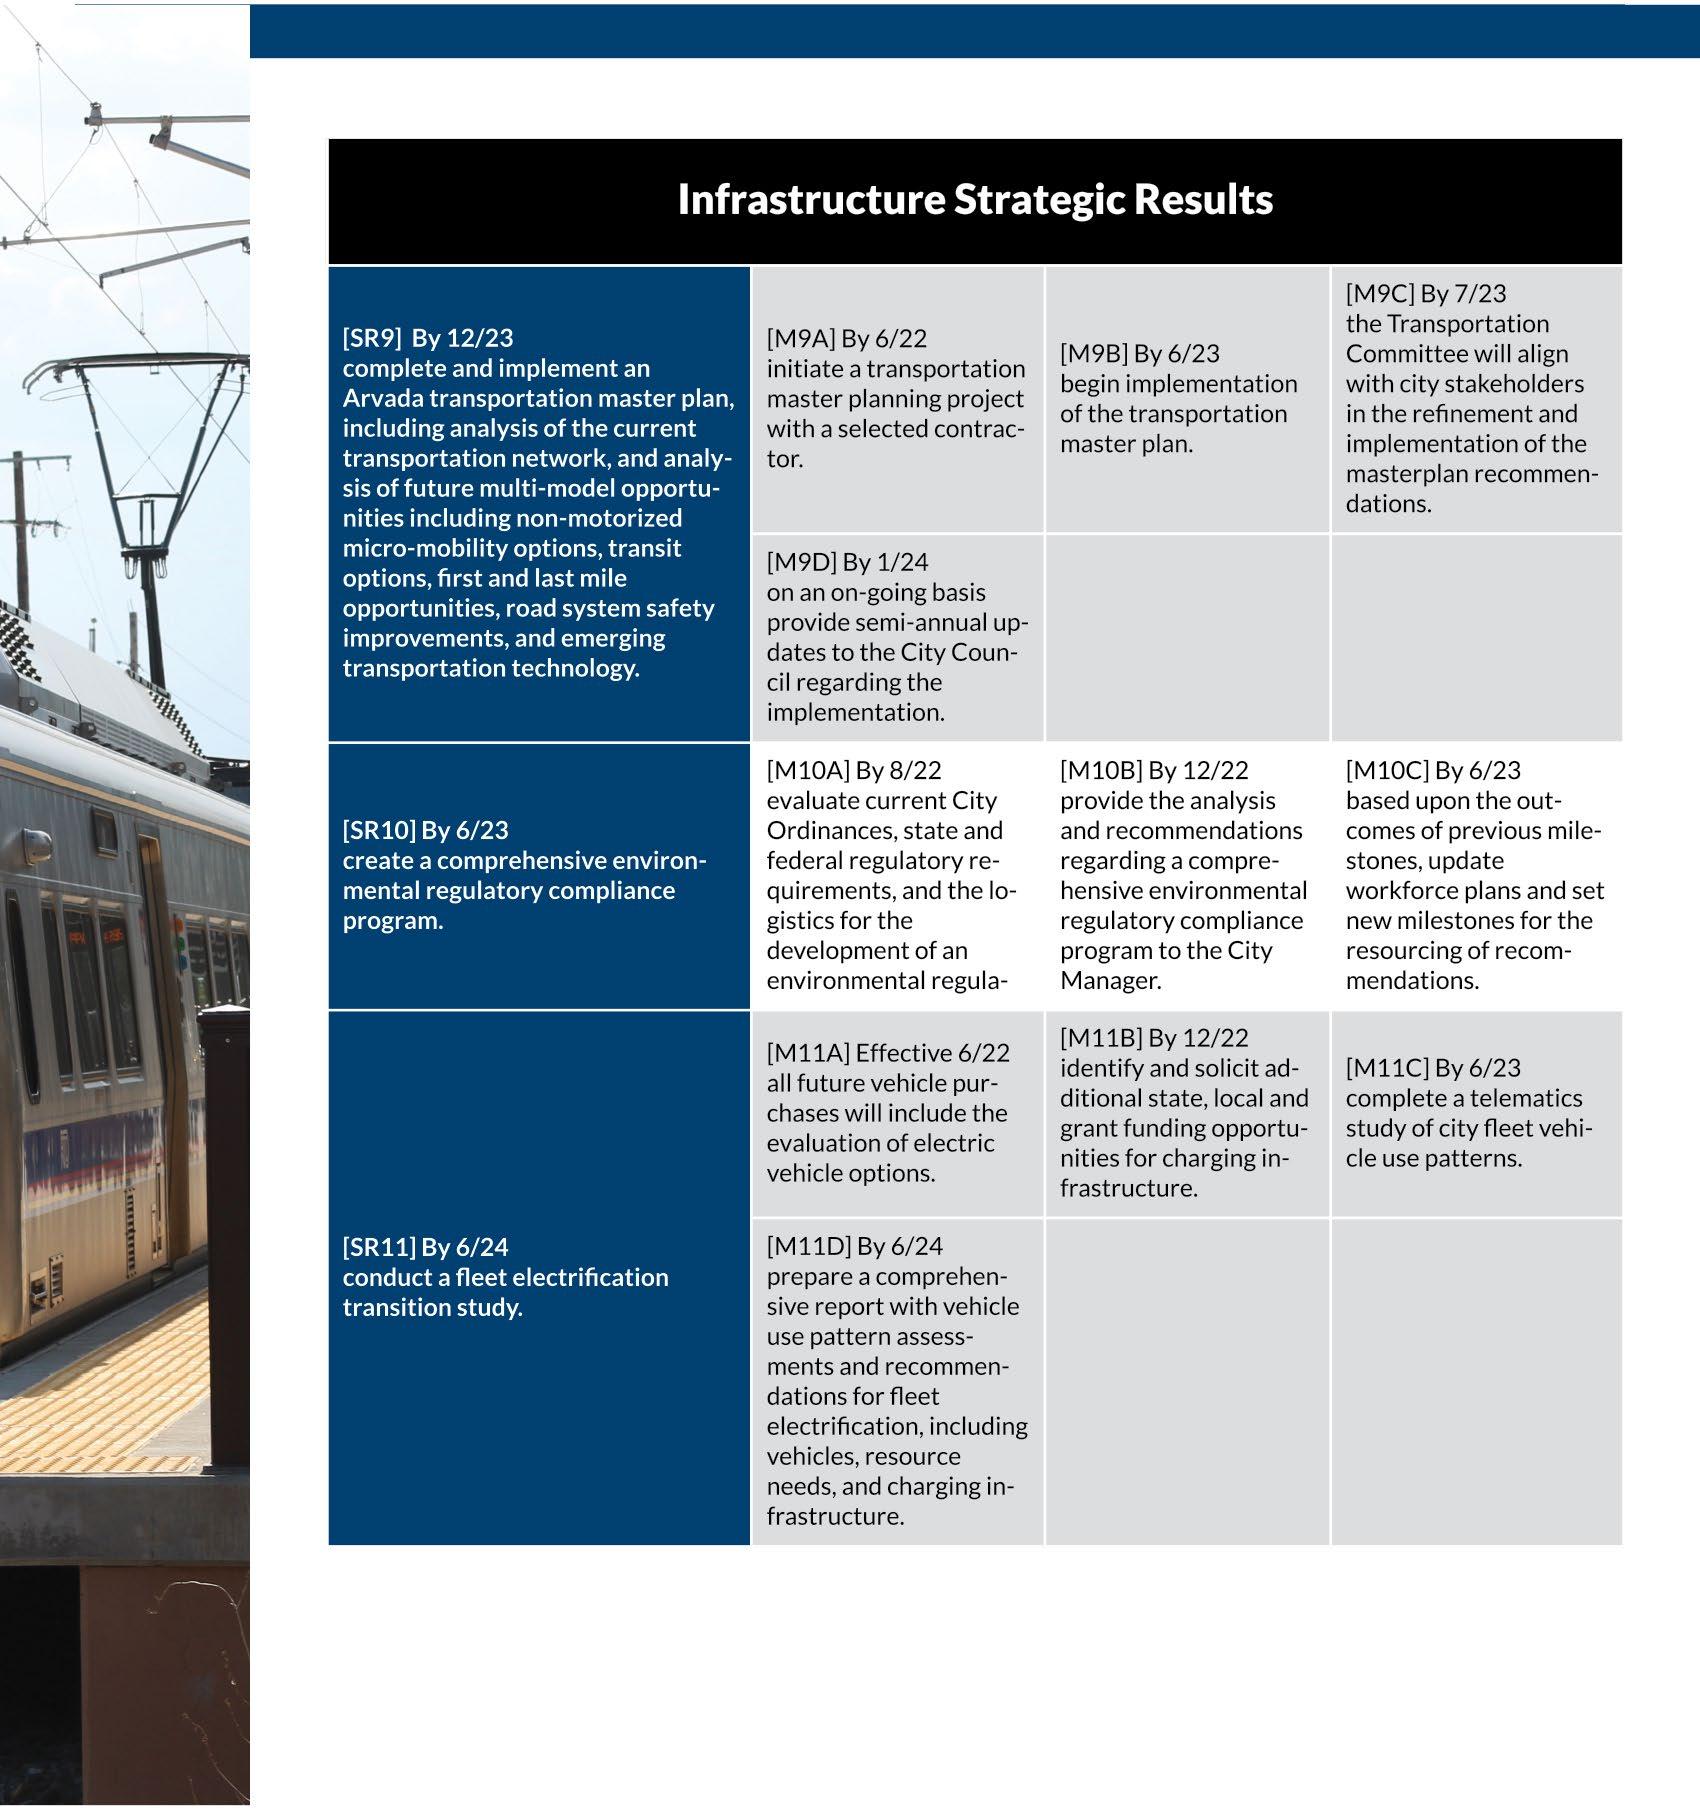
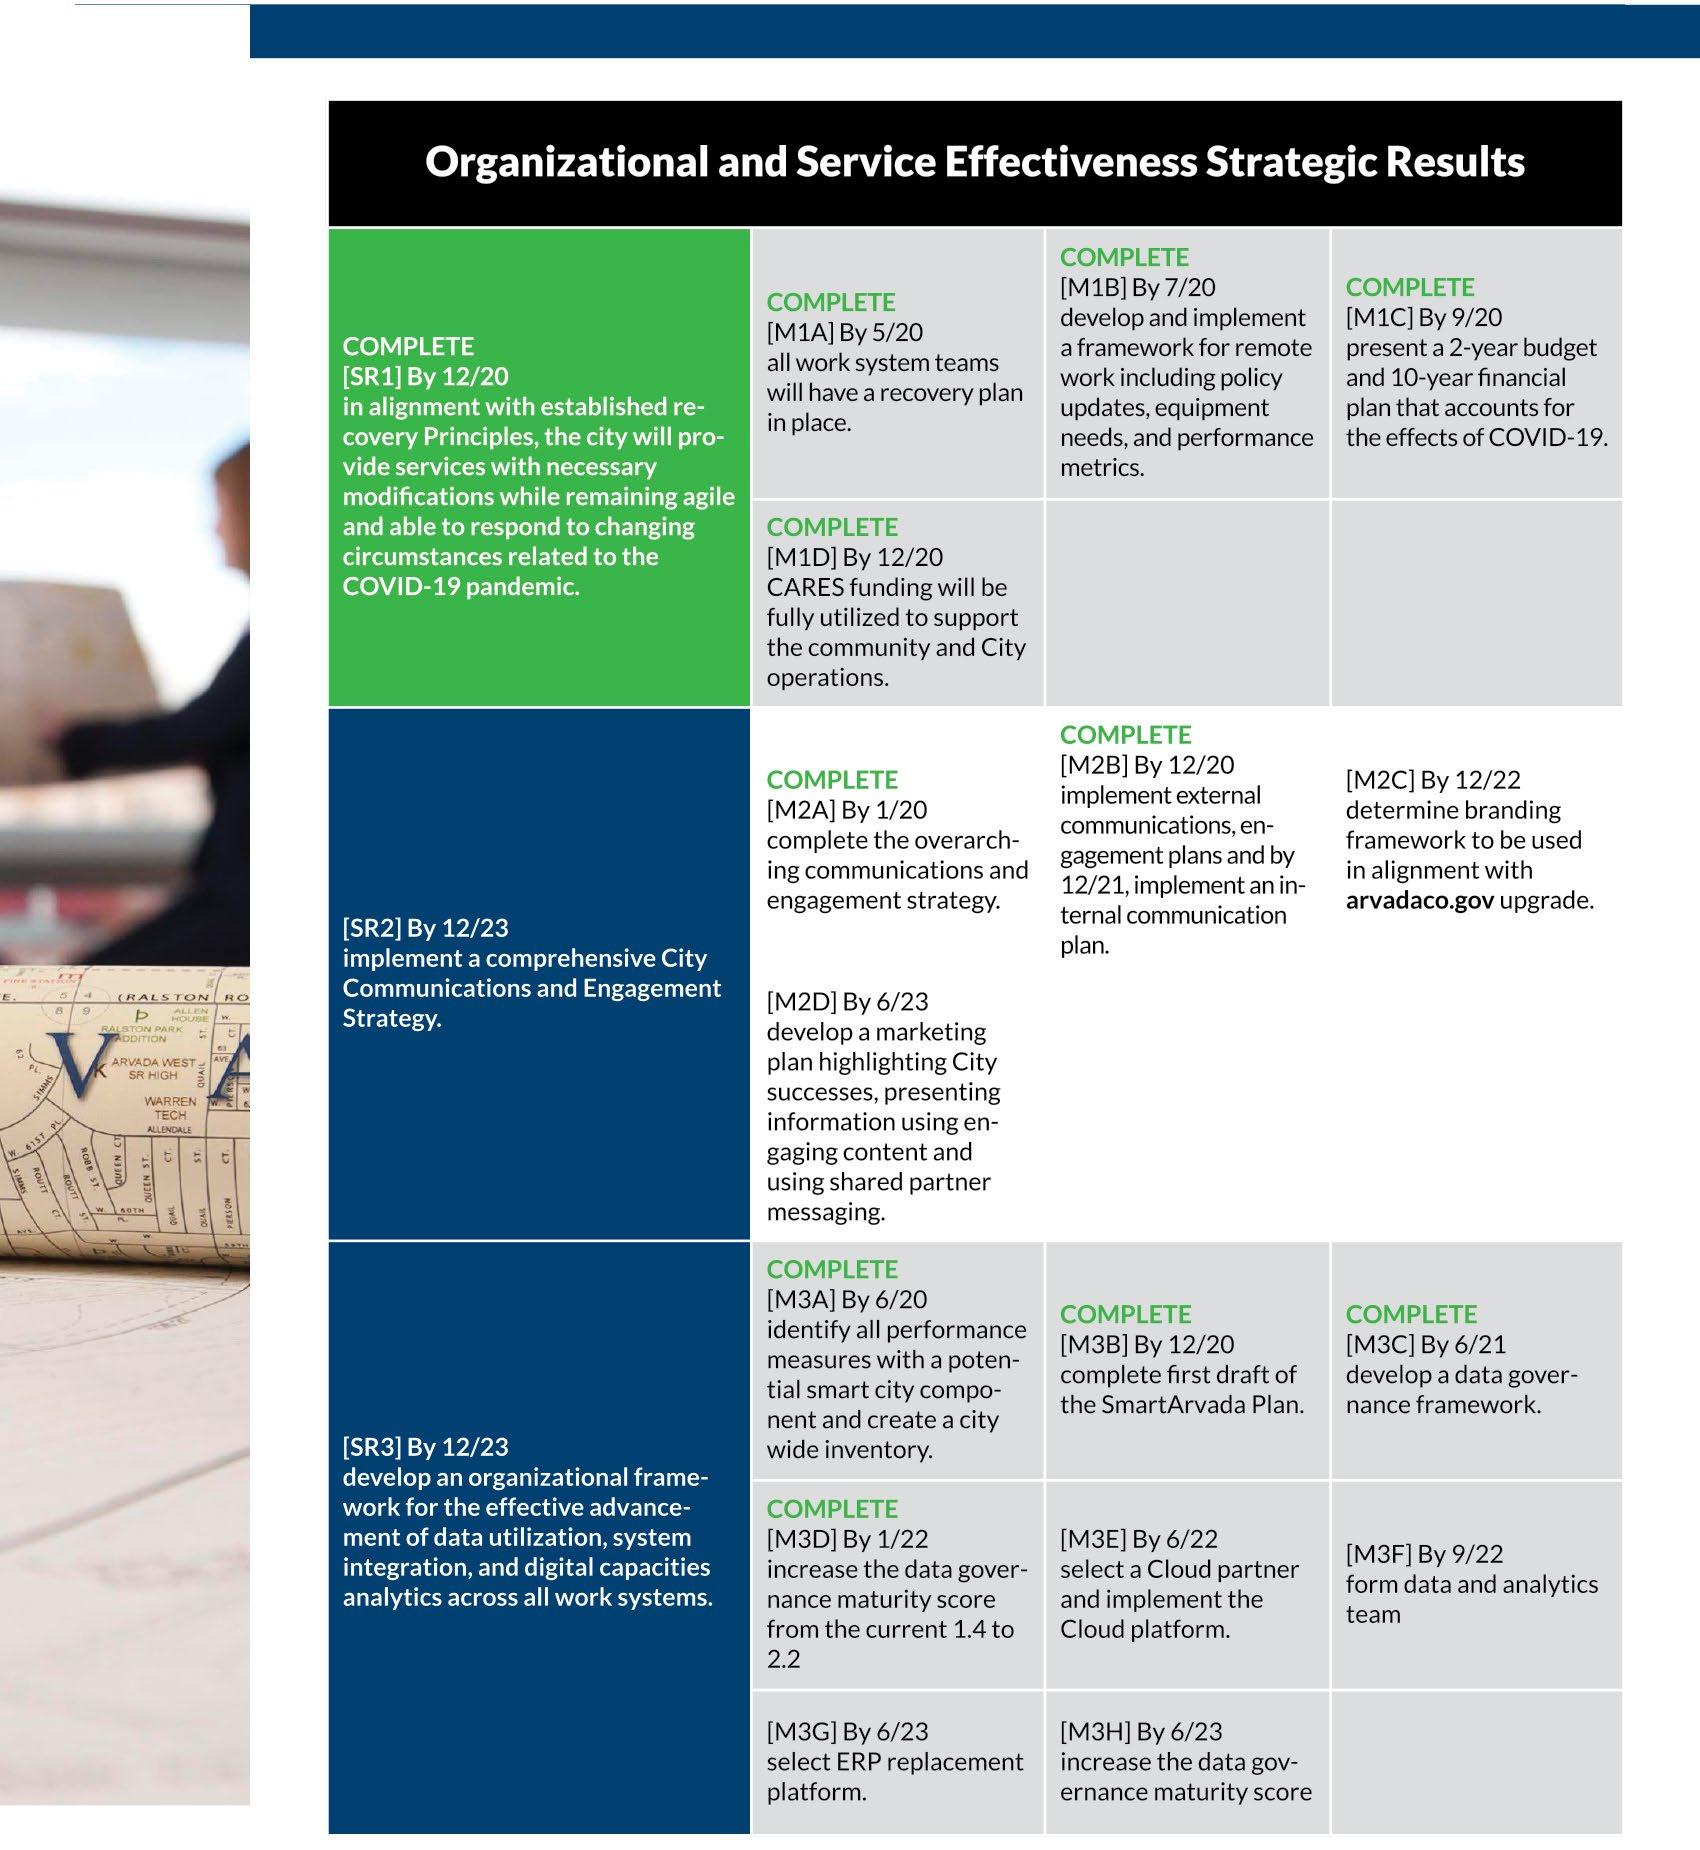
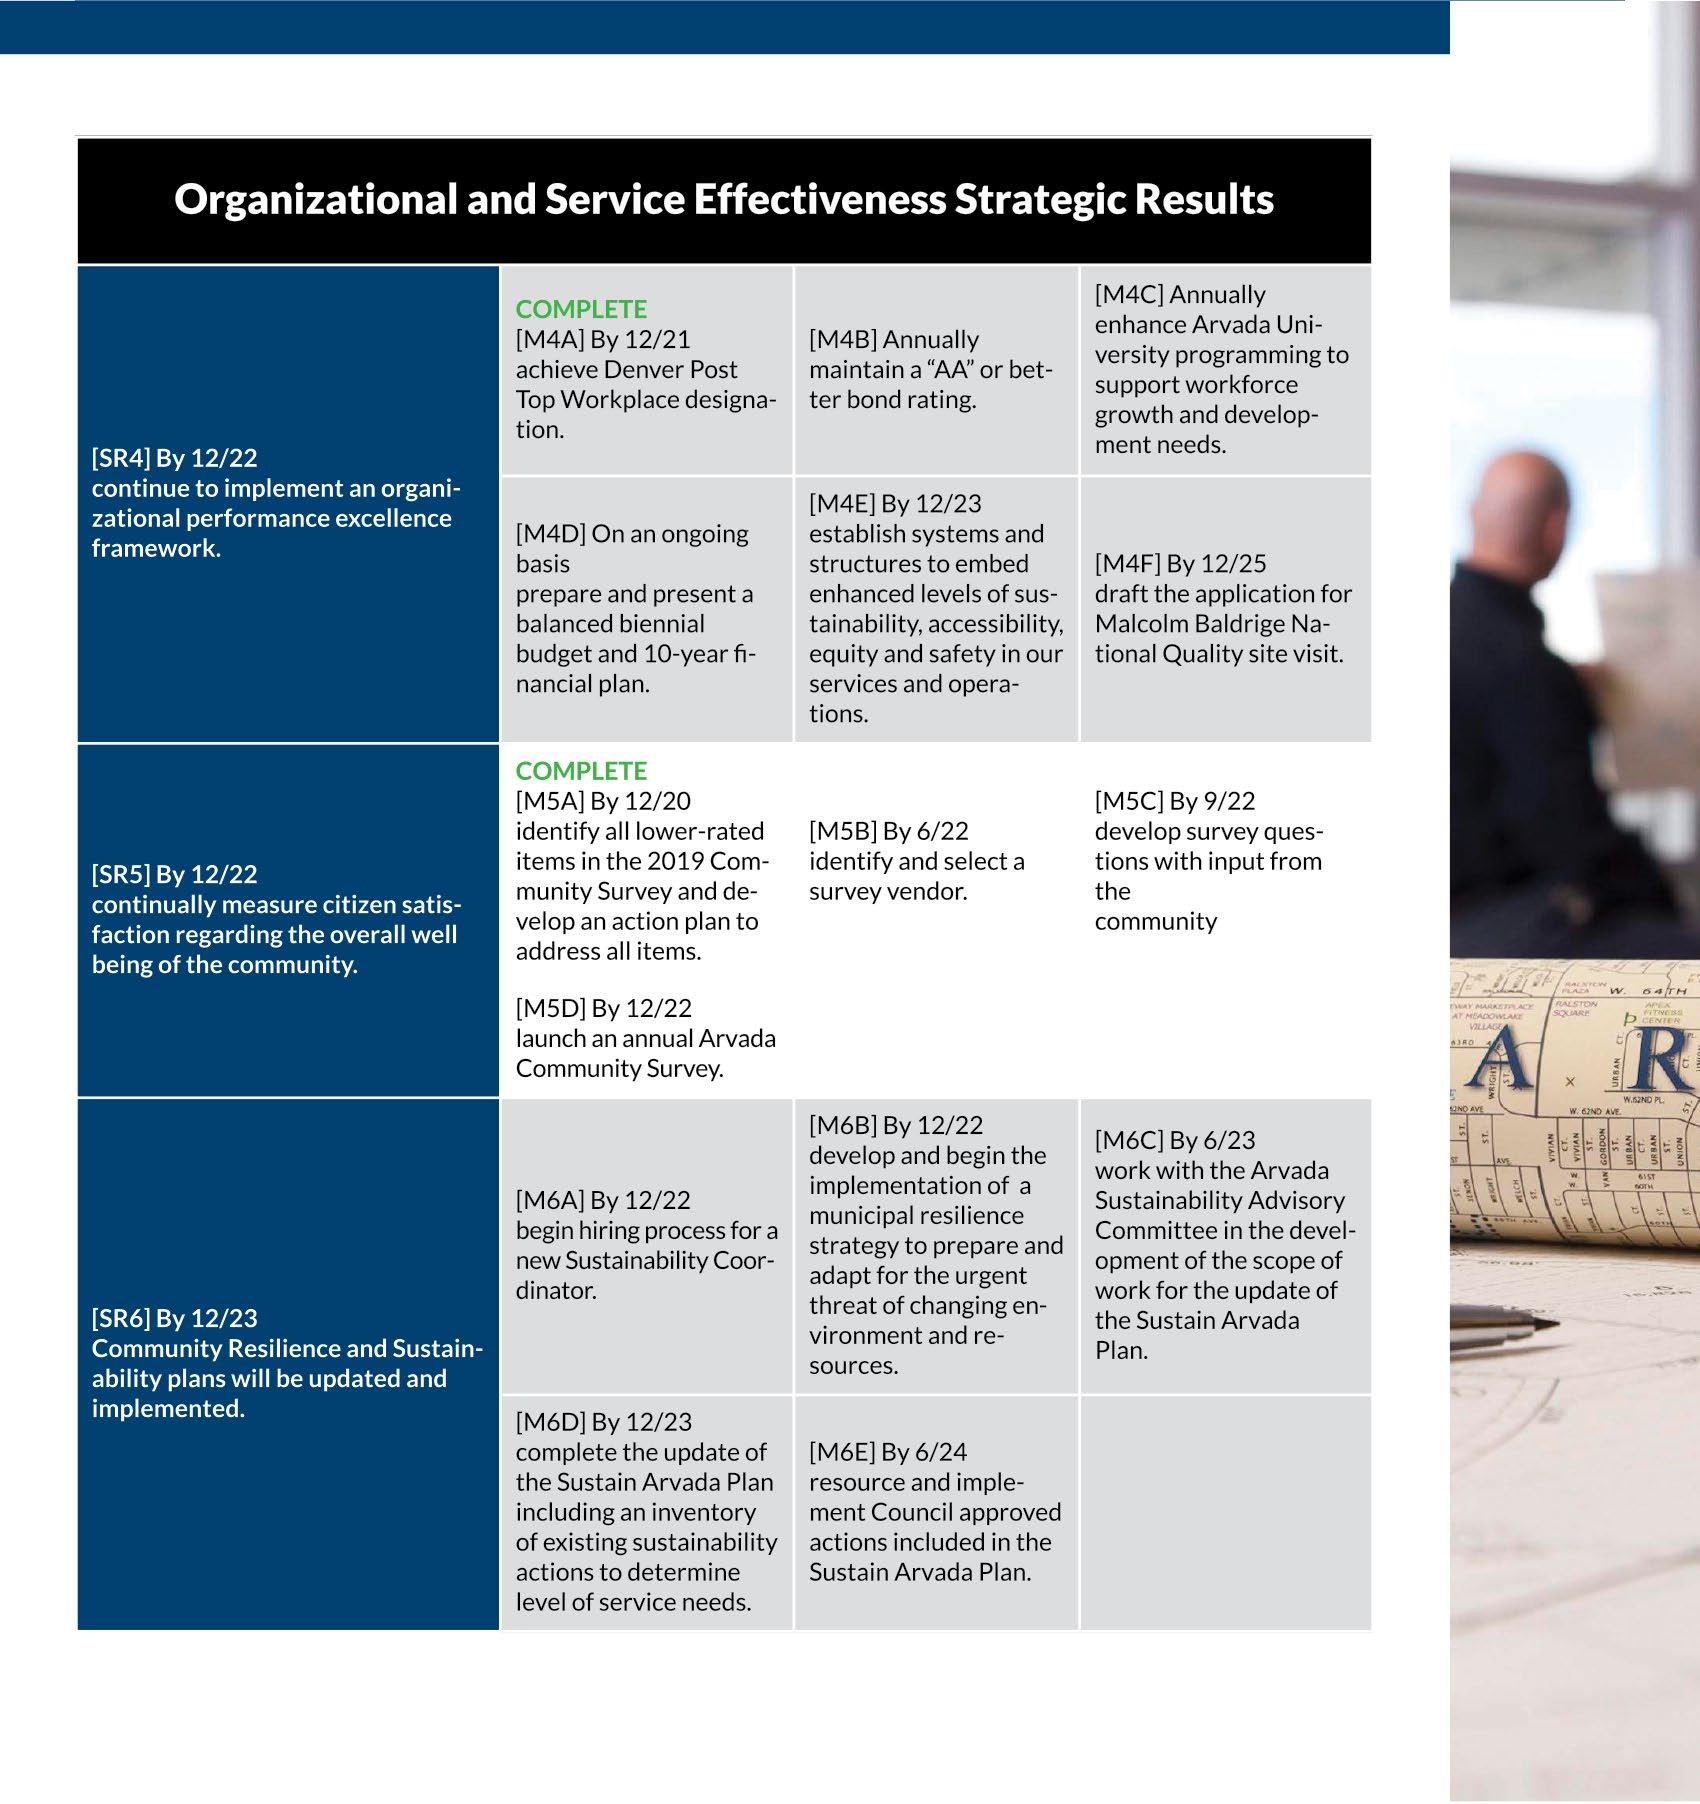
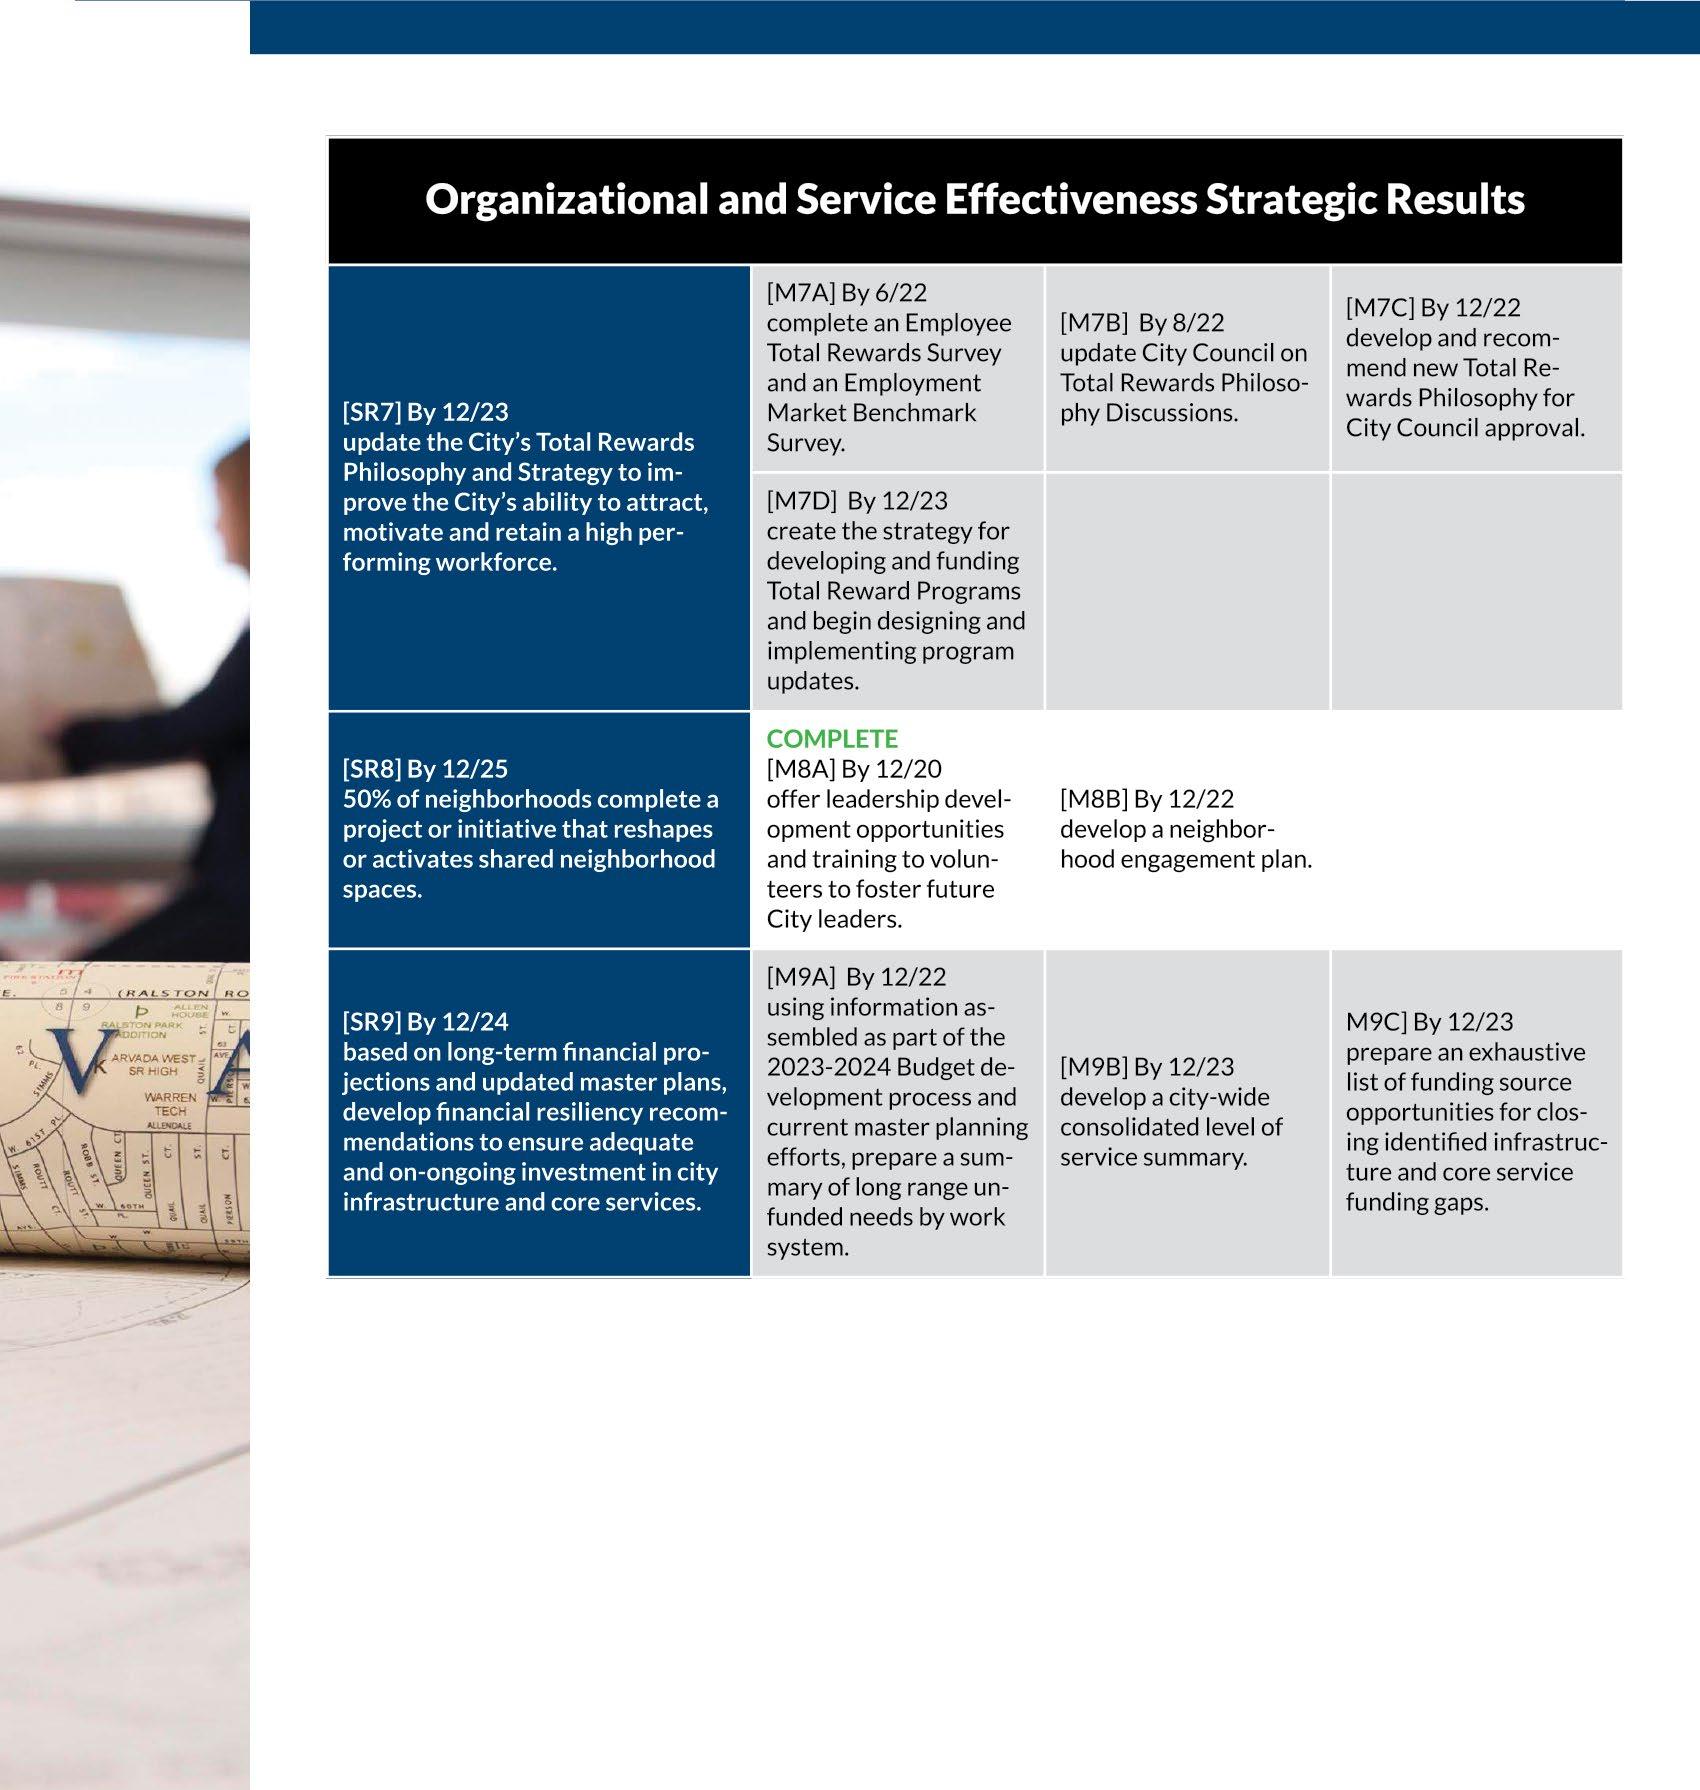
• Strategic Results defined as specific and measurable objectives directed by the City Council that provide guidance in supporting priorities and organizational transformation;
• Milestones defined as significant events or important achievements that indicate change or progress toward a strategic result; and
• Performance Measures that utilize the Specific, Measurable, Achievable, Relevant and TimeBased (SMART) goal framework to help focus our efforts and achieve the identified targets.
The Strategic Planning framework defines the performance management process that creates alignment between the City Council Strategic Plan and the day-to-day work accomplished by Arvada team members. Specifically, performance management implemented through this framework seeks to:
• Connect City Council Strategic Results to individual performance goals;
• Drive decisions and change used to inform budgets, set priorities and allocate resources;
• Hold all City team members accountable for achieving results; and
• Define value and transparency.
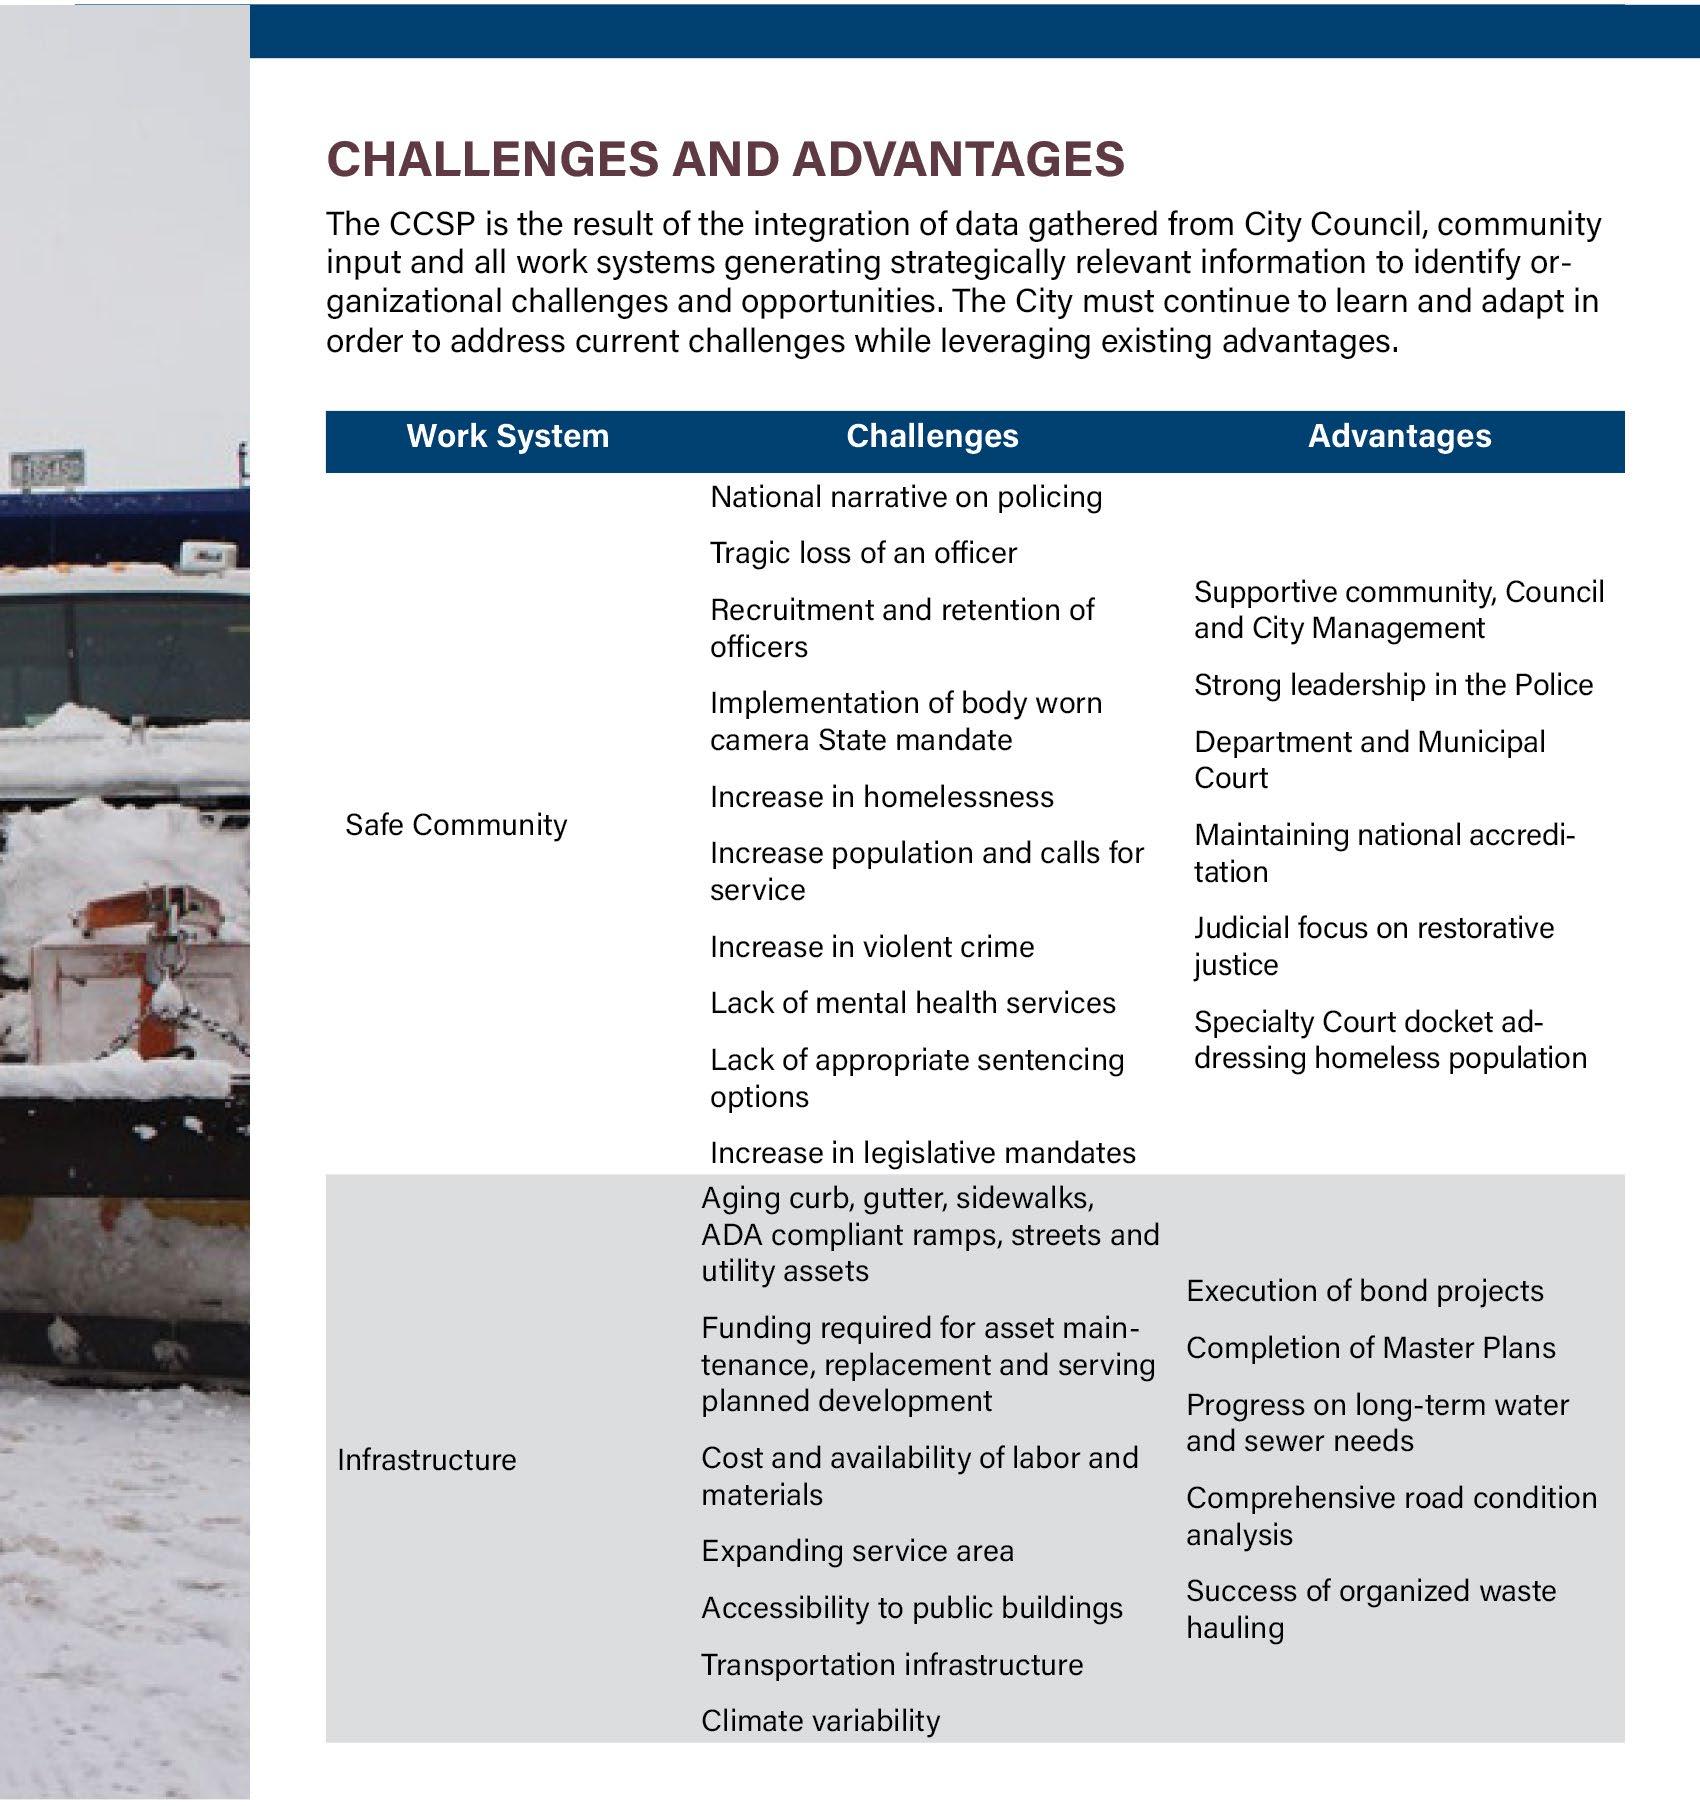
As stated herein, the work implemented by the City team is organized into five work systems that align to the Priority Areas, which are defined in the City Council Strategic Plan. The following information de scribes the purpose of each work system and lists their associated lines of business:
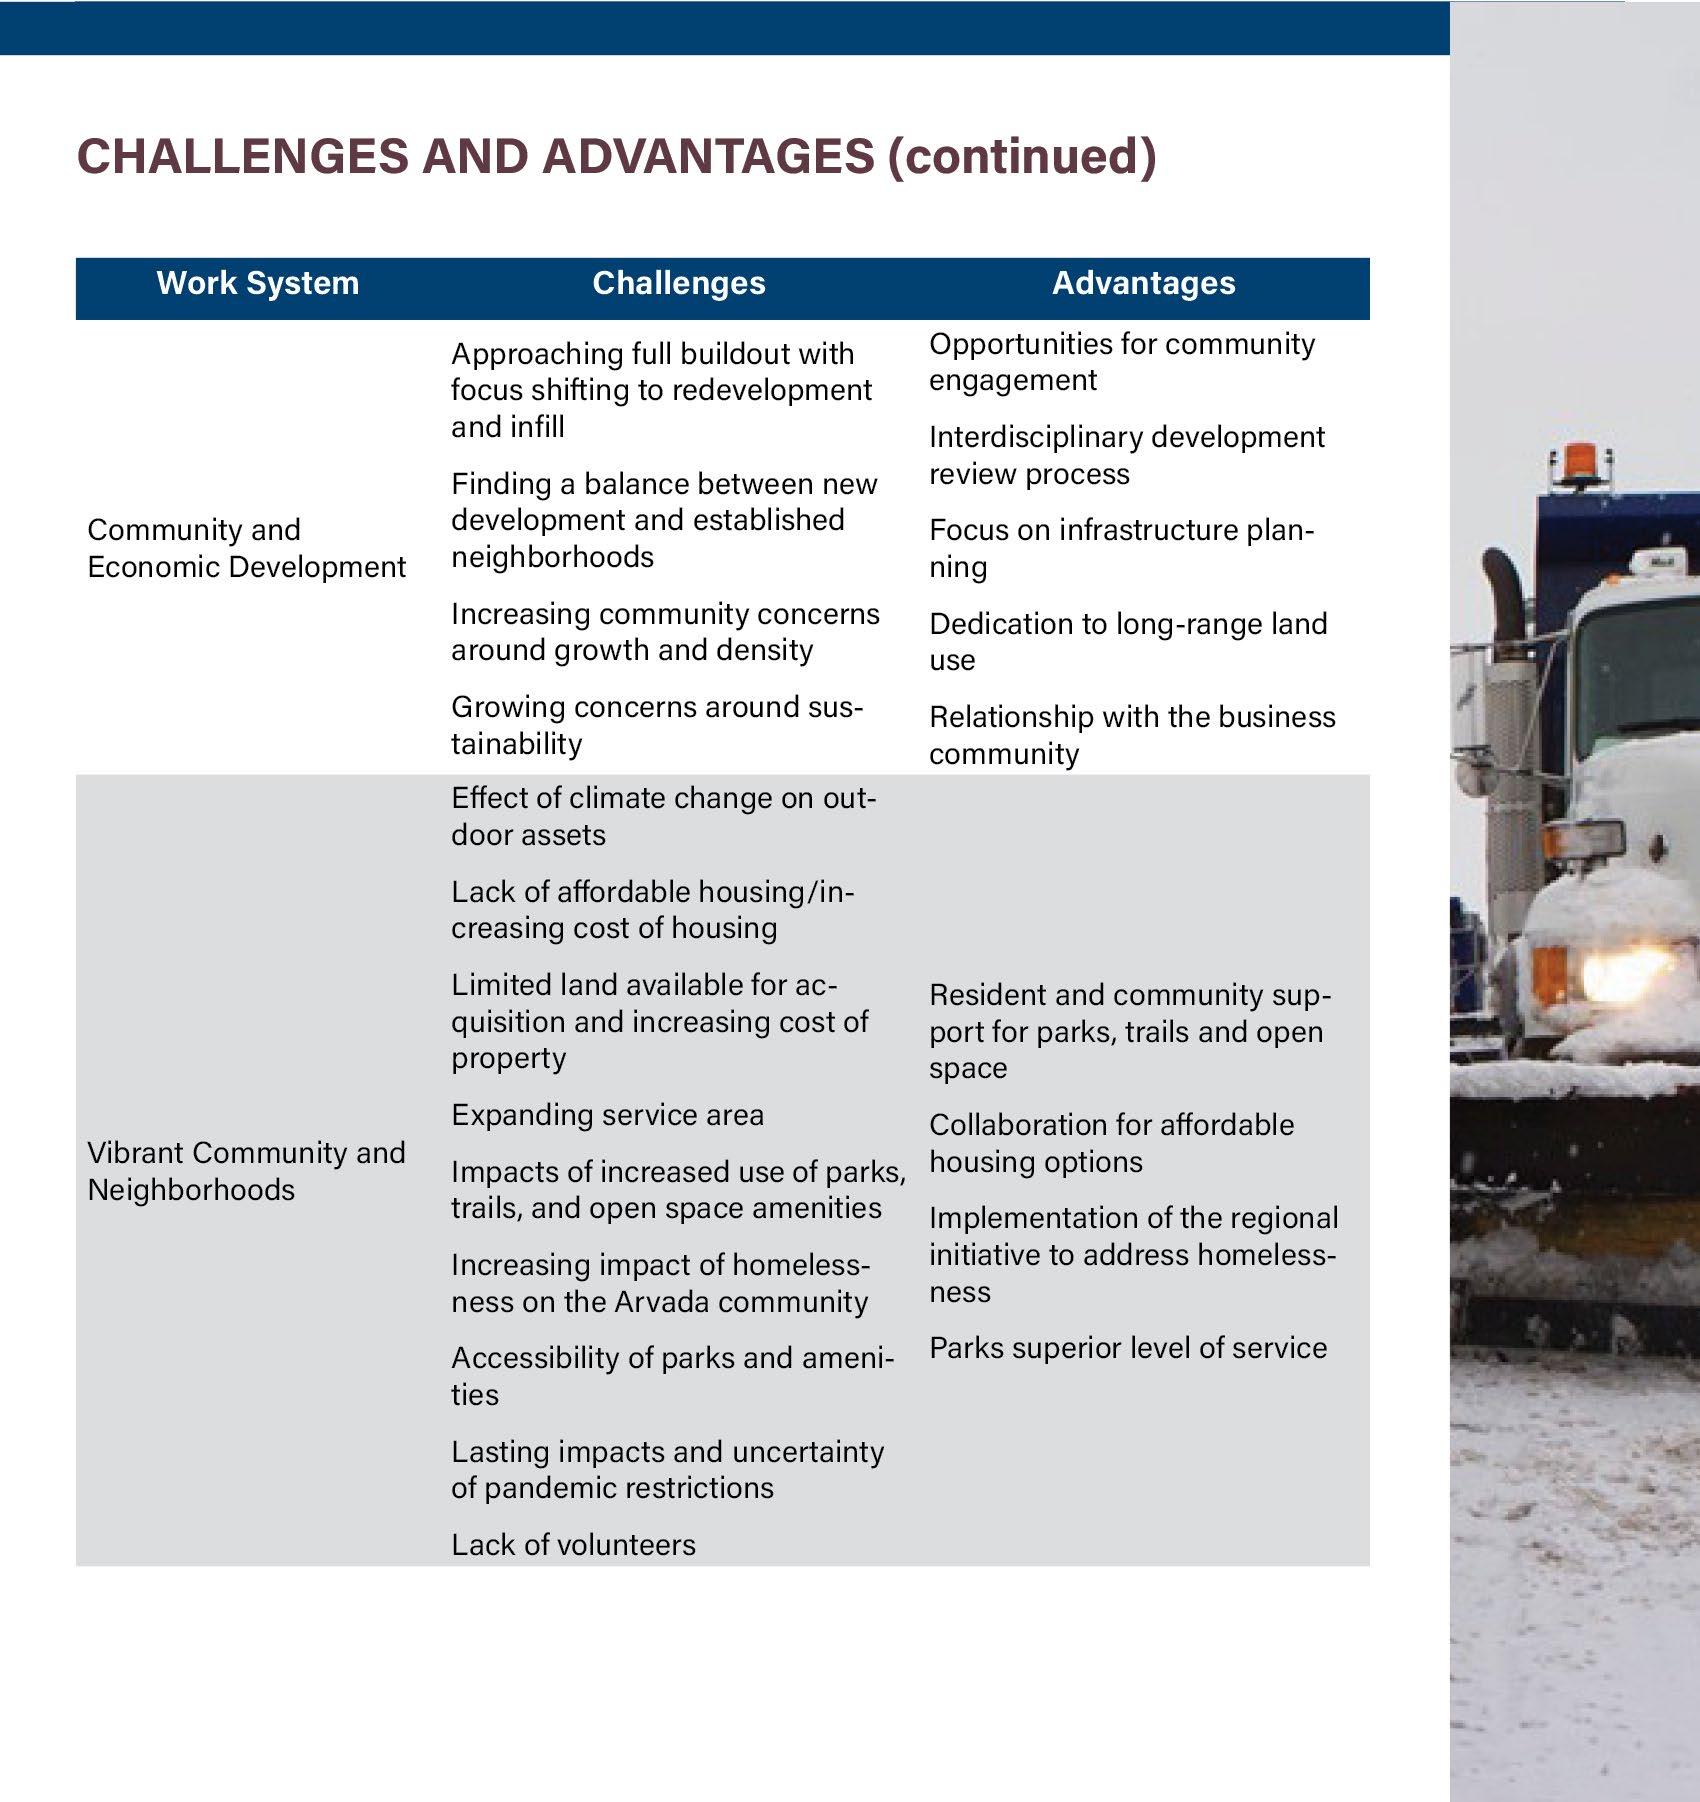
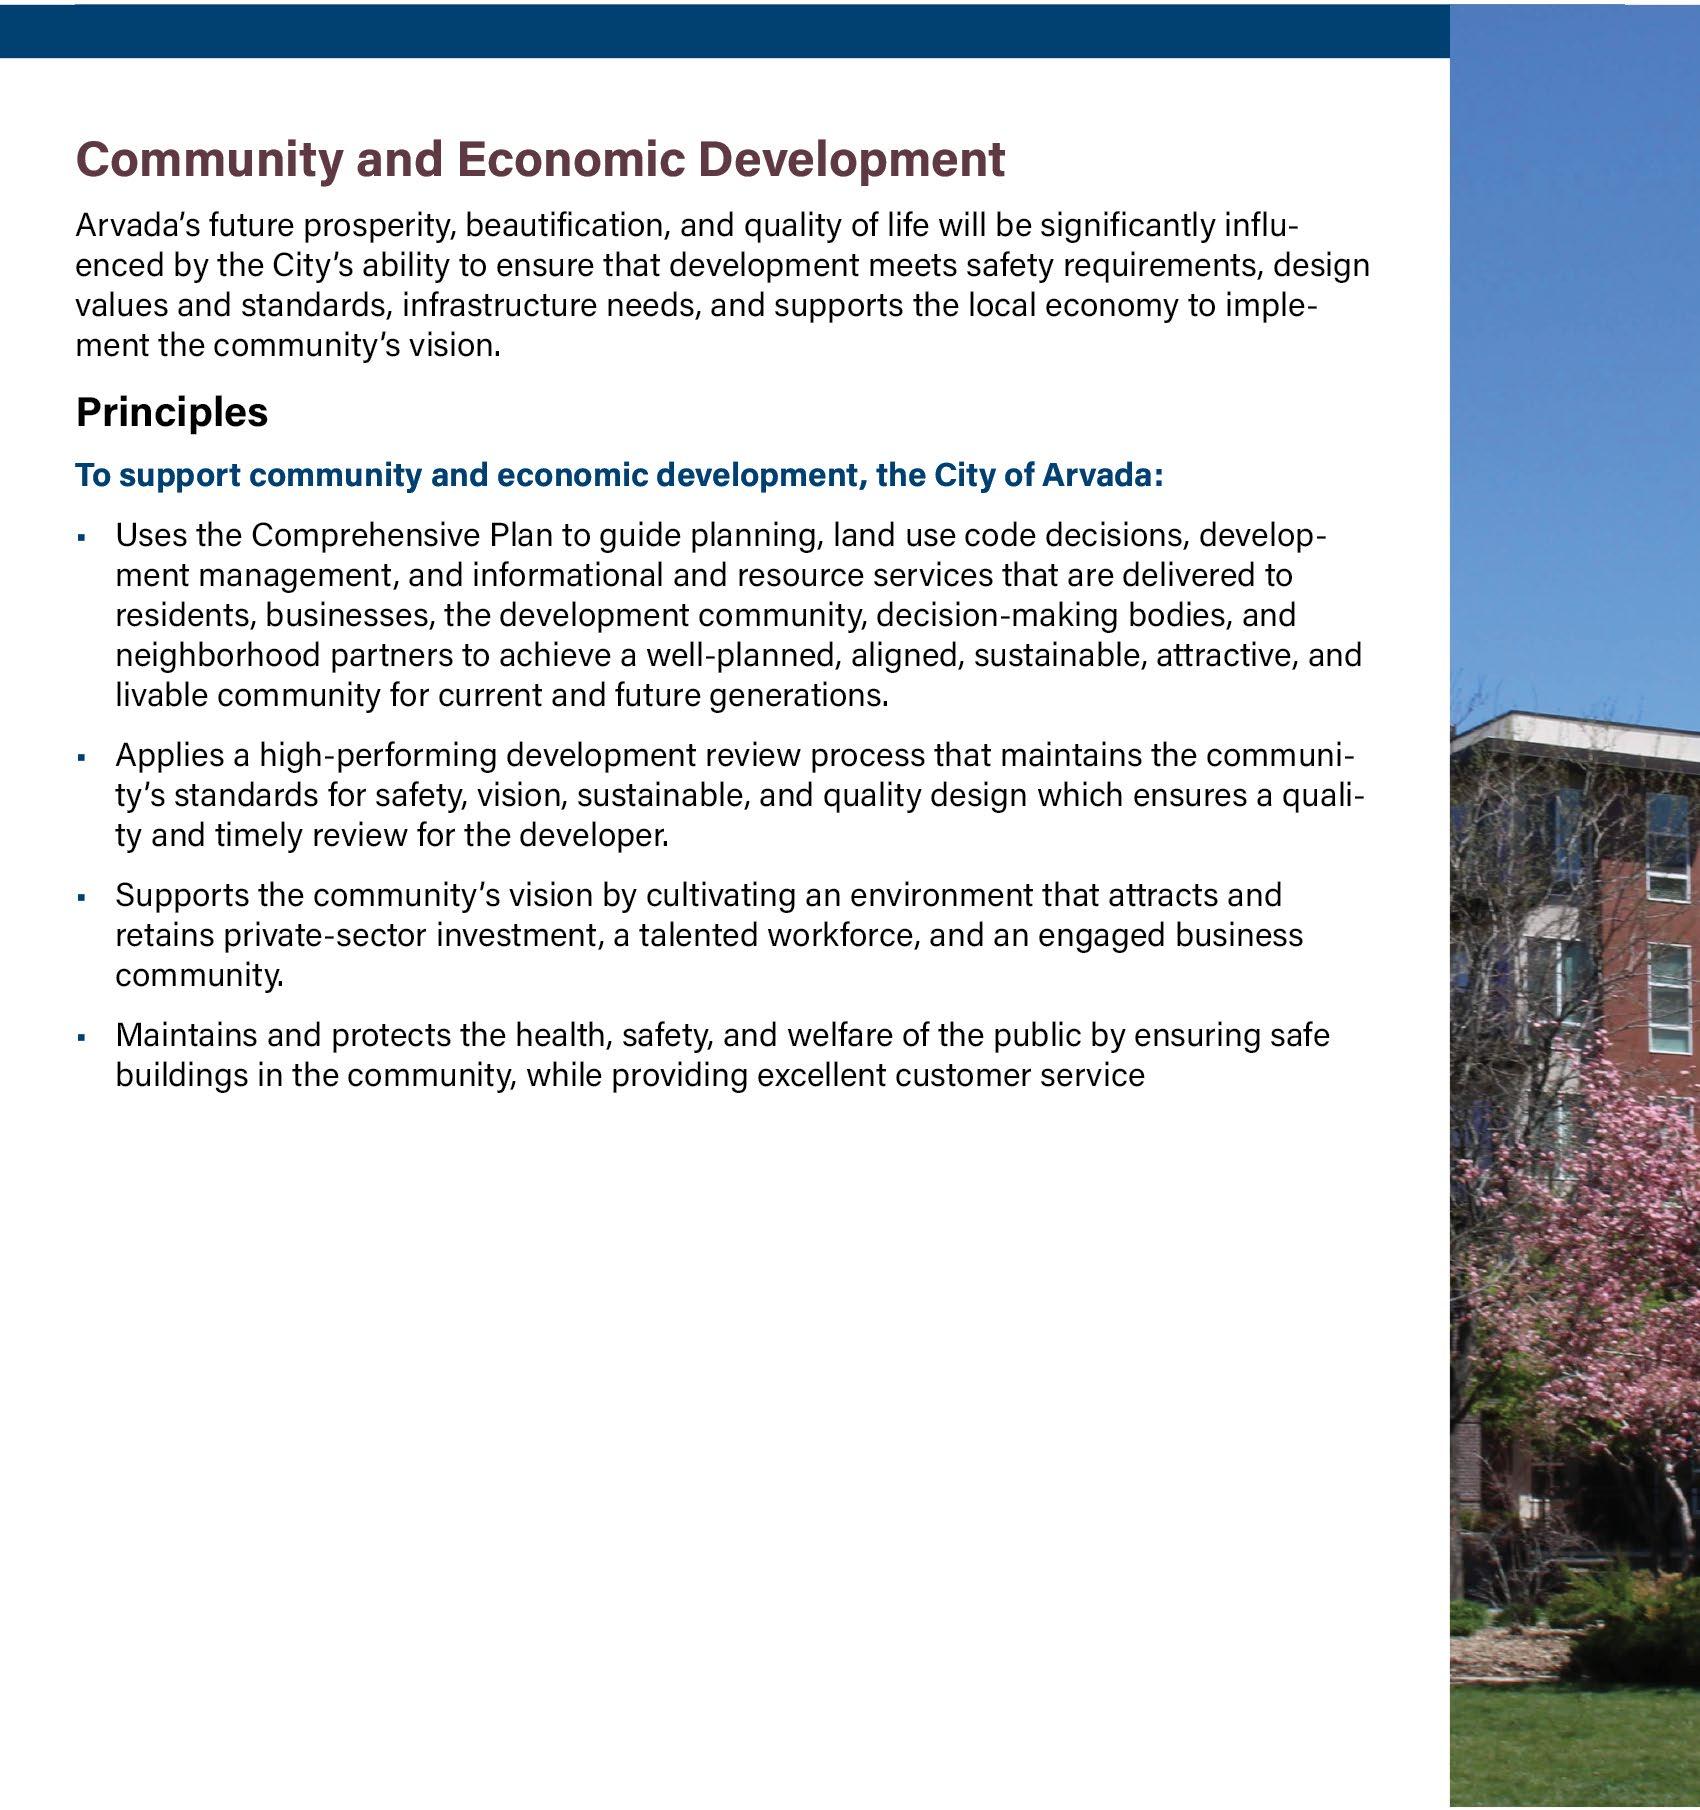
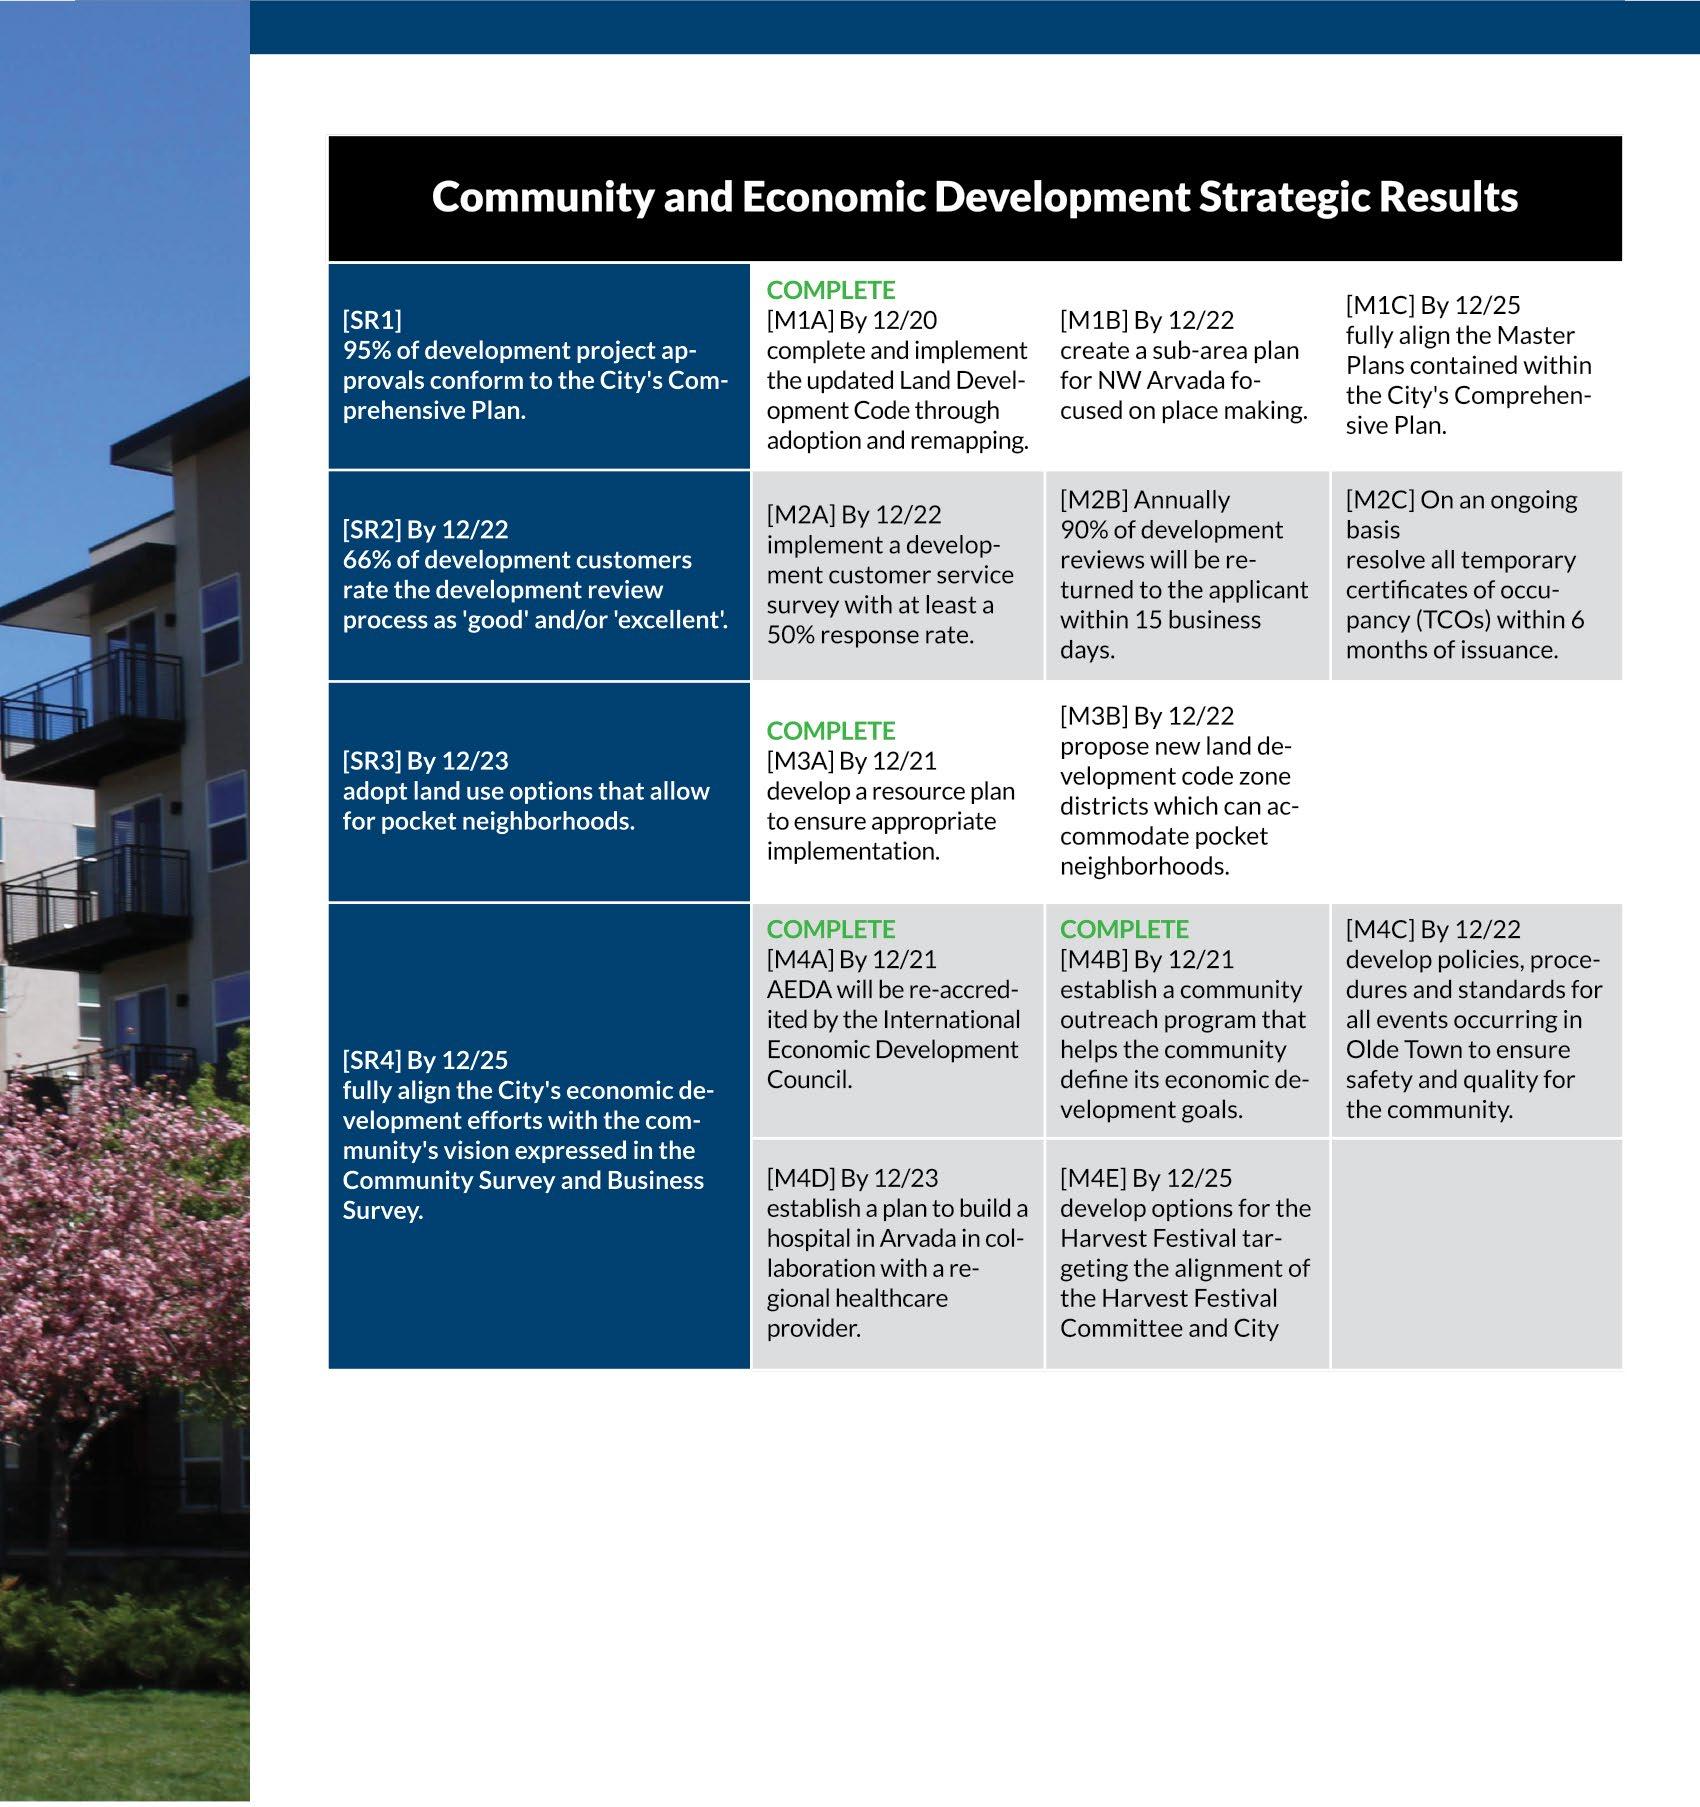
The purpose statement for the Community and Economic Development Strategic Plan Priority Area and Work System is: Arvada’s future prosperity and quality of life will be significantly influenced by the City’s ability to ensure that development meets design values and standards, safety requirements, infra structure needs, and supports the local economy to implement the community’s vision.
Associated lines of business include Building, Economic Development, Development Review, Long Range Planning and Housing Preservation and Resources
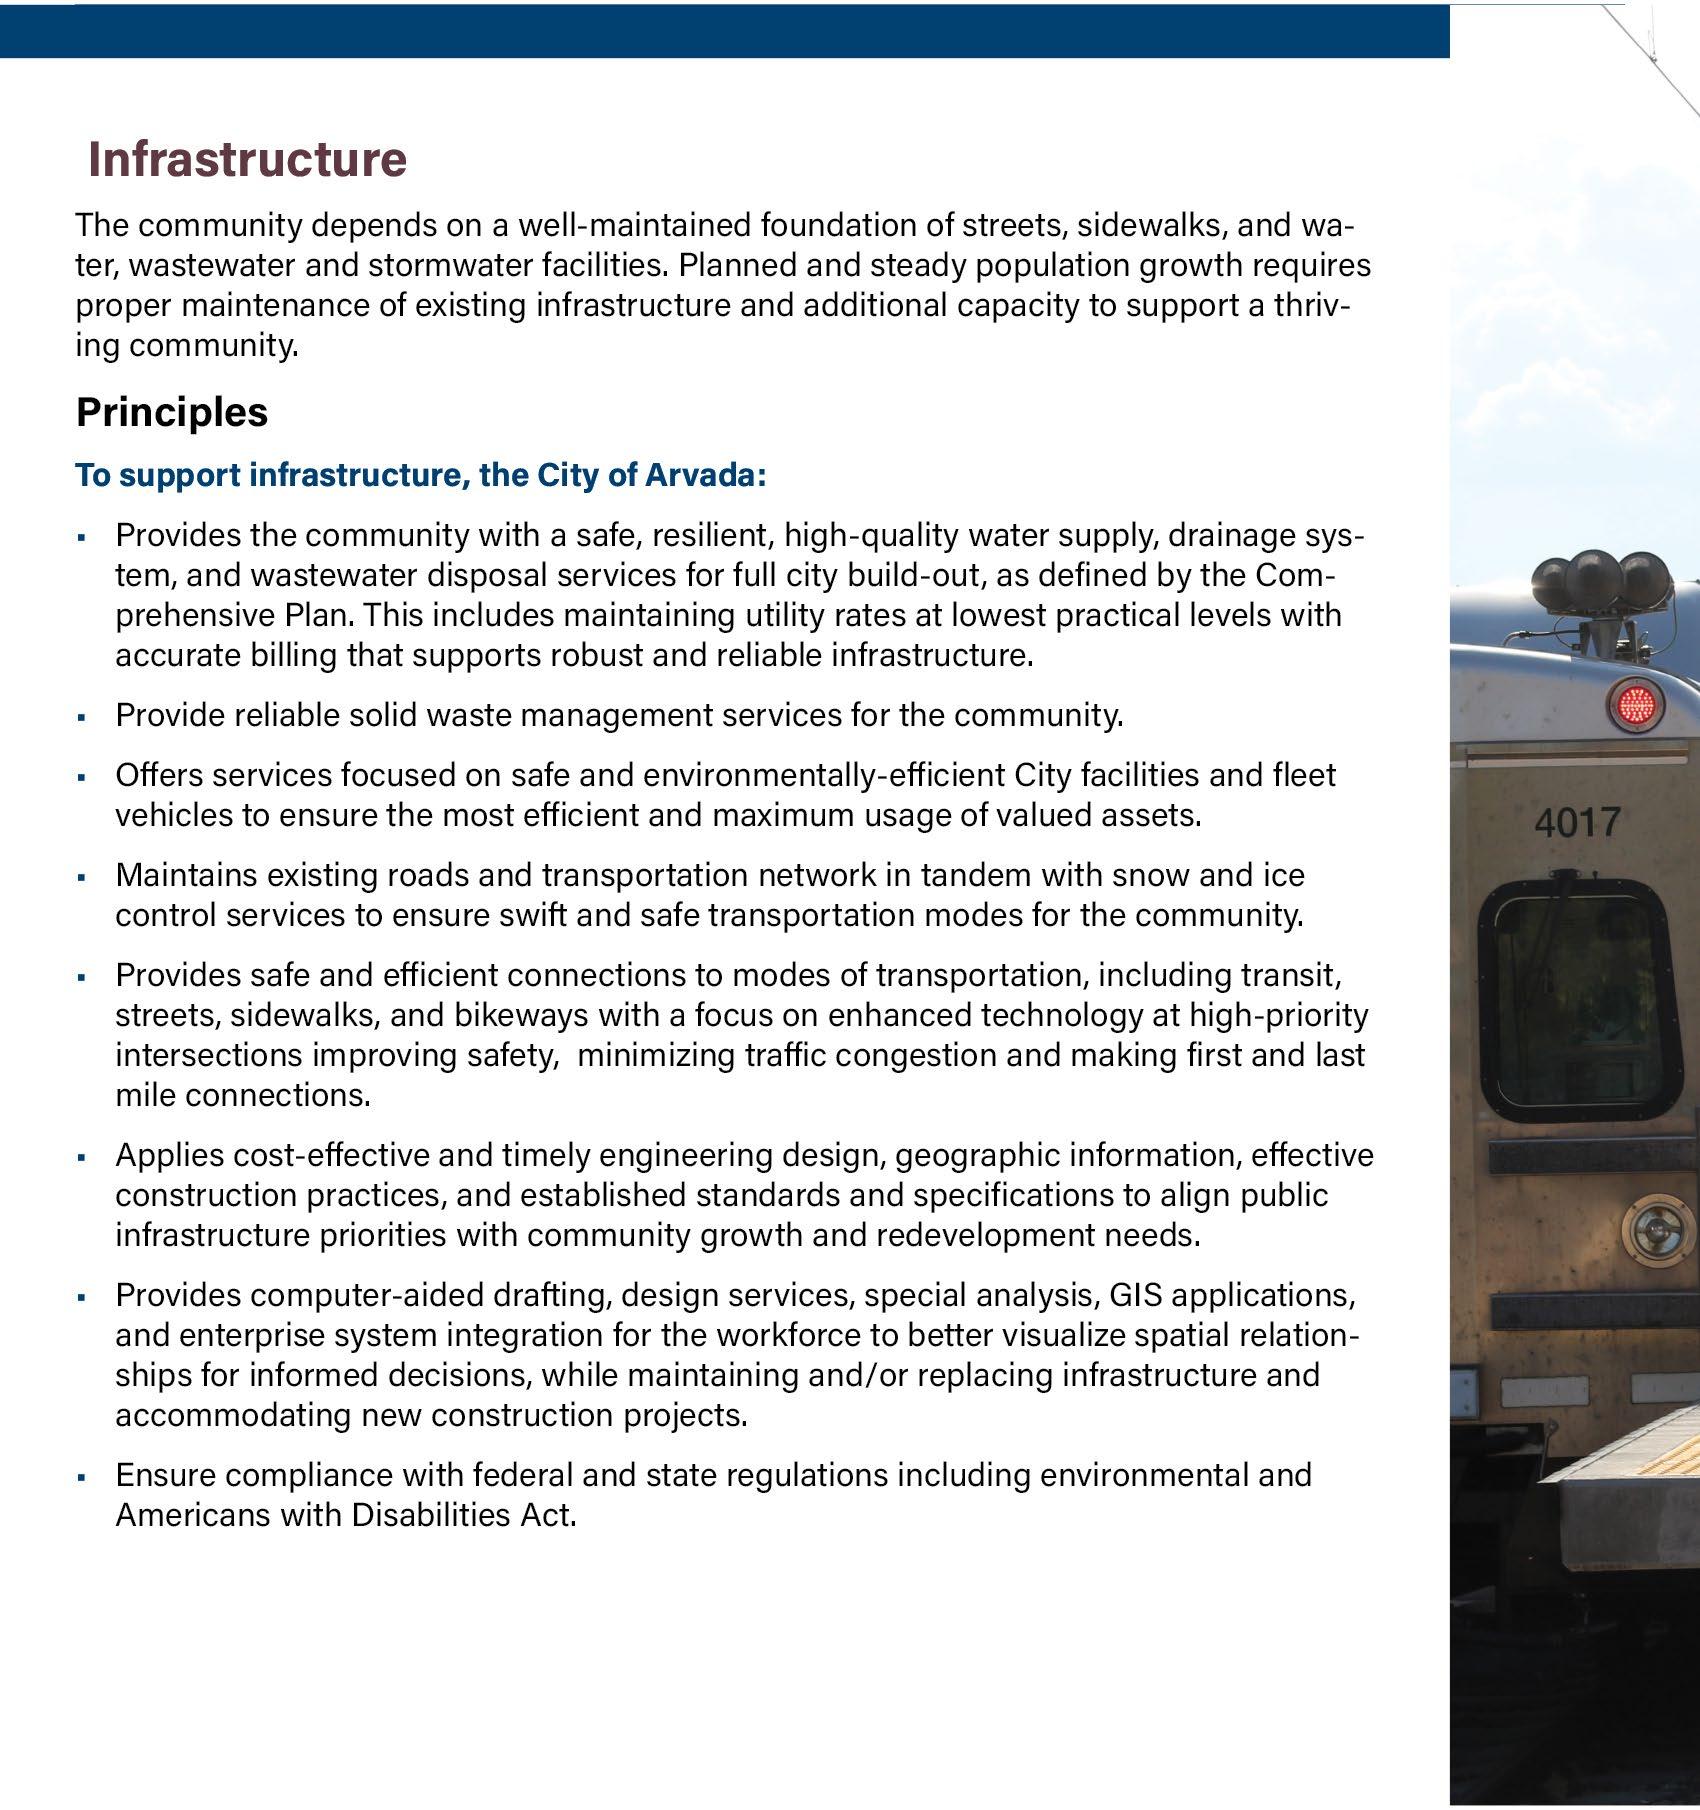
The purpose statement for the Infrastructure Strategic Plan Priority Area and Work System is: The community depends on a well maintained foundation of streets, sidewalks, and water, wastewater and stormwater facilities. Planned and steady population growth requires proper maintenance of existing infrastructure and additional capacity to support a thriving community.
Associated lines of business include Engineering, Facilities Management, Fleet Services, Flood Control, Geo Data, Street Infrastructure, Utility Customer Information Services, Wastewater Collection and Disposal, Drinking Water and Solid Waste .
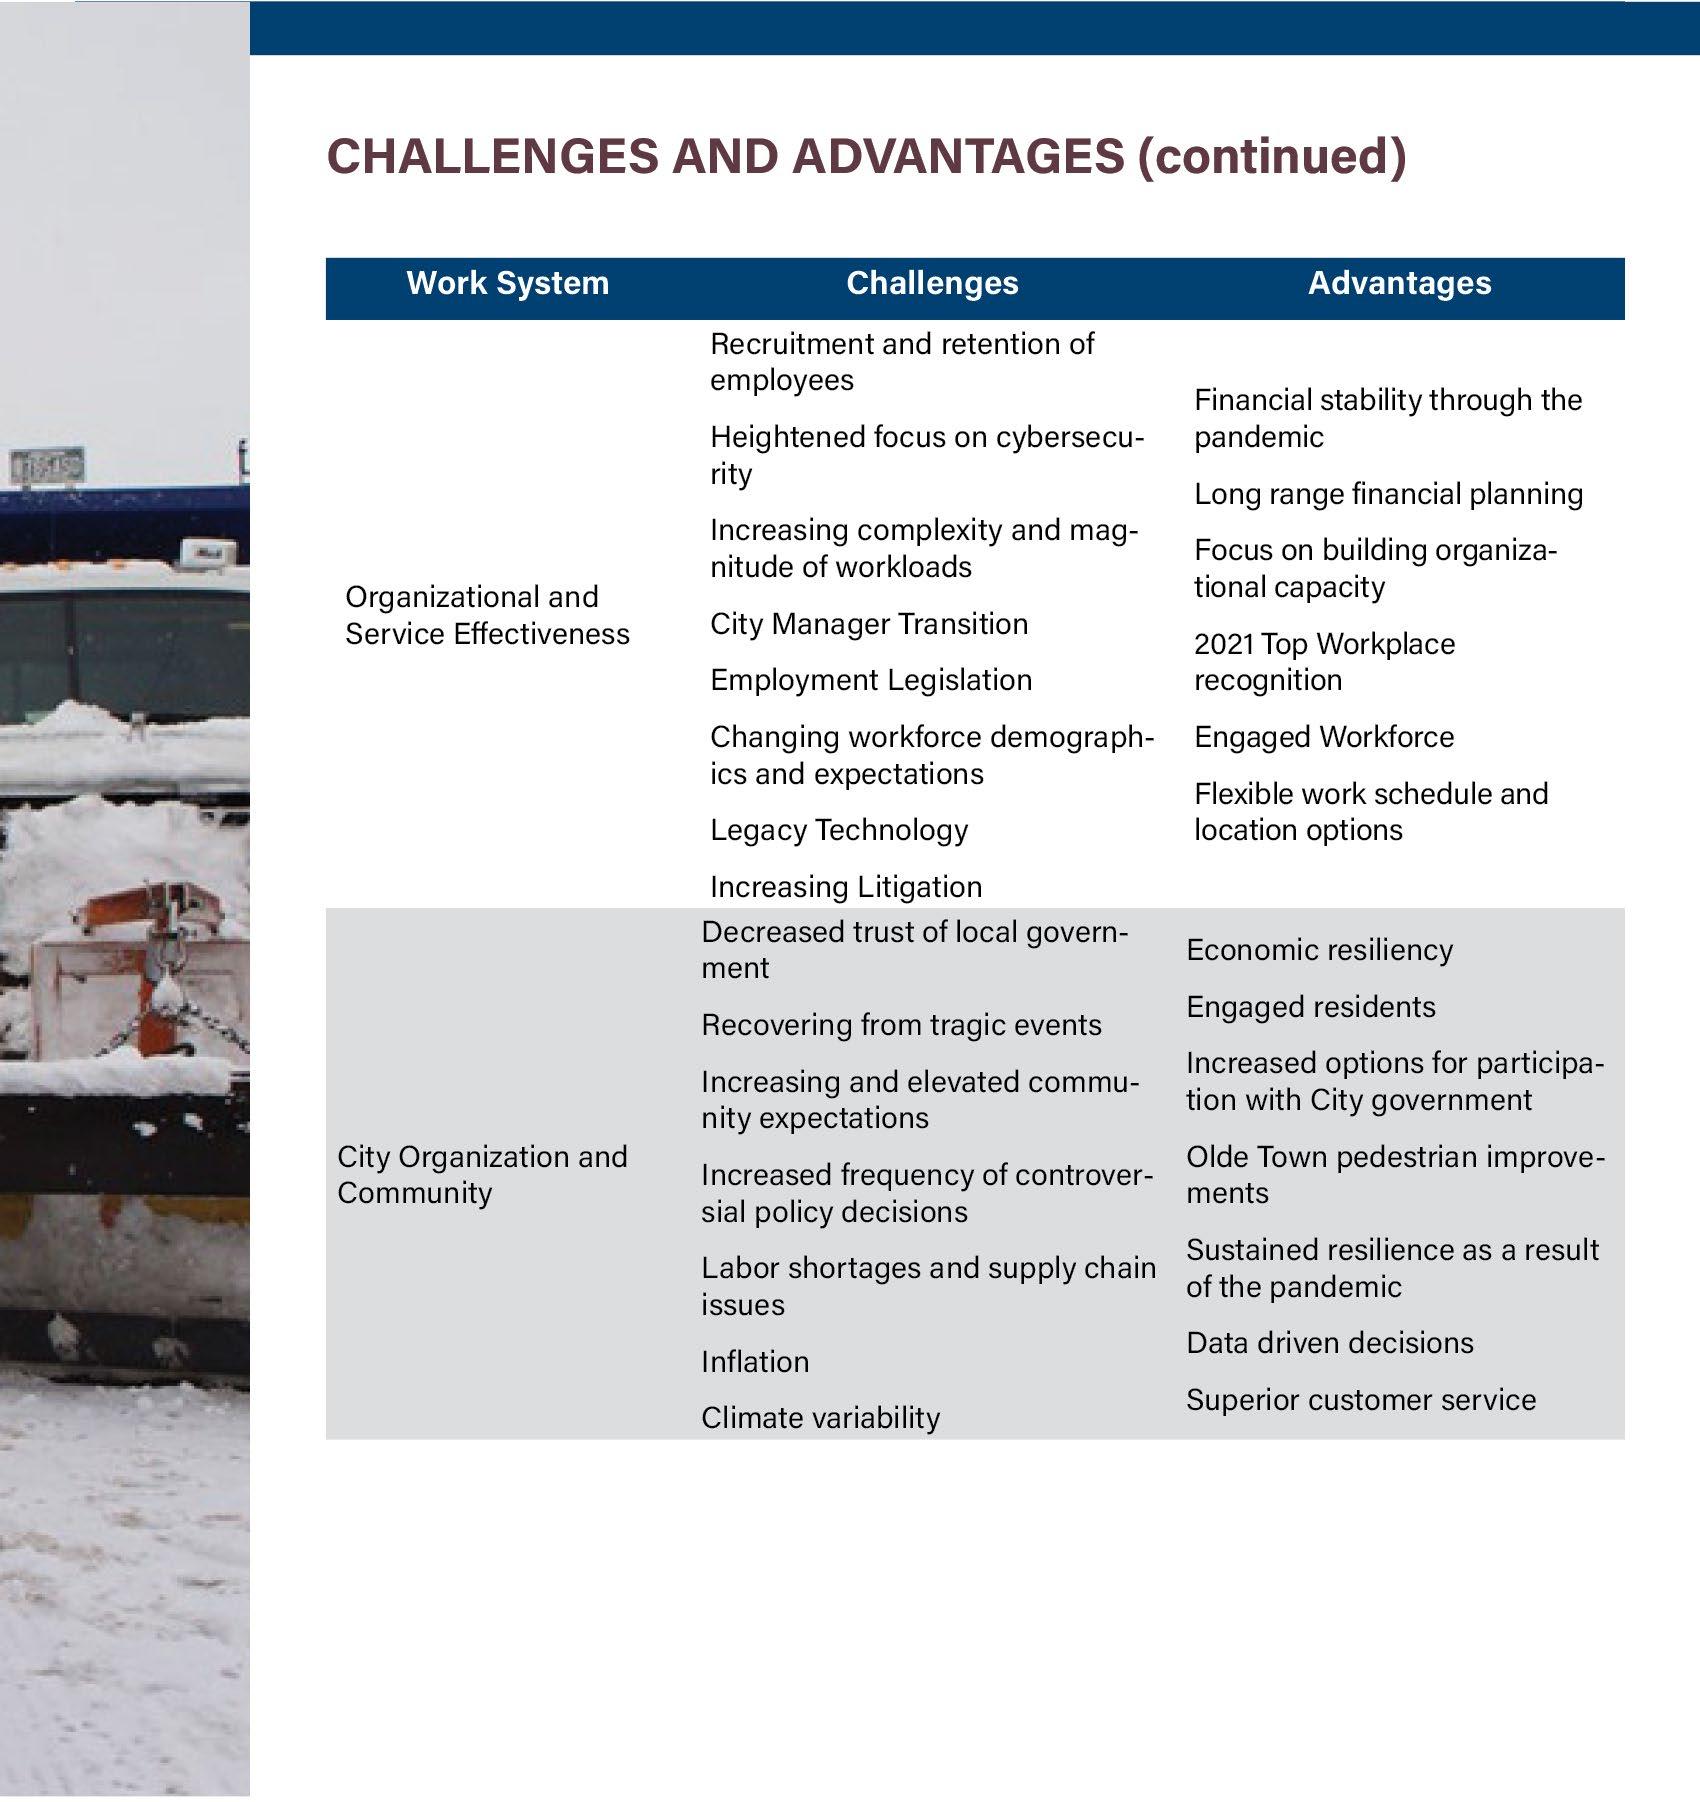
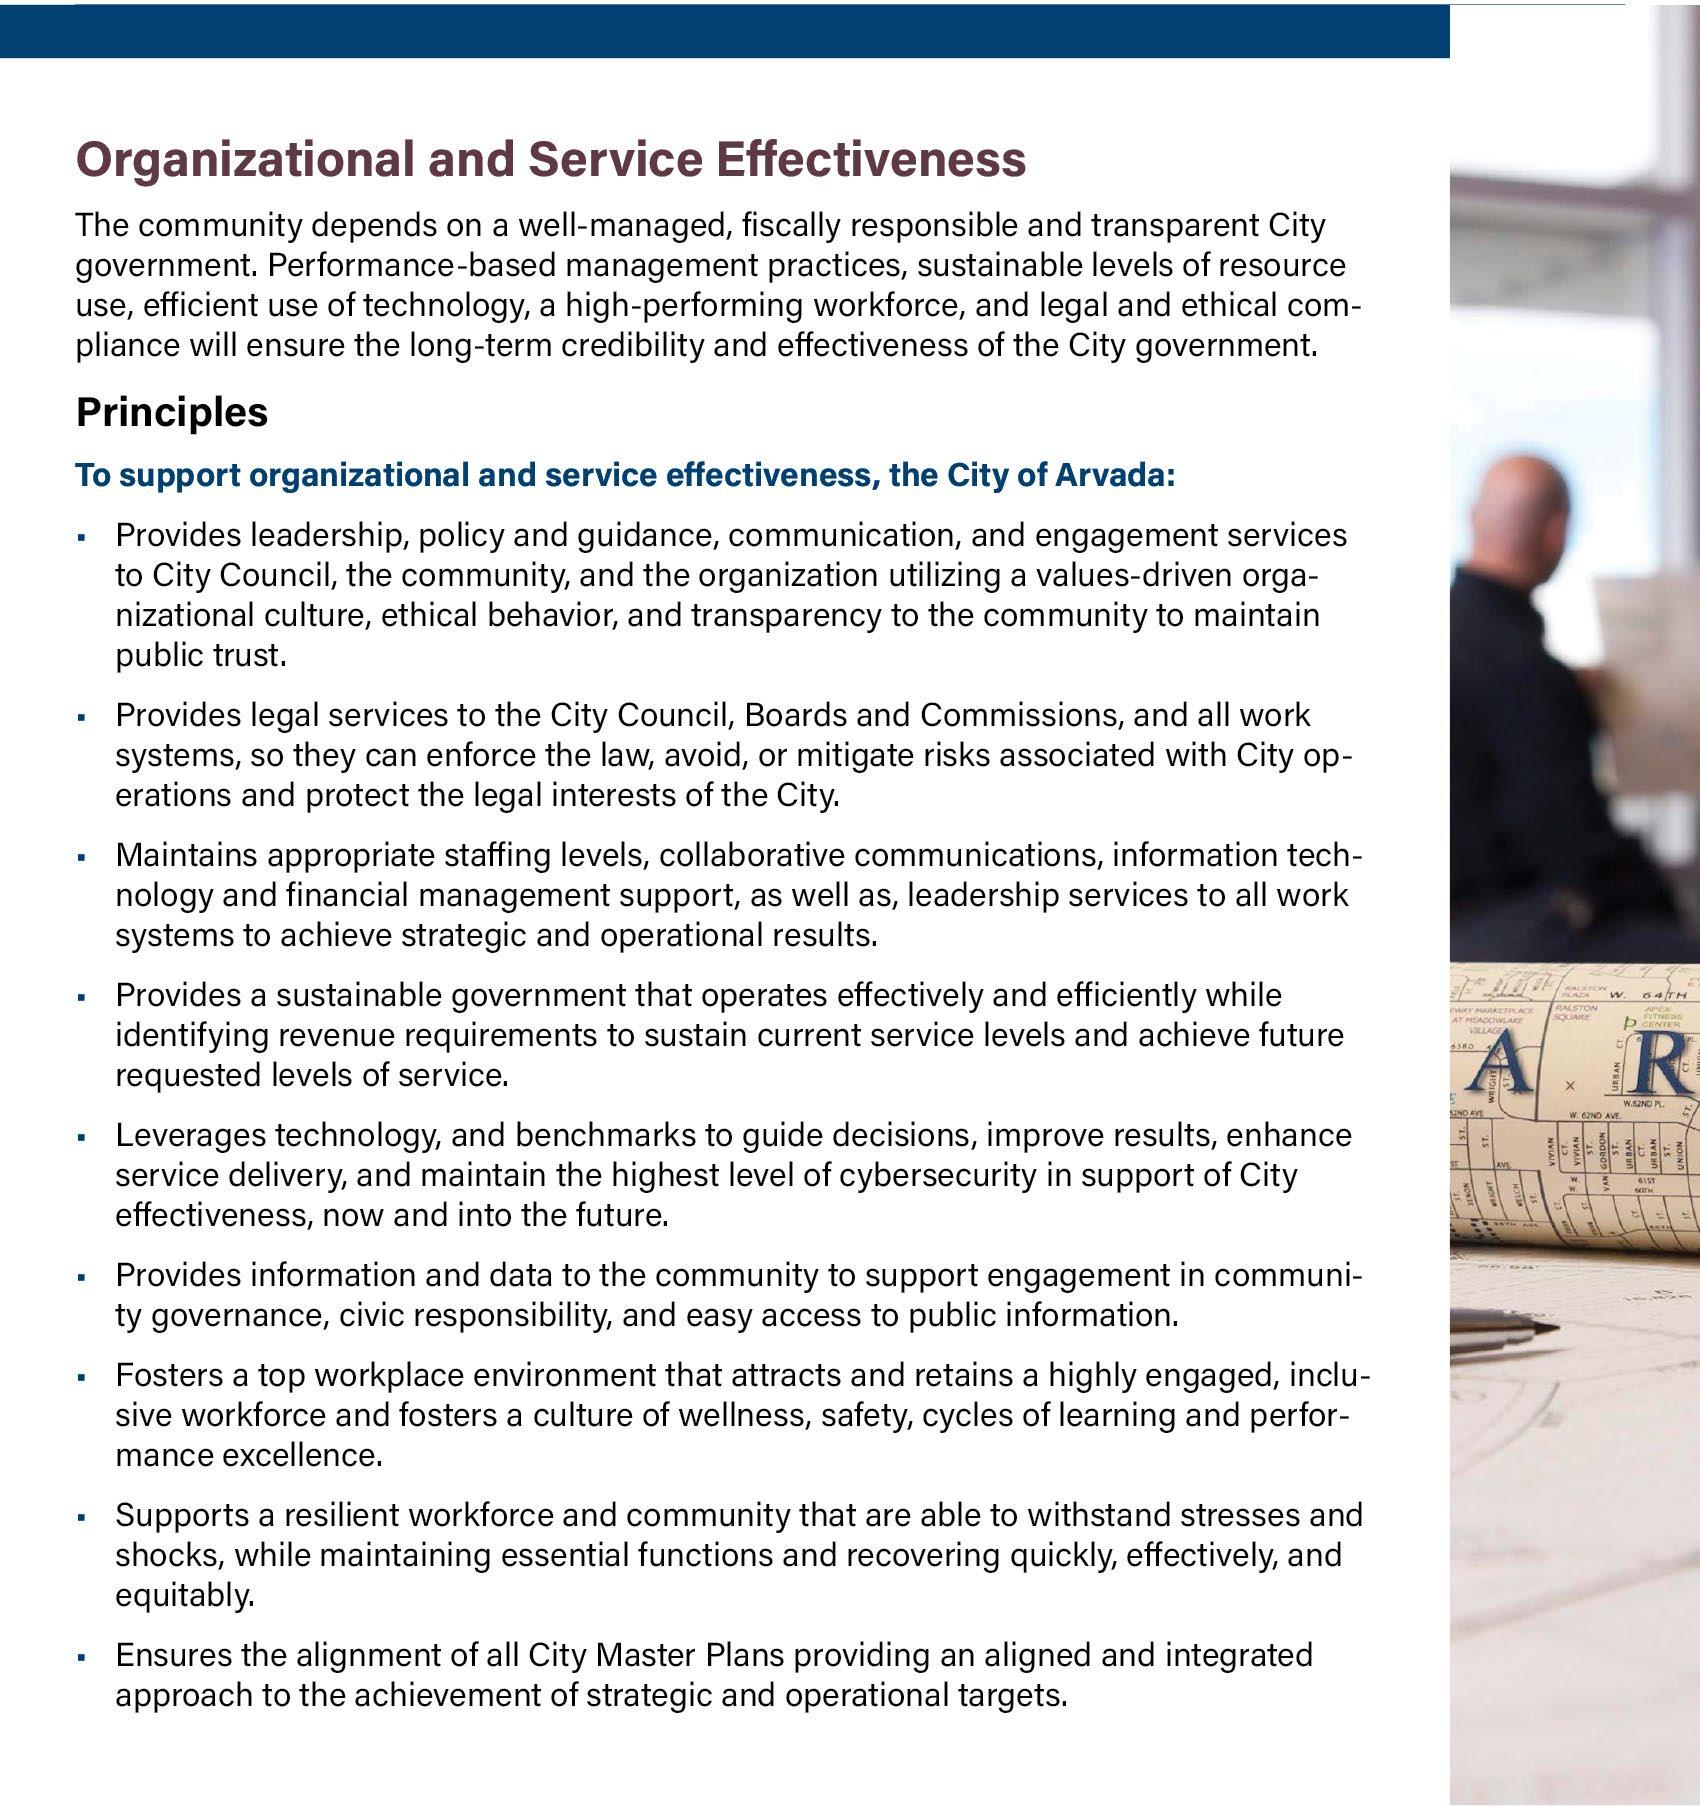
The purpose statement for the Organizational and Service Effectiveness Strategic Plan Priority Area and Work System is: The community depends on a well-managed, fiscally responsible City government to guide the organization in a manner that enhances quality of life. Performance based management practices, sustainable levels of resource use, efficient application of technology, a high performing workforce, and legal and ethical compliance will ensure the long term credibility and effectiveness of City government.
Associated lines of business include Business Systems, City Attorney, Community and Civic Engage ment, Compensation, Benefits and Wellness, Employment, Fair and Open Government, Revenue, Accounting and Financial Analysis, Service Excellence, Economic Vitality and Infrastructure, Strategic Partnership, Technology Infrastructure and Operations, Technology and Project Management Services, and Workforce and Strategic Partnerships
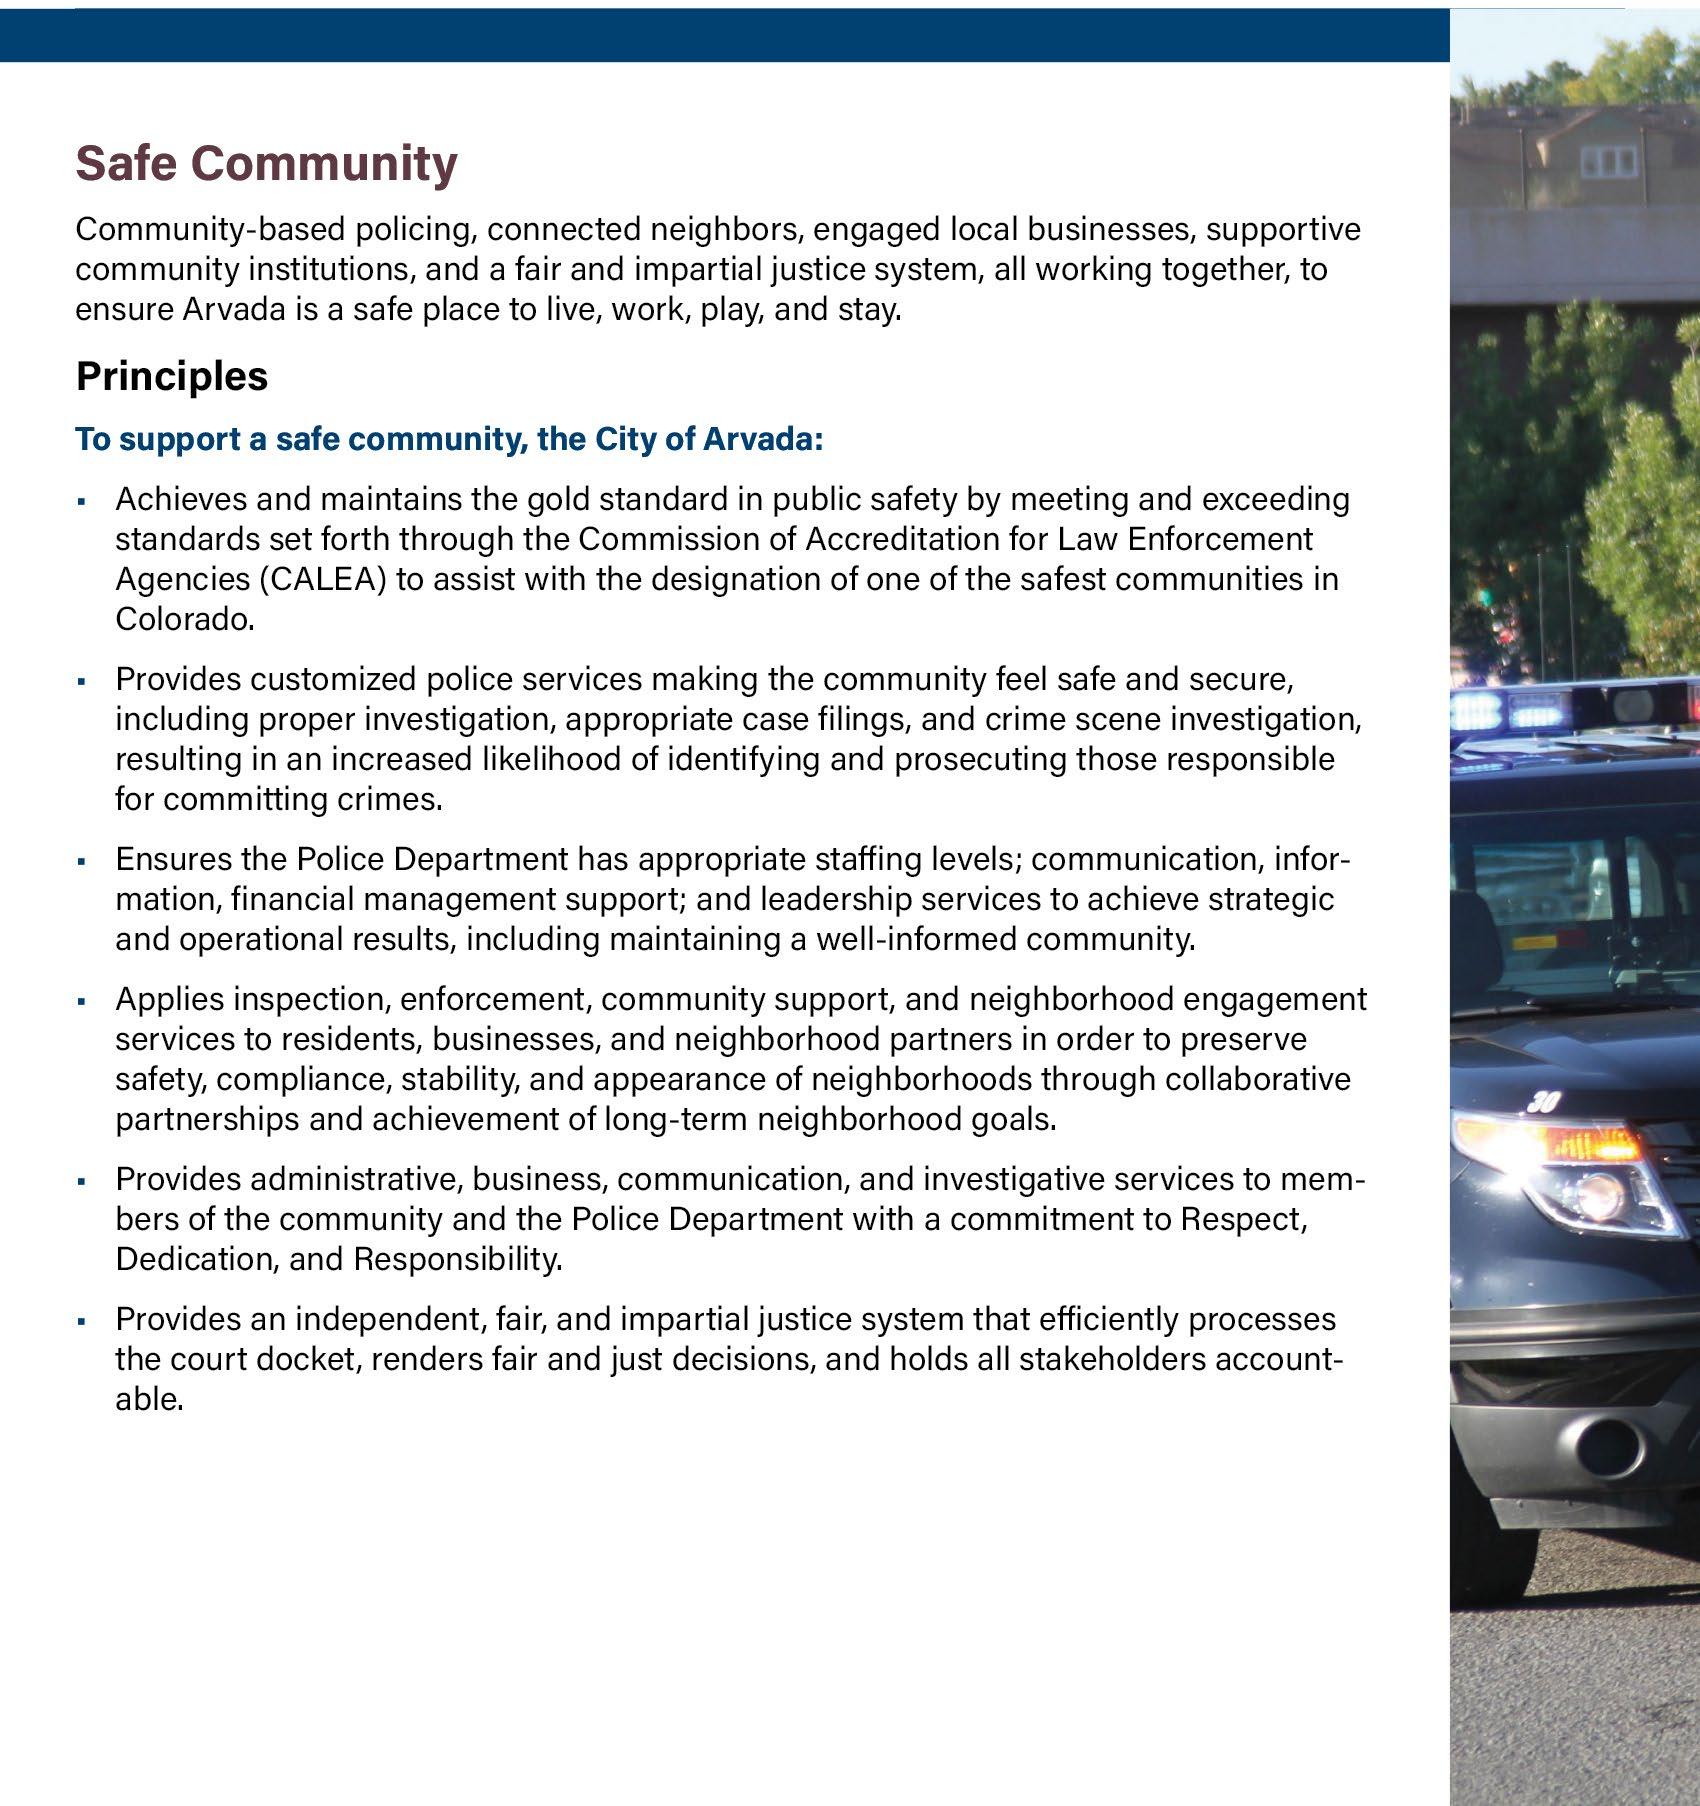
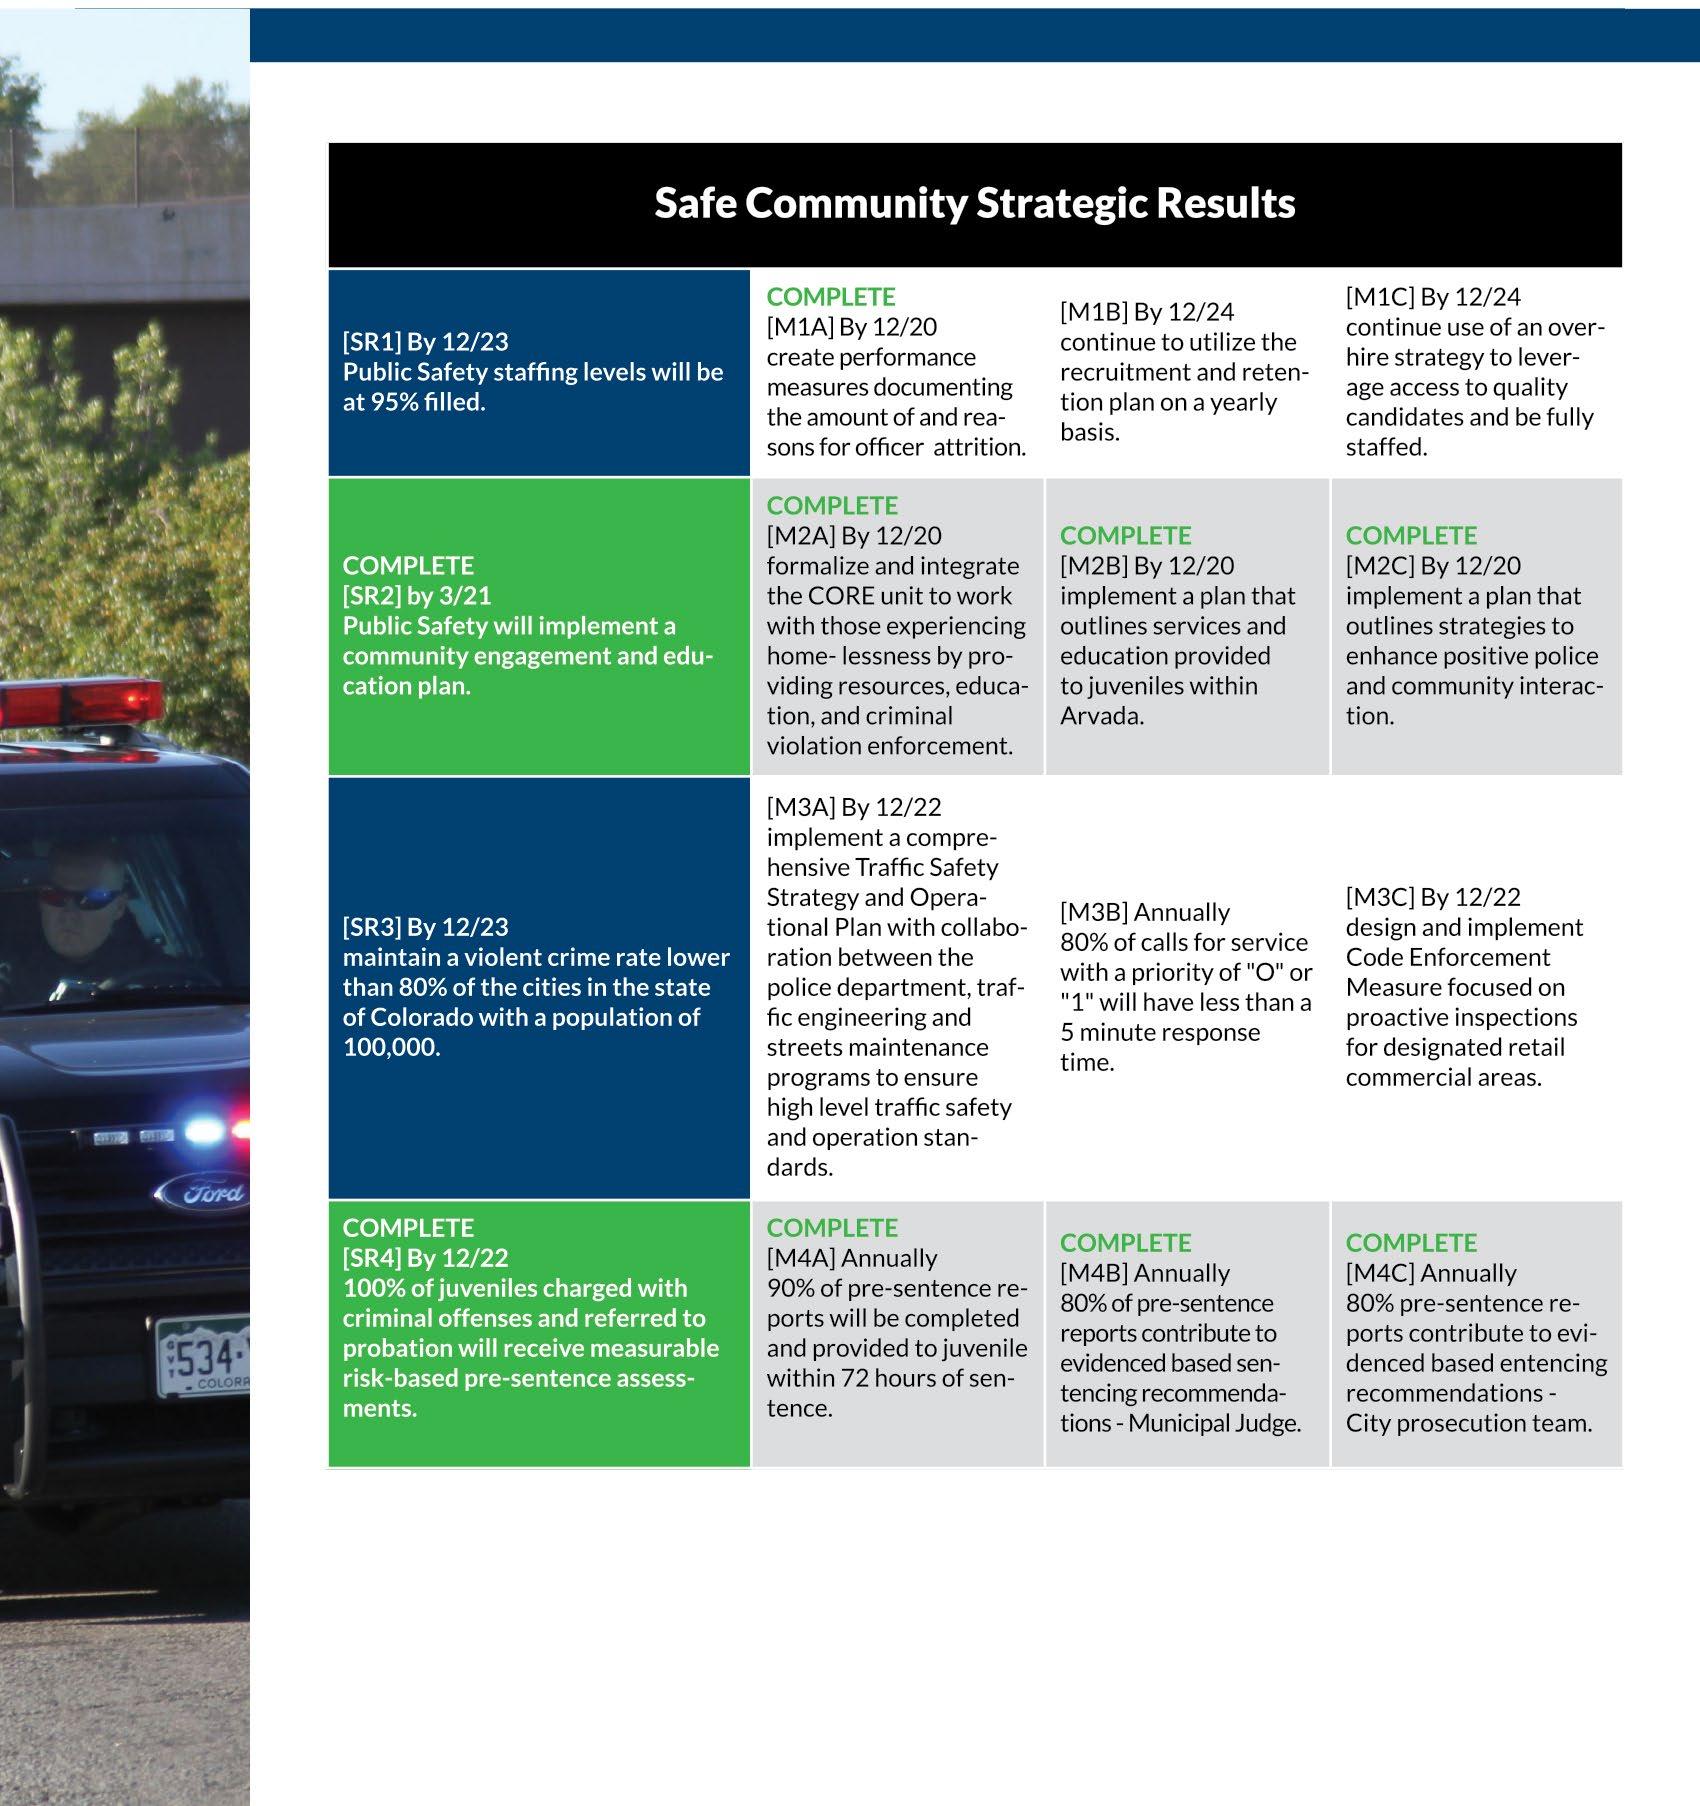
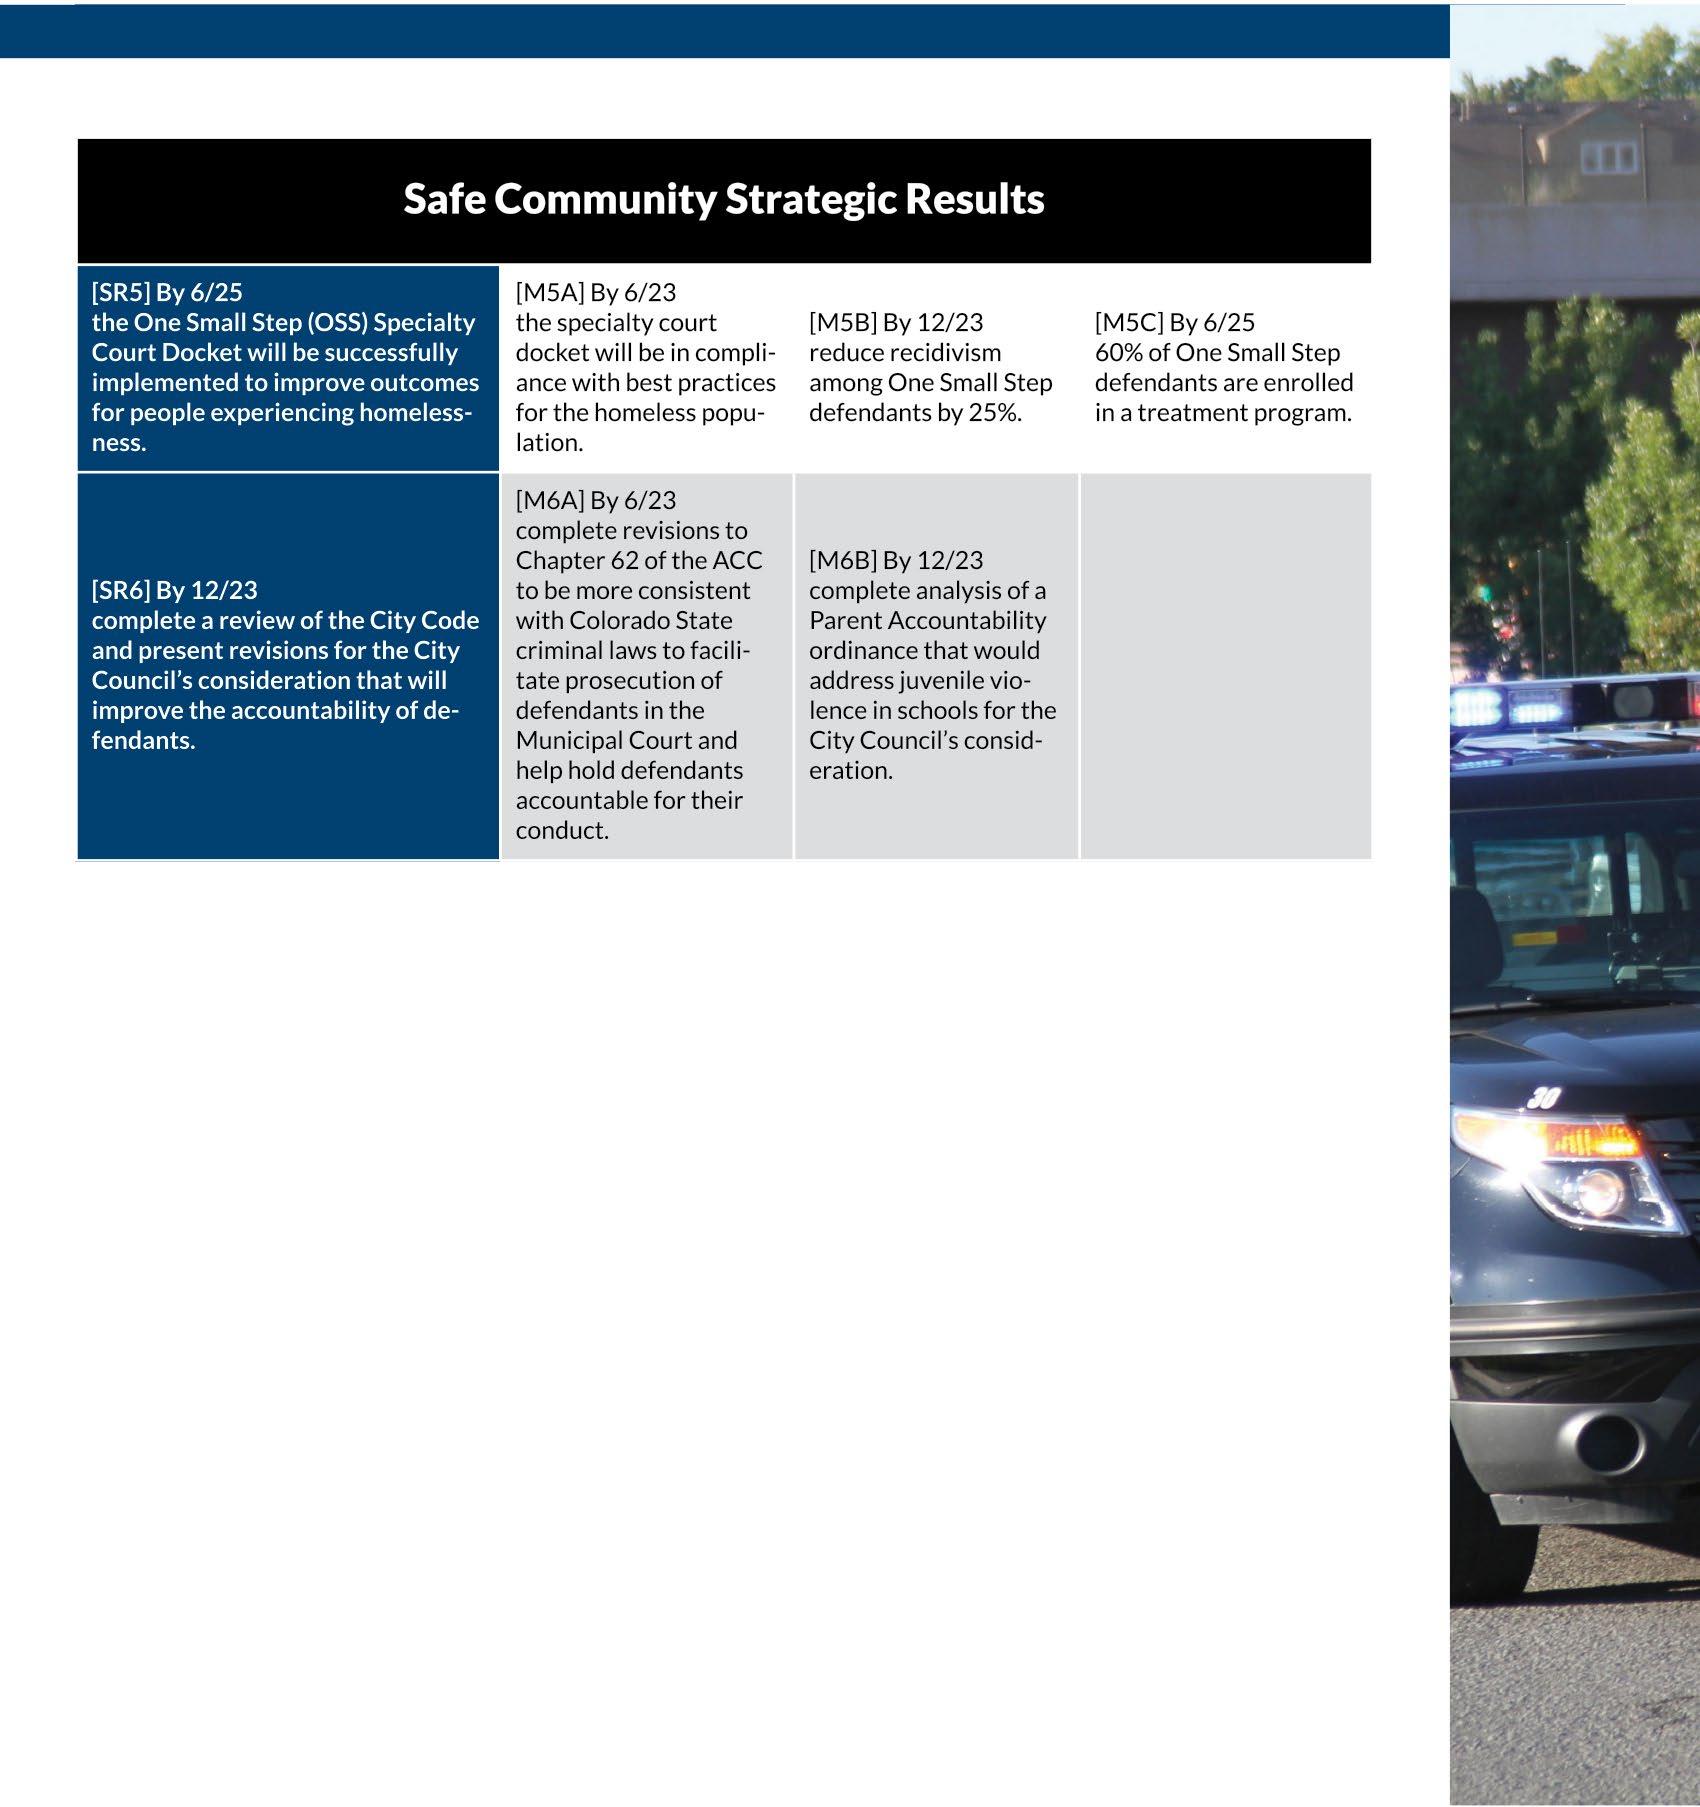
The purpose statement for the Safe Community Strategic Plan Priority Area and Work System is: Community based policing, connected neighbors, engaged local businesses, supportive community insti tutions, and a fair and impartial justice system, all working together, ensures that Arvada is a safe place to live, work, play and stay.
Associated lines of business include the Judicial Branch (Municipal Court), and Field Services and Oper ations within the Police Department
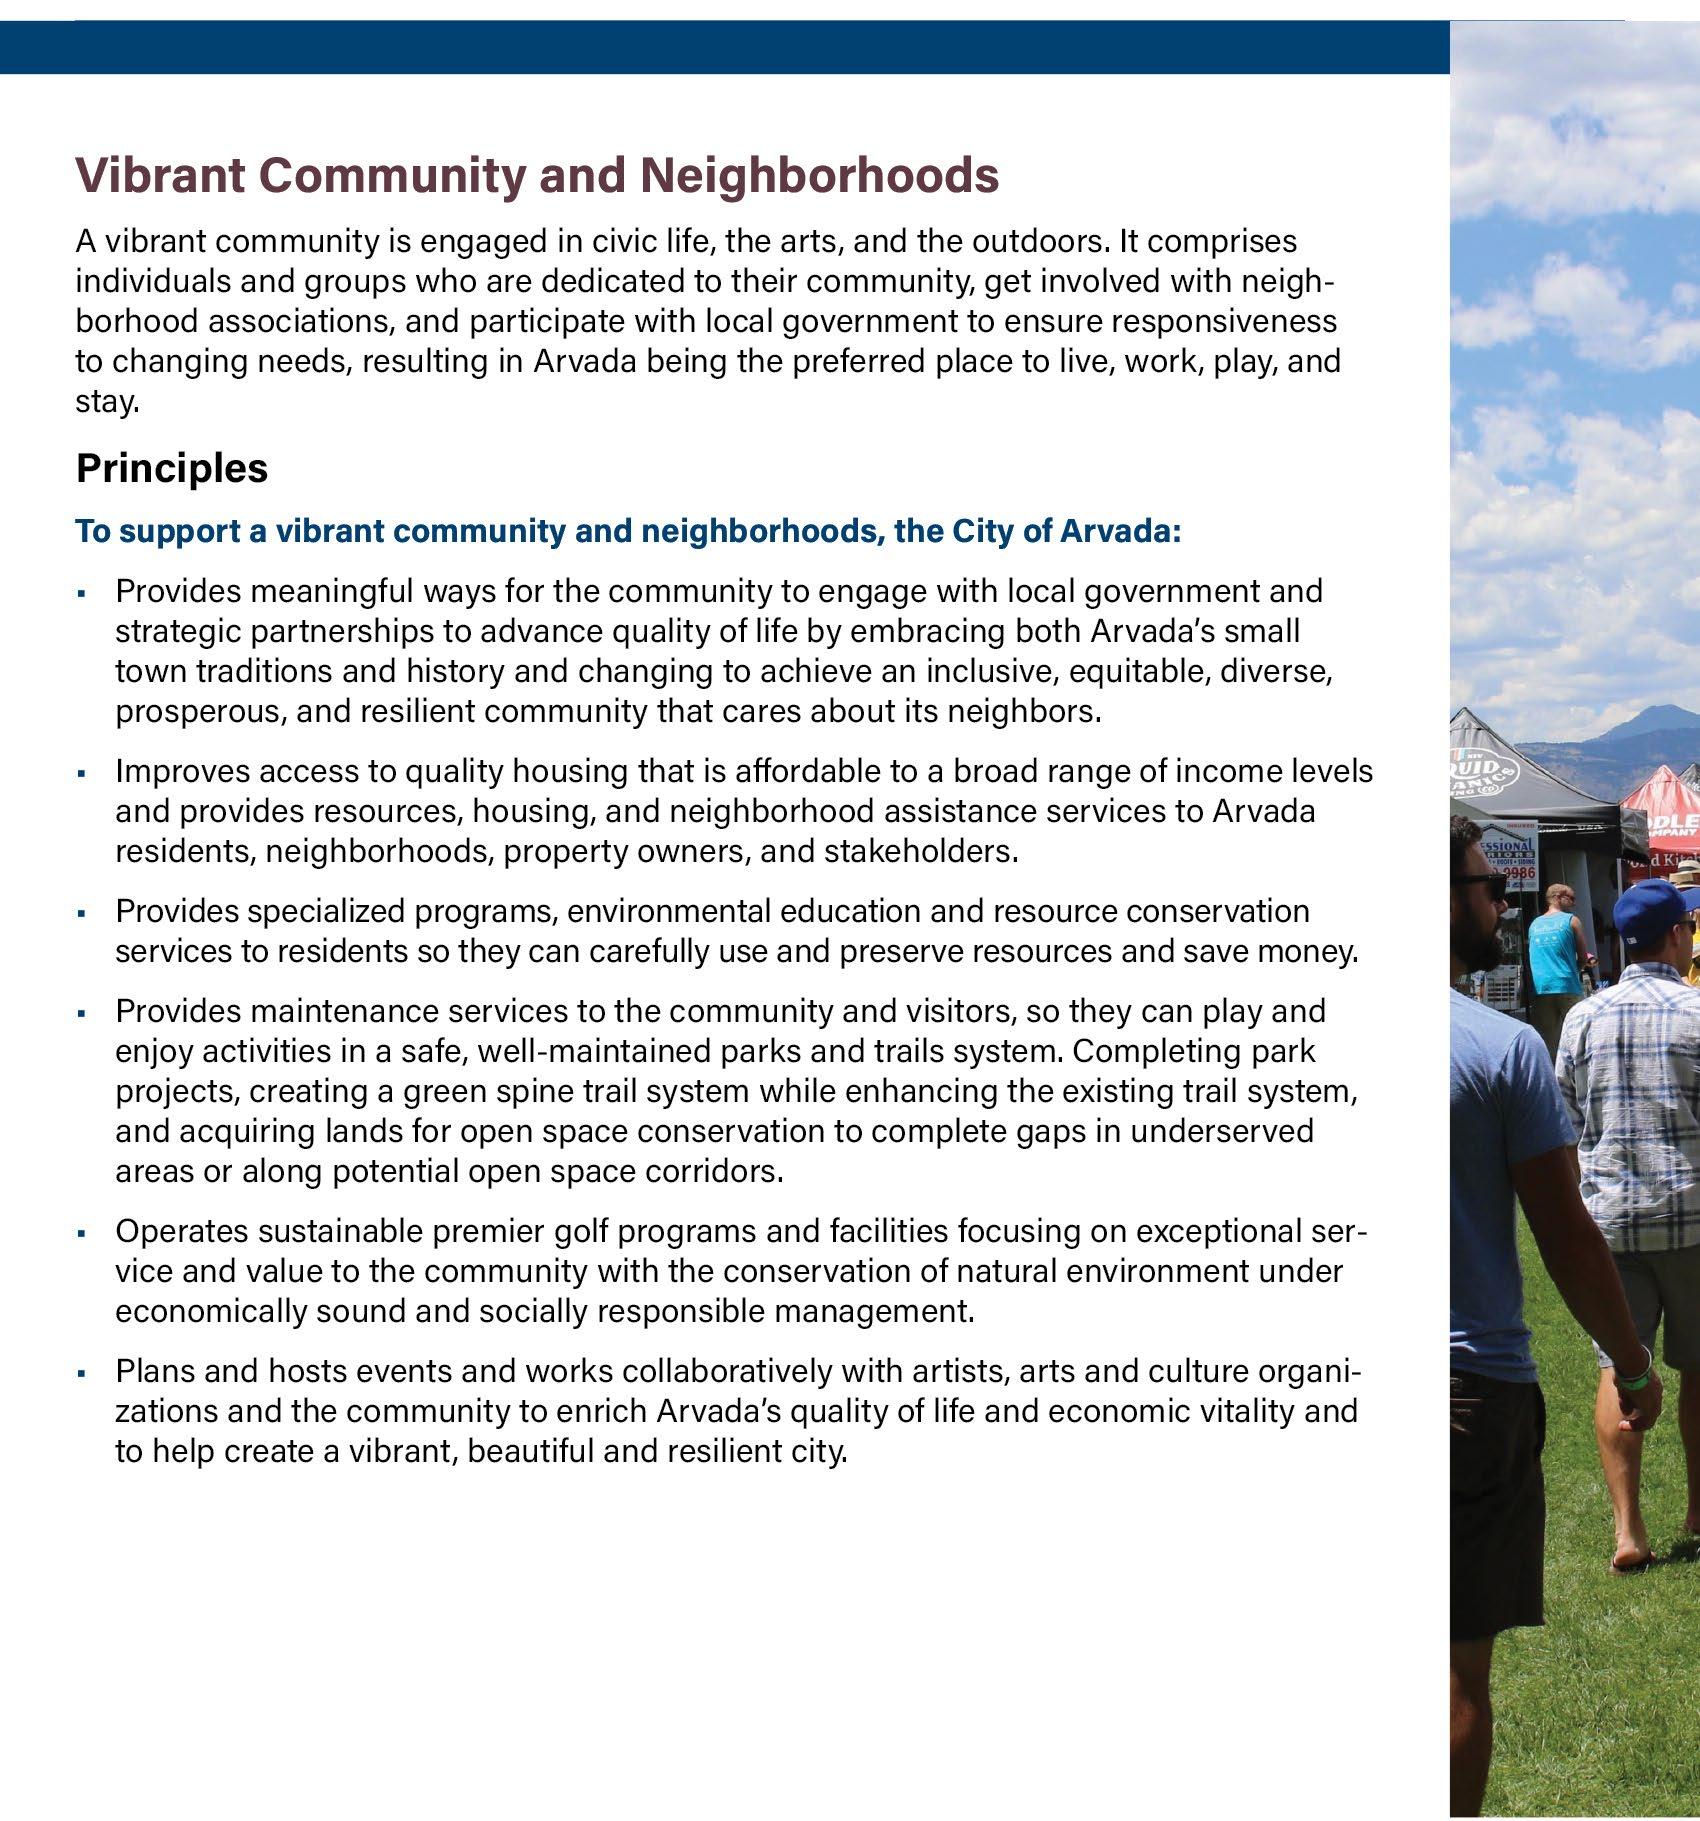
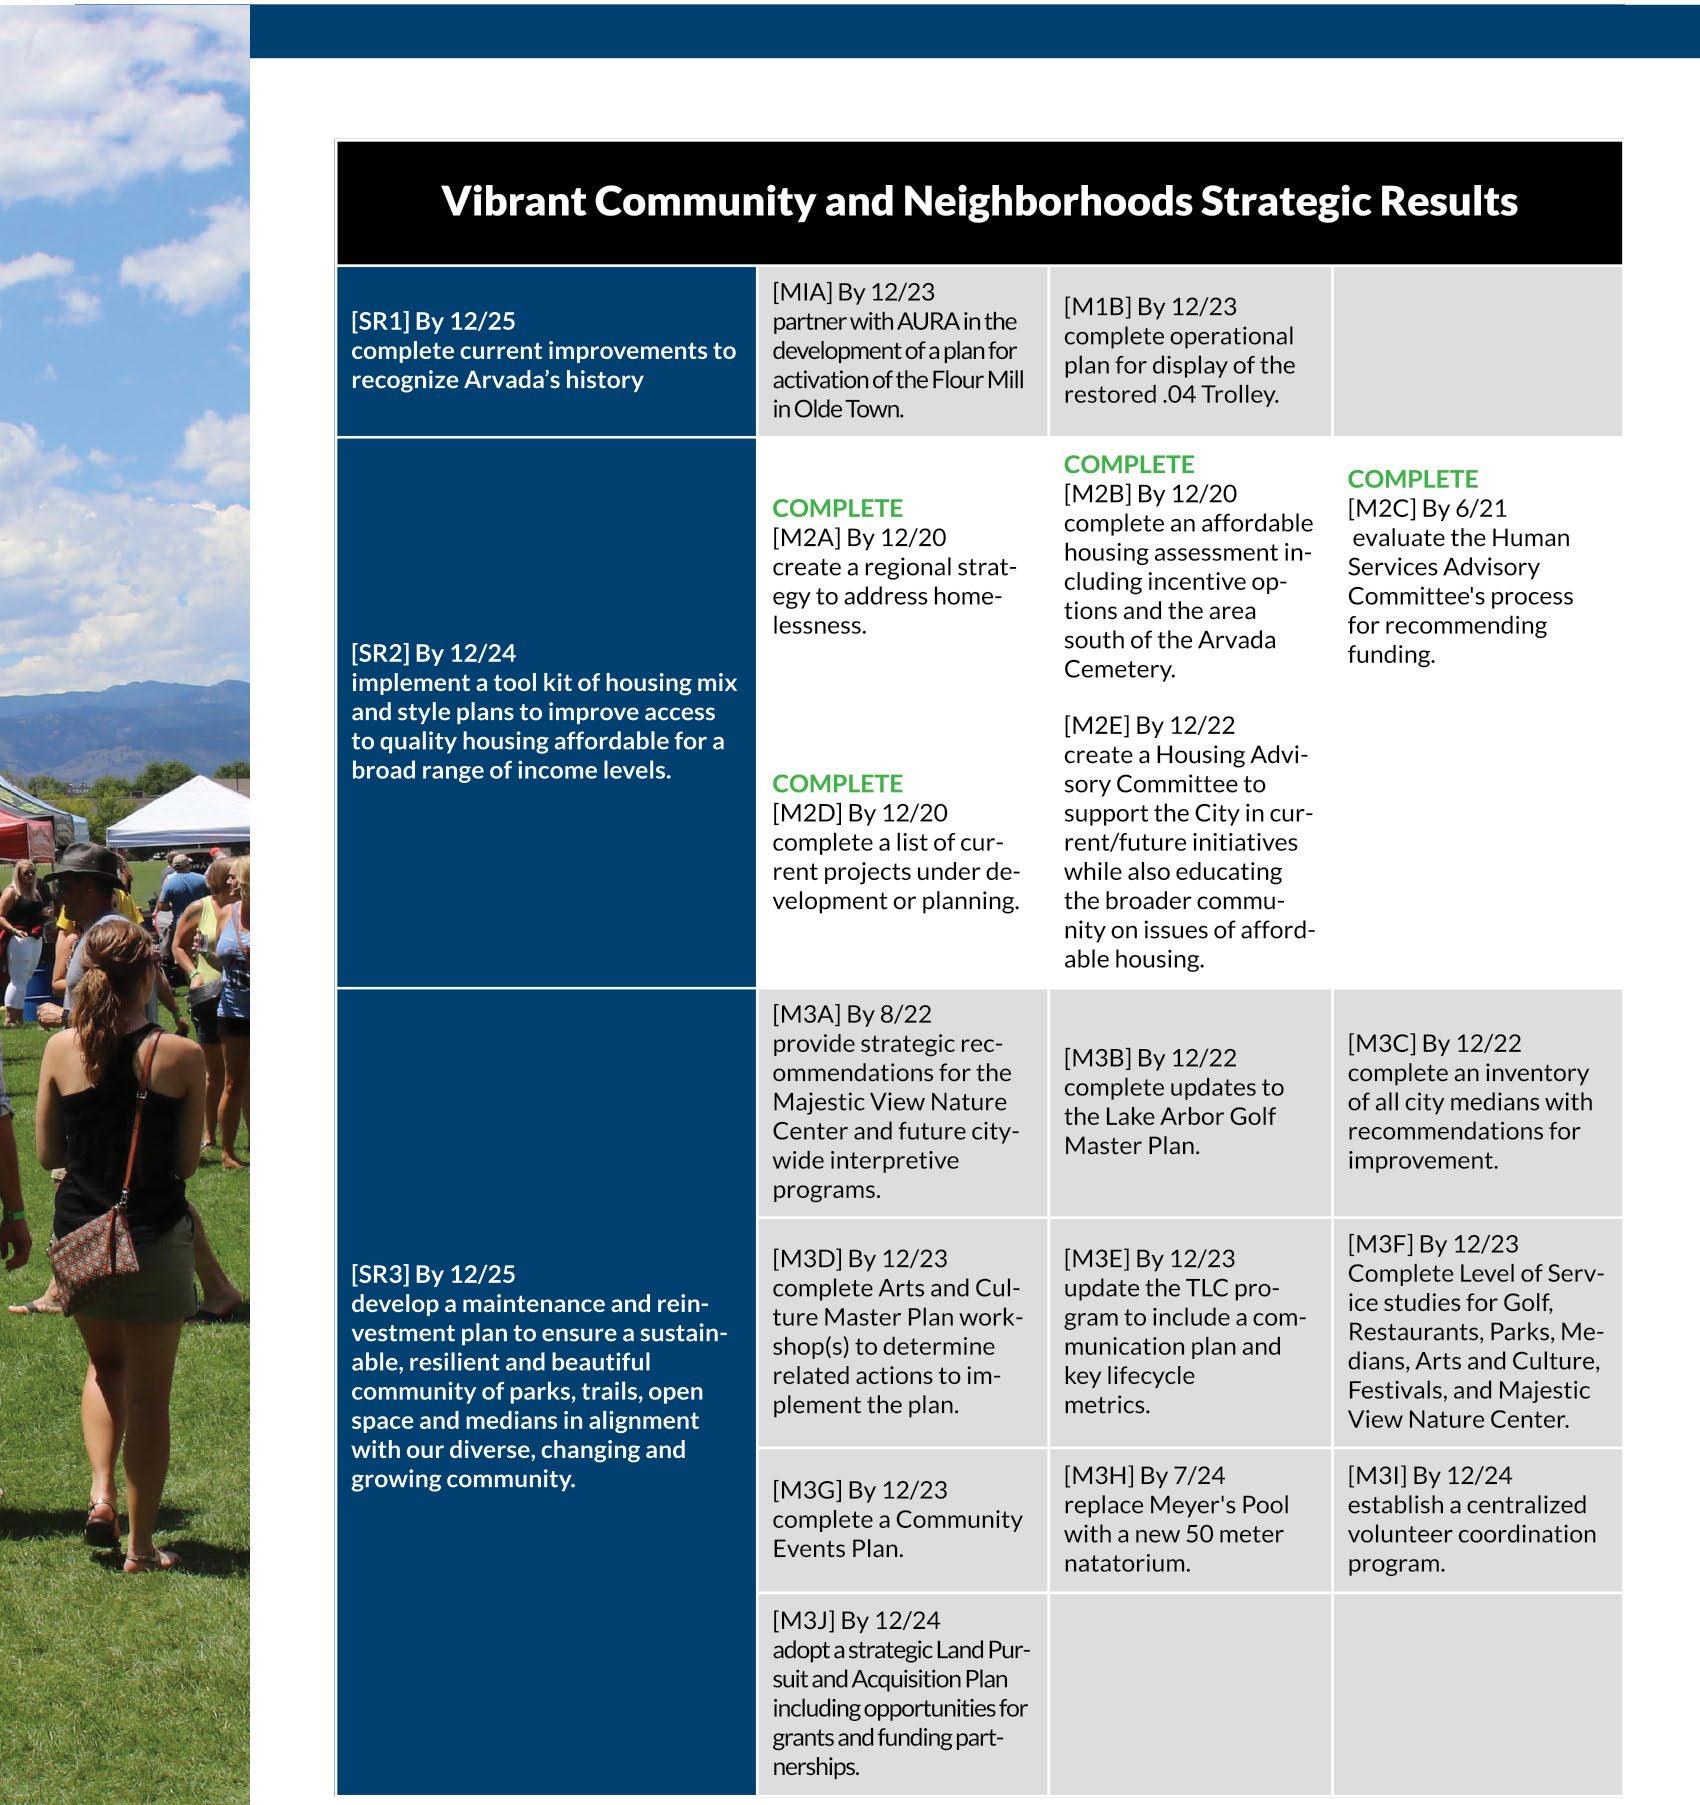
The purpose of the Vibrant Communities and Neighborhood Strategic Plan Priority Area and Works System is: A vibrant community is engaged in civic life, the arts and the outdoors. It comprises individu als and groups who are dedicated to their community, get involved with neighborhood associations and participate with local government to ensure responsiveness to changing needs and resulting in Arvada being the preferred place to live, work, play and stay.
Associated lines of business include Parks, Golf, and Sustainable and Vibrant Community
With full alignment of our work with the City Council Strategic Plan, implementation of a business model that defines high-level strategies for the completion of our work and performance measures that informs our progress and achievements, we will continue to honor our commitment to the following statement: “The City desires to continue its efforts to achieve and maintain service excellence by building a Customer-Focused and Results-Driven organization.”
With this commitment in mind, this letter summarizes the Proposed 2023-2024 Budget and presents a summary of the updated 2023-2032 Ten-Year Financial Plan
The City Council approved the 2021-2022 Revised Biennial Operating and Capital Budget on October 18, 2021 This approval authorized expenditures of $262,859,447 for 2022 as described in the budget document
On April 18, 2022, the City Council approved an additional appropriation of $91,051,666, which consist ed of $33,555,134 in carryover items primarily associated with continuing capital projects and delayed equipment purchases; $47,917,282 in new requests which included $35,250,000 for the construction of the replacement of Meyers Pool funded by the lease purchase agreement, the appropriation of funds received from grants, and transfers of funds collected through development fees; $9,270,000 in onetime requests, including $3,000,000 for the Enterprise Resource and Planning (ERP) financial and human capital technology platform, $3,350,000 in additional streets funding, and $309,000 associated with miscellaneous internal fund transfers . The additional appropriation was funded through a combination of unexpended funds approved as part of the 2021 Budget, actual 2021 revenues collected over the original estimates, and additional transfers from reserves in various City funds .
The additional appropriation was completed in a manner that maintained our fully balanced ten-year financial models and allocated resources to programs and projects aligned to the City Council’s direction as defined by the Strategic Plan and other relevant policy documents. The additional appropriation autho rized expenditures of $353,911,113 for 2022 .
In addition to presenting the ordinance that amended the 2022 Budget during the April 18 City Council meeting, the Finance team presented the 2021 Fourth Quarter Financial Report, which summarized the City’s financial condition through the end of a year that started with continued uncertainty associated with the COVID-19 pandemic, tragic incidents that cost the lives of two Arvada team members and economic recovery that favorably impacted the Arvada community, Denver Metro Region, Colorado and the United States The economic recovery was due, in part, to the decline in the infection and hospitalization metrics associated with the COVID-19 pandemic and easing of related restrictions
The 2021 Fourth Quarter Financial Report and year-end summary of the City’s financial condition con tinued to demonstrate the resiliency of the Arvada economy As reported by Director of Finance Bryan Archer on April 18, total 2021 revenues ended the year positive as nearly all categories exceeded the original budgeted estimates. As an example, the year over year increase for Sales Tax was 15.4%; Auto Use Tax increased by 16.8%; and General Use Tax increased by 30.9%. Total expenditures were within budgeted levels and nearly $9 million of American Rescue Plan Act (ARPA) funds were allocated to strategic projects . Our community and organization persevered as demonstrated by the following performance metrics recoded in 2021:
• Completed patching, milling, overlay and concrete work on 61 miles of local roads at a cost of ap proximately $9.1 million;
• Processed over 40,104 sales tax returns from 8,073 businesses that produced over $67 million in total sales tax revenue; and
• Issued 367 building permits which generated over $6.6 million in building revenue.
In addition, unemployment, which rose to 11 9% during 2020, dramatically decreased to 3 4% which was below the national level of 3 9% and state level of 4 2% Only one of the City’s 14 funds failed to meet the Council approved fund balance goals identified in the Budget and Fiscal Policy. The financial condi tion of the City, Arvada community and the region was very positive based on the 2021 economic and financial data.
During the August 15 City Council meeting, Mr. Archer presented the City’s 2022 mid-year financial re port The report was mostly positive as the year over year collections for sales tax revenue and auto use tax revenue is 9 6% and 11 6%, respectively Nearly all major categories are trending positive With the exception of capital projects, expenditures are in line with the amounts budgeted
Despite the mostly positive report, a deeper dive into the financial picture suggests that there is some cause for concern. Inflation has generated a 9.1% year over year increase through June 2022. Therefore, the sales tax increase of 9.6% can be primarily attributed to inflation. In addition, inflation is significantly increasing the cost of materials and labor which is driving up the cost of capital projects . Finally, general use tax recorded a 15.2% year over year decrease which is likely due to the impact of inflation and supply chain issues that is limiting reinvestment in properties, buildings and other capital assets by business owners. The impact of inflation, limited reinvestment activity and other factors are generating concerns that a recession could occur in the future .
While acknowledging the risk for a future recession, many economists agree that the current economy will remain relatively strong throughout 2022 and into 2023. Therefore, near term financial projections reflect the current positive trends in sales and use tax collections through 2022 with some cooling pro jected to occur in 2023 and into 2024 Based on this information, we believe that a recession, if it comes, will not have a significant financial impact on the City until 2025. At that time, financial strategies will be implemented to maintain the service levels projected within the proposed 2023-2024 Biennial Operating and Capital Budget should it be approved
With the additional revenue growth based on the current trends, the City has been able to address some of the higher priority needs by making immediate changes to the current budget These changes are proposed to be included in the 2023-2024 budget and 10-year Financial Models for the associated funds The changes include adding positions to several work systems to maintain existing levels of service and addressing the new City Council Strategic Results identified during the March 4 Council Retreat and approved within the 2022 update to the Strategic Plan on May 16 In addition, the City Council and the Leadership Team have collaborated to implement strategies necessary to maintain a competitive compensation package for existing employees .
The addition of 27 positions mid-cycle (from October 2021 to July 2022) were approved in order to make
an immediate impact on the ability of the City to serve its customers, address operational changes, sup port and improve the execution of capital projects, advance 2021 Strategic Plan initiatives and address emerging priorities that have been included in the recently approved 2022 Strategic Plan . The areas addressed include Housing, Homelessness, Parks, Public Safety, Engineering and Utilities . Please note the following brief summary of the additional positions:
• The addition of a Senior Probation Office in the Municipal Court is supporting the effective management/supervision of Court mandated probation conditions associated with the unhoused clients who participate in the One Small Step program
• The addition of four Parks Worker II positions is supporting the maintenance of additional parks and open space areas as well as addressing one of the major findings associated with the 2021 Parks Accident Investigation by adding additional full time supervision .
• The addition of five other parks positions, including a Leadworker, Supervisor, field programmer and two (2) Parks Worker II positions are supporting the transition of field scheduling from Apex to the City
• The addition of two Behavioral Health Clinicians is supporting the Police Co-Responder pro gram and will utilize grant funds formerly allocated to a third party human services provider .
• The addition of two Police Services Specialists and two Police Services Technicians is supporting expanded administrative and records activities in the Police Department .
• The addition of one Civil Engineer in Public Works is supporting the execution of capital im provement projects, including the Ralston Road and W 72nd Avenue Bond projects
• The addition of one Municipal Inspector in Public Works is supporting the Pavement Mainte nance Program .
Positions Approved in 2022 and Proposed for Funding in the 2023-2024 Budget
• The addition of a Safety Specialist in the City Attorney’s Office will address the major findings associated with the 2021 Parks Accident Investigation and the need to increase the City’s focus on workplace safety .
• The addition of a Sustainability Coordinator in the City Manager ’s Office will address Council direction included in the 2022 Strategic Plan to update and implement Community Resilience and Sustainability Plans
• The addition of a Payroll Specialist will support operational needs associated with the timely completion of payroll activities and the implementation of a new ERP solution
• The addition of a Housing Supervisor will address Council direction included in the 2022 Strategic Plan to establish and support a Housing Advisory Committee and implement current and future Affordable Housing initiatives.
• The addition of an Executive Assistant and Coordinator in Human Resources will support increasing operational activities, including the expanded recruitment workload and new employment law mandates related to health care, paid leave and pay equity regulations .
• The addition of four Civil Engineers will support the planning, design, construction, and planned development coordination of the utilities infrastructure master plans .
• The addition of a Public Works Manager will support oversight of facilities and capital improvement projects .
It is important to note that the City Manager’s authority to add positions mid-year and separate from the annual budget process is evaluated very carefully As explained herein, the decisions were associated operational gaps, the need to address current and emerging Council priorities and timely execution of capital projects The availability of additional funding allowed these positions to be considered and ulti mately approved without adversely impacting other Council and operational priorities
New positions proposed for the 2023-2024 Budget will, if approved, address an expanded capital pro gram focusing on transportation and utilities infrastructure, timely maintenance of City facilities, cyberse curity, and police services. There are a total of 15 new positions proposed as briefly summarized below:
• The addition of a Senior Economic Development Specialist will support the increased demand for core economic development services and is partially funded by a reduction of temporary wages
• The addition of two custodians will support the increased workload at City facilities and replace a position that was allocated to support the Arvada Center .
• The addition of a Civil Engineer will support mobility, roadway, and bridge design and construction projects .
• The addition of a Traffic Engineer IV will assist with traffic engineering development review, en gineering on the AFON fiber backbone project, assist with technical information and response to Ask Arvada inquiries, manage signal intersection rebuild projects and help with CIP projects that include intersections .
• The addition of a Municipal Inspector will support pavement program inspections for asphalt and concrete construction
• The addition of a Pavement Management Coordinator will support additional asphalt and con crete contractors and ADA compliance and oversight
• The addition of a Security Operations Analyst will support cybersecurity within utility operations
• The addition of two Civil Engineers will support master planned projects sequenced on the "road map" for water and sewer rehabilitation and capacity needs
• The addition of a Electro Mechanical Technician will support the preventative maintenance and calibration of instruments in the water distribution system .
• The addition of a Utility Foreman will help support efforts to prevent underground damage from boring operations, backflow prevention and distribution system water quality monitoring.
• The addition of a Chief Information Security Officer will be responsible for managing all City cybersecurity activities across all technology platforms . This position will address a gap in ded icated leadership for cybersecurity . The role will have oversight and guidance for all cybersecu rity related policies and efforts across the City.
• The addition to two Police Sergeants will support the effective supervision of police officers within the community . Compensation Increases
The “Great Resignation” has continued to impact the City organization and service levels . Following the tragic death of Officer Gordon Beesley and the continuing negative national narrative regarding law enforcement, 37 individuals left the Arvada Police Department and over 30 of the 191 sworn positions have been vacant this year. Outreach to police officers through small group meetings generated a num-
ber of issues In response, City Management, Police Command team members, Finance, and Human Resources collaborated to increase the pay for sworn officers in February by restructuring the pay range to add an additional step as well as premium pay in order to recognize the bachelor’s degree educational requirement for Arvada officers. The combined impact of the police compensation changes increased pay for most officers by about 4%.
The Police Department was not the only unit in the City impacted by the resignation of team members and the related impact on compensation Last month, the Human Resources team shared the results of the annual market benchmark study for all jobs in the City’s pay plan to determine how salaries have changed in the market year over year This information is used to recommend adjustments to the City’s pay ranges in order to stay competitive and maintain the City’s Employer of Choice Compensation Philosophy . This year’s study indicates that salaries have moved an average of 6% for all job families, with the exception of the Executive job family which has moved more aggressively at a rate of 15-18% .
Although these increases are much larger than the City is used to seeing, there are many factors that are contributing to these results . The “Great Resignation'' brought on by the COVID-19 pandemic has created higher turnover and employers are struggling to retain employees who are leaving their jobs for a variety of reasons . Furthermore, there are less available applicants in the workforce and an unprece dented number of job openings remain unfilled in the public sector.
The Human Resources team can confirm Arvada is experiencing similar challenges. Our turnover peaked at 17 .7% in 2021 compared to 12 .9% the year before, a 37% increase . The recruitment team reports a steep decline in the number of applicants for job openings, and 22% of our vacancies remained unfilled. After checking with other local government employers within the market area, Human Resources, Fi nance and the Leadership Team proposed a two-part strategy in order to maintain our status as an Employer of Choice and support and acknowledge the efforts of our employees who have been working under prolonged stressful conditions with higher than usual vacancy rates and increasing demands The strategy proposed to:
• Implement a 3% increase retroactive to August 1 instead of waiting for the planned date of January 1, 2023; and
• Implement an additional 3% increase in January 2023
The cost of the proposed increase is an additional $2,026,673 for the remainder of 2022 and 2023 . This commitment also adds $13 million to the 10-year Financial Models for all funds based on current assumptions . Approximately 80% of the cost for the additional compensation was supported by current and projected vacancy savings and lower health insurance costs .
Following an informal discussion with the City Council on July 29, the Council expressed their support and an announcement was transmitted to the Arvada team on Friday, August 12 .
The actions and decisions described herein, supported by the resilient financial condition of our orga nization and community continues to emphasize the following priorities that formed our response to the pandemic beginning in March 2020:
• People First - We will endeavor to maintain public service levels and avoid significant impacts to our entire City team, including furloughs, compensation reductions and layoffs.
• Compliance with the City Council Budget and Fiscal Policy – We will develop our two-year
budget, updated second-year budget and ten-year financial models in compliance with Council policy, including meeting minimum reserve fund balances for every year of the ten-year (20232032) period, align expenditure priorities to the City Council Strategic Plan and continue strategic investments by funding capital projects .
• Internal Service Funds – We will maintain our projected contributions into Internal Service funds, including facilities, vehicles, technology and insurance .
The Proposed 2023-2024 Biennial Operating and Capital Budget begins with the City Council Strategic Plan (CCSP) as the foundational document that guides the allocation of resources . Inclusion of the Strategic Plan is intended to emphasize the strategic focus associated with the allocation of resources in a manner that is consistent with Council and community priorities .
The City Council Budget and Fiscal Policy is included to emphasize the connection of the budget to the CCSP and provide other foundational elements associated with the budget, including mandated minimum reserve levels for each fund, updated 10-year Financial Models, timely reporting of CCSP Strategic Results and Internal Service Funds
The Community Profile provides a description of Arvada and summarizes the key demographics and characteristics of the community .
The next section summarizes the Legal Requirements and a high-level summary of the Budget Process. This section includes an explanation of the fund structure, financial management standards/poli cies and relevant state laws, including TABOR .
The Introduction section summarizes the connection of the budget to the performance measures and the City Council Strategic Plan . This section also includes an overview of the national and local econ omies, and the impacts of both on City revenue sources Analysis of these impacts generates revenue and expenditure assumptions that are used to develop the 2023-2024 budget and the 10-Year Financial Models for each of the City’s major funds The 10-Year Financial Models are the foundation of our 10Year Financial Plan, which is a key requirement of the City Council Budget and Fiscal Policy Minimum fund balance goals which must be maintained for each year of the 10-Year Plan are summarized for each of the major funds By meeting or exceeding the fund balance goal for each fund over the course of the 10-Year planning horizon, the City is able to meet present and future financial challenges.
The Revenue and Expenditure Summary begins on page 69 and defines each of the City’s major funds, including the General Fund, Internal Service Funds and Enterprise Funds This section provides an overview of each fund by summarizing revenues, expenditures and changes to the fund balance for 2023-2024 . The Fund Highlights summary presents a brief description of the activity within each fund and related changes to the fund balance. Major differences between the 2022 Budget and the 2023-2024 Budget are also summarized and include the following items:
• The total 2023 budget for all funds is $359,784,184 with $388,519,133 in revenues;
• As previously summarized herein, a one-time 3% increase was added in August of 2022 to all grades to offset inflationary pressures. The market rate adjustment for January of 2023 will be 3%;
• The near-site health clinic combined with the City of Arvada employee’s continued efforts to
make well informed healthcare decisions have resulted in favorable claim experience in 2021 and year to date in 2022 Based on claim experience, the increase in health insurance was reduced from 5% to 0%;
• As previously explained herein, the addition of 27 positions mid-cycle (from October 2021 to July 2022) has made an immediate impact on the ability of the City to serve its customers . The areas addressed were Housing, Homelessness, Parks, Public safety, Engineering and Utilities;
• As previously explained herein, an additional 15 positions are proposed to be added in January of 2023 to IT, AEDA, Engineering, Facilities, Water and Wastewater. The justification associat ed with these positions will be further explained in the summaries for each Fund;
• An increase of $1 .5 million dollars annually generated by the Highway Users Trust Fund (HUTF) will be added to the Streets Maintenance Fund to continue close the funding gap;
• An increase of $500,000 in the transfer to the Parks Fund to help offset field maintenance costs and the new positions associated with the 2021 Parks accident investigation;
• Continued commitment to safe, reliable, high quality water supply, drainage system and waste water disposal service is a top priority of the City A water rate increase of 12 3% and a service fee increase of $2 every month and a wastewater increase of 9 8% and a service fee increase of $1 every month are necessary to maintain these services Even with these increases, the City’s rates are very low compared to the surrounding cities; and
• Significant changes to System Development Charges (formally Tap Fees) will be implemented in 2023 to better align the charges with the true costs and allow the issuance of bonds to pay for much needed system improvements .
Presentation of the 10-Year Financial Models begins on page 105, which summarizes financial assumptions for all funds, including for personnel expenses such as market based compensation increases, benefits costs and transfers into Internal Service funds. More specific assumptions for each of the City’s major funds are presented prior to the actual tables showing the projected revenues and expenditures for each fund . Please note that two pages are required to show the projections for each year of the Ten-Year Models, 2023-2032 .
All of the City’s major funds are balanced for each year of the 10-Year Financial Planning period and therefore are in compliance with the City Council Budget and Fiscal Policy with the exception of the Parks Fund and the Solid Waste Fund . Please note the following comments regarding these funds .
The Parks Fund has been impacted by the additional positions required to take on athletic field sched uling from Apex, address service level challenges and implement the major findings of the 2021 Accident Investigation . To address these new conditions, an additional $500,000 annual payment from the General Fund has been allocated to the Parks Fund While this additional General Fund allocation has improved the near-term financial projections for the Parks fund, the 10-Year model shows a deficit beginning in 2026
The financial impact of the field scheduling transfer and additional positions will take some time for the Vibrant Communities and Neighborhoods team to work through in order to balance the 10-Year Model
As the team fully implements and then evaluates field scheduling and programming, there may be oppor tunities to reduce costs, increase revenues or make other changes that will reduce the deficit over time. If the deficit cannot be reduced, the City team will need to determine other strategies to address this chal lenge
The Solid Waste Fund is a new fund that was established to implement the City’s organized waste haul ing and recycling program in 2021 Two new utility technician positions are charged to this fund as well as the costs necessary to implement this new initiative, including the purchase of carts for the estimated 25,000 households . Internal borrowing from the Water Fund reserves will be used to stand up the Solid Waste Fund . This fund is projected to repay the Water Fund and meet the City Council Budget and Fiscal Policy requirements by 2026 .
The Work Systems begins on page 135 with the Community and Economic Development Work System . This section provides additional revenue and expenditure details as well as the Strategic Results that are included within the City Council Strategic Plan for each work system . The Work Systems section is intended to illustrate the relationship of each work system to the Strategic Plan, demonstrate value and show transparency . Milestones and performance measures are included to help tell the story . Council and community members will be able to review this information and determine the performance mea sures that are meeting or exceeding the target, just under the target or not meeting the target .
Capital Improvement Projects (CIPs) are presented beginning on page 177 . The CIPs are presented within the major functional areas of General Administration, Transportation, Facilities, Parks, Golf, Water, Wastewater and Stormwater Consistent with the Council Budget and Fiscal Policy and focus on longterm planning, the CIPs are projected over a long-term planning horizon through 2032 All capital projects that require ongoing expenditures following completion include an estimate of Operations and Mainte nance (O&M) costs that are allocated from the 10-Year Financial Models of the appropriate fund
The CIPs section summarizes the City’s focus on Taking Lasting Care (TLC) and implementing the pri orities and projects identified by the Citizens Capital Improvement Project Committee (CCIPC), which was formed in 2015 at the direction of the City Council This section also summarizes Strategic Results included in the 2020-2025 City Council Strategic Plan that determine funding priorities within the 20232032 Capital Improvement Plan
The CIPs section also presents a summary of continuing capital projects, all projects currently funded in the 10-Year Financial Model, and a detailed description of the funding and expenditures for the 2023 projects . All funded projects demonstrate alignment with the Strategic Plan, including the related strategic priority area and associated strategic principle . Over $815 million is committed to CIPs through 2032 . Please note the following limited list of high-priority projects is highlighted below as a sample of the more than 100 projects scheduled for completion or implementation in 2023, and each is explained in more detail within the CIPs Section:
• Ralston Road Reconstruction, Phase II
• W . 72nd Avenue and UPRR Grade Separation
• Traffic Signal Replacement
• W . 58th and Ward Intersection Improvements
• Annual Street Maintenance Asphalt and Concrete Replacement
• ADA Compliance – Facilities and Streets
• Sidewalks, Trails and Mobility
• Denver Water Moffat Project
• Water Distribution System Upgrades
• Ralston Plant Storage Tank Expansion
• North Trunk Sewer Line
• Median Renovations
• # 04 Trolley Park
• Meyers Pool Replacement
• Public Safety Evidence Building
The CIPs section also includes a list of over $844 million in un-prioritized projects These projects include W . 72nd Avenue improvements – Simms to Indiana ($33 million), Indiana Street widening, W . 64th to W . 86th ($42 million), Missing Sidewalks ($25 million), Gibbs West Community Park ($29 million), Trail Gaps ($50 million), Lake Arbor USGA Recommended Improvements ($550,000), Ralston Creek Flood Prevention Improvements ($28 .5 million) and Ralston Water Treatment Plant Storage Plant Tank Expansion ($33 million) . Additional projects will be added in future years related to the Americans with Disabilities Act (ADA) improvements with an estimated price tag of over $220 million . Please also remember that we are approximately $8 million to $10 million underfunded in our annual asphalt and concrete replacement street maintenance program . As we evaluate project and program priorities, we must account for continu ous revaluation of the un-prioritized projects described in the CIPs section
A summary of Debt Service Obligations is presented beginning on page 301 . This section summarizes the City’s long-term debt obligations, reviews state laws that regulate debt obligations and presents the City’s bond ratings Debt service requirements for all outstanding long-term debt obligations are sum marized for Council and community review This of course includes the Series 2019 Sales and Use Tax Revenue Bonds that are funding the Ralston Road Phase II and W 72nd - Kipling to Simms projects and the Series 2021 Certificates of Participation issued by the City Jefferson R-1 School District fund the replacement of the Meyers Pool complex
The Pay Plan Schedules section presents a summary of changes to the City positions within each Work System The summary starts on page 307 with 29 titles for the added positions and continues with changes due to new titles or reclassifications for existing positions. The title and reclassification changes are primarily associated with changes in job requirements and/or positions that take on new duties . Updating the pay plan is an important component within the City’s Total Compensation Philosophy wherein we strive to be an employer of choice within the Denver/Boulder region that attracts and retains highly talented and engaged employees .
The Pay Plan Schedules section also includes the total number of positions listed by fund, department and position, and the changes between 2021 Actual, 2022 Actual and the 2023-2024 proposed budgets .
The City Council Budget and Fiscal Policy is presented on pages 331-334 and is included to emphasize the connection of the budget to the CCSP and provide other foundational elements associated with the budget, including mandated minimum reserve levels for each fund, updated 10-year Financial Mod els, timely reporting of CCSP Strategic Results and Internal Service Funds
The final section of the budget is the Glossary of Terms, which is provided to assist those unfamiliar with budgeting terms and includes a few terms specific to the Arvada financial planning process.
As we present the proposed 2023-2024 Budget, the City organization is facing a critical shortage of team members in certain work units . The current shortage is most apparent in the Police Department, which is down by 28 sworn positions as this letter is being drafted .
The reasons associated with these vacancies vary from person to person . In some situations, the disrup
tion caused by the pandemic has caused some of our team members to reevaluate priorities associated with family and/or career interests and many have decided that public service is no longer appealing . For the Police Department, the national narrative associated with policing combined with reduced sentencing for offenders and higher standards to jail suspects is creating tremendous frustration.
While personal choice is a factor in such decisions, we must also consider the information generated by our 2022 annual market benchmark study for all jobs in the City’s pay plan . This study determines how salaries have changed in the market year over year .
The 2022 study indicates that salaries have moved an average of 6% for all job families, with the excep tion of the Executive job family which has moved more aggressively at a rate of 15-18% . Therefore, the Leadership Team believes that compensation is a factor . Whether or not the most recent compensation increase is enough to stem the tide and retain the best and brightest of our workforce remains to be seen .
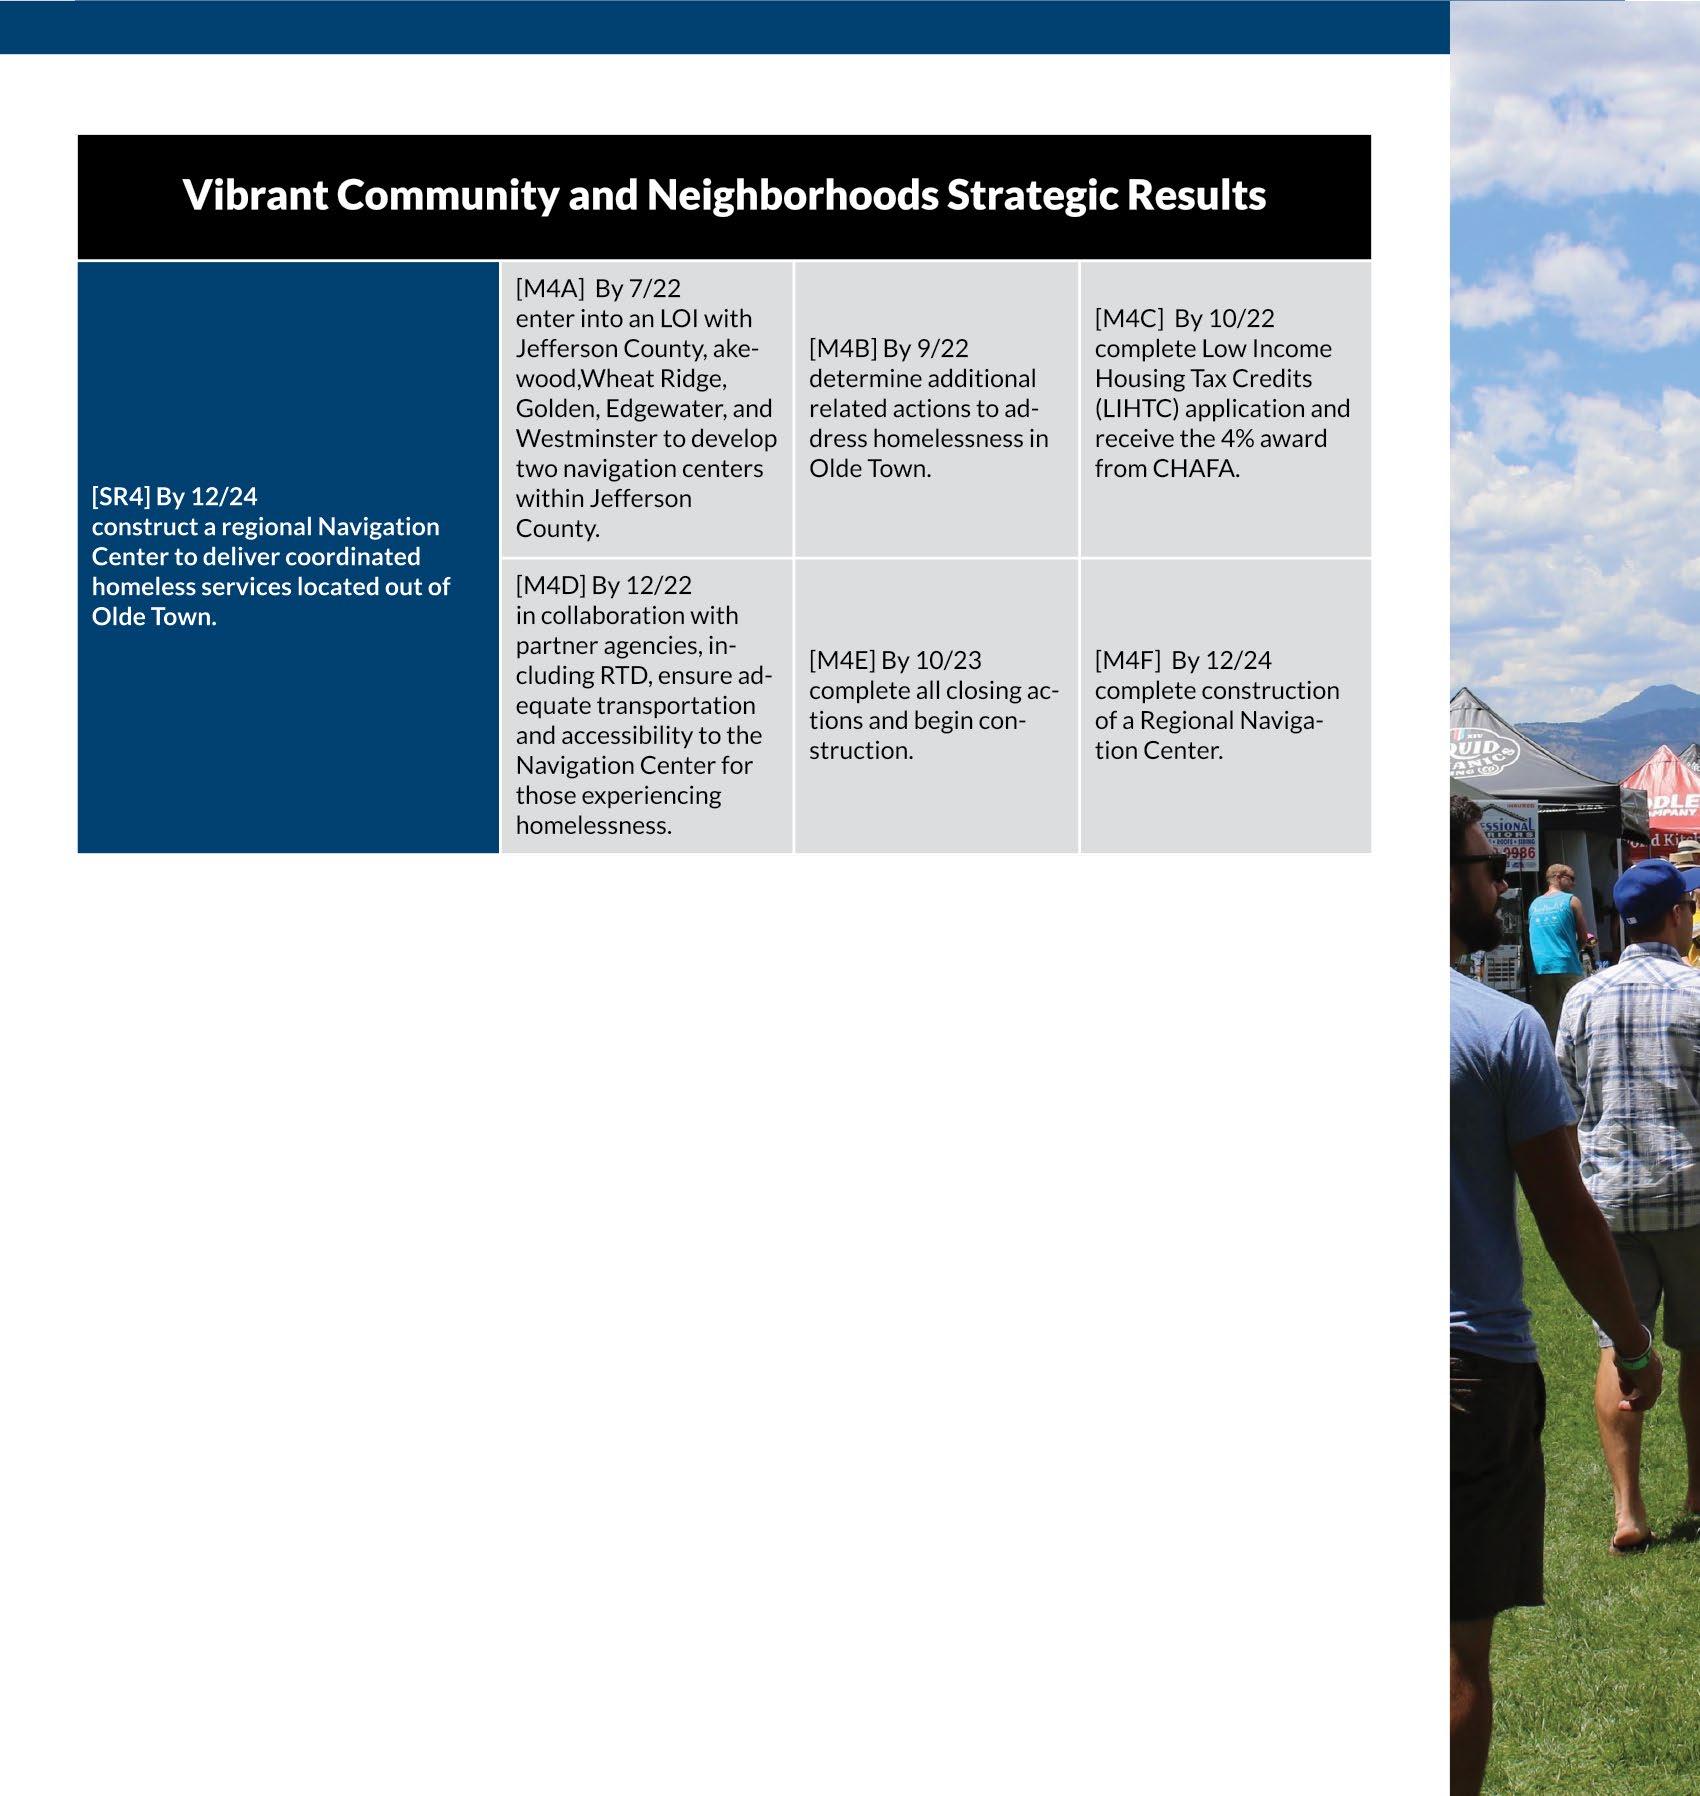
We are also engaged on a regional level to address homelessness that is impacting Jefferson County and the entire Denver Metro Area. Two Navigation Centers are planned to operate within Jefferson Coun ty in the northern and southern areas. Lakewood and Arvada have committed to finding locations for these Navigation Centers
On March 7, the City Council approved an agreement and the allocation of $2 75 million of ARPA funds to purchase a site that is planned to accommodate the northern Homeless Navigation Center campus at 5045 Marshall Street Lakewood is working on purchasing a site to accommodate the southern Naviga tion Center campus. Both sites will include affordable housing units and wrap-around services that are intended to support the transition of unhoused individuals and families into a more stable life An Inter governmental Agreement (IGA) with the other Jefferson County local governments is being drafted and will be considered by all of our partners within the next few months
The IGA will include financial commitments associated with the development and operation of the Navigation Centers . If the IGA is approved by all parties, contributions for the development of the site from the other local governments is expected to offset approximately $1.7 million of Arvada’s cost to purchase the site based on current financial assumptions.
There will also be annual contributions for the operating cost associated with the two Navigation Centers . Arvada’s annual contribution is expected to be approximately $1 million beginning in 2026 . Funding for this annual contribution has not been identified yet and will likely need to be reallocated from existing services and programs that have been implemented for the unhoused population . Our team will need to develop options for the City Council to consider if we are to remain engaged in this regional effort.
While Arvada remains in a very financially strong and resilient position, we must recognize that we will face challenges in the near future and over the long term . Our commitment to increase compensation in order to retain team members, add positions in order to maintain service levels, execute capital proj ects and fund new initiatives such as homelessness, affordable housing and sustainability are creating a higher level of financial risk then we have in the past. Our 10-year Financial Plans will provide us with options to create a “soft landing” should economic conditions abruptly change from the assumptions that have been factored into the proposed budget For example, a serious recession similar to the event that occurred from late 2007 through 2011 will require a reevaluation of priorities and potential reduction of service levels. Our current financial models will allow this to occur over multiple years so that the chang es would be planned, measured and strategic
The possible exception to the “soft landing” scenario is the Parks Fund which is faces a deficit beginning in 2026 . The VCN team is already working on possible service level changes that may need to be considered within the next two years .
As council members are well aware, transportation infrastructure remains significantly underfunded despite the increased investment of General Fund and HUTF resources of nearly $12 million annually, a nearly 500% increase over the last ten years. Our buildings and other public facilities require significant investment in order to improve accessibility for all people. This year, the Council identified the need to increase funding to improve the appearance of our medians and our proposed annual allocation of $200,000 is a modest investment .
The City Council Strategic Plan includes a new Strategic Result which will require the use of our longterm financial projections and updated master plans to develop financial resiliency recommendations that will ensure adequate and on-going investment in City infrastructure and core services . These rec ommendations are to be presented to the City Council by December 2024 The purpose of this work is to recognize our funding challenges and address them through a planned, measured and strategic process ahead of the need to make immediate decisions and choices It is anticipated that the options will include a combination of service level reductions, strategies to increase revenue, and initiatives to create efficien cies that will reduce operating costs
Over the last several years, the City has collected revenues that exceeded budgeted estimates while managing expenditures at or below budgeted levels This result occurred as the regional and local economy generated building and sales tax revenue during the historic economic expansion that began in 2012 and continued through 2019 The growth economy allowed the City to generate surplus funds, which the Council considered for a supplemental allocation in order to fund strategic opportunities the following year . Examples of funded strategic opportunities include the Transit Hub, Olde Town Improvements, Ralston Road Phase I and contributions to the Street Maintenance Fund .
We anticipate the possibility of limited one-time funds in 2023 . While acknowledging the possibility of one-time funds, we must exercise caution as we consider any allocation of these resources . The increased compensation we have agreed to implement in order to retain Arvada team members utilized projected salary savings to fund the additional costs . We also need to retain capital project savings in order to build up contingency funding for the current bond projects that have faced escalating costs primarily due to inflation. Finally, we have only $700,000 remaining in uncommitted ARPA funds following the decision to allocate $500,000 in order to support the Chamber’s B .O .L .D . imitative as it aligns the priorities expressed in the Strategic Plan . These facts suggest that the consideration of one-time funds generated by projected revenue increases over our initial estimates and expenditures below budgeted levels will be very limited
If we do have limited one-time funds available, we should consider the application of these funds for strategic infrastructure projects that remain under-funded These projects include the annual street main tenance program, accessibility improvements for City buildings and public infrastructure, and median renovations
The challenges associated with preparing and presenting the Proposed 2023-2024 Biennial Operating and Capital Budget and updated 10-year Financial Models have been expressed within this letter De
spite the challenges, we are proud to present to the City Council and the Arvada community this document that funds current and emerging priorities and, with one exception, is consistent with the City Coun cil Budget and Fiscal Policy. Specifically, the Proposed 2023-2024 Budget and 10-year Financial Models fund all core government services at the present levels; retains all team members; adds new team mem bers to address significant and emerging priorities; implements compensation increases consistent with our Total Compensation Philosophy; funds strategic investments in capital projects; and continues pro jected contributions into internal service funds to support capital assets such as technology, vehicles and facilities, and to mitigate risk
In closing, I want to thank the Leadership team for their amazing collaboration and teamwork in devel oping this Budget This team worked diligently to overcome the challenges and agree on the highest priorities, continue and improve City operations, advance strategic initiatives and complete projects They collaborated across work systems and with their department teams in order to identify the strategies to meet the many and varied challenges In addition, our Finance team developed excellent revenue and expenditure projections, reviewed and validated proposed expenditures, and presented alternatives for the Leadership team to consider as we finalized the allocation of $359,784,184 in public resources. In service to the Arvada community, through adversity and with resilience, we will continue to “Dream Big and Deliver!”
Respectfully submitted,
 Mark G Deven City Manager


Arvada is a beautiful first-ring suburb of Denver, the Mile High City, with a small-town feel despite its estimated population of 120,492 Established in 1870, Arvada enjoys a rich history, quiet tree-lined neighborhoods, and a robust mix of business Our strong civic leadership balances quality of life with an understanding and support of business and economic development . The City has been recognized at the state and national level for its business retention program .
Arvada’s land encompasses nearly 23,000 acres Three proximate interstate highways provide easy access to the larger metropolitan region and Denver International Airport An extraordinary trail system links with Denver trails on the east and the foothills of the Rocky Mountains to the west, punctuated with thousands of acres of parks and open spaces .
Arvada’s historic downtown provides an eclectic shopping and dining experience, and includes one of three area transit stops as part of the metropolitan FasTracks light rail system
Arvada’s diverse economic base, highly educated workforce, low crime rate, and superb quality of life have helped shape our community into one of the most attractive and competitive cities in the Centennial State!

• Jobs in Arvada: 27,685


• Median Income: $72,010
• Unemployment Rate: 2 .8%
• 120,492
• Households: 46,983
• Average Family Size: 3 0
• Owner Occupied: 76% (vs 24% Renter Occupied)
Real Estate - Residential
• Median Rent: $1,139
• Median Single Family Home Sales Price: $445,000

• Median Townhouse/Condo Sales Price: $283,750
Real Estate - Office
• Average Rent(Sq Ft): $21
• Vacancy Percentage: 6 .1%
• Vacant Sq Ft: 106k
Real Estate - Retail
• Average Rent (Sq Ft): $21
• Vacancy Percentage: 4 .2%
• Vacant (Sq Ft): 270k
Real Estate - Industrial
• Average Rent (Sq Ft): $12
• Vacancy Percentage: 3 .6%
• Vacant (Sq Ft): 170k

• K-12 Schools: 31
• Students: 15,711
• Teachers: 1,248
• Other Staff: 901
We Dream Big and Deliver
We are dedicated to delivering superior services to enhance the lives of everyone in our community
Innovation - We excel in creativity, flexibility and the use of best practices while valuing diverse backgrounds, ideas and perspectives.
Passion - We are a high performing, inclusive team inspiring each other to pursue excellence.
Opportunity - We value our diversity, embrace possibilities, face challenges, perservere and take action to deliver quality results.


The City of Arvada is a political subdivision of the State of Colorado, located in Jefferson and Adams Counties in the Northwest quadrant of the greater Denver, Colorado, metropolitan area The City Char ter establishes a Council-Manager form of government . The City’s governing body consists of an elect ed Mayor and six -member Council The Mayor and Council appoint a City Manager The City of Arvada is a “home rule” City, governed by its City Charter, the Colorado State Constitution, and City ordinances as adopted by the City Council .
The City Charter requires the adoption of budgets for the general fund, special revenue funds, debt service funds, capital projects funds, and proprietary funds. Budgets are not required for fiduciary funds. A fiduciary fund is custodial in nature and is used to account for assets that the government holds for others in an agent or trustee capacity
City Council annually appropriates all budgeted funds with the exception of the capital projects funds . Project-length budgets are adopted for these funds The City adopts budgets for all funds using the modified accrual basis of accounting, the same basis used in the entity’s financial statements, consistent with generally accepted accounting principles (GAAP)
The City Manager submits a proposed budget to the City Council for each of two budget years (January 1 to December 31) The budget includes an explanatory message and is submitted in early September The proposed budget contains a complete and detailed financial plan for all City funds. The proposed budget is open for public inspection and review By October 15th, City Council conducts at least one public hearing on the proposed budget. Not less than sixty days prior to the first day of the next fiscal year, City Council adopts the City budget by resolution and the annual appropriation by ordinance . The City prepares a combination line-item and program budget, but the legal level of control is at the fund level which is the amount approved by ordinance .

FEBRUARY
JUNE
A brief description of the City of Arvada’s fund structure follows:
• General Fund - This fund accounts for all the financial resources of the City which are not required to be accounted for in another fund
• Streets Fund - This fund accounts for costs associated with street repair and replacement including crack sealing, chip sealing, seal coating, milling and overlay and reconstruction . Revenues are derived from the City’s General Fund and the Highway Users Tax Fund which is the City’s share of the sate-collected tax revenue . This fund is budgeted separately, but included with the General Fund in the City of Arvada Annual Comprehensive Financial Report (ACFR)
• Arvada Housing Authority Fund – The Section 8 Housing Assistance Payments Program is administered by the Arvada Housing Authority
• Community Development Fund – This fund accounts for all entitlements, revenues and expen ditures of the Community Development Block Grant (CDBG), the Home Rehabilitation and the Essential Home Repairs programs .
• Parks Fund – This fund accounts for costs associated with the acquisition, design, development, maintenance and beautification of City parks, open space and trails.
• Police Seizure – Colorado State Statues authorize local law enforcement agencies to seize cash and other assets belonging to persons convicted of public nuisance crimes . This fund was established to account for these resources as they are awarded and expended by the City’s law enforcement agency
• Police Tax Increment Funds – The purpose of the tax increment funds is to account for the voter-approved sales tax increment ( 21 and 25) to fund expanded police services
• Grants Fund – This fund accounts for receipt of lottery monies through the Conservation Trust Fund .
• COP Debt Service Fund – This fund accounts for the payment of principal and interest on the $11,820,000 Series 2015 Refunding Certificates of Participation, the $11,180,000 Series 2016 Certificates of Participation and the $17,605,000 Series 2021 Certificates of Participation.
• Debt Service Fund – This fund accounts for the payment of principal and interest on the $70,925,000 Series 2019 Sales and Use Tax Revenue Bonds .
• Capital Improvement Projects Fund – This fund accounts for the financial resources to be used for the acquisition or construction of major capital projects (other than those financed by the Enterprise or Internal Service Funds)
The major Governmental Funds, as reported in the 2021 City of Arvada’s Annual Comprehensive Financial Report (ACFR), were the General Fund, Community Development Fund, Parks Fund, Construction Fund and General Capital Improvement Projects Fund .
• Insurance Service Fund – This fund accounts for the activities associated with the City’s worker’s compensation and property and liability insurance activities .
• Print Shop Fund – This fund accounts for the activities associated with the print shop operations
• Computer Fund – This fund accounts for the accumulation of financial resources necessary for the timely and orderly replacement and maintenance of the City’s computers
• Vehicles Fund – This fund accounts for the accumulation of financial resources necessary for the timely and orderly replacement and maintenance of the City’s vehicles and equipment .
• Building Fund – This fund accounts for the accumulation of financial resources necessary for the maintenance of City buildings
• Water Fund – This fund accounts for administration, operations, capital outlay, maintenance, debt service and billing and collection for the water utility operations
• Wastewater Fund – This fund accounts for administration, operations, capital outlay, mainte nance, billing and collection for the collection, transmission and disposal of sewage and wastewater
• Stormwater Fund – This fund accounts for all activities necessary to maintain a stormwater management plan
• Solid Waste Fund – This fund accounts for all activities necessary to maintain the solid waste and recycling program .
• Golf Course Fund – This fund accounts for all revenues and expenses of the Lake Arbor and West Woods Golf Courses
The major Enterprise Funds, as reported in the 2021 City of Arvada ACFR, were the Water Fund, the Wastewater Fund, the Stormwater Fund, the Golf Course Fund and the Solid Waste Fund
General Fund
Grants Fund
Street Maintenance Fund
Community Development
Arvada Housing Authority
Parks
Police Seizure
Police Tax Increment Fund
Police Tax Increment Fund
COP Debt Service
Debt Service Fund
Capital Projects Fund
Special Assessments Fund
Water Fund
Wastewater Fund
Stormwater Fund
Solid Waste Fund
Golf Course Fund
Insurance Fund
Computer Fund
Print Shop
Vehicle Fund
Building Fund
Annual budgets for governmental funds (General, Special Revenue and Debt Service funds) are prepared separately using the modified accrual basis of accounting, the same basis of accounting that is used in the entity’s financial statements. Under the modified accrual basis of accounting, revenues are recognized in the accounting period in which they become available and measurable, and expenditures are recognized in the accounting period when the liability is incurred, if
Annual budgets are also created for all Enterprise and Internal Service funds This basis used to budget these funds is also a modified accrual basis of accounting which includes capital expenditures and current debt service principal and interest payments and excludes depreciation, amortization and adjustments for accrued compensation absences .
Control of expenditures is exercised at the fund level Once the City Council adopts the budget, the City’s financial management system is used to monitor activity. Quarterly financial reports are prepared for City Council and compare actual expenditures and revenues against the budgeted and prior year amounts . Reviewing actual expenditures to budgeted amounts on a fund-by-fund basis ensures that expenditures are within the legal appropriated limits required by the City’s Charter
Once the budget is adopted, transfers between line items for regular operating expenses, within funds and programs, can be accomplished with the approval of the department director . Transfers from any personnel accounts require the approval of the department director and the City Manager .
The adopted budget can be amended during the year This action requires City Council approval in the form of a resolution . At the end of the year City Council approves a supplemental appropriation by ordi nance for the budget amendments approved throughout the year for any unforeseen changes arising after the adoption of the annual appropriation A supplemental appropriation can be made as long as the total amount budgeted does not exceed the actual or anticipated revenues and the available fund balance
All appropriations not spent at the end of the year lapse into the fund balance applicable to the specific fund except for appropriations in the Capital Improvement Fund which do not lapse until the project is complete or abandoned
In 2015, City Council adopted a budget and fiscal policy that utilizes long-range planning for each of the City’s major operating funds to maintain the fiscal health of the City. Specifically, the City prepares a twoyear budget based on a ten-year financial model. This method of budgeting is used to determine if future impacts of the current proposed budget are fiscally sound. Using this ten-year model, the City is able to test the effects of current financial decisions on future years’ financial conditions when approving funding requests throughout the organization .
There are many variables and factors that impact the ten-year model . These components include the following: beginning fund balance, projected revenues, projected expenditures (including capital expen ditures), ending fund balance and required Council established fund balance goals Revenue and expen diture projections are based on historical trends, various economic and inflation forecasts, and known changes in operations, legislation and capital outlay requirements .
The budget process begins with the estimated beginning fund balance for the current year Projected revenues and expenditures are applied to the beginning balance to calculate the ending balance for the proposed budget year This process is continued for the next ten years The resulting calculation of the ending balance in year ten is compared to the calculation of the minimum required fund balance goal .
The bottom line is that each fund should work towards maintaining a fund balance that is equal to, or exceeds, the required fund balance goal in the tenth year The “Ten-Year Models” section of this document includes summaries of ten-year financial models for the City’s major operating funds.
The comparison of ending balances to the required fund balance goal in the tenth year reveals whether or not adjustments in the current level of proposed expenditures are necessary in order to maintain long-term financial stability. If the ending balance is equal to or exceeds the fund balance goal, no adjustment in the current proposed budget is necessary The fund may also contemplate additional expenditures based on the needs in the fund . However, if it is less than the ending fund balance and the fund balance goal, the City has ten years to either eliminate one-time capital expenditures, reduce on-going operating expenditures, or some combination of the above to work toward the fund balance goal .
Taking a long-term view of the City’s current operations insures that the City acts in a fiscally responsible manner . Budgeting in this manner also allows management time to react and respond to changes in the economy and minimizes the effect of budget fluctuations on service delivery.
The City defines a balanced budget when estimated expenditures do not exceed estimated revenues and available fund balance for each year of the two-year budget For the 2023 budget, the City proposed a balanced budget
• The City Manager is responsible for recommending a balanced budget to the City Council sixty days prior to the first day of the next fiscal year.
• The City defines a balanced budget when estimated expenditures do not exceed estimated revenues and available fund balance .
• The City’s budget is prepared on the modified accrual basis for all funds, and assumes that prior year ending fund balances may be utilized to balance the budget .
• The City avoids the use of non-recurring and unpredictable revenues to fund ongoing expenditures
• The City will create and maintain a ten year financial forecast for each fund named in the City Council Budget and Fiscal Policy and work towards maintaining a fund balance that is equal to, or exceeds the fund balance goal in the tenth year .
• The City will provide ongoing funding for required capital maintenance and replacement through the Computer Maintenance and Replacement Fund, Vehicle Maintenance and Replacement Fund and Building Maintenance Fund
The City will create a ten-year Capital Improvement Plan that lists all capital improvements proposed for the ten year period including a project description, estimated project cost and timeline and alignment with any City Council Strategic Results .
A top priority of the City Council is to maintain the fiscal health of the City. Revenue projections are appropriately conservative and expenditures are monitored throughout the year . In stable economic times, the combination of these two strategies leads to revenue collections being higher than budgeted and expenditures being lower than budgeted . The combination of the two usually leads to additional monies in the fund balance which can be used for unanticipated increases in expenditures, unforeseen reductions in revenues, financing of one-time capital expenditures, adding to the fund balance or a combination of all the above. If these monies are used for expenditures, their use is not approved until the next year .
Included in the budget and fiscal policy adopted by City Council in 2015, is a required fund balance reserve that is established to mitigate current and future risks (e g revenue shortfalls or unanticipated expendi tures) . The City maintains a fund balance in its General Fund equal to 17% of annual expenditures . Three percent is reserved for emergencies as required by Article X of the Colorado Constitution . The remaining 14% protects the City from cyclical fluctuations in revenues or unanticipated expenditures. The City also establishes an individualized fund balance requirement for various operating funds Use of fund balance reserves must be recommended by the Finance Director, and approved by the City Manager and City Council
The Colorado statutes and the City of Arvada Investment Policy govern general provisions for the City’s investment strategies The investment policy for the City shall apply to the investment of all general and special funds of the City of Arvada over which it exercises financial control.
The City’s objectives for cash management and investments are:
• Preservation of capital through and protection of investment principal
• Maintenance of sufficient liquidity to meet the City’s cash needs
• Diversification to avoid incurring unreasonable market risks
• Maximization of the rate of return for prevailing market conditions for eligible securities
The Investment Policy further restricts the investment of City funds to the following types of securities and transactions:
• U S Treasury Obligations
• Federal Agency and Instrumentality Securities
• Repurchase Agreements
• Commercial Paper
• Corporate Debt
• Municipal Bonds
• Certificates of Deposit
• Local Government Investment Pools
• Money Market Mutual Funds
• Securities of the City of Arvada
• Short-term borrowing or lease-purchase contracts may be considered for financing major operating capital equipment when the Finance Director, with approval of the City Manager and City Council, determines that this is in the City’s best financial interest.
• Long-term debt will not be used to finance current operating expenses. When long-term debt is warranted for a project, the payback period for bonds used for the project must not exceed the useful life of the project
• The City of Arvada will attempt to obtain a minimum AA bond rating, although is currently rated AAA, and maintain a favorable rating through prudent financial management and adherence to a policy of full disclosure on financial reports.
• As required by State Statute, appropriate elections will be held to obtain voter approval for debt issuance
• The City will hire qualified bond counsel and financial advisors and market its debt on a competitive basis
•
Refunding or prepayment of outstanding debt may occur when the possibility of interest cost reduction exists, or the City wishes to restructure its debt service
In 1992, voters approved an amendment to the Colorado Constitution (Article X, Section 20) that places limits on revenue and expenditures of the state and local governments Even though the limit is placed on both revenue and expenditures, the constitutional amendment ultimately applies to a limit on revenue collections Growth in revenue is limited to the increase in the Denver-Boulder Consumer Price Index plus local growth (new construction and annexation) . This percentage is added to the preceding year’s revenue base, giving the dollar limit allowed for revenue collection in the ensuing year . Any revenue collected over the limit must be refunded to the citizens . Federal grants or gifts to the City are excluded in the revenue limit
In November 1996, the qualified electors of the City approved Resolution R96-127 which reads as follows:
Without creating any new tax or increasing any current taxes, shall the City of Arvada be permitted, in 1996 and each year thereafter, to retain and spend City revenues in excess of the spending, revenue raising, or other limits in Article X, Section 20 of the Colorado Constitution, utilizing such revenues for public safety, municipal services, transportation and other public improvements, parks and recreational facilities, and any other lawful public purpose?
Arvada is continuing to make decisions under the FOCUS performance-management system This inte grated performance-management system is not a project with a defined end date. Rather, this is a pro cess that defines how staff looks at what they do each day and how this supports the City Council Strate gic Results . It provides data for decision making and helps drive funding decisions for the many programs Arvada citizens want and need . Citizens will be able to see the value they receive for their investment through the performance measures and strategic results
All the revenue and expenditure assumptions for the 2023-2024 Biennial Operating Budget were made in the context of the FOCUS Arvada framework . Each department’s budget was based upon six key elements: a mission statement, a vision statement, Council strategic plan, department strategic results, lines of business and programs Using this framework and keeping the customer experience in mind, key results are identified that are to be accomplished during the two-year budget.
On September 16, 2019, City Council adopted a new six-year City Strategic Plan 2020 to 2025 . Their plan outlined five priority areas and 29 strategic goals to be accomplished over the next six years. City staff uses the Council’s identified strategic measures to develop milestones and measures to identify what results are being achieved and what needs refined. With these measures in place, discussions follow pertaining to process and budget, with the resulting goal of a true performance-based system City Council adopts annual revisions to the strategic plan to recognize updates to current goals and remove goals that have already been achieved The revisions approved on June 1, 2020 changed the timelines on a few of the approved measures due to the COVID pandemic . The revisions approved on July 19, 2021 added four measures to the plan . The most recent revision approved on May 16, 2022 added seven measures to the plan and removed two measures
US Gross Domestic Product (GDP) grew at an annualized rate of 5 7% for year ending 2021, the largest number since 1984 This was driven by a 6 9% increase in the fourth quarter alone The concept of “transitory inflation” went out the window with the Fed now trying to slow down the rapidly increasing inflationary rate. After receiving this data, the Fed telegraphed the start of rate hikes in March 2022. The Fed followed through by raising rates four times so far this year with three more expected this fall . The current short term interest rate target, as of August 2022, sits at 2 25% – 2 5% with the year-end number expected to be between 3 .25% and 4 .0% .
Unfortunately, inflation has continued to rise up to 9.1% for the 12 months ending June 2022, the highest in 40 years, consumer credit card debt has risen significantly in the past year just short of record all-time highs, vehicle debt is at a record high, consumer sentiment has fallen leading to a reduction in personal consumption, industry production has started to slow with many larger companies freezing hiring or even laying off team members and the 2-year and 10-year yield curves continue to be inverted.
Finally, the Gross Domestic Product (GDP) decreased at 0 .9% for the second quarter of 2022 . This marks the second consecutive quarter of negative growth, with the first quarter being down 1.6%. The technical definition of a recession is two consecutive quarters of negative economic growth, leaving the United States in a “technical recession” right now. What a lot people do not know is that the official pronouncement of a recession, for the United States, comes from a team of eight economists chosen by the National Bureau of Economic Research, called the Business Cycle Dating Committee . This group has been responsible for identifying recessions and has set the dates for the start and end of recession since 1978. Unfortunately, this group usually waits a while after a recession has begun to officially pronounce it, sometimes until the recession is actually over
Federal unemployment has dropped to 3 .6%, the lowest since March of 2020, and has stayed steady . Job openings still outpace the number of workers available, reducing the production of goods and increasing inflation as demand for goods has remained high.
The City’s general revenue collection is influenced by many different factors. Two of the major contrib utors are sales tax and building activity . As illustrated in the discussion below, the City has experienced very positive results in nearly every major sales tax revenue category for the past ten years In 2021, the City experienced consistent revenue growth with every month but August showing double digit year over year increases. The majority of this growth was driven by the increase in on-line sales and inflation. The City finished the year with a 15.4% increase in sales tax revenue, the largest since 2005. The City’s retail offerings include many essential businesses such as grocery, warehouse, online retail and home improvement stores This has allowed sales tax, the City’s largest revenues source, to be more stable than many other government entities . 2022 appears to be following the positive results of 2021 with some areas starting to slow down All major City revenues are up compared to 2021 except for court revenues and building use tax .
A 3% sales tax rate on all goods sold within the city limits pays for more than 53% of the General Fund services In addition, it pays for 82 police positions through an additional dedicated 0 46% tax on the same goods .
In six of the past eight years, there has been significant sales tax growth. The following graph illustrates the percentage increase each year since 2015. Since 2015, sales tax grew an average of 6%, significantly higher than the expected growth rate of 2 5% In the last two years, sales tax growth has exploded to an average of 12% per year . Initial estimates for sales tax growth in 2020 were conservative given all the COVID-19 restrictions The City saw an incredible increase of 9% in 2020 and this was followed up by a 15% increase in 2021 . The increase in sales tax can be attributed to the City’s main sales tax generators which are grocery stores and general department stores that had double digit increases and on-line retailers . The City also saw a 48% increase in its on-line retailer’s category as a result of the Marketplace Facilitators Act that was passed in October 2019. Sales tax in the first half of 2022 is continuing at very high pace up 9 6% through the second quarter, with the budget at 9% for 2022 There are signs that sales tax may level off in the second half of 2022 with consumer spending stating to slowdown. For the 2023-2024 budget, the City has projected growth in sales tax to be 3 5% and 1 5% respectively

The following graph demonstrates the trend in single-family housing permits . The majority of this growth from 2012- 2016 is due to two new housing developments in northwest Arvada . However, the City also saw an increase in the smaller in-fill developments around the G Line transit stations. In 2017, the City saw the first decrease in single-family detached home permits since 2011. This trend continued from 2018 through 2021 In 2022 and beyond, the City expects a base level of building activity
While the decrease in building activity
affects building revenues, the City conservatively budgets for building activity and bases building revenue on an average year Revenues from building activity generated almost $6 6 million of the City’s 2021 revenues for general operating purposes, including building use tax and building permits for the General Fund . This amount is reduced to $6 .1 million in 2022 to account for the base level of building activity . A small growth factor of 2 .5% - 3 .0% has been assumed for 2023 and beyond
Unemployment
Unemployment hit a peak of almost 14 7% in April 2020, the highest observed rate since data collec tion began in 1948 . At the state level and local level, this number reached 12 .2% . A large percentage of the jobs that were lost were in the service industry . By December of 2020 the unemployment rate dropped to 6 .7% with the number falling all the way to 3 .9% at the end of 2021 . Unemployment has remained steady since that time period, currently sitting at 3 6% Many industries are experiencing labor shortages, much like 2019, and have needed to cut back their service levels
All of these indicators and more went into development of the assumptions for the “Ten-Year Models .” The 2023-2024 Proposed Biennial Operating Budget document has a separate section for each Fund and the assumptions included in the ten-year plan
The ten-year model is not a budget, but a planning tool . It is important to understand the long-term implications of all current decisions and their impact on the City’s long-term financial plan. Each recom mendation that is included in the ten-year plan includes all operating costs for any new capital or ongoing operation recommendation
Ten-year plans typically anticipate both upticks and downward trends. The prior ten years have reflected the benefits of economic growth, and the resulting increased revenues. With that said, projections in this ten-year plan include impacts of a slowing economy . Revenue growth is expected to continue through 2022 and stabilize in 2023 with a proposed slowdown in 2024 .
Following is a summary of significant revenue and expenditure assumptions in this updated ten-year plan .
• Sales Tax revenue assumes a growth rate of 9% for 2022, 3 5 % for 2023 and a 1 5% for 2024
• Building use tax revenue assumes a reset of the base in 2022 to $3,292,000 with a 3% in 2023 and 2024 Increases of 1% - 4% are estimated for 2025 and beyond with a 0% in 2029 to reset the base again .
• Open Space revenues are derived from sales tax throughout the region Open Space revenues are budgeted to increase at 3 0% - 4 5% for all years of the model
• Water rates are budgeted to increase 12 3% in 2023 with an additional $2 per month increase in the service fee . Increases are estimated at 7% in the years thereafter . The large increase is to help offset inflationary increases and help fund a much needed bond issue to complete some large capital projects .
• Wastewater rates are budgeted to increase 9 8% in 2023 with an additional $1 per month increase in the service fee Increases are estimated at 6% in the years thereafter The large increase is to help offset inflationary increases; fund pass through charges from the Metro Reclamation District and help fund a much needed bond issue to complete some large capital projects .
• Stormwater rates will increase at 2% for 2023 . A 2% rate increase is projected to increase for the years thereafter until the master plan work can be completed
• Personnel-related costs were calculated based upon each employee’s current grade and step and include an assumption for future market-range adjustments (MRA’s) . The MRA methodology is not based on cost of living adjustments, but rather an analysis of each job class in an identified market. The MRA for 2022 was budgeted at 3% and came in at 3 47% This increase was covered by the increases in sales tax revenue . A mid-year 3% market rate adjustment was approved by City Council on August 1, 2022 to try and offset inflationary pressures. An additional 3% MRA is budgeted for January 1, 2023 .
• Medical cost increases are the most unknown due to external national forces and the full implementation of the Affordable Care Act. At this time, the increases are budgeted to be 0% in 2023 and 5% through the rest of the model
• Internal Service costs – insurance, building maintenance, vehicle maintenance and replacement
and computer maintenance and replacement all have increase of 1% - 3% throughout the model .
• Staff vacancy savings have been assumed in many of the funds. These are not the same across each fund due to the analysis of change in personnel by fund . Vacancy savings range from 1% to as high as 3%
• Ongoing street maintenance is now budgeted at $12 million with an additional $1 5 million dollar transfer added starting in 2023 . Variable growth rates from 2 .0%-3 .0% are assumed for the rest of the model .
Over time, each fund needs a well-considered fund balance goal In 2015, City Council adopted a budget and fiscal policy, included in this document under the Additional Information tab, setting minimum required reserve levels . All expenditures and revenues have to be considered within the context of ten-year implica tions . The goal is to ensure all funds have a positive balance, meeting or exceeding the established goal, within the end of the ten-year planning horizon .
• General Fund: 17% of fund expenditures
• Parks, Golf and Hospitality: 11% of fund expenditures .
• Utility Enterprise Funds: 25% of fund expenditures . These funds include: Water, Wastewater and Storm water .
• Enterprise Funds: 11% of fund expenditures This includes the Golf fund

• Internal Service Funds: These funds have no adopted levels, except for the Print Shop which is 11% All funds except the Enterprise funds are balanced throughout the model The Enterprise funds fall un der the required fund balance goal in the ten year model, but recover and meet the fund balance goal by the end of the model .
The factors noted above were all evaluated in developing the 2023-2024 Proposed Biennial Operating Budget . As presented in the following sections, changes to the budget continue to focus on City Council’s Strategic Plan and each individual department’s strategic results and performance measures . In addition, there are changes to ensure that the City continues to offer a competitive compensation package to attract top personnel
Overall, the City has benefitted from a healthy economy for the past ten plus years and the funds had healthy reserves going into the pandemic induced recession . Although the recession was short lived, the City fared much better than many of the comparable Cities and the State of Colorado . Half way through 2022, the City is continuing to see revenue growth in many areas that will help to fund the increasing cost of City operations and offset some of the inflationary growth. The next few years are still unpredictable with a growing concern of a recession. As such, the 2023 - 2024 Proposed Biennial Operating Budget offers an appropriately conservative direction for 2023 .
Bryan Archer Director of Finance• General Fund - This fund accounts for all the financial resources of the City which are not required to be accounted for in another fund .
• Streets Fund - This fund accounts for costs associated with street repair and replacement including crack sealing, chip sealing, seal coating, milling and overlay and reconstruction .
• Arvada Housing Authority Fund – The Section 8 Housing Assistance Payments Program is administered by the Arvada Housing Authority .
• Community Development Fund – This fund accounts for all entitlements, revenues and expenditures of the Community Development Block Grant (CDBG), the Home Rehabilitation and the Essential Home Repairs programs .
• Parks Fund – This fund accounts for costs associated with the acquisition, design, development, maintenance and beautification of City parks, open space and trails.
• Police Seizure – This fund accounts for seized assets awarded under the Colorado State Statutes as they are awarded and expended by the City
• Police Tax Increment Funds – The purpose of the tax increment funds is to account for the voter-approved sales tax increment ( 21 and 25) to fund expanded police services
• Grants Fund – This fund accounts for receipt of lottery monies through the Conservation Trust Fund
• Debt Service Funds – These funds account for the payment of principal and interest on the $70,925,000 Series 2019 Sales and Use Tax Revenue Bonds, $11,820,000 Series 2015 Refunding Certificates of Participation (COP), the $11,180,000 Series 2016 Certificates of Participation and the $17,605,000 Series 2021 Certificates of Participation.
• Capital Improvement Projects Fund – This fund accounts for the financial resources to be used for the acquisition or construction of major capital projects (other than those financed by the Enterprise or Internal Service Funds) .
• Insurance Service Fund – This fund accounts for the activities associated with the City’s worker’s compensation and property and liability insurance activities .
• Print Shop Fund – This fund accounts for the activities associated with the print shop operations .
• Computer Fund – This fund accounts for the accumulation of financial resources necessary for the timely and orderly replacement and maintenance of the City’s computers
• Vehicles Fund – This fund accounts for the accumulation of financial resources necessary for the timely and orderly replacement and maintenance of the City’s vehicles and equipment
• Building Fund – This fund accounts for the accumulation of financial resources necessary for the maintenance of City buildings
• Water Fund – This fund accounts for administration, operations, capital outlay, maintenance, debt service and billing and collection for the water utility operations .
• Wastewater Fund – This fund accounts for administration, operations, capital outlay, maintenance, billing and collection for the collection, transmission and disposal of sewage and wastewater .
• Stormwater Fund – This fund accounts for all activities necessary to maintain a stormwater management plan .
• Solid Waste Fund – This fund accounts for all activities necessary to maintain the solid waste and recycling program .
• Golf Course Fund – This fund accounts for all revenues and expenses of the Lake Arbor and West Woods Golf Courses .
Budget
2023 Funds Available
General Fund
Change in Fund Balance
$56,726,965 $121,226,687 $121,161,816 $56,791,836 0%
Grants Fund $1,036,270 590,529 184,481 $1,442,318 39%
Streets Maintenance Fund $10,744 12,074,121 12,009,303 $75,562 603%
Community Development $6,081,082 895,280 1,324,709 $5,651,653 -7%
Arvada Housing Authority $294,631 5,973,229 5,939,660 $328,200 11%
Parks $5,253,344 12,354,705 13,381,960 $4,226,089 -20%
Police Seizure $45,485 32,304 30,312 $47,477 4%
Police Tax Increment Fund .21 $8,206,431 7,109,038 8,158,595 $7,156,874 -13%
Police Tax Increment Fund .25 $9,918,505 7,999,007 10,148,513 $7,768,999 -22%
Total Special Revenue Funds: 30,846,493 47,028,213 51,177,533 26,697,173
Debt Service Funds:
COP Debt Service $167,945 3,268,984 3,277,985 $158,944 -5% Debt Service Fund $446,815 5,363,782 5,363,782 $446,815 0%
Total Debt Service Funds 614,760 8,632,766 8,641,767 605,759
Capital Projects Funds: Capital Projects Fund $36,634,912 14,292,544 13,401,598 $37,525,858 2%
Special Assessments Fund $17,125 - - $17,125 0%
Total Capital Projects Funds $36,652,037
13,401,598 37,542,983
-8%
$34,701,822
$2,267 103%
$4,515,123
Funds
General Fund
Special Revenue Funds:
Beginning Funds
Budget
Budget
Funds Available
Change in Fund Balance
$56,791,836 $125,310,129 $121,069,821 $61,032,144 7%
Grants Fund $1,442,318 596,435 190,016 $1,848,737 28%
Streets Maintenance Fund $75,562 12,484,244 12,205,400 $354,406 369%
Community Development $5,651,653 715,017 1,329,518 $5,037,152 -11%
Arvada Housing Authority $328,200 6,033,245 6,023,445 $338,000 3%
Parks $4,226,089 12,926,170 13,936,565 $3,215,694 -24%
Police Seizure $47,477 32,545 31,222 $48,800 3%
Police Tax Increment Fund 21 $7,156,874 7,089,246 7,031,237 $7,214,883 1% Police Tax Increment Fund .25 $7,768,999 8,156,564 8,341,275 $7,584,288 -2%
Total Special Revenue Funds: 26,697,173 48,033,466 49,088,678 25,641,961
Debt Service Funds:
COP Debt Service $158,944 3,268,484 3,277,484 $149,944 -6%
Debt Service Fund $446,815 5,361,282 5,361,282 $446,815 0%
Total Debt Service Funds 605,759 8,629,766 8,638,766 596,759
Capital Projects Funds: Capital Projects Fund $37,525,858 8,528,871 6,232,416 $39,822,313 6%
Special Assessments Fund $17,125 - - $17,125 0%
Total Capital Projects Funds 37,542,983 8,528,871
39,839,438
$20,196,692 -42%
$166,722
$3,470,832
All ending fund balances meet or exceed the City Council Fund Balance Goal except for the Parks, and Golf Course funds which are discussed in the Fund Highlights section .
The Grants fund balance increase of 39% in 2023 and 28% in 2024 is due to a reduction in the funding for capital projects .
The Streets Maintenance fund balance in 2022 includes projects that were not completed in 2021 and carried forward to 2022 These projects are expected to be completed in 2022 which will decrease the fund balance in 2022 The fund balance increase of 603% in 2023 and 369% in 2024 is related to the lower beginning fund balance due to projects completed in 2022
The Community Development fund balance decrease of 11% in 2024 is due to a reduction in federal grants related to emergency housing assistance .
Arvada Housing Authority Fund
The Arvada Housing Authority fund balance increase of 11% in 2023 is due to an increase in federal grant funding to assist with the Section 8 Housing assistance program .
The Parks fund balance decrease of 20% in 2023 and 24% in 2024 is due to the loss of reimbursement revenue from the APEX Recreation District for athletic field maintenance. In 2022 the City took over the duties to program athletic fields and all maintenance of athletic fields resides with the City.
Police Tax Increment Fund .21
The decrease of 13% in 2023 is due to a transfer to the Capital Improvement Fund to construct a new evidence storage building
Police Tax Increment Fund .25
The decrease of 22% in 2023 is due to a transfer to the Capital Improvement Fund to construct a new evidence storage building .
The Water fund balance decrease of 30% in 2024 is due to capital expenditures for various capital projects, which are discussed in the Capital Improvement section . It is anticipated the City will issue debt in late 2022 or early 2023 for capital projects, as these projects are constructed the fund balance will decrease . Although, the fund balance of this fund is declining, it will still meet its City Council appointed fund balance goal at the end of ten years
The Wastewater fund balance increase of 970% in 2023 is due to an anticipated bond issuance in late 2022 or early 2023 for various capital projects The fund balance decrease of 42% in 2024 is due to capital expenditures for capital projects, which are discussed in the Capital Improvement section . Although, the fund balance of this fund is declining, it will still meet its City Council appointed fund balance goal at the end of ten years .
The Stormwater fund decrease of 18% in 2023 and 23% in 2024 is due to capital expenditures for Ralston Creek Improvements from Vance Street to Wadsworth By-Pass in 2023 and 2024 . Although, the fund balance of this fund is declining, it will still meet its City Council appointed fund balance goal at the end of ten years .
The Solid Waste fund is a new fund added in 2021 to account for activities of the waste hauling and recycling program in the City of Arvada The fund balance decrease of 24% in 2023 and 29% in 2024 is due to the repay ment of a loan to the Water Fund for cart purchases in 2021 This fund does not yet have an established fund balance goal
The Golf Course Fund will start this budget cycle with a negative fund balance due to the West Woods Golf Course remodel in 2018 and effects from the COVID 19 pandemic which required the Golf Courses to close for a period of time . The fund balance increase of 103% in 2023 and 7,754% in 2024, is due to the restaurants operating at full capacity and the golf courses seeing unprecedented revenues due to increased golf rounds .
The computers fund balance decrease of 31% in 2023 is due to increased costs in items surrounding cybersecurity and a planned city-wide computer replacement program . The fund balance decrease of 12% in 2024 is due to increased costs in items surrounding cybersecurity .
The Print Shop fund balance decrease of 10% in 2023 and 12% in 2025 is due to a scheduled capital expenditure to replace equipment
A detailed replacement schedule is maintained for this fund Because each vehicle has its own replacement schedule, the replacement dollars spent each year can vary depending on what type of vehicle is being re placed The Vehicles fund balance increase of 36% in 2023 and 12% increase in 2024 are due to the decreased replacement of vehicles and equipment .
An energy efficiency agreement was signed in 2020. The agreement will replace lighting, heating, ventilation and air conditioning units, compressors and other building equipment with more energy efficient units. The fund balance will recover as the energy savings will be transferred into the Building fund over the next ten years . This contributes to the fund balance increase of 63% in 2023 and 84% in 2024 .
As the City team was working on the assumptions for the 2023-2024 proposed budget many components were going in different directions. Unemployment has returned to pre-pandemic levels, COVID cases are at their lowest levels and hard hit industries are returning to profitability. Unfortunately, inflation was increasing at levels not experienced in over 40 years, GDP was negative for the first two quarters of 2022 (a technical recession), consumer sentiment has started to fall, consumer credit card debt is just short of all-time highs, vehicle debt is at all-time highs and the 2 year and 10 year yield curves are inverted City revenues are growing at an unprecedented pace Sales tax was up 15 4% in 2021 and 9% so far in 2022 Auto use tax grew 33 5% in 2021 and is on pace to grow over 5% in 2022 Finally, the State of Colorado in creased the gasoline tax that funds the Highway Users Tax Fund (HUTF) expected to increase this revenue by 8% for the foreseeable future
With the additional revenue growth, the City has been able to address some of the higher priority needs making immediate changes to the current budget and future budgets The highest priorities for the 2023-2024 budgets are as follows:
• Maintaining a competitive compensation package for existing employees
• Adding positions to several work systems to maintain existing levels of service and address the new City Council Strategic Results
• Addressing shortages in the building, vehicle, computer and insurance internal service funds
• Increasing the funding for street maintenance to close the ongoing funding gap
• Funding for increasing costs related to capital projects
• Increasing funding to the Parks Fund to help offset the additional costs related to taking over athletic field maintenance programming from APEX
The major differences between the 2022 and 2023 budgets are in the following areas:
• A one-time 3% increase was added in August of 2022 to all grades to try and offset inflationary pressures The market rate adjustment for January of 2023 is estimated to be 3%
• The near-site health clinic combined with the City of Arvada employee’s continued efforts to make well informed healthcare decisions have resulted in favorable claim experience in 2021 and year to date in 2022 . Based on claim experience, the increase in health insurance was reduced from 5% to 0%
• The addition of 27 positions mid-cycle (from October 2021 to July of 2022) has made an immediate impact on the ability of the City to serve its customers The areas addressed were Housing, Home lessness, Parks, Public safety, Engineering and Utilities
• An additional 15 positions are proposed to be added in January of 2023 to IT, AEDA, Engineering, Facilities, Water and Wastewater
• An increase of $1 .5 million dollars annually will be added to the Streets Maintenance Fund to try and close the funding gap
• An increase of $500,000 in the transfer to the Parks Fund to help offset field maintenance costs
• Continued commitment to safe, reliable, high quality water supply, drainage system and wastewater disposal service is a top priority of the City . A water rate increase of 12 .3% and a service fee increase of $2 every month and a wastewater increase of 9 .8% and a service fee increase of $1 every month are necessary to maintain these services . Even with these increases, the City’s rates are very low compared to the surrounding cities
• Significant changes to System Development Charges (formally Tap Fees) will be implemented in 2023 to better align the charges with the true costs and allow the issuance of bonds to pay for much needed system improvements
All changes to the 2023 budget are presented in the following table:
Community and Economic Development
Community and Economic Development
Community and Economic Development
Community and Economic Development
General Fund Credit card fees $50,000
General Fund Senior Economic Development Specialist
General Fund Temporary Wages
General Fund/ Housing
Infrastructure General Fund/ Pub lic Works
Infrastructure General Fund/ Public Works
Infrastructure General Fund/Pub lic Works
Infrastructure General Fund/Pub lic Works
Infrastructure Streets Mainte nance Fund
Infrastructure Streets Mainte nance Fund
Infrastructure Streets Mainte nance Fund
Housing Development and Navigation Supervisor
$130,349
Increase to credit card fees due to increasing costs
New position to support economic development, partially funded from a reduction in temporary wages Salaries and benefits.
CED Challenges
CED Challenges
($60,000)
$137,312
Reduction due to addition of new Senior Economic Development Specialist position .
New position to supervise the Housing navigation and homelessness program Salaries and benefits. (mid-cycle)
Two custodians $149,388 New positions due to additional work loads at City Facilities and the Ar vada Center. Salaries and benefits.
Civil Engineer II $141,412 New position to assist with increased transportation construction projects Salaries and benefits.
Traffic Engineer IV $166,228 New position to implement signal timing, transportation master plan implementation and addressing ongoing citizen concerns with traffic flow. Salaries and benefits.
Public Works Project Manager
$149,661
New position to assist with project management. Salaries and benefits. (mid-cycle)
Truck $6,000 Ongoing replacement and maintenance for the Streets truck
Municipal Inspector II $115,298
Pavement Management Coordinator
$130,743
New position for pavement program inspections for asphalt and concrete construction. Salaries and benefits.
New position for pavement program coordination of additional asphalt and concrete contractors and ADA compliance and oversight Salaries and benefits.
Infrastructure Stormwa ter Fund Training and Supplies $4,181 Increased costs for training and supplies
Infrastructure Stormwa ter Fund Professional Services $83,675
Additional funding to review and provide audit support, floodplain on-call support and miscellaneous drainage program design support .
CED Challenges
CED Challenges
Infrastructure Challenges
Infrastructure Challenges
Infrastructure Challenges
Infrastructure Challenges
Infrastructure Principles
Infrastructure Challenges
Infrastructure Challenges
Infrastructure Challenges
Infrastructure Challenges
Infrastructure Stormwa ter Fund Compliance $176,170
Infrastructure Vehicles Fund CDL training $18,000
Infrastructure Wastewa ter Fund CDL training $18,000
Additional funding to contract the inspection of construction sites to be compliant with state and federal permits
Increase due to new regulations required to train CDL license holders
Increase due to new regulations re quired to train CDL license holders
Infrastructure Water Fund IT/ITCS Security Operations Analyst $141,018 New position for Cybersecurity in the Water fund. Salaries and benefits.
Infrastructure Water Fund Utility Foreman $120,515 New position to support underground damage prevention and distribution water quality monitoring Salaries and benefits.
Infrastructure Water Fund EletroMechanic Technician $122,007
Infrastructure Water Fund Civil Engineer I/II $141,561
New position to assist with preven tive maintenance and calibration of instrumentation in the water distribu tion system. Salaries and benefits.
New position to assist with master planned projects sequenced on "road map" for water and sewer rehabilitation and capacity needs .
Salaries and benefits
Infrastructure Water Fund Civil Engineer III $153,173
New position to assist with master planned projects sequenced on "road map" for water and sewer rehabilitation and capacity needs
Salaries and benefits
Infrastructure Water Fund Civil Engineer II $141,412
New position to assist with master planned projects sequenced on "road map" for water and sewer rehabilitation and capacity needs Salaries and benefits, (mid-cycle)
Infrastructure Challenges
Infrastructure Principles
Infrastructure Principles
Infrastructure Challenges
Infrastructure Challenges
Infrastructure Challenges
Infrastructure Challenges
Infrastructure Challenges
Infrastructure Challenges
Infrastructure Water Fund Postage $12,500
Infrastructure Water Fund Credit card fees $129,000
Infrastructure Water Fund CDL training $36,000
Infrastructure Water Fund Water Treatment Chemicals $293,228
Infrastructure Water Fund Electricity $40,000
Infrastructure Water Fund Supplies and Training $24,347
Additional funding for increase in postage rates Infrastructure Challenges
Increase to credit card fees due to increasing costs Infrastructure Challenges
Increase due to new regulations re quired to train CDL license holders Infrastructure Principles
Additional funding for increase in water treatment chemicals Infrastructure Challenges
Increase in electricity costs . Infrastructure Challenges
Increased costs for training and supplies
Infrastructure Water Fund Programming Logic Controls $150,000 Ongoing funding to replace programming logic controls at water treatment plant
Infrastructure Challenges
Infrastructure Challenges
Infrastructure Water Fund Cybersecurity
Infrastructure Water Fund Temporary Wages
$80,000
$20,000
Infrastructure Water Fund Professional Services $85,000
Infrastructure Wastewa ter Fund
Civil Engineer II $141,412
Professional services for cybersecurity program . Infrastructure Principles
Additional temporary wages to assist with increased duties in water distribution
Additional professional services for on call engineering services for distribution system increased work
New position to assist with master planned projects sequenced on "road map" for water and sewer rehabilitation and capacity needs . Salaries and benefits, (mid-cycle)
Infrastructure Challenges
Infrastructure Challenges
Infrastructure Challenges
Infrastructure Wastewa ter Fund
Two Civil Engineer III $306,402
New positions to assist with mas ter planned projects sequenced on "road map" for water and sewer rehabilitation and capacity needs . Salaries and benefits, (mid-cycle)
Infrastructure Challenges
Organizational and Service Effectiveness
Organizational and Service Effectiveness
Organizational and Service Effectiveness
Organizational and Service Effectiveness
Organizational and Service Effectiveness
General Fund/ City Managers Office
General Fund/ City Managers Office
General Fund/ Human Recourses
General Fund/ Human Recourses
General Fund/ In formation Technol ogy
Annual funding to Porchlight
$50,000
Annual Funding to Porchlight OSE Principles
Organizational and Service Effectiveness
Organizational and Service Effectiveness
General Fund/City Attorneys office
General Fund/City Managers Office
Metro Mayors Flex Fund $1,000
Third Party Investi gations
Top workplace Survey
Chief Information Security Officer
$30,000
Annual funding to Metro Mayors Flex Fund OSE Principles
Funding for 2023 and 2024 to conduct third party personnel investigations
OSE Challenges
$23,000
Funding for the Top Workplace Survey conducted every three years, off years the funding level is 8,000 (2024 and 2025)
OSE Principles
$174,252
New position for Cybersecurity Salaries and benefits.
OSE Challenges
Dues and Subscriptions
$30,000
Increase to dues and subscriptions due to increasing costs
Arvada Report $4,000
Increase in funding for Arvada Report production due to increased production and mailing costs
OSE Challenges
OSE Challenges
Organizational and Service Effectiveness
Organizational and Service Effectiveness
Organizational and Service Effectiveness
Organizational and Service Effectiveness
Organizational and Service Effectiveness
Organizational and Service Effectiveness
Organizational and Service Effectiveness
Organizational and Service Effectiveness
Organizational and Service Effectiveness
Organizational and Service Effectiveness
General Fund/City Managers Office
General Fund/ Finance
General Fund/ Finance
General Fund/ Finance
General Fund/Fi nance
General Fund/ Finance
General Fund/ Human Resources
General Fund/ Human Resources
General Fund/City Managers Office
Sustainability program
Foothills Animal Shelter
Senor tax rebates
Annual Financial Audit
Streets Funding Transfer
Payroll Specialist
$40,000
Funding for the Sustainability program added in 2022
OSE Principles
$60,000
$20,000
$12,500
$1,550,000
$113,128
Executive Assistant $113,128
HR Coordinator
$105,481
Foothills Animal Shelter debt and annual fees
Increase in funding for annual senior tax rebate program
Increase in funding for annual financial audit due to increased cost to perform the annual audit
Additional transfer to the Streets Fund for ongoing streets mainte nance costs
New position to assist with payroll . Salaries and benefits. (mid-cycle)
New position to assist with increased duties in the Human Resources Department. Salaries and benefits. (mid-cycle)
New position to assist with employ ee pay and benefits. Salaries and benefits. (mid-cycle)
OSE Principles
OSE Principles
OSE Challenges
OSE Challenges
OSE Challenges
OSE Challenges
OSE Challenges
Senior Sustainabili ty Coordinator
Insurance Fund Safety Specialist
Safe Community General Fund/ Municipal Court
Safe Community T21 Fund/ Public Safety
Safe Community T21 Fund/ Public Safety
Safe Community General Fund/ Pub lic Safety
Senior Probation Officer
Behavioral Health Clinician I
$138,962
New position for the sustainability program. Salaries and benefits.
OSE Principles
$137,936
$124,628
New position to assist with the safety program. Salaries and benefits. (mid-cycle)
New position to assist with the probation program Salaries and benefits. (mid-cycle)
$117,845
Behavioral Health Clinician II $126,852
Radio Replacement $280,000
New position to assist with behav ioral health. Salaries and benefits. (mid-cycle)
New position to assist with behavioral health. Salaries and benefits. (mid-cycle)
OSE Challenges
Safe Community Challenges
Safe Community Challenges
Safe Community Challenges
Annual funding for replacement of PD radios Safe Community Principles
Safe Community T21 Fund/ Public Safety
Safe Community
T22 Fund/ Public Safety
Safe Community T22 Fund/ Public Safety
Vibrant Com munity and Neighborhoods
Vibrant Community and Neighborhoods
Vibrant Community and Neighborhoods
Vibrant Community and Neighborhoods
Vibrant Community and Neighborhoods
Vibrant Community and Neighborhoods
Vibrant Community and Neighborhoods
Vibrant Community and Neighborhoods
Radio Replacement $60,000 Annual funding for replacement of PD radios Safe Community Principles
Radio Replacement $60,001 Annual funding for replacement of PD radios Safe Community Principles
Two Police Sergeants $357,552 New positions to increase the span of control in the community Salaries and benefits.
Golf Fund Credit card fees $80,000
Parks Fund/Fes tivals
Parks Fund/ Ma jestic View Nature Center
Parks Fund/ Majestic View Nature Center
Parks Fund/ Ma jestic View Nature Center
Parks Fund/ Ma jestic View Nature Center
Parks Fund/Park Mainte nance
Parks Fund/Park Mainte nance
Safe Community Challenges
Increase to credit card fees due to increasing costs VCN Challenges
Promotions $50,000 Additional funding to maintain current level of service for festivals and events
Temporary Wages $20,000 Temporary wages, social security and Medicare for summer camp instructors .
VCN Challenges
VCN Principles
Printing $2,200 Printing expense associated with summer camp program VCN Principles
Services and Charges $10,000 Services and charges associated with summer camp program VCN Principles
Supplies $12,000 Supplies associated with summer camp program
VCN Principles
Parks Supervisor $124,224
New position to supervise new field programming which was transferred to the City from APEX Recreation District. Salaries and benefits. (mid-cycle)
Parks Maintenance Lead worker $93,139 New position to supervise new field programming which was transferred to the City from APEX Recreation District. Salaries and benefits. (mid-cycle)
VCN Challenges
VCN Challenges
Vibrant Community and Neighborhoods
Vibrant Community and Neighborhoods
Vibrant Community and Neighborhoods
Parks Fund/Park Mainte nance
Parks Fund/Park Maintenance
Parks Fund/Park Mainte nance
Two Parks Worker II $180,260
Two new positions for new field programming which was transferred to the City from APEX Recreation District. Salaries and benefits. (mid-cycle)
VCN Challenges
Parks Field Pro grammer $93,502
Four Parks Worker II $360,520
New position for new field program ming which was transferred to the City from APEX Recreation District Salaries and benefits. (mid-cycle)
Four new positions to assist with increased parks maintenance duties Salaries and benefits. (mid-cycle)
VCN Challenges
VCN Challenges
Infrastructure Streets Mainte nance Fund
One Truck $60,000 New truck for position request . Infrastructure Principles
Infrastructure Wastewa ter Fund Metro Wastewater Increase $500,000 Metro Wastewater adjustment Infrastructure Challenges
Infrastructure Water Fund Denver Water In crease $818,587 Denver Water adjustment Infrastructure Challenges
Infrastructure Water Fund Professional Services $6,000
Funding to comply with the 2023 EPA unregulated contaminant moni toring rule .
Infrastructure Principles
Infrastructure Water Fund HVAC $20,000 2023 increase in HVAC costs Infrastructure Challenges
Infrastructure Water Fund Analyzer Replace ment $120,000 Funding to replace analyzers at wa ter treatment plant Infrastructure Challenges
Infrastructure Water Fund Two Vehicles $140,000 Vehicles for two new positions Infrastructure Principles
Safe Community General Fund/ Pub lic Safety
Safe Community T21 Fund/ Public Safety
Safe Community T22 Fund/ Public Safety
Radio Replacement $1,400,000 Replacement of PC radio system for 2023 and 2025 Safe Community Principles
Radio Replacement $300,000 Replacement of PC radio system for 2023 and 2025 Safe Community Principles
Radio Replacement $300,000 Replacement of PC radio system for 2023 and 2025 Safe Community Principles
$47,115,113 $28,622,954
13,026,272
4,175,086 47,765
5,151,560 15,077,752
$8,708,508 $18,521,762 $246,674,826
- - - 109,021,680
- 6,404,702 10,889,579 - 21,517,132
1,915,668 - 735,128 11,274,230 34,154,339
4,698,667 38,188 - 911,671 25,386,702 19,303,811 116,461 50,455,500
and
1,089,246 - - - - - - 1,089,246 Miscella
3,785,802 1,578,626 25,249 10,250,933 198,021 3,223,400 168,365 19,230,396
298,452 14,138,784 2,120,837 8,983,063 493,104 511,220 1,317,061 27,862,521
206,145 - - - (408,482) 2,000,000 306,522 2,104,185
109,951,072 43,907,388 7,493,292 22,163,422 32,074,047 36,663,138 13,182,640 265,434,998
Total Amount Available $157,066,185 $72,530,342 $8,118,942 $56,536,030 $140,782,278 $45,371,646 $31,704,402 $512,109,824
and
$46,918,310 $15,309,836
11,749,498 10,239,480
$7,610,829 $6,291,154 $2,541,535 $78,671,664
2,379,626 9,740,347 940,081 2,987,859 38,038,791
6,431,820 3,109,621 - 160,958 1,392,341 3,362,825 2,812,442 17,270,007
10,688,879 206,555 28,629,391
- 8,040,627
(40,672) 762,725
Beginning Fund Balance $61,006,684 32,221,148 $623,761 $48,394,048 $99,967,978 $18,154,915 $17,454,574 $277,823,109
97,050,063 13,918,140 5,361,782 108,780 - - - 116,438,765
Permits and Fees 3,710,007 64,878 - - 3,907,339 396,819 - 8,079,043
Intergovern mental 5,293,134 13,143,619 - - - - 14,157,993 32,594,746
Charges for Services 3,908,164 920,648 - - 27,515,151 28,610,848 110,222 61,065,033
and Forfeits 1,065,052 - - - - - - 1,065,052 Miscella neous 3,633,226 743,068 3,000 300,000 845,793 1,234,648 734,000 7,493,735 Revenue Transfer 317,101 18,213,673 2,512,621 6,131,355 473,752 324,294 4,480,482 32,453,278 Other Financing Sources - - - - - - 75,000 75,000
Revenues 114,976,747 47,004,026 7,877,403 6,540,135 32,742,035 30,566,609 19,557,697 259,264,652
Total Amount Available $175,983,431 $79,225,174 $8,501,164 $54,934,183 $132,710,013 $48,721,524 $37,012,271 $537,087,761
Expenditures
Personnel $49,051,197 $16,866,434
14,478,617
$7,477,975 $2,575,029 $84,592,160
3,120,240 1,964,534 39,642,846
1,754,529 6,298,689 22,903,758
212,908 43,251,863
- 8,526,604
- 939,540
1,249,336 13,335,455
7,421,099 71,509,091
39,827,189
-
19,813,606 324,543,119
$212,544,641
Beginning Fund Balance $56,726,965 $30,846,493 $614,760 $36,652,037 $68,510,477 $1,995,244 $17,198,665 $212,544,641
100,435,054 14,413,612 5,360,782 106,604 - - - 120,316,052
Permits and Fees 3,710,007 66,824 - - 10,618,026 3,033,153 - 17,428,010
Intergovern mental 5,562,841 13,521,882 - - - - 15,825,673 34,910,396
Charges for Services 4,008,308 1,120,267 - - 31,370,655 31,263,250 111,598 67,874,078
and Forfeits 1,086,353 - - - - - - 1,086,353 Miscella neous 6,097,510 806,353 3,000 300,000 1,039,169 1,241,785 372,000 9,859,817 Revenue Transfer 326,614 17,099,275 3,268,984 13,885,940 487,515 282,570 368,530 35,719,428 Other Financing Sources - - - - 51,250,000 50,000,000 75,000 101,325,000
Total Reve nues 121,226,687 47,028,213 8,632,766 14,292,544 94,765,364 85,820,758 16,752,802 388,519,133
Total Amount Available $177,953,652 $77,874,706 $9,247,526 $50,944,581 $163,275,841 $87,816,002 $33,951,467 $601,063,774
Expenditures
and
and
$58,336,843 $20,161,965 $- $120,159 $9,915,095 $8,009,733 $2,846,012 $99,389,807
14,750,854 9,841,937 3,000 - 11,861,393 2,150,035 2,601,784 41,209,003
9,057,456 4,349,448 - 4,649 1,937,141 1,827,573 8,029,536 25,205,805
14,613,255 229,993 33,016,768
3,653,200 - 15,381,967
876,103 - 899,313
887,581 1,421,582 12,123,576
Beginning Fund Balance $56,791,836 $26,697,173 $605,759 $37,542,983 $63,023,417 $39,659,884 $16,958,538 $241,279,590
Taxes 102,505,154 14,663,194 5,358,282 104,472 - - - 122,631,102
Permits and Fees 3,723,757 68,829 - - 11,040,287 3,154,279 - 17,987,152
Intergovern mental 5,828,233 13,518,704 - - - - 16,288,925 35,635,862
Charges for Services 4,172,657 1,269,075 - - 34,233,243 32,675,417 113,024 72,463,416
Fine and Forfeits 1,108,080 - - - - - - 1,108,080 Miscellaneous 7,635,835 845,849 3,000 300,000 1,059,952 1,221,322 390,000 11,455,958 Revenue Transfer 336,413 17,667,815 3,268,484 8,124,399 502,140 291,098 172,862 30,363,211 Other Financing Sources - - - - - - 75,000 75,000
Total Revenues 125,310,129 48,033,466 8,629,766 8,528,871 46,835,622 37,342,116 17,039,811 291,719,781
Total Amount Available $182,101,965 $74,730,639 $9,235,525 $46,071,854 $109,859,039 $77,002,000 $33,998,349 $532,999,371
Expenditures
Personnel $61,103,310 $21,126,996
15,140,924 10,026,857
9,318,167 4,498,836
4,913,072 12,302,717
533,724
$10,407,507 $8,378,917 $2,973,473 $104,117,680
2,211,077 2,719,326 41,474,646
1,972,469 1,878,927 6,327,543 24,000,818
1,280,385 14,548,293 236,893 33,291,360
3,653,200 - 15,378,966
- 898,636 - 922,542
914,208 1,113,139 12,135,933
following table
Tax
for Services and
the City
Actual 2022 Revised 2023 Budget 2024 Budget
122,631,102
17,428,010 17,987,152
30,363,211
Actual 2022 Revised 2023 Budget 2024 Budget
12,840,661
4,807,892
6,180,047
2,315,050
The City’s largest revenue source is sales tax . Currently, the City levies a 3 .46% on all retail sales within the City . 3% is allocated to the General Fund and .21% and .25% are restricted for police operations which are accounted for in the two tax increment funds .
Over the past ten years, the City has seen significant growth in retail sales, averaging 6.5% annual growth An increase of 9% is estimated for 2022 and is currently at a 9 6% increase over 2021 The increase in sales tax can be attributed to the City’s main sales tax generators which are grocery stores, general department stores and online sale that had double digit increases for the first six months of 2022. The City is conservatively budgeting sales tax at an increase of 3 5% for 2023 Sales tax estimates for the remaining years are based on a growth rate between 1% and 2 5% Revenue from anticipated retail ers is generally not included in the budget until a new store is constructed and operational However in 2029 through 2032 of the ten year financial plan, the City included the estimated sales tax of an urban renewal area that will end in 2028 .

$90,000,000 $100,000,000
$80,000,000
$70,000,000
$50,000,000 $60,000,000
$40,000,000
$30,000,000
$20,000,000
$10,000,000
$-

Property tax is a tax assessed on all real estate . The City has had the same property tax rate since 1993, or for over 30 years . The tax rate is 4 .31 or $4 .31 for every $1,000 of assessed value . Assessed value is based on 7 .15% of the residential appraised value and 29% on all other property . Real property is appraised every odd-numbered year and collections lag one year from valuations . Property tax col lections in 2023 are based on a non-appraisal year and are estimated to increase 1% due to new growth in the City 2024 collections are estimated to increase 4% and are based on a new appraisal year Property tax for 2025 and beyond is based on a 3% increase in appraisal years and 1% in non-appraisal years to account for new growth
$9,300,000
$8,800,000
$8,300,000
$7,800,000
$7,300,000
$6,800,000
$6,300,000
The City collects three types of use tax: Auto, Building and General Use Tax .
The City collected a record amount of auto use tax in 2021 with an increase of 16 .8% . Auto use tax in the first half of 2022 is up 11.6% due to strong auto sales in the used car market while new car sales are hampered by parts shortages . The estimate for 2023 and beyond assumes a 3% increase with at 3% decrease in 2027, as the City normally experiences a reset in auto use tax every five to seven years.
Building use tax has been steadily decreasing since 2017 when two housing developments in northern Arvada opened up There are still a healthy number of new houses being built in these developments as well as in-fill development in the City. A decrease of 15% is estimated for 2023 as new housing stabilizes, followed by increases of 0% to 4%
In the past, general use tax has been a stable source of revenue as it represents capital investment by Arvada businesses An increase of 15% is estimated in 2023 Increases in future years are forecasted at 2%
$20,000,000
$18,000,000
$16,000,000
$14,000,000
$12,000,000
$10,000,000
$8,000,000
$6,000,000
$4,000,000
$2,000,000
This category accounts for state and county shared revenue. The Jefferson County Open Space revenue is a .5% sales tax collected in Jefferson County and shared with cities. This revenue is to be used for acquiring, maintaining, administering and preserving open space and park and recreational capital improvements The City uses all of the Open Space revenues for ongoing park maintenance This revenue is estimated to increase 5% in 2023, with 4 5% increases in the future
The Highway Users’ Tax Fund (HUTF) is derived from the state sales tax on vehicle gas purchases and is allocated based on the number of vehicles and population in each City In the past, the City saw increases of 1%-4% each year In 2020, this revenue source saw a decline of 26% because of the sharp decline in gas purchases during the pandemic . 2021 saw an increase of 7% and an increase of 14 .1% for the first six months of 2022. An increase of 8.2% is estimated for 2023 with increases of 7.3% for 2024 and 2025 and 1% increases in future years .
The Road and Bridge tax is county shared revenue that is derived from a property tax mill levy set by the counties to be used for road and bridge construction, maintenance and administration . This reve nue source has varied from year to year . As the counties have the authority to change the allocations each year, the City has conservatively estimated a 10% decrease in 2023 and 2024 followed by a 1% increase in future years

$14,000,000
$12,000,000
$10,000,000
$8,000,000
$6,000,000
$4,000,000
$2,000,000
$0
The majority of this revenue source is from Water, Wastewater and Stormwater charges The City also implemented a solid waste and recycling program The City entered into an agreement with a single waste hauler to provide services for the City Services started in July 2021 In 2023, Water rates will increase 12 3% and there will be a $2 per month increase in the service fee, while Wastewater rates will increase 9 8% with a $1 per month increase in the service fee There will be a 2% increase in Stormwa ter rates The Solid Waste fund estimates a 3 5% increase in 2023 The estimated rate increases for these utilities is expected to be 2%-7% in future years
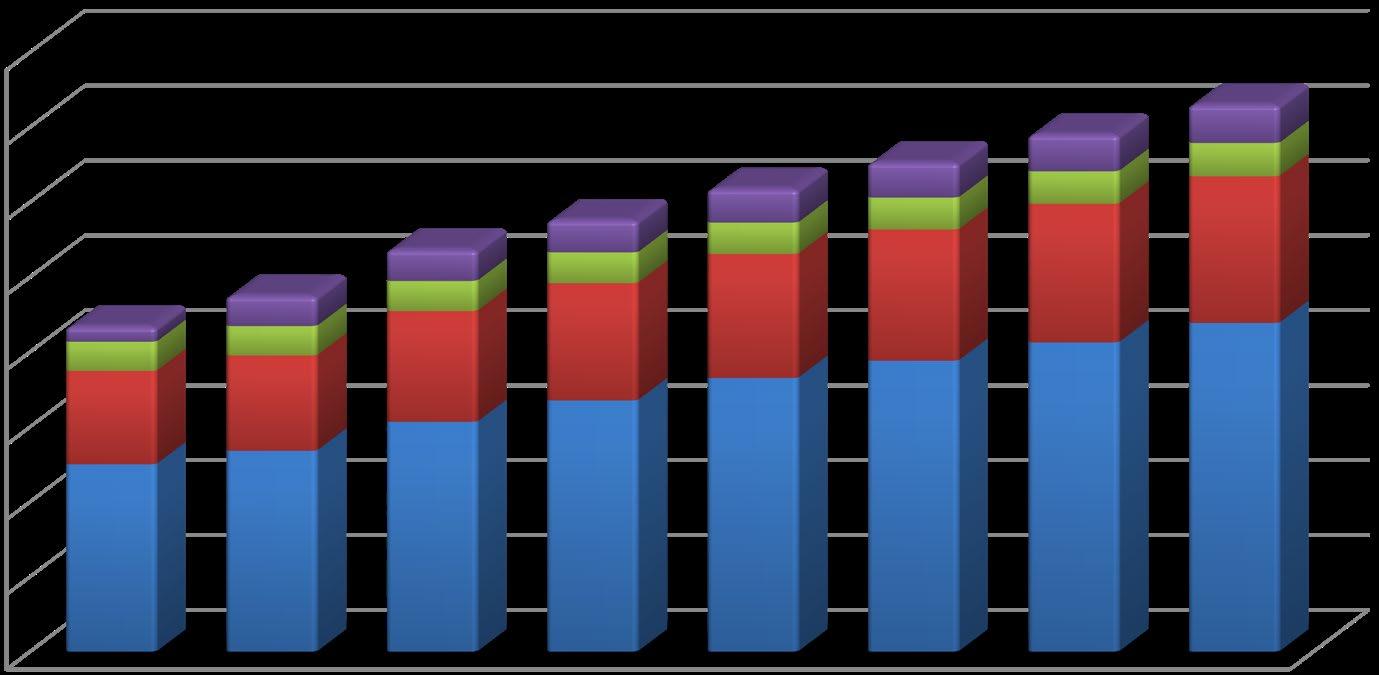
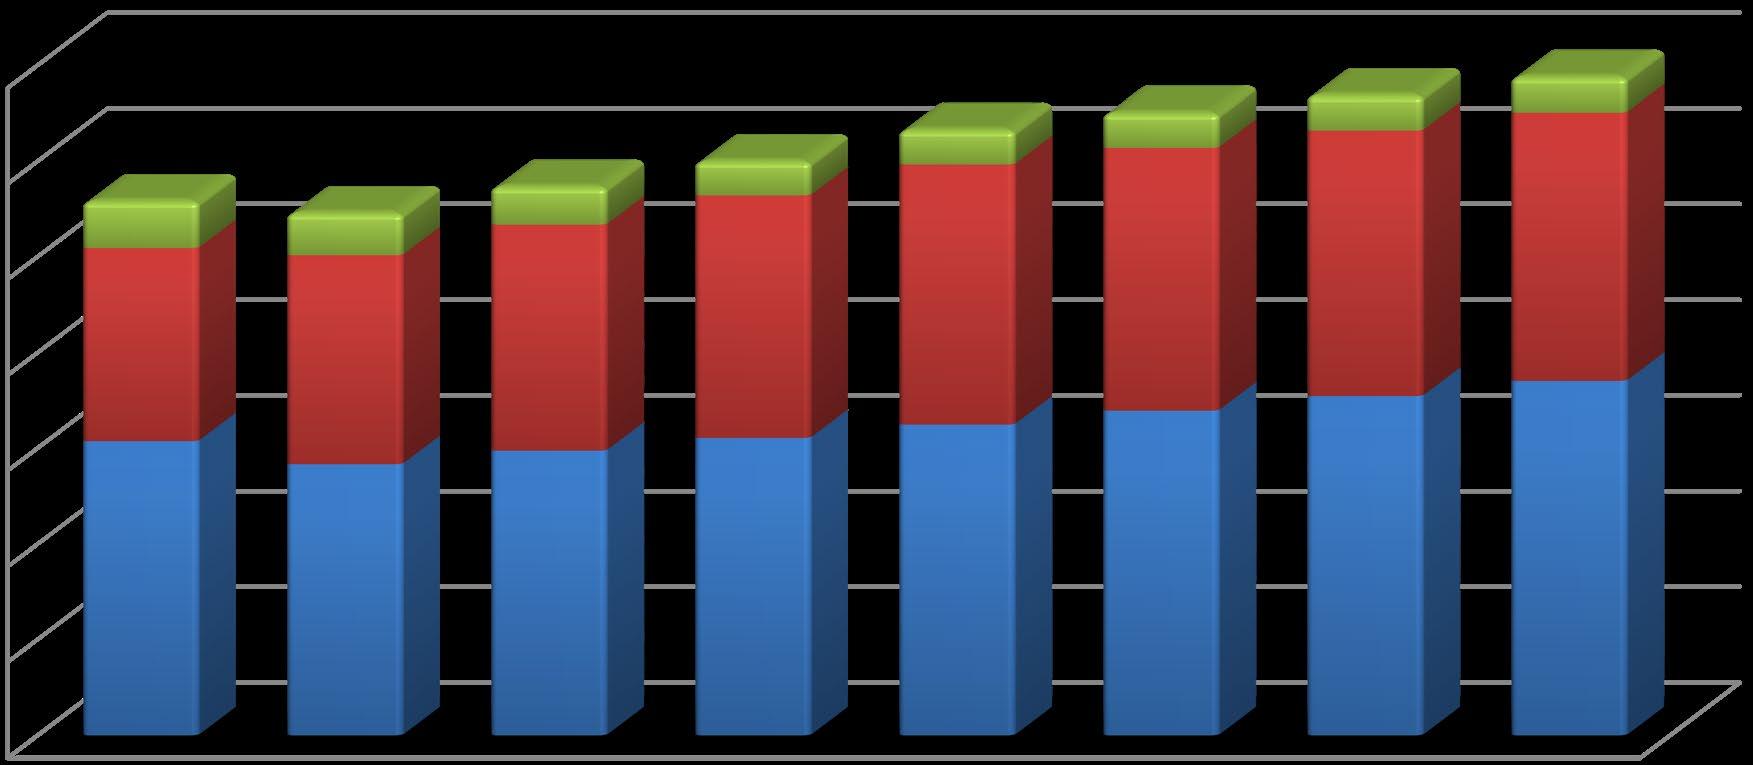
The City has followed the methodology of small rate increases each year in order to fund large capital maintenance projects to the system .
$80,000,000
$70,000,000
$60,000,000
$50,000,000
$40,000,000
$30,000,000
$20,000,000
$10,000,000
$-
The major source of miscellaneous revenue is interest earnings . The City invests its excess cash pursuant to the City’s investment policy . The primary objectives of the City’s investment activities, in priority order are safety, liquidity and yield . Consistent with this policy, the portfolio of securities is invested in U .S . Treasuries, U .S . Agencies, local government investment pools, commercial paper and corporate debt subject to rating and concentration limits .
Interest earnings in 2021 generated a 1.1% yield with the first six months of 2022 also generating a yield of 1 1% Interest revenue is estimated to decrease in 2022 from 2021 as the City spends down bond proceeds from the 2019 Sales and Use Tax bonds Interest revenue is expected to increase in 2023 due to proceeds from anticipated bond issues in early 2023 for Water and Sewer bonds Currently, the interest is estimated to decrease due to many investments “locked-in” at lower interest rates This is an area the City will continue to monitor as the Feds are expected to raise interest rates throughout 2022 to 3 7% to 4% by years end
$6,000,000
$5,000,000
$4,000,000
$3,000,000
$2,000,000
$1,000,000
charges
utility
expenses related to paying other
to
Water
Metro Wastewater for the treatment of the City's sewage
of trainings, including state and federal
Center for the Arts and Humanities of $3 .9 million
and 2024 appropriations as well as a ten-year plan for the City's capital
a Capital Improvement Plan
specific projects, please see the Capital Improvement Plan section
this
City
a legal provision to dedicate 60.0%
cent of sales tax to infrastructure, major capital maintenance, new construction or debt
referred to as 98-101 money after the section of the City's code
sales
total of $15 million
capital
be generated from sales tax for capital needs
this total $7 .3 million
be used to pay for debt service
previous capital
be dedicated to capital improvement projects
There
From
General
General
General
The largest transfers
from the General Fund
Water and Wastewater
operating
lines
support the activities of other
General Fund
building, utility
overhead
596,435
12,074,121 12,484,244
895,280 715,017
5,973,229 6,033,245
11,449,763 12,354,705 12,926,170
32,067 32,304 32,545
2,512,621 3,268,984 3,268,484
6,616,046 7,109,038 7,089,246
7,692,761 7,999,007 8,156,564
5,364,782 5,363,782 5,361,282
6,540,135 14,292,544 8,528,871
46,835,622
20,503,490
8,032,887
4,201,006
4,604,733
3,661,657
5,012,636
184,481 190,016
12,009,303 12,205,400
1,300,530 1,324,709 1,329,518
5,939,660 6,023,445
12,935,888 13,381,960 13,936,565
811,864 30,312 31,222
2,521,622 3,277,985 3,277,484
5,710,599 8,158,595 7,031,237
6,400,203 10,148,513 8,341,275
5,364,782 5,363,782 5,361,282
18,282,146 13,401,598 6,232,416
100,252,424 65,529,827
30,862,708 35,008,620
7,619,335 7,868,432
5,088,295 5,245,297
4,585,779 4,731,326
3,524,325
5,720,994
368,179
5,990,598
Sources
Actual 2022
Budget 2024 Budget
Actual 2022 Revised
Budget 2024 Budget
13,584,539
Work System
Community and Economic Development
2023
Fund
Project
System and
Revenue
Type
Debt Service Funds Enterprise Funds
12,090,829 - 140,377,176
Service and Effectiveness
Community
Communities and Neighborhoods
Capital Projects - 13,401,598
- 417,374
- 17,939,525 - -
- 13,480,385 - 7,613,991
184,480 -
Service - - - - 8,641,767 -
Total $121,161,816 $13,401,598 $16,992,929 $51,177,533 $8,641,767 $148,408,541
Expenditure
by Work System and Fund Type
Work System
General Fund
Project Funds
Internal Service Funds
Revenue Funds
$7,246,431
Debt Service Funds Enterprise Funds Community and Economic Development
23,527,293
440,756
12,291,238 110,078,923 Organizational Service and Effectiveness
Safe Community 33,803,227 - 14,983,504Vibrant Communities and Neighborhoods
Capital Projects
Service
Total $121,069,821
14,037,801 7,863,824
$8,638,766 $118,383,503
In 2015, City Council adopted a budget and fiscal policy that utilizes long-range planning for each of the City’s operating funds to maintain the fiscal health of the City. Specifically, the City prepares a two-year budget based on a ten-year financial model. This method of budgeting is used to determine if future im pacts of the current proposed budget are fiscally sound. Using this ten-year model, the City is able to test the effects of current financial decisions on future years’ financial conditions when approving funding requests throughout the organization Budgeting in this manner allows management time to react and respond to changes in the economy and minimizes the effect of budget fluctuations on service delivery. Ten-year model assumptions are reviewed on an annual basis and revised as necessary The objective is that each fund should work towards maintaining a fund balance that is equal to or exceeds the required City Council fund balance goal in the tenth year
For the ten-year models, projections of economically-driven revenues do not factor in potential recessions or periods of robust expansion, which may occur during the ten year forecast . Instead, the revenue forecast assures continued moderate growth in the economy and the City’s population . In addition, expenditures do not take into consideration expansion of services or programs or an increase in the number of employees .
• Personnel-related expenses are calculated in detail based upon each employee’s current grade and step and include future estimated market-rate adjustments A mid-year City wide market-rate adjustment was implemented in August of 2022 to try and keep up with inflation. The market-rate adjust ment is 3% for 2023 and 2% for 2024, 1% for 2025 and 2% for 2026-2032
• The increase in health insurance is estimated at 0% for 2023 . Increases in the future for the City’s medical plan are budgeted at 5% for 2024-2032 .
• Transfers to fund insurance lines, vehicle replacement, computer maintenance and computer replacement have a 50% to 3% increase throughout the models
• Transfers to fund building maintenance, vehicle maintenance and risk management services have a 3% increase throughout the models .
• The fund balance goal is 17% of all expenditures
• Sales tax revenue is continuing to see unprecedented growth and is based on a 9% increase in 2022 with a 3 5% increase in 2023 Sales tax in future years assumes growth rates between 1% and 2 5% These rates are based on the historical trend of sales tax
• Auto use tax assumes a 5% increase in 2022 Increases of 3% are estimated for 2023 and beyond with a 3% decrease in 2027, as the City normally experiences a reset in auto use tax every five to seven years .
• Building use tax revenue assumes a decrease of 15% in 2023 to reset building use tax to a base of $3,300,000 Increases of 0% to 4% are estimated for 2023 and beyond with a 0% in 2029 to reset the base
• Building permit revenue assumes no increase in 2022 and 2023 to keep revenues at the base of $2,750,000 . Increases of .5 to 1% are expected for 2024 and beyond .
• Assumes $1,336,000 in additional annual sales tax starting in 2029 when the Kipling Ridge urban renewal tax increment area ends .
• Assumes $10,150,000 for street maintenance in 2022 with a one-time transfer of $3,350,000 to help with immediate needs An additional $1,550,000 annual transfer will start in 2023, raising the base funding to $12,000,000 per year with variable growth rates from 2% to 3% for 2024 and beyond
• Assumes the required transfer to the Capital Projects Fund and/or Debt Service Fund to maintain com pliance with section 98-101 of the Arvada Code .
• Assumes a salary vacancy savings of 2 .75% for 2022 . The salary vacancy rate steps up in 2023 – 2026 to 3% and then back down to 2 25% in 2027 and beyond
• All non-personnel expenditures increased at 3% (up from 1 5% in prior budgets) in 2022 and beyond
• The fund balance goal is 11% of all expenditures .
• Assumes a transfer from the General Fund of $4,560,000 in 2022, with an additional $500,000 transfer starting in 2023 and beyond . Increases for 2024 – 2032 range from 3% to 4% .
• Reimbursement from the Apex Park and Recreation District (APEX) has been removed as the City’s Park Program has taken over the programming of the field operations to go along with the maintenance
• Open Space revenues are budgeted to increase at varying amounts from 3% - 4 .5% through the model .
• The City’s attributable share of Open Space revenue will continue to be used 100% for park maintenance and operations in 2023 and thereafter
Police Tax .21
• The fund balance goal is 11% of all expenditures .
• Sales tax, auto and building use tax assumptions are the same as the General Fund and also assume an increase when the Kipling Ridge urban renewal area ends .
• Assumes the replacement of the radio system and the creation of an evidence storage facility in the next 3 years
Police Tax .25
• The fund balance goal is 11% of all expenditures
• Sales tax, auto and building use tax assumptions are the same as the General Fund and also assume an increase when the Kipling Ridge urban renewal area ends .
• Assumes the replacement of the radio system and the creation of an evidence storage facility in the next 3 years Water
• The working capital goal is 25% of expenditures
• Rates are budgeted to increase 12 3% in 2023 with increases of 7% thereafter
• Service fees are budgeted to increase $2 per month in every year starting in 2022 – 2025 with no increase thereafter .
• System Development Charges (formally known as Tap Fees) will be placed at the market rate starting in 2023 . This will be close to a 100% increase and will be used to fund some much needed capital projects
• Assumes a debt service payment of $3,100,000 starting in 2023 for an anticipated debt issue in the fall of 2022 for capital projects .
• The Water fund does not meet its working capital goal in 2026 – 2031, but recovers and meets the working capital goal by 2032 .
• The working capital goal is 25% of all expenditures .
• Rates are budgeted to increase 9 .8% in 2023 with increases of 6% thereafter .
• Service fees are budgeted to increase $1 per month in every year starting in 2022 – 2025 with no increase thereafter
• System Development Charges (formally known as Tap Fees) will be placed at the market rate starting in 2023 . This will move the charge from $1,500 to $10,400 and will be used to fund some much need ed capital projects .
• Assumes a debt service payment of $3,000,000 starting in 2023 for an anticipated debt issue in the fall of 2022 for capital projects
• The Wastewater fund does not meet its working capital goal in 2025 – 2030, but recovers and meets the working capital goal by 2031 .
• The working capital goal is 11% of all expenditures .
• Assumes that the Golf fund will pay for its share of the COP to finance the West Woods expansion with a transfer to the COP fund of $424,000 in 2022 increasing to $470,000 in 2032 .
• Assumes that the Golf fund will pay the Wastewater fund $163,000/year on the note payable used to finance the irrigation system replacement.
• The Golf fund does not meet its working capital until 2027 .
• The working capital goal is 25% of all expenditures .
• There is no increase in rates for 2022 and a 2% increase each year thereafter .
• The Stormwater fund meets the working capital goal in all years .
• This was a new fund in 2021 to account for revenues and expenditures of a city-wide solid waste hauling and recycling system
• The Solid Waste fund does not meet its working capital goal in 2021 – 2025, but recovers and meets the working capital goal by 2026 .
• The fund balance goal is $3,000,000 plus the annual actuarial projection for limited loss .
• Revenues for insurance lines are assumed to increase at 3% throughout the model .
• Revenues for risk management services are increased at 3% throughout the model .
General Fund - Table 1
2025
2026
Taxes $90,546,114 $97,050,063 $100,435,054 $102,505,154 $105,069,336 $107,743,493
Licenses, Permits and Fees 4,175,086 3,710,007 3,710,007 3,723,757 3,687,576 3,671,464
Intergovernmental 5,151,560 5,293,134 5,562,841 5,828,233 6,205,617 6,267,273
Charges for Services 4,698,667 3,908,164 4,008,308 4,172,657 4,280,124 4,190,803
Fines & Forfeits 1,089,246 1,065,052 1,086,353 1,108,080 1,130,241 1,152,845
Miscellaneous 3,785,802 3,633,226 6,097,510 7,635,835 6,489,217 3,999,024
Other Financing Sources 206,145 - - - - -
Revenue Transfer 298,452 317,101 326,614 336,413 346,505 356,900
Total General Fund Revenue $109,951,072 $114,976,747 $121,226,687 $125,310,129 $127,208,616 $127,381,802
Personnel $46,918,310 $49,051,197 $58,336,843 $61,103,310 $62,848,547 $65,124,778
Services & Charges 11,749,498 14,478,617 14,750,854 15,140,924 15,568,540 16,009,370
Supplies & Expenses 6,431,820 8,812,982 9,057,456 9,318,167 9,559,588 9,877,239
Contract & Leases 5,365,621 13,565,191 4,859,542 4,913,072 4,878,793 5,031,988
Inventory (27,473) 20,000 20,600 21,218 21,854 22,510
Capital Maintenance 522,670 553,551 518,429 533,724 549,474 565,689
Capital Outlay 473,651 278,924 82,580 82,657 82,737 82,819
Transfers 24,623,006 32,492,041 33,531,468 29,952,585 32,301,606 31,905,765
Other 2,398 3,963 4,042 4,164 4,289 4,417
Total General Fund Expenditures
$96,059,501 $119,256,466 $121,161,816 $121,069,821 $125,815,427 $128,624,575
Fund Balance, Beginning $47,115,113 $61,006,684 $56,726,965 $56,791,836 $61,032,144 $62,425,333
Fund Balance, Ending $61,006,684 $56,726,965 $56,791,836 $61,032,144 $62,425,333 $61,182,561
Fund Balance Goal (17% of Expenditures)
$16,330,115 $20,273,599 $20,597,509 $20,581,870 $21,388,623 $21,866,178
Excess/(Deficiency) $44,676,569 $36,453,366 $36,194,327 $40,450,274 $41,036,711 $39,316,383
Taxes $110,017,826 $112,719,049 $116,703,441 $118,330,703 $121,087,376 $124,592,996
Licenses, Permits and Fees 3,685,421 3,699,448 3,713,545 3,727,713 3,741,952 3,756,261
Intergovernmental 6,329,546 6,392,442 6,455,967 6,520,126 6,584,927 6,650,377
Charges for Services 4,304,791 4,422,189 4,543,092 4,667,609 4,795,850 4,927,924
Fines & Forfeits 1,175,903 1,199,421 1,223,411 1,247,879 1,272,836 1,298,292 Miscellaneous 4,009,224 3,952,889 3,927,008 3,936,652 4,028,892 4,123,805
Sources - - - - - -
Revenue Transfer 367,606 378,634 389,992 401,691 413,742 426,153
Total General Fund Revenue $129,890,317 $132,764,072 $136,956,456 $138,832,373 $141,925,575 $145,775,807
Personnel $67,859,022 $69,944,065 $71,921,719 $73,783,243 $75,637,036 $77,454,979 Services & Charges 16,548,044 17,001,149 17,434,378 17,879,963 18,348,304 18,830,027
Supplies & Expenses 10,445,357 10,546,853 10,866,695 11,246,728 11,578,528 11,987,930
Contract & Leases 5,158,414 5,304,390 5,468,576 5,608,839 5,767,829 5,944,866
Inventory 23,185 23,881 24,597 25,335 26,095 26,878
Capital Maintenance 582,385 599,578 617,280 635,509 654,278 673,604
Capital Outlay 2,904 2,991 3,081 3,173 3,268 3,366
Transfers 33,016,064 34,074,701 35,081,466 35,815,022 36,947,518 38,202,032
Other 4,550 4,686 4,827 4,972 5,121 5,274
Total General Fund Expenditures $133,639,925 $137,502,294 $141,422,619 $145,002,785 $148,967,976 $153,128,957
Fund Balance, Beginning $61,182,561 $57,432,953 $52,694,731 $48,228,568 $42,058,156 $35,015,755
Fund Balance, Ending $57,432,953 $52,694,731 $48,228,568 $42,058,156 $35,015,755 $27,662,604
Fund Balance Goal (17% of Expenditures) $22,718,787 $23,375,390 $24,041,845 $24,650,473 $25,324,556 $26,031,923 Excess/(Deficiency) $34,714,166 $29,319,341 $24,186,722 $17,407,683 $9,691,199 $1,630,682
2025
2026
Licenses, Permits and Fees $47,765 $64,878 $66,824 $68,829 $70,894 $73,020
Intergovernmental 6,148,620 5,672,270 5,950,466 6,218,105 6,497,786 6,790,048
Charges for Services 38,188 920,648 1,120,267 1,269,075 1,336,323 1,338,639
Miscellaneous 806,496 197,925 191,995 186,590 187,740 188,921
Revenue Transfer 3,842,427 4,594,042 5,025,153 5,183,571 5,344,290 5,508,823
Total Revenues $10,883,497 $11,449,763 $12,354,705 $12,926,170 $13,437,033 $13,899,451
Personnel $5,429,674 $6,324,675 $6,951,551 $7,287,490 $7,525,771 $7,807,203
Services & Charges 2,232,686 2,830,987 3,002,398 3,090,292 3,184,467 3,277,787
Supplies & Expenses 1,936,247 2,383,194 2,616,018 2,722,434 2,824,893 2,922,388
Contract & Leases 176,624 578,078 579,971 597,370 615,291 633,750
Inventory 4,370 2,534 2,610 2,688 2,768 2,852
Capital Maintenance 151,681 247,180 229,313 236,192 243,278 250,576
Capital Outlay 36,200 8,000 - - - -
Transfers 232,000 561,141 - - - -
Other - 100 100 100 100 100
Total Expenditures $10,199,482 $12,935,889 $13,381,960 $13,936,565 $14,396,568 $14,894,655
Fund Balance, Beginning $6,055,456 $6,739,470 $5,253,344 $4,226,089 $3,215,694 $2,256,159
Fund Balance, Ending $6,739,470 $5,253,344 $4,226,089 $3,215,694 $2,256,159 $1,260,954
Fund Balance Goal (11% of Expenditures) $1,121,943 $1,422,948 $1,472,016 $1,533,022 $1,583,623 $1,638,412
Excess/(Deficiency) $5,617,527 $3,830,397 $2,754,073 $1,682,671 $672,536 $(377,458)
Licenses, Permits and Fees $75,211 $77,467 $79,791 $82,185 $84,651 $87,190
Intergovernmental 7,095,458 7,414,607 7,748,114 8,096,623 8,460,812 8,841,383
Charges for Services 1,341,025 1,377,206 1,379,737 1,382,344 1,385,029 1,422,531
Miscellaneous 191,934 195,035 198,226 201,510 204,889 208,367
Revenue Transfer 5,678,600 5,852,983 6,032,205 6,210,485 6,394,214 6,583,498
Total Revenues $14,382,229 $14,917,299 $15,438,073 $15,973,147 $16,529,595 $17,142,969
Personnel $8,090,948 $8,377,236 $8,656,380 $8,918,914 $9,166,562 $9,401,300
Services & Charges 3,373,948 3,473,035 3,575,138 3,680,347 3,788,758 3,900,469
Supplies & Expenses 3,037,594 3,129,594 3,224,182 3,358,440 3,465,832 3,595,010
Contract & Leases 652,762 672,345 692,515 713,291 734,690 756,730
Inventory 2,937 3,025 3,116 3,209 3,306 3,405
Capital Maintenance 258,093 265,836 273,811 282,026 290,486 299,201
Capital Outlay - - - - - -
Transfers - - - - - -
Other 100 100 100 100 100 100
Total Expenditures $15,416,382 $15,921,172 $16,425,242 $16,956,326 $17,449,733 $17,956,214
Fund Balance, Beginning $1,260,954 $226,801 $(777,073) $(1,764,242) $(2,747,421) $(3,667,560)
Fund Balance, Ending $226,801 $(777,073) $(1,764,242) $(2,747,421) $(3,667,560) $(4,480,805)
Fund Balance Goal (11% of Expenditures) $1,695,802 $1,751,329 $1,806,777 $1,865,196 $1,919,471 $1,975,184 Excess/(Deficiency) $(1,469,001) $(2,528,402) $(3,571,019) $(4,612,617) $(5,587,030) $(6,455,988)
Taxes $5,907,677 $6,316,379 $6,541,255 $6,654,610 $6,827,887 $7,003,205
Intergovernmental 402,929 216,667 452,783 297,636 309,548 50,000 Miscellaneous (17,606) 83,000 115,000 137,000 140,000 140,000
Total Revenues $6,293,000 $6,616,046 $7,109,038 $7,089,246 $7,277,435 $7,193,205
Personnel $4,040,166 $4,285,701 $5,330,173 $5,475,243 $5,685,638 $5,930,858
Services & Charges 410,388 206,430 297,787 305,433 313,321 321,458
Supplies & Expenses 454,998 735,884 691,428 695,553 717,221 740,869
Contract & Leases 414,944 367,027 369,038 380,109 391,512 403,258
Capital Maintenance 2,920 17,524 9,665 9,955 10,254 10,561
Capital Outlay 44,017 - - - - -
Transfers 395,634 98,033 1,460,504 164,944 469,517 174,227
Total Expenditures $5,763,068 $5,710,599 $8,158,595 $7,031,237 $7,587,463 $7,581,230
Fund Balance, Beginning $6,771,052 $7,300,984 $8,206,431 $7,156,874 $7,214,883 $6,904,856
Fund Balance, Ending $7,300,984 $8,206,431 $7,156,874 $7,214,883 $6,904,856 $6,516,830
Fund Balance Goal (11% of Expenditures) $629,096 $628,166 $897,445 $773,436 $834,621 $833,935
Excess/(Deficiency) $6,671,889 $7,578,265 $6,259,429 $6,441,447 $6,070,235 $5,682,895
Taxes $7,159,887 $7,330,185 $7,471,232 $7,560,609 $7,746,046 $7,968,463
50,000 50,000
120,000
50,000 50,000 50,000
50,000 30,000
$7,329,887 $7,490,185 $7,611,232 $7,690,609 $7,846,046 $8,048,463
$6,159,217 $6,344,454 $6,512,393 $6,680,392 $6,849,675 $7,021,758 $6,021,707 329,852 338,512 347,446 356,663 366,173 375,983 288,805 765,923 789,262 812,289 837,824 864,270 888,888 690,796 415,355 427,816 440,650 453,870 467,486 481,511 429,513 10,878 11,204 11,541 11,887 12,243 12,611 11,885 - - - - - - -
179,079 184,076 189,224 194,525 199,986 205,611 120,021 $7,860,304 $8,095,324 $8,313,542 $8,535,162 $8,759,833 $8,986,362 $7,562,727
Fund Balance, Beginning $6,516,830 $5,986,414 $5,381,274 $4,678,964 $3,834,411 $2,920,624
Fund Balance, Ending $5,986,414 $5,381,274 $4,678,964 $3,834,411 $2,920,624 $1,982,724
Fund Balance Goal (11% of Expenditures) $864,633 $890,486 $914,490 $938,868 $963,582 $988,500 Excess/(Deficiency) $5,121,780 $4,490,789 $3,764,474 $2,895,543 $1,957,042 $994,224
Taxes $7,118,595 $7,601,761 $7,872,357 $8,008,584 $8,217,029 $8,427,962
Miscellaneous (52,372) 91,000 126,650 147,980 154,379 124,000
Total Revenues $7,066,223 $7,692,761 $7,999,007 $8,156,564 $8,371,408 $8,551,962
Personnel $4,984,680 $5,080,170 $6,393,519 $6,834,947 $7,032,414 $7,275,493
Services & Charges 158,025 176,902 292,498 299,893 307,524 $315,397
Supplies & Expenses 614,629 843,433 799,337 832,756 861,720 890,871
Contract & Leases 186,644 153,697 153,248 157,846 162,581 167,459
Capital Maintenance 2,746 5,934 6,112 6,296 6,484 6,679
Capital Outlay - 832 857 883 909 936
Transfers 135,637 139,235 2,502,942 208,655 514,540 220,601
Total Expenditures $6,082,361 $6,400,203 $10,148,513 $8,341,275 $8,886,172 $8,877,436
Fund Balance, Beginning $7,642,085 $8,625,947 $9,918,505 $7,768,999 $7,584,288 $7,069,524
Fund Balance, Ending $8,625,947 $9,918,505 $7,768,999 $7,584,288 $7,069,524 $6,744,050
Fund Balance Goal (11% of Expenditures) $669,060 $704,022 $1,116,336 $917,540 $977,479 $976,518 Excess/(Deficiency) $7,956,887 $9,214,483 $6,652,662 $6,666,748 $6,092,045 $5,767,532
Taxes $8,617,220 $8,822,025 $8,992,133 $9,099,513 $9,322,747 $9,590,572
Miscellaneous 124,000 100,000 80,000 60,000 40,000 30,000
Total Revenues $8,741,220 $8,922,025 $9,072,133 $9,159,513 $9,362,747 $9,620,572
Personnel $7,521,096 $7,732,044 $7,924,001 $8,117,645 $8,315,252 $8,508,478
Services & Charges 323,520 $331,902 340,551 $349,475 358,683 $368,185
Supplies & Expenses 920,665 951,349 982,346 1,016,095 1,047,369 1,078,317
Contract & Leases 172,482 177,657 182,987 188,476 194,130 199,954
Capital Maintenance 6,879 7,086 7,298 7,517 7,743 7,975
Capital Outlay 965 993 1,023 1,054 1,086 1,118
Transfers 226,844 233,274 239,898 246,719 253,746 260,983
Total Expenditures $9,172,451 $9,434,305 $9,678,103 $9,926,982 $10,178,009 $10,425,011
Fund Balance, Beginning $6,744,050 $6,312,819 $5,800,539 $5,194,570 $4,427,101 $3,611,839
Fund Balance, Ending $6,312,819 $5,800,539 $5,194,570 $4,427,101 $3,611,839 $2,807,400
Fund Balance Goal (11% of Expenditures) $1,008,970 $1,037,774 $1,064,591 $1,091,968 $1,119,581 $1,146,751 Excess/(Deficiency) $5,303,850 $4,762,766 $4,129,978 $3,335,133 $2,492,258 $1,660,649
Licenses, Permits and Fees
$6,404,702 $3,907,339 $10,618,026 $11,040,287 $11,479,364 $11,935,928
Charges for Services 25,386,702 27,515,151 31,370,655 34,233,243 37,236,474 39,519,360
Miscellaneous 198,021 845,793 1,039,169 1,059,952 1,081,151 1,102,774
Revenue Transfer 493,104 473,752 487,515 502,140 517,205 532,721
Other Financing Sources (408,482) - 51,250,000 - - -
Total Revenues $32,074,047 $32,742,035 $94,765,364 $46,835,622 $50,314,194 $53,090,784
Personnel
$7,610,829 $8,510,206 $9,915,095 $10,407,507 $10,729,815 $11,113,154
Services & Charges 9,740,347 10,179,560 11,861,393 11,373,462 11,714,047 12,064,861
Supplies & Expenses 1,392,341 1,843,686 1,937,141 1,972,469 2,030,396 2,095,612
Contract & Leases 2,537,134 905,028 1,243,092 1,280,385 1,318,796 1,358,360
Debt Service - - 3,100,000 3,100,000 3,100,000 3,100,000
Inventory - - - - - -
Capital Maintenance 1,615,567 7,184,997 9,048,104 9,319,547 9,599,144 9,887,108
Capital Outlay 14,923,101 32,834,583 60,520,468 25,370,512 13,354,027 43,989,554
Transfers 2,994,334 2,735,029 2,620,571 2,699,188 2,780,164 2,863,569
Other 647 6,447 6,560 6,757 6,959 7,168
Total Expenditures $40,814,302 $64,199,536 $100,252,424 $65,529,827 $54,633,349 $86,479,386
Working Capital, Beginning $108,708,233 $99,967,978 $68,510,477 $63,023,417 $44,329,212 $40,010,056
Working Capital, Ending $99,967,978 $68,510,477 $63,023,417 $44,329,212 $40,010,056 $6,621,455
Working Capital Goal (25%) $6,472,800 $7,841,238 $9,932,989 $10,039,829 $10,319,831 $10,622,458
Excess/(Deficiency) $93,495,177 $60,669,238 $53,090,428 $34,289,383 $29,690,226 $(4,001,004)
Licenses, Permits and Fees
$12,410,677 $12,904,335 $13,417,657 $13,951,425 $14,506,456 $15,083,598
Charges for Services 41,959,000 44,566,944 47,354,236 50,332,304 53,516,635 56,920,501
Miscellaneous 1,124,830 1,147,326 1,170,273 1,193,678 1,217,552 1,241,903 Revenue Transfer 548,703 565,163 582,116 599,580 617,567 636,092
Other Financing Sources - - - - - -
Total Revenues $56,043,210 $59,183,769 $62,524,282 $66,076,987 $69,858,211 $73,882,094
Personnel $11,517,049 $11,918,061 $12,299,292 $12,635,687 $12,965,746 $13,286,535
Services & Charges 12,420,356 12,786,440 13,163,429 13,551,650 13,951,473 14,363,227
Supplies & Expenses 2,167,866 2,232,022 2,297,114 2,388,299 2,469,691 2,537,370
Contract & Leases 1,399,111 1,441,084 1,484,317 1,528,846 1,574,712 1,621,953
Debt Service 3,100,000 3,100,000 3,100,000 3,100,000 3,100,000 3,100,000
Inventory - - - - - -
Capital Maintenance 10,183,721 10,489,233 10,803,908 11,128,027 11,461,868 11,805,725
Capital Outlay 30,694,494 34,815,471 29,086,960 1,508,974 1,537,743 1,567,376
Transfers 2,949,476 3,037,960 3,129,099 3,222,972 3,319,661 3,419,251
Other 7,383 7,605 7,833 8,068 8,310 8,559
Total Expenditures $74,439,457 $79,827,876 $75,371,952 $49,072,523 $50,389,204 $51,709,997
Working Capital, Beginning $6,621,455 $(11,774,792) $(32,418,899) $(45,266,569) $(28,262,106) $(8,793,099)
Working Capital, Ending $(11,774,792) $(32,418,899) $(45,266,569) $(28,262,106) $(8,793,099) $13,378,998
Working Capital Goal (25%) $10,936,241 $11,253,101 $11,571,248 $11,890,887 $12,212,865 $12,535,655
Excess/(Deficiency) $(22,711,033) $(43,672,001) $(56,837,818) $(40,152,993) $(21,005,964) $843,343
Licenses, Permits and Fees
$1,694,087 $396,819 $3,033,153 $3,154,279 $3,280,370 $3,411,441
Charges for Services 13,378,439 13,525,017 15,647,895 16,510,010 17,423,226 18,390,608
Miscellaneous 3,048,232 875,200 871,200 839,200 805,200 821,200
Revenue Transfer (381,078) - 50,000,000 - - -
Total Revenues $17,739,680 $14,797,036 $69,552,248 $20,503,490 $21,508,796 $22,623,249
Personnel $1,647,051 $2,241,847 $2,522,969 $2,650,337 $2,737,298 $2,844,794
Services & Charges 172,862 697,896 662,581 682,148 702,306 723,073
Supplies & Expenses 506,474 526,117 577,612 585,429 599,537 616,270
Contract & Leases 8,345,788 9,507,840 10,293,076 10,086,868 10,389,474 10,701,158
Debt Service 3,000,000 3,000,000 3,000,000 3,000,000
Capital Maintenance 1,101,295 4,021,997 829,016 853,887 879,503 905,888
Capital Outlay 662,858 7,390,530 12,107,967 16,254,379 28,540,706 869,353
Transfers 823,445 938,176 869,488 895,572 922,440 950,113
Other 1,800 - - - - -
Total Expenditures $13,261,574 $25,324,403 $30,862,708 $35,008,620 $47,771,263 $20,610,650
Working Capital, Beginning $2,061,543 $6,539,649 $(3,987,718) $34,701,822 $20,196,692 $(6,065,776)
Working Capital, Ending $6,539,649 $(3,987,718) $34,701,822 $20,196,692 $(6,065,776) $(4,053,177)
Working Capital Goal (25% of Expenditures) $3,315,394 $6,331,101 $7,715,677 $8,752,155 $11,942,816 $5,152,662
Excess/(Deficiency) $3,224,256 $(10,318,818) $26,986,145 $11,444,537 $(18,008,592) $(9,205,839)
Licenses, Permits and Fees
$3,547,847 $3,689,704 $3,837,032 $3,990,528 $4,149,968 $4,315,955
Charges for Services 19,415,406 20,501,065 21,651,237 22,869,793 24,160,836 25,528,715 Miscellaneous 898,201 937,718 263,200 253,200 253,200 253,200
Transfer - - - - - -
Total Revenues $23,861,454 $25,128,487 $25,751,470 $27,113,521 $28,564,004 $30,097,870
Personnel $2,955,485 $3,067,771 $3,179,498 $3,271,968 $3,359,499 $3,447,282
Services & Charges 744,467 766,508 789,213 812,604 836,702 861,528
Supplies & Expenses 640,208 655,838 671,415 717,944 735,397 752,033
Contract & Leases 11,022,193 11,352,859 11,693,445 12,044,248 12,405,576 12,777,743
Debt Service 3,000,000 3,000,000 3,000,000 3,000,000 3,000,000 3,000,000
Capital Maintenance 933,065 961,057 989,889 1,019,585 1,050,173 1,081,678
Capital Outlay 870,687 635,853 4,380,469 4,003,593 409,662 421,952
Transfers 978,616 1,007,975 1,038,214 1,069,360 1,101,441 1,134,484
Other - - - - - -
Total Expenditures $21,144,722 $21,447,861 $25,742,142 $25,939,302 $22,898,450 $23,476,700
Working Capital, Beginning $(4,053,177) $(1,336,445) $2,344,181 $2,353,508 $3,527,727 $9,193,281
Working Capital, Ending $(1,336,445) $2,344,181 $2,353,508 $3,527,727 $9,193,281 $15,814,451
Working Capital Goal (25% of Expenditures) $5,286,180 $5,361,965 $6,435,536 $6,484,826 $5,724,612 $5,869,175 Excess/(Deficiency) $(6,622,626) $(3,017,784) $(4,082,028) $(2,957,099) $3,468,668 $9,945,276
Charges for Services $6,485,912 $7,106,746 $7,416,036 $7,739,326 $7,972,783 $8,214,624
Miscellaneous 698 2,090 2,253 2,463 2,641 2,870
Revenue Transfer 892,298 324,294 282,570 291,098 299,884 300,181
Total Revenues $7,378,909 $7,433,130 $7,700,858 $8,032,887 $8,275,308 $8,517,675
Personnel $3,767,897 $4,068,142 $4,250,641 $4,427,139 $4,558,971 $4,714,863
Services & Charges 622,536 641,872 644,468 660,732 677,455 694,649
Supplies & Expenses 850,898 901,316 917,090 942,377 967,459 997,869
Contract & Leases 191,656 246,320 247,171 248,048 248,951 206,930
Debt Service 163,200 163,200 163,200 163,200 163,200 163,200
Inventory 826,500 917,006 876,103 898,636 921,807 944,760
Capital Maintenance 53,991 52,227 58,564 60,321 62,131 63,995
Capital Outlay 40,504 131,124 30,000 30,000 30,000 30,000
Transfers 2,698 428,039 431,998 437,878 443,160 447,843
Miscellaneous 116,798 103 100 100 100 100
Total Expenditures $6,636,679 $7,549,349 $7,619,335 $7,868,432 $8,073,234 $8,264,209
Working Capital, Beginning $(705,265) $36,964 $(79,255) $2,267 $166,722 $368,795
Working Capital, Ending $36,964 $(79,255) $2,267 $166,722 $368,795 $622,261
Working Capital Goal (11% of Expenditures) $707,330 $750,968 $769,355 $796,109 $818,056 $838,548 Excess/(Deficiency) $(670,367) $(830,224) $(767,088) $(629,387) $(449,261) $(216,287)
Charges for Services $8,462,457 $8,719,233 $8,982,333 $9,254,971 $9,535,393 $9,824,357
Miscellaneous 3,064 3,314 3,526 3,798 4,066 4,345
Revenue Transfer 300,488 300,803 301,129 301,464 301,809 302,164
Total Revenues $8,766,009 $9,023,350 $9,286,987 $9,560,233 $9,841,267 $10,130,866
Personnel $4,873,202 $5,030,191 $5,185,763 $5,336,772 $5,488,121 $5,637,545
Services & Charges 712,329 730,510 749,206 768,433 788,208 808,545
Supplies & Expenses 1,025,652 1,057,099 1,088,791 1,116,203 1,151,970 1,182,439
Contract & Leases 207,888 208,874 209,891 210,937 212,015 213,126
Debt Service 163,200 163,200 163,200 163,200 163,200 165,729
Inventory 968,331 992,537 1,017,397 1,042,929 1,069,152 1,096,086
Capital Maintenance 65,915 67,893 69,930 72,027 74,188 76,414
Capital Outlay 30,000 30,000 30,000 30,000 - -
Transfers 451,120 456,414 459,830 465,264 470,219 474,697
Miscellaneous 100 100 100 100 100 100
Total Expenditures $8,497,736 $8,736,819 $8,974,107 $9,205,867 $9,417,174 $9,654,680
Working Capital, Beginning $622,261 $890,534 $1,177,065 $1,489,946 $1,844,312 $2,268,405
Working Capital, Ending $890,534 $1,177,065 $1,489,946 $1,844,312 $2,268,405 $2,744,591
Working Capital Goal (11% of Expenditures) $863,876 $889,593 $915,318 $940,214 $966,213 $991,846
Excess/(Deficiency) $26,659 $287,473 $574,627 $904,098 $1,302,192 $1,752,745
Licenses, Permits and Fees $2,709,580
$- $-
Charges for Services 3,874,417 3,935,577 4,014,289 4,094,574 4,176,466 4,259,995
Miscellaneous 173,692 102,299 104,345 106,432 108,561 110,732
Transfer - - - - - -
Total Revenues $6,757,690 $4,037,876 $4,118,634 $4,201,006 $4,285,026 $4,370,727
Personnel $778,590 $1,033,022 $1,092,342 $1,149,002 $1,186,118 $1,232,498
Services & Charges 138,923 1,770,967 831,727 856,641 882,305 908,742
Supplies & Expenses 74,056 127,503 131,627 143,648 147,005 150,501 Contract & Leases 105,803 215,679 437,258 450,375 463,887 477,803
Capital Outlay 648,192 4,496,380 1,043,222 1,074,375 1,106,606 1,289,804
Transfers 1,512,452 1,760,954 1,552,119 1,571,256 729,774 751,668
Other 493 - - - - -
Total Expenditures $3,258,509 $9,404,505 $5,088,295 $5,245,297 $4,515,695 $4,811,016
Working Capital, Beginning $7,352,232 $10,851,413 $5,484,784 $4,515,123 $3,470,832 $3,240,163
Working Capital, Ending $10,851,413 $5,484,784 $4,515,123 $3,470,832 $3,240,163 $2,799,874
Working Capital Goal (25%) $652,579 $1,227,031 $1,011,268 $1,042,731 $852,272 $880,303
Excess/(Deficiency) $10,198,834 $4,257,753 $3,503,854 $2,428,101 $2,387,891 $1,919,571
Licenses, Permits
for Services 4,345,195 4,432,099 4,520,741 4,611,156 4,703,379 4,797,446
112,946 115,205 117,509 119,860 122,257 124,702
- - - - - -
Revenues $4,458,141 $4,547,304 $4,638,250 $4,731,015 $4,825,636 $4,922,148
Personnel $1,279,759 $1,327,575 $1,373,568 $1,414,497 $1,452,156 $1,490,243 Services & Charges 935,974 964,026 992,923 1,022,690 1,053,353 1,084,939
Supplies & Expenses 154,858 158,442 162,156 166,818 170,584 174,474 Contract & Leases 492,137 506,901 522,108 537,772 553,905 570,522
Capital Outlay 846,908 870,358 894,512 919,390 -Transfers 774,218 797,444 821,368 846,009 871,389 897,531
Other - - - - - -
Total Expenditures $4,483,853 $4,624,747 $4,766,635 $4,907,174 $4,101,386 $4,217,709
Working Capital, Beginning $2,799,874 $2,774,162 $2,696,719 $2,568,335 $2,392,176 $3,116,426
Working Capital, Ending $2,774,162 $2,696,719 $2,568,335 $2,392,176 $3,116,426 $3,820,865
Working Capital Goal (25%) $909,236 $938,597 $968,031 $996,946 $1,025,346 $1,054,427
Excess/(Deficiency) $1,864,925 $1,758,122 $1,600,304 $1,395,230 $2,091,079 $2,766,438
Licenses, Permits and Fees $- $- $- $- $- $-
Intergovernmental 735,128 - - - - -
Charges for Services 2,050,955 4,043,507 4,185,030 4,331,506 4,504,766 4,707,481 Miscellaneous 778 255,060 263,987 273,227 282,790 292,687
Other Financing Sources 2,000,000 - - - - -
Total Revenues $4,786,861 $4,298,567 $4,449,017 $4,604,733 $4,787,556 $5,000,168
Personnel $97,616 $134,964 $143,782 $152,440 $158,615 $166,173 Services & Charges 5,760 9,505 11,259 11,556 11,862 12,178
Supplies & Expenses 1,931,397 199,593 201,244 207,472 213,696 220,107 Contracts & Leases 1,649,873 3,512,802 3,635,750 3,763,001 3,894,706 4,031,021
Debt Service 276,667 490,000 490,000 490,000 375,493Capital Outlay - - - - -Transfers 98,657 101,160 103,744 106,857 110,062 113,364
Total Expenditures $4,059,970 $4,448,024 $4,585,779 $4,731,326 $4,764,435 $4,542,844
Working Capital, Beginning $- $726,891 $577,434 $440,672 $314,079 $337,200
Working Capital, Ending $726,891 $577,434 $440,672 $314,079 $337,200 $794,524
Working Capital Goal (25% of Expenditures) $1,014,992 $1,112,006 $1,146,445 $1,182,832 $1,191,109 $1,135,711
Excess/(Deficiency) $(288,101) $(534,572) $(705,772) $(868,753) $(853,909) $(341,187)
Licenses, Permits
Intergovernmental - - - - - -
for Services 4,895,780 5,116,090 5,320,734 5,533,563 5,754,906 5,985,102 Miscellaneous 302,931 313,534 324,508 335,865 347,621 359,787
Financing Sources - - - - - -
Total Revenues $5,198,711 $5,429,624 $5,645,241 $5,869,429 $6,102,526 $6,344,889
Personnel $173,740 $181,414 $188,974 $194,623 $198,740 $202,938 Services & Charges 12,504 12,840 13,187 13,545 13,913 14,294
Supplies & Expenses 226,710 233,512 240,517 247,733 255,165 262,820 Contracts & Leases 4,172,107 4,318,131 4,469,265 4,625,689 4,787,589 4,955,154
Debt Service - - - - -Capital Outlay - - - - 3,000,000Transfers 116,765 120,268 123,876 127,592 131,420 135,363
Total Expenditures $4,701,826 $4,866,164 $5,035,819 $5,209,182 $8,386,827 $5,570,569
Working Capital, Beginning $794,524 $1,291,409 $1,854,869 $2,464,292 $3,124,539 $840,238
Working Capital, Ending $1,291,409 $1,854,869 $2,464,292 $3,124,539 $840,238 $1,614,559
Working Capital Goal (25% of Expenditures) $1,175,457 $1,216,541 $1,258,955 $1,302,295 $2,096,707 $1,392,642
Excess/(Deficiency) $115,953 $638,328 $1,205,337 $1,822,243 $(1,256,468) $221,917
Intergovernmental $2,203,511 $2,518,422 $3,469,066 $3,586,657 $3,708,357 $3,834,270
Miscellaneous 28,085 60,000 66,000 75,000 80,000 80,000
Revenue Transfer - - - - - -
Total Revenue $2,231,596 $2,578,422 $3,535,066 $3,661,657 $3,788,357 $3,914,270
Personnel $317,874 $344,908 $509,624 $539,154 $560,758 $587,193
Services & Charges 2,856,177 1,784,179 2,466,005 2,579,892 2,699,125 2,823,960
Supplies & Expenses 94,141 269,317 280,380 291,677 303,092 314,984
Contract & Leases 77,308 87,663 110,293 113,602 117,010 120,520
Capital Outlay - - - - - -
Carryover - - - - - -
Transfers - - - - - -
Total Expenditures $3,345,499 $2,486,067 $3,366,302 $3,524,325 $3,679,985 $3,846,657
Fund Balance, Beginning $3,829,661 $2,715,758 $2,808,113 $2,976,877 $3,114,209 $3,222,582
Fund Balance, Ending $2,715,758 $2,808,113 $2,976,877 $3,114,209 $3,222,582 $3,290,194
Intergovernmental $3,964,327 $4,099,344 $4,238,818 $4,382,135 $4,532,470 $4,687,475
Miscellaneous 80,000 80,000 80,000 80,000 80,000 80,000
Revenue Transfer - - - - - -
Total Revenue $4,044,327 $4,179,344 $4,318,818 $4,462,135 $4,612,470 $4,767,475
Personnel $613,911 $640,732 $665,243 $686,572 $705,155 $721,614
Services & Charges 2,954,663 3,091,514 3,234,804 3,384,842 3,541,947 3,706,458
Supplies & Expenses 327,371 340,278 353,725 367,739 382,343 397,564
Contract & Leases 124,136 127,860 131,696 135,646 139,716 143,907
Capital Outlay - - - - - -
Carryover - - - - - -
Transfers - - - - - -
Total Expenditures $4,020,081 $4,200,384 $4,385,468 $4,574,799 $4,769,161 $4,969,543
Fund Balance, Beginning $3,290,194 $3,314,440 $3,293,400 $3,226,750 $3,114,086 $2,957,396
Fund Balance, Ending $3,314,440 $3,293,400 $3,226,750 $3,114,086 $2,957,396 $2,755,328
2025
2026
Intergovernmental $2,749,843 $5,152,949 $4,620,602 $4,773,636 $4,866,002 $4,961,527
Charges for Services 35,568 28,000 28,000 28,000 28,000 28,000
Miscellaneous (18,771) 559,000 210,000 211,000 212,000 213,000
Revenue Transfer 241,000 3,000,000 - - - -
Total Revenue $3,007,640 $8,739,949 $4,858,602 $5,012,636 $5,106,002 $5,202,527
Personnel $64,063 $89,092 $92,553 $94,713 $96,686 $97,325
Services & Charges 742 37,048 731 747 764 782
Supplies & Expenses 2,245,469 5,579,345 7,351,955 5,625,534 6,340,152 4,594,970
Contracts & Leases 10,394 - - - - -
Capital Maintenance 18,048 - - - - -
Capital Outlay 121,817 3,000,000
Transfers - - - - - -
Total Expenditures $2,460,533 $8,705,485 $7,445,239 $5,720,994 $6,437,603 $4,693,077
Fund Balance, Beginning $7,718,385 $8,265,492 $8,299,956 $5,713,319 $5,004,961 $3,673,360
Fund Balance, Ending $8,265,492 $8,299,956 $5,713,319 $5,004,961 $3,673,360 $4,182,810
Intergovernmental $5,076,610 $5,175,923 $5,276,389 $5,379,585 $5,485,623 $5,593,035
Charges for Services 28,000 28,000 28,000 28,000 28,000 28,000
214,000 215,000 216,000 217,000 218,000 219,053
Transfer - - - - - -
Total Revenue $5,318,610 $5,418,923 $5,520,389 $5,624,585 $5,731,623 $5,840,088
Personnel $97,328 $97,332 $97,335 $97,339 $97,343 $97,347
Services & Charges 801 820 839 859 880 902
Supplies & Expenses 5,585,204 7,126,466 6,115,808 5,276,122 5,137,105 6,645,788
& Leases - - - - - -
Capital Maintenance - - - - - -
Outlay
- - - - - -
Total Expenditures $5,683,333 $7,224,617 $6,213,982 $5,374,320 $5,235,328 $6,744,036
Fund Balance, Beginning $4,182,810 $3,818,087 $2,012,393 $1,318,799 $1,569,064 $2,065,359
Fund Balance, Ending $3,818,087 $2,012,393 $1,318,799 $1,569,064 $2,065,359 $1,161,411
2025
2026
Intergovernmental $5,591,370 $5,347,094 $6,572,340 $6,740,106 $7,100,277 $7,250,698
Miscellaneous 162,540 73,000 71,000 74,000 80,000 86,000
Other 1,222,294 1,391,141 275,000 75,000 75,000 75,000
Total Revenue $6,976,204 $6,811,235 $6,918,340 $6,889,106 $7,255,277 $7,411,698
Personnel $1,890,032 $1,866,292 $1,957,447 $2,042,250 $2,091,395 $2,152,532
Services & Charges 125,141 95,596 121,931 125,250 128,672 132,200
Supplies & Expenses 446,048 401,487 354,603 366,195 377,143 388,481
Contract & Leases 40,128 43,000 44,290 45,619 46,987 48,397
Inventory (40,672) - - - - -
Capital Maintenance 931,260 798,974 686,173 706,758 727,960 749,799
Capital Outlay 4,024,344 4,325,099 1,757,750 2,606,912 2,846,920 5,100,146
Transfers 89,331 92,011 94,771 97,615 100,543 103,559
Total Expenditures $7,505,613 $7,622,459 $5,016,966 $5,990,598 $6,319,620 $8,675,114
Fund Balance, Beginning $6,651,346 $6,121,937 $5,310,713 $7,212,087 $8,110,595 $9,046,252
Fund Balance, Ending $6,121,937 $5,310,713 $7,212,087 $8,110,595 $9,046,252 $7,782,836
Intergovernmental $7,760,661 $7,343,610 $7,569,730 $7,943,032 $8,200,507 $8,521,009
Miscellaneous 92,000 98,000 104,419 111,285 118,630 126,488 Other 75,000 75,000 75,000 75,000 75,000 75,000
Total Revenue $7,927,661 $7,516,610 $7,749,149 $8,129,317 $8,394,137 $8,722,497
Personnel $2,268,412 $2,331,655 $2,394,558 $2,453,221 $2,513,680 $2,575,815
Services & Charges 135,837 139,588 143,455 147,441 151,552 155,791
Supplies & Expenses 400,974 412,832 425,081 437,743 450,502 465,232
Contract & Leases 49,849 51,344 52,885 54,471 56,105 57,788
Inventory - - - - - -
Capital Maintenance 772,293 795,462 819,326 843,906 869,223 895,299
Capital Outlay 1,321,802 1,604,097 3,716,985 3,439,617 19,572 20,159
Transfers 106,666 109,866 113,162 116,557 120,054 123,655
Total Expenditures $5,055,833 $5,444,844 $7,665,451 $7,492,955 $4,180,688 $4,293,740
Fund Balance, Beginning $7,782,836 $10,654,664 $12,726,430 $12,810,129 $13,446,490 $17,659,939
Fund Balance, Ending $10,654,664 $12,726,430 $12,810,129 $13,446,490 $17,659,939 $22,088,696
Intergovernmental $401,385 $804,528 $828,666 $853,526 $879,132 $905,507
Charges for Services $80,893 $82,222 $83,598 $85,023 $86,499 $88,026
Miscellaneous 185 42,000 25,000 30,000 35,000 40,000
Revenue Transfer 160,289 164,341 168,530 172,862 177,341 181,973
Total Revenue $642,752 $1,093,091 $1,105,794 $1,141,412 $1,177,973 $1,215,506
Personnel $66,762 $67,943 $71,608 $75,370 $77,822 $79,665
Services and Charges 2,484 40,490 4,810 4,941 5,076 5,215
Supplies and Expenses 3,110 5,208 4,649 4,876 5,022 5,172
Capital Maintenance 301,812 435,503 720,104 390,618 541,316 97,695
Transfers - - - - - -
Capital Outlay 244,404 - - - - -
Total Expenditures $618,572 $549,144 $801,172 $475,805 $629,236 $187,748
Fund Balance, Beginning $(83,930) $(59,750) $484,197 $788,819 $1,454,426 $2,003,163
Fund Balance, Ending $(59,750) $484,197 $788,819 $1,454,426 $2,003,163 $3,030,921
Intergovernmental $932,672 $960,653 $989,472 $1,019,157 $1,049,648 $1,081,010
Charges for Services $89,608 $91,245 $92,941 $94,695 $96,457 $98,252 Miscellaneous 40,000 40,000 40,000 40,000 40,000 40,000
Revenue Transfer 186,761 191,712 196,831 202,123 207,520 213,061
Total Revenue $1,249,041 $1,283,610 $1,319,244 $1,355,976 $1,393,625 $1,432,323
Personnel $81,564 $83,514 $85,516 $87,577 $89,699 $91,877
Services and Charges 5,359 5,508 5,661 5,820 5,983 6,152
Supplies and Expenses 5,328 5,487 5,652 5,822 5,996 6,176
Capital Maintenance 431,731 619,967 395,933 628,665 400,000 650,000
Transfers - - - - - -
Capital Outlay - - - - - -
Total Expenditures $523,982 $714,476 $492,762 $727,883 $501,679 $754,206
Fund Balance, Beginning $3,030,921 $3,755,980 $4,325,114 $5,151,596 $5,779,688 $6,671,634
Fund Balance, Ending $3,755,980 $4,325,114 $5,151,596 $5,779,688 $6,671,634 $7,349,751
Intentionally left blank
Arvada’s future prosperity and quality of life will be significantly influenced by the City’s ability to ensure that development meets safety requirements, design values and standards, infrastructure needs, and supports the local economy to implement the community’s vision.
To support community and economic development, the City of Arvada:
• Uses the Comprehensive Plan to guide planning, land use code decisions, development man agement, and informational and resource services that are delivered to residents, businesses, the development community, decision-making bodies, and neighborhood partners to achieve a well-planned, aligned, sustainable, and livable community for current and future generations
• Ensures the alignment of all City Master Plans providing an aligned and integrated approach to the achievement of strategic and operational targets .
• Applies a high-performing development review process that maintains the community’s standards for safety, vision, and quality design which ensures a quality and timely review for the developer .
• Supports the community’s vision by cultivating an environment that attracts and retains private-sec tor investment, a talented workforce, and an engaged business community
• Maintains and protects the health, safety, and welfare of the public by ensuring safe buildings in the community, while providing excellent customer service .
95% of development project approvals conform to the City’s Comprehensive Plan COMPLETED MILESTONES:
a By 12/2020 complete and implement the updated Land Development Code through adoption and remapping
MILESTONES:
• By 12/2022 create a sub-area plan for NW Arvada focused on place making
• By 12/2025 fully align the Master Plans contained within the City's Comprehensive Plan
Performance Measures
Target 2020 2021 2022 Target 2023 Target 2024 Target
Staff recommendations to City Council are adopted by City Council 96% 100% 96% 96% 96% 96%
Comprehensive Plan implementation strate gies will be initiated, on-going or complete 90% 98% 98% 98% 98% 98%
The team proactively updated several areas of the Comprehensive Plan (CP) in May and June of 2020 in association with the approval of the new Land Development Code (LDC) The new LDC up dated all zoning districts within the city and, as a result, some of the zoning was inconsistent with the intent of the new zoning .
As a result, the team updated several areas in the CP to provide better continuity between the new zone districts and the CP
During 2020, no comprehensive plan amendments were requested by a developer
By 12/2022 66% of development customers rate the development review process as ‘good’ and/or ‘excellent’
MILESTONES:
• By 12/2022 implement a development customer service survey with at least a 50% response rate
• Annually 90% of development reviews will be returned to the applicant within 15 business days . A 50% response rate .
• On an ongoing basis resolve all temporary certificates of occupancy (TCOs) within 6 months of issuance
MILESTONES:
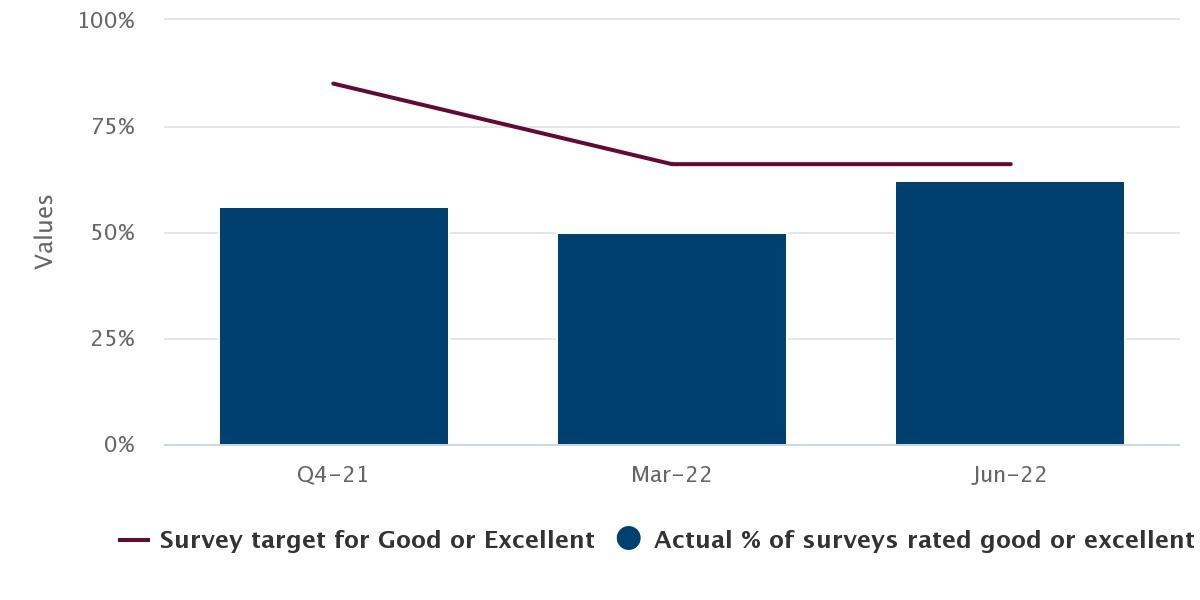
neighborhoods
neighborhoods
a regional
connect commercial
commercial
concept of pocket
creating of pocket
can accommodate pocket
residential activity at the neighborhood scale
uses that can integrate into the
from the local community
serve as a local
not
By 12/2025 fully align the City’s economic development efforts with the community’s vision expressed in the Community Survey and Business Survey
COMPLETED MILESTONES:
a By 12/2021 AEDA will be re-accredited by the International Economic Development Council a By 12/2021 establish a community outreach program that helps the community define its economic development goals MILESTONES:
• By 12/2022 develop policies, procedures and standards for all events occurring in Olde Town to ensure safety and quality for the community
• By 12/2023 establish a plan to build a hospital in Arvada in collaboration with a regional healthcare provide
• By 12/2025 develop options for the Harvest Festival targeting the alignment of the Harvest Festival Committee and City goals
Performance Measures Target 2020 2021 2022 Target 2023 Target 2024 Target
Annually facilitate the development of 150,000 square feet of new commercial real estate . 150,000 225,392 422,912 150,000 150,000 150,000
Community Survey - Planning for growth that add value to quality of life 75% N/A ** N/A N/A N/A Community Survey - Creating a competitive business environment 75% N/A ** N/A N/A N/A
Community Survey - Impact of growth change 65% N/A ** N/A N/A N/A
** The Community survey option was not continued after 2019
The City of Arvada performs a biennial community survey The results of the survey are used to help the City identify the areas where the City delivers excellent services and areas that need to be improved . The City was rated as a 3 .5 star community in the 2017 and 2019 survey
Meets or Exceeds Target Just Under Target Does Not Meet Target a Complete
The community depends on a well-maintained foundation of streets, sidewalks, and water, wastewater and stormwater facilities. Planned and steady population growth requires proper maintenance of existing infrastructure and additional capacity to support a thriving community.
To support infrastructure, the City of Arvada:
• Provides the community with a safe, reliable, high-quality water supply, drainage system, and wastewater disposal services for full city build-out, as defined by the Comprehensive Plan. This in cludes maintaining utility rates at lowest practical levels with accurate billing that supports replacement of aging infrastructure in order to maintain robust utility systems .
• Offers services focused on safe and environmentally-efficient City facilities and fleet vehicles to ensure the most efficient and maximum usage of valued assets.
• Maintains existing roads and transportation network in tandem with snow and ice control services to ensure swift and safe transportation modes for the community .
• Provides safe and efficient connections to modes of transportation, including transit, streets, side walks, and bikeways with a focus on enhanced technology at high-priority intersections improving safety and minimizing traffic congestion.
• Applies cost-effective and timely engineering design, geographic information, effective construction practices, and established standards and specifications to align public infrastructure priorities with community growth and redevelopment needs
• Provides computer-aided drafting, design services, special analysis, GIS applications, and en terprise system integration for the workforce to better visualize spatial relationships for informed decisions, while maintaining and/or replacing infrastructure and accommodating new construction projects .
• Enforces the federal Clean Water Act, Safe Drinking Water Act, and Endangered Species Act through best practices for stormwater runoff protecting water quality in rivers and streams, water shed health, and groundwater as a drinking water resource .
for
• Licenses, Permits and Fees include water and sewer system development fees, drilling fees, inspection fees , Waste and Recycling fees
increase in 2023 and 2024 is due to an increase in system development fees to coincide with current market rates in this area . System development fees were formally tap fees
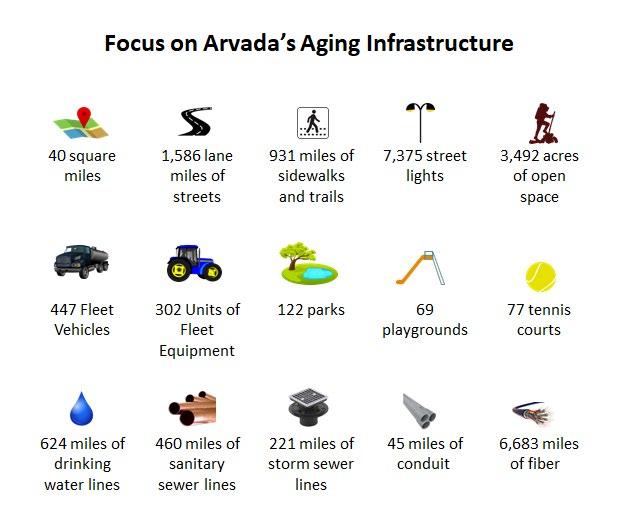
Charges for services increased in 2022 due to increases in water and wastewater rates and the implementation of the waste hauling and recycling program
increases in 2023 and 2024 are due to water and sewer rate increases of approximately 14% and 12% respectively
Miscellaneous revenues include interest on investments and recovered costs, including payments received as part of the 50/50 sidewalk replacement program
The increase in other financing sources in 2023 is due to planned $50,000,000 bond issues in the Water and Wastewater fund
• Personnel costs and the position count increased due to new positions in streets maintenance, facilities, engineering and the water and waste water funds .
• Utilities and water disposal charges are included in the services and charges category The annual increase in utilities was mitigated by implementation of the Ameresco Energy program in 2020 which is expected to reduce water, electric, and natural gas expenses
• The largest components of contracts are payments to Denver Metro Wastewater Reclamation District for wastewater processing, asphalt and concrete work in the Street Maintenance program, and services associated with the new Waste Hauling program
• Debt Service increases in 2023 due to the issuance of bonds in the Water and Wastewater Funds
• Capital Maintenance and Capital Outlay increase in 2022 due to the Gross Reservoir project and in 2023 capital projects which are discussed in further detail in the Capital Improvement section . The anticipated bond issues in water and wastewater funds will fund the capital projects
• Transfers include transfers from the Water, Wastewater, and Stormwater utilities to the general fund and transfers from the Stormwater fund for payment of COPs .
Aging curb, gutter, sidewalks, ADA compliant ramps, streets and utility assets
Funding required for asset maintenance, replacement and serving planned development
Cost and availability of labor and materials
service area
Execution of bond projects
Completion of Master Plans
Progress on long-term water and sewer needs
road condition analysis
Success of organized waste hauling Transportation infrastructure
Accessibility to public buildings
variability
in Funding
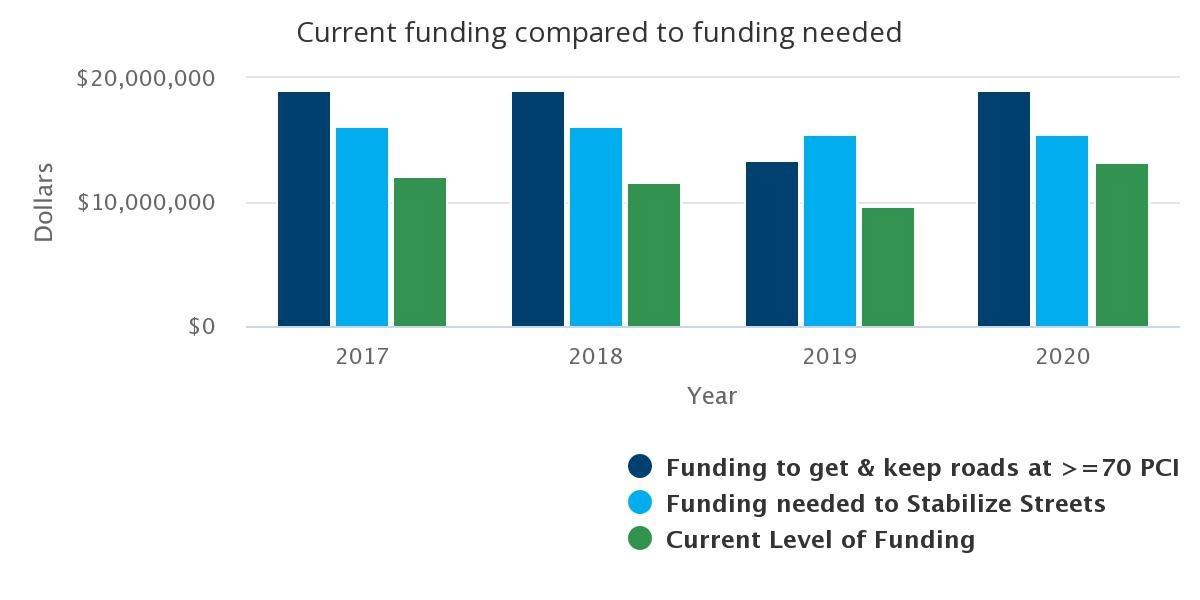
Over the past decade, the cost of repairs to the street system has outpaced the money the City is able to dedicate to street maintenance projects . In November 2016, the City placed a measure on the ballot to increase City sales and use tax by 1/2 cent to fund only street maintenance and improve ments The ballot measure did not pass Nevertheless, the City remains committed to protecting this asset and is working diligently to increase funding for street maintenance . This performance measure demonstrates that the City is making progress towards closing the gap in funding needed to stabilize streets
38
In 2020, the City transitioned from a Pavement Condition Index to a more comprehensive Pavement Quality Index (PQI) The PQI provides an overall indication of a pavement section's condition with re gard to present and future service to the user. The present service to the user is reflected in the Riding Comfort Index, which reflects the traveling public's opinion of the pavement's smoothness, hence the quality of service it provides . Future service to the user is measured through measurement of surface distress and structural adequacy The city-wide averages of these measures make up the PQI, which is rated from a low of 0 to a high of 100 The PQI helps the City to create its maintenance plan and efficiently allocate resources
City of Arvada
traffic signals
school zone flashers placed throughout the City. Signal
monitor, troubleshoot, and adjust signal timing
Traffic and Transportation Division
safety. Fifteen additional sig nals
to be
City's
of
traffic flow
coordination
Arvada Community (Citizen) Survey is conducted every other year, and functions as a consumer report card for the City by providing residents the opportunity to rate their satisfaction with their quality of life, community amenities, and local government The survey has a scale from 0 to 10 where 0-4 means “Does not meet expectations”, 5 means “Meets expectations”, and 6-10 means “Exceeds ex pectations”
By 12/2021 complete full implementation of waste hauling options
COMPLETED MILESTONES:
By 5/2020 the first reading of the proposed ordinance will be complete a By 6/2020 a public hearing at a City Council Business Meeting will be held and City Council will be provided with the option for contract approval a By 12/2020 develop a waste hauling engagement and outreach plan if the contract is approved by City Council a By 4/2021 complete initial household component selections to prepare for Cart Deployment in June a By 6/2021 stage and deploy waste and recycle carts a By 7/2021 begin waste and recycle collection services with a contracted vendor
Strongly
Arvada Community (Citizen) Survey is conducted every other year, and functions as a consumer report card for the City by providing residents the opportunity to rate their satisfaction with their quality of life, community amenities, and local government
Overall, two-thirds of residents either "somewhat" or "strongly" support the idea of single-hauler waste collection service
12/2023 update water, sewer, stormwater
plans and develop an implemen tation plan to address all findings
MILESTONES:
By 12/2021 complete the Sewer and Stormwater Master Plans
By 12/2022 complete the Water Master Plan
12/2023
to implement
Master Plans
City is committed to maintaining the investment in the water system infrastructure . Timely response to all urgent situations minimizes property damage and inconvenience to all customers . By investing in water main replacement and taking the time to analyze and prioritize existing infrastructure, pipeline breaks have remained under the target in recent years
and maintenance
needed to prevent blockages from forming in the pipelines
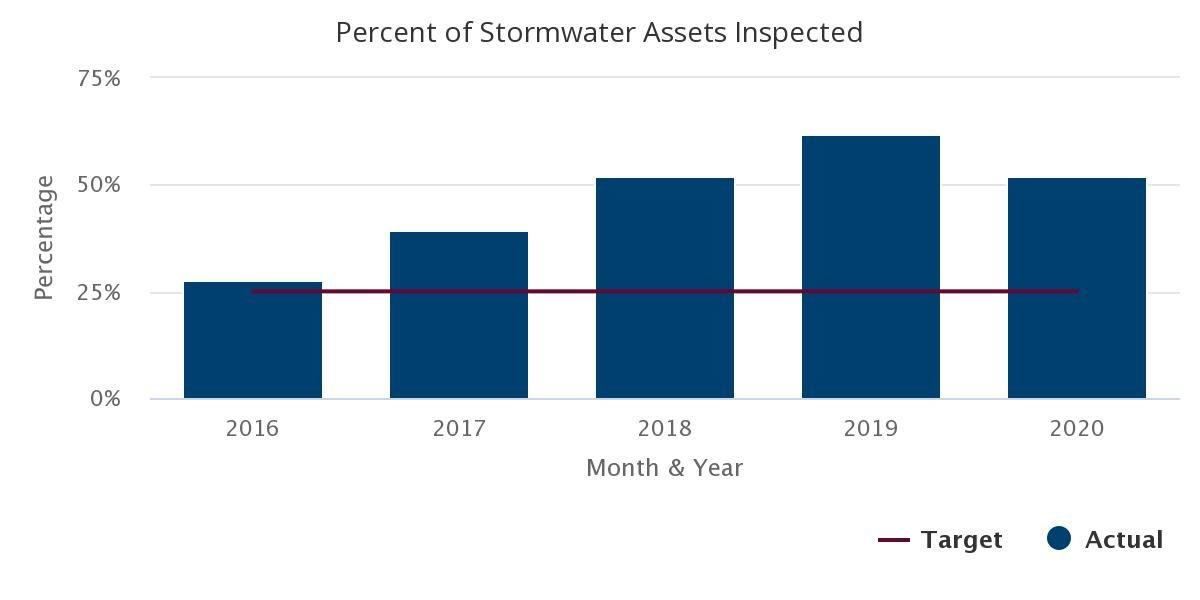
and cleaning
pipe segment
average of once every 4 years
effective in preventing the buildup of materials
lead to blockages. This work helps min imize local flooding and
water breaks, sewer
and flooding
sewer
the sewer system
increase the lifecycle of the pipes
this goal in mind, the City has a target of rehabilitating and/or replacing 60,000 lineal feet of sanitary sewer
blockages from forming in the pipelines; the City target of 66% of the system
year. Routine cleaning of the system
be cleaned
year
the industry standard of 33% . Mainline backups are caused by debris
a mainline is blocked and sewage backs up into the basement of a nearby
builds up over time
responsibility The City is responsible for locating all underground
City
not precisely located, any damage becomes the City’s responsibility
the
assets
of
12/2023
City Council
order to eliminate the street maintenance
12/2022
and develop policy direction for streets maintenance including ADA compliance requirements
12/2022 all new development in the City complies with ADA requirements and 2022 updated engineering standards
1/2023 complete research and create the business case for dedicated funding to street maintenance
obtain council support and direction for dedicated streets funding
12/2023 have a business case for maintaining infrastructure in the future
12/2025
utilize voter
the completion of Ralston Road phase 2
By 3/2023
the expansion
of bond funds
12/2024 the required 5-year
Avenue
2018, Arvada citizens approved Ballot Issue
to fund $79 8 million of improvements to Ralston Road and West 72nd Avenue By March 2022, 85% of those funds ($67 8 million) must be expended
of the end of FY 2020, 13% of the $79.8 million
bond
had been spent
$7,000,000
$6,000,000
$5,000,000
$4,000,000
$3,000,000
$2,000,000
$1,000,000
By 12/2025 complete a comprehensive plan for City facilities and properties that would be utilized for City business operations post COVID-19, including the City Hall campus, Indiana Shops, and other appropriate satellite facilities to ensure optimal usage of space
COMPLETED MILESTONES:
By 12/2020 update the conceptual plan for the Post Office property
By 12/2021 present the conceptual plan for the Post Office property with cost, funding, and schedule to City Council
MILESTONES:
By 12/2022 complete an evaluation of utilization of all currently operating City facilities
By 12/2023 determine need for additional facilities to support City operations
By 12/2024 develop a financial plan for improvements to existing City facilities and/or purchase of additional properties
Asset Management Program:
Maintain less than 3% facility cost index (FCI)
than 3% 0 .9% 0 .4%
The Facility Condition Index (FCI) is the ratio of current year required renewal cost to current building replacement value . It assesses the current and projected condition of the City’s building assets . Usage of the City Hall campus as a whole will be subject to future study. Currently, the post office has a lease through 2022 which it is anticipated they will renew In addition, the recent COVID situation has po tentially changed the way the City uses the workspace within City Hall Between the anticipated lease renewal and the likely potential change in the use of workspace at City Hall, the post office expansion plan has been placed on hold until the current situation stabilizes and the City has a better long-term view of how workspace will be used .
Through 12/2025 continue progress on having 100% of the water supply needed for buildout based upon the water supply master plan and current schedule for completion of Gross Reservoir by 2028
MILESTONES:
• By 12/2024 develop a Water Supply Master Plan
• Through 12/2025 maintain funds to meet water supply financial commitments
Through 12/2025 monitor Denver Water participation contract requirements to meet water delivery scheduled for 2028
2016
Responsible water use at golf courses - West Woods Average use for the prior three years
Responsible water use at golf courses - Lake Arbor
2016
2020
The ability to use water in a responsible manner while maintaining USGA golf course appearance and play-ability standards requires the monitoring of water usage at both courses. Pump station flow meter readings are collected at both pump stations and converted from gallons to acre feet The target is based on the average usage on the courses for the prior three years . In 2018 a new irrigation system was installed at West Woods which has reduced water usage .
By 12/2022 the engineering standards and City code framework will be updated
COMPLETED MILESTONES:
a By 12/2020 create new development agreement terms and tern- plate a By 12/2021 complete draft engineering standards and specifications update MILESTONES:
• By 12/2020 complete an inventory of engineering Ordinances and specifications and by 12/22, adopt new/revised Ordinances and specificationsnew/revised ordinances and specifications
By 12/2023 complete and implement an Arvada transportation master plan, including analysis of the current transportation network, and analysis of future multi –model op portunities including non-motored micro-mobility options, transit operations first and last mile opportunities, road system safety improvements, and emerging transportation technology
MILESTONES:
• By 6/2022 initiate a transportation master planning project with a selected contractor
• By 6/2023 begin implementation of the transportation master plan
• By 7/2023 the Transportation Committee will align with city stakeholders in the refinement and implementation of the masterplan recommendations
• By 1/2024 on an on-going basis provide semi-annual updates to the City Council regarding the implementation
By 6/2023 create a comprehensive environmental regulatory compliance program
MILESTONES:
• By 8/2022 evaluate current City Ordinances, state and federal regulatory requirements, and the logistics for the development of an environmental regulatory compliance program
• By 12/2022 provide the analysis and . recommendations regarding a comprehensive environmental regulatory compliance program to the City Manager
• By 6/2023 based upon the outcomes of previous milestones, update workforce plans and set new milestones for the resourcing of recommendations
By 6/2024 conduct a fleet electrification transition study
MILESTONES:
• Effective 6/2022 all future vehicle purchases will include the evaluation of electric vehicle options
• By 12/2022 identify and solicit additional state, local and grant funding opportunities for charging infrastructure
• By 6/2023 complete a telematics study of city fleet vehicle use patterns
• By 6/2024 prepare a comprehensive report with vehicle use pattern assessments and recommendations for fleet electrification, including vehicles, resource needs, and charging infrastructure
Intentionally left blank
The community depends on a well-managed, fiscally-responsible and transparent City government to guide the organization in a manner that enhances quality of life. Performance-based management practices, sustainable levels of resource use, efficient application of technology, a high-performing workforce, and legal and ethical compliance will ensure the long-term credibility and effectiveness of the City government.
To support organizational and service effectiveness, The City of Arvada:
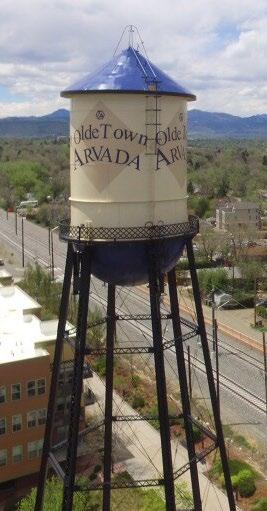
• Provides leadership, policy and guidance, communication, and engagement services to City Council, the community, and the organization utilizing a values-driven organizational culture, ethi cal behavior, and transparency to the community to maintain public trust .
• Provides legal services to the City Council, Boards and Commissions, and all work systems, so they can enforce the law, avoid, or mitigate risks associated with City operations and protect the legal interests of the City
• Maintains appropriate staffing levels, collaborative communications, information technology and financial management support, as well as, leadership services to all work systems to achieve strategic and operational results
• Provides a well-managed, fiscally responsible government that operates effectively and efficiently while identifing revenue requirements to sustain current service levels and achieve future requested levels of service
• Leverages technology, and benchmarks to guide decisions, improve results, enhance service delivery, and maintain the highest level of data security in support of City effectiveness, now and into the future.
• Provides multiple information platforms and data to the community to support its ability to engage in community governance, exercise civic responsibility, and easily ac cess
• Fosters a top workplace environment that attracts and retains a highly engaged, inclusive workforce and fosters a culture of wellness, safety, cycles of learning and performance excellence .
• Supports a resilient workforce and community that are able to withstand stresses and shocks, while maintaining essential functions and recovering quickly, effectively, and equitably .
Services
• Taxes include sales tax, general use tax, auto use tax, building use tax, property tax and property tax and account for over 82% of the General Fund budget This revenue increases 3 5% in 2023 due to the increase in sales tax Revenues increase 2% in 2024 as these revenue sources stabilize
• Highway Users’ Tax Fund and Jefferson County Road and Bridge taxes account for approximately $5 .5 million of intergovernmental revenues . The remaining amount of intergovernmental revenue is composed of allocations to the Insurance fund Intergovernmental revenue declines in 2023 as the 2022 revised revenue includes American Rescue Plan funding of $5 5 million
Charges for services reflect the cost of administrative services paid by the Enterprise funds.
Miscellaneous revenues include interest income and recovered costs
Achievement of Excellence in Procurement Award is earned by public and non-profit agencies that demonstrate a commitment to procurement excel lence . This annual program recognizes procurement organizations that embrace Innovation, Professionalism, Productivity, Leadership and e-Procurement
• Personnel include salaries and benefits for the City Manager’s Office, City Attorney’s Office, Finance, Human Resources and Information Technology departments. The increase in 2023 reflects two new positions in Information Technology and the City Manager's office, this increase also reflects four new positions add ed mid-year 2022 in Finance, Human Resources, and City Attorney's Office.
• The services and charges line item in 2022 includes expenses related to the receipt of funds from the American Rescue Plan as these funds will be spent from this line item
• The supplies and expense line item increases for 2023 are due to increased maintenance and replacement spending in the Computer Maintenance Fund
• The contracts and leases line item increases in 2022 are due to several one-time increases for legal fees, professional services and security projects Spending returns to normal levels in 2023
• Transfers include transfers to the Street Maintenance Fund, Capital Improvement Projects Fund, Parks Fund and Certificates of Participation Fund.
retention of
on
Manager
and location
a By 12/20, in alignment with established recovery principles, the City will provide services with necessary modifications while remaining agile and able to respond to changing circumstances related to the COVID-19 pandemic
COMPLETED Milestones:
a By 5/20, all work systems teams will have a recovery plan in place
a By 7/20, develop and implement a framework for remote work including policy updates, equipment needs, and performance metrics
a By 9/20, present a 2-year budget and 10-year financial plan that accounts for the effects of COVID-19
a By 12/20, CARES funding will be fully utilized to support the community and City operations
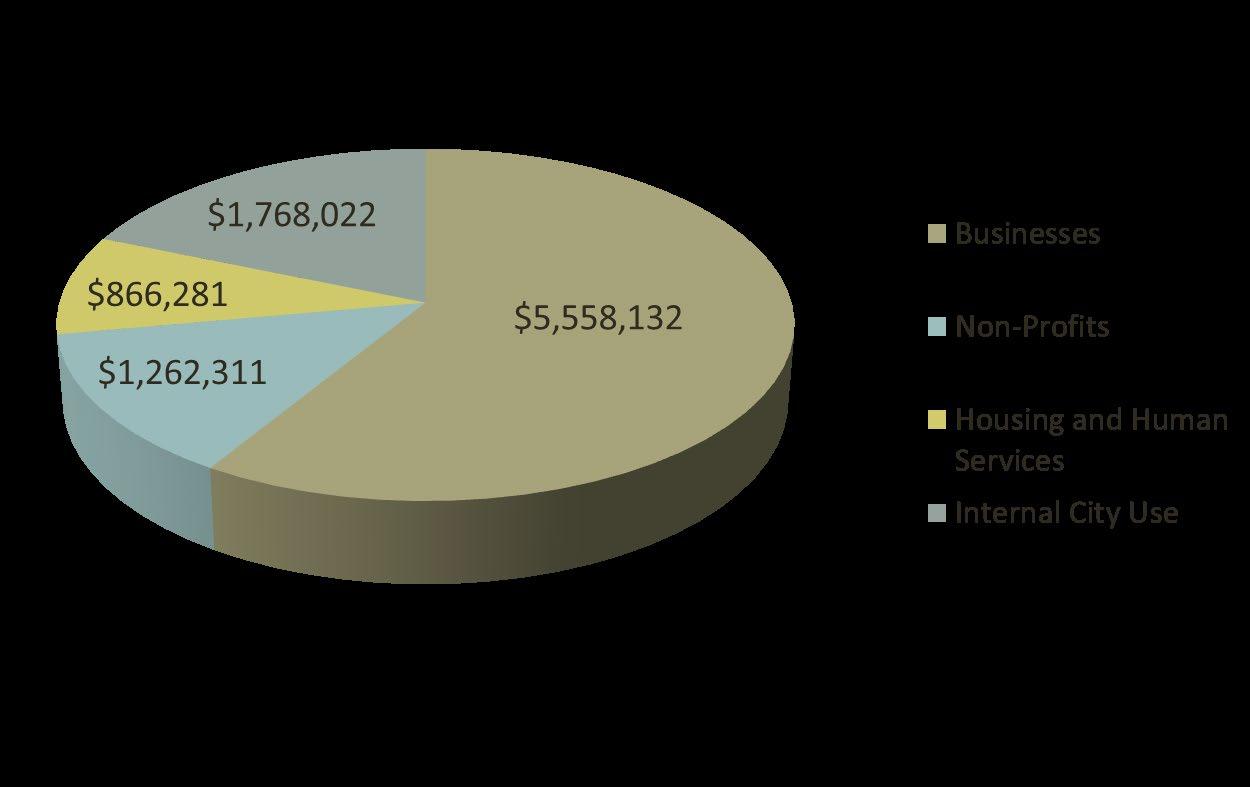
By 12/23, implement a comprehensive City communications and engagement strategy
COMPLETED MILESTONES:
a By 1/20, complete the overarching communications and engagement strategy
a By 12/20, implement external communications, engagement plans and an internal communication plan and by 12/21 implement an internal communications plan MILESTONES:
• By 12/22, determine branding framework to be used in alignment with arvadaco .gov upgrade
• By 6/23, develop a marketing plan highlighting the City successes, presenting information using engaging content and using shared partner messaging
By 12/23, develop an organizational framework for the effective advancement of data utilization, system integration, and digital capacities across all work systems
COMPLETED MILESTONES:
a By 6/20, identify all performance measures with a potential smart city component and create a city wide inventory
a By 12/20, complete first draft of the Smart Arvada Plan
a By 6/21, develop a data governance framework
a By 1/22, increase the data governance maturity score from the 1 4 to 2 2 MILESTONES:
• By 6/22, select a Cloud partner and implement the Could platform
• By 9/22 form data and analytics team
• By 6/23, select ERP replacement platform
• By 6/23, increase the data governance maturity score to 2 9
By 12/22, continue to implement an organizational performance excellence framework
COMPLETED MILESTONES:
a By 12/21 achieve Denver Post Top Workplace designation MILESTONES:
• Annually maintain a "AA" or better bond rating

• Annually enhance Arvada University programming to support workplace growth and development needs
• On an ongoing basis, prepare and present a balanced biennial budget and 10-year financial plan
• By 12/23, establish systems and structures to embed enhanced levels of sustainability, accessibility, equity and safety in our services and operations
• By 12/25 draft the application for Malcolm Baldridge National Quality site visit
AAA
reflects an opinion that the City has the current capacity
the highest possible rating
meet is debt obligations
Annually update the City's ten-year financial plan
Yes Yes Yes Yes Yes
GFOA Certificate of Achievement in Financial Reporting received Yes Yes Yes Yes Yes Yes
*GFOA Certificate of Distinguished Budget Presentation received Yes NA Yes NA Yes NA
Businesses voluntarily compliant with City tax codes
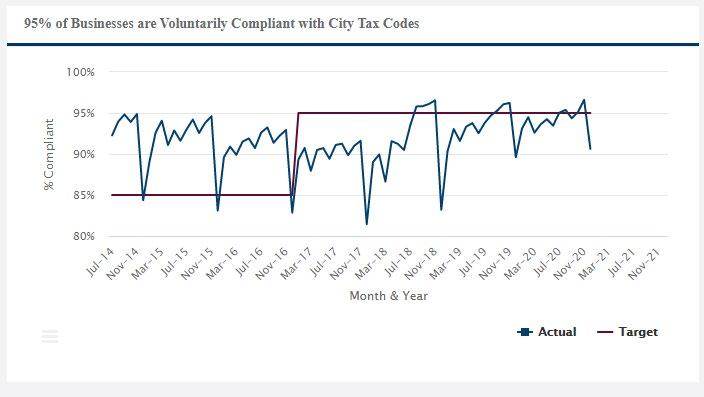
Licensed businesses that file and pay sales and use tax returns online
91% 88% 95% 95% 95%
95% 100% 99% 99% 99%
Grant proposals awarded 50% 73% 77% 50% 50% 50%
These performance measures demonstrate that the City is a well-managed, fiscally responsible government that can sustain current service levels and also utilizes long range planning to maintain the fiscal health of the City.
* The Certificate of Distinguished Budget is awarded every other year.
City's matched jobs graded
market value
to
Annual healthcare increase over previous year
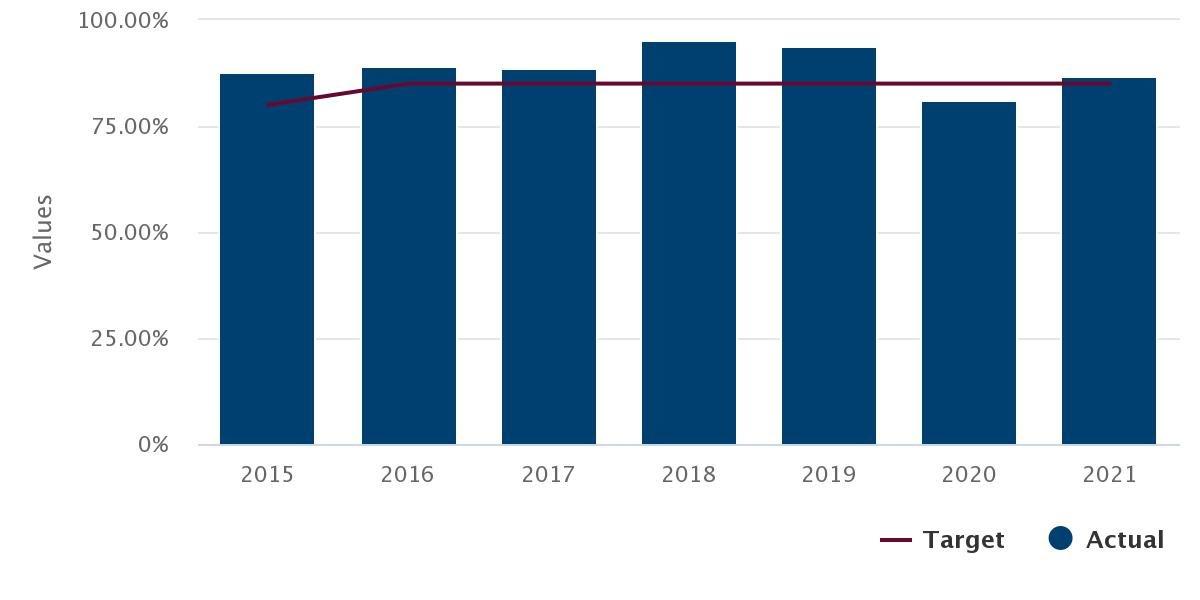
employees enrolled in the City's healthcare plan who receive an annual physical
participating in wellness awareness and incentives
Recruitments resulting in a hire during the first recruitment process
Vacancies posted where a conditional offer occurs within 45 days of the application deadline
*Achieve Denver Post Top Workplace designation
The City is an employer of choice and fosters a culture of safety, wellness, cycles of learning and process improvement that attracts and retains a highly-engaged and diverse workforce
*Denver Post Top Workplace only entered in 2018 and 2020
or less average storage space
use
or less system memory is in use for host servers
80% 80%
These technology performance measures track performance of the overall system and ensure that there is room for growth .
By 12/22 Continually measure citizen satisfaction regarding the overall well-being of the community
COMPLETED MILESTONES:
a By 12/20 identify all lower-rated items in the 2019 Community Survey and develop an action plan to address all items
MILESTONES:
• By 6/22, identify and select a survey vendor
• By 9/22, develop survey questions with input from the community
By 8/22, launch an annual Arvada Community Survey
By 12/23 Community Resilience and Sustainability plans will be updated and implemented MILESTONES:
• By 12/22, begin hiring process for a new Sustainability Coordinator
• By 12/22, develop a municipal resilience strategy to prepare and adapt for the urgent threat of changing environment and resources
• By 6/23, work with the Arvada Sustainability Advisory Committee in the development of the scope of work for the update to the Sustain Arvada Plan
• By 12/23, complete the update of the Sustain Arvada Plan including an inventory of existing sustainability actions to determine level of service needs
• By 6/24, resource and implement Council approved actions included in the Sustain Arvada Plan
By 12/23, update the City's Total Rewards Philosophy and Strategy to improve the City's ability to attract, motivate and retain
MILESTONES:
• By 6/22, complete an Employee Total Rewards Survey and an Employment Market Benchmark Study
• By 8/22, update City Council on Total Rewards Philosophy for City Council discussions
• By 12/22, develop and recommend new Total Rewards Philosophy for City Council approval
• By 12/23, create the strategy for developing and funding Total Reward Program and begin designing and implementing program updates
By 12/25, 50% of neighborhoods complete a project or initiative that reshapes or activates hared neighborhood spaced
COMPLETED MILESTONES:
a By 12/20, offer leadership development opportunities and training to volunteers to foster future City leaders MILESTONES:
• By12/22, develop a neighborhood engagement plan
By 12/24, based on long-term financial projections and updated master plans, develop financial resiliency recommendations to ensure adequate and ongoing investment in city infrastructure and core services
MILESTONES:
• By 12/22, using information assembled as part of the 2023-2024 Budget development process and current master planning efforts, prepare a summary of long range unfunded needs by work system
• By 12/23, develop a city-wide consolidated level of service summary
• By 12/23, prepare an exhaustive list of funding source opportunities for closing identified infrastructure and core service funding gaps
Meets or Exceeds Target Just Under Target Does Not Meet Target a Complete
Intentionally left blank
Community-based policing, connected neighbors, engaged local businesses, supportive community institutions, and a fair and impartial justice system, all working together, to ensure Arvada is a safe place to live, work, play, and stay.
To support a safe community, the City of Arvada:
• Achieves and maintains the gold standard in public safety by meeting and exceeding standards set forth through the Commission of Accreditation for Law Enforcement Agencies (CALEA) to assist with the designation of one of the safest communities in Colorado .
• Provides customized police services making the community feel safe and secure, including proper investigation, appropriate case filings, and crime scene investigation, resulting in an increased likelihood of identifying and prosecuting those responsible for committing crimes
• Ensures the Police Department has appropriate staffing levels; communication, information, financial management support; and leadership services to achieve strategic and operational results, including maintaining a well-informed community .
• Applies inspection, enforcement, community support, and neighborhood engagement services to residents, businesses, and neighborhood partners in order to preserve safety, compliance, stability, and appearance of neighborhoods through collaborative partnerships and achievement of long-term neighborhood goals .
• Provides administrative, business, communication, and investigative services to members of the community and the Police Department with a commitment to Respect, Dedication, and Responsibility
• Provides an independent, fair, and impartial justice system that efficiently processes the court docket, renders fair and just decisions, and holds all stakeholders accountable .
Click here to learn more about the Arvada Police Department


•
primary sources of revenue are sales tax from the General Fund along with a 21 and 25 sales tax increment generated from a voter-approved measure to fund expanded police services . Revenue trends closely follow those in the General Fund
Intergovernmental revenue is elevated in 2021 and 2023 from a COPS grant for four additional police officers.
The revenue transfer in 2021 was a contribution toward the purchase of a command vehicle as part of a West Metro Drug Task Force grant
By 12/23, Public Safety staffing levels will be at 95% filled
COMPLETED MILESTONES:
a By 12/20, create performance measures documenting the amount of and reasons for officer attrition
MILESTONES:
• By 12/24, continue to utilize the recruitment and retention plan on a yearly basis
• By 12/24, continue use of an over-hire strategy to leverage access to quality candidates and be fully staffed Performance Measures
2020 2021 2022 Target 2023 Target 2024 Target
Sworn Officers earned a Bachelor's Degree 100% Yes Yes 100% 100% 100%
A bachelor’s degree is a minimum educational requirement for all Arvada police officers. The Bureau of Justice Statistics state only 1% percent of U S police agencies require a four-year college degree

a By 2/21, Public Safety will implement a community engagement and education plan
COMPLETED MILESTONES:
a By 12/20, formalize and integrate the CORE unit to work with those experiencing homelessness by providing resources, education, and criminal violation enforcement a By 12/20, implement a plan that outlines services and education provided to juveniles within Arvada
a By 12/20, implement a plan that outlines strategies to enhance positive police and community interaction
Number of contacts officers have with high utilizers of mental health-related calls for service 54
Percentage of calls for service in which a mental health co-responder is dispatched
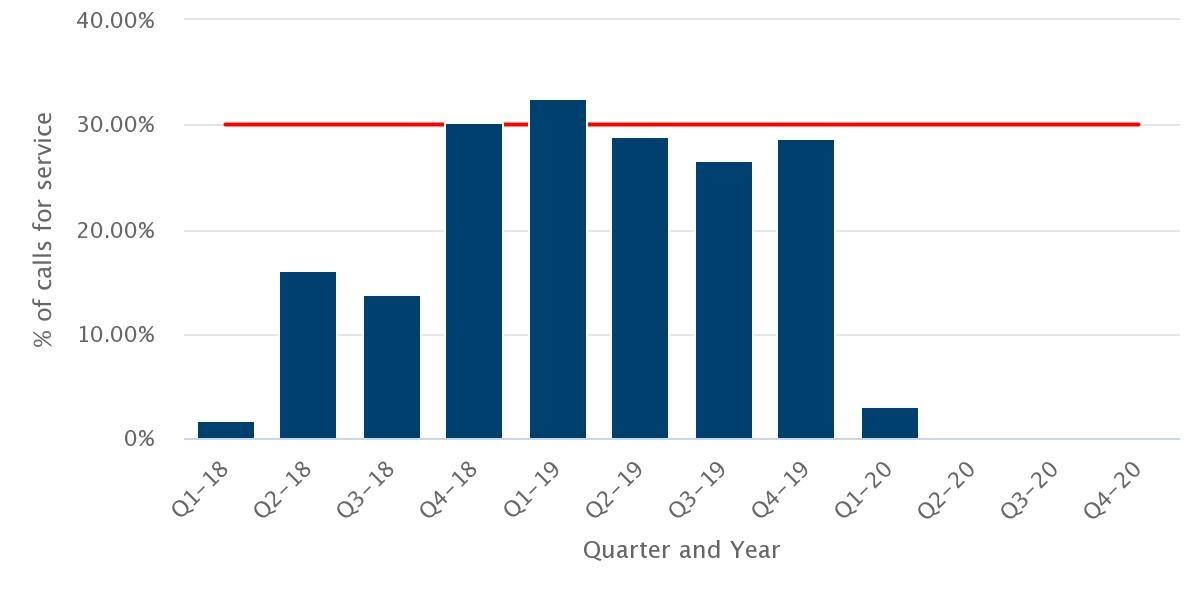
Percentage of time contributed by co-responders on mental health-related calls and services
2023 Target 2024
19%
Strategic Result 2 completed by 2021 Provides customized police services to the community to assist in making the community feel safe and secure, including proper investigation, crime scene investigation, and appropriate case filings, resulting in an increased likelihood of identifying and prosecuting those responsible for committing crimes
% of Calls for service in which a mental health co-responder is dispatched
AMO: Through a combination of education, community outreach and enforce ment, and in accordance with the IGA between the City of Arvada and Foothills Animal Shelter (FAS), 20% of the esti mated dogs in Arvada will be licensed annually
Target 2020 2021 2022 Target 2023
17%
2024 Target
Strategic Result 2 completed by 2021
Inspections, enforcement, community support, and neighborhood engagement services to resi dents, businesses, and neighborhood partners in order to preserve compliance, stability, safety, and appearance of neighborhoods through partnerships and achievement of long-term neighborhood goals Applies inspections, enforcement, community support, and neighborhood engagement services to residents, businesses and neighborhood partners in order to preserve compliance, stability, safety and appearance of neighborhoods through partnerships and achievement of longterm neighborhood goals .
By 12/23, maintain a violent crime rate lower than 80% of the cities in the state of Colorado with a population of 100,000
MILESTONES:
• By 12/22, implement a comprehensive Traffic Safety Strategy and Operational Plan with collaboration between the police department, traffic engineering and streets maintenance programs to ensure high level traffic safety and operation standards
• Annually, 80% of calls for service with a priority of "0" or "1" will have less than 5 minute response time
• By 12/2022, design and implement Code Enforcement Measure focused on proactive inspections for designated retail commercial areas
80% of calls with a priority of 0 or 1 will have less than five (5) minute response times
2020 2021
Target 2023 Target 2024 Target
80% 80% 80%
Appropriate staffing levels, communication, information, and financial management support as well as leadership services to the Police Department to achieve strategic and operational results including maintaining a well-informed community
Industry average is 10 minutes
Performance Measures
80% of the time, Sector Commanders will have 20 in person meetings per month with community members
Target 2020 2021
Target 2023 Target 2024 Target
86% 80% 80% 80%
** Measure not implemented until 2021
Applies inspection, enforcement, community support, and neighborhood engagement services to residents, businesses, and neighborhood partners in order to preserve safety, compliance, stability, and appearance of neighborhoods through collaborative partnerships and achievement of longterm neighborhood goals .
Performance Measures
Sergeants will respond to 20% of citizen initiated calls for service
LAB: Annually, 20% of CSI/CSS investigations will result in a CODIS or AFIS hit
2020 2021
Target 2023 Target 2024 Target
20% 20% 20%
20% 20% 20%
** Measure not implemented until 2021
Provides customized police services making the community feel safe and secure, including proper investigation, appropriate case filings, and crime scene investigation, resulting in an increased like lihood of identifying and prosecuting those responsible for committing crimes
a By 12/22, 100% of juveniles charged with criminal offenses and referred to probation will receive measurable risk-based pre-sentence assessments
a Annually, 90% of pre-sentence reports will be completed and provided to juvenile within 72 hours of sentence
a Annually, 80% of pre-sentence reports contribute to evidenced based sentencing recommendations - Municipal Judge
a Annually, 80% pre-sentence reports contribute to evidenced based sentencing recommendations - City prosecution team
By 6/2025 the One Small Step (OSS) Specialty Court Docket will be successfully implemented to improve outcomes for people experiencing homelessness
MILESTONES:
• By 6/2023 the specialty court docket will be in compliance with best practices for the homeless population
• By 12/2023 reduce recidivism among One Small Step defendants by 25%
• By 6/2025 60% of One Small Step defendants are enrolled in a treatment program
By 12/23, complete a review of the City Code and present revisions for the City Council's consideration that will improve the accountability of defendants
MILESTONES:
• By 6/23, complete revisions to Chapter 62 of the ACC to be more consistent with Colorado State criminal laws to facilitate prosecution of defendants in the Municipal Court and help hold defendants accountable for their conduct
• By 12/23, complete analysis of a Parent Accountability ordinance that would address juvenile violence in schools for the City Council's consideration
2023
Measures
% of juvenile tickets related to violence in schools
2024 Target
or Exceeds Target
Under Target
Not Meet Target
Intentionally left blank
A vibrant community is engaged in civic life, the arts, and the outdoors. It comprises individuals and groups who are dedicated to their community, get involved with neighborhood associations and participate with local government to ensure responsiveness to changing needs resulting in Arvada being the preferred place to live, work, play and stay.
To support vibrant communities and neighborhoods, The City of Arvada:
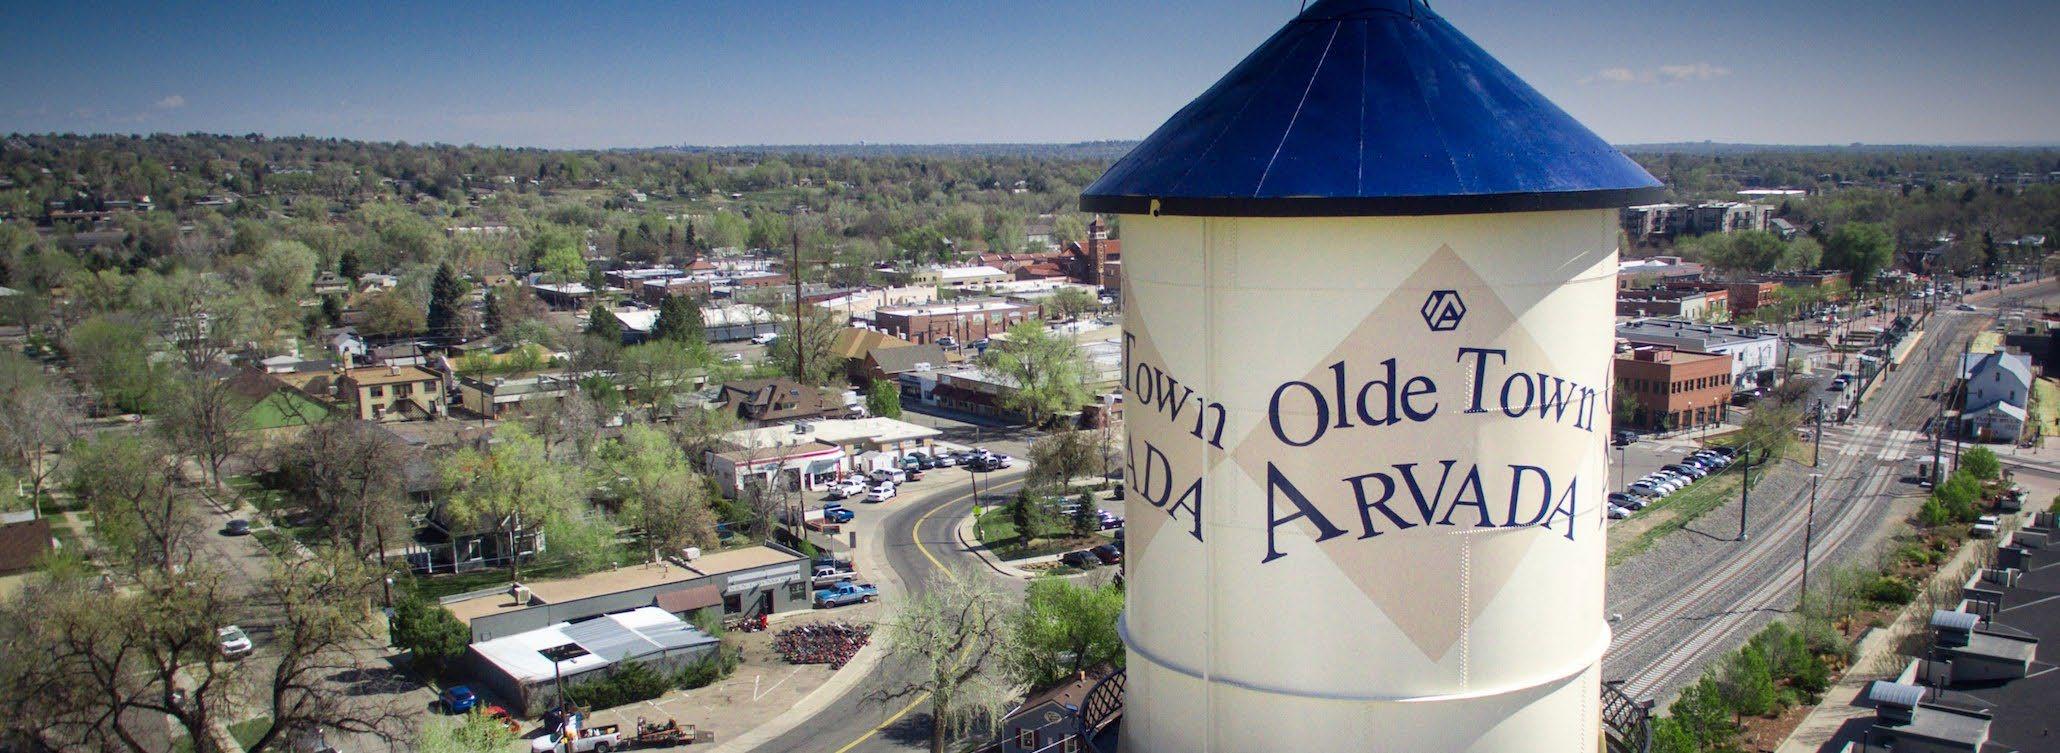
• Provides meaningful ways for the community to engage with local government and strategic partnerships to advance quality of life by embracing Arvada’s small town traditions and history to achieve an inclusive, equitable, diverse, prosperous, and resilient community that cares about its neighbors .
• Improves access to quality housing that is affordable to a broad range of income levels and provides resources, housing, and neighborhood assistance services to Arvada residents, businesses, property owners, and stakeholders
• Provides specialized programs and resource conservation services to the workforce, the community, and businesses so they can carefully use and preserve resources and save money .
• Provides maintenance services to the community and visitors, so they can play and enjoy activities in a safe, well-maintained parks, open space, and trails system Completing park projects and identifying trail gaps, creating a green spine trail system while enhancing the existing trail system, and acquiring lands for open space conservation to complete gaps in underserved areas or along potential open space corridors .
• Operates sustainable premier golf facilities focusing on exceptional service and value to the community with the conservation of natural environment under economically sound and socially responsible management
• Plans and hosts conferences and events, concessions, and centralized culinary services, focusing on exceptional service and value to businesses, groups, and individuals through an economically sound and socially-responsible management, ensuring customers can have an enjoyable, memorable, productive, and personalized event experience
the Arvada Housing Authority
Community Development programs
be moved to the Community and Economic Development
will include a majority of the intergovernmental grants. The remaining intergovernmental revenue is for Jefferson County Open Space funds
for services reflect the revenue
from golf and resturant operations at both Westwoods Golf Course and Lake Arbor Golf Course, banquet operations at the Golf Courses, education classes
Majestic View Nature Center
participation in Athletic Field
recovered
Recreation District
of
by the Parks Department, in 2022 the City
assumed all operations of
from the General Fund
of Parks
maintenance and field
in the Revenue
largest
Housing voucher program
Housing will be moving to the Community and
for the
in this line
expenditures
as reflected in the Other line
beverage and
to
to
this change
as will many miscellaneous
By 12/2025 complete current improvements to recognize Arvada’s history
MILESTONES:
By 12/2023 partner with AURA in the development of a plan for activation of the Flour Mill in Olde Town
By 12/2023 complete operational plan for display of the restored 04 Trolley
a By 12/2022 create a Housing Advisory Committee to support the City in current/ future initiatives while also educating the broader community on issues of affordable housing
COMPLETED MILESTONES:
By 12/2020 create a regional strategy to address homelessness a By 12/2020 complete an affordable housing assessment including incentive options and the area south of the Arvada Cemetery a By 6/2021 evaluate the Human Services Advisory Committee's process for recommending funding a By 12/2020 complete a list of current projects under development or planning
Measures
Number of households served by Essential Home Repairs Program
costs associated with Essential Home Repairs Program
of household served by Housing Choice Voucher Program
These performance measures support access to quality housing that is affordable to a broad range of income levels and provides resources, housing and neighborhood assistance services to Arvada residents, businesses, property owners, and stakeholders
By 12/2025 develop a maintenance and reinvestment plan to ensure a sustainable, resil ient and beautiful community of parks, trails, open space and medians in alignment with our diverse, changing and growing community
MILESTONES:
• By 8/2022 provide strategic recommendations for the Majestic View Nature Center and future city-wide interpretive programs
• By 12/2022 complete updates to the Lake Arbor Golf Master Plan
• By 12/2022 complete an inventory of all city medians with recommendations for improvement
• By 12/2023 complete Arts and Culture Master Plan workshop(s) to determine related actions to implement the plan
• By 12/2023 update the TLC program to include a communication plan and key lifecycle metrics
• By 12/2023 Complete Level of Service studies for Golf, Restaurants, Parks, Medians, Arts and Culture, Festivals, and Majestic View Nature Center
• By 12/2023 complete a Community Events Plan
• By 7/2024 replace Meyer's Pool with a new 50 meter natatorium
• By 12/2024 establish a centralized volunteer coordination program
• By 12/2024 adopt a strategic Land Pursuit and Acquisition Plan including opportunities for grants and funding partnerships
2016 2017 2018 2019 2020
Published Maintenance Standards Met for All Park Areas 95% 97% 99% 97% 94% 82%
% of Priority 1 Trails Cleared Once within 24 Hours of Snowfall 100% 100% 100% 100% 100% 100%
Open Space per Capita 31 .00 31 .21 30 .72 29 .33 29 .12 29 .12 Trails per Capita 1 30 1 34 1 25 1 30 1 29 1 29 Park Level of Service - Park within 10 minute walk of every residence 100% 91% 91% 84% 84% 84% Hours contributed by festivals commission 1,750 1,026 1,630 1,865 1,685 415
Nature Center: educators/aids with Ele mentary Exploration groups report students enjoyed learning about wildlife and nature 95% 96% 100% 100% 100% 0%
Nature Center: educator/aides surveyed answered excellent or above average when asked how the program ties to curriculum 90% 100% 96% 100% 91% 0% Golf course maintenance performance standards met 95% 51% 51% 51% 100% 100%
The City provides maintenance services to the community and visitors, so they can play and enjoy activities in a safe, well-maintained parks, open space, and trails system Completing parks projects and identifying trail gaps, creating a green spine trail system while enhancing the existing trail system, and acquiring lands for open space conservation to complete gaps in underserved areas or along potential open space corridors
By 12/2024 construct a regional Navigation Center to deliver coordinated homeless services located out of Olde Town
• By 7/2022 enter into an LOI with Jefferson County, Lakewood, Wheat Ridge, Golden, Edgewater, and Westminster to develop two navigation centers within Jefferson County
• By 9/2022 determine additional related actions to address homelessness in Olde Town
• By 10/2022 complete Low Income Housing Tax Credits (LIHTC) application and receive the 4% award from CHAFA
• By 12/2022 in collaboration with partner agencies, including RTD, ensure adequate transportation and accessibility to the Navigation Center for those experiencing homelessness
• By 10/2023 complete all closing actions and begin construction
• By 12/2024 complete construction of a Regional Navigation Center
Complete
The Capital Improvement Plan (CIP) for 2023 and 2024 represents the first two years of a ten-year plan that encompasses a strategic approach for the City’s capital investments for the next decade . This plan reflects a dual approach to utilizing scarce capital resources for capital improvement and major capital maintenance needs: Taking Lasting Care and the continued implementation of the Citizens Capital Improvement Planning Committee’s recommendations under the guidance of City Coun cil’s current Strategic Plan
First, the City is continuing its focus on “Taking Lasting Care” (TLC) of its vast inventory of assets Pre serving existing infrastructure is a chief priority of the capital plan Among TLC plans for the coming two years are:
• Allocation of resources for the replacement of aging traffic signals, guardrails, street medians and street infrastructure
• Reinvestment in the City’s park system with a focus on playground renovation, trail renovation, irrigation systems, and tree replacements
• Water system and sewer system repair and maintenance, including mains and ancillary infrastructure
Second, the City is focused on the long-term implementation of many of the recommendations of the 2015 Citizens Capital Improvement Planning Committee (CCIPC) . The 21-member CCIPC was charged by the Arvada City Council to prioritize capital projects and recommend funding strategies The Committee recommended 19 projects, of which 11 have been completed or have received signifi cant funding CCIPC-recommended projects in the upcoming two year plan include:
• Ongoing funding for installation of conduit and a backbone fiber network
Significant resources for missing sidewalks, transit-oriented development, bike and pedestrian access, and trails
budgeted capital expenditures by major category for 2023 and 2024 are listed below . The remainder of the capital improvement section explains what capital projects are, how the City pays for them, and how projects are identified and prioritized. This section also includes individual project pag es detailing each capital improvement within the 10-year plan
The Capital Improvement Plan (CIP) is a ten-year road map for creating, maintaining, and paying for Arvada’s present and future infrastructure needs The CIP outlines the project costs, funding sources, and estimated future operating costs associated with each capital improvement The plan is designed to ensure that capital improvements will be made when and where they are needed and that the City will have the funds to pay for and maintain them .
Capital improvement projects are non-routine capital expenditures that result in the acquisition of land, design and construction of new assets, or the renovation, rehabilitation, or expansion of existing capital assets. Capital projects usually have an expected useful life of at least five years.
Capital improvements make up the physical infrastructure that all cities must have in place to provide essential services to current residents and support new growth and development . They are also designed to prevent the deterioration of the City’s existing infrastructure, such as roads, parks, buildings, and underground pipes for water and sewer systems, and to respond to and anticipate future growth of the City .
Ongoing capital projects receive consistent funding for recurring capital infrastructure needs throughout the City and ensure that General CIP dollars are available for improvements in particular areas Their creation grew out of the recognition that, while some recurring needs are relatively small in scope, it was still imperative that resources be reserved to fund necessary work Routine capital expenditures generally will have no significant impact on the operating budget.
One-time capital projects generally receive funding for the construction of a public facility or acquisition of land for a future public facility These projects may have ongoing operating and maintenance costs, which have been included in the operating budget
Capital maintenance expenditures
recurring capital expenditures intended specifically to sustain existing infrastructure and capital capacity, such as with water and sewer main replacements .
the City’s
Funding – Since the electors of Arvada adopted a sales tax in 1969, the City Code has re quired that 60% of the first cent of sales tax revenue must be appropriated annually for capital projects or debt service. Codified as §98-101 in the Arvada Code of Ordinances, this funding is referred to as 98-101 funding The funding for 2023 and 2024
Water Fund – The Water Fund accounts for capital outlay and related debt service relating to the water utility operation Typically, water rates pay for ongoing maintenance and replacement costs while water system development fees cover projects related to growth and expansion .
Wastewater Fund – The Wastewater Fund accounts for capital outlay and related debt service relating to the collection, transmission, and disposal of sewage and wastewater Typically, wastewater rates pay for ongoing maintenance and replacement costs while wastewater system development fees cover projects related to growth and expansion .
Stormwater Fund – The Stormwater utility fee pays for capital improvements and debt service necessary to maintaining a stormwater management plan Using the Stormwater Fund to pay for joint capital projects with the Mile High Flood District (MHFD) also qualifies the City for MHFD funding to operate and maintain stormwater improvements within the District
Golf Fund – Revenue from the Golf Fund is expected to meet all of the identified capital needs and debt service for the Golf programs at Lake Arbor and West Woods Golf Courses .
Bond Proceeds – Proceeds from the sale of bonds fund specific capital improvement projects. A bond is a written promise to pay a designated sum of money at a specific date in the future, together with pe riodic interest at a specified rate, used as a long term financing tool. Bonds are used to fund the 72nd underpass project and the Ralston Road project included in the Continuing Projects list . This ten year capital improvement plan includes bond proceeds in the Water and Wastewater Funds which will be used for infrastructure projects in these funds and are identified in the 2023 and 2024 capital expendi ture table and individual project sheets
Grant Funding – Funding received from an outside agency for a specific capital improvement project. Grant funding does not need to be repaid, but it may require the City to match a certain percentage of the award
Developer Funding – Contributions that developers make to the City in support of public improve ments, such as traffic signals, roadway improvements, or park development, often to help respond to population growth .
Streets Fund – The Streets Fund accounts for costs relating to the asphalt and concrete replacement programs Revenues are derived from the City’s General Fund, the Highway Users Tax Fund, 50/50 sidewalk payments, and street degradation fees .
Other Funding Sources – Other funding sources included in the current CIP include:
• Conservation Trust – Profits from the sale of state lottery products are distributed to local governments by the Colorado Department of Local Affairs for park and recreation services
• Adams County Transportation Sales Tax – Each year the City receives funds through a trans portation sales tax from Adams County that can only be used in Adams County for transpor tation purposes
• Adams County Open Space Sales Tax – Each year the City receives funds through an open space sales tax from Adams County that can only be used in Adams County for open space purposes
• Lands Dedicated Opt-Out Fee – A fee in lieu of dedicating land to the City during develop ment; used for park development
• 3-Cent per Thousand Gallon Fee – This fee, which is based on annual water consumption, funds irrigation system upgrades
• Park Water Tap Fees – As part of new construction, park tap fees are collected to fund new park construction
Operating Impact – Each year, as capital projects are planned and others are completed, the costs re lated to maintaining those capital assets are examined Many times those costs can be absorbed in the City’s operations. Other times, additional staff and supplies are needed to maintain these projects. The operating impact of the 2023 and 2024 CIP is detailed later in this section and the operating impact of each project is included within the individual project pages .

In many respects, the planning process for selecting, scheduling, and financing capital improvements parallels the way someone might plan to buy a house or a car . The process involves assessing many competing needs, determining priorities, evaluating costs and financing options, and establishing a realistic timeline for completing the projects
The following graphic outlines the City of Arvada’s ten-year Capital Improvement Plan process:
• Council reviews progress of past successes in first quarter of year.
• Re-establishes priorities in context of new information, studies, surveys.
Development of Strategic Plan
Build and Measure
• Departments begin various legal processes to begin the construction processes.
• Quarterly reporting on all progress.
Develop ten-year capital maintenance and new projects to meet long-term strategic needs
Council adopts both the two-year appropriations and the ten-year plans
• Analyze prior year expenditures.
• Identify all possible sources of resources.
• Develop prioritization methodology to meet Strategic Plan.
• Analyze and select proposed projects for plan and for the ten-year planning horizon.
• Council reviews Proposed Plan.
• Adopts two-year appropriations.
• Prioritizes unfunded priorities and projects.
• Adds operating costs into the operating budget.
The prioritization of projects is done as part of the biennial budget process, with a preference towards funding projects that are mandated, remove a risk, and/or align with Council’s Strategic Plan . Mandates can include orders from the federal or state government that require action of the City, court orders, action required by health and life safety codes, and regulations regarding ADA accessibility .
The criteria used for each priority is as follows:
• Eliminates a hazard
• Satisfies an obligation, such as federal and state mandates, City Council Strategic Plan priorities, developer agreements, and legal contracts
• Funded entirely by sources other than CIP dollars – for example, Open Space funds, developer contributions, CDBG funds, the Regional Transportation District funds, etc .
• Eliminates a hazard
• Satisfies an obligation, such as federal and state mandates, City Council Strategic Plan priorities, developer agreements, and legal contracts
• Receives funding from other sources as well as CIP dollars
• May eliminate a hazard
• Does not satisfy an obligation
• Does not have funding available other than CIP dollars
The City’s Performance-based Budgeting program, FOCUS, acts as the foundation of Arvada’s budget process . In 2019, City Council adopted a new Strategic Plan to lay the foundation for meeting current and future community needs The following strategic results and milestones have provided guidance in determining funding priorities for the 2023-2032 capital improvement plan:
a By 2021 Arvada will have a traffic accident rate lower than the national average
• Through 2025 prepare an annual street maintenance report for City Council and the community a By 2021 complete the Sewer Master Plans
• By 2023 complete the Stormwater Master Plan a By 2021 complete the Water Master Plan
• By 2023 actions including conceptual project and operational changes to utilities programs necessary to implement the Master Plans are included in the 10-year CIP and performance budget
a By 2021 all new development in the City complies with ADA requirements and 2021 updated engineering standards
• By 2024 develop a financial plan for improvements to existing City facilities and/or purchase of additional properties
• Through 2025 continue progress on having 100% of water needed for build out based upon the water supply master plan and current schedule for completion of Gross Reservoir by 2028
• Through 2025, maintain funds to meet water supply financial commitments
• By 2022, complete strategic investments and initiatives to ensure parks, trails, open space, and amenities are in alignment with our diverse, changing, and growing community
The current Capital Improvement plan is also driven by the recommendations of the 2015 Citizens Capital Improvement Planning Committee (CCIPC) . The Committee was charged by the Arvada City Council with prioritizing capital projects and recommending funding strategies . To do this, the Com mittee learned about the projects, developed and applied evaluation criteria, and then deliberated on which projects to recommend to Council for funding and at what level The CCIPC recommended $73 million dollars of funding for nineteen different projects.
Below is a table identifying the CCIPC-recommended projects that have previously received funding or
W 72nd Ave & Indiana St Intersection
$11,109,523 $- $- Complete
Park Maintenance, Fleet, and Central Stores Bldg 10,218,612 - - Complete
W 72nd Ave
ATMS,
Underway
- Underway
59,703 61,494 Ongoing
700,000 700,000 Ongoing
2,336,136 245,975 253,354 Ongoing
59,851 60,747 Ongoing
2,758,820 494,577 500,408 Ongoing
1,490,321 171,054 676,185 Ongoing
$121,776,710 $28,731,160 $16,252,188
are receiving funding as part of the 2023 - 2024 budget
the seven years since the Committee released its report, the City has dedicated nearly $122 million to CCIPC-recommended projects, several million more than the level of funding recommended in the report . The ten-year capital improvement plan includes a substantial dedication of resources for CCIPC-recommended projects
Included in the CCIPC projects that received funding in recent years are two bond-funded projects As the previous sales and use tax bonds retired in 2018, a ballot question for reissuance of the bonds was voted on and approved in November 2018 . This approval allowed for the reissuance of bonds for two major road capacity projects: a grade separation on W. 72nd Avenue at the Union Pacific Railroad with improvements between Simms Street and Kipling Street, and the reconstruction and improvement of much of Ralston Road along the W 58th Avenue
In addition to the project recommendations made by the CCIPC, the group particularly examined the maintenance needs of the City’s street system . While street maintenance is capital in nature, the City’s program for maintenance is funded through operating dollars within the Streets Fund . The committee recommended that the City quickly take action “to address the pressing need for additional resources to repair and maintain roads and streets in Arvada ” Although a proposed sales and use tax increase to fund additional street maintenance was rejected by voters in 2016, the City increased its annual funding for street maintenance by redirecting other operating expenditures . Over the ten years of the plan, more than $138 million is dedicated to street maintenance in order to achieve that goal
As
Trolley
City
Public
PEG
Trolley
PEG
Arvada
PEG
Meyers
Ralston
Alkire
currently open
Capital Improvement
Completion
2022/20223
2023
Ongoing
72nd & Indiana Final Imprv
Leyden Road Study
Ward Road TOD
Alkire St Bridge @HL Canal
Grandview Guardrails
72nd Avenue - Sunrise Village
Bridge and Structures
Ramp Program
64th & Sheridan Int (FASTER)
W 55th Ave Median
Pierce Sidewalk (SRTS Grant)
72nd Ave Underpass (Bond)
Ralston Yukon-Garrison (Bond)
Long Lf Pavement Markings
Detection Program
Replacements - MUTCD
Tennyson Corridor (ADCO Grant)
Olde Town Street Ltg Phase II
Candelas Lighting
Xcel Undergrounding
Design
ROW
Misc Signal
Signal
2022
2022
.00 2022
.60 2022
Ongoing
TBD
.78 Ongoing
.00 Ongoing
TBD
.42 TBD
.00 TBD
Spring 2024
Summer 2023
.42 Ongoing
.31 Ongoing
Ongoing
34 2023
.92 TBD
.28 2022
Ongoing
.31 2022
.75 2022
Ongoing
Transportation Master Plan
Corridor
Safety
Marshall St Intersection
Street
Place &
W 59th Pl and Kipling Pkwy
86th Parkway
Pkwy &
Ralston & Rensselaer
58th Pl/Indep
& McIntyre
Standley Lake Lib
Renovation
Gold Strike Pk .
Systems
Tree Replacement Program
Park Lighting (CDBG)
Rec Center
Trail Crossings
Playground Renovation
Sabell Park (Dev .
Leyden Creek Trail
Arbor Rec Playground
Sabell Pk-Controller/Meter/Tap
Lakecrest Park
Front Range
Marge Roberts Park
.28
Public Safety
Lake Arbor
.00
.35
.84
.92
2023
2023
Ongoing
Ongoing
.00 TBD
.50 TBD
.88 Ongoing
.17 2022
TBD
.18
TBD
2021 Water
WTP
Hwy
Raw Water
RWTP
RWTP
RWTP
AWTP
RWTP
Canyon Pines Pump
Pumped Zones
Zones Pump
Hydraulic
Wastewater
Ralston Trunk Sewer
Oversizing
North Trunk Sewer
Alkire
Trunk
Youngfield
Hyatt
Ralston
Lake
Arvada
Ralston
Name
2023
Sources Existing 2023 2024 2025 2026 2027
§98-101 $ $14,530,362 $13,075,122 $12,982,793 $15,646,121 $16,037,274 $16,518,392
Other City $ 78,523,413 66,323,440 36,397,894 30,966,127 46,129,043 36,947,930 External $ 49,215,273 34,786,344 27,582,132 33,963,572 22,615,160 19,346,898
Total Sources $142,269,048 $114,184,906 $76,962,818 $80,575,820 $84,781,477 $72,813,220
Total Uses Existing 2023 2024 2025 2026 2027
Debt Service $- $7,337,465 $7,330,125 $6,985,265 $6,888,376 $6,892,083
Personnel - 123,446 130,850 137,308 144,086 150,563
General Administration 2,493,828 12,163,661 24,518,100 878,875 895,117 887,858
Transportation 333,141 10,999,932 4,876,841 3,911,597 3,962,045 4,109,352
Street Maintenance - 12,763,701 12,969,576 13,404,864 13,757,951 14,114,572
Parks and Golf 3,778,421 1,041,274 1,481,106 1,464,131 1,719,156 1,874,218
Water 19,418,459 65,219,270 46,849,835 30,735,741 42,805,683 66,365,498
Wastewater - 5,660,954 25,370,105 29,681,809 2,642,988 1,667,532
Stormwater 1,470,421 1,043,222 1,074,375 1,106,606 1,726,503 846,908
Total Uses $27,494,270 $116,352,925 $124,600,913 $88,306,196 $74,541,906 $96,908,583
Sources 2028
2031 2032 2023-2032
Total
§98-101 $ $16,931,352 $17,269,979 $17,442,678 $17,878,746 $18,415,108 $176,727,927
Other City $ 37,763,602 28,674,355 28,696,360 28,308,618 29,141,388 447,872,172 External $ 18,348,788 5,150,833 27,553,038 264,707 269,048 239,095,793
Total Sources $73,043,742 $51,095,167 $73,692,076 $46,452,071 $47,825,544 $863,695,892
Total Uses 2028
Service $6,896,306
Street
2032 2023-2032
Total
$69,919,121
174,162 177,638 1,529,738
952,584 917,183 46,551,535
5,330,886 5,486,311 5,646,401 54,017,905
141,710,391
1,865,568 20,435,896
398,496,910
1,345,713 72,446,619
- 9,952,295
The following table details the City’s 2023 capital expenditures by project . Capital expenditures are presented in major categories with the sources of funding shown for each project
Project 98-101 $ Other City $ External $ 2023 Total
Estimated Debt Service $7,337,465 $- $- $7,337,465
Salaries and Benefits 123,446 - - 123,446
Aquatics Center 356,172 - - 356,172
Arvada Fiber Optic Network 245,975 - - 245,975
Public Art 106,121 - - 106,121
ADA Compliance - Facilities 200,000 - - 200,000
Median Rennovations 200,000 - - 200,000
PEG Cable Fees - - 106,604 106,604
Public Safety Evidence Storage Building - 6,000,000 - 6,000,000
Adams County Transportation Projects - - 80,635 80,635
Bike Master Plan Implementation 50,000 - - 50,000
Bridge Repair 250,000 - - 250,000
Collector Street Improvements 67,196 - - 67,196
Guardrails 59,851 - - 59,851
Intersection Safety Improvements 100,794 - - 100,794
School Safety 26,878 - - 26,878
Sidewalks/TOD/Bike & Trail Gaps 700,000 - - 700,000
Traffic Signals 1,166,805 - - 1,166,805
Xcel Energy Undergrounding Fund Supplement 59,703 - - 59,703
Indiana Corridor Improvement Study * - - 1,096,000 1,096,000
Signal Interconnect 250,000 - - 250,000
Signal Timing Implementation 203,204 - - 203,204
Transportation Master Plan Implementation * 300,000 - - 300,000
Asphalt and Concrete Replacement - 11,954,121 120,000 12,074,121
ADA Compliance - Streets 689,580 - - 689,580
Parks
Adams County Open Space Projects - - 33,598 33,598
Irrigation Systems - 171,054 - 171,054
Park Water Tap Fees - 174,690 - 174,690
Playground Renovation 494,577 - - 494,577
Trail Renovation 67,196 - - 67,196
Tree Replacement Program 20,159 - - 20,159
Project 98-101 $ Other City $ External $ 2023 Total Water
Denver Water Moffat Project Participation * - 28,734,000 - 28,734,000
Leyden Rock / Candelas Gore Street Alignment Interconnection * - 618,000 - 618,000
NW Improvements - Leyden Rock - Upsize Quaker Alignment
Pipeline * - 650,000 - 650,000
Water Distribution System Upgrades - 541,216 - 541,216
Water System Replacement (Operations) - 8,127,684 - 8,127,684
Water Treatment Plant Expansion * - - 1,000,000 1,000,000
Canyon Pines Pump Station * - - 4,713,007 4,713,007 Distribution System Storage/Pumping/Pipe Expansion (additional water system upgrades) - - 6,000,000 6,000,000
Hydraulic Modeling - 50,000 - 50,000
Lead and Copper Corrosion Control and Service Line Replacement * - 230,000 - 230,000
Pumped Zones Pump Station * - - 6,000,000 6,000,000 Pumped Zones Storage Tank * - - 6,000,000 6,000,000 Smart Meter Upgrades * - - 4,100,000 4,100,000
Water Resources Master Plan * - 250,000 - 250,000 Water Treatment Plant Repair Program - 500,000 - 500,000
Infiltration Elimination Program - 450,204 - 450,204
North Sewer Trunk Line 61st and Tennyson * - 5,250,000 - 5,250,000
North Trunk Sewer Line 81st and Kipling * - 829,250 - 829,250 Sewer System Replacement (Operations) - 750,000 - 750,000
Alkire Lift Station * - - 1,936,500 1,936,500
North Trunk Sewer Improvements - W 81st & Teller to W 72nd & Sheridan * - - 950,000 950,000
North Trunk Sewer Improvements - W . 81st from Oak to Johnson * - - 1,950,000 1,950,000
Ralston Trunk Sewer Improvements - Simms to Pierson * - - 400,000 400,000 Ralston Trunk Sewer Improvements - W 69th from Coors to Urban * - - 300,000 300,000
Mile High Flood District Joint Maintenance Projects - 28,138 - 28,138
Mile High Flood District Joint Master Plan Studies - 59,703 - 59,703
Ralston Creek Improvements - Vance Street to Wadsworth By-Pass * - 477,621 - 477,621
Stormwater Master Plan Projects - 477,761 - 477,761 Grand Total $13,075,12 $66,323,440 $34,786,344 $114,184,906
The following table details the City’s 2024 capital expenditures by project . Capital expenditures are presented in major categories with the sources of funding shown for each project .
Project 98-101 $ Other City $ External $ 2024 Total
Estimated Debt Service $7,330,125 $- $- $7,330,125
Salaries and Benefits 130,850 - - 130,850
Arvada Fiber Optic Network 253,354 - - 253,354
Public Art 107,182 - - 107,182
ADA Compliance - Facilities 200,000 - - 200,000
Median Rennovations 206,000 - - 206,000
PEG Cable Fees - - 104,472 104,472
Adams County Transportation Projects - - 83,054 83,054
Bridge Repair 250,000 - - 250,000
Collector Street Improvements 69,212 - - 69,212
Guardrails 60,747 - - 60,747
Intersection Safety Improvements 103,818 - - 103,818
School Safety 27,685 - - 27,685
Sidewalks/TOD/Bike & Trail Gaps 700,000 - - 700,000
Traffic Signals 1,201,810 - - 1,201,810
Xcel Energy Undergrounding Fund Supplement 61,494 - - 61,494
Signal Interconnect 250,000 - - 250,000
Signal Timing Implementation 154,800 - - 154,800 Transportation Master Plan Implementation 300,000 - - 300,000
Asphalt and Concrete Replacement - 12,364,244 120,000 12,484,244
ADA Compliance - Streets 485,332 - - 485,332
Adams County Open Space Projects - - 34,606 34,606
Irrigation Systems 500,000 176,185 - 676,185
Park Water Tap Fees - 179,931 - 179,931
Playground Renovation 500,408 - - 500,408
Trail Renovation 69,212 - - 69,212
Tree Replacement Program 20,764 - - 20,764
capital
Project 98-101 $ Other City $ External $ 2024 Total
Denver Water Moffat Project Participation * - 8,616,000 - 8,616,000
Raw Water Meter Project * - - 500,000 500,000
Water Distribution System Upgrades - 552,040 - 552,040
Water System Replacement (Operations) - 8,371,514 - 8,371,514
Water Treatment Plant Expansion * - - 2,000,000 2,000,000
Arvada Water Treatment Plant Clarifier Rehab * - 1,720,000 - 1,720,000
Distribution System Master Plan Update - 250,000 - 250,000
Distribution System Storage/Pumping/Pipe Expansion (additional water system upgrades) - - 6,000,000 6,000,000
Hydraulic Modeling - 50,000 - 50,000
Lead and Copper Corrosion Control and Service Line Replacement * - 1,300,000 - 1,300,000
Risk and Resiliency Assessment / Emergency Response Plan Updates - 100,000 - 100,000
Smart Meter Upgrades * - - 2,900,000 2,900,000
Water Treatment Plant Repair Program - 500,000 - 500,000
Infiltration Elimination Program - 231,855 - 231,855
North Trunk Sewer Line 81st and Kipling * - 139,250 - 139,250 Sewer System Replacement (Operations) - 772,500 - 772,500
Alkire Force Mains * - - 1,890,000 1,890,000
North Trunk Sewer Improvements - 68th & Sheridan to Tennyson & W . 64th * - - 550,000 550,000
North Trunk Sewer Improvements - W 81st & Teller to W 72nd & Sheridan * - - 3,525,000 3,525,000
North Trunk Sewer Improvements - W 81st from Oak to Johnson * - - 2,875,000 2,875,000
North Trunk Sewer Improvements - W 84th from Alkire to Simms * - - 400,000 400,000
Ralston Trunk Sewer Improvements - Simms to Pierson * - - 2,750,000 2,750,000 Ralston Trunk Sewer Improvements - Union from W . 75th to W . 71st * - - 500,000 500,000
Ralston Trunk Sewer Improvements - W 69th from Coors to Urban * - - 3,350,000 3,350,000
Lower Ralston Creek Stabilization * - 500,000 - 500,000
Mile High Flood District Joint Maintenance Projects - 28,982 - 28,982
Mile High Flood District Joint Master Plan Studies - 61,494 - 61,494
Ralston Creek Improvements - Vance Street to Wadsworth By-Pass * - 368,962 - 368,962
Stormwater Master Plan Projects - 114,937 - 114,937 Grand Total $12,982,793 $36,397,894 $27,582,132 $76,962,818 * Denotes nonrecurring capital expenditures
The City’s operating budget is directly affected by the CIP. When certain types of capital projects are developed and completed, they also have ongoing financial impacts. For example, if the City were to construct a new building, the operating budget would increase to include capacity for any new equipment, utilities, and supplies needed to operate and maintain the facility. Park maintenance staff might be added when a new park is completed Likewise, operating costs can decrease with certain capital improvement For example, repair and maintenance costs could go down with the replacement of an aging traffic signal.
In the 2023-2032 Capital Improvement Program, each individual project includes an estimated future operating budget impact, if it is possible to identify the cost at this time in the project’s lifecycle The City carefully considers these operating costs when deciding which projects to move forward in the CIP.
The following table summarizes the quantifiable projected annual impact of the FY 2023-2024 CIP on the City’s operating budget:
Arvada Fiber Optic Network
Canyon Pines Pump Station
Raw Water Meter Project
Totals
Operational cost to maintain OSP Insight software, used to document the fiber cable and fiber strand allocation
$10,000 $-
Annual operating cost 10,000 -
Annual operating cost 5,000 -
$25,000 $-
The planned capital expenditures from 2025 to 2032 are shown in the chart below . Some of the larger projects that make up these expenditures include:
Arvada Fiber Optic Network - $2,187,290
ADA Compliance for Facilities - $1,618,180
Public Art - $911,988
Traffic Signals - $12,661,191
Sidewalks/TOD/Bike & Trail Gaps - $5,728,539
Arterial Improvements - $7,249,289
Bridge Repair - $2,022,725
Signal Interconnect - $2,022,725
Signal Timing Implementation - $1,001,920
Playground Renovations - $7,686,434
Irrigations System Renovations - $3,659,605
Trail Renovation - $633,915
Median Renovations - $1,886,776
Denver Water Moffat Project - $23,465,537
Water System Replacement - $76,675,584
Highway 93 Lakes Water Storage Project - $20,500,000
Water Treatment Plant Expansion - $48,000,000
Ralston Plant Storage Tank Expansion - $32,000,000
Water Treatment Plant Repair Program - $4,000,000
Water Treatment Plant Roof Replacement - $2,000,000 Smart Meter Upgrades - $2,900,000
Sewer System Replacement - $7,075,410
Infiltration Elimination Program - $2,305,672
Oversizing of Replacement Pipelines - $2,654,479 North Trunk Line Replacement - $17,570,000 Ralston Trunk Line Replacement - $9,800,000
Lower Ralston Creek Stabilization - $1,000,000
Ralston Creek Improvements - $501,494
Bates Lake Watershed Improvements - $705,741
Stormwater Master Plan Projects - $3,137,720
Each project included in the 2023-2032 Capital Improvement Plan is presented on a separate sheet within the following program areas: General Administration, Transportation, Street Maintenance, Parks and Golf, Water, Wastewater, and Stormwater . Each project sheet contains a description, picture, project justification, strategic plan alignment, project funding source details, anticipated uses of funds, expected timeline, and operating impact
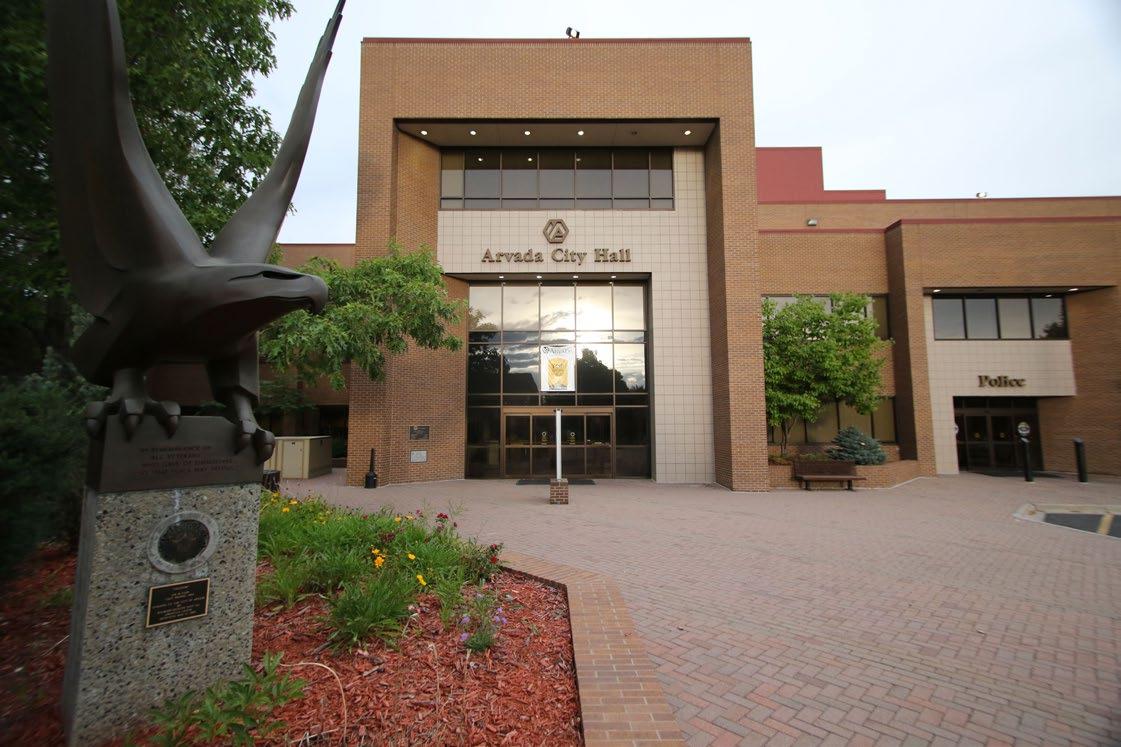
$4,347,008 $9,776,073
6,750,000
283,341 37,058,991
$4,630,349 $53,585,064
the Americans with Disabilities Act (ADA) requires that when viewed in their entirety, City services, programs, and activities are accessible to and usable by people with disabilities.
funding
be used to complete high priority projects identified by
plan as barriers to program accessibility in City facilities.
of City facilities and programs to individuals with disabilities. In addition, the project
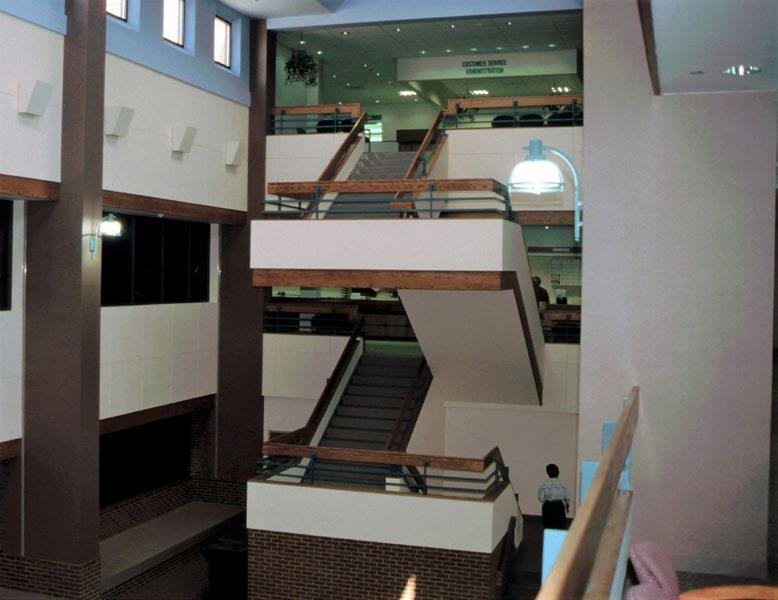
ADA Transition Plan completed in
meet
risk of DOJ assessment of the City’s ADA program and subsequent
Strategic Priority: Infrastructure
community depends on a well-maintained foundation of streets, sidewalks, and water, wastewater and stormwater facilities.
and steady population growth requires proper maintenance of existing
additional capacity to support a thriving community.
City’s risk of a
assessment.
project
Strategic Principle:
services focused on safe and environmentally-efficient City facilities and fleet vehicles to ensure the most efficient and maximum usage of valued assets.
compliance
federal requirement.
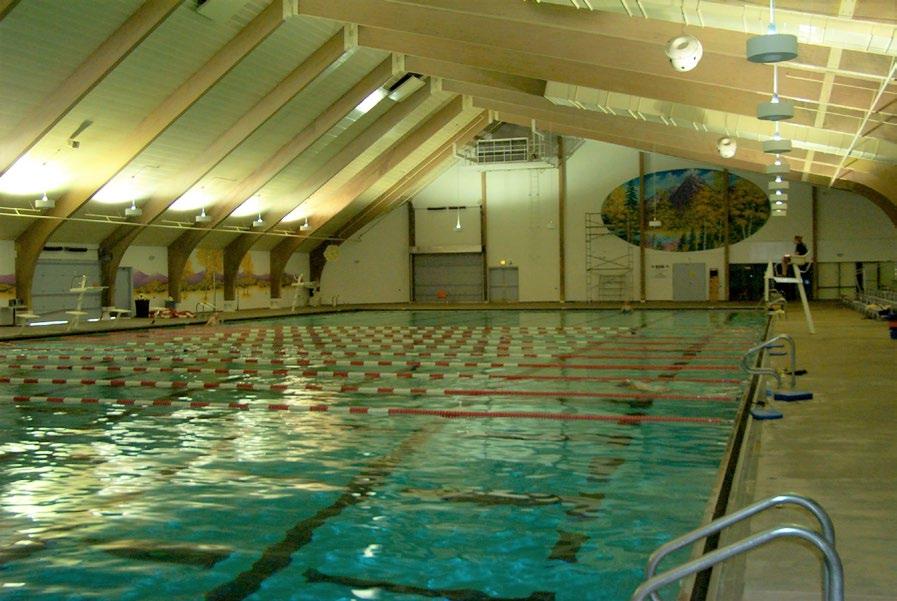
vibrant community is engaged in civic life, the arts, and the outdoors. It comprises individuals and groups who are dedicated to their community, get involved with neighborhood associations, and participate with local government to ensure responsiveness to changing needs, resulting in Arvada being the preferred place to live, work, play, and stay.
capital maintenance
Agreement
Strategic Principle:
meaningful ways for the community to engage with local government and strategic partnerships to advance quality of life by embracing both Arvada’s small town traditions and history and changing to achieve an inclusive, equitable, diverse, prosperous, and resilient community that cares about its neighbors
District. The funding identified below reflects the City’s share of
operating
not
the longevity of fiber optic cable,
Arvada Fiber Optic Network (AFON) is a backbone fiber network which will allow City facilities, Jefferson County Public Schools, and the Arvada Fire Protection District to have lateral network connections to Information Communication and Technology assets. AFON will not only provide a high-speed communication network linking current City assets distributed throughout the City but will position the City to undertake yet unforeseen technology improvements that will benefit the City and its citizens.
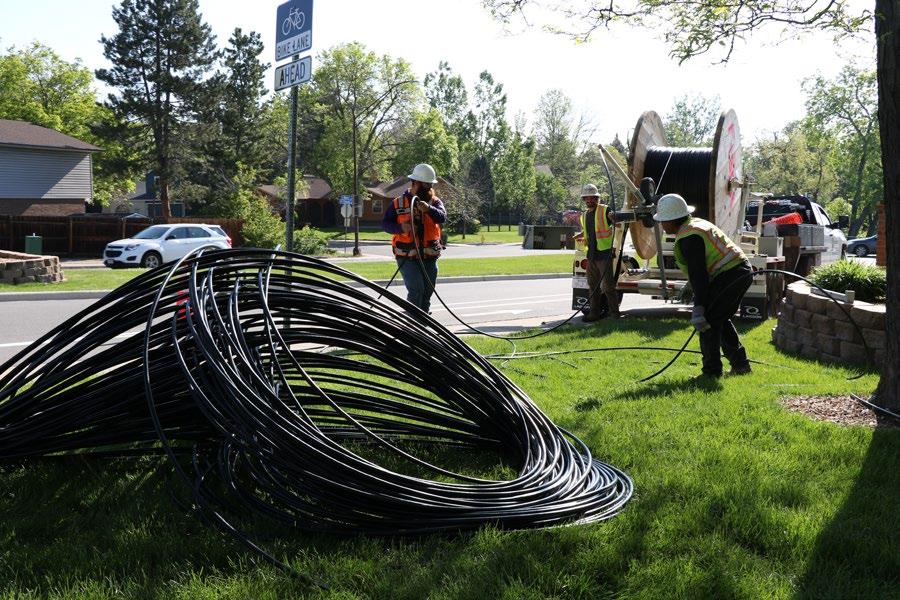
may arise over the next 30 years. Such initiatives may
and Smart City initiatives.
Strategic Priority: Infrastructure
community depends on a well-maintained foundation of streets, sidewalks, and water, wastewater and stormwater facilities. Planned and steady population growth requires proper maintenance of existing infrastructure and additional capacity to support a thriving community.
existing roads and transportation network in tandem with snow and ice control services to ensure swift and safe transportation modes for the community.
funding has come from Arvada Fire Protection District
Schools. Over $500,000 has been contributed as of 2019 from those two entities.
include grants related to public safety and traffic management.
January
generate other
of
next
to 5 years to complete. The changing needs of the City
cable.
Operational funding
be used for
is used to document the fiber cable and fiber strand allocation.
Strategic Priority: Vibrant Community and Neighborhoods
A vibrant community is engaged in civic life, the arts, and the outdoors. It comprises individuals and groups who are dedicated to their community, get involved with neighborhood associations, and participate with local government to ensure responsiveness to changing needs, resulting in Arvada being the preferred place to live, work, play, and stay.
This project is fully funded
Strategic Principle: Provides meaningful ways for the community to engage with local government and strategic partnerships to advance quality of life by embracing both Arvada’s small town traditions and history and changing to achieve an inclusive, equitable, diverse, prosperous, and resilient community that cares about its neighbors
Total
$2,292,776
$2,292,776
Total
There
ongoing
rights-of-way
from customers
cable providers Comcast and TDS
authorize
As part of these agreements, these cable
full amount of Public Education and Government
as authorized by the Federal Cable Act.
who subscribe to cable television through Comcast or TDS
view
community depends on a well-managed, fiscally-responsible and transparent City government to guide the organization in a manner that enhances quality of life. Performance-based management practices, sustainable levels of resource use, efficient application of technology, a highperforming workforce, and legal and ethical compliance will ensure the longterm credibility and effectiveness of the City government.
Education
Government
streamed
on computers or any mobile device. In addition to City Council meetings, Arvada’s Channel
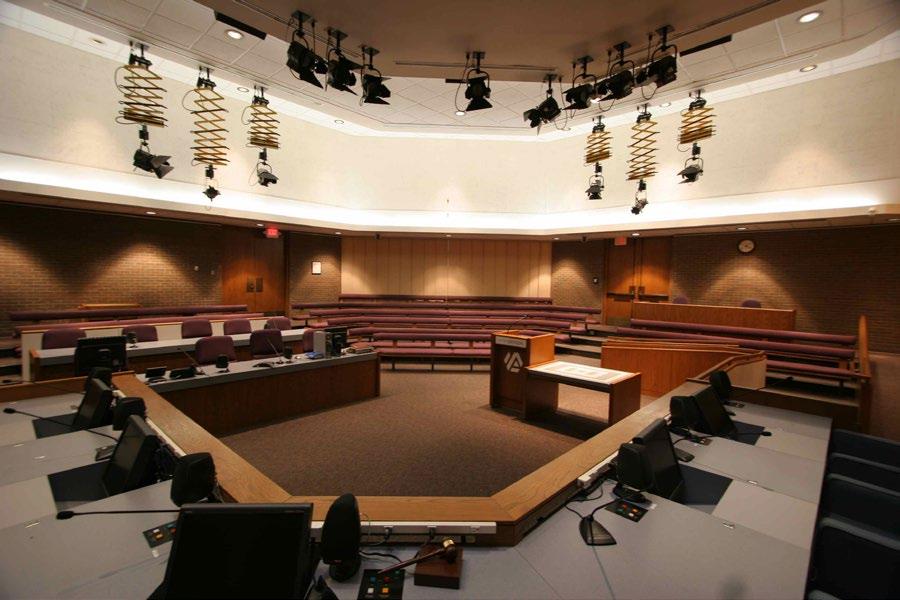
about City services and the community.
multiple information platforms and data to the community to support its ability to engage in community governance, exercise civic responsibility, and easily access and share public information.
Federal Cable Act. The project has a starting
In support of the City Art in Public Places Program, this project will fund the acquisition of public art for placement throughout the City. The funds are used within the guidelines set forth by the program and purchases are approved by City Council.
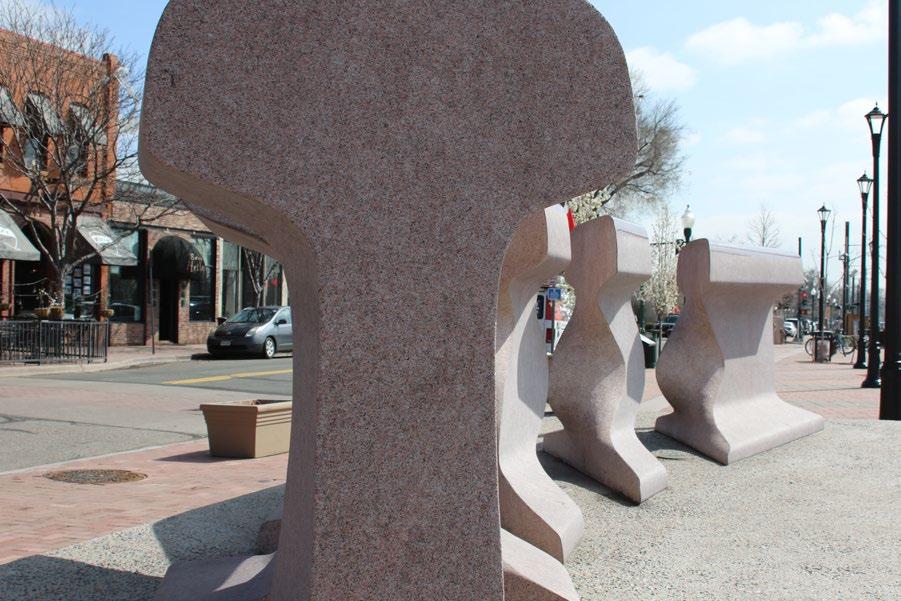
Established by City Council in 2009, program goals are to enhance and enrich the lives of Arvada’s residents, visitors, employees, and local businesses by incorporating works of art in public places, contribute to Arvada’s civic pride and sense of identity, increase access to works of art, and enhance Arvada’s reputation as a City which celebrates and supports the arts.
Strategic Priority: Vibrant Community and Neighborhoods
A vibrant community is engaged in civic life, the arts, and the outdoors. It comprises individuals and groups who are dedicated to their community, get involved with neighborhood associations, and participate with local government to ensure responsiveness to changing needs, resulting in Arvada being the preferred place to live, work, play, and stay.
project is fully funded.
Strategic Principle:
meaningful ways for the community to engage with local government and strategic partnerships to advance quality of life by embracing both Arvada’s small town traditions and history and changing to achieve an inclusive, equitable, diverse, prosperous, and resilient community that cares about its neighbors
project includes funding for capital maintenance
public
Creation of a permanent interpretive display of the restored historic streetcar in the pocket park at the corner of Grandview and Saulsbury, at the northeast corner of the Wadsworth bypass bridge. The display will include a covered structure to protect the trolley from rain and sun and it will be integrated into Olde Town as a public amenity with historical significance. Site improvements will include benches, interpretive signage, brick pavers around the installation, and additional landscaping improvements to create a destination setting and gathering place around the trolley.
The #.04 streetcar is significant to Arvada as it provided transit service to downtown Denver for decades along route 84. It is the last Denver tramway car in restorable condition and the last to run on the system before its closure in 1950. It is listed on the Colorado State Register of Historic Places. In consultation with History Colorado, which largely funded the Trolley restoration, the site was chosen due to its adjacency to the historic location of the No. 82 line and will be visible for all G Line passengers entering Olde Town.
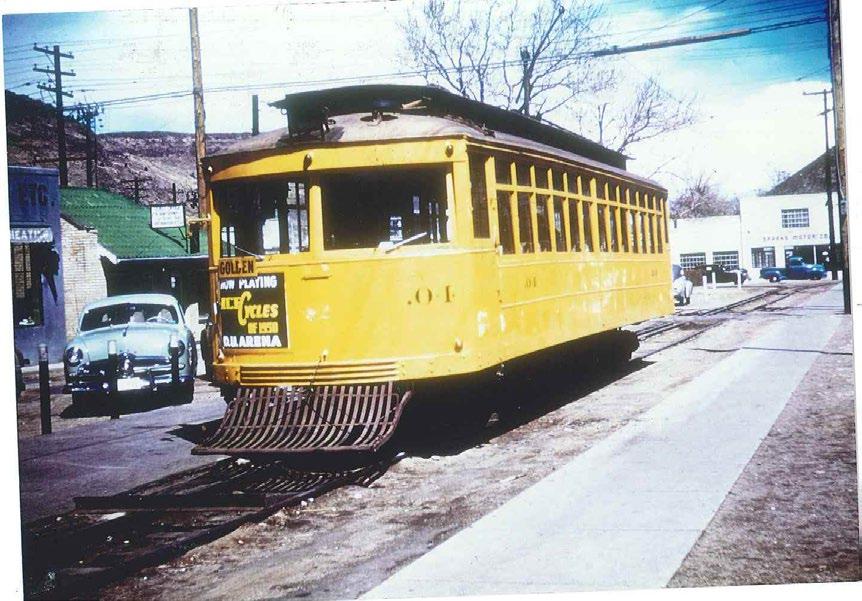
Strategic Priority: Vibrant Community and Neighborhoods
A vibrant community is engaged in civic life, the arts, and the outdoors. It comprises individuals and groups who are dedicated to their community, get involved with neighborhood associations, and participate with local government to ensure responsiveness to changing needs, resulting in Arvada being the preferred place to live, work, play, and stay.
Strategic Principle: Provides meaningful ways for the community to engage with local government and strategic partnerships to advance quality of life by embracing both Arvada’s small town traditions and history and changing to achieve an inclusive, equitable, diverse, prosperous, and resilient community that cares about its neighbors
project is primarily funded by $460,000 from the Arvada Urban Renewal Authority. Depending on final design, existing capital dollars may be reallocated to this project.
project is expected to be complete by winter
There will be ongoing maintenance costs for
absorbed by
Parks Maintenance budget.
Arvada, Jefferson County School and APEX Parks and Recreations District have entered into an Intergovernmental Agreement (IGA) to replace and operate a new facility for the George Meyers Pool. Arvada and Jefferson County Schools will fund the construction of new facility 50/50 and have jointing issued Certificates of Participation to fund the construction of the facility. Arvada will own the pool according to the IGA.
George Meyers
Strategic Priority: Vibrant Community and Neighborhoods
A vibrant community is engaged in civic life, the arts, and the outdoors. It comprises individuals and groups who are dedicated to their community, get involved with neighborhood associations, and participate with local government to ensure responsiveness to changing needs, resulting in Arvada being the preferred place to live, work, play, and stay.
Arvada and Jefferson County Schools
design
According
Strategic Principle: Provides meaningful ways for the community to engage with local government and strategic partnerships to advance quality of life by embracing both Arvada’s small town traditions and history and changing to achieve an inclusive, equitable, diverse, prosperous, and resilient community that cares about its neighbors
replacement of the George Meyers Pool.
operating cost
not yet known.
Public safety
larger facility
store police related evidence items
Public Safety’s current evidence storage facility is at capacity. Temporary storage solutions, using space at Indiana impound and purchasing connex units have helped but are not long term solutions. The need to obtain a new facility that will allow for current evidence storage levels and allow for growth projected as Arvada grows is critical. If not funded, evidence storage needs will continue and ability to properly store evidence will be compromised. Incorrect evidence storage will create negative impacts and a potential safety issue for citizens of Arvada.
Strategic Priority: Safe Community Community-based policing, connected neighbors, engaged local businesses, supportive community institutions, and a fair and impartial justice system, all working together, to ensure Arvada is a safe place to live, work, play, and stay. blah
Strategic Principle: Achieves and maintains the gold standard in public safety by meeting and exceeding standards set forth through the Commission of Accreditation for Law Enforcement Agencies (CALEA) to assist with the designation of one of the safest communities in Colorado.
for this project is from fund balance in the General Fund and Police Tax Increment Funds.
for this project
not been
Ongoing facilities maintenance and utilities expenses
being
some productivity and efficiency savings by re-purposing the current evidence storage area.
The parks system includes regional, community and neighborhood parks, as well as the trails that link neighborhoods to parks. This category includes the “Taking Lasting Care” component of the parks capital improvement program which includes major capital maintenance of existing parks or park infrastructure, including playground and trail renovation, tree replacement and irrigation systems. The plan also includes funding for a major renovation of Gold Strike Park, construction of the new Holistic Health and Fitness Park, and construction of two crossings of the Rocky Mountain Greenway Trail. Projects related to the City’s Golf enterprise also fall into this category.

Existing
$1,912,237
50,000
1,899,179
2028-2032
$1,447,266 $6,742,842 $14,140,986
389,137 2,127,963 4,013,564
37,815 206,785 2,284,340
$9,077,590 $20,438,890
19,908,614
$9,077,590 $20,438,890
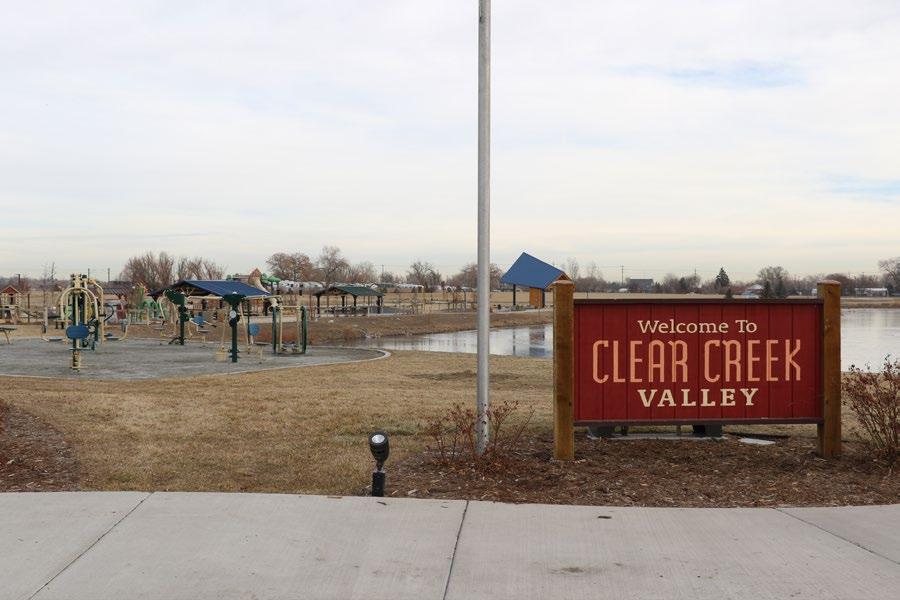
County
Strategic Priority: Vibrant Community and Neighborhoods
Strategic Principle:
vibrant community is engaged in civic life, the arts, and the outdoors. It comprises individuals and groups who are
to their community,
involved with neighborhood associations, and participate with local government to ensure responsiveness to
the preferred place to live, work, play, and stay.
from Adams County sales tax.
in Arvada
maintenance services to the community and visitors, so they can play and enjoy activities in a safe, well-maintained parks and trails system. Completing park projects, creating a green spine trail system while enhancing the existing trail system, and acquiring lands for open space conservation to complete gaps in underserved areas or along potential open space corridors.

A vibrant community is engaged in civic life, the arts, and the outdoors. It comprises individuals and groups who are dedicated to their community, get involved with neighborhood associations, and participate with local government to ensure responsiveness to changing needs, resulting in Arvada being the preferred place to live, work, play, and stay.
3-cent per thousand gallons of water
be
Strategic Principle:
maintenance services to the community and visitors, so they can play and enjoy activities in a safe, well-maintained parks and trails system. Completing park projects, creating a green spine trail system while enhancing the existing trail system, and acquiring lands for open space conservation to complete gaps in underserved areas or along potential open space corridors.
system
This varies annually based on consumption. Enterprise
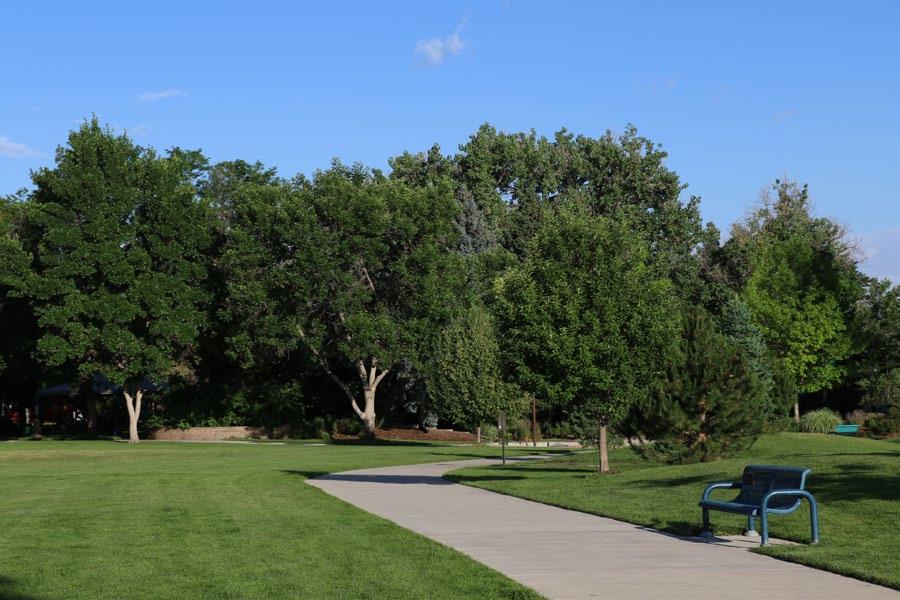
A vibrant community is engaged in civic life, the arts, and the outdoors. It comprises individuals and groups who are dedicated to their community, get involved with neighborhood associations, and participate with local government to ensure responsiveness to changing needs, resulting in Arvada being the preferred place to live, work, play, and stay.
through the water fund. The fee varies based on type of development.
Strategic Principle:
maintenance services to the community and visitors, so they can play and enjoy activities in a safe, well-maintained parks and trails system. Completing park projects, creating a green spine trail system while enhancing the existing trail system, and acquiring lands for open space conservation to complete gaps in underserved areas or along potential open space corridors.
Playgrounds receive intensive use at all parks
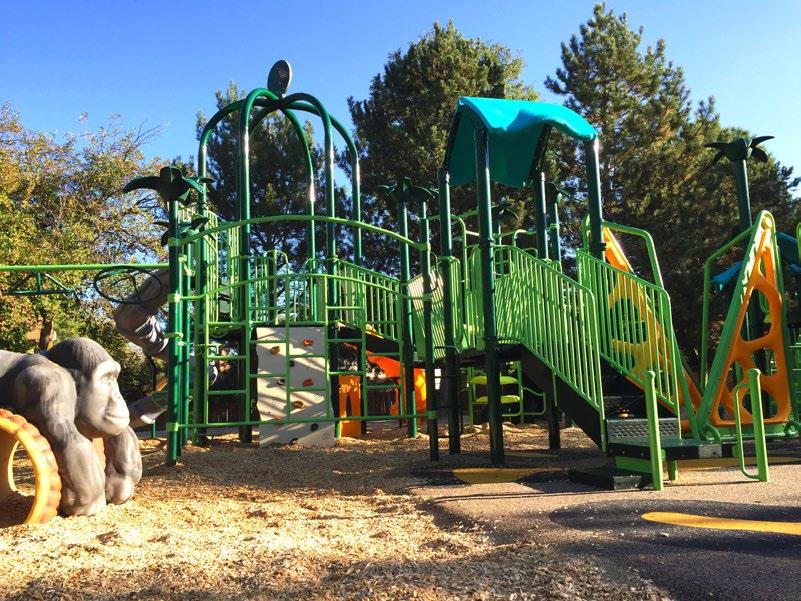
could
greatest potential risk for public use. Adding to use and risk issues, ongoing changes to ASTM Standards, CPSC Guidelines, and ADA access
manufacturers to update play equipment, making replacement of older equipment sometime impossible after 15 years.
A vibrant community is engaged in civic life, the arts, and the outdoors. It comprises individuals and groups who are dedicated to their community, get involved with neighborhood associations, and participate with local government to ensure responsiveness to changing needs, resulting in Arvada being the preferred place to live, work, play, and stay.
Strategic Principle:
maintenance services to the community and visitors, so they can play and enjoy activities in a safe, well-maintained parks and trails system. Completing park projects, creating a green spine trail system while enhancing the existing trail system, and acquiring lands for open space conservation to complete gaps in underserved areas or along potential open space corridors.
fees collected from developers located near the playground. As part of an IGA with the City, APEX
renovation can be supplemented by Park Development
be
Lake Arbor
Center playground.
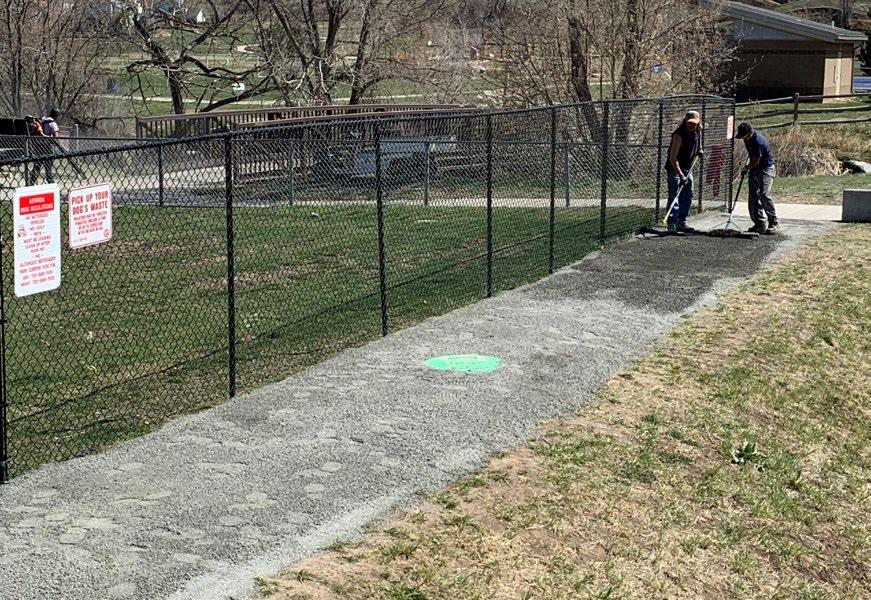
vibrant community is engaged in civic life, the arts, and the outdoors. It comprises individuals and groups who are dedicated to their community, get involved with neighborhood associations, and participate with local government to ensure responsiveness to changing needs, resulting in Arvada being the preferred place to live, work, play, and stay.
Strategic Principle:
maintenance services to the community and visitors, so they can play and enjoy activities in a safe, well-maintained parks and trails system. Completing park projects, creating a green spine trail system while enhancing the existing trail system, and acquiring lands for open space conservation to complete gaps in underserved areas or along potential open space corridors.
Strategic Priority: Vibrant Community and Neighborhoods
A vibrant community is engaged in civic life, the arts, and the outdoors. It comprises individuals and groups who are dedicated to their community, get involved with neighborhood associations, and participate with local government to ensure responsiveness to changing needs, resulting in Arvada being the preferred place to live, work, play, and stay.
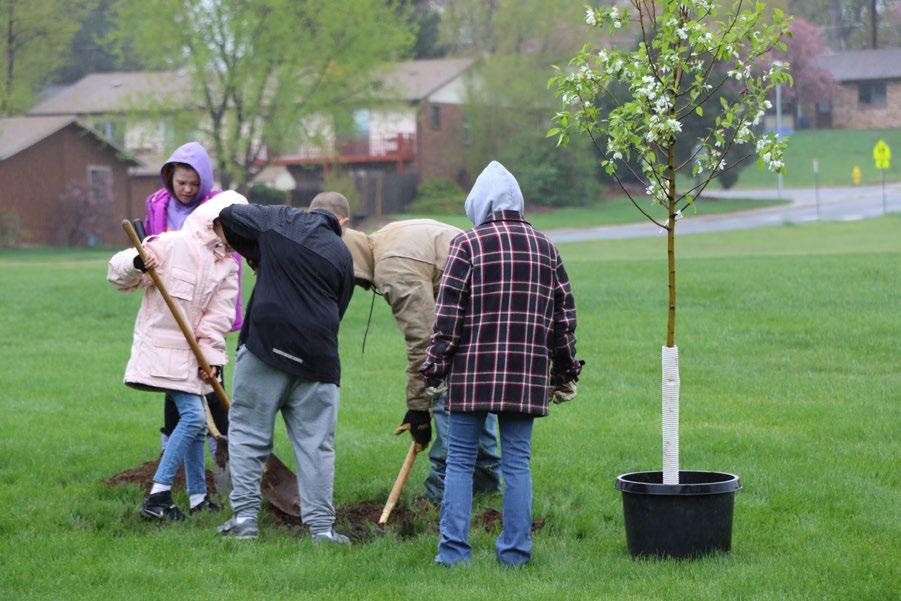
project is fully funded.
Strategic Principle:
maintenance services to the community and visitors, so they can play and enjoy activities in a safe, well-maintained parks and trails system. Completing park projects, creating a green spine trail system while enhancing the existing trail system, and acquiring lands for open space conservation to complete gaps in underserved areas or along potential open space corridors.
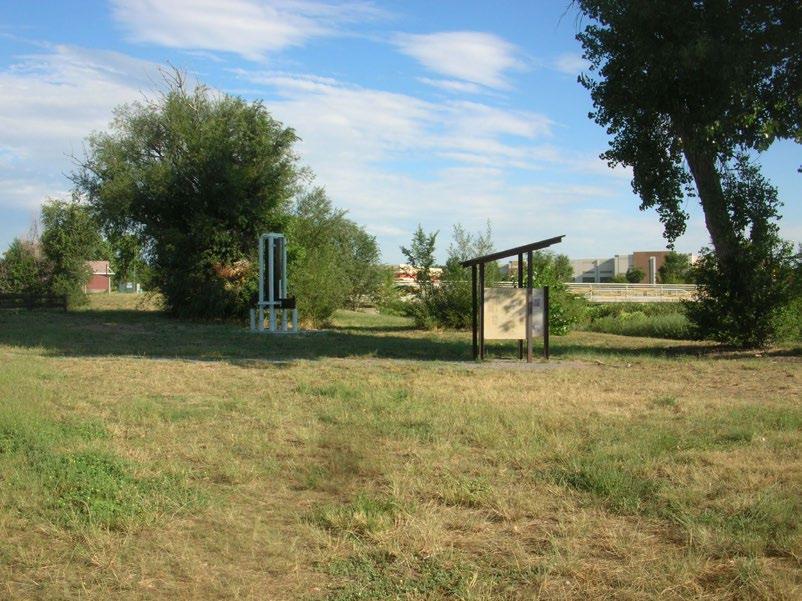
This
major improvements to the Gold Strike Park area. Preliminary
other governmental entities, such as Apex, Hyland Hills, Adams County,
County,
A vibrant community is engaged in civic life, the arts, and the outdoors. It comprises individuals and groups who are dedicated to their community, get involved with neighborhood associations, and participate with local government to ensure responsiveness to changing needs, resulting in Arvada being the preferred place to live, work, play, and stay.
portion of this project will be funded through the Conservation Trust.
Provides maintenance services to the community and visitors, so they can play and enjoy activities in a safe, well-maintained parks and trails system. Completing park projects, creating a green spine trail system while enhancing the existing trail system, and acquiring lands for open space conservation to complete gaps in underserved areas or along potential open space corridors.
annual operating
The City of Arvada and Red Rocks Community College (RRCC) are working together to develop a new park in the Arvada Ridge area which seeks to meet identified public park service gaps
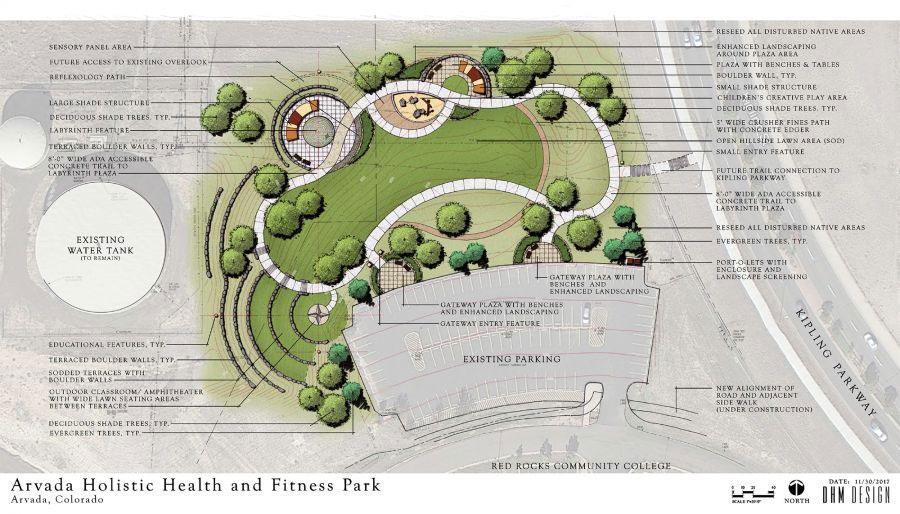
support higher education curriculum at the RRCC Arvada Campus.
of the first of its kind in the nation, Arvada’s
park
on whole-body health and offer a variety of uses for all ages and abilities, provide interactive features, and improve community
solutions to chronic health issues. Residents, practitioners, faculty, students, artists, and other stakeholders
new park.
Strategic Priority: Vibrant Community and Neighborhoods
A vibrant community is engaged in civic life, the arts, and the outdoors. It comprises individuals and groups who are dedicated to their community, get involved with neighborhood associations, and participate with local government to ensure responsiveness to changing needs, resulting in Arvada being the preferred place to live, work, play, and stay.
Strategic Principle:
Provides maintenance services to the community and visitors, so they can play and enjoy activities in a safe, well-maintained parks and trails system. Completing park projects, creating a green spine trail system while enhancing the existing trail system, and acquiring lands for open space conservation to complete gaps in underserved areas or along potential open space corridors.
This project is funded through Park Development fees, Lands Dedicated Opt-Out fees, and through Conservation Trust funding.
this project
Uses
The annual operating cost for Holistic Health and Fitness Park
Total
Strategic Priority: Vibrant Community and Neighborhoods
A vibrant community is engaged in civic life, the arts, and the outdoors. It comprises individuals and groups who are dedicated to their community, get involved with neighborhood associations, and participate with local government to ensure responsiveness to changing needs, resulting in Arvada being the preferred place to live, work, play, and stay.
for this project is provided through a
Strategic Principle: Operates sustainable premier golf programs and facilities focusing on exceptional service and value to the community with the conservation of natural environment under economically sound and socially responsible management.
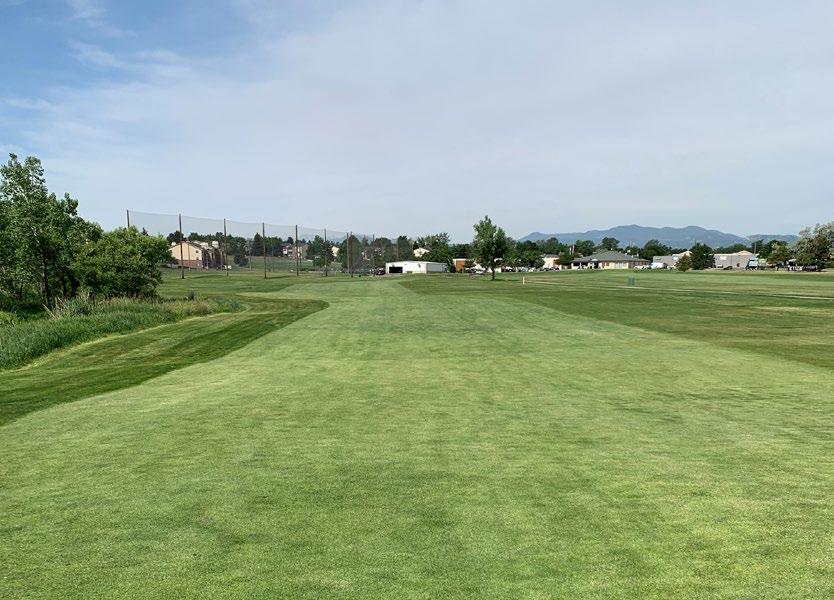
of the General Fund and the Golf Fund.
Uses
Timeline Start Completion
currently
City’s
series
span
coming
Major plans include improvements to Lake Arbor and Ralston Creek, as well as various outfall improvements
at mitigating potential threats of flash flooding and property damage. Ongoing operations include stream bank stabilizations, detention pond dredging, minor miscellaneous infrastructure replacements and upgrades, as well as joint master plan studies with the Mile High Flood District.

2,684,259 8,811,248
1,434,711
$10,245,958
Strategic Priority: Infrastructure
This is multi-phased project to rebuild the outlet works for the Bates Lake Detention area, upsize the existing stormwater pipe under the railroad tracks at Depew St., and expand the stormwater conveyance system along Sheridan Blvd. from W. 62nd Ave. to Clear Creek. The watershed boundaries are roughly Lamar St., W. 66th Ave., Tennyson St., and Clear Creek.
Strategic Principle:
community depends on a well-maintained
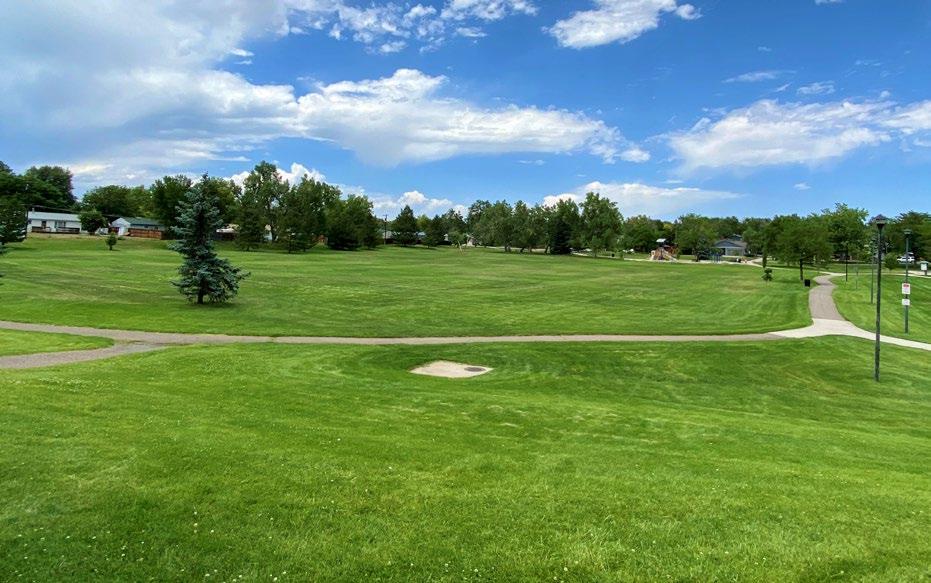
streets, sidewalks, and water, wastewater and stormwater
and steady population growth requires proper maintenance of existing
capacity to support a thriving
the community with a safe, reliable, high-quality water supply, drainage system, and wastewater disposal services for full city build-out, as defined by the Comprehensive Plan. This includes maintaining utility rates at lowest practical levels with accurate billing that supports replacement of aging infrastructure in order to maintain robust utility systems.
This project dredges Lake Arbor’s forebay and the western end of the lake to a depth of roughly six feet. These areas are shallower than the original design depths. Dredging the forebay and west half of the lake will improve water quality and vegetation overgrowth in the lake. It will also address shoreline stability issues by correcting ongoing erosion and making the shoreline more aesthetically pleasing.
project maintains
Strategic Priority: Infrastructure
community depends on a well-maintained foundation of streets, sidewalks, and water, wastewater and stormwater facilities. Planned and steady population growth requires proper maintenance of existing infrastructure and additional capacity to support a thriving community.
other overgrowth due to the shallow depth of water.
Strategic Principle:
Provides the community with a safe, reliable, high-quality water supply, drainage system, and wastewater disposal services for full city build-out, as defined by the Comprehensive Plan. This includes maintaining utility rates at lowest practical levels with accurate billing that supports replacement of aging infrastructure in order to maintain robust utility systems.
through the stormwater utility
a
operating costs
City of Arvada
managed through Mile High Flood District (MHFD). There is currently $1.4
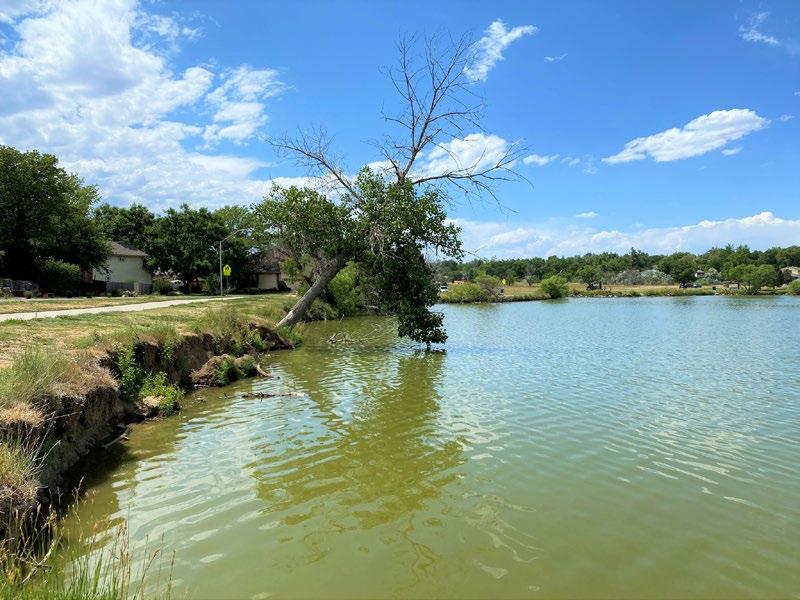
expected to be available for this work.
begin in
Strategic Priority: Infrastructure
Strategic Principle:
community depends on a well-maintained
growth requires proper maintenance of
of
sidewalks, and water, wastewater and stormwater
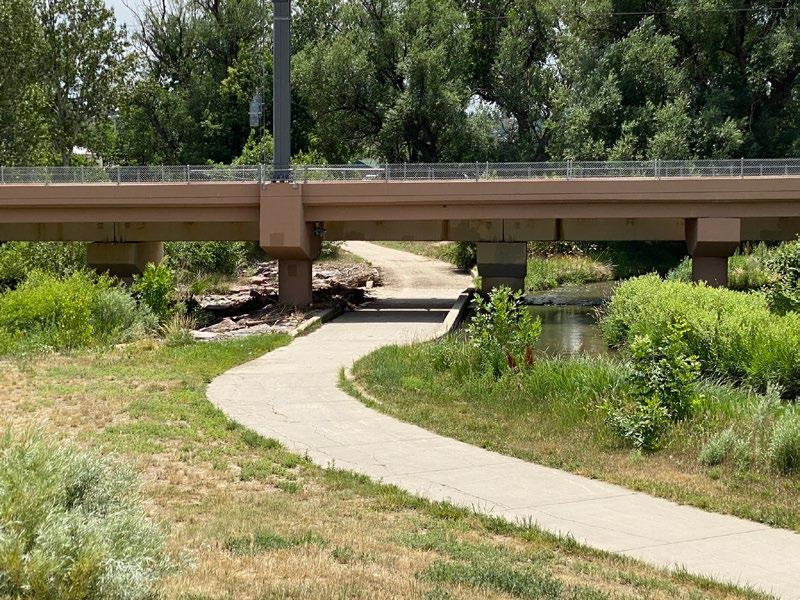
steady
Provides the community with a safe, reliable, high-quality water supply, drainage system, and wastewater disposal services for full city build-out, as defined by the Comprehensive Plan. This includes maintaining utility rates at lowest practical levels with accurate billing that supports replacement of aging infrastructure in order to maintain robust utility systems.
through the stormwater utility fee. Grant funding has been received to
this project.
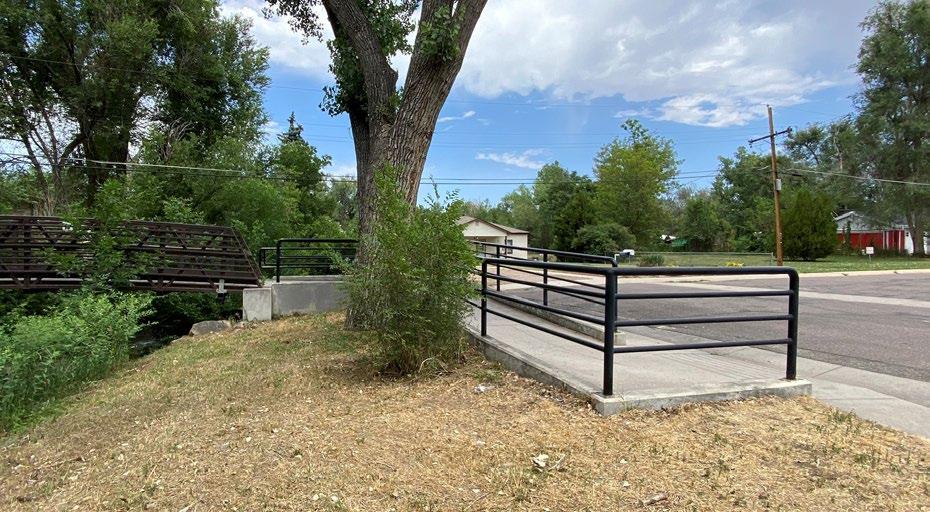
The purpose of this project
remove around twenty residential properties in the
along Ralston Creek from upstream of Vance Street to Wadsworth
not been identified, but it will probably be a combination of
detailed solution
and purchasing flood prone properties.
20 homes in this area
adjacent to Olde Town and with the opening of the G Line Commuter
potential.
community depends on a well-maintained foundation of streets, sidewalks, and water, wastewater and stormwater facilities. Planned and steady population growth requires proper maintenance of existing
capacity to support a
Strategic Principle:
Provides the community with a safe, reliable, high-quality water supply, drainage system, and wastewater disposal services for full city build-out, as defined by the Comprehensive Plan. This includes maintaining utility rates at lowest practical levels with accurate billing that supports replacement of aging infrastructure in order to maintain robust utility systems.
Funded through the stormwater utility fee.

Strategic Priority: Infrastructure
community depends on a well-maintained foundation of streets, sidewalks, and water, wastewater and stormwater facilities.
and steady population growth requires proper maintenance of existing
capacity to support
Strategic Principle:
the community with a safe, reliable, high-quality water supply, drainage system, and wastewater disposal services for full city build-out, as defined by the Comprehensive Plan. This includes maintaining utility rates at lowest practical levels with accurate billing that supports replacement of aging infrastructure in order to maintain robust utility systems.
through the stormwater utility fee.
funds
High Flood District.
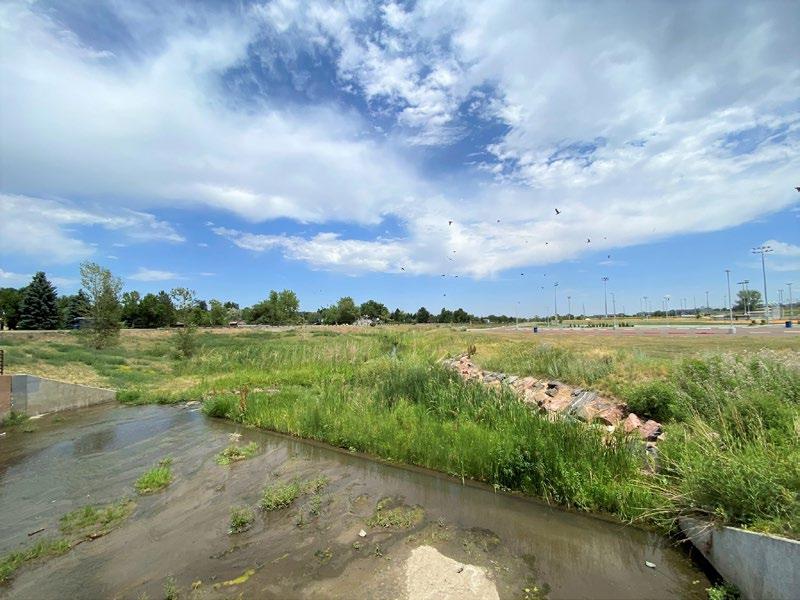
collaboration with
solutions to basin-wide drainage problems.
Mile
City becomes eligible to receive Mile High Flood District
available.
Strategic Priority: Infrastructure
community depends on a well-maintained foundation of streets, sidewalks, and water, wastewater and stormwater facilities. Planned and steady population
Strategic Principle:
requires proper maintenance of existing
additional capacity to support a thriving
the community with a safe, reliable, high-quality water supply, drainage system, and wastewater disposal services for full city build-out, as defined by the Comprehensive Plan. This includes maintaining utility rates at lowest practical levels with accurate billing that supports replacement of aging infrastructure in order to maintain robust utility systems.
through the stormwater utility fee.
funds
Mile High Flood District.
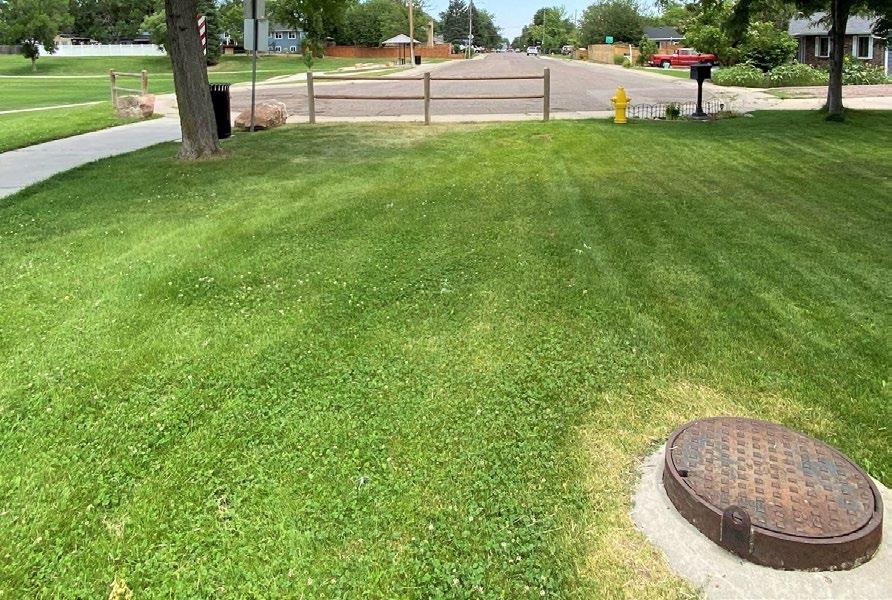
community
on
well-maintained
and water, wastewater and stormwater
Strategic Principle:
the community with a safe, reliable, high-quality water supply, drainage system, and wastewater disposal services for full city build-out, as defined by the Comprehensive Plan. This includes maintaining utility rates at lowest practical levels with accurate billing that supports replacement of aging infrastructure in order to maintain robust utility systems.
Street Maintenance
100%
50/50 concrete
program. Over $100 million is dedicated to street maintenance over the ten-year life of the program. The Street Maintenance program is funded through the City’s operating budget. Additional funding is provided through the capital program for ADA compliance improvements to the City’s sidewalks and curb ramps.
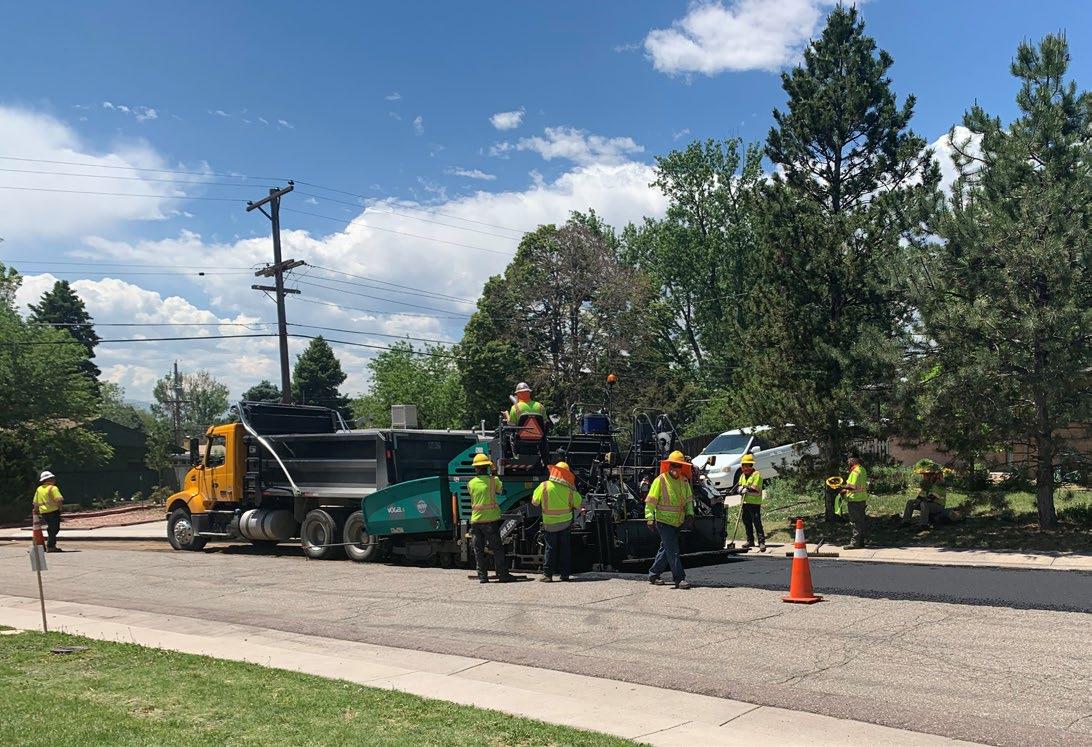
$604,279 $3,330,436
13,510,744 73,496,448 137,177,955
120,000 600,000 1,200,000
$74,700,727 $141,708,391
Strategic Priority: Infrastructure
water,
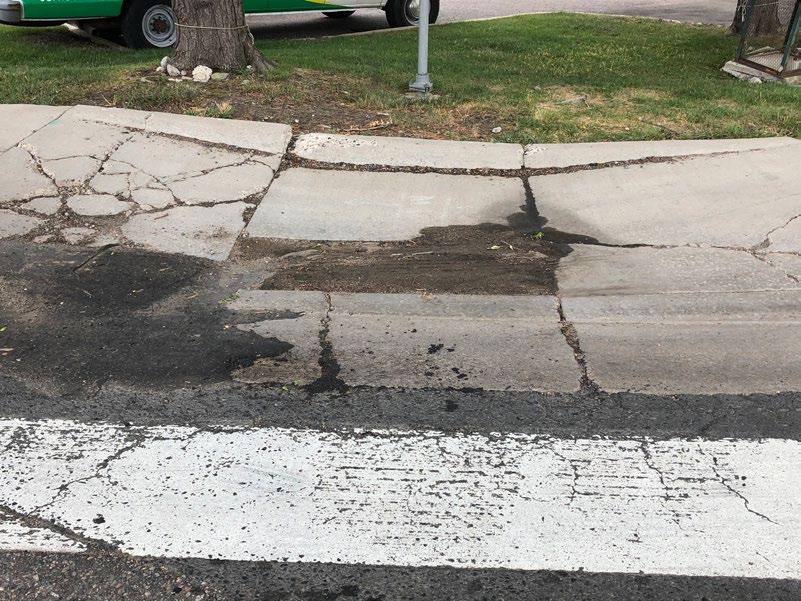
significant
Strategic Principle:
existing roads and transportation network in tandem with snow
ice control services to ensure swift and safe transportation modes for the community.
federal
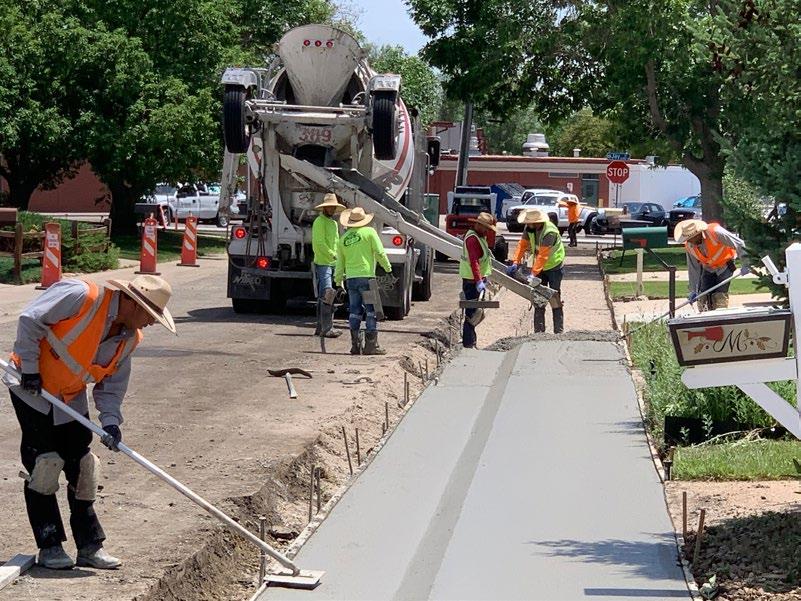
This project includes the asphalt program, the 100% concrete replacement program, and the 50/50 concrete replacement program. Arvada’s street infrastructure of 1,586 lane miles is the City’s largest and most valuable asset. The concrete program provides improved surface drainage, updated cross-pans and ADA ramps, and safe, attractive sidewalks. The asphalt program includes mill and overlay, extending the life of the streets 15-20 years.
Arvada.
electors of Arvada
address street maintenance
community depends on a well-maintained
of streets, sidewalks, and water, wastewater and stormwater facilities.
and steady population growth requires proper maintenance of existing infrastructure and additional capacity to support a thriving community.
existing roads and transportation network in tandem with snow and ice control services to ensure swift and safe transportation modes for the community.
project is funded by the
Fund, which is part of
City’s
General Fund
the Highway Users Tax
This
The Transportation category includes all redesign and construction of transportation infrastructure within the City limits, including roads, bridges, traffic signals, intersections, guardrails, bike lanes, and sidewalks. Much of the funding for transportation is dedicated to “Taking Lasting Care” of existing transportation infrastructure. However, the ten-year plan also includes funding for specific improvements to Leyden Road, Ralston Road, Pierce Street, and the Indiana Corridor. In addition, the ten year program targets challenges relating to traffic congestion with such projects as the Transportation Master Plan, Signal Interconnect, and Signal Timing Implementation.
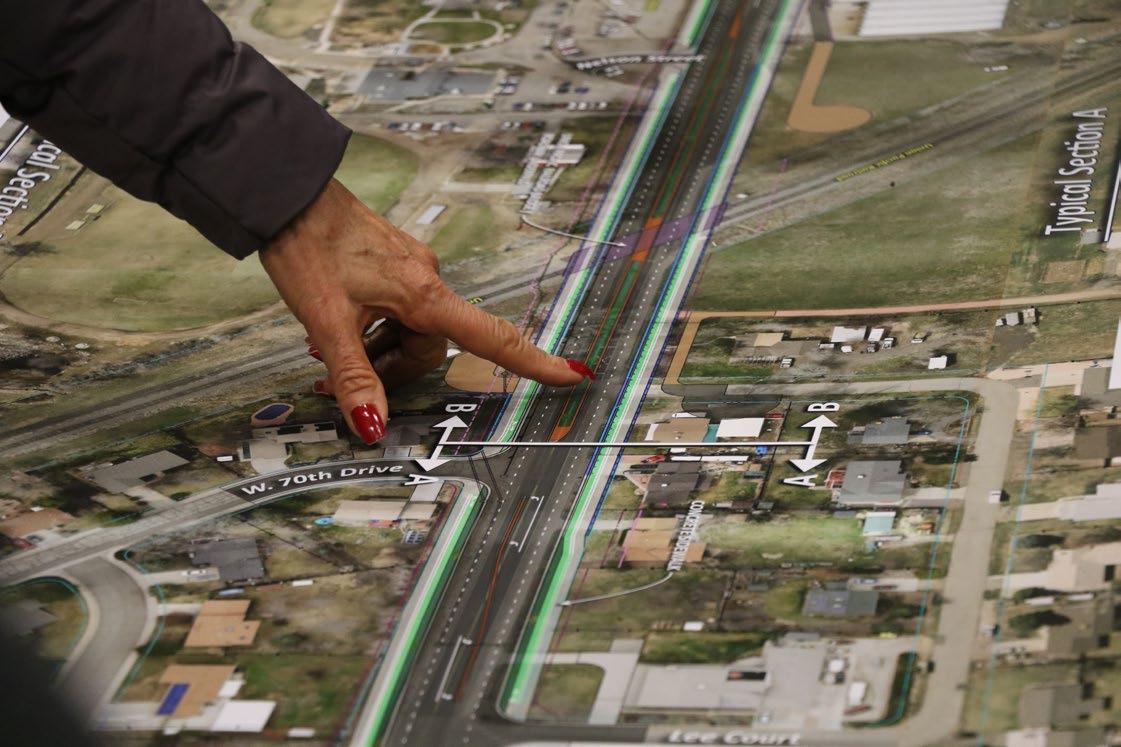
Sources Existing 2023 2024 2025 2026 2027 2028-2032 Total
$ $2,141,697 $3,234,431
City
7,030,861 1,176,635
$9,172,558 $4,411,066
$3,873,934 $4,018,596 $25,328,709 $45,602,984
90,755 496,288 9,051,251
$4,109,351 $25,824,997 $54,654,235
Uses Existing 2023
2027 2028-2032 Total
$333,759 $2,274,982 $6,356,313
808,792 1,898,613
22,741,224 46,399,309
$4,109,351 $25,824,997 $54,654,235
This project is for the initial study for a road widening and a new UPRR underpass along the Indiana Corridor, which is bounded by W. 82nd Ave. to W. 86th Ave. The City has requested a grant of approximately $1.1 million from Congressman Perlmutter’s office to fund the National Environmental Policy ACT (NEPA) study. The City must provide a match of 20%.
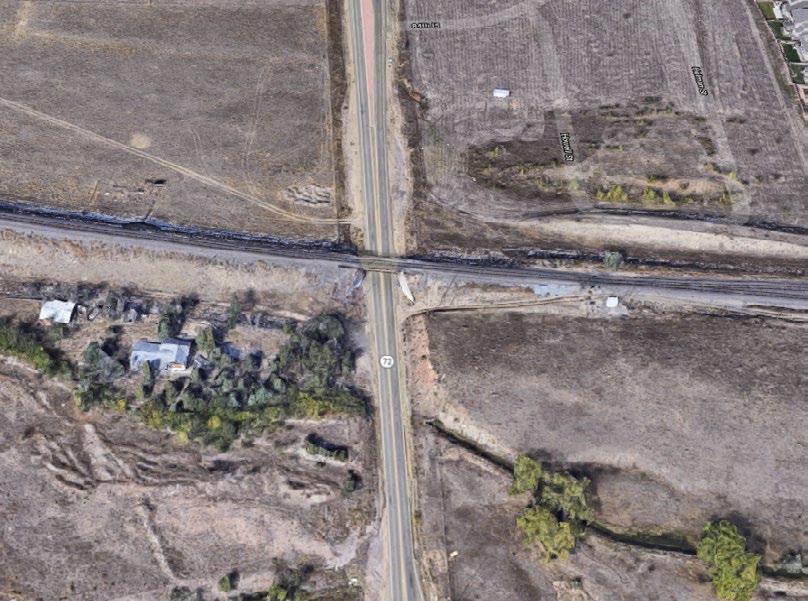
Indiana St. is a major north/south corridor. Traffic volumes have significantly increased over the past few years since the NW area of Arvada is being built out. The additional traffic and congestion is a significant issue for motorists and the public has actively encouraged the City to address this issue. The first required step is a NEPA study.
Strategic Priority: Infrastructure
The community depends on a well-maintained foundation of streets, sidewalks, and water, wastewater and stormwater facilities. Planned and steady population growth requires proper maintenance of existing infrastructure and additional capacity to support a thriving community.
Strategic Principle:
Provides safe and efficient connections to modes of transportation, including transit, streets, sidewalks, and bikeways with a focus on enhanced technology at high-priority intersections improving safety and minimizing traffic congestion.
This grant match is funded through the City’s 98-101 funding. The remainder of this study will be funded through a pending federal grant, which has been requested but not yet approved.
2023
2025
2027 2028-2032
Total
$- $- $274,000
The NEPA study is only the first step in the Indiana Corridor Improvement. If the City receives this grant, it is expected the study will conclude in 2023. The next step will be project design which is estimated at $3.8 million.
Uses
There is no operating cost impact associated with this project.
Total
Timeline Start Completion
Leyden Road needs improvement as a result of the significant development that has occurred in this area. This project intends to be a planning document to identify: 1) 10% roadway design, 2) right-of-way, 3) environmental impacts, 4) survey, 5) conceptual construction costs.
the significant development
project intends to begin the study
increased traffic
design
Strategic Priority: Infrastructure
Road and adjacent roadways, Leyden road is no longer capable of handling the traffic volume.
with improving Leyden Road.
The community depends on a well-maintained foundation of streets, sidewalks, and water, wastewater and stormwater facilities. Planned and steady population growth requires proper maintenance of existing infrastructure and additional capacity to support a thriving community.
Strategic Principle:
Provides safe and efficient connections to modes of transportation, including transit, streets, sidewalks, and bikeways with a focus on enhanced technology at high-priority intersections improving safety and minimizing traffic congestion.
This project is funded through Traffic Impact Fees from the Leyden Rock and Leyden Ranch developments.
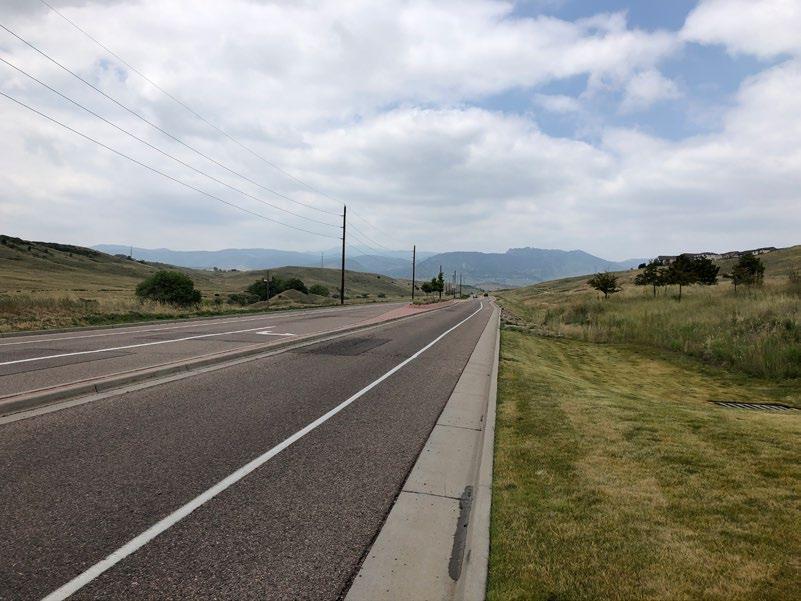
There
additional
This project will construct a new sidewalk with a curb along Pierce Street from 60th Ave. to 62nd Ave. in order to provide a safer environment for students walking to Secrest Elementary School.
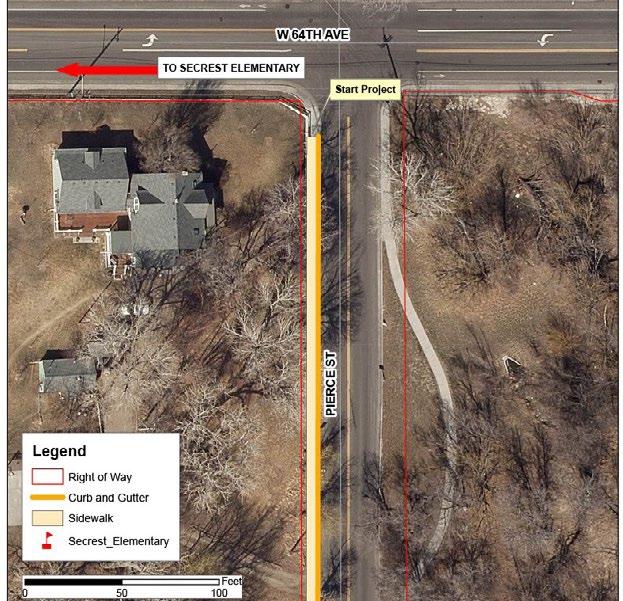
Pierce St. stretches from W 52nd to W 72nd within the Secrest Elementary School boundary area and is a collector roadway with around 1,500 vehicles per day and speed limits at 25 and 30 mph. Although most of the street has sidewalks on one side, there is a segment between W 60th Ave. and W 62nd Ave. that is missing a sidewalk on both sides of the street. Parent surveys indicated that many parents would never let their kids walk to school because of the speed of traffic.
Strategic Priority: Infrastructure
The community depends on a well-maintained foundation of streets, sidewalks, and water, wastewater and stormwater facilities. Planned and steady population growth requires proper maintenance of existing infrastructure and additional capacity to support a thriving community.
Strategic Principle: Provides safe and efficient connections to modes of transportation, including transit, streets, sidewalks, and bikeways with a focus on enhanced technology at high-priority intersections improving safety and minimizing traffic congestion.
This project is funded in part by a Safe Routes to School Grant. The balance is funded through the City’s Sidewalk/Transit-Oriented Development/Bike & Trail Gap capital program.
project is fully funded.
is
Completion
There are no operating costs associated with this project.
reconstruction of Ralston Road
a two-phase project
widen the corridor and
for the area. As part of the bond-funded Phase II
Yukon St. to Garrison St., the Arvada Urban Redevelopment Authority
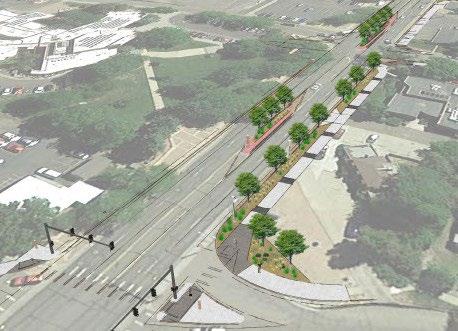
provided funding for streetscape improvements, including public space
pedestrian lighting, planted medians, and streetscape amenities.
existing, basic roadway infrastructure that existed before
pedestrian safety and connectivity, enhance business
Strategic Priority: Infrastructure
community depends on a well-maintained foundation of streets, sidewalks, and water, wastewater and stormwater facilities. Planned and steady population growth requires proper maintenance of existing
capacity to support a thriving
project is funded by
Urban Renewal
Strategic Principle:
safe and efficient connections to modes of transportation, including transit, streets, sidewalks, and bikeways with a focus on enhanced technology at high-priority intersections improving safety and minimizing traffic congestion.

The purpose of this project is to develop a Transportation Master Plan (TMP). The TMP is the long-range plan for the City of Arvada’s transportation network. It helps guide how the City develops its Capital Improvement Program (CIP) needs, budget, expectations, challenges, and priorities. It coordinates transportation improvements with land uses, and plans for what is needed to respond to growth.
TMP contains policies and projects that support future land uses in the City’s Comprehensive Plan. Understanding growth allows the City to plan for appropriate transportation improvements. Policies in the TMP will address various travel modes, such as car, bus, bicycle, and on foot, and they will help the City prioritize CIP projects. CIP prioritization will allow the City to identify funding mechanisms to upgrade the transportation system. The projects listed in the TMP will ensure that adequate transportation facilities are in
to develop vibrant Communities and Neighborhoods.
Strategic Priority: Infrastructure
The community depends on a well-maintained foundation of streets, sidewalks, and water, wastewater and stormwater facilities. Planned and steady population growth requires proper maintenance of existing infrastructure and additional capacity to support a thriving community.
Strategic Principle:
Provides computer-aided drafting, design services, special analysis, GIS applications, and enterprise system integration for the workforce to better visualize spatial relationships for informed decisions, while maintaining and/ or replacing infrastructure and accommodating new construction projects.
This project may require additional funding.
This project is expected to be completed by 2022.
the
and project prioritization are expected to result in a list of project needs. Some funding has been set aside for project implementation as well.
There
no ongoing operating cost associated with this project.
community
and water, wastewater
on
stormwater
proper maintenance
steady

Ward
sidewalk,
safe and efficient connections to modes of transportation,
transit, streets, sidewalks, and bikeways with a focus on enhanced technology at high-priority intersections improving safety and minimizing traffic
Safety Improvement Program and Developer Fees from Haskins Station
improvements
Ave.
lane
includes
include bicycle
expansion
construction
Strategic Priority: Infrastructure
community depends on a well-maintained foundation of streets, sidewalks, and water, wastewater and stormwater
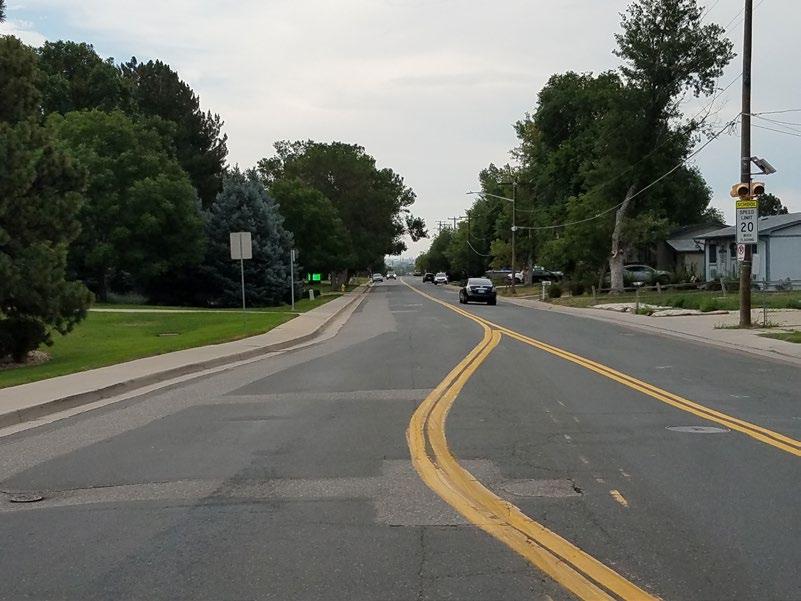
Planned and steady population growth requires proper maintenance of existing
capacity to support
Strategic Principle:
safe and efficient connections to modes of transportation, including transit, streets, sidewalks, and bikeways with a focus on enhanced technology at high-priority intersections improving safety and minimizing traffic congestion.
Timeline Start Completion
Transportation

Each year
City receives about $75,000 in a Transportation Tax from Adams County
can only be used in Adams County for transportation-related projects. The funds
captured in a holding account. The monies are used to complete missing sidewalks, upgrade street sections not meeting current City standards, and for the City match on jointly funded projects.
Strategic Priority: Infrastructure
community depends on a well-maintained foundation of streets, sidewalks, and water, wastewater and stormwater facilities. Planned and steady population growth requires proper maintenance of existing infrastructure and additional capacity to support a thriving community.
Strategic Principle:
Ave and Sheridan Blvd. The retrofits
of
These
the
in
existing roads and transportation network in tandem with snow and ice control services to ensure swift and safe transportation modes for the community.
year the City receives about $75,000
a
sales tax from Adams County
can only be used in Adams County for transportation purposes.
traffic
Strategic Priority: Infrastructure
Strategic Principle:
community depends on a well-maintained
requires proper maintenance of existing
support
and steady population
streets, sidewalks, and water, wastewater and stormwater
safe and efficient connections to modes of transportation, including transit, streets, sidewalks, and bikeways with a focus on enhanced technology at high-priority intersections improving safety and minimizing traffic congestion.
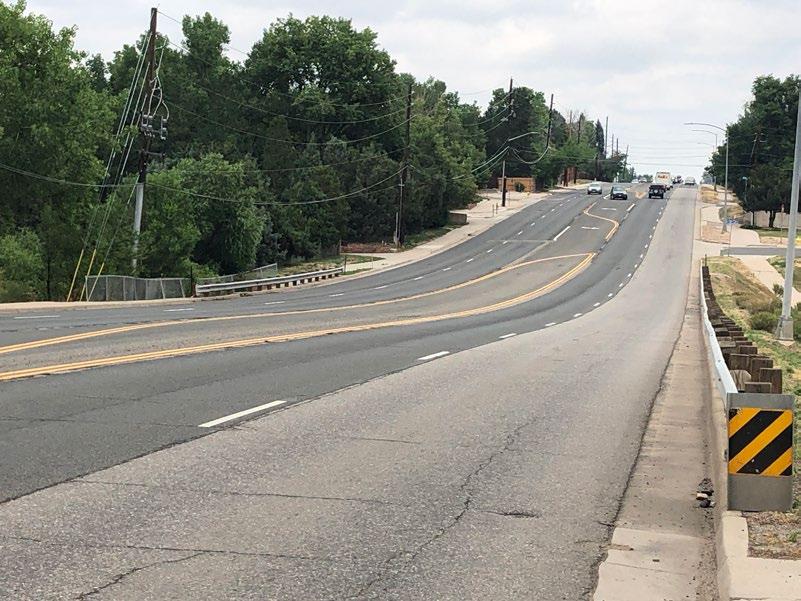
water, wastewater
Ralston Creek
demonstration project
safe and efficient connections to modes of transportation, including transit, streets, sidewalks, and bikeways with a focus on enhanced technology at high-priority intersections improving safety and minimizing traffic congestion.
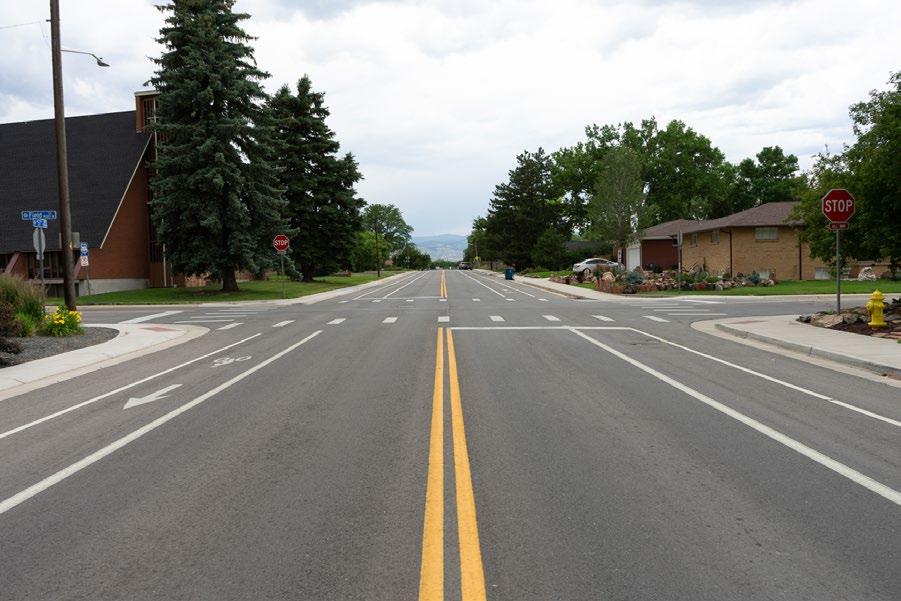
Strategic Priority: Infrastructure
community depends on a well-maintained
and water, wastewater and stormwater
requires proper maintenance
to support
existing
and steady
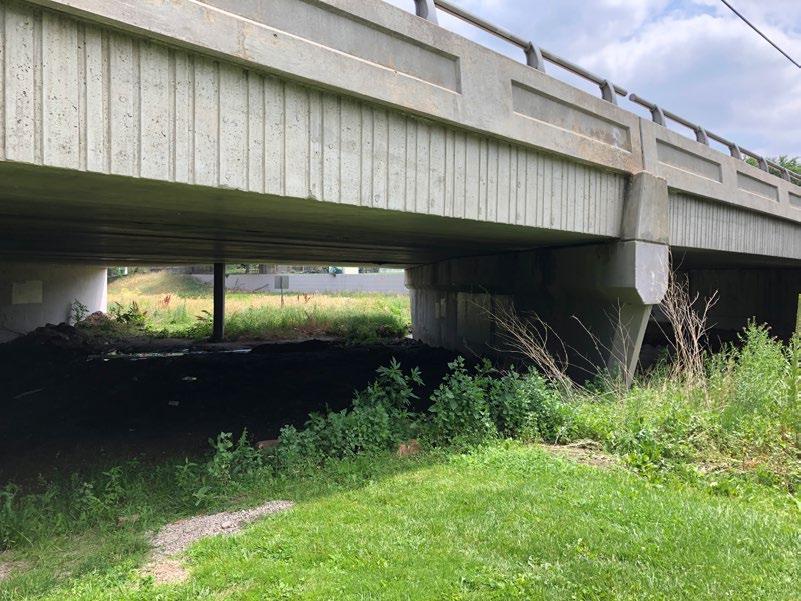
Strategic Principle:
existing roads and transportation network in tandem with snow and ice control services to ensure swift and safe transportation modes for the community.
This project
isolated improvements along collector streets such as turn lanes,
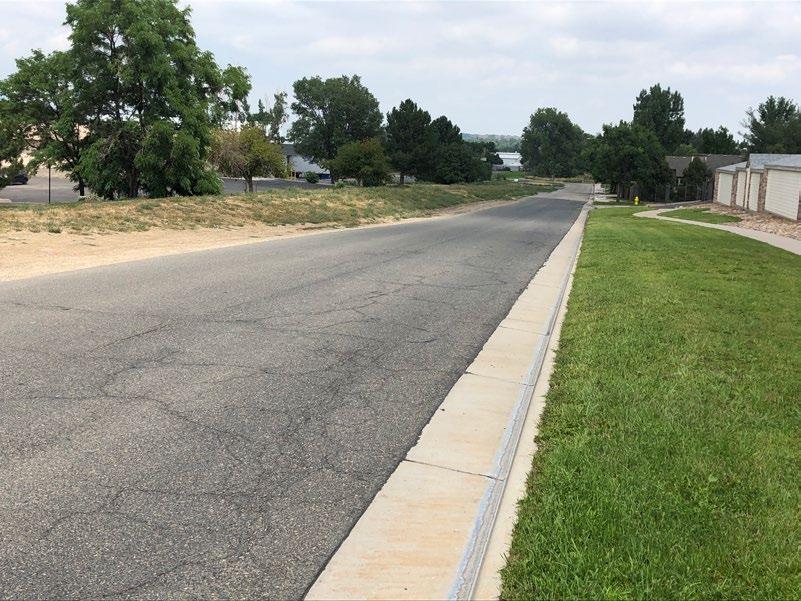
also provide the City’s match for outside funding on minor
as preliminary engineering studies or design needed to apply for outside
can serve as supplemental funding between a budgeted project and actual costs.
improve safety
Strategic Priority: Infrastructure
Strategic Principle:
community
on a
and steady population
streets, sidewalks, and water, wastewater and stormwater
requires proper maintenance of existing
additional capacity to support a thriving
safe and efficient connections to modes of transportation, including transit, streets, sidewalks, and bikeways with a focus on enhanced technology at high-priority intersections improving safety and minimizing traffic congestion.
This project will be used to conduct an inventory of the City’s guardrails, perform a structural assessment on existing guardrails, and install new guardrails or mitigate hazards that do not meet current City and AASHTO standards for roadside clear zones. Mitigation measures, in addition to the installation of guardrails, may include installing or extending culverts to eliminate a ditch or culvert end section or the removal of large roadside objects that pose a hazard to the traveling public.
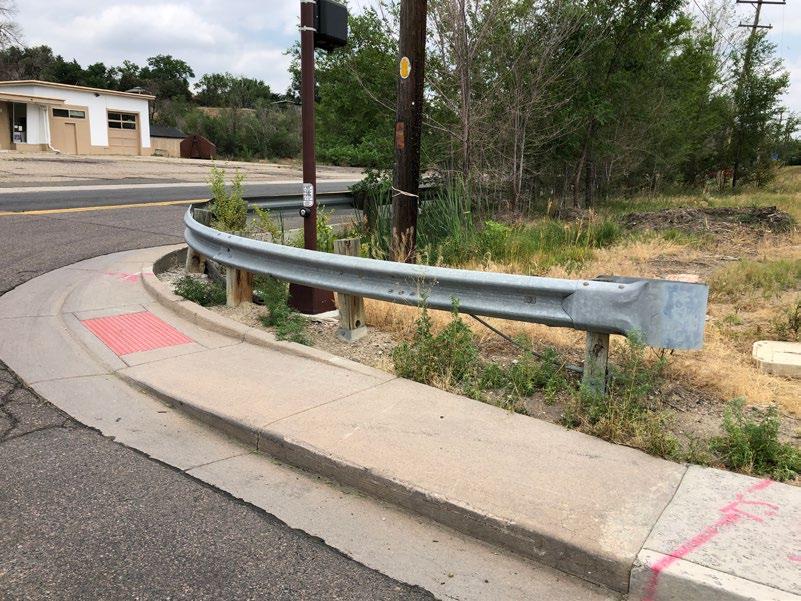
Improvement
Strategic Priority: Infrastructure
community depends on a well-maintained foundation of streets, sidewalks, and water, wastewater and stormwater facilities. Planned and steady population growth requires proper maintenance of existing infrastructure and additional capacity to support a thriving community.
Strategic Principle:
existing roads and transportation network in tandem with snow and ice control services to ensure swift and safe transportation modes for the community.
project
unmet
Strategic Priority: Infrastructure
water, wastewater
support

Strategic Principle:
safe and efficient connections to modes of transportation, including transit, streets, sidewalks, and bikeways with a focus on enhanced technology at high-priority intersections improving safety and minimizing traffic congestion.
Strategic Priority: Infrastructure
community
on a well-maintained
and water, wastewater and stormwater
proper
Strategic Principle:
safe and efficient connections to modes of transportation, including transit, streets, sidewalks, and bikeways with a focus on enhanced technology at high-priority intersections improving safety and minimizing traffic congestion.
Federal Safe Routes to School program.
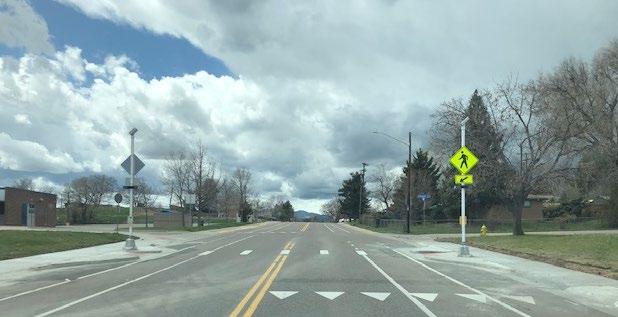
Strategic Priority: Infrastructure
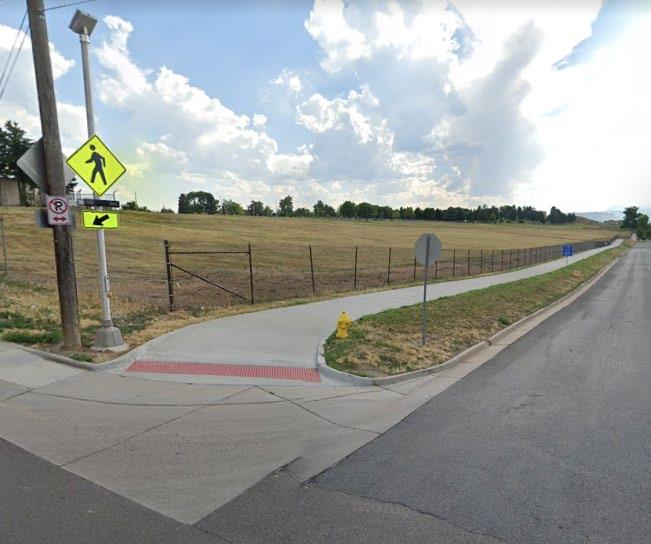
City’s
safe and efficient connections to modes of transportation,
transit, streets, sidewalks, and bikeways with a focus on enhanced technology at high-priority intersections improving safety and minimizing
this project
develop a multi-year strategic and implementation plan
to the city’s fiber backbone. This will allow the City to monitor realtime traffic operations effectively and better manage congestion.
less than one-third of the signalized intersections are connected to
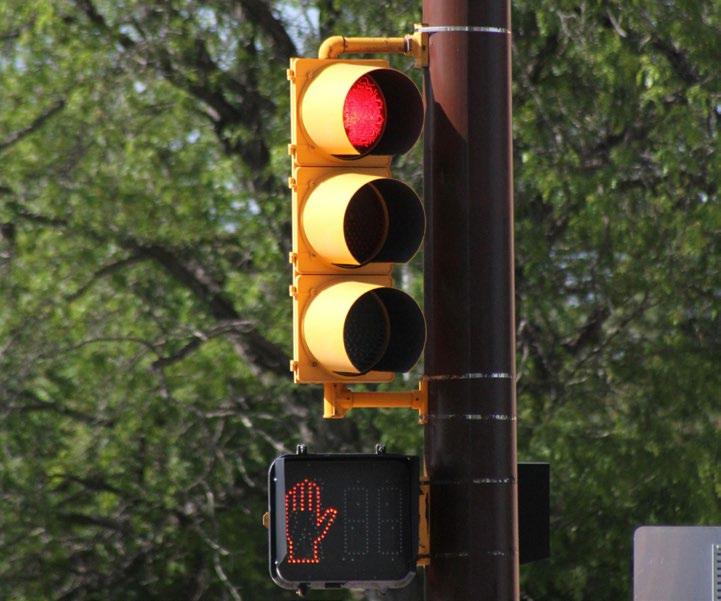
city’s fiber backbone. This prohibits the City from managing signal-related congestion issues in real-time. In the 2019 Community Survey, citizens
than average satisfaction levels with congestion and traffic signal timing. This project is also aligned with Arvada’s Smart City initiative.
Strategic Priority: Infrastructure
community depends on a well-maintained foundation of streets, sidewalks, and water, wastewater and stormwater facilities. Planned and steady population growth requires proper maintenance of existing infrastructure and additional capacity to support a thriving community.
Strategic Principle:
safe and efficient connections to modes of transportation, including transit, streets, sidewalks, and bikeways with a focus on enhanced technology at high-priority intersections improving safety and minimizing traffic congestion.
project is fully funded.
Strategic Priority: Infrastructure
community depends on a well-maintained
This project is to develop a multi-year strategic and implementation plan to upgrade and maintain city-wide signal timing to ensure safe and efficient traffic operations. This request complements the new, staff-run signal timing initiative to create a comprehensive approach to signal management. This funding will allow components of the signal infrastructure to be improved as the signal timing program is rolled out.
Strategic Principle:
and water, wastewater and stormwater
and steady population growth requires proper maintenance of existing
capacity to support a thriving
safe and efficient connections to modes of transportation, including transit, streets, sidewalks, and bikeways with a focus on enhanced technology at high-priority intersections improving safety and minimizing traffic congestion.
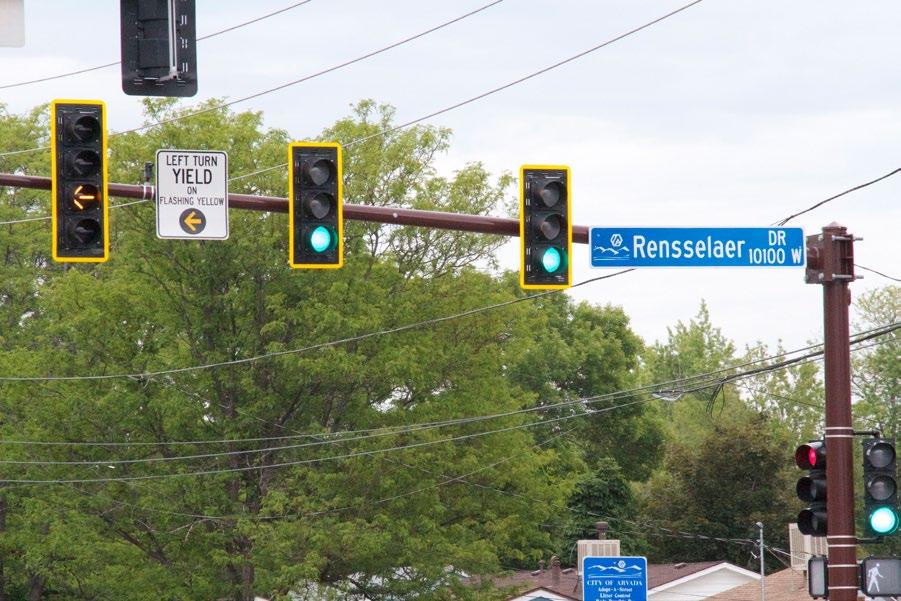
This project
continue the design and experimentation of traffic calming through
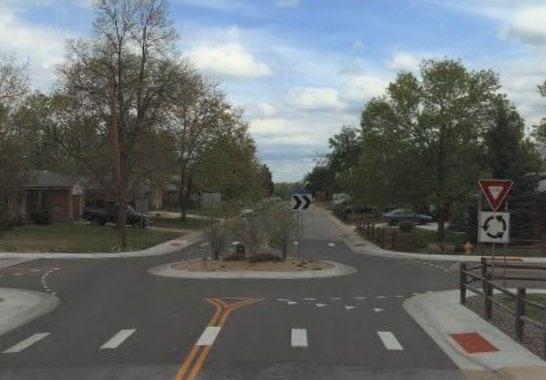
quicker, cheaper strategy. The funds will be used to construct a temporary traffic circle at
and Brooks to address traffic and pedestrian issues. Another project
design traffic circles and raised medians for W. 57th Ave and traffic circles along Grandview Ave.
Strategic Priority: Infrastructure
Strategic Principle:
community
on
of streets, sidewalks, and water, wastewater and stormwater
and steady population growth requires proper maintenance of existing
additional capacity to support a thriving
safe and efficient connections to modes of transportation, including transit, streets, sidewalks, and bikeways with a focus on enhanced technology at high-priority intersections improving safety and minimizing traffic congestion.
This project is to replace, rebuild, and build new traffic signals. The City is behind on replacing traffic signals at several locations. This project replaces old, deteriorating signals and upgrades signals in order for them to meet contemporary standards. It includes not only the signals themselves, but improving sidewalk crossings, obtaining right-of-way, and installing the latest technology to help connect signals. This project allows the City to leverage the installation of fiber and connect the signal infrastructure in order to better control signals remotely, optimize signal timing, and improve traffic flow.
Many of the City’s traffic signals are over 30 years old and are in need of replacement or rebuild. Some infrastructure is deteriorating, doesn’t meet current standards, doesn’t meet the needs of the intersection (e.g., signal lights
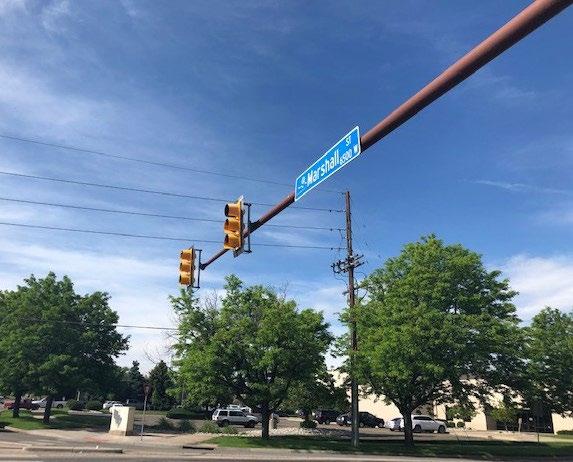
align with lanes), or vehicles are damaging the infrastructure (e.g., trucks at 80th and Chase). Without adequate funding, deterioration
lead
expensive emergency repair. In addition, some intersections now meet warrants for signalization (e.g., 64th and Quail and
and
The community depends on a well-maintained foundation of streets, sidewalks, and water, wastewater and stormwater facilities. Planned and steady population growth requires proper maintenance of existing infrastructure and additional capacity to support a thriving community.
Strategic Principle:
Provides safe and efficient connections to modes of transportation, including transit, streets, sidewalks, and bikeways with a focus on enhanced technology at high-priority intersections improving safety and minimizing traffic congestion.
this project provides ongoing funding for traffic signals,
is an additional unmet need to address the backlog of intersections that require new signals. This project now includes the capital dollars
set
for unlimited
supply installations at major intersections.
Inspection
maintenance
in poor repair
for
a
repairs can run in the range of $9,000 - $10,000 a
which can cost $20,000 or more to replace.
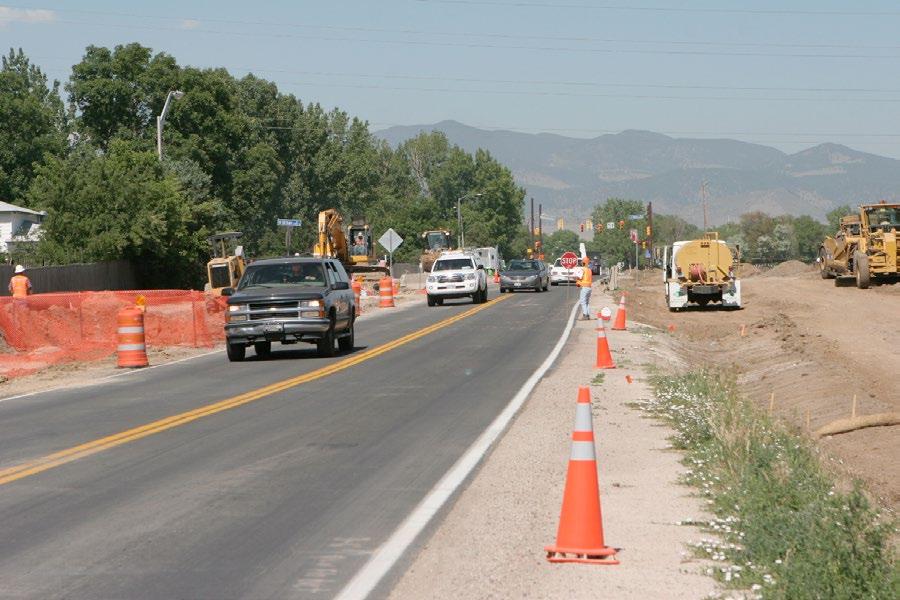
Strategic Priority: Infrastructure
community depends on a well-maintained foundation of streets, sidewalks, and water, wastewater and stormwater facilities. Planned and steady population growth requires proper maintenance of existing
capacity to support a thriving
project
Strategic Principle:
safe and efficient connections to modes of transportation, including transit, streets, sidewalks, and bikeways with a focus on enhanced technology at high-priority intersections improving safety and minimizing traffic congestion.
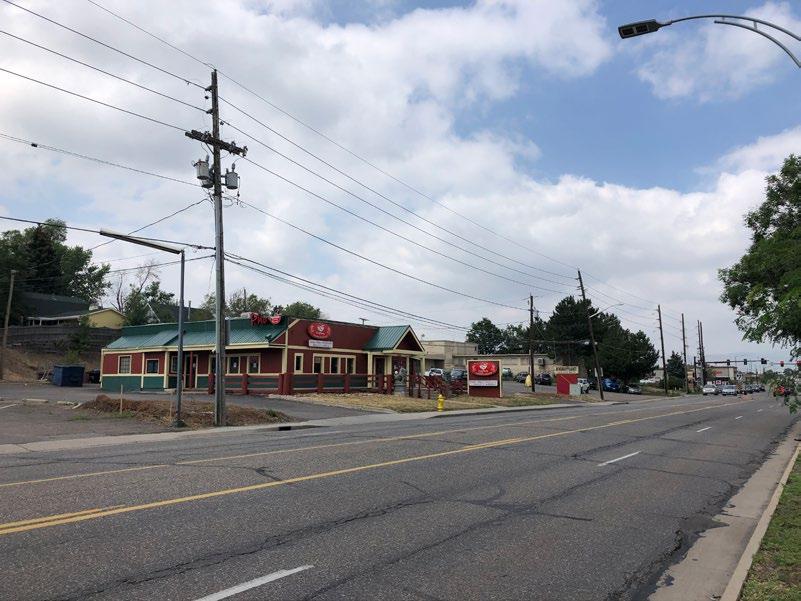
water,
existing roads and transportation network in tandem with snow
ice control services to ensure swift and safe transportation modes for the community.
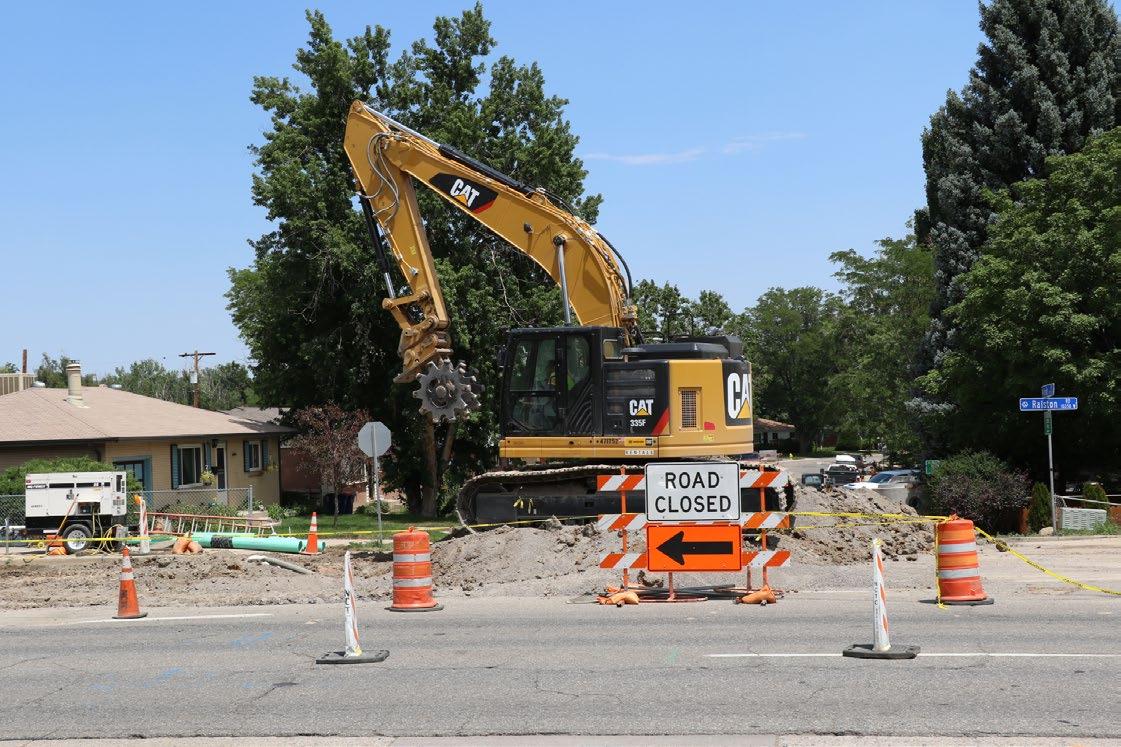
The plan for the Wastewater Division, which operates and maintains the City’s sanitary sewer system and is responsible for wastewater treatment by the Metro Wastewater Reclamation District, focuses primarily on the maintenance and replacement of sewer infrastructure throughout the City. The comprehensive inspections and proactive maintenance that have marked Wastewater operations for over a decade, particularly with its cure-in-place pipe (CIPP) work, will continue in order to carry on its exemplary service record. In addition, the expansion of system capacity in the north area of the City will meet rising demands as growth continues in the coming years.
5,536,500
$12,815,954
1,667,532 7,423,231 21,838,619
49,866,500
$1,667,532 $7,423,231 $71,705,119
The NTL has several areas that are at or exceed capacity. This project was identified as a priority segment as part of the Sewer Master Plan and is required to meet the timeline for planned development.
project was identified as
Strategic Priority: Infrastructure
The community depends on a well-maintained foundation of streets, sidewalks, and water, wastewater and stormwater facilities. Planned and steady population growth requires proper maintenance of existing infrastructure and additional capacity to support a thriving community.
the timeline for planned development.
Strategic Principle:
Provides the community with a safe, reliable, high-quality water supply, drainage system, and wastewater disposal services for full city build-out, as defined by the Comprehensive Plan. This includes maintaining utility rates at lowest practical levels with accurate billing that supports replacement of aging infrastructure in order to maintain robust utility systems.
project will be funded by
additional operating
Alkire Lift Station has no resiliency and is at capacity for the current design. This project will be designed as part of the Alkire Lift Station Upgrade.
Strategic Priority: Infrastructure
The community depends on a well-maintained foundation of streets, sidewalks, and water, wastewater and stormwater facilities. Planned and steady population growth requires proper maintenance of existing infrastructure and additional capacity to support a thriving community.
Strategic Principle:
Provides the community with a safe, reliable, high-quality water supply, drainage system, and wastewater disposal services for full city build-out, as defined by the Comprehensive Plan. This includes maintaining utility rates at lowest practical levels with accurate billing that supports replacement of aging infrastructure in order to maintain robust utility systems.
This project will be funded by
Total
No additional operating expenses
The
Station
meet
Strategic Priority: Infrastructure
The community depends on a well-maintained foundation of streets, sidewalks, and water, wastewater and stormwater facilities. Planned and steady population growth requires proper maintenance of existing infrastructure and additional capacity to support a thriving community.
Strategic Principle:
Provides the community with a safe, reliable, high-quality water supply, drainage system, and wastewater disposal services for full city build-out, as defined by the Comprehensive Plan. This includes maintaining utility rates at lowest practical levels with accurate billing that supports replacement of aging infrastructure in order to maintain robust utility systems.
will be funded by developer
Total
is expected to be complete in 2024.
Uses
The operating cost impact of this project is currently unknown.
Total
The North Trunk of the sanitary sewer has several bottlenecks. There is not enough capacity to serve growth in the northwest part of the City. This project will upsize the sewer line in the 61st and Tennyson area.
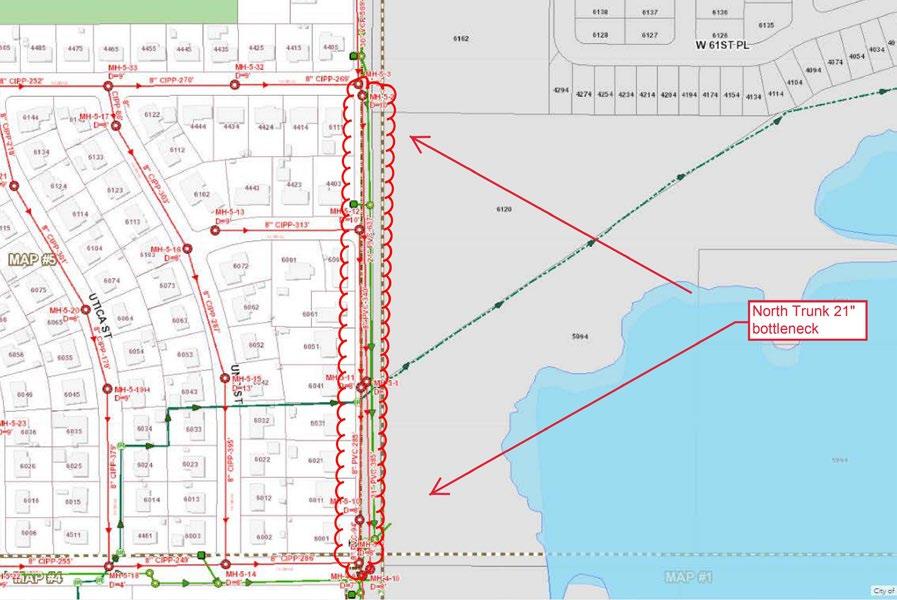
project
required
Strategic Priority: Infrastructure
The community depends on a well-maintained foundation of streets, sidewalks, and water, wastewater and stormwater facilities. Planned and steady population growth requires proper maintenance of existing infrastructure and additional capacity to support a thriving community.
Strategic Principle:
Provides the community with a safe, reliable, high-quality water supply, drainage system, and wastewater disposal services for full city build-out, as defined by the Comprehensive Plan. This includes maintaining utility rates at lowest practical levels with accurate billing that supports replacement of aging infrastructure in order to maintain robust utility systems.
project is funded through wastewater tap fees.
The
several areas that
the
at or exceed capacity. This project was identified as a
Plan and is required to meet the timeline for
The community depends on a well-maintained foundation of streets, sidewalks, and water, wastewater and stormwater facilities. Planned and steady population growth requires proper maintenance of existing infrastructure and additional capacity to support a thriving community.
Strategic Principle:
Provides the community with a safe, reliable, high-quality water supply, drainage system, and wastewater disposal services for full city build-out, as defined by the Comprehensive Plan. This includes maintaining utility rates at lowest practical levels with accurate billing that supports replacement of aging infrastructure in order to maintain robust utility systems.
be funded
The
several areas that
the
at or exceed capacity. This project was identified as a
Master Plan and is required to meet the timeline for
project
Strategic Priority: Infrastructure
The community depends on a well-maintained foundation of streets, sidewalks, and water, wastewater and stormwater facilities. Planned and steady population growth requires proper maintenance of existing infrastructure and additional capacity to support a thriving community.
Strategic Principle:
Provides the community with a safe, reliable, high-quality water supply, drainage system, and wastewater disposal services for full city build-out, as defined by the Comprehensive Plan. This includes maintaining utility rates at lowest practical levels with accurate billing that supports replacement of aging infrastructure in order to maintain robust utility systems.
project
be funded by
The NTL has several areas that are at or exceed capacity. This project was identified as a priority segment as part of the Sewer Master Plan and is required to meet the timeline for planned development.
project
identified as
Strategic Priority: Infrastructure
The community depends on a well-maintained foundation of streets, sidewalks, and water, wastewater and stormwater facilities. Planned and steady population growth requires proper maintenance of existing infrastructure and additional capacity to support a thriving community.
Strategic Principle:
timeline for planned development.
Provides the community with a safe, reliable, high-quality water supply, drainage system, and wastewater disposal services for full city build-out, as defined by the Comprehensive Plan. This includes maintaining utility rates at lowest practical levels with accurate billing that supports replacement of aging infrastructure in order to maintain robust utility systems.
project will be funded by
currently
The
areas that
of the
at or exceed capacity. This project was identified as a
Master Plan and is required to meet the timeline for
Strategic Priority: Infrastructure
The community depends on a well-maintained foundation of streets, sidewalks, and water, wastewater and stormwater facilities. Planned and steady population growth requires proper maintenance of existing infrastructure and additional capacity to support a thriving community.
Strategic Principle: Provides the community with a safe, reliable, high-quality water supply, drainage system, and wastewater disposal services for full city build-out, as defined by the Comprehensive Plan. This includes maintaining utility rates at lowest practical levels with accurate billing that supports replacement of aging infrastructure in order to maintain robust utility systems.
project
be
The
areas that
or exceed capacity. This project was identified as a
is required to meet the timeline for
Strategic Priority: Infrastructure
The community depends on a well-maintained foundation of streets, sidewalks, and water, wastewater and stormwater facilities. Planned and steady population growth requires proper maintenance of existing
additional capacity to support a
Strategic Principle:
Provides the community with a safe, reliable, high-quality water supply, drainage system, and wastewater disposal services for full city build-out, as defined by the Comprehensive Plan. This includes maintaining utility rates at lowest practical levels with accurate billing that supports replacement of aging infrastructure in order to maintain robust utility systems.
The North Trunk of the sanitary sewer has several bottlenecks. There is not enough capacity to serve growth in the northwest part of the City. This project will upsize the sewer line in the 81st and Kipling area.
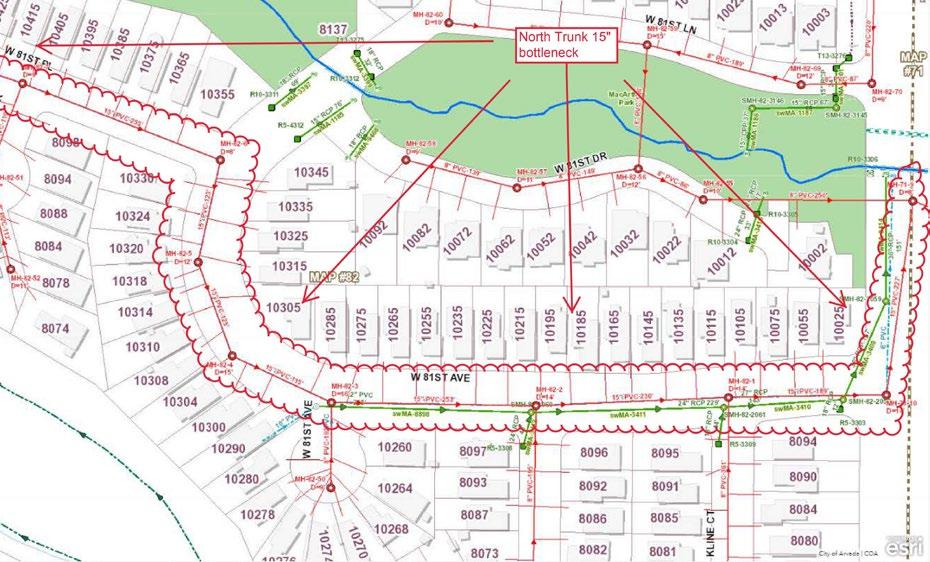
project
required
Strategic Priority: Infrastructure
The community depends on a well-maintained foundation of streets, sidewalks, and water, wastewater and stormwater facilities. Planned and steady population growth requires proper maintenance of existing infrastructure and additional capacity to support a thriving community.
Strategic Principle:
Provides the community with a safe, reliable, high-quality water supply, drainage system, and wastewater disposal services for full city build-out, as defined by the Comprehensive Plan. This includes maintaining utility rates at lowest practical levels with accurate billing that supports replacement of aging infrastructure in order to maintain robust utility systems.
project is funded through wastewater
The Central Ralston Trunk Line (CRT) has several areas that are at or exceed capacity.
project was identified as a priority segment as part of the Sewer Master Plan and is required
meet the timeline for planned development.
Strategic Priority: Infrastructure
The community depends on a well-maintained foundation of streets, sidewalks, and water, wastewater and stormwater facilities. Planned and steady population growth requires proper maintenance of existing infrastructure and additional capacity to support a thriving
Strategic Principle:
Provides the community with a safe, reliable, high-quality water supply, drainage system, and wastewater disposal services for full city build-out, as defined by the Comprehensive Plan. This includes maintaining utility rates at lowest practical levels with accurate billing that supports replacement of aging infrastructure in order to maintain robust utility systems.
project
be funded
Strategic Priority: Infrastructure
The Central Ralston Trunk Line (CRT) has several areas that are at or exceed capacity.
project
identified as a priority segment as part of the Sewer Master Plan and is required
meet
timeline for planned development.
The community depends on a well-maintained foundation of streets, sidewalks, and water, wastewater and stormwater facilities. Planned and steady population growth requires proper maintenance of existing infrastructure and additional capacity to support a thriving community.
Strategic Principle:
Provides the community with a safe, reliable, high-quality water supply, drainage system, and wastewater disposal services for full city build-out, as defined by the Comprehensive Plan. This includes maintaining utility rates at lowest practical levels with accurate billing that supports replacement of aging infrastructure in order to maintain robust utility systems.
project will be funded by
Strategic Priority: Infrastructure
The Central Ralston Trunk Line
has several areas that are at or exceed capacity.
identified as a priority segment as part of the Sewer Master Plan and is required
project
meet
timeline for planned development.
The community depends on a well-maintained foundation of streets, sidewalks, and water, wastewater and stormwater facilities. Planned and steady population growth requires proper maintenance of existing infrastructure
additional capacity to support a thriving
Strategic Principle:
Provides the community with a safe, reliable, high-quality water supply, drainage system, and wastewater disposal services for full city build-out, as defined by the Comprehensive Plan. This includes maintaining utility rates at lowest practical levels with accurate billing that supports replacement of aging infrastructure in order to maintain robust utility systems.
project
be
The Central Ralston Trunk Line (CRT) has several areas that are at or exceed capacity.
project was identified as a priority segment as part of the Sewer Master Plan and is required to meet the timeline for planned development.
Strategic Priority: Infrastructure
The community depends on a well-maintained foundation of streets, sidewalks, and water, wastewater and stormwater facilities. Planned and steady population growth requires proper maintenance of existing infrastructure and additional capacity to support a thriving community.
Strategic Principle:
Provides the community with a safe, reliable, high-quality water supply, drainage system, and wastewater disposal services for full city build-out, as defined by the Comprehensive Plan. This includes maintaining utility rates at lowest practical levels with accurate billing that supports replacement of aging infrastructure in order to maintain robust utility systems.
project
be funded
The Central Ralston Trunk Line (CRT) has several areas that are at or exceed capacity. This project was identified as a priority segment as part of the Sewer Master Plan and is required to meet the timeline for planned development.
project
Strategic Priority: Infrastructure
The community depends on a well-maintained foundation of streets, sidewalks, and water, wastewater and stormwater facilities. Planned and steady population growth requires proper maintenance of existing infrastructure and additional capacity to support a thriving community.
Strategic Principle:
Provides the community with a safe, reliable, high-quality water supply, drainage system, and wastewater disposal services for full city build-out, as defined by the Comprehensive Plan. This includes maintaining utility rates at lowest practical levels with accurate billing that supports replacement of aging infrastructure in order to maintain robust utility systems.
project
be funded
Strategic Priority: Infrastructure
community
on
well-maintained
water, wastewater and stormwater
proper maintenance
support a thriving
Groundwater infiltration into the city’s sanitary sewer system after heavy rains has been identified
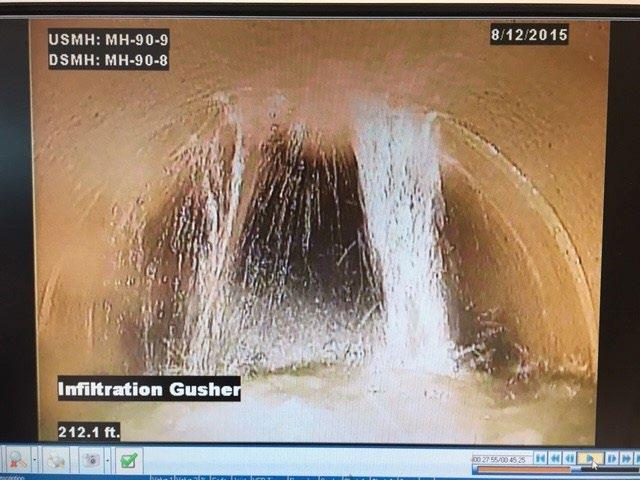
various points in the system. The City is then required to pay for treatment of this groundwater as it flows through the Metro Wastewater system. This project will fund improvements to underdrain systems and replacement of sections of sanitary sewer main where infiltration
the greatest.
Strategic Principle:
the community with a safe, reliable, high-quality water supply, drainage system, and wastewater disposal services for full city build-out, as defined by the Comprehensive Plan. This includes maintaining utility rates at lowest practical levels with accurate billing that supports replacement of aging infrastructure in order to maintain robust utility systems.
through
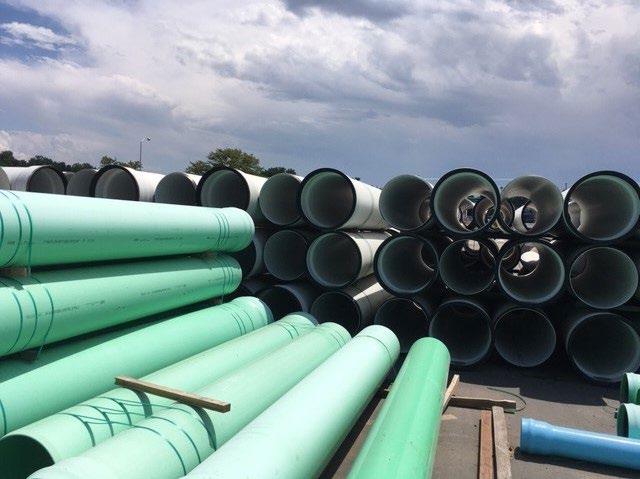
Strategic Priority: Infrastructure
Strategic Principle:
community depends on a well-maintained
requires proper maintenance of existing
capacity to support
and steady population
of streets, sidewalks, and water, wastewater and stormwater
the community with a safe, reliable, high-quality water supply, drainage system, and wastewater disposal services for full city build-out, as defined by the Comprehensive Plan. This includes maintaining utility rates at lowest practical levels with accurate billing that supports replacement of aging infrastructure in order to maintain robust utility systems.
Strategic Priority: Infrastructure
water,
sanitary sewer system was constructed before 1980. Material
that earlier time period has a 50-year life cycle. Using a relatively inexpensive process, these sewer lines are being rehabilitated, resulting in an extension of their life cycle by many decades.
Strategic Principle:
the community with a safe, reliable, high-quality water supply, drainage system, and wastewater disposal services for full city build-out, as defined by the Comprehensive Plan. This includes maintaining utility rates at lowest practical levels with accurate billing that supports replacement of aging infrastructure in order to maintain robust utility systems.
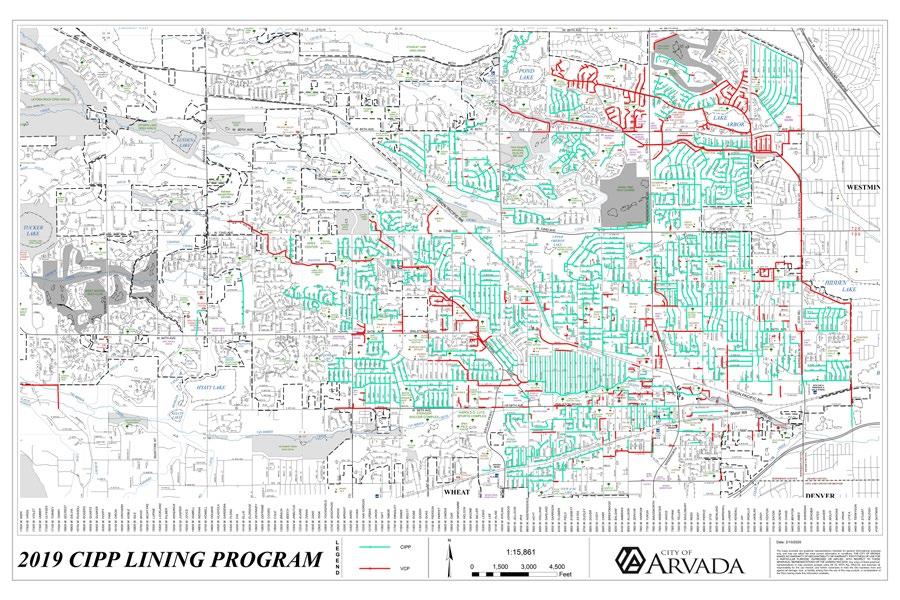
The Water category includes improvements for all water infrastructure, including water treatment plants and the drinking water distribution system. Over $117 million through the ten-year plan is included for the Gross Reservoir Expansion, which will substantially increase the availability of water for the City, ensuring a stable and adequate supply for decades to come. Other projects, including system capacity expansion to accommodate new growth in the northwest and continued water main replacements, will see to the continued provision of safe drinking water.
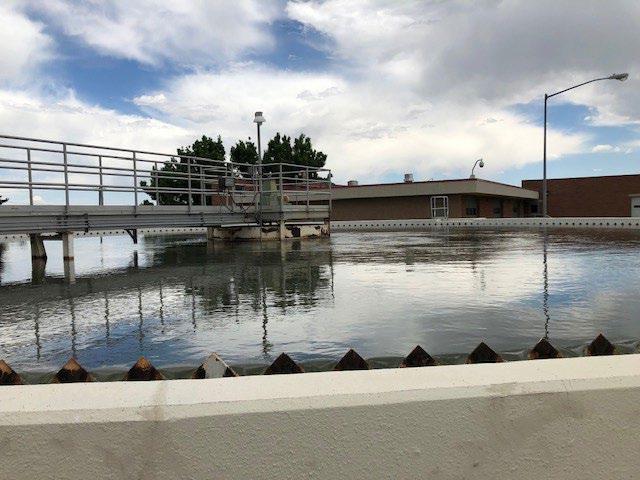
$ 75,577,340 39,700,900
$ 2,086,993 27,813,007
2028-2032
$- $-
29,971,220 20,533,609 66,852,423 269,280,787
22,000,000 19,000,000 50,000,000 138,200,000
$77,664,333 $67,513,907 $32,859,554 $21,085,741 $51,971,220 $39,533,609 $116,852,423 $407,480,787
363,302,056
$136,086,301 $407,480,787
Strategic Priority: Infrastructure
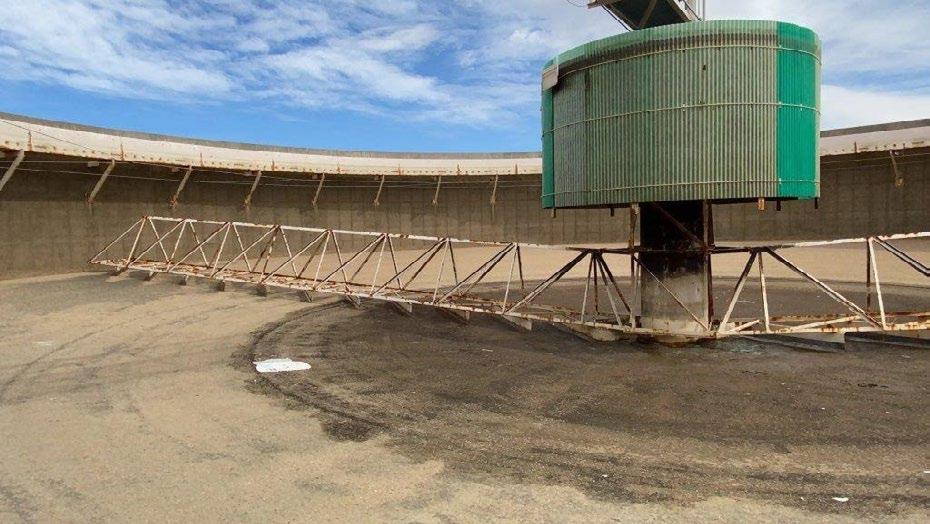
These structures
fair condition and while no major deficiencies exist, rehabilitation
use these assets and to extend their design life. This is a high priority
continue
from the water treatment master plan. The work includes sandblasting
recoating, replacement of key parts, and concrete patching.
community depends on a well-maintained foundation of streets, sidewalks, and water, wastewater and stormwater facilities. Planned and steady population growth requires proper maintenance of existing infrastructure
additional capacity to support a thriving
Strategic Principle:
Provides the community with a safe, reliable, high-quality water supply, drainage system, and wastewater disposal services for full city build-out, as defined by the Comprehensive Plan. This includes maintaining utility rates at lowest practical levels with accurate billing that supports replacement of aging infrastructure in order to maintain robust utility systems.
is from the Water Fund.
Strategic Priority: Infrastructure
community
on
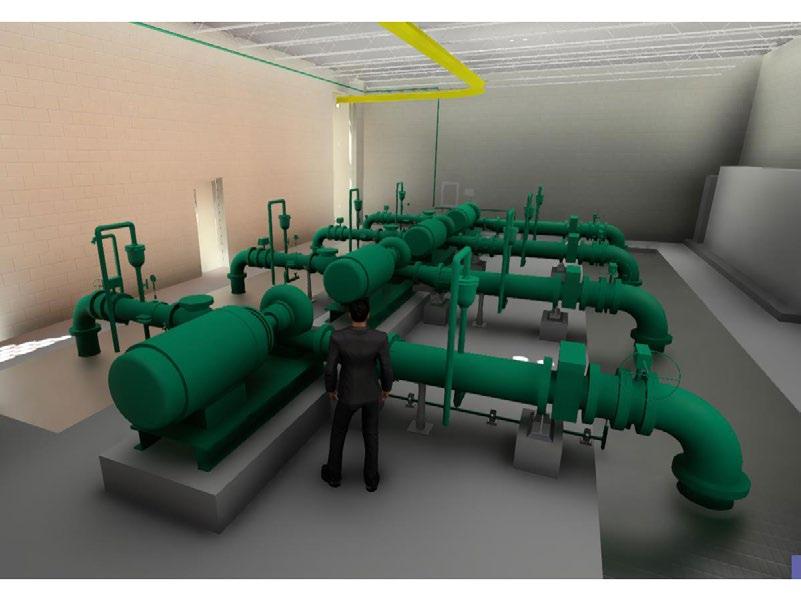
Strategic Principle:
and water, wastewater and stormwater
and steady population growth
capacity
proper maintenance of existing
support
the community with a safe, reliable, high-quality water supply, drainage system, and wastewater disposal services for full city build-out, as defined by the Comprehensive Plan. This includes maintaining utility rates at lowest practical levels with accurate billing that supports replacement of aging infrastructure in order to maintain robust utility systems.
This project will enlarge the water line crossing Wadsworth at Pomona and increase the size of the green pressure zone. At this time, the water system pressure is not sufficient for fire flow conditions in the Castlegate area.
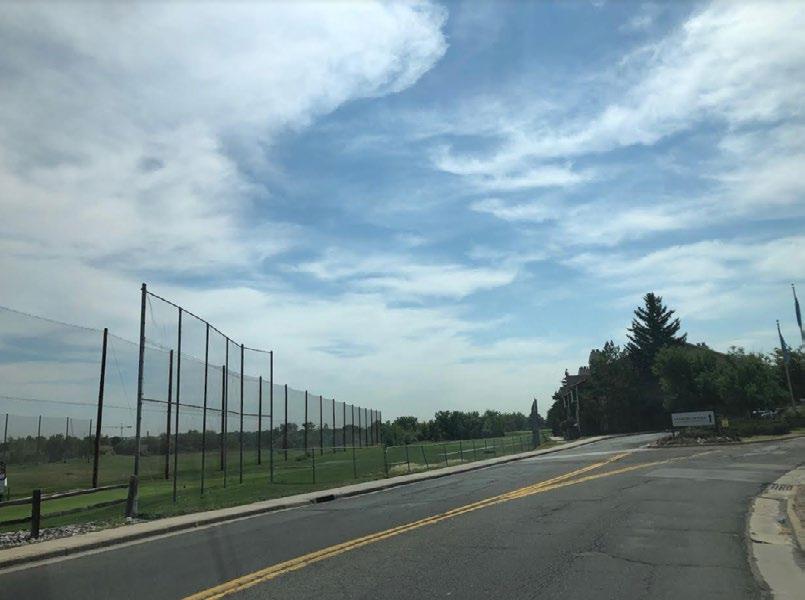
Strategic Priority: Infrastructure
The community depends on a well-maintained foundation of streets, sidewalks, and water, wastewater and stormwater facilities. Planned and steady population growth requires proper maintenance of existing infrastructure and additional capacity to support a thriving community.
Strategic Principle:
Provides the community with a safe, reliable, high-quality water supply, drainage system, and wastewater disposal services for full city build-out, as defined by the Comprehensive Plan. This includes maintaining utility rates at lowest practical levels with accurate billing that supports replacement of aging infrastructure in order to maintain robust utility systems.
is from the Water Fund water tap fees.
water treatment
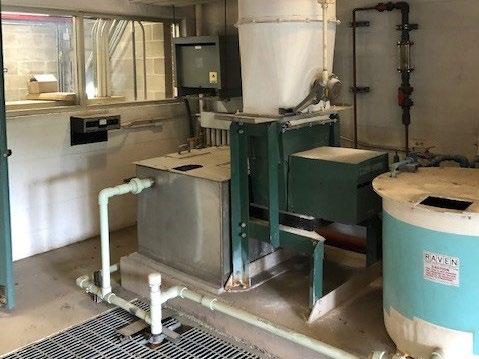
Strategic Priority: Infrastructure
Update and rehabilitate aging water treatment plant chemical feed systems. The original chemical building was built in 1962 and houses a number of out of service or obsolete chemical systems. Currently, the heating, ventilation, and air conditioning (HVAC) system is obsolete and the lavatories require updating. Individual chemical feed locations require backflow prevention and eyewash stations and water access are needed on all levels of the building.
pathogens.
consistent chemical feed,
aging systems are at risk of failure.
Strategic Principle:
community depends on a well-maintained
of streets, sidewalks, and water, wastewater and stormwater facilities. Planned and steady population growth requires proper maintenance of existing
additional capacity to support a thriving
Provides the community with a safe, reliable, high-quality water supply, drainage system, and wastewater disposal services for full city build-out, as defined by the Comprehensive Plan. This includes maintaining utility rates at lowest practical levels with accurate billing that supports replacement of aging infrastructure in order to maintain robust utility systems.
from the Water Fund.
Arvada
a financial partnership with Denver Water on the expansion of
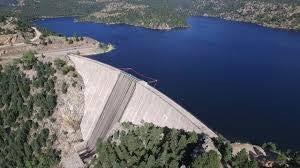
Arvada’s participation in the Moffat project will result in a water
needs of the City at full buildout.
Strategic Principle:
community depends on a well-maintained
requires proper maintenance of existing
capacity to support a
of
and steady population
sidewalks, and water, wastewater and stormwater
the community with a safe, reliable, high-quality water supply, drainage system, and wastewater disposal services for full city build-out, as defined by the Comprehensive Plan. This includes maintaining utility rates at lowest practical levels with accurate billing that supports replacement of aging infrastructure in order to maintain robust utility systems.
Denver Water
The water distribution master plan identified additional storage capacity needed for buildout. A storage master plan is currently planned to refine the analysis in 2022. This project contemplates an additional 3 MG of water storage for 2026-2027.
project
Strategic Priority: Infrastructure
The community depends on a well-maintained foundation of streets, sidewalks, and water, wastewater and stormwater facilities. Planned and steady population growth requires proper maintenance of existing infrastructure and additional capacity to support a thriving community.
Strategic Principle: Provides the community with a safe, reliable, high-quality water supply, drainage system, and wastewater disposal services for full city build-out, as defined by the Comprehensive Plan. This includes maintaining utility rates at lowest practical levels with accurate billing that supports replacement of aging infrastructure in order to maintain robust utility systems.
project will be funded by
operating cost

Strategic Priority: Infrastructure
community depends on a well-maintained foundation of streets, sidewalks, and water, wastewater and stormwater facilities. Planned and steady population growth requires proper maintenance of existing infrastructure and additional capacity to support a thriving community.
Strategic Principle:
the community with a safe, reliable, high-quality water supply, drainage system, and wastewater disposal services for full city build-out, as defined by the Comprehensive Plan. This includes maintaining utility rates at lowest practical levels with accurate billing that supports replacement of aging infrastructure in order to maintain robust utility systems.
Water Fund
Timeline Start Completion
The revised lead and copper rule requires water systems to conduct service line
corrosion studies, provide optimal corrosion control treatment and implement service line replacement
project
Strategic Priority: Infrastructure
The community depends on a well-maintained foundation of streets, sidewalks, and water, wastewater and stormwater facilities. Planned and steady population growth requires proper maintenance of existing infrastructure and additional capacity to support a thriving community.
Strategic Principle:
Provides the community with a safe, reliable, high-quality water supply, drainage system, and wastewater disposal services for full city build-out, as defined by the Comprehensive Plan. This includes maintaining utility rates at lowest practical levels with accurate billing that supports replacement of aging infrastructure in order to maintain robust utility systems.
Funding is from Water Fund water tap fees.
Total
Uses
The operating cost impact of
project is needed to serve growth and provide
This project connects the water system at Highway
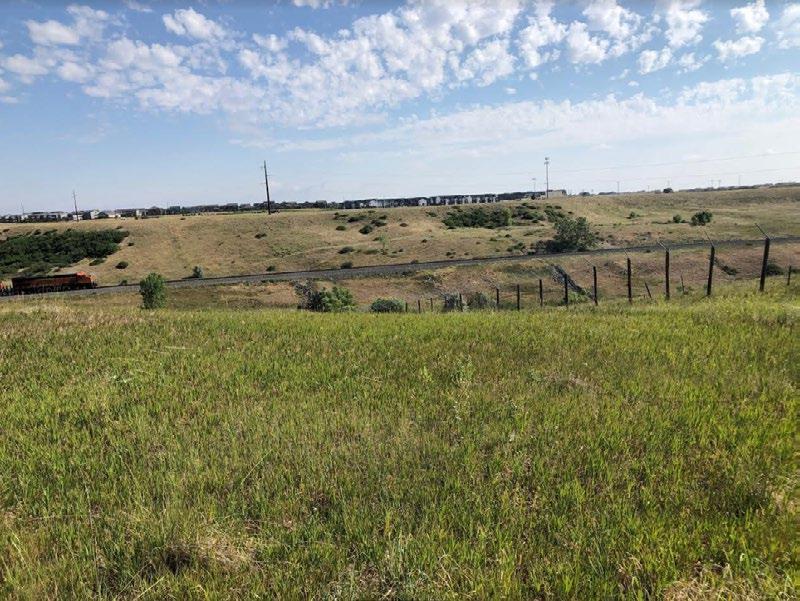
and Gore Street to the water system
Highway
and Gore Street - 2,400 feet of 18 inch pipeline, one railroad crossing,
crossing.
pumping operations on the west side of the City. It will provide additional fire protection to the northwest section of Arvada, including
Leyden Rock subdivisions. This project will enhance water system operations and eliminate the current labor intensive
and water turnover in this area.
Strategic Priority: Infrastructure
The community depends on a well-maintained foundation of streets, sidewalks, and water, wastewater and stormwater facilities. Planned and steady population growth requires proper maintenance of existing infrastructure and additional capacity to support a thriving community.
Strategic Principle:
Provides the community with a safe, reliable, high-quality water supply, drainage system, and wastewater disposal services for full city build-out, as defined by the Comprehensive Plan. This includes maintaining utility rates at lowest practical levels with accurate billing that supports replacement of aging infrastructure in order to maintain robust utility systems.
is from the Water Fund water tap fees.
operating
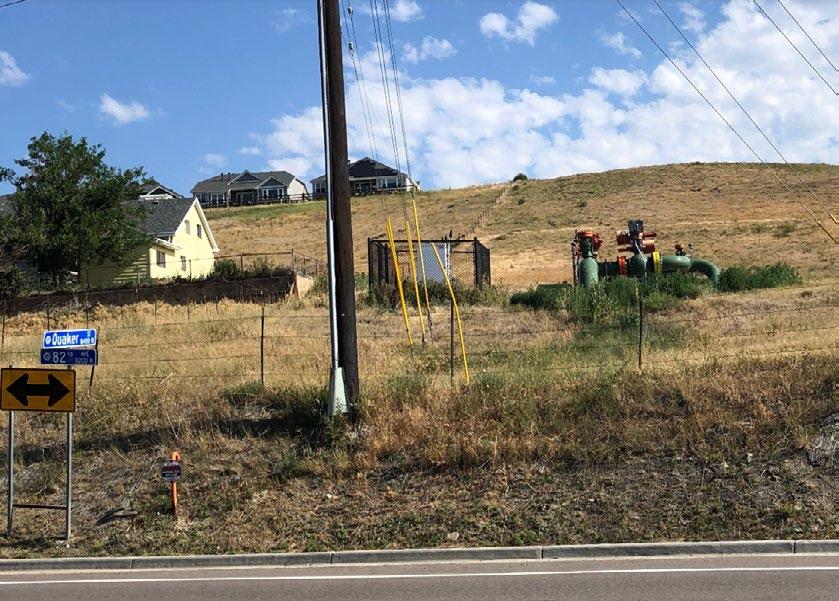
This project
replace existing 12 inch water pipeline with a 24 inch water pipeline
and Quaker Street north to Highway 72 - 3,600 feet of 24 inch pipeline and one railroad crossing.
Strategic Priority: Infrastructure
community depends on a well-maintained foundation of streets, sidewalks, and water, wastewater and stormwater facilities. Planned and steady population growth requires proper maintenance of existing infrastructure and additional capacity to support a thriving community.
Strategic Principle:
the community with a safe, reliable, high-quality water supply, drainage system, and wastewater disposal services for full city build-out, as defined by the Comprehensive Plan. This includes maintaining utility rates at lowest practical levels with accurate billing that supports replacement of aging infrastructure in order to maintain robust utility systems.
is from the Water Fund water
operating
The water distribution system requires additional water storage and pumping to meet current and future demands of planned development. These projects are required for planned development to continue on the current timeline.
projects is required for planned
Strategic Priority: Infrastructure
The community depends on a well-maintained foundation of streets, sidewalks, and water, wastewater and stormwater facilities. Planned and steady population growth requires proper maintenance of existing infrastructure and additional capacity to support a thriving community.
Strategic Principle:
Provides the community with a safe, reliable, high-quality water supply, drainage system, and wastewater disposal services for full city build-out, as defined by the Comprehensive Plan. This includes maintaining utility rates at lowest practical levels with accurate billing that supports replacement of aging infrastructure in order to maintain robust utility systems.
Partially funded by developer contributions and water bond issue.
Total
project
Uses
The operating cost impact of this project
currently
The water distribution system
additional water storage
pumping
meet
Strategic Priority: Infrastructure
The community depends on a well-maintained foundation of streets, sidewalks, and water, wastewater and stormwater facilities. Planned and steady population growth requires proper maintenance of existing infrastructure and additional capacity to support a thriving community.
Strategic Principle:
Provides the community with a safe, reliable, high-quality water supply, drainage system, and wastewater disposal services for full city build-out, as defined by the Comprehensive Plan. This includes maintaining utility rates at lowest practical levels with accurate billing that supports replacement of aging infrastructure in order to maintain robust utility systems.
is from
cost impact
project
be
twofold.
phase
Strategic Priority: Infrastructure
The community depends on a well-maintained foundation of streets, sidewalks, and water, wastewater and stormwater facilities. Planned and steady population growth requires proper maintenance of existing infrastructure and additional capacity to support a thriving
larger tank by 2030. After 2030, a second tank
Strategic Principle: Provides the community with a safe, reliable, high-quality water supply, drainage system, and wastewater disposal services for full city build-out, as defined by the Comprehensive Plan. This includes maintaining utility rates at lowest practical levels with accurate billing that supports replacement of aging infrastructure in order to maintain robust utility systems.
is from the Water Fund.
additional
design
are the heart of any water treatment plant. The existing filters at the Ralston
not been rehabilitated in over 25 years. Typical filter design life is 10 years. If not funded, the city risks not being able to meet regulatory requirements in the Safe Drinking Water Act. This project will also evaluate the potential to increase capacity in the existing filters and provide resiliency
serve growth in the city as contemplated in the comprehensive plan. This was identified as a high priority in the water treatment master plan.
Strategic Priority: Infrastructure
The community depends on a well-maintained foundation of streets, sidewalks, and water, wastewater and stormwater facilities. Planned and steady population growth requires proper maintenance of existing infrastructure and additional capacity to support a thriving community.
Strategic Principle:
Provides the community with a safe, reliable, high-quality water supply, drainage system, and wastewater disposal services for full city build-out, as defined by the Comprehensive Plan. This includes maintaining utility rates at lowest practical levels with accurate billing that supports replacement of aging infrastructure in order to maintain robust utility systems.
is from the Water Fund.
ongoing
Analysis of the current solids production rate from backwashing filters, characterization of solids produced, and analysis of alternatives for solids handling leading to the design and construction of the system improvements. The design will include recommendations to improve process efficiencies and to make the system more reliable and cost effective while maintaining the 36 MGD rated capacity.
City utilizes a total of four ponds: two ponds
filter backwash (with recycle)
two sludge ponds that process solids from the sedimentation basins. The ponds are undersized and leaking, causing operational
Additionally, planned filter improvements could result in increased flows to the solids handling system. As the city is growing, there
water treatment plant. The current facilities for water treatment plant residuals are at capacity. This project is critical in order
water to the public.
Strategic Priority: Infrastructure
community depends on a well-maintained foundation of streets, sidewalks, and water, wastewater and stormwater facilities. Planned and steady population growth requires proper maintenance of existing infrastructure and additional capacity to support a thriving community.
Strategic Principle:
Provides the community with a safe, reliable, high-quality water supply, drainage system, and wastewater disposal services for full city build-out, as defined by the Comprehensive Plan. This includes maintaining utility rates at lowest practical levels with accurate billing that supports replacement of aging infrastructure in order to maintain robust utility systems.
is from the Water Fund.
As part
Denver Water North Water Treatment Plant Project, the raw water pipelines
Ralston Reservoir to the Ralston Water Treatment Plant were recently replaced, which required the original raw water meter vault to be decommissioned. Construction of
new raw water master meter vault with six water meters is needed to support the new
provide required flow metering.
Strategic Priority: Infrastructure
community depends on a well-maintained foundation of streets, sidewalks, and water, wastewater and stormwater facilities. Planned and steady population growth requires proper maintenance of existing
capacity to support a thriving
Strategic Principle:
Provides the community with a safe, reliable, high-quality water supply, drainage system, and wastewater disposal services for full city build-out, as defined by the Comprehensive Plan. This includes maintaining utility rates at lowest practical levels with accurate billing that supports replacement of aging infrastructure in order to maintain robust utility systems.
is from the Water Fund water tap fees.
Project was recommended based on an assessment completed for the 54” TM alignment West of Indiana and adjacent to the new Ralston Ridge Development.
project would reduce
Strategic Priority: Infrastructure
The community depends on a well-maintained foundation of streets, sidewalks, and water, wastewater and stormwater facilities. Planned and steady population growth requires proper maintenance of existing infrastructure and additional capacity to support a thriving community.
Strategic Principle:
Provides the community with a safe, reliable, high-quality water supply, drainage system, and wastewater disposal services for full city build-out, as defined by the Comprehensive Plan. This includes maintaining utility rates at lowest practical levels with accurate billing that supports replacement of aging infrastructure in order to maintain robust utility systems.
Project funding is from Water Fund tap fees.
Total
is expected to be complete by 2025.
The operating cost impact of this project is currently unknown.
Upgrade water meters to smart water meters to gain efficiencies in meter reading and
billing.
efficiencies in meter reading
Strategic Priority: Infrastructure
The community depends on a well-maintained foundation of streets, sidewalks, and water, wastewater and stormwater facilities. Planned and steady population growth requires proper maintenance of existing infrastructure and additional capacity to support a thriving community.
Funded from customer water rates.
is fully funded and expected to be complete
Uses
There is no operating cost impact with this project.
Total
Strategic Principle:
Provides the community with a safe, reliable, high-quality water supply, drainage system, and wastewater disposal services for full city build-out, as defined by the Comprehensive Plan. This includes maintaining utility rates at lowest practical levels with accurate billing that supports replacement of aging infrastructure in order to maintain robust utility systems.
Total
Design
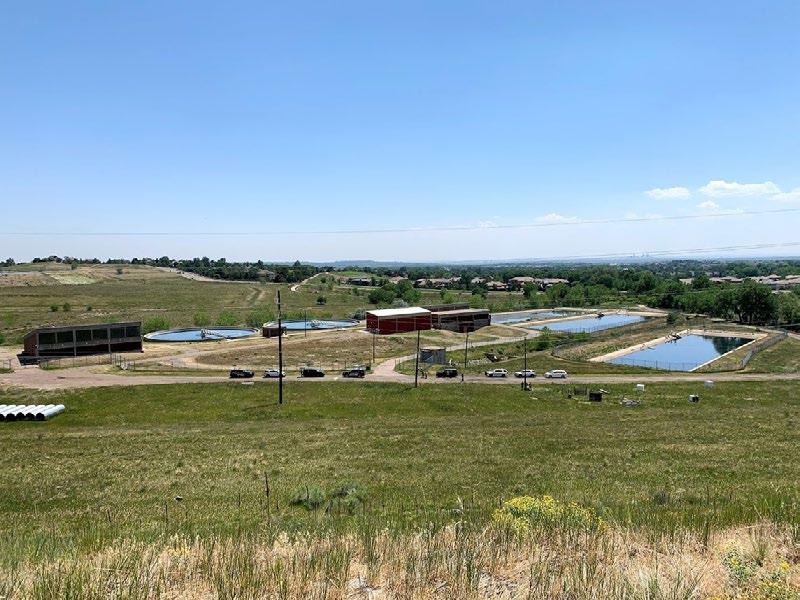
Conduct a
process evaluation to develop a cost model of options
treatment infrastructure and expanding treatment capacity. Facilitate
define the treatment facilities expansion plan, including an
identifies decision milestones.
serve growth and replace existing
City will either expand and rebuild existing plant, or build a new plant. This project will build
model
the best approach for increasing the total production capacity to
mgd
Strategic Priority: Infrastructure
The community depends on a well-maintained foundation of streets, sidewalks, and water, wastewater and stormwater facilities. Planned and steady population growth requires proper maintenance of existing infrastructure and additional capacity to support a thriving community.
Strategic Principle: Provides the community with a safe, reliable, high-quality water supply, drainage system, and wastewater disposal services for full city build-out, as defined by the Comprehensive Plan. This includes maintaining utility rates at lowest practical levels with accurate billing that supports replacement of aging infrastructure in order to maintain robust utility systems.
project is funded through the Water Fund.
no operating cost
Engineering design services will expand the City’s water treatment capacity by 12 MGD. Additional studies will determine the optimal location of the expansion, which is currently anticipated to be an additional 4 MGD at the Ralston Water Treatment Plant and an additional 8 MGD at the Arvada Water Treatment Plant.
Treatment Master Plan.
Strategic Priority: Infrastructure
The community depends on a well-maintained foundation of streets, sidewalks, and water, wastewater and stormwater facilities. Planned and steady population growth requires proper maintenance of existing infrastructure and additional capacity to support a thriving community.
Strategic Principle: Provides the community with a safe, reliable, high-quality water supply, drainage system, and wastewater disposal services for full city build-out, as defined by the Comprehensive Plan. This includes maintaining utility rates at lowest practical levels with accurate billing that supports replacement of aging infrastructure in order to maintain robust utility systems.
is from the Water Fund water
The Water Treatment Plant roof is leaking and while repairs were made, the asset requires eventual replacement.
replacement
Strategic Priority: Infrastructure
The community depends on a well-maintained foundation of streets, sidewalks, and water, wastewater and stormwater facilities. Planned and steady population growth requires proper maintenance of existing infrastructure and additional capacity to support a thriving community.
Strategic Principle:
Provides the community with a safe, reliable, high-quality water supply, drainage system, and wastewater disposal services for full city build-out, as defined by the Comprehensive Plan. This includes maintaining utility rates at lowest practical levels with accurate billing that supports replacement of aging infrastructure in order to maintain robust utility systems.
project is funded with
project
There is no operating cost impact with this project.
System
system master planning
Strategic Plan. The Water
completed in 2019. Routine
Strategic Priority: Infrastructure
community depends on a well-maintained foundation of streets, sidewalks, and water, wastewater and stormwater facilities. Planned and steady population growth requires proper maintenance of existing infrastructure and additional capacity to support a thriving community.
Strategic Principle:
the community with a safe, reliable, high-quality water supply, drainage system, and wastewater disposal services for full city build-out, as defined by the Comprehensive Plan. This includes maintaining utility rates at lowest practical levels with accurate billing that supports replacement of aging infrastructure in order to maintain robust utility systems.
Water
operating cost
water distribution system hydraulic model requires annual updates to reflect system
operational changes. This budget will be used to include those
model
scenario analysis.
how changes in the distribution system,
project based, will impact service throughout the system is fundamental
maintaining uninterrupted service
providing
used
Strategic Priority: Infrastructure
community depends on a well-maintained foundation of streets, sidewalks, and water, wastewater and stormwater facilities. Planned and steady population growth requires proper maintenance of existing infrastructure and additional capacity to support a thriving community.
model
also help evaluate the impact of changing water demands over time. The model
Strategic Principle:
the community with a safe, reliable, high-quality water supply, drainage system, and wastewater disposal services for full city build-out, as defined by the Comprehensive Plan. This includes maintaining utility rates at lowest practical levels with accurate billing that supports replacement of aging infrastructure in order to maintain robust utility systems.
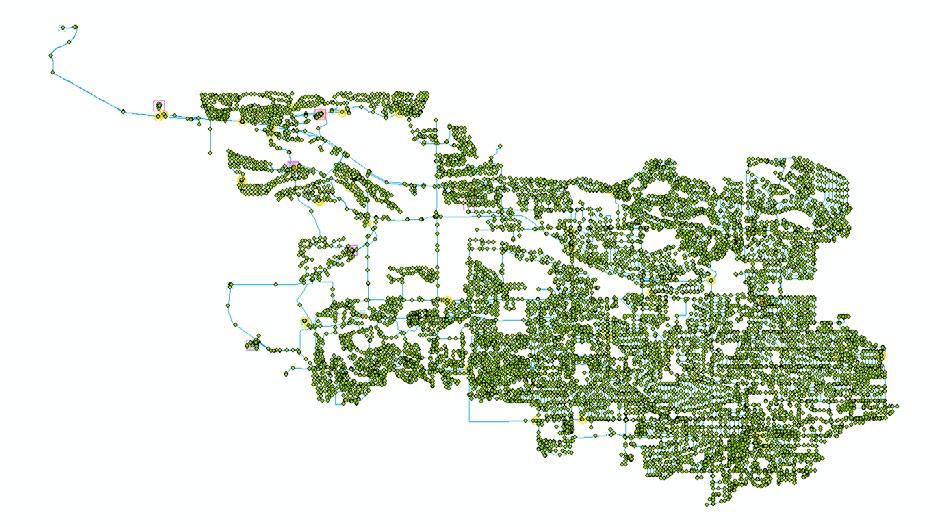
is from the Water Fund.
Updated Risk and Resiliency and Emergency Response Plans (RRA/ERP) are required by America’s Water Infrastructure Act (AWIA).
project
Strategic Priority: Infrastructure
The community depends on a well-maintained foundation of streets, sidewalks, and water, wastewater and stormwater facilities. Planned and steady population growth requires proper maintenance of existing infrastructure and additional capacity to support a thriving community.
Strategic Principle:
Provides the community with a safe, reliable, high-quality water supply, drainage system, and wastewater disposal services for full city build-out, as defined by the Comprehensive Plan. This includes maintaining utility rates at lowest practical levels with accurate billing that supports replacement of aging infrastructure in order to maintain robust utility systems.
project is funded
Total
Total
There is no operating cost impact
Strategic Priority: Infrastructure
community
on
well-maintained
and water, wastewater and stormwater
proper maintenance
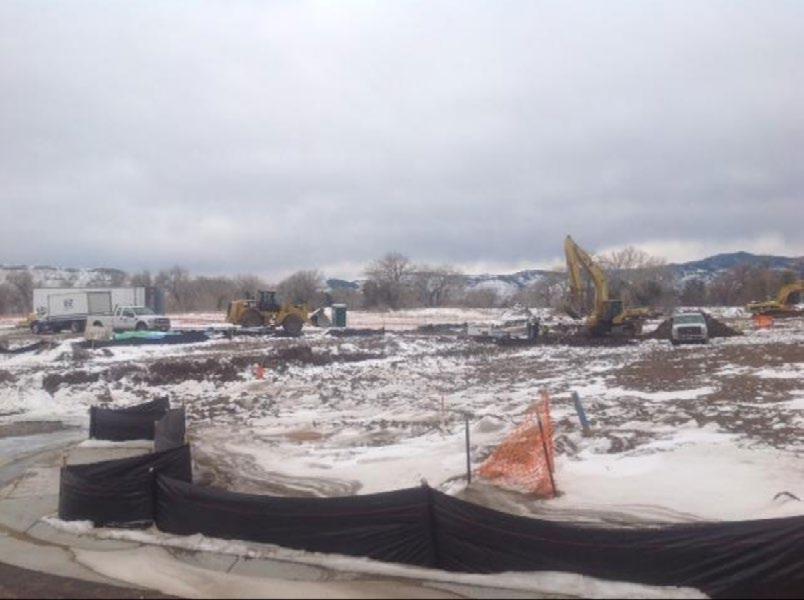
Strategic Principle:
the community with a safe, reliable, high-quality water supply, drainage system, and wastewater disposal services for full city build-out, as defined by the Comprehensive Plan. This includes maintaining utility rates at lowest practical levels with accurate billing that supports replacement of aging infrastructure in order to maintain robust utility systems.
the Water Fund water
Water Resources and raw water system master plan is needed to plan for future capacity and reinvestment needs for the system and supply portfolio. This plan compliments the recently completed Water Distribution Master Plan and Treatment Master Plans.
council included utilities system master
assets were not evaluated in the Water Treatment and Distribution System Master Plans.
for reinvestment and upgrades.
Strategic Priority: (blank)
community depends on a well-maintained foundation of streets, sidewalks, and water, wastewater and stormwater facilities. Planned and steady population growth requires proper maintenance of existing infrastructure and additional capacity to support a thriving community.
Strategic Principle: Provides the community with a safe, reliable, high-quality water supply, drainage system, and wastewater disposal services for full city build-out, as defined by the Comprehensive Plan. This includes maintaining utility rates at lowest practical levels with accurate billing that supports replacement of aging infrastructure in order to maintain robust utility systems.
is from the Water Fund tap fees.
operating cost
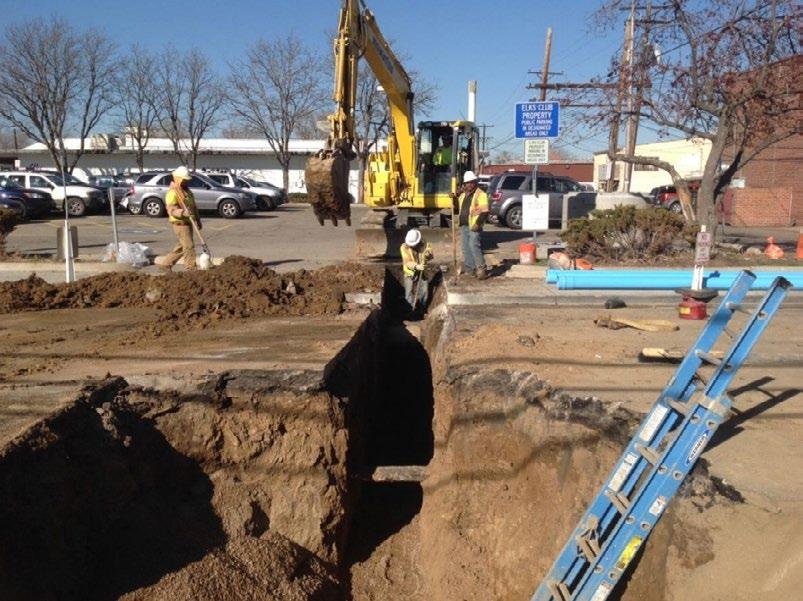
infrastructure installed prior to 1980 generally has a 50-year life cycle. As this part of the water system reaches the end of its life cycle, the infrastructure needs to be replaced. The pipeline replacement priority is based upon leak history, age, and other known factors about the condition of the pipeline. Another major component is meters, which generally have only a 20-year life cycle.
proactive main replacement
an expectation and responsibility to City of Arvada rate payers.
Strategic Priority: Infrastructure
community depends on a well-maintained foundation of streets, sidewalks, and water, wastewater and stormwater facilities. Planned and steady population growth requires proper maintenance of existing infrastructure and additional capacity to support a thriving community.
Strategic Principle: Provides the community with a safe, reliable, high-quality water supply, drainage system, and wastewater disposal services for full city build-out, as defined by the Comprehensive Plan. This includes maintaining utility rates at lowest practical levels with accurate billing that supports replacement of aging infrastructure in order to maintain robust utility systems.
Water Fund,
year
keep up with vendor costs and to grow the level of
Strategic Priority: Infrastructure
community depends on a well-maintained foundation of streets, sidewalks, and water, wastewater and stormwater facilities. Planned and steady population growth requires proper maintenance of existing
additional capacity to support a thriving
Strategic Principle:
the community with a safe, reliable, high-quality water supply, drainage system, and wastewater disposal services for full city build-out, as defined by the Comprehensive Plan. This includes maintaining utility rates at lowest practical levels with accurate billing that supports replacement of aging infrastructure in order to maintain robust utility systems.
water rates charged
Capital projects need a long lead time for planning, environmental studies, and cost evaluation . As a result, the City maintains a list of potential future projects . While these projects may be pursued in time, they have not been prioritized and are not a part of the current capital improvement plan .
General Administration $50,000
Post Office Master Plan 50,000
Transportation $340,655,256
Alkire St - W 86th Pkwy to W 88th Ave 700,000
Bicycle / Pedestrian Overpass at Alkire St. and Union Pacific Railroad 4,628,000
Bike Master Plan 59,560,000
Guardrails 580,000
Eldridge Street - W 64th Ave to Ralston Creek 3,000,000
Indiana Street Widening -W . 64th Ave . to W . 86th Pkwy 42,126,190
Kendrick Dr . Extension - W . 64th Ave . to Indiana St . 11,000,000
Leyden Parkway Improvements 8,000,000 Missing Sidewalks 25,000,000
Oberon Road Improvements 12,000,000
Quaker St Improvements - W 72nd Ave to Leyden Road 13,100,000
Traffic Calming 550,000
Traffic Signals 6,711,066
W 52 Ave trail/sidewalk 2,500,000
W 72nd Ave Improvements - Indiana St to McIntyre St 6,000,000
W 72nd Ave Improvements - Simms St to Indiana St 33,000,000
W . 72nd Ave . Spot Widening 800,000
W . 80th Ave . Improvements - Kipling St . to Simms St . 13,100,000
W 80th Ave Improvements - Simms St to Alkire St 13,100,000
W . 80th Avenue UP Railroad Grade Separation 8,100,000
Ward Rd Extension - Double E Ranch Frontage 1,000,000
Ward Rd Extension - W 72nd Ave to W 86th Pkwy 4-lane section 36,600,000
Ward Road Extension - W 72nd Ave to W 80th Ave (Two Lane Section) 15,000,000
Ward Road Improvements - W . 64th Ave . to W . 72nd Ave . 24,500,000
Parks $101,899,000
Arvada Blunn Reservoir 1,075,000
Churches Ranch National Historic District 1,710,000
Double E Park/ Ph2 325,000
Gibbs West Community Park 28,912,000
Hyatt Lake Park Preserve Acquisition 3,620,000
Indiana Equestrian Center Completion 785,000
Leyden Lake Open Space and Trails 3,340,000
Majestic View Facility Expansion 7,927,000
Moore Brothers Farm and Agricultural Center 1,525,000
Pioneer Park 355,000
Quaker Acres Park Expansion 450,000
Spring Mesa Open Space Acquisitions and Trail Extensions 800,000
The Hills at Standley Lake Park Completion 725,000
Trail Gaps 50,000,000
Wadsworth Median TBD
Welton Reservoir Trail 350,000
Golf $1,599,691
Lake Arbor Chipping Green 28,500
Lake Arbor Tree and Fencing Plan 296,191
Lake Arbor USGA Recommended Renovation 550,000
Lake Arbor/West Woods Cart Path Repairs 175,000
West Woods North Practice Facility Remodel 50,000
West Woods Silo Course Additions and Improvements 500,000
Stormwater
$95,388,300
Leyden Creek 22,110,638
Yankee Doodle Drainage Way 10,302,863
Moon Gulch 5,093,550
Clear Creek 5,788,125
Bates/Hidden Lake 9,839,813
Independence Street Outfall 3,472,875
Estes Street Outfall 2,894,063
Trail/Creek Separation 1,736,438
Van Gordon/Hyatt Drainage Way 9,839,813
Simms Street Outfall 2,778,300
Allison Street Outfall 6,482,700
Downtown W . 56th Avenue Outfall 810,338
Pierce Street Outfall 2,894,063
Sheridan Avenue Outfall 1,736,438
Yarrow Street Outfall 926,100
Miller Street Outfall 1,736,438
Sheridan Bridge Replacement 3,472,875 Misc Stormwater projects 3,472,875
Water $278,763,350
Continued System Planning (new project name) 1,050,000
Distribution System Storage Pumping/Pipe Expansion 12,600,000
Distribution System Storage Replacement 3,138,350
Ralston Plant Storage Tank Expansion 33,600,000
Treatment facilities expansion/replacement - pre-design & design 19,425,000
Treatment facilities expansion/replacement - construction 137,550,000
Water Treatment Plant Repair and Maintenance (annual program) 2,625,000 Water System Replacement Program (waterlines replaced at 2% replacement/year) 47,250,000
Future Water Storage Reservoir 21,525,000 Waste Water $26,197,500
North Trunk Sewer Improvements 21,183,750
Central/Ralston Trunk Sewer Improvements 4,646,250 Continued System Planning 367,500
Total Unfunded Projects $844,553,097
Intentionally left blank
Payments on all of the City of Arvada’s long–term obligations are included in debt service . This includes revenue bonds and lease purchase agreements . Additionally, the City has a number of lease-purchase agreements for equipment, however, such payments are handled through operating budgets, because the amounts are small and do not adversely affect operating budgets.
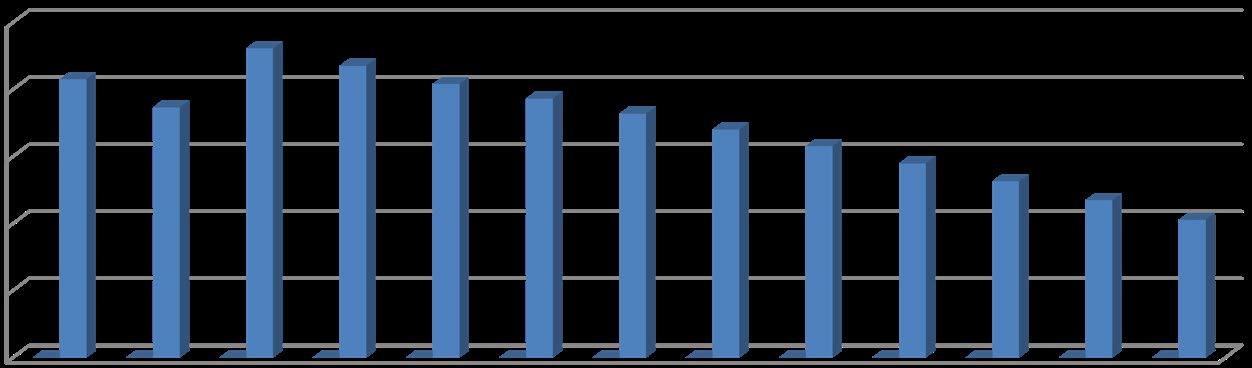
General obligation debt is a direct obligation which pledges the full faith and credit of the government . The Colorado Revised Statutes provides that general obligation indebtedness for all purposes shall not at any time exceed 3 percent (3%) of actual value, as determined by the County Assessor, of the tax able property in the City As of December 31, 20202 the City has no general obligation debt outstanding and does not intend to issue any general obligation debt at this time . The City’s debt is within the legal debt limit as demonstrated by the table below:
Legal Debt Limit
Actual Value
Debt Limit: 3 percent of Actual Value
Amount of General Obligation Debt
$22,804,052,971
$684,121,589
$0
In 2018, the City retired the 1998 Sales and Use Tax Bonds A ballot question for the reissuance of bonds was voted on and approved in November 2018 The City issued $70,825,000 of Sales and Use Tax Bonds in February 2019 for two transportation capital improvement projects
Certificates of Participation (COPs) are a lease-financing mechanism where the City enters into an agreement to make regular lease payments for the use of an asset over a period of time, after which the title of the assets transfers to the government Since the government can decide, at any time, to discontinue the lease, COPs do not constitute a multi-year fiscal obligation and can be issued without voter approval. While COPs are not technically debt, they are included in this graph to show the City’s total governmental financial obligations. Total debt in 2022 is $92,200,000 which decreases to $41,052,108 in 2032.
Certificates of Participation
$60,000,000
$40,000,000
$20,000,000
The City retired its only Enterprise bonds in 2020. However, a portion of the 2015 Certificates of Par ticipation were used to finance projects in the Stormwater Fund. The Stormwater Fund transfers twothirds of the annual debt service payment of the 2015 Certificates of Participation to the COP Debt Service Fund. In addition, approximately half of the proceeds from the 2016 Certificates of Participation were used to fund the expansion of the West Woods Golf Clubhouse The Golf Course Fund transfers approximately half of the debt service payment of the 2016 Certificates of Participation to the COP Debt Service Fund .
The City’s Sales and Use Tax Revenue Bond rating with Fitch Ratings is AAA, the very highest rating
The rating was assigned in January 2019 when the City issued bonds to fund two transportation capital improvement projects . Key rating drivers from Fitch’s rating report include:
• Revenue growth prospects are strong, continuing a historical trend in line with U .S . GDP
• The city's predominant use of pay-go for capital improvements and the absence of a net pension liability have resulted in low fixed costs
• Strong financial management practices support financial flexibility through economic cycles
• Pledged revenues provide ample debt service cushion to handily withstand a moderate economic decline scenario
The Fitch bond rating is a credit score that describes the general credit worthiness of a company, city or county that issues debt Fitch rates how likely debt will be repaid from the entity in question
AAA City of Arvada
AA
A
BBB
BB
B
CCC
CC
C
Highest credit quality – Exceptionally strong capacity for repayment
Very high credit quality - Very strong capacity for repayment
High credit quality – Repayment capacity more vulnerable to adverse business conditions
Good credit quality – Adverse business conditions more likely to im pair repayment capacity
Speculative - Elevated vulnerability to credit risk
Highly speculative – Material default risk is present
Substantial credit risk - Default is a possibility
Very high levels of credit risk - Default of some kind appears probable
Near default – A default or default like process has begun
D Default
The following table shows bond ratings from other cities in Colorado .
Arvada
Aurora
AAA
Fort Collins
Golden
-
Lakewood - -
Northglenn
Thornton
Westminster
-
*Assumed issuer credit rating based off of one notch higher than COP rating
The City issued Sales and Use Tax Bonds in the amount of $70,825,000 . The bonds were issued for the purpose of funding two capital improvement projects, widening an underpass at Union Pacific Rail road crossing on West 72nd Avenue between Kipling Street and Simms Street and improvements on Ralston Road between Yukon Street and Garrison Street . The bonds carry interest rates from 3% to 5% payable semi-annually June 1 and December 1 and principal due annually to December 31, 2028 .
$63,335,000
2023 2,750,000 2,610,781 5,360,781 60,585,000 2024 2,885,000 2,473,281 5,358,281 57,700,000 2025 3,030,000 2,329,031 5,359,031 54,670,000
2026 3,180,000 2,177,531 5,357,531 51,490,000
2027 3,340,000 2,018,531 5,358,531 48,150,000
2028 3,510,000 1,851,531 5,361,531 44,640,000
2029 3,685,000 1,676,031 5,361,031 40,955,000 2030 3,865,000 1,491,781 5,356,781 37,090,000
2031 4,060,000 1,298,531 5,358,531 33,030,000
4,265,000 1,095,531 5,360,531 28,765,000
4,435,000 924,931 5,359,931 24,330,000
4,565,000 791,881 5,356,881 19,765,000
4,710,000 649,225 5,359,225 15,055,000
4,855,000 502,038 5,357,038 10,200,000
5,015,000 344,250 5,359,250 5,185,000
5,185,000 174,994 5,359,994 0
The City issued certificates of participation in the amount of $7,880,000 to advance refund a portion of the Series 2005 Certificates of Participation, resulting in a deferred loss on the refunding of $444,000. The certificates of participation carry an interest rate of 1.78% payable semi-annually June 1 and December 1 and principal due annually to December 1, 2024
Year Principal Interest
Total Payment Principal Balance
$2,520,000
1,294,856 1,270,000
1,292,606 0
$2,587,462
The City issued certificates of participation in the amount of $11,180,000 for the purpose of funding two capital improvement projects, reconstruction and widening of West 72nd Avenue and Indiana Street and to expand the West Woods Golf Clubhouse. The certificates of participation carry an interest rate of 4% payable June 1 and December 1 and principal due annually to December 31, 2036
Year Principal Interest
Total Payment Principal Balance
$8,740,000
465,000 364,300 829,300 8,275,000
490,000
515,000
831,050 7,785,000
831,550 7,270,000
6,730,000
6,170,000
5,585,000
4,980,000
4,350,000
3,695,000
3,015,000
2,305,000
1,565,000
The City and Jefferson County School District issued certificates of participation in the amount of $35,210,000 for the purpose of funding the replacement of the Meyers Pool complex with a 50 meter pool. The City and School District are each responsible for ½ of the Certificates of Participation, the City’s portion is $17,605,000. The certificates of participation carry an interest rate of 2.25%. Interest and principle payments are due June 15 and December 15 .
2022 $17,605,000
2023 751,922 391,907 1,143,828 16,853,078 2024 768,935 374,893 1,143,828 16,084,144 2025 786,333 357,495 1,143,828 15,297,810
2026 804,125 339,703 1,143,828 14,493,685
2027 822,320 321,508 1,143,828 13,671,365
2028 840,926 302,902 1,143,828 12,830,439
2029 859,953 283,875 1,143,828 11,970,486 2030 879,411 264,417 1,143,828 11,091,074
2031 899,309 244,519 1,143,828 10,191,765
2032 919,658 224,171 1,143,828 9,272,108
940,466 203,362 1,143,828 8,331,641
961,746 182,082 1,143,828 7,369,896 2035 983,507 160,321 1,143,828 6,386,389
1,005,760 138,068 1,143,828 5,380,629
1,028,517 115,311 1,143,828 4,352,112
1,051,789 92,039 1,143,828 3,300,323
1,075,587 68,241 1,143,828 2,224,736
1,099,924 43,904 1,143,828 1,124,812
1,124,812
1,156,812 0
01 General Fund New Community and Economic Development
Community and Economic Development
(+) Senior Economic Development Specialist New
01 General Fund New Infrastructure Public Works (+) Public Works Project Manager New
01 General Fund New Infrastructure Public Works (+) Custodian (2) New
01 General Fund New Infrastructure Public Works (+) Civil Engineer II New
01 General Fund New Infrastructure Public Works (+) Traffic Engineer IV New
01 General Fund New Organizational and Service Effectiveness
01 General Fund New Organizational and Service Effectiveness
01 General Fund New Organizational and Service Effectiveness
01 General Fund New Organizational and Service Effectiveness
01 General Fund New Organizational and Service Effectiveness
City Manager's Office
(+) Senior Sustainability Coordinator New
Finance (+) Payroll Specialist New
Human Resources (+) HR Coordinator New
Human Resources (+) Executive Assistant New
IT (+) Chief Information Security Officer New
01 General Fund New Safe Community Municipal Court (+) Senior Probation Officer New
01 General Fund New Vibrant Community and Neighborhoods Housing (+) Housing Development and Navigation Supervisor
New
04 Street Fund New Infrastructure Public Works (+) Municipal Inspector II New
04 Street Fund New Infrastructure Public Works (+) Pavement Manage ment Coordinator New
14 Parks Golf & Hospitality
14 Parks Golf & Hospitality
New Vibrant Community and Neighborhoods Parks Golf and Hospital ity Services
New Vibrant Community and Neighborhoods Parks Golf and Hospitality Services
(+) Parks Supervisor New
(+) Parks Maintenance Leadworker New
14 Parks Golf & Hospitality
14 Parks Golf & Hospitality
New Vibrant Community and Neighborhoods
New Vibrant Community and Neighborhoods
Parks Golf and Hospital ity Services
Parks Golf and Hospital ity Services
(+) Parks Worker II (6) New
(+) Parks Field Programmer New
21 Tax Initia tive Fund New Safe Community Public Safety (+) Behavioral Health Clinician I New
21 Tax Initia tive Fund New Safe Community Public Safety (+) Behavioral Health Clinician II New
22 Tax Initia tive Fund New Safe Community Public Safety (+) Police Sergeant (2) New
41 Water Fund New Infrastructure Public Works (+) Civil Engineer II (2) New
41 Water Fund New Infrastructure Public Works (+) Civil Engineer III New
41 Water Fund New Infrastructure Utilities (+) Utility Foreman New
41 Water Fund New Infrastructure Utilities (+) Electro Mechanical Technician New
41 Water Fund New Infrastructure Utilities (+) OT/ITCS Security Operations Analyst New
42 Wastewa ter Fund New Infrastructure Public Works (+) Civil Engineer II New
42 Wastewater Fund New Infrastructure Public Works (+) Civil Engineer III (2) New
51 Insurance Fund New Organizational and Service Effectiveness
01 General Fund Title Organizational and Service Effectiveness
01 General Fund Title Organizational and Service Effectiveness
01 General Fund Title Organizational and Service Effectiveness
01 General Fund Title Organizational and Service Effectiveness
01 General Fund Title Organizational and Service Effectiveness
City Attor ney's Office (+) Safety Specialist New
City Attor ney's Office (+) Risk and Claims Analyst (-) Claims Specialist
City Manag er's Office (+) Digital Content Producer (-) Multi-Media Technician
Finance (+) Deputy Director of Finance (-) Assistant Finance Director
Human Resources (+) Senior Organizational Development Manager
(-) Organizational Development Manager
IT (+) Senior Systems Adminstrator (-) Senior Network Systems Adminstrator
01 General Fund ReClass Community and Economic Development
01 General Fund ReClass Community and Economic Development
01 General Fund ReClass Community and Economic Development
Community and Eco nomic Devel opment
Community and Eco nomic Development
Community and Eco nomic Devel opment
(+) Development Technician I (2) (-) Administrative Specialist (2)
(+) Development Techni cian II (2) (-) Administrative Specialist (2)
(+) Planner I (-) Planning Technician
01 General Fund ReClass Infrastructure Public Works (+) Assistant Building Manager (-) Public Works Project Manager
01 General Fund ReClass Infrastructure Public Works (+) Engineering Technician II (-) Administrator Coordinator
01 General Fund ReClass Infrastructure Public Works (+) Engineering Technician I (-) Administrator Coordinator
01 General Fund ReClass Infrastructure Public Works (+) Traffic Field Operations Supervisor (-) Traffic Crew Foreman
01 General Fund ReClass Infrastructure Public Works (+) Traffic Engineeri III (-) Traffic Field Operations Su pervisor
01 General Fund ReClass Infrastructure Public Works (+) Manager of Traffic Operations and Maintenance
01 General Fund ReClass Organizational and Service Effectiveness
01 General Fund ReClass Organizational and Service Effectiveness
01 General Fund ReClass Organizational and Service Effectiveness
01 General Fund ReClass Organizational and Service Effectiveness
01 General Fund ReClass Organizational and Service Effectiveness
01 General Fund ReClass Organizational and Service Effectiveness
City Attorney's Office
City Attorney's Office
City Manager's Office
City Manager's Office
City Manager's Office
(-) Traffic Engi neer III
(+) Assistant City Attorney II (4) (-) Assistant City Attorney I (4)
(+) Assistant City Attorney I (6) (-) Assistant City Attorney (6)
(+) Associate Data Scientist (-) Administrative Analyst
(+) Administrative Supervisor (-) Executive Assistant
(+) Strategic Planning and Performance Alignment Manager
(-) Innovation and Performance Manager
Finance (+) Budget Analyst (-) Business Analyst
01 General Fund ReClass Organizational and Service Effectiveness
01 General Fund ReClass Organizational and Service Effectiveness
01 General Fund ReClass Organizational and Service Effectiveness
01 General Fund ReClass Organizational and Service Effectiveness
01 General Fund ReClass Organizational and Service Effectiveness
01 General Fund ReClass Organizational and Service Effectiveness
01 General Fund ReClass Organizational and Service Effectiveness
01 General Fund ReClass Organizational and Service Effectiveness
01 General Fund ReClass Organizational and Service Effectiveness
01 General Fund ReClass Organizational and Service Effectiveness
01 General Fund ReClass Organizational and Service Effectiveness
Finance (+) Accountant (-) Accounting Supervisor
Finance (+) Payroll Supervisor (-) Payroll Administrator
Finance (+) Accounting Technician III (-) Accounting Technician II
Finance (+) Compliance Agent (-) Revenue Technician
Finance (+) Finance Program Coordinator (-) Executive Assistant
Human Resources (+) HR Technician (-) HR Coordinator
Human Resources (+) HR Coordinator (-) Administra tive Coordinator
Human Resources (+) Employment Specialist (-) Deputy Di rector of Human Resources
Human Resources (+) Senior Compensation Analyst (-) Compensa tion Analyst
Human Resources (+) Senior HR Busi ness Partner (-) HR Business Partner
IT (+) Web Systems Administrator (-) Web Architect
01 General Fund ReClass Safe Community Public Safety (+) Police Digital Records Technician (-) Police Re cords Specialist
01 General Fund ReClass Safe Community Public Safety (+) Police Accreditation Analyst (-) Police Accreditation Coordinator
14 Parks Golf & Hospitality
ReClass Vibrant Community and Neighborhoods
Parks Golf and Hospitality Services
Manager of Communications-VCN (-) Executive Assistant
21 Tax Initiative Fund ReClass Safe Community Public Safety (+) Lead Police Records Specialist (-) Police Records Specialist
41 Water Fund ReClass Infrastructure Utilities (+) Analytics and Business Intelligence Developer
(-) GIS Analsyt
41 Water Fund ReClass Infrastructure Utilities (+) Data & Analytic Manager (-) GIS Analsyt
41 Water Fund ReClass Infrastructure Utilities (+) Chief Plant Operator (-) Plant Operator A
41 Water Fund ReClass Infrastructure Utilities (+) Utility System Technician-Associate Level (9)
41 Water Fund ReClass Infrastructure Utilities (+) Utility System Technician-Senior Level (8)
(-) Utility System Technician (9)
(-) Utility System Technician (8)
42 Wastewa ter Fund ReClass Infrastructure Utilities (+) Utility Foreman (-) Utility System Technician-As sociate Level
42 Wastewater Fund ReClass Infrastructure Utilities (+) Utility System Technician-Associate Level (5)
42 Wastewa ter Fund ReClass Infrastructure Utilities (+) Utility System Technician-Senior Level (5)
(-) Utility System Technician (5)
(-) Utility System Technician (5)
44 Stormwater Fund ReClass Infrastructure Public Works (+) Engineering Manager (-) Senior Utilities Design Engineer
44 Stormwa ter Fund ReClass Infrastructure Utilities (+) Utility System Technician-Journey Level
44 Stormwater Fund ReClass Infrastructure Utilities (+) Utility System Technician-Senior Level
(-) Utility System Technician
(-) Utility System Technician
Risk
Claims
Safety
.00
1
.00
.00
Attorney
Administrative
City
.00
.00
2022 Actual 2023 Budget 2024 Budget
Senior
Administrative Specialist
Application System Administrator
Associate Data Scientist
Associate Technical Support Analyst
Chief Information Officer
Chief Information Security Officer
Cloud Systems Administrator
Community Connectivity Manager
IT Business Analyst
IT Infrastructure Architect
IT Security Specialist
Mobile Network Systems Administrator
Network Systems Administrator
Security Operations Analyst
Senior Applications Systems Administrator
Senior Database Administrator
Senior IT Project Manager
Senior Network Engineer
Senior Network Systems Administrator
Senior SQL Data Analyst/Developer
Service Desk Manager
Services Technician
Software Developer
Technical Support Analyst
Technical Systems Project Manager
Technology and Project Services Manager
Technology Infrastructure and Operations Manager
Web Architect
Web Systems Administrator
General Fund
00 1 00 1 00 1 00
.00 3 .00 3 .00 3 .00
.00 0 .00 1 .00 1 .00
00 1 00 1 00 1 00
00 1 00 1 00 1 00
00 0 00 1 00 1 00
.00 1 .00 1 .00 1 .00
00 0 00 0 00 0 00
00 1 00 1 00 1 00
00 1 00 1 00 1 00
.00 0 .00 0 .00 0 .00
.00 2 .00 2 .00 2 .00
00 1 00 1 00 1 00
00 2 00 2 00 2 00
.00 0 .00 0 .00 0 .00
.00 1 .00 1 .00 1 .00
00 2 00 2 00 2 00
00 1 00 1 00 1 00
00 1 00 1 00 1 00
.00 1 .00 1 .00 1 .00
.00 1 .00 1 .00 1 .00
00 0 00 0 00 0 00
00 1 00 1 00 1 00
.00 2 .00 2 .00 2 .00
.00 0 .00 0 .00 0 .00
00 1 00 1 00 1 00
00 1 00 1 00 1 00
00 1 00 0 00 0 00
.00 1 .00 2 .00 2 .00
28.00 30.00 30.00
Homeless Navigator
Housing Navigator
Housing Rehabilitation / Loan Specialist
Housing Services Specialist
Total Community Development Fund Positions
Administrative Specialist
Housing Choice Voucher Program Supervisor
Housing Services Specialist
Housing Specialist
Total Arvada Housing Authority Positions
Administrative Coordinator
City Forester
Computerized Irrigation Supervisor
Computerized Irrigation System Administrator
Director of Vibrant Community and Neighborhoods
Executive Assistant
Forestry Technician
Irrigation Crew Supervisor
Irrigation Maintenance Leadworker
Irrigation Maintenance Worker
Manager of Communications VCN
Municipal Services Worker
Nature Center Director
Parks and Urban Design Manager
Parks Field Programmer
Parks Maintenance Leadworker
Parks Manager
Parks Program Manager
Parks Supervisor
Parks Worker II
Senior Landscape Architect
Special Events Coordinator
Total Parks Fund Positions
.00 1 .00 1 .00 1 .00
00 1 00 1 00 1 00
00 1 00 1 00 1 00
92 1 00 0 00 0 00
4.50 4.50 4.50
50 0 50 0 50 0 50
00 1 00 1 00 1 00
.08 0 .00 0 .00 0 .00
.00 2 .00 2 .00 2 .00
3.50 3.50 3.50
1 00 1 00 1 00 1 00
.00 1 .00 1 .00 1 .00
00 1 00 1 00 1 00
00 1 00 1 00 1 00
00 1 00 1 00 1 00
.00 1 .00 0 .00 0 .00
.00 3 .00 3 .00 3 .00
00 1 00 1 00 1 00
00 1 00 1 00 1 00
.00 4 .00 0 .00 0 .00
.00 0 .00 1 .00 1 .00
00 1 00 1 00 1 00
00 1 00 1 00 1 00
00 1 00 1 00 1 00
.00 0 .00 1 .00 1 .00
.00 6 .00 7 .00 7 .00
00 1 00 1 00 1 00
00 1 00 1 00 1 00
.00 5 .00 6 .00 6 .00
.00 19 .00 29 .00 29 .00
00 2 00 2 00 2 00
00 1 00 1 00 1 00
53.00 62.00 62.00
Center
Nature Center
Assistant Golf Manager
Assistant Golf Professional
Assistant Restaurant Manager
Business Development Coordinator
Business Development Manager
Chef
Food and Beverage Manager
Golf Course Computerized Irrigation Technician
00 1 00
.00
.00
.00
.00
30 0 00
15 0 00
.45 0 .00
00 1 00
.00 2 .00
.00 0 .00
00
00
00 0 00
.00
.00
.00 1 .00 1 .00 1 .00
00 2 00 2 00 2 00
Golf Course Equipment Specialist
00 3 00 3 00 3 00
00 2 00 2 00 2 00 Golf Course Maintenance Worker
Golf Course Manager
Golf Professional
00 2 00 2 00 2 00
.00 1 .00 1 .00 1 .00 Golf Course Superintendent
00 2 00 2 00 2 00
Manager of Golf Course Operations
Sales Coordinator
Sous Chef / Kitchen Manager
Total Golf Course Fund
Assistant Banquet Manager
Business Development Coordinator
Development Manager
Chef
Services Manager
Services Supervisor
Service
.00 3 .00 4 .00 4 .00
00 1 00 1 00 1 00 Restaurant Manager
.00 1 .00 1 .00 1 .00
00 1 00 1 00 1 00
23.00 23.00 23.00
Administrative Coordinator
Animal Management Officer
Chief of Police
Code Compliance Officer
Crime Analyst
Criminalist
CSI Technician
Deputy Police Chief
Evidence Supervisor
Evidence Technician
Executive Assistant
Lead Crime Analyst
Liquor Licensing Control Administrator
Master Police Officer
Patrol Investigative Specialist
Police Accreditation Coordinator
Police Accreditation Analyst
Police Administrative Assistant
Police Commander
Police Digital Media Technician
Police Digital Records Technician
Police Equipment Coordinator
Police Lieutenant
Police Officer
Police Records Specialist
Police Recruiter
Police Sergeant
Police Services Technician
Training Coordinator
General Fund Positions
Animal Management Officer
Behvioral Health Clinician I
Behvioral Health Clinician II
Code Compliance Officer
Crime Analyst
Evidence Technician
00 1 00 1 00 1 00
.00 4 .00 4 .00 4 .00
00 1 00 1 00 1 00
00 4 00 4 00 4 00
00 2 00 2 00 2 00
.00 1 .00 1 .00 1 .00
.00 1 .00 1 .00 1 .00
00 2 00 2 00 2 00
00 1 00 1 00 1 00
.00 2 .00 2 .00 2 .00
.00 1 .00 1 .00 1 .00
00 1 00 1 00 1 00
00 1 00 1 00 1 00
00 9 00 9 00 9 00
.00 1 .00 1 .00 1 .00
00 1 00 0 00 0 00
00 0 00 1 00 1 00
00 0 00 0 00 0 00
.00 5 .00 5 .00 5 .00
.00 2 .00 2 .00 2 .00
00 0 00 2 00 2 00
00 1 00 1 00 1 00
00 4 00 4 00 4 00
.00 92 .00 92 .00 92 .00
00 10 00 8 00 8 00
00 1 00 1 00 1 00
00 17 00 17 00 17 00
.00 4 .00 4 .00 4 .00
.00 1 .00 1 .00 1 .00
170.00 170.00 170.00
.00 1 .00 1 .00 1 .00
.00 0 .00 1 .00 1 .00
00 0 00 1 00 1 00
00 1 00 1 00 1 00
00 1 00 1 00 1 00
.00 1 .00 1 .00 1 .00
Financial Business Analyst
Lead Police Records Specialist
Master Police Officer
Data Specialist
Police Civilian Operations Manager
Commander
Lieutenant
Officer
Records Specialist
Sergeant
Services Technician
Supervisor
Tax Initiative
Animal Management Officer
Master Police Officer
Civilian Operations Manager
Police Lieutenant
Officer
Records Specialist
Sergeant
Tax Initiative
Fund Positions
Fund Positions
Total Public Safety Positions
ADA Coordinator
Actual 2022 Actual 2023 Budget 2024 Budget
00
00 1 00
.00
.00
00
.00 1 .00 1 .00
.00
.00 1 .00
1 00 1 00 1 00
00 2 00 2 00
00 2 00 2 00 2 00
.00
.00
.00 1 .00
00 20 00 20 00 20 00
00
00
00 1 00 1 00
00
.00 3 .00
.00
.00
00 1 00
.00 3 .00
.00
.00
40.00 40.00
00 1 00 1 00 1 00
00 2 00 2 00 2 00
.00 1 .00 1 .00 1 .00
.00 1 .00 1 .00 1 .00
00 31 00 31 00 31 00
00
00
00 0 00 0 00
00
00 6 00
42.00 42.00
Actual 2022 Actual 2023 Budget 2024 Budget
.00
.00 1 .00
1
Building Manager
City Engineer
Building Craftsworker
Maintenance
Maintenance
Surveyor
1 00
1 00
.00 1 .00
1 00
00
00
.00 1 .00
.00
.00
City Engineer
Civil Engineer I
Civil Engineer II
Civil Engineer III
Community Connectivity Manager
Construction and Inspection Supervisor
Construction and Maintenance Supervisor
Craftsworker
Custodian
Director of Public Works
Electrician
Engineering Permit Coordinator
Engineering Services Manager
Engineering Technician I
Engineering Technician II
2022
2023
2024
00 1 00 1 00 1 00
00 0 50 0 50 0 50
50 1 00 5 00 5 00
.00 2 .00 2 .00 2 .00
00 1 00 1 00 1 00
00 1 00 1 00 1 00
00 1 00 1 00 1 00
.00 0 .00 1 .00 1 .00
.00 10 .00 12 .00 12 .00
00 1 00 1 00 1 00
00 1 00 1 00 1 00
00 0 00 1 00 1 00
.75 0 .00 0 .00 0 .00
00 0 00 1 00 1 00
00 0 00 1 00 1 00
Executive Assistant 0 00 1 00 1 00 1 00
Facilities Manager
GEO Data Services Manager
GIS Analyst
HVAC Specialist
Land Development Technician
Manager of City Facilities
Manager of Communication-Infrastructure
Manager of Development Engineering
Manager of Traffic Operations and Maintenance
Mobility Planning and Innovation Manager
Municipal Inspector Foreman
Municipal Inspector I
Municipal Inspector II
Parking and Travel Demand Management Coordinator
Pavement Manager
Public Works Project Manager
Senior Civil Designer
Senior Civil Engineer
Senior GIS Analyst
Senior Survey Technician
Streets Foreman
.00 0 .00 0 .00 0 .00
1 .00 0 .00 0 .00 0 .00
00 0 00 0 00 0 00
1 00 1 00 1 00 1 00
.00 0 .00 1 .00 1 .00
.00 1 .00 1 .00 1 .00
00 1 00 1 00 1 00
00 0 00 1 00 1 00
00 0 00 1 00 1 00
.00 1 .00 1 .00 1 .00
.00 1 .00 1 .00 1 .00
00 0 00 2 00 2 00
00 6 00 4 00 4 00
.00 1 .00 1 .00 1 .00
.00 1 .00 1 .00 1 .00
00 1 00 1 00 1 00
50 0 50 0 50 0 50
00 0 00 0 00 0 00
.00 0 .00 0 .00 0 .00
00 1 00 1 00 1 00
00 6 00 6 00 6 00
Civil Engineer I
Civil Engineer II
Civil Engineer III
Custodian
Senior Civil Designer
Senior Civil Engineer
Total Water Fund Positions
Civil Engineer I
Civil Engineer II
Civil Engineer III
Senior Civil Engineer
Total Wastewater Fund Positions
Civil Engineer III
Engineering Manager
Senior Utilities Design Engineer
Stormwater Administrator
Stormwater Inspector II
Stormwater Regulatory Analyst
Total Stormwater Fund Positions
Building Maintenance Worker
Total Buildings Fund Positions
Total Public Works Positions
Direct Mail Specialist
GIS Analyst
Senior GIS Analyst
Total General Fund Positions
Chief Plant Operator
Customer Information Manager
Information Supervisor
Director of Utilities
2021 Actual 2022 Actual 2023 Budget 2024 Budget
.00 0 .25 0 .25 0 .25
.00 0 .00 1 .75 1 .75
00 2 00 3 00 3 00
00 1 00 1 00 1 00
50 1 50 1 50 1 50
.00 0 .50 0 .50 0 .50
5.25 8.00 8.00
00 1 25 1 25 1 25
00 0 00 1 25 1 25
.00 0 .00 2 .00 2 .00
.00 0 .50 0 .50 0 .50
1.75 5.00 5.00
.00 1 .00 1 .00 1 .00
.00 0 .00 1 .00 1 .00
00 1 00 0 00 0 00
00 1 00 1 00 1 00
00 1 00 1 00 1 00
.00 1 .00 1 .00 1 .00
5.00 5.00 5.00
00 1 00 1 00 1 00
1.00 1.00 1.00
113.00 134.00 134.00
2021 Actual 2022 Actual 2023 Budget 2024 Budget
.00 1 .00 1 .00 1 .00
.00 1 .00 2 .00 2 .00
00 1 00 1 00 1 00
3.00 4.00 4.00
.00 4 .00 5 .00 5 .00
00 1 00 1 00 1 00
00 1 00 1 00 1 00
00 1 00 1 00 1 00
Electro Mechanical Technician
Executive Assistant
GIS Analyst
Operations Supervisor
Operations Support Supervisor
OT/ITCS Security Operations Analyst
Plant Operator
Plant Supervisor - SCADA
SCADA Process and Controls Technician
SCADA Process and Controls Technician
Senior Customer Information Specialist
Senior GIS Analyst
Utilities Business Manager
Utility Foreman
Utility Supervisor
Utility System Technician
Utility System Technician-Associate Level
Utility System Technician-Senior Level
Utility Systems Analyst
Water Quality Administrator
Water Quality Analyst
Water Quality Technician
Water Resources Administrator
Water Resources Analyst
Water System Manager
Water Treatment Manager
Water Fund
Executive Assistant
Utilities Business Manager
Utility Foreman
Utility Supervisor
Utility System Technician
Utility System Technician-Associate Level
Utility System Technician-Senior Level
Wastewater and Stormwater Manager
00 4 00 4 00 4 00
00 0 50 0 50 0 50
.00 4 .00
.00 2 .00
.00 1 .00 1 .00 1 .00
00 1 00 1 00 1 00
00 0 00 1 00 1 00
00 6 00 5 00 5 00
.00 1 .00 1 .00 1 .00
.00 2 .00 2 .00 2 .00
00 0 00 1 00 1 00
00 5 00 5 00 5 00
.00 1 .00 1 .00 1 .00
.00 0 .50 0 .50 0 .50
00 8 00 9 00 9 00
00 4 00 4 00 4 00
00 17 00 0 00 0 00
.00 0 .00 9 .00 9 .00
00 0 00 8 00 8 00
00 2 00 2 00 2 00
00 1 00 1 00 1 00
.00 2 .00 2 .00 2 .00
.00 1 .00 1 .00 1 .00
00 1 00 1 00 1 00
50 0 50 0 50 0 50
.00 1 .00 1 .00 1 .00
.00 1 .00 1 .00 1 .00
72.50
00 0 20 0 20 0 20
00 0 10 0 10 0 10
00 4 00 5 00 5 00
.00 2 .00 2 .00 2 .00
.00 10 .00 0 .00 0 .00
00 0 00 4 00 4 00
00 0 00 5 00 5 00
.70 0 .70 0 .70 0 .70
Wastewater
Executive
Customer Information
Business Manager
Customer
Assistant Fleet Manager
Courier
Equipment Technician
Lube Technician
Manager
Lead Master Fleet Technician
Master Fleet Equipment Technician
Courier
Business Manager
Systems
Equipment
119,622 123,809
160,427 166,443 172,268 177,867
167,646 173,933 180,020 185,871
178,124 184,804 191,272
147,474 151,161 154,562 157,653
200,191 205,196 210,326 215,058 219,359
209,199 214,429 219,790 224,735 229,230
227,831 233,527 238,781 243,557
INFT1 78,221 81,154
97,609 100,049 102,551 104,858 106,955
INFT2 84,635 87,809 90,882 93,836 96,651 99,551 102,537 105,613 108,254 110,960 113,456 115,726
INFT3 91,575 95,009 98,335 101,531 104,576 107,714 110,945 114,274 117,130 120,059 122,760 125,215
99,084 102,800 106,398 109,856 113,152 116,546 120,043 123,644 126,735 129,903 132,826 135,483
107,209 111,230 115,123 118,864 122,430 126,103 129,886 133,783 137,127 140,555 143,718 146,592
LTCU1 31,161 32,329 33,461 34,548 35,585 36,652 37,752 38,884 39,856 40,853 41,772 42,607
LTCU2 34,352 35,640 36,887 38,086 39,228 40,405 41,618 42,866 43,938 45,036 46,049 46,970
LTCU3 37,869 39,289 40,664 41,986 43,245 44,543 45,879 47,256 48,437 49,648 50,765 51,780
LTCU4 41,747 43,312 44,828 46,285 47,674 49,104 50,577 52,094 53,397 54,732 55,963 57,082 LTCU5 46,022 47,748 49,419 51,025 52,556 54,132 55,756 57,429 58,865 60,336 61,694 62,928
LTCU6 50,734 52,637 54,479 56,250 57,937 59,675 61,466 63,310 64,892 66,515 68,011 69,372 LTCU7 55,930 58,027 60,058 62,010 63,870 65,786 67,760 69,793 71,537 73,326 74,976 76,475 LTCU8 61,657 63,969 66,208 68,360 70,410 72,523 74,698 76,939 78,863 80,834 82,653 84,306 LTCU9 67,970 70,519 72,988 75,360 77,620 79,949 82,348 84,818 86,938 89,112 91,117 92,939
MGMT2
57,456
69,106 70,833 72,604 74,238 75,723
61,061 63,351 65,568 67,699 69,730 71,822 73,977 76,196 78,101 80,053 81,855 83,492 MGMT4 67,326 69,851 72,296 74,645 76,884 79,191 81,567 84,014 86,114 88,267 90,253 92,058
78,806
97,154 99,583 101,823 103,860
104,509 107,122 109,800 112,270 114,516
115,232 118,113 121,065 123,789 126,265 MGMT8 101,818 105,636 109,333 112,886 116,273 119,761 123,354 127,055 130,231 133,487 136,490 139,220 MGMT9 109,708 113,823 117,806 121,635 125,284 129,043 132,914 136,901 140,324 143,832 147,068 150,010 MGMT10 120,965 125,501 129,893 134,115 138,138 142,282 146,551 150,947 154,721 158,589 162,157 165,401 MGMT11 128,222 133,031 137,687 142,162 146,427 150,819 155,344 160,004 164,004 168,104 171,887 175,325 MGMT12 135,916 141,013 145,948 150,691 155,212 159,869 164,665 169,604 173,845 178,191 182,200 185,844 MGMT13 142,712 148,063 153,245 158,226 162,973 167,862 172,898 178,085 182,537 187,100 191,310 195,136
92,343 95,806 99,159
PROF3 51,387 53,314 55,180 56,974 58,683 60,443 62,257 64,124 65,728 67,371 68,887 70,264
PROF4 56,783 58,912 60,974 62,956 64,845 66,790 68,794 70,857 72,629 74,445 76,120 77,642
PROF5 62,745 65,098 67,377 69,566 71,653 73,803 76,017 78,297 80,255 82,261 84,112 85,794
PROF6 69,333 71,933 74,451 76,871 79,177 81,552 83,999 86,519 88,682 90,899 92,944 94,803
PROF7 76,613 79,486 82,268 84,942 87,490 90,115 92,819 95,603 97,993 100,443 102,703 104,757
PROF8 84,658 87,833 90,907 93,861 96,677 99,577 102,565 105,642 108,283 110,990 113,487 115,757
PROF9 93,547 97,055 100,452 103,717 106,828 110,033 113,334 116,734 119,652 122,644 125,403 127,911
PROF10 103,369 107,246 110,999 114,607 118,045 121,586 125,234 128,991 132,216 135,521 138,570 141,342
PROF11 114,223 118,507 122,654 126,641 130,440 134,353 138,383 142,535 146,098 149,751 153,120 156,183
TBS1 33,022 34,260 35,460 36,612 37,710 38,842 40,007 41,207 42,237 43,293 44,267 45,153
TBS2 36,374 37,738 39,059 40,328 41,538 42,784 44,068 45,390 46,524 47,687 48,760 49,736
TBS3 40,066 41,568 43,023 44,421 45,754 47,127 48,540 49,997 51,247 52,528 53,710 54,784
TBS4 44,132 45,787 47,390 48,930 50,398 51,910 53,467 55,071 56,448 57,859 59,161 60,344
TBS5 48,612 50,435 52,200 53,897 55,513 57,179 58,894 60,661 62,178 63,732 65,166 66,469
TBS6 53,546 55,554 57,498 59,367 61,148 62,982 64,872 66,818 68,489 70,201 71,780 73,216
TBS7 58,981 61,193 63,334 65,393 67,355 69,375 71,456 73,600 75,440 77,326 79,066 80,647
TBS8 64,967 67,404 69,763 72,030 74,191 76,417 78,709 81,071 83,097 85,175 87,091 88,833
TBS9 71,562 74,245 76,844
TBS10 78,825 81,781 84,643
89,299 91,532 93,820 95,931 97,850
98,363 100,822 103,343 105,668 107,781
Intentionally left blank
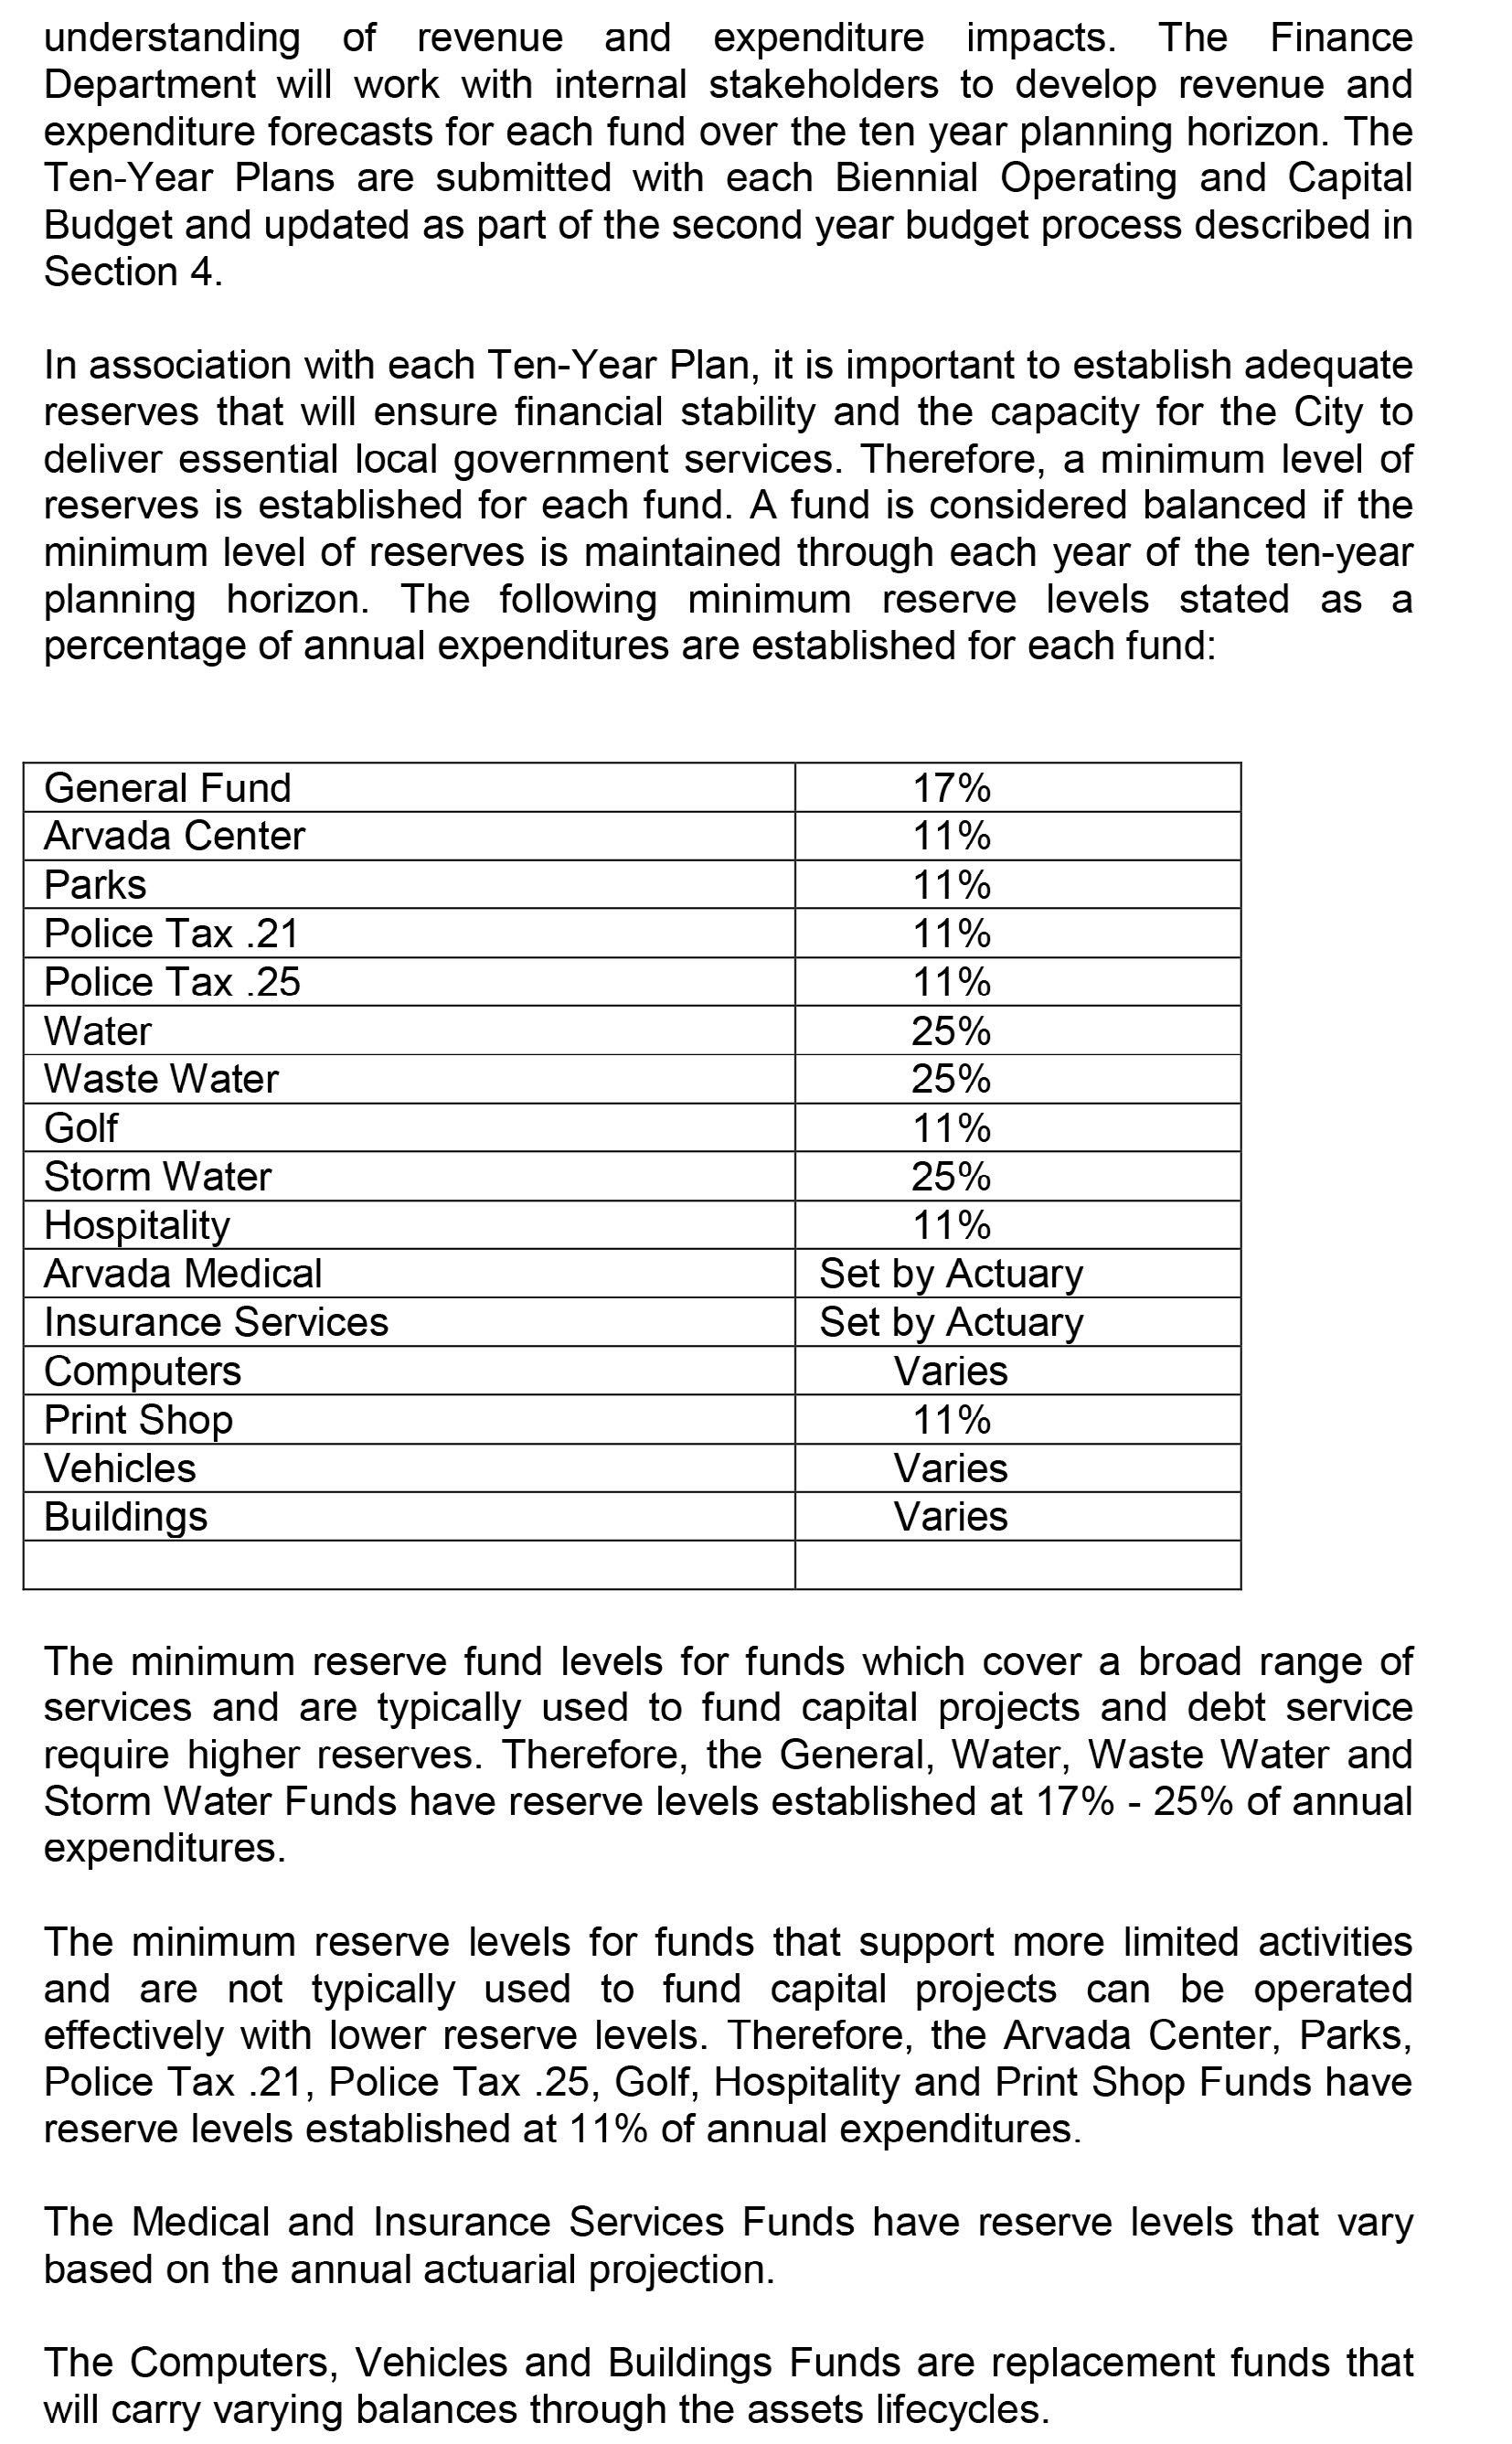
The City of Arvada Operating and Capital Budget is structured to be easily understood and meaningful to both the general public and the organization This glossary is provided to assist those unfamiliar with budgeting terms and a few terms specific to the Arvada financial planning process
98-101 Funding – Since the electors of Arvada adopted a sales tax in 1969, the City Code has required that 60% of the first cent of sales tax revenue must be appropriated annually for capital projects or debt service. Codified as 98-101 in the Arvada Code of Ordinances, this funding is referred to as 98-101 fund ing
Accrual Basis: A basis of accounting in which transactions are recognized at the time they are incurred, as opposed to when cash is received or spent .
Advance Refunding: The payoff and re-issuance of bonds to obtain better interest rates and/or bond conditions
American Rescue Plan Act of 2021 (ARPA): Is a $1 .9 trillion economic stimulus bill passed by the 117th U .S . Congress and signed into law by President Joe Biden on March 11, 2021, to provide additional relief to address the continued impact of COVID-19
Appropriation: Appropriation is a formal action by the City Council which approves the spending limits for the fiscal year for each fund .
Arvada Economic Development Association (AEDA): Arvada Economic Development Association provides start-up, existing or expanding businesses with the latest demographic, financial, business, and consumer research necessary to succeed in the City of Arvada
Assessed Valuation: Assessed valuation is a valuation set upon real estate or other property by the County Assessor as a basis for levying taxes .
Asset: Resources owned or held that have monetary value
Assigned Fund Balance: These are amounts that a government intends to use for a specific purpose . Intent can be expressed by the governing body or by an official or body to which the governing body delegates authority
Attrition: A method of achieving a reduction in personnel by not refilling the positions vacated through resignation, reassignment, transfer, retirement or means other than layoffs .
AURA: AURA stands for Arvada Urban Renewal Authority . AURA acquires and assembles property in order to redevelop blighted property located in the urban renewal district The district in Arvada includes five active areas that are located throughout the City
Authorized Positions: Employee positions, which are authorized in the adopted budget, to be filled during the year .
Bond: A long-term I O U or promise to pay Often bonds are issued to finance the construction of long
term capital projects . It is a promise to repay a specified amount of money (the face amount of the bond) on a particular date (maturity date) . Bonds come in two types: general obligation bonds are backed by the full faith, credit and taxing authority of the government and revenue bonds are backed only by a specific revenue stream, such as water user fees or sales tax
Budget: A plan of financial activity for a specified period of time (two years) indicating all planned revenues and expenditures for the budget period .
Budgetary Basis: This refers to the basis of accounting used to estimate financing sources and uses in the budget This generally takes one of three forms: Generally Accepted Accounting Principles (GAAP), cash, or modified accrual
Budgetary Control: The control or management of a government in accordance with the approved budget for the purpose of keeping expenditures within the limitations of available appropriations and resources . Capital Equipment: Assets of value greater than $5,000 and having a useful life greater than 36 months Capital equipment is also called fixed assets
Capital Improvements Plan (CIP): The appropriation and spending plan for improvements to city facilities including buildings, streets, water , stormwater and sewer projects, drainage improvements, parks and trails
Capital Outlay: Classification of expenditures related to the purchase of capital equipment
Capital Project: Major construction, acquisition or renovation activities which add value to a government’s physical assets of significantly increase their useful life .
Cash basis: A basis of accounting in which transactions are recognized only when cash is increased or decreased .
CCIPC: The Citizens Capital Improvement Plan Committee, a 21-member group of citizens appointed by City Council to report recommendations for capital improvement project prioritizations and funding
Certificate of Participation (COP): A certificate of participation is a lease financing agreement used by a government to improve or purchase infrastructure .
CDBG: CDBG stands for Community Development Block Grant, which is money given to cities from the federal government to improve blighted conditions and to assist low and moderate income persons
City Council Strategic Plan (CCSP): The City Council Strategic Plan is the guiding document that lays the foundation for meeting current and future community needs, integrates the Biennial Operating and Capital Improvement Budgets, and subsequently drives daily operations within the City of Arvada .
Committed Fund Balance: These are amounts constrained to specific purposes by a government itself, using its highest level of decision making authority To be reported as committed, amounts cannot be used for any other purpose unless the government takes the same highest-level action to remove or change the restraint .
Consumer Price Index (CPI): A statistical description of price levels provided by the U S Department of
Labor . The index is used to measure the increase in the cost of living (economic inflation) .
Contingency: A contingency is a budgetary reserve set aside for emergency or unanticipated expenditures and/or revenue shortfalls
Coronavirus Aid, Relief, and Economic Security Act (CARES): Also known as the CARES Act is a $2 .2 trillion economic stimulus bill passed by the 116th U .S . Congress and signed into law by President Donald Trump on March 27, 2020, in response to the economic fallout of the COVID-19 pandemic in the United States
Debt Service: Debt Service is the principal and interest payments on outstanding bonds .
Depreciation: Expiration in the service life of capital equipment attributable to wear and tear, deterioration, action of the physical elements, inadequacy or obsolescence
Emergency Reserve: The Emergency Reserve is a term used in TABOR .TABOR requires Arvada to maintain 3% of total fiscal year spending as an emergency reserve .
Encumbrance: An encumbrance is the formal accounting recognition of commitments to expend resources in the future
Enterprise Fund: An enterprise fund is a separate set of financial records used for operations which are financed and operated in a manner similar to a private business enterprise . City enterprise funds are set up in order to pay ongoing costs of a program using ongoing revenues and fees generated by the program such as Arvada’s utility service
Fiscal Year: A fiscal year is the one year period designated by the city for the beginning and ending of financial transactions . This is the period covered by the budget and the financial report . The city’s fiscal year begins January 1 and ends December 31 .
FOCUS: This is the name given to the City of Arvada’s system of performance based budgeting and the practice of developing budgets based on the relationship between program funding levels and expected outcomes from that program .
Full Time Equivalent Position (FTE): A position converted to the decimal equivalent of a full-time position based on 2,080 hours per year For example, a part-time typist working for 20 hours per week would be equivalent to 5 of a full-time equivalent
Full Faith and Credit: A pledge of the government’s taxing power to repay debt obligations .
Fund: A fund is a fiscal and accounting entity with a self-balancing set of accounts recording cash and other financial resources, related liabilities and residual balances
Fund Balance: A fund balance is the difference between total assets and total liabilities for a fund .
GASB: GASB is the Governmental Accounting Standards Board, which is the source of generally accepted accounting principles for public-sector entities like the City of Arvada
General Obligation (G.O.) Bond: This type of bond is backed by the full faith, credit and taxing power of the city .
General Fund: A general purpose fund supported by taxes, fees and other revenues which may be used for any lawful purpose . This fund accounts for all financial resources except those required to be accounted for in another fund .
Goal: A goal is a statement of broad direction, purpose or intention based on the needs of the community A goal is general and timeless; that is, it is not concerned with a specific achievement in a given time period
Government Finance Officers Association (GFOA): An organization founded in 1906 that represents public finance officials throughout the United States and Canada .
Infrastructure: Infrastructures are facilities on which the continuance and growth of a community depend such as a road, water lines, sewer lines, public buildings, and parks . Infrastructure assets are immovable and of value only to the government .
Internal Service Fund: This fund accounts for the financing of goods or services provided by one department or agency to other departments or agencies of the governmental unit An example is the insurance fund
Liability: An obligation to pay an amount in money, goods, or services to another party .
Line of Business: A grouping of Programs with similar common purposes Local Growth: Local growth is a term defined by TABOR Local growth is the net percentage change in actual value of all real property
Maintenance and Operation Costs: The day to day operation and maintenance costs of a municipality include such things as gas and electric utility bills, telephone expense, reproduction costs, postage and vehicle maintenance
Milestone: A significant event or important achievement that indicates change or progress toward a strategic result . Milestones signal anchors and serve as visible indicators of progress toward achievement of a strategic result .
Mill: Property tax rates that are based on the valuation of property are measured in units called mills A tax rate of one mill produces one dollar of taxes on each $1,000 of assessed property valuation
Modified Accrual: Modified accrual is a basis of accounting where revenues are recognized in the accounting period in which they become available and measurable, and expenditures are recognized in the accounting period when the liability is incurred, if measurable
Non-spendable Fund Balance: These are amounts that are not in a spendable form (such as inventory) or are required to be maintained intact (such as the corpus of an endowment fund) .
Operating Budget: An operating budget contains the day-to-day costs of delivering city services The operating budget is the spending plan for the entity
Operating Revenue: Funds that the government receives as income to pay for ongoing operations . It includes such items as taxes, fees from specific services, interest earnings and grant revenues . Operating revenues are used to pay for day-to-day services
Operating Expenditures: The cost for personnel, materials and equipment required for a department to function .
Performance Measure: Using smart goal framework, performance measures are specific, measurable, achiveable, realistic and timely Performance measures help focus efforts and ability to achieve targets All strategic performance measures are directly aligned with a strategic result and all operational performance measures align with one or more principles .
Personnel Expenditures: Expenditures for salaries, wages and fringe benefits for employees .
Principle: Principles are high-level business strategies that form our business model and serve as pillars of excellence . They are broad in scope and apply to all areas within the City organization and provide standards for how we do business in order to successfully support City Council priorities . They promote working collaboratively in a deliberate strategic direction
Program: A subdivision within a department within which revenues and expenditures are organized around benefits experienced by consumers of the program’s services
Reserve: A reserve is a portion of the fund balance that is not available for appropriation or expenditure .
Resolution: A resolution is a formal statement of a decision or expression of opinion put before or adopted by the city council
Restricted Fund Balance: These are amounts constrained to specific purposes by their providers (such as grantors, bondholders, and higher levels of government), through constitutional provisions or enabling legislation
Revenue Bond: This is a type of bond that is backed only by a particular source of revenue, such as water sales, road tolls, and sales taxes .
Strategic Result: A specific and measurable objective directed by City Council providing guidance in supporting priorites and organizational transformation Strategic resutls are a statement of a desired end-state and are measurable and explicity defined using outcome language They provide guidance to organizational transformation .
STRAT OP: A strategic planning framework and process emphasizing perspective first helps us close the gap between City Council’s vision and our day to day work
Supplemental Appropriation: An additional appropriation made by the governing body after the budget year has started .
TABOR: TABOR (Taxpayer Bill of Rights, Article X, and Section 20 of the Colorado Constitution) is an amendment to Colorado’s State Constitution passed by election in 1992 that imposes revenue limitations for governments .
TABOR Caps: TABOR caps are the limits placed each year on how much money cities can receive The caps are calculated on a yearly basis and are dependent upon local growth plus inflation
Taking Lasting Care (TLC): Taking Lasting Care is one of the key components of the City’s Capital Improvement Plan and focuses on reinvestment of resources to existing infrastructure .
Taxes: Taxes are compulsory charges levied by a government for the purpose of financing services performed for the common benefit of the people This term does not include specific charges made against particular persons or property for current or permanent benefit, such as special assessments
Tax Levy: A tax levy is the total amount to be raised by general property taxes as measured by mills . A mill equals $1,000 of assessed valuation
Transfer: A transfer is expenditure from one fund for the benefit of a receiving fund
User Charges: The payment of a fee for direct receipt of a public service by the party benefiting from the service is a user charge .
Working Capital: The difference between the current assets and current liabilities in a fund In other words, working capital is the amount of money available to pay for current operations