FINANCIAL REPORT SECOND QUARTER 2022 COMMUNITY AND ECONOMIC
ORGANIZATIONALINFRASTRUCTUREDEVELOPMENTANDSERVICEEFFECTIVENESSSAFECOMMUNITYVIBRANTCOMMUNITYANDNEIGHBORHOODS
Finance Department • 8101 Ralston Road • Arvada, Colorado 80002 720-898-7120 • Contributors:www.arvada.org Bryan Archer, Director of Finance Deb Nielson, Assistant Director of Finance Vacant, Budget Analyst Chris Kelly, Budget Analyst Carolyn Ewing, Budget Analyst Vesta Weinhauer, Controller Danielle Trujillo, Accounting Supervisor Vacant, Accounting Supervisor Natasha Galston, Grant Accountant Jenna Belec, Executive Assistant Steve Milke, Bun Heng, Print Shop
1 Table of Contents Overview .............................................................................................................................. 2-3 General Fund ....................................................................................................................... 4-7 Street Maintenance Fund..................................................................................................... 8-9 Parks Fund ........................................................................................................................... 10 Special Revenue Funds Tax Increment Funds ......................................................................................................... 11 Community Development .................................................................................................. 12 Arvada Housing Authority 13 Capital Improvements Projects Fund ................................................................................ 14-15 Enterprise Funds Water Fund ....................................................................................................................... 16 Wastewater Fund 17 Stormwater Fund .............................................................................................................. 18 Golf Fund .......................................................................................................................... 19 Solid Waste Fund .............................................................................................................. 20 Internal Service Funds Insurance Fund ................................................................................................................. 21 Computer Fund ................................................................................................................. 22 Vehicle Fund ..................................................................................................................... 23 Print Services Fund ........................................................................................................... 24 Buildings Fund .................................................................................................................. 24 3F Bond Projects ............................................................................................................. 25-26 City of Arvada Investment Report ..................................................................................... 27-28 Performance Data............................................................................................................ 29-30
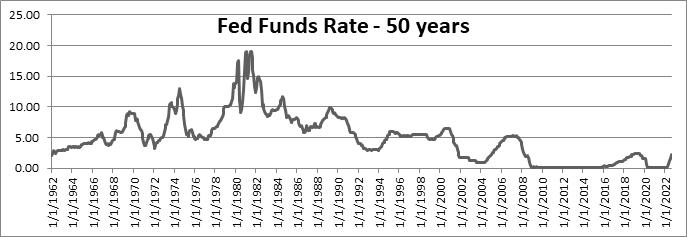
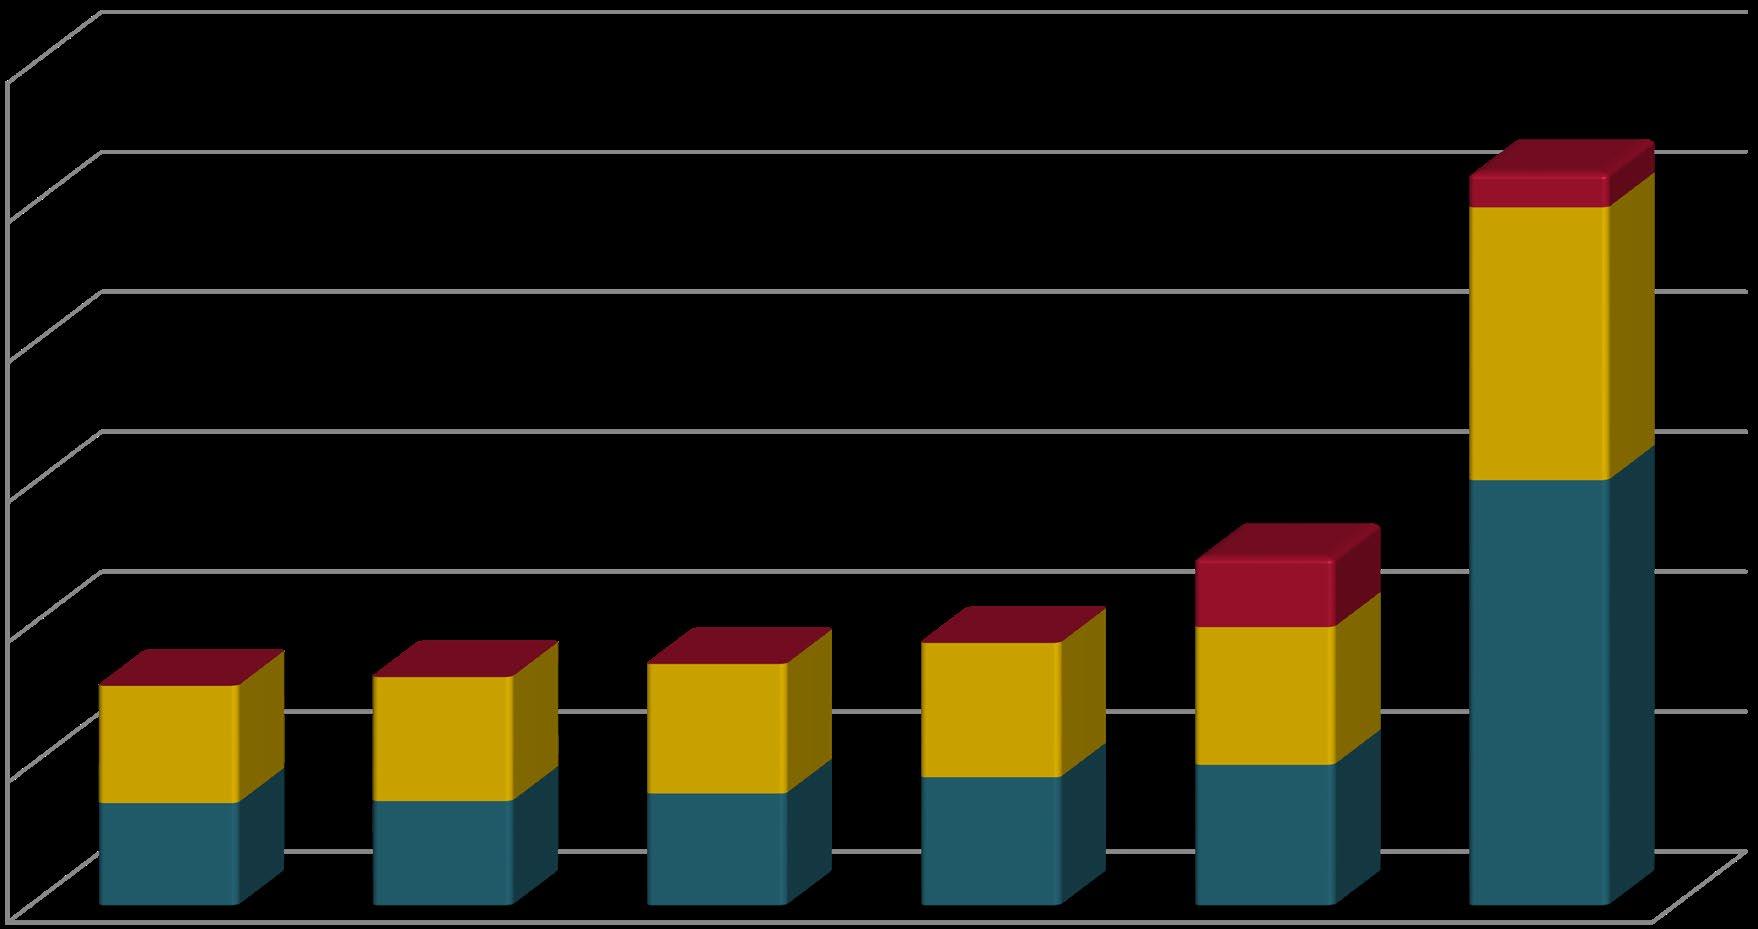
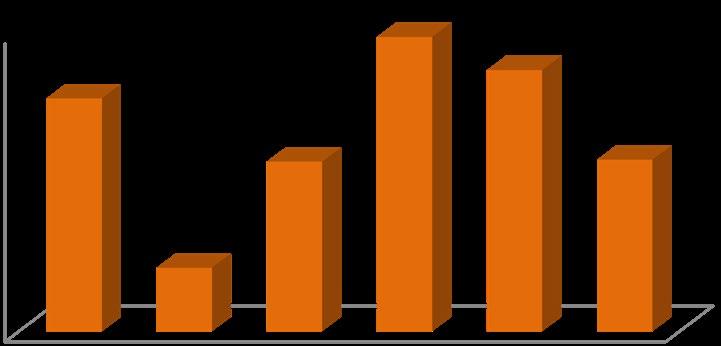
The Federal Reserve has continued to try and fight inflation by increasing short term rates. The current range sits at 2.25% – 2.50% after a 50 basis point increase in May, and 75 basis point increases in June and July. The Fed is expected to continue to increase rates throughout the rest of 2022. As you can see in the graph below, the Fed Funds rate has been very low since 2009 and is only now returning to a more “normal” level.
The Financial Report for the City of Arvada provides an unaudited overview of the major funds and how their revenues and expenditures performed in comparison to budget. This is not meant to be a complete accounting, but rather a quick look at the highlights.
OVERVIEW 2022 Second Quarter Financial Report
The State of Colorado’s fiscal year ended on June 30, 2022 with revenues exceeding the budget and the TABOR cap. Individual and joint state income tax filers will receive $750 and $1,500 refund checks due to the excess. Quickly rising inflation can be difficult to manage with a TABOR cap as the cost of essential services can grow faster than allowed as the TABOR cap is backward looking. Unemployement has fallen slightly to 3.4%, below the national average as businesses continue to look for qualified employees. State economists are expecting a slowdown for at least the first half of fiscal year 2023 but do not think Colorado will enter a recession.
2
The second quarter for the City of Arvada continued the strong start in revenues with a little bit of a slowdown. Increases in sales tax, building use and auto use have led to year over year overall growth of 13.4%. Sales tax is up 9.6% for the second quarter. Since the inflation reading came in at 9.1%, growth is this category is small. The categories of Full Service Restaurants, Electronic Shopping and Electric Power continue to experience double digit growth with Limited Service Restaurants and Liquor Stores showing negative year over year revenues. With recessionery concerns, sales tax will be clossely monitored.
The second quarter of 2022 continued the mixed economic messages that started in the first quarter. COVID cases are at the lowest levels since the start of the pandemic, federal unemployment has stayed steady at 3.6% and hard hit industries are returning to profitability.
Finally, the Gross Domestic Product (GDP) decreased at .9% for the second quarter of 2022. This marks the second consecutive quarter of negative growth, with the first quarter being down 1.6%. The technical definition of a recession is two consecutive quarters of negative economic growth, leaving the United States in a “technical recession” right now. What a lot people do not know is that the official pronouncement of a recession, for the United States, comes from a team of eight economist chosen by the National Bureau of Economic Research, called the Business Cycle Dating Committee. This group has been responsible for identifying recessions and has set the dates for the start and end of recession since 1978. Unfortunately, this group usually waits a while after a recession has begun to officially pronounce it, sometimes until the recession is actually over.
Unfortunately, inflation has continued to rise up to 9.1% for the 12 months ending June 2022, the highest in 40 years, consumer credit card debt has risen significantly in the past year just short of record all-time highs, vehicle debt is at a record high, consumer sentiment has fallen leading to a reduction in personal consumption, industry production has started to slow with many larger companies freezing hiring or even laying off team members and the 2-year and 10-year yield curves continue to be inverted.
Auto use tax continues to be strong with the second quarter coming in up 11.6%. The demand for new and used cars has remained high even with all of the inflationary pressure. Building revenues have exceeded their budget for 2022. A few large commercial projects pulled permits and began construction in the second quarter. Residential activity has slowed down to a more normal pace. As short-term interest rates rise, building activity will be an area to keep an eye on.
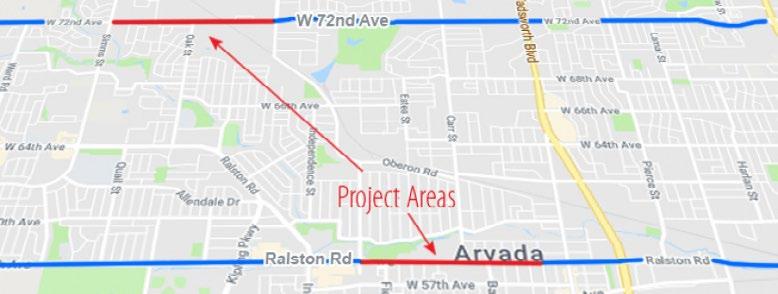
One capital project is discussed this month –Meyers Pool Replacement. The citizens of Arvada passed Ballot Issue 3F in November of 2018, approving a sales and use tax bond to fund the widening of Ralston Road from Yukon to Garrison and the widening and creation of an underpass on 72nd Avenue from Kipling to Ward. Please see the project detail pages (pages 25-26) in the document for detailed updates.
Inflationary pressures continue as the cost to provide core services is increasing. For example, water chemicals used to create clean drinking water have gone up over 30% in the past year alone. Lead time on larger construction items has moved from 6-9 months to 12-18 months and the ability to purchase new vehicles is almost non-existent. Finally, the largest inflationary pressure is on salaries and wages. Competition for the best and brightest, of which Arvada has many, has become fierce with outside agencies willing to increase base pay 20%-50%.
3 OVERVIEW
The second quarter of 2022 brought about much of the same as the first quarter. Rising inflation, increased competition for talent, political unrest, increases in short-term interest rates and greater concern around a pending recession. With the ongoing commitment to 10-year financial planning, the City is positioned well to endure any challenges thrown its way.
4 GENERAL FUND General Fund Overview The General Fund pays for the City’s basic services. This includes police, planning, transportation planning, street light maintenance and costs, building activity and general administration. In addition, the General Fund also provides for the following: • Operational support to the Parks Fund • General Debt Service payments • Transfer to the Capital Improvements Fund for new parks, transportation and other infrastructure projects • Grant support to the Arvada Center • The 2022 beginning fund balance was $61,007,000. • $10,605,330 of the fund balance is dedicated to projects not completed in 2021, one-time items and new requests. • The 2022-2030 ten-year financial plan requires the use of $26,235,587 to balance. A new 10-year plan will be developed this summer in conjunction with the 2-year budget cycle. The following table provides a comparison of budgeted cash balances, revenues and expenditures to actual amounts. General Fund Budget2022 As 06/30/22of As 06/30/21of Beginning Fund Balance $61,007,000 $61,007,000 SalesREVENUES&Use Tax $ 77,086,936 $ 37,176,903 $ 32,424,950 Property Tax 7,949,428 5,787,568 5,409,963 Interest 786,750 450,160 388,137 Other 20,996,948 11,515,698 9,402,278 Total Revenues $106,820,062 $54,930,329 $47,625,328 OngoingEXPENDITURES $105,556,604 $43,076,051 $38,935,340 Capital 7,806,371 345,000 740,343 Debt Service 5,361,782 1,370,891 1,433,266 Total Expenditures $118,724,757 $44,791,942 $41,108,949 Income/(Loss) (11,904,695) 10,138,387 6,516,379 Ending Fund Balance $49,102,305 $71,145,387 GENERAL FUND ENDING FUND BALANCE BY QUARTER COMPARED TO FUND BALANCE GOAL OF 17% OF BUDGETED EXPENDITURES 70%60%50%40%30%20%10%0% 2018Q1 2018Q2 2018Q3 2018Q4 2019Q1 2019Q2 2019Q3 2019Q4 2020Q1 2020Q2 2020Q3 2020Q4 2021Q1 2021Q2 2021Q3 2021Q4 2022Q1 2022Q2

• General use tax decreased 15.2% from 2021 in the second quarter.
Revenue Highlights
06/30/2018
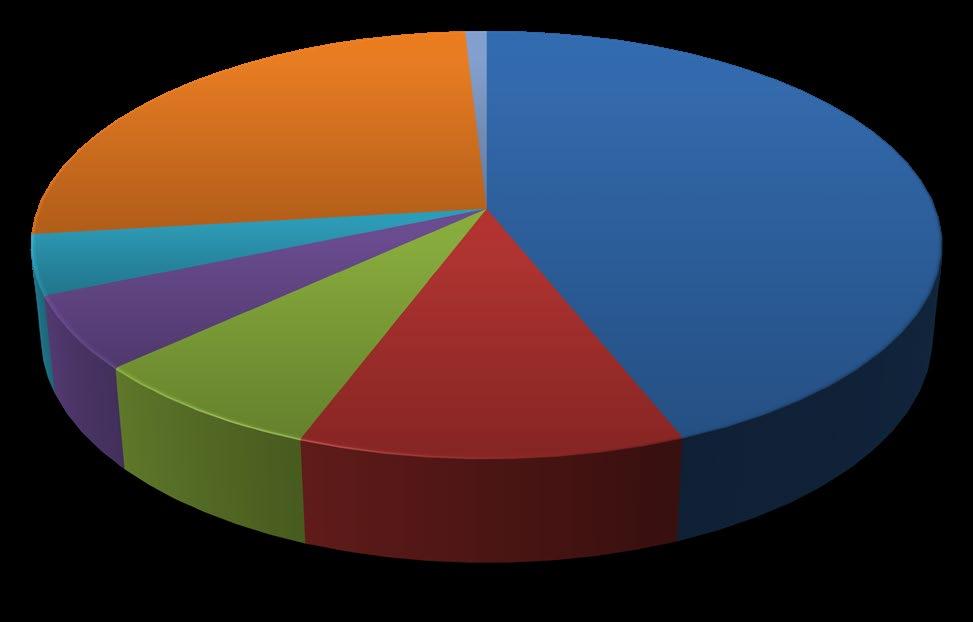
Auto Use Tax 8.4%Building Use Tax & Permits 5.1% Court Fines & Fees .9% Franchise Fees 4.0% 12.7%OtherInterest.7% 202 2 BUDGETED GENERAL FUND REVENUES
Building
Use Tax Collections Use
• With inflation at 9.1%, the relative increase in sales tax is slightly over the inflation rate. Use Tax
• Building Use Tax and Permits saw an increase of $2,429,462, Building Use Tax is discussed in more detail in the “Use Tax” section.
• Sales tax collections lag one month; therefore, collections for the second quarter represent five months’ collections.
• Property tax saw an increase of $377,605 and is discussed in more detail in the “Property Tax” section.
Sales
• Auto use tax is expected to meet budget projections.
5 GENERAL FUND Sales Tax Sales Tax Collections
Auto
• Sales tax saw an increase of $2,422,427 and is discussed in more detail in the “Sales Tax” section.
• Auto use tax is up 11.6% in the second quarter compared to the second quarter 2021.
• Building use tax increased 96.4% for the second quarter.
Property Tax
• The nation continues to see a shortage in new cars and the price of used cars is also elevated, so auto use tax has continued to increase.
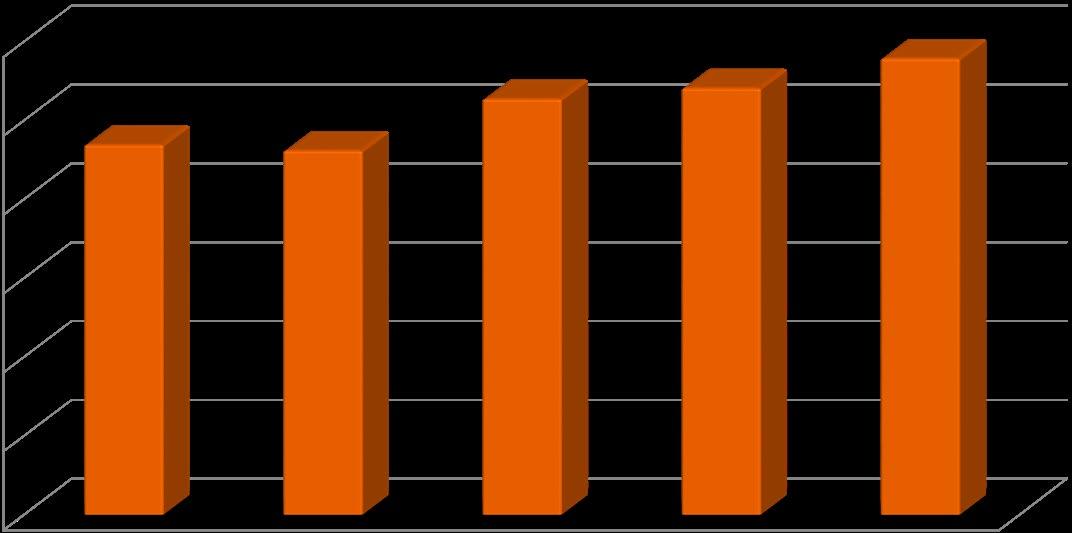
$30,000,000$25,000,000$20,000,000$15,000,000$10,000,000$5,000,000$06/30/2019 06/30/2020 06/30/2021 06/30/2022 Tax $20,793,558 $20,778,493 $21,347,397 $26,170,377 $28,688,548 Tax
General Use Tax
• Court fines and fees saw a decrease of $68,621 or 13.5% from 2021.
• General use tax saw a decrease of $57,828 and is discussed in more detail in the “Use Tax” section.
Sales
• Sales tax is up 9.6% for the second quarter.
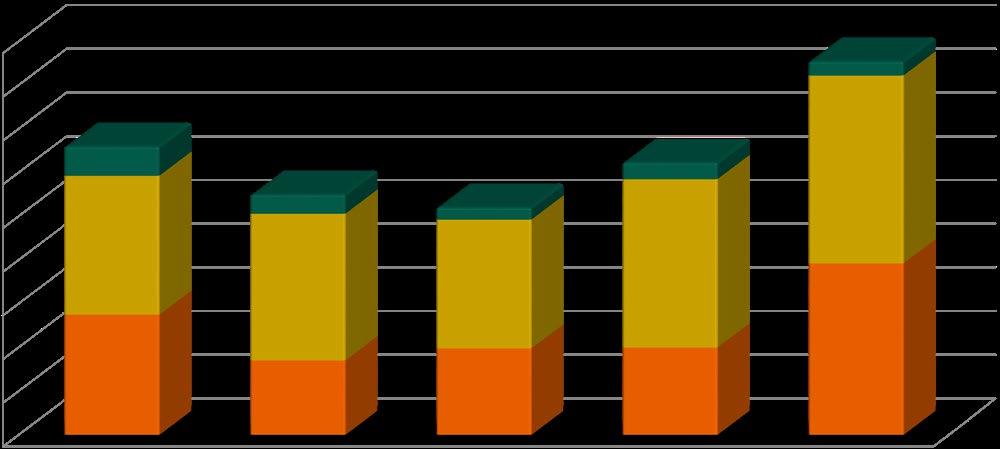
$9,000,000$8,000,000$7,000,000$6,000,000$5,000,000$4,000,000$3,000,000$2,000,000$1,000,000$0 06/30/2019 06/30/2020 06/30/2021 06/30/2022 General $669,368 $441,026 $278,433 $380,827 $323,000 Auto $3,179,145 $3,356,192 $2,944,833 $3,851,443 $4,296,327 Building $2,746,422 $1,700,707 $1,976,505 $1,996,557 $3,921,665
• Franchise fees saw an increase of $213,055 or 12.2% over 2021 which is due to increased tax collections from Xcel Energy.
06/30/2018
• Building use tax has exceeded the budget for 2022 due to some large commercial projects, the permit and use tax was collected during second quarter 2022.
• Inflation also attributes to the growth in building use tax; however, the City is continuing to see a normal level of growth. Use Tax
• The decrease is due to several businesses with larger use tax remittances in 2021. This revenue will continue to be monitored throughout the year. 7.4% 59.8%Tax 1.0%Tax
Use
• Overall revenues increased $7,305,001 or 15.3% over 2021.
6 GENERAL FUND Intergovernmental revenues $2,500,000$2,000,000$1,500,000$1,000,000$500,000$0 06/30/2018 06/30/2019 06/30/2020 06/30/2021 06/30/2022 Jefferson County $1,665,230 $1,706,104 $1,535,893 $1,509,332 $1,521,783 HUTF $401,793 $406,420 $402,869 $442,799 $505,321 RevenuesIntergovernmental • Highway Users Tax Fund (HUTF), the City’s share of statecollected gas tax revenue, is up 14.1% for the second quarter. This tax is collected on the number of gallons of gas sold. • Road and Bridge revenues are up .8%. This revenue is City’s share of property tax collected by Jefferson County & Adams County and dedicated to the maintenance of roads and bridges. Property Tax • The City’s property tax rate is 4.31 mills per $1,000 of valuation. • 2022 property tax is based on the mill which is placed on the assessed valuation from 2021. • Property tax is up 6.9% from 2021 with an increased assessed valuation. ProPerty tax ColleCtIons $6,000,000$5,000,000$4,000,000$3,000,000$2,000,000$1,000,000$0 06/30/2018 06/30/2019 06/30/2020 06/30/2021 06/30/2022 Property Tax $4,690,945 $4,618,738 $5,272,544 $5,409,963 $5,787,568
7 GENERAL FUND Personnel,44.0% Services and 11.7%Charges, Supplies and 7.4%Expenses, DebtContracts5.5%Service4.5% Transfers26.0% Miscellaneous0.9% • Overall expenditures increased $3,682,993 or 8.9% over 2021. • Services and charges increased $1,196,919 or 24.4% over 2021 which is due to the timing of the in-kind payment made to the Arvada Center in 2021 as this payment was made in the third quarter 2021 vs the second quarter 2022. • Supplies and expenses saw an increase of $933,161 or 29.1% over 2021. This is primarily due to contributions to the computer replacement and maintenance fund to support additional costs associated with technology. • Contracts saw an increase of $1,626,481 or 59.2% over 2021. This is due to contracts related to the new body worn camera program in the Police Department and grants to Colorado Homeless Families and the Arvada Chamber of Commerce. Salary and Benefit 202 2 BUDGETED GENERAL FUND EXPENDITURES • Salaries and Wages increased due to the additional positions approved across several City’s departments. Additional positions were necessary as a result of regulatory mandates such as body worn cameras in the Police Department and field programming being acquired from APEX. • Overtime and Temporary Wages increased due to turnover. Difficulties in the current job market caused the hiring process to take longer than normal. Job duties needed to be completed so the existing staff members were relied upon to fulfill these responsibilities. Expenditure Highlights Salary & Benefits Budget2022 As 06/30/22of As 06/30/21of Salaries & Wages $39,295,647 $15,110,735 $14,586,222 Vacancy Savings (1,399,550) -Overtime 842,696 533,514 484,896 Group Insurance 7,295,665 2,454,174 2,577,523 Retirement 4,280,417 1,720,046 1,662,258 Medicare 560,318 216,235 205,394 Temporary Wages & SS 676,968 220,286 147,435 Other 532,247 306,178 257,251 Total $52,084,408 $20,561,167 $19,920,979
• The Pavement Management Team is committed to improving our accessibility and roadways throughout the City. As well as making significant progress with the 2022 PMP, the Pavement Management Team has and continues to collaborate to build and improve processes and procedure. Second Quarter examples include:
• Communication. Continuous collaboration with internal teams to review, update and implement standardized communication internally and externally.
• Instability in the petroleum industry. The instability in the petroleum industry has triggered significant increases in petroleum products which play a critical role in manufacturing, delivery and placement of asphalt products.
• Road Matrix. Utilizing software to assist with determining pavement maintenance applications and priorities.
• Poor subgrade conditions were found during repaving. Unforeseen additional costs were also incurred. However, by addressing and correcting before repaving, the result will significantly extend the service life of the streets. This does impact the proposed areas projected to be completed in 2022 as it relates to available funding.
• ADA Curb Ramp Removal and Replacement. Additional unforeseen removal and replacement of concrete in order to meet ADA curb ramp compliance. This triggers additional costs which impacts the funding needed to complete the ADA curb ramps scheduled for completion in 2022 in preparation for mill and overlay.
Expenditure Highlights Revenue ChallengesHighlights
8 STREET MAINTENANCE FUND Street Maintenance Fund Overview The Street Maintenance Fund accounts for costs associated with street maintenance, repair and replacement including: crack sealing, chip sealing, seal coating, reconstruction, milling and overlay. Revenues are derived from the City’s General Fund and the Highway Users Tax Fund which is the City’s share of state-collected gas tax revenue Street Maintenance Fund Budget2022 As 06/30/22of As 06/30/21of Beginning Fund Balance $1,556,870 $1,556,870 GeneralREVENUESFund Transfer $13,499,631 $5,074,815 $4,975,252 Other 120,000 116,695 166,332 Total Revenues $13,619,631 $5,191,511 $5,141,584 AsphaltEXPENDITURESReplacement $5,000,000 $6,268 $1,545,563 Concrete Replacement 4,451,541 - $814,025 Crack Sealing 1,484,722 446,022 $1,351 Other 1,385,535 $52,406 $240,864 Total Expenditures $12,321,798 $504,696 $2,601,803 Income/(Loss) 1,297,833 4,686,815 2,539,781 Ending Fund Balance $2,854,703 $6,243,685 $2,539,781 • Revenues consist of a transfer from the General Fund, payments from participants in the 50/50 Sidewalk Replacement program and street degradation fees • The Pavement Management Program (PMP) 2022 construction started in the second quarter and has made significant progress. The Pavement Management team is currently managing seven construction contracts with various vendors. Curb ramp and concrete replacement has been completed in Wildflower Ponds, Westwoods and West 66th Ave and Miller Street neighborhoods with construction underway in the Lamar Heights and Ralston/Allendale neighborhoods. Approximately 112,225 square yards of pavement resurfacing has been completed with another 161,506 square yards currently under construction
• ADA compliance. Collaborating with internal teams to develop and implement a standardized process when addressing non-compliant curb ramps which are included in the 2022 PMP.
9 STREET MAINTENANCE FUND The 2022 Concrete Program will include but is not limited to: • Complete any warranty work from 2021 • Remove and replace ADA ramps on intersecting streets in preparation for the future Overlay Programs • Remove and replace qualifying combination sidewalk curb and gutter and/or vertical curb and gutter for the 2023-2024 Overlay Program The 2022 Asphalt Program will include but is not limited to: • Mill and overlay arterial, collector and residential pavement according to the map provided • Crack Seal arterial, collector and residential pavement according to the map provided • Chip and Slurry Seal arterial, collector and residential pavement according to the map provided A C H 7 ) E RALSTON P Y W 8 C O T A E A A N O D F N O N WY S 70 V G U 4 W 6 6 T B H S Y D O 1 7 5H A V C W R H O AVE 7T A W O E N 7 5 N C U M 9 W 80TH AVE U E W S S E V R R S W R D C W V E N W B S N E D 8 O C V E K L N G T S 6 W T R 6 P S N M N D N A T S H 2 M W O WY V S T P A AVE R E F C Y N H T A L P Q U K E S U W 3 PARKWAY R A D S BE V R S S E R W 80 H T 8 W 7 W N M 5 M R 8 H C S H 7 2 C Q R N W D AM R W E J R L 8 Q W 2 S V L S W R D 5 D V R M W A O M D 7 W W W O N Y N E 6 E I-76 5 L 7 5 4 C H R W W R R R B N W 8 H 7 N R 9 R N 86TH C Y O S R CNY AVE DENVER BOULDER TURNPKE W 5 ) B 7 S O C S R A H G LS R C W T H Y N C P H W 88TH AVE WADSWORTH Y W 72ND AVE R 5 D H R A S E E H O H N W E N G W 58 H AVE N A W QU 7 H C N L V T E D S H 2 1 C A W R O 0 3 7 T Y R W 6 R L S W 3 N Y C T A D N C Y 5 H R A W Q NO S R O 6H C C 8 U E A S T P N G V W 7 4 7 C U F C D W A D W O R H B V W PKWY W W B R H N WA W 3 T C H D M H E D N B V D C H 9 W 64TH AVE U U U T Y D G T E 8 M M c N T R S R O E N A D AN H N O Y D Y T N H N N N WA L R D H H D R R H D U A E 2 L M YW V N A W 5 H 6 A E 5 S D A 6 ROAD L P 8 9 P O O C I 70 W S E WA 80TH AVE C S H 9 5 W 58TH AVE R O 6 R 7 H L N O T C C W W H O D 6 R 70 R N 3 L PK R K TH AVE R QU W W A H T C 4 5 R W R U W O A D W8 T E W W D W C R T E V W L AE H SSAPYB T H 2 WE O R B M W 2ND AVE D Y 7 N N 7 C Q Y H E R A A C R N D A N S H E D N B V D R 6 6 T C A S CSH 72) T H S N A P T C R A WA A W R W Y T H D NNA R W N 6 A R C N P M S D H W C P W 0 R T R WL S W T 7 S R O A U U B ) W L D A W W 64 H 2 D E R 8 S C S 7 2 E W W O S W K P NG PKWY RALSTON RD W 86TH G R 6 V A S T O 6H HWY 36W R W UH M 7 HARLANW.6000 TENNYSONW.4400UTICAW.4500VRAINW.4600WINONAW.4700WOLFFW.4800XAVIERW.4900YATESW.5000ZENOBIAW.5100SHERIDANW.5200AMESW.5300BENTONW.5400CHASEW.5500DEPEWW.5600EATONW.5700FENTONW.5800GRAYW.5900INGALLSW.6100JAYW.6200KENDALLW.6300LAMARW.6400MARSHALLW.6500NEWLANDW.6600OTISW.6700PIERCEW.6800QUAYW.6900REEDW.7000SAULSBURYW.7100TELLERW.7200UPHAMW.7300VANCEW.7400WEBSTERW.7500WADSWORTHW.7600YUKONW.7700YARROWW.7800ZEPHYRW.7900ALLISONW.8000AMMONSW.8100BALSAMW.8200BRENTWOODW.8300CARRW.8400CODYW.8500DOVERW.8600DUDLEYW.8700ESTESW.8800EVERETTW.8900FIELDW.9000FLOWERW.9100GARRISONW.9200GARLANDW.9300HOLLANDW.9400HOYTW.9500INDEPENDENCEW.9600IRISW.9700JELLISONW.9800JOHNSONW.9900KIPLINGW.10000KLINEW.10100LEEW.10200LEWISW.10300MILLERW.10400MOOREW.10500NELSONW.10600NEWCOMBEW.10700OAKW.10800OWENSW.10900PARFETW.11000PIERSONW.11100QUAILW.11200QUEENW.11300ROBBW.11400ROUTTW.11500SIMMSW.11600SWADLEYW.11700TABORW.11800TAFTW.11900UNIONW.12000URBANW.12100GORDONVANW.12200VIVIANW.12300WARDW.12400WRIGHTW.12500XENONW.12600XENOPHONW.12700YOUNGFIELDW.12800YANKW.12900ZANGW.13000ZINNIAW.13100ALKIREW.13200ARBUTUSW.13300BEECHW.13400BRAUNW.13500COLEW.13600COORSW.13700DEFRAMEW.13800DEVINNEYW.13900ELDRIDGEW.14000ELLISW.14100FIGW.14200FLORAW.14300GARDENIAW.14400GLADIOLAW.14500HOLMANW.14600HOWELLW.14700INDIANAW.14800ISABELLW.14900JOYCEW.15000JUNIPERW.15100KENDRICKW.15200YUCCAW.18100 YANKEEW.18000 YULEW.17900 WINDYW.17800 WILKERSONW.17700 WIERW.17600 VIRGILW.17500 VIOLETW.17400 UMBERW.17300 ULYSSESW.17200 TORREYW.17100 TERRYW.17000 SECRESTW.16900 SALVIAW.16800 RUSSELLW.16700 ROGERSW.16600 QUARTZW.16500 QUAKERW.16400 POPPYW.16300 PIKEW.16200 ORIONW.16100 ORCHARDW.16000 NOBLEW.15900 NILEW.15800 MOSSW.15700 MCINTYREW.15600 LUPINEW.15500 LOVELANDW.15400 KILMERW.15300 RALEIGHW.4200STUARTW.4300 REVISIONNO.DRAWNSHEETDATEPROJECTBYMANAGEROF E Overlay Program Crack Seal Slury Seal ADA and Concete Program DATEBY 1 2 3 4 DepartmentWorksPublic DivisionEngineering K. BOHAN C. 4/26/2022KELLEY OF11StreetsPrograms2022.mxdG:\GIS_Data\MXD\Public_Works\Streets\Maintenance\2022\22ST01 MAINTENANCESTREET 2022-PROGRAMS Rd.Ralston8101 80002ColoradoArvada, 720-898-7640Phone CK62ndWandSimms,80th,W.Added4/8/2022

10 PARKS FUND Parks Fund Overview The Parks Fund accounts for costs associated with the acquisition, design, development, maintenance and beautification of parks, open space and trails within the City. Revenues are derived from the City’s General Fund, Grants Fund, Apex and Jefferson County Open Space funds. Parks Fund Budget2022 As 06/30/22of As 06/30/21of Beginning Fund Balance $6,740,000 $6,740,000 OpenREVENUESSpace $6,075,271 $2,008,975 $1,826,726 City Cash Transfer 4,592,969 1,965,964 1,921,214 APEX Reimbursement 500,000 1,002,738Other 300,120 667,063 154,109 Total Revenues $11,468,360 $5,644,740 $3,902,049 OngoingEXPENDITURES $12,948,162 $5,535,149 $3,968,709 Capital 8,000 614Total Expenditures $12,956,162 $5,535,763 $3,968,709 Income/(Loss) (1,487,802) 108,977 (66,660) Ending Fund Balance $5,252,198 $6,848,977 • Overall revenues for Parks increased $1,742,691 or 44.7% over 2021, a majority due to the APEX reimbursement for athletic field maintenance done in 2021 and received in 2022 • Jefferson County Open Space increased $182,249 or 9.9% • In January 2022 the Parks Department transitioned athletic field programming from the APEX Recreation District to the Parks Department. This new revenue source has contributed $467,659 to the revenue increase. • Overall expenditures increased by 39.5% or $1,567,054 over 2021. • The purchase of vehicles and equipment for the addition of athletic field programming and for four new parks maintenance workers added to increase safety while performing park maintenance added $788,638. • The addition of athletic field programming has added $376,319 in expenses to the fund Expenditure Highlights Revenue Highlights $12,000,000$10,000,000$8,000,000$6,000,000$4,000,000$2,000,000$2018 2019 2020 2021 2022 2022 Budget APEX $- $- $- $- $1,002,738 $500,000 Cash Transfer $1,673,223 $1,774,297 $1,848,614 $1,921,214 $1,965,964 $3,897,969 Open Space $1,461,748 $1,488,269 $1,597,491 $1,826,726 $2,008,975 $6,075,271


• Use Tax increase arose from inflation and an increase construction
sales
increase.
for daily interest in
activities.
and
services are significantly increasing.
technology needs
11 SPECIAL REVENUE FUNDS Special Revenue Funds Overview Special Revenue Funds account for revenues that are to be used for specific purposes. The following funds are considered special revenue funds: Tax Increment Funds Budget2022 As 06/30/22of As 06/30/21of Beginning Fund Balance $15,927,000 $15,927,000 SalesREVENUESTax/Audit Revenue $10,198,818 $4,562,536 $4,186,291 Use Tax 2,018,619 1,231,366 955,083 Other 433,667 199,446 (72,768) Total Revenues $12,651,104 $5,993,348 $5,068,606 OngoingEXPENDITURES $13,440,642 $5,009,954 $4,757,194 Capital 24,289 6,334 14,448 Total Expenditures $13,464,926 $5,016,288 $4,771,642 Income/(Loss) (813,822) 977,060 296,964 Ending Fund Balance $15,113,178 $16,904,060 Tax Increment Funds Overview There are two tax increment funds which account for the voter-approved sales tax increases to fund expanded police services. The first accounts for the .21 cent sales and use tax and the second accounts for the .25 cent sales and use tax. Sources include sales tax, general use tax, auto use tax, building use and interest income. Since the tax increment is in addition to the City’s 3% sales tax, revenue trends in the tax increment fund will closely follow those in the general fund.
• Sales Tax revenue increased due to The price of goods and over the last year which directly related to the tax
• Ongoing expenditures increased due to the to the Computer Internal Service Fund. This fund in part is used to pay the of the Public Safety Department the of technology goods and
made in 2022.
cost
inflation.
is
in new
• Ongoing expenditures also
services has increased
contributions
increased due to trainings such as disability training, de-escalation training, and leadership training. • Community Development • Housing • Tax Increment Funds Expenditure Highlights Revenue Highlights
for
• Other revenue increased due to a larger accounting adjustment entry 2021 than the same entry

12 SPECIAL REVENUE FUNDS Community Development Fund Budget2022 As 06/30/22of As 06/30/21of Beginning Fund Balance $6,286,000 $6,286,000 RecoveredREVENUES $156,810 $211,716 $386,632 Grants 859,470 172,728 44,929 City Cash Transfer 45,000 26,725 22,500 Interest/Other 34,000 9,169 1,201 Total Revenues $1,095,280 $420,338 $455,262 OngoingEXPENDITURES $449,715 $156,974 $184,805 EssentialCDBG Home Repairs 392,050 173,056 161,293 CDBG Other 446,836 96,865 83,521 Emergency Rental Assistance - - 928,036 Total Expenditures $1,288,601 $426,894 $1,357,655 Income/(Loss) (193,321) (6,557) (902,392) Ending Fund Balance $6,092,679 $6,279,443 Community Development Overview The Community Development Fund accounts for all entitlements, revenues and expenditures of the Community Development Block Grants (CDBG) program and the Home Rehabilitation program and Essential Home Repairs program. • Overall revenues decreased by $34,925 or 7.7% from 2021. • Increases in interest rates in 2022 are responsible for the slowdown of Deferred Loan repayments compared to 2021. Repayment amounts decreased 45.2% compared to last year, or $174,916. • Grant revenue increased in 2022 due to additional spending on Homeless Hotel costs reimbursed under CDBG-CV program. The difference between the years is at $127,800, or 284.4%. • Overall expenditures decreased $930,877 which is a 68.6% decrease over 2021. • The decrease is due to the completion of the Emergency Rental Assistance program in 2021. • CDBG Program spending (Essential Home Repairs, Emergency Housing, Subgrants) increased in 2022 by $11,763 or 7.3% due to spending on Emergency Shelter for Homeless under CDBG-CV program. • Two essential home repair projects were completed during the second quarter of 2022, the same as 2021. The wait list for essential home repairs is at 60 applications as of June 30, 2022. • Ongoing expenses decreased 15.1% due to a change in staffing. Expenditure Highlights Revenue Highlights
13 SPECIAL REVENUE FUNDS Arvada Housing Authority Arvada Housing Authority Budget2022 As 06/30/2022of As 06/30/2021of Beginning Fund Balance $247,000 $247,000 RecoveredREVENUES $14,400 $6,903 $9,090 Grants 5,823,395 3,330,995 3,043,870 Transfers (Rev) 75,000 -Interest/Other 1,000 212 31 Total Revenues $5,913,795 $3,338,110 $3,052,990 OngoingEXPENDITURES $809,544 $169,868 $163,898 Rents 4,979,205 2,871,041 2,842,226 Transfers (Exp) 38,535 10,808 18,057 Total Expenditures $5,827,284 $3,051,717 $3,024,181 Income/(Loss) 86,511 286,393 28,809 Ending Fund Balance $333,511 $533,393 Overview The Authority administers funds received for rent subsidy to low/moderate income households under Section 8 of the U.S. Housing Assistance Payment Program. • Overall revenues increased $285,119 or 9.3% over 2021. • Grants revenue increased $287,125 or 9.4% from 2021 due to rising rental costs in the Arvada area and the addition of the Mainstream voucher program during 2021 which aids families with disabled members. • For the first half of 2022 there have not been transfers from the General Fund or Community Development fund due to staffing changes, this matches 2021. • Overall expenditures increased $27,536 or .9% over 2021. • Rent expenditures slightly increased by $28,815 or 1.0%. • The Arvada Housing Authority served 433 families during 2022 while 445 were served during the same period in 2021. The Housing Authority also served 35 families with disabled family members through the Mainstream voucher program, 2 vouchers less than last year. The waitlist was opened in 2021 and there are 808 people on it. The Housing Authority can help up to 508 families. Expenditure Highlights Revenue Highlights
14 CAPITAL IMPROVEMENTS PROJECTS FUND Capital Improvement Projects (CIP) Fund Overview Capital Improvement Fund Budget2022 As 06/30/22of As 06/30/2021of Beginning Fund Balance $48,394,048 $48,394,048 TransfersREVENUES $8,103,150 $369,057 $740,343 Grants and Recovered Costs - 108,791 912,063 Contributions - 101,845 4,987,202 Interest 300,000 281,628 271,058 Total Revenues $8,403,150 $861,321 $6,910,666 CIPEXPENDITURESAdministration $2,346,993 $304,658 $201,605 CIP Technology $238,810 $438,806 $636,255 CIP Street Projects 1,560,641 297,364 1,039,202 CIP Traffic Projects 7,713,690 212,077 962,405 CIP Park Projects 4,992,667 (6,198) 137,516 Total Expenditures $16,852,801 $1,246,707 $2,976,983 Income/(Loss) (8,449,651) (385,386) 3,933,683 Ending Fund Balance $39,944,397 $48,008,662 • Transfers are from the General Fund for a project to remodel the second floor at City Hall. • Contributions reflect traffic impact fees and development fees that are designated for specific capital projects. • Grants and recovered costs are reimbursements from other agencies that have shared in the cost of a project. • Administration expenditures are related to improvements to the KATV control room and ADA compliance at City Hall and the Arvada Center. • Technology expenditures are related to the fiber conduit boring project. • Streets expenditures are related to the streets master plan and guardrail rebuilds. • Traffic expenditures are related to the traffic signal rebuilds, school safety and the Alkire Street trail. The Capital Improvement Projects Fund accounts for capital projects for streets, traffic, and parks. Expenditure Highlights Revenue Highlights CIP$438,806Technology AdministrationCIP$304,658 CIP$297,364ProjectsStreets CIP$212,077ProjectsTraffic
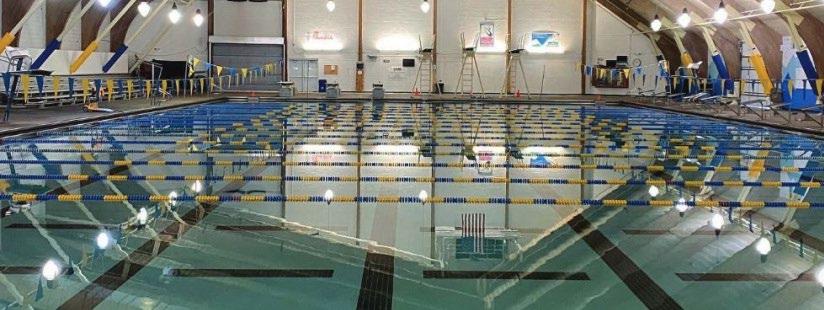
Project Meyers Pool Replacement: Meyers pool is over 40 years old and serves 160,000 to 170,000 swimmers each year. Repairs to the pool have become more costly and parts to repair the pool are even harder to find. In 2021, the City, Jefferson County Schools and the APEX signed an agreement to participate in funding and operation of a new pool. The City and Jefferson County Schools will share equally in the cost to construct the new pool; the City will own the pool. APEX will continue to operate the daily activities of the new pool. The pool will be located at the existing Meyers Pool site; the current pool will remain in operation until the new pool opens which is scheduled for the fourth quarter, 2024. The project is currently in the design phase.
CAPITAL IMPROVEMENTS PROJECTS FUND
Updates
15
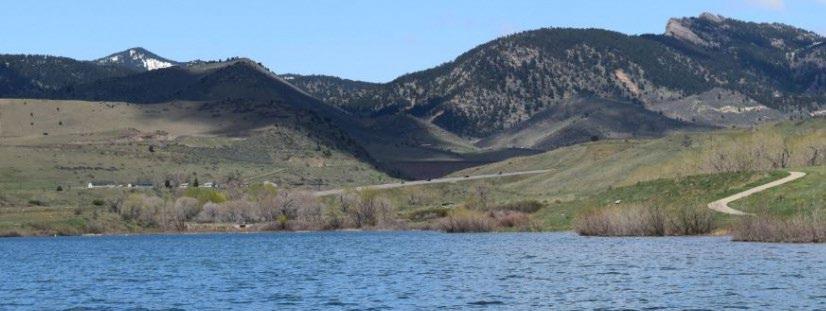
16 ENTERPRISE FUNDS Water Fund Overview The Water Fund accounts for all activities within the scope of the water utility operations including administration, operations, capital water projects, financing and related debt service and billing and collection. $36,514,560 of the Fund Balance is a cash escrow reserved in Denver Water’s name and related to the Gross Reservoir expansion. The Water Fund’s overall obligation is expected to total $117 million through 2026. Water Fund Budget2022 As 06/30/22of As 06/30/21of Beginning Fund Balance $99,967,000 $99,967,000 WaterREVENUESCharges $26,790,444 $8,561,311 $6,664,763 Tap Fees 3,668,479 2,672,620 1,796,417 Interest 896,689 475,432 470,786 Other 1,559,423 7,030,052 505,593 Total Revenues $32,915,035 $18,739,415 $9,437,558 OngoingEXPENDITURES $25,369,880 $8,973,645 $8,778,098 Debt Service - -Major Capital Maintenance 5,959,997 980,390 1,312,645 Capital 32,807,292 4,584,138 8,978,982 Total Expenditures $64,137,169 $14,538,174 $19,069,725 Income/(Loss) (31,222,134) 4,201,242 (9,632,167) Ending Fund Balance $68,744,866 $104,168,242 • Water Charges revenue has increased as a result of an increase in consumption. The increase in water consumption is partially due to several months in 2022 being hotter and dryer than the same months in 2021. • Tap Fees revenue increase due to the surge in new construction. Residential and commercial construction in the first half of 2022 was more than the first half of 2021. • Other revenue increased due to a large payment received from Canyon Pines MD for a pump station construction project. • The Ongoing expenditures are comparable with the expenditures in 2021. • Capital expenditures decreased due to large payments for the Ralston Water Pump Station and Pipeline project made in 2021 compared to the lower total amount of payments for other capital projects in 2022. Expenditure Highlights Revenue Highlights
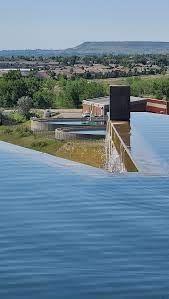
17 ENTERPRISE FUNDS Wastewater Fund Overview The Wastewater Fund accounts for all activities necessary in the collection, transmission and disposal of sewage and wastewater. • Sewer Charges revenue increased as a result of the new 2022 rate schedule. • Other revenue increased due to a retainage fee being refunded from Jefferson Center Metropolitan District (JCMD) for the Alkire Lift project. • The Metro District expenditure line item increased due to a significant price increase from Metro Water Recovery. Their costs have increased and they pass them along to their customers. • Ongoing expenditures increased because of the additional engineering positions needed for new capital projects which are in the initial phases. Wastewater Fund Budget2022 As 06/30/22of As 06/30/21of Beginning Fund Balance $13,262,000 $13,262,000 SewerREVENUESCharges $12,707,789 $6,249,235 $5,896,538 Tap Fees 386,421 179,821 185,515 Interest 178,650 162,892 162,763 Other 1,476,176 844,143 723,708 Total Revenues $14,749,036 $7,436,090 $6,968,524 MetroEXPENDITURESDistrict $9,490,000 $5,000,870 $4,166,827 Ongoing 4,184,206 1,514,780 1,346,113 Major Capital Maintenance 3,945,282 1,254,449 1,156,767 Capital 7,385,568 97,943 (127,849) Total Expenditures $25,005,056 $7,868,042 $6,541,859 Income/(Loss) (10,256,020) (431,952) 426,665 Ending Fund Balance $3,005,980 $12,830,048 Expenditure Highlights Revenue Highlights
18 ENTERPRISE FUNDS Stormwater Fund Overview The Stormwater Fund accounts for all activities necessary to maintain a stormwater management plan. • Stormwater Fee revenue is comparable to the previous year’s revenue. The rate did not change for 2022. • Other revenue decreased due to a larger accounting adjustment entry for daily interest in 2021 than the same entry made in 2022. • Ongoing expenditures increased because of additional positions needed for new capital projects. • Capital expenditures increased due to the larger payments for the Ralston Creek at Ward Road project in 2022 compared to the payment made for the Drainage and Flood Control Improvements capital project in 2021. Stormwater Fund Budget2022 As 06/30/22of As 06/30/21of Beginning Fund Balance $10,851,000 $10,851,000 StormwaterREVENUES Fee $3,935,577 $1,967,596 $1,948,692 Other 102,299 41,445 182,868 Total Revenues $4,037,876 $2,009,041 $2,131,560 OngoingEXPENDITURES $4,178,024 $908,699 $786,522 Debt Service 862,107 431,054 433,233 Capital 4,496,379 702,617 608,623 Total Expenditures $9,536,510 $2,042,370 $1,828,379 Income/(Loss) (5,498,634) (33,329) 303,182 Ending Fund Balance $5,352,366 $10,817,671 Expenditure Highlights Revenue Highlights
19 ENTERPRISE FUNDS Golf Fund Overview The Golf Course Fund accounts for all revenues and expenses of the Lake Arbor and West Woods Golf Courses, including food service operations. Golf Rounds by Type - January - June Golf Fund Budget2022 As 06/30/22of As 06/30/21of Beginning Fund Balance $33,000 $33,000 GolfREVENUESCourses $4,326,245 $2,085,982 $1,825,942 Restaurants 2,073,722 1,035,905 763,805 Construction Revenue - -City Cash Transfer 324,294 149,352 137,261 Total Revenues $6,724,261 $3,271,240 $2,727,008 GolfEXPENDITURESCourses $2,525,344 $1,144,515 $991,974 Restaurants 2,100,918 860,566 729,547 Administration 2,499,043 1,284,049 1,190,463 Capital - - 12,075 Total Expenditures $7,125,305 $3,289,131 $2,924,059 Income/(Loss) (401,044) (17,891) (197,051) Ending Fund Balance $(368,044) $15,109 • Overall revenues increased in the 2nd quarter 2022 $544,232 or 19.9% from 2021 • Golf course revenue increased 14.2% or $260,040 from 2021. Golf rounds played increased by 4% • Restaurant revenue increased $272,100 or 35.6% from 2021 • People are feeling more comfortable going to restaurants, and West Woods was finally able to accommodate guests at full capacity. • Overall first quarter expenditures increased $365,072 or 12.5% over 2021. • Golf Course expenditures increased $152,541 or 15.4% due to the increase in golf rounds played and the higher support costs. • Restaurant expenditures increased $131,020 or 17.9% due to the increased operational costs related to higher revenue sales SupportPlayer SuperAnnualsUsers SuperClubsUsers CorpTournament/Leagues GrowGamethe Total West Woods 2021 22,322 3,419 - 567 80 26,388 2022 24,075 3,153 - 324 101 27,653 Variance 1,753 (266) - (243) 21 1,265 8% -8% 0% -43% 26% 5% Lake 2021Arbor 10,152 4,556 - - - 14,708 2022 10,777 4,172 - 187 - 15,136 Variance 625 (384) - 187 - 428 6% -8% 0% 0% 0% 3% Combined Rounds Total 2021 32,474 7,975 - 567 80 41,096 2022 34,852 7,325 - 511 101 42,789 Variance 2,378 (650) - (56) 21 1,693 7% -8% 0% -10% 26% 4% Expenditure Highlights Revenue Highlights
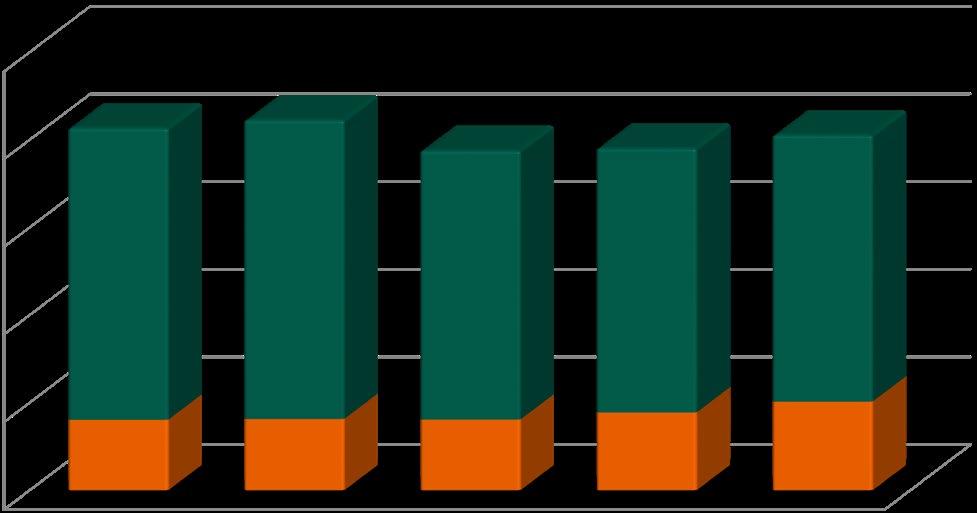
20 ENTERPRISE FUNDS Solid Waste Fund Overview In 2020, the Arvada City Council approved a new waste and recycling program. The City entered into an agreement with a single trash company to provide waste and recycling collection for residents. The trash and recycling services started in July 2021 Solid Waste Fund Budget2022 As 06/30/22of As 06/30/21of Beginning Fund Balance $727,000 $727,000 ChargesREVENUES&Fees $6,078,968 $2,070,219 $Other 532,800 2,170Total Revenues $6,611,768 $2,072,389 $OperatingEXPENDITURES $5,748,249 $1,791,854 $81,123 Debt Services 490,000 -Other - -Total Expenditures $6,238,247 $1,791,854 $81,123 Income/(Loss) 373,521 280,535 (81,123) Ending Fund Balance $1,100,521 $1,007,535 • The Operating expenditures are the charges for the solid waste hauling services provided by Republic Services, the daily operations of the City’s personnel and the drop off events. Expenditure Highlights Revenue Highlights • Revenues are only in 2022 due to trash and recycling services not beginning until July 2021.
21 INTERNAL SERVICE FUNDS Internal Service Funds Overview There are five Internal Service Funds – Insurance Fund (Risk Management), Computer Fund, Print Services Fund, Vehicles Fund and Building Fund. Internal Service Funds charge internal programs and departments for use of goods and services. The Funds then pay for all associated costs of things such as purchasing insurance, vehicle purchases and maintenance, computer purchases and maintenance, and buildings maintenance. *Per GASB Statement 10, an additional $2,518,436 in cash is currently held in the Risk Management fund to cover potentially incurred liabilities as of the beginning of the year. This figure was reached by the Risk Management’s actuary for year ending 2021 Insurance Fund TheOverviewInsurance Fund, administered by the Risk Management Program of the City Attorney’s Office, accounts for the City’s self-insurance against loss. It is funded with contributions by all City departments and programs based on their levels and types of exposure. The Fund is also used for loss prevention programs, the protection of City personnel and the preservation of City property and assets. • Revenues increased $37,789 or 2.9% over 2021. • The increase is primarily due to the increase in contributions from other funds. • Overall expenditures increased $582,989 or 49.3% over 2021. • Workers compensation claims increased $111,617 over 2021 due to an increase in claim costs. • Liability claims increased $131,788 due to increased insurance premiums and the payment of some large claims due to a large water main break. • Property claims increased $363,919 due to increased insurance premiums, smoke mitigation and repairs due to a fire at the Community Table building and claims due to a sewer back up. Insurance Fund Budget2022 As 06/30/22of As 06/30/21of Beginning Fund Balance $2,788,000 $2,788,000 ContributionsREVENUES $2,518,422 $1,259,212 $1,206,540 Interest 60,000 27,166 38,395 Other - 43,342 46,996 Total Revenues $2,578,422 $1,329,720 $1,291,931 RiskEXPENDITURESManagement Administration $2,051,314 $1,764,723 $1,181,734 Risk Management Operations 438,821 174,648 166,761 Total Expenditures $2,490,135 $1,939,371 $1,348,495 Income/(Loss) 88,287 (609,651) (56,564) Ending Fund Balance $2,876,287 $2,178,349 Expenditure Highlights Revenue Highlights
22 INTERNAL SERVICE FUNDS Computer Fund TheOverviewComputer Fund provides resources for both ongoing maintenance and replacement of the City’s computers, network hardware, and other electronic infrastructure. It is funded with contributions by all City departments based on their levels of use of this technology. • Contributions to this Internal Service Fund from the City’s departments were increased starting this year to accommodate for the price increases from the businesses that provide our technology needs. The increase in Maintenance and Replacement revenues represents the higher prices we have experienced and those we have estimated to occur. • Maintenance expenditures increased from additional cybersecurity safeguards added in 2022. • Total expenditures in 2022 are in-line with the previous year’s expenditures. Computer Fund Budget2022 As 06/30/22of As 06/30/21of Beginning Fund Balance $8,265,000 $8,265,000 MaintenanceREVENUES $2,594,520 $1,318,264 $838,814 Replacement 5,558,429 1,299,973 775,775 Other 587,000 134,445 (37,785) Total Revenues $8,739,949 $2,752,681 $1,576,803 MaintenanceEXPENDITURES $2,871,630 $1,041,397 $949,366 Replacement 2,708,659 183,765 237,289 Other 104,085 37,126 14,955 Total Expenditures $5,684,374 $1,262,289 $1,201,610 Income/(Loss) 3,055,575 1,490,393 375,193 Ending Fund Balance $11,320,575 $9,755,393 Expenditure Highlights Revenue Highlights
23 INTERNAL SERVICE FUNDS Vehicle Fund TheOverviewVehicles Fund provides resources for the maintenance and replacement of City vehicles and heavy equipment. It is funded with contributions by all City departments based on their vehicle inventory and use • Overall revenues increased 7.1% from last year in the same time period. This is largely due to transfers from other departments for the purchase of new vehicles not included in the annual replacement contributions or increases in purchase costs related to inflation . • Expenditures have increased slightly, 2.7% over 2021. In the second quarter of 2022, the City purchased: • Chip truck for Parks • Turf equipment for Parks • Two police motorcycles • Bobcat for Parks • Dump truck for Utilities operations Vehicles Fund Budget2022 As 06/30/22of As 06/30/21of Beginning Fund Balance $6,260,000 $6,260,000 MaintenanceREVENUES Contributions $2,626,363 $1,197,681 $1,321,427 Replacement Contributions 4,036,872 2,366,555 1,483,219 Other 148,000 117,955 633,624 Total Revenues $6,811,235 $3,682,191 $3,438,270 MaintenanceEXPENDITURES $2,794,685 $1,437,800 $1,442,998 Replacement 4,810,635 1,419,203 1,337,861 Total Expenditures $7,605,320 $2,857,003 $2,780,859 Income/(Loss) (794,085) 825,188 657,411 Ending Fund Balance $5,465,915 $7,085,188 Expenditure Highlights Revenue Highlights
24 INTERNAL SERVICE FUNDS Buildings Fund • Revenues include savings related to the Ameresco Energy Performance contract being transferred to the Buildings fund to help offset the original construction costs. Other revenues include rebates associated with the Ameresco Energy Performance contract and interest on investments • Replacement spending includes condensers at the Arvada Water Treatment Plant and HVAC renovations at the Olde Wadsworth Shops. The large expenditure item in Equipment in 2021 was the final payment on the completion of the Ameresco Energy Performance contact TheOverviewBuildings Fund provides resources for maintaining major portions of facility infrastructure as replacement becomes necessary. The primary types of infrastructure are HVAC equipment, parking lots, roofs, and carpet. It is funded with contributions by all City departments based on their facility occupancy Building Fund Budget2022 As 06/30/22of As 06/30/21of Beginning Fund Balance $(57,237) $(57,237) ReplacementREVENUES Transfers $1,051,090 $320,224 $325,034 Other 42,000 386 1,211 Total Revenues $1,093,090 $320,610 $326,245 PersonnelEXPENDITURES $67,506 $28,679 $30,809 Replacement 443,731 78,887 3,150 Equipment - - 244,404 Total Expenditures $511,237 $107,567 $278,363 Income/(Loss) 581,853 213,043 47,882 Ending Fund Balance $524,616 $155,806 Print Services Fund TheOverviewPrintServices Fund provides ongoing operational support for the City’s printing needs. • Overall revenue decreased 4.5% from 2021. • Printing revenue decreased 4.4% from 2021 due to fewer print jobs in 2022. • Copier revenue decreased 4.5% from 2021 due to lower use of copiers in 2022. • Overall expenditures increased .9% over 2021. • Printing expenditures increased 5.1% over 2021 primarily due to an increase in internal service fund charges to cover risk management, building and vehicle use. • Copier expenses decreased 9.9% from 2021 due fewer supply purchases and lower repair and maintenance expenditures. • There is $96,000 budgeted for equipment replacement in 2022; however, the equipment will not be replaced until 2023. Print Services Fund Budget2022 As 06/30/22of As 06/30/21of Beginning Fund Balance $374,000 $374,000 PrintREVENUESShop $200,000 $96,126 $100,687 Copiers 135,000 59,670 62,445 Total Revenues $335,000 $155,795 $163,132 PrintEXPENDITURESShop $260,504 $107,103 $101,893 Copiers 87,021 35,932 39,904 Equipment 96,000 -Total Expenditures $443,525 $143,035 $141,797 Income/(Loss) (108,525) 12,761 21,335 Ending Fund Balance $265,475 $386,761 Expenditure Highlights Revenue RevenueExpenditureHighlightsHighlightsHighlights
• The new east 12” waterline was connected at Brentwood. The remaining lateral work to install new fire hydrants will occur after the traffic lanes are shifted to the north.
• The following activities were completed on the north side of Ralston between Balsam and Yukon: asphalt and concrete removal; pouring of concrete driveways, sidewalks, curb and gutter, and ramps; roadway excavation, subgrade prep, geogrid and base course installation, and paving of lower lifts of roadway
Description: Ralston Road is an arterial roadway and a major east-west corridor for Arvada’s transportation network, serving 23,000 vehicle trips each day. It provides connectivity to major northsouth corridors including three State Highways. The Regional Transportation District (RTD) operates five bus lines using portions of Ralston Road. The Citizens Capital Improvement Plan Committee has twice ranked Ralston Road improvements as the number one transportation priority and recommended it for funding to the City Council. The project also addresses concerns expressed in recent Arvada Citizen Surveys. The 2014 Comprehensive Plan generated transportation models indicating that the congestion, operation, and safety of Ralston Road will deteriorate with the build-out of the City, and roadways will perform at the lowest levels of services
• Sanitary sewer and water line connections completed.
• The north side of Carr, Brentwood, and Balsam are closed at Ralston.
• The City lost one valuation trial. The final cost will be determined in August. The other case may settle out of court.
Wet Utilities:
Ralston Road Budget Actual Remaining Design $1,809,992 $1,950,166 $(140,174) Right-of-Way 4,861,539 4,479,490 382,049 Construction 10,540,410 4,741,185 5,799,225 Miscellaneous 671,059 200,125 470,934 Total Project $17,883,000 $11,370,965 $6,512,035 Ralston Road 72nd Avenue
•Drainage: The storm sewer system, including pipe, manholes, and inlets, was completed on the north side of Ralston Rd between Estes and Carr
• Lumin8 continued signal work at the Carr, Balsam, and Allison intersections.
• Fire hydrants installed at Everett, Estes, Dudley, and Dover.
• The overhead conversions by Xcel Energy, Lumen and Comcast are approximately 98% complete.
25 OnOverview:November 6, 2018 the citizens of Arvada approved Ballot Issue 3F to fund improvements to Ralston Road and West 72nd Avenue. Municipal bonds are commonly used by cities to fund capital improvement projects. In 2018, the City finished paying off a previous bond issue, freeing up $4.5 million in annual payments already accounted for in the City’s current budget. “Debt re-authorization” allows the money from the previous bond to be applied to a new bond whose funds will be used for these new capital improvement projects 3F BOND PROJECTS
• The following activities were completed on the south side of Ralston between Garrison and Estes: asphalt and concrete removal
Ralston Court (Private Development):
Challenges:
• The City continues to receive calls from citizens about the inconvenience of the construction zone. Through the City’s social media outlets, the project webpage, and direct contact with project team members, the City attempts to explain the challenges of the construction zone. The project team recognizes the challenges with a construction zone and the City and Contractor teams are taking all reasonable steps to avoid as much inconvenience as possible.
• Ammons and Allison intersections reopened
Roadway:Progress:
• Developers along this stretch of Ralston are keen to complete their sub-surface utility work before Ralston is paved and the City’s pavement moratorium begins. Hamon was hired by the Ralston Court developer to complete the sanitary sewer and water line connections. This caused an approximately two-week delay to the City’s project.
Next Steps:
• Once the north widening is completed, Hamon will shift traffic to the north in late August and will work on the south side for the second phase of the project.
Dry Utilities:
Ralston Road - Yukon to Garrison Bond Project
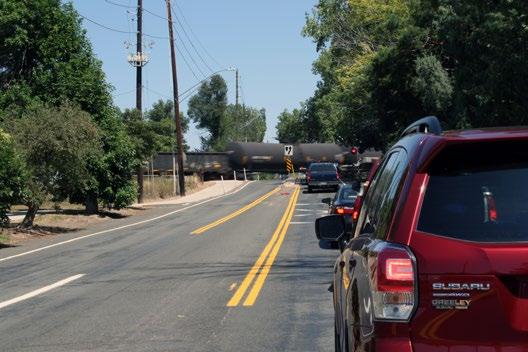
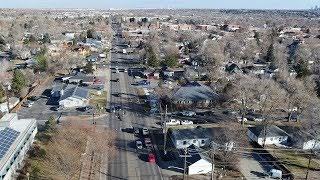
W. 72nd Avenue Bond Project Description: W. 72nd Avenue is an arterial parkway and a major east-west corridor for Arvada’s transportation network, serving 21,000 vehicle trips each day. It provides connectivity to major north-south corridors including three State Highways. The regional corridor not only serves all of Arvada, it provides access to Westminster and Golden/Jefferson County. The Citizens Capital Improvement Plan Committee twice ranked improvements to W. 72nd Avenue as a high priority. The project also meets concerns expressed in recent Arvada Citizen Surveys. The 2014 Comprehensive Plan generated transportation models indicating the congestion, operations, and safety of W. 72nd Avenue will deteriorate with the build-out of the City and roadways will perform at the lowest levels of service.
Other Challenges:
26 3F BOND PROJECTS 72nd Avenue Budget Actual Remaining Design $2,915,584 $4,602,005 $(1,686,421) Right-of-Way 5,550,000 5,576,465 (26,465) Professional Services 2,695,226 1,647,353 1,047,873 Construction 53,339,190 3,725,559 49,613,631 Total Project $64,500,000 $15,551,381 $48,948,619
Next Steps:
• UPRR has returned 60% bridge plans with comments. Plans are to be resubmitted 8/5.
• Construction Package 2 - CP-2 (Swadley to Oak). Work includes utilities and full roadway reconstruction. 100% Plans signed/stamped were received in February 2022. CP-2 began in March. Currently, detour pavement has been established and traffic has been moved to the north side of the road. Storm sewer and water line construction is well underway with walls to begin construction 8/8. Some delays have been experienced due to dry utility companies’ failure to relocate their facilities. CP-2 is $22.6 million
• For the underpass excavation component of CP-3, the project team is developing a plan to mitigate underpass excavation and dewatering issues and possible environmental issues. Options include discharging groundwater to the public sanitary sewer system and treating for heavy metals using a Baker Truck removal system, thus allowing discharge into the storm sewer system. A possible test hole is being considered at a City-owned property at the 72nd and UPRR intersection to better understand the dewatering method needed to waterproof the underpass excavation limits.
• Continue development of a construction organizational chart to allow the City team to forecast construction staffing needs for the different construction packages. Inspections will be a combination of City staff and Owner’s Rep staff.
•Progress:Construction Package 1 - CP-1 (tree removal, utility relocation for the entire corridor, and new utilities). Xcel, Comcast, and Lumen are working to relocate utilities in the corridor. Xcel 1% electric work started in November 2021 completed a critical path by removing certain poles so that SEMA CP-2 work could begin. A revised end date to the SEMA contract has been established as June 6, 2022 due to the Xcel, ROW acquisition, and Union Pacific Rail Road (UPRR) delays. SEMA has met their contract deadline and is complete with CP-1.
• Continue working with the UPRR to have them review plans in a timely manner and to get the on-site visit site review complete. The City to begin negotiation of the C & M (Construction and Maintenance) Agreement in late 2022.
• The citizens of Arvada continue to be interested in the construction progress. The City’s team of representatives continues to respond to all inquiries in a professional and timely fashion.
• Sonheim Underground Stream - The project team is assessing how the underpass may cut off underground stream flow to several properties on the south side of 72nd. A french drain is being proposed to recharge the water table in that location. Assessments are ongoing.
• All Notices of Intent (NOIs) have been delivered. Of the 72 Parcels impacted, 70 offers have been accepted or have closed. Of the remaining 2 parcels, 1 is in the condemnation process, 1 other may go to condemnation, however, the City remains committed to working with the property owner to successfully settle the issues
Project Challenges:
• One citizen experienced some mud wash into her backyard from the construction area due to a large rain storm. Additional protections have been put in place to prevent this from happening again.
• Construction Package 3 - CP-3 (Oak to Kipling, including the UPRR underpass) has five components: 1) bridge structure; 2) railroad shoofly; 3) temporary vehicular bypass; 4) roadway design plans; and 5) Construction and Maintenance Agreement (C & M Agreement), which are at varying stages of review by UPRR and the City. UPRR reviews have been occurring outside the expected timelines. The bridge abutment will be redesigned to a style which UPRR is more comfortable with. 60% bridge plans have been returned with comments from UPRR and will be resubmitted 8/5. Anticipated NTP is Q2 of 2023
• Project scheduling will remain fluid until there is a better understanding of the UPRR coordination and response time and Xcel Energy’s utility relocation delays. Construction Package 2 underway. UPRR reviews and timelines continue to be unpredictable
• The project team continues to work with dry utility contractors to get their infrastructure relocated and to keep our contractor, SEMA, moving on the roadway and utility portion of the project Right of Way (ROW):
• Continue coordination efforts with stakeholders, including the UPRR, Xcel Energy, Jefferson County School District, and Lincoln Academy, to allow a smooth transition from design to construction
27 CITY OF ARVADA INVESTMENT REPORT
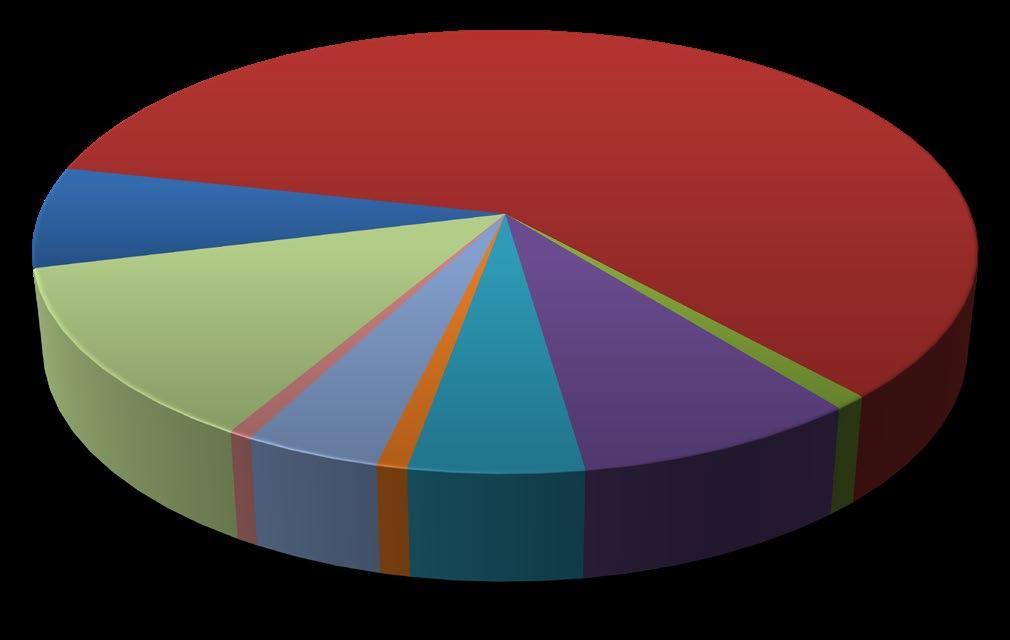
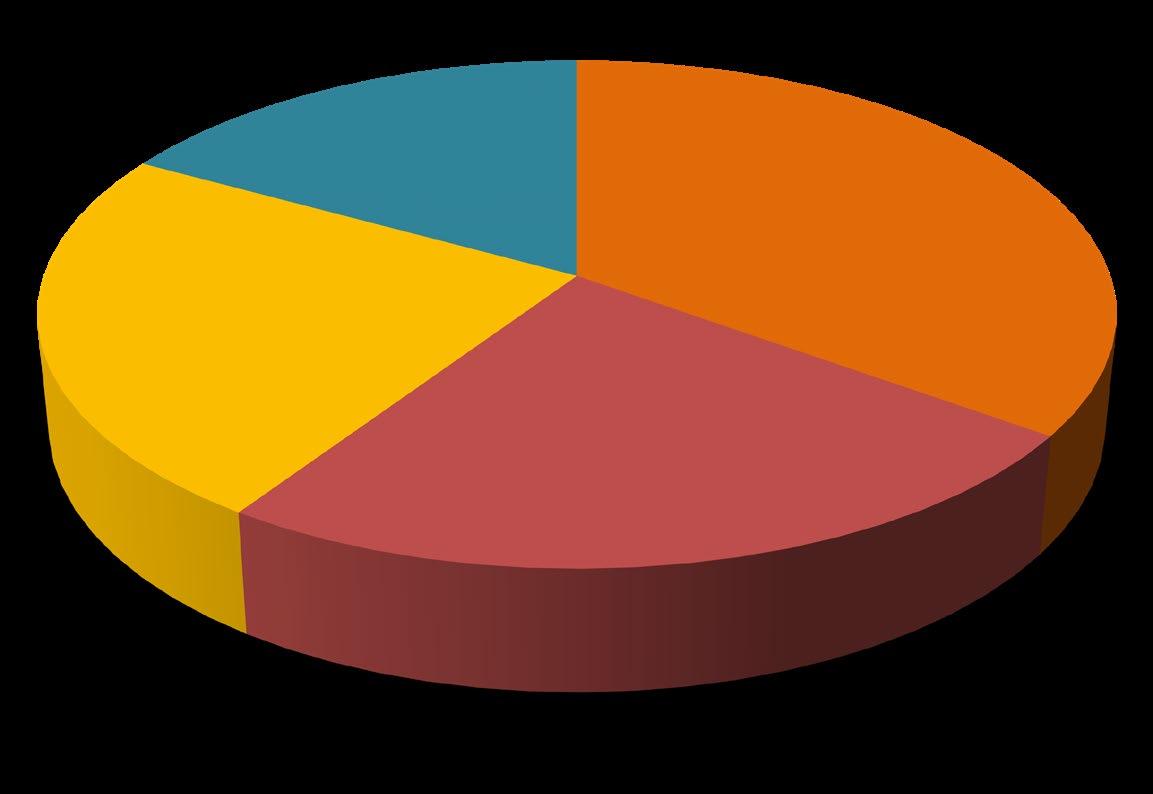
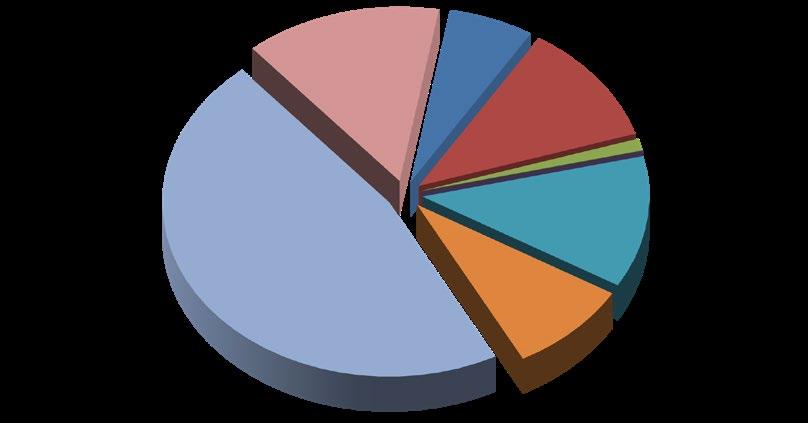
PORTFOLIO CHANGES Par Value as 06/30/2022of Par Value as 6/30/2021of Difference CITY-MANAGED PORTFOLIO CashMM/Savings/ $17,559,772 $2,519,937 $15,039,835 LGIP 32,615,214 37,886,978 (5,271,764) Time CD 3,204,308 6,917,150 (3,712,842) Corporate 23,669,000 30,661,000 (6,992,000) Municipal 21,850,000 9,255,000 12,595,000 US Agency 115,000,000 85,000,000 30,000,000 US Treasury 20,000,000 7,000,000 13,000,000 Subtotal - City $233,898,294 $179,240,064 $54,658,230 PFM-MANAGED PORTFOLIO Negotiable CD $- $1,070,000 $(1,070,000) Corporate 11,670,000 8,638,000 3,032,000 Municipal 3,480,000 2,575,000 905,000 US Agency 19,245,000 15,740,000 3,505,000 US Treasury 20,460,000 24,775,000 (4,315,000) Subtotal - PFM $54,855,000 $52,798,000 $2,057,000 SUMMARY OF CONSOLIDATED PORTFOLIO CashMM/Savings/ $17,559,772 $2,519,937 $15,039,835 LGIP 32,615,214 37,886,978 (5,271,764) Time CD 3,204,308 6,917,150 (3,712,842) Negotiable CD - 1,070,000 (1,070,000) Corporate 35,339,000 39,299,000 (3,960,000) Municipal 25,330,000 11,830,000 13,500,000 US Agency 134,245,000 100,740,000 33,505,000 US Treasury 40,460,000 31,775,000 8,685,000 Total - Combined $288,753,294 $232,038,064 $56,715,230 CONSOLIDATED MATURITY DISTRIBUTIONCONSOLIDATED PORTFOLIO ALLOCATION MM/Savings/Cash6.1% 11.3%LGIPTime MunicipalCorporate1.1%CD12.2%8.8%US46.5%Agency US 14.0%Treasury 25.0%20.0%15.0%10.0%5.0%0.0% 0-.25 .25-1 1-2 2-3 3-4 4-5 19.5% 5.3% 14.2% 24.7% 21.9% 14.4% Maturity (years)
The second quarter of 2022 continued to be focused around high inflation, labor force challenges, and the Fed’s tightening policy. The CPI index reached its highest level in 40 years coming in at 9.1% in June. In order to stem inflation FOMC raised the federal funds rate by 50 basis points (bps) in May and 75 bps in June bringing the target range to 1.50-1.75%. Starting June 1, the Fed also started executing its plans to shrink the balance sheet by reducing its holdings in Treasuries, Agencies and agency mortgage-backed securities. The consumer confidence index dipped significantly in June driven primarily by high prices of gas, food and shelter which effect the most vulnerable population. The federal unemployment rate kept steady at 3.6%. Despite the workers shortage, the labor market remained strong adding jobs well over the estimates. The City’s combined investment portfolio grew by over $50 million in the last year to a total of almost $289 million. The portfolio is well diversified within all the allowable by investment policy sectors. Two thirds of the portfolio is allocated to US Agencies and Treasuries, followed by 12.2% in corporate debt and 11.3% in LGIPs. $7 million of LGIP total balance is invested in term products with competitive yields that are laddered out from 3 to 9 months. The spreads on callable agencies have widened significantly too. The city added a few securities to the portfolio with a lock out period of 1 or 2 years. As of June 30, liquidity levels are above the target of 12% due to proceeds from maturities at the end of the period that have not been reinvested.
Investment Portfolio Objectives
As stated in the City’s investment policy, the primary objectives of the City’s investment activities, in priority order, is safety, liquidity and yield. Consistent with this policy, the portfolio of securities is invested in U.S. Treasuries, U.S. Agencies; local government investment pools (LGIPs), commercial paper, certificates of deposit and corporate debt subject to rating restrictions and concentration limits which are outlined in the City’s investment policy. The City-managed investment portfolio is administered to provide sufficient liquidity to meet all reasonably anticipated operating cash needs without selling securities prior to maturity. The portfolio overseen by PFM is actively managed which means that investments may be sold prior to maturity and reinvested in order to achieve the desired duration, yield or diversification of the portfolio.
Maturity distribution graph shows a bell-shaped allocation, with majority of investments in a 2-3 year bucket. As interest rates start to peak, the city will focus on longer term buckets.
• Investment-grade corporate spreads are getting wider and may look more attractive in 2022. The City will be selective in this sector but will look to re-invest few bonds as the current corporate bonds mature.
• The City will continue to utilize LGIPs for its excess cash. The yields in the LGIP pools are expected to rise along with the Fed interest rates.
• The supply in municipal bonds sector will slow down with the increasing interest rates. It may be more challenging to get a significant allocation to the taxable Munis. The city will continue to look for the opportunities in this sector.
• The Federal Agencies’ spreads have been lifting especially on the callable options. With the rising interest rates the risk of securities being called before maturity is lower. The City will look to increase its allocation to callable Agencies in the shorter maturity buckets while balancing it with the bullets (noncallable) on the longer end. There has been no significant change to the duration of the portfolio when compared with the first quarter of 2022. The current duration of the city’s portfolio is 2.28 years, which decreased from 2.33 years. PFM portfolio increased from 2.32 to 2.34 years. Yield-to-maturity (YTM) at cost and YTM at market shows a big gap indicating how much the securities in the portfolio have decreased in value. The current unrealized loss on the total portfolio sits at a little over $11 million. The good news is that maturing securities are getting reinvested into much higher yields. In the first half of the year the City earned a total of $1.56 million in investment earnings. The average year-to-date yields on the city’s and PFM portfolio were 1.14% and 1.16% respectively. The yield on the PFM portfolio has decreased by 29 bps, which also resulted in decrease in its portfolio earnings. In the rising rates environment and flattening Treasury yield curve, most securities in the portfolio are under water and that limits active trading opportunities. It is also a longer term portfolio and is inherently exposed to a higher interest rate risk. While the average yield on the city’s portfolio decreased, the benchmark portfolio increased by 55 bps which is reflective of the increasing rates. The city’s portfolio always lags its benchmark and will start moving in the same direction, hopefully, in the next quarter.
From the credit rating perspective, over 93% of the City’s portfolio is invested in securities that are rated in the AAA and AA category. A little over 6.6% is allocated to A and BBB+ rated investments. The investment policy requires a minimum of A- rating from two credit rating agencies. The Credit Quality graph is based on the S&P rating only. The 0.22% of the securities that are rated BBB+ by S&P has at least A- rating from the other two agencies, Moody’s and Fitch. The allocation to A-rated securities has grown from 17 corporate names to 21 in the second quarter, a well-diversified bucket of investments. 82.5%category A category6.5%
categoryAAA10.8% AA
categoryBBB+0.2%
28 CITY OF ARVADA INVESTMENT REPORT ACCOUNT SUMMARY PORTFOLIO CHARACTERISTICS 6/30/2022 6/30/2021 Difference City Interest Earnings $1,180,919 $992,158 $188,760 PFM Interest Earnings 382,380 572,375 (189,995) Total Interest Earned $1,563,299 $1,564,533 $(1,234) YTD City Portfolio Yield 1.14% 1.17% -3 bps YTD PFM Portfolio Yield 1.16% 1.45% -29 bps YTD Benchmark 0.73% 0.18% +55 bps PORTFOLIO PERFORMANCE City PFM Duration to Maturity (yrs) 2.28 2.44 Yield to Maturity at Cost 1.23% 1.19% Yield to Maturity at Market 2.59% 3.13% City PFM Total Par Value $233,898,294 $54,855,000 $288,753,294 Book Value 234,314,665 54,811,154 289,125,819 Market Value 225,281,249 52,377,532 277,658,781 Unrealized Gain /(Loss) $(9,033,415) $(2,433,622) $(11,467,038) CREDIT QUALITY (S&P RATING) Investment Management Focus - 2022 • The market expectation is that the Fed will raise the interest rates at each of their 2022 meetings. The City will focus on slightly extending the portfolio duration by the end of the year to take advantage of the higher rates.
By
By
12/2020 create performance measures documenting the amount of and reasons for officer attrition Completed By 12/2024 continue to utilize the recruitment and retention plan on a yearly basis By 12/2024 continue use of an over-hire strategy to leverage access to quality candidates and be fully staffed BY 12/2023 PUBLIC SAFETY STAFFING LEVELS WILL BE AT 95% FILLED Infrastructure THROUGH 12/2025 CONTINUE PROGRESS ON HAVING 100% OF THE WATER SUPPLY NEEDED FOR BUILDOUT BASED UPON THE WATER SUPPLY MASTER PLAN AND CURRENT SCHEDULE FOR COMPLETION OF GROSS RESERVOIR BY 2028 By 12/2024 develop a Water Supply Master Plan Through 12/2025 maintain funds to meet water supply financial commitments Through 12/2025 monitor Denver Water participation contract requirements to meet water delivery scheduled for 2028 Community and Economic Development
12/2022 implement a development customer service survey with at least a 50% response rate Annually 90% of development reviews will be returned to the applicant within 15 business days On an ongoing basis resolve all temporary certificates of occupancy (TCOs) within 6 months of issuance BY 12/2022 66% OF DEVELOPMENT CUSTOMERS RATE THE DEVELOPMENT REVIEW PROCESS AS ‘GOOD’ AND/OR ‘EXCELLENT.’
29 WE DREAM BIG AND DELIVER Safe Community
By 10/2022 complete Low Income Housing Tax Credits (LIHTC) application and receive the 4% award from CHAFA
BY 12/2024 BASED ON LONG-TERM FINANCIAL PROJECTIONS AND UPDATED MASTER PLANS, DEVELOP FINANCIAL RESILIENCY RECOMMENDATIONS TO ENSURE ADEQUATE AND ONGOING INVESTMENT IN CITY INFRASTRUCTURE AND CORE SERVICES
By 12/2022 in collaboration with partner agencies, including RTD, ensure adequate transportation and accessibility to the Navigation Center for those experienc ing homelessness By 10/2023 complete all closing actions and begin construction.
By 12/2023 develop a city-wide consolidated level of service summary
Vibrant Community and Neighborhoods
By 7/2022 enter into an LOI with Jefferson County, Lakewood, Wheat Ridge, Golden, Edgewater, and Westminster to develop two navigation centers within Jefferson County Completed By 9/2022 determine additional related actions to address homelessness in Olde Town
30 WE DREAM BIG AND DELIVER
Organizational and Service Effectiveness
By 12/2022 using information assembled as part of the 2023-2024 Budget development process and current master planning efforts, prepare a summary of long range unfunded needs by work system
By 12/2023 prepare an exhaustive list of funding source opportunities for closing identified infrastructure and core service funding gaps
By 12/2024 complete construction of a Regional Navigation Center
BY 12/2024 CONSTRUCT A REGIONAL NAVIGATION CENTER TO DELIVER COORDINATED HOMELESS SERVICES LOCATED OUT OF OLDE TOWN