City of Orinda 2023-2031


Adopted
January 31, 2023
City Council
Inga Miller, Mayor
Darlene Gee, Vice Mayor
Latika Malkani, Councilmember, Brandy Iverson, Councilmember
Janet Riley, Councilmember
Former City Council Members
Dennis Fay, Mayor
Amy Worth, Councilmember
Nick Kosla, Councilmember
Planning Commission
Ann Parnigoni, Chair
Willy Mautner, Vice-Chair
Robert Hubner, Commissioner
Brandyn Iverson, Former Commissioner
Marian Jelinek, Commissioner
Lina Lee, Commissioner
John Lynn Smith, Commissioner
Project Staff
David Biggs, City Manager
Drummond Buckley, Planning Director
Winnie Mui, Associate Planner
Osa Wolff, City Attorney
The purpose of the Housing Element is to identify housing solutions that solve our local housing problems and to meet or exceed the Regional Housing Needs Allocation (RHNA). The City recognizes that housing is a need that is met through many resources and interest groups. This Housing Element establishes the local goals, policies, and actions the City will implement and/or facilitate to solve our identified housing issues.
California Government Code Section 65583 requires the Housing Element to include the following components:
● A review of the previous element’s goals, policies, programs, and objectives to ascertain the effectiveness of each of these components, as well as the overall effectiveness of the Housing Element.
● An assessment of housing needs and an inventory of resources and constraints related to meeting these needs.
● An analysis and program for preserving assisted housing developments.
● A statement of community goals, quantified objectives, and policies relative to the maintenance, preservation, improvement, and development of housing.
● A program that sets forth an eight-year planning period schedule of actions that the City is undertaking, or intends to undertake, in implementing the policies set forth in the Housing Element.
The Housing Element is intended to be a dynamic, action-oriented planning tool. Unlike the other elements of the General Plan, which typically have a 15- to 20-year time frame, state law sets a shorter time frame for the Housing Element. The element covers an eight-year time frame and replaces a Housing Element adopted in April 2015 that covered the period from 2015 to 2023. This element covers a period extending from 2023 to 2031.
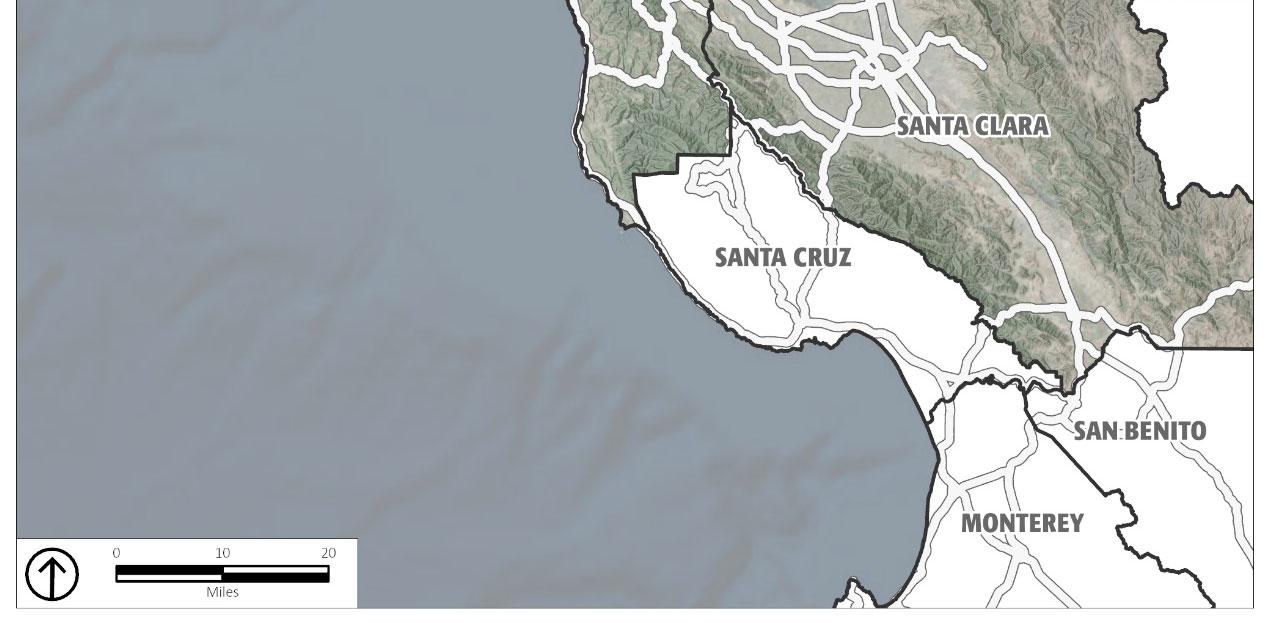
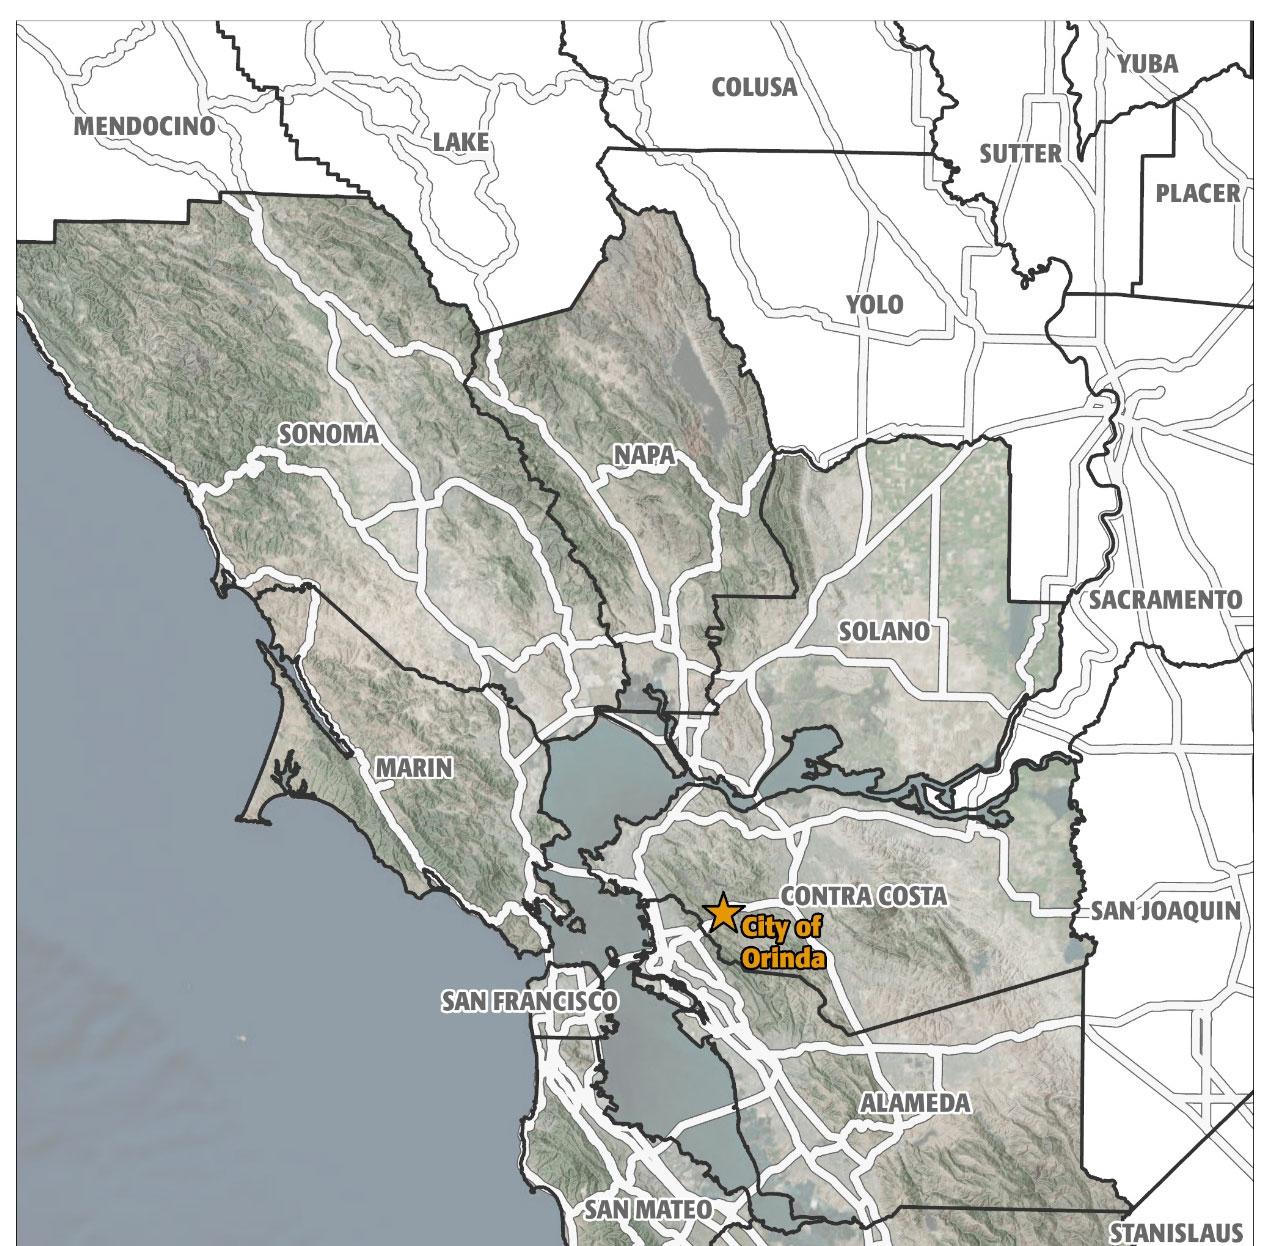
The Housing Element is organized into the following sections and has been structured to comply with state housing element guidelines. The content of the sections is listed below. Figure 1-1 shows the location of Orinda relative to the other communities and nine counties that constitute the San Francisco Bay Area.
This Housing Element is organized into the following sections:
Section 1 – Introduction: This section provides information on the State of California’s requirements, the purpose of the Housing Element, the organization of the document, and General Plan consistency.
Section 2 – Public Participation: Describes the opportunities the City provided for public participation during the preparation of the updated Housing Element.
Section 3 – Evaluation of the Previous Housing Element: This section contains an evaluation of the prior Housing Element and its accomplishments and analyzes differences between what was projected and what was achieved.
Section 4 – Housing Needs Assessment (Population, Employment, and Housing Characteristics): This section focuses on demographic information, including population trends, ethnicity, age, household composition, income, employment, housing characteristics, housing needs by income, and housing needs for special segments of the population. This section also includes an assessment of fair housing.
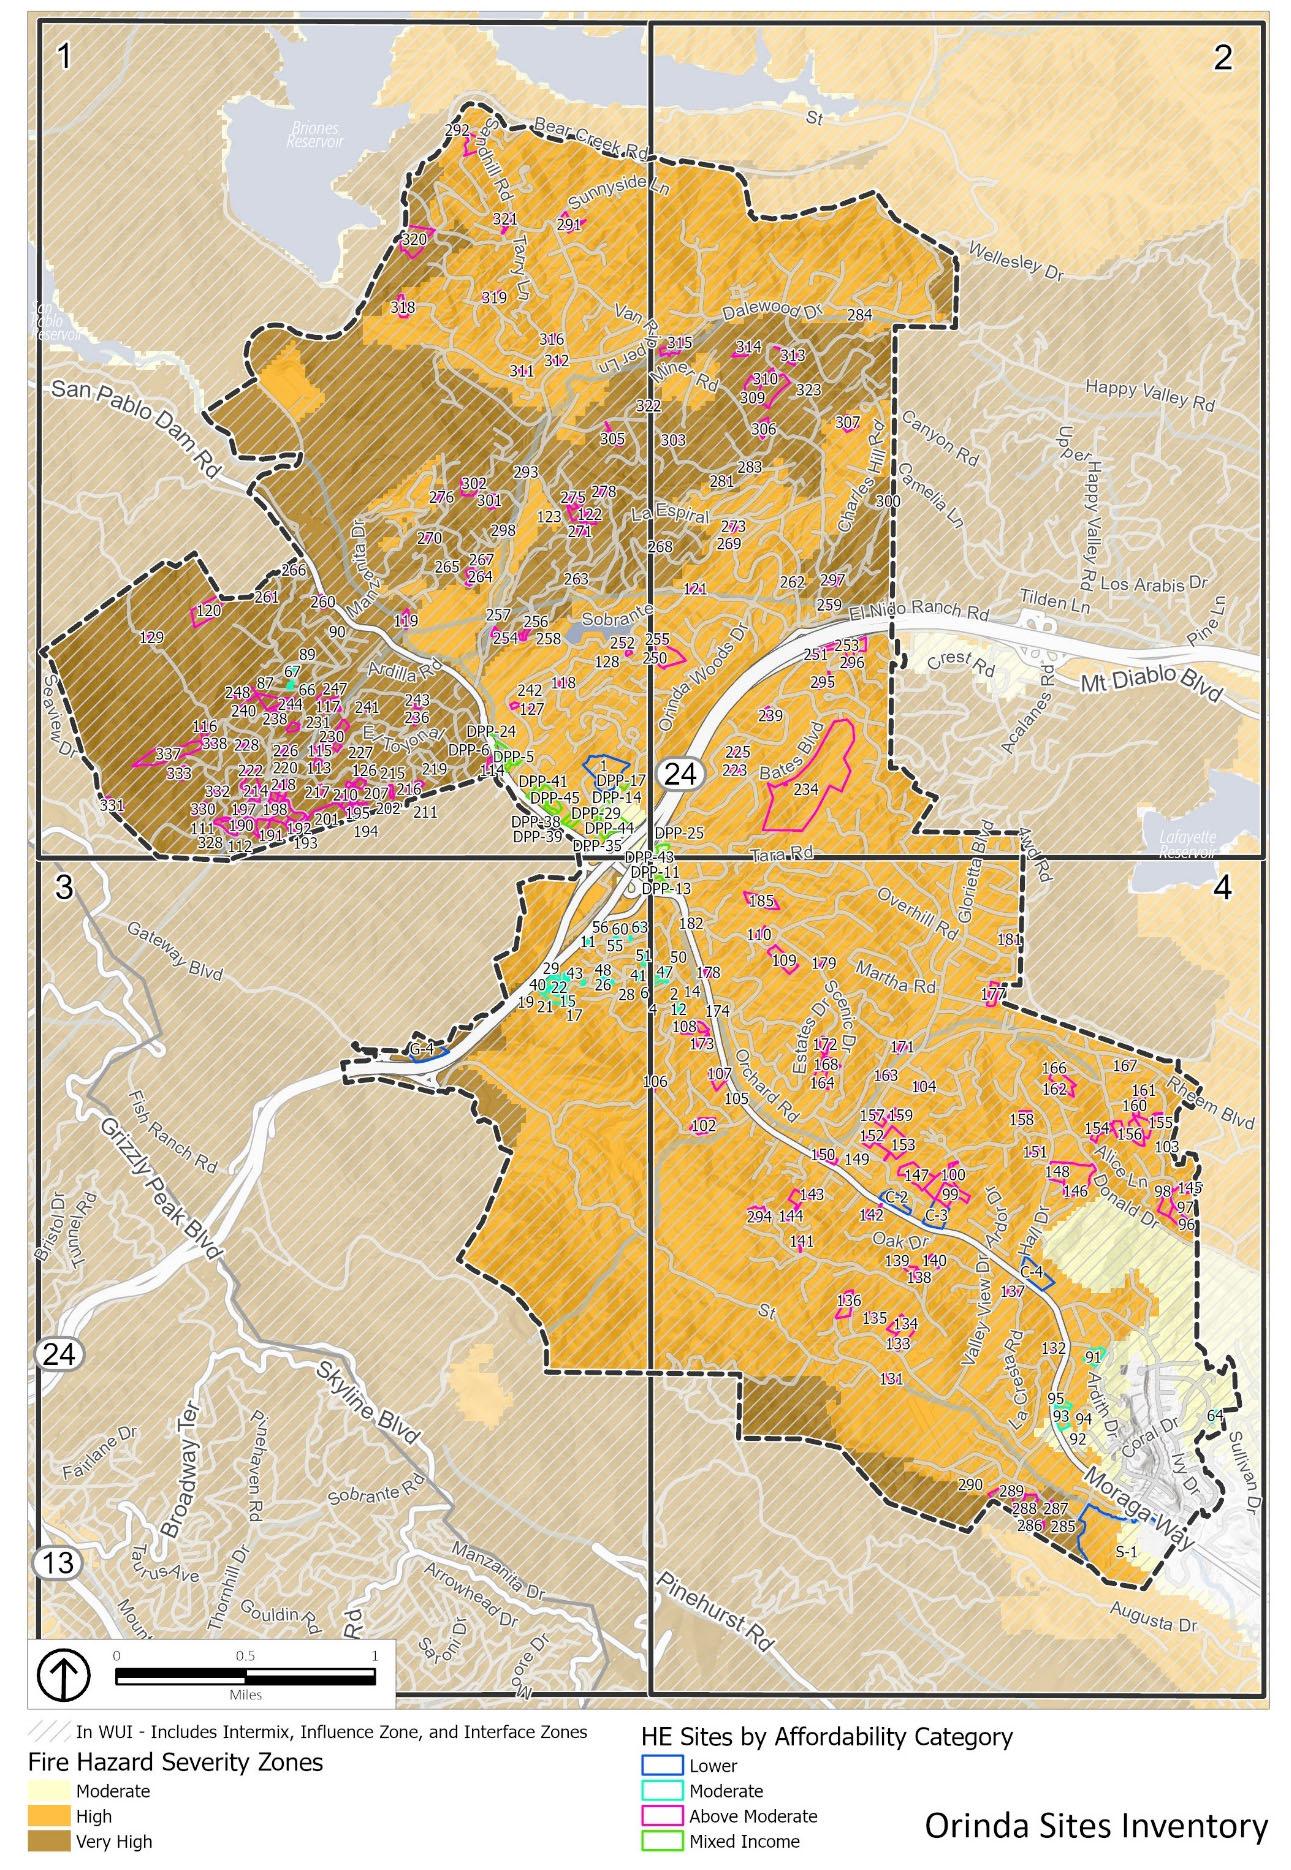
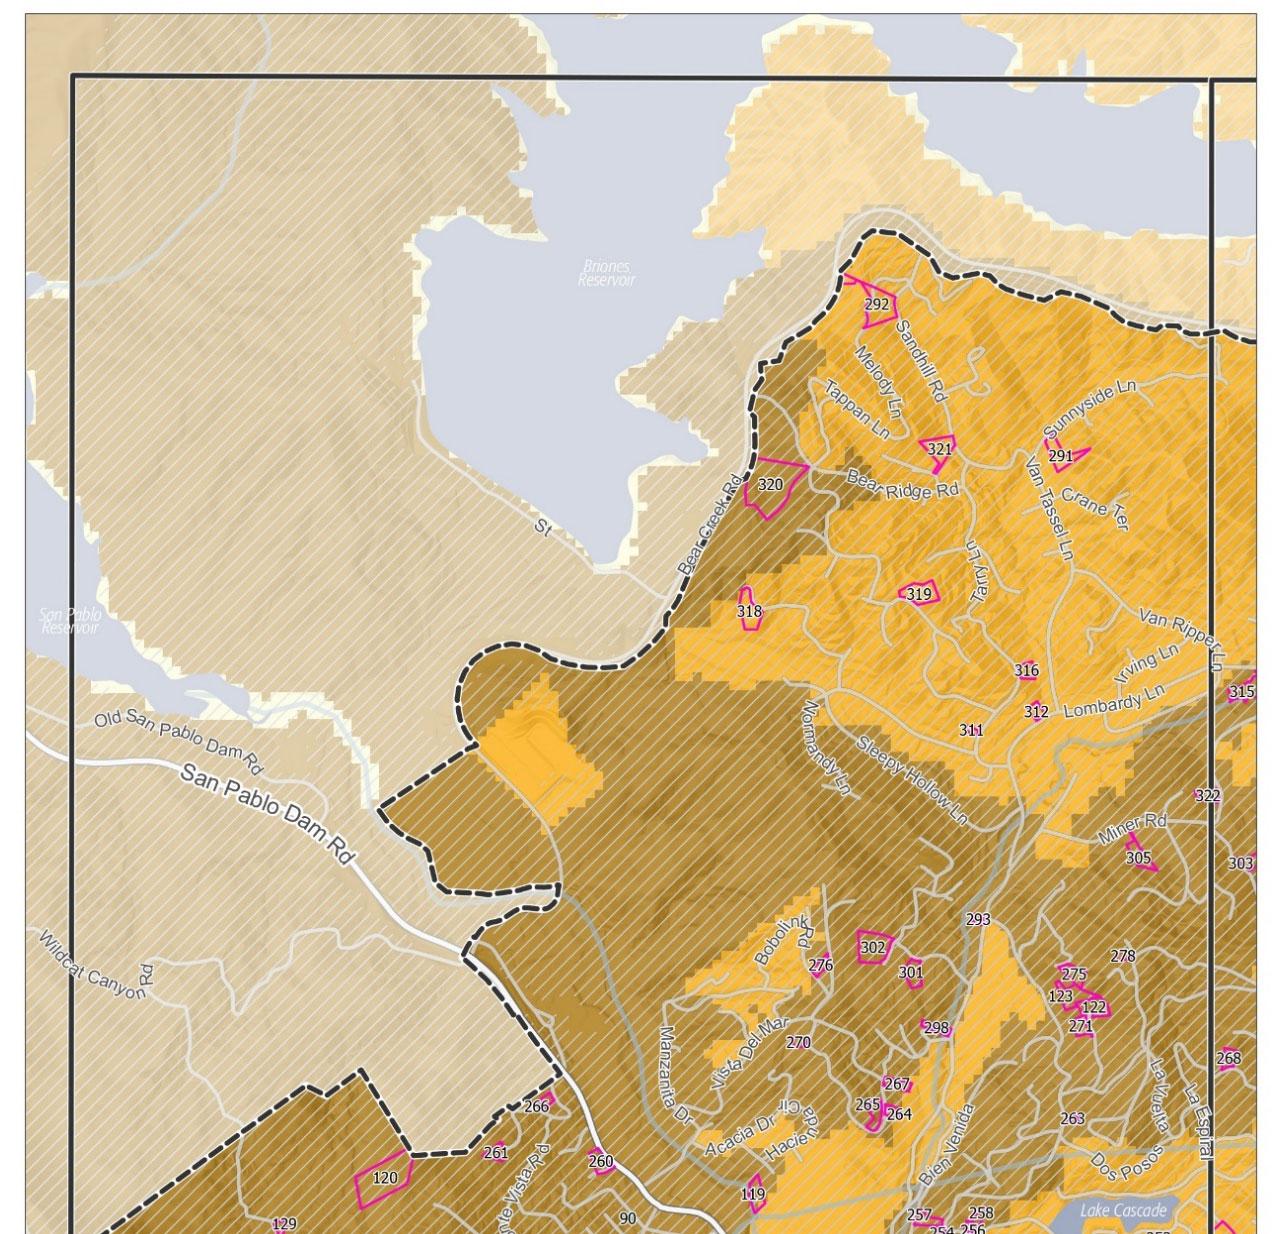
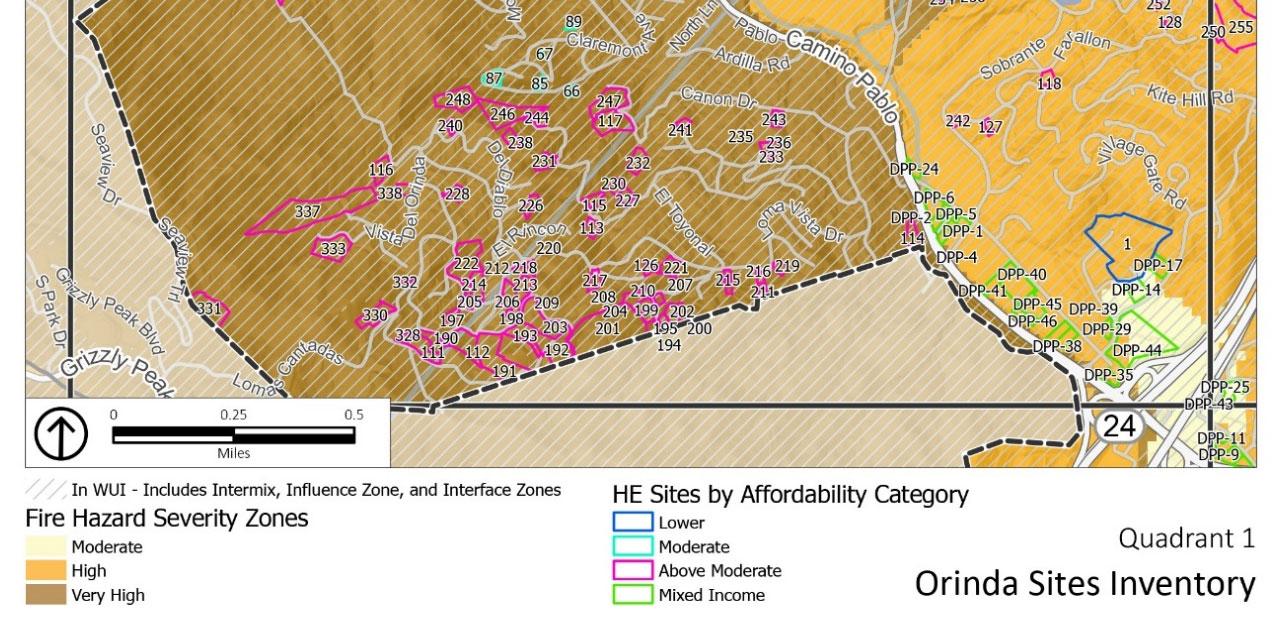
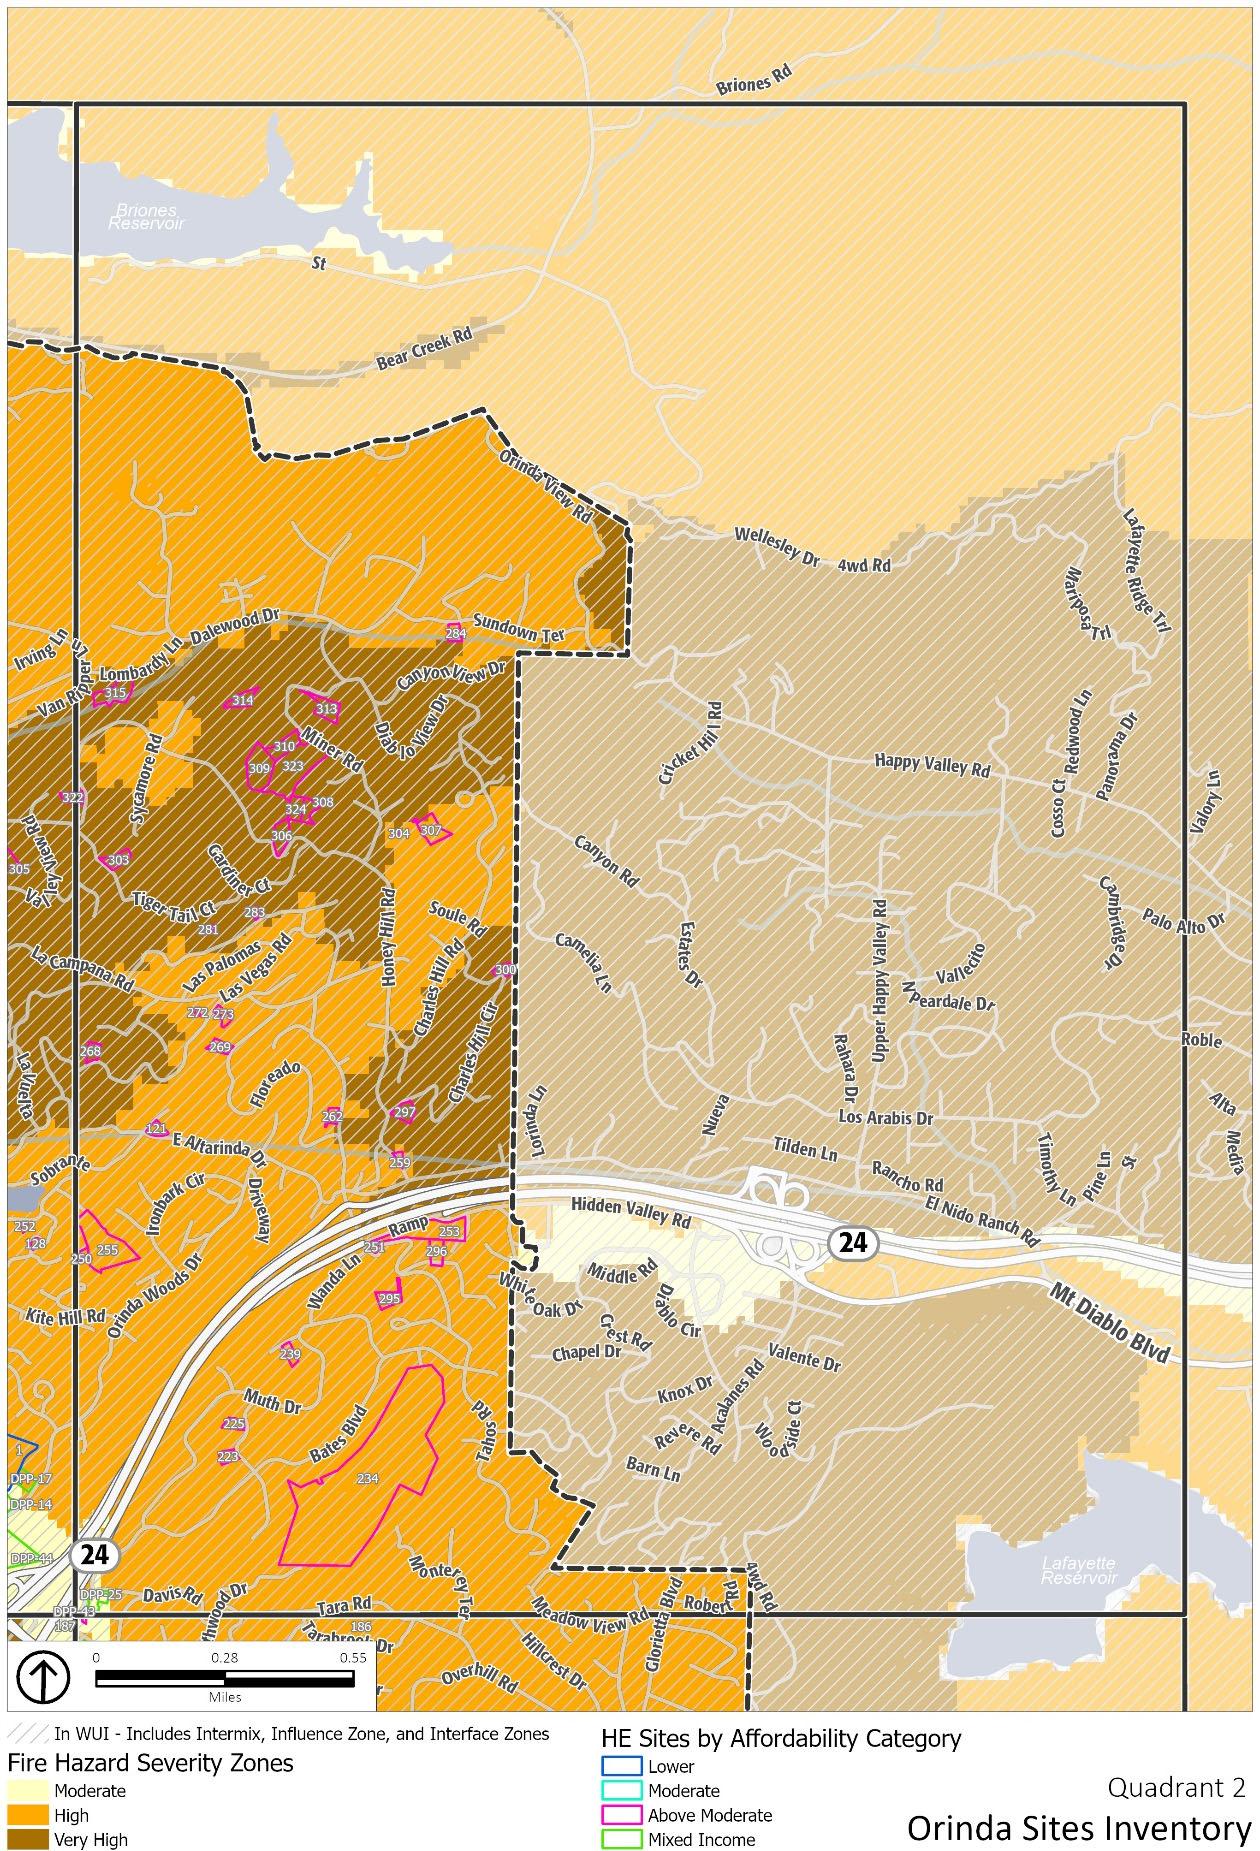
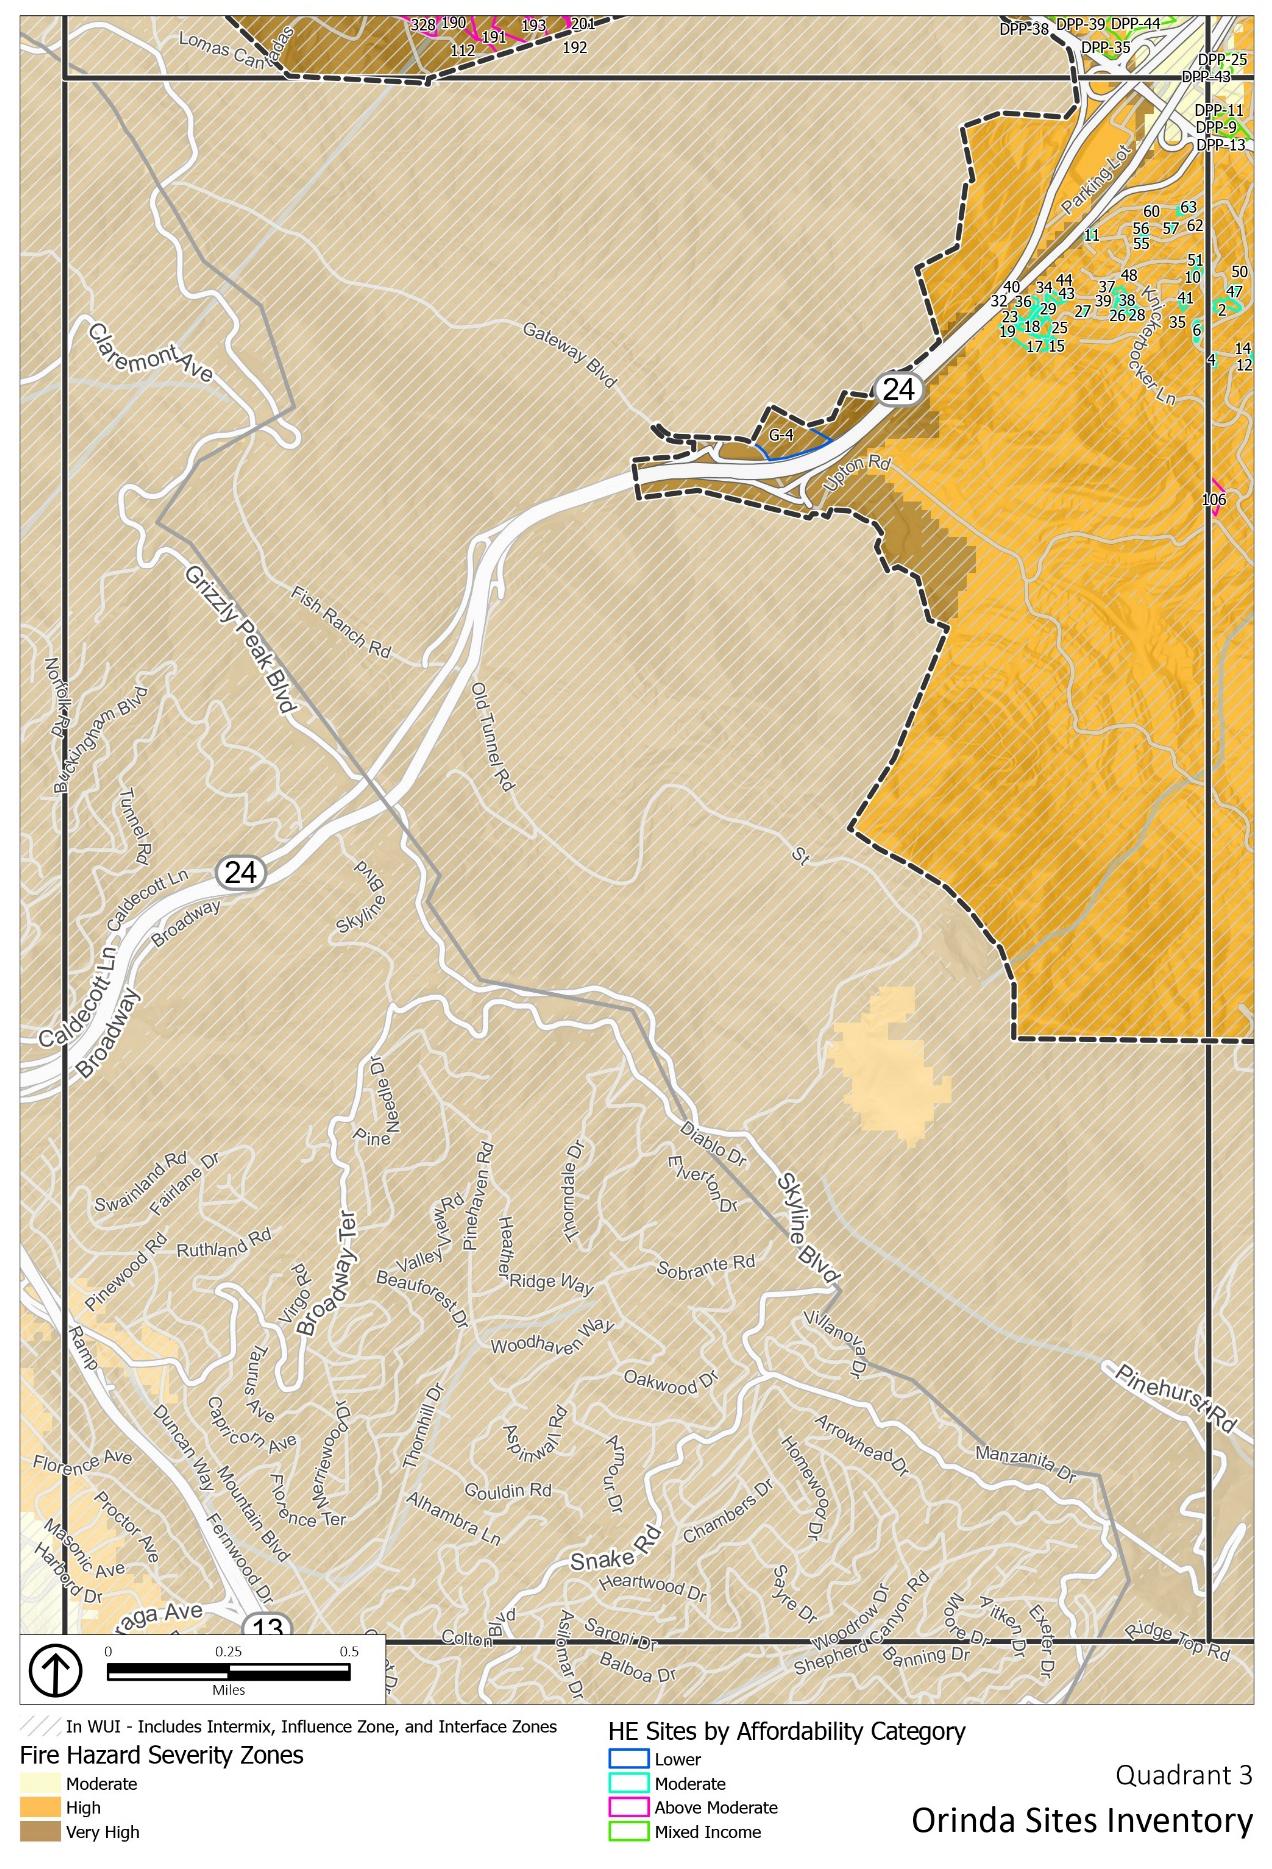
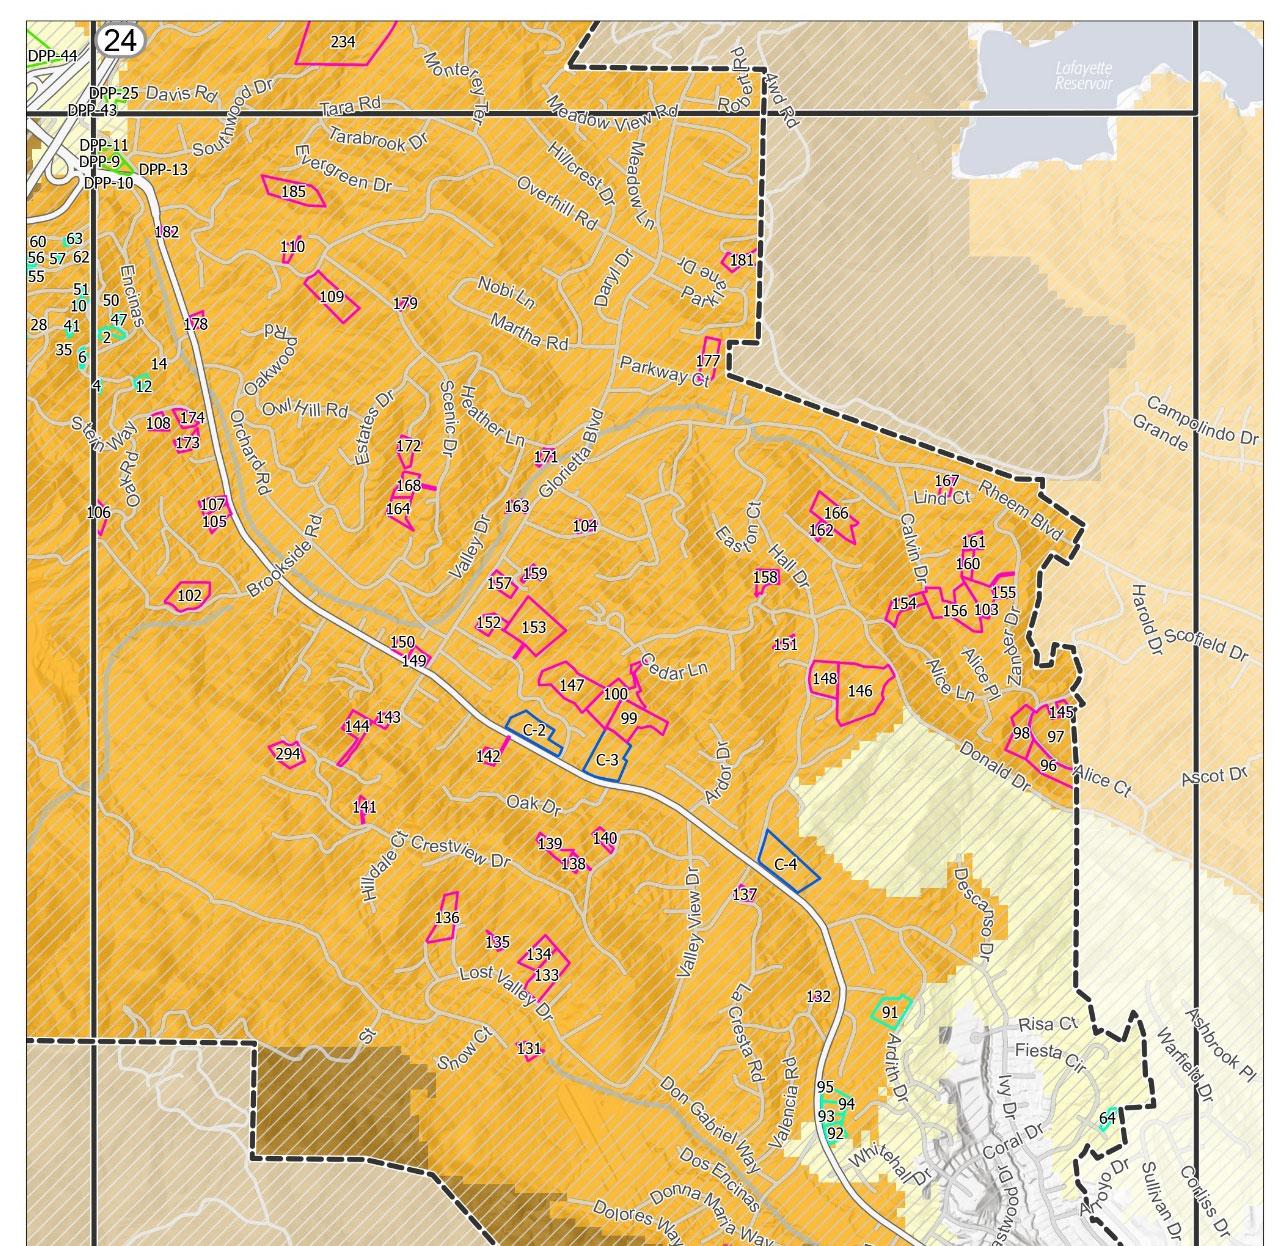
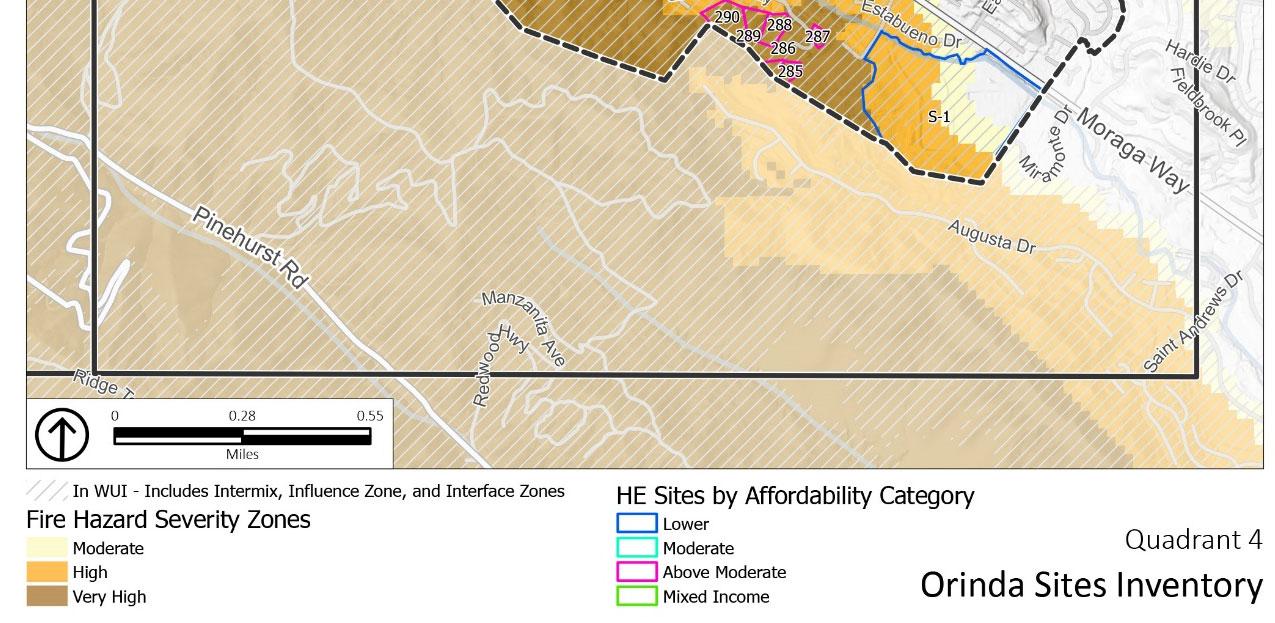
Section 5 – Housing Resources and Opportunities (Sites Inventory): This section describes the City’s housing resources as well as the City’s existing housing stock and the potential areas for future housing development. This section also discusses opportunities for energy conservation, which can reduce costs to homeowners and infrastructure costs to the City.
Section 6 – Housing Constraints: This section analyzes potential governmental and non-governmental constraints to housing development in Orinda. This includes the City’s planning, zoning, and building standards that directly affect residential development patterns as well as influence housing availability and affordability. Potential non-governmental constraints include the availability and cost of financing, the price of land, and the materials for building homes, as well as natural conditions that affect the cost of preparing and developing land for housing, and the business decisions of individuals and organizations (some examples are home building, finance, real estate, and rental housing that impact housing cost and availability).
Section 7 – Goals, Policies, and Actions: This section sets forth the City’s goals, policies, and actions that are designed to address the housing needs in Orinda. Based on the findings of all of the previous sections, the Goals, Policies, and Actions section identifies actions the City will take to meet local housing goals, quantified objectives, and address the housing needs in Orinda.
State law requires that “the general plan and elements and parts thereof comprise an integrated, internally consistent, and compatible statement of policies.” The purpose of requiring internal consistency is to avoid policy conflict and provide a clear policy guide for the future maintenance, improvement, and development of housing within the city.
The Housing Element has been reviewed for consistency with the City’s other General Plan Elements. The Orinda General Plan has periodically been amended but there has not been a comprehensive update since it was adopted in 1987. The policies and actions in this Housing Element are consistent with the policy direction contained in other parts of the General Plan. The City will continue to review and revise the Housing Element, as necessary for consistency, when amendments are made to the General Plan.
Per Assembly Bill (AB) 162 (Government Code Section 65302.g.3), upon the next revision of the Housing Element on or after January 1, 2014, the Safety Element shall be reviewed and updated as necessary to address the risk of fire for land classified as state responsibility areas, as defined in Section 4102 of the Public Resources Code, and land classified as Very High Fire Hazard Severity Zones, as defined in Section 51177. Senate Bill (SB) 379 (Government Code Section 65302.g.4) requires that the Safety Element be reviewed and updated as necessary to address climate change adaptation and applicable resiliency strategies. SB 1035 (Government Code Section 65302.g.6) requires that the Safety Element be reviewed and updated as needed upon each revision of the Housing Element or local hazard mitigation plan, but not less than once every eight years. SB 99 (Government Code Section 65302.g.5) requires that on or after January 1, 2020, the Safety Element includes information to identify residential developments in hazard areas that do not have at least two evacuation routes. The City is currently (2022) working to review and update the City’s current Safety Element incorporating all State law changes, including applicable laws and any additional requirements and General Plan guidelines from the State of California Governor’s Office of Planning and Research (OPR).
State law (California Government Code Section 65580 et seq.) requires the California Department of Housing and Community Development (HCD) to project statewide housing needs and allocate the anticipated need to each region in the state. For the Bay Area, including Orinda, HCD provides the regional need to the Association of Bay Area Governments (ABAG), which then distributes the Regional Housing Needs Allocation (RHNA) to the cities and counties within the ABAG region. ABAG allocates housing production goals for cities and counties based on their projected share of the region’s household growth, the state of the local housing market and vacancies, the jurisdiction’s housing replacement needs, among other criteria.
Orinda falls under the jurisdiction of ABAG. ABAG is responsible for developing a Regional Housing Needs Plan (RHNP) allocating the region’s share of the statewide housing needs to lower-level councils of governments. The RHNA is a minimum projection of additional housing units needed to accommodate projected household growth of all income levels by the end of the housing element’s statutory planning period. As shown in Table 1-1, Orinda is required to plan for 1,359 units during the 2023-2031 planning period at certain densities, 587 units of which must be affordable to lower-income (extremely low, very low-, and low-income) households, 215 must be affordable to moderate-income households, and 557 for above-moderate income households.
Source: ABAG 2021
Note: It is assumed that 50 percent of the very low- income is allocated to the extremely low-income category.
State law requires cities and counties to make a diligent effort to achieve participation from all segments of the community in preparing a Housing Element. Section 65583[c][6] of the California Government Code specifically requires that “The local government shall make a diligent effort to achieve public participation of all economic segments of the community, specifically lower income households and special needs groups, in the development of the Housing Element, and the action shall describe this effort.”
The diligent effort required by state law means that local jurisdictions must do more than issue the customary public notices and conduct standard public hearings prior to adopting a Housing Element. State law requires cities and counties to take active steps to inform, involve, and solicit input from the public, particularly low-income and minority households that might otherwise not participate in the process.
To meet the requirements of state law, Orinda completed the public outreach and encouraged community involvement, summarized below and described herein. The City did not receive any requests for translation services, but does provide translation services if requested.
● Stakeholder Consultations
● Property Owner Meeting
● Focus Groups
● Community Workshop
● Balancing Act -- Online Sites Tool
● Planning Commission and City Council Study Sessions
● City Council Meeting
To ensure that the city solicits feedback from all segments of the community, consultations were conducted with service providers and other stakeholders who represent different socioeconomic groups. In August and September 2021, staff reached out to seven stakeholder organizations to offer the opportunity for each to provide one-on-one input on housing needs and programs. All stakeholders provided feedback via one-on-one interviews or with email responses. Representatives from the following stakeholders were interviewed:
● Housing Consortium of the East Bay (HCEB) on August 26, 2021
● Orinda Senior Village on August 27, 2021
● Eden Council for Hope and Opportunity on September 4, 2021
● Eden Housing on September 6, 2021
● Contra Costa County Continuum of Care (CoC) and Contra Costa County Health, Housing, and Homeless Services (H3) on September 14, 2021
● Regional Center of the East Bay (RCEB) on September 22, 2021
● East Bay Housing Organizations (EBHO) on September 30, 2021
In each consultation, the stakeholders were asked all or some of the following questions, depending on the type of organization interviewed:
Opportunities and concerns: What 3 top opportunities do you see for the future of housing in Orinda? What are your 3 top concerns for the future of housing in Orinda?
Housing preferences: What types of housing do your clients prefer? Is there adequate rental housing in the city? Are there opportunities for home ownership? Are there accessible rental units for seniors and persons with disabilities?
Housing barriers/needs: What are the biggest barriers to finding affordable, decent housing? What are the unmet housing needs in this jurisdiction?
Housing Conditions: How would you characterize the physical condition of housing in this jurisdiction? What opportunities do you see to improve housing in the future?
Equity and Fair Housing: What factors limit or deny civil rights, fair housing choice, or equitable access to opportunity? What actions can be taken to transform racially and ethnically concentrated areas of poverty into areas of opportunity (without displacement)? What actions can be taken to make living patterns more integrated and balanced?
How has COVID affected the housing situation?
Unanimously across all consultations, it was expressed that the city has a growing and aging senior population with a need for housing in amenity-rich areas. The aging population would like the opportunity to age in place. Many seniors have limited incomes and lack the finances to remain in their current housing situation and some residents are being priced out of the city. Additionally, housing is physically difficult for the aging population that are likely to have mobility issues and not all housing units are easily accessible for this population (e.g., some housing units require the use of staircases to access).
Orinda Senior Village expressed interest in having housing, amenities, and transit within walking distance. It was expressed that senior housing sometimes faces backlash in the Orinda community even though there is a great need for this type of housing. In addition, it was mentioned that there is a need for more one- to two-bedroom affordable housing units to accommodate the growing senior population and those living with intellectual disabilities.
When speaking with the Regional Center of the East Bay, it was expressed that residents with intellectual disabilities typically require supportive services (e.g., case management, grocery delivery, and/or other services) to be successful and may even have a caretaker living with them. As a result, there is a need for more one- to two-bedroom affordable housing units. The lack of affordable housing in Orinda and across the county, makes it hard to find affordable one- and two-bedroom units.
East Bay Housing Organizations stated that the City of Orinda is a generally high resourced community, not known for having high concentrations of poverty or larger populations of color. The City also tends to have lengthy housing project timelines that may be more expensive than normal, and could deter development. Orinda Senior Village expressed that there also tends to be pushback on the need for affordable housing in the community.
Eden Housing expressed that there is a need for incentives, such as land dedication, a site zoned for affordable housing, and financial and/or political capital, from the City for affordable housing projects to pencil out. It was recommended that the City create additional streamlined processes and grant additional fee waivers for the development of affordable housing projects. Eden Housing also discussed the benefit of the Housing Element process and that zoning land for higher density reduced the likelihood of California Environmental Quality Act (CEQA) litigation, lowering the overall cost of the project, and allowing the project to start further in the development process.
The City was awarded a $75,000 grant through the Association of Bay Area Governments (ABAG) to work with government and nonprofit organizations to perform feasibility analysis for groups interested in developing housing on their property. The City held a stakeholder meeting on September 23, 2021 where a presentation regarding real estate development basics, affordable housing, and partnership options was given. To date, staff has been coordinating with Orinda Union School District (OUSD), Acalanes Union High School District (AUHSD), St. Stephen’s Church, and St. John’s Church all which have indicated a possible interest in housing.
On September 20, 2021, the City of Orinda held a Focus Group meeting that included eight attendees, to solicit input on the needs and barriers to development in the community in the Housing Element update. The presentation provided a short overview of the Housing Element process and discussed the new State laws that will need to be addressed as a part of this Housing Element cycle. Polling was included to gather direct feedback from the stakeholder groups.
Participants inquired on past production history and how that played into the 6th cycle Housing Element update. There was interest in the Bay Area Rapid Transit (BART) sites to accommodate the RHNA rather than the Downtown Precise Plan (DPP) sites. There were questions around the percentage of the lowincome and very low-income housing units that would likely be occupied by families with children. There were also questions around relying on accessory dwelling units (ADUs) to accommodate the RHNA.
On October 18, 2021, the City held a Community Workshop that was led by two City Council subcommittee members and attended by 20 members of the public. The intent of the workshop was to review the RHNA process and solicit input from stakeholders and the public on sites to accommodate the RHNA. The current capacity was discussed as well as different strategies to accommodate the 6th cycle RHNA. Discussion included several topics related to the sites analysis, including ADUs, how to track production and affordability; No Net Loss; what if all units develop at market rate, how will the public be involved in the site-selection process; will the City be relying on SB 9; what is considered high density; how is vulnerability to fire hazard considered; why did the City decide on a 25-percent RHNA buffer; will sites in the downtown be affordable to moderate and above moderate incomes. City staff gathered all feedback and this was presented to City Council.
To encourage interactive participation from the public, the City launched an online Housing Element simulation tool through the Balancing Act platform in mid-December 2021. With the Housing Element simulation tool members of the public were able to create their own housing plan by increasing and decreasing the number of housing units from the available categories. As of February 15, 2022, a total of 69 submissions had been received. The following were the top identified sites.
● BART – the Western Lot (housing units were increased in 56 submissions)
● The Downtown Office Zoning District (DPP) (units were increased in 53 submissions)
● BART – Eastern Lot (units were increased in 51 submissions) and the
● Downtown Commercial Zoning District (DPP) (units were increased in 47 submissions)
The feedback from the public on this tool was summarized and presented to City Council to inform their decision on which sites to include in the inventory.
On November 9, 2021, the City held a Planning Commission Study Session and on November 16, 2021, the City held a City Council Study Session. These study sessions were on the 2023-2031 Housing Element update and the public was invited to attend and participate in this virtual event. Noticing for both meetings was sent to the public, local service providers, affordable housing developers, and other community organizations in an effort to reach special-needs groups and lower-income households that may not have seen the information posted at City buildings or on the City’s website.
City staff presented an overview of the Housing Element update process and required contents of the element, discussed early strategies and possible sites to meet their RHNA, reviewed new state laws, and solicited feedback from the Planning Commission and community members on these strategies and other housing needs in Orinda.
Commissioners expressed interest in considering rate of growth for ADUs and increasing production numbers; accordingly, adding SB 9 units; and discussing church sites and how those would develop with housing. The public had comments around the city not being required to build, but just providing incentives; reusing sites and the requirements that must be placed on those sites; and looking at the concern of overconcentrating units in one area.
Councilmembers and the public had several discussion items, including what the different income levels are for the different categories, clarification on governmental constraints, site discussions on the sites and assumed densities, how to take credit for lower-income units that are not deed restricted, how to track affordability of ADUs, restricting units in high and very high severity fire zones, and site feasibility in general.
On February 15, 2022, the City held a City Council meeting to present staff’s recommendations on sites to meet the RHNA and move forward with analysis in the Housing Element. Recommendations were based on several factors, including state law requirements, and public feedback gathered through meetings and the Balancing Act RHNA plan tool.
The City received ongoing public comments during the drafting of the Housing Element. Public comments included, but were not limited to, the following topics:
• Inclusion and exclusion of the BART and St. Stephen’s Church properties in the sites inventory
• Inclusionary housing ordinance
• Appropriate densities and incentives for affordable development
• Parking requirements
• Underutilized sites
• Environmental review
• Interest in decreased density and height in the Downtown
All comments received were considered and used to inform the sites analysis and assessment of fair housing issues, and goals, policies, and actions were included and/or revised to incorporate the feedback received.
Revisions included new and revised policies and programs to research adoption of an inclusionary housing ordinance and to review and revise parking standards to ensure they do not constrain the development of housing. Revisions also included modifying the sites inventory to remove specific sites that are no longer being considered for housing and add additional details to the non-vacant sites analysis. The City also made density changes based on feedback from the public and the City Council, which included increasing the allowable density in the Downtown area from assuming 30 units per acre to allow for 50 units per acre on certain sites.
The Draft Element, as revised, will remain available on the City’s website for additional public review and comment during the second submittal to HCD (60-days) and was available to the public the entire 90-day HCD review period. As revisions are made to respond to HCD comments, this information will also be posted on the City’s website.
Prior to submittal to HCD for a second round of review, and during the 60-day review period, the City considered ongoing comments from the public, Orinda residents, Orinda Watch, East Bay for Everyone, Inclusive Lafayette, YIMBY Law California Legal Advocacy and Education Fund, and all comments received at the October 10, 2022 Subcommittee Meeting and the November 1, 2022 City Council meeting. The comments are summarized below.
• Inclusion and exclusion of the BART in the sites inventory
• Timing of program actions
• Require not consider an Inclusionary housing ordinance
• Appropriate densities and heights
• Parking requirements
• Underutilized sites – including sites in the Downtown Precise Plan and the Caltrans Gateway site
• Interest in increased and decreased density and height in the Downtown
• ADU and SB9 Requirements
• Inclusion and exclusion of the Caltrans Gateway site
Comments were considered and informed the revised draft Housing Element for submittal. Revisions and modifications were made to the applicable sections of the draft including the sites analysis, the assessment of fair housing issues, the housing constraints section, and the goals, policies, and actions.
During the preparation of this Housing Element update, public input was actively encouraged in a variety of ways. The element was posted to the City’s website, and a hard copy was available for review at the Planning Department counter. The City emailed a link to all individuals and organizations, including organizations representing low- and moderate- income households and special needs groups, that have expressed interest in, or previously requested notices relating to, the City’s housing element. This included organizations representing all income groups and special needs groups. The city also mailed out a postcard to all residents in Orinda once the draft Housing Element was available in April. The postcard provided a link to the draft Housing Element and provided information regarding the Planning Commission and City Council meetings where the draft was considered. Updates are also provided on the Housing Element on the Plan Orinda website, in the City’s weekly e-newsletter (named Orinda Outlook), and people can sign up to receive email updates of upcoming events/available documents on the Plan Orinda website.
Per Government Code Section 65585, the Draft Housing Element was made available for public comment for 30 days, from March 31, 2022 to April 30, 2022. Public comment was received, and an additional 10 business days was allowed to consider and incorporate public comments into the draft revision before submitting to HCD on May 16, 2022. The draft was made available on the City’s website and was noticed to residents through the same methods as the Planning Commission and City Council meetings. Additional direct noticing was sent to local housing advocate groups, and individuals and organizations that have previously requested notices related to the housing element. The City received a findings letter from HCD on August 12, 2022 and revised the draft Housing Element to address the identified findings. The revised draft Housing Element was posted on the City’s website for at least seven days and interested participants were noticed of the availability, consistent with State Law. The draft Housing Element was also presented to both the Housing Subcommittee on October 10, 2022 and to the City Council on November 1, 2022, which provided for additional public participation. At both meetings staff presented the revisions to the draft and requested feedback. The City then re-released the revised draft Housing Element for an additional seven days from November 4, 2022 through November 10, 2022 before resubmitting to HCD for an additional 60-day review period. Revisions to address any public comment were incorporated prior to submittal.
Per California Government Code Section 65588, “Each local government shall review its housing element as frequently as appropriate to evaluate all of the following: (1) The appropriateness of the housing goals, objectives, and policies in contributing to the attainment of the state housing goal. (2) The effectiveness of the housing element in attainment of the community’s housing goals and objectives. (3) The progress of the city, county, or city and county in implementation of the housing element. (4) The effectiveness of the housing element goals, policies, and related actions to meet the community’s needs, pursuant to paragraph (7) of subdivision (a) of Section 65583.”
California Government Code Section 65588 requires that local governments review the effectiveness of the housing element goals, policies, and related actions to meet the community’s special housing needs. As shown in the Review of Previous Housing Element matrix, Table 3-2 the City worked diligently to continuously promote housing for special-needs groups in a variety of ways.
● The City made completeness determinations ahead of the 30-day completeness deadline to ensure housing for low-income and special-needs households.
● Accessory dwelling units (ADUs) can be an affordable option for many low-income households. The City encouraged builders in the Wilder development to include second units in new homes and/or incorporate space so the flexibility for second unit conversions were a viable option in the future. As a result, eight approvals for ADUs were granted in the Wilder subdivision.
● In 2014, the City worked successfully with Eden Housing to develop 66 units affordable to extremely low- and very low-income senior households at the Monteverde Senior Housing project.
Table 3-2 summarizes the programs from the 2015-2023 Housing Element. To the degree that such programs are recommended to be continued into the current Housing Element, these programs are reorganized and presented in Section 7.
1.A Orinda Grove Development. Facilitate redevelopment/reuse of the former Pine Grove School as a mixed-income residential development including 8 moderate- income housing units and 65 market-rate housing units. Unit construction is under way on the Orinda Grove development at the Pine Grove School site, and construction will continue through 2014 and 2015. Development of this site was made possible through a land exchange agreement between the City of Orinda, the Orinda Union School District, and Pulte Homes. Using Planned Development (PD) provisions, the City allowed flexibility in lot size and enabled a mix of unit types in the development. Eight of the units will be set aside in perpetuity for moderate-income households of four persons or more. The remaining 65 units will count toward the City’s above moderate-income production target.
continued development and construction of the Monteverde Senior Apartments development on the former Orinda Library site. This development will produce 66 units of housing for very low- and extremely low-income seniors at a density of 48 units per acre and is anticipated to be completed in December 2014. As noted earlier in the Housing Element, the City entered into a Development Disposition and Loan Agreement (DDLA) with Eden Housing for the development of senior housing on the City-owned 1.4-acre former library site. The City’s contribution of the site for the project was made possible by in-lieu fees collected from the developers of the Wilder project in Gateway Valley. City funds were supplemented by HOME and CDBG funds provided by the County. The City will continue to work with Eden Housing to facilitate completion of the
Redevelopment of the former Pine Grove School was completed in 2015. It is a mixedincome residential development with 8 below-market rate (BMR) units reserved for households earning moderate incomes and 65 market-rate units.
Action was completed, delete action.
The City facilitated the development and construction of the Monteverde Senior Apartments development on the former Orinda Library site. The development produced 66 BMR units for very low- and extremely low-income seniors at a density of 48 units per acre. The construction was completed in November 2014 and the development was fully occupied in December 2014.
Action was completed, delete action.
project, which is now under construction. The project includes 66 units reserved for very low- and extremely low-income seniors, and one manager’s unit (presumed to rent at moderate income affordability levels).
1.C Promotion of Second Units. Continue to implement a public information and outreach campaign via the City's website and the Orinda City newsletter to inform property owners of the standards for second unit development and the importance of second units to Orinda. Provide information to encourage residents to apply for second units, particularly where their homes already include space that is configured for a conforming second unit (e.g., carriage houses, au pair quarters, second kitchens on floors with separate entrances). The City will produce a flyer regarding second units and provide the flyer at the Planning Department counter and to project applicants for all discretionary land use applications. On average, a total of 93 discretionary land use applications, mainly for residential development projects, are considered annually by the Planning Department. Many of the projects are on property that could support the development of a second unit. In addition, the City will publish at least annually informational materials pertaining to second units through a combination of media including the City's website and direct. The City recognizes second units as an essential part of Orinda’s affordable housing supply and seeks to increase the number of second units as a way to provide for the City’s share of the region’s housing needs. Use permit requirements for most second units were eliminated over a decade ago in accordance with state law. However, many residents may still be unaware of their right to apply for a second unit, the standards for second units, and the potential benefits of second units (in terms of supplemental household income or providing an affordable living environment for local workers, elder Orindans, college students, or young professional adults).
The City will continue to make information on second units available on its website and will include an article on second unit standards and opportunities in the quarterly Orinda newsletter.
During the 5th planning period, the City implemented a public information and outreach campaign via the City's website and newsletter to inform property owners of the standards for second unit development as well as the importance and opportunities second units provide the City for affordable housing. Applicants at the Planning Department counter continue to be informed of the second unit standards and, as appropriate, encouraged to consider, including a second unit in their development proposals.
On August 1, 2017, City Council approved Ordinance 17-03 consistent with the new state law. In January 2020, state law required local jurisdictions to ministerially approve “accessory dwelling units" (ADUs) when units meet a set of minimum standards.
29 building permits for ADUs were issued from 2015 through 2020.
2015: 3
2016: 2
2017: 7
2018: 4
2019: 7 2020: 9
1.D. Legalization of Existing Unregistered Second Units. Notify property owners that under the revised second dwelling unit standards, formerly illegal second units may possibly now meet the requirements of the Zoning Ordinance. In tandem with Action 1.C, the City will continue to proactively reach out to the owners of properties where unregistered second units are believed to exist, based on anecdotal evidence, past permit applications, real estate advertisements, and other sources. These owners will be notified (via a letter from the City) of the opportunity to legalize or register their second units, subject to the development standards established through the City’s zoning regulations. The City seeks to legalize unregistered units both to ensure the health and safety of occupants and to maintain better data on the contribution such units make to Orinda’s housing supply. Through this action, the City anticipates legalization of five second units during the planning period.
The City maintains an ADU page on the City’s website that provides details on the ADU ordinance and answers to Frequently Asked Questions. The City is also working on creating an ADU handout to provide more information on the requirements.
One building permit was issued in 2018 for the legalization of an existing second unit that was entitled and reported in 2017. With new state laws that went into effect on January 1, 2020, we expect to see more legalization of unregistered second units.
Continue. Modify to work with property owners to legalize any remaining, existing unregistered ADUs.
Encourage builders in the Wilder development to include second units in new homes or to incorporate space with the flexibility for second unit conversions in the future. The approval of the Wilder subdivision provides Orinda with a unique opportunity to promote the inclusion of second units in new homes. The development is the largest project to be developed in Orinda in over 40 years. A number of different builders have been and will be engaged in development of the project’s 245 homesites. The City will continue to work with these builders and with new property owners to promote the idea of second units as a component of the housing stock. A number of incentives will continue to be considered, such as deferring
During the 5th planning period, the City encouraged builders in the Wilder development to include second units in new homes and/or incorporate space so the flexibility for second unit conversions were a viable option in the future. As a result, 8 approvals for ADUs were granted in the Wilder subdivision:
2015: 4
2017: 2
2018: 1
Continue
collection of impact fees for the square footage associated with the second unit until issuance of the certificate of occupancy.
Because second units in Wilder will be located within new custom-built homes, their rents would most likely place them in the affordability range for moderate-income households. This is a segment of the market that is difficult to accommodate in Orinda now, due to the historic nature of single-family homes in what is now a predominantly built-out community. Even if 10 percent of the new homes included a second unit, 25 new units could be generated in this manner.
1.F Affordable Housing Incentive Program. Continue to implement the City's affordable housing incentive program (density bonus ordinance), which grants up to a 35 percent increase in the number of permitted units for developments which set aside 20 percent or more of their units as affordable, as defined by state law. The City has adopted an Affordable Housing Incentive Program (Section 17.4.31 of the Municipal Code) that includes provisions for density bonuses for developments that include units reserved for low- and moderate-income households. The program is intended to comply with state density bonus law (Government Code Section 65915) and does not include requirements or incentives beyond those mandated by the Government Code.
Under the state requirements, developers are entitled to develop up to 35 percent more housing units on a site than is allowed by zoning, if a share of the units is reserved for lower- and moderate-income households. A sliding scale (based on the percentage of total units in the project that are affordable) is used to calculate the bonus. Such incentives were exercised in the approval of the Monteverde Senior Apartments project, wherein the permitted density of 38 units per acre was increased to 51 units per acre. The City will continue to apply such bonuses in the future, as appropriate.
Implementation of this action has resulted in the development of 18 extremely low- and very low-income units in the first year of the 5th cycle.
2019: 0
2020: 1
There are approximately 10-15 lots remaining in the Wilder development.
The City continued to implement the City’s affordable housing incentive program through the Density Bonus program that allowed for a 35-percent increase in the number of permitted units for developments. Through the City’s affordable housing program, 66 units restricted to extremely low- and very low-income households were developed for the Monteverde Senior Housing project. Without the program, approximately 55 units would have been allowed on the project site. The development was competed in November 2014 and fully occupied in December 2014.
The City intends to update the density bonus provisions of the Orinda Municipal Code to be consistent with current state law.
Continue.
Further implementation of this action is dependent on housing developer interest and could generate up to 16 additional units with development of the remaining RHNA (48 units) for affordable housing.
1.G Technical Assistance to Organizations that can develop or preserve lower-cost housing. Provide outreach and assistance to nonprofit organizations and builders whose expertise can inure to the benefit of low- and moderate- income Orinda residents, particularly seniors and those with special needs. A number of builders in the Bay Area are engaged in the development of high-quality affordable housing for lowand moderate-income households, including seniors. The City has worked collaboratively with such developers in the past to facilitate affordable housing construction. For example, the City provided technical assistance to Eden Housing during the permitting process for the Monteverde Senior Apartments development and provided financial assistance through $2.5 million in in-lieu fees from the Wilder development. The City will continue to provide information on federal, state, and county housing assistance programs in the future and will assist these individuals and organizations in obtaining funds to build and/or preserve affordable housing.
The City meets with people interested in developing housing on an ongoing basis, and will continue to do so in the future. When applications for affordable units or mixed-income housing developments are received, the City will proactively work with the applicants to address issues of concern, such as parking, traffic, and design. The City may also continue to explore ways to reduce the cost of developing such housing in Orinda, including offsetting land costs and fees on a case-by-case basis. The City anticipates contacting at least once a year non-profit organizations and builders of affordable and special needs housing to apply for funding to develop or preserve lower cost housing. The City anticipates applying for one funding application during the planning period.
The City provided technical assistance to organizations that help develop or preserve lower-cost housing, particularly seniors and those with special needs. In 2014, the City worked successfully with Eden Housing to develop 66 units affordable to extremely lowand very low-income senior households at the Monteverde Senior Housing project. The project includes one manger’s unit affordable at the moderate-income level.
In September 2021, an application for a 52unit affordable senior housing project named “Vista Verde Senior Housing Project” was submitted. The application is currently under review.
Continue.
Due to the national emergency declaration probed by the COVID-19 Pandemic, the County faced difficulties executing this
Continue.
seniors and other households. Contra Costa County’s Neighborhood Preservation Program provides loans to low- and moderate-income persons to improve their homes by correcting health and safety problems and improving livability. Loans are available throughout the entire county of Contra Costa except for the incorporated cities of Richmond and Pittsburg. Work done under the program may include re-roofing, plumbing, heating, electrical, dry rot and termite repairs, disabled access, security, exterior painting, and energy conservation. Participation in the program is subject to annual income limits—in 2014, qualifying participants could earn no more than $45,100 for a household of one to $64,400 for a household of four. The low interest loans range from a 3% interest rate for up to $50,000 to zero interest loans with deferred payment.
The City has not advertised this program in the past due to the relatively high incomes of most residents and the excellent condition of Orinda’s housing. However, as the population gets older and a larger number of residents may be living on fixed incomes, there may be benefits to local participation. This action would include coordination with County staff to confirm program requirements and eligibility, followed by advertisement of the program on the City’s website and in its quarterly newsletter.
Participate in the County's First-Time Homebuyer and Mortgage Credit Certificate (MCC) programs. Contra Costa County offers programs for firsttime homebuyers, including the Mortgage Credit Certificate program and a Below Market Rate home purchase program. The County also provides referral services to local nonprofits which assist homeowners seeking to purchase their first homes. The MCC program has been in effect since 1985 and provides qualified first-time buyers with federal income tax credits. These credits reduce the individual’s annual tax payment, which effectively frees up additional income for the mortgage payment. The program is available for homes up to $673,616 for persons with annual
program. This was due to both limited contact with COVID-19 at risk clients as well as construction and permit constraints.
Thirty-five projects under this program were funded and completed within the unincorporated county since 2014, with 14 households at 30% of the area median income (AMI), 7 households at 50% AMI, 12 households at 80% AMI, and 2 at 120% AMI.
The County makes information about Neighborhood Preservation Program on the County’s website, public access cable channels, through notices in the media, and via presentations given periodically.
The City continues to participate in the firsttime homebuyer and MCC programs. Due to limited time and resources, the City did not take additional steps to advertise the program's availability during the planning period. As noted in the Housing Element, the City will coordinate with County staff on implementing this program more proactively into the next planning period.
Continue.
incomes up to $89,200 for households with 1–2 persons and $102,500 for households with 3 persons or more.
The County has indicated that MCCs are currently available. The City will contact appropriate representatives at the County to determine how to best advertise opportunities for first-time buyers. If appropriate, information on the program will be included on the City’s website and included in the quarterly newsletter.
2.D Second Unit Rent Data. Continue to collect and monitor data on second unit rents to better understand their role in the Orinda housing market and the income groups they serve. As noted in the programs under Goal 1, the City supports the construction of second units as a way to meet Orinda’s Regional Housing Needs Allocation. This action program calls for the continued regular collection of data on second unit rents, using a combination of outreach to the owners of registered units and surveys of data sources and advertised rental listings (such as craigslist).
The City collected and monitored data periodically on second unit rents using online rental forums, such as Craigslist. The average rental prices surveyed for similar residential ADUs within or near Orinda in 2019 was about $1,568. In 2020, the average was approximately $1,755. The income state limits for lower-income 4-person households were $61,950 in 2019 and $65,250 in 2020. A household typically uses 30 percent of their income for housing. The ADUs surveyed are affordable to both moderate- and lowerincome households.
Continue, modify to include quantifiable objectives, and change the name of the program to Accessory Dwelling Unit Rent Data.
Maintain a sliding scale for calculating floor area ratios (FAR) as a way to preserve the city's existing stock of smaller homes. As noted in Chapter 5 of the Housing Element, the City’s zoning regulations limit the floor area that may be constructed on each Orinda lot based on the size of that lot. For example, a home on a 5,000-squarefoot lot may not exceed 1,400 square feet. In 2010, the City amended its requirements so that that the limits could be exceeded through the design review process. Nonetheless, the limits are still effective at reducing the incidence of teardowns and maintaining the city’s inventory of smaller homes, especially on lots less than 10,000 square feet. Over 600 residential parcels in the city are less than 10,000 square feet. Data from the assessor’s office indicates that existing homes on these lots have
The Planning Staff successfully implemented this program by continuing to implement structure size limitations that can be found in the City's Zoning Code (Orinda Municipal Code Section 17.6.8).
Continue and monitor to ensure outcomes match the intent of the action and do not constrain housing development that may benefit lower-
average assessed values that are 40 percent lower than homes on lots greater than 10,000 square feet. The City will continue to maintain floor area limits as a strategy for maintaining the city’s semi-rural character and conserving more affordable homes.
2.F Design Awards and Recognition. Develop a new category in the Mayor's Awards for Architectural Excellence for small homes or modifications to existing small homes. The City currently has an annual design awards program that recognizes outstanding projects in several categories, including community beautification and environmental sustainability. The City should consider creating a new category for renovation or new construction of small homes (2,000 square feet or less) as a way to recognize the value and benefits of such homes as part of the Orinda housing stock.
2.G Reduction in Home Energy Costs. Continue to advise residents of programs for reducing residential energy costs. Pacific Gas and Electric (PG&E) offers a number of programs to reduce residential energy costs.
REACH (Relief for Energy Assistance through Community Help) provides one-time assistance payments for energy costs to low-income customers.
The federal LIHEAP (Low Income Home Energy Assistance Program) offers assistance through reduced energy rates and weatherization assistance. In addition, CARE (California Alternate Rates for Energy) and FERA (Family Energy Rate Assistance) both provide rate discounts for low-income households. PG&E also offers energy audits and rebates for the use of energy-efficient appliances and the recycling of less efficient appliances. Information on these programs should be kept in the Planning Department waiting area and made available via links from the City’s website.
2.H Title 24 Administration. Continue to enforce residential energy conservation requirements as set forth in Title 24, California Administrative Code. Orinda will continue to implement and enforce Title 24 energy efficiency standards. Adhering to these standards can substantially reduce energy costs in new construction and major
and moderateincome households.
In 2016, the Mayor's Award for Architectural Excellence was presented to Eden Housing's Monteverde Senior Housing project, which included 66 multifamily units. The Mayor’s Award for Architectural Excellence was changed and is now the Mayor’s Award of Excellence.
Delete.
To ensure energy cost reduction information was made publicly available, the City provided pamphlets on assistance programs in the Planning Department waiting area.
Continue.
During the 5th planning period, the City continued to enforce the residential energy conservation requirements.
Continue.
remodels, reducing home energy costs and providing more income for housing and other expenses.
3.A Downtown. Study the feasibility of mixed-use development at appropriate densities. Both the existing Orinda General Plan and the existing Orinda Zoning Ordinance support mixed-use development in the Downtown area. Mixed use (upper-floor residential over ground-floor retail or office uses) is explicitly allowed by the Zoning Ordinance in the Downtown Commercial (DC) zone.
This action would continue the planning efforts for Downtown to determine the type, extent, and density of housing that would be appropriate in the Downtown area and would also explore the types of zoning standards that could facilitate such development.
Implement the City's Affordable Housing Incentive Program to reduce production costs in projects containing affordable units such as adjusting design standards on a case-by-case basis, which could include adjusting standards for setbacks, lot coverage, street width, unit size, and parking, for all affordable housing projects. As noted earlier in this chapter, the City’s Affordable Housing Incentive Program corresponds to the Statemandated density bonus law. Government Code Section 65915(d)(2) requires every city in California to provide one to three development incentives or concessions for projects that include affordable units (the number of incentives/concessions depends on the percentage of affordable units in the project). It is up to each local government to determine the incentives (for example, allowing additional height, reducing parking requirements, or allowing greater lot coverage). Cities may also offer incentives above and beyond those required by the State.
This task will include an evaluation of the potential incentives available to developers in Orinda in order to determine which are most effective and
The City allowed residential units above commercial uses that are part of a mixed-use development with a general use permit per Orinda Municipal Code Sections 17.8.4 and 17.31. In 2020, Orinda started a Downtown Precise Plan that will increase the allowed density in the Downtown Commercial Zone and allow residential use in the Downtown Office Zone where it is currently prohibited.
Continue, modify to strengthen commitment to facilitating mixed-use with appropriate densities.
The City continued the adjustment of design standards to improve affordability. Through the construction of 66 units of housing for very low- and extremely low-income seniors at the Monteverde Senior Apartments Project was completed in December 2014. This project made use of the City's Affordable Housing Incentive Program to build at a higher density than usually allowed by code.
The City continued to meet with interested housing developers on an ongoing basis. As applications for affordable units or mixedincome housing developments were submitted, the City proactively worked with the applicants to address issues of parking, traffic and design, and explored ways to reduce the cost of developing such housing in
Continue and implement Design Standards.
which are most viable given community concerns related to building mass, scale, height, parking, and other compatibility issues. Modifications to the existing program may be made in response to the findings.
Orinda on a case-by-case basis. The Planning staff educates applicants of the applicable zoning regulations and application process. Most recently, Planning staff actively worked with the applicant of the senior housing project at 10 Irwin Way prior to submittal.
3.C Shared Housing Program. Consider participating in ECHO’s housing’s “Shared Housing” or some similar program as a way to improve housing opportunities for lower-income seniors and extremely lowincome Orinda residents. Orinda has the second highest median age among Contra Costa County cities. In 2010, 36 percent of the city’s households included a person over 65 and 11 percent of the city’s households—695 households in total—consisted of persons over 65 living alone. At the same time, the Census indicates that Orinda has the highest average number of rooms per housing unit among the 19 cities in Contra Costa County. These statistics suggest that the City might benefit from a program that matches single seniors with others in the community— including locally employed service workers, teachers, public safety personnel, caregivers, and even “boomerang” young adults (children returning to Orinda after college).
Some of the city’s single seniors and empty nesters with surplus space in their homes may wish to rent out space in return for income or care but may be reluctant to advertise or rent to strangers. The nonprofit Eden Council for Hope and Opportunity (ECHO), which serves residents throughout the East Bay, operates a shared housing program that might potentially benefit those residents. The program matches persons needing housing with homeowners who have available space. ECHO is currently carrying out a shared housing program in Livermore and Pleasanton.
The intent of this program is to explore the feasibility of engaging ECHO or some similar organization to start a comparable program in Orinda. ECHO also provides counseling on shared living, supportive services, and
Due to limited time and staff resources since approval of the Housing Element in 2015, the City did not take action to pursue a partnership with ECHO or other similar program to establish a shared senior housing program in Orinda. The City will join in the County program in the future based on available funding and staffing.
Continue.
information and referral, as well as educational workshops on home sharing. The program may be a helpful way to assist extremely lowincome Orinda households, including single seniors on fixed incomes, persons with physical or developmental disabilities, and young adults seeking employment.
3.D No Net Loss Housing Capacity. Develop and implement an evaluation procedure to ensure the City maintains sufficient land to accommodate the Regional Housing Needs Allocation throughout the planning period. Because Orinda has a limited number of sites on which it can meet its Regional Housing Needs Allocation for low and very lowincome households during the planning period, it is important that the availability of these sites be monitored.
Section 65863 of the California Government Code stipulates that a community may not reduce the allowable density on a housing site if the result is that the city is no longer able to meet its Regional Housing Needs Allocation. The City will comply with Government Code 65863.
3.E Housing Sites. As a part of the 5th Cycle Housing Element, the City considered anew whether to rely on the 3.2 acre Santa Maria site to help meet the City's RHNA for lower income households. The City selected the Santa Maria site in EIR Alternative 1 to zone at up to 20 dwelling units per acre (the "default density" under State law) in order to accommodate 48 units of the City's allocation of lower income households. Through this Action, the City will initiate and process an amendment of the development policies (i.e., general plan, zoning and/or zoning map) applicable on the selected site to replace the existing High Density Overlay District on the site with policies to accommodate a total of 48 units at up to 20 dwelling units per acre (the "default density" under State law). This will be a public process. The precise wording of the development policies and configuration of the area covered will be determined through that public process.
The City of Orinda had a limited number of sites available to meet its RHNA allocation during the planning period. As a result, the Planning Department continued to monitor the sites identified in the Housing Element as both zoning changes and multifamily housing sites became proposed.
Continue.
On April 12, 2016, the Orinda City Council approved revisions to the use permit process in the RM District to accommodate the allocated 48 units for lower-income households. The HD overlay was applied to 2.4 acres of the Santa Maria site at 20 units per acre, for a capacity of 48 units per acre.
Action was completed, delete.
3F. Extremely Low-Income Housing. Encourage additional housing resources for extremely low-income Orinda residents, particularly seniors and persons with physical or developmental disabilities. The Needs Assessment in Chapter 3 identified 283 extremely low-income owneroccupied households and 156 extremely low-income renter households in Orinda. Based on Census data, the majority of these households are headed by seniors. Other extremely low-income households in the city include persons with disabilities, low wage workers, and the long-term unemployed.
The City encourages the creation of additional housing resources for extremely low-income households. Since a majority of Orinda’s extremely low-income residents are homeowners, programs to assist in home repair and maintenance through low-cost loans or grants are strongly supported. The City may also encourage the inclusion of extremely low-income units within new affordable rental developments. In addition, affordable housing tenant selection should place a priority on extremely low-income persons. The Monteverde Senior Apartments development now under construction exemplifies both of these provisions—it includes units reserved for extremely low-income persons and a tenant selection process that focuses on extremely low-income households. Similar measures may be included in the event affordable housing is built for persons with developmental disabilities or other physical disabilities.
The City will also encourage context-appropriate solutions to meet the housing needs of other extremely low-income households in Orinda, including individuals and families. These include shared housing opportunities, second units, small group homes, and transitional housing. Activities such as grant and funding assistance, priority processing, deferral of impact fees until issuance of certificates of occupancy, and support for applications to create new housing units will be supported in the future. The Planning Department will produce an informational pamphlet regarding assistance and resources available to all extremely low-income households and to persons with developmental or other
The Monteverde Senior Apartments development completed in 2014 includes units reserved for extremely low-income persons with a tenant selection process that focuses on extremely low-income households.
Continue.
physical disabilities. The information will be updated at least twice during the planning period and distributed to the local faith community and made available at City Hall and on the City’s website and at the Contra Costa County Supervisors’ office.
4A. Revise the Use Permit Requirements. Revise the use permit process in the Residential Medium-Density (RM) District. The City will modify the decision-making criteria in the current use permit process in the RM District and establish guidelines to define compatibility of uses. The revisions will balance certainty for applicants with the continued preservation and enhancement of existing community character.
4B. Reduction of Permitting Costs and Delays. Explore the feasibility of expanding the City's Affordable Housing Incentive Program to add provisions for reductions in application- processing costs for multi-family projects containing affordable units. Although Title 17.4.31 of the Municipal Code establishes an Affordable Housing Incentive Program, the program currently only includes State-mandated density bonus requirements. The City used in-lieu housing fees from the Wilder project to facilitate affordable housing and may, on a case-by-case basis, continue to consider housing fees through development agreements in the future. Additional financial incentives also may be considered for projects incorporating affordable units, including priority processing and deferral of impact fees until issuance of certificates of occupancy. Such reductions would be determined on a case-by-case basis, depending on the attributes of each project.
On April 12, 2016, the Orinda City Council approved revisions to the use permit process in the RM District to accommodate the allocated 48 units for lower-income households.
The Planning Staff continued to make completeness determinations ahead of the 30-day completeness deadline. To ensure housing for low-income and special-needs households development impact fee waivers continued to be available for affordable housing projects. Applicants can come to the counter and speak to planning staff regarding the City’s process and have one-on-one discussions about potential projects. Planning Staff also have a Conceptual Development Review (CDR) pre-application that allows applicants to submit a potential project and obtain written comments on their preliminary project prior to formal submittal of a discretionary application.
4C. Shared Parking Regulations. Consider adopting shared parking regulations where it can be demonstrated that there will be no parking shortages. The City’s current parking regulations require that each use in a mixed-use building provide parking as though it were a freestanding use. As a result, uses in the same building with different parking demand
In 2020, the City adopted a parking variance in-lieu fee that permitted developers to pay an in-lieu fee for nonresidential development parking requirements. The City continues to consider expanding the parking variance in-
Action was completed, delete.
Continue.
Continue.
characteristics may be providing a larger aggregate number of spaces than is actually needed by the building.
This action will study provisions to allow sharing of parking where it can be demonstrated that the overall demand for the project can be met without spillover onto nearby streets. For example, residential guest parking could be shared with office or retail parking. These provisions might also consider the feasibility of shared parking agreements that enable the use of off-site parking lots.
4D. Building Code Updates. Continue to implement the California Building Code of Regulations as locally amended. Update or amend the codes as state requirements change. This is an ongoing program. The City will amend Title 15 of the Municipal Code (Building Regulations) as needed to incorporate state requirements, including those related to green building and energy conservation. Amendments to reflect issues of local concern (such as high fire danger) will be made as needed.
4E. Fee Updates. Periodically review planning and building fees to ensure they cover required costs but are not more than is necessary to provide the required City services. This is an ongoing program. The City periodically reviews its planning and building fees to ensure that they are appropriate, based on actual operating costs and fees charged for comparable services provided by other cities. The City will ensure that its fees are not excessive and that its housing-related fees are not used to cross-subsidize other City services. Fees were last updated in 2014.
5A. Fair Housing Program. Distribute information regarding fair housing issues in the City's quarterly newsletter, at the Orinda Library, and at City offices. This is an ongoing program. Pamphlets on fair housing laws and procedures will be made available at City Hall and the library, and information on fair housing requirements will be incorporated in the City’s newsletter. This information should also be available via the City website. The City’s Planning Director will be identified as the point of contact in the event a fair housing complaint is received, with referrals provided to the
lieu ordinance to residential development in the future.
The City established both a permitting process and a streamlined process for small residential solar energy systems. The City continued to implement building codes as required by the state.
Continue.
The Planning Department's fees were updated annually to reflect actual processing costs during the planning period.
Continue, modify so planning fees are made available online.
The City continues to include Fair Housing information in quarterly newsletters, the Orinda Library, and at City offices. This policy remains active. There were no fair housing complaints from 2015-2020. Articles regarding affordable homeownership at Orinda Grove were included in past
Continue, expand with Fair Housing program.
Contra Costa Housing Authority or the California Department of Fair Employment and Housing as necessary.
5B. Local Preference in Housing Opportunities. Continue measures to ensure that persons who work in Orinda receive preference in the occupancy of new affordable for-sale housing units. The City has already taken steps to provide preference in the purchase of the moderateincome units at Orinda Grove for those who currently work in Orinda, including schoolteachers, firefighters, law enforcement officers, and others in the moderate-income bracket. Similar provisions would apply as additional moderate-income for-sale housing is developed in the future.
5C. Assistance for persons with developmental disabilities. Support the construction and rehabilitation of housing to meet the needs of Orinda residents with developmental disabilities, including small group homes and units in affordable housing developments that are designed for developmentally disabled persons. Developmentally disabled residents include children with mental or physical impairments and adults who were born with a disability or developed a disability before age 18. Many developmentally disabled persons can live and work independently, but some require a group living environment with supervision or living units with special features. The City will continue to support the development of small group homes that serve developmentally disabled adults and will work with the nonprofit community to encourage the inclusion of units for persons with developmental disabilities in future affordable housing developments. The City will also coordinate with the Regional Center of the East Bay to inform Orinda families of the resources available to them and to explore incentives so that a larger number of future housing units include features which meet the needs of persons with developmental disabilities and other special needs.
Source: City of Orinda, February 2022
newsletters to highlight available opportunities for affordable housing.
From 2015-2020, the local preference program provisions were incorporated into the established below-market rate (BMR) program for the Orinda Grove project. The program was initiated in 2014 and began with 8 BMR units. Of the 8 initial applicants, 7 were employed in Orinda. In 2019, a unit was sold, and by 2020, 6 units were estimated to be occupied by persons who work in Orinda.
Several of the units in the Monteverde project included universal design features to accommodate the unique needs of seniors and persons with disabilities. In January 2021, a memory care facility with 38 assisted-living units was approved at 1 Wilder Rd.
Continue.
Continue.
The 2015–2023 Regional Housing Needs Allocation (RHNA) prepared by the Association of Bay Area Governments (ABAG) determined that zoning to accommodate 227 additional housing units needed to be in place in Orinda during the prior planning period to meet regional housing needs. ABAG disaggregated this allocation into four income categories: very low, low, moderate, and above moderate.
Table 3-1 compares the 5th Cycle RHNA to the building permits issued during 2015 to 2021. The City issued permits for a total of 346 units from 2015 to 2021. Among these, approximately 12 percent (43 units) were for building permits affordable to moderate-income households and the remaining (303 units) were market rate units.
Source: ABAG Regional Housing Needs Allocation (RHNA) Plan, December 2021, City of Orinda, February 2022
This chapter of the Housing Element profiles demographic and housing conditions in Orinda to assess the city’s future housing needs. Pursuant to California Government Code requirements, data on population, household characteristics, income and employment, special-needs groups, housing stock characteristics, building condition, and housing value is presented.
The analysis in this section primarily uses data compiled by the Association of Bay Area Governments (ABAG) in the Data Profiles for Housing Elements workbook, released in April 2021. ABAG data is primarily from the 2015 - 2019 American Community Survey (ACS). ACS figures are estimates based on samples; for a small city like Orinda, reported figures may be subject to large margins of error. In addition, data from sources including the City of Orinda, the California Department of Finance (DOF), or anecdotal evidence has also been used where appropriate.
As of January 2021, the City of Orinda had a population of 19,078. This represented 1.6 percent of Contra Costa County’s total population. The city has experienced limited growth in recent years. Population increased by 5.5 percent between 2014 and 2021, compared to 0.3 percent between 2000 and 2010 (see Table 4-1).
The growth rate of the neighboring cities of Lafayette and Moraga (collectively forming the “Lamorinda” area) was slightly lower from 2014 to 2021. Orinda’s growth was similar to the growth rate of Contra Costa County (6.1 percent) for the same period (see Table 4-2).
In the 2021 projections, ABAG forecasted slow population growth in Orinda. ABAG projects the population to be 20,200 in by 2040, equivalent to an increase of approximately 10 percent over the 20-year period from 2020 to 2040.
Source: 2000, 2010, and 2019 US Census, California Department of Finance, E-5 series (ABAG Housing Element Data Package, 2021)
Source: 2010 and 2019 US Census, California Department of Finance, E-5 series (ABAG Housing Element Data Package, 2021)
Table 4-3 and Figure 4-1 illustrate the age distribution in Orinda for 2010 and 2019. The table indicates a slight increase in the average age of residents since 2010, increasing from an average of 46.1 to 48.7, respectively. Specifically, there was a slight increase in residents aged 55 and over in 2019 (38.6 percent), compared to 2010 (36.7 percent). From 2010 to 2019, there was a 2.4-percent decrease in population for individuals 5 to 14 years of age and an increase of 2.1 percent for the 65 to 74 age group. The secondhighest decrease in population was for the 25 to 34 age group, at 1.6-percent decrease.
Data (2015-2019) (ABAG Housing Element Data Package, 2021)
Source: U.S. Census Bureau, American Community Survey
Source: U.S. Census Bureau, American Community Survey 5-Year Data, 2005-2010 and 2015-2019 (ABAG Housing Element Data Package, 2021)
Orinda’s racial and ethnic diversity increased moderately between 2010 and 2019 (see Table 4-4). However, the racial and ethnic composition of the city, as documented by the 2015-2019 ACS, differs from that of the county and the Bay Area. About 72.0 percent of Orinda residents were white, contrasted with 39.3 percent and 43.8 percent for the Bay Area and county, respectively (see Figure 4-2).
The Census Bureau defines Hispanic/Latinx ethnicity separate from racial categories. For the purposes of this graph, the “Hispanic or Latinx” racial/ethnic group represents those who identify as having Hispanic/Latinx ethnicity and may also be members of any racial group. All other racial categories on this graph represent those who identify with that racial category and do not identify with Hispanic/Latinx ethnicity.
Source: U.S. Census Bureau, American Community Survey 5-Year Data (2015-2019) (ABAG Housing Element Data Package, 2021)
White, Non-Hispanic Black or African American, Non-Hispanic
Asian / API, Non-Hispanic American Indian or Alaska Native, Non-Hispanic
Source: U.S. Census Bureau, American Community Survey 5-Year Data (2015-2019) (ABAG Housing Element Data Package, 2021)
A household refers to the people occupying a home, such as a family, a single person, or unrelated persons living together. Family households often prefer single-family homes or condominiums to accommodate children, and nonfamily households generally occupy smaller apartments or condominiums.
According to the DOF, as of 2021, there were 2.8 persons per household in the City of Orinda.
According to the 2015-2019 ACS, Orinda had a total of 5,679 family households residing in occupied housing units. Of these, 340 were female-headed family households, about 4.7 percent, and 101 were male-headed family households, about 1.4 percent, and the remaining 73.1 percent were married-couple families. Single-person households represent approximately 17.7 percent of all family households in Orinda (see Table 4.5). In Contra Costa County, 17.1 percent of households were single headed households (female-headed and male-headed). For the Bay Area, 15.2 percent of households were single-headed households.
Table 4-5 shows household types for Orinda, Contra Costa County, and the Bay Area.
Single-parent households, particularly those headed by women, are likely to have greater demand for childcare and other social services than two-parent households. Because single-parent households often have limited incomes, these households may have trouble finding adequate, affordable housing.
Source: U.S. Census Bureau, American Community Survey 5-Year Data (2015-2019) (ABAG Housing Element Data Package, 2021)
Overcrowding is defined as more than one person per room, based on the Census Bureau’s definition of “room,” which excludes bathrooms, porches, balconies, foyers, halls, or half-rooms. Severe overcrowding occurs when there are more than 1.5 persons per room. Overcrowding can result when there are not enough adequately sized units within a community, or when high housing costs relative to income lead individuals or households to share housing. Overcrowding may also create secondary problems, such as deterioration of housing stock from overuse.
Though 1.00 or more persons per room is the general measure of overcrowding, the actual level of perceived overcrowding will vary according to household size and structure. Houses with fewer rooms and non-related adult residents may seem more overcrowded than larger, family households. According to the 2013-2017 Comprehensive Housing Affordability Strategy (CHAS) data, the city had no overcrowded or severely overcrowded households (more than one person per habitable room), compared to 5.0 percent for the county and 6.9 percent for the Bay Area (see Table 4-6). This is at least partially because of the relatively large size of Orinda homes. The 2015-2019 ACS data indicated that only 5.2 percent of the city’s housing stock consists of one-bedroom and studio units and 89.4 percent of the homes have three or more bedrooms. This suggests that the City’s housing stock provides the housing types needed for Orinda residents.
Source: 2013-2017 CHAS Data Book (ABAG Ho using Element Data Package, 2021)
According to the 2015-2019 ACS, the city’s median family income in 2019 was $324,649 (see Table 4-7). The 2015–2019 ACS also indicated that the estimated median family income from 2009 to 2019 increased by $141,370. This is approximately double the median for Contra Costa County as a whole and is 278 percent higher than the State of California median. Moreover, family income grew faster in Orinda than it did in either the county or the state. The 2015-2019 ACS data showed a 77.1-percent rise in median income, compared to 56.8 percent for the county, and 22.2 percent for the state.
Median family income is often greater than median household income because a household can consist of single individuals, whereas family income always consists of two or more individuals.
More than half of Orinda’s households had annual incomes exceeding $200,000. On the other hand, an estimated 851 households in the city—or about 11.9 percent of the city’s households—have annual incomes of less than $50,000 a year. As noted in Section 3.8, Persons with Special Needs, some 5.7 percent of the city’s households earn less than $25,000 a year. While some of these households may be single seniors with very low monthly housing costs, the figure also includes families and others who may spend large portions of their incomes on housing. Moreover, even seniors with low housing costs (e.g., no mortgage) may face expensive utility bills or home repair and maintenance costs beyond their means.
Source: American Community Survey 5-Year Data (20 15-2019) (ABAG Housing Element Data Package, 2021)
Although standards applied to gauge housing costs vary, households that pay more than 30 percent of income on housing cost are considered to be overpaying for housing or cost burdened, while households that pay 50 percent or more are considered severely overpaying or severely cost burdened.
Tables 4-8A, Households by Income, and 4-8B, Overpayment for Housing by Lower Income Households, show that 1,154 households (16.3 percent) of all Orinda households are overpaying for housing. Of the total households, 1,040 households are lower income households. When looking at lower income households specifically, 644 households (56 percent) are paying between 30 and 50 percent of their income for housing costs and 510 (44 percent) are paying over 50 percent of their income for housing. Of the lower income households overpaying, 14.6 percent are renter households and 85.4 percent are owner occupied households.
Even though median income in Orinda is relatively high, housing costs remain a challenge for a substantial number of the city’s residents. This can be an issue for some seniors as well as for working families, single parents, and others who face changing life circumstances. The sudden loss of employment, a health care emergency, or a family crisis can quickly result in a heavy cost burden, with few affordable options available within the city.
Source: 2014-2018 CHAS Data Sets https://www.huduser.gov/portal/datasets/cp.html
The 2015–2019 ACS indicates that about 44 percent of Orinda’s working residents were employed in white-collar occupations, such as financial and professional services (see Table 4-9). The largest employment industries in 2019 were financial and professional services, health and educational services, and manufacturing/wholesale and transportation. The fastest-growing employment industries between 2011 and 2019 were financial and professional services as well as health and education. The greatest decrease was in information.
According to the 2015–2019 ACS, 61 percent of the population age 16 and over in Orinda were in the labor force. Based on the 2015–2019 ACS, the average commuting time to work was about 36.1 minutes. Similarly, the commuting time in Contra Costa County in 2019 was 38.7 minutes.
According to ABAG’s Plan Bay Area 2040 statistics published in 2018, it was projected that there would be 5,495 jobs in Orinda in 2020. According to the 2015–2019 ACS, there were 7,167 households in the city in 2019, resulting in a job to housing ratio of 0.58. This is comparable to the Contra Costa County ratio of 0.98 jobs per household. Most Orinda residents work outside the city, often commuting to jobs in San Francisco, Oakland, and other East Bay and South Bay employment centers.
Future job and housing growth is an important regional policy issue. Past trends have included limited capacity for housing growth and likewise has little capacity for job growth. An increasing number of residents are telecommuting or working from home, helping to reduce traffic congestion and related greenhouse gas emissions.
ABAG’s statistics from 2018 indicated that in 2010 there were 4,835 jobs in Orinda. From 2010 to 2040 jobs were projected to increase to 5,500, or just under 1 percent per year between 2010 and 2040. The number of households in Orinda is projected to increase to 6,825 during the same period. Thus, the jobsto-housing ratio is expected to increase slightly to 4.2 percent over the next 30 years.
Because the city does not expect to add major new employment centers, additional housing demand associated with locally occurring job growth will be very low. Historically, financial and professional services have been the biggest industry in the City of Orinda. The city also has an abundance of health and educational services. According to the 2015–2019 ACS, the top industry providing employment continues to be financial and professional services (13.5-percent increase), followed by health and educational services (7.8-percent increase) and construction (2.1-percent increase).
Source: U.S. Census Bureau, American Community Survey 5-Year Data (2015-2019) (ABAG Housing Element Data Package, 2021)
1 Other services except public administration.
Table 4-10 shows the top employers in Contra Costa County in 2021 by number of employees. None were located in the City of Orinda. The top employers in Contra Costa County in 2021 were Chevron Corporation and Chevron Research and Technology.
Chevron Richmond Refinery
Contra Costa Regional Med Ctr
Richmond
Martinez
John Muir Health Concord Med Concord
Kaiser Permanente Antioch Med
Antioch
Kaiser Permanente Martinez Med Martinez
Kaiser Permanente Walnut Creek Walnut Creek
La Raza Market Richmond
USS Posco Industries Pittsburg
500 – 999
Broadspectrum Americas
C & H Sugar Co Inc
Richmond
Crockett
Longs Drug Store Walnut Creek
Los Medanos College
Martinez Arts Outpatient Clinic
Pittsburg
Martinez
Nordstrom Walnut Creek
Oakley Union School District Oakley
Robert Half Intl San Ramon
San Ramon Regional Medical Ctr
San Ramon
Santa Fe Pacific Pipe Lines Richmond
Shell Oil Prod US Martinez Martinez
Sutter Delta Medical Ctr Antioch
US Veterans Medical Ctr Martinez
Source: Employment Development Department, 2021
According to the Employment Development Department, there were 8,900 persons in the Orinda labor force in 2021 (see Table 4-11). Generally, the unemployment rate has decreased since 2010 in the City of Orinda. However, in 2020, the unemployment rate more than doubled. This increase can most likely be attributed to the COVID-19 pandemic. In 2021, the unemployment rate decreased by almost half to 3 percent.
Source: Employment Developmen t Department, December 2010-2021
This section describes certain characteristics of the city’s housing supply, including type, condition, ownership, vacancy, and costs.
The California Department of Housing and Community Development (HCD) defines a housing unit as a house, an apartment, a mobile home or trailer, a group of rooms, or a single room occupied as separate living quarters, or if vacant, intended for occupancy as separate living quarters. Separate living quarters are those in which the occupants live separately from any other individuals in the building, and which have direct access from outside the building or through a common hall. For vacant units, the criteria of separateness and direct access are applied to the intended occupants whenever possible.
The ACS indicated there were 7,194 housing units in Orinda in 2021. This is an increase of 5 percent (6,804 units) from 2010. In 2021, approximately 93 percent of the city’s housing stock was made up of singlefamily units (see Table 4-12 and Figure 4-3). Multifamily housing units representing about 5 percent of the housing stock.
Source: California Department of Finance, E-5 series (ABAG Housing Element Data Package, 2021)
Source: California Department of Finance, E-5 series (ABAG Housing Element Data Package, 2021)
Approximately 90 percent of households in Orinda in 2019 were owner-occupied, a 9.9-percent increase from 2010 (see Table 4-13). The city experienced a slight increase in the number of renters from 677 in 2010 to 711 in 2019, a 5-percent increase.
Source: U.S. Census Bureau, Census (2015-2019) (ABAG Housing Element Data Package, 2021) (ABAG Housing Element Data Package, 2021)
The percentage of owner-occupied housing units is still much higher in Orinda than the county or the Bay Area (see Table 4-14), where only 65.9 percent of the county’s households and 56.1 percent of the Bay Area’s households are homeowners.
Source: U.S. Census Bureau, Census (2015-2019) (ABAG Housing Element Data Package, 2021)
Residential vacancy rate is a good indicator of the balance between housing supply and demand in a community. When the demand for housing exceeds the available supply, the vacancy rate will be low. When there is an excess supply, the rate will be high. A vacancy rate of 3 to 5 percent is generally indicative of a healthy market. When vacancy rates fall below 3 percent, there is upward pressure on home prices and rents.
In 2019, Orinda’s vacancy rate was 4.5 percent. Of the 341 units reported by the Census as “vacant” in 2019, 41 were for sale and 97 were sold or rented but not yet occupied (see Table 4-15). There were also 82 units reported as “seasonal, recreational, or occasional use” and 121 units reported as “other.” Other is described as “when it does not fit into any year-round vacant category.” In comparison, Contra Costa and the Bay Area had slightly lower vacancy rates in seasonal/recreational/occasional use unit at 11.5 percent for the county and 21.6 percent for the Bay Area. Whereas in Orinda, the highest “vacant” unit reported was the “other vacant.” It should be noted that the data provided by the ACS is an estimate and not an exact figure, but rather a range of possible values. Based on current data (2022) from Zillow.com, there were 24 units for rent or 6.5 percent of the housing stock in the City of Orinda.
Source: U.S. Census Bureau, American Community Survey 5-Year Data (2015-2019) (ABAG Housing Element Data Package, 2021)
1 The ACS has a margin of error of +/- 19 for the “for rent” category meaning this is not an exact depiction of the housing stock between 2015 and 2019.
Age is one measure of housing stock conditions and a factor for determining the need for rehabilitation. Without proper maintenance, housing units deteriorate over time. Thus, units that are older are more likely to need major repairs (e.g., a new roof or plumbing). Generally, houses 30 years and older are considered aged and are more likely to require major or minor repairs. In addition, older houses may not be built to current standards for fire and earthquake safety.
Approximately 87 percent of Orinda’s total housing stock is 30 years old or older (i.e., was constructed before 1991). As noted in Table 4-16, this compares to 84.2 percent for Contra Costa County.
Although a high percentage of the city’s homes are more than 40 years old and as such may require more regular maintenance and repair, the majority of the city’s housing stock is well maintained. The homes in need of rehabilitation and replacement are not concentrated in any one geographic area.
Because of high home prices, homes that require rehabilitation or replacement are typically purchased by households with above-moderate incomes. These homes are then rehabilitated, eliminating the substandard condition. Residential additions and major remodels over 1,000 square feet are subject to design review under City codes and regulations. Per SB 9, lots zoned for single-family use allow duplexes to be built on single family lots, subject only to objective standards, which makes splitting of existing single-family lots a ministerial approval process. The purpose of these regulations is to help ensure the proposed residential additions blend in with their surroundings and reflect the dominant visual character of the immediate neighborhoods.
Source: U.S. Census Bureau, Census (2015-2019) and Department of Finance 2021 Housing Estimates (ABAG Housing Element Data Package, 2021)
Orinda’s housing stock is in excellent condition. According to 2015–2019 ACS data, about 1.0 percent of the renter housing stock lacked complete kitchen and plumbing facilities. However, the 2015–2019 ACS indicates that its sampling methodology should be supplemented by local knowledge requiring rehabilitation based on recent community surveys, such as knowledgeable builders/developers in the community or nonprofit housing developer organizations. The City is unaware of any occupied housing units lacking plumbing or kitchens, with the exception of those that may currently be under renovation or under construction.
Based on visual reconnaissance of Orinda neighborhoods, it is believed that fewer than 10 homes in the city are dilapidated, abandoned, or in poor condition. Because it would not be a prudent use of City resources to do a physical conditions survey of each of Orinda’s approximately 7,167 homes given the very small number that are substandard, the City has researched various indicators to estimate housing condition. These are shown in Table 4-17 and are primarily based on code enforcement cases and resident complaints. The code inspection program is primarily complaint driven and by request only.
Another indicator of housing condition is the level of reinvestment in Orinda’s existing housing stock. The valuation of work authorized by residential building permits between 2009 and 2012 (three fiscal years) was roughly $51.3 million. The total amount was between $16 and $19 million each fiscal year. Of the three-year total, 77 percent represented reinvestment in existing homes and 23 percent was related to new construction. Almost $40 million in valuation was added to existing homes through residential alterations and additions in just three years.
The City has included Action 2.C in this Housing Element to advertise the availability of home maintenance and repair loans through Contra Costa County to Orinda residents and consider pursuing additional funding for home repairs and improvements. In addition, the City will respond on a complaint basis to code enforcement violations to ensure that the Orinda housing stock remains safe and in good repair.
One of the major barriers to housing availability is the cost of housing. To provide housing to all economic levels in the community, a wide variety of housing opportunities at various prices should be made available. Housing affordability is dependent on income and housing costs.
Housing affordability is based on the relationship between household income and housing expenses. According to the United States Department of Housing and Urban Development (HUD) and HCD, housing is considered “affordable” if the monthly housing cost does not exceed more than 30 percent of a household’s gross income.
Housing in Orinda is expensive. Orinda’s median home sales price, as reported by Redfin in December 2021 was $2,300,000.
Table 4-18 shows median home sales prices for Orinda, Moraga, Lafayette, and Contra Costa County from 2016 to 2021. Median prices decreased from 2016 to 2017 for Orinda, and increased for Moraga, Lafayette, and the county. From 2017 to 2018, median prices decreased again by 4.4 percent in Orinda and by 5.6 in Lafayette. For Moraga and the county, prices increased by almost 5 percent. While home prices in Orinda and Lafayette significantly increased between 2018 and 2019, a decrease in price occurred for Moraga and a slight increase occurred for the county. Between 2019 and 2020, home prices increased by 1.2 percent in Orinda and 9.0 percent in Moraga. Both the county (14.9 percent) and Lafayette (22.6 percent) experienced significant increases in median sales price in 2020. For 2021, prices increased by 38.6 percent in Orinda, 31.7 in Moraga, and 21.1 percent in Lafayette. The county experienced a 9.2 increase in price from 2020 to 2021.
Source: Redfin 2015-2021 (www.Redfin.com)
Rents in Orinda are also well above the state and county medians, in part because most of the rental properties are large, detached single-family homes.
Compared to a recent survey of craigslist.com, Zillow.com, and Roomies.com websites in November 2021, there were 15 properties, single-family apartments and individual rooms in Orinda advertised for rent. These included two one-bedroom units, with rents from $800 to $2,100 per month, and 10 units with three or more bedrooms with rents ranging from $2,749 to $7,000 per month. Advertised rents ranged from $850 to $7,000 per month (see Table 4-19). According to the HUD Oakland – Fremont Metro FMR area that encompasses the City of Orinda, in 2019, the fair market rent for a two-bedroom unit was $2,126. A three-bedroom was $2,925 and a four-bedroom was $3,587. The costs have significantly increased, by 30 to 40 percent for a two and four bedroom and decreased by 6 percent for a threebedroom.
Source: Craigslist, Apartments.com, and Realtor, November 2021.
Based on the analyses presented, housing units are available for purchase at prices that often exceed affordability limits for moderate-income households. One-bedroom, market-rate apartment rents are often affordable to low- and moderate-income households, but these units are typically only suitable for one- and two-person households.
Orinda’s history of development followed a course of single-family homes in a semi-rural environment. Orinda’s development pattern contributes to its continuing attractiveness as a place to live and its quality of life.
Federal and state agencies regard 30 percent of gross annual income as a reasonable expenditure for housing. Based on this guideline, the maximum unit price affordable to each income group can be estimated. Table 4-20 provides HCD income limits as of 2021 for Contra Costa County. The table indicates the maximum sales or rent price for an “affordable” unit serving each of the income groups listed.
Table 4-20 provides the affordable rents and maximum purchase price, based on the HCD income limits for Contra Costa County. As shown in Table 3-20, the maximum affordable rent is $1,025 for an extremely low-income four-person household, $1,712 monthly for a very low-income household, $2,740 for a lowincome household, and $3,767 for a moderate-income household. As shown in Table 4-19, two- and three-
bedroom units were renting at median prices of $3,932 to $4,520, respectively, and therefore are out of the affordability range for extremely low-income, very low-income, and low-income households and within reach of moderate-income households. The two-bedroom units were within the price range for moderate-income households.
As of December 2021, the median sales price for all single-family homes in the city was $2,300,000. The maximum affordable sales price for a four-person household is $260,054 for an extremely low-income household, $434,481 for a very low-income household, $695,170 for a low-income household, and $966,856 for a moderate-income household. This indicates that all households would have a hard time affording existing and newly constructed homes in Orinda at a median sales price of $2,300,000.
While high monthly mortgage payments are resulting in many instances of overpayment among homeowner households, a relatively large number of Orinda households are living mortgage free.
Source: California Department of Housing and Community Development, memorandum dated December 31, 2021 – “State Income Limits for 2021”
1. Affordability estimates do not include utility costs.
2. Total affordable mortgage based on a 5-percent down payment, an annual 2.88 percent interest rate, 30-year mortgage, and monthly payment equal to 30 percent of income.
As required by Government Code Section 65583, the Housing Element must analyze the extent to which below-market rate units are at risk of converting to market-rate housing. If there are at-risk units, the element should include programs to encourage preservation of these units or to replace any that are converted to market rate. The units to be considered are any units that were constructed using federal assistance programs, state or local mortgage revenue bonds, redevelopment tax increments, in-lieu fees or an inclusionary housing ordinance, or density bonuses. Housing is considered to be “at risk” if it is eligible to be converted to non-low-income housing due to: (1) the termination of a rental subsidy contract, (2) mortgage prepayment, or (3) the expiration of affordability restrictions. The time period applicable in making this determination is the 10-year period following the last mandated update of the Housing Element, which in the case of Orinda, is 2023 to 2031. There are currently no units at risk of converting to market rate in the next 10 years.
Federally subsidized rental housing in Orinda is currently being provided by the 150-unit Orinda Senior Village (see Table 4-21). This project was developed with the use of HUD 202 funds. The Senior Village provides housing for disabled persons (15 units) and persons 62 years of age and older. In addition, the Monteverde Senior Apartments is a 67 affordable unit development built by Eden Housing in 2014. The project is financed through Low-Income Housing Tax Credits (LIHTC), HOME, Community Development Block Grant (CDBG) funds, and a City land contribution of $2.5 million, funding for which was received from the developer of the Wilder residential project in Gateway Valley. The project has an affordability restriction of 30 years, to comply with the requirements associated with Low-Income Housing Tax Credit financing.
No other low-income, multifamily rental units in the city have been constructed with the use of federal assistance programs, state or local mortgage revenue bonds, redevelopment tax increments, in-lieu fees or an inclusionary housing ordinance, or density bonuses.
Sources: California Housing Partnership, Preservation Database 2021.
Qualified entities are organizations that have the ability to purchase or assist with maintaining the affordability of a project that is at-risk of being converted from affordable to market rate. The organizations available to assist with a potential project in Orinda are listed below.
● Rubicon Programs, Inc.
● ACLC, Inc
● East Bay NHS
● Affordable Housing Associates
● Eskaton Properties Inc.
● Rural California Housing Corp
● East Bay Asian Local Development Corporation
● Pacific Community Services, Inc.
● Community Housing Development Corp.
● Anka Behavioral Health
● Satellite Housing Inc.
● Northern California Land Trust, Inc.
● City of Walnut Creek
● Alameda County Allied Housing Program
● ROEM Development Corporation
● Neighborhood Housing Services of the East Bay
● L + M Fund Management LLC
Consistent with California planning and zoning law, the Housing Element must include an analysis of special housing needs. This includes the needs of seniors, persons with physical and developmental disabilities, large families, farmworkers, families with female heads of households, extremely low-income households, and households and persons in need of emergency shelters.
According to the 2015-2019 ACS, approximately 22.6 percent of the population (4,449 persons) were senior residents (65 years or older). Senior-headed households made up approximately 38.1 percent (2,728 households) of the households in Orinda. Of those, 88.3 percent were owner-occupied households and 11.7 percent were renter-occupied households. The 2015-2019 ACS reports that the majority of senior, owner-occupied households (1,620 households or 67.2 percent) had incomes greater than 100percent area median income (AMI). The majority of renter-occupied households (130 households or 40.8 percent) had incomes between 0 and 30 percent of the AMI or the extremely low-income group. In addition, about 2,409 of senior citizens are owners compared to the 319 senior citizens that are renters, with a majority (216 residents) living in assisted living facilities (refer to Table 4-22 and Figure 4-4).
With a third (32.2 percent) of senior households falling into the low-income group, senior housing is an identified need of the city. The City has developed and recently approved affordable senior housing projects, and has included several actions to support the needs of senior households (Actions 1.F, 2B, 3.A, and 3.B).
Source: U.S. Census Bureau, American Community Survey 5-Year Data (2015-2019) (ABAG Housing Element Data Package, 2021)
Source: U.S. Census Bureau, American Community Survey 5-Year Data (2015-2019) (ABAG Housing Element Data Package, 2021)
Senior Housing and Services
In Orinda Senior Village, there are 150 housing units set aside exclusively for senior citizens, including units for persons with disabilities. Based on the total number of units occupied by seniors (2,728 units), these dedicated units represent only a fraction of the potential demand for housing that is specifically designed for seniors. A majority of Orinda’s seniors reside in large single-family homes, many of which are located on steep, narrow, and twisting roads, far from transit and the amenities of downtown. These residents choose to remain in the city because of the high quality of life and their attachment to the community, but some may prefer housing that requires less maintenance, easier navigation (e.g., fewer stairs), and better access to health care and other services.
The City of Orinda provides a variety of senior services and programs. The City’s website outlines a variety of senior resources, such as Senior Tech Help, and resources on how to apply for CalFresh. The City also works with other agencies and nonprofit organizations to meet the needs of seniors in the community. The Orinda Recreation Department sponsors fitness, recreational, and social programs, and provides referrals to the Contra Costa County Agency on Aging and Adult Services.
Senior health care counseling is provided through a volunteer health insurance and advocacy program at Orinda Senior Village. The County Connection Link program provides paratransit service. This service is supplemented by the Seniors Around Town program, providing free door-to-door rides to seniors who are unable to drive and may not qualify for the County Connection Link program. The Council on Aging, Lamorinda Spirit Van, the Library and Community Center, and the recently established Lamorinda Village also offer programs for seniors.
These programs are an important resource for Orinda’s growing senior population, but they are primarily oriented around transportation, health care, and recreational needs rather than housing. The aging of the population is expected to fuel additional demand for senior housing in the future, along with programs to assist Orinda residents who wish to age in place. The City worked with Eden Housing to successfully secure
financing for the development of 67 affordable senior residences (plus a moderate-income manager unit) on the City-owned former library site (Monteverde Senior Apartments). Construction was completed in December 2014.
The U.S. Census collects data for several categories of disability. The ACS defines six aspects of disability: hearing, vision, cognitive, ambulatory, self-care, and independent living.
● Hearing difficulty: deafness or serious difficulty hearing
● Vision difficulty: blindness or serious difficulty seeing even when wearing glasses
● Cognitive difficulty: serious difficulty concentrating, remembering, or making decisions due to a physical, mental, or emotional condition
● Ambulatory difficulty: serious difficulty walking or climbing stairs
● Self-care difficulty: difficulty dressing or bathing (Activities of Daily Living [ADL])
Disabled residents have distinct housing needs depending on the nature and severity of the disability. Physically disabled persons generally require modifications to housing, such as wheelchair ramps, elevators or lifts, wide doorways, accessible cabinetry, modified fixtures and appliances, etc. If the disability prevents the person from operating a vehicle, then proximity to services and access to public transportation are also important. People with severe or mental disabilities may also require supportive housing, nursing facilities, or care facilities. If the physical disability prevents individuals from working or limits their income, then cost of housing and related modifications can increase.
According to the 2015–2019 ACS, 1,627 persons in Orinda had a disability, making up 9.1 percent of the total population as compared to Contra Costa County, where 12.6 percent of persons had a disability (see Table 4-23). Living arrangements of disabled persons depend on the severity of disability. Many disabled persons live in their own home, in an independent situation, or with other family members.
As shown in Table 4-24, of these residents, 3.6 percent (about 59 persons) had a hearing difficulty, 3.1 percent (about 51 persons) had an ambulatory difficulty, 3.0 percent (about 50 persons) had difficulty living independently, 2.5 percent (40 persons) had a cognitive difficulty, 2.1 percent (33 persons) had a self-care difficulty, and 1.3 percent (21 persons) had a vision difficulty. Note that one person can have more than one disability.
Source: U.S. Census Bureau, American Community Survey 5-Year Data (2015-2019) (ABAG Housing Element Data Package, 2021)
Source: U.S. Census Bureau, American Community Survey 5-Year Data (2015-2019) (ABAG Housing Element Data Package, 2021)
According to Section 4512 of the Welfare and Institutions Code, “developmental disability” means a disability that originates before an individual attains 18 years of age, continues, or can be expected to continue, indefinitely, and constitutes a substantial disability for that individual. It includes intellectual disabilities, cerebral palsy, epilepsy, and autism. This term also includes disabling conditions found to be closely related to intellectual disability or to require treatment similar to that required for individuals with intellectual disabilities but does not include other conditions that are solely physical in nature. Many developmentally disabled persons can live and work independently within a conventional housing environment. More severely disabled individuals require a group living environment where supervision is provided. The most severely affected individuals may require an institutional environment where medical attention and physical therapy are provided. Because developmental disabilities exist before adulthood, the first issue in supportive housing for the developmentally disabled is the transition from the person’s living situation as a child to an appropriate level of independence as an adult.
According to the most recent data by the California Department of Developmental Services from 2020, there were a total of 68 persons with developmental disabilities in the City of Orinda. Of those, 38 were under the age of 18 (see Table 4-25). Based on 2020 consumer count data by the California Department of Developmental Services, there were 65 persons with developmental disabilities living at home with a parent, family, or guardian.
Source: California Department of Developmental Services, Consumer Count by California ZIP Code and Age Group (2020)
The California Department of Developmental Services provides community-based services to approximately 360,000 persons with developmental disabilities and their families through a statewide system of regional centers, developmental centers, and community-based facilities. The Regional Center of the East Bay (RCEB) is one of 21 regional centers in California that provides point-of-entry services for people with developmental disabilities. The center is a private, nonprofit community agency that contracts with local businesses to offer a wide range of services to individuals with developmental disabilities and their families.
RCEB provides services to developmentally disabled persons throughout Alameda and Contra Costa Counties and acts as a coordinating agency for multiple service providers in the region. They provide a resource to those needing counseling, day care, equipment and supplies, behavior intervention, independent living services, mobility training, nursing, residential care facilities, supportive living services, transportation, vocational training, and other services.
A number of housing types are appropriate for people living with a developmental disability: rentsubsidized homes, licensed and unlicensed single-family homes, Section 8 vouchers, special programs for home purchase, HUD housing, and SB 962 homes (SB 962 homes are adult residential homes for persons with specialized health care needs). Supportive housing and group living opportunities for persons with developmental disabilities can be an important resource for those individuals who can transition from the home of a parent or guardian to independent living.
The design of housing-accessibility modifications, the proximity to services and transit, and the availability of group living opportunities represent some of the types of considerations that are important in serving this need group. Incorporating barrier-free design in all new multifamily housing (as required by California and federal fair housing laws) is especially important to provide the widest range of choices for disabled residents. Special consideration should also be given to the affordability of housing, as people with disabilities may be living on a fixed income.
Housing resources for persons with developmental disabilities and other disabilities in Orinda are limited. Orinda Senior Village includes 14 one-bedroom and one two-bedroom units that are barrier-free apartments designed for persons with mobility impairments needing the accessibility features of the unit. The special design features include lower shelves, cabinets, sinks, stoves, and light switches, as well as roll-in showers and grab bars in the bathrooms and wheelchair-accessible doorways. In addition, the 47bed Orinda Rehabilitation and Convalescent Hospital provides long-term care for disabled elderly residents. Most single-family homes are not designed for persons with mobility or sensory limitations. The City works with residents wishing to retrofit their homes to install grab bars, wheelchair ramps, handicapped bathrooms, and other modifications that meet the needs of persons with mobility limitations. It will also continue to support the development of small group homes that meet the needs of developmentally disabled residents.
According to the 2015-2019 ACS, there were 7,167 households in Orinda. Of the total households,, 7.6 percent (546 households) were made up of five or more persons (see Figure 4-5 and Table 4-26) and approximately 92.7 percent of the large households were homeowners. Nearly all of those households were homeowners. There are approximately 6,713 dwelling units with three or more bedrooms in the City of Orinda, an amount that exceeds the current estimated needs for large families. Based on data gathered and shown in Table 4-27, none of the city’s households (large or otherwise) were estimated to
be living in overcrowded conditions (i.e., more than one person per room). It appears that large families living in the city are adequately housed, but the high cost of housing in Orinda may exclude large households from securing housing in the City.
A majority of the city’s rental housing stock consists of individual single-family homes for rent, rather than apartment buildings. In fact, less than 5 percent of the city’s housing stock consists of multifamily units, and almost half of these units are in Orinda Senior Village. Orinda’s large families, including both renter and owner households, generally reside in single-family homes.
Source: U.S. Census Bureau, American Community Survey 5-Year Data (2015-2019) (ABAG Housing Element Data Package, 2021)
Source: U.S. Census Bureau, American Community Survey 5-Year Data (2015-2019) (ABAG Housing Element Data Package, 2021)
Source: American Community Survey, 2015-2019
Single-parent households, particularly those headed by women, are likely to have greater demand for childcare and other social services than two-parent households. Because single-parent households often have limited incomes, these households may have trouble finding adequate, affordable housing.
According to the 2015-2019 ACS, Orinda had a total of 340 female-headed households (4.7 percent), and 101 male-headed households (1.4 percent). Single-headed households represent approximately 6.2 percent of all households in Orinda (see Figure 4-6). In Contra Costa County, 17 percent of households were single headed (male or female). For the Bay Area, 15.2 percent of households were single-headed households. Table 4-28 shows household types for Orinda, Contra Costa County, and the Bay Area.
Source: U.S. Census Bureau, American Community Survey 5-Year Data (2015-2019) (ABAG Housing Element Data Package, 2021)
Female-Headed Family Households
Married-couple Family Households
Single-person Households
Male-headed Family Households
Other Non-Family Households
Source: U.S. Census Bureau, American Community Survey 5-Year Data (2015-2019) (ABAG Housing Element Data Package, 2021)
According to the U.S. Department of Agriculture, Census of Farmworkers for 2017, there were 450 permanent hired farmworkers and 860 seasonal farmworkers in Contra Costa County. As of 2019, the California Department of Education indicated there were no farmworkers or migrant worker students in the City of Orinda. It is safe to assume that the majority of Orinda residents likely work for corporate employers. Recognizing that Orinda is in an urbanized area in which farming operations do not exist, the City complies with all state law but does not have a need to provide housing specifically targeted to farmworkers.
An extremely low-income household is defined as a household earning 30 percent of less than the area median. According to HCD, the median income for a four-person household in Contra Costa County was $125,600 in 2021. Based on the above definition, an extremely low-income household of four earns less than $41,100 a year. Employees earning the minimum wage in California ($14 per hour) and working 40 hours a week would be considered extremely low income, as their total annual earnings would be $29,120.
Orinda is a relatively affluent community and the number of extremely low-income households in the city is small. According to CHAS 2013-2017 data (ABAG Housing Element Data Package, 2021), there were 244 owner-occupied households that fell into the extremely low-income category, and 165 renter-occupied
households that fell into the extremely low-income category for a total of 409 households or 5.9 percent of all households in Orinda.
Households with extremely low incomes have a variety of housing situations and needs. This population includes persons who are homeless, persons with disabilities, college students, seniors living on fixed incomes, and the long-term unemployed. As noted previously, this population also includes minimum wage workers. For some extremely low-income residents, housing may not be an issue—for example, domestic workers and students may live in in-law units at low (or no) rents. Other extremely low-income residents spend a substantial amount of their monthly incomes on housing or may alternate between homelessness and temporary living arrangements with friends and relatives.
As a small community, the City has limited resources to meet the housing needs of extremely low-income households. There are no emergency shelters in Orinda. The City works with the Contra Costa Housing Authority and with the local faith community to assist those in need and to help residents locate suitable housing in the area.
Homeless individuals and families have perhaps the most immediate housing need of any group. They also have one of the most difficult sets of housing needs to meet, due to both the diversity and the complexity of factors that lead to homelessness and to community opposition to the siting of facilities that serve homeless clients. California law requires that Housing Elements estimate the need for emergency shelter for homeless people.
The number of homeless residents is extremely small. The 2020 Contra Costa County Homeless Annual Point in Time Count Report found 1,374 unsheltered individuals in the county as a whole, 1 of whom was unsheltered in Orinda. The count was conducted in the winter, when seasonal demand is likely at its highest.
There are presently no emergency shelters or transitional housing facilities in Orinda, however several churches participate in the Winter Nights Family Emergency Shelter Program coordinated through the Contra Costa Interfaith Coalition, which provides meals and emergency shelter to families and seniors from mid-October to the end of April.
Homelessness is often the end result of multiple factors that converge in a person’s life. The combination of loss of employment, inability to find a job because of the need for retraining, and the high housing costs in Contra Costa County lead to some individuals and families losing their housing. For others, the loss of housing is due to chronic health problems, physical disabilities, mental health disabilities, or drug and alcohol addictions along with an inability to access the services and long-term support needed to address these conditions. According to the Contra Costa Homeless Continuum of Care Homelessness Awareness Month Toolkit 2020, the three primary causes of homelessness are the lack of affordable housing, lack of access to support services, and low incomes.
Veterans may have a variety of housing needs. Like other households, they may have trouble locating a safe, appropriately sized home at an affordable price. Some may face more severe limitations due to disabilities. According to the 2015-2019 ACS, there were an estimated 190 veterans residing in Orinda. Of those, none are age 18 to 34, 32.6 percent are 35 to 54, and 67.4 percent are 55 to 64.
Orinda’s housing allocation is determined by ABAG, consistent with the requirements of state housing law. While the process of determining each locality’s share of regional housing needs has evolved over the years, the most recent estimates are contained in the Regional Housing Needs Allocation (RHNA) for the 2022 to 2031 period (note that the RHNA period varies slightly from the Housing Element planning period, which is 2023 to 2031).
ABAG periodically prepares housing needs estimates for all cities in the Bay Area. According to estimates prepared by ABAG (RHNA, 2022–2031), Orinda’s “fair share” of the regional housing need during the current planning period is 1,359 housing units (see Table 4-29). This translates into an average of 170 housing starts per year between June 30, 2022, and January 15, 2031. By comparison, 291 residential units were constructed or permitted in the city from 2015 to 2020, or approximately 36 units per year.
Per state law, the RHNA has two primary purposes: identification of housing needs and allocation of the housing needs to every community. The identification of need refers to the number of housing units necessary to house every household at an affordable price and to replace all dilapidated housing units. The RHNA refers to the number of additional households in each income category that should have housing opportunities available in a particular community. The model strives to obtain an equitable distribution of low- and moderate-income housing throughout the region by allocating units for lowerincome households to each jurisdiction and by allocating a greater percentage of lower-income housing units to jurisdictions with a relatively small number of lower-income households, as compared to the countywide distribution.
Six major criteria are used in determining the fair share for each community:
● Market demand for housing.
● Employment opportunities.
● Availability of suitable sites and public facilities.
● Commuting patterns.
● Type and tenure of housing needs.
● Housing needs of farmworkers.
In addition, an impaction avoidance factor is considered in an attempt to avoid further impaction of jurisdictions with relatively high proportions of lower-income households.
As indicated earlier, ABAG has forecast the need to house 1,359 additional households in Orinda by 2031. Using the methodology outlined previously, ABAG has broken this projection down by income category. The distribution of this projected need by income category is shown in Table 4-29.
The 1,359 units assigned to Orinda include 372 very low-income units and 215 low-income units, 215 moderate-income units, and 557 above moderate-income units. The extremely low-income units are included in the very low-income category serving extremely low-income households and households with 30 to 50 percent of median income.
Source: Association of Bay Area Governments, Regional Housing Needs Allocation for 2023-2031
To the extent energy costs continue to rise, or for other reasons, some homeowners are becoming increasingly interested in energy conservation and efficiency measures to reduce these costs. While the opportunity to use alternative energy sources may be most advantageous in brand new homes, there may also be opportunities to retrofit existing homes with energy-conserving technology, including the use of renewable energy sources. Some of the most readily available and financially feasible measures are described below. These measures are further described in Tables 4-30 and 4-31.
Insulation and Weatherproofing. Most homes in Orinda are over 30 years old. Many of these homes have single-pane windows and uninsulated walls, attics, and roofs. These homes can be insulated, and windows and doors can be replaced or recalked to improve heating and cooling efficiencies and reduce utility bills.
Natural Lighting. Daytime interior lighting costs can be significantly reduced with the use of skylights. Skylights can be installed at a reasonable cost in most existing homes.
Solar Energy. Solar energy may provide a cost-effective way to heat and cool a home and may produce environmental benefits as well. Solar heating and cooling systems are of three general types: passive, active, or a combination thereof. In passive solar systems, the building structure is designed to collect and store the sun’s energy, and then re-radiate the stored heat. Passive buildings typically have a southerly orientation to maximize solar exposure and are constructed with dense materials that have the ability to absorb heat. Active systems convert the sun’s energy into electricity through photovoltaic panels that are either roof or ground mounted. Active systems can also heat water directly. The front-end cost of installing solar panels is typically amortized in 3 to 10 years through lower utility bills.
Energy-Efficient Equipment
Energy-efficient gas ranges with pilotless ignitions
Energy-efficient gas built-in surface units with pilotless ignitions
Energy-efficient gas built-in ovens with pilotless ignitions
Energy-efficient gas water heaters
Energy-efficient gas forced air furnaces with pilotless ignitions
Energy-efficient gas wall furnaces with automatic thermostats
Energy-efficient gas clothes dryers with pilotless ignitions
Gas outlets for energy-efficient gas clothes dryers
Energy-Efficient Support Measures
Gas heating thermostats with setback capability
Clogged filter indicators for gas heating systems
Fireplace dampers with exposed handles
Heat exchangers in fireplace or freestanding solid fuel units
Humidifiers added to gas heating system
Flue dampers as integral part of forced air heating system
Energy-Efficient Equipment
Double-glazed windows and doors
Glass area less than 12% of heated space
Foam-filled (or equivalent) insulated exterior doors
Insulation in attic increased to R-22 or R-30
Insulation in walls increased to R-19
Slab perimeter insulation R-7 or greater
Hot water pipe insulation in unheated areas
R-19 insulation installed under wood floors
Energy-Efficient Solar and Gas Installations
Energy-efficient solar/gas water heating
Energy-efficient solar gas space heating
Energy-efficient solar/gas pool heating
Energy-Efficient Electrical Equipment
Air economizers in conjunction with cooling system
Dishwashers with power-saving drying cycles
Air conditioning or room units with energy efficiency rating of 9 or more
Fluorescent lighting fixtures in kitchen, baths, and recreation rooms
Source: Pacific Gas & Electric, 2022
1. Keep room temperature at 65 degrees or lower. Turn heating control down at night or when away from home. Install a thermostat with a night setback feature, which does this automatically.
2. Draw draperies at night to limit heat loss; open them on sunny days to let the heat in.
3. Close damper when fireplace is not in use.
4. Check the furnace filter monthly and replace it when dirty. To check filter, hold it to the light; if light does not pass through readily, replace filter. Cleaning is not recommended (unless equipped with a permanent filter).
5. Turn off furnace pilot at end of heating season.
6. Weather-strip windows and doors.
7. Caulk cracks around windows and doors.
1. Take shorter showers
2. Repair leaky faucets.
3. Install water-saving showerheads, which restrict water flow.
4. Operate dishwashers only for full loads.
5. Set water heater thermostat below "normal." Turn to "pilot" position when away for extended periods of time (one week or longer).
6. Use cold water for operating food waste disposer and for pre-rinsing dishes.
7. When hand washing dishes, avoid rinsing under continuous hot running water.
1. Wash and dry full loads of clothes or adjust water level for the size of the load.
2. Wash clothes in warm or cold water.
3. Do not over-dry clothes; follow manufacturer’s instructions for drying time.
1. Reduce burner flame to simmer after cooking starts.
2. Cook by time and temperature; avoid opening oven door while food is cooking.
3. Use one-place cooking when possible; prepare meals using only the oven, broiler, or top burner.
4. Check to make sure all burners are off when not in use.
Source: Pacific Gas & Electric, 2022
Energy Audits. Pacific Gas and Electric Company (PG&E) provides energy audits to local residents on request. The City’s role in this process is to supply the public with information regarding this resource, including the appropriate contacts. Energy audits are helpful in pinpointing sources of energy loss and providing recommendations to remedy energy inefficiencies. Sources of energy loss could include old furnaces and condensing units, poor ductwork, and lack of insulation. The audit presents an opportunity for PG&E to identify and qualify homeowners for energy-efficiency programs, such as installation of energy-efficient refrigerators and window re-caulking. PG&E offers rebate programs for residents and businesses to implement some of these measures:
● New Construction. The City of Orinda will continue to require the incorporation of energyconserving appliances, fixtures, and other devices into the design of new residential units, consistent with Title 24 and the California Building Code. The City will also continue to review new subdivisions to ensure that each lot optimizes solar access and orientation to the extent possible.
● Water Conservation. Simple water conservation techniques can save thousands of gallons of water per household, thus reducing costs. Many plumbing products eliminate unnecessary water waste by restricting the volume of water flow from faucets, showerheads, and toilets. The use of drought-resistant and native plant materials can also measurably contribute to water conservation. A household can also save water by simply fixing dripping faucets and using water more conservatively. The East Bay Municipal Utility District provides residents with tools to conserve water, such as DIY Guides for Leaks and an online portal for customers to track and manage their water use.
Assembly Bill (AB) 686, Government Code Section 65583(c)(10)(A), requires that all housing elements due on or after January 1, 2021, contain an Assessment of Fair Housing (AFH) consistent with the core elements of the analysis required by the federal Affirmatively Furthering Fair Housing (AFFH) Final Rule of July 16, 2015.
Under California law, Government Code section 65583(c)(5), AFFH means “taking meaningful actions, in addition to combating discrimination, that overcome patterns of segregation and foster inclusive communities free from barriers that restrict access to opportunity based on protected characteristics.”
AB 686 requires the City of Orinda and all jurisdictions in the state to complete three major requirements as part of the housing element update:
1. Conduct an AFH that includes a summary of fair housing issues; an analysis of available federal, state, and local data knowledge to identify patterns of segregation or other barriers to fair housing; and prioritization of contributing factors to fair housing issues.
2. Prepare the Housing Element Land Inventory and identification of sites through the lens of AFFH.
3. Include a program in the Housing Element that affirmatively furthers fair housing and promotes housing opportunities throughout the community for protected classes and addresses contributing factors identified in the AFH (applies to housing elements beginning January 1, 2019).
In order to comply with AB 686, the City of Orinda (City) has completed the following outreach and analysis.
State law requires cities and counties to make a diligent effort to achieve participation by all segments of the community in preparing a Housing Element. As discussed in the Public Participation section of this Housing Element, the City has used a variety of outreach methods in addition to the standard public hearing process to reach stakeholders and members of all socioeconomic segments of the City in order to develop housing policies and actions and finalize the site inventory to address the needs of the City’s residents and workforce. All these efforts have informed and contributed to the development of the 2021–2029 Housing Element update. As a part of identifying current and future housing needs for residents, City staff conducted several public outreach efforts, including:
● Public Workshops, Planning Commission and City Council meetings
● Consultations with stakeholders and nonprofits
● An online, interactive RHNA site selection tool
Meetings and Workshops
The City held five public meetings. These meetings were held virtually and publicized on the City’s website.
• City Council Sites Review Meeting, February 15, 2021
• Focus Group, November 20, 2021
• Community workshop, October 18, 2021
• Planning Commission Study Session, November 9, 2021
• City Council Study Session, November 16, 2021
Online Sites Tool
To encourage interactive participation from the public, the City developed an online RHNA tool, based upon the Balancing Act financial outreach platform, to give residents an opportunity to provide feedback on the sites targeted for housing development. This tool allows residents to create their own housing plan for the City by selecting or deselecting sites, choosing whether to rezone a site or not, and visualize what is necessary to meet the City’s RHNA. This method gathers public input on which sites the public would like to see included in the 6th Cycle sites inventory and where they approve of potential re-zonings. This occurs through a process similar the Planning Commission and City Council’s processes for site review, in that it allows and requires participants to see the whole of the list rather than focusing only on the sites close to them. Findings resulting from resident input on the Balancing Act online tool were reviewed at the City Council Sites Review Meeting.
Consultations and meetings were conducted with seven local stakeholder organizations and agencies. Stakeholders also provided input directly related to aspects of the Housing Element and discussed current
and future housing needs. In addition to these consultations, staff met with stakeholder specifically for feedback on the Housing Element update. The input from each of these organizations is discussed here.
The Housing Consortium of the East Bay (HCEB) discussed the barriers for housing for developmentally challenged individuals in Orinda, primarily including low incomes (many under 30-percent area median income [AMI]) and discrimination both regarding rental and ownership. HCEB expressed a need for dense, larger, affordable units close to the BART station and other amenities. HCEB emphasized that folks with developmental disabilities tend to be excellent tenants who take pride in their homes, but can face discrimination that creates a barrier for this population to access already-limited housing opportunities.
The Orinda Senior Village (OSV) consists of 148 one-bedroom units of project-based Section 8 housing for residents 62+ years of age. 16 accessible units are available for people under 62 with physical disabilities. Representatives of the Orinda Senior Village communicated that there is a growing senior population with a need for accessible design features in housing, and a shortage of affordable housing units. Older units tend to be more affordable but typically have fewer accessibility features, and representatives expressed the importance of newer accessible units to allow residents to age in place. OSV related that Orinda is a highly desirable location and demand outweighs supply for the populations they serve. OSV emphasized that affordable and accessible housing needs to be placed in amenity-rich locations. OSV is overseen by the nonprofit Orinda Senior Housing Foundation. Orinda Senior Housing Foundation recently (2021) filed an application to construct the Vista Verde 52-unit affordable senior housing project, next door to the OSV, at Orinda Community Church.
Continuum of Care, Contra Costa Health, Housing and Homeless Services (H3/CoC)
H3/CoC is a funder of direct service providers but does not itself provide services. They acquire and administer funding for agencies, provide front-line training, and assist with standardized assessments for clients. H3/CoC expressed a lack of sufficient investment in affordable housing development and preservation, cross-jurisdictional barriers, and issues of race and class bias. H3/CoC emphasized a growing senior population in needs of supportive housing, and a lack of awareness and commitment to preserve existing housing of this type, as well as development of new units. H3/CoC expressed a need for collaboration both with grassroots organizations and regional government at the county level.
Regional Center for the East Bay (RCEB) is one of 21 statewide regional centers of the Department of Developmental Services. RCEB provides services to 20,000 residents with intellectual disabilities. RCEB emphasized that populations they serve prefer one- or two-bedroom units because they often require supportive services and may have caretakers living with them. However, because of affordability and availability restrictions, many residents will end up in studios and/or in neighborhoods with scarce amenities. High costs of housing in Orinda serve as a barrier to RCEB’s client population who often live on fixed incomes and, if employed, generally earn low wages. Security deposits are a barrier to access for residents on fixed incomes, as well as insufficient accessibility features.
Eden Council of Hope & Opportunity (ECHO) provides fair housing services in Orinda and surrounding areas. ECHO expressed a high demand for affordable housing and insufficient stock. The majority of fair
housing cases are related to disability accommodation issues and racial discrimination. ECHO explained that communities often oppose affordable housing development on the basis of traffic, density, and other issues, but do not understand that affordable housing is a resource for everyone. ECHO expressed a need for more Section 8 vouchers due to high demand and to increase access to rental housing.
East Bay Housing Organization
East Bay Housing Organization (EBHO) connects community members, public officials, developers, service providers, planners, and advocates to ensure everyone has a safe, healthy, and affordable home. EBHO identified the primary fair housing goals in Orinda as increasing the relatively small amount of multifamily housing, improving public perception of affordable housing, and ensuring people who work in Orinda can afford to live there if they want to.
Eden Housing is a non-profit affordable housing developer, primarily working on new construction of multifamily housing. Eden also provides property management services. Eden explained that in order to develop in a wealthier community, they need more resources. The most beneficial aspect of Housing Element law for Eden is zoning sites for affordable housing, which reduces the potential for California Environmental Quality Act (CEQA) litigation and reduces overall costs and timelines. Eden finds that they have to spend a lot of time educating city staff and councilmembers on housing laws and would benefit from a mechanism to inform decision-makers earlier.
The California Government Code Section 65583(a)(10)(A)(ii) requires the City of Orinda to analyze racially or ethnically concentrated areas of poverty, disparities in access to opportunity, and disproportionate housing needs, including displacement risk. Since 2017, the California Tax Credit Allocation Committee (TCAC) and California Department of Housing and Community Development (HCD) have developed annual maps of access to resources such as high-paying job opportunities; proficient schools; safe and clean neighborhoods; and other healthy economic, social, and environmental indicators to provide evidencebased research for policy recommendations. This effort has been dubbed “opportunity mapping” and is available to all jurisdictions to assess access to opportunities within their community.
The TCAC/HCD Opportunity Maps can help to identify areas within the community that provide strong access to opportunity for residents or, conversely, provide low access to opportunity. The information from the opportunity mapping can help to highlight the need for housing element policies and actions that would help to remediate conditions in low-resource areas and areas of high segregation and poverty and to encourage better access to affordable housing in high-resource areas for lower-income households and communities of color.
TCAC/HCD categorized census tracts into high, moderate, or low resource areas based on a composite score of economic, educational, and environmental factors that can perpetuate poverty and segregation, such as school proficiency, median income, and median housing prices. The TCAC/HCD Opportunity Maps use a regional index score to determine categorization as high, moderate, or low resource. “High resource areas” as described throughout this assessment and its associated programs are those that have one or more of the following conditions: a concentration of employment opportunities, strong public transit or pedestrian infrastructure, access to high performing educational facilities, positive environmental conditions, generally good housing conditions, or low rates of overpayment and overcrowding compared
to other areas of the city. Orinda falls within the Bay Area TCAC region, which includes all the Bay Area counties. Within the Bay Area, 40 percent of census tracts are either highest or high resource and the remaining 60 percent of census tracts are evenly divided into moderate and low resource.
In the Bay Area region, cities with substantial areas “highest resource” include Orinda, Piedmont, Hillsborough, Mill Valley, and Lafayette; cities with substantial areas designated as “high resource” include Pleasanton, Clayton, and Berkeley; cities with substantial areas designated as “moderate resource” include Union City, Daly City, Brentwood, and Hercules. Cities with substantial areas designated as “low resource” include Richmond, Hayward, Vallejo, and Pittsburg. Areas identified as having “high segregation and poverty” are census tracts that have an overrepresentation of people of color compared to the County as a whole, and at least 30 percent of the population in these areas is below the federal poverty line ($41,100 annually for a family of four in 2021). There are no areas identified as having high segregation and poverty within Orinda city limits– the closest tracts identified in the region are found in Clearlake, Vallejo, San Rafael, San Francisco, Oakland, and Martinez. According to the HCD/TCAC Opportunity Map (Figure 4-7) the entirety of the City of Orinda is designated as a highest resource area, excluding one small, vacant area of the city across Bear Creek Road from the Pacific Gas and Electric Company (PG&E) Sobrante Station. This moderate resource area is within City limits but falls into a primarily external census tract. The tract, the majority of which lies outside of Orinda, has recreational, agricultural, and infrastructure uses encompassing Charles Lee Tilden Regional Park, Kennedy Grove Recreational Area, and the San Pablo and Briones Reservoirs, as well as other low-density areas to the northeast. This parcel is not representative of the rest of the city, and due to the parcel’s vacancy, this analysis will assume the designation not to be a reflection of other populated parts of the city.
Orinda is part of a regional cluster of highest opportunity areas in and around southwest Contra Costa County which covers part or all of the cities of Moraga, Lafayette, Danville, and San Ramon. This highest resource cluster is circled by moderate and low resource census tracts also within Contra Costa County. Other nearby cities in the region with highest resource census tracts include San Francisco, Berkeley, Oakland, Piedmont, and Walnut Creek. Nearby cities with significant proportions of moderate resource tracts include Clayton, El Cerrito, Hercules, Pinole, Brentwood, Martinez, and Berkeley, while nearby cities with significant proportions of low resource tracts include parts of Oakland, San Leandro, Richmond, San Pablo, Pinole, Hayward, Concord, Pittsburg, Antioch, and Oakley. In general, the southern and southeastern areas of Contra Costa County have higher access to resources, while the northern and northeastern areas of the County have moderate and low access to resources. There are no areas identified as having “high segregation and poverty” within Orinda. In Contra Costa County, one tract in Martinez is identified; in adjacent counties, several tracts in Vallejo, San Rafael, San Jose, Stockton, Oakland and San Francisco are designated. High segregation and poverty designations are found in urban core areas, while highest resource areas are found in suburban areas, as well as distinct sections of urban areas often adjacent to but segregated from low-resource areas, as in San Francisco, Oakland, San Jose, and Redwood City.
Orinda is primarily a suburban residential community with relatively high housing costs, while other cities in northern Contra Costa County with lower opportunity scores are less uniformly residential. The northern side of the county, especially along the Route 4 corridor and the coast of Suisun Bay, sees a higher diversity of land uses including more widespread commercial and industrial areas and denser housing as compared with Orinda and comparable parts of the county. Southern Contra Costa County, and especially the southwestern part of the county are less densely developed, with large mountainous
regional parks surrounding residential communities characterized by larger-lot, single-family homes, few industrial uses, and isolated commercial uses or compact commercial corridors. While Orinda offers many beneficial public amenities including parks, high-performing schools, convenient transit, and access to fresh food, Orinda’s high housing costs effectively exclude many low- and moderate-income households in the region from accessing these opportunities, limiting upward mobility for low-income households. As described in the following subsections, this pattern of concentrated wealth/high-income households is closely aligned with relatively low racial and ethnic diversity in Orinda, indicating that the cost and availability of housing in Orinda works to reinforce the spatial segregation of communities of color in Contra Costa County and the Bay Area region.
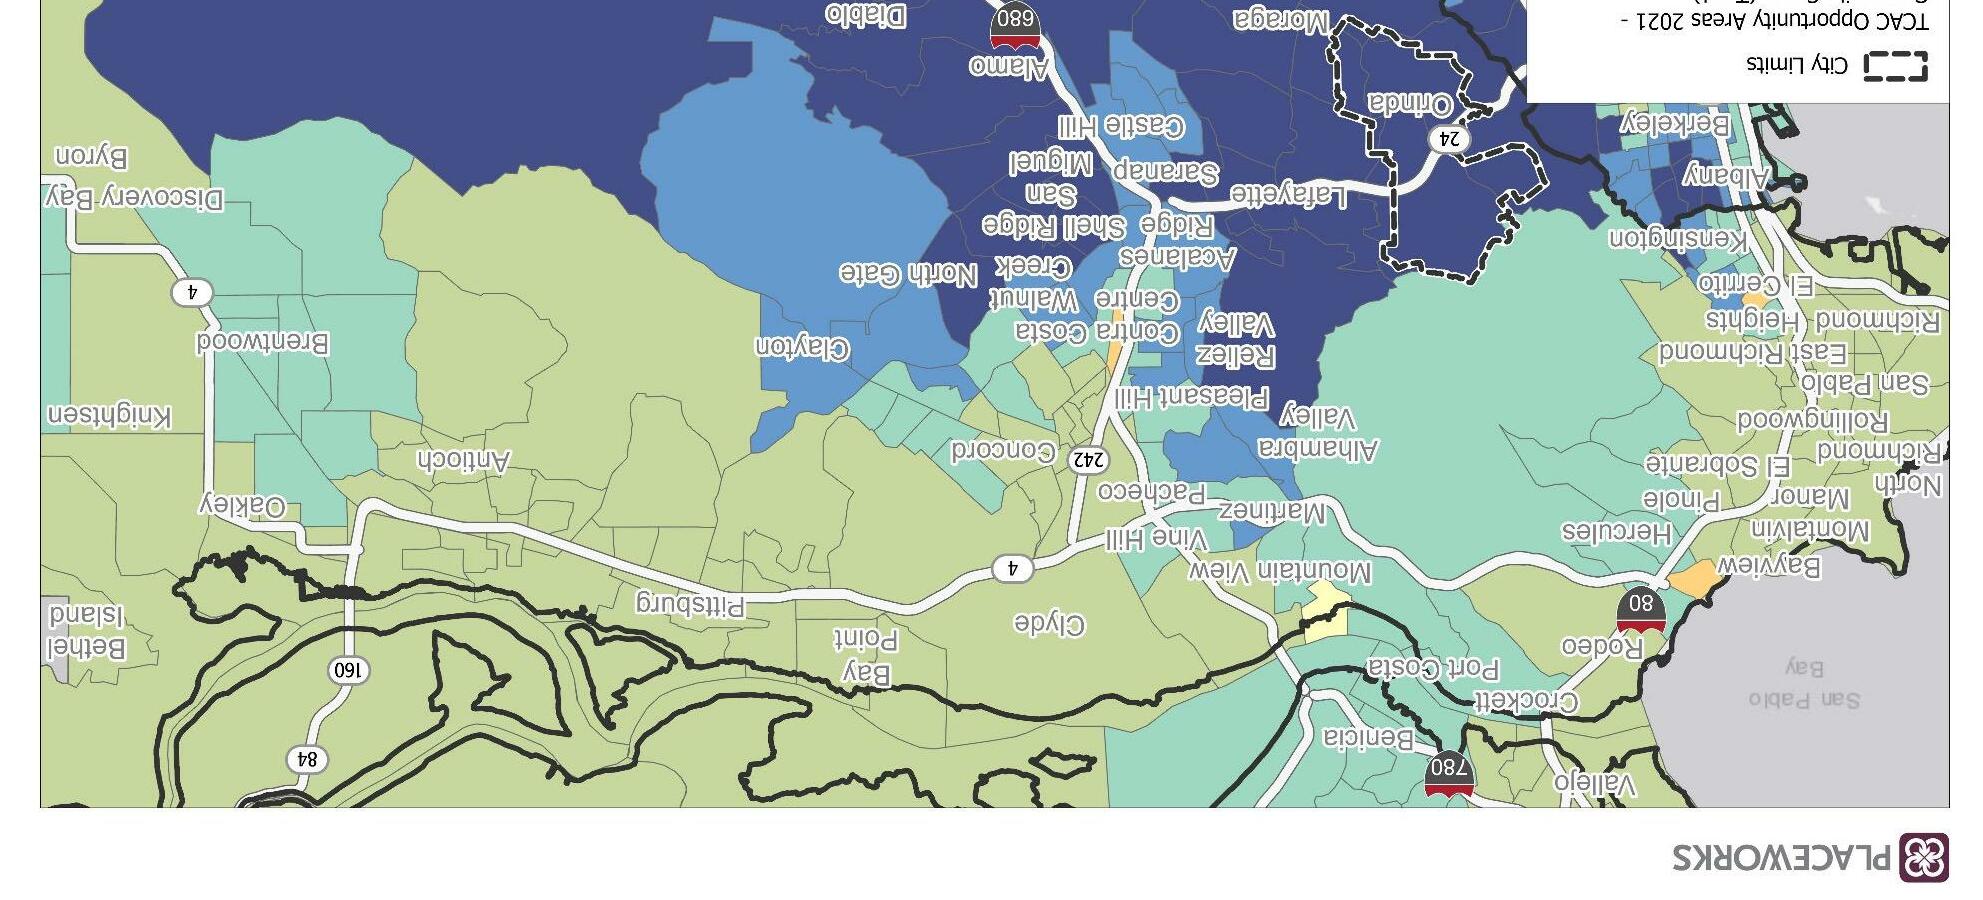
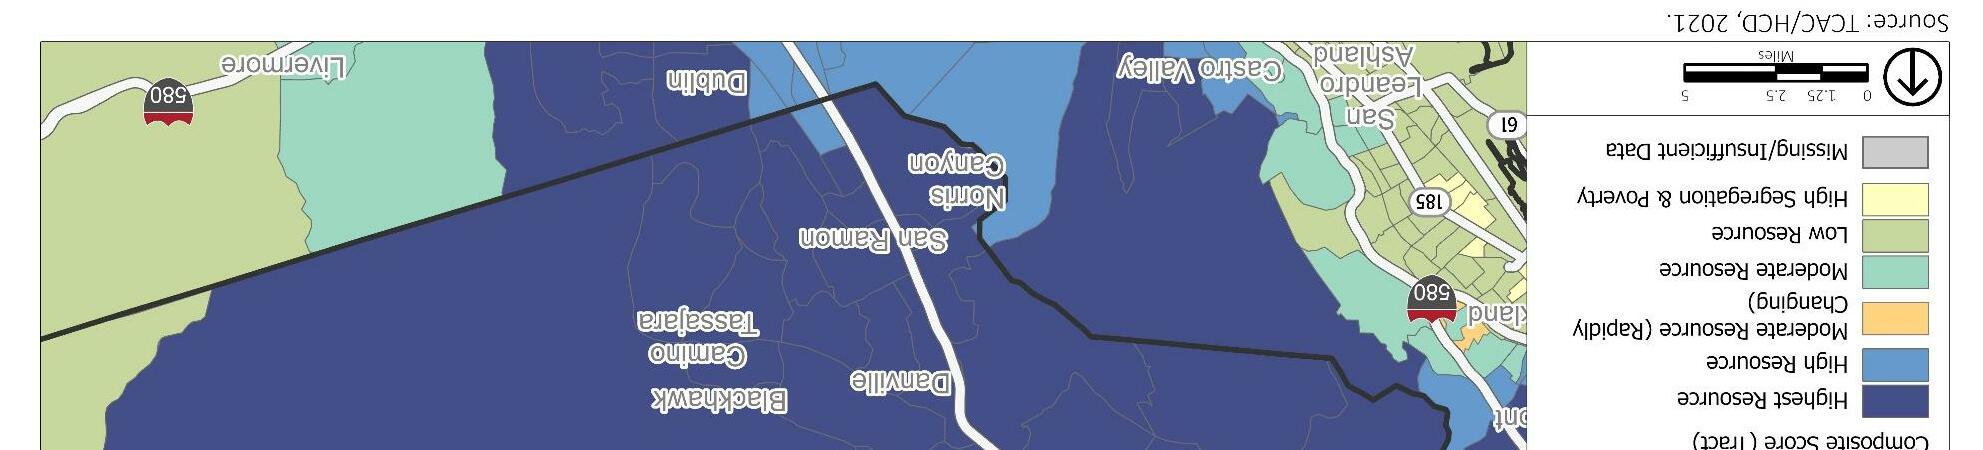
The area that is the City of Orinda was previously home to indigenous Americans, including the Ohlone and Miwok peoples. The arrival of Europeans in California directly and indirectly caused the displacement and death of vast numbers of indigenous peoples. Hispanic settlers were the first Europeans to establish permanent housing in the areas around Orinda, which were part of four Mexican land grants. Beginning in the 1880s, American settlers began developing the basic infrastructure of a permanent settlement, including a post office and railroad station. Orinda was still primarily a ranching and seasonal community but following the completion of the Caldecott Tunnel in 1937, which provided easier access to major existing Bay Area cities, the city became a popular year-round residence. Still only a few thousand residents, growth accelerated particularly in the 1970s, with the population growing 148 percent between the 1970 and 1980 censuses. When Orinda was incorporated as a city in 1985, it had nearly 17,000 residents.
Consistent with many other American cities, Orinda saw practices during the 20th century, which sought to limit and/or outright restrict the sale and rental of housing to non-White residents. Racially restrictive covenants that deny ownership or occupancy by anyone not “Caucasian” were attached to homes in Orinda.1 While the passage of the Fair Housing Act of 1968 made government-sponsored redlining and racially restrictive covenants illegal, Orinda’s racial/ethnic demographics over the latter half of the 20th century is reflective of the impact of exclusionary practices (Table 4-32). As shown in Table 4-32, Orinda’s White population made up at least 90 percent of the population until 2000 and continues to represent over two-thirds of the population. Orinda experienced the most growth between 1970 and 1980 following the opening of BART in 1973, which catalyzed residential growth in inland Contra Costa County. Significantly, Orinda’s White population grew by 140 percent during this decade, from 6,685 to 15,994. This coincides with a period of “white flight,” during which white homeowners in the Bay Area (and across the country) left areas of increasing diversity, resulting in the development (and incorporation) of primarily residential suburbs.2 Consequently, all other racial/ethnic populations represented a very small proportion of Orinda’s overall population for decades. Asian residents comprise the largest proportion of Orinda’s population following Whites but did not exceed 10 percent of the population until after 2010 (and as of 2019 do not exceed 20 percent of the population). Orinda’s Black population has only made up more than 1 percent of the population since 2019.
1 https://www.mercurynews.com/2019/02/26/for-whites-only-shocking-language-found-in-property-docs-throughout-bayarea/
2 Moore, Eli, Nicole Montojo, and Nicole Mauri. "Roots, Race, and Place: A History of Racially Exclusionary Housing in the San Francisco Bay Area." Haas Institute for a Fair and Inclusive Society, University of California, Berkeley. October 2019. haasinstitute.berkeley.edu/rootsraceplace
Source: U.S. Census Bureau 1960-2010 (ABAG Bay Area Census), American Community Survey 5-Year Data (2015-2019) (ABAG Housing Element Data Package, 2021)
1 Census data for Orinda in 1960 did not provide racial/ethnic specification beyond White, Black, and All Other races; therefore, this number may be inclusive of Asians and Hispanic persons.
2 Census data for Orinda in 1970 and 1980 provides number of persons of Hispanic ethnicity of any race but does not differentiate ethnicity in racial populations (i.e., identify Hispanic and Not Hispanic). Due to this, the population and associated percentage total above the total population for these years.
The pattern of white flight and the corresponding growth of residential suburban cities in the Bay Area between the 1950s and 1990s resulted in concentrated areas of wealth and poverty in addition to racial/ethnic concentration. The accumulation of wealth in inland Contra Costa County concentrated resources, resulting in high performing schools and investments in community resources, such as parks, trails, and tree-lined streets, that positively impact property values. As will be discussed further, Orinda residents benefit from access to highly proficient schools and favorable environmental conditions due to low exposure to pollutants and contaminants that cause long term health issues. While Orinda and surrounding suburban cities are somewhat distant from major employment centers in Oakland, Berkley, and San Francisco, the city maintains a low unemployment rate (3.0 percent) and very high median incomes. This, coupled with high median home sales price (exceeding $2 million, as shown in Table 4-18), indicate that Orinda residents enjoy access to housing choice and choose to prioritize proficient schools and small-town residential character over proximity to job centers.
The UC Berkeley/U Toronto Urban Displacement Project (UDP) aims to understand and describe the nature of gentrification, displacement, and exclusion, and also to generate knowledge on how policy interventions and investment can support more equitable development. One product of that research are gentrification, displacement, and exclusion typology maps that summarize housing market dynamics and
displacement and gentrification risk into categories at the census tract level. These maps indicate the entirety Orinda is a “Stable/Advanced Exclusive” area. This places Orinda among the roughly 30 percent of tracts in the region which are exclusive to low-income (and many moderate-income) households, including several tracts in Marin, San Mateo, eastern Oakland, and Berkeley. Limited access to highresource areas exacerbates adverse issues in low-opportunity areas; a 2019 UDP report titled “Rising Housing Costs and Re-Segregation in the San Francisco Bay Area” used a data-driven approach to find that “increases in housing prices in the San Francisco Bay Area between 2000 and 2015 were correlated with shifts in where low-income people of color lived in the region. It also provides evidence that these shifts contributed to new concentrations of poverty and racial segregation in the region and the perpetuation of racial disparities in access to high-resource neighborhoods.” Additionally, the report found that disparities in access to resources was greater between racial groups than it was between income groups of the same demographic. As an example, the study found that “low-income White households were seven times more likely to live in higher resource neighborhoods than moderate- and high-income Black households.”3
As discussed, Orinda’s development responded to urban-transplant families seeking “a less urban environment” and “higher quality schools” offered in inland Contra Costa County.4 As such, upwards of 90 percent of Orinda’s land area is designated for single-family zoning, creating a small town, familyoriented residential character. As of 2020, single-unit detached housing units comprise approximately 93 percent of the City’s 7,145 housing units and 90 percent of households live in owner-occupied housing. Conversely, multifamily units (five or more units) comprise approximately 5 percent of Orinda’s housing units. This includes two subsidized senior housing developments (Orinda Senior Village and Monteverde Senior Apartments), providing a total of 216 affordable units for qualifying seniors households.
The Othering & Belonging Institute, a UC Berkeley research center, published a report in 2020 analyzing the characteristics of communities in the Bay Area in relation to the degree of single-family zoning. The research finding identified that in Contra Costa County and across the Bay Area regionally, cities with high levels of single-family zoning enjoy greater access to resources (this comparison is significant even when considering that the Bay Area region is generally wealthy and expensive).5 Predominance of single-family zoning aligned with higher median incomes, home values, proficient schools and other factors that are similarly associated with the highest-resource designation in the TCAC/HCD opportunity map. Singlefamily zoning predominates residential areas in the Bay Area; only in two jurisdictions of the 101 surveyed did single-family zoning comprise less than 40 percent of the jurisdiction’s land area. However, access to higher quality resources was greatest in jurisdictions with at least 90 percent of the land area designated to single-family zoning.
3 https://www.urbandisplacement.org/wp-content/uploads/2021/08/bay_area_resegregation_rising_housing_costs_report_2019.pdf
4 City of Orinda. “History of Orinda” February 2022. https://www.cityoforinda.org/263/History-of-Orinda
5 Menendian, Stephen, Samir Gambhir, Karina French and Arthur Gailes. “Single-Family Zoning in the San Francisco Bay Area.” Othering & Belonging Institute, University of California, Berkeley. October 2020.
https://belonging.berkeley.edu/single-family-zoning-san-francisco-bay-area
In Orinda, the Othering & Belonging Institute identified that based on 2014-2018 ACS data, the predominance of single-family zoning correlates with a median income exceeding $200,000, median house value of nearly $1.5 million, and a highly educated and employed resident population. Lafayette produced a similar correlation, as did San Ramon and Clayton. Conversely, the cities of Pittsburg, Hercules and Richmond that feature lower rates of single-family zoning compared to the region (up to 80 percent) correlate with a median income of less than $100,000 and median house value around $400,000, with between 20 to 40 percent of residents earning a bachelor’s degree or higher. While single-family zoning can create highly desirable places to live, higher entry costs associated with this housing type can pose a barrier to access for low- and moderate-income households, restricting access to economic, educational, and other opportunities present in higher-resource communities.
Source: UC Berkeley, 2022 (ACS 2014-2018)
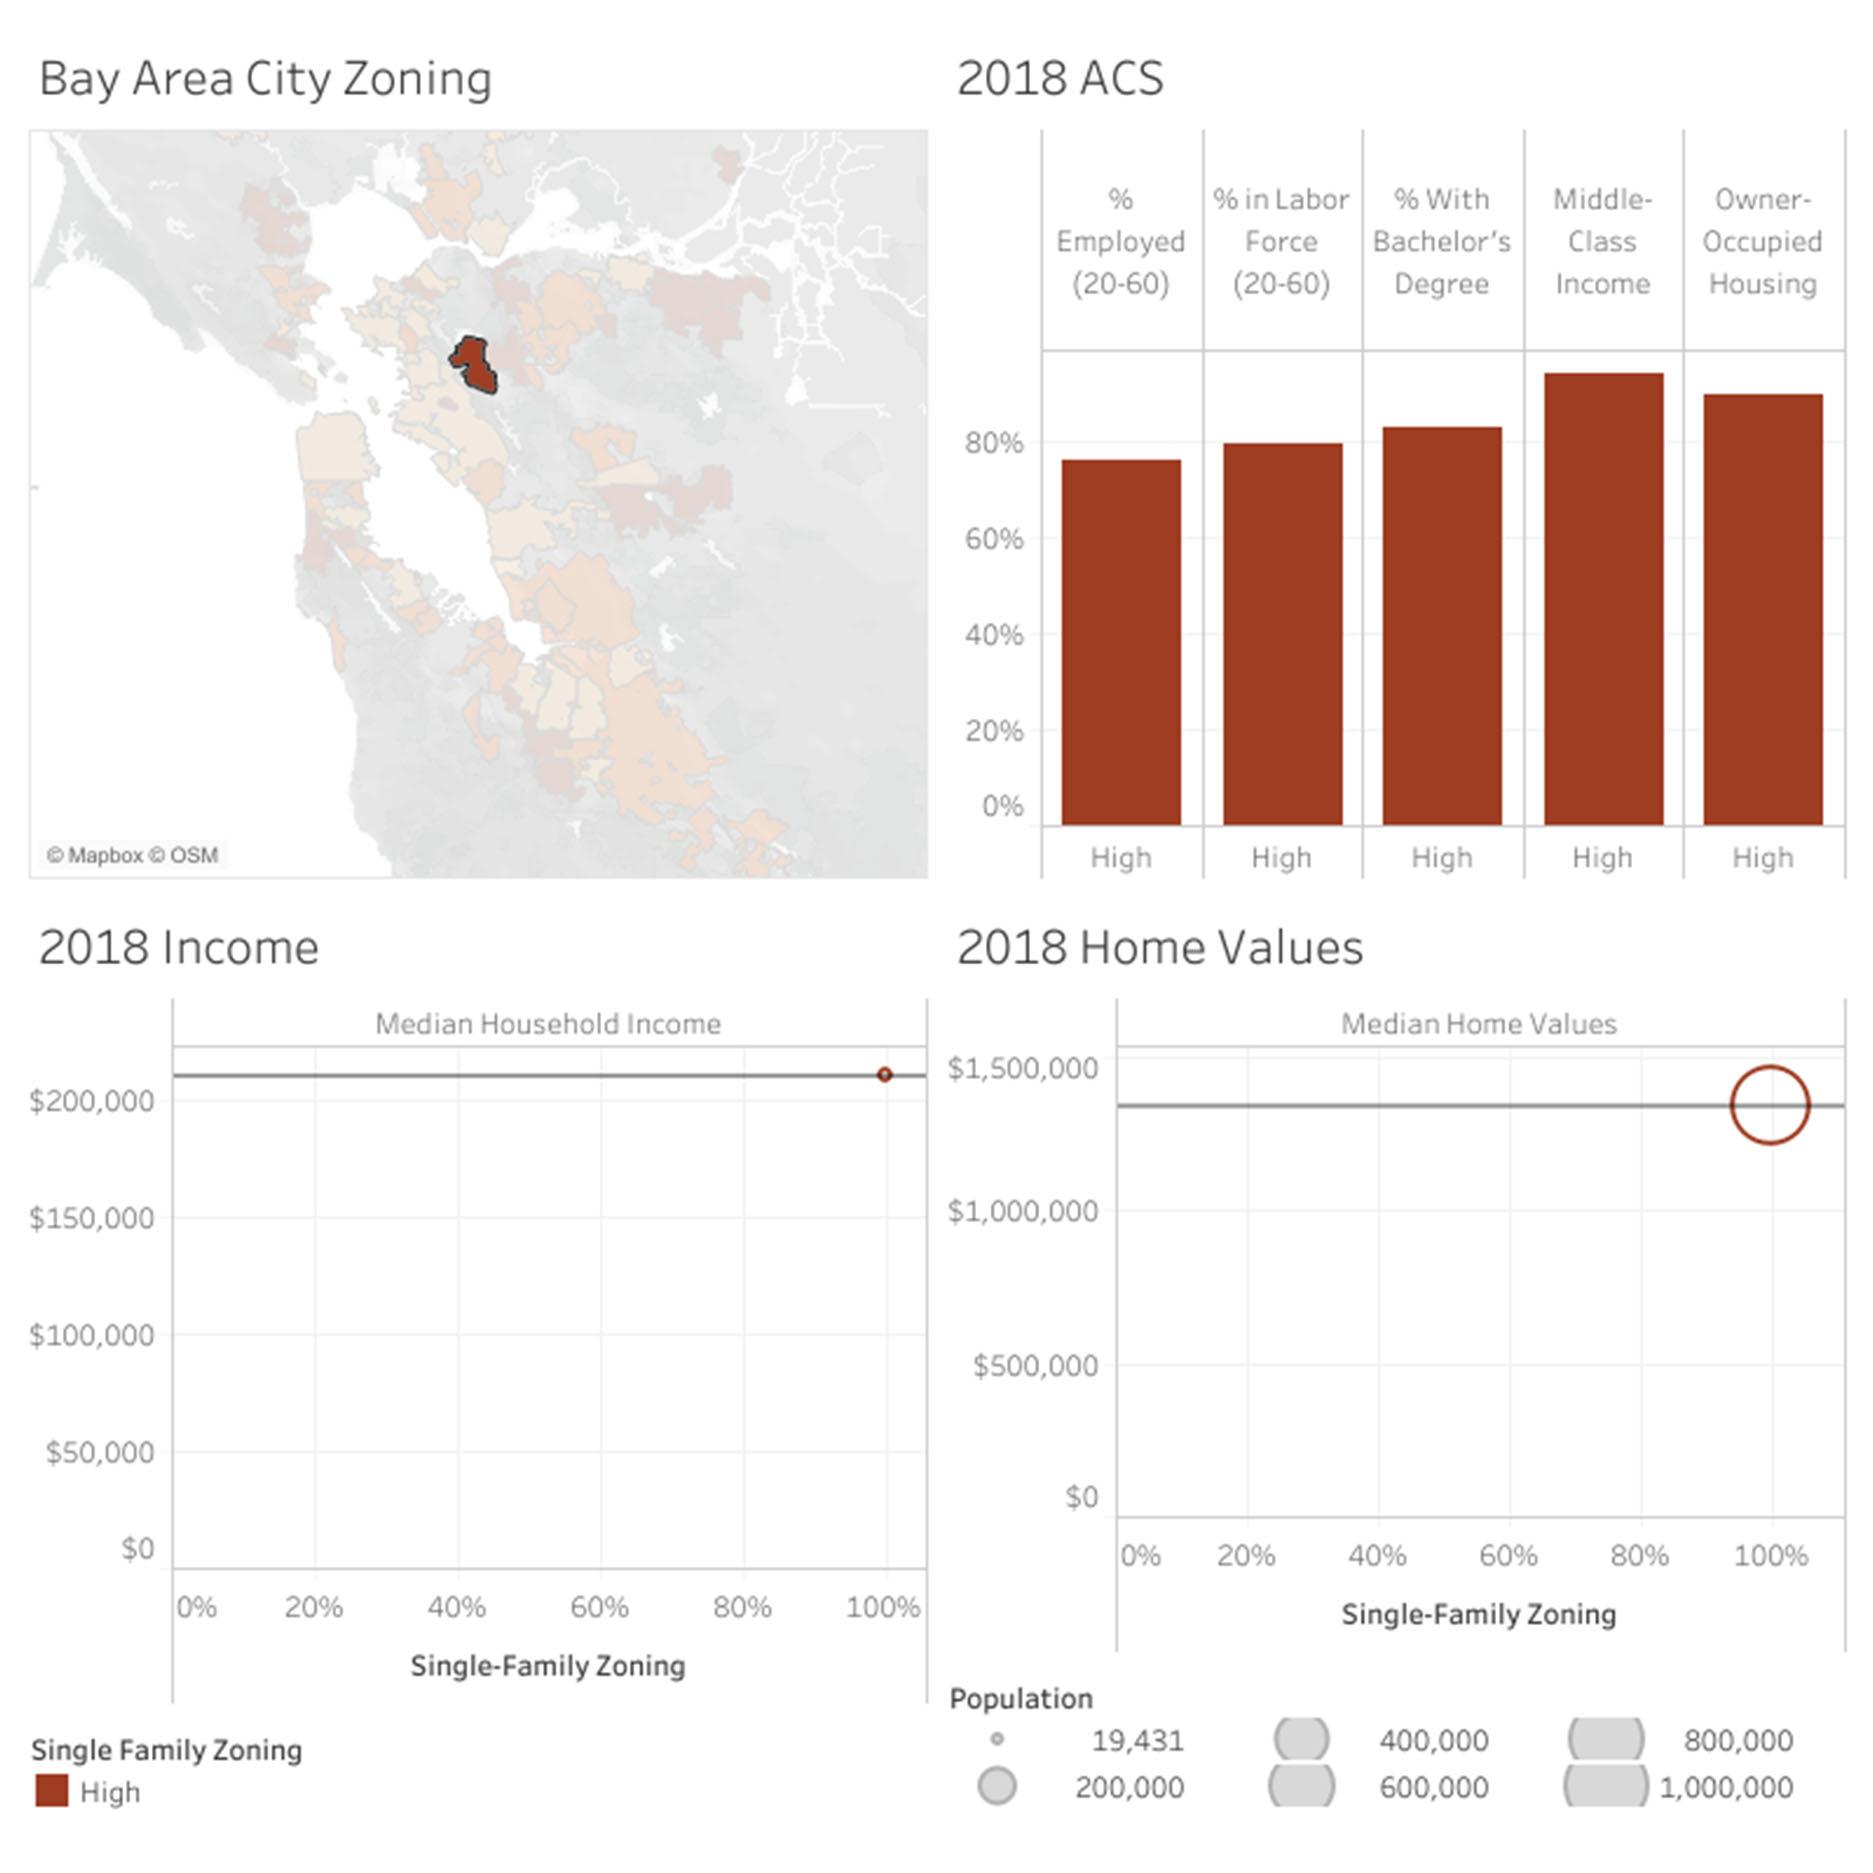
The 2019 ACS 5-year estimate reports Orinda’s citywide population as 72 percent White non-Hispanic, with individual block groups ranging between 60 and 85 percent. Orinda is bisected by Highway 24 which runs east/west and separates the city into north and south sides. The share of the population identifying as White non-Hispanic is slightly higher on the north side of the city. The north side is the location of the City’s two least-diverse block groups, which are 82 and 85 percent White non-Hispanic and intersect the Orinda Downs and Charles Hill neighborhoods. Block groups on the north side trend toward the higher end of the City’s range of 60 to 85 percent, with 79 percent White non-Hispanic in Sleepy Hollow, 77 percent in Claremont/El Toyonal, and 79 percent in the residential neighborhoods east of Orinda Country Club. The City’s relatively more diverse block groups are found south of Highway 24. The City's most diverse block group, with 60 percent White non-Hispanic residents, is found on the south side of the City between Rheem Blvd and Donald Drive. However, most of this block group extends into the neighboring City of Moraga, which is a slightly more diverse city, making it unclear whether the diversity measured in this individual block group is more representative of residents of Orinda or Moraga, or a combination of the two. Other block groups on the south side range between 69 to 75 percent White non-Hispanic, which is less diverse in the regional context but still place them among Orinda’s more-diverse block groups in relation to the City’s north side. (Figure 4-8)
Orinda is slowly becoming more diverse, though it is still a relatively less-diverse city in its regional context. Orinda’s citywide population is 72 percent White non-Hispanic, a decline from 79 percent in 2010 and 87 percent in 2000. The second largest demographic is Asian/API non-Hispanic residents, which make up 16.4 percent of its 2019 population, up from 11.5 percent in 2010 and 9.4 percent in 2000. Hispanic/Latinx residents make up 5.3 percent of the city’s population, up from 4.6 percent in 2010 and 3.3 percent in 2000. Black/African American residents comprise 1.17 percent of the city’s population. 6 This data indicates that Orinda is a city with a majority White non-Hispanic population which has slowly become more diverse over time, with a substantial and growing Asian/API population, a smaller growing Hispanic community, and relatively few residents identifying by other ethnic/racial categories.
As described above, diversity in Orinda is unevenly distributed. A diversity index score is a metric developed by ESRI which represents the likelihood that two people within a particular census block group, chosen at random, will belong to different racial or ethnic groups. Diversity index scores based on the 2010 US Census find no census tract fully or partially within Orinda scoring above 55 percent. The lowest scores were found north of Highway 24, with some additional low-scoring tracts on the south side. More diverse, higher-scoring tracts were found on the southwest side of the city in the areas west of Moraga Way, as well as in the Alice neighborhood, east of Hall drive between Moraga Way and Rheem Blvd. Consistent with 2019 ACS demographic data, 2018 diversity index scores reflect the increased diversity in the city, but also demonstrate that the northernmost sections of the city, which were the least diverse in 2010, have remained the least diverse in 2018. However, all census tracts south of Highway 24, as well as the residential area along Orinda Woods Drive immediately north of the 24 and south of Camino Sobrante, now score uniformly between 40 percent and 55 percent. The spatial distribution of change in diversity index scores over the decade indicate that, while Orinda has become generally more diverse, with
particular growth in the Asian/API community, that shift has occurred in neighborhoods that were already marginally diverse, and that the City’s least diverse neighborhoods have remained its most exclusive.
As shown in the Neighborhood Segregation Map (Figure 4-8), Orinda’s racial/ethnic demographics largely mirror neighboring residential suburbs in and around southwestern Contra Costa, including Moraga, Danville, San Ramon, and census-designated places of Canyon, Alamo, and Diablo. The Neighborhood Segregation Map identifies the racial/ethnic composition of a block group for any group that comprises at least 10 percent of the population. As discussed, Orinda has majority White population with a growing Asian population and shows as Asian-White in Figure 4-8. Similarly, Orinda’s neighboring communities have majority White communities, typically greater than 60 percent. Patterns of concentrations of nonWhite populations in Contra Costa County reflect those found throughout the Bay Area, with non-White populations predominantly in dense urban and historically industrial areas along the bay coastline. This includes Richmond, Hercules, Pittsburg and Antioch; cities and surrounding communities that saw an exodus of its White population during the latter half of the 20th century.
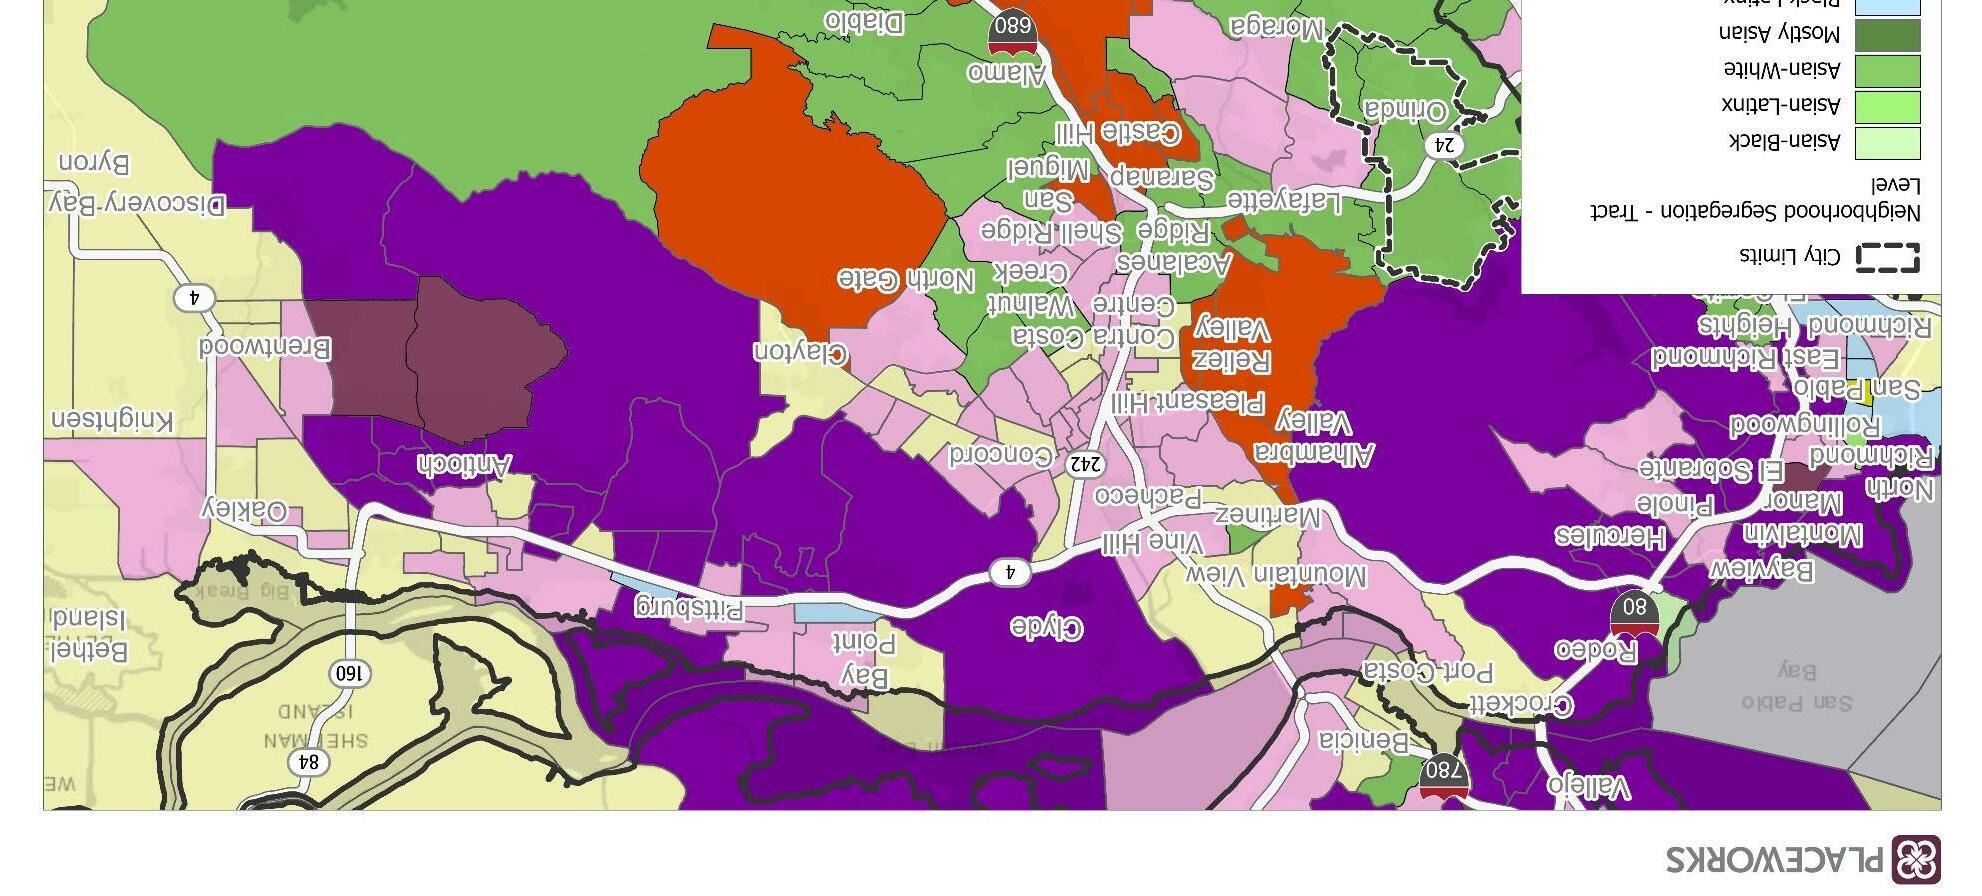
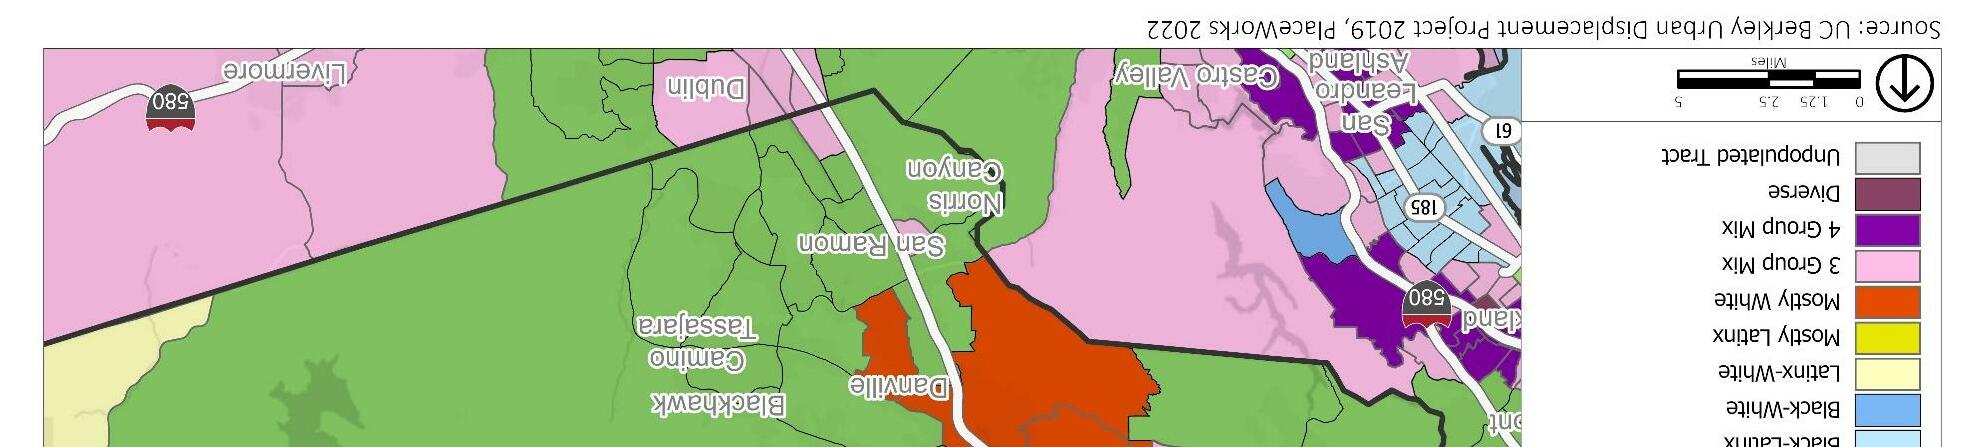
A racially/ethnically concentrated area of poverty (R/ECAP) is defined by HUD as an area in which 50 percent or more of the population identifies as non-White and 40 percent or more of households are earning an income below the federal poverty line. There are no R/ECAPs in Orinda, as there are no census tracts in the City that satisfy either the poverty or diversity requirement (Figure 4-9). The absence of R/ECAPs in Orinda does not necessarily indicate equitable integration of housing and resources regionally. Although poverty rates are lower than the threshold, this may reflect a lack of sufficient affordable units to accommodate households experiencing poverty, excluding them from the City entirely.
Regionally, there are several R/ECAPs in incorporated jurisdictions, including one in the City of Concord, one in the City of Berkeley, and multiple in the City of Oakland. While no unincorporated areas of Contra Costa County are designated as R/ECAPs, North Richmond has a median household income of $50,313, falling in the very low-income category, and is 65 percent Hispanic or Latino, and Bay Point is $50,752, also in the very low-income category, and is 58 percent Hispanic or Latino. Both the communities of North Richmond and Bay Point are in urban areas along the Bay coastline, aligning with patterns of concentrated non-White populations and lower median incomes in these areas.
Racially concentrated areas of affluence (RCAAs), while not formally defined, signify the opposite of R/ECAPs; that is, areas largely exclusive to White non-Hispanic households who earn the highest incomes. For the purposes of this analysis, census tracts are designated as RCAAs when the percentage of total white population is 1.25 times greater than average percentage of total white population for all census tracts in the ABAG region and have a median income 1.25 times greater than the State area median income ($87,500). All of Orinda qualifies as an RCAA, as all of the city’s census tracts are more than 60 percent White non-Hispanic and all block groups have median incomes of exceeding $125,000 (Figure 410). The vast majority of inland, suburban Contra Costa County qualifies as RCAAs, including the predominantly single-family residential cities and unincorporated communities surrounding Orinda, suggesting that RCAAs in Contra Costa County tend to have a higher-than-average percentage of singlefamily zoning. Notably, no areas along the Bay coast qualify as an RCAA, reinforcing the legacy of racially restrictive covenants in the predominantly residential suburban areas in inland Contra Costa County.
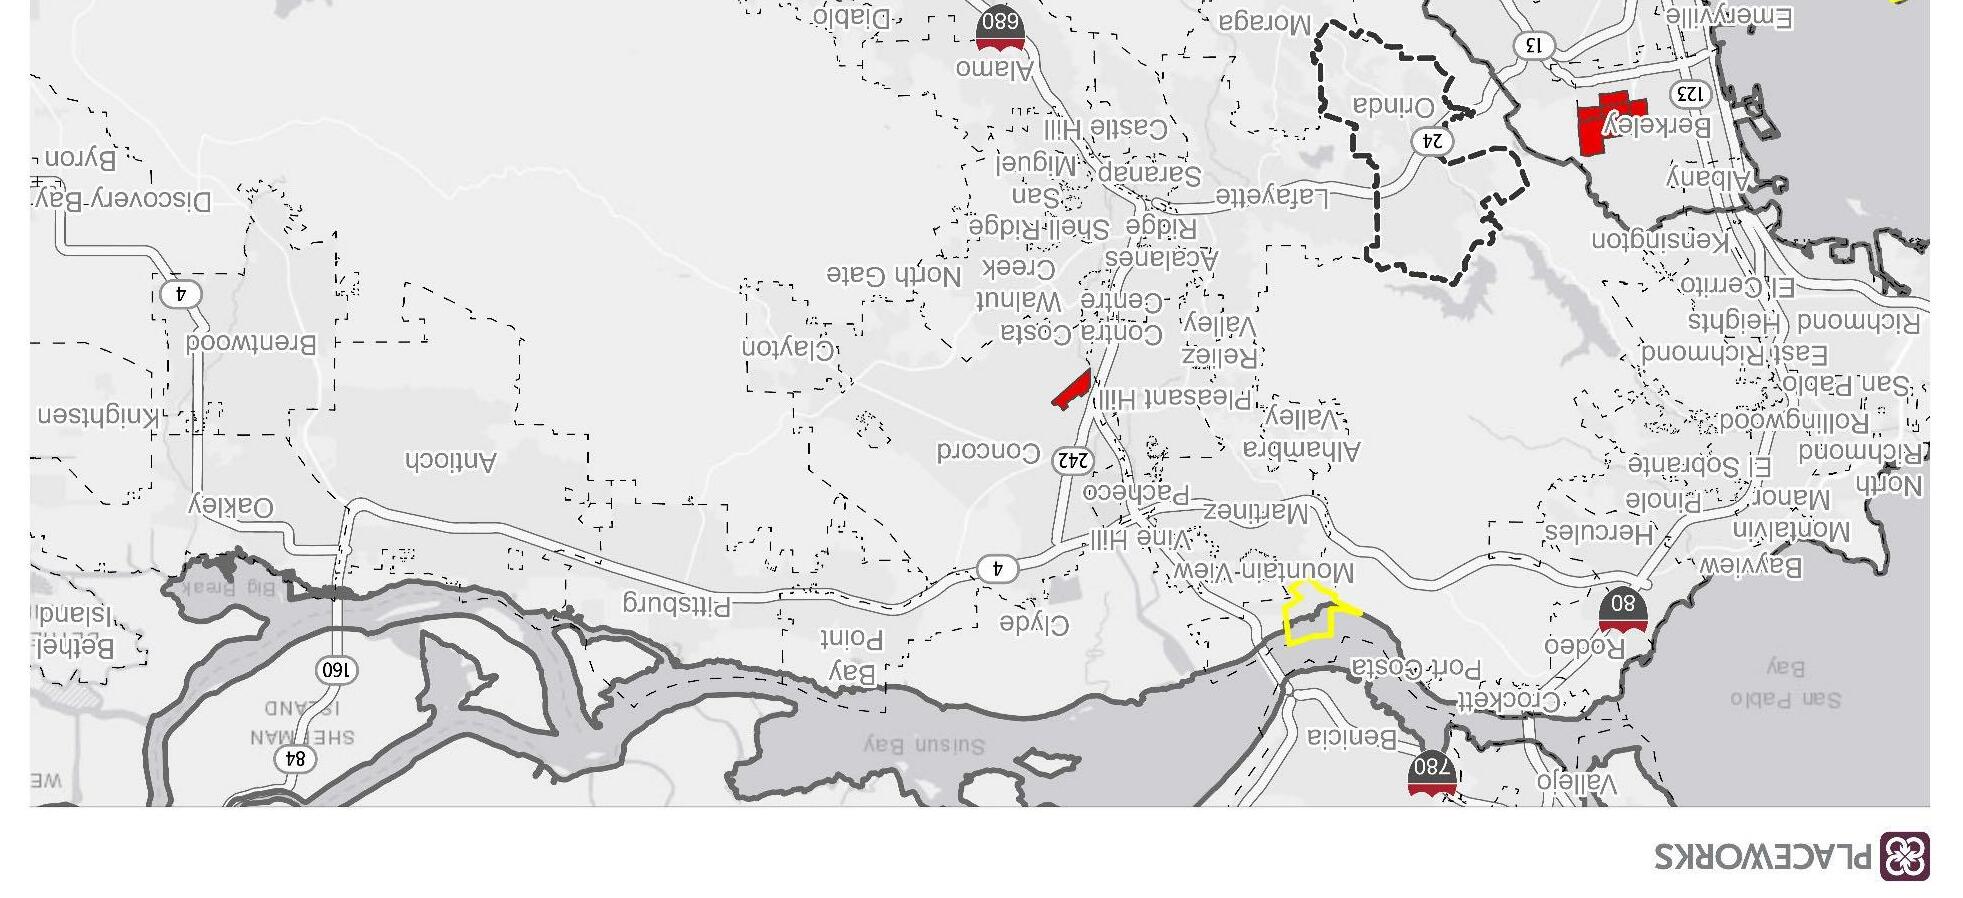
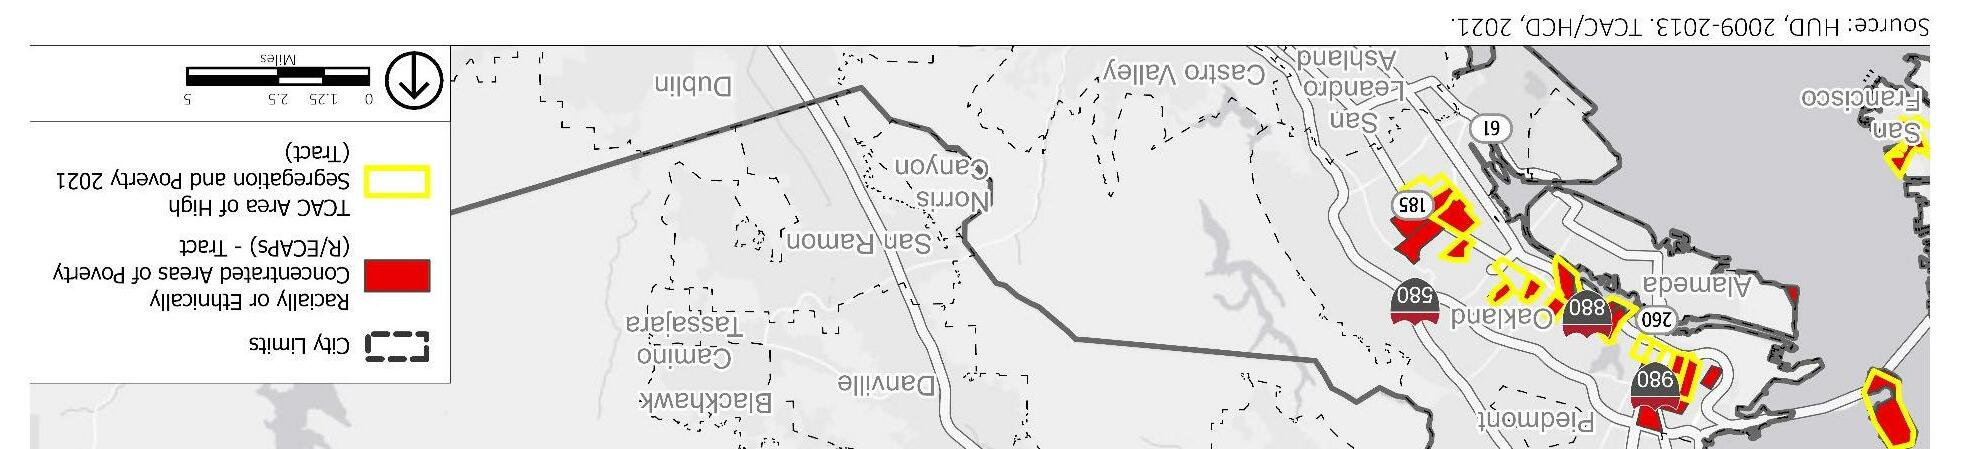
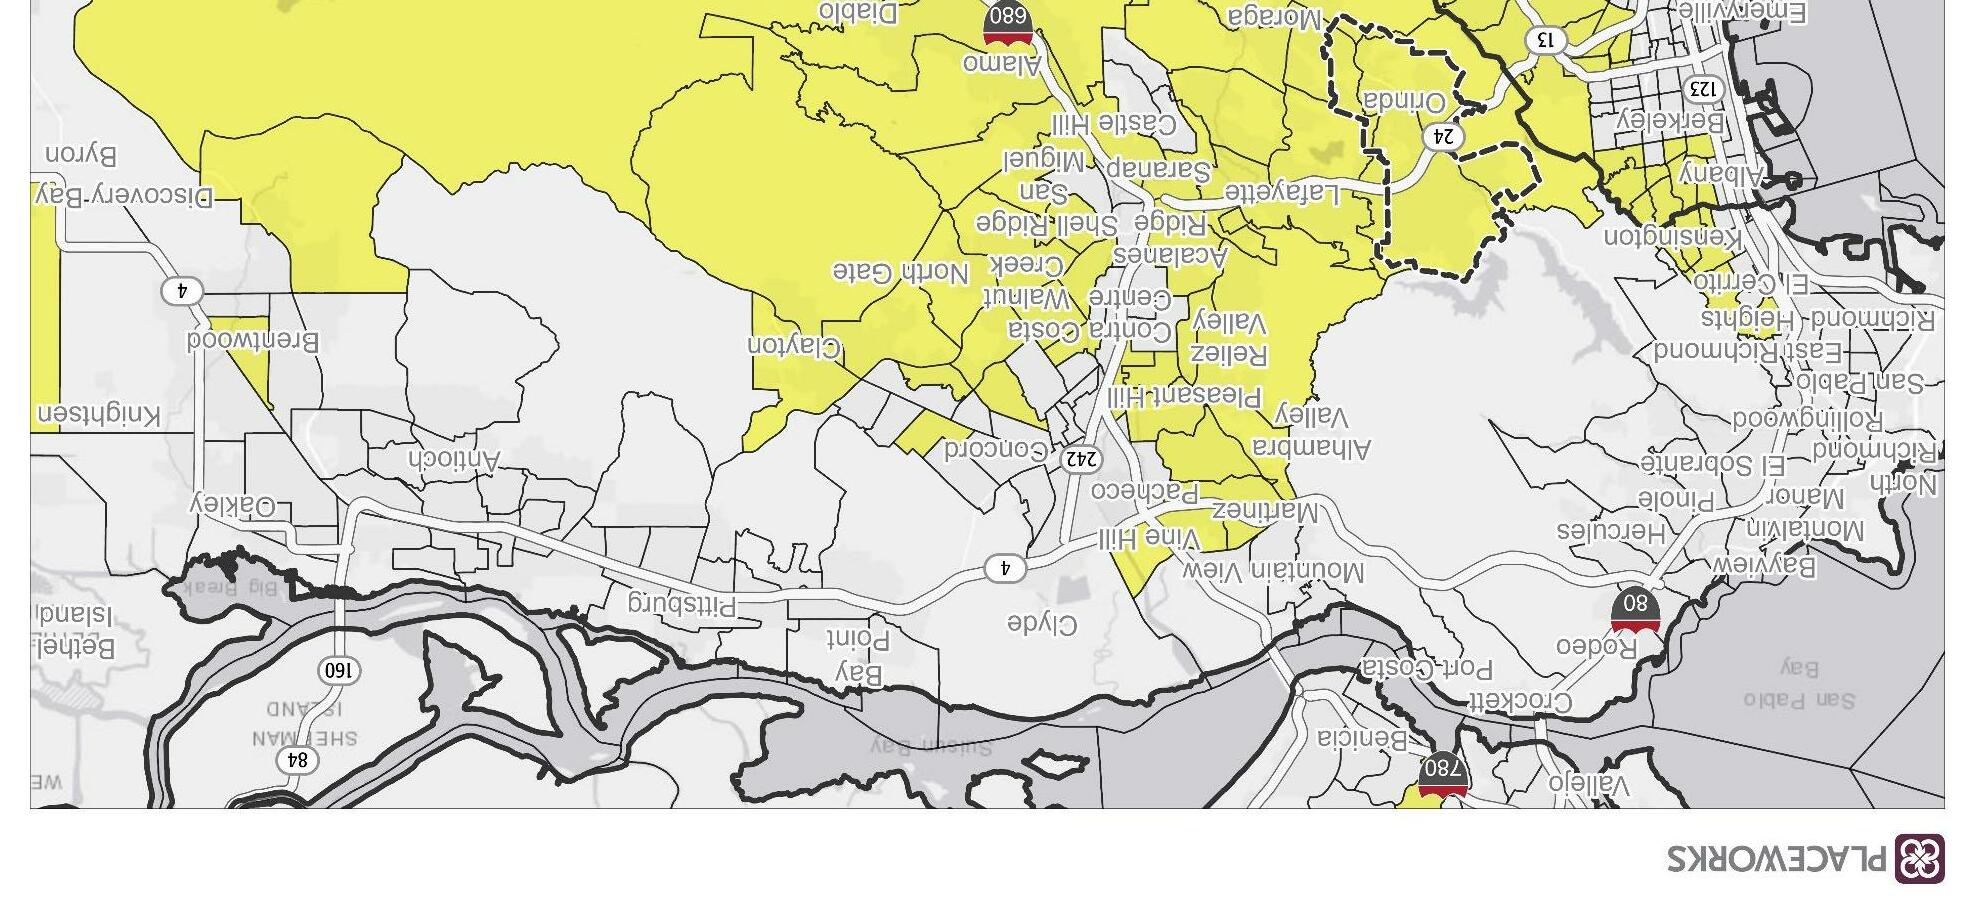
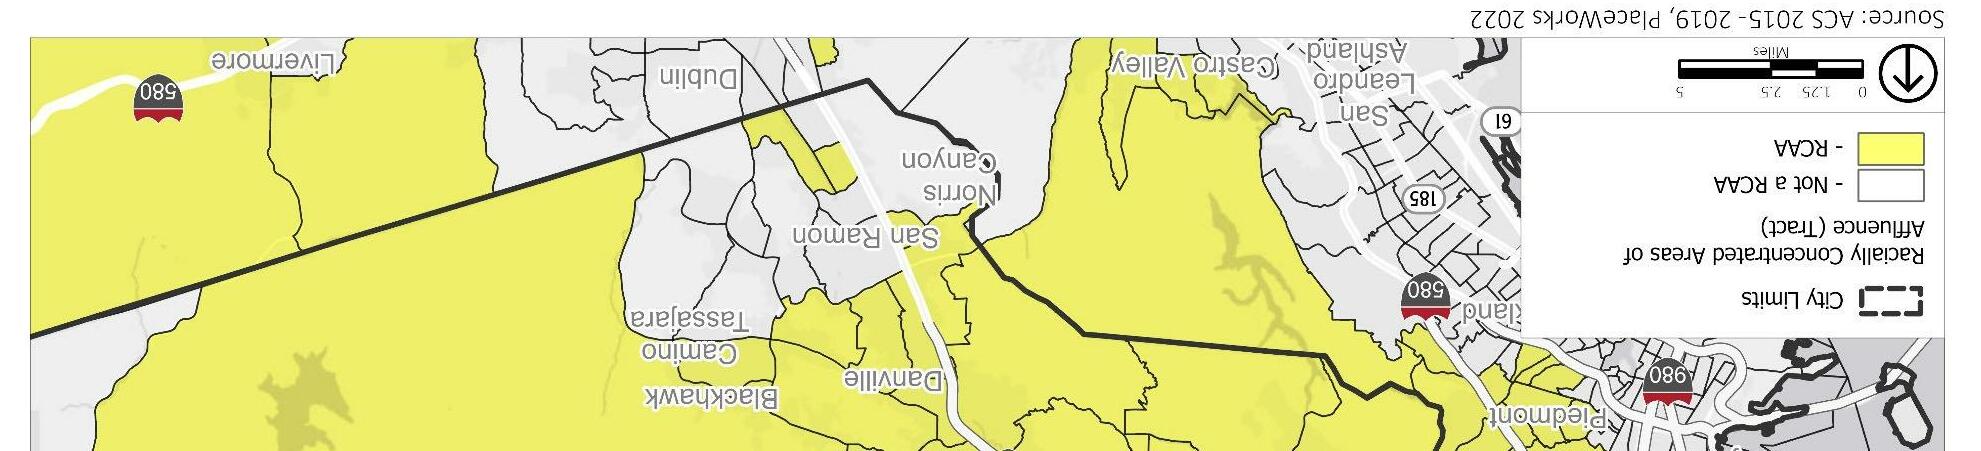
All of Orinda is associated with highly positive economic outcomes, suggesting that Orinda residents face limited barriers for economic mobility (Figure 4-11). The HCD/TCAC map measures access to positive economic outcomes based on incidence of poverty, adult education attainment, adult employment, proximity to jobs, and median home value. Orinda’s citywide median household income of $223,217 is among the highest in the region as well as the state. With exception of one block group that encompasses a portion of south Orinda and Lafayette neighborhoods along the Lafayette reservoir, all block groups in Orinda have average household incomes over $125,000, with several above $200,000 on both north and south sides of the city (ACS 2015-2019). Variation within this range is evenly distributed across the City, with no overwhelming spatial concentration of highest income households on one particular side of the city (Figure 4-12). Though certain neighborhoods have higher incomes than others, relatively higherincome neighborhoods can be found on both the south and north sides of the city. There are no areas of poverty within City limits, indicating that uniformly high costs of housing may be a barrier to access for lower-income households seeking housing in the region, forcing these households to move elsewhere.
In this regional context, Orinda is part of an enclave of high-income communities that includes Moraga, Lafayette, and other primarily residential communities in suburban inland Contra Costa County. The nearby cities of Oakland, Berkeley, Emeryville, Walnut Creek, Richmond, San Pablo, Hayward, see a much wider range of household incomes, with each of these cities containing block groups at and below median income. With exception of Walnut Creek, cities with varied incomes are located along San Francisco and Suisun Bays, where industrial uses are more prevalent and there is greater density than in inland suburban communities. In Contra Costa County and the larger East Bay region, areas of concentrated higher income correspond with concentrated White populations, including in Orinda and the surrounding cities in inland Contra Costa County. High housing costs and lack of a variety of housing types may contribute to effectively excluding many low- and moderate-income households to high resource areas such as Orinda, limiting upward mobility for low-income households.
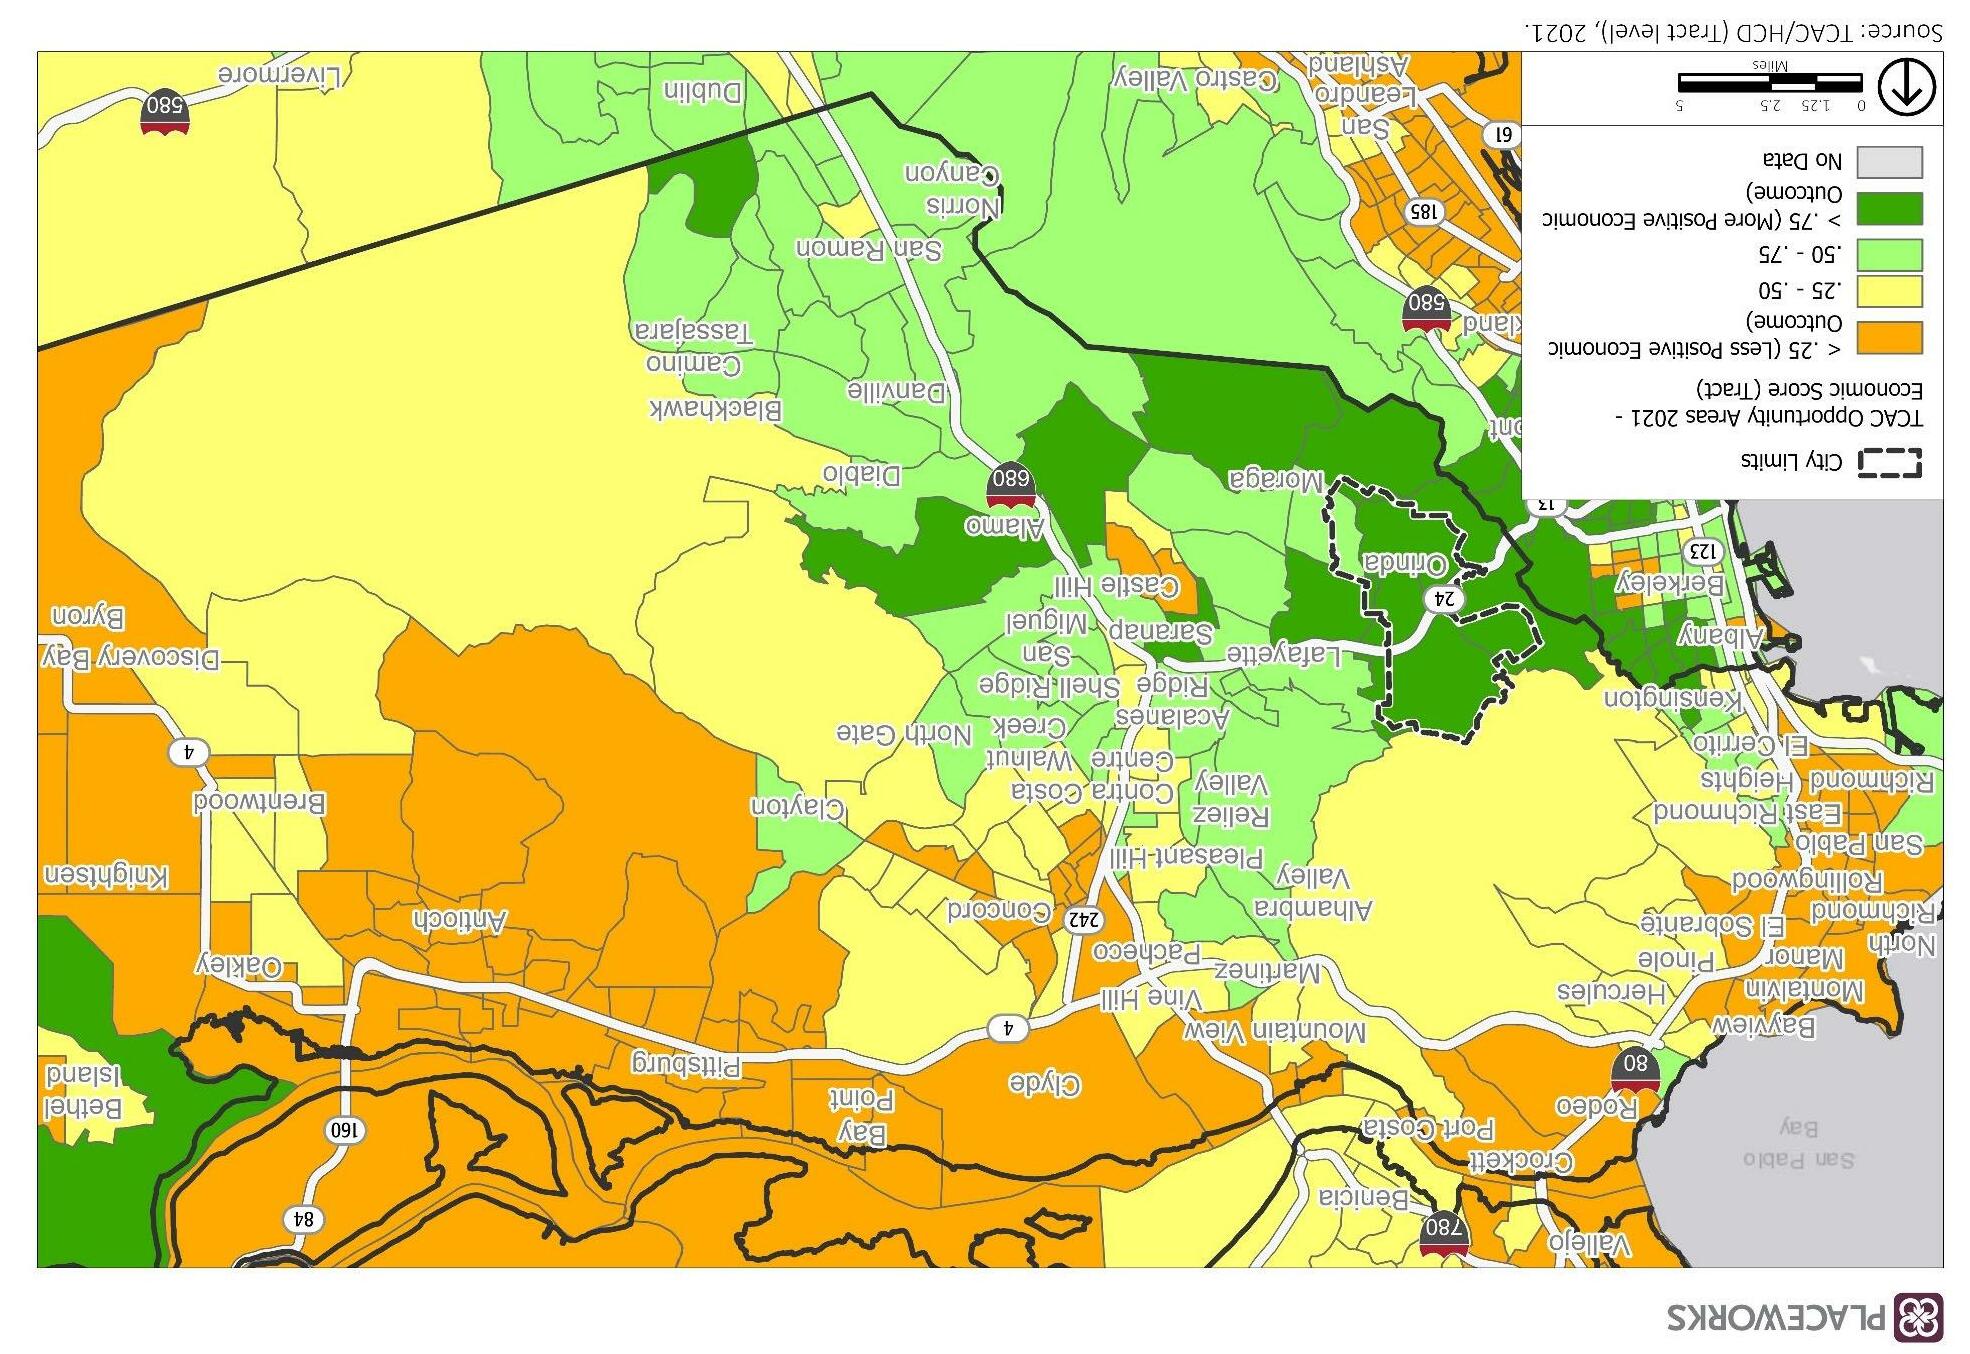
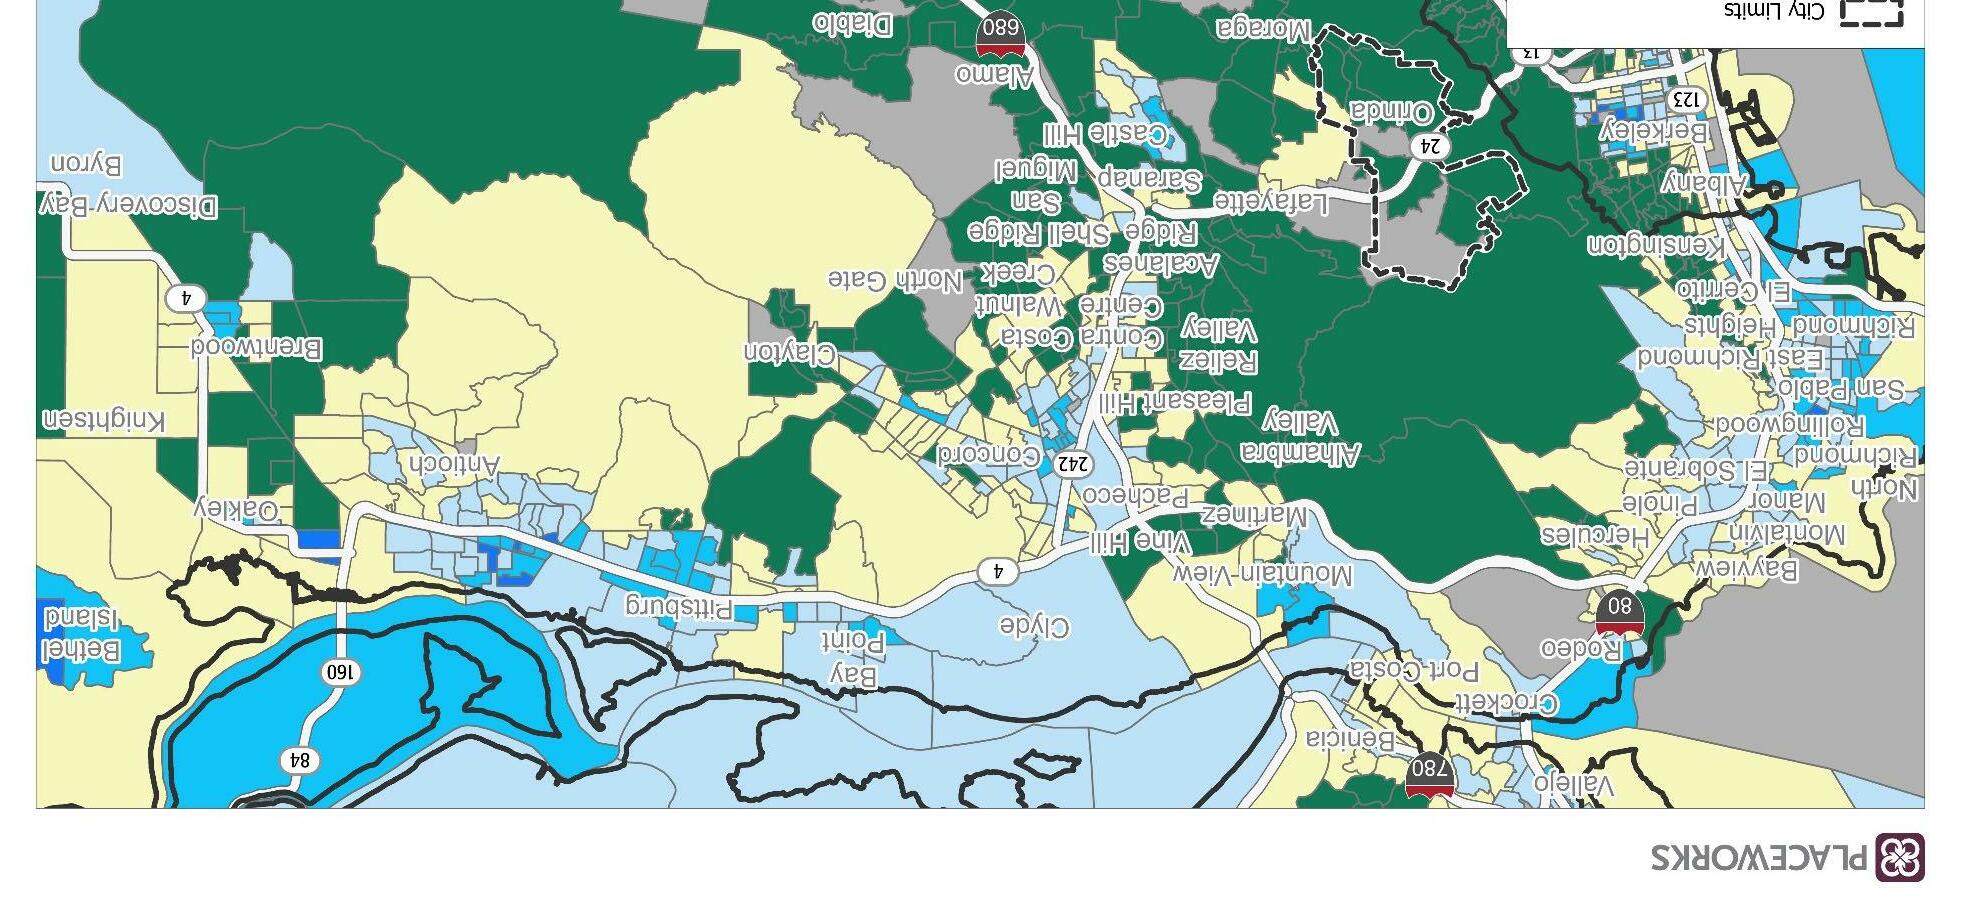
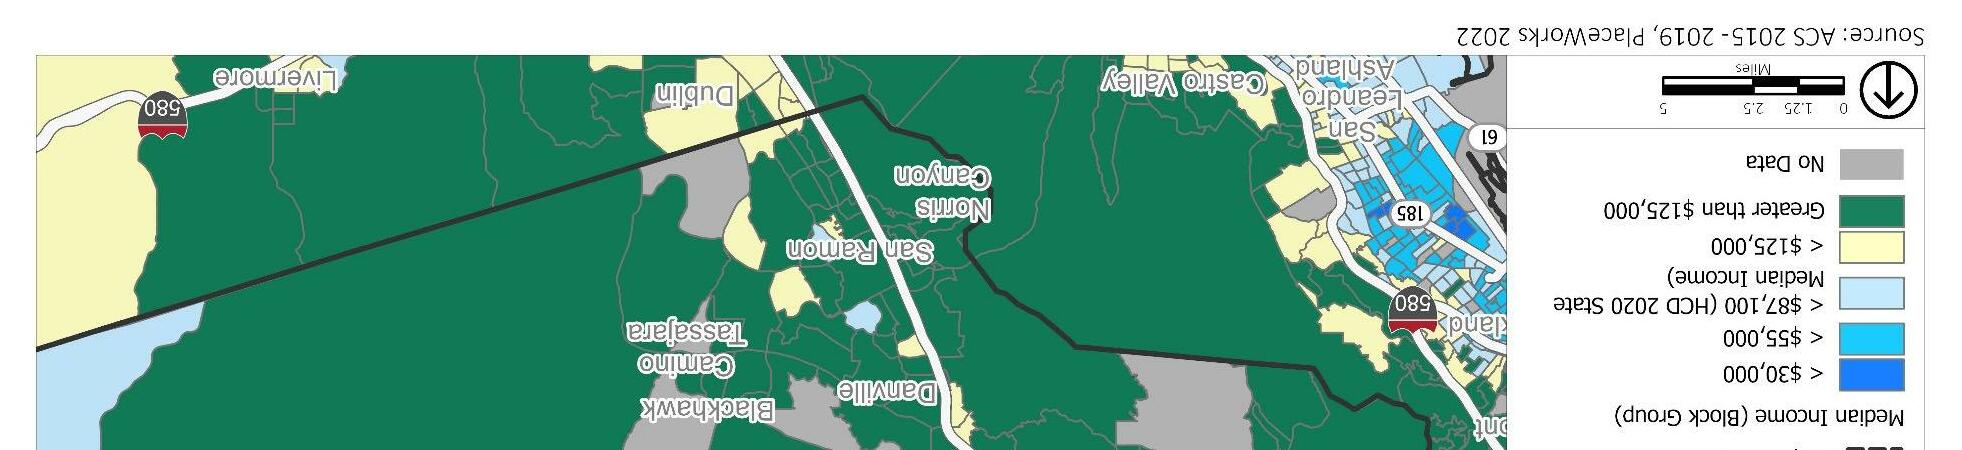
According to the 2015-2019 ACS, approximately 10 percent of Orinda’s population live with at least one disability. This includes 3.5 percent of the population which is both under 65 and living with at least one disability. This rate is low relative to the region – particularly high rates in Contra Costa County are found in Concord, Martinez, and southwestern Walnut Creek, although the presence of the gated Rossmoor community for residents 55 or older in this area may skew this data. While the percentage of the population with a disability varies slightly throughout the County, there are no significant concentrations of this population. In most populated areas of the County, disability rates range from less than 10 percent in Rodeo, Bay Point, and many central areas of the County to 17 percent in Crockett. The areas with the lowest rates of poverty in the center of the county are largely undeveloped and recreational areas, so do not accurately represent patterns in the County. Given that disability rate in populated areas has very limited variation, it is likely that persons with disabilities have similar accessible housing options throughout the county and are therefore have options in all communities. While the disability rate is slightly higher in Contra Costa County than in the region, the patterns of concentrations are similar between the two. More urban areas with higher density of population, often along the bay and in downtown areas, have slightly higher rates of disability in both the Bay Area and the County. This may be due to a concentration of accessible housing, proximity to transit, and the availability of resources in these areas. Contra Costa County largely reflects disability patterns found throughout the region.
Within Orinda, the rate of the population living with a disability is evenly distributed spatially, with no significant concentrations in any one side of the city (Figure 4-13). Both the highest rate by census tract (9.7 percent) and lowest rate by census tract (5.9 percent) are found on the north side of the city, immediately adjacent to one another. The most recently available data reports an estimate of 65 to 68 persons with development disabilities living in the City of Orinda. Additional housing designed to accommodate residents with ambulatory and/or developmental disabilities would increase access to Orinda’s resources for these groups.
To improve access to housing for those with disabilities and to support and fund (when funds are available) services and developments targeted for disabled persons and households, the City has included Actions 1.F, 2.C, 3.A, 3.B, 3.C, and 3.D and 5.A.
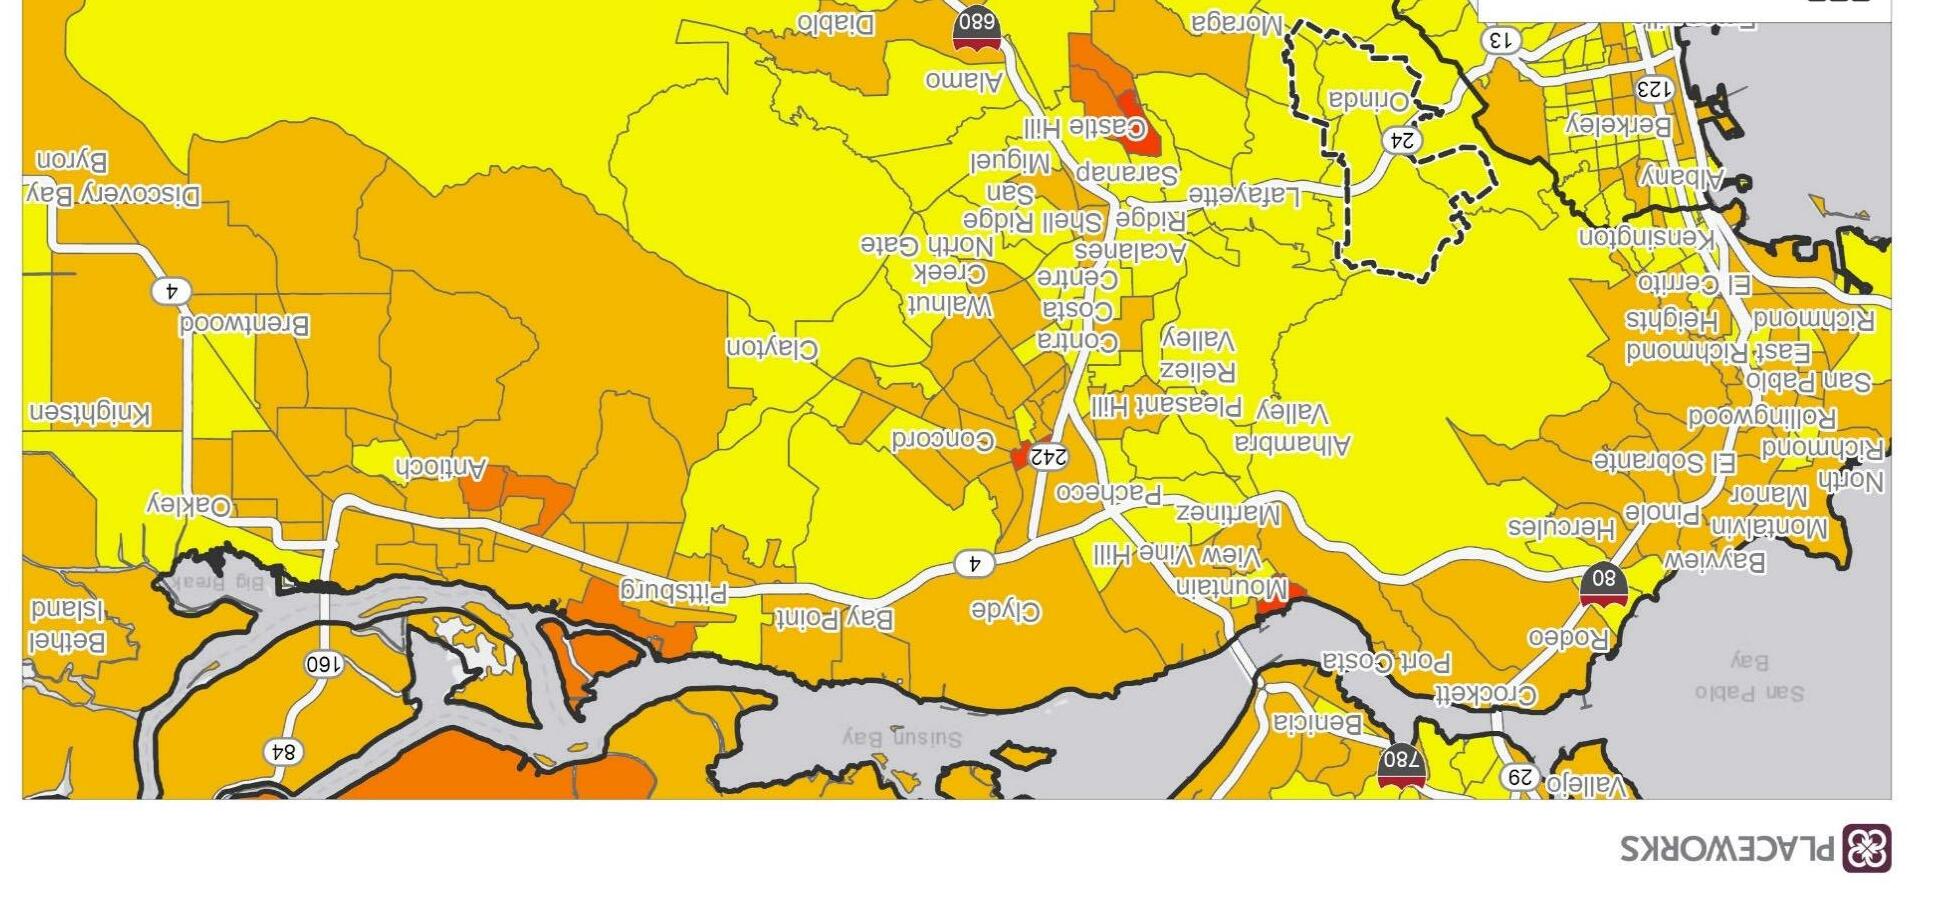
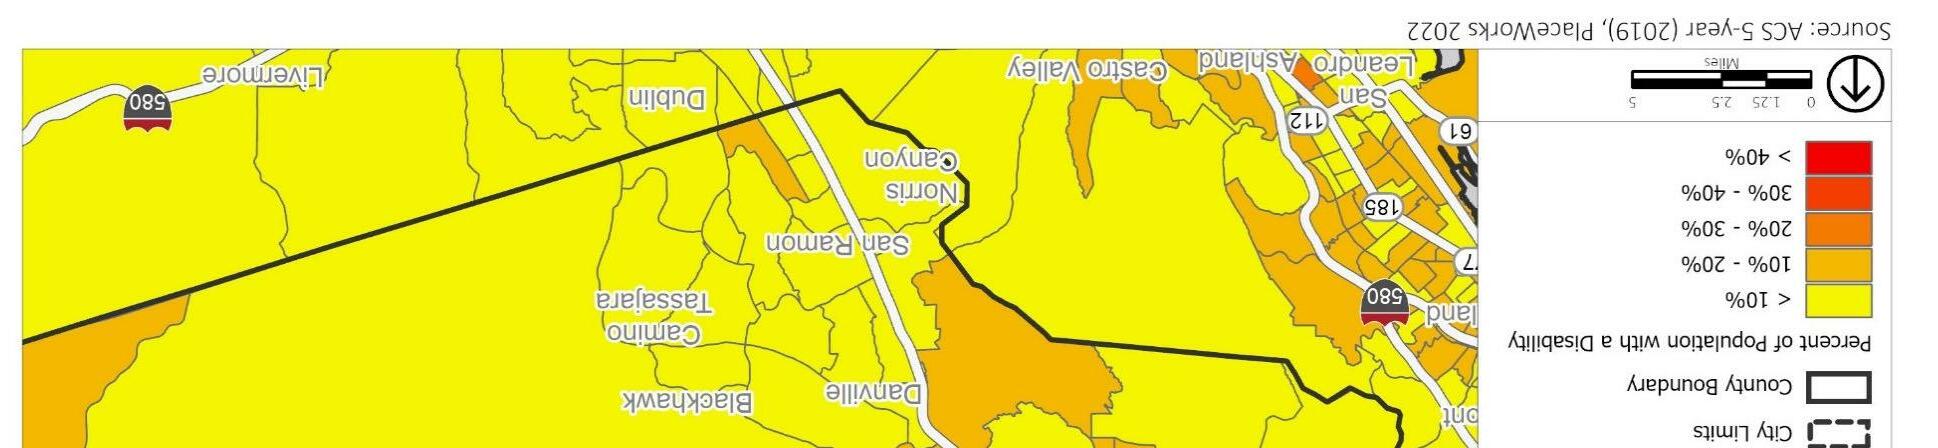
Orinda is a family-oriented community and is likely to remain so, should the housing market remain accessible to this population. The percentage of children living in married-couple households is over 80 percent in all census tracts. Similar rates are found in other high resource areas of Contra Costa County. The percent of adults 18 years and older in households living alone is low for the region, with no census tract seeing a rate over 20 percent. Areas in the region with higher rates are found in downtown Oakland and Rossmoor/Walnut Creek. This may indicate a low number of seniors living independently and/or a low number of young single adults, students, and professionals. The percent of adults 18 and older living with a spouse is close to 70 percent in most tracts within Orinda except for one southeastern section of the city, which is also the area of the city with a relatively lower income described above (though still high for the region.) This area also has a relatively lower rate of spousal cohabitation, 55 percent. The percent of children in female-headed households with no spouse or partner present is low citywide, with no census tract seeing a rate over 20 percent. The highest rates regionally are found in downtown Oakland.
Orinda reflects familial trends observed in Contra Costa County regionally, which features a higher percentage of families with children than neighboring Bay Area counties (Figure 4-14). The dominance of families in Contra Costa County is reflected by a higher proportion of the housing stock consisting of multibedroom single-family detached homes than in the region overall. The rate of households who are married couples with children is higher in suburban, primarily residential communities in southwestern County around Orinda, such as Diablo and Alamo, among others. In more urban communities, with higher densities of housing, the rate of adults living alone or without a spouse (such as roommate situations) and female-headed households increases (Figures 4-15 and 4-16, respectively). Areas that offer higher density housing may provide monthly housing costs that are more affordable to single-income households and therefore result in a concentration of female headed households and/or adults living alone that are more susceptible to overpayment and displacement risk.
The homogeneous character of familiar status and household composition in Orinda may reflect barriers to access including high home values (i.e., unaffordable monthly housing costs) and a lack of diversity of housing types. Further, while Orinda is, and has historically been, predominantly occupied by families with children, rising home prices may present a future risk to families to afford housing in the city. In order to foster a more inclusive environment for households of diverse familial statuses, and reduce displacement risk for families with children resulting from increasing housing costs, the City has included Actions 1.A, 1.B, 1.D, 1.E, 3.A, and 3.B, to expand access to multifamily housing, denser single-family housing, ADUs, and affordable senior housing.
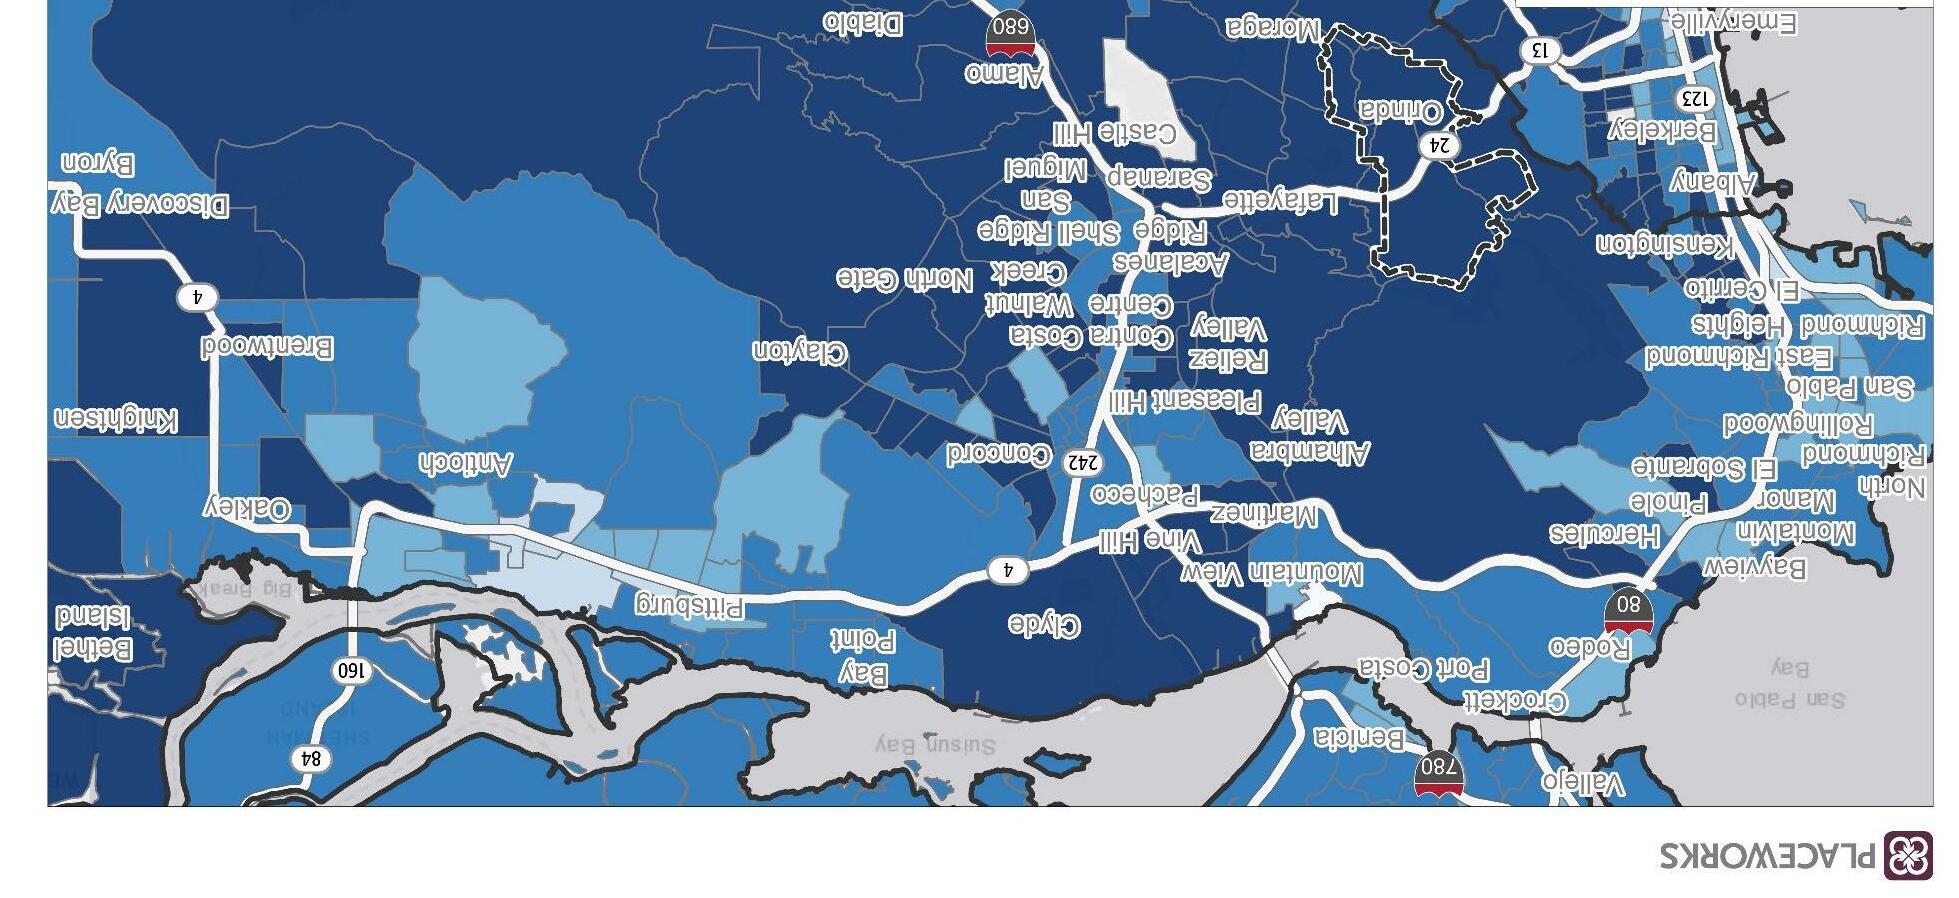
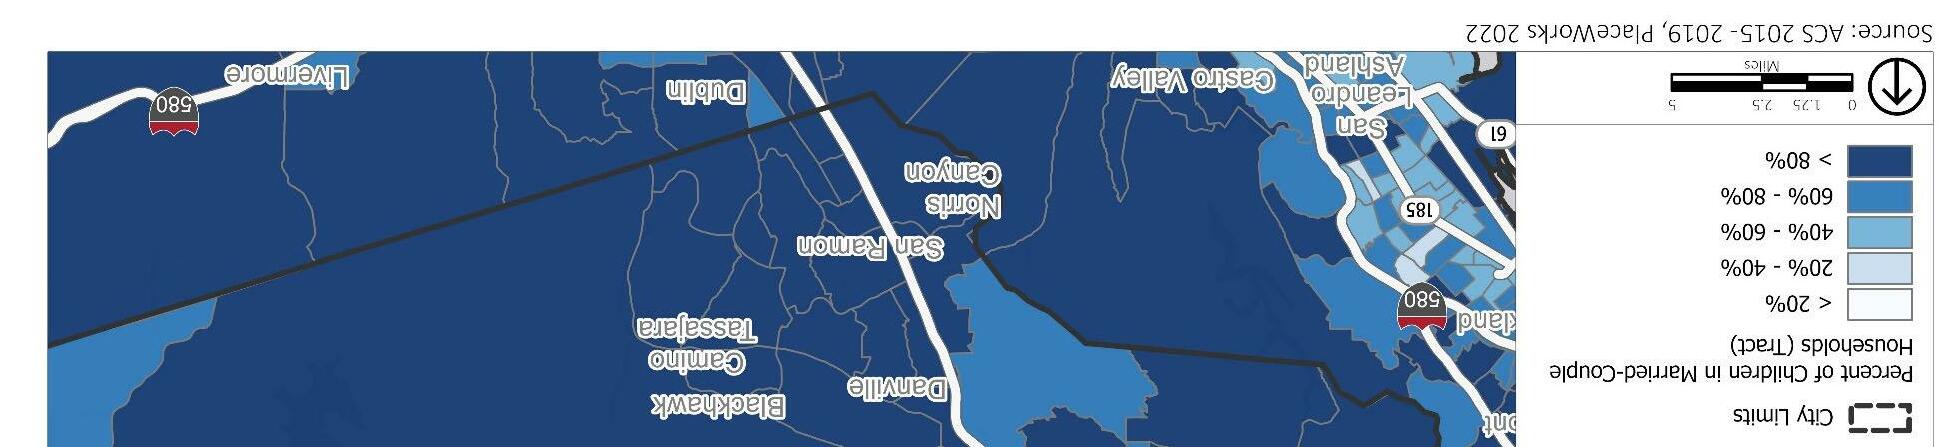
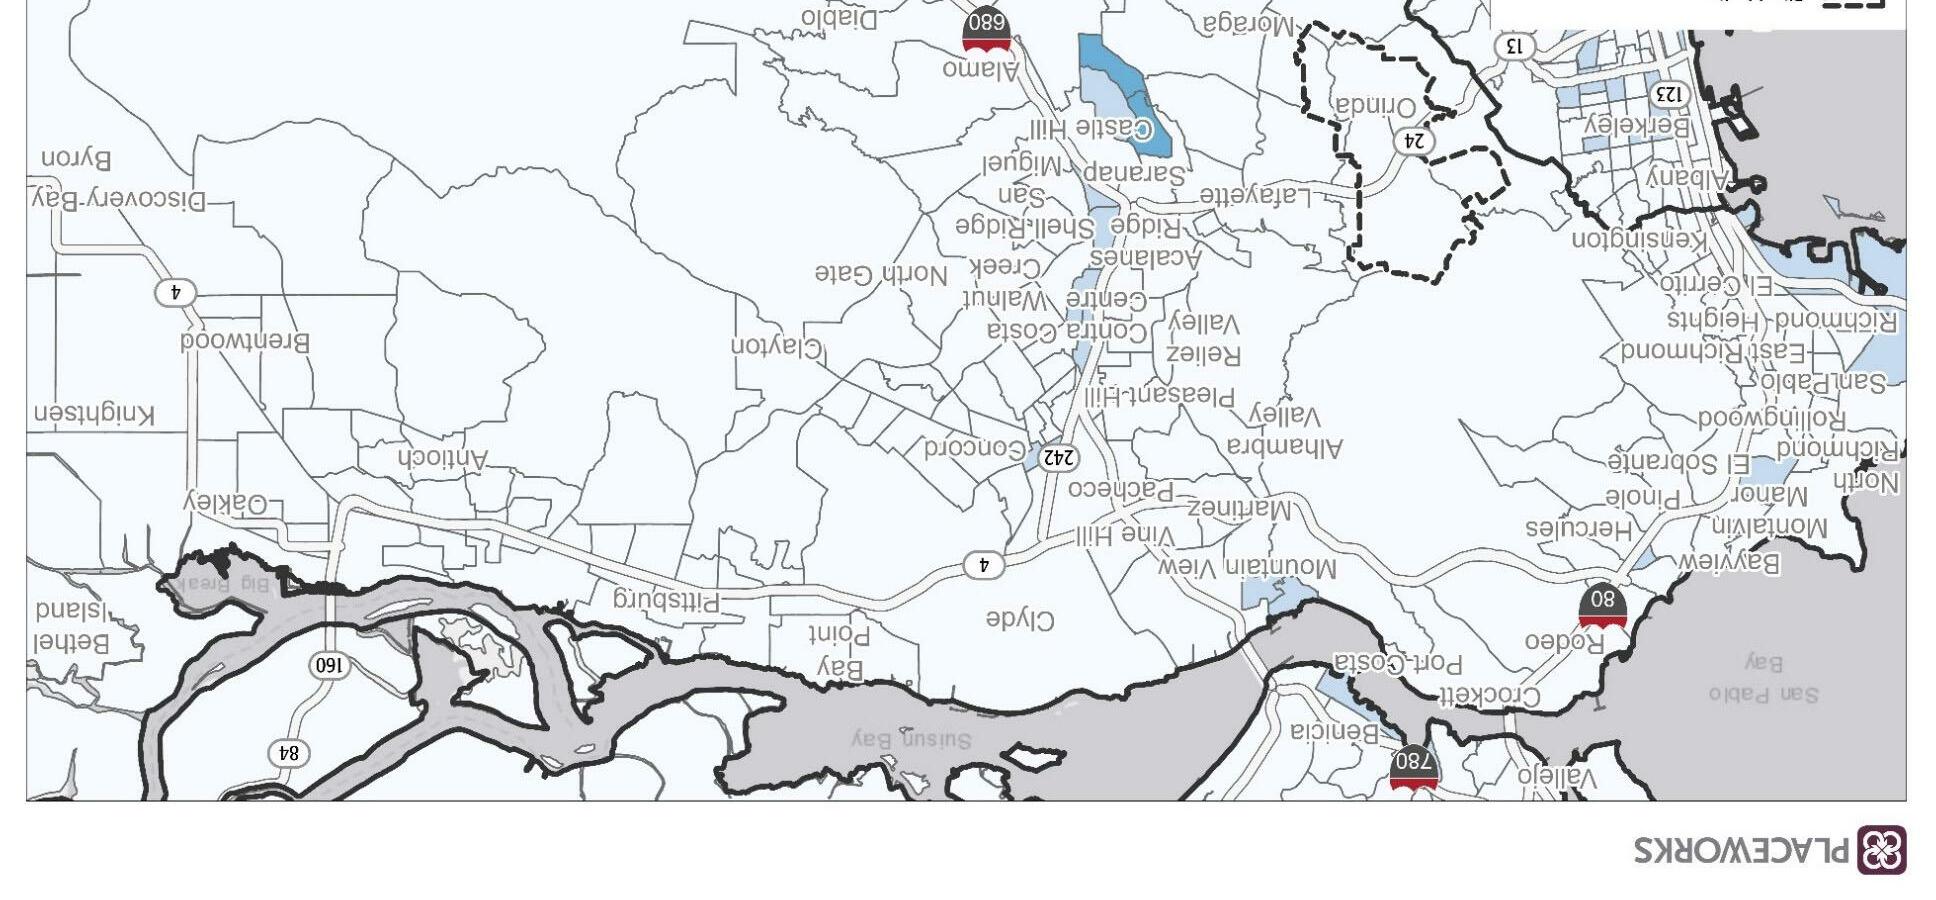
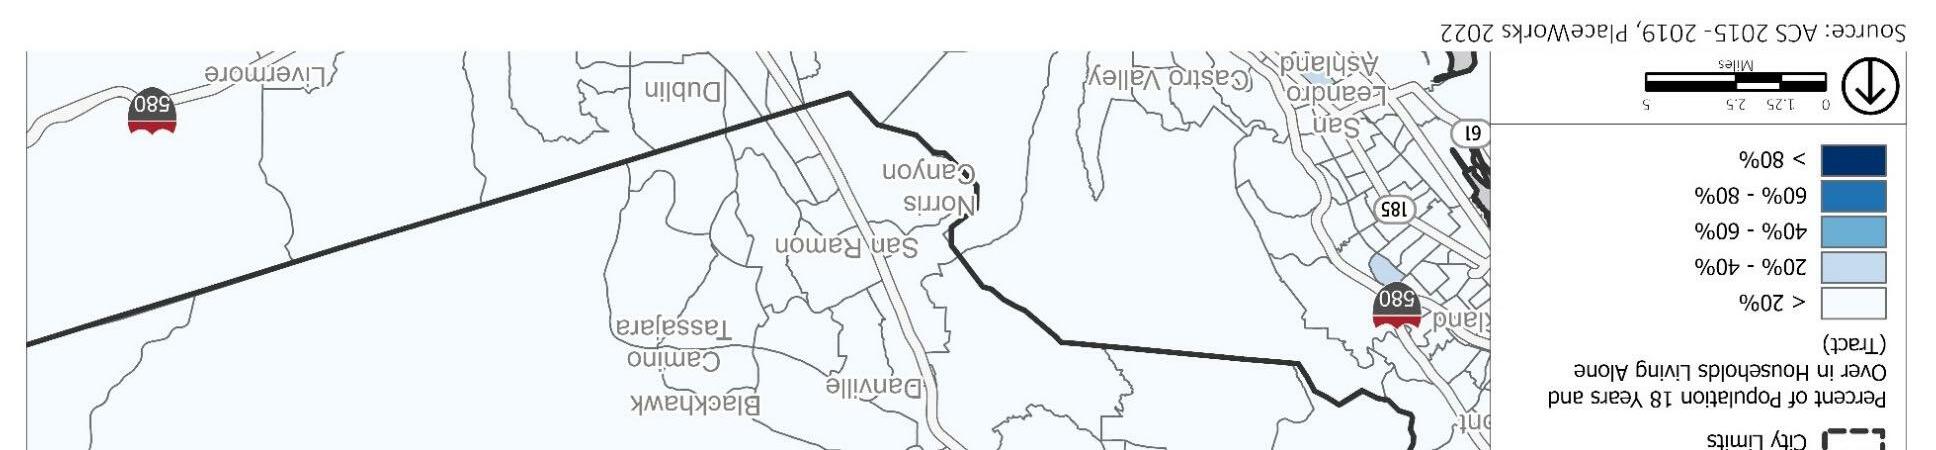
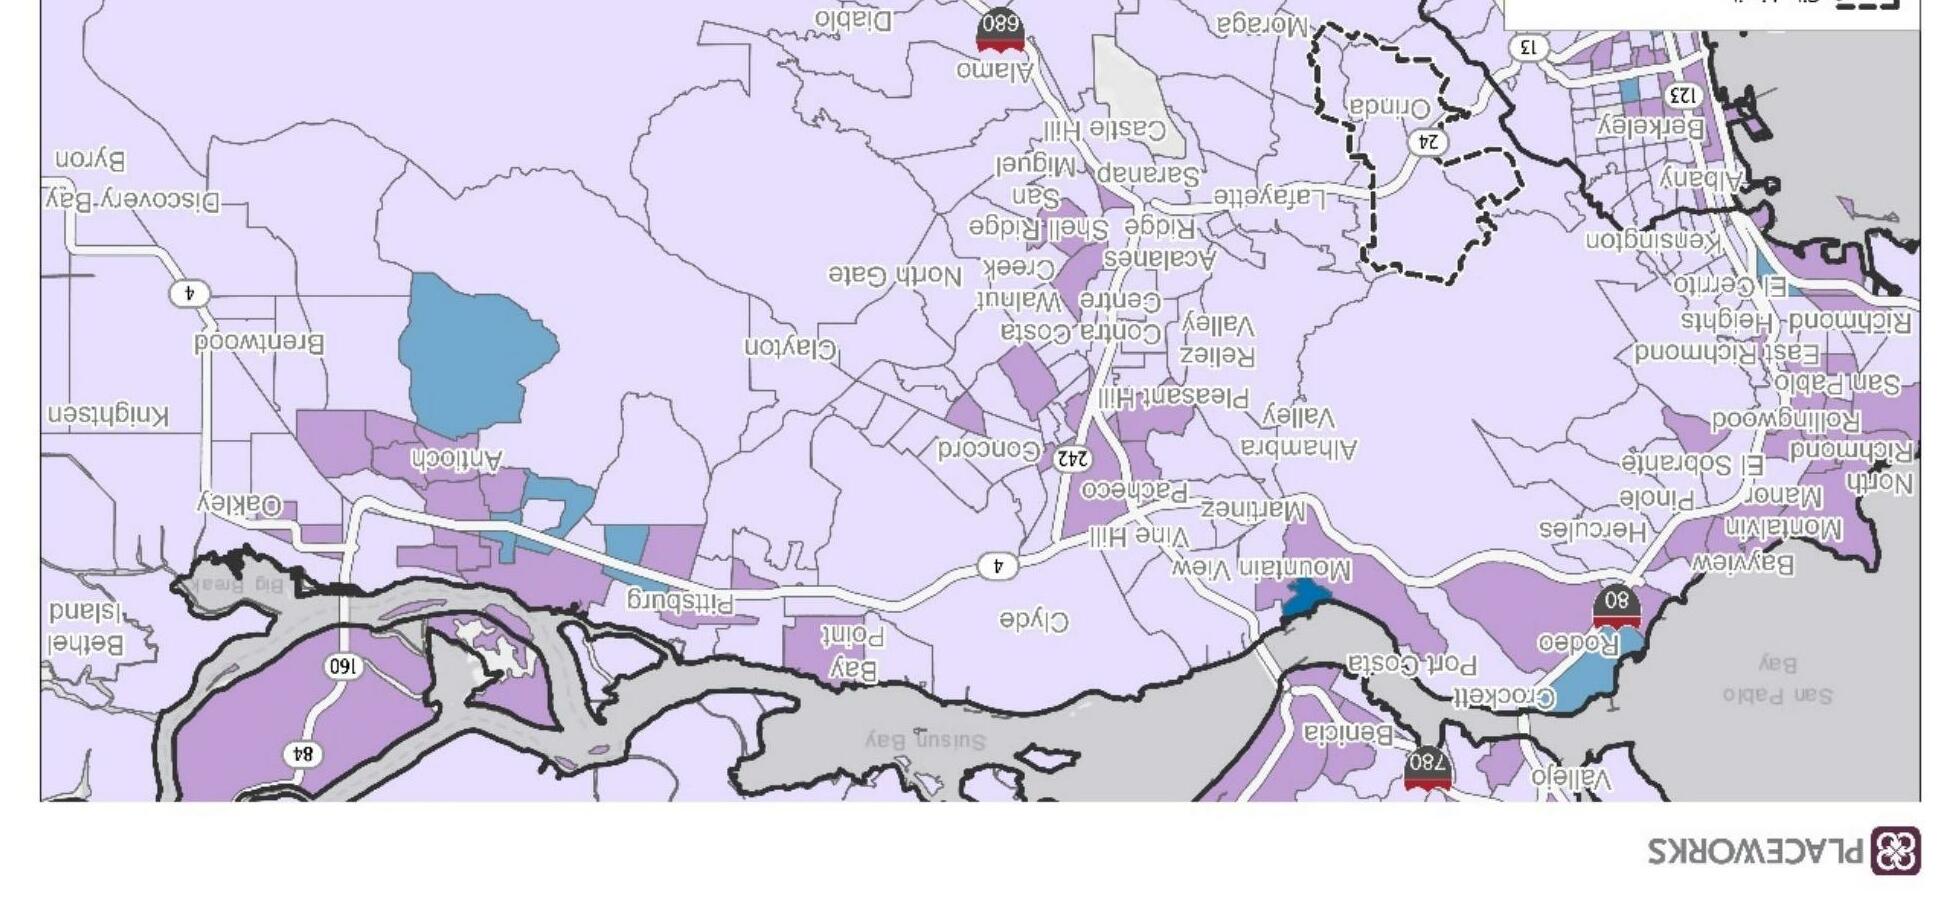
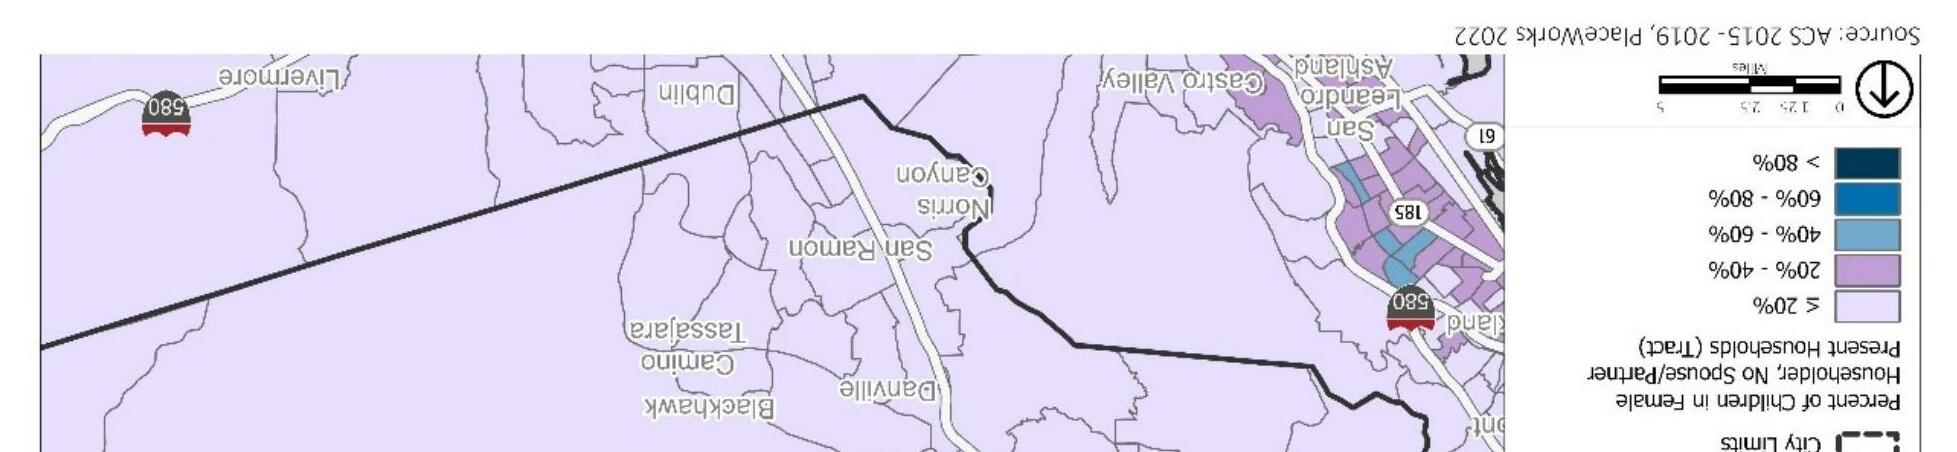
In February 2021, the California Office for Environmental Health Hazard Assessment (COEHHA) released the fourth version of CalEnviroScreen, a tool that uses environmental, health, and socioeconomic indicators to map and compare community’s environmental scores. A community with a high score, is one with higher levels of pollution and other negative environmental indicators. A community with a score in the 75th percentile or above, is one with higher levels of pollution and other negative environmental indicators and is considered a disadvantaged community. There are no disadvantaged communities in the City of Orinda; all tracts in Orinda are score in less than the fifth percentile.
A disadvantaged community or environmental justice community (“EJ Community”) is identified by the California Environmental Protection Agency (CalEPA) as “areas that is disproportionately affected by environmental pollution and other hazards that can lead to negative health effects, exposure, or environmental degradation,” and may or may not have a concentration of low-income households, high unemployment rates, low homeownership rates, overpayment for housing, or other indicators of disproportionate housing need.7 In February 2021, the California Office for Environmental Health Hazard Assessment (COEHHA) released the fourth version of CalEnviroScreen, a tool that uses environmental, health, and socioeconomic indicators to map and compare community’s environmental scores (see Figure 4-17). In the CalEnviroScreen tool, communities that have a cumulative score in the 75th percentile or above (25 percent highest score census tracts) are those that have been designated as disadvantaged communities under SB 535.8 The cumulative score for each census tract includes an exposure score, with a low score being a positive outcome, for each of the following:
● “Ozone concentrations
● PM2.5 concentrations
● Diesel particulate matter emissions
● Drinking water contaminants
● Children’s lead risk from housing for children
● Use of certain high-hazard, high-volatility pesticides
● Toxic releases from facilities
● Traffic impacts9”
Communities that are identified as disadvantaged communities based on their cumulative pollution exposure score are targeted for investment through the State cap-and-trade program. However, the condition of these communities poses fair housing concerns due to disproportionate exposure to
7 California Health and Safety Code § 39711
8 California Office of Environmental Health Hazard Assessment. SB 535 Disadvantaged Communities, June 2017. https://oehha.ca.gov/calenviroscreen/sb535
9 California Environmental Protection Agency, California Office of Environmental Health Hazard Assessments. Update to the California Communities Environmental Health Screening Tool: CalEnviroScreen 4.0 Public Review Draft, February 2021. https://oehha.ca.gov/media/downloads/calenviroscreen/document/calenviroscreen40reportd12021.pdf
unhealthy living conditions. In the City of Orinda, the cumulative scores of all census tracts are below the 5th percentile, indicating that there are no areas that meet the criteria of a disadvantaged community and are not disproportionately exposed to high levels of pollutants compared to other census tracts in the State.
However, Highway 24, which bisects the community, is the primary source of pollutants resulting from freeway traffic that may impact residents. However, CalEnviroScreen reports that in tracts that encompass the City of Orinda west of Camino Pablo and Moraga Way, along Highway 24, fall in the 23rd to 26th percentile for diesel particulate matter, which includes exhaust from trucks, buses, trains, and other equipment with diesel engines that travel freeways. Similar scores are found in the tract north of Highway 24 and east of Camino Pablo. In contrast, the tract south of Downtown adjacent to the Lafayette Reservoir has scores in the 38th percentile for this pollutant. However, the assessment of ozone pollution, which is caused by smog from trucks and cars, reports that no area of the city is above the 8th percentile, indicating limited exposure to this pollutant. While these scores are relatively low, and are better than most of the Bay Area, CalEnviroScreen does report significantly higher impacts due traffic that reflect most communities located along major freeway corridors. In the tracts west of Camino Pablo and Moraga Way along Highway 24, traffic impacts are in the 69th to 72nd percentiles. To the east, scores are slightly lower, in the 49th to 52nd percentiles. Traffic impacts measures traffic density, or the number of vehicles on the road, and therefore concentration of noise and exhaust from cars and trucks. Therefore, while, residents of Orinda all have access to healthy conditions overall that may benefit long-term health and quality of life relative to other areas of the state, proximity to Highway 24 may have negative impacts on the health of residents living most closely to the freeway.
While most census tracts in Contra Costa County have similar cumulative pollution exposure scores as the City of Orinda, nearly all cities along the perimeter in more urbanized or industrial areas and along major highways have scores in the 75th percentile and above, up to the 95th percentile in the cities of Richmond and Antioch. These areas were historically considered undesirable partially due to proximity to harbors and industry along the San Francisco Bay and the resulting poor environmental conditions that persist today. Current efforts throughout the Bay Area to focus investment in the development of parks, treelined streets, and preservation of open space will aid in improving the conditions of residents of these areas. In Orinda, Highway 24 is designated a scenic highway as it traverses through an area with significant amounts of permeant open space which already serves to mitigate impacts from the freeway. In addition, residents have access to numerous parks, trails, and open space. The City will continue to expand access to these amenities by implementing policies in the Open Space, Schools, and Utilities Elements of the General Plan. In addition, individual developments proposed in close proximity to Highway 24 will also be required to provide for tree coverage and vegetation to contribute to the scenic nature of the corridor and the environment.
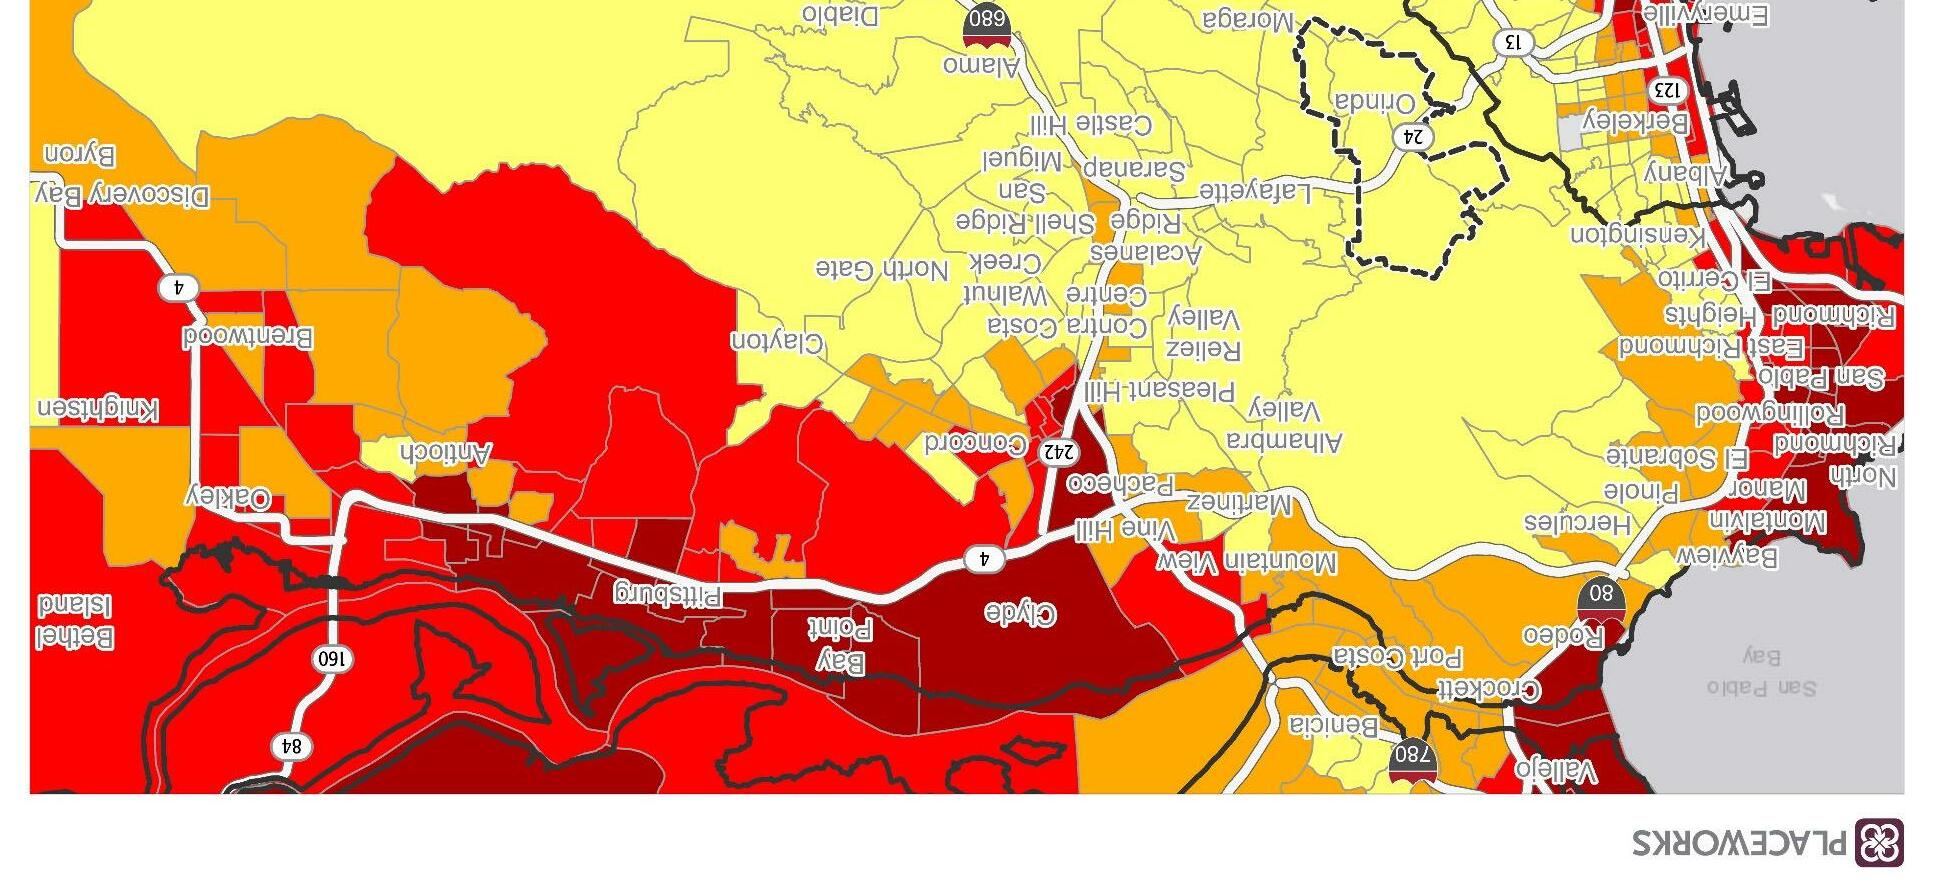
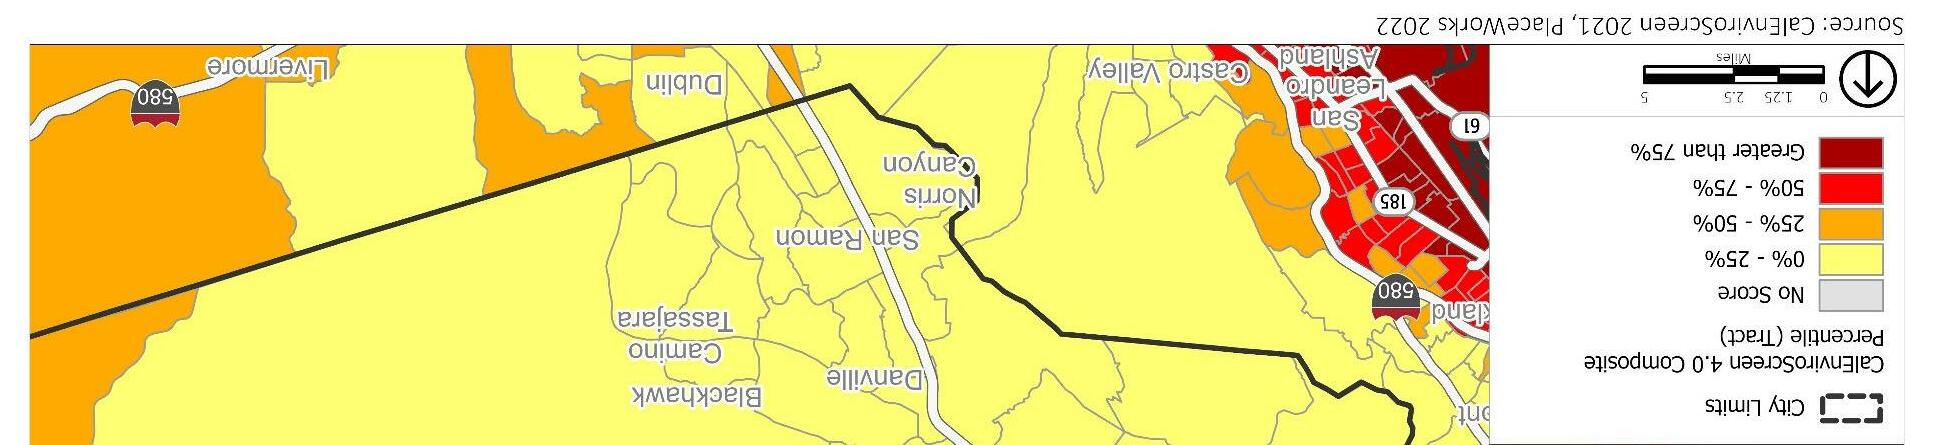
The Orinda Unified District includes four elementary schools and one middle school, all located in the City of Orinda. Miramonte High, also in Orinda, is part of the Acalanes Union High School District, which serves students from Orinda as well as other parts of Contra Costa County. These six schools within city limits are distributed across the northern and southern portions, primarily near arterial routes such as Moraga Way, Glorietta Boulevard, and Camino Pablo, ensuring access to a nearby school for students living in different parts of the city.
Each year, the California Department of Education publishes performance metrics for each school in the state, including student assessment results for English Language Arts and Mathematics as they compare to the state on meeting grade-level standards. As shown in Table 4-33, all Orinda schools significantly exceed the statewide grade level standard for performance for English Language Arts and Mathematics.
Source: California Department of Education, 2019
The abundance of high performing schools for all Orinda residents is further supported by TCAC/HCD’s educational score, an attribute of the opportunity area maps. While data is not available for the northeast quadrant of Orinda, the remainder of the city scores in the 96th to 99th percentile for anticipated positive educational outcomes. The high school performance scores found in Orinda are reflective of jurisdiction such as the cities of Lafayette, Walnut Creek, Danville, and Clayton. In contrast, jurisdictions on San Francisco Bay and Suisun Bay have significantly lower anticipated educational outcomes. For example, the City of Richmond scores below the 15th percentile, the City of Concord in the 3rd to 61st percentiles, and the City of Berkeley in the 57th to 76th percentiles. While educational performance and expected outcomes vary significantly throughout the Bay Area, residents of Orinda, regardless of where they live within the city, have access to some of the highest performing schools in the region, and state. To improve housing access for prospective residents who wish to send school-aged children to the high performing schools in Orinda, the City has included Program 1.E to promote construction of ADUs and Program 1.G to support affordable housing development to increase the supply of accessible units for lower- and moderate-income households to live in Orinda and establish residency in the school district.
Orinda residents are served by the Bay Area Rapid Transit (BART) system, which offers light rail service connecting residents from the Orinda Station in downtown Orinda to services, employment centers, and other destinations throughout the Bay Area. The Antioch-SFO + Millbrae Line stops at the Orinda BART Station and provides direct connection to downtown San Francisco, San Francisco International Airport (SFO), and other major destinations and employment hubs. BART operates from 5:00 a.m. to midnight on weekdays, 6:00 a.m. to midnight on Saturdays, and 8:00 a.m. to 9:00 p.m. on Sundays. Single-ride fares are based on the distance between origin and destination, though discounts are available for youth, seniors, low-income riders, and persons with disabilities.
All Transit is a data tool that measures access to transit, connectivity, and service availability. The tool analyzes the transit frequency, routes, and access to determine an overall transit score at the city, county, and regional levels. Figure 4-18 depicts the areas in Contra Costa County where transit is available, and shows areas with higher scores of connectivity, access to jobs, and frequency of service. According to All Transit, the City of Orinda has a transit performance score of 4.2 compared to higher scores in nearby jurisdictions, including 4.6 for the City of Lafayette, 6.6 for the City of Piedmont, and 5.0 for Contra Costa County. Overall, Contra Costa County has a transit score of 5.0 compared to 7.1 in Alameda County, 3.9 in Solano County, and 6.8 in the San Francisco-Oakland-Hayward Metro Area. The slightly lower score in Contra Costa County than Solano and the urban MSA is likely due to the concentration of populations along the bay and in the center of the county. Limited to no transit services are available in the areas to the east, or connections running east-west.
While transit service is available to Orinda residents on major east-west and north-south routes, there is limited transit service within neighborhoods. Therefore, the City has included Action 1.F to work with County Connection to identify whether unmet transit needs exist in Orinda and, if so, provide assistance as needed to expand routes.
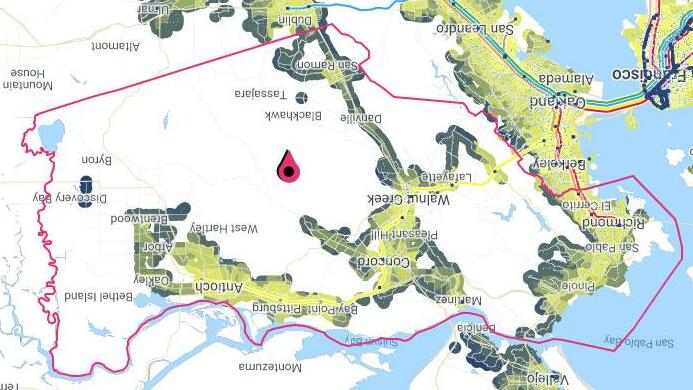
While there are currently no licensed adult residential facilities or assisted living facilities in Orinda for seniors or persons with disabilities, there are two existing senior housing projects and a new senior housing project working through the planning process. Orinda Senior Village offers 150 affordable units to low-income seniors and Monteverde Senior Apartments offers an additional 66 units to low-income seniors. When constructed, Vista Verde Senior Housing will provide an additional 52 units for moderateincome seniors. However, while there are several senior housing options, the lack of assisted units for persons with disabilities may present a barrier to these individuals to live in the City of Orinda. During consultations, stakeholders noted a significant need for additional low-income units for seniors and persons with disabilities as well as supportive housing and assisted living opportunities. They noted that a lack of this housing can result in older residents being forced to relocate to housing outside of Orinda if they reach a point where they are unable to live independently. The City has included Action 1.F, 3.B, 3.C, and 5.A to provide incentives to developers to increase the supply of assisted and non-assisted housing for special needs groups. Additionally, the City will allow residential care facilities, regardless of size, in all zones that permit residential uses of the same type, in accordance with the City’s definition of family (Action 4.A).
Other services for Orinda seniors and persons with disabilities include the Seniors Around Town volunteer transportation service and County Connection LINK paratransit service. Seniors Around Town is a free service operated by volunteer drivers and offers free door-to-door service for seniors to non-emergency medical appointments and errands around town. County Connection LINK is a reservation-based ADA paratransit service operates as a fixed-route service between 4:30 a.m. and 11:00 p.m. on weekdays and 7:00 a.m. and 10:30 p.m. on weekends. One-way LINK fares are $5.00. The routes are offered in similar areas as the County Connections standard fixed routes, which includes Route 6 (Lafayette / Moraga / Orinda).
The HUD jobs proximity index quantifies the accessibility of a given residential neighborhood as a function of its distance to all job locations within a Core-Based Statistical Area (CBSA,) with larger employment centers weighted more heavily. Orinda’s jobs proximity index scores are between 40 - 60 for the majority of the city, close to the median in comparison with other residential areas in the state. Nearby regional job centers with high scores include sections of San Francisco, Oakland, Emeryville, Berkeley, Walnut Creek, San Ramon, San Leandro, San Rafael, and Corte Madera. While Orinda is primarily residential with a small commercial corridor along Camino Pablo Road where it meets Highway 24. Nearby areas with significantly low scores indicating furthest proximity from job locations include sections of Hayward, Castro Valley, San Lorenzo, South Oakland, southwest San Francisco, Daly City, Pacifica, Richmond, San Pablo, Pinole, and Hercules. While some of these areas are suburban areas farther from job opportunities, others include low resource urban areas where access to quality jobs is limited. Orinda lies between a number of jobs centers and has a mobility advantage due to the presence of both Highway 24 and a dedicated BART stop.
Orinda has a lower unemployment rate than in other parts of the region. However, Orinda’s jobs-housing ratio is substantially lower than the averages for Contra Costa County as well as for the Bay Area, indicating that, while Orinda residents have reasonable access to job opportunities in nearby jurisdictions, there are relatively few job opportunities available in Orinda itself as compared with the amount of housing
available in the city. This data, in combination with the city’s regionally high incomes and resources, indicate that while there are more limited employment opportunities within the city of Orinda, residents who live in Orinda and work outside of the city earn high incomes. Housing costs are high in Orinda, with few lower-income households able to afford housing in the city.
The US Census Bureau considers a household overcrowded when the rate of persons per room is greater than 1.00, and severely overcrowded when the rate of persons per room is greater than 1.50. Homes in Orinda are primarily single-family residences, and Orinda does not contain any overcrowded households, placing it among the least crowded cities in the state. While the rate of overcrowding is generally lower in Contra Costa County than it is in the greater Bay Area, nearby jurisdictions with areas of rates of overcrowding above the statewide average include Oakland, San Francisco, Richmond, Pittsburg, Concord, Daly City, San Bruno, and Menlo Park/East Palo Alto. Census tracts in Oakland, San Leandro, Hayward, and Richmond exceed 20 percent, and several tracts in Oakland and Richmond are identified as having rates of severely overcrowded households. These jurisdictions have low resource tracts and more dense, urban areas within city limits, unlike Orinda which is primarily suburban residential.
Though data does not indicate that overcrowding is a problem within Orinda’s boundaries, it is an obstacle to fair and affordable housing regionally. Additionally, the high costs of housing in Orinda may exclude larger households from securing housing in the city, forcing these households to seek accommodations elsewhere in the region. In order to help reduce rates of overcrowding regionally, the City has included Action 1.A, 1.B, and 1.E to support the development of more housing units, relieving pressure on the regional housing market, as well as accommodating more multifamily development, in order to make Orinda a more accessible environment for larger households.10
Overpayment
Each year, the U.S. Department of Housing and Urban Development (HUD) receives custom tabulations of American Community Survey (ACS) data from the U.S. Census Bureau. These data, known as the "CHAS" data (Comprehensive Housing Affordability Strategy), demonstrate the extent of housing problems and housing needs, particularly for low-income households. The latest available CHAS data related to overpayment for the City of Orinda covers the 2014-2018 ACS 5-year estimate period. A household is considered to be overpaying/cost burdened when 30 percent or more of household income is spent on housing costs (rent, mortgage payments, etc.) Households spending more than 50 percent of their income on housing costs are considered to be severely cost burdened. Cost burdened/overpaying households are at an elevated risk of displacement.
Overpayment is an issue in Orinda for both homeowners and renters. 23 percent of households in Orinda are cost burdened – this rate differs between homeowners and renters, with 22 percent of homeowners and 33 percent of renters overpaying. Regionally, 36 percent of households in Contra Costa County overpay, with 30 percent of owners and 50 percent of renters and overpaying. This data indicates that households overpay at a lower rate in Orinda than the average in Contra Costa County and is consistent with the regional pattern of renters overpaying at a higher rate. Owner-occupied units comprise an
overwhelming 89.7 percent of households in Orinda which drives the citywide average downward, but data indicates that the relatively fewer renter households in Orinda face elevated rates of cost burden. Additionally, 10 percent of renters and 11 percent of owners are severely cost burdened.
Cost burden is distributed highly unevenly by income – while 23 percent of overall households are cost burdened, 60 percent of low income (<80 percent AMI) households are cost burdened, while only 15 percent of households above AMI are cost burdened. Moderate-income households are cost burdened at a rate of 48 percent. This data indicates that, even among households with relatively high incomes, finding affordable housing can be a challenge in Orinda. Among moderate and low-income households, those who do find housing in Orinda must commit a large portion of their monthly income toward housing expenses. Cost burden is also unevenly distributed spatially. As shown in Figure 4-19, renters in El Toyonal/Claremont overpay at a rate of 65 percent, while renters in the Wilder/Lost Valley area overpay at a rate of 18 percent. Overpayment by owner households is more evenly distributed with owners overpaying at rate of 31 percent in El Toyonal/Claremont, and 35 percent in Wilder/Lost Valley. Of owner households, 49 percent in the Alice/Ivy Drive neighborhoods overpay, the highest rate citywide. This area of owner overpayment is also relatively more diverse in terms of race/ethnicity, suggesting that nonWhite homeowners may be cost burdened at a higher rate than White non-Hispanic owners in Orinda. 68 renters (0.9 percent) in the city use Housing Choice Vouchers (HCVs), all of which are found north of Highway 24 and east of Camino Pablo, in the census tract covering the Charles Hill/Sleepy Hollow/Orinda Downs neighborhoods. While this tract includes the city’s least diverse, consistently affluent areas, it also includes the downtown area, which likely accounts for HCV utilization.
Cost burden in Orinda is less severe than in other parts of Contra Costa County, although the relative lack of income diversity and large proportion of homeowners in the city may indicate that Orinda’s regionally low rates of cost burden are not a reflection of housing affordability within the city, but of a lack of housing affordability regionally, with housing in Orinda among the least affordable. Lower- and moderate-income households which are cost burdened may not seek or secure housing in Orinda but are forced to look elsewhere in the county or region. In order to actively protect residents from displacement, reduce cost burden on renters and owners, with particularly attention to owners of color in the Alice/Ivy Drive area, the City has included Actions 2.B, 2.C, 3.A, 3.B, and 4.A which includes rehabilitation programs for seniors, expanding the allowed housing types permitted in Orinda (include single-room occupancy uses), and partnering with fair housing providers to increase services and outreach to Orinda residents.
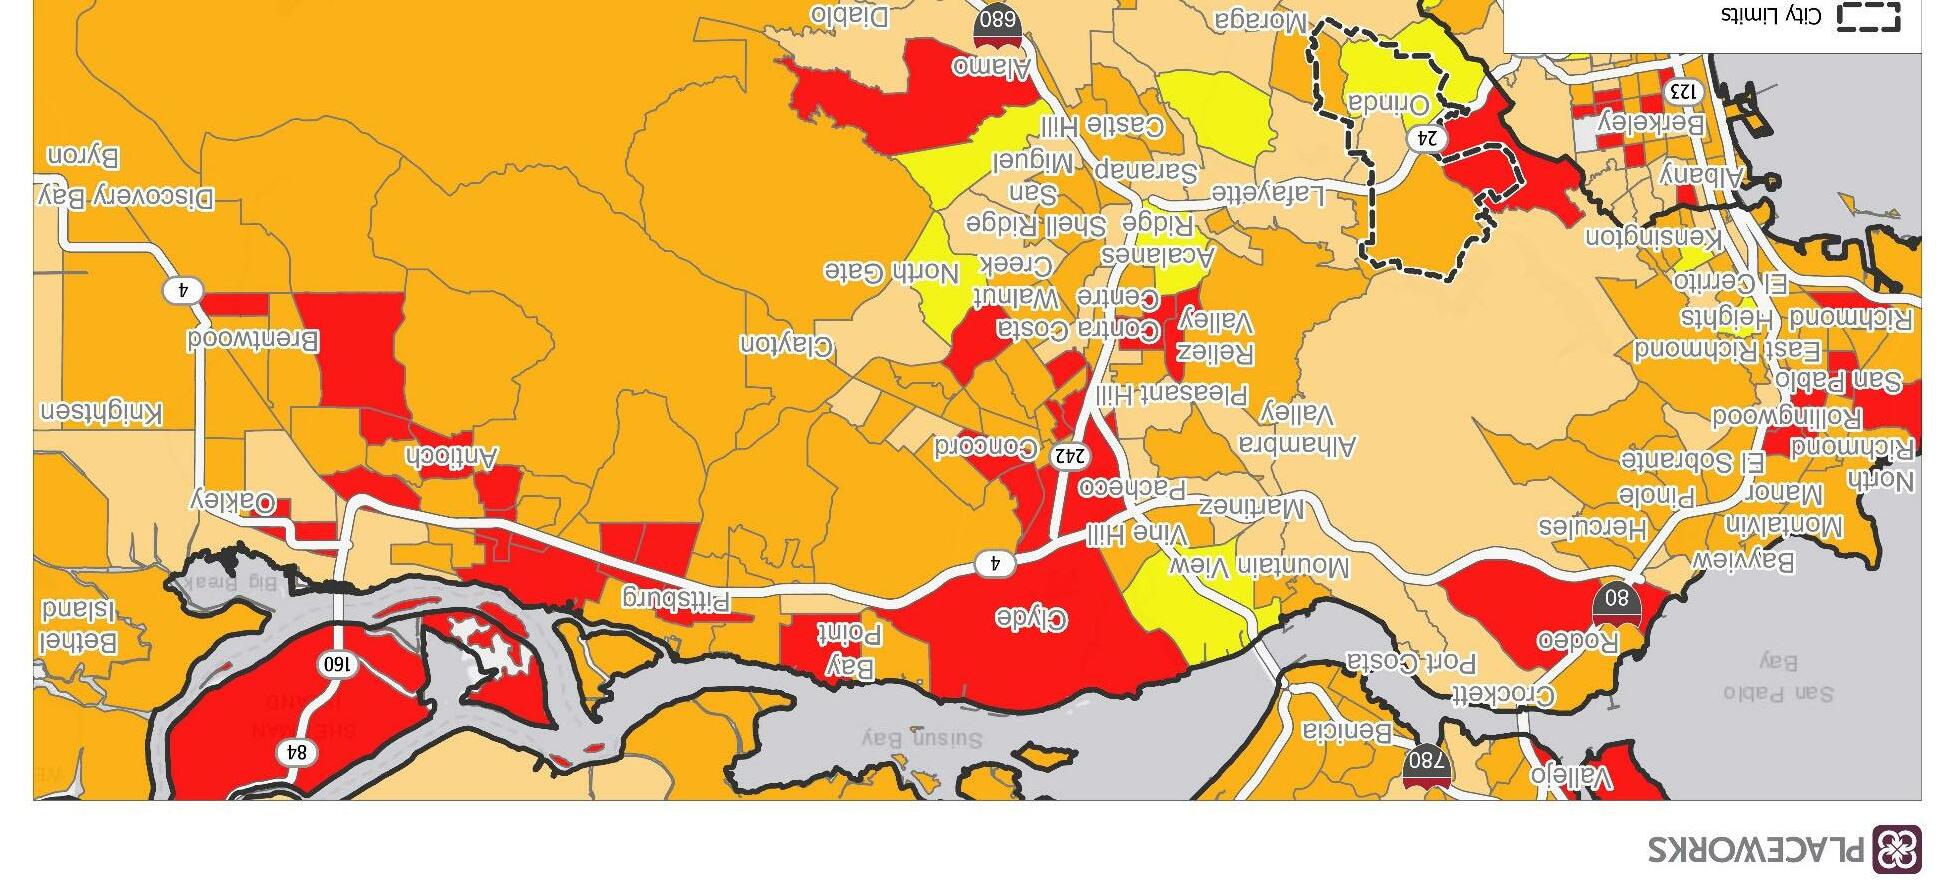
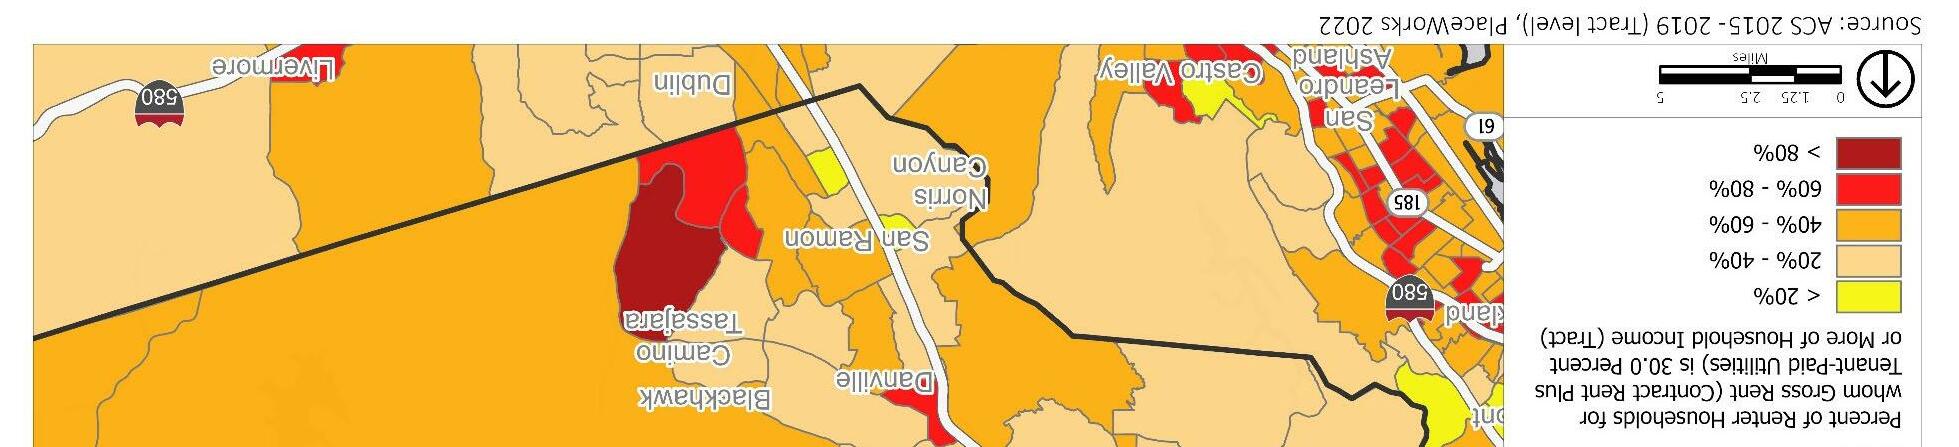
Residents living in substandard housing face significant safety concerns. As described in the Population, Employment, and Housing Characteristics chapter, Orinda’s housing stock is generally in excellent condition. 2015-2019 ACS data indicates that approximately 1 percent of rental units (or 67 units) lack complete kitchen and plumbing facilities, and the City is not aware of any occupied units lacking plumbing or kitchens entirely. The 2015-2019 ACS indicates that data should be supplemented by local knowledge. Based on visual reconnaissance of Orinda neighborhoods, it is believed that fewer than 10 homes in the city are dilapidated, abandoned, or in poor condition.
Of housing units in Orinda, 53 percent were built prior to 1959, and 83 percent were built prior to 1979. Only 4 percent of units were built since 2000. In Contra Costa County, 24 percent of units were built prior to 1959, and 57 percent were built prior to 1979, and 15 percent were built since 2000.11 The housing stock in Orinda is older on average than the region, and relatively few new units have been built in Orinda in recent years. These data indicate both that Orinda’s aging housing stock is likely to be in higher need of repair, and that the rate of new development has been slow in the past few decades, indicating that the City likely has capacity to add more units, further easing pressure on the regional market and supporting local affordability. Orinda residents have relatively high incomes, and housing repairs likely do not pose a threat of displacement to most existing homeowners. As described in the Population, Employment, and Housing Characteristics chapter, the level of reinvestment in Orinda’s housing stock is high; the valuation of work authorized by residential building permits between 2009 and 2012 (three fiscal years) was roughly $51.3 million.
To provide support in instances where residents are at risk of displacement due to safety concerns related to substandard housing conditions, the City has included an Action 2.A and 2.B to advertise the availability of home maintenance and repair loans through Contra Costa County to Orinda residents and consider pursuing additional funding for home repairs and improvements.
Information on the population of persons experiencing homelessness is based on Point-in-Time (PIT) information provided to HUD by Continuums of Care (CoC) in the application for CoC Homeless Assistance Programs. The PIT Count provides a count of sheltered and unsheltered homeless persons on a single night during the last ten days in January. Data is provided at the county-level. The 2020 Contra Costa County Homeless Annual Point in Time Count Report found 1,374 unsheltered individuals out of a total 2,277 persons experiencing homelessness in the county as a whole, only 1 of whom was unsheltered in Orinda. The count was conducted in the winter, when seasonal demand is likely at its highest. The estimated number of unsheltered individuals in Contra Costa County decreased by 4 percent from 2019 to 2020.
The homeless population in Orinda has been extremely small compared to other communities in Contra Costa County, and at times there have been no homeless residents counted within Orinda city limits. In 2015, there were 4 homeless residents living in Orinda, a population which declined to 1 by 2020. Due to the small size of this population, demographic characteristics of the single homeless
resident, or four in 2015, is not available to protect the identity of those residents. As such, trends related to demographic characteristics cannot be identified for Orinda’s homeless population.
Unhoused populations are lowest in central Contra Costa County, which includes Orinda. The heat map (Figure 4-20) shows that unhoused populations are largely concentrated in urban, dense cities along the bay coastline, including cities such as Richmond and Antioch. In keeping with the trends observed for concentrated areas of income, race, and access to opportunities, Contra Costa County’s unhoused population reinforces the same stratification. The low number of persons experiencing homelessness in central Contra Costa County is likely due to the lack of resources for persons experiencing homelessness and concentration of above-moderate income households, which despite high rates of overpayment in Orinda and surrounding cities, can create a buffer to displacement risk. As discussed in Section 4.8.8, Homeless, there are no emergency shelters or transitional housing opportunities currently operating in Orinda. While this may be largely due to the lack of demand in the city, it may also present a barrier to persons experiencing homeless or at risk of homelessness to remain in Orinda due to a lack of services. However, there are several churches in the city that participate in the Winter Nights Family Emergency Shelter Program to fill that gap during cold winter months. In order to address the shortage of services for persons experiencing or at risk of homelessness, the City has identified Action 3.B, among others, to facilitate the development of extremely low-income housing to help reduce displacement risk for this population and Action 1.F to encourage development of supportive and transitional housing opportunities.
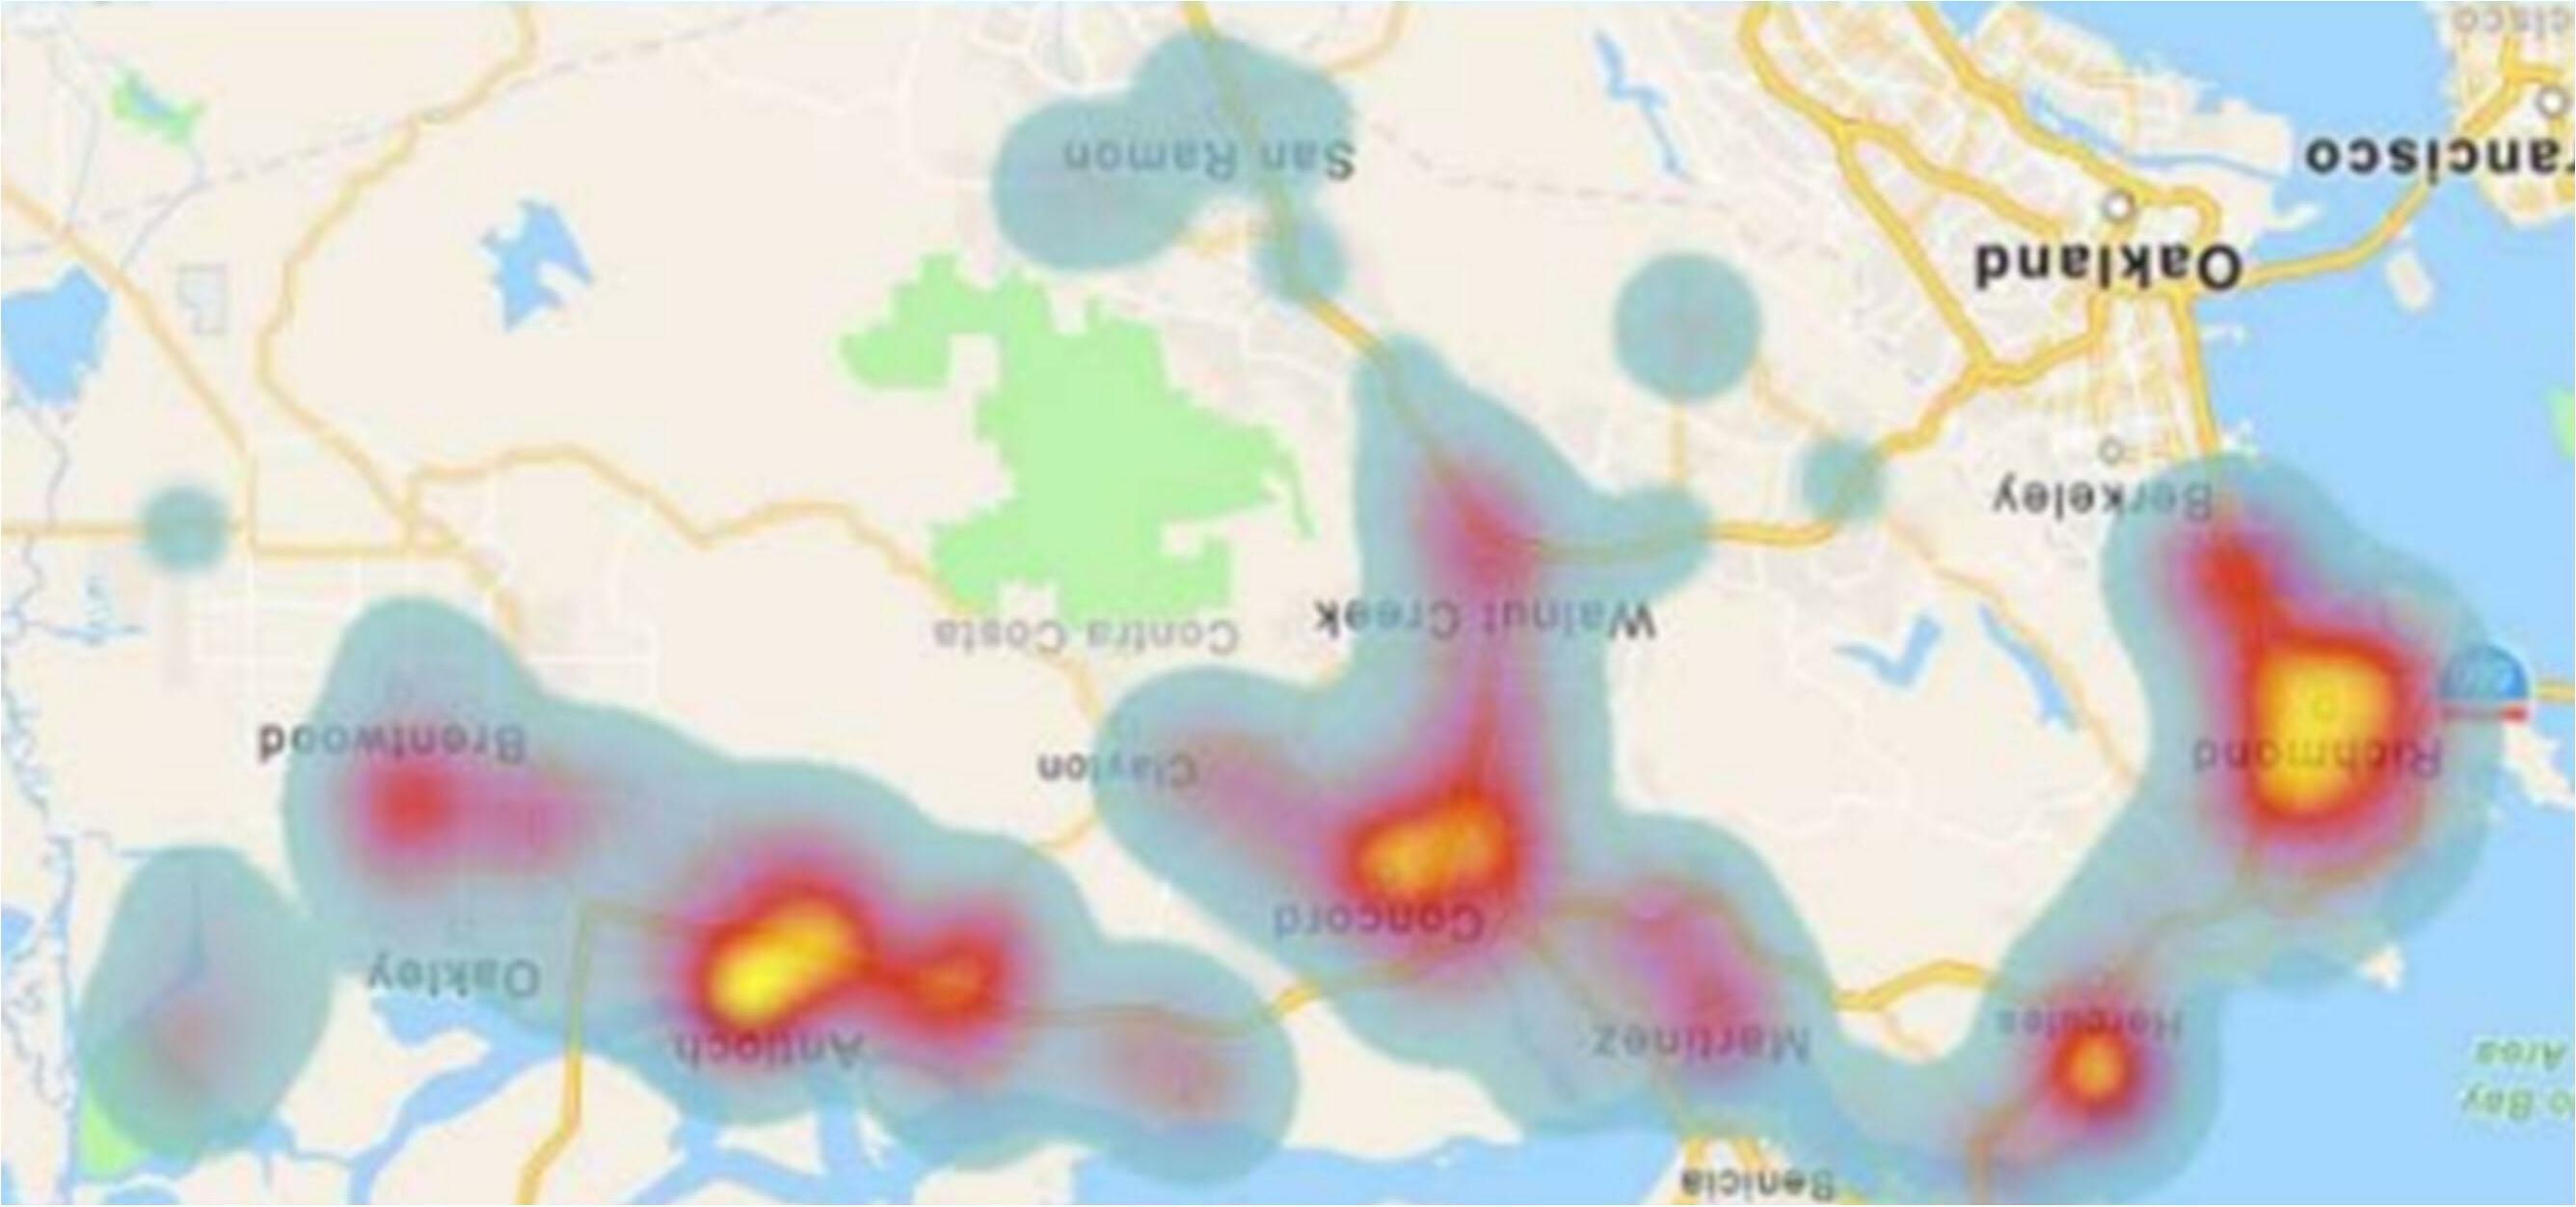
There are no emergency shelters or transitional housing facilities in the City of Orinda; however, several churches participate in the Winter Nights Family Emergency Shelter Program coordinated through the Contra Costa Interfaith Coalition, which provides meals and emergency shelter to families and seniors from mid-October to the end of April. Regionally, Contra Costa Health Services operates two emergency shelter sites in the county, one in Concord and the other in Richmond. Both facilities operated 24/7 and have the capacity to serve over 160 persons.
In accordance with Government Code Section 65583(a)(4), emergency shelters are allowed by right, without discretionary review, in residential districts. Additional information about emergency shelters can be found in the Constraints section of the Housing Element.
Displacement Risk
Orinda has seen a spike in home sales prices between 2020 and 2022. Zillow.com maintains a “Home Value Index” which reports monthly change in typical home values for a given area. In January 2020, the Home Value Index for Orinda was $2.09 million. This figure has been consistent over the preceding twoyear period with the Value Index in January 2018 at $2.06 million, representing an increase of 1.5 percent over a two-year period. In contrast, the Home Value Index as of December 31, 2021, was $2.8 million, representing an increase of nearly 34 percent over a two-year period, and a 22 percent year-over-year increase. The oldest Home Value Index data available is from January 2012, when the Index was at $1.2 million, indicating a 200 percent increase over the decade between 2012 and 2022.
The ACS 2019 5-year estimate reports median household income in Orinda to be $223,217, with the corresponding Zillow Home Value Index for December 2019 at $2.1 million. The ACS 5-year estimate for household income in 2012 was $162,267 (or $199,591 in inflation-adjusted 2021 dollars.) As described above, the Home Value Index in 2012 was $1.2 million. Adjusted for inflation, this represents an increase of 11.8 percent in median household income between the 2012 and 2019 against an increase of 75 percent in home values. Rises in home values have rapidly outpaced rises in income in Orinda. While existing homeowners have seen their assets appreciate in value over time, rapidly rising home values alongside relatively stagnant wages represent a growing barrier to entry for households seeking the benefits of the high-quality resources available in the city. Increases in housing price are reflected in increased rent costs, impacting both renting and owning households. In order to help overcome these barriers to access and combat displacement by ensuring housing affordability in Orinda, the City has included Action 1.F, 2.B, 2.C, 2.D, 3.A, and 3.B.
The City enforces fair housing and complies with fair housing laws and regulations through a twofold process: review of City policies and code for compliance with state law and referring fair housing complaints to appropriate agencies. Any updates or revisions to the City Zoning Ordinance that are needed to comply with fair housing laws have been identified in the Housing Element actions. The City will continue to regularly review land use policies, permitting practices, and building codes for compliance with state and federal fair-housing laws.
In addition to assessing fair housing issues related to development standards, fair housing issues can include disproportionate loan rates by race, housing design that is a barrier to individuals with a disability, discrimination against race, national origin, familial status, disability, religion, or sex when renting or selling a housing unit, and more. The City ensures dissemination of fair housing information and available services through the City’s Housing website. The City will continue to make fair housing information
available, updating annually or as needed, on the City’s website and through annual distribution of printed materials at City buildings and making materials available at community meetings.
ECHO provides HUD-approved fair housing services to Contra Costa County residents. ECHO offers counseling, investigation, mediation, enforcement, and education through their Fair Housing Program. Counselors conduct investigations and enforcement in response to reports of housing discrimination complaints. ECHO also provides landlord-tenant law counseling regarding evictions, deposits, repairs, retaliations, etc.
Between 2013 and 2021, two Fair Housing cases were filed in the City of Orinda. Both of these cases were filed regarding discriminatory terms, conditions, privileges, or services and facilities, and both resulted in no cause determinations. One was filed on the basis of Race, while the other was filed on the basis of Disability. The latter case was also filed regarding failure to make a reasonable accommodation.
In addition, the City demonstrates compliance or intention to comply with fair housing law through the following:
● The City demonstrates compliance with Density Bonus Law (California Government Code, Section 65915).
● The City intends to comply with No-Net-Loss (Government Code, Section 65863) through identifying a surplus of sites available to meet the City’s RHNA allocation. In total, the City’s surplus unit capacity is 330, composed of 217 lower-income units, 24 moderate-income units, and 88 above moderate-income units.
● The City complies with the Housing Accountability Act (Government Code, Section 65589.5).
● The City complies with SB 35 (Government Code, Section 65913.4).
● The City complies with SB 330 (Government Code, Section 65589.5).
Government Code Section 65583(c)(10)(A) added a new requirement for Housing Elements to analyze the location of lower-income sites in relation to areas of opportunity. The location of housing in relation to resources is integral in fostering inclusive communities and addressing disparities in access to opportunity. To assess whether sites improve or exacerbate fair housing conditions and whether sites are isolated by income group, the City examined the 2021 Opportunity Areas map prepared by TCAC and HCD (Figure 421), which identifies areas where characteristics have been shown by research to support positive economic, educational, and health outcomes for low-income households and positive long-term outcomes for children in particular. Development of affordable housing on these sites will provide housing options for lower-income households within walking distance of local amenities and transit, creating more equitable access to the City’s resources. Figures 4-22 through 4-27 and accompanying charts included in this sites inventory analysis present the number of projected units by income category and overall site acreage in relation with each of the following indicators to assess how the sites’ locations will affirmatively further fair housing:
● Median Household Income
● Racial/Ethnic demographic composition
● Population living with a disability
● Female-headed households with no spouse/partner present
● Job Proximity Index scores
● Overpayment
Orinda’s 6th Cycle RHNA allocation totals 1,359 units, separated by income level and number of units as follows: lower, 587; moderate, 215; and above moderate, 557. Table 4-34 shows the distribution of those units by census tract and Figure 4-21 maps the census tracts.
As shown, approximately 32.3 percent of the City’s lower-income capacity, 31.9 percent of the moderateincome capacity, and 39.3 percent of the above moderate-income capacity is located in Census tract 3540.02, which is the tract east of Camino Pablo and north of Highway 24 and includes Downtown. This tract has one of the lowest rates of poverty in Orinda (2.7 percent), and a relatively low proportion of lowto-moderate-income households, which may indicate a current shortage of affordable housing in this area. The inclusion of approximately a third of the lower-income capacity is intended to promote incomeintegration in close proximity to services, jobs, and transit.
In contrast, tract 3522.01 has the lowest median income and highest proportion of low-to-moderateincome households. Approximately 6.2 percent of the lower-income capacity, 8.6 percent of the moderate-income capacity, and 6.5 percent of the above moderate-income capacity has been identified in this tract in an effort to reduce the concentration of lower- and moderate-income households while still maintaining income integration and providing housing opportunities to reduce displacement risk of existing residents.
As all of Orinda is considered a RCAA, the City has identified units for all income categories in each tract to facilitate ongoing income integration and provide housing mobility opportunities for lower- and moderate-income households through the city. The only exception to this is tract 3500.00. However, as noted in Table 4-34, this tract is almost entirely comprised of the Lafayette Reservoir Recreation Area, and the only area within Orinda city limits is east of Glorietta Boulevard and north of Rheem Boulevard, which likely accounts for only a small portion of the 2,243 households in the entire tract. In an effort promote access to opportunities, lower- and moderate-income housing opportunities have been identified in tracts that encompass more direct access to amenities and services in the city center.
Table 4-34 presents how the distribution of sites by income will help to combat existing fair housing issues in Orinda through facilitation of mixed-income neighborhoods, thus reducing concentrations of affluence and promoting housing mobility, and providing additional housing opportunities in high resource areas and areas that will reduce the displacement risk resulting from overpayment and overcrowding. The concentration of the largest portion of the RHNA, for all income categories, in the tract that includes Downtown will facilitate greater access to opportunity for households in this area, with the goal of reducing reliance on individual vehicles to access services and reduce sprawling development.
While not all residents reside Downtown, and RHNA sites have been identified throughout the city, Downtown remains a commercial hub for transit connectivity, services, and employment opportunities. The future of Downtown Orinda, including economic revitalization, is a priority of the City, especially in light of increased residential capacity. The Downtown Precise Plan specifically aims to preserve and enhance the vibrancy of downtown by establishing standards for mixed-use design to increase capacity
for services, amenities, and jobs in addition to housing production. Further, the DPP will include an evaluation of the impacts of development on infrastructure Downtown to identify strategies to facilitate and promote access for all residents, current and future, regardless of where they live in the city.
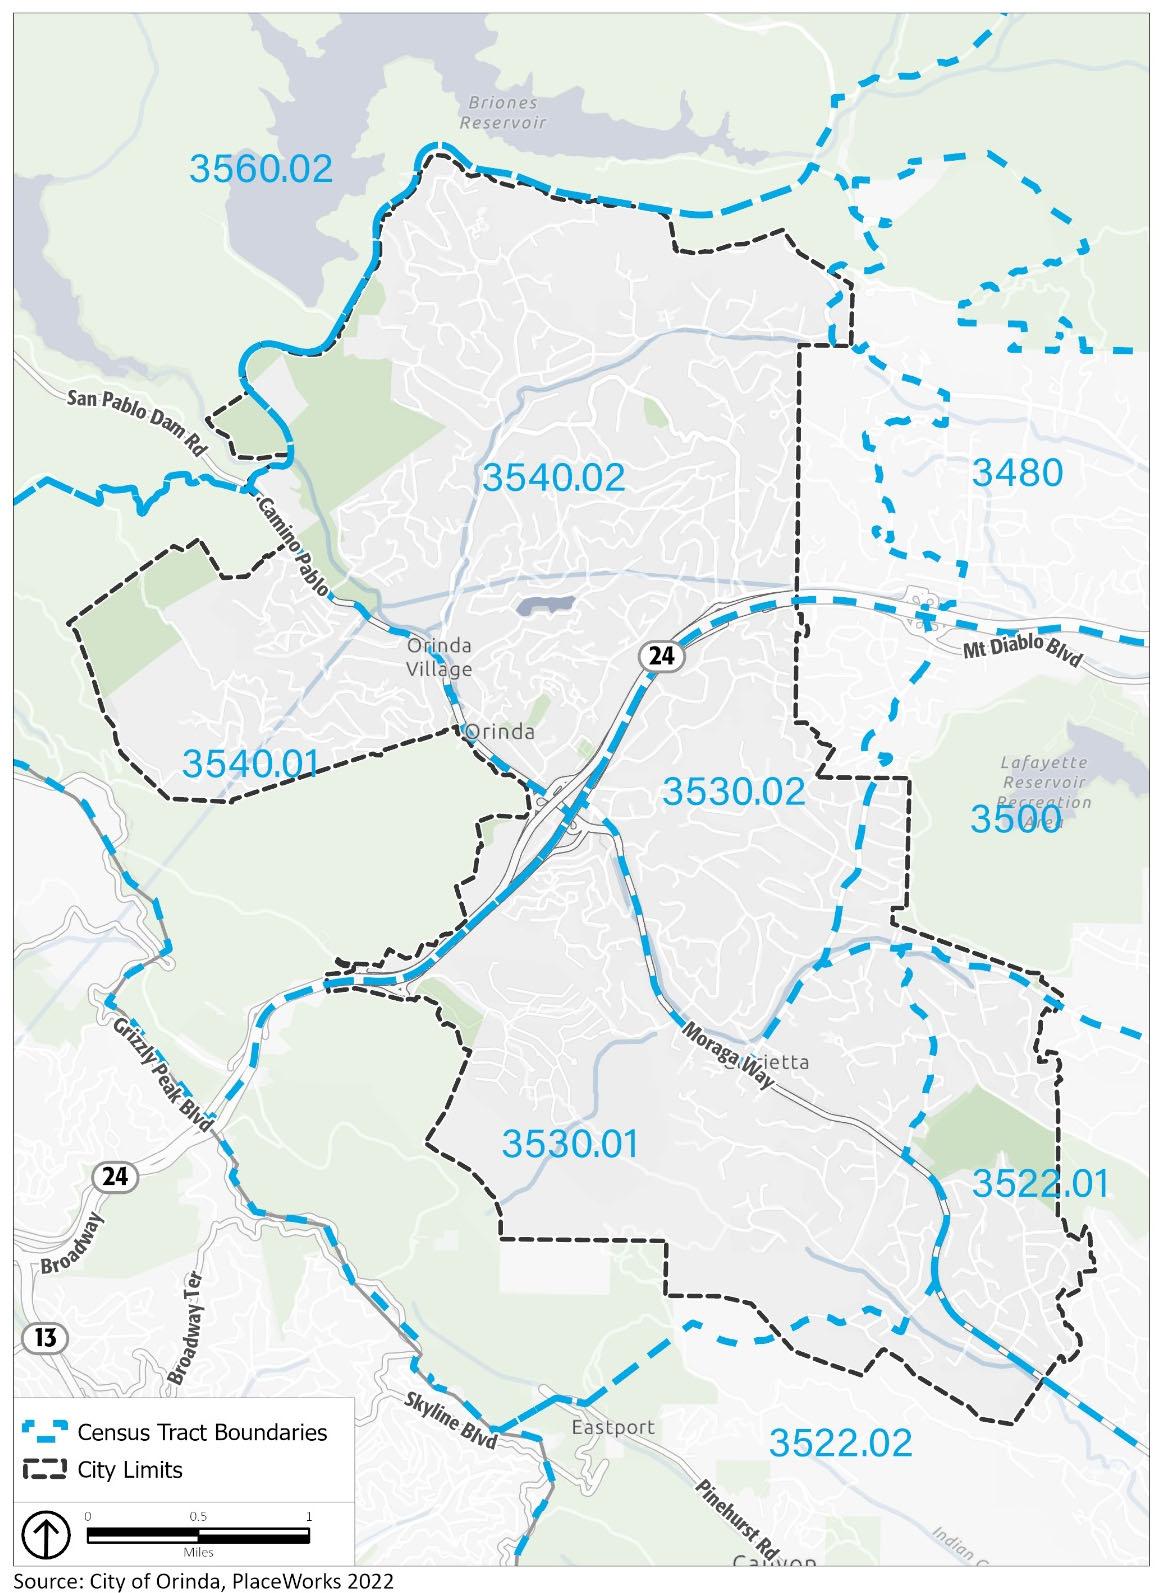
Sources: 2015-2019 ACS; Esri, 2018; TCAC/HCD 2021; HUD, 2020; OEHHA, 2021; CHHS, 2022*Tract includes land outside of city limits and may not fully represent the portion of the population that resides within Orind a.
**Tract is primarily comprised of the Lafayette Reservoir Recreation Area.
Note: The Caltrans Gateway site, while located in tract 3540.01, is separated from other residential areas in that tract by Siesta Valley Recreation Area. Therefore, this site, which includes capacity for 200 lower-income units, will have better access to tract 3530.01, which has comparable demographic characteristics but a significantly lower rate of renter overpayment. Tract 3530.01 also has a higher median income and lower rate of poverty. Facilitating development of 200 lowerincome units in this area will help to promote income-integration in an affluent area.
As seen in Figure 4-22, TCAC and HCD has designated the entirety of Orinda as a highest resource area –as a result, all sites identified to accommodate the RHNA are in highest resource neighborhoods. Because of the city’s uniformly highest-resource designation, sites in different parts of the city do not vary only marginally in terms of their access to resources. As discussed, residents of Orinda enjoy access to highperforming schools and good environmental conditions regardless of where you live within the city; the city is served by two school districts (Orinda Unified School District and Acalanes Unified High School District) made up of very high-performing elementary, middle, and high schools, and there are limited sources of pollutants within the city limits beyond proximity to Highway 24 that would negatively impact long-term health. In order to assess differences between sites identified in different highest-resource areas, the City has relied on more localized data as reported by community members and stakeholders to contextualize its sites inventory.
While the city is uniformly designated as highest resource, the distribution of sites does result in concentration of lower-income units in the Downtown neighborhood. The City has committed to a adopting the Downtown Precise Plan to provide 184 units affordable to lower-income households in the Downtown neighborhood. During the City’s Sites Review Meeting with the City Council, residents expressed concerned about balancing the need to locate low-income housing near services and resources and promoting inclusion throughout the city. However, during one-on-one consultation, Eden Housing expressed support for the rezoning paction, identifying the action as most beneficial aspect of the City’s effort to support affordable housing development, effectively reducing the potential for CEQA litigation for affordable housing developers and thereby reducing overall costs and timelines. Locating lowerincome units in the Downtown neighborhood directly addresses feedback from HCEB, an organization that supports Contra Costa County residents with developmental disabilities. HCEB expressed a need for dense, larger, affordable units close to the BART station and other amenities. Orinda Senior Village, an affordable senior housing development, echoed this need for seniors during a one-on-one consultation, emphasizing that affordable and accessible housing needs to be placed in amenity-rich locations. In this regard, the Downtown is the most appropriate location for units affordable to lower-income households (such as persons with disabilities, who often live on a fixed income).
While providing affordable housing units in Orinda via the Downtown rezoning action is the City’s primary objective to address current issues of exclusion, the City is also committed to providing access to highresource neighborhoods for lower- and moderate-income households. The City’s moderate-income units are identified in existing high-resource neighborhoods in north and south Orinda, integrating moderateincome households into existing above moderate-income communities. Further, the City expects that at least half of the projected ADUs (63 total) will be affordable to lower-income households, which will allow the integration of lower-income households into existing above moderate-income communities.
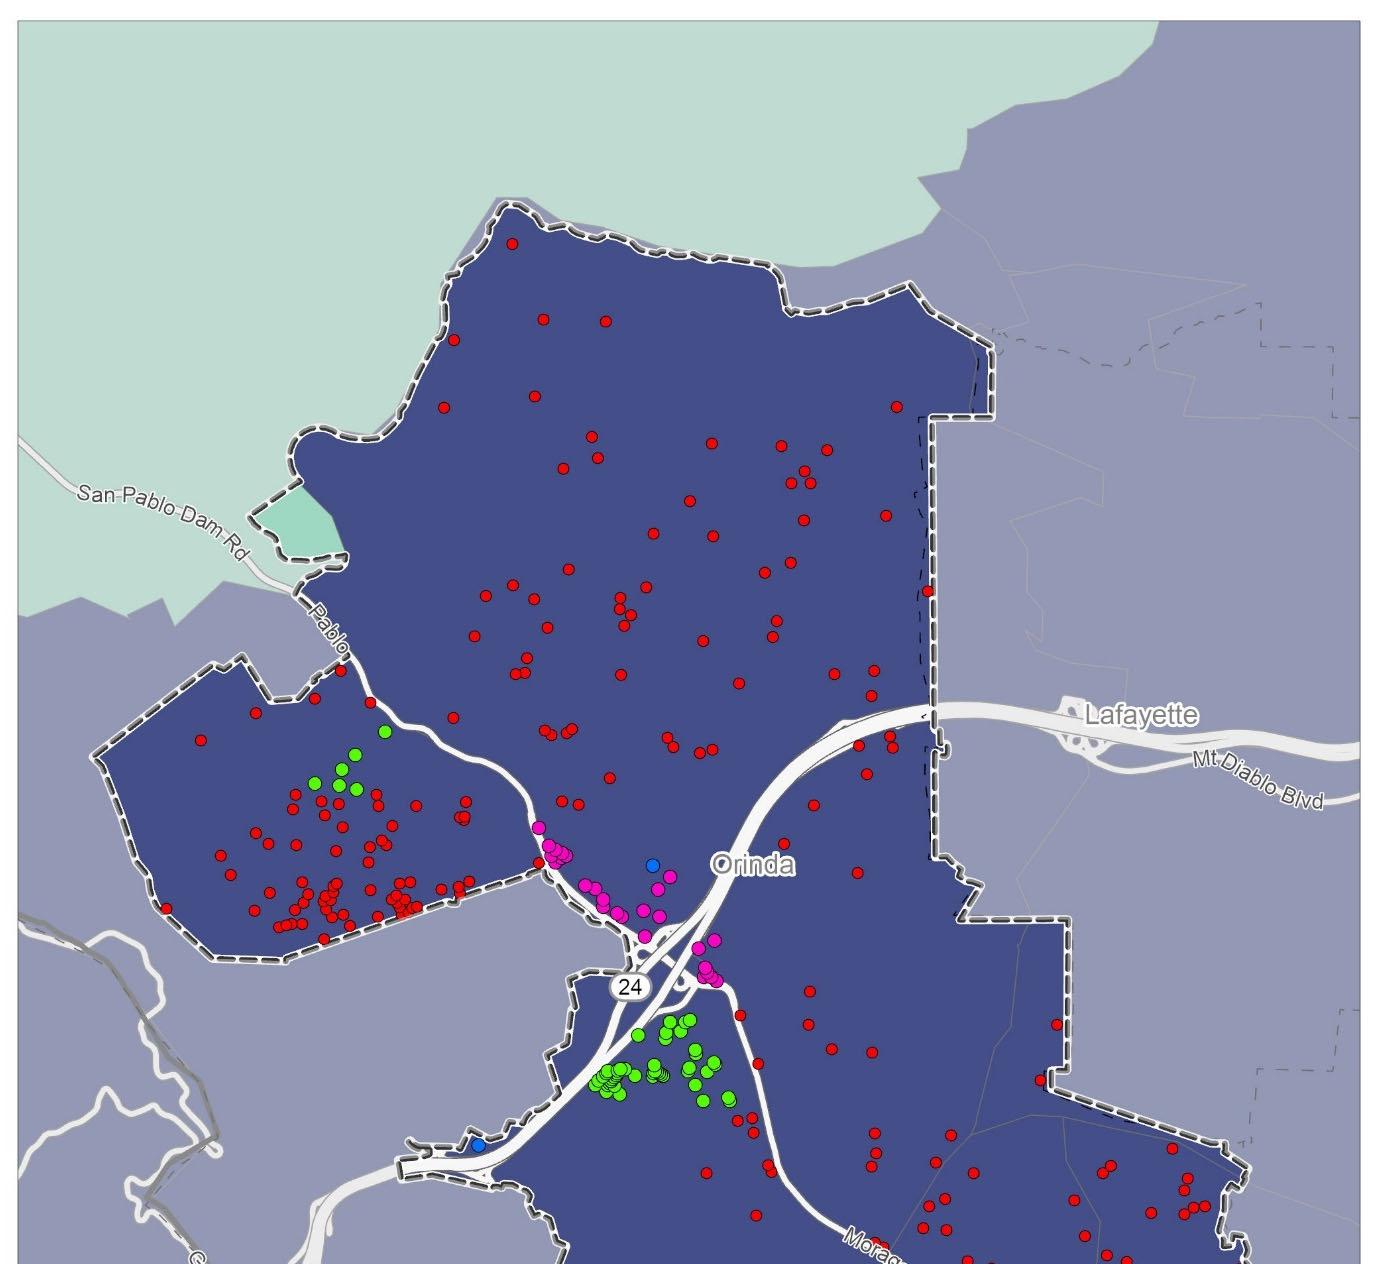
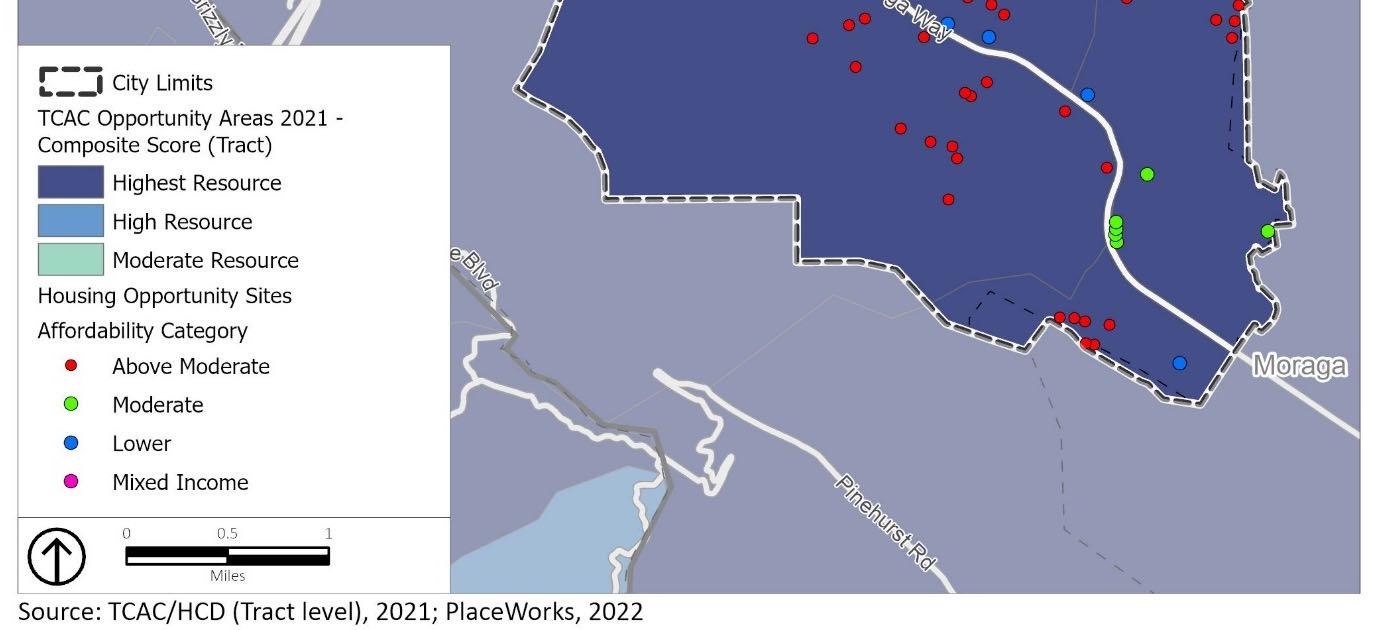
As seen in Figure 4-23 and Chart 4-2, median incomes in Orinda are uniformly high, limiting access to housing in the city for lower- and even moderate-income households. Not all areas of Orinda have median income data but based on the citywide median income and housing sales prices, it can be assumed that areas without median income data are largely above-moderate households. Overall, the distribution of units planned for lower-income households and moderate-income households will have the effect of creating mixed-income communities. The City will introduce the most lower income units (30.6 percent) in areas with moderate-income median income (between 109,601 and $150,701) and the most moderateincome units (81.0percent) in areas with an above moderate-income median income (greater than $150,700), creating mixed-income communities in historically exclusively wealthy neighborhoods. In an area of relatively lower median income for the City of Orinda (less than $109,601), the City will introduce 8.3 percent of its above moderate-income capacity. Additional housing units in the city targeting these income groups will reduce the effects of exclusion by income in the city. Introducing affordable housing and more varied housing types in Downtown Orinda is another key strategy to address exclusion in the city. Orinda is strategically locating the largest proportion of lower-income RHNA units in the part of the city which offers the best access to transit, essential commercial services, and access to high-performing schools and community resources. As the City rezoning process will increase opportunity for high density housing through mixed use development in the downtown area, affordable units developed on rezoned sites can have access to on-site commercial areas and essential services as a part of the development, which is particularly important for lower-income seniors and persons living with disabilities or other mobility challenges. The City’s commitment to increasing capacity to meet its RHNA is addressed in Action 1.A, 1.B, and 1.C.
Locating lower- and moderate-income RHNA in the Downtown will help ameliorate patterns of segregation both locally and regionally. The development of these sites with lower- and moderate-income housing units will make Orinda more accessible to households with a wider range of incomes, making the city itself less exclusive, while simultaneously combatting regional patterns of segregation in Contra Costa County. By creating affordable housing in one of the county’s highest-resource communities, the City will reduce the risk of displacement for lower-income residents in the County, supporting access to the region’s high-performing schools and quality jobs for low- and moderate-income households, and increasing regional mobility for lower-income households.
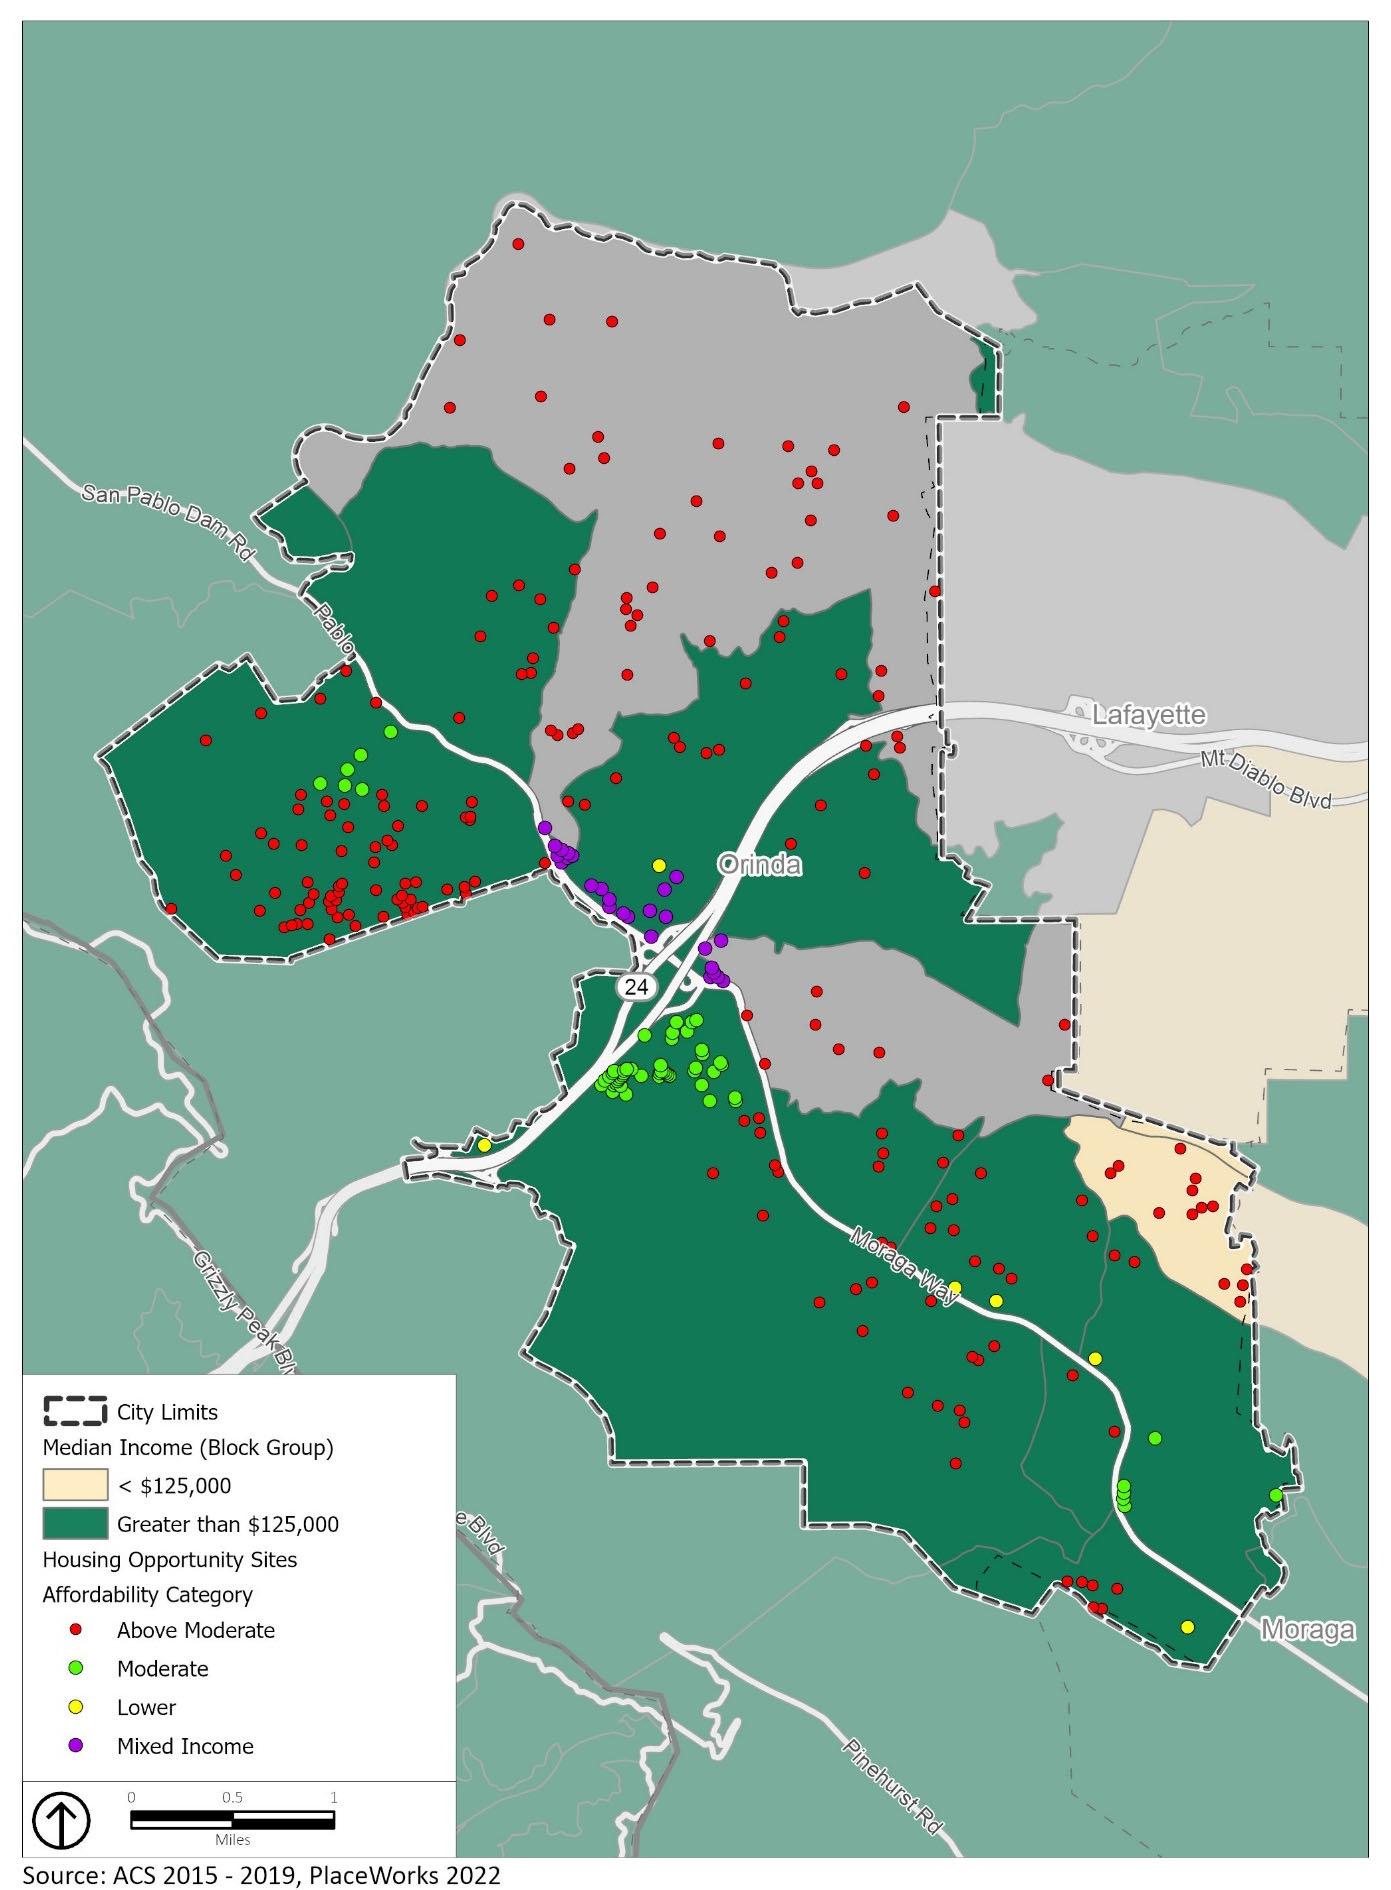
Source: HCD State Income Limits, 2021; City of Orinda, 2022
Racial/Ethnic Demographic Composition
As described previously in this section, Orinda’s largest demographic is White non-Hispanic, followed by Asian/Asian-American (Figure 4-24). Because different parts of the City do not vary substantially in their demographic composition, lower-, moderate-, and above-moderate income units are not located in areas of concentration any particular minority demographic, but instead can be understood to all be concentrated in an area of primarily affluent White non-Hispanic households. As discussed, a mixture of exclusionary practices until 1968 and high costs of housing and limited housing types (i.e., predominantly single-family housing) largely posed a barrier to access for diverse populations; it was not until 1990 that the percentage of non-White populations exceed 10 percent and not until 2010 that the percentage of non-White populations exceed 20 percent. Additional lower- and moderate-income units in the City will improve access to housing in the City for residents who would otherwise be priced out and excluded from the City, a category that has historically included communities of color in the Bay Area. As shown in Chart 4-3, 85.6 percent of lower-income units are identified on sites located in areas where 25.0 to 29.9 percent of the population identifies as non-White, including 616 lower-income units and 91 moderate-income units in areas of the City where there are currently no Black residents. This offers an opportunity for lowerand moderate-income non-White households that were historically excluded from housing opportunities in Orinda, particularly Black households, to access the opportunity and resources Orinda residents have access to, disrupting a legacy of concentrated higher income White households in
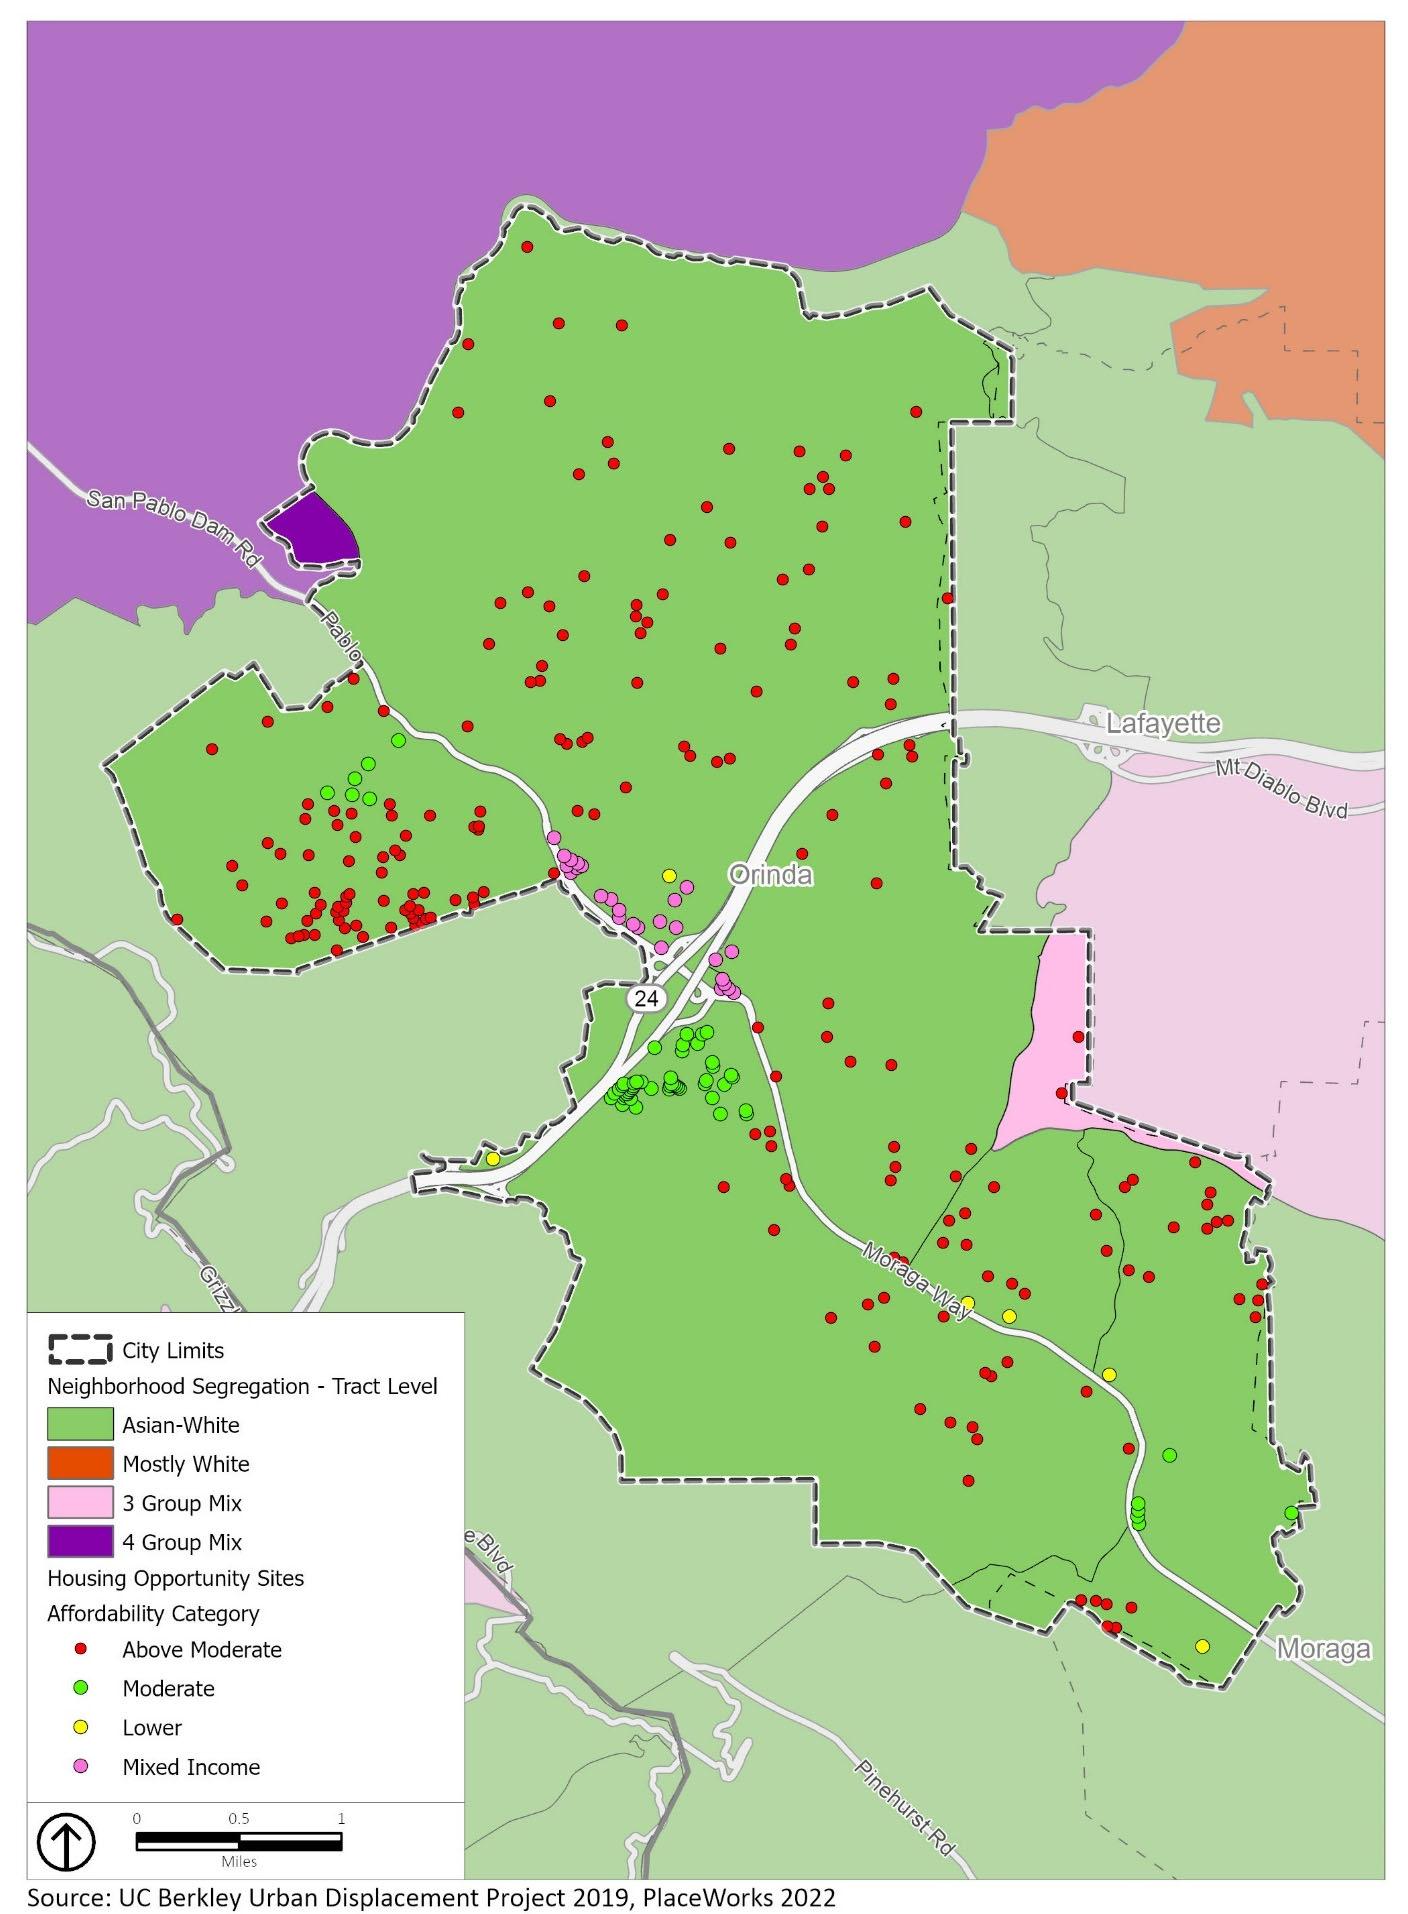
As described previously, approximately 10 percent of Orinda’s population live with at least one disability, including 3.5 percent of the population both under 65 and living with at least one disability. This rate is low relative to the region. As shown in Chart 4-4 and Figure 4-25, most (96.7 percent) of the lower-income capacity and 72.7 percent of the moderate-income capacity identified in Orinda is in census tracts with rates of persons living with disabilities of between 6 and 10 percent. High housing costs, a lack of variety of housing types, and relatively few new developments with accessibility features contribute to the exclusion of persons with disabilities from the city. Additionally, less-reliable transit access and limited access to essential resources (pharmacies, clinics, and other resources) in residential parts of the city outside of the downtown area may make living in Orinda less feasible for potential residents with disabilities, as identified by stakeholders serving seniors and persons with disabilities. Locating units affordable to lower- and moderate-income residents in and around the downtown area will help to improve access for and accommodate the needs of persons living with disabilities, who benefit from close access to services and amenities as well as proximity to transit. Additionally, mixed-use housing types viable in the downtown area can help accommodate the needs of residents living with disabilities by integrating services or amenities on-site.
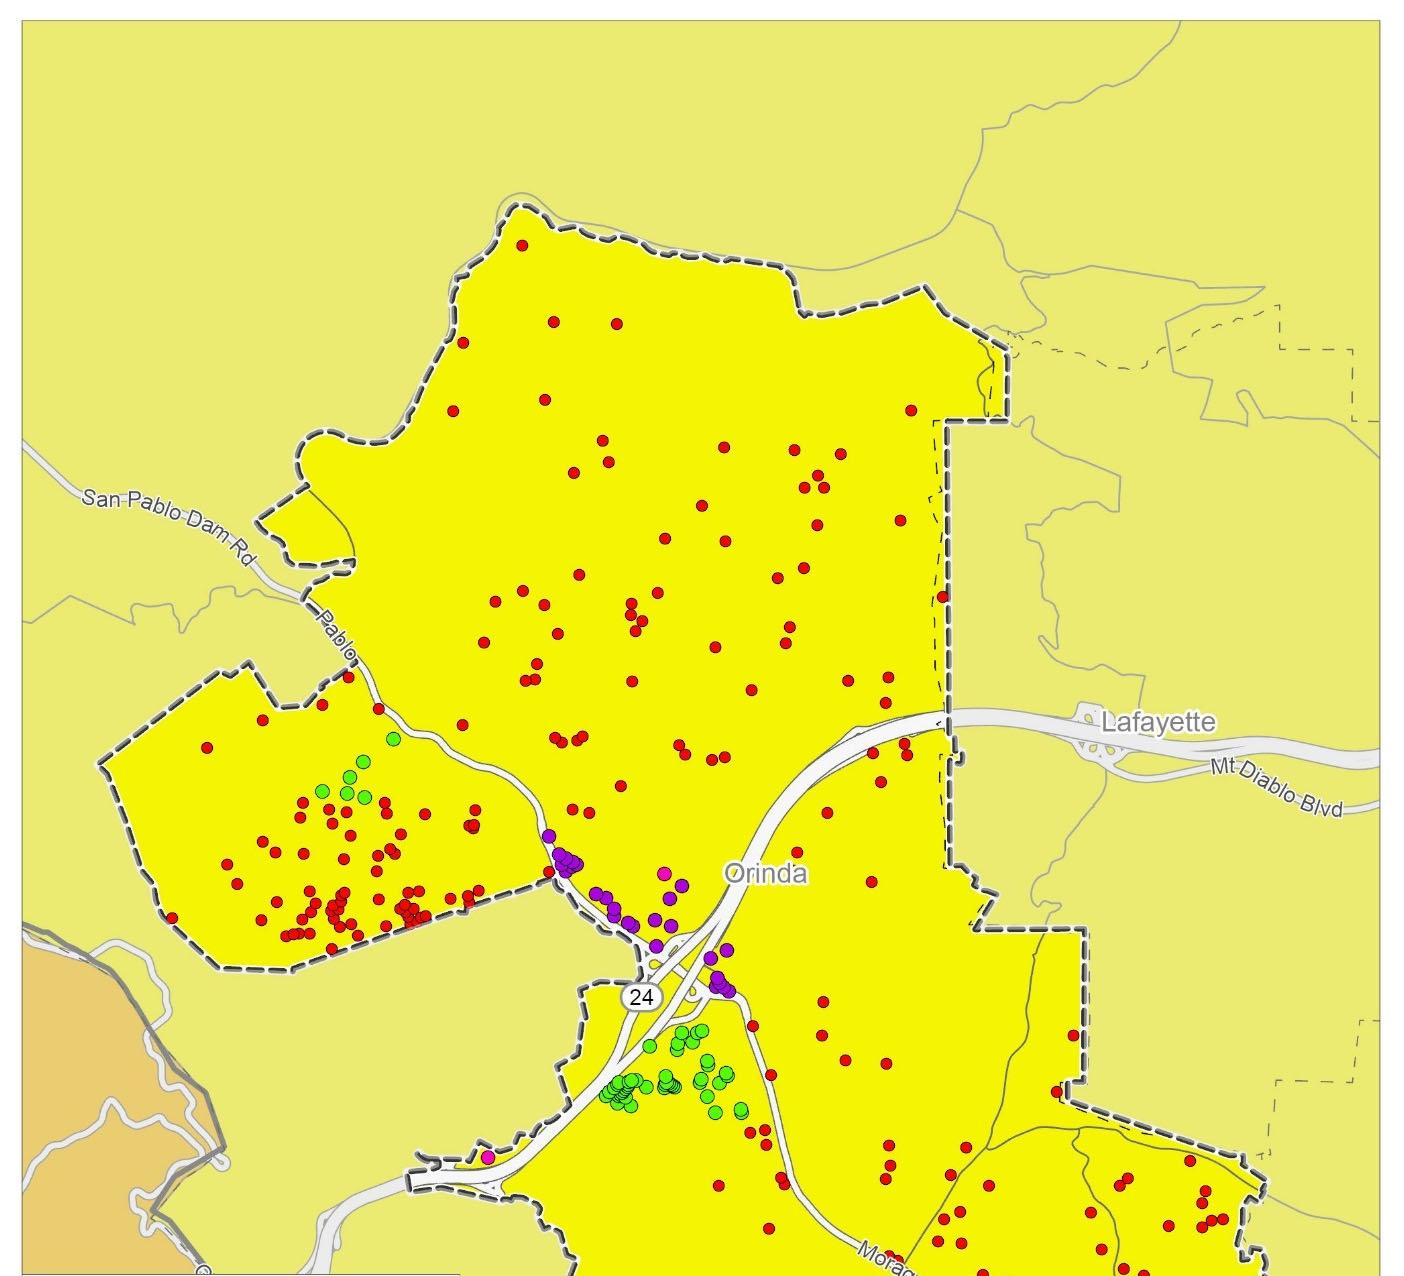
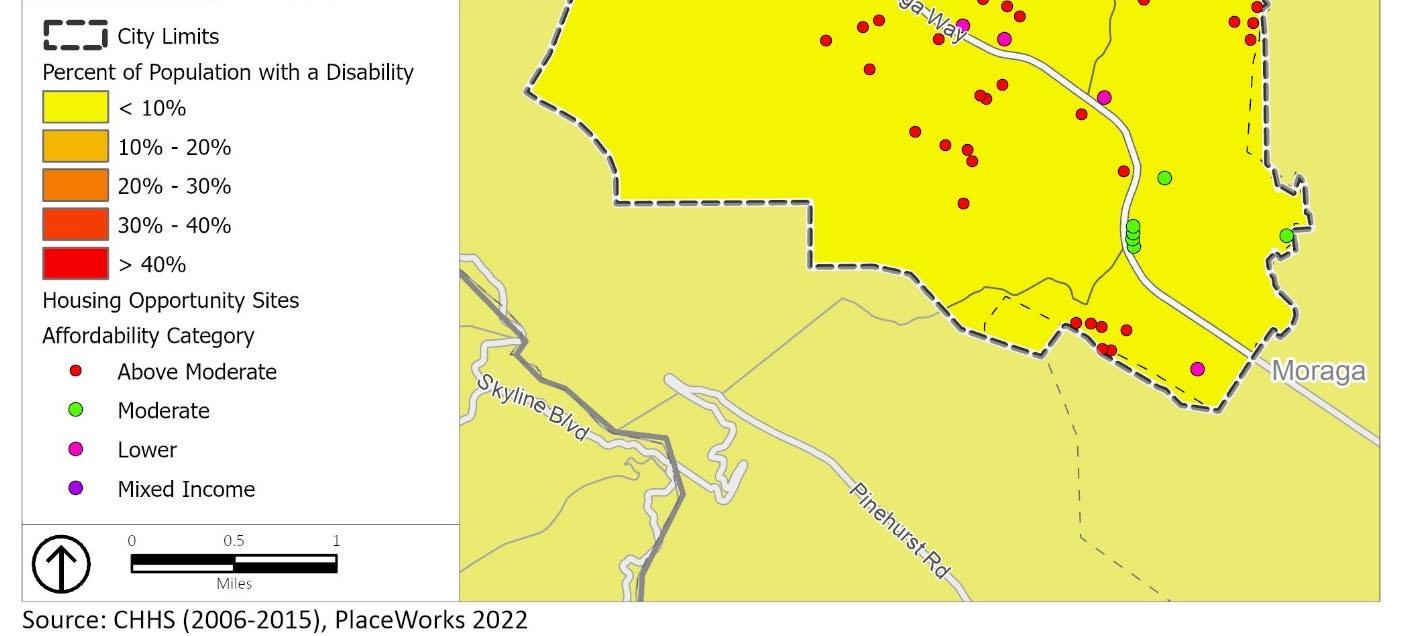
Source: 2015-2019 ACS; City of Orinda, 2022
Familial Status
Female-headed households with children and no spouse/partner present face particular challenges to housing access and are at elevated risk of displacement. As reflected in Figure 4-26, no census tract in Orinda sees a rate of such households above 20 percent. This low rate may reflect exclusivity due to Orinda’s high housing costs and limited housing types that make it difficult to access housing affordable to a single-income household, let alone a household with children. As shown in Chart 4-5 , most sites identified for housing at all income levels, including the majority of lower income units ( 53.8 percent) are located in tracts with rates of this household type at 3.0 to 5.9 percent, expanding housing opportunities for female headed households in an area where there some existing female headed households, but increasing the opportunity for female headed households outside of Orinda to access resources within Orinda (such as proficient schools) that would have otherwise been unaffordable. In areas with the highest concentration of female headed households (still less than 10 percent), 30.6 percent of the lower income has been identified, along with 10.3 percent of moderate-income capacity and 14 percent of above moderate-income capacity to decrease competition for lower income units within these neighborhoods. By adding moderate and above-moderate units throughout the city, and particularly by adding and situating lower-income units Downtown to provide access to resources, Orinda will combat exclusion by becoming more accessible to female-headed households with children and no spouse or partner present.
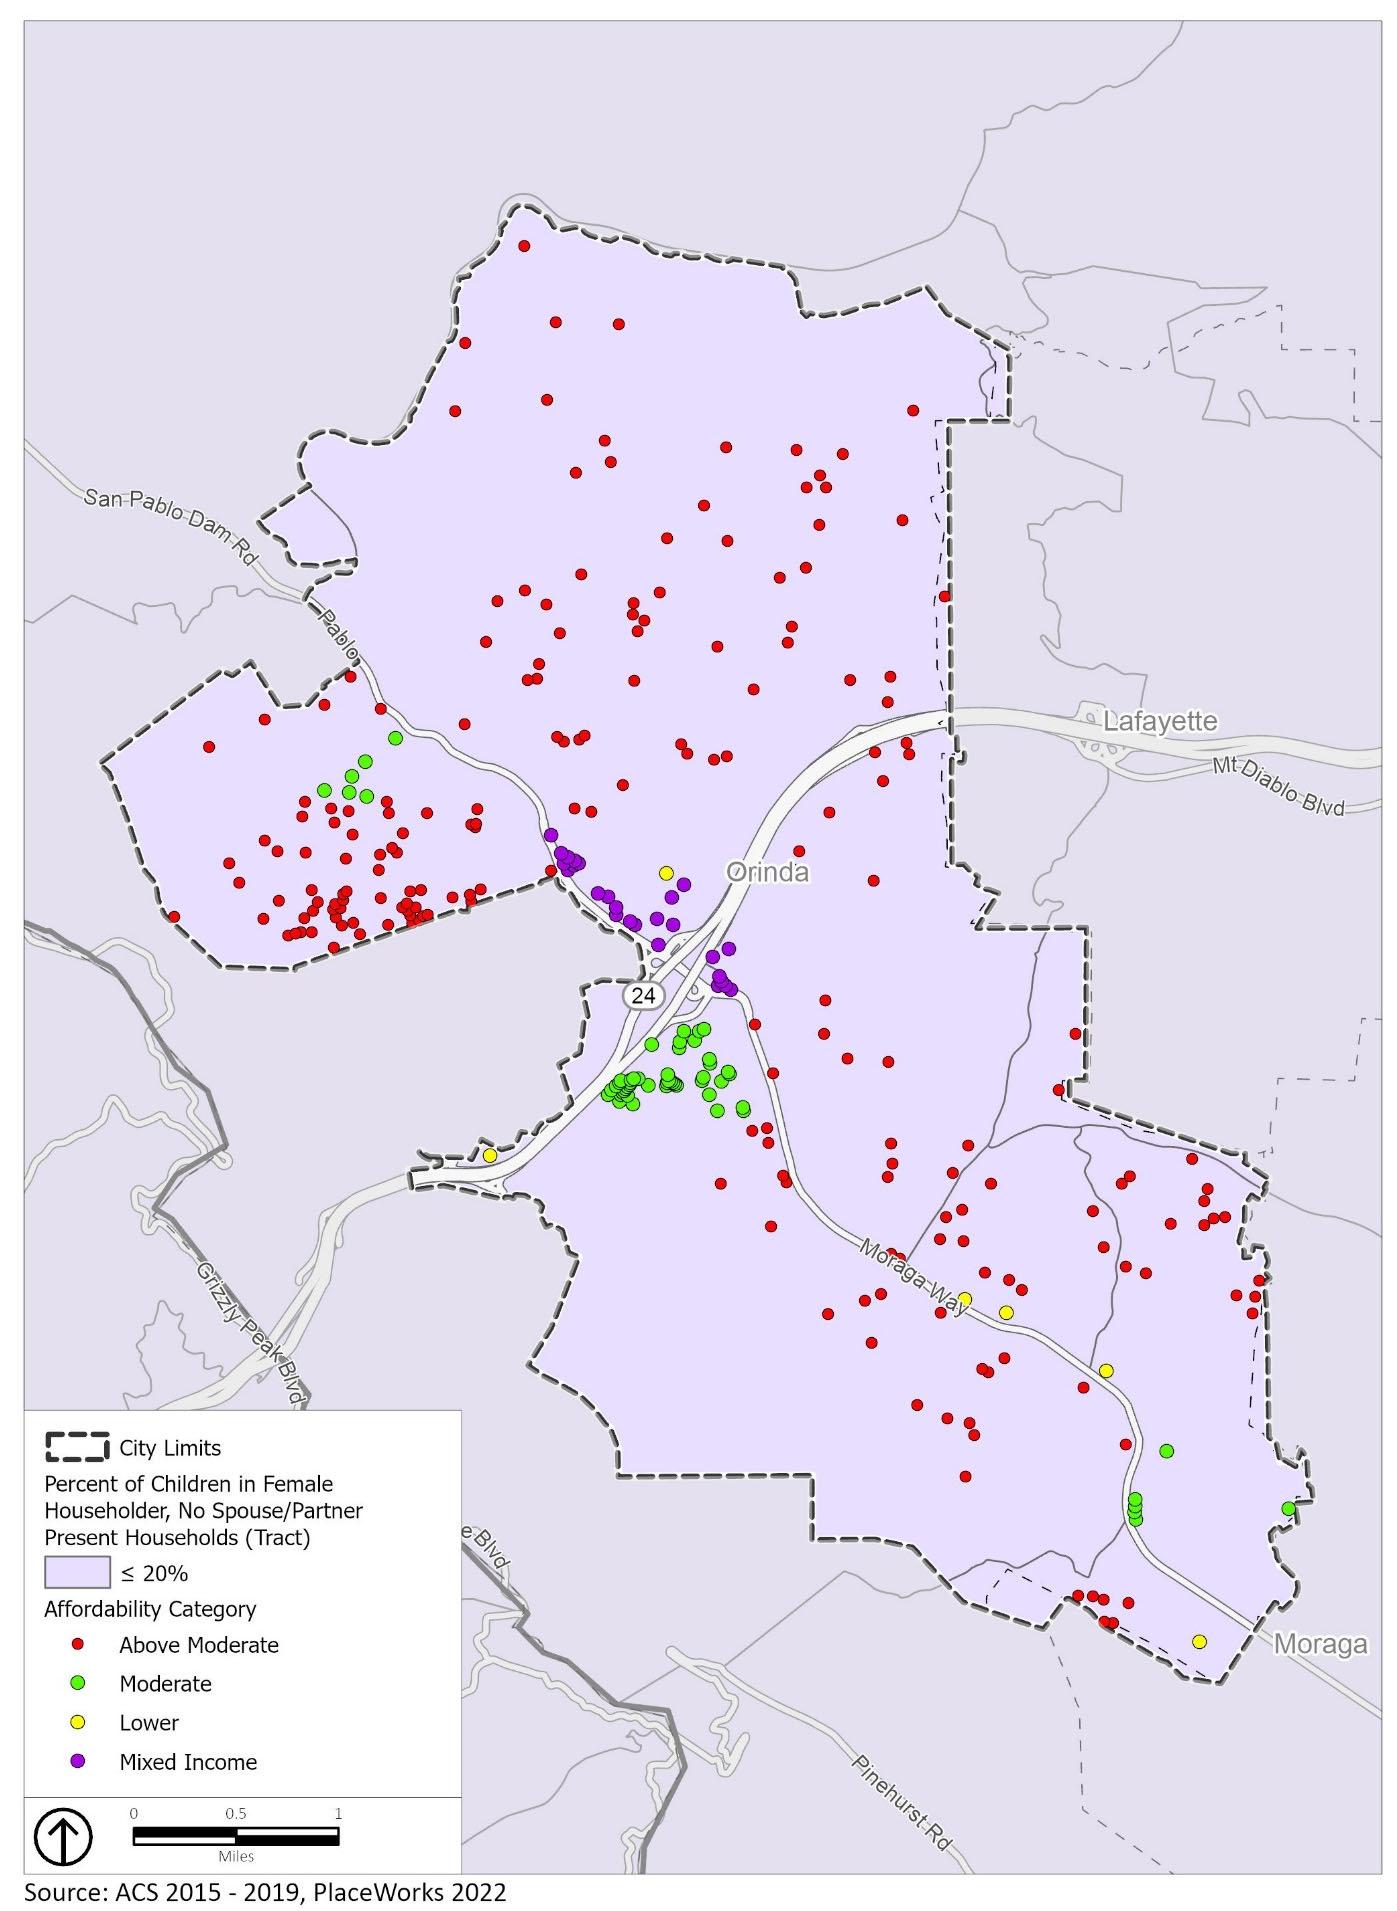
Source: 2015-2019 ACS; City of Orinda, 2022
Jobs Proximity
Jobs Proximity Index percentiles in the city range between 47th and 63rd percentile as demonstrated in Chart 4-6. In general, different areas of the city do not score substantially higher than one another when summarized by census tract. The bulk of the City’s lower-income capacity (69.4 percent), moderateincome capacity (89.7 percent) and above moderate-income capacity (92.9 percent) are planned in areas with the highest job proximity scores, receiving a score between 50 and 60 (Chart 4-6). The areas of Orinda outside of downtown are primarily residential, offering limited local commercial uses with job opportunities.
Ability to commute from these residential areas by transit is limited. When considering where to locate future housing for all income levels, and particularly lower-income units, downtown Orinda would offer the most convenient access to jobs available within the city. When compared to regional job centers, particularly the employment opportunities in Walnut Creek, Berkeley/Oakland/Emeryville, and San Francisco, Orinda does not represent a strong employment center (Figure 4-27). However, the presence of the BART station downtown provides direct access to employment centers from Orinda; as a result, housing close to this station is in a strategic location for commuting to these two areas, a detail not fully reflected in Jobs Proximity Index maps which summarize locations up to the census tract level.
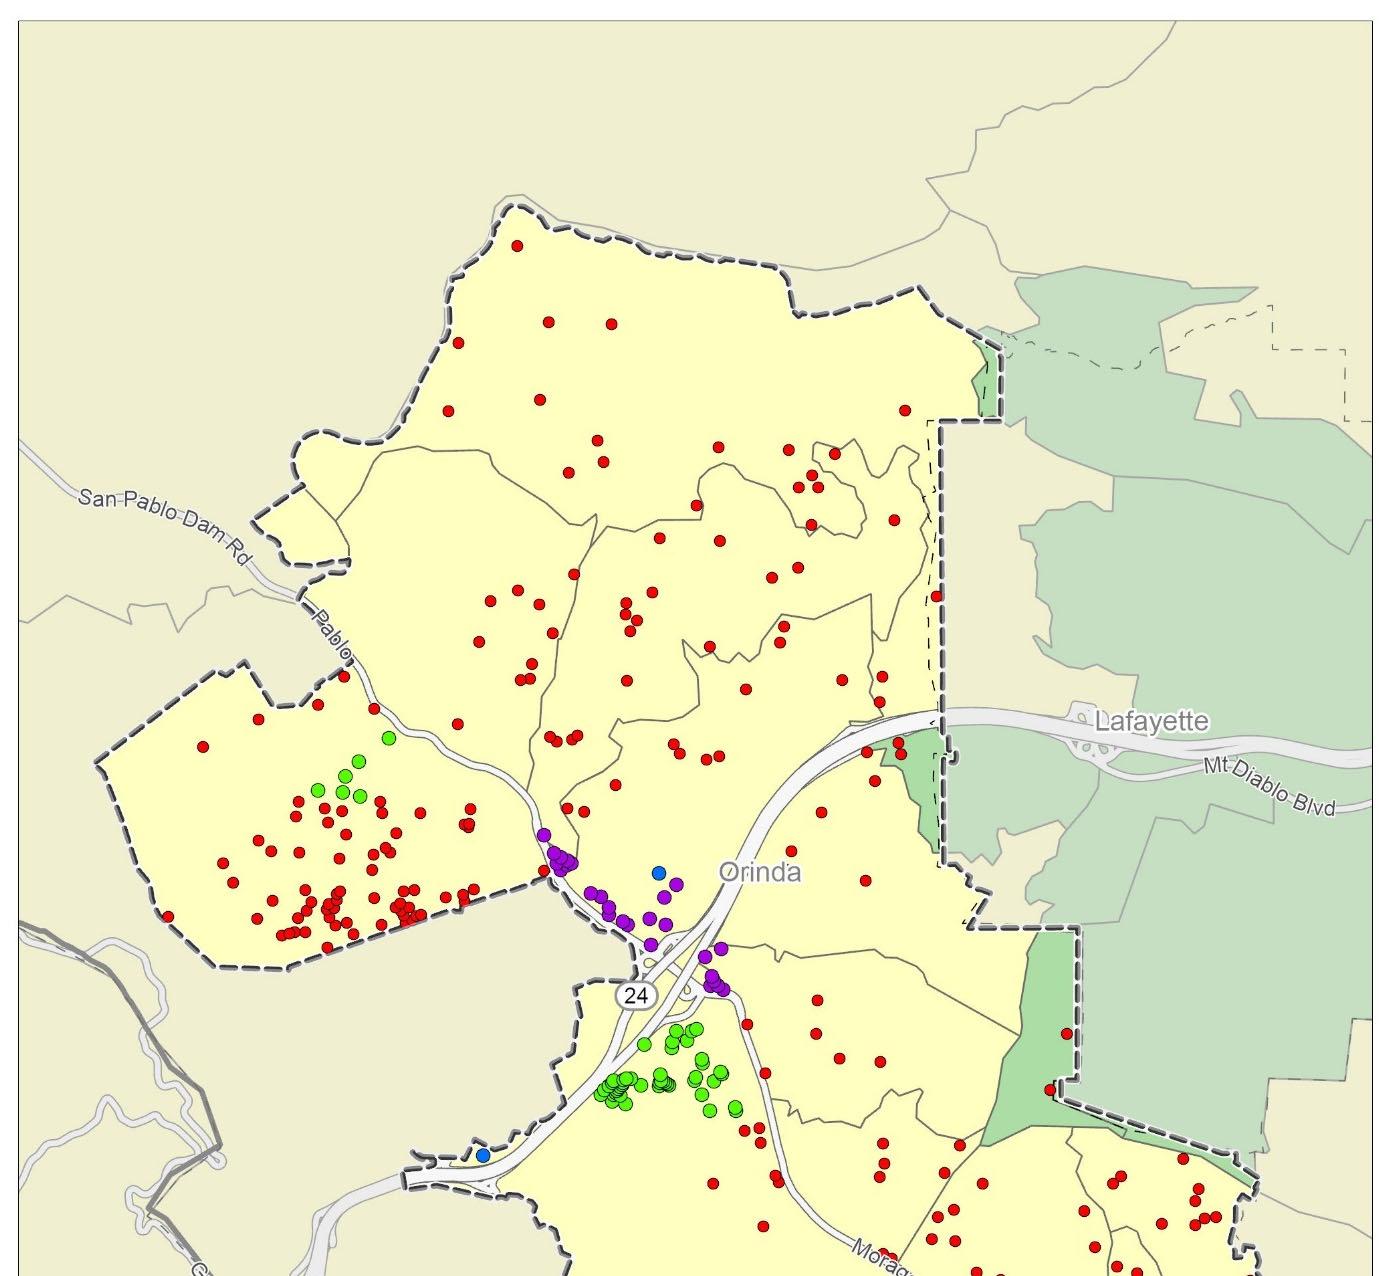
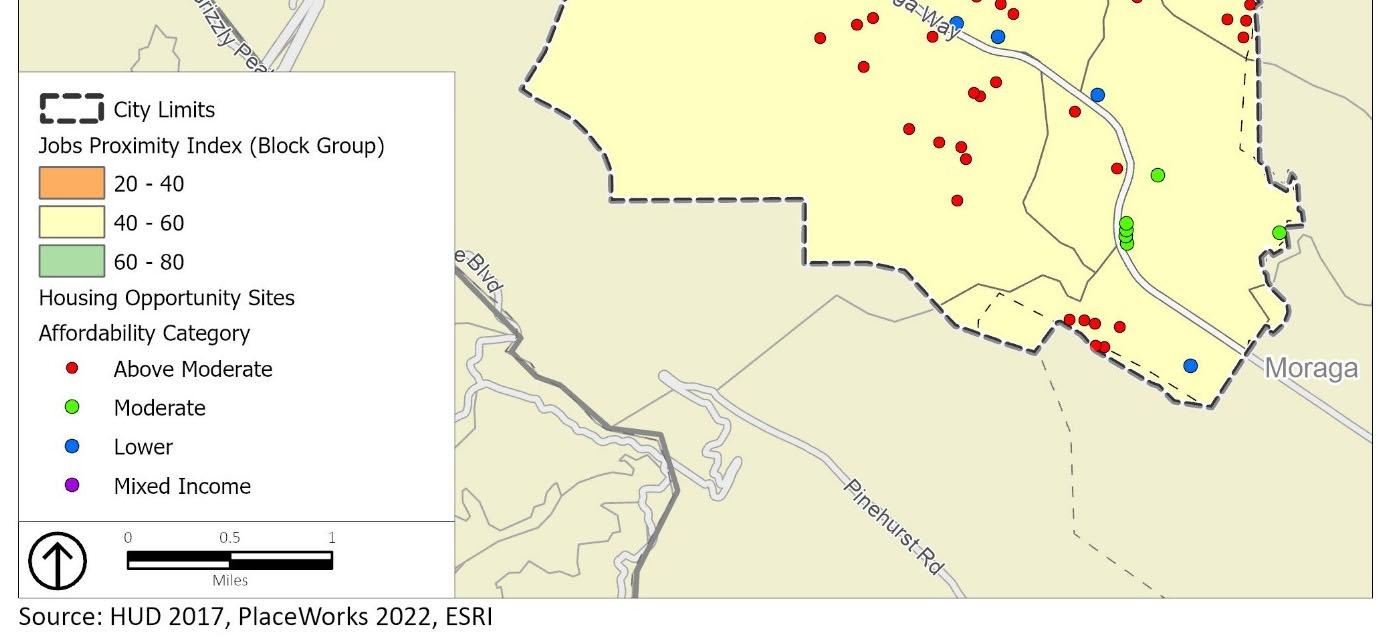
As described previously overcrowding is not an issue in Orinda, which does not have overcrowded units (Figure 4-28). However, overpayment impacts both renting and homeowning households in the city, with significantly higher rates of overpayment among renters as compared with owners. As demonstrated in Figure 4-28, many sites identified for above moderate and moderate affordability are in the northwestern quadrant of the city, north of Highway 24 and west of San Pablo Dam Road, in the Claremont neighborhood. This section of Orinda sees its highest rate of overpayment, with 65 percent of renters contributing 30 percent or more of their household income toward housing expenses. Locations in this area are primarily among single-unit homes. An increase in housing supply at the moderate- and above moderate-income levels in this area through the addition of ADUs or other small-lot residential housing would help meet demand in this area, providing more renter choice and lowered rents and improving access to housing in Orinda for moderate-income households. The Claremont neighborhood census tract is bounded by Highway 24 and Camino Pablo Road, which separate the area from parts of the city with lower rates of renter cost burden, including the parts of Downtown where lower-income sites are located. By locating lower-income units in parts of the city which do not currently see relatively high rates of cost burden, the City is actively combating a concentration of lower-income units at risk of displacement in a part of the City where renters are already at an elevated risk of displacement.
As demonstrated in Chart 4-7, lower-income units are well distributed across areas of varying levels of overpayment by renters, ensuring that sites are not concentrated in one particular neighborhood with preexisting high rates of cost burden. That being said, the largest shares of units are identified in areas with the highest rates of renter overpayment, with 27.8 percent of lower-income capacity planned in areas with 60 to 80 percent of renters experiencing cost burden and an additional 31. percent of lowerincome capacity planned in areas with 40 to 60 percent of renters experiencing overpayment, which will meaningfully increase the supply of lower income units for these households, thereby reducing displacement risk. Moderate-income units located near Downtown and in Claremont, as well as above
moderate-income units dispersed throughout the city, will ease pressure on limited affordable housing stock by increasing the supply of total housing units. Increasing housing supply affordable to lower-income households will improve housing stability and can have the additional benefits of improving student performance socioeconomically disadvantaged students and increasing diversity within Orinda. The integration of approximately a third of each income category’s capacity in Downtown aims to prevent a concentration of lower-income units. Further, introducing low- and moderate-income units in highest resource areas Downtown disrupts existing patterns by creating a mixed-income community in the city.
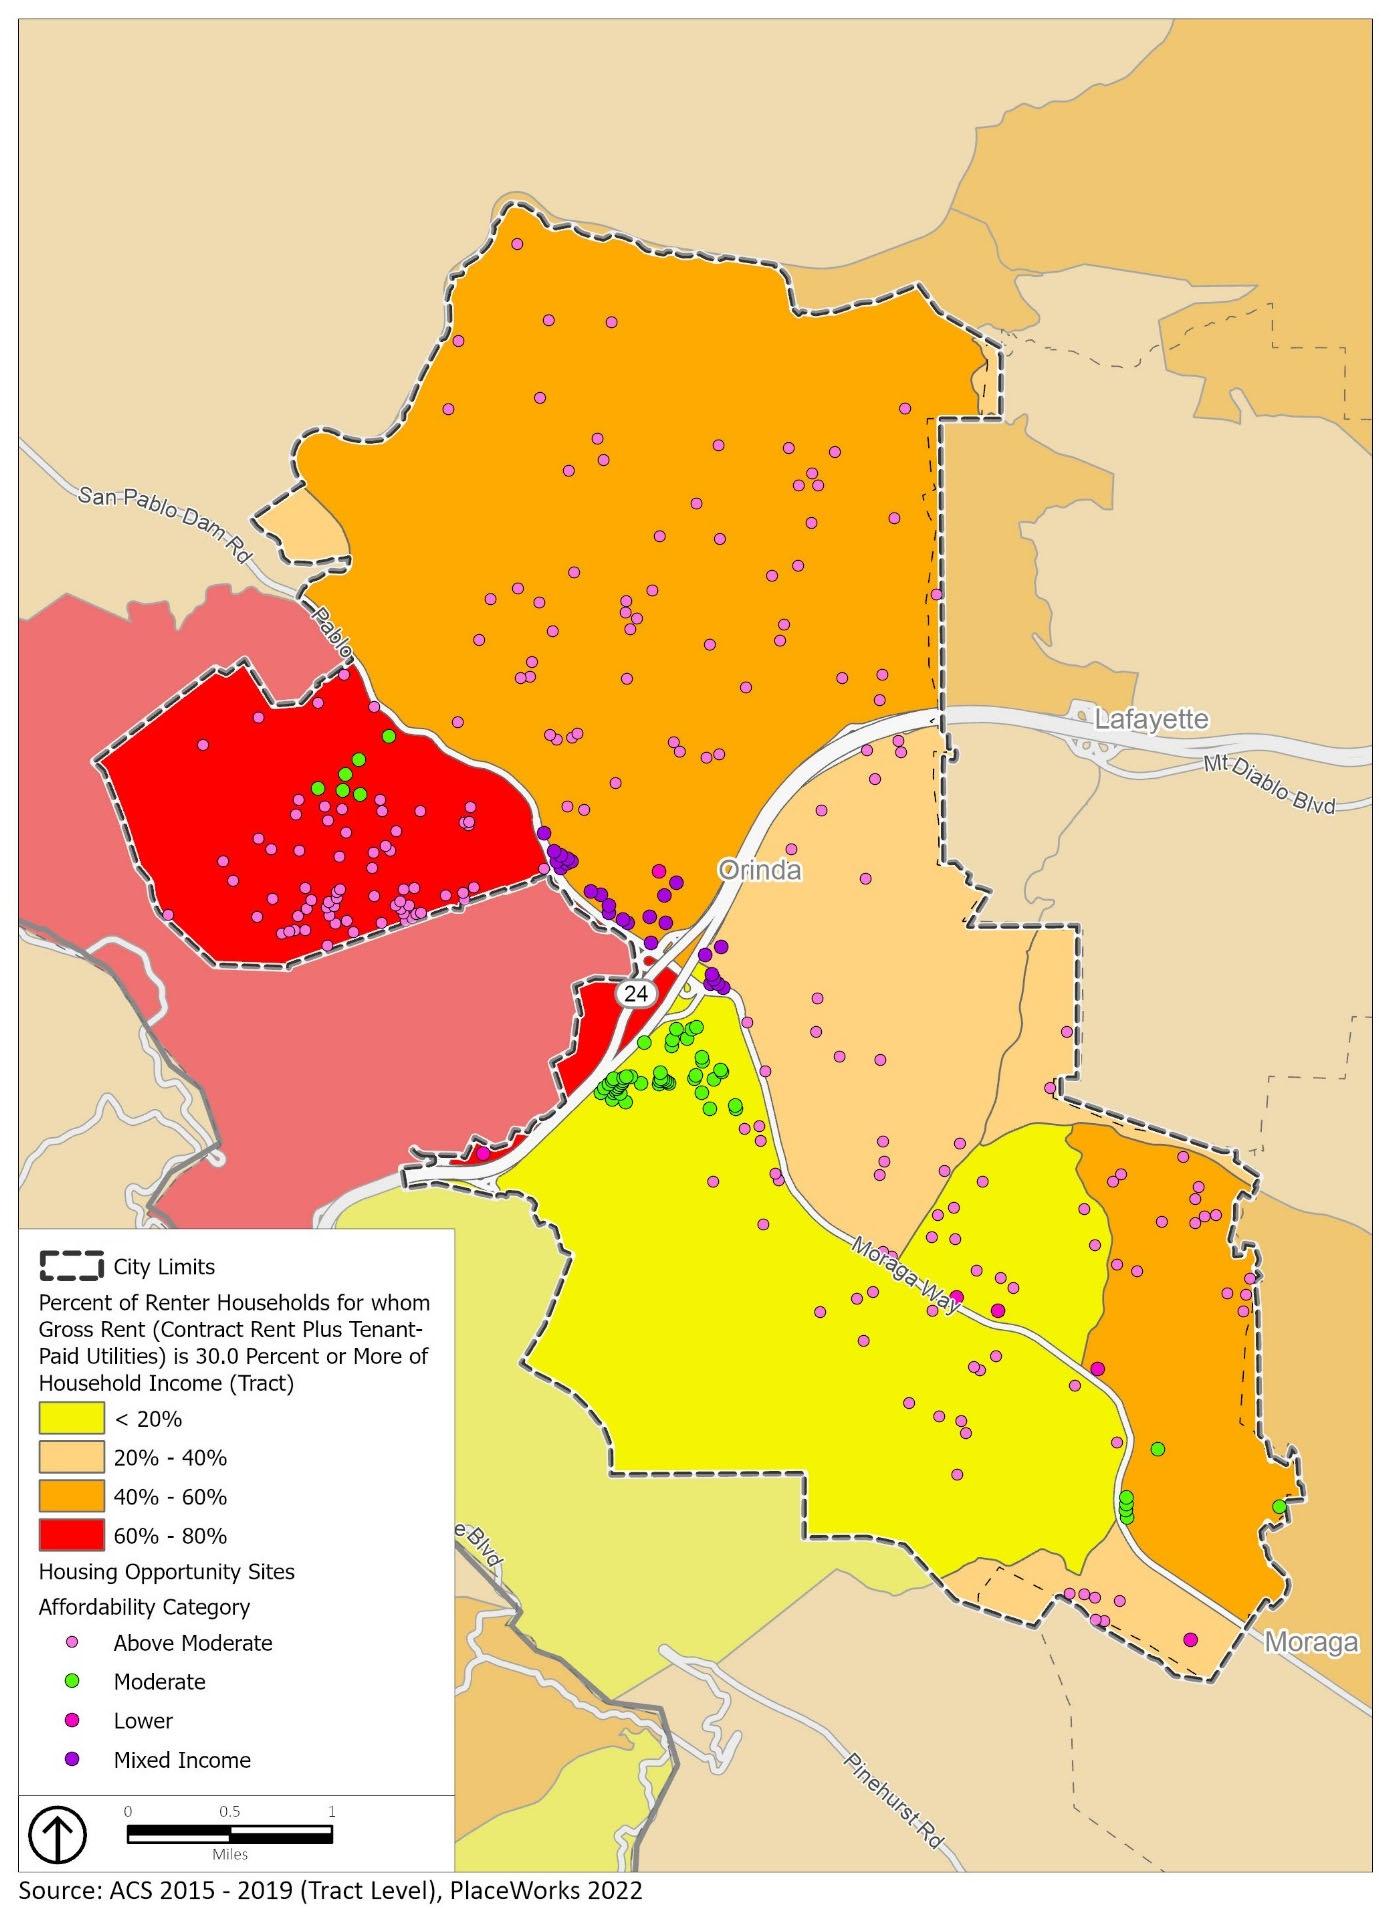
Source: 2015-2019 ACS; City of Orinda, 2022
Through discussions with stakeholders, fair housing advocates, and this assessment of fair housing issues, the City identified factors that contribute to fair housing issues, as shown in Table 4-35, Contributing Factors to Fair Housing. While there are several strategies identified to address the fair housing issues, the most pressing issue is dominance of single-family housing and exclusionary housing prices that present a barrier to entry and mobility for lower- and moderate-income households. Prioritized contributing factors are bolded in Table 4-35 and associated actions to meaningfully affirmatively further fair housing related to these factors are bold and italicized. Additional programs to affirmatively further fair housing are included in Section 7.2, Goals, Policies, and Actions.
Legacy of exclusionary practices toward lower-income residents and nonwhite population resulting in concentration of White, above
Pre-1968 racially restrictive covenants for some housing in Orinda
Housing shortages regionally in Contra Costa County and the greater Bay Area
Unaffordable rents and home prices
Predominance of single-family residential
Adopting the DPP to permit up to 50 du/ac in the Downtown (Action 1.A).
Rezoning Opportunity Sites to allow for multifamily capacity (Action 1.B, Action 1.C).
Permit multifamily by right in the RM zoning district and allow SROs in Orinda (Action 4.A).
Implement proactive marketing campaign to encourage construction of ADUs (Action 1.E).
moderate-income households Neighborhoods are desirable and costly Educate the public on housing types and who affordable housing serves (Action 5.A).
Lack of public support for higherdensity and/or affordable housing
Educate the public on housing types and who affordable housing serves (Action 5.A).
Limited variety of housing types
Predominance of single-family residential
Implement proactive marketing campaign to encourage construction of ADUs (Action 1.E).
Permit multifamily by right in the RM zoning district and allow SROs in Orinda (Action 4.A).
Incentivize development of housing in mixed use projects (Action 1.A).
Limited housing mobility opportunities for lower-income households
Housing shortages regionally in Contra Costa County and the greater Bay Area
High cost of ownership units
Predominance of single-family residential
Neighborhoods are desirable and costly
Shortage of services for unhoused population, persons with disabilities, and lower income residents.
No emergency shelters, transitional housing, or supportive housing in the city limits
Limited affordable housing specifically for persons with disabilities
Lack of public support for higherdensity and/or affordable housing
Work with local agencies and organizations to initiate a first-time and/or moderate-income homebuyer program (Action 2.D).
Promote ADUs and a variety of other housing types in high opportunity and resource areas (Action 1.E).
Educate property managers and landlords on avoiding income discrimination and the benefits of advertising units to Section 8 voucher holders (Action 5.A).
Permit multifamily by right in the RM zoning district and allow SROs in Orinda (Action 4.A). Meet/Collaborate with neighboring jurisdictions on annual basis to determine regional solutions to increase housing and supportive services for unhoused population, persons with disabilities, and lower income residents (Action 1.F, 3.B, 3.C, 5.A).
California law (Government Code Section 65583 (a)(3)) requires that the Housing Element contain an inventory of land suitable for residential development, including vacant sites that can be developed for housing within the planning period and nonvacant (i.e., underutilized) sites having potential for redevelopment. State law also requires an analysis of the relationship of zoning and public facilities and services to these sites.
The Regional Housing Needs Allocation (RHNA) is the State of California-required process that seeks to ensure cities and counties are planning for enough housing to accommodate all economic segments of the community. The process is split into the following three steps.
1. Regional Determination: The California Department of Housing and Community Development (HCD) provides each region a Regional Determination of housing need, which includes a total number of units split into four income categories. The City of Orinda is within the region covered by the Association of Bay Area Governments (ABAG). HCD provided ABAG a Regional Determination of 441,176 units for the 6th Cycle RHNA (2023-2031). This is the total number of units that the cities and counties in the ABAG region must collectively plan to accommodate.
2. RHNA Methodology: Councils of Governments (COG), including ABAG, are responsible for developing a RHNA Methodology for allocating the Regional Determination to each city and county in the COG’s region. This methodology must further specific state objectives, including, but not limited to, promoting infill, equity, and environmental protection; ensuring jobs-housing balance; and affirmatively furthering fair housing.
3. Housing Element Updates: Each city and county must then adopt a housing element that demonstrates how the jurisdiction can accommodate its assigned RHNA through its zoning. HCD reviews each jurisdiction’s housing element for compliance with state law.
The City of Orinda’s share of the regional housing need was determined by a methodology prepared by ABAG as part of the Regional Housing Needs Plan, adopted in December 2021. In accordance with ABAG’s Regional Housing Needs Plan, the City must plan to accommodate a total of 1,359 housing units between June 30, 2022, and December 15, 2030. Table 5-1 shows the City’s RHNA by income category. Of the 1,359 total units, the City must plan to accommodate 372 units for very low-income households, 215 units for low-income households, 215 units for moderate-income households, and 557 units for above moderateincome households.
Source: ABAG 2021
Note: It is assumed that 50 percent of the very low- income is allocated to the extremely low-income category
State Housing Element law emphasizes the importance of adequate land for housing and requires that each Housing Element “…identify adequate sites… to facilitate and encourage the development of a variety of housing types for all income levels…” (California Government Code Section 65583(c)(1)). To allow for an adequate supply of new housing, land must be zoned at a variety of densities to ensure that development is feasible for a wide range of income levels. The identified land must also have access to appropriate services and infrastructure, such as water, wastewater, and roads.
To demonstrate the City’s capacity to potentially meet its RHNA, an adequate sites inventory was conducted. The inventory must identify adequate sites that will be made available through appropriate zoning and development standards and with public services and facilities needed to facilitate and encourage the development of a variety of housing types for households of all income levels.
The analysis of the relationship of suitable sites to zoning provides a means for determining the realistic number of dwelling units that could actually be constructed on those sites in the current planning period. The analysis also identifies the zoning districts the City believes can accommodate its share of the regional housing needs for all income levels.
The sites listed in Tables 5-4, 5-5, and 5-6 includes a list of sites identified through a selection process that included public input, Planning Commission and City Council input, and feedback gathered through the Balancing Act RHNA plan tool. The sites identified are currently available and/or will be rezoned as a part of this Housing Element update process. These sites will allow for the development of a variety of housing types that will meet the needs of all income groups allocated by ABAG for the 2023-2031 planning period.
Pursuant to California Government Code Section 65583.2(c), a non-vacant site identified in the previous planning period and a vacant site that has been included in two or more previous consecutive planning periods cannot be used to accommodate the lower-income RHNA unless the site is subject to an action in the Housing Element requiring rezoning within three years of the beginning of the planning period to allow residential use by right for housing developments in which at least 20 percent of the units are affordable to lower-income households.
Site 1 has been included in the past two housing element cycles and is subject to California Government Code Section 65583.2(c). Site 1, the Santa Maria Church site already allows by right development up to 20 units per acre. Additionally, the City has included Housing Element Action 1.J which commits the City to allowing residential use by right on sites consistent with Government Code Section 65583.2(c), for housing developments in which at least 20 percent of the units are affordable to lower-income households.
Housing element law requires jurisdictions to provide a requisite analysis showing that zones identified for lower-income households are sufficient to encourage such development. The law provides two options for preparing the analysis: (1) describe market demand and trends, financial feasibility, and recent development experience; or (2) use default density standards deemed adequate to meet the appropriate zoning test. According to state law (California Government Code Section 65583.2(c)(3)(B)), the default density standard for Orinda is 20 dwelling units per acre (du/ac). The City has included several sites (listed in Tables 5-2, 5-3, and 5-4) that are proposed to require a minimum of 20 units per acre and are assumed to accommodate the City’s lower-income RHNA.
The majority, if not all, of the sites to accommodate the RHNA are infill sites. Therefore, the City relied heavily on the current multifamily development standards and on-site improvement requirements (e.g., setbacks, building height, parking, density requirements, land use controls, water and wastewater access, and open space requirements) but also considered project examples (Vista Verde Senior Housing and Monteverde Senior Apartments) in Orinda. The average realistic capacity of the project examples was 88 percent. Refer to Table 5-2.
There has not been any residential or commercial development in the Downtown Precise Plan (DPP) project area since 1987, so to account for non-residential development the city assumed a 60 percent realistic capacity, and has only assumed 27 percent of the overall plan will develop in the planning period, for the DPP sites (Table 5-5A).
For the Opportunity Sites (Table 5-7), the City assumed the minimum density of 20 du per acre (the default density) as a realistic capacity. Additionally, the opportunity sites take into account the overall percentage of each site that could be available for the development of housing. For the remaining sites assumed to meet the moderate- and above moderate-income sites, the City assumed an 80 percent realistic capacity. These sites are summarized in Table 5-4 and listed by APN in Appendix A.
Source: City of Orinda, 2022
The City currently has one approved market rate project and one approved affordable project that can accommodate a portion of the City’s RHNA. The Countryhouse Memory Care project was approved in January 2021. This project includes a two-story building with 38 market rate assisted living units, each with a small kitchen and bathroom.
The City’s affordable housing project, the Vista Verde Senior Housing project was approved by City Council on August 16, 2022 and construction is assumed to start in 2023 The Vista Verde Senior Housing project is an all-affordable project that will include 8 units affordable to very low-income households, 30 units affordable to low-income households, 13 units affordable to moderate-income households, and one caretaker unit for a total of 52 units (Table 5-3). There will be enforceable agreements recorded covering all units in the project (except caretaker unit) for a term of 55 years, per State density bonus law and the financing for the project.
Source: City of Orinda, March 2022
The City prepared an inventory of vacant and underutilized sites currently available and planned to be available before the start of the 2023-2031 planning period to accommodate the City’s RHNA. The sites have been categorized into three groups, Current Sites (Table 5-4 and Appendix A), Downtown Precise Plan (DPP) sites (Table 5-5), and Opportunity Sites (Table 5-7). Tables 5-4, 5-5, 5-6, and 5-7 provide the characteristics of each site, including zoning, general plan designation, acreage, and realistic capacity for the sites currently zoned for housing or that will be rezoned. (Actions 1.A and 1.B). Figures A-1 through A6 in the appendix provide maps of each site assumed to accommodate the RHNA.
The following sites (Table 5-4) currently have the appropriate zoning and general plan designation to meet a portion of the City’s RHNA. See Figure 5-1, and Figures A-1 through A-6 in the appendix. Appendix A also includes a full listing of the sites that can accommodate the moderate- and above moderate-income RHNA.
Source: City of Orinda, March 2022
1Refer to Appendix A for a site-by-site listing
*The full site acreage including the church is 9.4 acres. Development would be assumed to develop on vacant land adjacent to the church which could total 2.4 acres.
The City of Orinda has several unique development scenarios as to how single-family developments occur in the city. This includes, small lot development, adjacent legal lots under common ownership, driveway access, general plan policies directing development on specific sites, and lots deemed undevelopable. The following discussion describes each of these scenarios.
Orinda has many small (3,000 to 6,000 sf) lots developed with single family homes. For instance, in the Brookwood Road and Claremont Avenue neighborhoods:
Orinda Municipal Code Section 17.4.4 reduces the minimum setback requirements on smaller lots, regardless of which single family zone the lots are located in. For instance, for lots with a front width of less than 60 feet, the side yard setback is 5 feet for a single-family home.
Orinda’s single-family zones contain many sites comprised of two legal lots where a home is located on one lot and the separate lot is either a developed or undeveloped yard area. The Planning Department routinely receives inquiries from property owners who are interested in potentially developing or selling the separate legal lot which they own. For instance, when the property at 125 Canon Drive was for sale in 2021, many of the prospective buyers asked about the development potential for a new home on the vacant lot that was currently used for yard area (the property consists of a 1.13-acre legal lot with two units and a .47-acre vacant lot used for yard area).
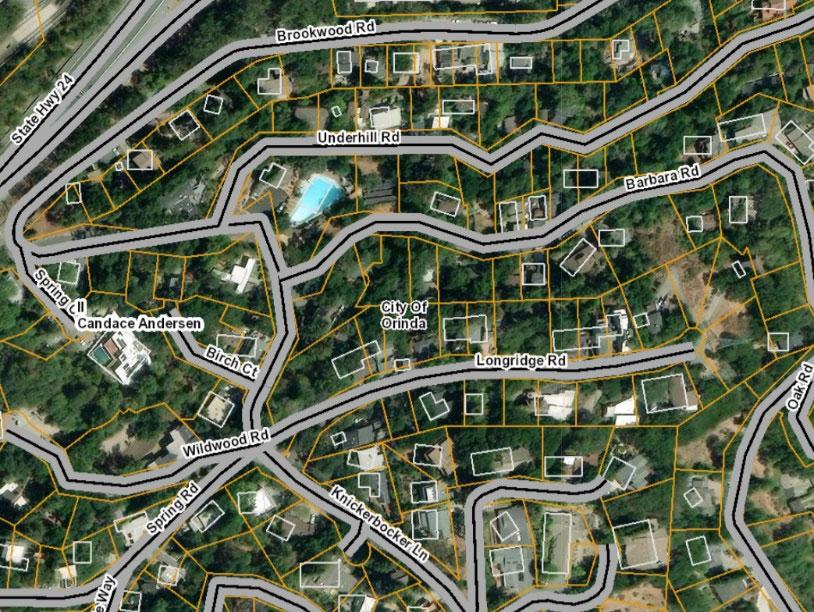
The 43-acre Southwood Valley parcel is zoned for single-family residential with a General Plan land use designation of open space and single-family. The General Plan Land Use map has a schematic designation for the site, consistent with Implementing Policy 2.1.2.J requiring that 33 acres of the site be preserved as open space. In 2017, the Planning Department received a subdivision application for the site which consisted of 18 single-family lots plus the required open space. The project was not acted upon because the applicant withdrew during the completeness review stage.
It’s relatively common for properties in Orinda to gain access via driveway easements across other properties. In the assessor parcel map excerpts below, this condition is illustrated for three separate properties (4 Las Vegas, 29 La Fond, and 13 Crestview).
Some properties in Orinda are categorized as “unbuildable” by the Contra Costa County Assessor’s office. This designation is made by the County Tax Assessor’s office and does not impact whether a site is actually buildable from a planning and zoning perspective. These sites are legal, potentially buildable lots. The “unbuildable” designation by the Assessor’s office lowers property taxes but does not prohibit development. Planning staff routinely explains to prospective applicants that the standard zoning allowances apply to all residentially-zoned lots, including those designated “unbuildable” by the County Assessor.
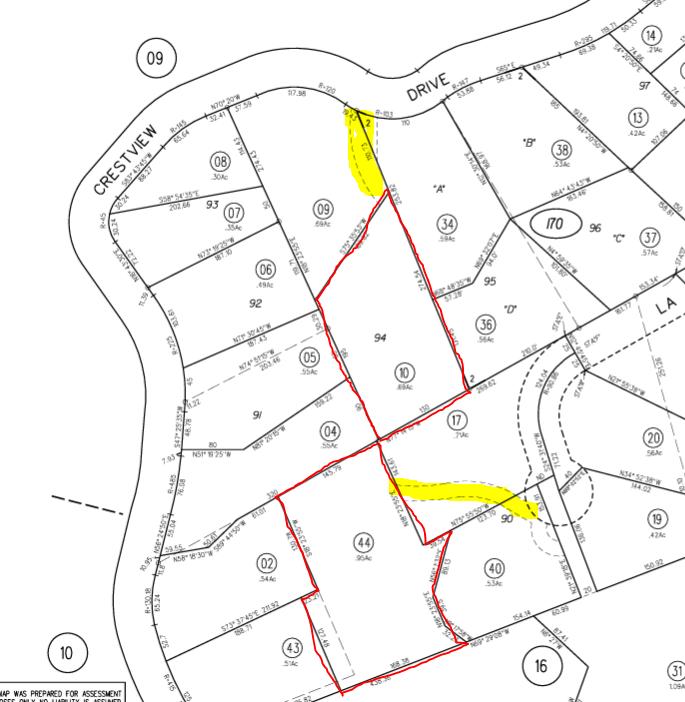
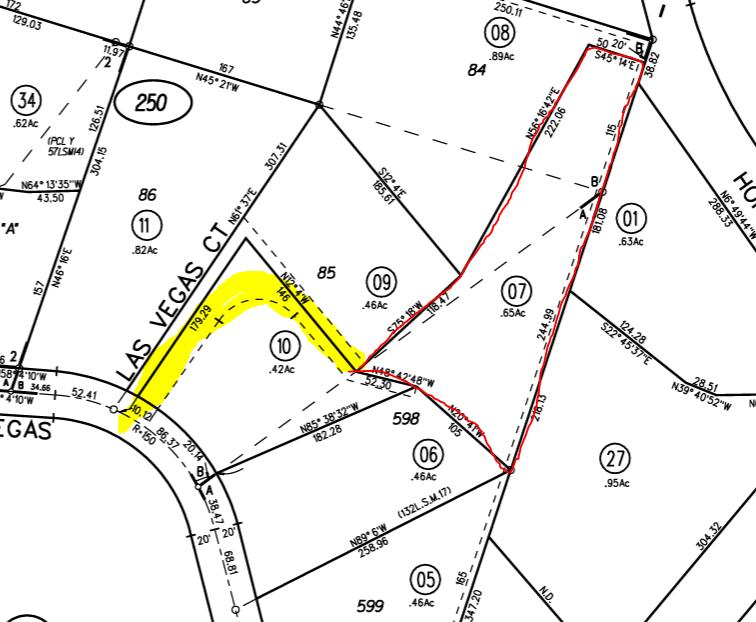
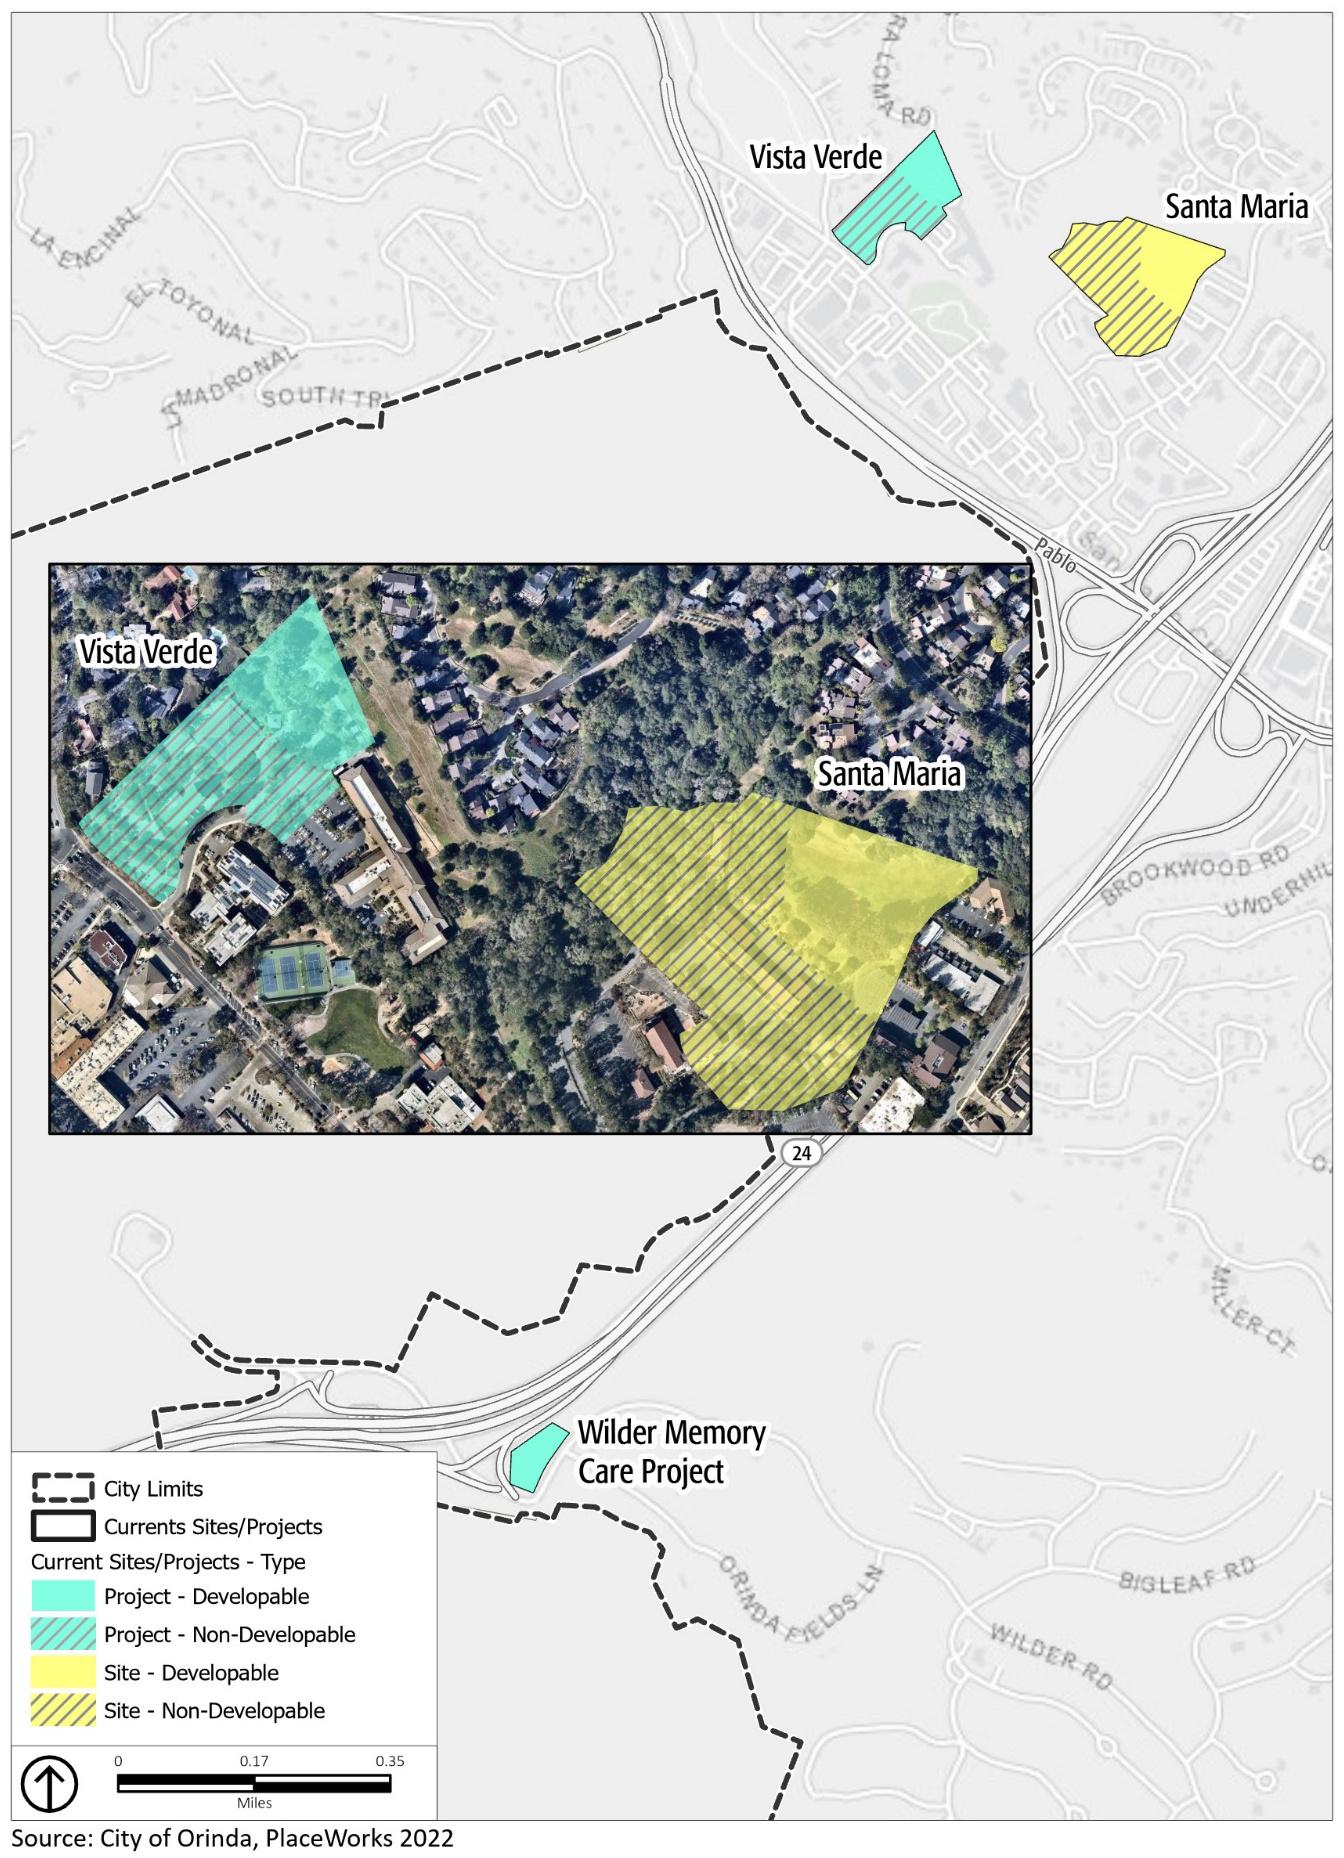
The city is in the process of preparing the Downton Precise Plan (DPP). The draft plan is expected to be available December 2022. The DPP covers a 146.3-acre project area, but the focus area comprises a total of approximately 60 acres. The DPP is intended to revitalize Orinda’s downtown and stimulate housing production by increasing allowable residential densities in the Downtown Commercial (DC) zoning district and allowing multifamily residential developments in the Downtown Office (DO) zoning district. These increased densities allow for a maximum capacity of 1,618 units. Figure 5-2 shows where the DC and DO zoning districts fall within the DPP. To account for nonresidential development the City took a conservative approach and applied a 60 percent realistic capacity to each site in the DPP to assume for non-residential uses, bringing the realistic capacity to 971 units. The City then removed sites where the redevelopment was limited due to factors such as limited contact with property owners, long term leases in place, and the overall condition of the building. With removal of these sites this further reduced the realistic capacity to 342 units. The 342 units assumes that 21 percent of the entire DPP area will develop in the 8-year planning period. The City sees this as an appropriate assumption. Action 1.A has been included to rezone the DPP to allow for the development of high-density multifamily housing. Once rezoned, the DPP will require a minimum of 20 units per acre and with a maximum density of 50 units per acre in the Downtown Commercial (DC) zoning district and DPP will require a minimum of 20 units per acre with a maximum of 25 units per acre in the Downtown Office (DO) zoning district. While all sites identified in Table 5-4A allow for mixed use developments, sites within the DO (DPP -14, -25, -29, and44) and the DC (DPP-41) allow for 100 percent residential development.
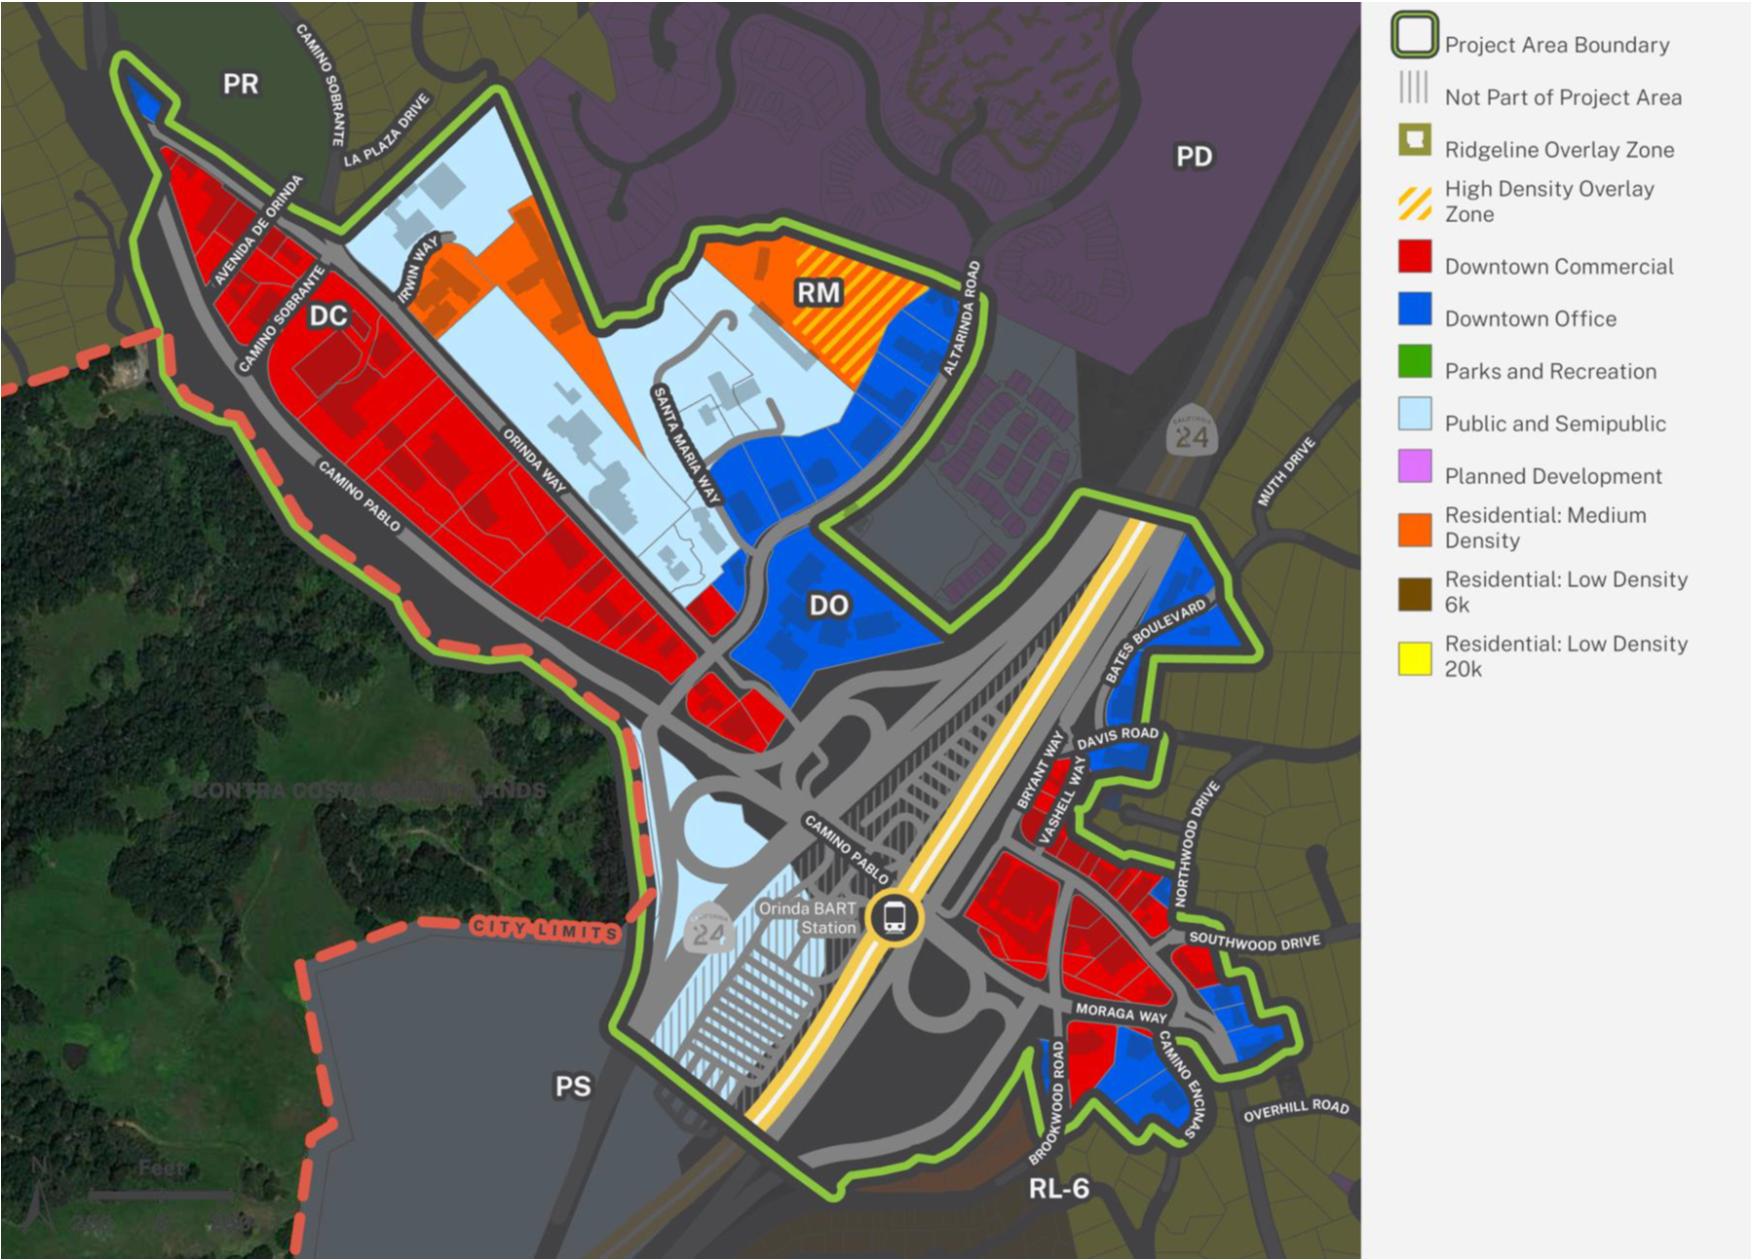
The DPP is made up of several different sites that are prime for redevelopment. Based on the nature of the location it is assumed that some sites will demolish the existing use, and some will redevelop with the current use on the site. The approach will be determined on a project-by-project basis. The DPP sites are made up of infill sites and therefore will most likely build out using 100 percent of each site acreage. The building footprint already includes setbacks, sidewalks, etc.
While the Environmental Impact Report (EIR) will analyze the DPP sites at densities up to 85 du/acre, the Housing Element analysis assumes the following:
● Downtown Office (DO) zoning district: 20 - 25 du/ac
● Downtown Commercial (DC) zoning district: 20 - 55 du/ac
Over the past several years City staff has had ongoing conversations with property owners about the interest in the redevelopment of the downtown area. Additionally, as a part of the preparation of the DPP, the City interviewed several stakeholders to discuss the future of the downtown. Over a two-day working session, the panelists were asked to provide recommendations. Stakeholders included government agencies and consultants, property owners, specifically, the owner of 25A Orinda Way, Vintage House, CVS, BevMo, Nation’s, et al, Phair’s Properties, and Theatre Square property owners. Other stakeholders included East Bay Municipal Utility District, Friends of Orinda Creeks, Historic Landmarks Committee, Leasing agents, Orinda Association, Orinda Chamber of Commerce, Orinda Vision, Orinda Watch, SaveOrinda, Teen Advisory Council, and What’s Up Downtown Orinda.
In late July 2022 the City sent out a survey to Downtown Orinda property owners to gather information on their interest in residential development or mixed-use development. The survey also doubled as an invitation to a virtual stakeholder meeting on August 3, 2022, to provide a presentation by the City’s economics consultant (Economic & Planning Systems, Inc. (EPS)) to provide a financial analysis to downtown Orinda property owners on the viability of redevelopment. The meeting was to provide technical analysis that helps downtown property owners understand the potential for future reinvestment and redevelopment of their properties. The virtual stakeholders meeting was well attended by both property owners, their representatives, and housing developers. Interest in residential development was expressed by the majority of attendees.
Of the sites included in Table 5-5, and assumed to meet a portion of the RHNA, 50 percent of the property owners have expressed interest in residential or mixed-use development.
The DPP Objective Design Standards are established to implement the vision of the DPP. The development standards included in the plan are intended to be “objective” and clearly communicate the design intent of the DPP’s vision, which will streamline the development proposal review and entitlement process. California State law defines objective standards as those that “involve no personal or subjective judgment by a public official and are uniformly verifiable by reference to an external and uniform benchmark or criterion available and knowable by both the development applicant and public official prior to submittal.”
The DPP Objective Design Standards support the development of Downtown Orinda as an attractive, mixed-use, and walkable center for Orinda. The standards will govern the physical form, character, and uses of private development as well as public realm elements, such as civic spaces. The DPP Objective Design Standards focus on form and massing, roof design, walls, windows, materials, colors, and specific building type.
The DPP is intended to revitalize Orinda’s downtown and stimulate housing production by increasing allowable residential densities in the Downtown Commercial (DC) zoning district and allowing multifamily residential developments in the Downtown Office (DO) zoning district. While the City does not have any current project examples due to the current density limitations in the Downtown, the city relied on project examples from surrounding and/or nearby jurisdictions (refer to Section 5.7.5) to provide trends of residential and mixed-use development in neighboring downtown areas. These projects include market rate development as well as projects that include an affordable component. These projects also demonstrate that residential development, with units affordable to lower income households, are occurring, which further supports development potential in the DPP area. The City also reviewed projects specifically looking at densities and heights consistent which what is being proposed in the DPP (50 du/acre and 45 ft in height and will allow at least 4-stories) to ensure this is achievable.
Project Example 1 – ROEM Apartments
San Ramon, Ca
Density calculated at 66.27 du/acre
4 Story, Type V, 1 Story Type I, Parking Podium
169 multifamily units
Project Example 2 – Mixed Use Development
Walnut Creek, Ca
Density calculated at 64.29 du/acre
Retail, 1 Story Above Grade, Multi-Family Homes, 3 Stories Above Grade, 60 Parking Spaces
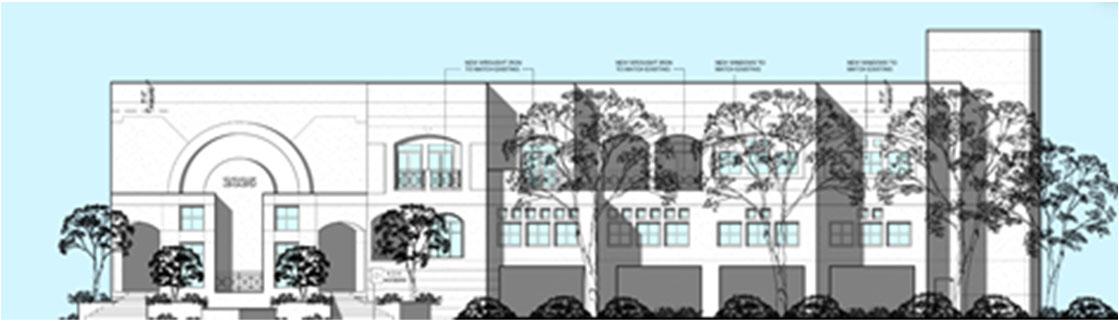
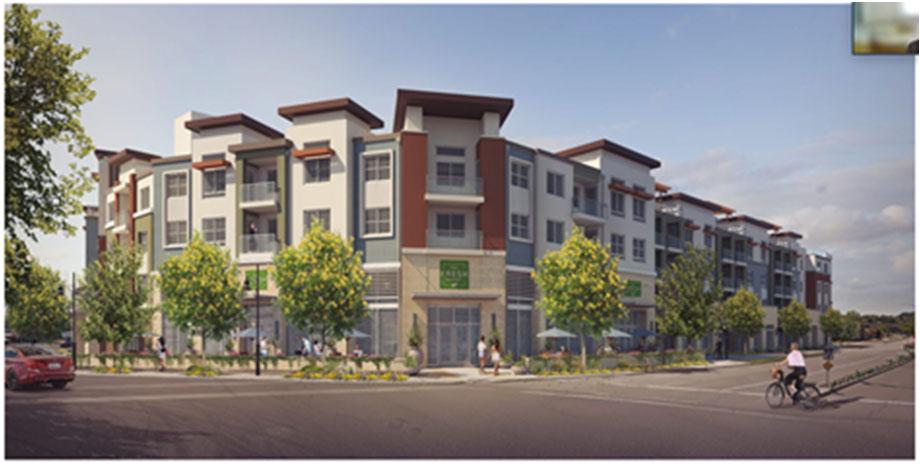
27 multifamily units
Project Example 3 – Salmon Run Apartments
Concord, Ca
Density calculated at 68.09 du/acre
3 Stories with rooftop deck
32 multifamily units
Considering these project examples above and the project examples listed in section 5.7.5, coupled with the proposed changes/rezones to Orinda’s Downtown, (increased building height to allow 35 to 45 feet, increased density to allow 20-50 units per acre), which are consistent with neighboring jurisdictions development standards, the DPP is ripe for redevelopment within the planning period.
In September 2022 the City’s economic consultant (EPS) prepared a memorandum evaluating the real estate market conditions affecting the redevelopment potential of Downtown Orinda. This analysis was prepared to inform the City of Orinda’s 6th Cycle 2023-2031 Housing Element and the Downtown Precise Plan. Below is a summary of the key findings furthering the redevelopment potential and opportunity for Orinda’s Downtown.
• A variety of market and real estate indicators suggest that Orinda’s downtown retail sector is underperforming and that many properties are likely providing modest or negligible financial returns to existing owners. Despite its relatively affluent population, Orinda’s retail sector never recovered from the Great Recession of 2008-09 and has further struggled due to the impact and aftermath of the COVID-19 pandemic. When adjusted for inflation, lease rates and sales volumes have declined continuously for at least two years and may not fully recover due to longstanding and pandemic-accelerated changes to retail trade more broadly. Moreover, the significant “leakage” of retail spending by Orinda residents to other jurisdictions has persisted for many years and reflects Downtown’s relatively weak position in a highly competitive retail market. The overall market conditions suggest that many properties are generating relatively weak economic returns to existing property owners in their current format and may be ripe for a change of use and /or redevelopment.
• Available data suggests that a large proportion of Downtown Orinda’s commercial properties are old, relatively low density, and outdated, suggesting that redevelopment to new and more intensive uses could unlock value relative to current conditions. While Downtown has good “bones” and strong supporting infrastructure, the age and level of development on many commercial properties suggest that they may present prime opportunities for redevelopment. By way of example, the median commercial floor area ratio (FAR), the ratio of building space to land area, is about .35 which suggests relatively low development intensity. Meanwhile the average commercial building size is roughly 12,000 square feet, relatively small for a successful downtown. Most of the buildings are also old (albeit not historic) with an average age of 58 years and mostly designated as Class C by the real estate community (indicating a low level of improvements and modern amenities).
• Fueled by its strong community attributes, Orinda has consistently maintained a highly favorable residential market, with growth across all housing types primarily limited by supply constraints rather than a lack of demand. While Orinda’s commercial district has struggled over the last several decades, the residential market has remained consistently strong. Home prices, rents, and occupancy rates in the city have historically outperformed Contra Costa County and the broader East Bay Region. The city’s attractiveness is fueled by strong community attributes, including a quaint, small-town feel, low crime rates, good schools, and a strategic location with convenient accessibility to major employment centers (facilitated by a Bay Area Rapid Transit (BART) station), among other factors. Furthermore, the rate at which buyers and renters typically absorb new or available housing suggests significant pent-up demand.
• The combined effects of poor commercial market performance, relatively low development intensity, and a strong housing market suggest that Orinda’s downtown is well-positioned for residentially-led reinvestment. Orinda’s relatively anemic retail sector (characterized by low sales volume, business closings, and leakage to surrounding communities), in conjunction with outdated and inefficient commercial land uses, makes the downtown area ripe for redevelopment. At the same time, continued strength in the city’s residential market and Downtown’s strategic location adjacent to BART and mixed-use amenities would suggest that appropriately scaled and positioned housing projects would likely be an attractive real estate investment.
In summary, unlike the commercial sector, the overall residential market dynamics in Orinda appear highly favorable to new development. Home prices and occupancy rates remain consistently high and resistant to economic downturns and available supply is rapidly absorbed. The juxtaposition between highly favorable residential and rather unfavorable commercial market conditions suggests a relatively lucrative opportunity for downtown property owners to pursue housing redevelopment.
Table 5-5A provides the current and planned zoning and General Plan land use designations for each DPP site. Table 5-6 provides a detailed description on the redevelopment potential for each DPP site. For determining capacity, the City assumed a mixed income approach for each site to not only provide for a more realistic assumption, but to ensure the city is affirmatively furthering fair housing. The City used the percentage of the RHNA category to distribute the units on each site (DPP- 1, -2, -3, -4, -6, -8, -14, -17,25, -38-41, and -44-46) and has distributed accordingly. The City assumed that 43 percent of each site will be affordable to lower income households, 16 percent will be affordable to moderate income households, and 41 percent will be affordable to above moderate income households. For sites that do not allow for at least 16 units per site (DPP-5, -9, -11, -24, -29, and -43) capacity was only allocated towards the moderate- and above moderate- income categories. Additionally, sites on the BevMo Block (DPP-10, -12 and -13), were allocated towards lower and moderate-income categories. This was based on the extensive interest in redevelopment of this site, coupled strategic thinking of only allowing limited leases, and overall owner interest. DPP-35 was allocated solely towards lower income due to the recent (2022) interest from an affordable housing developer.
Additionally, as previously discussed, to ensure the City is not over projecting development, a 60-percent realistic capacity was applied to each site to account for non-residential development, bringing the total capacity down to 421 units. The city also accounted for the fact that the entire DPP will not develop during the 6th cycle timeframe (2023-2031). Looking at the maximum residential assumption for the DPP (1,618 units) and the assumed realistic capacity of 421 units, the City is only assuming that only 26 percent of the DPP will develop during the 6th cycle planning period. See Figure 5-3 for a map of the DPP sites.
Source: City of Orinda, January 2023
Notes: 1 Site acreage was reduced by 50 percent
DPP-1
No current leases. Anticipated to be vacated by October 2022.
N/A- This was the parking lot for Phairs.
The property owner of this site also owns the Phair's site (DPP-2). Planning staff has met and discussed potential mixed use (retail and residential) redevelopment at several times since 2016; the most recent meeting in October 2020. The property owner also attended the stakeholder meeting with EPS in August 2022 and had continued interest in residential and/or mixed-use development. In 2017, staff met with a developer who was proposing a mixed-use retail and assisted living housing project that included this parcel as well as neighboring sites. The developer was working on the proposal in coordination with the property owner of this and the other sites that would be redeveloped for the project; repurposing of Avenida de Orinda was also discussed. That year the Planning Director and the City Manager also met with the property owner onsite, touring the vacant Phairs site and discussing potential mixed-use development of the parking lot as well as the Phairs building. In 2018, staff met several times with the property owner and a development team that was proposing to redevelop the site plus surrounding sites with a mix of retail, condominiums, and hotel. On February 17, 2022, the Planning Director talked with a different developer who said he was working with this property owner, as well as neighboring owners, on a mixed-use project consistent with the proposed Objective Design Standards that would include ground floor retail and multifamily units. Redevelopment of DPP-1 and DPP-2 with parcel consolidation would result in a 0.66 acre site. Staff’s conversations with the property owner have always included the development of both sites as one redevelopment project.
DPP-3
Built in 1926. Building has been vacant for over 20 years. Building is dilapidated and has not had any improvements in years. A permit was issued in 2019 to demolish the existing covered canopy that was failing. The City received a code enforcement complaint in 2020 of overgrown trees on the site, graffiti on the doors, a busted window large enough to crawl through, and easy entry into the building due to a missing fence.
The property owner of this site also owns the parking lot site behind Orinda Motors (DPP-1). Planning staff has met and discussed potential mixed use (retail and residential) redevelopment at several times since 2016; the most recent meeting in October 2020. The property owner also attended the stakeholder meeting with EPS in August 2022 and had continued interest in residential and/or mixed-use development. In 2017, staff met with a developer who was proposing a mixed-use retail and assisted living housing project that included this parcel as well as neighboring sites. The developer was working on the proposal in coordination with the property owner of this and the other sites that would be redeveloped for the project; repurposing of Avenida de Orinda was also discussed. That year the Planning Director and the City Manager also met with the property owner onsite, touring the vacant Phairs site and discussing potential mixed-use development of the parking lot as well as the Phairs building. In 2018, staff met several times with the property owner and a development team that was proposing to redevelop the site plus surrounding sites with a mix of retail, condominiums, and hotel. On February 17, 2022, the Planning Director talked with a different developer who said he was working with this property owner, as well as neighboring owners, on a mixed-use project consistent with the proposed Objective Design Standards that would include ground floor retail and multifamily units. Redevelopment of DPP-1 and DPP-2 with parcel consolidation would result in a 0.66 acre site. Staff’s conversations with the property owner have always included the development of both sites as one redevelopment project.
DPP-4 23 Avenida de
The main occupant is the property owner, Countryhouse, which builds and operates assisted
Parking lot was likely constructed in conjunction with the construction of a fire station on the site. The fire station building burned down and the site has been vacant for at least 40 years. Like the Phair's building, no improvements have been made on the site in years. Site does not appear to be maintained and contains overgrown vegetation.
This parcel has split ownership. The sites is 50 percent owned by the same owner as stites DPP-1 and DPP-2 and the other 50 percent is owned by a family trust. For the Phairs owner, see above. In 2017, the Planning Director met with a real estate agent and members of the family trust to discuss City plans for this area. Staff made it clear that mixed use retail and residential would be allowed, and the trust members expressed interest. The family trust was also represented by the developers noted above when specific projects were being considered. Staff’s discussions with the property owners have included consolidation with DPP-1 and DPP-2. The consolidation of DPP-1, DPP-2, and DPP-3 would result in a 0.99 acre site.
Built in 1949. Good condition. In 2017, staff met onsite with the property owner and potential redevelopment with residential use was discussed. The site is included with some of the aforementioned proposals.
DPP-5 63 Orinda Way 265-012-012
Orinda Motors
DPP-6 79 Orinda Way 265-011-002 Country Club Plaza Yes
Built in 1923. Good condition. Staff met with the property owner in 2016/17 as part of the Technical Assistance Panel by ULI. The property owner expressed some interest in potential redevelopment of this and their adjacent parcel, which together comprise the Orinda Motors business (DPP 5 and DPP-8)
Built in 1955. Structures appear to be inexpensively constructed and in poor condition. No major improvements have been made, perhaps since construction in 1955.
City staff met owner for the first time at the stakeholder meeting with EPS where the interest in residential development was expressed.
DPP-8 61 Orinda Way 265-012-010 Orinda Motors Yes
DPP-9 Brookwood Road 273-021-002 Portion of Parking Lot in Front of BevMo
DPP-10 6 Camino Pablo 273-021-005 Bevmo, Maya, Nation's, Reem's Steaks
DPP-11 50 Moraga Way 273-021-004 CVS
DPP-12 64 Moraga Way 273-021-003 Europa, Orinda Hardware, First Republic Bank, Loards
Yes
Built in 1962. Good condition. City staff met with the property owner in 2016/17 as part of the Technical Assistance Panel by ULI. Property owner expressed some interest in potential redevelopment of this and their adjacent parcel, which together comprise the Orinda Motors business.
Yes
Limiting leases to 5 years
The Nations restaurant use is moving across the street.
N/A- this is a portion of the Bevmo parking lot. It contains no structures.
Built in 1955. Good condition. Has not been updated.
Built in 1957. Fair condition. Has not been updated.
The BevMo block is owned by two family trusts. Staff has meet with representatives for one of the trusts on several occasions. Trust representatives also attended some of the meetings regarding the DPP. Trust representative have also had discussions with multiple potential developers in the past few years and remains in contact with the property manager for one of the family trust; staff has also met with the other family trust property manager. DPP-9, DPP-10, DPP-11, and DPP-13 are all under one family trust ownership. The family trust ownership has expressed interest in parcel consolidation for a redevelopment project. The consolidation of DPP-9, DPP-10, DPP-11, and DPP-13 would result in a 1.43 acre site.
Yes
DPP-13 80 Moraga Way 273-021-009 Well Fargo Bank Yes
DPP-14 9 Altarinda Road 260-192-004 Masonic Lodge Potentially
DPP-17 15 Altarinda Road 260-192-002 Professional Offices Several office spaces are currently available for lease.
DPP-24 112 Camino Pablo 262-290-006 Professional Offices
DPP-25 89 Davis Road 268-141-020 Professional Offices 1 empty office space currently available for lease
Built in 1949. Fair condition, has not been updated.
Built in 1983. Fair condition.
Built in 1952. Staff met with Masonic leadership for this center in early 2021. The discussion included the housing element and RHNA, the DPP, and gauged interest in potentially doing a housing project on the site, including the idea of a project that would keep the meeting hall either in its current form or perhaps a new facility in combination with housing.
Built in 1970s. Older building that does not utilize the entire property. County be developed around current use or building county be demolished and site redeveloped completely.
Built in 1970s. Older wood shingle roof building.
Consistent with several of the Downtown sites included in this analysis, vacancy provides opportunity for redevelopment.
Consistent with several of the Downtown sites included in this analysis, vacancy provides opportunity for redevelopment.
Built in 1983.
Consistent with several of the Downtown sites included in this analysis, vacancy provides opportunity for redevelopment.
DPP-29 5 Santa Maria Way 260-192-009 Professional Offices
DPP-35 1 Orinda Way 265-170-034 Lamorinda Martial Arts Studio, Orinda Hair Studio, Yu Bistro
DPP-38 19 Orinda Way 265-170-009 Parker Thatch, Village Pizza
2 empty office spaces currently available for lease
Built in 1958.
Consistent with several of the Downtown sites included in this analysis, vacancy provides opportunity for redevelopment.
Built in 1974. One of the state's largest affordable housing developers expressed interest redeveloping the site with multifamily affordable housing. Staff explained that this would be consistent with the Housing Element update and DPP. The developer was in talks with the property owner and expressed an interest in redeveloping the subject parcel and its adjacent parcel. The adjacent parcel, APN 265-170-037 is currently used as a parking lot for the subject parcel and is under the same ownership. While the adjacent parcel is not included as an opportunity site in the Housing Element, the two parcels would be consolidated for development for a total 0.72 acre site. The development would potentially use a portion of the parcel that used to be right-of-way; staff shared the County's quitclaim and easement for that part of the site.
2 empty retail spaces in this building have been for lease since March 2021.
DPP-39 21 Orinda Way 265-170-014 Hilton House, Dipping Nails, Genuine Goodness, UPS Store
DPP-40 27 Orinda Way 265-170-005 Rite Aid Yes- long term lease
Built in 1959. Appears to be in poor condition, and cheaply constructed.
This property was recently put up for sale. Staff explained the DPP mixed use plans to the leasing agent/broker representing the seller.
Built in 1956. Appears to be in poor condition, not well constructed.
Based on the conditional of the building, and the surrounding interest in redevelopment, City staff believes this site is appropriate to include.
Built in 1958. Fair to good condition. Building has not been updated on exterior.
DPP-41 31 Orinda Way 265-170-022 Bank of America Yes No
DPP-43 Vashell Way 268-142-008 Parking Lot adjacent to Casa Orinda
DPP-44 4 Orinda Way 260-191-006 Pinegrove Business Center Yes
DPP-45 25 Orinda Way 265-170-038
Professional Offices For sale
DPP-46 25 Orinda Way 265-170-040 Parking lot for office
Source: City of Orinda, January 2023
For sale
Built in 1964. Currently a vacant building (previously Bank of America) that was sold this year.
Staff met with potential buyers regarding mixed-use development on the site when the site changed hands a few years ago. It's unknown if the current owner is interested in mixed use, but staff has heard that the site is planned to be redeveloped. It is assumed that Rite Aid would move back into the redeveloped building and therefore the long term least would stay in place.
Site has been vacant for years. Bank of America recently put this parcel on the market. Staff worked with broker to ensure potential buyers understand the proposed rezoning to allow high density multifamily residential uses.
Year built unknown. Staff met with the property owner in 2016 and 2017. They were interested in the downtown planning process but have not participated since then. The adjacent parcel, APN 268-142-001 is under the same ownership as the subject parcel. DPP-43 is currently used as the parking lot for the adjacent parcel. While the adjacent parcel is not included as an opportunity site in the Housing Element, the two parcels would be consolidated for development for a total 0.39 acre site.
Built in 1981. Good condition. A portion of the site used as a parking is under repair.
Built in 1974. Older 3 story building with parking lot. The configuration of the building would be good for reuse. Property does have some overhead powerlines, but density could be achieved on space not located under power the lines.
City staff received an email from one of the Bay Area's largest developers regarding potential redevelopment of the site with multifamily residential. Staff reached out to discuss the proposal and to inform them of the proposed DPP densities and objective design standards. Staff has also met with the property owner to explain the proposed zoning changes and what that will allow.
City staff recently met with a potential developer who is interested in redeveloping the site with multi-family development based on the development standards in the draft Downtown Precise Plan (30 dwelling units per acre, subject to objective design standards). DPP-45 and DPP-46 are adjacent parcels under the same ownership. DPP-46 is currently being used as the parking lot for the existing building on DPP-45. The developer expressed an interest in redeveloping both parcels as one consolidated project. The two consolidated parcels would result in a total 1.67 acre site.
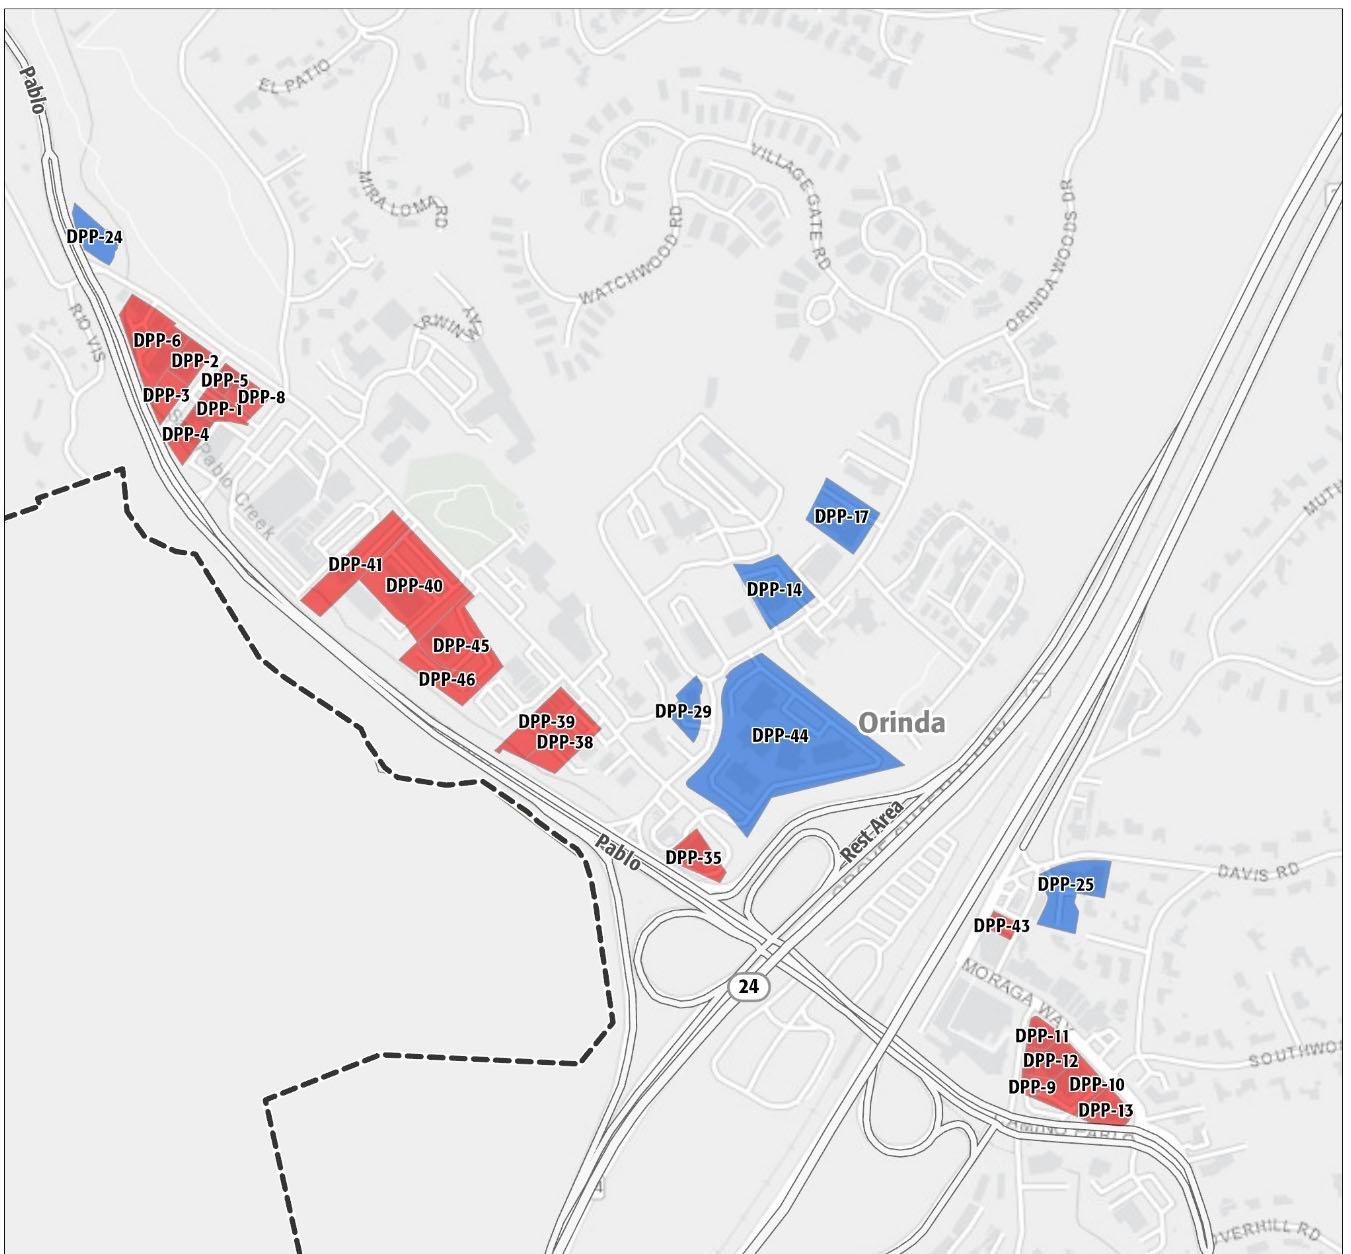
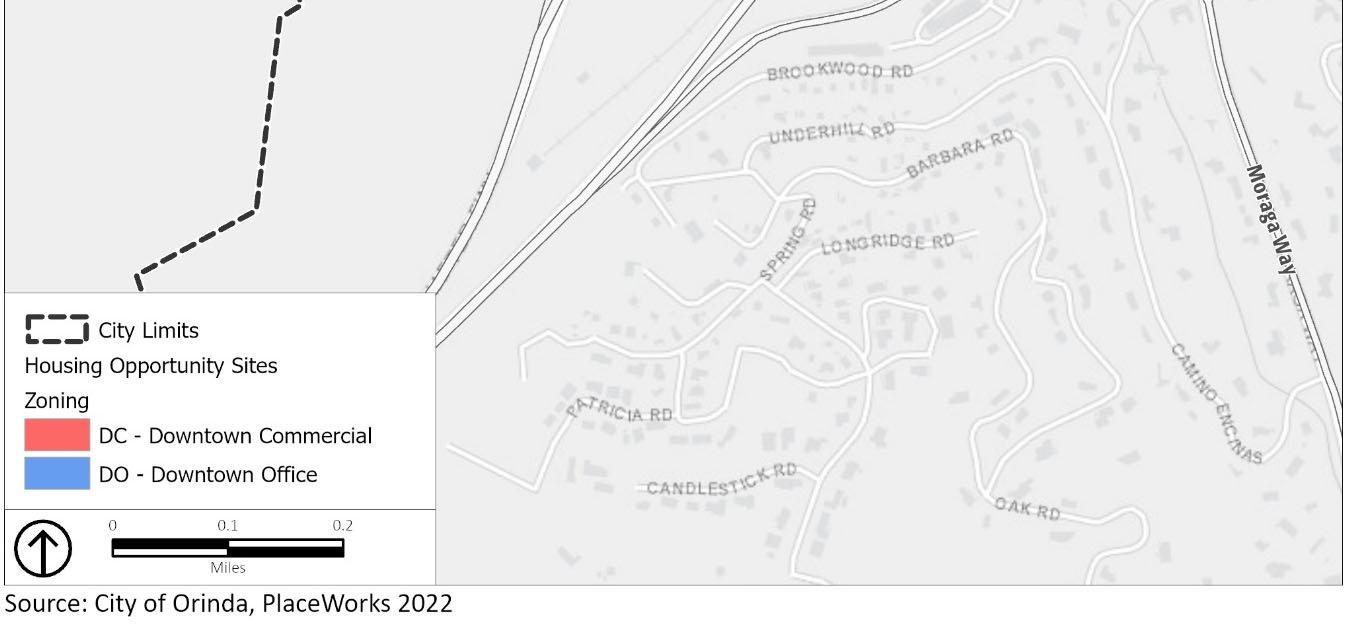
The City has identified several opportunity sites that could add to the city’s housing capacity (refer to Table 5-7). The City looked at available church sites with underdeveloped land, school sites with excess land, and Government (Caltrans) sites. As a part of the Housing Element update the city considered which sites provided the most certainty for development. Table 5-7 shows all sites considered including sites that are not being assumed as a part of this analysis. The sites not included in the analysis are shaded in grey.
Of the full list of opportunity sites, the City identified three possible existing churches with large surface parking lots presenting as underdeveloped land. Development of these sites assumes using the excess parking lots and possible vacant portions of the lot. Development does not assume removing the current church use but rather integrating housing. The intent is to rezone only a portion of the church property and the approximate percentage of the site assumed is listed in Table 5-7.
Figure 5-5 provides a map of all of the opportunity sites that are being analyzed as a part of the Environmental Impact Report (EIR). Figure 5-5 also denotes which sites are being considered under the EIR, and which are assumed in this sites analysis. Figure 5-6 identifies the sites the City proposes to rezone to accommodate the lower income RHNA and provides a closer look at the portion of the site that will be rezoned. As shown on Figure 5-6, the City is planning to apply the new RH-25 or RH-40 zoning districts to allow for increased density on the vacant/underutilized portion of each site.
The City has spoken with St Stephen’s Church and St John’s Orthodox Church and all churches participated in a survey early on in the process (2021) asking whether or not they would be interested in permitting housing on a portion of the church property. The City has a history of redeveloping church property. The Vista Verde Senior project was approved in August 2022 and proposes utilizing available Orinda Community Church-owned property to create new affordable housing opportunities in Orinda.
The proposed church properties identified in Table 5-7 are all very similar in nature to the recently approved Vista Verde project. The approved Vista Verde project involves development on the upper portion of the Orinda Community Church parcel. The portion of the parcel is partly an existing parking lot and partly undeveloped. All three church sites (Sites C-2, C-3, and C-4) are all either proposed to have development on an undeveloped portion of the lot or on the existing parking lot.
1. Holy Shepherd Church, site C-2 (433 Moraga Way) – Potential development area is the existing parking lot.
2. St. Marks Church, site C-3, (451 Moraga Way) – Potential development area is the rear undeveloped portion of the lot.
3. St. John’s Church, site C-4, (501 Moraga Way) – Potential development area is partially a parking lot and partially undeveloped. St. John’s has considered two different multi-family projects on their site within the last 10 years. In 2007, they had plans for a 3-story assisted living unit structure with 60 units. In 2015-2016, the church engaged with Agemark and had conceptual plans drawn for approximately 18 affordable senior housing units. Due to the site not being zoned appropriately, St John’s did not move forward with either project. St. John’s Church is very interested in building affordable housing on the potential development area portion of their site
and with the City completing the necessary rezoning, this removes potential barriers the Church may encounter.
Additionally, the City has found that similar developments are occurring in surrounding and/or nearby communities (Refer to section 5.7.5 for project examples).
The City looked at the Miramonte High School site, which has a large undeveloped portion of the southern side of the Miramonte High School property owned by Acalanes Union High School District (AUHSD). The City had conversations with the school district regarding housing development but no decisions have been made.
Additionally, the City was awarded a $75,000 grant through the Association of Bay Area Governments (ABAG) to work with government and nonprofit organizations to perform feasibility analysis for groups interested in developing housing on their property. A stakeholder meeting was held in September 2021 where a presentation regarding real estate development basics, affordable housing, and partnership options was given. To date, staff has been coordinating with three groups that have indicated a possible interest in housing:
● Orinda Union School District (OUSD)
● Acalanes Union High School District (AUHSD)
● St. John’s Church
These groups have met with staff and are still considering their options in regard to housing. These discussions have been very preliminary, with City staff explaining the RHNA process and EPS, the City’s economic consultant, explaining, in general terms, the economics of housing production.
As discussed in section 5.7.5, the City has had success in the past with mixed income projects on previously owned school property. Orinda Grove included 73-units, including 65 market-rate units and 8 moderateincome units. The project included relocation of the City-owned ball fields to the area near the northwesterly corner of the project site, and construction of an OUSD office building to replace the OUSD offices on the site.
The City has identified the Caltrans right-of-way adjacent to the Highway 24 Wilder Road off-ramp (Gateway, Site G-4) as a potential site to accommodate a portion of the City’s RHNA. This is an old potential cloverleaf site that is no longer planned for that use (Refer to Figure 5-4). It was determined that this site would need infrastructure support but is a prime candidate for development beyond that constraint. The Caltrans Gateway site is adjacent to the existing Wilder community which is served by utilities and infrastructure, and school bus service provided by a Joint Powers Authority (JPA) called the Lamorinda School Bus Transportation Agency (LSBTA). In addition, the adjacent Wilder community Development Agreement and CC&Rs require the eventual implementation of a shuttle to the BART Station and downtown. That service has not yet been instituted due to lack of demand due primarily to the COVID Pandemic. Once instituted, it could also potentially serve the Caltrans Gateway site. Pedestrian and bike access is available through the adjacent Wilder community via the Brookside trail connection to Moraga Way, and bikes are permitted on Highway 24 from the Wilder interchange to the Camino Pablo
interchange. A more direct trail connection between the site and the downtown can be explored as part of any future development proposal.
In conversation with City staff, Caltrans has discussed the possibility of decertification of this site and that there is no objection from Caltrans in proceeding with the decertification process for this right-of-way area. This right-of-way was originally purchased and graded for a Highway 24 cloverleaf onramp that Caltrans has no intention of ever constructing. Although the site has not yet been declared surplus by the state, the city is willing to shepherd the parcel through that process, including paying the associated fees in furtherance of affordable housing development. It is not the City’s intent to purchase the land but to work with the state to arrange for an affordable housing developer to lease or purchase and develop the land. In additional to meetings with Caltrans, city staff has met with the Department of General Services, and HCD to discuss making the Gateway sites available to affordable housing developers via the excess land/sites program created through the Governor’s order EO-06-19.
Should decertification be needed, the following steps and timeframes are assumed for this process:
1. City pays $35,000 deposit to Caltrans to cover staff time and initiate decertification process
2. Caltrans circulates proposed decertification internally, creates new parcel for site
3. Caltrans finalizes mapping and appraisal (if needed)
4. City passes resolution that property rights will be used for public purposes
5. City works with State to identify affordable housing developer to purchase property
6. After deed is finalized, decertified parcel is sold to affordable housing developer
Assumed total timeframe for decertification, including excess lands process: 36 months
The City has included two actions to assist with the development of the Caltrans Gateway site.
Action 1.C to rezone the site to the new Residential High Density-40 (RH-40) zoning district which will require a minimum of 20 units per acre with a maximum of 40 units per acre. The City will work with Caltrans and the State to decertify the site (formally remove it from the Highway 24 right-of-way, if necessary) or will pursue action through the Governor’s Executive Order to decertify the site, which may be pursued concurrently. The City will assist any interested developers with this process, including covering the cost for the decertification process. The City will biennially reach out to affordable housing developers to encourage development on this site and will initiate the decertification process by June 2023 and evaluate the decertification progress by June 2024 to determine if decertification will be completed by January 2025. If it is identified that completion of the decertification process will extend beyond January 2025, the City will identify additional sites to rezone, if a shortfall is identified, and rezone additional sites by January 2026.
Action 4.D to assist with the need for infrastructure in the way of grants and coordination with East Bay MUD and Action 1.C to assist in the decertification process and assist any interested developers with decertification requirements.
In summary, the following list identifies why the Caltrans Gateway site is appropriate to accommodate a portion of the City’s RHNA.
• The site is situated similarly to the recently-approved 34 unit congregate care facility on the opposite side of Hwy 24 at Wilder Road.
• This site is one of the viable, large vacant plots of land available in Orinda.
• This site is a potential candidate for affordable housing under the Governor's Order regarding excess land that are owned by State agencies.
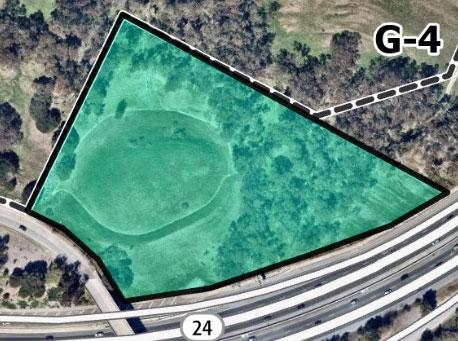
• The site is located in a high resource area in close proximity to a major recreational facility, a performing arts venue, public trails and open space, and Orinda's newest neighborhood.
• With improved pedestrian and bike connection, shuttle or transit links, it is also close and accessible to downtown Orinda and BART.
• The City has committed to pursuing the Caltrans decertification process and is exploring the Excess Lands program with our local legislators.
In summary, the capacity from the opportunity sites identified (Church Properties, School Site, and the Caltrans Gateway site) to meet a portion of the City’s lower income RHNA will provide capacity for 486 units, which is more than 50 percent (227 units) of the identified shortfall. These sites will be rezoned to RH-25 or RH-40 district. The land use designation on each site will also be amended to the new Residential – High Density Multi-Family or the Residential – Very High-Density Multi-Family (Actions 1.B and 1C).
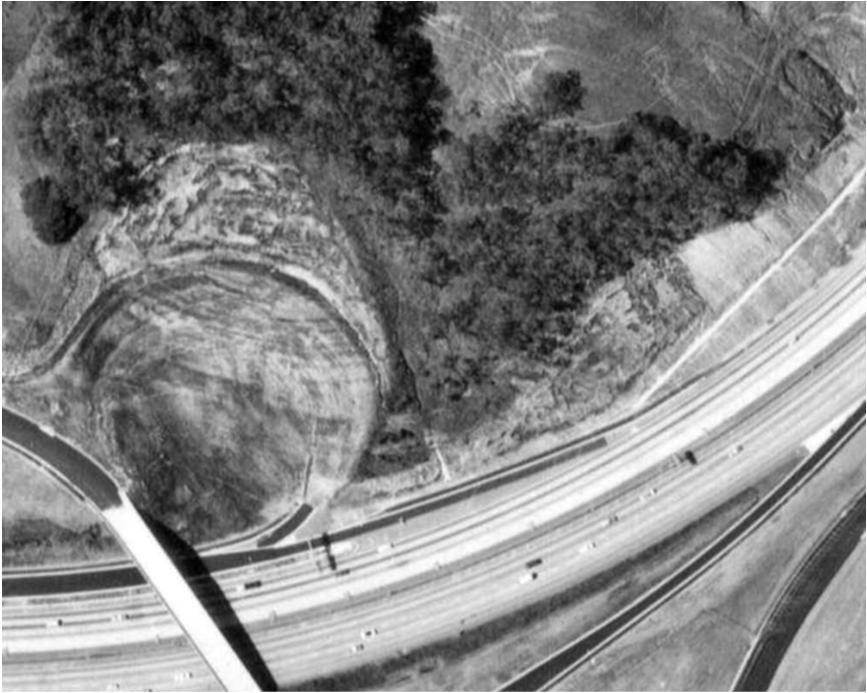
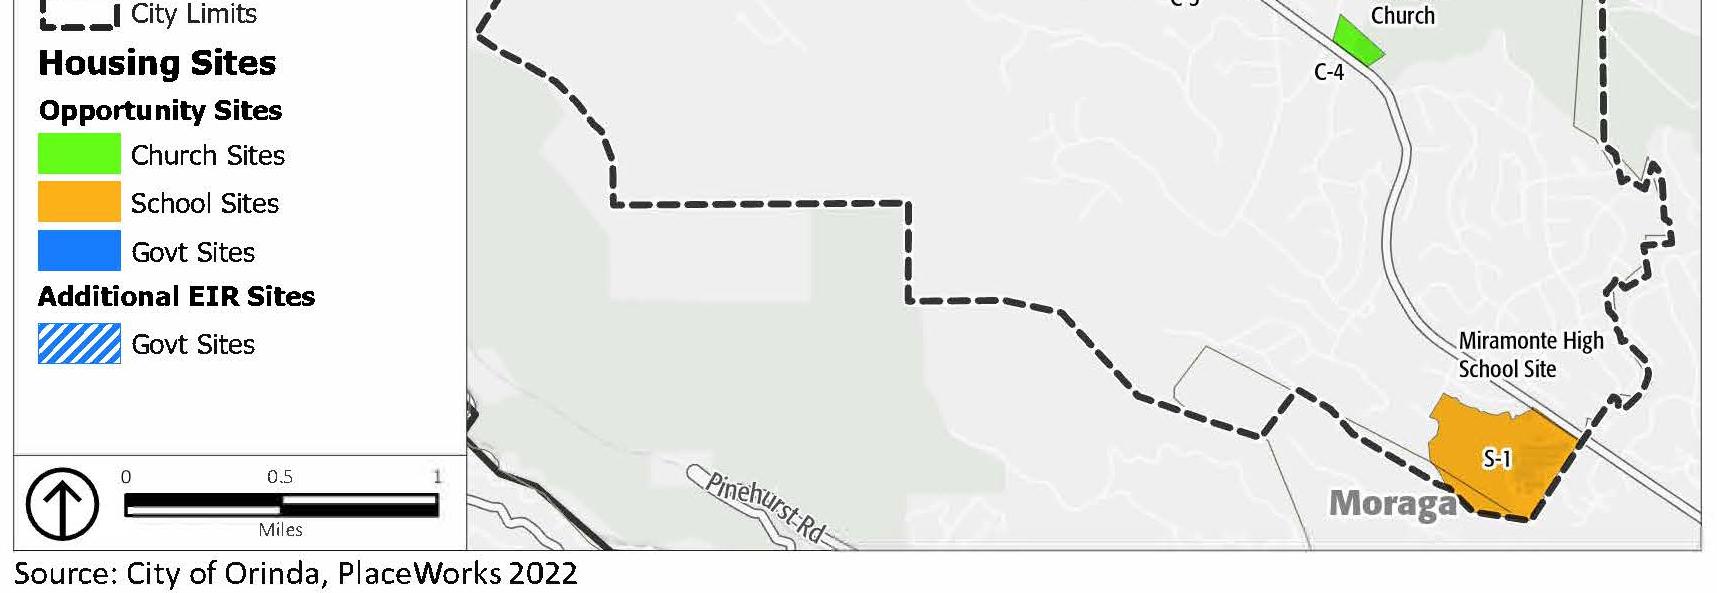
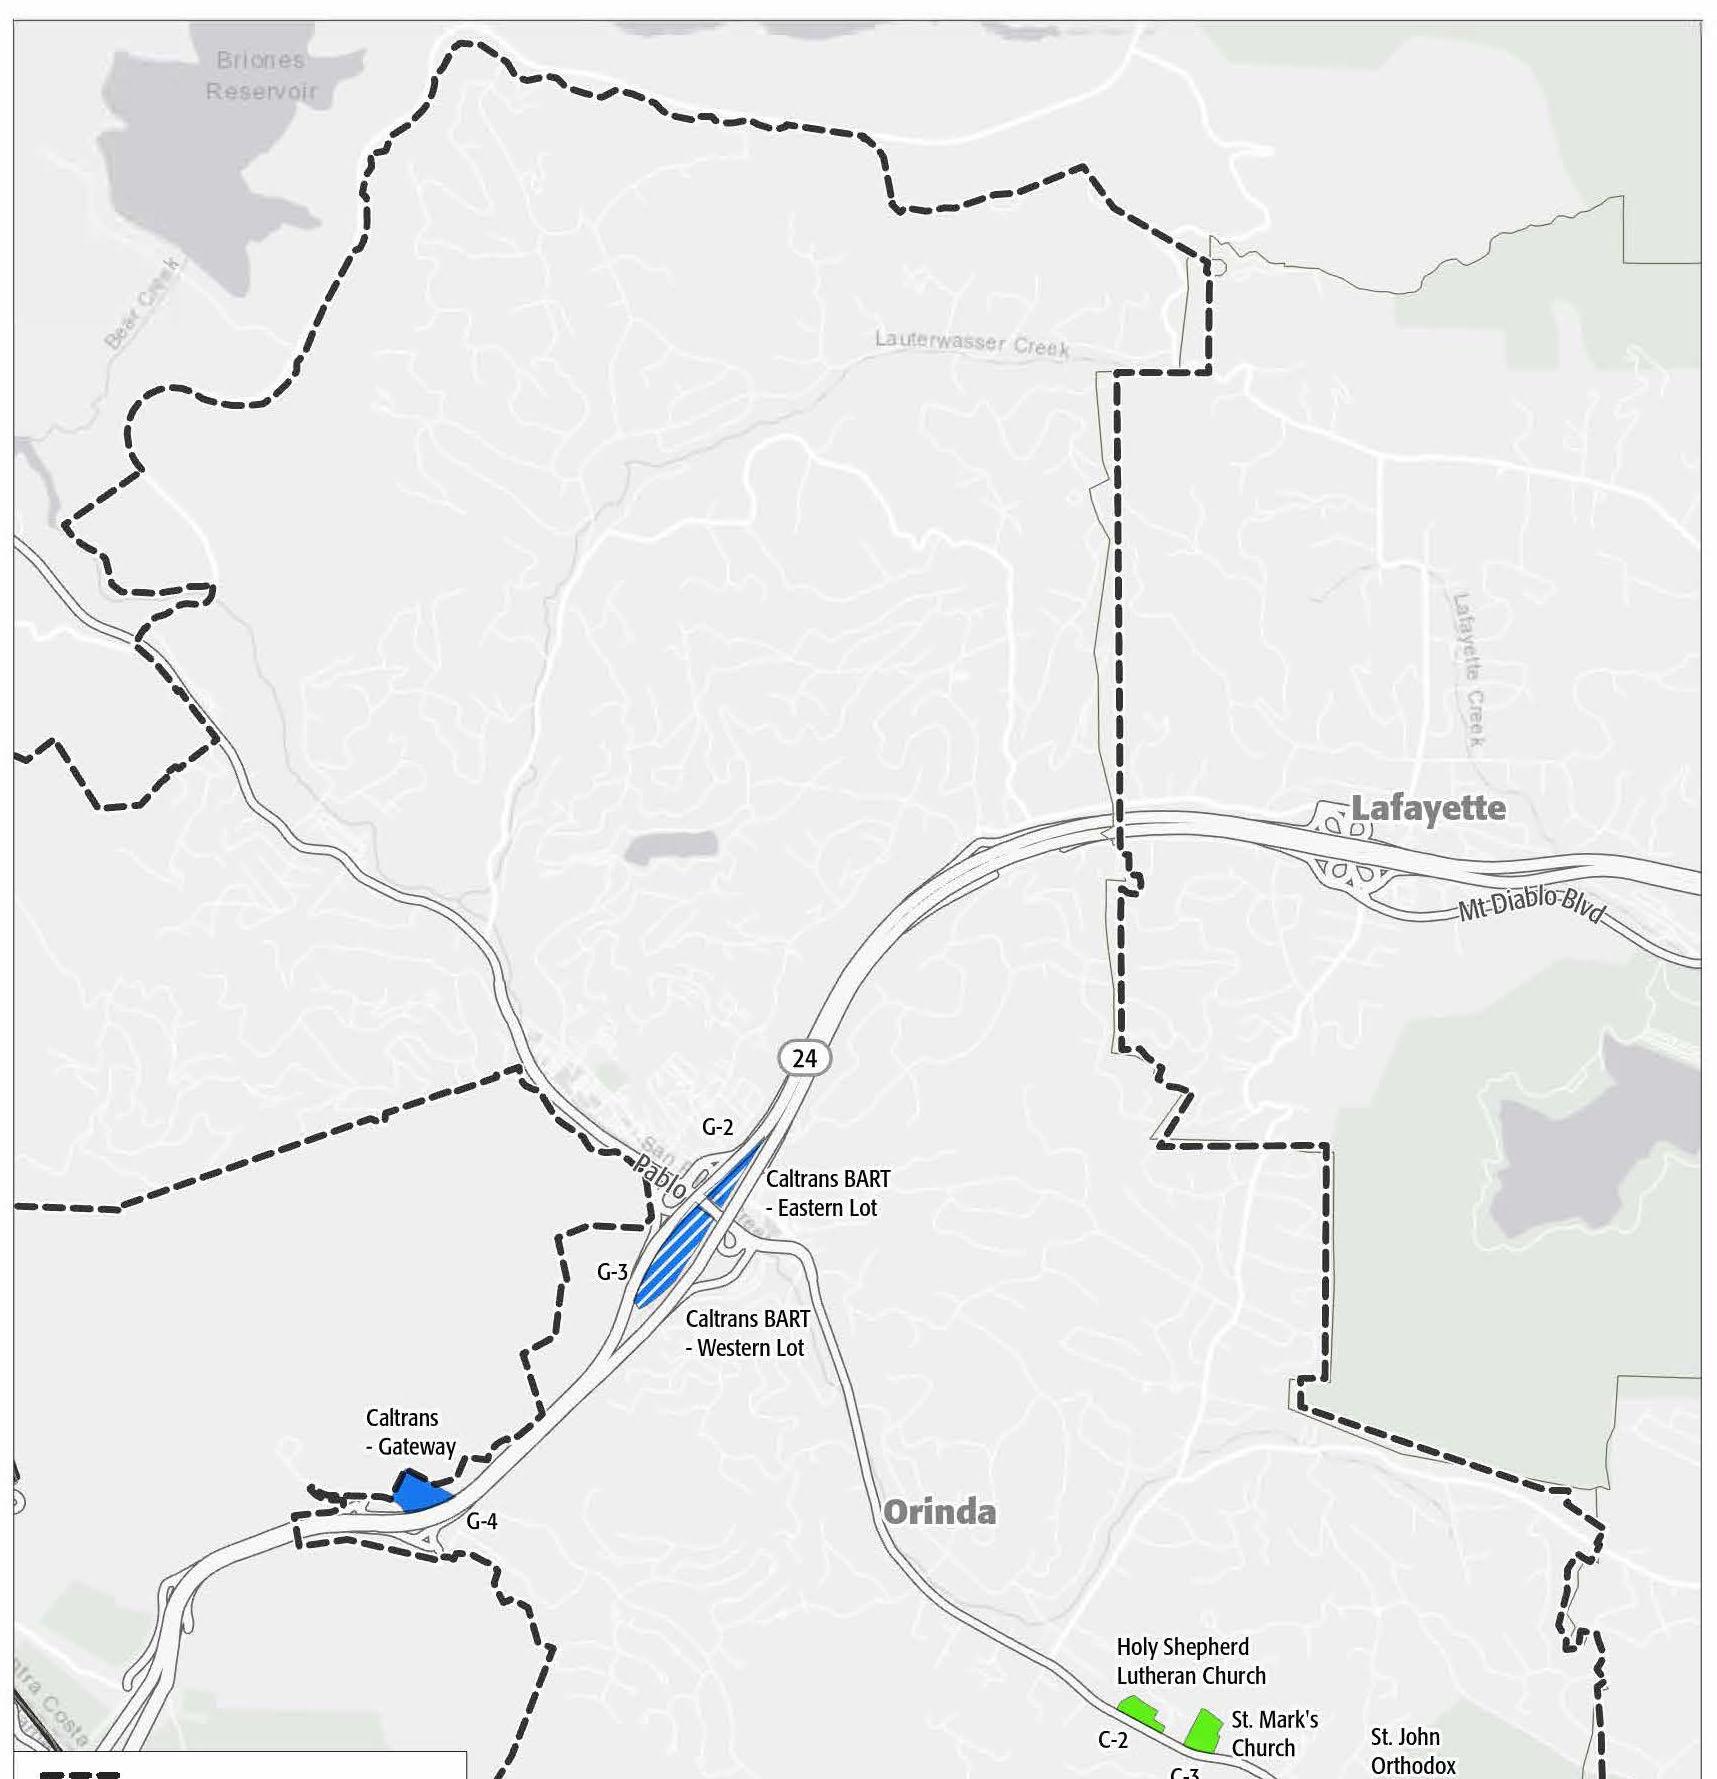
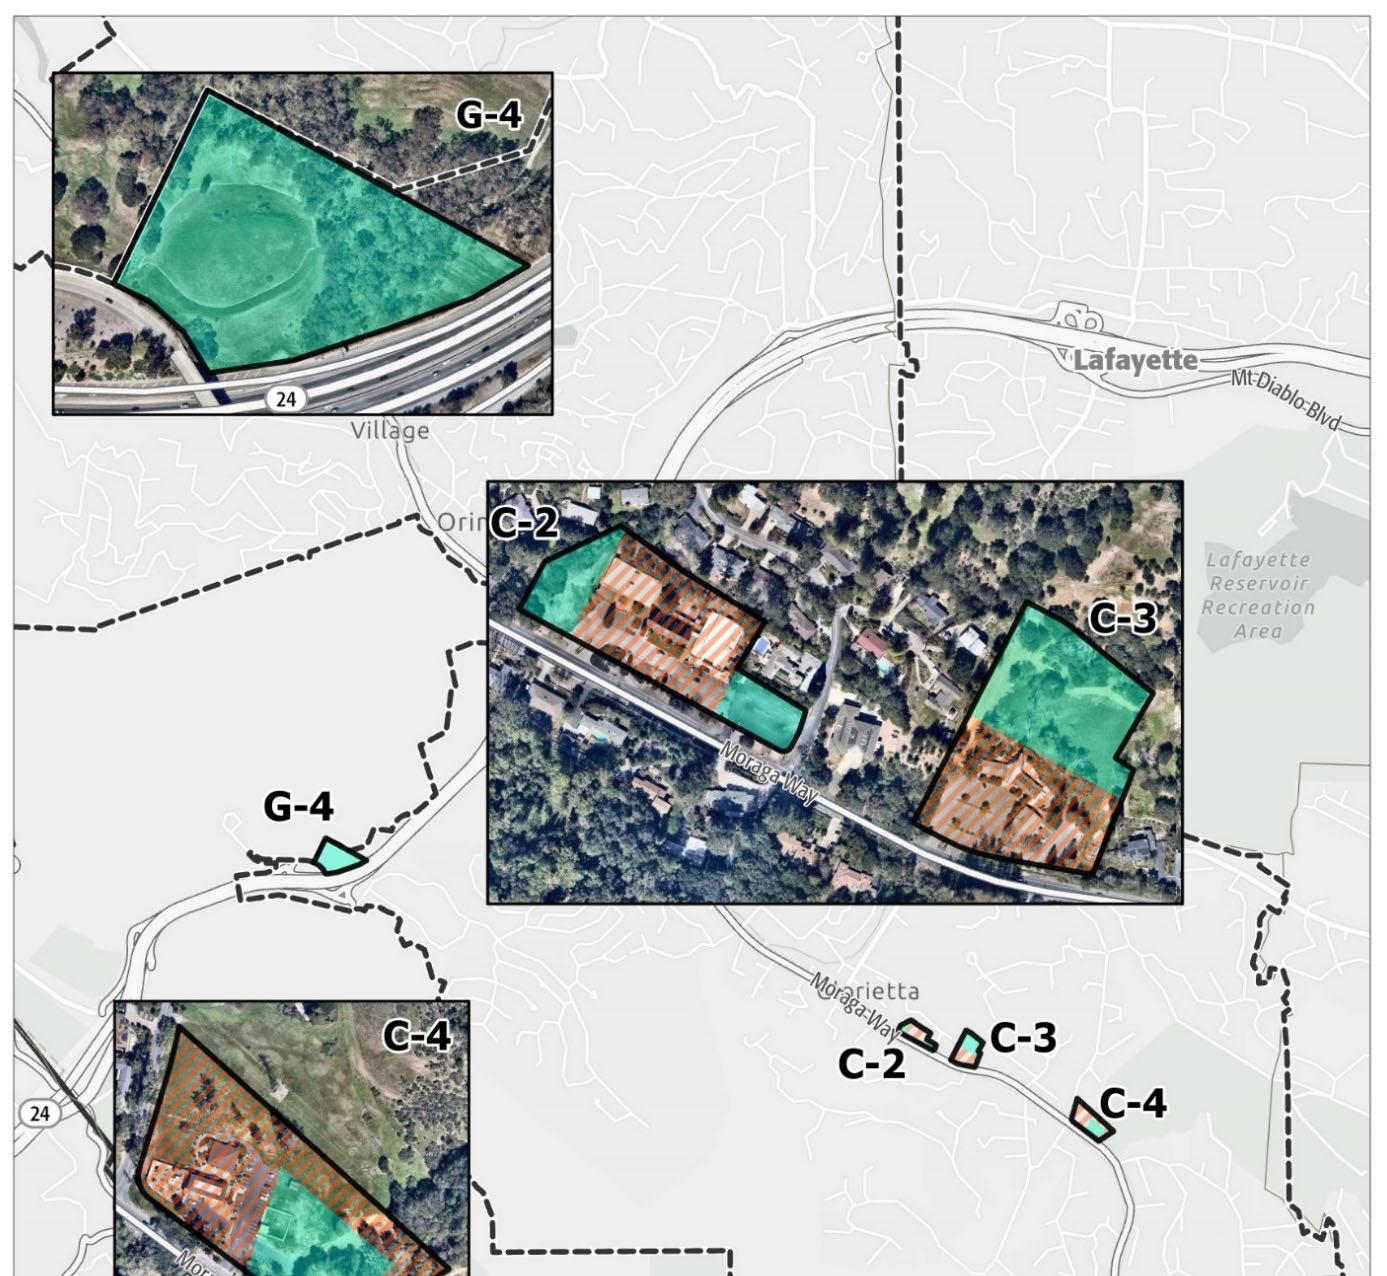
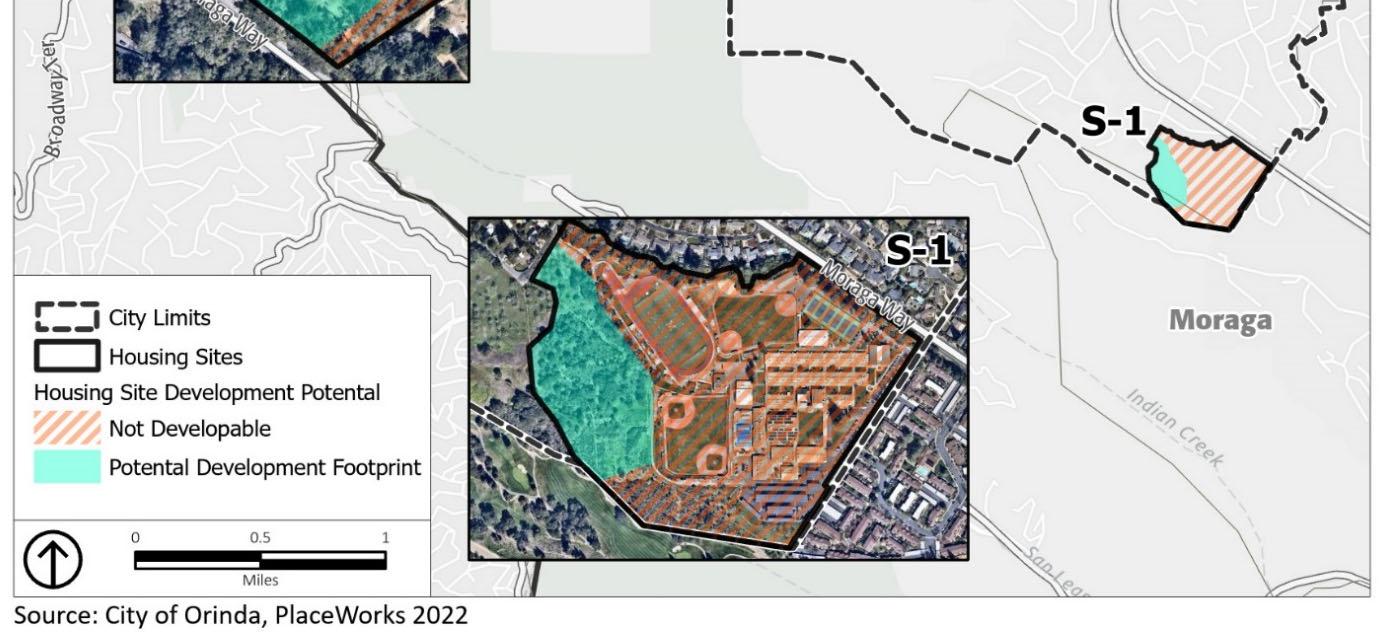
The Bay Area Rapid Transit (BART) sites (Sites G-2, and G-3) are not assumed in the City’s site inventory capacity at this time. While these sites are prime for housing, and are being analyzed under the EIR, there are some identified constraints that could make these sites harder to develop. Should some of the identified constraints be mitigated, the city could consider including both the eastern and western BART parking lots as sites to meet the RHNA. The current identified constraints to development are summarized in the following bullets.
● Timing- As noted in a letter from BART on March 7, 2022, the BART Transit Oriented Development (TOD) Work Plan identifies the Orinda station in the mid-term phasing plan with an estimated timeframe of 2025-2030. While this would be within the Housing Element planning period, the challenges with ownership and other constraints may not likely result in housing development during the 6th Cycle.
● Ownership -The BART parking lots are owned by Caltrans and subject to BART easement.
● Density/Height-BART’s Technical Guide to AB 2923 identifies the Orinda station as a Neighborhood/Town Center station. Neighborhood/Town Center stations have a baseline zoning of 75 du/ac with an allowable building height of 5 stories or more. While AB 2923 does not apply to Orinda because BART does not own the station, BART may be unlikely to accept a density or building height below the baseline zoning.
● Planning for Two Parking Lots-If a housing project was proposed in the parking lots, it is assumed that BART would request that both parking lots are considered together as one.
● Parking-Development would likely result in a loss of parking spaces. BART is currently prioritizing sites where replacement parking is minimized. Orinda’s station is auto dependent, meaning there would be an expectation of a higher amount of replacement parking and presents a challenge for a project to be financially feasible.
● Development Standards-Other than the existing zoning regulations, the City does not have any development standards specifically for the BART parking lots. The City would be in a better position to develop a specific plan or objective design standards prior to moving forward with residential development.
As shown below, the city has a track record of developing affordable and market-rate housing on nonvacant sites, including church property, school district-owned sites, and other parcels that have underdeveloped and or underutilized land, including the former City’s library. The City also gathered data for surrounding jurisdictions to show trends of similar redevelopment and uses on the same types of properties.
To promote the development on Non-Vacant Sites, the City has included Action 1.K to establish an outreach and coordination program to connect developers, builders, and owners of non-vacant sites.
Vista
The Vista Verde Senior Housing Project, approved in August 2022, includes 52 affordable units on 1.4 acres of the 4.86-acre site. The project will be developed next to its sister community, the existing 150-unit Orinda Senior Village (OSV). This site is currently non-vacant, and the uses include a church and an existing parking lot. The project site will be on its own lot created via subdivision. That lot has been rezoned from Public, Semi-Public and Utility (PS) to Residential Multifamily (RM) with the Senior Housing Overlay (SHOverlay). The SH-Overlay allows for densities up to 38 units per acre. The 52 units for this site is the maximum allowable density for the 1.4 acres, showing a 100-percent realistic capacity. This project did not include any density bonus units but is taking advantage of concessions under the density bonus law.
Project Type: Affordable -- Nonvacant, church property
Maximum Allowable Height: 27 feet
Maximum Allowable Density: 38 du/acre
Monteverde Senior Apartments
Eden Housing, LLC constructed the Monteverde Senior Apartments with completion in December 2014. The project included 67 units affordable to extremely low- and very low- income senior households on a 1.4-acre site. This project was developed on what was the former Orinda Library. The site required rezoning from PS to RM SH-Overlay to allow densities up to 38 units per acre. This project received a density bonus (14 units), and the project was developed at a density of 47.9 units to the acre with a realistic capacity of 126 percent. Excluding the density bonus units from the calculation, the realistic capacity was 100 percent.
Project Type: Market Rate -- Nonvacant
Maximum Allowable Height: 40 feet
Maximum Allowable Density: 47.9 du/acre
Orinda Grove
The former Orinda Union School District’s (OUSD) Pine Grove School property was declared surplus in December 2003. The City adopted the Pine Grove Neighborhood Design Policies and Guidelines to facilitate medium-density residential development on the property in 2004. In 2008, the City approved a 73-unit residential project on the site, including 65 market-rate units and 8 moderate-income units. The project included relocation of the City-owned ball fields to the area near the northwesterly corner of the project site, and construction of an OUSD office building to replace the OUSD offices on the site. The 11.1acre site was rezoned PD (Planned Development) as part of the approval process.
Project Type: Nonvacant, school property
Maximum Allowable Height: 35 feet
Maximum Allowable Density: 6-10 du/acre
Surrounding Jurisdictions Project Examples – Mixed-Use, Nonvacant Sites, and Church property developments
1312 Laurel Street – San Carlos
The project located at 1312 Laurel Street in San Carlos includes a two-story, mixed-use building with 2 ground-floor commercial spaces and 2 residential units on the second floor. The residential units are twobedroom units, and each unit is approximately 1,500 square-feet in size. The roof is utilized as a rooftop garden for the residential units. The zoning district permits 20 units per acre, resulting in two allowable units on the 0.11-acre site. A density bonus was not utilized for this project. The structure has a 38-foot building height where a maximum 50-foot building height is allowed.
Project Type: Market rate-- Mixed use
Maximum Allowable Height: 38 feet
Maximum Allowable Density: 20 du/acre
1435 Webster Street – Alameda
The project located at 1435 Webster Street is a three-story, mixed-use project with three ground-floor commercial tenant spaces and nine residential units on the second and third floor. The site allows for up to seven residential units and the applicant utilized a 24 percent density bonus for two additional units. The project includes eight two-bedroom units ranging from approximately 1,000-1,300 square-feet in size and 1 three-bedroom 1,925 square-foot unit. The building meets the maximum 40-foot building height with an additional 2 feet of allowed architectural elements, resulting in a total 42-foot building height.
Project Type: Market rate -- Mixed use
Maximum Allowable Height: 42 feet
The Mill at Brown – Lafayette
The Mill at Brown project located at 3408 Mt. Diablo Boulevard in Lafayette’s Downtown includes 13 three-story townhomes with units ranging from1,100-1,800 square-feet in size. The zoning district permits 35 units per acre, resulting in 12.25 allowable units on the 0.35-acre site. Utilizing a density bonus, the applicant rounded up to 13 units. The building includes a 33-foot 6-inch building height where a maximum 35 feet height is allowed. This project included two below market rate (BMR) units.
Project Type: Affordable/Market Rate -- Mixed use, non-vacant
Maximum Allowable Height: 35 feet
Maximum Allowable Density: 35 du/acre
210 Lafayette Circle – Lafayette
The project located at 210 Lafayette Circle in Lafayette’s Downtown is a 0.38-acre site that was the previous used as a restaurant. At the time of approval, the building was vacant. The zoning on this site allows for 35 units to the acre (total of 13 units with allowable density) and has a 35-foot maximum building height. The approved Project is a mixed-use project with 12 units (including 2 BMR units) with a maximum building height of 34 feet with 700 square feet of ground floor commercial live/workspace.
Project Type: Affordable/Market rate -- Mixed use and nonvacant
Maximum Allowable Height: 35 feet
Maximum Allowable Density: 35 du/acre
St Paul’s Commons – Walnut Creek
St Paul’s Commons is on the grounds of St. Paul’s Episcopal Church and was completed in May 2020. The project consists of 44 affordable housing apartments (30 studios, and 14 on-bedroom apartments) that are managed by Resources for Community Development (RCD) and the John Stewart Company. Trinity Center, which serves the homeless and working poor, resides on the ground floor, alongside meeting space that is available for other parish and non-profit community activities. The entire parcel is 0.65 acres and the St. Paul’s Commons was developed on the vacant portion of the site. The project was developed at 70 units per acre.
St Paul’s Commons was developed in partnership with RCD and supports the Church’s outreach ministries and was methodically designed to aesthetically fit into and enhance the Church campus as well as the surrounding neighborhood. St. Paul’s Commons is leased by St. Paul’s Episcopal Church.
Project Type: Affordable --Church property
Maximum Allowable Height: 50 feet
Maximum Allowable Density: 43 du/acre
Jordan Court – Berkeley
Jordan Court is a housing community of 35 affordable studio units for seniors in the heart of North Berkeley that was completed in February 2022. Jordan Court was developed in partnership with All Souls Episcopal Parish and includes administrative and residential space for the church. The entire parcel is Jordan Court was developed on the vacant portion of the sites.
Project Type: Affordable -- Church property
A small site is classified as a site that is smaller than one half acre in size. The city is relaying on 12 sites to meet a portion of the RHNA that are located in the DPP that are smaller than one half acre, as shown in Table 5-8 and in the Sites Inventory section. The City is assuming that 26 units would be affordable to lower income households, making up 4.2 percent of the lower income RHNA. Several of the smaller sites specifically in the County Club Plaza Shopping Center (Sites DPP 1- 6) and sites on the BevMo block (DPP9-13) have the same owner, vacant buildings, and vacant parking lots which makes consolidation more feasible.
The existing Orinda Municipal Code already includes robust procedures allowing for consolidation (i.e., merger) of small parcels in common ownership. Those procedures can be found in Orinda Municipal Code Chapter 16.16 (MERGERS) and Chapter 17.20 (LOT LINE ADJUSTMENTS AND VOLUNTARY LOT MERGERS). These existing procedures are efficient, familiar to City staff, and would likely be used to facilitate development consistent with the Housing Element. As such, many of the sites that are now identified as smaller than 0.5 acre would likely be larger than 0.5 acre at the time development is actually pursued. Please refer to Table 5-6 for detailed parcel information, including information regarding adjoining parcels that are already in common ownership and/or currently used in a consolidated manner
When looking at project examples from nearby communities with similar characteristics such as, lot sizes, allowable densities, development standards, current uses (department stores, grocery stores, automotive uses, etc.), and affordability, it concludes that development on small lots is not a constraint. Additionally, while lot consolidation is an option, based on project examples, lot consolidation would not be necessary for these sites to develop, which provides for more flexibility to the property owner and/or developer. To further ensure that these sites are feasible for development, the City has included Action 1.L to assist with lot consolidation and provide incentives for development on these sites and continue allowing lot mergers as a part of the City’s current procedures.
Looking at the City’s current polices and procedures, new actions included in the Housing Element and project examples from neighboring communities, small site development is not seen as a constraint and the identified small sites are appropriate to accommodate a portion of the City’s lower income RHNA.
Source: City of Orinda, January 2023
Project Examples
The following projects show that development of market rate and affordable units is feasible on small lots.
Vacant Project Examples
San Pablo – 1971 23rd Street
● Approved February 2022
● Vacant site
● Lot Size – 0.06 acres
● Stories/Height – 2 stories/23’ height
● Maximum density – 55 du/ac (Market Rate – 7 units)
Lafayette – Chestnut Townhomes
● Approved July 2018 with 5-attached townhomes
● Vacant site
● Lot Size – 0.28 acres
● Stores/Height – 2 stories/22’-3” height
● Maximum density – 35 du/ac (Market Rate – 9 units)
Lafayette – 942 Dewing Avenue
● Approved March 2015 with 5 single-family and duplex dwelling units
● Vacant site
● Lot Size – 0.22 acres
● Stories/Height – 2 stories/25’ height
● Maximum density – 35 du/ac (Market Rate – approximately 8 units)
Lafayette – 950 Hough Avenue
● Approved March 2021
● Vacant site
● Lot Size – 0.43 acres
● Stories/Height – 4 stories/49’ height
● Maximum density – 35 du/ac (Affordable/Market Rate – 3 lower and 18 above moderate income units)
Lafayette – Samantha Townhomes
● Approved July 2021
● Vacant site
● Lot Size – 0.39 acres
● Stories/Height – 2 stories/35’ height
● Maximum density – 35 du/ac (Affordable/Market Rate --2 low- and 10 above moderate- income units)
Non-Vacant Project Examples
El Cerrito – Mayfair Phase II project
● Construction late 2023
● Non-vacant – grocery store and gas station
● Lot Size – 0.48 acres
● Stories/Height – 5 stories/60’ height
● Maximum density – 35 du/ac (100 percent affordable -- 44 very low-, 24 low-income , and 1 above moderate managers unit for a total of 69 units).
Concord – Galindo Terrace project
● Construction late 2023
● Non-vacant – gas station, billboard, and two-story building
● Lot Size – 0.53 acres
● Stories/Height – 5 stories
● Maximum density – 100 du/ac (100 percent affordable – 62 lower income units)
Pleasant Hill – Harb Subdivision
● Pending Approval 2023
● Non-vacant –two residential buildings
● Lot Size – 0.34 acres
● Maximum density – 29.4 du/ac (100 percent affordable – 9 very low-income units)
Lafayette – The Mill at Brown
● Under Construction 2023
● Non-vacant – auto oriented retail uses
● Lot Size – 0.38 acres
● Stories/Height – 3 stories/33”-6’
● Maximum density – 35 du/ac (Affordable/Market Rate – 2 lower, 11 above moderate-income units)
California Government Code Section 65583.1(a) states that a town, city, or county may identify sites for accessory dwelling units (ADUs) based on the number of ADUs developed in the prior housing element planning period, whether the units are permitted by right, the need for ADUs in the community, the resources or incentives available for their development, and any other relevant factors. Based on recent changes in state law reducing the time to review and approve ADU applications, requiring ADUs that meet requirements to be allowed by right, eliminating discretionary review for most ADUs, and removing other restrictions on ADUs, it is anticipated that the production of ADUs will increase in the 6th-cycle housing element planning period.
The City issued building permits for 4 ADUs in 2018, 7 in 2019, 9 in 2020, and 21 in 2021, showing a growth pattern over the last 4 years. This analysis assumes that the number of ADU applications and permits will average 10 ADUs per year, for a total of 80 ADUs during the planning period. To promote ADUs, the City has included Action 1.E to comply with State law and make construction of ADUs feasible for more property owners.
To determine assumptions on ADU affordability in the ABAG region, ABAG conducted a regional analysis of existing ADU rents and prepared a draft report in September 2021. The analysis resulted in affordability assumptions that allocate 30 percent of ADUs to very low income, 30 percent to low-income households, 30 percent to moderate-income households, and 10 percent to above-moderate-income households. Affordability of ADUs projected to be built in the city during the planning period were based on the ABAG analysis and were slightly adjusted to be more realistic for Orinda and to not over project for lower income households. This adjustment assumes that 45 percent instead of 60 percent of the projected ADUs will be affordable to lower (very low- and low-income households), and 45 percent instead of 30 percent will be affordable to moderate. Of the 80 ADUs projected to be built, it is estimated that 18 units will be affordable to very low-income households, 18 units will be affordable to low-income households, 36 for moderate-income households, and 8 for above-moderate-income households.
To ensure that the City has sufficient capacity to accommodate the RHNA throughout the planning period, HCD recommends in their Housing Element Site Inventory Guidebook (Government Code Section 65583.2) that the City create a buffer in the sites inventory of at least 15 to 30 percent more capacity than required, especially for capacity to accommodate the lower income RHNA.
Table 5-9A and 5-9B compare the City of Orinda’s RHNA to the sites inventory capacity. Accounting for the current site capacity and the proposed rezone capacity, the city will have a surplus of 205 for lower income (including extremely low-, very low-, and low-) household, 6 units available to moderate- income households, and 48 units available to above moderate-income households, for a total surplus of 259 units. The 205-unit surplus for the lower income RHNA equates to a 35 percent buffer.
The City is relying on Actions 1.A, 1.B, and 1.C, to ensure there are adequate sites to accommodate the RHNA for all income categories.
Source: ABAG 2021, City of Orinda, January 2023
TABLE
INCOME CATEGORY (CONT.)
Notes
ABAG 2021, City of Orinda, January 2023
1 50 percent of the shortfall, or 227 units will be met on sites that allow for exclusively residential development (Action 1.B, Action 1.C).
2 Surplus equates to a 35 percent buffer for the lower income RHNA which provides sufficient capacity should Action 1.C not be implemented within the planning period. If Action 1.C is implemented, Site G-4 would provide additional surplus.
State law requires that the Housing Element include an evaluation of potential constraints to housing production and conservation. Constraints are broadly characterized as being “governmental” and “nongovernmental.” Governmental constraints include land use controls, building codes, site improvement requirements, developer fees, and policies or procedures that make it difficult or expensive to build housing in the city. Non-governmental constraints are associated with factors such as the cost of land, the adequacy of infrastructure, the availability of credit and financing, and community views on development.
Orinda’s General Plan was adopted in 1987, two years after the City’s incorporation. The intent of the General Plan is to express the City’s values and goals for future development. The plan consists of two volumes, including Plan Policies (Volume 1) and a Technical Supplement and Environmental Impact Report (EIR) (Volume 2). Volume 1 is organized in four sections. The Land Use and Circulation section includes policies for the city as a whole, as well as specific policy direction for Downtown Orinda and Gateway Valley (also known as Wilder). It also addresses open space, parks, schools, utilities, and transportation. The Housing section corresponds to the Housing Element of the General Plan. The Environmental Resources Management section meets the state mandate for conservation, safety, and noise elements. The Growth Management section meets the Contra Costa County mandate established by voter-approved Measures C and J.
The General Plan has been amended several times since 1987, primarily in response to development approvals and land use policy changes. Given the city’s built-out character, most of the goals and policies in the existing General Plan continue to remain current and valid. The overall goals of the General Plan are to preserve the high quality of Orinda’s residential neighborhoods, enhance the “village” character of the downtown, and preserve the open spaces and natural resources in and around the city. The plan balances housing needs with infrastructure capacity and environmental planning considerations. The General Plan does not envision major changes in the character of Orinda, nor does it anticipate any significant growth in the city’s employment base.
The plan includes a Land Use Map that identifies the types of uses and densities/intensities of use permitted within the Orinda planning area. The map includes three residential categories, two downtown categories, a public/semi-public category, a parks/recreation category, an open space category, and a utilities category. A separate category has been created for the Gateway Valley Specific Plan area.
The five residential categories allow:
● Residential – Very Low-Density, Single Family (5-10 acres per unit)
● Residential – Low-Density, Single-Family (1-2 units per acre)
● Residential – Multi-Family (6–10 units per acre)
● Residential – High Density Multifamily (20-30 units per acre) (Action 1.D)
● Residential – Very High Density Multifamily (30-50 units per acre) (Action 1.D)
The multifamily category allows densities greater than 10 units per acre for senior housing, provided the impacts are comparable to non-age-restricted units developed at 10 units per acre. In addition, and where necessary to accommodate the RHNA, the city may also permit housing at densities exceeding 10 units per acre for non-age restricted housing. To ensure the city has a General Plan land use designation consistent with the proposed RH-25 and RH-40 zoning districts, the City will create two new Land Use Designations – the Residential, High Density Multi-Family land use designation that will allow for 20-30 units per acre and the Residential, Very High Density Multi-Family land use designation that will allow for 30-50 units per acre (Action 1.D).
The primary tool for implementing the General Plan is the City’s Zoning Ordinance (Title 17 of the Orinda Municipal Code). The ordinance considers the categories and designations on the General Plan Land Use Map, as well as General Plan policies to conserve neighborhood character, manage traffic and service impacts, and protect environmental quality. There are nine residential (RV- and RL-) zones, as listed below. A summary of the zoning and development standards for RL-40, RL-15, RL-10, and RM is presented in Table 6-1 and are available on the City’s website.
Single Family Zones:
● Residential Very Low Density – Estates (RVL-E): minimum net lot size of 10 acres
● Residential Very Low Density (RVL): minimum net lot size of 5 acres
● Residential Low Density (RL)
RL-40: minimum net lot size of 40,000 square feet
RL-20: minimum net lot size of 20,000 square feet
RL-15: minimum net lot size of 15,000 square feet
RL-12: minimum net lot size of 12,000 square feet
RL-10: minimum net lot size of 10,000 square feet
RL-6: minimum net lot size of 6,000 square feet
It should be noted that although the above listed zones are single family zones, additional units are allowed per state law (e.g., ADU, JADU law, and SB9).
Multifamily Zones:
● Residential Medium Density (RM): no greater than 10 units per acre consistent with General Plan range of 6-10 units/acre and with higher density as needed to meet the RHNA.
● High-Density Overlay (HD-Overlay): maximum of 20 units per acre
● Senior Housing Overlay District (SH-Overlay): maximum of 38 units per acre
The City is planning to create 2 new zoning districts as a part of this Housing Element update (Action 1.D).
● RH-25: Will required a minimum density of 20 units per acre with a maximum of 25 units per acre.
● RH-40: Will required a minimum density of 20 units per acre with a maximum of 40 units per acre.
The Zoning Ordinance includes residential districts that roughly parallel General Plan categories, although there are a larger number of zoning districts. Table 6-1 summarizes the development standard for each zone. Development and zoning standards are also available on the City's website, consistent with transparency requirements.
The standards in Orinda are comparable to those in nearby communities. Density limits in Orinda’s very low-, low-, and medium-density residential districts are comparable to those in neighboring cities. The setback standards and height limits are not excessive and do not constrain residential development.
Ensuring that current standards allow for the full potential of a parcel the city analyzed the development standards in the RM and the SH-overlay zones and reviewed the 27-foot height requirements.
The RM zone allows for 10 units per acre and has a minimum 120-foot lot width and 120 foot lot depth. Calculations for a sample site are listed below
● 120’ lot width x 120’ lot depth = 14,400 sf lot size
● 14,400sf = 0.33 acres
● 0.33 acres x 30 du/ac proposed density = 9.9 units
The maximum capacity in the RM is 10 units, which demonstrates the minimum lot width and depth does not pose a constraint to achieving the maximum allowable density on RM zoned sites.
The SH overlay zone allows for 38 units per acre and currently has a minimum 120-foot lot width and 120foot lot depth. However, based on the Vista Verde Senior Project, the city plans to amend the lot standards in the SH overlay from a 120-foot lot width and depth to 150 feet lot width and depth to ensure maximum densities can be achieved (Action 1.D). The following calculations are based on a sample site at the new 150-foot lot width.
● 150’ lot width x 150’ lot depth = 22,500 sf lot size
● 22,500 sf = 0.52 acres
● 0.52 acres x 38 du/ac density = 19.76 units
The maximum capacity in the SH-overlay is 38 units, which demonstrates the new minimum lot width and depth will not pose a constraint to achieving the maximum allowable density on sites with the SH-overlay.
Additionally, with the creation of the new RH-25 and RH-40, the City will ensure all development standards are realistic and that maximum allowable densities are achievable.
When looking at height, the City ‘s zoning code allows for 27 feet or two and a half stories in all zones, with the exception of the DC which allows for 35 feet and 3 stories. With adoption of the DPP, the height limit will be increased as described in the sites inventory analysis.
While development has been minimal over the past years, the city looked at neighboring cities for project examples that show 27 feet is not a constraint to multifamily development in the RM or SH zones, and the maximum density is achievable at 27-feet. Example 1 shows that 55 units to the acre was achieved with a 23-foot height limit and examples 2 and 3 show that 35 units per acre was achieved with a 22-foot height limit and 25-foot height limit.
For the new RH-25 (25 units per acre maximum) and RH-40 (40 units per acre maximum), the RH-25 will have a 27-foot height limits, which is sufficient as shown below. For the RH-40, the height will be increased in the RH-40 to allow for 50 feet and 5 stories.
While the city does not see the 27-foot height limit as a constraint, Action 1.D has been included to ensure that the SH-overlay zone allows for 3 stories.
Example 1 – San Pablo – 1971 23rd Street
● Approved February 2022 with 4 units
● Lot Size – 0.06 acres
● Stories/Height – 2 stories/23’ height
● Maximum density – 55 du/ac (7 units)
Example 2 – Lafayette – Chestnut Townhomes
● Approved July 2018 with 5-attached townhomes
● Lot Size – 0.28 acres
● Stores/Height – 2 stories/22’-3” height
● Maximum density – 35 du/ac (9 units)
Example 3 – Lafayette – 942 Dewing Avenue
● Approved March 2015 with 5 single-family and duplex dwelling units
● Lot Size – 0.22 acres
● Stories/Height – 2 stories/25’ height
● Maximum density – 35 du/ac (approximately 8 units)
Source: City of Orinda, 2021
1 The Front, Side, and Rear Yard Setback may, at the applicant’s discretion, be measured from the edge of the existing paved roadway rather than from the property line (i.e., the right-of-way boundary), provided the resulting setback measures no less than 15 feet from the property line with street frontage.
2 The Total (Combined) Side Yard Setback is the combination of both Side Yard Setbacks. The Total (Combined) Side Yard Setback requirement shall not apply to those portions of the property more than 50 feet from the front property line.
3 For the Senior Housing (SH) -Overlay, the Zoning Code states, “the maximum building height shall be as required by the closest adjoining residential or downtown district base regulations or as established by the Planning Commission by conditions imposed at the time of review for approvals”. Since most, if not all, of the opportunity sites are adjoining a residential zoning district, the maximum height would be 27’ with a maximum of 2.5 stories in the SH-Overlay. For the HighDensity (HD-25)-Overlay, the maximum building height and maximum number of stories is set by the underlying RM district, with has a 27’ maximum building height and a maximum of 2.5 stories. The RH-40 will have a 50-foot height limit (5 stories). Action 1.C has been included to remove the Planning Commission approval for the allowed height in the SH-Overlay.
The City created a Senior Housing Overlay District to incentivize the production of multifamily housing for seniors. Senior housing may be built by right, only requiring design review, up to a density of 38 units per acre. Building heights in such instances are based on the closest adjoining residential or downtown district or may be established by the Planning Commission during the development review process. Building plane lines have been established to reduce the possibility that very large structures will cast shadows or have significant visual impacts on adjacent lower-density parcels.
In addition, the City established the High-Density Overlay District (Section 17.4.34 of the Municipal Code) to facilitate multifamily housing by right at a density of up to 20 units per acre (minimum density is 6 units per acre).
Section 17.4.32 of the Orinda Municipal Code includes the City’s base zoning Residential Medium Density (RM) standards for multifamily development, and additionally flexibility is available when an overlay is applied. Multifamily development is allowed in the RM zone without a use permit. When the Senior Housing Overlay District or High-Density Overlay District applies, projects are permitted by right.
Section 17.4.31 of the Municipal Code includes incentives for affordable housing, namely the statemandated density bonus. The code adopts state density bonus requirements (Government Code Section 65915) by reference and the City applies application requirements, approval requirements, and housing incentive agreement requirements, consistent with state law. A density bonus provides up to 35 percent additional density on a property for projects that include affordable units as well as market-rate units. The density bonus may be used in tandem with the Senior Housing Overlay District or the High-Density Overlay District. This provision was used in the construction of the Monteverde Senior Apartments development by Eden Housing, with 67 units on 1.45 acres (approximately 48 units per acre) completed in December 2014.
New multifamily development in the city may also occur through the optional Planned Development (PD) process. Should developers choose to go through I PD process, it allows development standards to be established on a site-specific basis in response to the unique characteristics of the site under consideration, within the allowable density range established by the General Plan. The residential density in a residential PD plan may not go over the permitted General Plan density for the total area of the designated parcels for the PD application. PD districts may be less than the required minimum sizes (1 acre) if the City Council finds a unique character to the specific site.
Section 17.8.1(k) of the Municipal Code establishes that one of the purposes of the Downtown Zoning District is to “provide for multifamily housing, including affordable housing, in downtown areas, consistent with the housing element of the general plan.” The Downtown Zone includes two sub-districts: a Downtown Commercial (DC) zoning district and a Downtown Office (DO) zoning district. The Downtown Commercial district explicitly allows multifamily dwellings with a general use permit with a maximum density of 10 units per acre in addition to being part of a mixed-use development. Currently, the Downtown Office district does not allow residential uses and is intended primarily for freestanding office buildings. However, with adoption of the DPP residential densities will increase in the Downtown Commercial zoning district and will allow for multi-family residential developments in the Downtown Office zoning district.
Development in the Downtown Commercial district is currently subject to a 50-percent minimum lot coverage standard and a maximum 35-foot height. Setbacks of 10 feet apply on the front, side, and rear lot lines, and a minimum of 20 percent of the site must be landscaped. The standards do not establish a maximum floor-area ratio (FAR).
Despite the allowance for mixed use, no projects have actually been built. One possible reason is that many parcels in the Downtown area are relatively small, meaning any given parcel can only support a few second-story units if limited to the 10 units per acre standard. The relatively low maximum density of 10 units per acre may also be a barrier to mixed use development. With adoption of this Housing Element and implementation of Actions 1A, 1D, 1K, and 1L, the city is addressing any potential barriers by increasing the allowable density, height, and assisting with lot consolidation.
Parking Standards
The City’s Municipal Code establishes residential parking standards, as summarized in Table 6-2. Parking requirements are comparable to those in nearby cities and do not represent a development constraint. Action 4.A specifically commits to reviewing parking standards for emergency shelters. Additionally, Action 4.E commits the City to review and revise parking standards to ensure they do not pose a constraint to the development of housing.
Source: City of Orinda, 2021
*Applied in single family residential zones consistent with SB 9
The City of Orinda is a small, suburban community bisected by Highway 24 and with physical constraints to outward expansion, such as open space to the north and boundaries of neighboring cities to the south, east, and west. Typical single-family lots in the RVL zones range from 5 to 10 acres (approximately 217,800 to 435,600 square feet) and in the RL zones lots range from 6,000 to 40,000 square feet. Typical singlefamily densities are 1 to 4 homes per acre but there may be an increase with the additional of ADUs, JADUs, and SB9 units. Multifamily densities are typically between 10 and 20 units per acre depending on the land use designation. In the previous planning period, no sites identified to accommodate the lowerincome Regional Housing Needs Allocation (RHNA) in the inventory were developed below the minimum allowable density of the zone in which the site is located.
State law requires the City to consider the impacts of development standards on the cost of housing, and further to consider the cumulative impacts of development standards on the cost and supply of housing. In the past, the primary development standard affecting housing cost was, the lot size standard, since this standard effectively establishes a 6,000-square-foot minimum for single-family neighborhoods. The passage of SB 9 has lessened this constraint by allowing lot splits and duplexes by right. Similarly, the primary standard affecting housing cost for multifamily units is the density limit of 10 units per acre. The primary development standard affecting housing cost. However, all but one of the City’s sites zoned for RM also has an overlay, allowing for increased densities of up to 38 units per acre. Building multifamily units at this density (4,356 square feet of lot area per unit) allows the dedication of large areas as common open space and hence preserves the city’s semi-rural character. This is mitigated to some extent as a potential constraint on the development of housing by allowances for high-density senior housing in the RM district and multifamily housing in the High-Density Overlay District and by provisions for Planned Developments, which allow the transfer of density from one part of a site to another. The City is planning to create two new Land Use Designations – the Residential, High Density Multi-Family land use designation that allows for 20- 30 units per acre and the Residential, Very High Density Multi-Family land use designation that allows for 30- 50 units per acre to be consistent with the two new zoning districts (RH25 and RH-40) which will allow for increased densities (Action 1.D).
Additionally, when looking at current RM standards, maximum allowable density are achievable as discussed in the Development Standards section. Since lot sizes are relatively large, off-street parking standards also can be easily met on most properties. As noted previously, the FAR limit for single-family lots is regarded as an opportunity, rather than a constraint, since it reduces the incidence of teardowns and helps preserve smaller homes. On vacant lots, the FAR limit is not a constraint since it can be exceeded through the Design Review process. Development of the new General Plan land use and the two new high density zoning districts, housing is not constrained in the City of Orinda.
The Orinda Municipal Code currently provides a density bonus of up to 35 percent over the otherwise maximum allowable residential density under the municipal code and the Land Use Element of the General Plan (or bonuses of equivalent financial value) when builders set aside 20 percent or more of their units as affordable, as defined by state law. The City is currently in compliance with all Density Bonus requirements.
Housing Element law specifies that jurisdictions must identify adequate sites to be made available through appropriate zoning and development standards to encourage the development of various types of housing for all economic segments of the population. This includes single-family housing, multifamily housing, manufactured housing, mobile homes, emergency shelters, and transitional housing, among others. Table 6-3 summarizes the permitted housing types by zone.
P=Permitted; UP= Use Permit Required; L Permitted, but limited by additional regulations
Source: City of Orinda, 2021
1 Multifamily in the RM is classified as L: Permitted but limited by additional regulations. These regulations are consistent with typical multifamily development standards and do not require anything beyond what is required as a part of the design review.
2 Multifamily dwellings are allowed with a general use permit under Chapter 17.31, provided they are built at a density that does not exceed 10 units per acre and are part of a mixed-use development.
3 The City has included Action 4.A to permit SROs with a Use Permit in the Downtown Commercial (DC).
An accessory dwelling unit (ADU) is accessory to a primary residence and has complete independent living facilities for one or more persons. ADUs have a few variations, including:
● Detached: The unit is separated from the primary structure.
● Attached: The unit is attached to the primary structure.
● Converted Existing Space: Space (e.g., master bedroom, attached garage, storage area, or similar use, or an accessory structure) on the lot of the primary residence that is converted into an independent living unit.
● Junior ADU (JADU): A specific type of conversion of existing space that is contained entirely within an existing or proposed single-family residence.
To comply with Government Code Section 65852.2 and 65852.26, ADUs must be permitted ministerially subject to objective design standards.
The City has adopted multiple updates to its ADU ordinance since 2017 to conform with the requirements of state law. The City submitted its current ADU ordinance to HCD for review in 2020 and did not receive any comments. The City understands, however, that state law relating to ADUs has been continually evolving. The City will therefore continue to evaluate and pursue any needed updates to its ADU ordinance, including in response to changes in state law and/or future comments it may receive from HCD (Action 1.E).
The California Health and Safety Code (Section 50801) defines an emergency shelter as “housing with minimal supportive services for homeless persons that is limited to occupancy of six months or less by a homeless person. No individual or households may be denied emergency shelter because of an inability to pay.”
Government Code Sections 65582 and 65583(a)(5)) requires jurisdictions to allow emergency shelters and supportive and transitional housing without a conditional use permit. Within identified zones, only objective development and management standards may be applied, given that they are designed to encourage and facilitate the development of or conversion to an emergency shelter.
The City permits emergency shelters by right without discretionary review in the Public, Semi-Public, and Utility District. To address the need for an emergency shelter, the City identified four vacant suitable sites, ranging in size (1.4, 2.7, 5.3, and 17.9 acres), that can accommodate at least one year-round emergency shelter in the Public, Semi-Public and Utility (PS) zoning district. The four sites are close to services and transit. These sites have readily available utilities and other infrastructure to support construction of a new emergency shelter.
The City also adopted objective managerial standards to encourage and facilitate the development of an emergency shelter and are consistent with the City’s identified need of one unsheltered person in the City of Orinda. Specific to the occupancy limit, while the one identified individual needing shelter could be met with the standards of seven clients per night, to ensure this does not constrain the development of an emergency shelter, the City plans to increase this limit to 20 beds. Additionally, shelters throughout the
region also provide existing shelter beds that could accommodate the City’s need. Development standards for emergency shelters in Orinda include:
● Occupancy is limited to seven clients per night
● Sites must be located:
Within one-half mile of the Orinda BART station
More than 200 feet from the edge of pavement of Highway 24
More than 300 feet from a general day care use
● One parking space must be provided for every three beds, plus one space per on-site management staff person
● The interior of the client waiting and intake area must have a minimum of 50 square feet per bed at the emergency shelter
● A manager must be on-site at all times while clients are present
● Night and security lighting shall be provided and security measures necessary to ensure safe and convenient access and use of the emergency shelter
All outdoor lighting should be shielded to prevent glare
Outdoor light fixtures that are more than three feet above the ground must be shielded to prevent direct illumination off-site
The maximum illumination at ground level shall not exceed the minimum required under the State Building Code.
The City will review development standards for emergency shelters and amend the spacing requirements and increase the bed limit to 20 beds to ensure compliance with state law and will amend the parking standards for emergency shelters to ensure that standards are sufficient to accommodate all staff, provided they do not require more parking for emergency shelters than other residential or commercial uses within the PS zone (Action 4.A).
Low-Barrier Navigation Centers
Government Code Section 65662 requires that the development of Low-Barrier Navigation Centers be developed as a use by right in zones where mixed-uses are allowed or in non-residential zones that permit multifamily housing. For a navigation center to be considered “low barrier,” its operation should incorporate best practices to reduce barriers to entry, which may include, but is not limited to, the following:
● Permitting the presence of partners if it is not a population-specific site, such as for survivors of domestic violence or sexual assault, women, or youth
● Pets
● Ability to store possessions
● Providing privacy, such as private rooms or partitions around beds in a dormitory setting or in larger rooms with multiple beds
Action 4.A has been included to comply with State law.
Supportive housing is defined by Section 50675.14 of the Health and Safety Code as housing with linked on- or off-site services with no limit on the length of stay and which is occupied by a target population, as defined in Health and Safety Code Section 53260 (i.e., low-income person with mental disabilities, AIDS, substance abuse, or chronic health conditions, or persons whose disabilities originated before the age of 18). Services linked to supportive housing usually focuses on retaining housing, living and working in the community, and/or health improvement.
Transitional housing is defined in Section 50675.2 of the Health and Safety Code as rental housing for stays of at least six months but where the units are recirculated to another program recipient after a set period. It may be designated for a homeless individual or family transitioning to permanent housing. This housing can take many structural forms such as group housing and multifamily units and may include supportive services to allow individuals to gain necessary life skills in support of independent living.
Pursuant to Government Code Section 65583, transitional and supportive housing types are required to be treated as residential uses and subject only to those restrictions that apply to other residential uses of the same type in the same zone. The City’s Zoning Ordinance allows supportive and transitional housing where other residential dwellings of the same type are allowed in the same zone, such as single-family and multifamily uses. To further address state law, the City has included Action 4.A to allow supportive housing without discretionary review in all zones that allow multifamily housing or mixed-use development, including nonresidential zones, per Government Code Sections 65583 and 65650.
Extremely low-income households typically comprise persons with special housing needs, including, but not limited to, persons experiencing homelessness or at risk of homelessness, persons with substance abuse problems, and farmworkers. Government Code Section 65583 requires the quantification and analysis of existing and projected housing needs of extremely low-income households. Housing Elements must also identify zoning to encourage and facilitate supportive housing and single-room occupancy units.
To encourage and facilitate the development of housing affordable to extremely low-income households and in accordance with Government Code Section 65583, the City will define single-room occupancy units and identify zones where they are permitted (Action 4.A).
The City of Orinda incorporates the Federal Fair Housing Act and the California Fair Employment and Housing Act of 1964 as a part of its building requirements. These two statutes address the fair housing practices adhered to by the City, which include practices against housing discrimination toward persons with disabilities. In compliance with Government Code Section 65583, the City permits supportive housing for disabled residents in any residential zone that permits residential uses of a similar type in the same zone. To ensure there are no constraints to persons with disabilities, Action 4.A has been incorporated into the Housing Element to mitigate any possible constraints.
● Reasonable accommodations – The City’s Zoning Ordinance includes administrative procedures for reviewing and approving requests for modifications to land use and zoning requirements or procedures regulating the siting, funding, development, and use of housing for people with
disabilities to ensure reasonable accommodations (Chapter 17.46). A reasonable accommodation limited term permit may be approved by the director only after the director first finds:
The housing, the subject of the request for reasonable accommodation, is to be used by an individual under the Fair Housing Amendments Act of 1988.
The request for accommodation is necessary to make specific housing available to an individual protected under the Fair Housing Amendments Act of 1988.
The requested accommodation would not impose an undue financial or administrative burden to the City of Orinda.
The requested accommodation would not require a fundamental alteration in the nature of the housing, land use, and zoning action of the City of Orinda.
The establishment, maintenance, or operation of the temporary activity would not be detrimental to the public health, safety, or welfare of persons residing or working in the neighborhood of the proposed activity.
The limited term aspect of reasonable accommodations refers to the personal nature of the accommodation to the applicant. Therefore, accommodations do not run with the land unless the City finds that the accommodation is physically integrated into the structure and cannot be easily removed or altered to comply with the ’ity's zoning regulations or policies. Reasonable accommodations granted by the City shall remain in effect for as long as an individual with a disability occupies the affected dwelling(s) and shall be removed within sixty (60) days of the termination of such occupancy, unless requested and approved for the new occupant. Action 4.F has been included for the City to review the current reasonable accommodation procedure and ensure the required findings are not potential barriers to housing for persons with disabilities.
● Separation requirements – The City’s Zoning Ordinance does not impose any separation requirements between supportive housing or residential care facilities.
● Site planning requirements – Currently, the City’s Zoning Ordinance requires special regulations for residential care facilities for the elderly and limits the maximum number of persons who may reside in the facility by lot size, including employees. The City has included Action 4.A to amend the language of Chapter 3.28.210 to remove site planning requirements for residential care facilities for the elderly for eight or fewer persons to ensure the standards are no different than for other residential uses in the same zone and to permit residential care facilities with seven or more persons without a use permit in all residential zones.
● Definition of “family” – The City defines family as “one or more persons occupying a dwelling unit and living as a single housekeeping unit.”
Health and Safety Code Sections 1267.8 and 1566.3 require local governments to treat licensed group homes and residential care facilities with six or fewer residents no differently than other by-right singlefamily housing uses. “Six or fewer persons” does not include the operator, the operator’s family, or persons employed as staff. Local agencies must allow these licensed residential care facilities in any area zoned for residential use and may not require licensed residential care facilities for six or fewer persons to obtain conditional use permits or variances that are not required of other family dwellings.
“Residential Care, Limited” or “Limited residential care” means 24-hour nonmedical care for eight or fewer persons in need of personal services, supervision, protection, or assistance essential for sustaining the activities of daily living, which are licensed by the State of California (Health and Safety Code Sections 1568.0831, 1569.85, and 11834.23). No use permit or other special permitting requirements apply in such instances. Design Review has not been used to deny or substantially modify a housing project for persons with physical or developmental disabilities to the point where it is no longer feasible. The City does not impose special occupancy permit requirements or business licenses for group homes or for retrofitting structures for group home use.
“Congregate care residential” means a facility that provides 24-hour nonmedical care of persons in need of personal services, supervision, or assistance essential for sustaining the activities of daily living or for the protection of the individual. The facility contains small individual dwelling units of usually only one or two rooms with a small kitchen allowing for independent living but also provides common dining, housekeeping, recreational, and social facilities (Health and Safety Code Sections 1502(a)(1); 1597.43). Small kitchens that comply with state and local standards must be included in each individual dwelling unit for this definition to apply.
The City’s Zoning Ordinance has both congregate care and residential care facilities for the elderly. Residential care facilities for the elderly with eight or fewer persons are permitted in all residential zones and facilities with seven or more are permitted with approval of a use permit in all residential zones. Similarly, congregate care facilities are only permitted in the RM residential zone with a use permit.
Consistent with state law, the City also allows residential care homes for persons with disabilities (eight or fewer residents). There are no additional zoning, building code, or permitting procedures other than those allowed by state law. The City also allows and encourages the retrofitting of homes to facilitate aging in place, including the installation of such features as grab bars and lower countertops. The Monteverde Senior Apartments have universal design standards. The buildings three wings contain 66 one-bedroom apartments, where 5 percent of the apartments comply fully with the Americans with Disabilities Act (ADA) standards and about 2 percent comply with ADA standards for residents with visual and hearing impairments.
To comply with current State law, the City has included Action 4.A to permit congregate care facilities with seven or more persons without a use permit in all residential zones.
The City does not have any land designated for agricultural uses and is in compliance with Health and Safety Code Sections 17021.5 and 17021.6. However, to comply with the State Employee Housing Act (Health and Safety Code Sections 17021.5 and 17021.6) the City will amend the zoning code to regard employee housing serving six or fewer employees as a single-family dwelling for purposes of applying land use and zoning regulations. Additionally, this amendment will allow employee housing of no more than 12 units or 36 beds as an agricultural use and permitted in the same manner as other agricultural uses in the same zone (Action 4.A).
The permitting process for the single family or multifamily construction of new residential units in Orinda is comparable to that of most cities in the area. New homes are subject to Design Review by the Planning Commission (only if it does not meet the SB 9 criteria). Prior to the formal submittal of a Design Review application, applicants can elect to go through a Conceptual Development Review process and obtain preliminary written comments from staff regarding their project. This informal process takes two to three weeks and costs $435. As part of the Conceptual Development Review process, applicants can elect for an optional Planning Commission study session add-on to obtain preliminary feedback from the Planning Commission for an additional cost of $485. When a development application for a new residential unit is formally submitted, the Planning Department reviews the application for completeness. Once an application is deemed complete, the project is scheduled for the next Planning Commission public hearing. The Planning Commission meets twice a month. On average, projects are considered by the Planning Commission within three months of submittal. The City Council only reviews residential projects on appeal.
Upon Planning Commission approval of a design review application and expiration of the subsequent 10day appeal period, construction documents may be submitted for a building permit. The plan check/issuance of a building permit typically takes four to six weeks to complete.
All development applications are processed in accordance with the time frames mandated by the State’s Permit Streamlining Act. In an effort to further streamline development review procedures, the City amended its development review process, including requiring Design Review for fewer residential projects, eliminating the City’s Design Review Board (the Planning Commission assumed the function of this body), and creating a Zoning Administrator position to allow the hearing and approval of minor projects.
Single-family housing is permitted by right in all residential zones, and no use permits are required. Design review is required for new homes Commission (only if it does not meet the SB 9 criteria), and the procedure and required findings are noted under the Design Review heading.
Multifamily senior housing is allowed by right in areas covered by the Senior Housing Overlay. Multifamily housing is allowed by right in the RM and the High-Density Overlay. Design review is required for new multifamily housing, with special findings included for senior housing.
The City, through its design review, does not dictate style of homes and will approve a wide variety of designs as determined by the desires of the applicant. The City does not restrict the size of homes, particularly on exposed sites and in relationship to adjoining neighbors as larger homes, particularly on second stories, may adversely impact privacy. Design features, such as stepped-back second stories and breaking up the mass and scale of the design of articulation, may be required in the design review process. Bright colors and lack of vegetation also may create a project that looms large on its lot. Choosing more earth tone colors and planting trees can go a long way to allowing the project to blend into its neighborhood setting. Projects submitted for Conceptual Review will receive comments from staff with
guided concerns over any of these issues. It is strongly recommended that the applicant and any assisting professional agents incorporate the comments into the design.
Orinda’s Design Review program is intended to preserve and enhance the city’s character, maintain property values, and protect public health and safety. It strives to encourage diverse architectural designs that are sensitive to local context, surrounding uses, and aesthetics. The City has established several different levels of Design Review depending on the size and scope of the project, the type of use, and the project’s location.
Typical projects subject to design review include new single-family homes Commission (only if it does not meet the SB 9 criteria), additions larger than 1,000 square feet, and additions that create a second story above or below an existing residence. There are also a number of unique triggers for Design Review, including additions that result in homes larger than 7,000 square feet, additions on small or narrow lots, additions in the Ridgeline and Environmental Preservation Overlay District, and additions that exceed the maximum floor area permitted on the parcel.12 There are also provisions that enable affected neighbors to request Design Review.
The City has established findings for approving Design Review applications.
The findings are as follows:
● Siting and Neighborhood Context. The proposed development is designed and located on the site so that the building envelope is compatible, but not necessarily identical with its surroundings. It protects undeveloped ridgelines and hillsides, maintains the dominance of wooded and open ridges and hillsides, and preserves a significant or scenic vista.
● Design. The design elements are visually harmonious and in scale with the size of the structure while balancing environmental and solar considerations. If the proposed development is an addition or remodel of an existing structure, the existing construction and proposed construction are visually harmonious. Facades and exterior walls shall be designed to reduce the blocky or massive features of building surfaces and provide articulation.
● Privacy, views, light, and air. The proposed development does not substantially impair the existing views and access to light and air or substantially infringe on the privacy of neighbors and balances the sensitivity of the design to its impact on neighboring properties and the applicant’s ability to develop the property.
● Landscaping. Primary landscaping elements complement the structure and environment as appropriate for the structure itself, the site, and neighborhood. Landscaping provides privacy and screens the proposed structure.
These findings do not represent a development constraint. The first finding requires that the building is compatible with its surroundings and protects hillsides and ridgelines. This is a fundamental land use principle and ensures that new homes and additions will protect the quality of life and the character of 12. In each of these examples, there are exceptions for small additions (the size thresholds vary). Design review would typically not be required if the addition took place within the footprint of an existing structure.
Orinda neighborhoods and can be met in a variety of ways for any given development. The second finding primarily applies to additions and remodels and relates to the visual harmony and scale of building modifications. The third finding addresses public health and safety considerations, such as access to light and air, along with basic issues regarding privacy and view obstruction. The final finding is simply that landscaping complements the structure and provides appropriate screening.
Conditions may be imposed by the decision-making body (e.g., the Zoning Administrator or the Planning Commission) through the Design Review process. Special findings must be made for very large homes (over 7,000 square feet), homes on very steep lots, and homes on narrow lots (less than 50 feet) and small lots (less than 5,000 square feet).
In addition, the City has adopted a separate set of standards for senior housing to reflect the desirability of this use. For senior housing, the development is pedestrian – oriented with an emphasis on breaking up the building mass so it appears less monolithic and blocky. Projects in the Downtown Commercial and Downtown Office zones are also evaluated to ensure they are consistent with Downtown design guidelines.
The Zoning Administrator has approval authority. According to the Orinda Municipal Code Section 17.30.5, decision makers may balance the importance of minimizing impacts on neighboring properties and the applicant’s ability to develop the property. Design Review requirements are not required for multidwelling projects proposed in the High-Density Overlay.
Most of the Planning Process Review Task Force (PPRTF) recommendations were included through ordinance revisions in 2010. This has effectively reduced Design Review as a potential constraint and has made it faster and easier to navigate the process.
Senate Bill (SB) 9 (Chapter 162, Statutes of 2021) requires ministerial approval of a qualifying housing development in a single-family zone, the subdivision of a parcel in a single-family zone into two parcels, or both. SB 9 facilitates the creation of up to four housing units in the lot area typically used for one singlefamily home. SB 9 contains eligibility criteria addressing environmental site constraints (e.g., wetlands, wildfire risk, etc.), anti-displacement measures for renters and low-income households, and the protection of historic structures and districts. Key provisions of the law require a local agency to modify or eliminate objective development standards on a project-by-project basis if they would prevent the construction of up to two units at least 800 square feet in size. ADUs may be constructed on lots created pursuant to SB 9. The City is currently in compliance with SB 9 requirements and while there has been interest in developing SB 9 units, the city is not relying on any units to meet the RHNA.
Senate Bill (SB) 330, the Housing Crisis Act of 2019, established specific requirements and limitations on development application procedures. The bill allows housing developments for which a preliminary application is submitted that complies with applicable general plan and zoning standards is subject only to the development standards and fees that were applicable at the time of submittal. This applies to all projects unless the project square footage or unit count changes by more than 20 percent after the
preliminary application is submitted. The developer must submit a full application for the development project within 180 days of submitting the preliminary application.
City of Orinda offers an optional pre-application review (PAR) for all development proposals to advise a prospective applicant of current City standards and requirements, shorten the length of time required to process a development proposal once it has been accepted for processing, provide a written record of staff’s assessment of a development proposal, and limit requests for special studies to those identified in the PAR letter. Pre-application meetings have helped to shorten the review process and allow for better communication between applicants, City departments, and utility providers. The City has established an application process related to SB 330 and makes the preliminary application available on the City’s website.
SB 35 requires jurisdictions that have failed to meet their RHNA to provide streamlined, ministerial entitlement process for housing developments that incorporate affordable housing. The City of Orinda has a SB 35 application available to developers that includes specific requirements for the streamlining procedure. The application is available on the City’s website for developers interested in pursuing the streamlined process. This procedure aids in minimizing the review time required for development processes and, in turn, reducing costs to developers that may increase the housing production in the city.
Short Term Rental Ordinance
The City adopted a short-term rental ordinance in 2017 (Orinda Municipal Code Section 17.3.12) and updated it in September 2021. A short-term rental (STR) is defined in the Orinda Municipal Code as a dwelling that is leased or rented in full or in part for the purpose of overnight lodging for less than 30 consecutive days. Any person who operates a short-term rental must first register their rental with the City. The requirements for the rental are as follows:
● The maximum occupancy when a property is used for short-term rental is limited to two people per bedroom plus three people, calculated based on the total number of bedrooms on the property.
● Only one short-term rental can take place on a single property at any given time.
● The short-term rental host is responsible for ensuring the short-term rental complies with all local, state, and federal health and safety requirements.
● The short-term rental host is responsible for compliance with all City regulations, including those regarding noise, parking, and occupancy.
● While rented, the short-term rental shall not be used for any use or event that would require a Temporary Event Permit pursuant to Chapter 17.37.
● The short-term rental takes place on property owned by the host and containing the host’s primary residence.
● The host personally lives on the property when it is used for short-term rentals.
● The host is physically present to monitor and regulate activity during the short-term rental, including by meeting guests upon arrival.
● The duration of the short-term rental is at least two nights.
● Any on-line listings and/or other advertisements authorized by the host for the short-term rental specify that the host will be present and/or share the dwelling unit used for the short-term rental.
● Any on-line listings and/or other advertisements authorized by the host clearly identify the shortterm rental registration number provided by the City.
Orinda’s short-term rental ordinance is not seen as a constraint but rather a way to preserve the rental stock to ensure rental units are available for current and future Orinda residents.
Measure J
Measure J (2004) is a 25-year extension of the previous Measure C Contra Costa Transportation Improvement and Growth Management Program (GMP) approved by the voters in 1988. The GMP in the Contra Costa Transportation Authority (CCTA) ordinance was established to reduce suburban sprawl and promote the production of affordable housing. The required Growth Management component of the GMP is intended to ensure that future residential, business, and commercial growth pays for the facilities required to address the impacts of those projects on transportation facilities and congestion. In addition, the GMP includes elements to ensure that Contra Costa County cities make meaningful progress in achieving their affordable housing goals. The annual money jurisdictions receive from the Measure J to support road paving projects (Return to Source funds), is predicated by satisfactorily completing the biannual Grown Management Checklist, which includes compliance with the Housing section in the checklist, demonstrating the City’s meaningful progress in achieving the city’s affordable housing goals.
Measure J requires each jurisdiction participating in the GMP to adopt a Growth Management Element (GME) as part of its General Plan that establishes an Urban Limit Line. The Urban Limit Line is intended to reduce suburban sprawl, requiring longer commutes from housing to job centers and to promote compact urban development patterns and restrict the extension of infrastructure into areas where urban development is not planned. While adoption of this development boundary may constrain the development of market rate large lot single family residential subdivisions, which typically pass on the mitigation fees to the homebuyer, its focus on more efficient use of land and targeting of development opportunities to areas where infrastructure is currently in place and contributes towards reducing costs typically associated with expansion of infrastructure systems that constrain the production of affordable housing from the developer’s perspective.
In 2020, the Contra Costa Transportation Authority updated the text and requirements of the GMP to ensure that Measure J more appropriately balances development and congestion management as outlined in new statewide goals, as required by Senate Bill (SB) 743. Measure J-require transportation impact analyses focused on roadway capacity and vehicle delay, particularly on Routes of Regional Significance. The adoption of SB 743 shifted the focus of transportation planning from roadways and congestion-based analyses to transportation, land use, and planning decisions which encourage infill development, promote public health through active transportation, and reduce greenhouse gas emissions.
Participation in a regional development mitigation program to establish fees, exactions, assessments or other measures to fund regional or subregional transportation improvements to mitigate the impacts of planned or forecast development on the regional transportation system can be a constraint to the development of affordable housing by compounding per unit pre-development costs. However, these fees have been a component of the local entitlement process in Contra Costa County jurisdictions for the past several decades and therefore do not pose a new financial impediment. Orinda waives the payment of these transportation impact fees for affordable housing projects and for affordable units in mixed income projects.
Measure J requires that a jurisdiction demonstrate reasonable progress in providing housing opportunities for all income levels and meeting housing goals. The City’s reporting is tied to the quantified objectives adopted in the Housing Element to illustrate that the City has adequately planned to meet the existing and projected housing needs through the adoption of land use plans and regulatory systems which provide opportunities for, and do not unduly constrain, housing development. Additionally, the measure stipulates the jurisdiction incorporate policies and standards into the development approval process that support transit, bicycle and pedestrian access in new developments.
Directing growth to infill locations by establishing an Urban Limit Line is a key component of protecting agricultural and natural resources. The intent is encouraging housing, particularly affordable housing, in the neighborhoods near transit that the City of Orinda has identified as priorities for development and investment to create income-integrated neighborhoods. Further, it supports increasing residential density in priority development areas and in the vicinity of transit opportunities, which in turn, as cited by developers in outreach, supports the development of affordable multifamily housing which needs higher densities to be cost effective. Development of multifamily residential has historically not been cost effective in locations where infrastructure and utilities services are not already in place, therefore, this measure does not add a constraint to development of multifamily or alternative higher density housing types.
The City’s building codes are based on the most recent version of the California Building, Plumbing, Mechanical, and Electrical codes. These codes are considered to be the minimum necessary to ensure the public’s health, safety, and welfare. The City has adopted amendments to the codes based on changes to the 2019 California Building Code to match the County’s version of the Building Code by adopting Ordinance 20-03. Modifications require smoke detectors in flat-roof buildings, prohibit the use of gypsum wallboard as seismic bracing, and restrict the use of Portland Cement Plaster as seismic bracing for singlestory, single- and two-family dwellings, and accessory structures. The modifications to the 2019 California Green Building Standards for Green Building include submitting a construction waste management plan (WMP) on a form approved by the City. The criteria for the WMP is aimed to reduce and prevent material waste. In addition, the City uses its code enforcement powers in a manner that does not constrain housing development or improvement. Code enforcement is primarily carried out in response to resident complaints or observation of non-permitted structures. The City does not have any unique or proactive code enforcement programs that could be construed as creating housing constraints.
Subdivision-level improvement requirements are defined in the City’s Municipal Code. These requirements stipulate standards for streets, sidewalks, water and sewer, drainage, curbs and gutters, utility easements, and landscaping. Such improvements may be considered as a housing cost constraint if they are more costly than what is minimally required to meet health and safety standards or involve requirements that are atypical or exceptionally high relative to other jurisdictions in the vicinity.
In Orinda, the city’s infrastructure, including streets, storm drains, water lines, sewer pipes, and dry utilities, is already in place, greatly reducing potential infrastructure impacts on housing costs. The 245lot Gateway Valley (Wilder) development required extensions of existing roadways, installation of new roadways, utilities, landscaping, and signage. Because this infrastructure was largely privately funded, the cost of construction is likely to be passed on to future homeowners in the area through an assessment district. This makes it less feasible to construct affordable housing in this area. As a result, in that case, the developers of Gateway Valley contributed funds to construct affordable housing in the Orinda Village area, on a site that is much closer to transit and services where infrastructure was already in place.
Street standards in Orinda are listed in Section 16.52.140 of the Municipal Code. The standards require that private roads be at least 16 feet wide (curb to curb) or 25 feet wide (for streets without curbs). Public roads must be at least 32 feet wide (curb to curb) or 36 feet wide (for streets without curbs). Minor streets have a grade (slope) limit of 20 percent. While Orinda’s street standards are not excessive and present no constraints to development, the City’s subdivision regulations do allow narrower streets to ensure consistency with the General Plan. Since the General Plan calls for retaining rural character, the City is able to approve public streets that are less than 32 feet wide. The city’s higher-density housing opportunities are in and around the downtown area, where the streets are already in place and would not need to be widened or reconstructed to accommodate new development.
The City’s subdivision regulations also include requirements for water, sewer, and drainage facilities. These facilities are already in place on the sites listed in Chapter 4 of the Housing Element and would not need to be expanded or reconstructed in the event these sites were developed with housing.
Development fees in Orinda include impact fees for schools, parks, drainage, traffic, and fire. The City also collects planning application fees and plan check fees.
Fees specifically charged by the City at the time of development include (1) a per-residential-unit local transportation impact fee to contribute toward street improvement and maintenance costs; (2) drainage fees based on the square footage of impervious surface on-site; (3) an in-lieu fee for the acquisition and/or improvement of public parkland in those cases where land is not dedicated pursuant to the Quimby Act and where adequate private recreational facilities are not provided on-site; (4) a subregional transportation fee administered by the Lamorinda Fee and Finance Authority; (5) a parking in-lieu variance fee would be collected and put toward mitigating parking in Orinda, potential mitigations might include a parking lot or shuttle services. The in-lieu fee will not apply to residential buildings and (6) fire district fees to provide efficient fire protection and emergency medical services.
In 2019, the local traffic fee was $4,236 per single-family unit and $2,965 per second unit or multifamily unit. The regional traffic impact fee was $4,236 for single-family units and $2,965 for multifamily units.
The drainage fees were $1.50 per square foot of impervious surface area and are the same for singlefamily homes and multifamily units. The park dedication fees were $19,098 per detached single-family unit, $12,976 for single-family attached or townhomes, and $13,327 per multifamily unit.
Charges assessed by other agencies include a school impact fee assessed by the Orinda Union School District in accordance with AB 2926, and meter installation and hook-up fees charged by the East Bay Municipal Utilities District (EBMUD) and the Central Contra Costa Sanitary District (Central San) to defray the capital costs associated with providing water and sewer services. The school impact fees are currently $4.08 per square foot for residential development and 0.66 cents per square foot for nonresidential development. A new 2,500-square-foot single-family home would have a school impact fee of almost $10,000, while a typical multifamily unit of about 1,000 square feet would have a school impact fee of $4,000.
EBMUD offers a Customer Assistance Program (CAP) for low-income households and emergency shelters based on income limits set by the agency. The program offers qualifying low-income households a 50percent reduction of the standard bimonthly service charge and 50 percent of home water use, up to a maximum of 1,050 gallons per person per month.
In 2022, the Moraga-Orinda Fire District (MOFD) fees for residential projects up to 5,000 square feet are a $544 for plan review and $410 for inspection of projects up to 5,000 square feet. For projects greater than 5,000 square feet, MOFD charges an hourly rate of $136 for both plan review and inspections. Preproject review fees are $568, design review fees of residential projects are $339, and residential additions or remodel fees are $568. Plan review and inspection of fire protection systems for new or modified residential projects are each $410 for the first 25 heads, and $205 for each additional 25 heads, or portion thereof. The combined fees for a typical single-family unit, smaller than 5,000 square feet, would be approximately $2,113 for design review, plan review, and inspection. The combined fees of a multi-family project greater than 5,000 square feet will depend on the number of hours plan review and inspections take.
All of these development fees and charges affect the price of housing. On a cumulative basis, impact fees on a 2,500-square-foot single-family home (with an impervious footprint of 2,000 square feet) would be roughly $41,520. Fees on a 40-unit apartment building (800-square-foot units, with an impervious footprint of 6,000 square feet) would be $24,021 per unit. These totals include the school impact fees and the city and regional impact fees.
The cost of building permits and plan checking would be added to these totals. Building permits and plan checking fees are collected by Contra Costa County and are based on the value of the project. For example, a new home with a construction value of $875,000 would be subject to a permit fee of $4,782, while a residential addition with a construction value of $100,000 would have a permit fee of $983. A new home in this example would have a plan checking fee of roughly $4,828. Additional fees of $1,552 are collected for a Title 24 energy report, electrical is $431, plumbing is $431, and mechanical inspections cost $431 (and an earthquake fee of $13 per $100,000 valuation). The addition of these charges brings the permitting fees to approximately $10,803 for the home in this example. EBMUD charges a water service installation fee of $9,259 per meter for a three-quarter-inch lateral in paved conditions and a system capacity charge of $34,760 for a three-quarter-inch meter, and Central San collects a fee of approximately $8,388 per unit.
When added to the impact fees listed, total planning, building, utility connection, and impact fees are in the range of $106,495 per unit for a new single-family home. As a benchmark for comparison, the 2021 Draft Contra Costa County Housing Element indicated that permitting costs and impact fees ranged from $33,462 to $55,928 in the unincorporated portions of the county. Orinda falls near the upper end of this range, mainly due to the higher costs for water and sewer capacity fees in Orinda than surrounding areas.
A useful metric for evaluating planning and permitting fees is the percentage of total construction costs associated with these fees. Construction costs for single-family homes in Orinda are approximately $176 per square foot, or roughly $352,360 for a 2,000-square-foot home. Typical cost for a vacant lot is $680,000 to $1,800,000, bringing the total cost of building a new home to roughly $2.1 million. Thus, the total permitting and impact fee costs of $102,300 represent approximately 4.7 percent of the total cost of the home. This is a lower percentage than the amount reported by nearby communities, in part because the relative cost of land and construction in Orinda is higher than the county average.
For multifamily units, the building permit and plan checking fees are calculated on a schedule similar to that used for single-family homes. However, the construction cost per square foot is lower and the unit size is smaller, so total fees per unit are less. The City relied on the Vista Verde Senior Housing Project to determine the total cost for multifamily construction and to determine the percent the City’s fees that make up the overall project cost. While the Vista Verde Senior Housing project did receive some fee deferrals, in order to provide an overall fee cost for any multifamily development, those deferrals were not assumed in this analysis. The Vista Verde Senior Housing project is a five story development that includes 52 units, ranging in size from 700 square feet to 950 square feet. The calculation is for a steel frame structure including forced air heating and cooling and constructed of good quality materials. The estimated total construction cost is approximately $38 million, which equates to approximately $730,000 per unit. These construction costs include labor, materials, equipment, but do not include costs of buying land. However, that would only further reduce the fee percentage of the overall development. The total fees for this modified project (assuming the project is not affordable), including planning fees and impact fees would be approximately $4,253,950, which is approximately 11.2 percent of the overall project cost. See the approximate breakdown.
*Note: This project was more complex than most and therefore the cost is reflective This project included design review, a minor subdivision, general plan amendment, zoning amendment, density bonus, tree removal permit, elevated deck permit, and Initial Study/Mitigated Negtive Declaration.
Additionally, as noted previous, pursuant to Measure J, a significant portion of these fees are waived for affordable projects.
Development fees are typically incorporated into the sales price of a home or amortized through apartment rents in the case of multifamily rentals. While the percent that fees makeup of the overall project for single family (4.7 percent) is slightly lower than for a multifamily project (11.2 percent), this is typical and consistent with surrounding jurisdictions. However, to ensure this does not significantly change over the planning period, the City’s Fee Ordinance continues to allow the City to waive the transportation, park, and drainage fees for affordable housing projects. Furthermore, the City does not collect school impact fees for senior housing development, and other projects that do not generate a student population, and affordable housing projects are exempt from park dedication and drainage impact fees. The City also has existing development impact fee waivers for affordable projects and therefore are not seen as a constraint. To further ensure that fees are not a constraint on multifamily development (affordable or market rate), the City has included Action 1.F to promote fee deferrals for affordable development and Action 4.G to annually monitor fees and meet with developers and applicants to ensure fees are not a barrier to housing.
The City collects development fees for permits, design reviews, tentative tract maps, minor subdivisions, lot line adjustments, general plan amendments, variance, and rezoning. These fees are necessary because new development is dependent on adequate public facilities. The development permit fees are in Table 6-4 and are available on the City’s website. Some of the City development fees involve staff hourly charges and cash deposits before the commencement of projects.
* Staff housing rates range from $120 – $153 an hour, $130 assumed for calculations.
1 This fee does not apply to multifamily units.
2A cash deposit is required before work commences
Similar to surrounding cities, Orinda collects planning fees to finance the costs for providing community services as well as the administrative costs associated with processing applications. Payment of fees is necessary to ensure a satisfactory level of service to ensure the safety, public health, and well-being of the community. Based on a review of fees in the City of Orinda, planning fees do not pose a constraint to development. To demonstrate the costs that contribute to development in Orinda, the City has included the total fees associated with the development of single-family residential projects and development fees for multifamily development in Table 6-5.
$1,040
Variance
Staff hourly rate charges. A cash deposit will be required before work commences. (When combined with another application/addition: $814. Time extension: $465)
$2,600
General Plan Amendment
Zone Change
Staff hourly rate charges. A cash deposit will be required before work commences.
$2,600
Staff hourly rate charges. A cash deposit will be required before work commences.
$1,560
Staff hourly rate charges. A cash deposit will be required before work commences. (When combined with another application/addition: $814. Time extension: $465)
$2,600
Staff hourly rate charges. A cash deposit will be required before work commences.
$2,600
Staff hourly rate charges. A cash deposit will be required before work commences.
$10,010
Site Plan/Design Review
$1,279 plus $1.60/sq ft, up to a maximum of $10,248.
$39,000
Planned Unit Development
Specific Plan
Staff hourly rate charges. A cash deposit will be required before work commences
$39,000
For non-standard projects a fee will be charged that is equivalent to the hourly cost of the employee(s) involved, the cost of materials, equipment, and overhead.
Staff hourly rate charges. A cash deposit will be required before work commences**
$39,000
Staff hourly rate charges. A cash deposit will be required before work commences.
$39,000
For non-standard projects a fee will be charged that is equivalent to the hourly cost of the employee(s) involved, the cost of materials, equipment, and overhead.
Tentative Tract Map
$3,915
$6,530 if requires, or may require, protest proceeding
$3,915 if does not require protest proceeding
$6,530 if requires, or may require, protest proceeding
Vesting tentative Map
Staff hourly rate charges. A cash deposit will be required before work commences.
$20,020
Staff hourly rate charges. A cash deposit will be required before work commences.
Source: City of Orinda 2021-22
$20,020
Staff hourly rate charges. A cash deposit will be required before work commences.
$20,020
Staff hourly rate charges. A cash deposit will be required before work commences.
* Staff housing rates range from $120 – $153 an hour, $130 assumed for calculations. **Residential square footage as calculated in Orinda Municipal Code Chapter 17.6
The City is well positioned to compete for housing assistance programs for residential development projects. The City worked with Eden Housing to secure financing for the development of 67 affordable senior residences (Monteverde Senior Apartments) on the City-owned former library site. Among the financing sources used for the project were tax credits, County HOME, and Community Development Block Grant (CDBG) funds, and through a land contribution from the City worth $2.5 million, funding for which was negotiated with the developers of the Wilder project. During the approval process for the Monteverde Senior Apartments, Eden Housing representatives indicated that Orinda’s downtown could be well positioned for further housing assistance funds given the lack of existing housing in the downtown; the proximity to the Orinda BART station; and the proximity to the commercial, cultural, and government services of downtown Orinda.
On the other hand, state and federal housing programs that finance the rehabilitation of existing housing stock or that benefit lower-income residents tend to be less viable in Orinda. Eligibility for such programs is usually based on indices such as the percentage of lower-income residents and the age or condition of the housing stock. In Orinda, homes are in excellent condition and the population is relatively affluent. The City may be better off relying on County programs for the limited population and structures that could benefit. Contra Costa County offers a number of low-interest loan and grant programs that are open to participation by all county residents, including those living in incorporated cities.
The city’s high housing values also result in rents that generally exceed the maximum levels for participation in the Section 8 Rental Assistance Program. Under this program, the United States Department of Housing and Urban Development (HUD) pays landlords the difference between what a lower-income household can afford (30 percent of its income) and the fair-market rent for adequate housing in the private market. According to the Contra Costa Housing Authority, there were no Section 8 vouchers being used in Orinda in 2014; however, the Monteverde Senior Apartments includes 66 units.
Some of the most commonly used state and federal housing assistance programs are enumerated and their applicability to the City of Orinda is examined in Table 6-6.
In the previous three years, the City has received $160,000 from SB 2 grants to fund portions of the EIR for the Downtown Precise Plan. The City was also granted the Local Early Action Planning (LEAP) award in 2020 for $65,000 that is funding a portion of the Objective Design Standards as part of the Downtown Precise Plan. Lastly, the City was awarded the Regional Early Action Plan (REAP) grant for $104,660 for the update of the 6th Cycle Housing Element.
In the Goals, Policies, and Actions section of this element, the City has set forth various measures that it will undertake to mitigate or remove governmental constraints that hinder the City from meeting its share of the regional housing needs. These measures include deferring payment of application/development impact fees and granting priority processing of development applications. While the City can and will undertake these measures to remove governmental constraints, non-governmental constraints beyond the City’s control will continue to impact the affordability of housing in Orinda.
Section 8 Vouchers
Local rents generally exceed fair market rents for the Section 8 program. No certificates/vouchers are currently in use in the City of Orinda. Countywide demand is far in excess of funding, which further limits the potential for participation by Orinda residents. Availability of assistance depends on efforts and priorities of the Contra Costa County Housing Authority.
Section 203(K) Inapplicable due to well-maintained condition of local housing stock.
Section 8 New Construction
Provides security for projects financed with federal loans. Strong competition for limited funds available. Also, see comments related to Section 8 above.
Section 202
Section 106(b) – Seed Money Loans
Community Development Block Grant (CDBG)
The HUD Section 202 program is used to construct housing for low-income seniors. Section 202 funds were used to help construct the Orinda Senior Village project. While there is limited funding currently available and intense competition for available funds, future downtown residential development could be eligible. Section 202 housing requires a nonprofit sponsor. These funds could be used as a potential source for elderly/disabled housing on multifamily housing sites.
Used solely in connection with Section 202 loans. See comments related to Section 202 programs.
Funds may be used for rehabilitation, land write-down, and off-site improvement costs, but not for actual construction of new housing. Funds are inadequate to have a measurable impact on affordable housing opportunities, unless combined with other funding mechanisms. Development of affordable senior housing on the former library site was funded in part through CDBG.
Low Income Housing Tax Credits
CHFA-Direct Lending
Preservation Financing
California Self-Help Housing
Mobile Home Park Resident Ownership Program
Emergency Shelter
Special User Housing Rehabilitation
Predevelopment Loans
Senior Citizen Shared Housing
Used in conjunction with loans, grants, and other forms of government assistance. LIHTC was a significant part of the funding package for the Eden project on the former library site and could be part of an overall funding package for development of housing on multifamily housing sites.
Overall construction costs, and resulting rents, are a deterrent to local use of program. Developers must apply directly to CHFA (California Housing Finance Agency) for loans.
Not needed since the only at-risk units in the city (Orinda Senior Village) have had their affordability contracts extended by the current owners.
Land availability and costs are major deterrents to use of program.
Mobile homes are allowed in Orinda, but high land costs discourage their development. An assessment of current building permits shows that no recent permits have been granted for mobile home installation.
Needs are adequately being met at this time and the City adopted changes to its zoning regulations in 2013 to formally allow emergency shelters in the PS zone, in compliance with state law.
Inapplicable due to absence of substandard housing.
Could potentially be used by a nonprofit sponsor to cover predevelopment expenses associated with potential elderly/disabled housing development.
Program could be used to provide outreach, referral, and placement services to senior citizens interested in shared housing arrangements. Ongoing costs and lack of in-house administrative staff are obstacles to use of program. The City could explore participating in an existing shared housing program, such as the program operated by ECHO Housing.
Section 811
Rental Housing Construction
Deferred Payment Rehabilitation Loans
Marks Foran Rehabilitation Loans
AB 1151-Density Bonuses
AB 655-Multifamily Revenue Bonds
Single-Family Mortgage Revenue Bonds
Home Investment Partnerships (HOME)
Limited funding and intense competition for available funds. Requires nonprofit housing sponsor. Potential funding source for disabled housing on the sites listed in Chapter 4.
As name implies, program applies to construction of rental housing. Preference of local developers to construct for-sale housing is an obstacle to the use of program, as are local construction costs.
No need for program in light of condition of housing stock.
No need for program due to well-maintained condition of local housing stock.
Applies to all local governments in California. The City’s Zoning Ordinance provides density bonuses and other incentives for housing developments that meet criteria set forth in the California Government Code.
City would have to execute cooperative agreement in order to make countywide bond proceeds available locally. However, the use of funds depends on developer interest. Rents allowed under program could be a deterrent to use by local developers.
Similar to multifamily bond program, the City would have to execute a cooperative agreement in order to make countywide bond proceeds available within city. Sale prices allowed under program eliminate new homes from consideration. Some resale homes within the city fall within program limits. Limited applicability.
Funds may be used for construction, acquisition/rehabilitation, and tenant based rental assistance. City supported Eden Housing’s application for such funds.
FHLB Affordable Housing Program Developers must apply to Bank of America Community Development Bank for assistance.
Tax Exempt Affordable Mortgage Program
Provides bond-financed, fixed-rate mortgage for 30 to 40 years to developers of housing that has at least 20% of units occupied and affordable to households making no more than 50% of county median income. Program depends on developers providing housing.
Source: City of Orinda 2022
Non-governmental constraints include the availability of financing, the price of land, and the cost of construction. These and other constraints are discussed in this section.
Since the mid-1960s, raw land prices have been significantly higher in the San Francisco Bay Area than in other areas of California and the rest of the United States. The Construction Industry Research Board (CIRB) reported that land costs for a single-family home rose from $6,600 (21 percent of the total cost) in 1970 to $26,700 (27.8 percent) in 1980. By 2018, land was 40 to 50 percent of total home costs depending on the market, with coastal markets being the most expensive.
Based on research conducted in September 2022 as part of the Housing Element update, there was one vacant lot for sale in Orinda. The 0.83-acre lot was listed for $225,000 on LandWatch.com, or approximately $271,084 per acre. While not within city limits, a 10-acre lot in Lafayette adjacent to the Lafayette Reservoir Recreation Area, just east of Orinda city limits, was listed for $1,600,000, or approximately $160,000 per acre, and may be representative of land costs in Orinda due to its proximity. In both cases, the price of land is beyond the means of very low- and low-income households, and in some cases, moderate-income households. Moreover, the more affordable lots in the city tend to be the most constrained. Their steep slopes or awkward dimensions mean that special design solutions and construction techniques may be required to build a home, therefore increasing the cost of a project further.
High land costs in Orinda reflect the scarcity of developable land in the city, the relatively large parcel sizes, and the city’s desirability as a place to live. These costs represent a constraint to affordable housing development, since it does not make economic sense for a builder to construct a modest, entry-level home on a lot that costs hundreds of thousands of dollars.
Although not required by state housing law, the City has written down land costs through a $2.5 million contribution negotiated with the developers of the Wilder project to facilitate development of the Monteverde Senior Apartments development (on the former public library site) and to facilitate the inclusion of ownership units affordable to moderate-income households in the Orinda Grove development on the Pine Grove site (a former public school). It has also identified church-owned property as housing opportunity sites, recognizing that private land may be too expensive to support affordable units on a large scale. Moving forward, the City may opt at its own discretion to continue to use these approaches to dealing with high land costs and limited land supply in the city.
Orinda’s low-density land use patterns and hilly vegetated terrain helps make wildfires a natural hazard of significant concern to the community. Almost all of Orinda is designated as a Wildland-Urban Interface, where buildings and infrastructure are mixed with areas of flammable wildland vegetation, increasing the community’s exposure to wildfire events. The Orinda Safety Element identifies the mapped wildfire hazard zones in the community. The effects of climate change, including warmer temperatures and more frequent and intense droughts, are expected to increase Orinda’s wildfire risk in the future. In addition to the direct risk of loss of life, injury, and property damage or destruction from wildfires, they can also cause
power outages, disrupt transportation and other infrastructure networks, and create harmful levels of air pollution.
The Moraga-Orinda Fire District reviews all new development in Orinda, including affordable housing units planned for in this Housing Element, and requires that they meet local fire-safe standards that are more stringent than state requirements. Policies being considered for the Safety Element update include requirements for developers to prepare fire protection plans and ensure sufficient emergency access, increased development and maintenance of fuel breaks, and efforts to ensure an adequate water supply for firefighting purposes.
The Moraga-Orinda Fire District also provides fire protection services to the community, has a number of regulations and programs in place to decrease the threat posed by wildfires. This includes a Fire Code that requires additional fire protection standards beyond State minimums for the construction and operation of buildings and other structures, requirements for fire-safe landscaping and site design, limits on open burning, free chipping services to support vegetation management, and other efforts. The City of Orinda also reduces wildfire risk through policies and standards in the Orinda Safety Element and other elements of the General Plan, The Orinda Municipal Code, and other mechanisms.
In some instances, such as a nearby wildfire event, it may be necessary to evacuate part or all of Orinda. The main highways and roads in Orinda, including Highway 24, Moraga Way, and Camino Pablo, may serve as evacuation routes if necessary. However, in keeping with Orinda’s largely residential and rural character, many roads in the community are narrow and winding with limited connections to the rest of the road network, including the primary evacuation routes. The Orinda Safety Element identifies potential evacuation routes and areas with limited ingress and egress. The City has published maps and other information to raise community awareness about how to prepare for and conduct evacuations safety.
As a part of the site-by-site analysis, sites that were not suitable for development were removed from the sites inventory and are not assumed to meet the City’s RHNA.
Sites in and around downtown Village and Theatre Districts are generally the best suited for urban development and higher-density residential uses. They have good access, gentle topography, utility service, and no natural or human-made hazards. The major constraints to development in these areas are San Pablo Creek and the Pacific Gas and Electric Company (PG&E) transmission lines. The creek runs north to south through Orinda Village. It is buried below ground in some locations and runs above ground in others. Where the creek has not been buried, development must be set back from the banks to avoid flooding and protect riparian vegetation. This is more of a commercial development constraint than a residential constraint, given the commercial zoning along the creek corridor.
The City has included 6 sites in the inventory that are in the presence of multiple high-voltage transmission lines (and associated steel towers) in and around Downtown Orinda.
There are no infrastructure constraints to development in Orinda, other than the absence of sewer lines in portions of the upper El Toyonal area. The areas identified for possible future multifamily development are located in areas with water, sewer, and drainage services. These areas would only require laterals to utility lines in adjacent streets for service.
Every 10 years, EBMUD performs a comprehensive demand projections study to understand water demand and supply projections for a 30-year horizon. The most recent update was completed in 2020 and projected demand and required supply for 2050. As reported in EBMUD’s 2020 Urban Water Management Plan, the water demand forecasting methodology relied on long-term planning documents approved and adopted by the local and regional land use agencies. Specifically, “Growth projections in EBMUD’s future water demand is a reflection of planned land-use changes and redevelopment projects forecasted by the local and regional land use agencies” (EBMUD Urban Water Management Plan, 2020). As demonstrated in the Urban Water Management Plan, EBMUD shows adequate capacity to accommodate the demand including the 2023-2031 RHNA, through 2050 through a diversified and resilient portfolio that includes recycled water and conservation programs.
Water supply is adequate to meet projected needs. To account for capacity, Central San prepared the updated wastewater utility service capacity/demand report for Board acceptance in 2018. The methodology Central San employs to track capacity is a capacity modeling program called InfoWorks to assess the impacts of proposals for localized development in areas of known or anticipated capacity deficiencies or current, high-maintenance facilities. The anticipated demand is projected and discussed in the 2017 Comprehensive Wastewater Master Plan (CWWMP, which estimated that affordable units would have an added burden of 0.46 (million gallons a day (mgd), residential units an extra 1.01 mgd, and non-residential an added 0.59 mgd. In combination with the 2017 average daily sanitary flow (ADWF) of 33.3 mgd, the effluent discharge capacity total is below the 53.8 mgd limit for 2022. Using this data, Central San concludes they can provide sufficient and adequate collection and treatment services for anticipated demand up until the year 2035. Central Contra Costa Sanitary District (CCCSD) prioritizes new wastewater connections for affordable housing (CCCSD Resolution 2008-114). An entire proposed development that has at least one affordable housing unit will receive priority. To accurately account for these units, CCCSD uses the RHNA developed by ABAG for lower-income units when measuring future demand for capacity collection and treatment services.
To comply with SB 1087, the City will immediately forward its adopted Housing Element to its water and wastewater providers so they can grant priority for service allocations to proposed developments that include units affordable to lower-income households.
Both EBMUD and CCCSD have adequate capacity to accommodate the 2023-2031 RHNA on sites identified in the Sites Inventory Section.
Dry utilities, including cable, electricity, and telephone service, are available to all areas within the city. There is sufficient capacity to meet the current need and any future need. Service providers are as follows:
Cable: Comcast
Electricity: Pacific Gas and Electric
Mobile Coverage: AT&T Wireless, T-Mobile, and Verizon Wireless
Internet Service: Xfinity and AT&T
Construction costs for a single-family home are approximately $176 per square foot. This is based on costs calculated for a 2,000-square-foot, wood-framed, single-story, four-cornered home, of good quality construction and including a two-car garage and forced-air heating and cooling in Orinda. Estimated total construction costs for such a home are $352,360. These construction costs include labor, materials, and equipment, but do not include costs of buying land (2022 National Building Cost Manual and 2022 94563 zip code modifiers, Craftsman Book Company).
In contrast, costs for multi-family construction are estimated to be approximately $178 per square foot. The higher cost of construction for multi-family compared to single-family likely poses a constraint on development of this housing type. The cost is estimated for a 4-story building in Orinda with 40 units and an average unit size of 800-square-feet each. The calculation is for a wood or light steel frame structure including forced air heating and cooling and constructed of good quality materials. The estimated total construction costs for each unit are $137,885, and total construction costs for the building are $5,703,577. These construction costs include labor, materials and equipment but do not include costs of buying land or off-street parking. (2022 National Building Cost Manual and 2022 94563 zip code modifiers, Craftsman Book Company.) While construction costs are outside of the control of the City, Actions 1.E and 1.F to assist in the development of affordable for-sale and rental housing, through density bonuses and other measures, to reduce the per-unit cost.
However, construction costs in Orinda are higher than regional averages, since most work is custom-built for owners rather than built on speculation or in large quantities (with associated economies of scale). Many residents have remodeled their homes using high-end materials and construction methods. In addition, market conditions drive the demand for homes with numerous amenities and luxury market features. New construction costs of $300 per square foot are not uncommon, resulting in home costs that often exceed $1 million. When homes are sold, labor and material costs may be passed along to future buyers.
In November 2021, the prevailing mortgage interest rate for a 30-year fixed loan was 3.36 percent. From a historical perspective, mortgage rates are low compared to 18.8 percent in 1982 and have somewhat offset the inflation of housing and construction costs. However, financing may be more difficult to secure now than it was five years ago, particularly for low- and moderate-income buyers. For qualified homebuyers, securing financing is not considered a potential constraint to the development, improvement, or maintenance of housing in Orinda.
The California Government Code requires the Housing Element to contain “a statement of goals, quantified objectives, and policies relative to the maintenance, preservation, improvement, and development of housing” (Section 65583(b)(1)). This chapter fulfills that requirement. It builds on information in previous chapters to provide direction on key housing issues in Orinda.
The Housing Element’s goals define the major topic areas covered. These topics are:
1. New Housing Production
2. Housing Conservation
3. Housing Opportunity Sites
4. Housing Constraints
5. Fair Housing
6. Energy Conservation
In accordance with state law, measurable objectives have been developed for specific actions. These objectives represent targets for the number of housing units to be preserved, improved, or developed during the 2023-2031 planning period.
Each of the Housing Element’s six goals is accompanied by policies and actions. The policies are intended to guide day-to-day decisions on housing, while the actions identify the specific steps the City will take after the element is adopted to achieve its housing objectives. The actions are followed by narrative text providing further detail on the steps to be taken in the coming years. The actions lay the groundwork for future housing development through the establishment and administration of land use and development controls, concessions and incentives, and the use of available federal and state financing and subsidy programs.
Goal 1: New Housing Production. Encourage the development of a variety of types of housing for all income levels, which will be assisted through appropriate zoning and development standards.
Goal 2: Housing Conservation. Promote the conservation and maintenance of Orinda’s housing stock.
Goal 3: Housing Opportunity Sites. Provide additional housing opportunities and sites to meet the needs of Orinda’s low-, very low-, and moderate-income households.
Goal 4: Housing Constraints. Reduce governmental constraints to the production and preservation of housing in Orinda.
Goal 5: Fair Housing. Promote equal housing opportunities for all Orinda residents, regardless of race, religion, sex, marital status, ancestry, national origin, or color.
Goal 6: Energy Conservation. Promote energy conservation and efficiency in existing housing and new development.
Encourage the development of a variety of types of housing for all income levels, which will be assisted through appropriate zoning and development standards.
Policy 1.1: Housing Diversity. Provide for a diversity of housing types to meet current and future needs of all residents without compromising the semi-rural character of Orinda’s neighborhoods.
Policy 1.2: Infrastructure. Maintain land use policies that allow residential growth consistent with the availability of adequate infrastructure and public services.
Policy 1.3: Promote Accessory Dwelling Units. The City shall develop tools, resources, and educational materials to increase awareness and support, and to promote and facilitate the development of Accessory Dwelling Units (ADUs) in neighborhoods throughout the city.
Policy 1.4: Design Quality. Apply high standards of quality and design to all housing development in the city. Where multifamily or mixed-use housing is constructed, it should respect the context of the site and its surroundings and make a positive contribution to the character of Orinda.
Implementing Actions
Action 1.A: Downtown Precise Plan. Adopt the Downtown Precise Plan (DPP) to allow for the development of high-density multifamily housing to accommodate a portion of the City’s Regional Housing Needs Allocation (RHNA). The DPP covers a 146.3-acre project area, but the focus area comprises a total of approximately 60 acres. The DPP will require a minimum of 20 units per acre with a maximum density of 50 units per acre in the Downtown Commercial (DC) zoning district and will require a minimum of 20 units per acre with a maximum density of 25 units per acre in the Downtown Office (DO) zoning district, to allow for at least 342 units (Table 5-5). Additionally, the City will create two new General Plan land use designations (Action 1.D) Residential, High Density Multi-Family (RH) which will allow 20-30 units per acre, and Residential, Very High Density Multi-Family (RVH) which will allow 30-50 units per acre, to be consistent with the increased allowable density The City will ensure compliance with Government Code Section 65583, subdivision (c)(1) and 65583.2 subdivisions (h) and (i), as listed below.
● Permit owner-occupied and rental multifamily uses by right and not require a conditional use permit or other discretionary review or approval for developments in which 20 percent or more of the units are affordable to lower income households.
● Permit the development of at least 16 units per site and a minimum of 20 dwelling units per acre.
● Ensure (a) at least 50 percent of the shortfall of low- and very low-income regional housing need can be accommodated on sites designated for exclusively residential uses, or (b) if accommodating more than 50 percent of the low- and very low-income regional housing need on sites designated for mixed-uses, all sites designated for mixed-uses must allow 100 percent residential use and require residential use to occupy at least 50 percent of the floor area in a mixed-use project.
● Ensure sites will be available for development during the planning period where water and sewer can be provided.
Responsible Agency: Planning Department, Contra Costa County Building Department
Timeframe: Adopt the DPP within 3 years and 120 days from January 31, 2023. Monitor affordability and location of rezoned sites. Create two new General Plan Land Use Designations to be consistent with increased allowable densities in the Downtown Commercial (DC) zones concurrently with associated rezones, by May 31, 2026.
Funding Source: General Fund
Quantified Objective: Create opportunity for at least 422 units and increase the current capacity to provide opportunity for multifamily housing for all households, which will be within close proximity to services and other resources in high opportunity areas.
Action 1.B: Housing Opportunity Sites. Rezone sites listed in Table 5-7 of the Housing Sites Inventory to allow for additional capacity to accommodate a portion of the City’s RHNA. The following actions will be taken:
● Sites C-2, C-3, and C-4 are church properties that 12.64 acres. The city assumed that only 4.94 acres, a capacity of 99 units, will be rezoned to the new Residential High Density-25 (RH-25) zoning district which will allow for a minimum of 20 units per acre and a maximum of 25 units per acre, on a percentage of the site specified in Table 5-7.
● Site S-1 is the Miramonte High School Site and totals 51.95 acres. The city is only assuming 18 percent, 9.35 acres allowing for a capacity of 187 units, will be rezoned to the new Residential High Density-25 (RH-25) zoning district which will require a minimum of 20 units per acre and a maximum of 25 units per acre, on a percentage of the site specified in Table 5-7.
Additionally, the City will create two new General Plan land use designations (Action 1.D) Residential, High Density Multi-Family (RH) which will allow 20-30 units per acre, and Residential, Very High Density Multi-Family (RVH) which will allow 30-50 units per acre, to be consistent with the increased allowable density.
The City will ensure compliance with Government Code Section 65583, subdivision (c)(1) and 65583.2 subdivisions (h) and (i), as listed below.
Action 1.C
● Permit owner-occupied and rental multifamily uses by right and will not require a conditional use permit or other discretionary review or approval for developments in which 20 percent or more of the units are affordable to lower income households.
● Permit the development of at least 16 units per site and a minimum of 20 dwelling units per acre.
● Ensure (a) at least 50 percent of the shortfall of low- and very low-income regional housing need can be accommodated on sites designated for exclusively residential uses, or (b) if accommodating more than 50 percent of the low- and very low-income regional housing need on sites designated for mixed-uses, all sites designated for mixed-uses must allow 100 percent residential use and require residential use to occupy at least 50 percent of the floor area in a mixed-use project .
● Ensure sites will be available for development during the planning period where water and sewer can be provided.
Responsible Agency: Planning Department, Contra Costa County Building Department
Timeframe: Complete all rezones within 3 years and 120 days from January 31, 2023. Monitor affordability and location of rezoned sites. Create two new General Plan Land Use Designations to be consistent with increased allowable densities in the new RH-25 and RH-40 zones concurrently with associated rezones, by May 31, 2026.
Funding Source: General Fund
Quantified Objective: Create opportunity for 286 units for lower-income households that will be within close proximity to services and other resources in high-opportunity areas.
Caltrans Gateway Site Development. Site G-4, the Caltrans right-of-way site (Gateway) totals 10 acres. The city assumes that the entire site will be rezoned allowing for of highdensity housing with minimum capacity of 200 units and a maximum of 400 units. The site will be rezoned to the new Residential High Density-40 (RH-40) zoning district which will require a minimum of 20 units per acre with a maximum of 40 units per acre. Additionally, the City will create two new General Plan land use designations (Action 1.D) Residential, High Density Multi-Family (RH) which will allow 20-30 units per acre, and Residential, Very High Density Multi-Family (RVH) which will allow 30-50 units per acre, to be consistent with the increased allowable density.
The site is currently owned by Caltrans and the City will work with Caltrans and/or go through the Governor’s Executive Order to decertify the site. The City will assist any interested developers with the decertification requirements as projects come forward, including costs to for the decertification process. The City will also work closely with Caltrans and the developer to determine the next steps and help facilitate the process. The City will initiate the decertification process by June 2023 and evaluate the decertification progress by June 2024 to determine if decertification will be completed by January 2025. If identified that completion of the decertification process will extend beyond January 2025,
the City will identify additional sites to rezone, if a shortfall is identified, and rezone additional sites by January 2026. The City will also biennially reach out to affordable housing developers to encourage development on this site.
The City will work with the potential developer of the site to ensure walkability is improved by connecting pedestrian paths with the downtown. This could be done in the way of a city funded and/or grant funded study. The City will also proactively engage in discussions to have the future Wilder Shuttle and/or with CountyConnection about a potential shuttle to ensure connectivity from the Caltrans Gateway site to the Orinda Downtown and the BART station. The site would also be easily served by the existing the existing school bus route serving the nearby Wilder community.
The City will ensure compliance with Government Code Section 65583, subdivision (c)(1) and 65583.2 subdivisions (h) and (i), as listed below.
● Permit owner-occupied and rental multifamily uses by right and will not require a conditional use permit or other discretionary review or approval for developments in which 20 percent or more of the units are affordable to lower income households.
● Permit the development of at least 16 units per site and a minimum of 20 dwelling units per acre.
● Ensure (a) at least 50 percent of the shortfall of low- and very low-income regional housing need can be accommodated on sites designated for exclusively residential uses, or (b) if accommodating more than 50 percent of the low- and very low-income regional housing need on sites designated for mixed-uses, all sites designated for mixed-uses must allow 100 percent residential use and require residential use to occupy at least 50 percent of the floor area in a mixed-use project .
● Ensure sites will be available for development during the planning period where water and sewer can be provided.
Responsible Agency: Planning Department, Contra Costa County Building Department
Timeframe: Initiate decertification process by June 2023, evaluate decertification progress by June 2024, if determined that completion will exceed January 2025, identify additional rezone sites, and rezone additional sites by January 2026. Meet with Caltrans annually and/or as potential developers come forward. Reach out to affordable housing developers biennially to encourage development on the site (Site G-4) and assist any interested developers with decertification requirements as projects come forward. Proactively study potential pedestrian paths and additional shuttle service by 2025.
Funding Source: General Fund
Quantified Objective: Create opportunity for 200 units for lower-income households that will be within close proximity to services and other resources in high-opportunity areas.
Action 1.D. Residential Zoning Districts and Land Use Designation. Establish two new zoning districts to support the development of lower income housing and assist with meeting the lower income RHNA. The Residential High Density-25 (RH-25) will require a minimum of 20 units per acre with a maximum of 25 units per acre. The Residential High Density-40 (RH-40) will require a minimum of 20 units per acre with a maximum of 40 units per acre and will have a height limit of 50 feet/5 stories. Both zoning districts will be consistent with the two new Land Use Designations, Residential, High Density Multi-Family (RH) which will allow 20-30 units per acre, and Residential, Very High Density Multi-Family (RVH) which will allow 3050 units per acre.
Amend the Senior Housing Overlay (SH-Overlay) to remove the following statements regarding height limit approval “or as established by the Planning Commission by conditions imposed at the time of review for approvals”. The allotted height will be “as required by the closest adjoining residential or downtown district base regulations”. The City will also increase the allowable lot width from 120 feet to 150 feet, and the lot depth from 120 feet to 150 feet and will revise the height limit to allow for 3 stories. Responsible Agency: Planning Department, Contra Costa County Building Department
Timeframe: Create the RH-25 and RH-40 zoning districts and the RH and RVH land use designations within 3 years and 120 days from January 31, 2023. Amend the SH-Overlay by December 2024.
Funding Source: General Fund
Quantified Objective: Create opportunity for 670 units for lower-income households that will be within close proximity to services and other resources in high-opportunity areas.
Action 1.E: Promotion of Accessory Dwelling Units. The City will encourage the construction of ADUs through the following actions, which are aimed at providing an increased supply of affordable units throughout the city, thereby increasing access to high resource established neighborhoods outside of the Downtown and Opportunity zone areas and help reduce displacement risk for low-income households.
● Review and revise the City’s ADU ordinance, as needed, including in response to recent changes in state law and/or future comments it may receive from HCD.
● Continue to implement a public information and proactive outreach campaign via the City’s website and the Orinda City newsletter to inform property owners of the standards for ADU development, permitting procedures, construction resources, and the importance of ADUs to Orinda, including ADUs affordable to lower-income households.
● Provide information to encourage residents to apply for ADUs, particularly where their homes already include space that is configured for a conforming ADU (e.g., carriage houses, au pair quarters, second kitchens on floors with separate entrances).
● Produce a flyer regarding ADUs and make available at the Planning Department counter and to project applicants for all discretionary land use applications.
● At least annually, publish informational materials pertaining to ADUs through a combination of media, including the City’s website and direct mailings.
● Identify incentives for construction of ADUs with new development, which may include differing collection of impact fees for the square footage associated with the ADU until issuance of the certificate of occupancy.
● Collect and monitor data on ADU production and affordability and identify additional capacity within 6 months, if needed.
Responsible Agency: Planning Department, Contra Costa County Building Department
Timeframe: Review and revise the current ADU ordinance, as needed, by December 2024; make ADU materials available by December 2023 and implement proactive outreach campaign by June 2024, implement by June 2025; evaluate effectiveness of ADU approvals and affordability every other year, starting 2024; and identify additional site capacity, if needed, by 2025.
Funding Source: General Fund
Quantified Objectives: 63 ADUs to improve housing mobility and improve proximity to services and employment opportunities for lower- and moderateincome households (40 ADUs are assumed to address the displacement risk).
Action 1.F: Multifamily Development. To assist in the development of affordable for-sale and rental housing, the City will continue to offer density bonuses and will implement additional measures, including, but not limited to, expedited permit processing, reduced parking standards, and reduced lot sizes. The City will prioritize projects that are in areas with currently low percentages of renter-occupied households to facilitate housing mobility and integration of ownership and rental units.
Responsible Agency: Planning Department, Contra Costa County Building Department
Timeframe: Implement additional incentives by June 2024. Ongoing thereafter, as applications are processed through the Planning Development and Contra Costa County Building Department, reach out to housing developers annually.
Funding Source: General Fund
Quantified Objective: 50 lower-income units, 30 units within close proximity to services and other resources in high opportunity areas.
Action 1.G: Support Affordable Housing Development. Work with housing developers to expand opportunities for affordable lower-income housing for special-needs groups, including persons with physical and developmental disabilities, female-headed households, large families, extremely low-income households, and persons experiencing homelessness by creating partnerships, providing incentives, and pursuing funding opportunities.
● Support affordable housing development for special-needs groups throughout the city, including in areas that are predominantly single-family residential. The target populations include seniors; persons with disabilities, including developmental disabilities; female-headed households; and homeless persons to reduce the displacement risk for these residents from their existing homes and communities.
● Promote the use of the density bonus ordinance, application process streamlining, and fee deferrals to encourage affordable housing, with an emphasis on encouraging affordable housing in high-resource areas and areas with limited rental opportunities currently.
● Facilitate the approval process for land divisions, lot line adjustments, and/or specific plans or master plans resulting in parcel sizes that enable affordable housing development and process fee deferrals related to the subdivision for projects affordable to lower-income households.
● Give priority to permit processing for projects providing affordable housing for specialneeds groups.
● Work with public or private sponsors annually to identify candidate sites for new construction of housing for special needs and take all actions necessary to expedite processing of such projects.
● Encourage residential development near parks, open space, transit routes, civic uses, social services, and other health resources.
● Partner with nonprofit and for-profit affordable housing developers to support their financing applications for state and federal grant programs, tax-exempt bonds, and other programs that become available.
● Pursue federal, state, and private funding for low- and moderate-income housing by applying for state and federal monies for direct support of lower-income housing construction and rehabilitation, specifically for development of housing affordable to extremely low-income households.
● Pursue partnerships with the Regional Center of the East Bay to identify funding opportunities and promote housing for persons with disabilities.
Responsible Agency: Planning Department, Contra Costa County Building Department
Timeframe: Ongoing, as projects are processed by the City. Annually apply for funding and annually engage with the Regional Center of the East Bay and public and/or private sponsors.
Funding Source: Where feasible, leverage state and federal financing, including Low Income Housing Tax Credits, CHFA multifamily housing assistance programs, HCD Multifamily Housing Loans, CDBG funds, HOME funds, and other available financing.
Quantified Objective: 50 lower-income units to reduce displacement risk.
Action 1.H: No Net Loss of Housing Capacity. Develop and implement an evaluation procedure to ensure the City maintains sufficient land to accommodate the Regional Housing Needs Allocation (RHNA) throughout the planning period. Should the City fall into a no net loss situation, within 180 days, the City will identify a replacement site to ensure the remaining RHNA is being met.
Responsible Agency: Planning Department
Timeframe: Develop a monitoring program by January 2024; ongoing monitoring as zoning changes are proposed and/or as development is proposed on multifamily housing sites.
Funding Source: General Fund
Action 1.I: Senate Bill 9 (SB 9) – The California Housing Opportunity and More Efficiency (HOME) Act. Through SB 9, the City will expand homeownership opportunities by allowing property owners to split a single-family zoned lot into two lots and/or place up to two housing units on a single-family zoned lot. Properties meeting the various criteria specified in the legislation are eligible to add the additional housing by right and are exempt from review under CEQA. The city is in compliance with SB 9.
Responsible Agency: Planning Department
Timeframe: Ongoing; monitor as units are approved
Funding Source: General Fund
Quantified Objective: 25 units to expand homeownership opportunities.
Action 1.J Sites Used in Previous Housing Element Cycles. Pursuant to Government Code Section 65583.2(c), a nonvacant site identified in a prior housing element and a vacant site that has been included in two or more consecutive planning periods that was not approved to develop a portion of the locality’s housing need shall not be deemed adequate to accommodate a portion of the housing need for lower income households in the current housing element unless the site is zoned at residential densities consistent with the City’s default density and the site is rezoned within three years of the beginning of the planning period to allow residential use by right for housing developments in which at least 20 percent of the units are affordable to lower income households.
Responsible Agency: Planning Department
Timeframe: Within three years of the beginning of the planning period
Funding Source: General Fund
Action 1.K Development on Non-Vacant Sites. Establish an outreach and coordination program to connect developers, builders, and owners of non-vacant sites. The program shall:
(1) Emphasize reaching out to owners of non-vacant sites to discuss any interest in redeveloping and available incentives.
(2) Marketing and advertising these sites to the development community along with any incentives that might be available.
(3) Establish biennial meetings with developers and builders.
Responsible Agency: Planning Department
Timeframe: Initiate by October 2023 and maintain throughout planning period on a biennial basis.
Funding Source: General Fund
Quantified Objective: Engage with 5 property owners of high-potential non-vacant sites each year.
Action 1.L Lot Consolidation. The City will help facilitate lot consolidations to combine small residential lots (lots 0.5 acres or smaller) into larger developable lots by providing information on development opportunities and incentives for lot consolidation to accommodate affordable housing units available on the City’s website and discussing with interested developers. As developers/owners approach the City interested in lot consolidation and development on small lots, for the development of affordable housing, the City will offer the following incentives on a project-by-project basis:
• Allow affordable projects to exceed the maximum height limits,
• Lessen setbacks, and/or
• Reduce parking requirements.
The City will also offset fees (when financially feasible) and offer concurrent/fast tracking of project application reviews to developers who provide affordable housing.
Responsible Agency: Planning Department
Timeframe: Identify incentives by August 2023, offer incentives by January 2024. Ongoing thereafter, as projects are processed through the Planning Department. Annually meet with local developers to discuss development opportunities and incentives for lot consolidation.
Funding Source: General Fund
Quantified Objective: 26 lower income units, 36 moderate income units, and 38 above moderate-income units.
GOAL 2: HOUSING CONSERVATION
Promote the conservation and maintenance of Orinda’s housing stock.
Policy 2.1: Housing Reinvestment. Encourage reinvestment in the city’s housing stock by private property owners.
Policy 2.2: Affordable Housing Preservation. The City shall prioritize the preservation of existing affordable housing at risk of loss of affordability covenants as a critical means of mitigating the displacement and loss of affordable housing units from the City’s inventory.
Policy 2.3: Smaller Homes. Conserve Orinda’s existing supply of smaller and more affordable singlefamily homes, including older two- and three-bedroom homes on lots smaller than 10,000 square feet. Development standards that encourage preservation of smaller homes on such lots should be continued as a way to discourage “teardowns” and maintain housing diversity.
Policy 2.4: Code Enforcement. Maintain code enforcement programs to ensure that all housing units are safe and sanitary and contribute positively to the city’s character. Require abatement of housing nuisances, consistent with provisions of the Orinda Municipal Code.
Implementing Actions
Action 2.A: Preservation of At-Risk Housing Units. As of March 2022, the city does not have any publicly assisted affordable projects at risk of converting to market rate in the next 10 years. The City shall maintain and update the affordable housing database as a mechanism to monitor and identify units at risk of losing their affordability subsidies or requirements. For complexes at risk of converting to market rate, the City shall:
● Contact property owners of units at risk of converting to market-rate housing within one year of affordability expiration to discuss the City’s desire to preserve complexes as affordable housing.
● Coordinate with owners of expiring subsidies to ensure the required notices to tenants are sent out at 3 years, 12 months, and 6 months.
● Reach out to agencies interested in purchasing and/or managing at-risk units.
● Work with tenants to provide education regarding tenant rights and conversion procedures pursuant to California law.
Responsible Agency: Planning Department, Contra Costa County Conservation and Development Division
Timeframe: Annually monitor units at risk of converting; coordinate noticing as required per California law.
Funding Source: General Fund
Quantified Objective: Preserve 217 lower-income units as funding expires to reduce displacement risk.
Action 2.B: Housing Rehabilitation. Participate in Contra Costa County’s housing rehabilitation program and publicize the availability of the County’s low-interest loan programs for lowerincome seniors and other households.
The City will coordinate with County staff to confirm program requirements and eligibility annually. The City will continue to advertise the program on the City’s website and in its quarterly newsletter. The City will also distribute information on the program in areas of concentrated rehabilitation need or senior households, where need for the program may be greatest.
Responsible Agency: Planning Department, Contra Costa County Conservation and Development Division
Timeframe: Ongoing; coordinate with County staff at least annually; post information/links to the City’s website by February 2023; advertise the program in the City’s newsletter quarterly; mail informational flyers to residents of areas of concentrated need annually.
Funding Source: Contra Costa County, General Fund
Quantified Objective: Connect 20 lower-income households with rehabilitation opportunities and reduce displacement.
Action 2.C: Home Maintenance and Repair Programs. Advertise the availability of existing home maintenance, repair, and improvement programs such as the low- and zero-interest loans offered through Contra Costa County’s Neighborhood Preservation Program on the City’s website and through printed materials made available at City Hall and other public locations such as libraries. Consider applying for additional grant funding to assist homeowners with addressing Americans with Disabilities Act (ADA) accessibility modifications to their homes. Conduct code enforcement on a complaint-driven basis to address safety and code compliance issues. Targeted efforts to improve housing conditions in areas of need will facilitate place-based revitalization and assist in reducing displacement risk for these residents by improving living conditions and enabling them to remain in their home and community.
Responsible Agency: Planning Department, Contra Costa County Building Department
Timeframe: Provide information on the City’s website by January 2023, printed materials by March 2023, updating each annually or as changes are made. Pursue funding for additional assistance annually and as NOFAs are made available.
Funding Source: Contra Costa County, General Fund
Quantified Objective: Connect 30 eligible households with maintenance and repair assistance programs and reduce displacement.
Action 2.D: Participation in First-Time Home Buyer and MCC Programs. Participate in the County’s First-Time Homebuyer and Mortgage Credit Certificate (MCC) programs to provide financial assistance to eligible first-time low-income and moderate-income homebuyers. To reduce displacement risk of prospective homebuyers being priced out of the community, the City will promote the availability of these programs in areas with concentrations of renters, particularly low-income renters, through providing information materials at public buildings and locations and will post the programs on the City’s website and in City buildings.
Responsible Agency: Planning Department, City Council
Timeframe: Develop informational materials to distribute annually and post on the City’s website by May 2023.
Funding Source: General Fund, MCC program (Contra Costa County)
Quantified Objective: Connect 25 eligible residents with assistance through either the First-Time Homebuyer or MCC programs to reduce displacement and assist in housing mobility for eligible households.
Action 2.E: Replacement Housing. To facilitate place-based revitalization for households at risk of displacement due to new development, the City will require replacement housing units subject to the requirements of Government Code, Section 65915, subdivision(c)(3), on sites identified in the site inventory when any new development (residential, mixed-use, or nonresidential) occurs on a site that has been occupied by or restricted for the use of lowerincome households at any time during the previous five years. This requirement applies to non-vacant sites and vacant sites with previous residential uses that have been vacated or demolished.
Responsible Agency: Planning Department, Contra Costa County Conservation and Development Division
Timeframe: The replacement requirement will be implemented immediately and applied as applications on identified sites are received and processed.
Funding Source: General Fund
Quantified Objective: Replace any of units identified in the sites inventory if (a) they are planned to be demolished for purposes of building new housing, and (b) they are determined to be occupied by low-income households, provide assistance to prevent displacement of lower-income households due to loss of affordable units.
GOAL 3: HOUSING OPPORTUNITIES
Provide additional housing opportunities and sites to meet the needs of Orinda’s low-, very low-, and moderate-income households.
Policy 3.1: Adequate Sites. Maintain an adequate number and variety of sites to meet the City’s Regional Housing Needs Allocation.
Policy 3.2: Mixed-Income Housing. Encourage larger-scale residential developments to include a mix of unit types, including smaller units and units that are affordable to lower- and moderateincome households.
Policy 3.3: Downtown Residential Use. Promote and allow multifamily residential uses within Orinda’s Downtown.
Policy 3.4: Shared Housing. Encourage the sharing of housing units by homeowners seeking to age in place or supplement their income. Shared housing can provide an important resource for seniors, young adults, and others in the community who cannot afford their own home or apartment.
Policy 3.5: Extremely Low-Income Households. Ensure compliance with state regulations regarding zoning for emergency shelters and other provisions to ensure housing opportunities for extremely low-income Orinda households or those residents who are in crisis or in need of emergency assistance.
Policy 3.6: Development Agreements. On a case-by-case basis, consider the use of development agreements in larger residential projects as a mechanism for generating funding for affordable housing or providing affordable units within new market-rate projects.
Policy 3.7: Special-Needs Housing. Promote the development of special-needs housing, such as housing for seniors; housing for persons with physical, developmental, or mental disabilities; housing for extremely low-income persons, and female-headed households.
Action 3.A: Shared Housing Program. Participate in the Eden Council for Hope and Opportunity (ECHO) housing’s “Shared Housing” or some similar program as a way to improve housing opportunities for lower-income seniors and extremely low-income Orinda residents.
Work with ECHO, which serves residents throughout the East Bay. The shared housing program matches persons needing housing with homeowners who have available space. The City will explore the feasibility of engaging ECHO or some similar organization to start a comparable program in Orinda. ECHO also provides counseling on shared living, supportive services, and information and referral, as well as educational workshops on home sharing. Implementing this program will support the City’s housing mobility efforts
to increase access to high-resource neighborhoods in Orinda for extremely low-income households in Orinda and from other areas of Contra Costa County that otherwise could not afford to live in Orinda, including single seniors on fixed incomes, persons with physical or developmental disabilities, and young adults seeking employment.
Responsible Agency: Planning Department
Timeframe: Within one year of adopting the Housing Element, or by June 2024, connect with ECHO or similar organization to establish a shared housing program in Orinda. Develop an outreach program to inform Orinda residents about the shared housing program by December 2024.
Funding Source: CDBG, General Fund
Quantified Objective: Connect 20 eligible persons in existing Orinda homes through the shared-home program to reduce displacement risk for lowerincome households and assist in housing mobility for eligible households.
Action 3.B: Extremely Low-Income Housing. Encourage additional housing resources for extremely low-income Orinda residents, particularly seniors and persons with physical or developmental disabilities, through a variety of actions, including:
● Facilitate and encourage the construction of housing affordable to extremely lowincome households by assisting nonprofit and for-profit developers with financial and/or technical assistance in a manner that is consistent with the City’s identified housing needs.
● Provide financial support annually, as available, to organizations that provide counseling, information, education, support, housing services/referrals, and/or legal advice to extremely low-income households, persons with disabilities, and persons experiencing homelessness.
● Expand regulatory incentives for the development of units affordable to extremely lowincome households and housing for special-needs groups, including persons with disabilities (including developmental disabilities), and individuals and families in need of emergency/transitional housing. Incentives will include, but are not limited to, revisions to the Municipal Code to streamline the approval process for extremely lowincome housing and proposals to exempt such housing from certain impact fees. Amendments will be completed, and fee waivers will be determined by December 2024.
● The City will provide financial support annually, as available, to organizations that provide counseling information, education, support, housing services/referrals, and/or legal advice to extremely low-income households to mitigate risk of displacement and support housing stability for extremely low-income households, persons with disabilities, and persons experiencing homelessness.
Responsible Agency: Planning Department
Timeframe: Ongoing; as projects are processed by the Planning Department. Following the update of the Development Code (Actions 1.G and 1.H), review the Development Code and revise as needed annually. By December 2024, expand incentives and reach out to organizations that support extremely low-income residents to understand funding needs, and review and prioritize local funding at least twice in the planning period, and support expediting applications on an ongoing basis.
Funding Source: General Fund
Quantified Objectives: Assist 20 extremely low-income households to reduce displacement risk.
Action 3.C: Assistance for Persons with Developmental Disabilities. The City will also coordinate with the Regional Center of the East Bay to inform Orinda families of the resources available to them and to explore incentives so that a larger number of future housing units include features that meet the needs of persons with developmental disabilities and other special needs.
The City will continue to support the development of small group homes that serve developmentally disabled adults and will work with the nonprofit community to encourage the inclusion of units for persons with developmental disabilities in future affordable housing developments. The City will coordinate housing activities and outreach with the Regional Center for the East Bay and encourage housing providers to designate a portion of new affordable housing developments for persons with disabilities, including persons with developmental disabilities, to increase housing mobility opportunities and pursue funding sources designated for persons with special needs and disabilities.
Responsible Agency: Planning Department
Timeframe: Ongoing; Meet with disability providers by December 2023 and annually coordinate with regional offices and developers to pursue housing opportunities.
Funding Source: General Fund
Quantified Objectives: 10 housing units for persons with disabilities to reduce displacement risk.
Action 3.D: Developmental Disability Services. The City will work with the Regional Center for the East Bay to implement an outreach program that informs families within the city about housing and services available for persons with developmental disabilities. The program could include the development of an informational brochure, including information on the City’s website, and/or providing housing-related training for individuals/families through workshops.
The City will then meet with disability service providers, including the Regional Center for the East Bay, to identify whether there is unmet demand anywhere in the city. If an unmet
need is realized, work with providers to secure funding to expand services for persons with disabilities.
Responsible Agency: Planning Department
Timeframe: Development of an outreach program within one year of adopting the Housing Element (or by December 2024) and meet with disability providers by June 2023. If an unmet demand is realized, work with providers to secure funding to expand services by March 2024.
Funding Source: General Fund
Quantified Objectives: 10 housing units for persons with disabilities to reduce displacement risk.
Action 3.E: Objective Design Standards. Adopt multifamily objective design standards that apply to all housing development projects for which objective standards are required and target the Downtown Precise Plan and Housing Opportunity Sites to support the development of Downtown Orinda as an attractive, mixed-use, and walkable center for Orinda.
Responsible Agency: Planning Department, Contra Costa County Conservation and Development Division
Timeframe: Adopt objective design standards with adoption of the comprehensive Zoning Code update within 3 years and 120 days from January 31, 2023, concurrent with program 1A, 1.B, and 1C, implement after adoption. SB2 expenditures will be consistent with SB2 grant requirements.
Funding Source: Senate Bill 2 Grant, General Fund
Quantified Objective: 300 units over the planning period; of these, 200 units in high opportunity areas to promote access to resources and mobility for target households.
Action 3.F: Shared Parking Regulations. Consider adopting shared parking regulations where it can be demonstrated that there will be no parking shortages.
This action will study provisions to allow sharing of parking where it can be demonstrated that the overall demand for the project can be met without spillover onto nearby streets. For example, residential guest parking could be shared with office or retail parking. These provisions might also consider the feasibility of shared parking agreements that enable the use of off-site parking lots.
Responsible Agency: Planning Department, Public Works/Engineering
Timeframe: Complete study by December 2024, determine next steps within 6 months, by June 2025.
Funding Source: General Fund
Action 3.G: Inclusionary Housing Ordinance. The City will research an inclusionary housing ordinance. This ordinance will identify acceptable methods to provide affordable housing such as: a) construction of housing on- site, b) construction of housing off-site, c) dedication of land for housing, and d) payment of an in-lieu fee. Development of this ordinance requires an analysis of the following variables:
● Limiting the application of the ordinance to developments exceeding a certain size.
● Percentage of housing units required to be set aside as affordable.
● Design and building requirements.
● Timing of affordable unit construction.
● Determination of a fee in lieu of developing affordable units.
● Developer incentives, such as fee deferrals and waivers.
● Administration of affordability control.
Responsible Agency: Planning Department
Timeframe: Determine the appropriateness of an inclusionary ordinance within two years after adoption of the Housing Element. If determined appropriate, adopt an inclusionary ordinance within one year of making the determination.
Funding Source: General Fund
Quantified Objective: 145 lower income units in high opportunity areas to promote access to resources and mobility for target households.
Reduce governmental constraints to the production and preservation of housing in Orinda.
Policy 4.1: Development Standards. Ensure that the development standards expressed in the City’s zoning regulations support the types of uses and activities listed as permitted or conditionally permitted in the Zoning Ordinance, including housing.
Policy 4.2: Approval Processes. Ensure that Orinda’s permitting, and approval processes do not unduly constrain or delay the construction of housing. City procedures should be consistent with Permit Streamlining Act requirements and should not include unreasonable fees or regulations.
Action 4.A: Amend Development Standards to Remove Constraints. The City will amend the Municipal Code to review and revise standards, as needed.
● Emergency Shelters: Allow sufficient parking to accommodate all staff working in the emergency shelter, provided that the standards do not require more parking for emergency shelters than other residential or commercial uses within the same zone, in compliance with Government Code Section 65583(a)(4)(A)(ii)), and amend the managerial standards to ensure that shelter spacing requirements will only be subject to the same development and management standards that apply to residential or commercial development within the same zone except for those standards prescribed by statute and increase the bed limit (clients per night) from seven to 20.
● Multifamily Residential: Remove the “Additional Use Regulations” for multifamily housing in the Residential Medium Density (RM) district, allowing this use by right and remove the use permit requirement in the Downtown Commercial (DC) zoning district to allow this use by right.
● Residential Care Facilities: Allow residential care facilities, regardless of size, in all zones that permit residential uses of the same type, in accordance with the City’s definition of family.
● Single-Room Occupancy Units: To encourage housing mobility, define single-room occupancy (SRO) units and allow them in the DC (Downtown Commercial) zoning district with a use permit, in compliance with Government Code Section 65583(c)(1).
● Transitional and Supportive Housing: Allow supportive housing as a permitted use without discretionary review in zones where multifamily and mixed-use developments are permitted, including nonresidential zones permitting multifamily uses (Government Code Section 65583(c)(3) and Section 65650).
● Low-Barrier Navigation Centers: Allow low-barrier navigation centers for the homeless by right in zones that allow for mixed-use and nonresidential zones permitting multifamily uses, per Government Code Section 65662.
● Employee/Farmworker Housing: Allow employee/farmworker housing that serves six or fewer persons as a single-family structure and permit it in the same manner as other single-family structures of the same type in the same zone and across all zones that allow single-family residential uses. The amendment will also treat employee/farmworker housing consisting of no more than 12 units or 36 beds as an agricultural use and permit it in the same manner as other agricultural uses in the same zone, in compliance with the California Employee Housing Act (Health and Safety Code Sections 17021.5 and 17021.6).
Responsible Agency: Planning Department
Timeframe: Amend the Zoning Code by December 2024.
Funding Source: General Fund
Quantified Objective: 30 units; of these, encourage 20 units in areas with close proximity to resources and services to improve access to opportunity for lower-income and special-needs persons.
Action 4.B: Development Review and Processing Procedures. The City will continually seek to improve development review and procedures to minimize the time required for review and project approval. This reduction in time will reduce the cost to developers and may increase housing production in the city.
Responsible Agency: Planning Department, Contra Costa County Building Department
Timeframe: Annually review and revise, starting in June 2023
Funding Source: General Fund
Action 4.C: Building Code. As new uniform codes are adopted every three years by the California Building Standards Commission, the City will review and revise its building codes for current compliance and adopt the necessary revisions to further local development objectives.
Responsible Agency: Planning Department, Contra Costa County Building Department
Timeframe: Annually review and update the City’s building codes and as new codes are adopted by the State of California.
Funding Source: General Fund
Action 4.D: Infrastructure Availability. The City will coordinate with the East Bay Municipal Utilities District (EBMUD) annually and as projects are proposed and apply for funding from the Community Development Block Grant (CDBG), Infill Infrastructure Grant Program, or other funding programs, as available, to fund design plans and infrastructure improvements for affordable housing projects.
Responsible Agency: Planning Department
Timeframe: Annually coordinate with EBMUD and apply for grants annually and as Notices of Funding Availability (NOFAs) are released.
Funding Source: General Fund
Quantified Objective: Expansion of water and sewer services to ensure all sites included in the sites inventory have water and sewer readily available.
Action 4.E: Revised Parking Standards. To ensure parking is not a constraint on the development of housing, the City will complete the following actions:
- Review and revise current parking standards to ensure they do not constrain the development of housing, (i.e., the City will not require more than 1 parking space for a 1-bedroom unit).
- Analyze existing parking standards for residential units. Based on this analysis, consider modifications to the Zoning Ordinance to better encourage infill development.
- Review parking standards for housing for persons with disabilities and affordable housing and consider reductions.
- Consider parking reductions, eliminating parking minimums, and explore instituting parking maximums.
Responsible Agency: Planning Department, Contra Costa County Building Department
Timeframe: Review and revise parking standards by December 2024, analysis, outreach and coordination will be initiated in 2024. Recommendations to be presented to the City Council for consideration and approval in 2025. Should the City Council not approve the recommendations, the City will review, revise, and present again by July 2026 for consideration and approval. Implement after approval.
Funding Source: General Fund
Action 4.F: Reasonable Accommodations. The City will continue to implement state requirements (Sections 4450 to 4460 of the California Government Code and Title 24 of the California Code of Regulations) to include accessibility in housing and public facilities for persons with disabilities and will review and revise findings for approving reasonable accommodation requests, specifically, the establishment, maintenance, or operation of the temporary activity would not be detrimental to the public health, safety, or welfare of persons residing or working in the neighborhood of the proposed activity, to ensure they do not pose any barriers to housing for persons with disabilities.
Responsible Agency: Planning Department, Contra Costa County Building Department
Timeframe: Ongoing, as applications are processed by the City; review and revise regulation approval findings as needed, and specifically remove requiring any type of fee, by December 2022.
Funding Source: General Fund
Quantified Objective: Assist 3 residents with reasonable accommodation requests to reduce displacement risk and improve housing mobility
Action 4.G: Monitor Development Fees. The City will monitor development fees to ensure they are reasonable and do not unduly constrain development while protecting the quality, health, and public safety of the community. The City will analyze all fees required for multifamily development and reduce them if found to be a constraint. The analysis process will include meeting with multifamily developers/applicants to get their input regarding constraints associated with fees.
Responsible Agency: Planning Department
Timeframe: Annually review, meeting with developers/applicants by December 2024, reduce thereafter.
Funding Source: General Fund
GOAL 5: FAIR HOUSING
Promote equal housing opportunities for all Orinda residents, regardless of race, religion, sex, marital status, ancestry, national origin, or color.
Policy 5.1: Promote Mixed-Income Neighborhoods. The City shall promote mixed-income neighborhoods with an equitable distribution of housing types for people of all incomes throughout the City by encouraging new affordable housing in high resource areas.
Policy 5.2: Prohibit Discrimination. Prohibit discrimination in the sale or rental of housing to anyone on the basis of race, color, ancestry, national origin, religion, disability, sex, familial status, marital status, or other characteristics protected by the California Fair Employment and Housing Act (Part 2.8 commencing with Section 12900 of Division 3 of Title 2), Government Code Section 65008, and any other state and federal housing and planning law.
Action 5.A: Affirmatively Furthering Fair Housing (AFFH). In compliance with California Government Code Sections 8899.50, 65583(c)(5), 65583(c)(10), 65583.2(a) (AB 686), develop a plan to “affirmatively further fair housing” (AFFH). The AFFH plan shall take actions to address significant disparities in housing access and needs for all persons regardless of race, color, religion, sex, gender, sexual orientation, marital status, national origin, ancestry, familial status, source of income, or disability and any other characteristic protected by the California Fair Employment and Housing Act (Part 2.8, commencing with Section 12900, of Division 3 of Title 2), Government Code Section 65008, and any other state and federal fair housing and planning law.
Specific actions include:
● Implement the following strategies to affirmatively further fair housing in coordination with the efforts of this action.
Strategies to facilitate housing mobility/expand affordable housing in high opportunity areas: Actions 1.A, 1.B, 1.C, 1.D, 1.E, 1.F, 2.D, 3.A, 3.B, 3.E, and 4.A.
Strategies to reduce or prevent displacement/place-based revitalization strategies: Actions 1.E, 2.A, 2.B, 2.C, 2.E, 3.B, 3.C, and 3.D.
● Pamphlets on fair housing laws and procedures will be made available at City Hall and the library, and information on fair housing requirements will be incorporated in the City’s newsletter. Promote the availability of multi-lingual resources by ensuring that City-provided services and materials are available in languages other than English or that they make clear the availability of interpretation or translation services. This information should also be available via the City’s website. The City’s Planning Director will be identified as the point of contact in the event a fair housing complaint is received,
with referrals provided to the Contra Costa Housing Authority or the California Department of Fair Employment and Housing, as necessary.
● Work with fair housing providers that serve Orinda residents on an annual basis to track fair housing complaints and identify areas of fair housing law in need of increased enforcement. Provide information about fair housing choices to residents by distributing fair housing materials upon request and contracting with a fair housing rights nonprofit to provide fair housing services on an ongoing basis, including fair housing complaint intake, investigation, resolution, general housing (landlord/tenant) counseling, mediations, assistance, referrals, and resolution.
● Annually host outreach events throughout the community at local gathering places such as parks, grocery stores, libraries, and more to recruit underrepresented groups to participate in the public outreach process and apply to committees through coordinating with service providers and posting information in grocery stores and public buildings.
● Meet with disability service providers, including the East Bay Regional Center, to identify whether there is unmet demand anywhere in the city by June 2023. If an unmet demand is realized, work with providers to secure funding to expand services by March 2024.
● Meet with developers within one year of Housing Element adoption to identify mechanisms to encourage construction of housing units suitable for persons with disabilities (no age restriction). Strategies may include incentives such as fee waivers, parking reductions, or density bonuses.
● Support affordable housing development for special-needs groups throughout the city to increase access to high resource areas, particularly in areas that are predominantly single-family residential. The target populations of this include seniors; persons with disabilities, including developmental disabilities; female-headed households; and homeless persons to reduce the displacement risk for these residents from their existing homes and communities.
● Annually meet with neighboring cities, the County, the Association of Bay Area Governments, and other agencies in the development of programs aimed at providing unmet services to persons with disabilities, unhoused populations, and extremely lowincome households, including development of homeless shelters and related services. Initiate collaboration by December 2023.
Responsible Agency: Planning Department
Timeframe: Ongoing; post information annually in the City’s newsletter; update and redistribute informational materials as needed; translate and make materials available by December 2023.
Funding Source: General Fund
Quantified Objective: Assist at least 100 households annually to further fair housing goals, including seeking funding to increase service capacity for individuals
with disabilities by 20, support development of 30 units for special needs population, and connect at least 30 residents with fair housing resources and information through informational materials and outreach.
Promote energy efficiency in existing and new housing development to support energy conservation in Orinda.
Policy 6.1: Encourage the use of energy conservation features in residential construction, rehabilitation, and remodeling.
Action 6.A: Promote Energy Conservation. Promote energy efficiency in existing housing and new development:
● PG&E offers assistance to low-income households who want to make their homes energy efficient through the Energy Savings Assistance Program
● EBMUD offers free conservation items to single and multi-family households, including shower diverters, hose nozzles and both bathroom and kitchen faucet aerators
● Encourage developers to be innovative in designing energy-efficient homes and improving the energy efficiency of new construction.
● Promote the EDMUD Customer Assistance Program that assists qualified low-income residents with one-time water bill payments as well as eligible homeless shelters
● Promote California’s Low-Income Weatherization Program, which provides low-income households with solar photovoltaic (PV) systems and energy efficiency upgrades at no cost to residents
Responsible Agency: Planning and Building and Safety Departments
Timeframe: Make information available on the City’s website and in public places, such as City Hall, by July 2023.
Funding Source: General Fund, SCE, and SoCalGas funding sources.
Quantified objectives estimate the number of units likely to be constructed, rehabilitated, or conserved/preserved by income level during the planning period. The quantified objectives do not set a ceiling on development; rather, they set a target goal for the City to achieve based on needs, resources, and constraints. Each quantified objective is detailed by income level, as shown in Table 7-1.
Source: City of Orinda, March 2022
1 As replacement units are identified.